Embed Size (px)
Citation preview

CHILD FRIENDLY SCHOOLS EVALUATION:
Country Report for Philippines
EVALUATION OFFICE
December 2009
EVALUATION REPORT

CHILD FRIENDLY SCHOOLS EVALUATION:
Country Report for the Philippines
EVALUATION
REPORT
EVALUATION OFFICE
DECEMBER 2009

Child Friendly Schools Evaluation: Country Report for the Philippines © United Nations Children’s Fund, New York, 2009 United Nations Children’s Fund Three United Nations Plaza New York, New York 10017
December 2009
The purpose of the evaluation reports produced by the UNICEF Evaluation Office is to assess the situation, facilitate the exchange of knowledge and perspectives among UNICEF staff, and propose measures to address the concerns raised. The content of this report does not necessarily reflect UNICEF's official position.
The text has not been edited to official publication standards, and UNICEF accepts no responsibility for errors.
The designations in this publication do not imply an opinion on the legal status of any country or territory, or of its authorities, or the delimitation of frontiers.
For further information, please contact: Evaluation Office United Nations Children’s Fund Three United Nations Plaza New York, New York 10017, United States Tel: +1(212) 824-6322 Fax: +1(212) 824-6492

Preface
The Evaluation Office, working closely with the Education Section, commissioned American Institutes for Research (AIR) to conduct a global evaluation of UNICEF’s Child Friendly Schools (CFS) programming strategy in 2008. The purpose of the evaluation was to assess how CFS models have been implemented in multiple contexts to improve education quality, and to provide data on the extent to which key CFS principles of child-centeredness, inclusiveness, and democratic participation are being realized in countries that are implementing CFS. The evaluation was also expected to create CFS assessment tools and provide a baseline against which future progress can be evaluated.
The evaluation methodology consisted of a desk review of CFS documents from all regions, site visits and primary data collection in six countries (Guyana, Nicaragua, Nigeria, Philippines, South Africa, Thailand), and an online Delphi survey of UNICEF education officers from all regions. The country visits included extensive new data collection via surveys, observations, interviews, photos and videos, and focus group discussions. In order to obtain the perspective of all key stakeholders, the evaluation teams collected data from teachers, school leaders, parents, and schoolchildren. Hence, in addition to this global evaluation report, six in-depth country case-study reports were produced from this work.
This report presents in-depth analyses and results of the status of CFSs in the Philippines. We hope that readers from both the education sector and the evaluation discipline will be satisfied with the rigor of the methodologies and clarity of the analysis.
Our appreciation for the effort and professionalism that was demonstrated in this evaluation goes to David Osher, the lead evaluator from AIR, and the AIR data collection team and authors of the Philippines report: Susan Caceres, Jennifer Anderson, and Laurence Dessein. Support was also provided by Chen-Su Chen, Jeff Davis, Corbrett Hodson, and Olivia Padilla. We also extend thanks to the national research teams that assisted AIR in each country.
We would also like to express gratitude to our colleagues in the Education Section—Cream Wright, Changu Mannathoko, and Maida Pasic—for recognizing the need for an independent evaluation, for insightful contributions at every stage, and for mobilizing their education colleagues in regional and country offices. Likewise, we appreciate the efforts made in all participating UNICEF country offices, especially in the six case study nations. Finally, sincere commendations go to my colleagues who managed the evaluation, Samuel Bickel (Senior Advisor) and Kathleen Letshabo (Evaluation Specialist, Education).
Readers of this report inspired to learn more about the child-friendly schools approach are invited to visit the UNICEF website (www.unicef.org/http://www.unicef.org/) for all the reports in this series. Readers interested in UNICEF’s evaluation priorities and strategies will also find important information there.
Finbar O’Brien Director Evaluation Office UNICEF New York Headquarters

ii
Table of Contents
Executive Summary .................................................................................................................................... v
CHAPTER 1 – Introduction ......................................................................................................................... 1
1.1 The CFS Initiative ...................................................................................................................... 1
1.2 A History of CFS in the Philippines .......................................................................................... 3
1.3 Global Evaluation of CFS .......................................................................................................... 4
1.4 Approach ................................................................................................................................... 5
CHAPTER 2 – Evaluation of CFSS in the Philippines ............................................................................. 6
2.1 Methodology .............................................................................................................................. 6
CHAPTER 3 – Findings: The State of CFS in the Philippines ............................................................... 12
3.1 Effective With Children ............................................................................................................ 12
3.2 Healthy for Children ................................................................................................................. 16
3.3 Protective of Children .............................................................................................................. 19
3.4 Gender Sensitive and Inclusive ............................................................................................... 22
3.5 Family and Community Involvement ....................................................................................... 25
CHAPTER 4 – Conclusions and Recommendations ............................................................................. 29
Effective for All Children ....................................................................................................................... 29
Healthy for All Children ......................................................................................................................... 29
Protection for All Children ..................................................................................................................... 30
Inclusive and Gender-Sensitive to all Children ..................................................................................... 30
Involve Families and Community Institutions ....................................................................................... 31
References ................................................................................................................................................. 32
Acknowledgements .................................................................................................................................. 33
Appendix A: Scale Construction Items ................................................................................................... 34
Appendix B: School Head Survey Item-by-Item Responses ................................................................ 38
Appendix C: Teacher Survey Item-by-Item Responses ........................................................................ 41
Appendix D: Student Survey Item-by-Item Responses ......................................................................... 44
Appendix E: School Observation Item-by-Item Responses ................................................................. 47
Appendix F: Classroom Observation Item-by-Item Responses ........................................................... 49

iii
Tables
Table 1. CFS Principles and Features .......................................................................................................... 2
Table 2. Duration of CFSS Implementation by School Type (Urban or Rural) ............................................. 7
Table 3. Student School Climate Survey Participant Grade Levels, by Gender ........................................... 8
Table 4. Teachers’ Years Teaching at School, by School Type (Urban or Rural) ........................................ 8
Table 5. Teachers’ Residence in Community by School Type (Urban or Rural) .......................................... 8
Table 6. Grade Levels Taught by Teachers, by School Type (Urban or Rural) ........................................... 9
Table 7. School Director Time in Position at Current School by School Type (Urban or Rural) .................. 9
Table 8. Dual Role of School Director by School Type (Urban or Rural) ..................................................... 9
Table 9. School Directors’ Residence in Community by School Type (Urban or Rural) and Gender ........ 10
Table 10. Head Teacher Reports on School Services Provided to Support Student Health ...................... 19
Table 11. Student Enrollment by Grade, Gender, and School Type (Urban or Rural) ............................... 24
Table 12. Student Absence Reports by Gender and School Type (Rural or Urban) .................................. 24
Figures
Figure 1. CFS Model of Change ................................................................................................................... 3
Figure 2 Child-Centred Pedagogy: Classroom Observation ....................................................................... 13
Figure 3. An Attentive Classroom Environment and Student Academic Engagement ............................... 15
Figure 4. A Safe School Environment and Student Academic Engagement .............................................. 20
Photographs
Photograph 1. Typical Philippines CFS Classroom ........................................................................................
Photograph 2. Latrine Without Water ..............................................................................................................
Photograph 3. Unused Water Sanitation System ...........................................................................................
Photograph 4. School Medicinal Garden ........................................................................................................
Photograph 5. Well-Maintained School Garden..............................................................................................

iv
Acronyms
AIR American Institutes for Research
CFS Child Friendly Schools
CFSS Child Friendly School System
PTCA Parent–Teacher–Community Association
UNICEF United Nations Children’s Fund

v
Executive Summary
For nearly a decade, the Department of Education has implemented Child Friendly School System (CFSS) programming in schools throughout the country with the support of UNICEF Philippines. The purpose of this report is to present an evaluation of the effectiveness of CFSS intervention efforts within the Philippines. The core research questions addressed in this report are as follows:
1. To what extent have Child Friendly Schools (CFS) in the Philippines promoted a child-centred and effective environment that promotes quality learning?
2. To what extent have CFS in the Philippines created an environment that promotes physical health?
3. To what extent have CFS in the Philippines created an environment that promotes security and psychosocial health?
4. To what extent have CFS in the Philippines created an environment that responds to diversity and acts to ensure inclusion, gender sensitivity, and equality of opportunity for all children?
5. To what extent have CFS in the Philippines involved families and communities?
UNICEF contracted with the American Institutes for Research (AIR) in 2008 to conduct a global evaluation of its CFS initiative. The evaluation was expected to serve as a baseline assessment, examining the effectiveness of UNICEF’s CFS programming efforts in the areas of inclusiveness, pedagogy, architecture and services, participation and governance, and systemic management. The Philippines was selected as one of six countries for this global evaluation.
For this CFS global evaluation, AIR visited 25 schools in the Philippines that had received support under the CFSS initiative. During school visits, AIR researchers and local trained data collectors observed the school grounds and buildings; watched teachers in action; surveyed school heads, teachers, and students; and conducted interviews and focus groups with school heads, teachers, families, and other key stakeholders. Within the constraints of the global evaluation, AIR was not able to tailor all of its evaluation questions specifically to the Philippines context, but it benefited from the data gathered in the Philippines in the course of the global evaluation in addressing the country’s own focus.
The Philippines has made significant strides in all aspects of its CFSS. Most teachers supported the use of interactive teaching methods. Over 90 percent of students said that students were encouraged to participate in class and work together during class. Nearly all students found that what they were learning was interesting and was what they needed to know in life. Classroom observations also suggested that teachers were using child-centred teaching techniques, were organized, and were interacting with students respectfully and positively.
Teacher survey data further demonstrated teachers’ commitment to more innovative pedagogical techniques in order to create a more effective and high-quality learning environment for their students. All of the classrooms were clean and orderly and students had sufficient space to work. However, there were causes for concern about some classrooms with inadequate protection from the elements, poor ventilation, loud noise, and inappropriately sized furniture, which more often occurred in rural schools. Interviews with teachers and school heads pointed to a few consistent barriers that prevented schools from fostering a more child-friendly environment: (a) large numbers of students in the classrooms and (b) insufficient instructional resources.
Schools promoted the physical health, hygiene, and nutrition of their students. Schools offered feeding programs, which were operated by families. School gardens were created to supplement the feeding programs. All parties were concerned with the sustainability of the programs, since limited resources were a significant barrier. School heads reported that students were provided with health education and access to health and dental screenings. The largest barrier to health, hygiene, and sanitation in rural schools was a lack of water systems; this was not a concern in urban schools.

vi
There was a high level of awareness about the importance of safety, security, and psychosocial well-being among stakeholders, but interview reports did not reveal particular efforts or activities to develop positive social and emotional skills of students. Nearly all teachers and students felt safe in the school. Teachers used positive forms of discipline and management with students. While most students reported that they accepted each other and interacted with and treated each other positively, a significant minority of approximately 25 – 30 percent of students reported being unable to resolve conflict without starting a fight and that there schools were being run by bullies that that there were some students who no one talked to.
In the area of inclusiveness and gender sensitivity, stakeholders reported that the schools provided equal access and participation to both boys and girls regardless of their ethnicity or religious background. There was overall gender parity in terms of enrollment and attendance, with boys missing significantly more days than girls to work or assist the family. Students were positive about the acceptance they felt from teachers toward themselves and their families. Capacity at the schools to support students with disabilities was low, with 75 percent of the school heads indicating they did not have teachers who had been specially trained to work with students with disabilities.
The level of participation by parents and community institutions was high across schools. According to schools heads, every school had an active Parent–Teacher–Community Association (PTCA). All of the schools relied upon families, through PTCAs, to provide time and labour to assist the schools, such as preparing the building for the new school year, planting and maintaining the school garden, preparing the feeding program, and implementing construction projects. Few schools engaged parents in decisionmaking about matters affecting the school; instead school staff perceived family participation mainly in terms of resource support for the school. Regular meetings and dialogue occurred between teachers and parents to inform parents of their child’s progress. Parents supported learning at home, according to their reports. Community participation in schools related more to financial assistance rather than involvement in decisions related to schools.
Recommendations by CFS area include the following:
Effective for All Children: The Department of Educatioin should focus on addressing the problems associated with large class sizes and provide teachers with continuous training and professional development opportunities, with a focus on child-centred teaching methods;
Healthy for All Children: The Department of Education and UNICEF should work together to identify additional donors to make financial contribution to the CFSS initiative to school infrastructure and services to improve water, sanitation, ventilation, and instructional materials;
Protection for All Children: The Department of Education should provide training in social-emotional learning to school heads and teachers to reduce the incidence of bullying and fighting at school;
Inclusive and Gender-Sensitive to all Children: The Department of Education should offer training to teachers in how to educate students with disabilities and schools and communities should work together find solutions to boys’ poor attendance and promotion rates; and
Involve Families and Community Institutions: The Department of Education should provide workshops to school heads and parents to build a better understanding of how to involve parents and community institutions in schools, beyond providing resource support.

1
CHAPTER 1 – Introduction
The Education Section of UNICEF’s Programme Office introduced the Child Friendly Schools (CFS) framework for schools that ―serve the whole child‖ in 1999.
1 Today, the CFS initiative is UNICEF’s
flagship education programme, and UNICEF supports implementation of the CFS framework in 95 countries
2 and promotes it at the global and regional levels. This chapter introduces the first global
evaluation of CFS.
1.1 The CFS Initiative
UNICEF grounded the CFS framework in the principles of child rights set forth in the 1990 Convention on the Rights of the Child and other international human rights instruments and international declarations such as the Declaration of Education for All (1990). These principles emphasize the right of all children to receive free and compulsory education in settings that encourage enrollment and attendance; institute discipline humanely and fairly; develop the personality, talents, and abilities of students to their fullest potential; respect children’s human rights and fundamental freedoms; respect and encourage the child’s own cultural identity, language, and values, as well as the national culture and values of the country where the child is living; and prepare the child to live as a free, responsible individual who is respectful of other persons and the natural environment.
3
Three other inputs shaped the early development of CFS. The first was effective school research, which emphasized the importance of school factors for disadvantaged students. The second was the World Health Organization’s mental health promotion initiatives, which focus on the importance of connectedness, caring, and access to support. The third was UNICEF’s interest in child-, family- and community-centred approaches to school improvement.
UNICEF envisions and promotes CFS models not as abstract concepts or a rigid blueprint but rather as ‖pathways towards quality‖ in education that reflect three key, and interrelated, principles derived from the Convention on the Rights of the Child (UNICEF, in press):
Child-centredness: Central to all decision making in education is safeguarding the interests of the child.
Democratic participation: As rights holders, children and those who facilitate their rights should have a say in the form and substance of their education.
Inclusiveness: All children have a right to an education. Access to education is not a privilege that society grants to children; it is a duty that society fulfills to all children.
UNICEF anticipates that CFS will evolve and move toward quality education through the application of these principles. The following features of CFS derive from these principles; as the principles gain traction these features are strengthened.
4
1 The Chabbott (2004) desk review, in which the author reviewed earlier documents and interviewed key personnel, provides the
basis for these historical observations. 2 CFS is implemented in 95 countries, one of which is identified as the Pacific Region, which consists of 13 independent island
countries and 1 territory under New Zealand administration (Tokelau). 3 See http://www.unicef.org/crc/
4Adapted from the UNICEF Child Friendly Schools manual (UNICEF, in press).
2
Table 1. CFS Principles and Features
Principle Features of a child-friendly school derived from principle
Child-centredness The school uses child-centred pedagogy in which children are active participants, provided by reflective practitioners.
The school has a healthy, safe, and protective learning environment provided through appropriate architecture, services, policies, and actions.
Democratic participation Children, families, and communities are active participants in school decision making.
Strong links exist among home, school, and community.
Policies and services support fairness, nondiscrimination, and participation.
Inclusiveness The school is child seeking.
The school is Inclusive and welcoming for all students.
The school is gender sensitive and girl friendly.
Policies and services encourage attendance and retention.
Although presented separately, the three principles are complementary, interactive, and to some degree overlapping. When schools implement one principle they will inevitably touch on and begin to apply another. Democratic participation provides an example: safeguarding the interests of the child (child-centredness) through child-centred pedagogy and a focus on the needs of the whole child should be enhanced both by the active participation of children in their learning and well-being and by the participation by families and communities to provide necessary supports. Similarly, being inclusive of all children and seeking out children should be enhanced by child-centredness and the active participation of students, families, and the community.
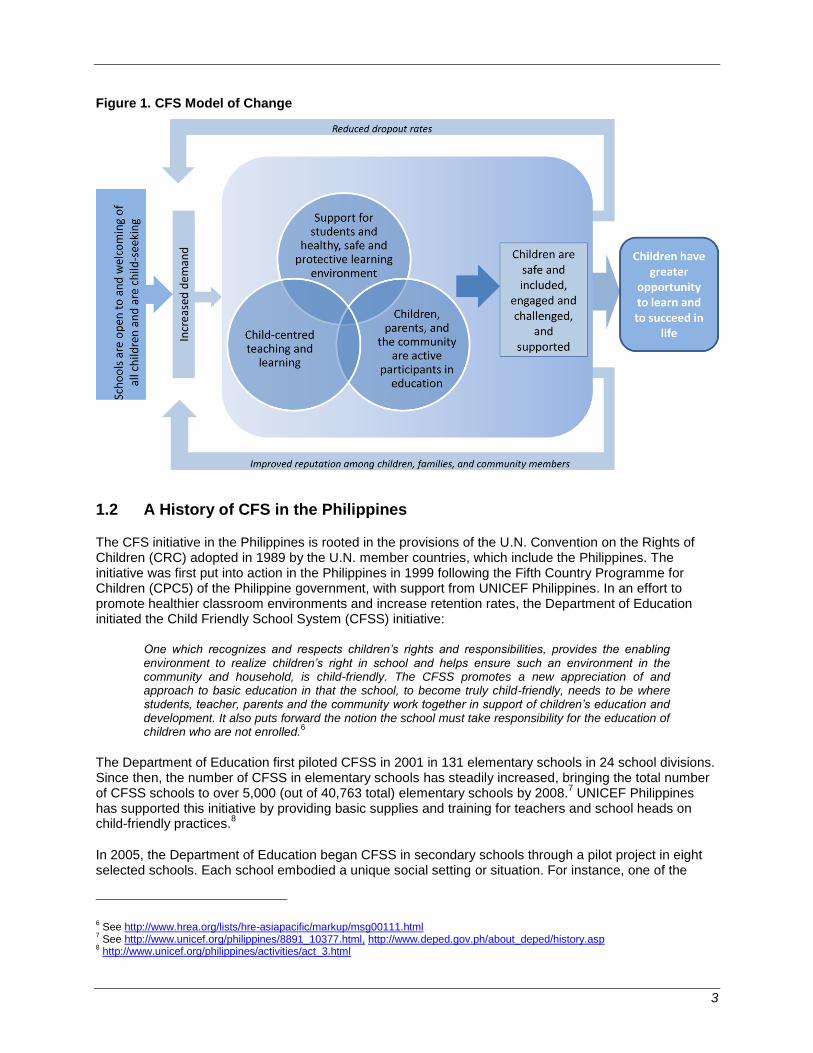
Figure 1 (below) presents a conceptual framework of CFS models. This framework was developed for, and then used to guide, this evaluation. It shows how the application of the three principles should lead to quality education and positive student outcomes.
5 First, schools are accessible and welcoming to all
children and seek out children. Within a school, child-centred pedagogical approaches are implemented in a healthy, safe, and protective learning environment that encourages the democratic participation of children, parents, and the community. Together, these lead to children being safe and included, engaged and challenged, and supported—all of which are important outcomes because children are, in turn, more likely to learn and stay in school. This dynamic leads to students having greater opportunity to learn and succeed in life. It also leads to reduced dropout rates because students and their families see the value of school. Moreover, successful schools are viewed positively by the community, and this improved reputation leads to greater demand.
Schools are situated in a broader context than is depicted in this figure. National and local policies, advocacy efforts, and multisector approaches will determine (to varying degrees) the availability and allocation of resources and school-level policies and practices. Another influence is the efforts by UNICEF, the government, and other partners such as nongovernmental organizations (NGOs) and civil society organizations to promote and support schools. Finally, a country’s economic health and demographic profile and political situation, and whether the country has recently experienced a natural disaster or political conflict, will necessarily influence how the principles are implemented and realized.
5 While it is grounded in UNICEF’s theory of action, it is also grounded in empirical research that it is important to provide students,
teachers, and families with the supports necessary to address barriers to participation and learning and to build conditions for learning and development (e.g., Battistich & Horn, 1997; Christenson & Thurlow, 2004; Greenberg et al., 2003; Hamre & Pianta, 2001; Osher, Dwyer & Jimerson, 2006; Osher et al., 2007; Osher & Kendziora, in press; Osterman, 2000; Slap, Lot, Huang, Daniyam, Zink, & Succop, 2003; Teddlie & Reynolds, 2000; Wentzel & Wigfield, 1998).
3
Figure 1. CFS Model of Change
1.2 A History of CFS in the Philippines
The CFS initiative in the Philippines is rooted in the provisions of the U.N. Convention on the Rights of Children (CRC) adopted in 1989 by the U.N. member countries, which include the Philippines. The initiative was first put into action in the Philippines in 1999 following the Fifth Country Programme for Children (CPC5) of the Philippine government, with support from UNICEF Philippines. In an effort to promote healthier classroom environments and increase retention rates, the Department of Education initiated the Child Friendly School System (CFSS) initiative:
One which recognizes and respects children‟s rights and responsibilities, provides the enabling environment to realize children‟s right in school and helps ensure such an environment in the community and household, is child-friendly. The CFSS promotes a new appreciation of and approach to basic education in that the school, to become truly child-friendly, needs to be where students, teacher, parents and the community work together in support of children‟s education and development. It also puts forward the notion the school must take responsibility for the education of children who are not enrolled.
6
The Department of Education first piloted CFSS in 2001 in 131 elementary schools in 24 school divisions. Since then, the number of CFSS in elementary schools has steadily increased, bringing the total number of CFSS schools to over 5,000 (out of 40,763 total) elementary schools by 2008.
7 UNICEF Philippines
has supported this initiative by providing basic supplies and training for teachers and school heads on child-friendly practices.
8
In 2005, the Department of Education began CFSS in secondary schools through a pilot project in eight selected schools. Each school embodied a unique social setting or situation. For instance, one of the
6 See http://www.hrea.org/lists/hre-asiapacific/markup/msg00111.html
7 See http://www.unicef.org/philippines/8891_10377.html, http://www.deped.gov.ph/about_deped/history.asp
8 http://www.unicef.org/philippines/activities/act_3.html

4
schools selected was in a community that was experiencing armed conflict, while another one was in a community of indigenous people. In 2007, the number of CFSS high schools was expanded, and by 2008, the CFSS high schools totalled 61 (out of a national total of 7,683) distributed among 26 school divisions. The primary goal of the initiative was to contribute to the improvement of access to and quality of basic education. The characteristics of CFS have been adapted and defined specifically for the Philippines social–cultural context. CFSS in the Philippines are each working to embody the following five characteristics:
9
To be effective with children
To provide healthy environments for children
To be protective of children
To be gender sensitive and inclusive of all children
To involve families and communities
In 2005, the Philippines succeeded in making the CFSS concept an integral part of the Ministry of Education’s long-term plan, aligning CFSS with its Basic Education Reform Agenda (BESRA). BESRA is a framework of policy actions that was developed to guide the Philippines as it attempts to achieve its Education for All objectives by 2015. BESRA, like CFS, focuses on the teaching and learning conditions of schools and the competencies of teachers as fundamental necessities to improving student outcomes and meeting education goals. The Department of Education is currently adapting CFSS principles into its reform efforts focused on school-based management (SBM). This includes the merging of SBM and CFSS checklists, the development of common standards and competencies, the integration of CFSS principles and practices into the SBM operational guidelines and the master training plan and training modules, and the addition of CFSS indicators into the current national EMIS (education management information system).
1.3 Global Evaluation of CFS
UNICEF contracted with AIR in January 2008 to conduct a global evaluation of the CFS initiative. The evaluation was expected to serve as a baseline assessment to examine the effectiveness of UNICEF’s CFS programming efforts in the areas of inclusiveness, pedagogy, architecture and services, participation and governance, and systemic management. The evaluation was also intended to provide some information as to the cost of intervention. The Philippines was selected as one of the six countries for this global evaluation. The global evaluation featured the following aspects:
Site visits by teams—data collection included 1- and 2-day visits by teams to approximately 25 schools in two or more regions in each of the six countries, for a total of 150 schools;
Focus on a range of CFS schools in terms of locality (urban versus rural environments), duration of implementation, and demography;
Randomization where feasible for surveys and focus groups conducted with students, teachers, and families, and for classroom observations;
Learning directly from students and teachers about how they experienced their schools;
Balanced sensitivity to local context and analytical uniformity by combining AIR and local site visitors;
Creating or tailoring 14 instruments and 17 reporting scales to address the needs of the evaluation;
Employing a Web-based Delphi survey of UNICEF education officers to contextualize findings; and
Drawing on AIR’s experience with other UNICEF evaluations in areas such as CFS and social and emotional learning to inform this evaluation.
9 Power Point Presentation provided by UNICEF Philippines ―Child-Friendly School System CPC 6, 2005-2009‖

5
1.4 Approach
The global evaluation utilized mixed methods to describe how CFS models were implemented in multiple contexts (Guyana, Nigeria, Nicaragua, Philippines, South Africa, and Thailand) to provide data on the extent to which the key principles of CFS—child-centredness, inclusiveness, and democratic participation—were being realized, and to provide a baseline and create tools to monitor future progress. Moreover, the global evaluation combined quantitative, qualitative, and visual data from diverse sources, which permitted the triangulation of data from multiple sources to test the consistency of findings obtained from different stakeholders. In addition, the evaluation was designed to describe how CFS models have been implemented in multiple contexts to provide data on the extent to which the key principles of CFS are being realized, to identify challenges, and to provide a baseline and create tools to monitor future progress.
The global evaluation also focused upon the range of CFS schools within each country so that schools were selected to represent differences in locality, duration of implementation, and demography. This report, the purpose of which is to present an evaluation of the effectiveness of UNICEF CFSS intervention efforts within the Philippines, is based upon data collected in the global evaluation of CFS (AIR, 2009).

6
CHAPTER 2 – Evaluation of CFSS in the Philippines
As described in Chapter 1, UNICEF organizes the three main principles of CFS into child centredness, democratic participation, and inclusiveness. For the past 8 years, UNICEF Philippines has focused its efforts according to these principles, as well as educational effectiveness. The evaluation questions and results have been organized across the five characteristics of the Child Friendly Schools System as identified within the Philippines, and address core research questions as follows:
1. To what extent has CFSS promoted a child-centred and effective environment that promotes quality learning?
2. To what extent has CFSS created an environment that promotes physical health? 3. To what extent has CFSS created an environment that promotes security and psychosocial
health? 4. To what extent has CFSS created an environment that responds to diversity and acts to ensure
inclusion, gender sensitivity, and equality of opportunity for all children? 5. To what extent does CFSS involve families and communities?
The report concludes with a section that identifies best practices that emerged in the course of this evaluation and provides recommendations for the future success of such initiatives in the Philippines.
2.1 Methodology
This country-specific report is based upon data collected for AIR’s 2009 global evaluation (AIR, 2009). The evaluation utilized mixed methods to describe how CFS models were implemented in multiple contexts, to provide data on the extent to which the key principles of CFS—child-centredness, inclusiveness, and democratic participation—were being realized, and to provide a baseline and create tools to monitor future progress. Moreover, the evaluation combined quantitative, qualitative, and visual data from diverse sources, which permitted the triangulation of data from multiple sources to test the consistency of findings obtained from different stakeholders. In addition, the evaluation was designed to describe how CFS models have been implemented in multiple contexts to provide data on the extent to which the key principles of CFS are being realized, to identify challenges, and to provide a baseline and create tools to monitor future progress. Key aspects of the evaluation methodology are described below.
In the Philippines, the evaluation:
Employed site visits by teams—the data collection included 1- and 2-day visits by teams to 25 schools in the southern and northern regions of Thailand;
Focused on the range of schools—schools were selected to represent the range of CFS schools in terms of locality (urban versus rural environments), duration of implementation, and demography;
Employed randomization—students, teachers, and families were randomly selected for interviews, focus groups, or surveys, and the classrooms to be visited were randomly selected;
Addressed phenomenological issues—the evaluation employed survey instruments to explore how a representative group of students and staff experienced the school;
Balanced sensitivity to local context and analytical uniformity by combining AIR and local site visitors;
Created or tailored instruments and scales to address the needs of the evaluation—AIR customized or created 14 instruments and 17 reporting scales to meet the needs of the evaluation;
Drew on its experience with CFS through other projects with UNICEF to evaluate and support social and emotional learning in CFS.

7
2.1.1 Instruments
Multiple assessment tools were created or modified for the purposes of the global CFS evaluation. These included a student survey (for use in Grades 5 and up), teacher survey, school director survey, classroom observation tool, schoolwide observation tool (including both indoor and outdoor areas), and interview and focus group protocols to learn more from parents, teachers, head teachers, and other key stakeholders. In addition, school demographic and visual data (i.e., photos and video) were obtained.
10
Because these tools were not designed for the Philippines specifically, items may not align exactly with the focus of CFSS in the Philippines. However, there was a significant amount of data available that did allow us to address the specific areas of CFSS focus in the Philippines for this report.
2.1.2 Sample
The scope of this evaluation made it impossible to visit all regions or schools where CFSS had been implemented, so AIR worked closely with UNICEF Philippines to obtain a sample of 25 schools that had received support from the CFSS initiative. These schools were distributed across metro Manila (Quezon City, Manila City, and Pasay City), Camarines Norte, Guimaras, and Negros Oriental. Because of UNICEF travel restrictions, the data collection teams were unable to visit Mindanao, as originally planned.
A total of 25 schools were visited, representing a mix of locality (urban and rural), years of CFSS implementation, and level (primary and secondary). As shown in Table 2 (below), 12 out of 25 schools had implemented CFSS for at least 5 years, offering a valuable perspective on long-term implementation. Among rural schools sampled, however, a majority had implemented CFSS for less than 5 years.
Table 2. Duration of CFSS Implementation by School Type (Urban or Rural)
Urban Rural Total Philippines
2 years or fewer 0 5 5
Between 2 and 4 years 2 6 8
Between 5 and 7 years 0 3 3
More than 7 years 4 5 9
From 25 school visits, surveys were administered to 1,934 students, 336 teachers, and 24 school directors. At all schools, students in Grades 5 and higher were asked to complete the school climate survey. Although the evaluation team originally aimed to have 100 students and 25 teachers within each school complete the survey, some of the rural schools were quite small, with only 2–3 teachers on staff and 20–40 students in Grade 5 or above.
Table 3 (below) shows the grade levels of student participants, broken down by gender. More than 70 percent of the students sampled were in Grades 5 or 6. Most primary schools served students only up to Grade 6. In these situations, random samples of Grade 5 and 6 students were selected to complete the student survey. If there were students in upper grades, they were also asked to complete the survey. More females than males were sampled at each grade level.
10
See the UNICEF Child Friendly Schools Programming: Global Evaluation Final Report produced by AIR (2009) for a more complete description of these tools.

8
Table 3. Student School Climate Survey Participant Grade Levels, by Gender
Grade Female Male Total Philippines
5 287 272 559
6 470 402 872
7 72 39 111
8 41 19 60
9 or higher 206 125 331
Total participants 1,076 857 1,933
Table 4 (below) shows characteristics of teachers who completed the survey, broken down by school type (urban or rural) and years teaching in their current school. Most participating teachers had worked at their school for several years, with rural schools more likely to have newer teachers than urban schools.
Table 4. Teachers’ Years Teaching at School, by School Type (Urban or Rural)
Years Teaching Urban Rural Total Philippines
Less than 2 19 49 68
3 to 5 19 30 49
6 to 10 34 25 59
11 to 15 28 40 68
More than 15 43 52 95
Table 5 (below) shows the distribution of male and female teachers by school type and shows the number of teachers of each who reported they did or did not live in the community where their school was located. Nearly 90 percent of teachers were female, and more than half of the teachers lived in the community where their school was located.
Table 5. Teachers’ Residence in Community by School Type (Urban or Rural)
Urban Rural Total Philippines
Male
Live in school community
3 13 16
Do not live in school community
8 11 19
Total male 11 24 35
Female
Live in school community
62 100 162
Do not live in school community
70 74 144
Total female 132 174 306

9
Participating teachers represented all grade levels as shown in Table 6.
Table 6. Grade Levels Taught by Teachers, by School Type (Urban or Rural)
Grade Urban Rural Total Philippines
Early childhood classroom 6 12 18
1 32 34 66
2 20 29 49
3 16 26 42
4 26 25 51
5 20 32 52
6 32 35 67
7 14 34 48
8 3 25 28
9 11 30 41
10 or higher 30 5 35
Most of the school directors who participated in this evaluation were relatively new to that role in their respective schools (see Table 7).
Table 7. School Director Time in Position at Current School by School Type (Urban or Rural)
Time in position Urban Rural Total Philippines
Less than 2 years 2 12 14
3 to 5 years 3 4 7
6 to 10 years 1 1 2
11 to 15 years 0 1 1
More than 15 years 0 0 0
As shown in Table 8, none of the school directors from urban schools taught at their school in addition to their administration responsibilities, but among rural schools most school directors did have a dual role.
Table 8. Dual Role of School Director by School Type (Urban or Rural)
Role Urban Rural Total Philippines
Also currently teach at this school
0 11 11
Do not also currently teach at this school
5 7 12
Most school directors reported that they did not reside in the community where their school was located; in fact, none of the urban school directors resided in the community where their school was located (see Table 9). Seventy-one percent of school directors were female.

10
Table 9. School Directors’ Residence in Community by School Type (Urban or Rural) and Gender
Urban Rural Total Philippines
Male
Live in school community 0 2 2
Do not live in school community 1 4 5
Female
Live in school community 0 5 5
Do not live in school community 5 7 12
Total participants
Live in school community 0 7 7
Do not live in school community 6 11 17
2.3 Data Collection
Field data collection took place from July 14 to July 26, 2008. The evaluation team consisted of eight national data collectors sponsored by INTEM, a local firm specializing in evaluation work, and two AIR researchers. The pairing of AIR staff with local site visitors was done to provide a balanced sensitivity to the local context. Local data collectors had experience collecting data for development projects. In addition, they were trained in person by the AIR staff. The training provided an explanation of the CFSS, a description of and rationale for the evaluation, orientation to the instruments and interview techniques, and review of the site visit protocol and data collection schedule. Local data collectors were trained with role-playing techniques to conduct interviews, as well as to perform school and classroom observations. AIR staff also ensured that local data collectors were well informed regarding proper procedures for the protection of human subjects, such as maintaining confidentiality. This training ensured consistency among the data collectors. Moreover, during field operations, daily debriefing meetings occurred among the entire data collection team. This was done to address questions or concerns among the data collectors and provided an additional consistency check.
There were two data collection teams, each led by an AIR evaluator. During the first week of data collection activities, Team 1 travelled throughout metro Manila (Quezon City, Manila City, and Pasay City). In Week 2, Team 1 travelled to Camarines Norte. During this same time period, Team 2 visited one school in Quezon City during the first week of data collection before travelling to Guimaras and Negros Oriental. Meetings with advocacy groups, policymakers, and UNICEF program implementers were interspersed throughout the data collection period for both teams.
There were two types of site visits: regular and intensive. The regular visits included the collection of the school records data; school and classroom observations; the student, teacher, and school director surveys; and an abridged school director interview. The intensive site visits also included extensive qualitative data gathering—including focus group discussions with teachers, parents, and community members—and a detailed interview with the school director. The typical duration of a regular visit lasted about 3.5–4 hours, whereas an intensive visit usually lasted at least 5 hours.
At the beginning of the school visit, the data collection team met with the school director or head teacher to introduce themselves, discuss the purpose of the global evaluation and the school visit, and describe the specific evaluation activities that were planned for the day. The goal of this discussion was to work with school staff to set a timeline for evaluation activities that would cause minimum disruption to teaching and learning activities. Also, school staff needed time to arrange for focus group discussions with parents and local community members. Typically, data collectors would administer the student survey first. To ensure adequate comprehension of survey questions among students who might be poor readers, the

11
data collectors read each survey item aloud and then gave students time to mark their responses on their survey sheets. Then, data collectors typically conducted school and classroom observations (including video and photograph documentation), followed by a brief lunch break with the school staff. In the afternoon, if it was an intensive school visit, data collectors would conduct focus groups with parents and teachers and conclude the visit with the school director interview. Finally, daily debriefings among the entire data collection team proved to be a useful way to share experiences and best practices, and to address questions or concerns among the data collectors.
All data collectors had access to digital voice recorders to record all interviews and focus groups to ensure that participant views and quotes were captured accurately. Tapes were transcribed for analysis. Photographs and video clips were recorded during the intensive visits to document particularly compelling or interesting representations of the CFSS pillars. Throughout the course of the trip, more than 90 photographs and videos were recorded. The videos focused on classroom interactions (e.g., a student-led presentation at Datagon Elementary School, a small rural hinterland school in Negros Oriental about 3 hours from a major town), while the photographs focused on architecture and layout of the school buildings, latrines, and other static elements (e.g., murals painted on school grounds, beautiful ponds, and natural landscaping at School 15 in Guimaras).
2.4 Data Analysis
The Philippines data collected during the global evaluation were analyzed by using valid and accepted quantitative and qualitative procedures. Qualitative analysis was conducted using the transcripts from the focus groups and interviews. The interview and focus group data were initially coded based upon each of the five characteristics of the Philippines CFSS. Coded sections were then combined across data sources to search for common patterns, themes, and perspectives that emerged across stakeholders (i.e., school heads, teachers, and parents). Survey, classroom, and school observation data were then explored with descriptive statistics to compare these findings with those that emerged from the qualitative analysis. To further explore the survey or observational data, cross-tabulations or statistical tests of significance were conducted where appropriate, to explore differences in the sample. Finally, both qualitative and quantitative data were combined to answer each research question, with the qualitative data providing contextual information to broaden the perspectives and validate findings from surveys and observations.
2.5 Limitations
There are several limitations to the approach of this evaluation. First, because of the logistical, time, and security constraints for field data collection, it was not possible to visit child-friendly schools in every region of the Philippines. As a result, the sample was only based upon schools located in five districts in the northern Philippines: metro Manila (Quezon City, Manila City, and Pasay City), Camarines Norte, Quezon City, Guimaras, and Negros Oriental. Thus, the sample did not include schools in other regions of the country, which may have other demographic characteristics. Second, some of the findings presented in this report are generated from self-report survey data gathered from students, teachers, school heads. Over-reliance on self-report data raises concern about the reliability and validity of data due to systematic response distortions by respondents, or the tendency for respondents to produce what they perceive to be socially desirable responses. However, this possibility was mitigated through cross-verification and triangulation of data through multiple data sources, usage of quantitative and qualitative data gathering methods, and use of both direct observation and self-report data to create a comprehensive picture of CFSS programming. Finally, due to the absence of a comparison sample of schools where CFS was not implemented, it was difficult to assess the unique impact of CFS programming on students attending CFSs in comparison to their peers who received alternative programming strategies or attended schools which did not benefit from CFS programming.

12
CHAPTER 3 – Findings: The State of CFS in the Philippines
In this chapter, we examine how well the Philippines had achieved its goal of developing schools that were child friendly based on the five characteristics described in Chapter 1. For each subsection of this chapter, we address one key research question associated with a focal area by drawing upon data from surveys, focus groups, and classroom and school observations. The subsections are organized by descriptors of each characteristic and/or additional themes that emerged from the data analysis related to it. In some sections, comparisons from the global report (AIR, 2009) are noted.
3.1 Effective With Children
A child-centred environment is a cornerstone of UNICEF CFS programming globally, and has also been a focus in the Philippines. For the Philippines, a child-centred environment is one that ―promotes quality learning and encourages children to participate in school and community activities‖ (UNICEF Philippines, 2005). Moreover, a CFS is effective with children when it ― has the best interest of the child in all its learning activities, employs teaching methods that are suited to the child’s age, abilities and ways of learning, and encourages children to work together to solve problems to achieve what they aim to do‖ (UNICEF Philippines & Philippines Department of Education).
In this section, we describe the extent to which student-centred pedagogies were used, whether teachers received professional development, and whether teachers addressed the needs of all learners. We also discuss the extent to which classrooms provided a physical environment that was conducive to learning.
3.1.1 Teachers use student-centred pedagogy
To examine the use of student-centred pedagogy, we asked teachers to describe the pedagogical methods they were using to teach, and we also observed what they actually did in classrooms. In addition, we asked students the extent to which they had an active role in classroom activities.
During interviews, teachers across schools reported that they used child-friendly methods. They described using peer learning techniques such as pairing a higher achieving student with a lower achieving one or using cooperative learning so that students could work in small groups together. Other examples included use of manipulatives or visuals (i.e., globe, semantic webs, or concept maps), science experiments, group projects/activities, discussions, with teachers acting as facilitators of learning. In addition, many schools utilized programs implemented by the Department of Education such as Drop Everything and Read (DEAR), or Instructional Management by Parents, Community and Teachers (IMPACT), which is being implemented in 19 CFS elementary schools to strengthen multigrade teaching in small and remote schools. The IMPACT schools were supported in terms of building the capacities of school heads and teachers in implementing the innovations; advocacy with children, parents, and community members; provision of teaching and learning materials; and on a more selective basis, supporting improvements in physical facilities. The IMPACT schools further strengthened the school and classroom management practices along the seven CFS goals.
Teacher survey data further demonstrate teachers’ commitment to more innovative pedagogical techniques in order to create a quality learning environment for their students. A total of 98 percent of teachers (n = 340) reported that students had better academic achievement in classrooms where their active participation in learning was encouraged. A large majority of teachers (81.2 percent, n = 281) strongly disagreed that when teachers allowed students to discuss or debate ideas in class, it took time away from learning. However, teachers were divided regarding the effectiveness of lectures. A total of 46 percent of teachers (n = 160) believed that classroom learning was most effective when based primarily on lectures, with students responding when called on. This suggests that student-centred instructional practices were accepted and used by teachers, but that some still preferred to use the lecture method. Students were favourable about their involvement in their learning. A total of 91 percent of students (n = 1,744) reported that they were encouraged to participate in classroom discussion. Nearly

13
all of them (90.7 percent, n = 1,752) indicated that they were encouraged to work together in class and share ideas and opinions in class (88.1 percent, n = 1,703).
During interviews, teachers also reported several barriers that prevented them from fostering a more child-friendly environment. The main barrier was crowded classrooms, sometimes with 50–70 students. The next common problem was lack of instructional resources, such as workbooks, science equipment, or science books. These resources were still lacking despite the school supplies, books, and instructional materials supplied by UNICEF Philippines to some of the schools. Finally, many teachers wished they had instructional technology available in their schools to facilitate more student-centred teaching.
Despite these barriers, observational data revealed that the classroom environment was a strong aspect in the CFS visited in the Philippines. Raters indicated that in every observed classroom, teachers were well prepared, maintained an engaging class, facilitated discussion among students, communicated verbally and nonverbally in a positive manner, and interacted with students in a respectful manner. Raters also indicated that in every observed classroom, students participated in class activities and interacted with the teacher in a respectful manner.
11
Based on comparisons of observational data across the six countries, as shown in Figure 2, an overwhelming majority of teachers (96 percent) were rated excellent on the Child-Centred Pedagogy scale, which measured different aspects of teaching and classroom management techniques, including the teacher’s use of child-centred teaching strategies, preparation of organized lesson plans, and the manner in which the teacher communicated and interacted with students.
Figure 2 Child-Centred Pedagogy: Classroom Observation
9
34
51
4
41 37
52
66
40
96
59 63
48
0
20
40
60
80
100
Nigeria South Africa Philippines Thailand Guyana Nicaragua
Perc
enta
ge o
f Stu
dent
s
Needs Improvement Satisfactory Excellent
Needs Improvement: Teachers do not know students by name. Students and teachers are disrespectful or unfriendly toward one another. Teachers rely on rote teaching techniques, such as requiring students to copy lessons from the blackboard or textbook. Students are not encouraged to ask questions or discuss the material that is being taught.
Satisfactory: Teachers use active, student-centred techniques to engage students during class time, with some attempt to elicit higher order thinking and associate the content of the lessons to students’ lives outside of the classroom. Teachers use positive disciplinary strategies. Teachers invite students to discuss class materials, and most students participate during class discussions. Students and teachers are respectful of one another, and teachers know students’ names.
Excellent: Teachers are well organized and present material in an engaging manner, encouraging discussion among students and relying on active, student-centred teaching strategies. Teachers relate classroom activities to students’ lives outside the class. Students are asked questions that prompt higher level thinking, such as evaluation and analysis. Teachers provide students with support and guidance, ensuring that all students (including those with special learning needs) have the chance to succeed in their classroom. Teachers are respectful of students and know students by name. Students are respectful of their teachers, engaged during class time, and actively participate in class activities.
11
See Appendix F for a list of other observed practices.

14
3.1.2 Teachers are provided with opportunities to enhance their knowledge and skills
School heads reported that professional development was provided to teachers in several ways. UNICEF conducted CFS training, while the Department of Education offered sessions related to initiatives such as IMPACT and BESRA. In addition, some school heads provided informal support through a process called ―school learning action cell‖ (SLAC), in which a dialogue between the school head and grade level teachers was used to discuss teaching strategies and content. School heads found SLAC to be a valuable way to improve teaching practices, since it facilitated teacher-to-teacher sharing.
There was agreement between teachers and school heads, with 98.2 percent, of the teachers reporting that they were given ongoing opportunities to learn better techniques through workshops, seminars, or trainings. Similarly, nearly all teachers reported that they had been provided with professional development opportunities that had helped them to be better teachers (96.3 percent, n = 333) and that school leadership had provided them with adequate support to continually improve their teaching methods (96.8 percent, n = 335). Because teachers had been provided with these supports, it is not surprising that they embraced the use of child-friendly teaching strategies.
3.1.3 Teachers promote quality learning outcomes
The global evaluation did not focus directly on student outcomes, but did examine whether schools had provided an environment conducive to improving performance—specifically whether teachers focused on higher order skills and provided interesting and challenging activities and assignments to students.
Observation data indicated that teachers asked questions that facilitated higher order thinking activities (e.g., application, analysis, synthesis, and evaluation, etc.). These observations reflect the success of the shared CFS/BESRA goal of improving teacher competencies to contribute to learning outcomes by building a shared social regard for learning.
Most students had a positive regard for what they were learning in school. Ninety-five percent of students reported that the topics they were studying were interesting, that the school prepared them to continue on for more education after they graduated (93 percent), and that they were given more challenging work when they mastered their work (78.3 percent). Although there were no significant differences by gender or grade of the student, students in rural schools disagreed significantly more than those who attended urban ones that they were provided with more challenging work when they mastered their work.
12 One
possible explanation could be that rural schools had classrooms with multiple grades, which may limit the attention given to students. Also, the multigrade classrooms used learning modules, which may not provide adequately challenging material.
3.1.4 Teachers address the needs of all learners
The survey asked teachers about their perceived responsibility toward all students. Nearly all teachers agreed that it was their responsibility to ensure that all students in their class were successful (95.7 percent), that all students can learn (97.9 percent) and that it was their responsibility to find a way to meet the learning needs of every student (98.6 percent). Only ten percent of teachers (n = 312) held the belief that focusing on students who are behind in their work takes too much time away from the other students.
Classroom observational data also showed that teachers addressed the learning of all students, adapted lessons for students with special learning, and encouraged and supported participation of students who were struggling with their academic work.
To address the learning needs of all students, teachers in many schools reported that they provided remedial lessons during lunch. This was necessary because there was a range of student levels within
12
t(253.85) = -12.252, p < .001 when students master their work they are provided more challenging work based on locality

15
the classrooms, particularly with significant numbers of children who had reentered school and had skills deficits due to their intermittent attendance.
For teachers to be able to adapt their lessons to better support the learning of all children, they must first recognize when a student does not understand the content. Eighty-seven percent of students (n = 1,687) reported that their teachers noticed if they were having difficulty with their lessons. Student responses of those disagreeing with this item did not vary based on gender or locality of school, but by the type of grades the student reported receiving. Specifically, those who usually received fair grades did not believe teachers noticed when they had difficulty, unlike students with excellent, good, or poor/failing grades.
Further analysis was conducted on whether the provision of an environment where teachers noticed when students had difficulty with their lessons had any relationship with student academic engagement, as measured by whether the individual student reported wanting to come to school in the first place
13 and
the desire of the individual student to continue his or her education.14
Five schools where students had expressed the highest level of agreement
15 with the student survey item „teachers notice if I am having
difficulty with my lessons (the most attentive schools) were compared with the five schools with the lowest levels of agreement on the same item (the least attentive schools). As shown in Figure 3 (below), students who attended the most attentive schools were significantly more likely to state that they looked forward to coming to school and that they wanted to complete secondary school when compared with students who attended the least attentive schools.
16
Figure 3. An Attentive Classroom Environment and Student Academic Engagement
83%
97%
64%
93%
0%
20%
40%
60%
80%
100%
Less Attentive More Attentive
Look Forward to School
Want to Complete Secondary
3.1.5 Classrooms provide a physical environment conducive to learning
The evaluation also assessed the degree to which classrooms had a physical environment that was conducive to learning, had adequate seating and work space, had appropriate lighting and ventilation, and had a blackboard that could be seen by all students. Most classrooms in the Philippines met students’ basic needs in these
13
Measured by the survey item I look forward to coming to school 14
Measured by the survey item I want to complete secondary school 15
Level of agreement was measured by the school mean for this survey item. 16
t(357.767) = –9.042, p < .001 for Look forward to coming to school; t(144.591) = –5.671, p < .001 for I want to complete secondary school
Photograph 1. Typical Philippines CFS Classroom

16
areas. Raters indicated that every classroom was clean and orderly and that blackboards were visible to all students. Students had sufficient space to work, and they had a chair or bench to sit on while working.
17 However, rural schools were more often observed to have problems with adequate protection
from the elements (25 percent, n = 9), ventilation (42 percent, n = 15), and noise (and inappropriately sized furniture were noted in some classrooms).
3.1.6 Summary: Effective for children
In this section, we explored the extent to which the CFSS in the Philippines has engendered a child-centered and effective environment that promotes quality learning. Across schools, most teachers reported using child-centred methods, but some teachers still believed students learned best if they used teacher-centred pedagogical methods. Nearly all teachers believed that continuous opportunities for professional development were provided to them. Nearly all teachers indicated that it was their responsibility to ensure that all students in their class were successful.
Most students were favourable about their involvement in their learning. Most students reported that they thought the subjects they studied at school were interesting and were preparing them for life after school. Students who attended a school with more attentive teachers were significantly more likely to report that they looked forward to coming to school and that they wished to complete secondary school when compared with students who had teachers who did not notice when they had difficulty (less attentive). Students in rural schools disagreed significantly more than those who attended urban ones that they were provided with more challenging work when they mastered their work. Most classrooms in the Philippines were appropriate in terms of cleanliness, student work space, and blackboards, but some were inadequate in terms of protection from the elements, ventilation, noise, and poorly sized furniture, which occurred more often in rural schools.
3.2 Healthy for Children
The CFSS describes a healthy environment as one that “promotes children‟s health, promotes teachers‟ and other school personnel‟s health, and has explicit policies on health promotion.” During interviews, school heads, teachers, and parents stressed the importance of CFS going beyond academics and
providing an environment that develops the whole child. In this section we discuss the efforts made in CFS to promote physical health, hygiene, and nutrition for their students. In addition, these services are compared with those provided in other countries in the global evaluation (AIR, 2009). Finally, we conclude with a brief summary of key findings for this section.
3.2.1 Schools promote physical health and hygiene
Physical health was a topic that was discussed often during interviews with school heads, teachers, and parents, since these stakeholders believed it was critical for CFS to offer services that promoted the health and hygiene of their students. Services consisted of constructing additional comfort rooms (toilets), providing annual health and dental screening, and empowering students with knowledge related to health education. These services were reported across schools, regardless of region or locality of the school.
All school heads (n = 24) strongly believed that the school taught students how to avoid high-risk behaviours and how to
17
See Appendix F for a list of other classroom conditions.
Photograph 2. Latrine Without Water

17
live a healthy life. In addition, nearly all school heads (91.6 percent, n = 22) reported that schools provided students with access to annual health examinations. A majority of school heads (66.7 percent, n = 16) reported that the school provided routine vision and hearing screenings to students, and referred students to free or affordable follow-up services if needed. Most teachers (87.2 percent, n = 300) reported that health issues were not a barrier to student learning, which demonstrates the success of school-based health services in reducing obstacles to learning.
The main barrier to promoting health, sanitation, and hygiene was lack of clean water or water supply in rural schools, according to interview reports with school heads, teachers, and parents. However, this barrier was not reported in urban schools. In some rural schools clean water was not available throughout the school. Rural school heads similarly described the problem, as stated by one school head:
There are three deep wells in the school, but we do not have water distribution lines to the classrooms and school facilities. Potable water is only available in the school canteen; thus children have to go to the canteen to get their drinking water (School Head 8).
In schools that had inadequate water supply, parents, teachers, and school heads were concerned about the health risks that this caused to children and the difficulty in maintaining a hygienic environment. “There is a dry well and pump but no potable water at this school. Children must drink water at home before or after coming to school” (Parents, School 13). Lack of water also made it difficult to clean the comfort rooms, even after collecting rain water.
To assist some of the rural schools without water systems, UNICEF installed electric-based water systems. However, schools were not able to sustain the financial costs of its operation. Schools heads reported that they could not afford to pay for both the costs of instructional materials, such as reproduction of workbooks and test materials, as well as the operation of the water system.
Inadequacies with water and latrines were noted during school observations, predominately in rural schools. Staff and students had ongoing, easy access to drinking water in only 40 percent of the schools observed (n = 10), Similarly, functioning sinks with soap were not located close to latrines in 40 percent of the schools.
3.2.2 Schools promote nutrition
Nutrition was another area that received considerable attention from the schools. Nearly all school heads (91.7 percent, n = 22) reported that the school offered a feeding program to all students. All school heads (n = 24) also agreed that their school used height/weight screening to identify malnourished children. The majority of school heads also indicated that their school provided micronutrient supplements to students who needed them (70.9 percent, n = 17) and that the school provided deworming treatment of parasitic infections to students who needed them (83.3 percent, n = 20).
Photograph 3. Unused Water Sanitation System

18
During interviews, school heads, teachers, and parents expressed concern about student nutrition and hunger, since many children came from poor families. Fifty-eight percent of teachers (n = 200) believed that inadequate nutrition kept students from learning as much as they should. Teachers also commented on the reality of the situation for many students who lived far from school: “one can‟t imagine seeing a child walking for a few kilometres just to go to school without having breakfast and no pack lunch with him or her” (School 8).
For this reason, schools involved parents and community in running and financing a snack or meal program in the schools. Depending upon the resources of the school, the feeding program either targeted the neediest students or was provided to all. Programs in most schools operated daily, but in a few schools it was weekly. Schools financed the feeding program either from donations from parents, the community, and teachers, or used money generated from selling healthy snacks in the canteen during recess time. In addition, schools also established gardens to generate vegetables and herbs for the feeding program. Parents were positive about the school gardens, since it was a way of teaching about the environment and recycling.
Teachers, school heads, and parents reported positive results from the feeding program. Some of the changes noted
were increased student height/weight, improved nutrition and health, and decreased malnutrition and absenteeism. Perhaps, because the feeding program operated consistently in most schools, a lower percentage of students than teachers reported that hunger was a serious issue affecting their learning. In fact, only 33 percent of students (n = 632) indicated that they were too hungry to pay attention in school. The biggest challenge for the feeding program was financial resources. The gardens supplemented the feeding program during some months, but sustainability of the program was a concern raised in all schools and is exemplified by the comments shared by these teachers:
The only problem is how to sustain it [feeding program] on a yearly basis or even just a monthly basis. When we run out of budget, the school cannot continue it. The school just had a rice distribution program. It was very effective but it lasted only for a month (School 11).
3.2.3 Health and nutrition services provided in the Philippines compared with other countries in the global report
As previously noted, the Philippines was part of the global report (AIR, 2009), along with Nigeria, South Africa, Thailand, Guyana, and Nicaragua. Data compiled for the global report indicated that school heads
Photograph 4. School Medicinal Garden
Photograph 5. Well-Maintained School Garden
19
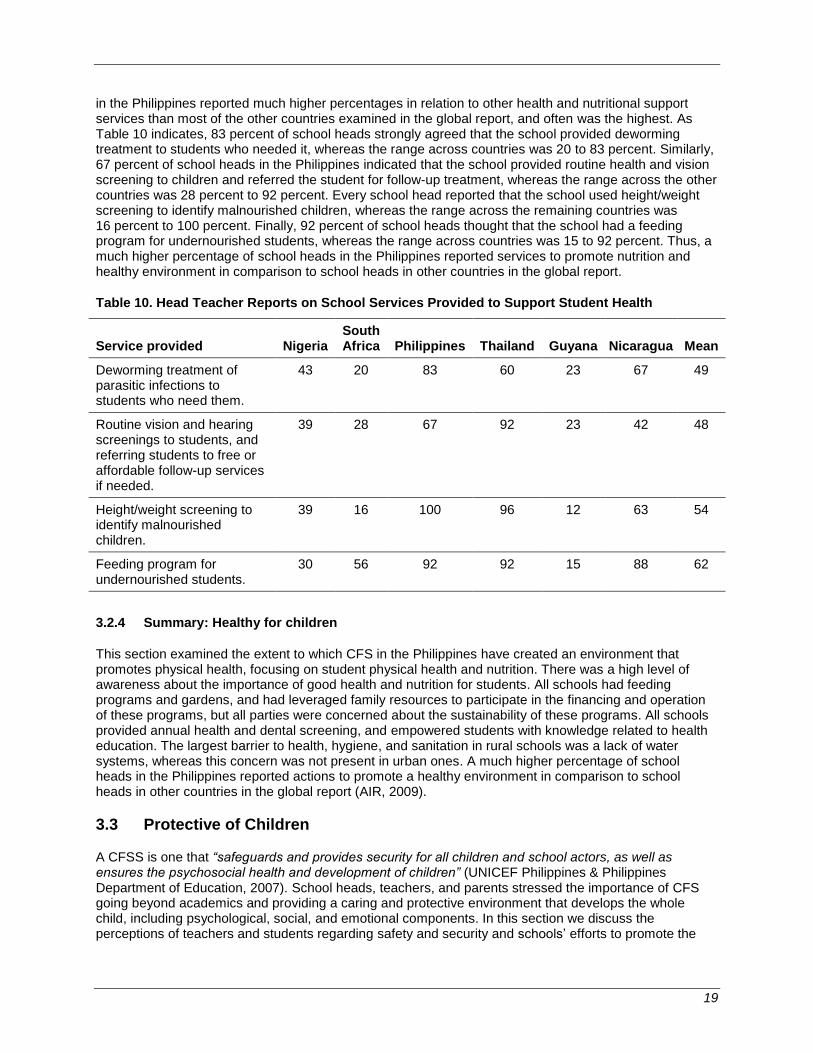
in the Philippines reported much higher percentages in relation to other health and nutritional support services than most of the other countries examined in the global report, and often was the highest. As Table 10 indicates, 83 percent of school heads strongly agreed that the school provided deworming treatment to students who needed it, whereas the range across countries was 20 to 83 percent. Similarly, 67 percent of school heads in the Philippines indicated that the school provided routine health and vision screening to children and referred the student for follow-up treatment, whereas the range across the other countries was 28 percent to 92 percent. Every school head reported that the school used height/weight screening to identify malnourished children, whereas the range across the remaining countries was 16 percent to 100 percent. Finally, 92 percent of school heads thought that the school had a feeding program for undernourished students, whereas the range across countries was 15 to 92 percent. Thus, a much higher percentage of school heads in the Philippines reported services to promote nutrition and healthy environment in comparison to school heads in other countries in the global report.
Table 10. Head Teacher Reports on School Services Provided to Support Student Health
Service provided Nigeria South Africa Philippines Thailand Guyana Nicaragua Mean
Deworming treatment of parasitic infections to students who need them.
43 20 83 60 23 67 49
Routine vision and hearing screenings to students, and referring students to free or affordable follow-up services if needed.
39 28 67 92 23 42 48
Height/weight screening to identify malnourished children.
39 16 100 96 12 63 54
Feeding program for undernourished students.
30 56 92 92 15 88 62
3.2.4 Summary: Healthy for children
This section examined the extent to which CFS in the Philippines have created an environment that promotes physical health, focusing on student physical health and nutrition. There was a high level of awareness about the importance of good health and nutrition for students. All schools had feeding programs and gardens, and had leveraged family resources to participate in the financing and operation of these programs, but all parties were concerned about the sustainability of these programs. All schools provided annual health and dental screening, and empowered students with knowledge related to health education. The largest barrier to health, hygiene, and sanitation in rural schools was a lack of water systems, whereas this concern was not present in urban ones. A much higher percentage of school heads in the Philippines reported actions to promote a healthy environment in comparison to school heads in other countries in the global report (AIR, 2009).
3.3 Protective of Children
A CFSS is one that “safeguards and provides security for all children and school actors, as well as ensures the psychosocial health and development of children” (UNICEF Philippines & Philippines Department of Education, 2007). School heads, teachers, and parents stressed the importance of CFS going beyond academics and providing a caring and protective environment that develops the whole child, including psychological, social, and emotional components. In this section we discuss the perceptions of teachers and students regarding safety and security and schools’ efforts to promote the

20
emotional well-being of their students, including the use of positive forms of discipline. We also describe students’ perceptions of treatment by teachers, as well as peers.
3.3.1 Perceptions of safety and security differed between teachers and students
Although nearly all teachers and students reported feeling safe in the schools, more teachers than students felt safe in school (97.4 percent of teachers, compared with 92.5 percent for students). In addition, nearly all teachers (96.8 percent, n = 335) held the view that the school was not affected by crime and violence in the community. However, the reports of students and teachers differed in their perceived safety outside the school. The majority of students felt safe walking to and from school (86.7 percent, n = 1,677), whereas 34 percent of students indicated that they sometimes stayed home because they worried about safety (n = 673).
Student disengagement from school is a serious challenge to reaching the Millennium Development Goals of universal primary education and limits the attainment of BESRA-related desired outcomes. Based on the fact that 34 percent of all students overall indicated that they stayed at home because they worried about their safety, the evaluation examined whether providing a safe school environment for students had any relationship with student academic engagement in two areas: the individual student wanting to come to school in the first place and his or her desire to remain engaged in education. Using responses to the student survey item I sometimes stay home from school because I am worried about my safety, five schools where students had expressed the highest level of disagreement with the statement were designated as most safe schools and were compared on student academic engagement with students from the five schools with the lowest levels of disagreement (the least safe schools). As shown in Figure 4 (below), students who attended the most safe schools were significantly more likely to state that it was very true that they looked forward to coming to school. Although a higher percentage of students from the most safe schools reported wanting to complete secondary school when compared with students who attended the least safe schools, the difference between groups was not significant.
18
Figure 4. A Safe School Environment and Student Academic Engagement
3.3. 2 Positive forms of discipline are used with students
Every head teacher reported that teachers received training on how to use child-friendly methods of student discipline (n = 24). School heads also indicated that teachers established classroom rules to guide children’s behaviour and used more proactive and positive forms of discipline, such as talking with students privately or meeting with parents. In addition, school heads also said that teachers used community service with students rather than punishments.
These reports were consistent with observation data. During every classroom observation, raters indicated that teachers used positive methods to manage student behaviour (n = 48). During interviews, parents supported the claims made by school heads. Parents reported that corporal punishment was not
18
t(408.818) = –15.287, p < .001 for I look forward to coming to school; t(727.742) = –1.477, p = .140 for I want to complete secondary school
52%
91% 94% 95%
0%
20%
40%
60%
80%
100%
Look Forward to School Want to Complete Secondary School
Least Safe
Most Safe

21
used by teachers. Parents believed that using punishment was not consistent with the principles of child-friendly schools, since the school should be protective of and caring toward children.
The student survey did not ask specifically about corporal punishment or discipline, but it did ask students whether they felt respected by their teacher and whether their teacher said unkind things to them. These two items can give an indication of how positive and caring the classroom environments are perceived by students. Nearly all students strongly agreed that their teacher treated them with respect (94.4 percent, n = 1,825), whereas only 19.6 percent of students reported that their teacher said unkind things to them. Thus, these data showed a positive perception on the part of students regarding how teachers treated them, which is consistent with the interview reports of the other stakeholder groups and with observation data.
3.3.3 Students’ perceptions regarding bullying and peer interactions
Another important focus of the child-friendly school system is the elimination of bullying and violence so as to create caring and protective environments for all children. Preventing negative student interactions such as bullying and violence is important for students to feel safe and secure in schools. The first course of action that is required is to institute a policy and procedures. The school head survey asked whether there were procedures in place for students to safely report instances of bullying, harassment or harm from other students without fear; 95.9 percent (n = 23) strongly believed these procedures existed.
The student survey asked students their perceptions about peer interactions, relationships, and acceptance. The responses indicated that although the majority of students accepted each other and interacted with and treated each other positively, a significant minority of students reported bullying and interstudent violence. Twenty-three percent (n = 446) of students reported that they did not know how to disagree without starting a fight or an argument, and 24.6 percent (n = 453) of students believed it was okay to fight someone who insulted them. Similarly, a significant minority (21.1 percent, n = 408) of students believed that students liked to put each other down and that the school was being ruined by bullies. More than a third of students thought that there were some students who were teased by everybody (35.2 percent, n = 681) and who nobody talked to (21.8 percent, n = 421). In contrast, a large majority of students reported that students helped each other, even if they were not friends (88.5 percent, n = 1,711); students treated each other with respect (90.7 percent, n = 1,754), and if students saw another one being picked on, they tried to stop it (81.7 percent, n = 1,579). These results show that an emphasis on social-emotional learning is needed in classrooms. Students need to learn how to resolve conflict without fighting or bullying other students.
3.3.4 Limited focus on emotional well-being
During interviews, school heads, teachers, and parents noted the importance of developing the whole child, including his or her social and emotional well-being, and they showed awareness of this topic. Every school head (n = 24) agreed that the school provided education to all students in the development of positive social and emotional skills. However, no examples were provided during interviews from any of these parties showing how the schools promoted or addressed social and emotional learning. This suggests more attention may be needed to further develop the knowledge and skills of school heads and teachers regarding how they can enhance students’ emotional well-being. In addition, the promotion of student social and emotional learning may be considered as a future area of focus for CFSS, since research has demonstrated a significant relationship between the provision of a school environment with good conditions for learning and children’s mental health (Osher, 2007).
3.3.5 Summary: Protective for children
In this section, we considered the extent to which CFS in the Philippines have created an environment that promotes security and psychosocial health. There was a high level of awareness about the importance of safety, security, and emotional well-being among stakeholders. Although nearly all teachers and students felt safe in the school, 34 percent of students indicated that they sometimes stayed home because they worried about safety. Students from the least safe schools were significantly less

22
likely to report that they look forward to school when compared with students attending the safest schools. Teachers used positive forms of discipline with students. Nearly every school head indicated that there was a policy for students to safely report instances of bullying, harassment, or harm from other students without fear. A large majority of students reported that students accepted each other and interacted with and treated each other positively. Every school head indicated that the school provided education to all students in the development of positive social and emotional skills, but this was not substantiated with examples or descriptions during interview reports. More attention may be needed to further develop the knowledge and skills of school heads and teachers regarding how they can enhance students’ emotional well-being.
3.4 Gender Sensitive and Inclusive
The provision of a school environment that responds to diversity to meet the needs of all students is a central feature of CFS efforts globally, as well as within the Philippines. The CFSS “ensures that all children come and stay in school and promotes gender-fair practices.” This section addresses school head, student, teacher, and parent perceptions of whether the CFS were inclusive and accepting of all types of students, including girls, religious minorities, and students with disabilities.
3.4.1 Schools are inclusive and nondiscriminating
School heads, teachers, and parents believed that schools were inclusive, since children from every ethnic and religious background in the community attended the school and were not discriminated against. In addition, they reported that any child who wanted to attend the school was accepted. Nearly all school heads (91.7 percent, n = 22) reported that the school had a written policy on educating all students, regardless of race, ethnicity, gender, language, disability, or religion. In addition to the school policies, school heads and parents described examples of accepting attitudes to encourage the inclusion and participation of all students. For example, one school did not require Muslim students to participate in religious classes; another school permitted Muslim students to say their prayers during school.
School heads and parents believed being inclusive meant encouraging the participation of out-of-school youth. To assist with this effort, many schools conducted a mapping of the catchment area, which provided a list of families and the ages and names of children. Teachers then used this information to visit families to persuade parents to send their children to school. Similar to the interview reports, the survey data revealed that nearly all school heads indicated that staff from the school went into the community to encourage the enrollment of minority students, students living in poverty, or others at risk for poor educational outcomes (95.9 percent, n = 23). Moreover, every school head agreed that staff from the school made direct contact with families whose children dropped out of school or were at risk of dropping out to encourage the child’s continued enrolment (n = 24).
Students most at risk of dropping out were from poor families. For this reason, many school heads described extra efforts extended to these children to encourage their continued participation. Some rural school heads took an advocacy approach by working with local NGOs to combat child labour in mining activities. Other schools created an Adopt-a-Child program to feed poor children or pay for their school supplies, which were either funded by donations from teachers or fundraising activities by the school.
Finally, school heads felt that to be inclusive they should be flexible with enrollment policies so that all children could attend. To enroll a child in school, parents were required to present a birth certificate for their child, which can be difficult for rural parents. Instead of turning the children away, as the policy required, school heads accepted the children without certificates and then worked with local officials (Barangay) to get certificates for them.

23
3.4.2 Students’ perceptions of acceptance of all students by school staff
Students were positive in their reports of the acceptance they felt from school staff toward themselves and their family. Ninety-two percent of students (n = 1,782) indicated that their school was a welcoming place for all types of students. Ninety-five percent of students (n = 1,846) agreed that teachers at their school expected students like them to succeed in life. The majority of students believed that the school was a welcoming place for families like theirs (86.5 percent, n = 1,672). Sixty-six percent of students (n = 1,285) believed that when students broke the rules they were treated fairly.
Perceptions of gender sensitivity
School heads, teachers, and parents consistently reported during interviews that schools were gender sensitive. They believed the schools promoted gender equality and provided the same opportunities for boys and girls. Parents compared the situation in the past with the present:
Girls may have been receiving less than deserved, or at least less than what their male counterparts received, but that was in the past. Now, there is not much to complain about since girl-children have about the same experiences as boy-children do. (Parents 5)
Teachers, school heads, and students perceived schools to have gender-fair practices and treatment. All school heads (n = 24) believed that boys and girls were equally permitted and encouraged to participate in school activities, academic classes, and physical activities in the school. Nearly all teachers (99.1 percent, n = 341) also agreed that boys and girls had equal opportunities to succeed in the school. In addition, 93 percent of students also reported equal opportunities between boys and girls (n = 1,810), and there was little variation across schools. When students disagreed with this item, responses did not vary based on gender. Instead, those who attended rural school and were in the fifth grade tended to disagree more often than those in urban schools or higher grades.
3.4.4 Overall schools have parity in enrollment and attendance between boys and girls
Student enrollment data were collected from school heads during site visits. Across the full sample, girls and boys had nearly equal enrollment, with ratios ranging from 0.86 to 1.1 (see Table 10). Table 11 also shows the number of boys and girls enrolled in the schools visited, by grade level and by school type (e.g., rural or urban). Across the schools visited, boys had slightly higher enrollment than girls in nearly every grade. When examining the sample by school type (e.g., rural or urban), one sees that there was consistent parity in enrollment between girls and boys across all grades in urban schools. However, this was not the case within rural schools, since there were changing girl-to-boy ratios across the grades, with lower ratios occurring in kindergarten, fourth, and seventh grades (with ratios ranging from .79 to 1.1). This suggests that monitoring the enrollment of girls in rural schools may be important. In addition, there may be particular grades where rural girls are vulnerable to dropping out, such as fourth and seventh grades. The data also suggests that once rural girls complete the seventh grade, they seem to be likely to persist to subsequent grades.

24
Table 11. Student Enrollment by Grade, Gender, and School Type (Urban or Rural)
Grade
Boys Girls Girls: Boys Ratio Total Girls: Total Boys Ratio
Urban Rural Urban Rural Urban Rural Boys Girls All Schools
(n = 25)
Kindergarten 411 274 408 235 .99 .86 685 643 .94
First 2,621 485 2,185 491 .83 1.00 3,106 2,676 .86
Second 2,165 399 2,049 379 .95 .95 2,564 2,428 .95
Third 2,112 397 2,005 354 .95 .89 2,509 2,359 .95
Fourth 2,033 390 1,953 314 .96 .80 2,423 2,267 .94
Fifth 1,864 325 1,842 320 .99 .98 2,189 2,162 .99
Sixth 1,828 309 1,840 310 1.00 1.00 2,137 2,150 1.00
Seventh 1,265 586 1,208 464 .95 .79 1,851 1,672 .90
Eighth 1,287 464 1,181 426 .92 .92 1,751 1,607 .92
Ninth 1,262 412 1,187 389 .94 .95 1,674 1,576 .94
Tenth 1,095 395 1,125 447 1.00 1.10 1,490 1,572 1.10
Students were asked two survey questions regarding attendance: how often they had been truant from school and how often they had missed school in order to work or assist at home. Most students reported that they never missed school without the permission of their family, with higher percentages of girls reporting so (86 percent n = 922) than boys (77 percent, n = 659). However, when asked how often they missed school to work or help at home, significantly more boys reported missing days from school (25 percent, n = 216) than girls (16 percent, n = 177), as depicted in Table 12.
19 Slightly more rural
students (21 percent, n = 288) than urban ones (18 percent, n = 105) missed days from school to work or assist at home
20. It should be noted that these figures may be underestimates, since students who are
often absent may not have been present in school when AIR conducted its visits.
Table 12. Student Absence Reports by Gender and School Type (Rural or Urban)
Number school days missed to work or help at home Boys Girls Rural Urban
None 636 (75%) 896 (84%) 1,052 (79%) 480 (82%)
15 days or less 197 (23%) 154 (14%) 256 (19%) 95 (16%)
16 to 30 days 10 (1%) 8 (1%) 12 (1%) 6 (1%)
More than 30 days 9 (1%) 15 (1%) 20 (1%) 4 (1%)
Total (n = 1,925) 852 1,073 1,340 585
19
t(31.525) = 3.584, p < .001 for missing school to work or help out at home based on gender. 20
t(13.030) = 1.937, ns, for missing school to work or help out at home based on locality.

25
3.4.5 Participation of children with disabilities
For students with disabilities to be able to participate in schools, a policy promoting equal participation is needed, including efforts to encourage their enrollment, accessible buildings, and teachers who know how to address their learning needs. Nearly all school heads (95.8 percent, n = 23) believed that students with disabilities were offered equal opportunities to participate in school activities. A total of 83 percent of school heads (n = 20) reported that the school screened students for learning disabilities. However, only half of the school heads (54.2 percent, n = 13) indicated that staff from the school went out into the community to encourage the enrollment of children with disabilities.
There was limited concern about the accessibility for children with physical disabilities across the schools. Observers found lack of accessibility for children with physical disabilities related to drinking water in 25 percent of the schools (n = 6); latrines and sinks in 12 percent of schools (n = 3); and to the building and classrooms in 8 percent of schools (n = 2).
21
Most school heads (75percent, n = 18) did not believe that they had teachers who were trained to work with students with disabilities. Lack of knowledgeable teachers may be one reason why some school staff may not have encouraged the enrollment of children with disabilities. Another reason provided by many school heads was the crowded conditions of the school and the lack of space to provide special education services.
3.4.6 Summary: Gender sensitive and inclusive
In this section, we explored the extent to which CFS in the Philippines have created an environment that responds to diversity and acts to ensure inclusion, gender sensitivity, and equality of opportunity for all children. We focused on the stakeholders’ perceptions of whether CFS were inclusive and accepting of all types of students, gender parity in enrollment and attendance, and the extent to which students with disabilities were encouraged to enroll, participate, and succeed in school. School heads, teachers, and parents reported that schools were inclusive, since children from every ethnic and religious background in the community attended the school and were not discriminated against. School heads targeted efforts to engage out-of-school children. Students were positive in their reports of the acceptance they felt from school staff toward themselves and their families. School heads, teachers, and students all perceived equal opportunities between boys and girls in the schools. Schools had parity in enrollment and attendance, but significantly more boys reported missing school to work or help the family. Reasons why some school staff may not have encouraged the enrollment of children with disabilities were lack of trained staff and lack of space within the schools.
3.5 Family and Community Involvement
UNICEF has encouraged community participation in schools through its CFS programming, and this focus was emphasized in the Philippines. The CFSS promotes ―working closely with children’s families and engages the support and interaction of community institutions.‖ In this section the evaluation examined the extent to which families were informed of what is happening at their child’s school and about their child’s progress, and the extent to which schools reached out to families to encourage their involvement in activities and decisions. In addition, we address whether school staff engaged with community institutions for material assistance or involved them in matters affecting the school. We conclude with a brief summary of key findings in this area.
21
For a complete review of school conditions, see Appendix E.

26
3.5.1 Families are informed about their child’s progress and they are encouraged to support learning
Parents, teachers, and school heads reported that regular meetings and dialogue occurred between teachers and parents. A Card Day or a homeroom meeting (i.e., an informal meeting when the parent drops off the child in the morning) were examples of when teachers met with parents to discuss their child’s performance and other issues. Parents also said that they could request additional meetings with teachers if they so desired. Similar to interview reports, every school head (n = 24) indicated that teachers kept families informed of student progress (at least twice during the school year) and that teachers contacted families promptly if there were concerns about a student’s learning or behaviour. In addition, school heads said that they encouraged parents to meet with teachers periodically to talk about their child’s progress.
Staff in every school also encouraged parents to support their child’s learning at home and talked to families about how to help their children with their academic studies. School heads and teachers used time at Parent–Teacher–Community Association (PTCA) meetings to provide tips to parents on how they could support their child’s learning at home to improve their study habits. For example, they asked parents to control playtime until homework was finished, have the child study more, and ensure he/she got plenty of sleep at night. Parents also checked their children’s assignments. Because of these efforts, some parents reported that they now felt like partners with the teachers.
3.5.2 Involvement of families in the schools
The PTCA was the main vehicle for family involvement in the schools. Through these organizations, families primarily provided their time and labour to improve the schools. For example, across schools, families prepared the building for the new school year in a campaign called brigada eskuela, or school brigade, by repairing, repainting, and cleaning classrooms. Families were also active in the school gardens. They planted, fertilized, and maintained the gardens, and harvested its vegetables. Parents also prepared nutritious snacks or meals for the feeding programs. In some schools, the PTCA also implemented construction projects to build additional classrooms, canteens, or playgrounds. In a few schools, families were concerned about children’s safety, and so they volunteered as security officers in the schools or acted as chaperones to help children cross over small streams nearby the school. School heads understood the burdens this placed on families, as expressed by this comment:
The school relies on the free labour that parents can contribute. The school recognizes this as a great debt of gratitude. Giving free labour may entail big sacrifice of their family, especially those surviving on a daily basis. (School 9)
Given all the efforts that PTCAs have directed toward the schools, it is not surprising that every school head (n = 24) reported that the school had an active PTCA. In addition, nearly all teachers (91.6 percent, n = 315) indicated that many parents came to events at the school. School heads attributed the active participation of families to the fact that they now knew what was happening in the schools and so were more cooperative and engaged.
3.5.2 Few schools involved families in decision making in the school
Nearly every school head reported that all types of families were encouraged to participate in decision making at the school, regardless of race, ethnicity, gender, language, disability, or religion (91.7 percent, n = 22). A total of 74 percent of teachers (n = 256) believed that families were involved in making decisions that affected the school.
Interview data indicated that involvement of families in schools was mainly in the form of voluntary labour efforts, rather than through making decisions affecting the school. Parents in only one school described being part of the school improvement planning process. In two other schools parents described topics at PTCA meetings in which their opinions were sought about issues related to school operations (e.g., cutting down trees and wearing uniforms). Perhaps one reason for the difference between the positive

27
survey results and the interview data is that school staff perceived family participation mainly in terms of resource support for the school rather than involvement in decisions.
3.5.3 Schools have engaged with community partners
In addition to family involvement, every school engaged the participation of community partners, such as NGOs and local, Barangay, and provincial government units. Schools involved community partners in three ways: (a) keeping the community informed about what is happening at the school, (b) engaging in partnerships with local businesses and/or community organizations to increase financial support for the school, and (c) advocating to increase awareness or create change.
Every school head reported that the school actively informed the community about what was happening at the school at least several times a year. One means of keeping the community informed was to attend monthly Barangay council meetings to discuss school problems, policies, or achievements. Other school heads used more informal means to communicate with Barangay or local government officials. The result of these efforts was a strong relationship between schools and Barangay or local government officials.
Because of the efforts to communicate with community partners, these groups provided financial and material assistance to the schools because they knew what was happening. Support included providing money or food for the feeding program, helping to clean the school, hosting social gatherings, painting the school with murals illustrating the CFSS principles, providing transportation to parents and children to school events, donating financial resources, and giving toothbrushes to young children. Because of the financial resources provided by community partners, schools were able to construct classrooms, canteens, playgrounds, footbridges, and fences around the school. The funding for materials was often provided by community groups, while the labour was donated by families. ―If we have the funds, we can construct additional classrooms by mobilizing parents to support school building through their free labour, if materials are available‖ (School 14).
In addition to financial support provided by Barangay, local, and provincial governments, some schools also engaged NGOs such as Miriam College and St. Vincent. These organizations supported schools by providing computers, training, books, uniforms, and school supplies for poor students. Every school head found the support provided by its community partners to be invaluable, and 95 percent of them (n = 23) reported that their school had partnerships with local businesses or community organizations to support student learning. Nearly all teachers (94.7 percent, n = 326) also thought that adults in the community supported the school.
In a few schools, parents and school heads also reported that they worked with NGOs and their local or Barangay officials for advocacy purposes. An urban school felt that the community violence needed to be addressed, and so the ―PTCA and Barangay officials reached out to parents and conducted a series of dialogues on how to establish peace and order in the community‖ (Parents, School 3). The issue of child labour was very important for rural schools, and so school heads involved Barangay officials and representatives of NGOs to change community perceptions. These efforts were described by parents:
Many children used to work in the rivers doing gold panning. Others were employed on small-scale mining industries. The community thought at first it was just fine until some groups came and told them that it was child labour. CFS was introduced also and the parents learned about child‟s rights to school. For parents, CFS means children are in school instead of working in the mining grounds during school days. Child-friendly school also means there is unity among parents, teachers, and Barangay officials in terms of addressing school issues such as school drop-out due to hunger and child labour. The school used to have lower enrollment due to gold panning activities. With the advocacy groups child labour was arrested. The parents and teachers asked the Barangay officials to enforce child‟s right to education. The Barangay captain then issued an ordinance banning school-age children to work in gold panning areas. Now the enrollment in the school has increased. Most of the children are now in school. (School 9)

28
3.5.4 Limited involvement of community partners in the management of schools
Every school head reported that the school included community members on all decision-making and advisory committees at the school. However, interview data indicated that involvement in the schools by the community was through financial or resource support, rather than making decisions affecting the school. Perhaps one reason for the difference between the positive survey results and the interview data is that school heads perceived community participation mainly in terms of assistance to the school, rather than involvement in decisions.
3.5.5 Summary: Family and community involvement
In this section, we sought to uncover the extent to which CFS in the Philippines have involved families and communities. We examined the extent to which families were kept informed about what was happening at their child’s school and about their child’s progress, and the extent to which the school reached out to encourage family and community institutions to be involved in activities and decisions. Regular meetings and dialogue occurred between teachers and parents to inform parents of their children’s progress. Parents supported their child’s learning at home, and through PTCAs they provided time and labour to assist the school. Few schools engaged parents in decision making about matters affecting the school; instead school staff perceived family participation mainly in terms of resource support for the school. Community institutions were also actively involved in schools by providing financial and material support, but not decision making input.

29
CHAPTER 4 – Conclusions and Recommendations
The Philippines elected to focus its CFS interventions to create schools that are effective for all children, healthy for all children, protective of all children, and inclusive and gender sensitive, and that involve families and community institutions. The conclusions and recommendations are presented as they relate to each of the foci listed above.
Effective for All Children
In the area of schools being effective for all children, there was progress in the use of child-centred pedagogy. Nearly all interviewed and surveyed teachers strongly supported the use of interactive teaching methods in their classroom and reported having opportunities for professional development. Nearly all teachers strongly agreed that it was their responsibility to ensure that all students in their class were successful.
Most students were interested in what they were learning and felt that they were being prepared appropriately for life after graduation. Students who attended schools with more attentive teachers (as defined by students’ perceptions of whether the teacher noticed when they had difficulty) were significantly more likely to report that they looked forward to coming to school and that they wished to complete secondary school, when compared with students who had less attentive teachers. Most classrooms in the Philippines had appropriate cleanliness, student work space, and blackboards, but some were inadequate in terms of protection from the elements, ventilation, and noise, and had poorly sized furniture, which occurred more often in rural schools. Instructional barriers included crowded classrooms with a large number of students (e.g., 50–70 students) and a lack of instructional resources such as workbooks, science equipment, or science books.
Thus, the following actions are recommended:
The Department of Education should focus on providing more support to schools that have large class sizes. This support could include hiring more teachers or possibly changing the school schedule so that large classes that currently meet once per day would be broken into smaller classes that meet at different times during a day. Smaller class sizes would provide teachers with more opportunities to attend to the needs of individual students, and students would have more work space and better access to learning materials (e.g., they would have to share less).
The Department of Education should also take steps to improve teachers’ capacities to provide effective education to all children. Teachers’ need access to training, continuous professional development, and mentoring in the areas of child-centred teaching methodologies.
Healthy for All Children
In the area of being healthy for all children, there was considerable emphasis in all the schools on providing health and nutrition services. All schools had feeding programs and gardens, and had leveraged family resources to participate in the financing and operation of these programs, but all parties were concerned with the sustainability of these programs. Depending upon the resources of the school, the feeding program (e.g., healthy snack or meal) operated daily or weekly. All schools provided annual health and dental screening, and empowered students with knowledge related to health education. The largest barrier to health in the Philippines was poor hygiene and sanitation in rural schools (due to a lack of water systems); this concern was not present in urban schools. Despite UNICEF efforts to provide electric water systems to rural schools, the lack of water has persisted because schools do not have the financial resources to pay for the electricity to operate the system.
Thus, the following actions are recommended:

30
UNICEF Philippines should consider acting as a coordinate to convene donors to seek additional funds to augment the supply of financial resources to assist the Department of Education in the Philippines. Additional investments should be made in school physical infrastructure to construct additional classrooms; improve water, sanitation, and ventilation infrastructure; and sustain the feeding program.
Protection for All Children
Providing protection for all children was a topic that school heads, teachers, and parents were aware of and believed was important. Teachers used positive forms of discipline with students and did not use corporal punishment. Every school head survey indicated that there was a policy for students to safely report instances of bullying, harassment, or harm from other students without fear. A majority of students reported that students accepted each other and interacted with and treated each other positively. However, a large minority of approximately 25 – 30 percent of students reported bullying and that they did not know how to resolve arguments without fighting.
Although school head survey results around the issue of student protection and safe schools were positive (i.e., every school head indicated that the school provided education to all students in the development of positive social and emotional skills), this was not substantiated by interview reports with teachers and parents.
Similarly, although nearly all teachers and students reported that they felt safe in the school, 35 percent of students reported that they sometimes stayed home because they were worried about safety. Based on the paradoxical results for similar questions related to school safety and student protection, more resources may need to be invested in developing teachers’ knowledge and skills regarding how they can enhance students’ emotional well-being since limited attention and resources seemed to have been devoted to this area.
The following actions are recommended:
The Department of Education should provide training for school heads and teachers on child-centred pedagogical techniques/methods and incorporate topics related to social–emotional learning (SEL)— specifically socialization (including conflict resolution and anti-bullying), emotional well-being, and cognitive development—into this training, so that more efforts will be focused upon students’ psychosocial health.
Inclusive and Gender-Sensitive to all Children
The Philippines was successful in developing inclusive and gender-sensitive environments at schools. Students from every ethnic and religious background in the community attended the schools and did not experience discrimination. School heads targeted efforts to engage out-of-school children. Students were largely positive in their reports of the acceptance they felt from school staff toward themselves and their families. School heads, teachers, and students all perceived equal opportunities between boys and girls in the schools. Schools had parity in enrollment and attendance, but significantly more boys reported missing school to work or help the family. Accessibility for students with physical disabilities was not a common problem in the schools. A barrier to inclusiveness was the lack of space and lack of training for staff in how to reach out to children with disabilities.
The following actions are recommended:
For schools to be able to educate children with disabilities, the Department of Education will need to provide additional training to teachers.
Schools and communities should convene and discuss the reasons behind boys’ poor attendance and promotion rates. School-based solutions and initiatives that address this problem should be documented and shared with the larger education community in the Philippines.

31
Involve Families and Community Institutions
Filipino families and community institutions were involved in the schools through regular meetings. Dialogue occurred regularly between teachers and parents to inform parents of their child’s progress. Parents also supported their child’s learning at home. In addition, through PTCAs, parents provided labour to assist the schools in tasks such as preparing the building for the new school year, planting and maintaining the school garden, preparing the feeding program, and implementing construction projects. However, few schools engaged parents in decision making about matters affecting the school; instead, school staff perceived family participation mainly in terms of resource and labour support for the school. Community institutions were also actively involved in schools by providing financial and material support, but not by providing input into decision making.
The following actions are recommended:
The Department of Education should offer workshops to school heads and parents to build a better understanding of how to involve parents and community institutions in schools, beyond providing resource support.

32
References
American Institutes for Research (2009). UNICEF Child Friendly Schools Programming: Global Evaluation Final Report. Washington DC: Author.
Battistich, V., & Horn, A. (1997). The relationship between students’ sense of their school as a community and their involvement in problem behaviors. American Journal of Public Health, 87, 1997-2001.
Bekuis, T. (1995). Unsafe public schools and the risk of dropping out: A longitudinal study of adolescents. Paper presented at the annual meeting of the Eastern Psychological Association, Boston, MA.
Chabbott, C. (2004). UNICEF‟s Child-Friendly Schools Framework: A Desk Review. Unpublished manuscript.
Christenson, S. L., & Thurlow, M. L. (2004). School dropouts: Prevention considerations, interventions, and challenges. Current Directions in Psychological Science, 13(1), 36-39.
Hamre, B. K., & Pianta, R. C. (2001). Early teacher-child relationships and the trajectory of children’s school outcomes through eighth-grade. Child Development, 72, 625-638.
Osher, D., & Kendziora, K. (in press). Building conditions for learning and healthy adolescent development: A strategic approach. In B. Doll, W. Pfohl, & J. Yoon, J. (Eds.), Handbook of Youth Prevention Science. New York: Routledge.
Osher, D., Dwyer, K., & Jimerson, S. (2006). Foundations of school violence and safety. In S. Jimerson & M. Furlong (Eds.), Handbook of school violence and school safety: From research to practice (pp.51–71). Mahwah, NJ: Erlbaum.
Osher, D., Sprague, S., Axelrod, J., Keenan, S., Weissberg, R., Kendziora, K., & Zins, J. (2007). A comprehensive approach to addressing behavioral and academic challenges in contemporary schools. In J. Grimes & A. Thomas (Eds.), Best Practices in School Psychology (5th ed., pp. 1263–1278). Bethesda, MD: National Association of School Psychologists.
Osher, D. Building Conditions for Learning and Healthy Adolescent Development: A Strategic Approach. Carter Center Annual Mental Health Symposium. Atlanta, GA. December 7, 2007.
Slap, G. B., Lot, L., Huang, B., Daniyam, C. A., Zink, T. M., & Succop, P. A. (2003). Sexual behaviour of adolescents in Nigeria: A cross sectional survey of secondary school students. British Medical Journal, 326, 1-6.
Teddlie, C. & Reynolds, D. (2000). School effectiveness research and the social and behavioral sciences. In C. Teddlie & D. Reynolds (Eds.), The international handbook of school effectiveness research (pp. 301-321). London: Falmer.
Wentzel, K. R., & Wigfield, A. (1998). Academic and social motivational influences on students’ academic performance. Educational Psychology Review, 10, 155-175.
UNICEF Philippines (no date). Child-Friendly School System CPC 6, 2005-2009. Manila: Philippines, Author.

33
Acknowledgements
Many people contributed to the evaluation and preparation of this report and the authors acknowledge their important contributions.
AIR staff who led the site visits to the six countries provided both superb technical leadership in the field and valuable insights to help us interpret the data that was collected: Mona Habib and Susan Skipper Caceres (Guyana); Markus Broer and Olivia Padilla (Nicaragua); Elizabeth Spier and Gwen Willis-Darpo (Nigeria); Luke Shors and Nitika Tolani-Brown (the Philippines and Thailand); and Tom Bewick and Cassandra Jessee (South Africa). Laurence (Lolo) Dessein organized the country site visits in collaboration with UNICEF country offices and supported the field teams from the home office with the support of Rob Hurtekant. Rima Azzam managed the project during the inception phase. Roy Zimmermann managed project logistics in the home office throughout the data collection period. Corbrett Hodson contributed to data analysis and report production. Miguel Socias developed the cost model and conducted analyses for the cost analysis. Elizabeth Spier played a key role in the development of many instruments. Judy Benjamin, Jeff Davis and Jerry Mindes provided quality assurance oversight throughout the project and reviewed drafts of the report and provided valuable suggestions. Mark Strickland of Schoolhouse Partners provided valuable consultation on the cost model and analyses.
The authors would like to thank the staff of the UNICEF country offices for the extraordinary effort they made to facilitate our country site visits, before, during and after our time in-country: in Guyana, Sekeywi Carruthers, Deguene Fall and Bhagmattie Bhojedat; in Nicaragua, Anyoli Sanabria, Maria Elena Ubeda and Fatima Aguado; in Nigeria, Maman Sidikou, Valentina Solarin and George Igelegbai; in the Philippines, Lulay de Vera and Martin Ignatius Bernardo; in Thailand, Rangsun Wiboonuppatum and Marut Jatiket; and in South Africa, Andries Viviers, Nadi Albino and Rosaria Kunda.
We thank Cream Wright, Changu Mannathoko and Maida Pasic of the Education Section and Sam Bickel and Kathleen Letshabo of the Evaluation Unit of UNICEF Headquarters for their guidance and support throughout the evaluation.
Finally, we thank the school heads, teachers, parents and students in the schools we visited for speaking with us about their experiences and the government, donor and NGO representatives that we met with during our site visits for taking the time to meet with us and help us understand CFS in their countries.

34
Appendix A: Scale Construction Items
Table A1 Challenging Student-Centred Learning Environment scale student survey items
Q49 When students master their lessons, they are given more challenging work.
Q51 The topics we are studying at this school are interesting.
Q64 Lessons at this school are boring. (R)
Q56 Every student is encouraged to participate in class discussions.
Q59 Teachers at this school will listen if you want to explain your answers in class or on assignments.
Q67 Students are encouraged to work together in class.
Q68 Students are encouraged to share their ideas and opinions in class.
Q12 I have given up on school. (R)
Q15 I want to complete secondary school.
Q20 Adults in the community encourage me to take school seriously.
Q23 Teachers and school staff believe that all students can learn.
Q44 Teachers at this school expect students like me to succeed in life.
Q52 Students at this school think that it is okay to cheat. (R)
Q53 Students at this school try to do a good job on their lessons, even if they are difficult or not interesting.
Table A2 Safe and Welcoming School Learning Environment scale student survey items
GO1 Students are protected from access by unauthorized adults while at school.
GO2 Students are within sight or hearing of school staff at all times except for brief periods (e.g., when using the latrine).
GO3 Students are not permitted to roam the hallways or school grounds when class is in session.
GO4 Students are not permitted to leave school grounds without the knowledge and permission of school staff.
GO5 Older students do not have unsupervised access to younger students while on school grounds (except siblings or other close family members).
GO6 School buildings are in good structural condition.
GO7 School buildings are in good physical condition (e.g., no peeling paint, broken windows, etc.)
GO21 Students have adequate space to work and play without being disturbed by others.
IA2 Toxic materials (e.g., cleaning chemicals) are kept inaccessible to students at all times.
IA3 The school keeps a stocked first aid kit accessible at all times.
OA1 If the school is located near a road, there is a physical barrier between traffic and school grounds.
OA2 School buildings and grounds have a welcoming appearance.
OA3 Examples of student work or achievements are displayed in common areas.
OA9 Outdoor play areas and equipment are safe and in good repair.
OA10 Students are protected from the elements while using outdoor play areas (e.g., protected from excessive sun, dust, rain, or wind).

35
Table A3 Healthy Learning Environment: Hygiene and Sanitation scale school observation items
GO8 Students and staff have ongoing, easy access to drinking water.
GO10 Functioning sinks with soap are located close to latrines.
GO12 Latrines are designed to allow students privacy.
GO13 There is an adequate number of functioning latrines available so that students do not have to wait an excessive amount of time to use them.
GO14 Latrines are safe and in good repair.
GO15 Latrines are accessible to classrooms.
GO16 Latrines and sinks are clean and sanitary.
GO17 Students and staff wash their hands after using latrines.
GO18 Students and staff wash their hands prior to eating or handling food.
GO19 Functioning sinks with soap are located close to food preparation areas.
GO20 Any food prepared and served at school is prepared and stored in sanitary conditions.
IA1 The school buildings are clean.
IA4 School buildings provide adequate protection from the elements (rain, heat, cold, wind, dust)
OA4 The school grounds are kept free of litter and garbage, except in designated containers.
OA5 The school grounds are kept free of unwanted animals and animal waste (e.g., stray dogs). Any school pets are kept in sanitary conditions.
OA6 The school has a sanitary system for the disposal of waste water.
OA7 The school has a sanitary system for the disposal of latrine waste.
OA8 Smoking is prohibited on the school grounds.

36
Table A4 Healthy Learning Environment: Child-Centred Services scale school head survey items
Q14 This school screens students for learning disabilities, such as difficulty with reading or mathematics.
Q15 This school has teachers who have been specially trained to work with students with disabilities.
Q16 Staff from this school goes out into the community to encourage the enrollment of children with disabilities.
Q17 Staff from this school goes out into the community to encourage the enrollment of minority students, students living in poverty, or others at risk for poor educational outcomes.
Q49 This school recruits teachers who speak the home language(s) of the students.
Q50 Students at this school have daily contact with a teacher who speaks their home language.
Q57 The school provides job-readiness skills education to all students in grades 5 and up.
Q51 The school is able to make referrals to community-based providers of medical and mental health services that are not offered by the school.
Q52 The school is able to access child welfare services and other support systems for orphans and vulnerable children.
Q54 The school provides health education to all students regarding the avoidance of high-risk behaviors (e.g., HIV/AIDS education, prevention of substance abuse).
Q55 The school provides health education to all students in the promotion of healthy daily living (e.g., nutrition, dental hygiene).
Q56 The school provides education to all students in the development of positive social and emotional skills.
Q58 Student health and development programs are adapted to meet local socio-cultural norms, values, and beliefs.
Q59 The school provides students with access to annual health examinations.
Q60 The school provides students with access to annual mental health screening.
Q61 The school provides micronutrient supplements to students who need them.
Q62 The school provides de-worming treatment of parasitic infections to students who need them.
Q63 The school provides routine vision and hearing screenings to students, and refers students to free or affordable follow-up services if needed.
Q64 The school uses height/weight screening to identify malnourished children.
Q65 The school has a feeding program for under-nourished students. [Mark „very true‟ if the program is provided to all students]
Q66 Students have an opportunity to eat at least every 4 hours while at school.
Q68 Students are allowed access to latrines and drinking water whenever they need them (not only at specified times).
Q71 The school’s water supply is checked regularly to ensure that it is always safe for drinking.
Q72 The school follows procedures to reduce the presence of disease vectors (e.g., mosquitoes) on or near school grounds.
Q76 There is at least one staff member present at all times who knows basic first aid.

37
Table A5 Safe, Respectful and Inclusive scale student survey items
Q24 I feel safe at my school.
Q25 I feel safe walking both to and from school.
Q26 I sometimes stay home from school because I am worried about my safety. (R)
Q30 This school is badly affected by crime and violence in the community. (R)
Q09 Students at this school help each other, even if they’re not friends.
Q13 Students at this school treat each other with respect.
Q19 If students see another student being picked on, they try to stop it.
Q27 Students at this school like to put each other down. (R)
Q28 This school is being ruined by bullies. (R)
Q34 There are some students in this school who nobody talks to. (R)
Q35 There are some students at this school who everybody teases. (R)
Q36 Students at this school think it is okay to fight someone who insults them. (R)
Q42 Students at this school know how to disagree without starting a fight or an argument.
Q31 My teachers treat me with respect.
Q38 This school places a high value on understanding and respecting children’s rights.
Q39 Teachers at my school say unkind things to students. (R)
Q41 Sometimes I do not want to come to school because of how the teachers treat me. (R)
Q45 Teachers at this school are interested in what students like me have to say.
Q21 I think that this school respects families like mine.
Q29 I look forward to coming to school.
Q32 Some types of students at this school are treated better than others by teachers and school staff. (R)
Q33 Both boys and girls have equal opportunities to succeed at this school.
Q43 This school is a welcoming place for all types of students.
Q46 When students break rules, they are treated fairly.
Q55 Adults in this school apply the same rules to all students equally.
Q63 I wish I went to a different school. (R)
Q65 The school is a welcoming and inviting place for families like mine.
Table A6 Inclusive Classroom Environment scale classroom observation items
I30 In general, boys and girls receive equal time and attention from the teacher.
I31 The teacher shows similar expectations for both boys and girls (e.g., asks questions of similar difficulty).
I32 In general, students receive equal time and attention regardless of their background (e.g., ethnicity, religion, language, etc).
I33 The teacher encourages and supports participation by struggling students.
Table A7 Student Participation scale teacher survey items
Q19 Students are involved in helping to solve school problems.
Q20 In this school, students are given a chance to help make decisions.
Q33 The principal (school director) asks students about their ideas.

38
Appendix B: School Head Survey Item-by-Item Responses
Table displays the percentage of the 24 participating school heads that provided each response
Not at
All True A Little Bit True
Mostly True
Very True
6 Some students in the community are unable to attend this school because they cannot pay school fees or school costs.
79.2 8.3 8.3 4.2
7 Students at this school are informed of their rights. 0.0 0.0 8.3 91.7
8 There is a procedure in place for students to safely report instances of bullying, harassment, or harm from other students without fear.
0.0 4.2 29.2 66.7
9 There is a procedure in place for students to safely report instances of bullying, harassment, or harm from teachers without fear.
0.0 12.5 16.7 70.8
10 Boys and girls are equally permitted and encouraged to participate in school activities.
0.0 0.0 0.0 100
11 Boys and girls are equally permitted and encouraged to participate in academic classes.
0.0 0.0 0.0 100
12 Boys and girls are equally permitted and encouraged to participate in physical activity at school.
0.0 0.0 4.2 95.8
13 Some students have difficulty attending school here because of transportation problems.
12.5 16.7 41.7 29.2
14 This school screens students for learning disabilities, such as difficulty with reading or mathematics.
12.5 4.2 20.8 62.5
15 This school has teachers who have been specially trained to work with students with disabilities.
37.5 37.5 4.2 20.8
16 Staff from this school goes out into the community to encourage the enrollment of children with disabilities.
16.7 29.2 25.0 29.2
17 Staff from this school goes out into the community to encourage the enrollment of minority students, students living in poverty, or others at risk for poor educational outcomes.
0.0 4.2 29.2 66.7
18 Staff from this school makes direct contact with families whose children drop out of school or are at risk of dropping out to encourage the child’s continued enrollment.
0.0 0.0 12.5 87.5
19 When students are absent from school for more than a few days, school staff makes direct contact with their families to find out what the problem is and to facilitate the child’s return to school as soon as possible.
0.0 0.0 16.7 83.3
20 My school has a written policy on educating all students, regardless of race, ethnicity, gender, language, disability, or religion.
4.2 4.2 12.5 79.2
21 Pregnant and parenting students are permitted to attend this school. 25.0 0.0 25.0 50.0
22 School staff regularly keeps families informed of student progress (at least twice during the school year).
0.0 0.0 0.0 100
23 School staff contacts families promptly if there are concerns about a student’s learning or behavior.
0.0 0.0 4.2 95.8
24 School staff talks to families about how to help their children with their academic studies.
0.0 0.0 4.2 95.8
25 School staff talks to families about child labour and children’s rights. 0.0 0.0 8.3 91.7
26 All teachers, students and parents have been told about the teacher code of conduct.
0.0 0.0 12.5 87.5
27 My school has a policy on appropriate teacher-student behavior. 0.0 0.0 16.7 83.3
28 This school has a policy prohibiting the release of student information or displaying or posting student information such as exam scores for the public to see.
50.0 4.2 12.5 33.3
29 Students play a formal role in decision-making at school (for example, through student government).
0.0 0.0 16.7 83.3
30 Students at this school plan and implement community outreach activities. 0.0 8.3 29.2 62.5
31 Students at my school have opportunities to serve in leadership roles, such as a member of the student council, governing board, or prefect.
0.0 4.2 8.3 87.5

39
Not at
All True A Little Bit True
Mostly True
Very True
32 This school actively informs the community about what is happening at the school at least several times a year.
0.0 0.0 12.5 87.5
33 This school provides information about what is happening at the school to families in a language and format they understand (written or oral).
0.0 4.2 0.0 95.8
34 This school provides information to all families about school policies on bullying, harassment, and physical and sexual violence to families in a language and format they understand (written or oral).
0.0 4.2 12.5 83.3
35 Teachers are given an opportunity to help plan school activities and participate in long term planning for the school.
0.0 0.0 0.0 100
36 This school includes community members on all decision-making and advisory committees.
0.0 0.0 16.7 83.3
37 This school provides training for community representatives on the school's decision-making or advisory committees.
0.0 12.5 20.8 66.7
38 All types of families are encouraged to participate in decision-making at this school, regardless of race, ethnicity, gender, language, disability, or religion.
0.0 8.3 16.7 75.0
39 This school has partnerships with local businesses or community organizations to support student learning.
0.0 4.2 16.7 79.2
40 The school conducts conferences with parents at least twice a year. 0.0 4.2 0.0 95.8
41 This school provides information on student progress to families in a language and format they understand (written or oral).
0.0 0.0 4.2 95.8
42 This school has an active Parent Teacher Association (PTA) or School Management Council (SMC).
0.0 0.0 4.2 95.8
43 This school holds regular teacher staff meeting on how to improve students' achievement.
0.0 0.0 4.2 95.8
44 This school conducts classroom observations of teachers. 0.0 0.0 8.3 91.7
45 This school teaches students about the history, culture, and traditions of different ethnic groups in our country.
0.0 0.0 20.8 79.2
46 Students regularly take part in activities like group projects, field trips, group brainstorming, etc.
0.0 4.2 37.5 58.3
47 Teachers in this school receive training on appropriate teacher conduct. 0.0 0.0 12.5 87.5
48 Teachers in this school have received training on how to use child-friendly methods of student discipline.
0.0 0.0 16.7 83.3
49 This school recruits teachers who speak the home language(s) of the students.
4.2 20.8 16.7 58.3
50 Students at this school have daily contact with a teacher who speaks their home language.
0.0 8.3 8.3 83.3
51 The school is able to make referrals to community-based providers of medical and mental health services that are not offered by the school.
0.0 8.3 16.7 75.0
52 The school is able to access child welfare services and other support systems for orphans and vulnerable children.
4.2 12.5 29.2 54.2
53 The school is able to teach students how to protect themselves from risks in the community.
0.0 0.0 0.0 100
54 The school provides health education to all students regarding the avoidance of high-risk behaviors (e.g., HIV/AIDS education, prevention of substance abuse).
0.0 0.0 8.3 91.7
55 The school provides health education to all students in the promotion of healthy daily living (e.g., nutrition, dental hygiene).
0.0 0.0 0.0 100
56 The school provides education to all students in the development of positive social and emotional skills.
0.0 0.0 8.3 91.7
57 The school provides job-readiness skills education to all students in grades 5 and up.
4.2 0.0 33.3 62.5
58 Student health and development programs are adapted to meet local socio-cultural norms, values, and beliefs.
0.0 4.2 25.0 70.8
59 The school provides students with access to annual health examinations. 4.2 4.2 20.8 70.8
60 The school provides students with access to annual mental health screening. 54.2 16.7 16.7 12.5

40
Not at
All True A Little Bit True
Mostly True
Very True
61 The school provides micronutrient supplements to students who need them. 12.5 16.7 16.7 54.2
62 The school provides de-worming treatment of parasitic infections to students who need them.
16.7 0.0 0.0 83.3
63 The school provides routine vision and hearing screenings to students, and refers students to free or affordable follow-up services if needed.
16.7 16.7 16.7 50.0
64 The school uses height/weight screening to identify malnourished children. 0.0 0.0 0.0 100
65 The school has a feeding program for under-nourished students. [Mark „very true‟ if the program is provided to all students]
8.3 0.0 29.2 62.5
66 Students have an opportunity to eat at least every 4 hours while at school. 4.2 4.2 25.0 66.7
67 Students are given a break in their studies of at least 15 minutes at least every 3 hours while at school.
8.3 4.2 20.8 66.7
68 Students are allowed access to latrines and drinking water whenever they need them (not only at specified times).
0.0 4.2 16.7 79.2
69 Teachers have a break away from students for at least 15 minutes, at least every 4 hours.
8.3 8.3 20.8 62.5
70 The school director is on site and accessible to staff and students at least half of the time.
0.0 0.0 4.2 95.8
71 The school’s water supply is checked regularly to ensure that it is always safe for drinking.
4.2 8.3 25.0 62.5
72 The school follows procedures to reduce the presence of disease vectors (e.g., mosquitoes) on or near school grounds.
0.0 0.0 16.7 83.3
73 School grounds are kept free from weapons. 0.0 0.0 8.3 91.7
74 School grounds are kept free from drugs and alcohol. 0.0 0.0 0.0 100
75 School staff has been trained in managing emergencies that impact the school.
0.0 12.5 20.8 66.7
76 There is at least one staff member present at all times who knows basic first aid.
0.0 8.3 20.8 70.8
77 Students with disabilities are offered equal opportunities to participate in school activities.
0.0 4.2 12.5 83.3

41
Appendix C: Teacher Survey Item-by-Item Responses
Table displays the percentage of the 344 participating teachers that provided each response
Not at
All True A Little Bit True
Mostly True
Very True
5 At this school, students and teachers get along really well. 0.6 3.5 28.9 67.1
6 Students in this school help each other, even if they are not friends. 0.6 7.2 40.2 52.0
7 This school fails to involve parents in most school events or activities. 83.2 4.6 6.1 6.1
8 At school, decisions are made based on what is best for students. 0.6 1.4 13.3 84.7
9 Teachers and students treat each other with respect in this school. 0.6 1.2 15.3 82.9
10 I trust the principal (school director) will keep his or her word. 1.2 2.6 20.2 76.0
11 At this school, it is difficult to overcome the cultural barriers between teachers and parents.
54.6 26.3 15.3 3.8
12 Teachers in this school treat each other with respect. 0.9 0.9 16.5 81.8
13 The principal (school director) and other leaders in this school make good decisions.
0.3 2.0 28.9 68.8
14 The school is a welcoming and inviting place for parents. 0.3 1.4 13.6 84.7
15 Adults in the community support this school. 0.9 4.3 30.3 64.5
16 Lots of parents come to events at this school. 0.9 7.5 29.2 62.4
17 The principal (school director) looks out for the personal welfare of school staff members.
2.9 3.2 27.2 66.8
18 Adults in the community encourage youth to take school seriously. 0.9 4.6 34.1 60.4
19 Students are involved in helping to solve school problems. 2.0 9.5 40.5 48.0
20 In this school, students are given a chance to help make decisions. 2.9 11.3 33.8 52.0
21 Adults in the community know what goes on inside schools. 2.6 6.1 43.4 48.0
22 Teachers and school staff believe that all students can learn. 0.3 1.7 14.7 83.2
23 Both boys and girls have equal opportunities to succeed at this school. 0.3 0.6 8.4 90.8
24 I feel safe at my school. 0.3 2.3 13.9 83.5
25 My students are safe at school. 0.9 0.3 15.6 83.2
26 This school is being ruined by bullies. 76.9 15.9 4.9 2.3
27 This school is badly affected by crime and violence in the community. 83.8 13.0 1.4 1.7
28 I am satisfied with my involvement with decision-making at this school. 1.4 5.8 28.9 63.9
29 When students break rules, they are treated fairly. 1.7 3.5 18.8 76.0
30 School staff members have a lot of informal opportunities to influence what happens here.
17.3 15.9 41.6 25.1
31 Crime and violence are or should be major concerns at school. 29.2 14.5 26.9 29.5
32 The work rules at this school make it easy for teachers to their jobs well. 0.6 4.6 30.1 64.7

42
Not at
All True A Little Bit True
Mostly True
Very True
33 The principal (school director) asks students about their ideas. 2.6 7.8 38.7 50.9
34 Health issues keep students at this school from learning as much as they should.
7.2 5.5 27.7 59.5
35 Hygiene is or should be a concern at this school. 2.0 4.6 13.9 79.5
36 All students should be encouraged to participate in class discussions. 0.0 0.6 6.4 93.1
37 Inadequate nutrition keeps students at this school from learning as much as they should.
20.2 21.7 33.8 24.3
38 Classroom learning is most effective when based primarily on lectures, with students responding when called on.
20.8 25.4 25.1 28.6
39 It is the teacher’s responsibility to ensure that all students in their class are successful.
0.3 4.0 24.3 71.4
40 Students can benefit academically from learning that takes place outside the classroom.
8.4 18.5 33.5 39.6
41 When teachers allow students to discuss or debate ideas in class, it takes time away from learning.
61.8 19.4 14.7 4.0
42 Students have better academic achievement in classrooms where their active participation in learning is encouraged.
0.3 1.4 13.3 85.0
43 It is the teacher’s responsibility to find a way to meet the learning needs of every student in their class.
0.0 1.4 16.2 82.4
44 This school provides me with adequate resources to help every student in my class to succeed.
3.5 13.3 37.0 46.2
45 This school provides a sanitary environment for staff and students. 1.2 5.2 25.7 67.9
46 Teachers should not make a lot of effort to help students who are behind in their work because it takes too much time away from the other students.
77.2 13.0 6.1 3.8
47 Teachers should focus their efforts on those students who have the best chance to succeed in life.
52.6 19.4 13.0 15.0
48 I am able to speak the home language of the students in my class. 8.7 27.5 25.7 38.2
49 Teachers at this school help each other. 0.6 3.2 17.1 79.2
50 Teachers in this school trust each other. 1.2 3.8 27.2 67.9
51 Teachers at this school are given ongoing opportunities to learn better techniques through workshops, seminars, or trainings.
0.3 1.4 14.7 83.5
52 I have been provided with professional development opportunities that have helped me to be a better teacher at this school.
0.6 3.2 24.9 71.4
53 School leadership provides teachers at this school with adequate support to continually improve their teaching methods.
0.0 3.2 26.9 69.9
54 School leadership provides teachers at this school with adequate support to continually improve their relationships with all types of students.
0.6 2.3 30.1 67.1
55 Teachers at this school provide each other with helpful feedback to improve their teaching methods.
1.4 2.9 28.9 66.8
56 Students at this school have the materials they need to learn. 2.9 23.7 39.3 34.1
57 Teachers at this school have the resources they need to plan effective lessons.
0.9 11.0 35.3 52.9
58 Teachers at this school are provided with an effective curriculum to guide their teaching.
0.3 3.2 22.5 74.0
59 Teachers at this school have adequate opportunities to prepare their lessons.
0.6 4.6 23.7 71.1
60 Some types of students at this school are treated better than others by teachers and school staff.
67.1 17.3 8.7 6.9
61 This school places a high value on understanding and respecting children’s rights.
0.0 1.7 12.4 85.8
62 I am unable to implement the curriculum as well as I would like because I don’t have the right materials available.
58.4 22.8 14.2 4.6

43
Not at
All True A Little Bit True
Mostly True
Very True
63 Families are involved in making decisions that affect this school. 8.1 17.3 28.0 46.5
64 This school is a welcoming place for all types of children. 0.3 0.9 4.9 93.9

44
Appendix D: Student Survey Item-by-Item Responses
Table displays the percentage of the 1,933 participating students that provided each response
Yes No Not
Applicable
3 Is the language that the teachers at your school use the same as the language you use at home?
51.0 49.0
4 Is the religion you practice at home the same as most other students at your school?
64.6 33.4 2.0
Mostly
Excellent Mostly Good
Mostly Fair
Mostly Poor/ Failing
5 What kind of grades do you usually get? 6.7 72.9 18.8 1.5
Yes No
6 Do you expect to continue your education next year? 97.8 2.2
Never Less than Once per
Month
Once per Month or
More
7 During the past year, how many days did you miss school without permission from the school or from your family?
81.8 13.9 4.3
Never 15 Days or Less
16 to 30 Days
More than 30 Days
8 During the past year, how many days did you have to miss school in order to work or to help out at home?
79.6 18.2 0.9 1.2
Not at All
True A Little Bit True
Mostly True
Very True
9 Students at this school help each other, even if they are not friends. 1.6 9.9 29.3 59.2
10 At school, decisions are made based on what is best for students. 2.3 3.8 12.7 81.2
11 I can talk with at least one adult at school about things that are bothering me.
9.5 17.6 33.8 39.1
12 I have given up on school. 83.4 5.2 4.9 6.5
13 Students at this school treat each other with respect. 2.4 6.9 22.9 67.8
14 The principal (school director) and other leaders in this school make good decisions.
2.1 2.9 10.1 84.9
15 I want to complete secondary school. 1.6 2.0 5.5 90.9
16 In this school, students are given a chance to help make decisions. 2.6 6.7 24.8 65.9
17 Teachers at this school really care about students like me. 3.3 3.3 13.0 80.3
18 Students are involved in helping to solve school problems. 8.8 10.6 30.4 50.2
19 If students see another student being picked on, they try to stop it. 6.7 11.6 26.2 55.5
20 Adults in the community encourage me to take school seriously. 1.9 3.7 12.3 82.2
21 I think that this school respects families like mine. 2.5 3.3 15.8 78.4
22 My family knows what goes on inside this school. 8.5 11.6 27.7 52.1
23 Teachers and school staff believe that all students can learn. 2.3 4.6 16.3 76.8
24 I feel safe at my school. 2.4 5.1 20.4 72.1

45
Not at All
True A Little Bit True
Mostly True
Very True
25 I feel safe walking both to and from school. 4.0 9.3 29.7 57.0
26 I sometimes stay home from school because I am worried about my safety.
49.4 15.8 16.7 18.2
27 Students at this school like to put each other down. 64.6 14.3 11.3 9.8
28 This school is being ruined by bullies. 54.2 20.5 14.3 11.0
29 I look forward to coming to school. 9.4 3.8 9.9 76.8
30 This school is badly affected by crime and violence in the community. 66.3 13.3 9.8 10.6
31 My teachers treat me with respect. 2.7 2.8 9.7 84.7
32 Some types of students at this school are treated better than others by teachers and school staff.
38.2 20.0 19.3 22.5
33 Both boys and girls have equal opportunities to succeed at this school. 2.4 4.0 12.0 81.6
34 There are some students in this school who nobody talks to. 59.9 18.4 12.6 9.2
35 There are some students at this school who everybody teases. 35.6 29.1 17.7 17.5
36 Students at this school think it is okay to fight someone who insults them. 56.2 20.7 11.4 11.7
37 This school does a good job teaching students what they really need to know in life.
2.4 4.2 11.3 82.0
38 This school places a high value on understanding and respecting children’s rights.
3.2 2.8 11.8 82.3
39 Teachers at my school say unkind things to students. 69.1 11.3 10.0 9.6
40 I feel safe everywhere at my school. 4.7 11.7 23.2 60.4
41 Sometimes I do not want to come to school because of how the teachers treat me.
78.8 8.1 6.4 6.7
42 Students at this school know how to disagree without starting a fight or an argument.
11.0 12.5 24.3 52.3
43 This school is a welcoming place for all types of students. 3.5 4.3 9.6 82.6
44 Teachers at this school expect students like me to succeed in life. 1.9 2.6 12.8 82.7
45 Teachers at this school are interested in what students like me have to say.
5.6 8.5 28.1 57.7
46 When students break rules, they are treated fairly. 17.3 16.2 22.7 43.8
47 This school does not try to help students who are behind in their work to catch up.
73.5 9.4 9.3 7.9
48 My teachers give me feedback on my assignments that help me to improve my work.
7.8 5.5 19.6 67.1
49 When students master their lessons, they are given more challenging work.
12.1 9.7 23.7 54.6
50 This school does a good job in preparing students to continue on for more education after they graduate.
3.7 3.1 11.4 81.9
51 The topics we are studying at this school are interesting. 1.9 2.7 17.0 78.4
52 Students at this school think that it is okay to cheat. 80.1 10.0 5.5 4.3
53 Students at this school try to do a good job on their lessons, even if they are difficult or not interesting.
4.4 7.6 21.6 66.3
54 Adults in this school are usually willing to give students extra help. 4.0 5.9 22.2 67.8

46
Not at All
True A Little Bit True
Mostly True
Very True
55 Adults in this school apply the same rules to all students equally. 6.3 7.4 19.8 66.5
56 Every student is encouraged to participate in class discussions. 3.2 5.1 15.9 75.9
57 Teachers notice if I am having difficulty with my lessons. 3.7 9.0 27.6 59.7
58 Teachers give students opportunities to improve their work if they do poorly on an assignment.
4.8 5.2 18.2 71.9
59 Teachers at this school will listen if you want to explain your answers in class or on assignments.
1.7 3.5 12.2 82.6
60 Students at this school have the materials they need to support their learning.
5.7 8.7 22.4 63.1
61 Sometimes I am too hungry to pay attention in school. 44.7 22.6 18.0 14.7
62 I can talk to teachers or other adults at school if I am having problems in class.
7.1 11.4 24.2 57.4
63 I wish I went to a different school. 63.7 12.6 10.4 13.3
64 Lessons at this school are boring. 75.0 10.8 6.2 8.0
65 The school is a welcoming and inviting place for families like mine. 5.8 7.7 19.7 66.8
66 Families like mine are involved in making decisions that affect this school. 14.8 13.7 23.1 48.4
67 Students are encouraged to work together in class. 4.0 5.4 17.0 73.7
68 Students are encouraged to share their ideas and opinions in class. 5.5 6.4 20.3 67.8
69 It is difficult for students like me to get extra help from teachers. 41.5 18.4 18.8 21.3
70 The principal (school director) asks students about their ideas. 8.1 8.9 19.6 63.3

47
Appendix E: School Observation Item-by-Item Responses
Table displays the percentage of the 25 school observations that received each rating
Not at all
True Somewhat
True Very True
Outdoor Areas
1 If the school is located near a road, there is a physical barrier between traffic and school grounds.
4.0 4.0 92.0
2 School buildings and grounds have a welcoming appearance. 0.0 16.0 84.0
3 Examples of student work or achievements are displayed in common areas. 4.0 28.0 68.0
4 The school grounds are kept free of litter and garbage, except in designated containers.
0.0 16.0 84.0
5 The school grounds are kept free of unwanted animals and animal waste (e.g., stray dogs). Any school pets are kept in sanitary conditions.
16.0 8.0 76.0
6 The school has a sanitary system for the disposal of waste water. 12.0 16.0 72.0
7 The school has a sanitary system for the disposal of latrine waste. 4.0 16.0 80.0
8 Smoking is prohibited on the school grounds. 0.0 4.3 95.7
9 Outdoor play areas and equipment are safe and in good repair. 4.3 43.5 52.2
10 Students are protected from the elements while using outdoor play areas (e.g., protected from excessive sun, dust, rain, or wind).
28.0 20.0 52.0
11 All outdoor play areas are accessible to students with physical disabilities. 0.0 24.0 76.0
Indoor Areas
1 The school buildings are clean. 0.0 16.0 84.0
2 Toxic materials (e.g., cleaning chemicals) are kept inaccessible to students at all times.
0.0 0.0 100
3 The school keeps a stocked first aid kit accessible at all times. 8.7 39.1 52.2
4 School buildings provide adequate protection from the elements (rain, heat, cold, wind, dust)
0.0 24.0 76.0
General Observations
1 Students are protected from access by unauthorized adults while at school. 0.0 20.0 80.0
2 Students are within sight or hearing of school staff at all times except for brief periods (e.g., when using the latrine).
0.0 4.0 96.0
3 Students are not permitted to roam the hallways or school grounds when class is in session.
0.0 0.0 100
4 Students are not permitted to leave school grounds without the knowledge and permission of school staff.
0.0 4.0 96.0
5 Older students do not have unsupervised access to younger students while on school grounds (except siblings or other close family members).
0.0 16.0 84.0
6 School buildings are in good structural condition. 0.0 40.0 60.0
7 School buildings are in good physical condition (e.g., no peeling paint, broken windows, etc.)
4.0 64.0 32.0
8 Students and staff have ongoing, easy access to drinking water. 20.0 40.0 40.0
9 Drinking water is accessible to students with disabilities. 25.0 20.8 54.2
10 Functioning sinks with soap are located close to latrines. 40.0 36.0 24.0

48
Not at all
True Somewhat
True Very True
11 Latrines and sinks are accessible to students with disabilities. 12.5 20.8 66.7
12 Latrines are designed to allow students privacy. 0.0 8.0 92.0
13 There is an adequate number of functioning latrines available so that students do not have to wait an excessive amount of time to use them.
12.0 24.0 64.0
14 Latrines are safe and in good repair. 0.0 32.0 68.0
15 Latrines are accessible to classrooms. 4.0 20.0 76.0
16 Latrines and sinks are clean and sanitary. 4.0 48.0 48.0
17 Students and staff wash their hands after using latrines. 10.0 65.0 25.0
18 Students and staff wash their hands prior to eating or handling food. 4.8 57.1 38.1
19 Functioning sinks with soap are located close to food preparation areas. 27.3 27.3 45.5
20 Any food prepared and served at school is prepared and stored in sanitary conditions.
0.0 18.2 81.8
21 Students have adequate space to work and play without being disturbed by others. 4.0 28.0 68.0
22 All school buildings and classrooms are accessible to students with physical disabilities.
8.3 16.7 75.0
23 Students with disabilities are grouped with non-disabled students whenever possible.
18.8 0.0 81.3
24 Students are not separated into different groups for instruction or school activities based on cultural or social background (with the exception of language instruction or transitional programs if needed).
0.0 4.3 95.7

49
Appendix F: Classroom Observation Item-by-Item Responses
Table displays the percentage of the 48 observed classrooms that received each rating
Not at All
True Somewhat
True Very True
1 The classroom is protected from the elements (solid roof, walls, and floor). 2.1 20.8 77.1
2 The classroom has adequate ventilation. 2.1 31.3 66.7
3 The classroom is a comfortable temperature. 6.3 31.3 62.5
4 The classroom lighting is adequate for students to work. 2.1 29.2 68.8
5 The classroom is clean and orderly (the floor is clean, the tables are orderly, no garbage on the floor).
0.0 29.2 70.8
6 Outside noise does not affect communication within the classroom. 8.5 27.7 63.8
7 Students each have sufficient space to work. 0.0 31.3 68.8
8 Students each have a chair or bench to sit on while working. 0.0 14.6 85.4
9 Furniture is of the right size for students to work comfortably. 6.3 18.8 75.0
10 There is a blackboard/whiteboard in the classroom that all students can see clearly from their seats.
0.0 4.2 95.8
11 Posters, artwork, or maps (commercially produced or handmade) appear on the walls of the classroom.
4.2 12.5 83.3
12 There are examples of student work or projects visible in the classroom. 27.1 29.2 43.8
13 The teacher presents lessons in a well-prepared and organized manner. 0.0 2.1 97.9
14 The teacher maintains an engaging class, without pressuring the students. 0.0 4.2 95.8
15 The teacher facilitates discussions among students. 0.0 10.9 89.1
16 The teacher gives the students the opportunity to present their work to the rest of the class in groups or on their own.
0.0 4.3 95.7
17 The teacher asks questions that facilitate higher order thinking activities (e.g., application, analysis, synthesis, and evaluation, etc).
0.0 20.8 79.2
18 The teacher relates information presented in the lesson to students’ lives outside of the classroom, or to life skills or social emotional learning.
0.0 18.8 81.3
19 While the students are working, the teacher moves around the classroom to provide support and guidance.
2.1 17.0 80.9
20 The teacher addresses students by name. 0.0 10.4 89.6
21 The teacher communicates both verbally and nonverbally in a positive and friendly manner.
0.0 4.2 95.8
22 The teacher interacts with the students in a respectful manner. 0.0 4.2 95.8
23 The teacher uses positive methods to manage student behavior. 0.0 0.0 100
24 The teacher adapts lessons for student with special learning needs. 0.0 24.4 75.6
25 The students pay attention when the teacher gives them instructions. 0.0 8.5 91.5
26 The students ask the teacher questions.
27 The majority of the students participate in class activities.
28 The students spend little time (less than 20 percent) copying the lesson literally from the textbook or chalkboard into their notebooks.
0.0 30.2 69.8

50
Not at All
True Somewhat
True Very True
29 The students interact with the teacher in a respectful manner. 0.0 10.4 89.6
30 In general, boys and girls receive equal time and attention from the teacher. 2.2 28.3 69.6
31 The teacher shows similar expectations for both boys and girls (e.g., asks questions of similar difficulty).
0.0 2.1 97.9
32 In general, students receive equal time and attention regardless of their background (e.g., ethnicity, religion, language, etc).
0.0 2.1 97.9
33 The teacher encourages and supports participation by struggling students. 0.0 4.2 95.8