Embed Size (px)
Citation preview

WESTERN AUSTRALIASTATE BUDGET2020-21
READER’S GUIDEto the 2020-21 Budget Statements
Reader’s Guide to the 2020-21 Budget Statements
© Government of Western Australia
Acknowledgement of Country
The Government of Western Australia acknowledges the traditional custodians throughout Western Australia and their continuing connection to the land, waters and community. We pay our respects to all members of Aboriginal communities and their cultures; and to Elders past, present and emerging.
Excerpts from this publication may be reproduced, with appropriate acknowledgement, as permitted under the Copyright Act 1968.
For further information please contact:Department of TreasuryLocked Bag 11 Cloisters Square WA 6850Telephone: +61 8 6551 2777Facsimile: +61 8 6551 2500Email: [email protected]: http://www.ourstatebudget.wa.gov.au
Published October 2020
ISSN 1448–2630
Reader’s Guide to the 2020-21 Budget Statements
Contents
What is in the Budget Papers? ............................................................................................. 1
Budget Paper No. 1 – 2020-21 Treasurer’s Speech ............................................................ 1
Budget Paper No. 2 – 2020-21 Budget Statements ........................................................... 1
Budget Paper No. 3 – 2020-21 Economic and Fiscal Outlook ............................................ 1
Budget Paper No. 2 ............................................................................................................... 2
Introduction .......................................................................................................................... 2
Budget Paper No. 2 – Chapter 3: Agency Information in Support of the Estimates ............ 2
Illustrative Example .............................................................................................................. 3
Illustrative Budget Tables ..................................................................................................... 4
Appropriations, Expenses and Cash Assets ........................................................................ 4
Spending Changes .............................................................................................................. 5
Significant Issues Impacting the Agency.............................................................................. 5
Outcomes, Services and Key Performance Information ...................................................... 5
Asset Investment Program................................................................................................... 9
Financial Statements ......................................................................................................... 10
Net Appropriation Determination ........................................................................................ 16
Reconciliation Relating to Major Functional Transfers and Accounting Policy Changes .. 17
Details Of Administered Transactions ............................................................................... 18
Special Purpose Account Details ....................................................................................... 18
Glossary ............................................................................................................................... 19
Reader’s Guide to the 2020-21 Budget Statements
1
What is in the Budget Papers?
BUDGET PAPER NO. 1 – 2020-21 TREASURER’S SPEECH
This is the Budget speech delivered in Parliament by the Treasurer on 8 October 2020. It outlines the priorities of the Government for the budget year and is the formal second reading of the Recurrent and Capital Appropriation Bills.
BUDGET PAPER NO. 2 – 2020-21 BUDGET STATEMENTS
This paper supports the Appropriation Bills and provides details in relation to the amounts to be appropriated by the Parliament in passing the Bills. It provides financial and performance information for agencies receiving appropriations from the Consolidated Account. It comprises the following chapters:
Chapter 1 – Consolidated Account Expenditure Estimates
Summarises appropriations from the Consolidated Account. The item numbers in this chapter correspond to the Appropriation Bills presented to the Parliament. Chapter 1 also gives a summary view of past appropriations plus estimated forward projections.
Chapter 2 – Net Appropriation Determinations
Summarises the total revenue retained by agencies under net appropriation determinations. These determinations allow the agencies to retain certain revenue received and to apply that revenue towards the delivery of services as specified in agency disclosures in Chapter 3. For detailed Net Appropriation Determinations, please refer to individual Agency Budget Statements in Chapter 3: Agency Information in Support of the Estimates.
Chapter 3 – Agency Information in Support of the Estimates
Presents detailed financial and performance information by agency consistent with summary level information disclosed in Chapters 1 and 2.
BUDGET PAPER NO. 3 – 2020-21 ECONOMIC AND FISCAL OUTLOOK
This paper outlines the key economic and other assumptions underlying the Budget and analyses the fiscal position of, and forecast results for, the public sector as a consolidated whole. It does so at a whole-of-government level as well as for the components of the public sector – the general government sector, public financial corporations and public non‑financial corporations. It assesses the Budget aggregates against the Government’s financial targets.
Note: Due to the delay of the release of the 2020-21 Budget to 8 October 2020, which is after the release of the 2019-20 Annual Report on State Finances and agency Annual Reports, the 2019‑20 Actuals will be reflected in financial tables in Budget Papers 2 and 3 rather than the Estimated Out‑Turn as is usually the case.
A glossary of terms frequently used in the Budget Papers can be found at the back of this Reader’s Guide.

Reader’s Guide to the 2020-21 Budget Statements
2
Budget Paper No. 2
INTRODUCTION
Budget Paper No. 2 supports the Appropriation Bills and provides detail in relation to the amounts to be appropriated by the Parliament in passing the Bills. It provides financial and performance information for government agencies that operate primarily with Parliamentary appropriation funding (thereby receiving funds from the Consolidated Account). Public non‑financial corporations, public financial corporations and agencies not fully funded by Parliamentary appropriation report only their Asset Investment Program in this Budget Paper.
The Budget Papers are presented on an accrual accounting basis. Accrual accounting discloses the full cost of providing government services and indicates the ability of the public sector to deliver sustainable services into the future.
Financial data presented in the 2020-21 Budget Papers are based on data collected from the State’s public sector agencies using Australian accounting standards.
BUDGET PAPER NO. 2 – CHAPTER 3: AGENCY INFORMATION IN SUPPORT OF THE ESTIMATES
Agency details are arranged by Ministerial portfolio, and include activity and performance projections for 2020-21 (the Budget year). The presentation structure for a government agency supported by service appropriation includes:
• Appropriations, Expenses and Cash Assets;
• Spending Changes;
• Significant Issues Impacting the Agency;
• Resource Agreement;
• Outcomes, Services and Key Performance Information:
− Relationship to Government Goals;
− Service Summary;
− Outcomes and Key Effectiveness Indicators; and
− Services and Key Efficiency Indicators;
• Asset Investment Program;
• Financial Statements:
− Income Statement;
− Details of Controlled Grants and Subsidies;
− Statement of Financial Position;
− Statement of Cashflows; and
− Net Appropriation Determination;
Reader’s Guide to the 2020-21 Budget Statements
3
• Reconciliation Relating to Major Functional Transfers and Accounting Policy Changes;
• Details of Administered Transactions; and
• Agency Special Purpose Account Details.
ILLUSTRATIVE EXAMPLE
The purpose of presenting the following illustrative budget tables is to assist readers with understanding Budget Paper No. 2 – Chapter 3: Agency Information in Support of the Estimates. The illustration demonstrates specific examples of the information contained within the Budget Statements at agency level.
Please note that not all disclosures in this example will apply to all agencies’ Budget Statements. For example, administered transactions only apply when the agency has administered activities and/or functions.
Reader’s Guide to the 2020-21 Budget Statements
4
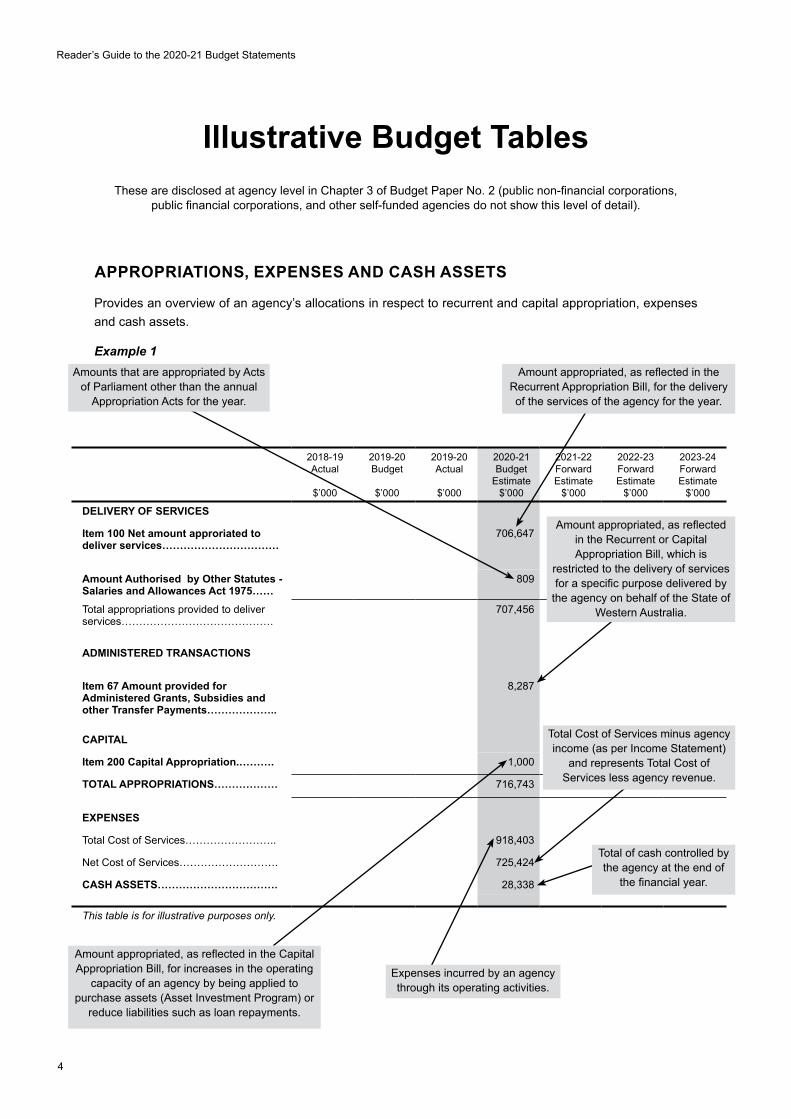
Illustrative Budget TablesThese are disclosed at agency level in Chapter 3 of Budget Paper No. 2 (public non‑financial corporations,
public financial corporations, and other self‑funded agencies do not show this level of detail).
APPROPRIATIONS, EXPENSES AND CASH ASSETS
Provides an overview of an agency’s allocations in respect to recurrent and capital appropriation, expenses and cash assets.
Example 1
2018-19 Actual
$’000
2019-20 Budget
$’000
2019-20 Actual
$’000
2020-21 Budget
Estimate$’000
2021-22 Forward Estimate
$’000
2022-23 Forward Estimate
$’000
2023-24 Forward Estimate
$’000
DELIVERY OF SERVICES
Item 100 Net amount approriated to deliver services……………………………
706,647
Amount Authorised by Other Statutes - Salaries and Allowances Act 1975……
809
Total appropriations provided to deliver services…………………………………….
707,456
ADMINISTERED TRANSACTIONS
Item 67 Amount provided for Administered Grants, Subsidies and other Transfer Payments………………..
8,287
CAPITAL
Item 200 Capital Appropriation.………. 1,000
TOTAL APPROPRIATIONS……………… 716,743
EXPENSES
Total Cost of Services…………………….. 918,403
Net Cost of Services………………………. 725,424
CASH ASSETS……………………………. 28,338
This table is for illustrative purposes only.
Amounts that are appropriated by Acts of Parliament other than the annual
Appropriation Acts for the year.
Amount appropriated, as refl ected in the Recurrent Appropriation Bill, for the delivery of the services of the agency for the year.
Amount appropriated, as refl ected in the Capital Appropriation Bill, for increases in the operating
capacity of an agency by being applied to purchase assets (Asset Investment Program) or
reduce liabilities such as loan repayments.
Expenses incurred by an agency through its operating activities.
Total Cost of Services minus agency income (as per Income Statement)
and represents Total Cost of Services less agency revenue.
Total of cash controlled by the agency at the end of
the fi nancial year.
Amount appropriated, as refl ected in the Recurrent or Capital Appropriation Bill, which is
restricted to the delivery of services for a specifi c purpose delivered by
the agency on behalf of the State of Western Australia.

Reader’s Guide to the 2020-21 Budget Statements
5
SPENDING CHANGES
Outlines movements in recurrent expenditure since publication of the preceding year’s Budget.
Example 2
Recurrent spending changes, other than cashflow timing changes and non‑discretionary accounting adjustments, impacting on the agency’s Income Statement since presentation of the 2019-20 Budget to Parliament on 9 May 2019 are outlined below:
2019-20 Actual
$’000
2020-21 Budget
Estimate $’000
2021-22 Forward Estimate
$’000
2022-23 Forward Estimate
$’000
2023-24 Forward Estimate
$’000
New Initiatives
Item 1…………………………………….. - 1,000 1,500 2,000 2,500
Item 2…………………………………….. - 1,000 1,000 1,000 1,000
Ongoing Initiatives
Item 3…………………………………….. - (2,000) - - -
Other
Item 4…………………………………….. - - 5,000 - -
SIGNIFICANT ISSUES IMPACTING THE AGENCY
Demonstrates the impact that significant issues and major achievements have had or are expected to have on the achievement of government desired outcomes, and the associated financial and non‑financial (performance) targets.
Narrative contains a concise explanation of the issue, achievement or challenge and explains what the agency has done or will do and the actual or potential impact on its performance. The information is pitched at a strategic level rather than an operational or service level.
Example 3
Significant Issues Impacting the Agency
Department of ABC
1. In these challenging financial and economic circumstances, the Department‘s advice to Government will focus intensely on ensuring value for money outcomes, identifying opportunities for reform in service delivery, and ensuring the State’s long‑term financial sustainability.
This table is for illustrative purposes only.
OUTCOMES, SERVICES AND KEY PERFORMANCE INFORMATION
Provides information on the agency’s progress towards achievement of Government desired outcomes through the funding and delivery of services. In addition to assisting interested parties to assess agency performance in achieving desired outcome(s) and obtaining value for taxpayers’ funds from services delivered, the performance information is also available to help agencies understand their own performance – facilitating strategic planning, enhancing resource management and highlighting areas for improvement.

Reader’s Guide to the 2020-21 Budget Statements
6
Relationship to Government Goals
Demonstrates the link between the most appropriate high level government goal and the more specific agency level government desired outcome(s). Agencies are funded to deliver services and achieve the desired outcomes, which ultimately contribute to meeting the high level government goals.
Example 4
Government Goal(s) Desired Outcome(s) Service(s)Sustainable Finances:
Responsible fi nancial management and better service delivery.
A strong and competitive State economy.
3. Economic and Revenue Forecasts and Policy Development
This table is for illustrative purposes only.
One of four broad priority areas of government, which are able to be linked to the agency level
outcomes.
The intended results to be achieved through the delivery
of services by government agencies
The services delivered by a government agency in order to achieve the desired outcomes.
Service Summary
Provides a summary of the total cost of services (expenditure) for each service identified in an agency’s Outcome Based Management structure. Information on the estimated annual cost of each service covers the period up to the Budget year and across the forward estimates.
Example 5
Expense
2018-19Actual
$’000
2019-20Budget
$’000
2019-20Actual
$’000
2020-21Budget
Estimate$’000
2021-22ForwardEstimate
$’000
2022-23ForwardEstimate
$’000
2023-24ForwardEstimate
$’000
1. Service 17,899
2. Service 446,981
3. Economic and Revenue Forecasts and Policy Development 405,358
4. Service 48,165
Total Cost of Services 918,403
This table is for illustrative purposes only.Refl ects the Total Cost of Services
contained in the Appropriations, Expenses and Cash Assets table (Example 1).

Reader’s Guide to the 2020-21 Budget Statements
7
Outcomes and Key Effectiveness Indicators
Provides meaningful performance management information. In this regard, outcomes are defined as the effect or impact on the community or target clients of government services. Key effectiveness indicators provide information on the extent to which outcomes have been achieved through funding and delivery of agreed services. At least one audited key effectiveness indicator is required to be reported for each agency level government desired outcome disclosed in the Budget Statements. Information disclosed must be consistent with that disclosed in agency annual reports.
Example 6
2018-19Actual
2019-20Budget
2019-20Actual
2020-21BudgetTarget
Note
Outcome: A strong and competitive State economy:
Accuracy of key general government revenue forecasts:
Tax revenue -10.5% ±5% -4.9% ±5%
Mining revenue -10.3% ±3% 2.5% ±3%
This table is for illustrative purposes only.
Outcomes are the intended results to be achieved through the delivery of services.
Audited key eff ectiveness indicators.
Reader’s Guide to the 2020-21 Budget Statements
8
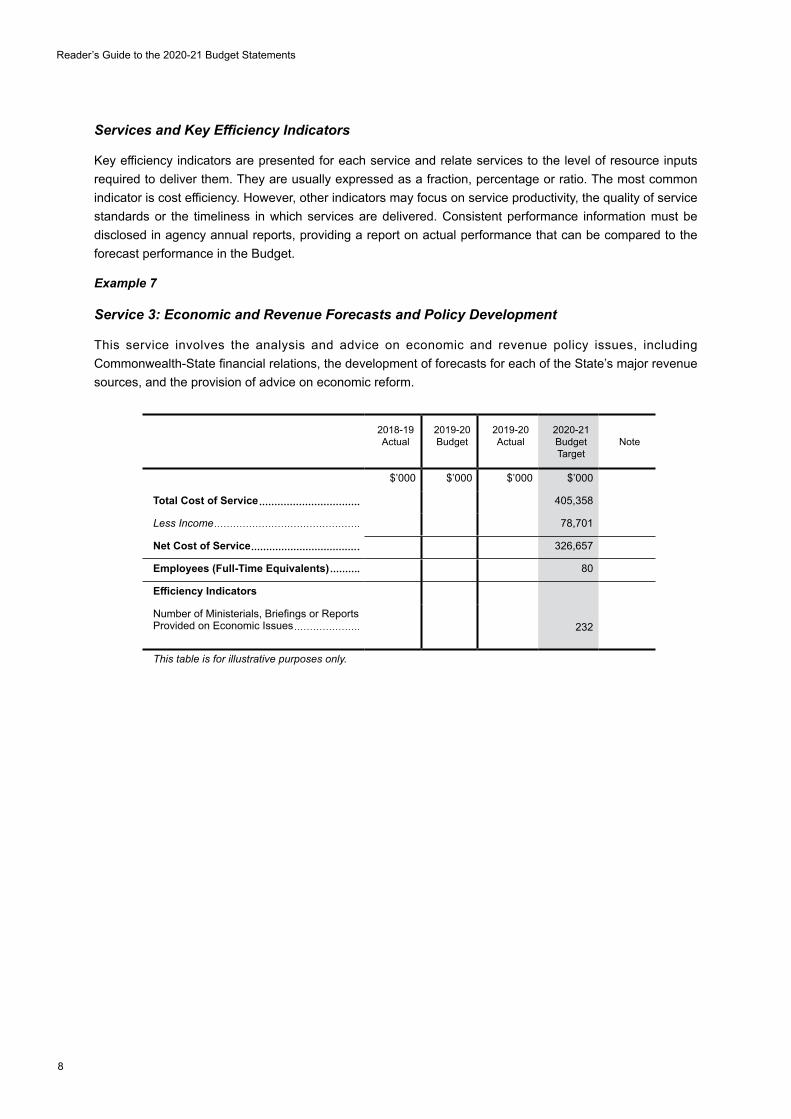
Services and Key Efficiency Indicators
Key efficiency indicators are presented for each service and relate services to the level of resource inputs required to deliver them. They are usually expressed as a fraction, percentage or ratio. The most common indicator is cost efficiency. However, other indicators may focus on service productivity, the quality of service standards or the timeliness in which services are delivered. Consistent performance information must be disclosed in agency annual reports, providing a report on actual performance that can be compared to the forecast performance in the Budget.
Example 7
Service 3: Economic and Revenue Forecasts and Policy Development
This service involves the analysis and advice on economic and revenue policy issues, including Commonwealth‑State financial relations, the development of forecasts for each of the State’s major revenue sources, and the provision of advice on economic reform.
2018-19Actual
2019-20Budget
2019-20Actual
2020-21Budget Target
Note
$’000 $’000 $’000 $’000
Total Cost of Service 405,358
Less Income 78,701
Net Cost of Service 326,657
Employees (Full-Time Equivalents) 80
Efficiency Indicators
Number of Ministerials, Briefings or Reports Provided on Economic Issues 232
This table is for illustrative purposes only.

Reader’s Guide to the 2020-21 Budget Statements
9
ASSET INVESTMENT PROGRAM
Provides information on an agency’s Asset Investment Program for the Budget year and projections for the forward estimates and is comprised solely of fixed asset purchases.
Example 8
1. The Department’s planned Asset Investment Program for 2020-21 is approximately $223.2 million, comprising $44.1 million for works in progress and $179.1 million for new works. Significant programs in 2020‑21:
1.1. Program A.1 – $8.4 million; and
1.2. Program A.2 – $35.8 million.
2. Asset investment on Project C in 2020-21 ($177.6 million) makes up most of the new works scheduled in 2020-21.
Estimated Total Cost
$’000
Actual Expenditure to 30-6-20
$’000
2019-20Expenditure
$’000
2020-21Budget
Estimate$’000
2021-22Forward Estimate
$’000
2022-23Forward Estimate
$’000
2023-24Forward Estimate
$’000
WORKS IN PROGRESSProject A
Program A.1 8,356
Program A.2 35,781
COMPLETED WORKSProject B 181,166 -
NEW WORKSProject A
Program A.3 2020-21 1,445
Election Commitment – Project C 177,645
Total Cost of Asset Investment Program
181,166
223,227
Loan and other Repayments 1,000
Total 181,166 224,227
FUNDED BYCapital Appropriation 39,190
Drawdowns from the Holding Account 5,992
Asset Sales 92,306
Internal Funds and Balances 181,166 73,352
Resources Received Free of Charge from BMW 13,387
Borrowings -
Other -
Total Funding 181,166 224,227
This table is for illustrative purposes only.
Reader’s Guide to the 2020-21 Budget Statements
10
FINANCIAL STATEMENTS
Provides summary information on the net cost of the agency’s activities, assets, liabilities and equity, and cash movements for each financial year. A brief commentary in support of each financial statement is also provided to assist readers in understanding and interpreting the agency’s financial position. Agencies are required to publish full audited financial statements in their annual report in accordance with Australian accounting standards.
Income Statement
The Income Statement presents information on expenses and income, and the resulting net cost of the agency’s activities in a financial year.
The net cost of services reported in this statement impacts on the Government’s net operating balance financial target.
Expenses are costs incurred by an agency through its operating activities. Employee costs, supplies and services, interest and grants are some of the common expenses incurred by agencies.
Expenses are recorded in the Income Statement when an obligation requiring payment is entered into (regardless of whether that payment is to be made immediately or at some time in the future), or when an economic benefit is used. This is why expense amounts in the Income Statement may differ from similarly categorised payments for operating activities in the Statement of Cashflows. Some expenses may be non‑cash in nature.
Depreciation and amortisation is another expense category reported in the Income Statement. Depreciation and amortisation expense represents the allocation of the value of asset acquisitions over their useful life. Given the non‑cash nature of the expense, it does not have a matching category in the Statement of Cashflows.
Income is generated by an agency from its operating activities, mainly in the form of user charges. Revenues are recorded at the time they are earned, rather than the time at which payment is received, so revenue amounts in the Income Statement may differ from receipts from operating activities in the Statement of Cashflows. The difference between expenses and income is known as the net cost of services. This amount matches the amount shown against net cost of services contained in the Appropriations, Expenses and Cash Assets table. Net cost of services is a key monitoring point for agencies – a change in net cost of services directly impacts on the general government or public corporation net operating balance.
Income from State Government mainly comprises the appropriations for recurrent services approved by Parliament. Capital appropriations are not shown in this statement. In some cases, total income from State Government will match the net cost of services. However, there will often be minor variations due to carryover commitments across financial years, and recognition of superannuation expenses associated with (now closed) defined benefits superannuation schemes, or where an agency has a revenue source in addition to service appropriation (e.g. Commonwealth grants or departmental fees and charges).
For most agencies, the difference between net cost of services and income from State Government is their operating result, also known as a change in surplus/(deficiency) for the period.
Reader’s Guide to the 2020-21 Budget Statements
11
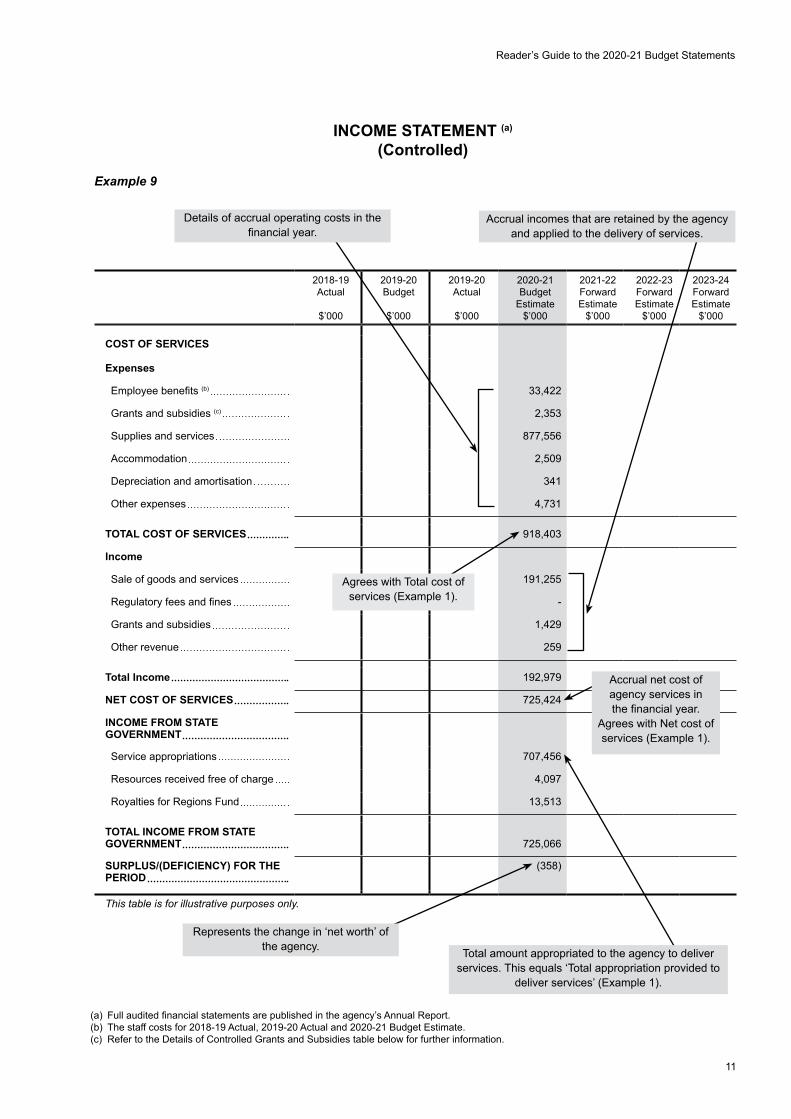
INCOME STATEMENT (a) (Controlled)
Example 9
2018-19Actual
$’000
2019-20Budget
$’000
2019-20Actual
$’000
2020-21Budget
Estimate$’000
2021-22ForwardEstimate
$’000
2022-23ForwardEstimate
$’000
2023-24ForwardEstimate
$’000
COST OF SERVICES
Expenses
Employee benefi ts (b) 33,422
Grants and subsidies (c) 2,353
Supplies and services 877,556
Accommodation 2,509
Depreciation and amortisation 341
Other expenses 4,731
TOTAL COST OF SERVICES 918,403
Income
Sale of goods and services 191,255
Regulatory fees and fi nes -
Grants and subsidies 1,429
Other revenue 259
Total Income 192,979
NET COST OF SERVICES 725,424
INCOME FROM STATE GOVERNMENT
Service appropriations 707,456
Resources received free of charge 4,097
Royalties for Regions Fund 13,513
TOTAL INCOME FROM STATE GOVERNMENT 725,066
SURPLUS/(DEFICIENCY) FOR THE PERIOD
(358)
This table is for illustrative purposes only.
Total amount appropriated to the agency to deliver services. This equals ‘Total appropriation provided to
deliver services’ (Example 1).
Accrual net cost of agency services in the fi nancial year.
Agrees with Net cost of services (Example 1).
Details of accrual operating costs in the fi nancial year.
Accrual incomes that are retained by the agency and applied to the delivery of services.
Agrees with Total cost of services (Example 1).
Represents the change in ‘net worth’ of the agency.
(a) Full audited fi nancial statements are published in the agency’s Annual Report.(b) The staff costs for 2018-19 Actual, 2019-20 Actual and 2020-21 Budget Estimate.(c) Refer to the Details of Controlled Grants and Subsidies table below for further information.

Reader’s Guide to the 2020-21 Budget Statements
12
Details of Controlled Grants And Subsidies
Example 10
This table details grants and subsidies paid or expected to be paid consistent with the agency’s services and directed at achieving the agency’s outcomes.
2018-19Actual
$’000
2019-20Budget
$’000
2019-20Actual
$’000
2020-21Budget
Estimate$’000
2021-22Forward Estimate
$’000
2022-23Forward Estimate
$’000
2023-24ForwardEstimate
$’000
Contribution to XYZ 2,000
Other 353
TOTAL 2,353
This table is for illustrative purposes only.
STATEMENT OF FINANCIAL POSITION
Also known as the Balance Sheet, the Statement of Financial Position is a record of assets, liabilities and equity at the end of each financial year. Assets and liabilities are further classified into current and non‑current.
By providing information on the type of assets and liabilities, this statement gives an indication of the agency’s financial strength.
Current assets are cash and other assets that are expected to be converted to cash within 12 months, such as receivables and inventories.
Non-current assets are usually more of a physical nature with longer-term useful lives, such as land, buildings and equipment. These are required to enable agencies to deliver services to their customers.
Current liabilities are usually obligations that would be met within 12 months, such as payables (creditors), employees’ annual leave entitlements and interest expenses due but not paid.
Non-current liabilities are longer-term obligations, such as employees’ long service leave entitlements, borrowings (debt) in excess of 12 months, and superannuation.
Equity represents the difference between total assets and total liabilities. Equity is also known as net assets or net worth. The components of equity are:
• contributed equity – the accumulation of capital contribution appropriations since 2001-02 and the net value of any assets and liabilities transferred to or from other government agencies as a result of restructures or function transfers;
• accumulated surplus/(deficit) – the accumulation of operating results (from the Income Statement) over the life of the entity; and
• reserves – usually in the form of asset revaluation reserves resulting from the revaluation of assets over time to maintain current accurate valuations. Land revaluations are normally a major component of asset revaluation reserves.

Reader’s Guide to the 2020-21 Budget Statements
13
STATEMENT OF FINANCIAL POSITION (a)
(Controlled) Example 11
2018-19Actual
$’000
2019-20Budget
$’000
2019-20Actual
$’000
2020-21Budget
Estimate$’000
2021-22ForwardEstimate
$’000
2022-23ForwardEstimate
$’000
2023-24ForwardEstimate
$’000
CURRENT ASSETSCash assets 23,199
Restricted cash 5,139
Receivables 400
Holding account receivables 67
Other 70
Total current assets 28,875
NON-CURRENT ASSETSHolding account receivables 6,168
Property, plant and equipment 22,000
Intangibles 708
Other 12
Total non-current assets 28,888
TOTAL ASSETS 57,763
CURRENT LIABILITIESEmployee provisions 5,348
Payables 3,900
Other 717
Total current liabilities 9,965
NON-CURRENT LIABILITIESEmployee provisions 1,900
Payables 31
Other 67
Total non-current liabilities 1,998
TOTAL LIABILITIES 11,963
EQUITYContributed equity 26,739
Accumulated surplus/(defi cit) 18,453
Reserves 608
Total equity 45,800
TOTAL LIABILITIES AND EQUITY 57,763
Current liabilities are those expected to be settled within
12 months.
The accumulated balance of capital contributions.
Assets that are either cash or are likely to be converted to cash within 12 months.
Assets that do not fall within the defi nition of current assets.
Non current liabilities are longer term obligations.
Represents the diff erence between cost and current
valuation of assets controlled by the agency.
The sum of assets less liabilities and represents the
ownership interest of the Government in the agency.
(a) Full audited fi nancial statements are published in the agency’s Annual Report.

Reader’s Guide to the 2020-21 Budget Statements
14
STATEMENT OF CASHFLOWS
Cash receipts and cash payments are recorded in the Statement of Cashflows. These receipts and payments are categorised into cashflows from State Government, operating activities, investing activities and financing activities.
The net cash movements in this statement directly impact on the public sector’s net debt and the Government’s related financial target.
The Cashflows from State Government item is the cash component of the appropriation for recurrent services and, if applicable, capital contribution appropriations and drawdowns from the holding account (i.e. appropriations approved but not yet drawn for eventual asset replacement and/or employee leave entitlements)(1).
Receipts and payments included under Cashflows from operating activities relate closely to income and expenses from operating activities. These categories are similar in nature – the difference is that amounts are not recorded in the Statement of Cashflows until income is actually received or expenses are actually paid.
Cashflows from investing activities relate to the purchase or sale of assets, such as land, buildings and equipment. The Income Statement discloses the depreciation and amortisation expense associated with the cost of asset purchases that have a finite useful life. Any profit or loss on the disposal of an asset is also recorded in the Income Statement.
Cashflows from financing activities relate mainly to borrowings. Any new borrowings are recorded as proceeds from borrowings. Repayments of existing debt are also recorded here.
The net increase or decrease in cash held is simply the sum of cash receipts less cash payments for the period. Total cash at the beginning and end of the period is also shown. Cash assets at the end of the reporting period match the total of cash assets shown in the Statement of Financial Position.
(1) The cash component of the appropriation for services will differ from the appropriation income shown in the Income Statement by the amount of depreciation and amortisation expense and any increase in leave liabilities. These amounts are included in the accrual appropriation approved by Parliament, but in the first instance are transferred into a holding account administered by the Department of Treasury. Agencies subsequently draw on their credits in the holding account to replace existing assets and meet leave liability obligations when they fall due.
Reader’s Guide to the 2020-21 Budget Statements
15
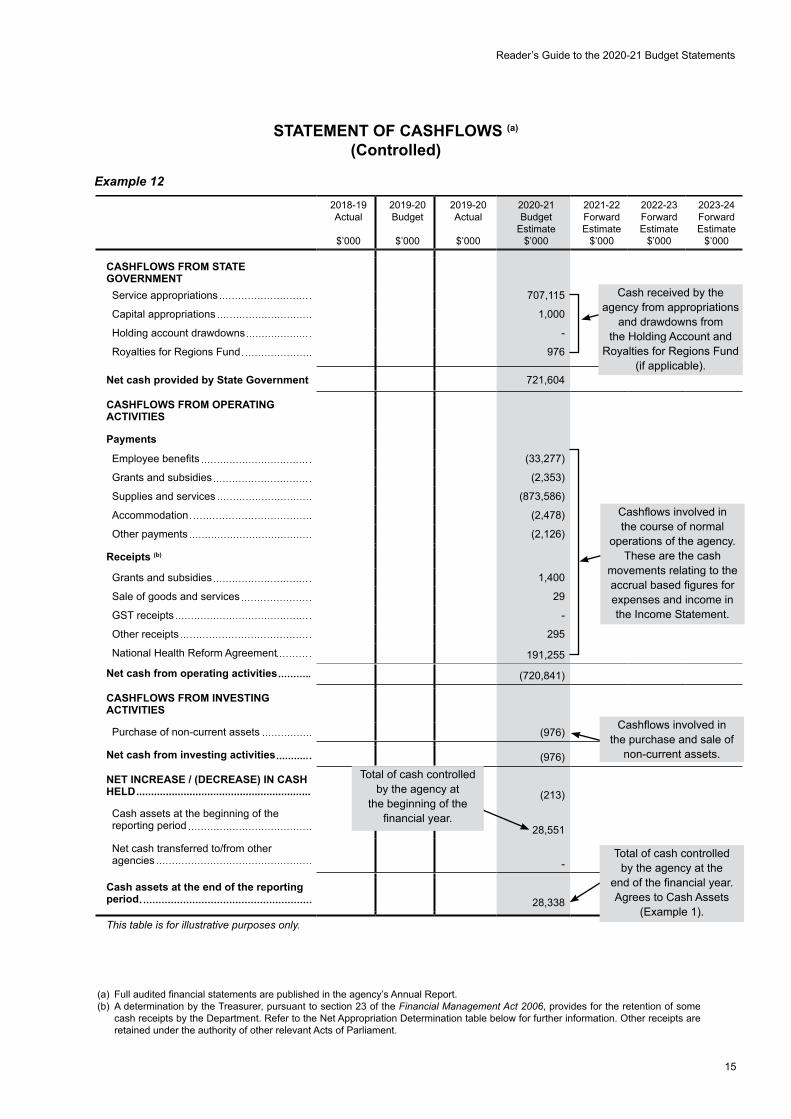
STATEMENT OF CASHFLOWS (a)
(Controlled)
Example 12
2018-19Actual
$’000
2019-20Budget
$’000
2019-20Actual
$’000
2020-21Budget
Estimate$’000
2021-22ForwardEstimate
$’000
2022-23ForwardEstimate
$’000
2023-24ForwardEstimate
$’000
CASHFLOWS FROM STATE GOVERNMENTService appropriations 707,115
Capital appropriations 1,000
Holding account drawdowns -
Royalties for Regions Fund 976
Net cash provided by State Government 721,604
CASHFLOWS FROM OPERATING ACTIVITIES
Payments
Employee benefi ts (33,277)
Grants and subsidies (2,353)
Supplies and services (873,586)
Accommodation (2,478)
Other payments (2,126)
Receipts (b)
Grants and subsidies 1,400
Sale of goods and services 29
GST receipts -
Other receipts 295
National Health Reform Agreement 191,255
Net cash from operating activities (720,841)
CASHFLOWS FROM INVESTING ACTIVITIES
Purchase of non-current assets (976)
Net cash from investing activities (976)
NET INCREASE / (DECREASE) IN CASH HELD ........................................................... (213)
Cash assets at the beginning of the reporting period 28,551
Net cash transferred to/from other agencies -
Cash assets at the end of the reporting period 28,338
This table is for illustrative purposes only.
Cashfl ows involved in the purchase and sale of
non-current assets.
Cashfl ows involved in the course of normal
operations of the agency. These are the cash
movements relating to the accrual based fi gures for expenses and income in the Income Statement.
Cash received by the agency from appropriations
and drawdowns from the Holding Account and
Royalties for Regions Fund (if applicable).
Total of cash controlled by the agency at
the beginning of the fi nancial year.
Total of cash controlled by the agency at the
end of the fi nancial year. Agrees to Cash Assets
(Example 1).
(a) Full audited fi nancial statements are published in the agency’s Annual Report.(b) A determination by the Treasurer, pursuant to section 23 of the Financial Management Act 2006, provides for the retention of some
cash receipts by the Department. Refer to the Net Appropriation Determination table below for further information. Other receipts are retained under the authority of other relevant Acts of Parliament.

Reader’s Guide to the 2020-21 Budget Statements
16
NET APPROPRIATION DETERMINATION
This table details the revenue that agencies are permitted to keep and apply to agency services under the Financial Management Act 2006.
Example 13
2018-19Actual
$’000
2019-20Budget
$’000
2019-20Actual
$’000
2020-21Budget
Estimate$’000
2021-22Forward Estimate
$’000
2022-23Forward Estimate
$’000
2023-24ForwardEstimate
$’000
Grants and SubsidiesGrants and Subsidies 1,400
Sale of Goods and ServicesRegistration Fees 21
Temporary Permits 8
GST ReceiptsGST Receipts on Sales -
Other ReceiptsOther Receipts 295
TOTAL 1,724
This table is for illustrative purposes only.

Reader’s Guide to the 2020-21 Budget Statements
17
RECONCILIATION RELATING TO MAJOR FUNCTIONAL TRANSFERS AND ACCOUNTING POLICY CHANGES
This table is used to reconcile an agency’s financial statements and performance information for Machinery of Government changes and/or accounting policy changes where the financial statements have not been backdated to reflect the changes.
Where there is a Machinery of Government/functional change within agencies there are two different ways of reflecting it in the Budget Statements. When a change is significant and material the performance information and financial statements are backcast. If the change is minor the performance information is backcast and a reconciliation of the financial statements is conducted within the above reconciliation table.
Example 14
2018-19Actual
$’000
2019-20Budget
$’000
2019-20Actual
$’000
2020-21Budget
Estimate$’000
2021-22ForwardEstimate
$’000
2022-23ForwardEstimate
$’000
2023-24ForwardEstimate
$’000
EXPENSES
Total Cost of Services as per Income Statement 918,403
Add Transfer from Department of DEF 200
Minus Transfer to Department of XYZ 200
Adjusted Total Cost of Services 918,403
APPROPRIATIONS
Service Appropriations as per Income Statement 707,456
Add Transfer from Department of DEF 200
Minus Transfer to Department of XYZ 200
Adjusted Total Appropriations Provided to Deliver Services 707,456
This table is for illustrative purposes only.
Agrees with the Total Cost of Services as per the
Income Statement.
Agrees with the Total amount appropriated to agency to
deliver services (Example 1).

Reader’s Guide to the 2020-21 Budget Statements
18
DETAILS OF ADMINISTERED TRANSACTIONS
This table outlines revenue/expenses that are managed by the agency on behalf of the State of Western Australia.
Example 15
2018-19Actual
$’000
2019-20Budget
$’000
2019-20Actual
$’000
2020-21Budget
Estimate$’000
2021-22Forward Estimate
$’000
2022-23Forward Estimate
$’000
2023-24ForwardEstimate
$’000
INCOME
Administered Appropriation 8,287
Services Received Free of Charge 1,068
TOTAL INCOME 9,355
EXPENSES
Office of the Chief Psychiatrist 3,428
Mental Health Tribunal 2,907
Mental Health Advocacy Service 3,020
TOTAL EXPENSES 9,355
This table is for illustrative purposes only.
SPECIAL PURPOSE ACCOUNT DETAILS
This table details the relevant Act associated with any Special Purpose Account and how the account is utilised.
Example 16
2018-19Actual
$’000
2019-20Budget
$’000
2019-20Actual
$’000
2020-21Budget
Estimate$’000
Opening Balance 10 10 10 10
Receipts:
Appropriations 1,982 500 500 500
Other - 1,600 600 1,200
1,992 2,110 1,110 1,710
Payments 1,982 2,100 1,100 1,700
Closing Balance 10 10 10 10
This table is for illustrative purposes only.

Reader’s Guide to the 2020-21 Budget Statements
19
Glossary
Australian Bureau of Statistics Government Finance Statistics Manual
The Australian Bureau of Statistics’ publication Australian System of Government Finance Statistics: Concepts, Sources and Methods 2015 contains a comprehensive and definitive guide to the classification of financial aggregates for National Accounts and Government Finance Statistics (GFS) purposes.
Accrual accounting Accounting method that records revenue and expenses when they are incurred, regardless of when cash is exchanged. The term ‘accrual’ refers to any individual entry recording revenue or expense in the absence of a cash.
Asset Investment Program
Total public sector purchases of non ‑financial assets (i.e. the State’s infrastructure program).
Average Weekly Earnings
Average Weekly Earnings statistics represent the average (before tax) earnings of all employees, including payments for overtime, but not payments in kind or other benefits such as superannuation.
Balance sheet Also known as Statement of Financial Position. A financial statement that presents the financial position of a sector by detailing the stock of assets, liabilities and equity at the end of a reporting period.
Borrowings Borrowings refer to interest bearing liabilities mainly raised from public borrowings raised through the Western Australian Treasury Corporation, and finance leases and other interest bearing arrangements. Borrowings exclude liabilities raised from other government entities (including finance lease arrangements), which are classified as advances received.
Capital grants (transfers)
Transactions in which the ownership of an asset (other than cash and inventories) is transferred from one institutional unit to another, to enable the recipient to acquire another asset or in which cash is transferred to enable the recipient to acquire an asset other than inventories, for which no economic benefits of equal value are receivable in return.
Cashflow statement A financial statement that presents a summary of all cash receipts and payments for a sector in a reporting period.
Cashflow from operating activities
Receipts and payments of cash relating to a reporting entity’s operating activities.
Cashflow from investing activities
Relates to the purchase or sale of assets, such as land, buildings and equipment.
Cashflow from financing activities
Shows the cash receipts and payments related to transactions with the providers of finance.
Reader’s Guide to the 2020-21 Budget Statements
20
Cash surplus/deficit Reported in the cashflow statement, the cash surplus/deficit measures the net impact of cashflows (excluding financing activities) during the period. It equals net cashflows from operating activities (things that agencies do on a daily basis as part of their operations) plus net cashflows from the acquisition and disposal of non‑financial assets (i.e. infrastructure activities), less distributions paid (i.e. dividends). For Government Finance Statistics purposes at whole‑of‑government level, the cash surplus/deficit is further adjusted to account for the value of assets acquired under finance leases and similar arrangements. The Commonwealth refers to this aggregate as the ‘underlying cash balance’ in its publications and is that tier of government’s headline Budget measure. A surplus is generally consistent with declining levels of net debt while a deficit indicates a need for more borrowing.
Chain Volume Measures Refers to indicators of ‘real’ or ‘constant price’ activity, which abstract from the effect of changes in economy-wide prices over time.
Classification of the Functions of Government
The Classification of the Functions of Government (COFOG) classifies expenses and acquisitions of non financial assets of the public sector and general government sector in terms of the purposes for which the transactions are made. As required under AASB 1049, total assets of the State and general government sector are also required to be allocated to this functional classification where possible to do so. The major groups reflect the broad objectives of government and the groups and subgroups details the means by which these broad objectives are met. The COFOG replaced the Government Purpose Classification in 2018‑19.
Consolidated Account The Constitution Act 1889 creates the Consolidated Account. Under section 64 of the Constitution Act 1889, all moneys due to the State from taxes, charges, imposts, and other sources, and that are not hypothecated by separate legislation must be credited to the Consolidated Account and can only be expended if authorised by an Appropriation Act. The legislation does not impose any restrictions on the purposes for which the Consolidated Account may be appropriated. See also Public Bank Account below.
Consolidated financial statements
The aggregate financial statements for the whole‑of‑government (and its sub‑sectors), including the financial outcomes of public sector agencies. Transactions, assets and obligations between agencies are eliminated on consolidation.
Consumer Price Index The Consumer Price Index (CPI) measures changes in the price of a ‘basket’ of goods and services purchased by households. Growth in the CPI is often used as a benchmark estimate of inflation.
Contingent asset A possible asset that arises from past events and whose existence will be confirmed only by the occurrence or non-occurrence of one or more uncertain future events not wholly within the control of the entity. Contingent assets are not recognised on the balance sheet. For example, the State may expect to receive a cash benefit if it delivers on various obligations in the future.
Contingent liability A potential financial obligation arising out of a condition, situation, guarantee or indemnity, the ultimate effect of which will be confirmed only on the occurrence or non ‑occurrence of one or more uncertain future events. Contingent liabilities are not recorded on the balance sheet. Examples include pending legal proceedings and items covered by government guarantees, sureties and indemnities.
Convergence difference The difference between the amounts recognised in the financial statements (prepared under Australian accounting standards) compared with the amounts determined for Government Finance Statistics purposes as a result of differences in definition, recognition, measurement, classification and consolidation principles and rules.

Reader’s Guide to the 2020-21 Budget Statements
21
Current Prices Refers to estimates of economic activity that are expressed in terms of the prices of the period to which the observation relates. In other words, current price estimates have not been adjusted for the effects of price movements over time.
Current grants (transfers)
The provision of something of value for no specific return or consideration (e.g. grants, subsidies and donations).
Employee expenses These expenses include all costs related to employment including wages and salaries, Fringe Benefits Tax, leave entitlements, separation payments, defined benefits superannuation plans and defined contribution superannuation plans.
Employment Employment is defined as all people aged 15 years and over who are engaged in one or more hours of work during the survey period. It includes people who are temporarily absent from work.
Expenses Expenses are defined as transactions that reduce net worth or consume an economic benefit. They represent the cost of operating. Purchases of services (other than those that are capitalised as infrastructure) are expenses because the services are consumed when provided and net worth is reduced by the cost of the services. For example, the purchase of labour services (commonly known as ‘salaries’) is an expense.
Finance lease Lease agreements that transfer substantially all the risks and benefits relating to ownership of an asset from the lessor (legal owner) to the lessee (party using the asset). For example, public sector agencies often lease buildings, vehicles, etc. and record such leased assets on their balance sheets. All related costs and the total remaining lease liability is also recorded in the financial statements. Depending on the nature of the arrangement, Public Private Partnerships may be recognised as lease arrangements. Leases are treated as government debt on the State’s balance sheet.
Financial asset Any asset that is:
• cash;
• an equity instrument of another entity;
• a contractual right:
– to receive cash or another financial asset from another entity; or
– to exchange financial assets or financial liabilities with another entity under conditions that are potentially favourable to the entity; or
• a contract that will or may be settled in the entity’s own equity instruments and is:
– a non-derivative for which the entity is or may be obliged to receive a variable number of the entity’s own equity instruments; or
– a derivative that will or may be settled other than by the exchange of a fixed amount of cash or another financial asset for a fixed number of the entity’s own equity instruments. For this purpose, the entity’s own equity instruments do not include instruments that are themselves contracts for the future receipt or delivery of the entity’s own equity instruments.
Assets that are highly liquid (such as cash or very short term investments that convert to cash very easily) are treated as an offset to borrowings and other financial instruments, to derive net debt.
Financial liability Financial obligations to a third party. Includes deposits held on behalf of third parties, advances (loans) received from the Commonwealth, borrowings (including finance leases), employee entitlements (such as unfunded superannuation liabilities), accounts payable, etc.

Reader’s Guide to the 2020-21 Budget Statements
22
Financial Management Act 2006
The Act sets out the framework for public sector budgeting in Western Australia.
Fiscal aggregates Analytical balances that are useful for macroeconomic analysis purposes, including assessing the impact of a government and its sectors on the economy. Key fiscal aggregates defined under ABS Government Finance Statistics manual are required to be disclosed under AASB 1049: Whole of Government and General Government Sector Financial Reporting. They are opening net worth, net operating balance, net lending/– borrowings, change in net worth due to revaluations, change in net worth due to other changes in the volume of assets, total change in net worth, closing net worth, and cash surplus/–deficit.
Forward estimates Estimates of financial aggregates for future years. These assume that there will be no significant change in government policy and are designed to provide a longer‑term perspective to the budget process.
Full-Time Equivalent One Full Time Equivalent staff member is the same as one person working full time for one financial year.
General government sector
Defined in Government Finance Statistics as an entity or group of entities which are mainly engaged in the production of goods and/or services outside the normal market mechanism. General government goods and services are largely provided free of charge or at nominal charges well below costs of production. Government departments are usually recognised as general government sector agencies.
Government Finance Statistics
Refers to statistics that measure the financial transactions of governments and reflect the impact of those transactions on other sectors of the economy. Government Finance Statistics in Australia are developed by the Australian Bureau of Statistics in conjunction with all governments and are mainly based on international statistical standards developed, in consultation with member countries, by the International Monetary Fund.
Government Purpose Classification
The Government Purpose Classification (GPC) classifies expenses and acquisitions of non‑financial assets of the public sector and general government sector in terms of the purposes for which the transactions are made. As required under AASB 1049, total assets of the State and general government sector are also required to be allocated to purpose classification where possible to do so. The major groups reflect the broad objectives of government and the groups and subgroups details the means by which these broad objectives are met. The GPC is being replaced by the Classification of the Functions of Government.
Grants and subsidies Transactions in which one unit provides goods, services, assets (or extinguishes a liability) or labour to another unit without receiving approximately equal value in return. Grants can either be of a current or capital nature (see current grants and capital grants).
Gross borrowing Loans and debt obligations liabilities, other than advances, created through direct agreements with lenders, the sale of securities and acquisition of finance leases. Gross borrowing is the largest component of gross debt, used to calculate the State’s net debt.
Gross debt A component of net debt. Gross debt includes borrowings, deposits held on behalf of third parties, and advances (loans) from the Commonwealth. Net debt is derived from gross debt less liquid financial assets.
Gross State Income Gross State Income is a measure of the real purchasing power of income generated within a State. It is calculated by adjusting the chain volume measure of Gross State Product for changes in the terms of trade.
Reader’s Guide to the 2020-21 Budget Statements
23
Gross State Product Gross State Product (GSP) measures the value of all final goods and services produced within a State. GSP is a common measure of economic growth.
Key fiscal aggregates Financial aggregates that are important for analysis purposes, including assessing the impact of a government and its sectors on the economy. For example, net operating balance, net debt, etc.
Labour Force All people aged 15 years and over who are willing and available to work, comprising both the employed and the unemployed.
National Partnership Payment
A Commonwealth government grant to a State and/or Territory to support the delivery of specified outputs or projects, to facilitate reforms or to reward the delivery of nationally significant reforms. Each National Partnership Payment is supported by a National Partnership Agreement which defines mutually agreed objectives, outputs and performance benchmarks.
Net cashflows from investments in financial assets (liquidity management purposes)
Includes cash receipts from liquidation or repayment of investments in financial assets for liquidity management purposes less cash payments for such investments. Investment for liquidity management purposes means making funds available to others with no policy intent and with the aim of earning a commercial rate of return.
Net cashflows from investments in financial assets (policy purposes)
Includes cash receipts from the repayment and liquidation of investments in financial assets for policy purposes less cash payments for acquiring financial assets for policy purposes. Acquisition of financial assets for policy purposes is distinguished from investments in financial assets (liquidity management purposes) by the underlying motivation for acquiring the assets. Acquisition of financial assets for policy purposes is motivated by Government policies such as encouraging the development of certain industries or assisting citizens affected by natural disaster.
Net cashflows from operating activities
Cash received from taxes, grants and subsidies, sales of goods and services, interest, dividends and tax equivalents, less the cash paid for day to day activities (wages, salaries and goods and services). Capital sales or acquisitions (infrastructure spending) are not included as operating activities. This is the cash equivalent of the net operating balance on the operating statement.
Net debt Net debt measures the public sector’s net stock of selected gross financial liabilities less liquid financial assets. Net debt is derived from the balance sheet as the sum of deposits held, advances received, government securities, loans, leases and other borrowings, less the sum of cash and deposits, advances paid and investments, loans and placements.
Net financial liabilities Equals total liabilities less financial assets (other than equity in public corporations and other entities). This measure is broader than net debt as it includes significant liabilities, other than borrowings (for example, accrued employee liabilities such as superannuation and long service leave entitlements).
Net financial worth Measures the public sector’s net holdings of financial assets. It is calculated from the Uniform Presentation Framework balance sheet as financial assets less liabilities. Net financial worth is a broader measure than net debt, as it incorporates provisions (such as superannuation, but excludes depreciation and doubtful debts) as well as holdings of equity. Net financial worth includes all classes of financial assets and liabilities.

Reader’s Guide to the 2020-21 Budget Statements
24
Net lending/borrowing An operating statement measure that differs from the net operating balance as it includes spending on capital items but excludes depreciation. The net lending/borrowing measure more accurately reflects the cash requirements of the public sector in any given year. A net lending (or fiscal surplus) balance indicates that the public sector is saving more than enough to finance all its investment spending. A net borrowing (or fiscal deficit) position indicates that the public sector’s level of investment is greater than its level of savings.
Net operating balance This is calculated as income from transactions less expenses from transactions. It is a summary measure of the ongoing sustainability of operations and excludes gains and losses resulting from changes in price levels and other changes in the volume of assets. It is the component of the change in net worth that is due to transactions.
Net worth It is an economic measure of wealth and provides a relatively comprehensive picture of the public sector’s overall financial position. It is calculated as total assets less total liabilities less shares and other contributed capital. For the general government sector, net worth is assets less liabilities, since shares and contributed capital do not exist for the central government.
Nominal Prices See Current Prices.
Operating statement A financial statement that presents the operating performance of a reporting entity by detailing all items of revenue and expense recognised as they accrue during a reporting period. Cashflows for these accruing operating activities may occur in the same or subsequent reporting period.
Other economic flows The change in the volume or value of assets and liabilities that does not result from operating activities.
Other revenue Revenue not elsewhere classified or disclosed.
Participation Rate The Australian Bureau of Statistics defines the participation rate as the ratio of the labour force to the total civilian population aged 15 years and over. Some countries and organisations, including the OECD, estimate the participation rate as the ratio of the labour force to the population aged between 15 years and 64 years.
Reader’s Guide to the 2020-21 Budget Statements
25
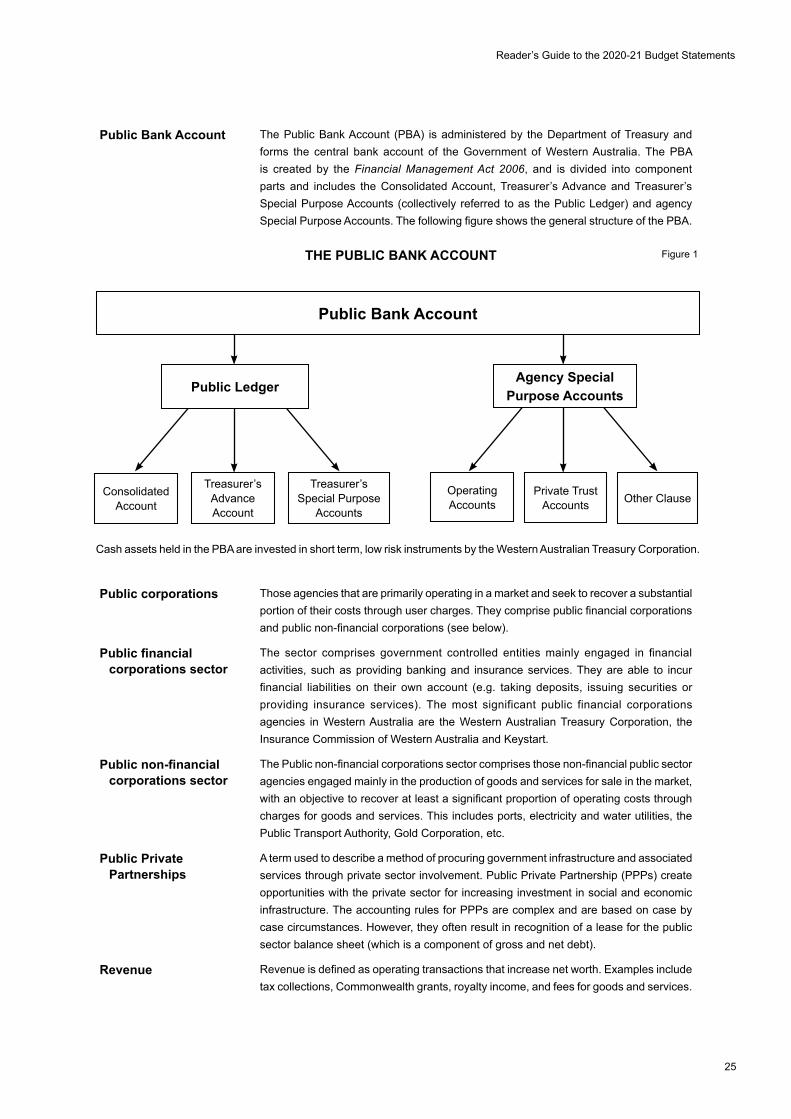
Public Bank Account The Public Bank Account (PBA) is administered by the Department of Treasury and forms the central bank account of the Government of Western Australia. The PBA is created by the Financial Management Act 2006, and is divided into component parts and includes the Consolidated Account, Treasurer’s Advance and Treasurer’s Special Purpose Accounts (collectively referred to as the Public Ledger) and agency Special Purpose Accounts. The following figure shows the general structure of the PBA.
Public corporations Those agencies that are primarily operating in a market and seek to recover a substantial portion of their costs through user charges. They comprise public financial corporations and public non‑financial corporations (see below).
Public financial corporations sector
The sector comprises government controlled entities mainly engaged in financial activities, such as providing banking and insurance services. They are able to incur financial liabilities on their own account (e.g. taking deposits, issuing securities or providing insurance services). The most significant public financial corporations agencies in Western Australia are the Western Australian Treasury Corporation, the Insurance Commission of Western Australia and Keystart.
Public non‑financial corporations sector
The Public non‑financial corporations sector comprises those non‑financial public sector agencies engaged mainly in the production of goods and services for sale in the market, with an objective to recover at least a significant proportion of operating costs through charges for goods and services. This includes ports, electricity and water utilities, the Public Transport Authority, Gold Corporation, etc.
Public Private Partnerships
A term used to describe a method of procuring government infrastructure and associated services through private sector involvement. Public Private Partnership (PPPs) create opportunities with the private sector for increasing investment in social and economic infrastructure. The accounting rules for PPPs are complex and are based on case by case circumstances. However, they often result in recognition of a lease for the public sector balance sheet (which is a component of gross and net debt).
Revenue Revenue is defined as operating transactions that increase net worth. Examples include tax collections, Commonwealth grants, royalty income, and fees for goods and services.
THE PUBLIC BANK ACCOUNT Figure 1
Public Bank Account
Public Ledger
Consolidated Account
Operating Accounts
Treasurer’s Advance Account
Private Trust Accounts
Treasurer’s Special Purpose
AccountsOther Clause
Agency Special Purpose Accounts
Cash assets held in the PBA are invested in short term, low risk instruments by the Western Australian Treasury Corporation.
Reader’s Guide to the 2020-21 Budget Statements
26
Sale of goods and services
Refers to revenue from the direct provision of goods and services, and includes fees and charges for services rendered, sales of goods and services, fees from regulatory services and work done as an agent for private enterprises. It also includes rental income under operating leases and on produced assets such as buildings and entertainment, but excludes rent income from the use of non-produced assets such as land.
State Final Demand State Final Demand (SFD) is a component of GSP. It measures domestic economic activity, and is comprised of household private consumption, dwelling investment, business investment and public consumption and investment. SFD excludes net interstate and overseas trade (i.e. exports minus imports) and changes in inventories.
Superannuation – concurrent cost (expense)
The current service cost of employees.
Superannuation – interest cost (expense)
Represents the carrying cost of unfunded superannuation liabilities. Unfunded superannuation is essentially a debt owing to employees. Part of the annual valuation of these ‘debts’ includes the carrying (or interest) cost. The State of Western Australia now concurrently funds the superannuation costs of almost all of its employees (since 1998-99). As a result, superannuation interest costs are anticipated to decline over the next two to three decades as unfunded entitlements are gradually paid out.
Tax equivalents regime The mechanism to ensure that public corporations incur similar tax liabilities (mainly income tax and local government rates) as privately owned organisations that are exposed to the tax system. Under these arrangements, greater parity exists between the cost structures of public sector trading entities and the private sector, aiding in the achievement of competitive neutrality.
Taxation revenue Taxation revenue represents revenue received from the State’s taxpayers and includes payroll tax, land tax, duties levied principally on conveyances and land transfers, gambling taxes levied mainly on private lotteries and racing, insurance duty relating to compulsory third party policies, motor vehicle taxes, including registration fees and duty on registrations and transfers, levies on statutory corporations in other sectors of government and other taxes, including landfill levies, licence and concession fees.
Terms of Trade The ratio of export prices to import prices. An increase in terms of trade indicates that a larger volume of imports can be purchased with a given volume of exports.
Total change in net worth
The net result of all items of income and expense recognised for the period. This is sometimes also referred to as the ‘Comprehensive Result’. It is the aggregate of operating result and other movements in equity, other than transactions with owners as owners.
Total non‑financial assets
Assets that are not ‘financial assets’, predominantly land and other fixed assets (i.e. infrastructure).
Total non‑financial public sector
The total non‑financial public sector represents the consolidated transactions and assets and liabilities of the general government and public non‑financial corporations sectors. In compiling statistics for the total non‑financial public sector, transactions and debtor/creditor relationships between sub-sectors are eliminated.
Transaction Transactions are those economic flows that are considered to arise from an interaction between two entities by mutual agreement. They also include flows within an entity such as depreciation where the owner is simultaneously acting as the owner of the depreciating asset and as the consumer of the service provided by the asset.
Unemployment People aged 15 years and over who were not employed during the survey period, but were actively looking for work.
Reader’s Guide to the 2020-21 Budget Statements
27
Uniform Presentation Framework
The Uniform Presentation Framework (UPF) was first agreed by the Australian Loan Council in 1994. The current UPF incorporates the use of accounting standard Australian Accounting Standards Board (AASB) 1049: Whole of Government and General Government Sector Financial Reporting and specifies that Commonwealth, State and Territory governments will present a minimum set of Budget and financial outcome information on AASB 1049 and Government Finance Statistics bases according to an agreed format.
Whole-of-government financial report
A financial report prepared by a Government that is prepared in accordance with Australian accounting standards and thereby separately recognises assets, liabilities, income, expenses and cashflows of all entities under the control of the Government of Western Australia on a line-by-line basis.


![dfat.gov.au · Web viewDFAT Budget Statements. DFAT Budget Statements. Portfolio overview. ASIS Budget Statements [] Budget Statements . 2019-20 PBS 31 March 1400.DOCX2019-20 PBS](https://img.pdfslide.us/doc/110x75/5ccd648688c9932b558d9fa3/dfatgovau-web-viewdfat-budget-statements-dfat-budget-statements-portfolio.jpg)