Embed Size (px)
Citation preview
Read the article and take notes Read the article and take notes on the following:on the following:
Causes of the stock market crashCauses of the stock market crash Public reactionPublic reaction Broker’s reactionsBroker’s reactions Government’s responseGovernment’s response Optimism about rebuilding of stock Optimism about rebuilding of stock
market and aiding investorsmarket and aiding investors Speculated short-term and long-term Speculated short-term and long-term
economic effectseconomic effects Speculated political and social effectsSpeculated political and social effects
October 11—How is our current October 11—How is our current economic situation similar and economic situation similar and
different to what occurred different to what occurred during the Great Depression?during the Great Depression?
The Great Depression The Great Depression vs. The Great vs. The Great
RecessionRecession
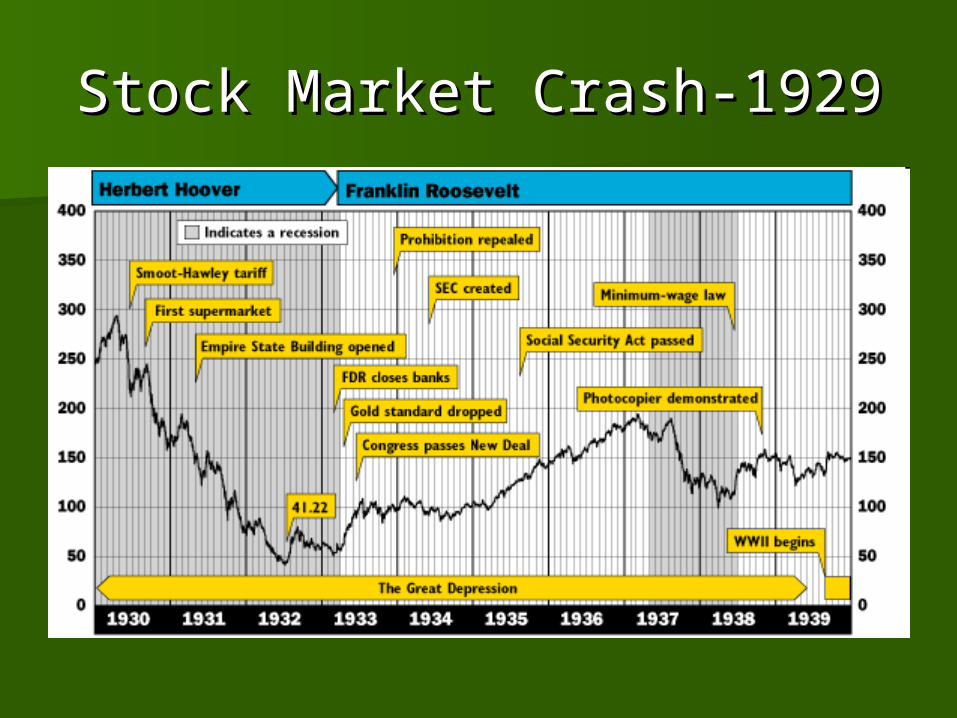
Stock Market Crash-1929Stock Market Crash-1929
October 28—DOW dropped 13%October 28—DOW dropped 13% October 29 (Black Tuesday)—it October 29 (Black Tuesday)—it
plunged 12% more.plunged 12% more. Over the next 3 years, the US stock Over the next 3 years, the US stock
market declined 89%.market declined 89%. The index didn’t regain its 1929 peak The index didn’t regain its 1929 peak
until 1954.until 1954.
Stock Market Crash-1929Stock Market Crash-1929

Stock MarketStock Market
http://www.google.com/finance?http://www.google.com/finance?client=ob&q=INDEXDJX:DJIclient=ob&q=INDEXDJX:DJI
Purchasing PowerPurchasing Power
During Great Depression deflation During Great Depression deflation was the major issue.was the major issue.
2010 estimated inflation = 1.6%2010 estimated inflation = 1.6%
Purchasing PowerPurchasing Power 1929—More than half of US families 1929—More than half of US families
lived on the edge of or below the lived on the edge of or below the minimum subsistence levelminimum subsistence level
Poverty rate in 2009 =14.3% which is Poverty rate in 2009 =14.3% which is 43.6 million Americans43.6 million Americans
2008 = 13.2 percent, up from 12.5 2008 = 13.2 percent, up from 12.5 percent in 2007. percent in 2007.
There were 39.8 million people in There were 39.8 million people in poverty in 2008, up from 37.3 million in poverty in 2008, up from 37.3 million in 2007.2007.
Purchasing PowerPurchasing Power As of 2008, Household debt increased As of 2008, Household debt increased
from about 50% of the GDP in 1980 to a from about 50% of the GDP in 1980 to a peak of 100% in 2006. Households owe as peak of 100% in 2006. Households owe as much as the entire US economy can much as the entire US economy can produce in a year.produce in a year.
Household income dropped 9.8% from Household income dropped 9.8% from December 2007 to June 2011. Income December 2007 to June 2011. Income dropped more after the recession officially dropped more after the recession officially ended in June 2009. ended in June 2009.
Income dropped 3.2% Dec 2007-June 2009Income dropped 3.2% Dec 2007-June 2009
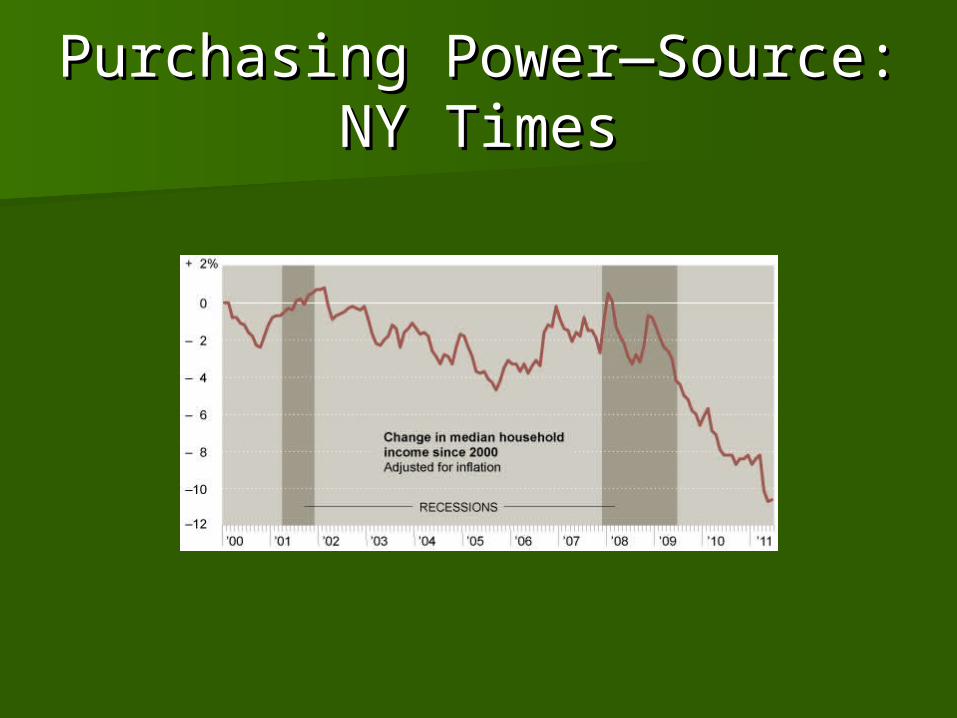
Purchasing Power—Source: Purchasing Power—Source: NY TimesNY Times
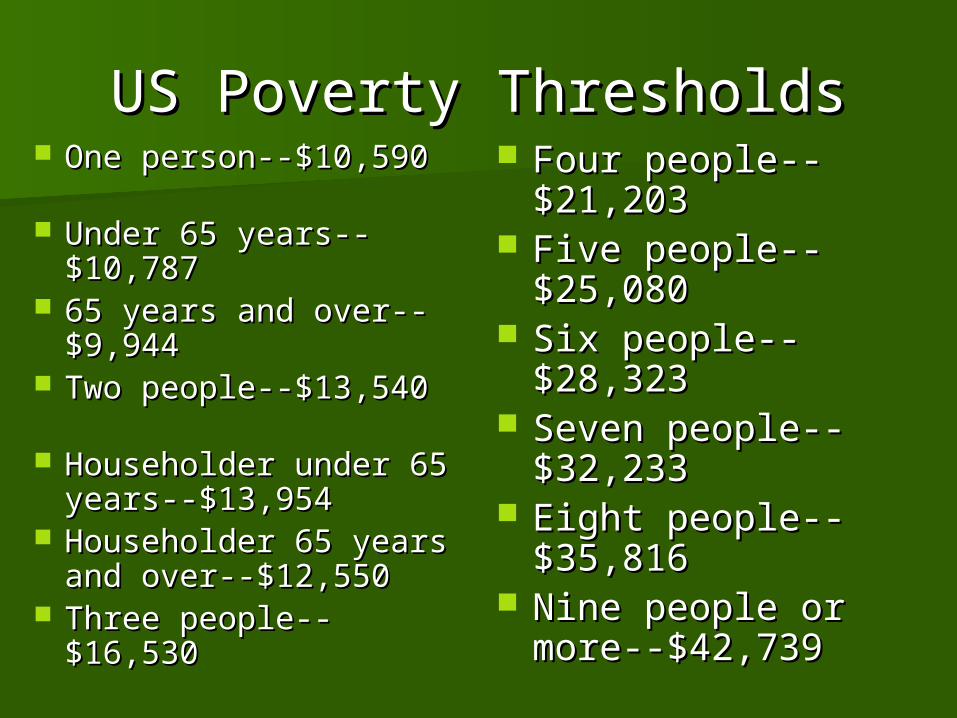
US Poverty ThresholdsUS Poverty Thresholds One person--$10,590 One person--$10,590 Under 65 years-- Under 65 years--
$10,787 $10,787 65 years and over--65 years and over--
$9,944 $9,944 Two people--$13,540 Two people--$13,540 Householder under 65 Householder under 65
years--$13,954 years--$13,954 Householder 65 years Householder 65 years
and over--$12,550 and over--$12,550 Three people--$16,530Three people--$16,530
Four people--Four people--$21,203 $21,203
Five people--Five people--$25,080 $25,080
Six people--$28,323 Six people--$28,323 Seven people--Seven people--
$32,233 $32,233 Eight people--Eight people--
$35,816 $35,816 Nine people or Nine people or
more--$42,739more--$42,739
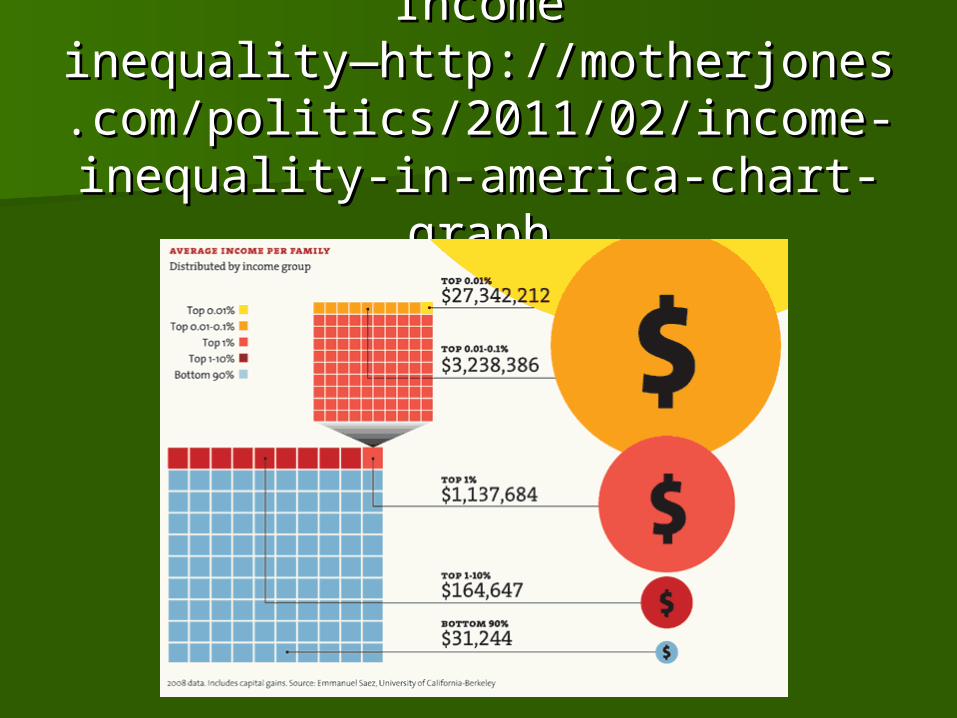
Income Income inequality—http://motherjones.coinequality—http://motherjones.co
m/politics/2011/02/income-m/politics/2011/02/income-inequality-in-america-chart-graphinequality-in-america-chart-graph
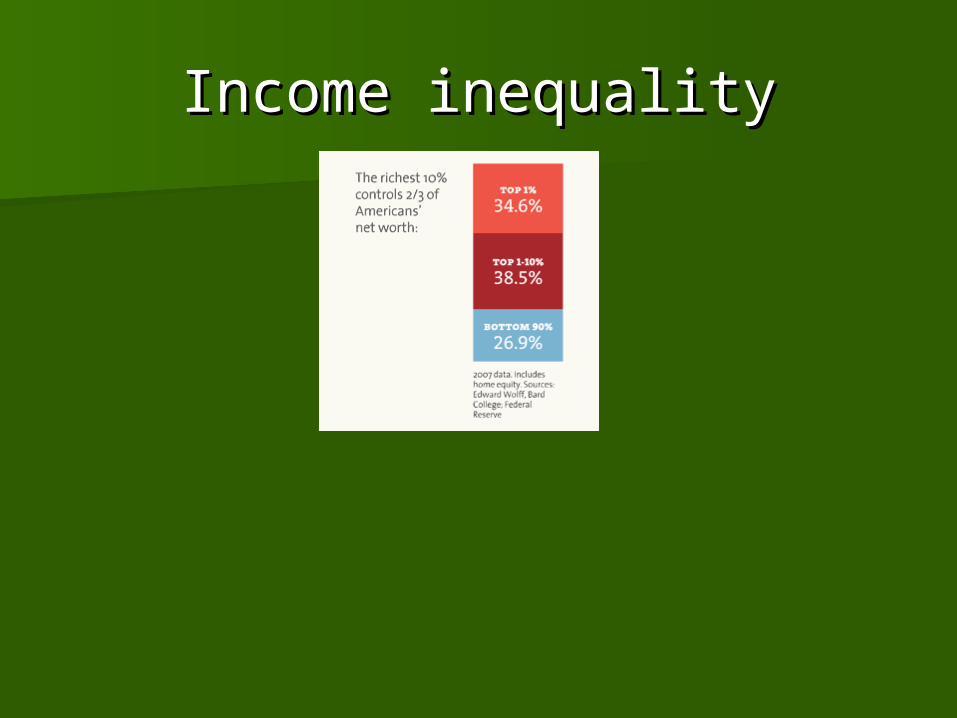
Income inequalityIncome inequality
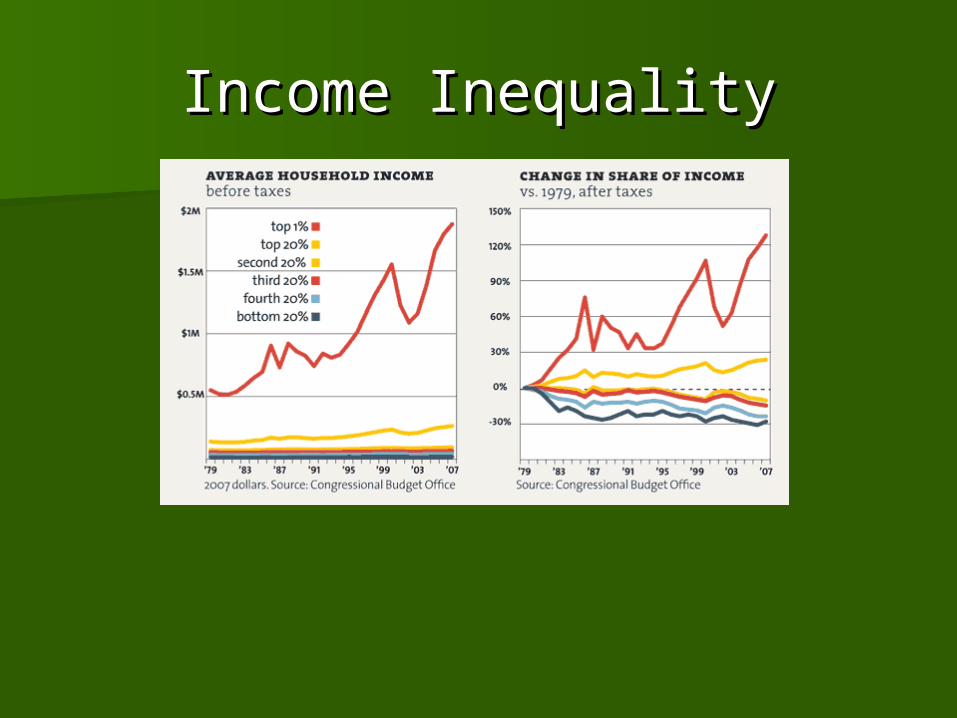
Income InequalityIncome Inequality
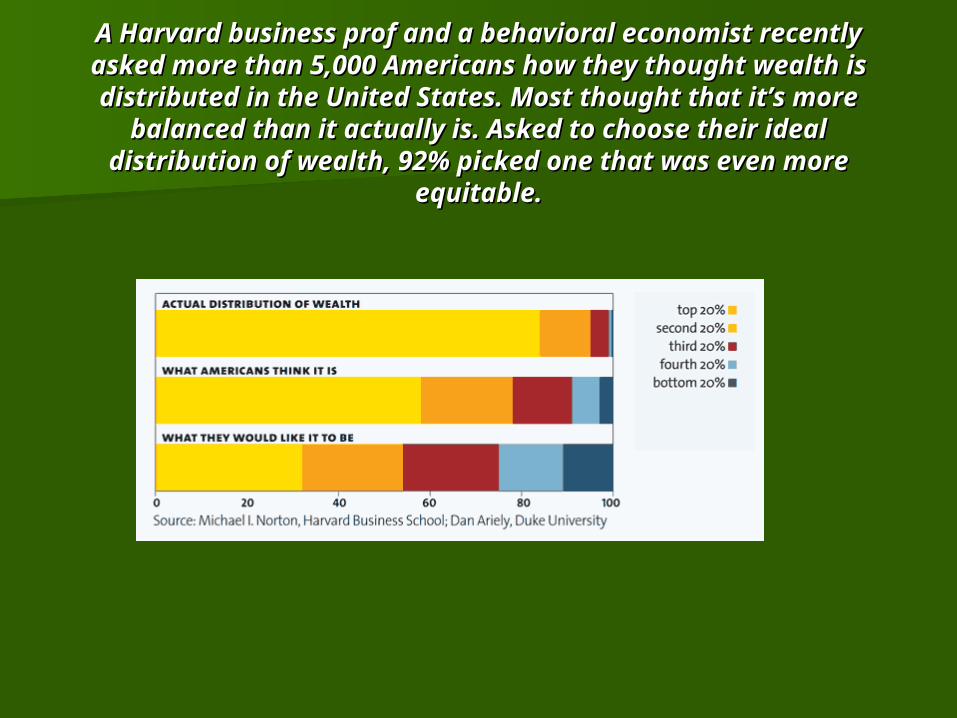
A Harvard business prof and a behavioral economist A Harvard business prof and a behavioral economist recently asked more than 5,000 Americans how they recently asked more than 5,000 Americans how they thought wealth is distributed in the United States. thought wealth is distributed in the United States.
Most thought that it’s more balanced than it actually Most thought that it’s more balanced than it actually is. Asked to choose their ideal distribution of wealth, is. Asked to choose their ideal distribution of wealth,
92% picked one that was even more equitable.92% picked one that was even more equitable.
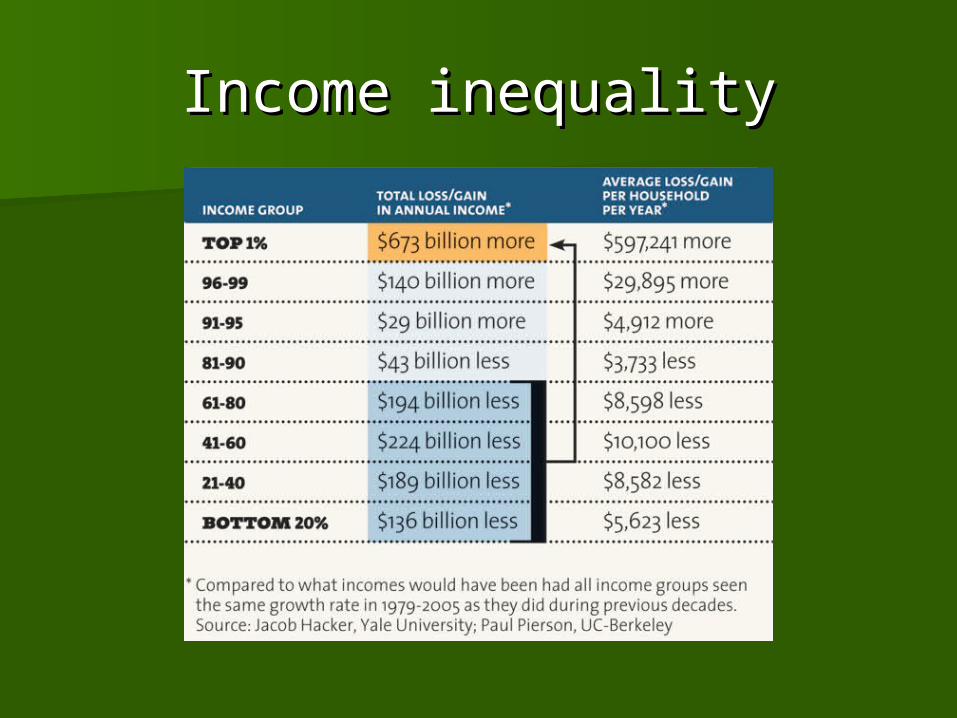
Income inequalityIncome inequality
US International TradeUS International Trade
1929—Demand for US goods declines1929—Demand for US goods declines 2008—Our number one export is our 2008—Our number one export is our
debt. We sell $700 billion of our debt debt. We sell $700 billion of our debt a year to foreigners.a year to foreigners.
http://www.usdebtclock.org/http://www.usdebtclock.org/ US Debt = 62.3% of GDP as of 2010US Debt = 62.3% of GDP as of 2010
US TradeUS Trade
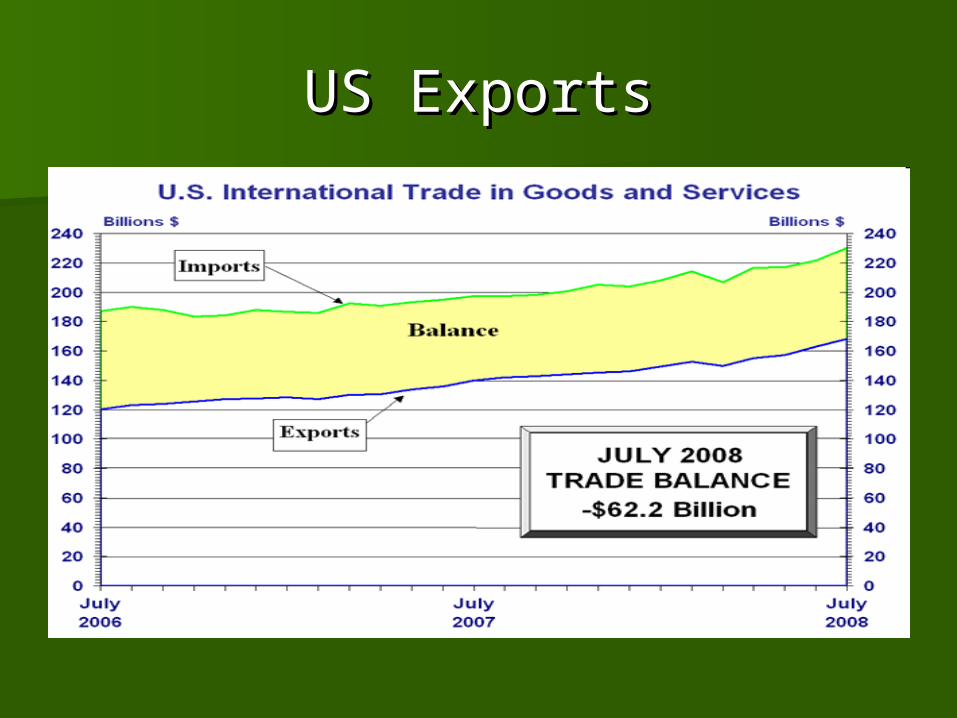
As of December 2008, U.S. exports of As of December 2008, U.S. exports of goods and services grew by 12.0% in goods and services grew by 12.0% in 2008 to $1.84 trillion, while imports 2008 to $1.84 trillion, while imports increased 7.4% to $2.52 trillion. increased 7.4% to $2.52 trillion.
Exports comprised 13.1% of U.S. GDP Exports comprised 13.1% of U.S. GDP in 2008. To put in historical terms, in 2008. To put in historical terms, exports were 9.5% of U.S. GDP five exports were 9.5% of U.S. GDP five years earlier (2003), and 5.3% 40 years earlier (2003), and 5.3% 40 years ago (1968). years ago (1968).
US ExportsUS Exports
Credit StructureCredit Structure 1929-US allies could not pay their debt 1929-US allies could not pay their debt
because Germany and Austria could not because Germany and Austria could not pay the reparations and the US was not pay the reparations and the US was not willing to forgive or reduce the debt.willing to forgive or reduce the debt.
About 4 million homes have been About 4 million homes have been repossessed since 2006.repossessed since 2006.
4.2 million loans are currently 4.2 million loans are currently delinquent. It would take 4 years for the delinquent. It would take 4 years for the market to absorb those houses.market to absorb those houses.
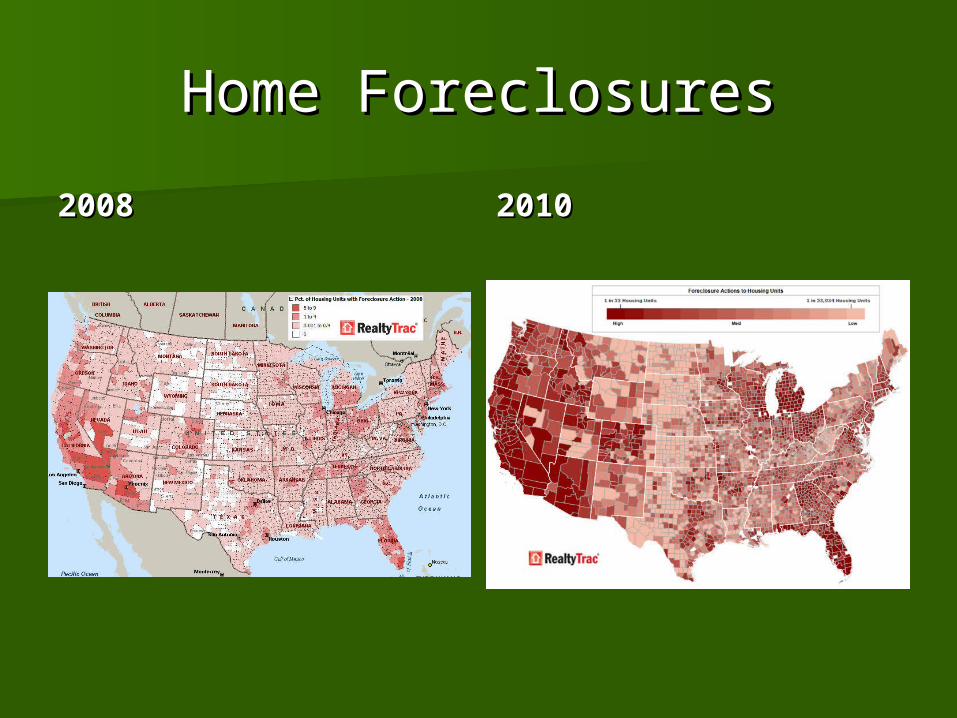
Home ForeclosuresHome Foreclosures
20082008 20102010
TariffsTariffs
1929—Protective Tariffs1929—Protective Tariffs Today—Free tradeToday—Free trade
International EconomyInternational Economy
Great Depression--European banks Great Depression--European banks began to fail in 1931. Germany had began to fail in 1931. Germany had high inflation.high inflation.
2008—Stocks plunge in Europe and 2008—Stocks plunge in Europe and Asia. Tokyo market falls 9.4% on Asia. Tokyo market falls 9.4% on October 8 which is its worse decline October 8 which is its worse decline since the 1987 crash.since the 1987 crash.
2009—Much like the US, international 2009—Much like the US, international stock markets have stabilized.stock markets have stabilized.
International Economy International Economy TodayToday
European Union debt, especially European Union debt, especially PIIGS (Portugal, Ireland, Italy, Greece PIIGS (Portugal, Ireland, Italy, Greece and Spain)and Spain)
http://www.economist.com/node/http://www.economist.com/node/1583802915838029
Japanese earthquake and tsunamiJapanese earthquake and tsunami
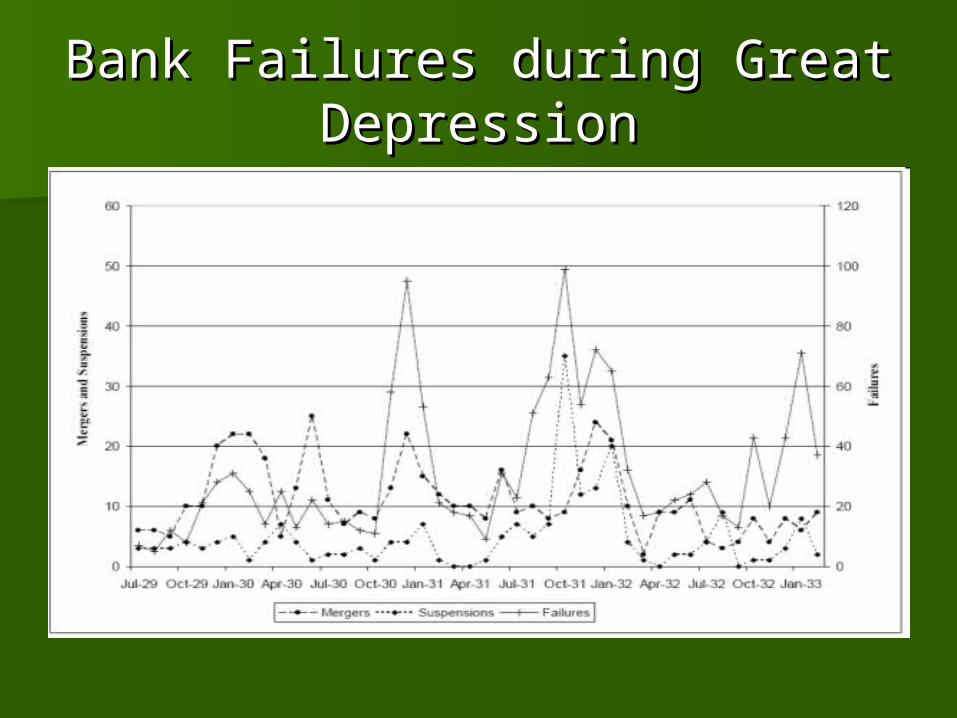
Bank Failures during Great Bank Failures during Great DepressionDepression
Bank failures TodayBank failures Today By 2007 the financial sector’s debt was By 2007 the financial sector’s debt was
equivalent to 116% of the GDP, compared equivalent to 116% of the GDP, compared with a mere 21% in 1980.with a mere 21% in 1980.
To date, US banks have admitted to $334 To date, US banks have admitted to $334 billion in losses and write-downs. They billion in losses and write-downs. They were able to raise $235 billion in new were able to raise $235 billion in new capital but that is still a $99 billion net loss.capital but that is still a $99 billion net loss.
140 banks failed as in 2009 140 banks failed as in 2009 156 banks failed in 2010156 banks failed in 2010 74 banks failed in 2011 as of September 74 banks failed in 2011 as of September
2011.2011.
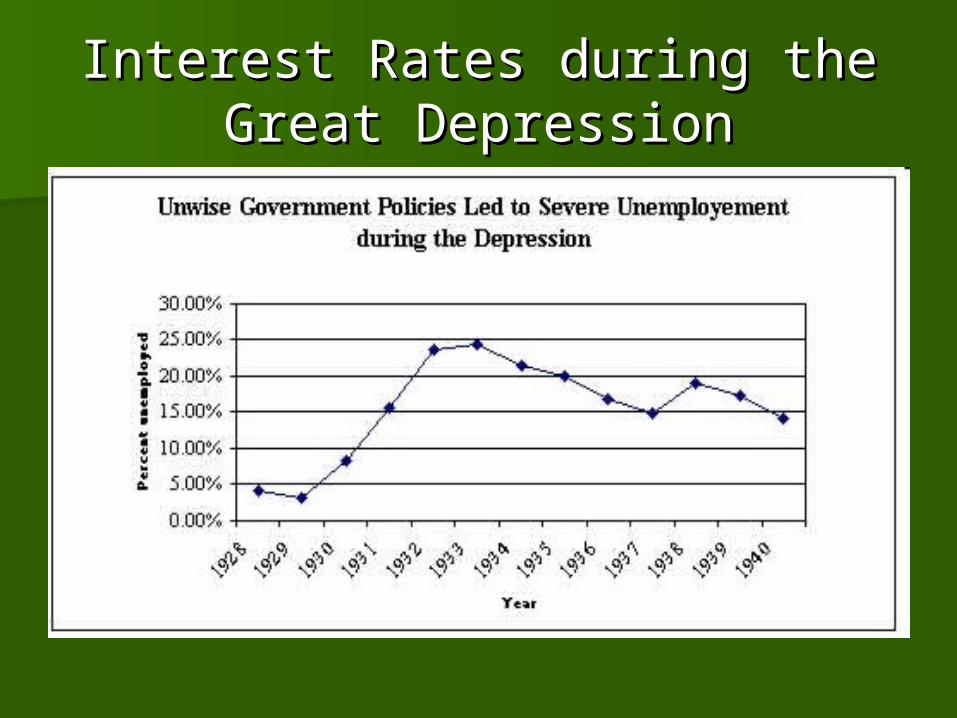
Interest Rates during the Great Interest Rates during the Great DepressionDepression
Interest Rates TodayInterest Rates Today Since the credit crunch began in August 2007, Since the credit crunch began in August 2007,
Bernanke has repeatedly cut the federal funds rate Bernanke has repeatedly cut the federal funds rate from 5.25% down to an effective rate at one point from 5.25% down to an effective rate at one point last week of about 0.25%.last week of about 0.25%.
The Federal Reserve has pumped about $1.1 trillion The Federal Reserve has pumped about $1.1 trillion into the financial system in the past 13 months.into the financial system in the past 13 months.
Fed said it would leave the interest rate at 0.25% for Fed said it would leave the interest rate at 0.25% for “an extended period.”“an extended period.”
Policy makers also announced that they would stretch Policy makers also announced that they would stretch out the Fed’s program to buy up almost $1.5 trillion out the Fed’s program to buy up almost $1.5 trillion worth of mortgage-related securities through the end worth of mortgage-related securities through the end of March. That program is aimed at keeping mortgage of March. That program is aimed at keeping mortgage rates low and propping up the housing market.rates low and propping up the housing market.
US GNPUS GNP
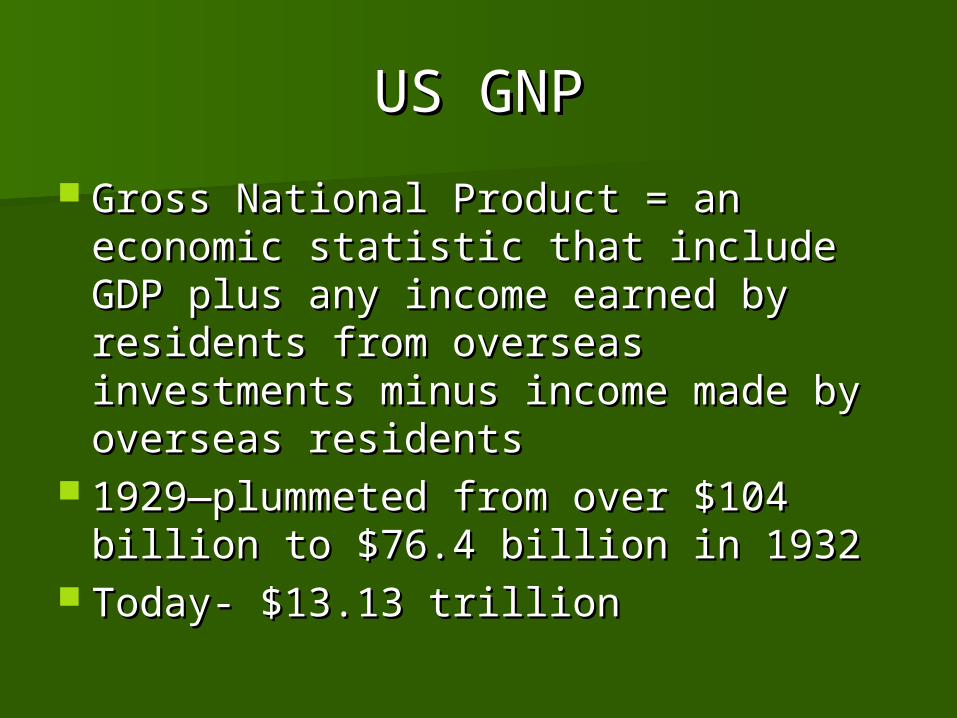
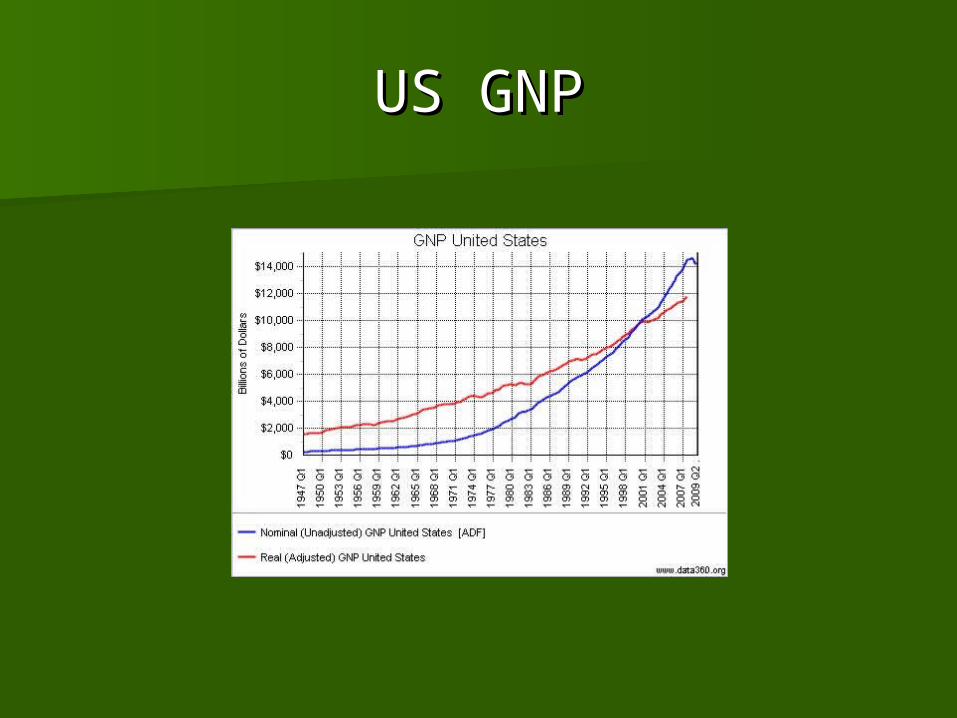
Gross National Product = an Gross National Product = an economic statistic that include GDP economic statistic that include GDP plus any income earned by residents plus any income earned by residents from overseas investments minus from overseas investments minus income made by overseas residentsincome made by overseas residents
1929—plummeted from over $104 1929—plummeted from over $104 billion to $76.4 billion in 1932billion to $76.4 billion in 1932
Today- $13.13 trillionToday- $13.13 trillion
US GNPUS GNP
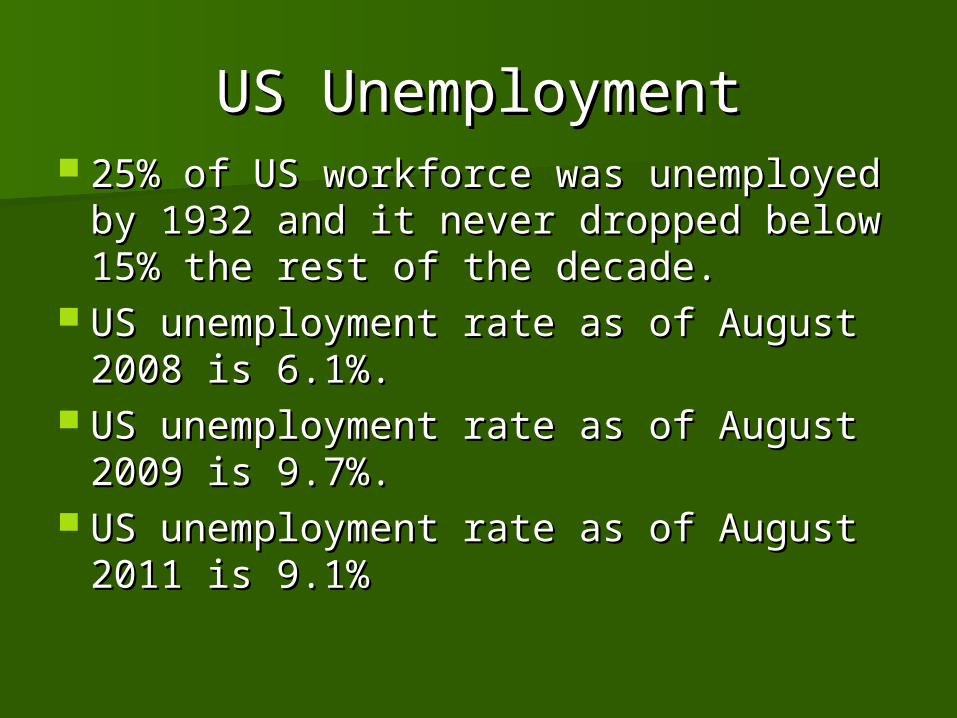
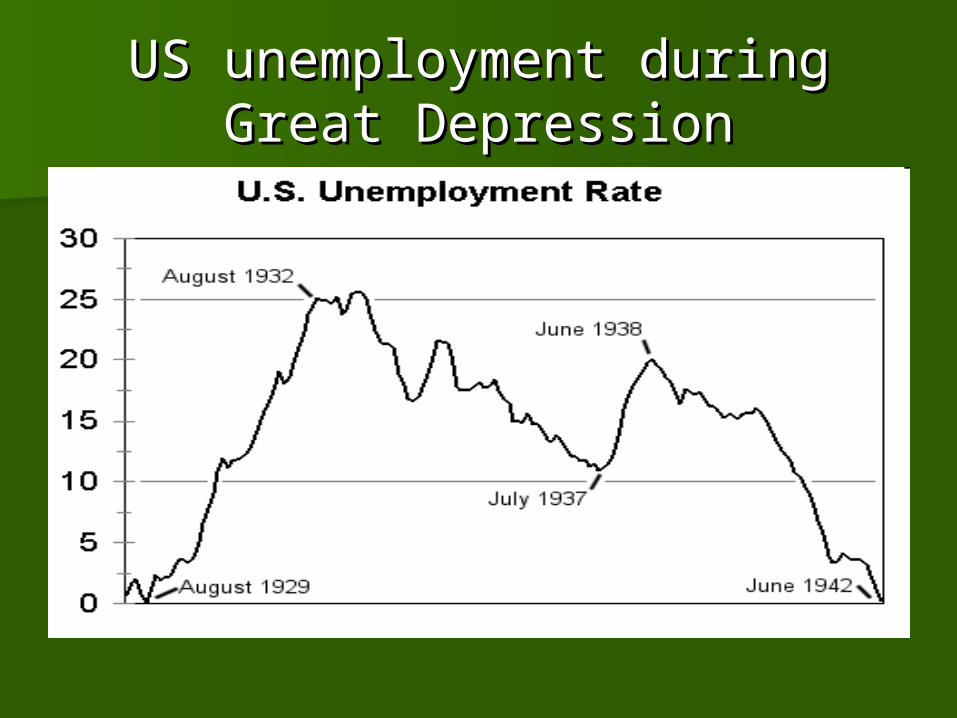
US UnemploymentUS Unemployment 25% of US workforce was unemployed 25% of US workforce was unemployed
by 1932 and it never dropped below by 1932 and it never dropped below 15% the rest of the decade.15% the rest of the decade.
US unemployment rate as of August US unemployment rate as of August 2008 is 6.1%.2008 is 6.1%.
US unemployment rate as of August US unemployment rate as of August 2009 is 9.7%.2009 is 9.7%.
US unemployment rate as of August US unemployment rate as of August 2011 is 9.1%2011 is 9.1%
US unemployment during US unemployment during Great DepressionGreat Depression
US Unemployment during US Unemployment during Great RecessionGreat Recession
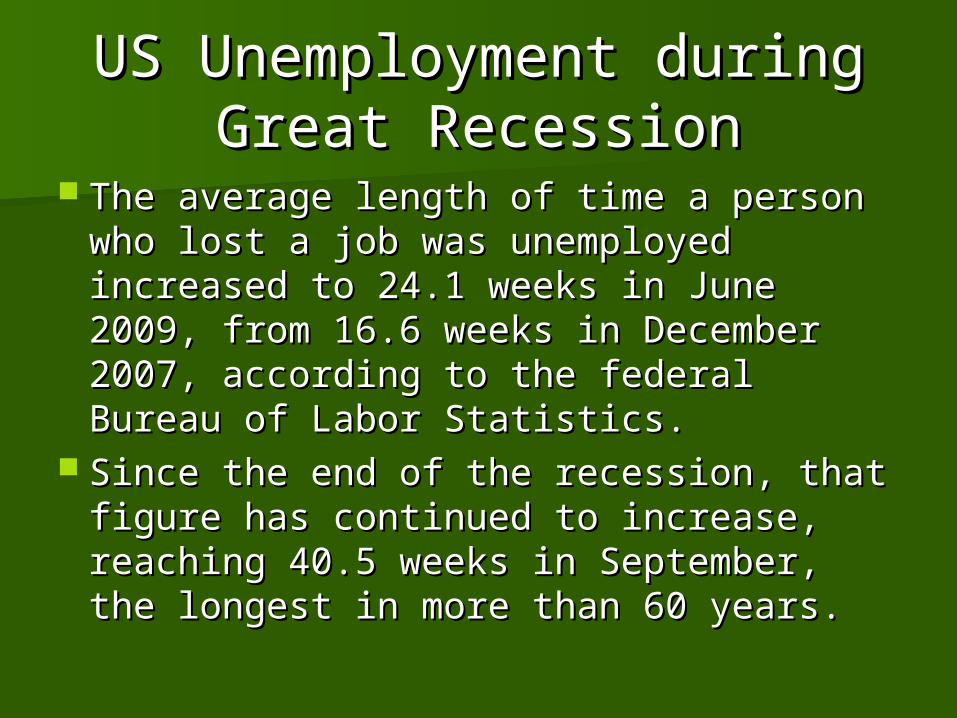
The average length of time a person who The average length of time a person who lost a job was unemployed increased to lost a job was unemployed increased to 24.1 weeks in June 2009, from 16.6 24.1 weeks in June 2009, from 16.6 weeks in December 2007, according to weeks in December 2007, according to the federal Bureau of Labor Statistics. the federal Bureau of Labor Statistics.
Since the end of the recession, that Since the end of the recession, that figure has continued to increase, figure has continued to increase, reaching 40.5 weeks in September, the reaching 40.5 weeks in September, the longest in more than 60 years.longest in more than 60 years.
US unemployment during US unemployment during Great RecessionGreat Recession
http://www.google.com/publicdata/http://www.google.com/publicdata/explore?explore?ds=z1ebjpgk2654c1_&met_y=unemployds=z1ebjpgk2654c1_&met_y=unemployment_rate&tdim=true&fdim_y=seasonalment_rate&tdim=true&fdim_y=seasonality:S&dl=en&hl=en&q=us+unemploymity:S&dl=en&hl=en&q=us+unemployment+rate#ctype=l&strail=false&nselm=ent+rate#ctype=l&strail=false&nselm=h&met_y=unemployment_rate&fdim_y=h&met_y=unemployment_rate&fdim_y=seasonality:S&scale_y=lin&ind_y=falseseasonality:S&scale_y=lin&ind_y=false&rdim=state&ifdim=state&tdim=true&h&rdim=state&ifdim=state&tdim=true&hl=en&dl=enl=en&dl=en

Make a venn diagram Make a venn diagram comparing the Great comparing the Great
Depression and the current Depression and the current recession. Use this recession. Use this
discussion and notes from discussion and notes from class.class.
How did the Great Depression How did the Great Depression affect African Americans?affect African Americans?
They experience more unemployment, They experience more unemployment, homelessness, malnutrition, and homelessness, malnutrition, and disease than they had in the past and disease than they had in the past and more than whites experience.more than whites experience.
More than half still lived in the South, More than half still lived in the South, but approx. 400,000 moved to the but approx. 400,000 moved to the North.North.
2 million, half the African American 2 million, half the African American population of the US—were on some population of the US—were on some form of relief by 1932.form of relief by 1932.
How did the Great How did the Great Depression affect Latinos?Depression affect Latinos?
Approx. half a million Latinos left the Approx. half a million Latinos left the US for Mexico in the first few years of US for Mexico in the first few years of the Great Depression.the Great Depression.
How did the Great How did the Great Depression affect women?Depression affect women?
By the end of the Depression, 25% By the end of the Depression, 25% more women were working than had more women were working than had been at the beginning.been at the beginning.
Black women suffered massive Black women suffered massive unemployment because of the decline unemployment because of the decline in domestic service jobs.in domestic service jobs.
As many as half of all African As many as half of all African American women lost their jobs in the American women lost their jobs in the 1930s.1930s.

UN p. 753-760UN p. 753-760
Herbert HooverHerbert Hoover Agricultural Marketing ActAgricultural Marketing Act Hawley-Smoot TariffHawley-Smoot Tariff International financial panic of the International financial panic of the
spring of 1931spring of 1931 Reconstruction Finance Corporation Reconstruction Finance Corporation
(RFC)(RFC) ““Bonus Army”Bonus Army”
AP p. 795-801AP p. 795-801
Election of 1932Election of 1932 Emergency Banking Relief Act of Emergency Banking Relief Act of
19331933 Glass-Steagall Banking Reform Act Glass-Steagall Banking Reform Act
UN Ch 26UN Ch 26UN 761-774UN 761-774 Emergency Banking ActEmergency Banking Act Economy ActEconomy Act Glass-Steagall ActGlass-Steagall Act Agricultural Adjustment Agricultural Adjustment
ActAct National Industry National Industry
Recovery ActRecovery Act Tennessee Valley Tennessee Valley
AuthorityAuthority Federal Emergency Relief Federal Emergency Relief
Administration (FERA)Administration (FERA)
UN p. 775-789UN p. 775-789 Second New DealSecond New Deal National Labor Relations National Labor Relations
ActAct Social Security ActSocial Security Act Works Progress Works Progress
Administration (WPA)Administration (WPA) ““Court-packing plan”Court-packing plan” Recession of 1937Recession of 1937 Limits and legacies of Limits and legacies of
New DealNew Deal Fair Labor Standards ActFair Labor Standards Act

![Kegworth Air disaster Example of multiple levels of analysis What causes a plane to crash? [1 min.]](https://img.pdfslide.us/doc/110x75/56649dda5503460f94ad105e/kegworth-air-disaster-example-of-multiple-levels-of-analysis-what-causes-a.jpg)


![[ 7.2 ] After the Crash. Learning Objectives Identify the causes of the stock market crash of 1929. Describe the ways in which the Great Depression affected](https://img.pdfslide.us/doc/110x75/56649d305503460f94a09304/-72-after-the-crash-learning-objectives-identify-the-causes-of-the-stock.jpg)