Embed Size (px)
Citation preview

RCN231
REACTOR CENTRUM NEDERLAND

MUTM» UL'SMf 4.MM» O* «CTtVATWHt MTf CTOM UUP rit IPtCTNUt UK*<*DM*Q
* * * * * l^nQuHU. • TAAft

RCN-231
Neutron selfshielding of activation detectors used
in spectrum unfolding
Willem L. Zijp
henk J, Nolch6nii»s
RCN does not assume any liability with
respect to the use of, or for damages
resulting from the use of any information,
apparatus, method or process disclosed in
this document.
Petten, August 1975.

- 3 -
Abstract * * •
Zijp, Willem L. and »oitheniu&, ilcok J.
Mentron selfshielding of activation detectors used in spectrum
unfolding.
Neutron selfshielding corrections for activation detectors have been
studied with a computer program SELFS, which is used in combination
with SAND-II, the computer program for determining neutron spectra
with aid of a set of irradiated foil detectors. The method does not
apply integral correction factors to the measured activities, but
Applies energy dependent correction factors to the group cross
section values. This calculation method has the advantage that
correction can be calculated only once for a given foil thickness
and can be applied to each neutron spectrum with known shape. The
applied formula to calculate the selfshielding is valid under limited
conditions, but in practice the elementary formula provides data
which are accurate enough. The results of calculations have been
compared with literature data (e.g. for a 1/E neutron spectrum, and
for the neutron spectra of the II facility in Nol and CFRMF in Los
Alamos). The cross section data required were taken from the SAND-II,
ENDF/B and the BNt-325 data sources. The program SELFS is written
in FORTRAN and was used on a CDC-6600 computer.
Reactor Centrum Nederland, 1975, August. 30 pp, 10 fig., 8 tab.
Keywords;
activation analysis neutron spectra
activation detectors s codes
computer calculations self-shielding
corrections thickness
differential cross sections total cross sections
foils


- 5 -
CONTENTS
£21*
! . INTRODUCTION 7
2 . THEORY tJSED IS SELFS 8
3 . BRIEF INTRODUCTION TO SAND-ll !0
4 . OPERATION OF SELFS 10
5 . PREPARATION OF TOTAL CROSS SECTION DATA II
6 . TEST OF SELFS 12
6 . 1 . Results for gold 12
6 . 2 . Results for copper 12
6 . 3 . Results for cobalt 13
6 . 4 . Results for : U 13
7 . CONCLUSION 13
8. REFERENCES 14
TABLES 15-19
FIGURES 20-30
\


- 7 -
it i d the program SAND-11 is often used to determine neutron spectra
with aid of activation and fission foils» irradiated in locations of
interest in the High Flux Reactor (HFR), the Low Flux Reactor (LFR),
and the coupled fast thermal critical facility STEK. The SAND-II pro-
gran jlj requires as input a best estimate of the neutron spectrin.
a set of experimentally obtained saturation activities, and a cross
section library for all reactions of interest. The calculations are
«efforned in 620 energy groups, comprising the whole range from 10"'°
MtY up to IS WeV.
The experimental activation or fission rates may be influenced by
relatively important neutron selfshielding effects due to the thick-
mess of the selected target material.
This report describes a method which perform a correction for this
aemtron selfshielding not to the measured activities, but to the
group cross sections. The method prepares a set of corrected cross
section values, adapted to the target material,and this modified
cross section set is then valid for each type of neutron spectrum.
Te test this approach we derived also integral selfshielding cor*
rection factors and compared these with experimental self shielding
data reported by other laboratories. In this way calculations with
the program SELFS have been performed for a 1/E neutron spectrum,
and for the neutron spectra of the II facility at Wol and the CFRHF
at Idaho,

8 -
2. THEORY VSED IS SELFS
Th* seIfshielding factor C for an activation Jetector can be defined
as the ratio of the experimental activation to the theoretically
expected activation without sel{shielding, the latter activation being
determined by the appropriately chosen activation cross section and
the flux density of neutrons at the surface of the detector.
The selfshielding factor defin* ! in this way is always less than unity.
Assuming an isotropic flux density» one has generally '2|:
C -
<• t ^ /2 f f f , / r \ . tc\ ~Sv-JF(E).x/cOSi?» . , ^ j- . - •' - "act'E'# *E(E).e E simt.d^.dE.dx E*)yOp«0
• t »/2 ƒ ƒ / cracc(£).$E(E).siir.d^.dE.dx
E"0 x«0 e-0
where Nv - the number of target «tons per unit voli
a a c ts the activation cross section;
ct - the total cross section (activation plus scattering);
t * foil thickness.
The equation used in SELFS is based on the following assumptions:
- the neutron flux density can be considered as aonoenergetir is each ^ . energy group;
- the cross sections can be taken constant in these energy groups;
* the incident neutron flux density is isotropic;
- t*}«T* are no multiple interactions;
- the foil may be considered as a plane slab (i.e. there are no
edge effects);
* the flux depression outside the foil is much less than the
self-shielding in the foil; - the Doppler broadening effect is negligible.
When we apply a rather fine group structure, like the 620 group
structure of SAKD-I1, then the first two assumptions will five negli
gible errors (except when very narrow resonances occur),
when the integration in the formula above is performed first over
the energy one obtains for each energy group is

- 9 -
t "12 „ ï -• f e ^
l .sm^.d-.dx „1 x-0 "«0
t f f
x«0 -^0 where ~ denotes the total cross section for group i.
Substitution of u - cos-
and v* t'
(which expresses the foi l thickness in units of mean Tree path,
since r 1 - t/7 tl» where :: t i s the aacroscopic to ta l cross section in
Che i group) and integration over x leads to
• i ° */ Gl» — ƒ u(I-e~ 'U) .du.
1
Substitution of $ « l/u gives
i
c«-I« -St (l-e " )
ds. 1
Introducing E->(T), the third exponential integral defined as
one obtains the basic expression used in SELFS:
C(TS 1-2 E 3 < T * )
Since one can calculate G(r ) ««lues for each cross section for each
energy group i relevant to the multifoil detector set, one can pre*
pare a new and modified group cross section set which can be used in
the spectrum evaluation program. The cross section modified for self-
shielding can be written as
<0c ^ d " C ^ 1 ) ^ 1 *
These modified cross section data with 620 energy groups for the »pe-
cified fo i l s have bean need in the MÏCD-TT program.

- 10 -
3. BRIEF INTRODUCTION TO SAND-II
This program has been developed by McElroy and coworkers [if to eva
luate the neutron flux density spectrum» starting from measured
activities of a series of irradiated activation and fission detectors»
and a zeroth approximation neutron spectrum.
One of the main features of this program is that the information of
the zeroth approximation spectrum (the input spectrum) is essential
in deriving the solution spectrum (the output spectrum). The program
can select an input spectrum from a library of about 60 neutron
spectra» or can prepare such an input spectrum from tabulated group
flux density data by using interpolation and extrapolation procedures.
By subsequent iterative adjustments of the neutron spectra, the pro
gram arrives at an appropriate output spectrum, which produces calcu
lated activities which fit within experimental error as close as
possible to the measured activities. The calculation is performed for
620 energy -roups, ranging from 10"10 MeV to 18 MeV.
Also the SAND-II cross section library covers this range.
The cross section library is made from point cross section values by
the subprogram CSTAPE. For more information on the SAND-II program
the reader is referred to ! 1 f.
4. SELFS IK RELATION TO SANI>-II
The program SELFS reads an original cross section library made by the
program CSTAPE of the SAND-II package, or a library made by SELFS.
It then performs the calculations required to obtain modified cross
sections, and writes a new library which contains the original group
cross sections and the modified group cross sections.
The library can be used in a SAND-II spectrum calculation, and can also
be read by SELFS, when an extension of the library with respect to
other foil thicknesses is required.
Mian SELFS has to calculate modified cross section data for one or
more foils, one has to specify in the input a few characteristics of
the foils under consideration (e.g. reaction name, thickness, atonic
«as» number, etc.).

11 -
The programs SELFS and SAND-II prov;de a means to calculate integral
selfshielding factors, which lead themselves for comparison with ex
perimental selfshiel ding factors.
The integral selfshielding factors which are clearly spectrum depen
dent can be determined as a ratio of two activity values calculated
by using cross section data and neutron spectrum data; these activity
calculations have to be performed for the unmodified capture cross
section data as well as for the modified capture cross section data
set. The calculation of the activities is easily performed with the
ACTIVITY node of the SAND-II program using the modified and the un
modified differential cross section values, and also the differential
neutron spectrum data in the SAND-II group structure with 620 groups.
The program offers the possibility for the calculation of several
activities in one computer run, so that integral selfshielding factors
for several materials and foil thicknesses can easily be obtained.
5. PREPARATION OF TOTAL CROSS SECTION DATA
The first version of SELFS, prepared by I. Kondo [ 3| took only into
account the activation cross sections, thus neglecting the contri
bution of the scattering cross section to the total cross section.
This version yielded rather inaccurate results. This was especially
the case for reactions with an important scattering contribution (e.g.
copper, manganese and cobalt). A modified version, prepared by T. Noda
|4|, took into account also the scattering effect by introducing the
total cross sections. This approach made it necessary to have avail
able in addition to the activation cross section library a total
cross section library, ngain in the 620 groups structure.
The calculations started with total cross section values prepared from
BNL-325 and from the ENDF/B-III file. The data from the file were con
verted into point values and changed into the SAND-II group structure.
Recently the ENDF/B IV file with up-to-date capture and total cross
section data became available. In applying this file many more cross
section point values have been prepared than previously, so that,
apart from a probable improvement in the quality of the data, also
improvement was established for the conversion into the SAND-II group
structure |5|, The conversion from ENDF/B IV data to the input data for
the CSTAPE of the SARD-II program package was performed with a special
program package prepared by Barsky |6|.

- 12 -
6. TEST OF SELFS
The program SELFS was tested by comparing calculated C-values with
experimental values reported by other laboratories. The comparison
was performed for a few materials (e.g. the reactions '̂ Au(n,r)!,pAu,
€ :Cu(n,v)'"*Cu, * ,r'U(n,f)) and three different neutron spectra (i.e.
a 1/E spectrum, the Y.Z spectrum, and the CFRMF spectruw). For these
neutron spectra experimentally determined selfshielding factors were
available, while also the shapes of the neutron spectra are well-
known. The data for the ÏY. secondary intermediate energy standard
neutron field at Mol were obtained from Fabry i6j. The data for the
Coupled Fast Reactivity Measurement Facility at Idaho «ere ob
tained from a LMFBR progress report ! 7! .
6 . 1 . Results for gold
Results for G-values for gold fo i l s a re presented in tab les 1 and 2.
All G-factors were ca lcu la ted with aid of to ta l cross sec t ion data
from the ENDF/B HI and the ENDF/B IV f i l e . The 1/E spectrum which
was applied had a cadmium cut-off energy of 0.68 eV. Here the G-values
using a c and at from the ENDF/B IV f i l e are in good agreement with
the experimental data published by Brose J 8 | .
For the IZ and CFRMF neutron spect ra the G-values based on the
ENDF/B I I I data are somewhat c loser to the reference values than
values based on the ENDF/B IV data,
6 .2 . Results for copper
The r e s u l t s of the ca lcu la t ions of se l f sh ie ld ing factors for the
activation reac t ion 63Cu(n,y)61*Cu are presented in tables 3 , 4 and 5,
In case of the 1/E spectrum we observe that the G-values calculated
with o c from the ENDF/B I I I f i l e show rather large deviations from
the reference values, and are worse than the C-values using o c from
the SAND-II l ibrary. Remarkable i s that in this case the SAND-I1
cross sect ions yield s t i l l better agreement with experimental data
than the recent ENDF/B IV cross sect ions .
For the LL spectrum the agreement between calculated and experimental
G-values i s rather poor. Here the smallest deviations are obtained i
i i

- 13 -
for the ENDF/B III capture cross sections. The deviations remain
targe (about 5%) for these cross section data.
In the case of the CFRMF spectrum we obtain the best results using
the cross sections from the ENDF/B IV file.
h.3. Results for cobalt
Calculated selfshielding factors for cobalt foils in the CFRMF neutron
spectrum deviate appreciably from the experimental values, reported
by McElroy (see table 6). Since it is well-known that scattering
cross section of cobalt has a strong influence on the selfshielding,
this point should be investigated further.
6.4. Res ul ts for; " ';l'
Some experimental data are available for the CFRMF f a c i l i t y . The
calculated G-values for this f a c i l i t y , using the cross sect ion data
from the ENDF/B IV f i l e are very c lose to the experimental data of
McElroy.
7. CONCLUSION
Tests of the described simple mathematical model for the calculat ion of
neutron se l f sh i e ld ing factors using capture cross sect ion data and
total cross sect ion data derived from the ENDF/B IV dosimetry f i l e ,
resulted in values for the se l f sh ie ld ing factors which often agreed
with experimental data.
Discrepancies were observed for copper f o i l s in the ZY. spectrum and
for cobalt f o i l s in the CFRMF spectrum.
Further tests should be perfo.*med with other detector mater ia l s , pre
ferably with re la t ive ly large scattering cross s ec t ions .
Also the influence of the energy group structure used in the ca lcula
t ions of the G-values should be considered.
- 14 -
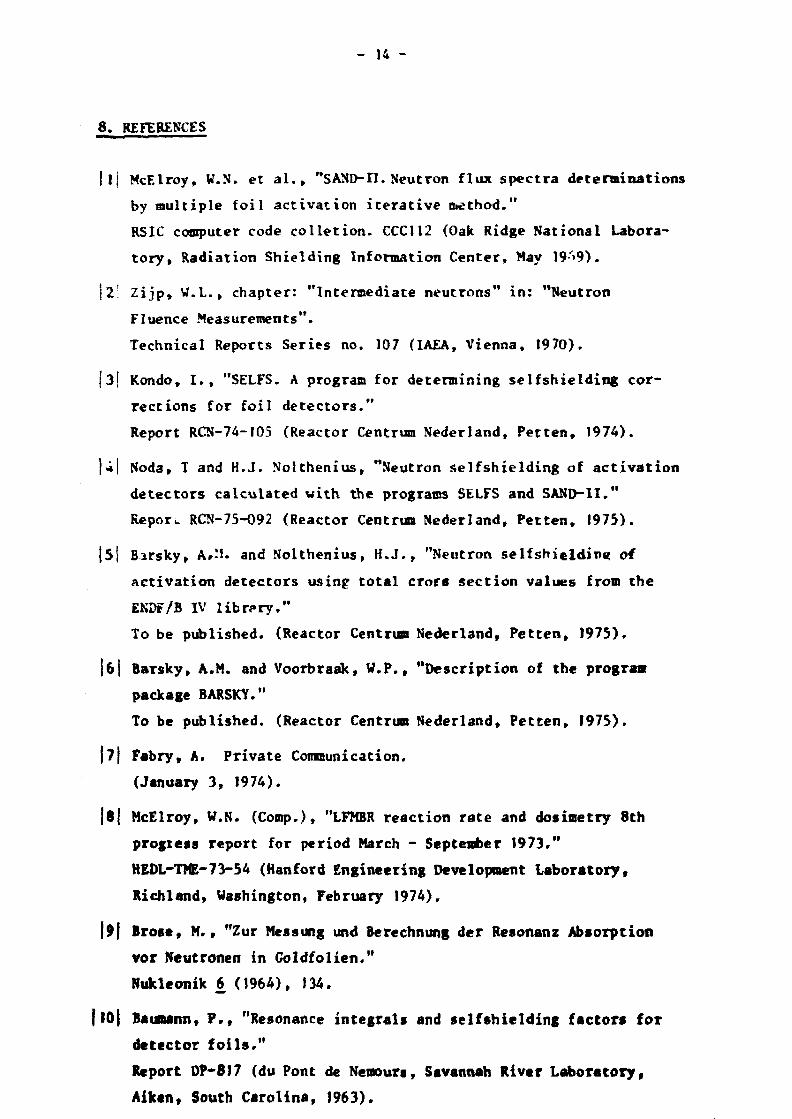
8. REFERENCES
[ij McElroy, W.N. et al., "SAND-II. Neutron flux spectra determinations
by multiple foil activation iterative method."
RSIC computer code collet ion. CCC112 (Oak Ridge National Labora
tory, Radiation Shielding Information Center, May 19''9).
12| Zijp, VJ.L., chapter: "Intermediate neutrons" in: "Neutron
Fluence Measurements".
Technical Reports Series no. 107 (IAEA, Vienna, 1970).
(3( Kondo, I., "SELFS. A program for determining selfshielding cor
rections for foil detectors."
Report RCN-74-105 (Reactor Centrum Nederland, Petten, 1974).
}•*! Noda, T and H.J. Nolthenius, "Neutron selfshielding of activation
detectors calculated with the programs SELFS and SAND-1I."
Repor*. RCN-75-092 (Reactor Centrum Nederland, Petten, 1975).
|S( Birsky, A»M. and Nolthenius, H.J., "Neutron selfshielding of
activation detectors using total crors section values from the
ENDF/B IV library."
To be published. (Reactor Centrum Nederland, Petten, 1975).
J6f Barsky, A.M. and Voorbraak, W.P., "Description of the program
package BARSKY."
To be published. (Reactor Centrum Nederland, Petten, 1975).
|7j Fabry, A. Private Communication.
(January 3, 1974).
|8| McElroy, W.N. (Comp.), "LFMBR reaction rate and dosimetry 8th
progtess report for period March - September 1973."
HEDL-TME-73-54 (Hanford Engineering Development Laboratory,
Richland, Washington, February 1974),
|9| Brose, M., "Zur Messung und Berechnung der Resonanz Absorption
vor Neutronen in Goldfolien,"
Nukleonik 6 (1964), 134,
IlOj Baumann, P., "Resonance integrals and selfshielding factor» for
detector foils,"
Report DP-817 (du Pont de Nemours, Savannah River Laboratory,
Aikent South Carolina, 1963),

- 15 -
Table I. Selfshieldings for gold foils in a I/E apsectrum
Values C3 and G4 were obtained using ac and ? t from ENDF/B I I I and
ENDF/B IV f i les respectively.
Values G2 were obtained using oc from SAND-II l ibrary and i t from
the ENOF/B I I I f i l e .
1G£ denotes the re la t ive deviation (Gexp -Gj) /Gj .
The cadmium cut-off energy of the J/E neutron spectrum for these calculations was 0.68 eV... ,
f o i l thickness
( in an) exp
1
- •—*r—
% G2 G3 H LG2
( i n Z) AG 3 j ( in %)'
£G 4 j ( in X)'
2xK)-5 » 0.9936 0.9957 0.9963 0.9957 - 0 . 2 1 -0 .2 7 1
- 0 .21 :
4xl0"5 • 0.9893 0.9936 0.9926 0.9914 -0 .43 -0 .33 -0 .21
8xl0~5 * 0.9815 0.9833 0.9857 0.9834 - 0 . 1 8 -0 .38 -0 .19 :
2xl0~4 0.9644 0.9630 0.9667 0.9624 +0.1 J -0 .24 -0 .21
4 x l 0 ' 4 0.9340 0.9340 0.9408 0.9334 -0 .00 -0 .73 -0 .06
8xl0~* 0.8852 0.8896 0.9007 0.8890 0.50 -1 .75 -0 .43
2xKT 3 0.7852 0.7946 0.8141 0.7935 -1 .20 -3 .68 -1 .05
4xl0~ 3 0.6836 0.6909 0.7190 0.6899 -1 .07 -5 .18 -0 .91
8x10"3 0.5612 0.5655 0.6022 0.5658 -0 .77 -7 .31 - 0 . 8 1
2xl0" 2 0.3952 0.3996 0.4427 0.4023 -1 .11 1-12.02 1
-1 .76
4xl0~2 0.3020 0.2997 0.3403 0.3028 +0.77 1-12.68 -0 ,26
8xJ0"2 0.2219 0.2272 0.2591 0.2271 -2 .39 -16.76 -2 ,29
2x10"' 0.1505 0.1640 0.1796 0.1550 -8 .97 -19.34 - 2 . 9 0
4x10" ! * 0.1118 0.1313 0.1347 0.1160 -17 .4 -20.5 -3 ,62
8x10" ! » 0.0836 1
0.1048 0.O983 0.0858 -25 .4 -17,6 1
^2.52
these values were taken fro» the experimental work by Brose | 9 [ ,
Only the values denoted with a * refer to calculations by Brose.

- 16 -
Table 2, Selfshielding for gold foils in the 1 neutron spectrum.
Values G3 and G4 were obtained using c and ot from ENDF/B III and
ENDF/B IV files respectively.
Values G2 were obtained using ac from SAND-II library and 1t from
ENDF/B III file.
AGj denotes the relative devi
fo i l G a )
r 1 thickness
(in mm) G a ) G2 G3 G, i AG-»
i ( i n ! ) • • ~ i • 1 1
AC 3
(in%) A«4
(in I )
2x l0" 3 0.986 0.988 0.984 0.984 j -0 .20 +0.20 +0.21
4xl0" 3 0.978 0.981 0.974 0.975 | -0 .31 +0.41 +0.31
8xl0"3 0.965 0.973 0.960 0.963 J - 0 ,83 +0.52 +0.20
2xlO"2 0.932 0,958 0.933 0.943 -2.79 -0 .11 -1 .20
4x l0 - 2 0.894 0.944 0.905 0.925 -5.59 - 1 . 2 3 -3.36
8xI0 - 2 0.863 0.920 0.86 7 0.902 -7 .30 -0 .46 -4.29
1 • , , — , , , . . , . ,
These experimental values were taten from the work by Fabry |7|,
Table 3. Selfshielding for gold foils in the CFRMF neutron spectrum
Values G3 and G4 were obtained using ac and ot from ENDF/B 111 and
ENDF/B IV files respectively.
Values G2 were obtained using ac from SAND-II library an% ot from
ENDF/B III file.
AGj denotes the relative deviation (Gexp '6$)/Gj*
f o i l G a ) »exp
r • • •'"
thickness ( in m)
G a ) »exp G2 G3 G4 &G2
(in*) AG 3
(in Z) AGA
<inZ)
1.270x10⁻³ 1.000 0.999 0.997 0.999 •0,10 +0.30 *0.)t
1.270x10⁻² 0.976 0.992 0.979 0.990 -1 .64 -0 .30 -1 .40
S.OBOxlO'2 0.923
1
0.973 j 0.939
i 0.969 -5 .42 • 1.73 -4 .77
These experimental values were tafren from the work by McElroy |8|.

- ]7 -
Tabic 4 . Sel f sh ie ld ing for copper f o i l s in a 1/E neutron spectrum.
Values C3 and G4 were obtained using c ross sec t ion data from ENDF/B I I I
and ENDF/B IV f i l e s r e s p e c t i v e l y .
Values Gj were obtained using a c t i v a t i o n cross sec t ions from SAND-II
l i b r a r y and t o t a l cross s ec t ions from BNL-325.
Values G2 were obtained using ~c from SAXD-II l i b r a r y and ~ t from
ENDF/B I I I f i l e .
AGj/Gj denotes the r e l a t i v e dev ia t ion ( G e x p - G - ) / G | .
The cadmiim cu t -o f f energy of the 1/E neutron spectrum was 0.622 eV,
except that for G4 a value of 0.68 eV was used.
1
fo i l ; t h i c k - ; p o s i -ness i t ion (in mm)
l
a) Gexp
G l •
' 1 G2 G 3 G4 AGj/Gi
( in Z>
'C2/G2
(in X)
iC 3 /G r e f
(in %)
iG4/C r ef
( in 50
4.7244
4.798
4.801
4.851
1.074
1.128
1.270
1.270
2.210
2.248
5.207
5.207
A
A
B
B
A
B
A
B
A
B
A
B
0.910
0.902
0.930
0.940
0.868
0.850
0.828
0.836
0.780
0.782
0.686
0.692
0.Q33
0.933
0.939
0.932
0.880
0.876
0.862
0.862
0.809
0.807
0.695
0.695
0.928
0.928
0.927
0.927
0.872
0.868
0.853
0.853
0.798
0.796
0.681
0.681
0.897
0.896
0.896
0.895
0.817
0.811
0.791
0.791
0.713
0.710
0.551
0.551
0.948
0.948
0.948
0.947
0.904
0.901
0.892
0.892
0.842
0.840
0.732
0.732
- 2 . 4 7
-3 .32
-1.O0
•0 .86
- 1 . 3 6
- 4 . 2 9
- 3 . 9 4
-3 .02
- 3 . 5 8
- 3 . 1 0
- 1 . 2 9
- 0 . 4 3
-1.94
-2 .80
•0.32
• 1.40
-0 .46
-2 .12
-3 .02
-2 .03
-2 .31
-1 .79
+0.73
• 1.62
• 1.4
+0.7
+3.8
•5 .0
+6.2
•4 .8
•4 .7
•5 .7
+9.4
• 10.1
•24.5
+25.6
- 4 . 0
- 4 . 8
- 1 . 9
- 0 . 8
-4 .0
-5 .6
-7 .1
-6 .7
- 7 . 3
- 6 . 8
- 6 . 2
- 5 . 8
These experimental values were taken from the work l y Baumann | l 0 | .

- 18 -
Table 5 . Se l f sh ie ld ing for copper t o i l s in the CFKMF neutron spectrum.
Values G3 and G4 were obtained using ? c and ct from ENDF/B I I I and
INDF/B IV f i l e s r e s p e c t i v e l y .
Values Gi were obtained using 3C from SAND-11 l ib ra ry and ctt from
ENDF/B I I I f i l e .
üGi denotes the r e l a t i v e devia t ion (G e x _- Gi ) /Gj .
f o i l thickness
( in nm) exp Gl G3
G4 iG2/C2
( in Z)
^G3/G3
( in Z)
AG4/G4
(in Z)
U270xl0~3 1.000 0.998 0.997 0.999 •0 .20 +0.30 +0.14
2 .540xl0 - 3 0.966 0.972 0.952 0.977 -0 .62 • 1.47 -1.10
1.267xl0"3 0.934 0.907 0.843 0.917 +2.98 + 10.79 -1 .84
These experimental values were taken from the work by McElroy [ 8 | .
table 6 . Se l f sh ie ld ing for copper f o i l s in the Zl neutron spectrum.
Values G3 and G4 were obtained using dc and at from ENDF/B I I I and
EHDF/B IV f i l e s r e spec t ive ly .
Values G2 were obtained using ac from SAND-II l i b r a r y and at from
ÏRDF/B I I I f i l e .
f o i l thickness
( in mm)
G a ) ^exp G2 G3 G4 &G2
(in Z)
AG3
( i n Z)
AG4
( in Z)
2,79x!0"2
5»58xl0~2
1.16x10-'
1,65x10"'
2.23x10"'
0.900
0.854
0.822
0.800
0.778
0.977
0.960
0.931
0,911
0.891
0,957
0.927
0.877
0.845
0.813
0.981
0.965
0,939
0,921
0.902
-8 .56
-12 .4 i
-13 .26
-13.86
-14.52
- 6 . 3 3
-8 .55
-6 ,69
- 5 . 6 3
-4 .50
- 8 . 2 3
- I I . 5
-12 .4
-13 .1
-13 .7
These experimental values were taken from the work by Fabry | 7 [ .

- 19 -
Table 7. SeIfshie lding for ' 3 ' u f i s s ion in the CFRMF neutron spectrum.
Values G4 were obtained using 7 f and zt from ENDF/B-IV f i l e .
iG4 denotes the r e l a t i v e deviation (GeXD - C ^ ) ^ .
f o i l thickness ( in mm)
Cexp C4
1
1.270 * 10"} 1.000 1.000 0 .0
1.270 * 10"1 0.985 0.982 • 0.27
2.540 * 10"1 0.964 0.966 - 0.26
These experimental values were taken from the work by McElroy ;8 i .
Table 8. Se l f sh ie ld ing for cobalt in the CFHMF neutron spectrum.
Values G4 were obtained using oc and ot from ENDF/B-IV f i l e .
AG4 denotes the re la t ive deviation (C^%p " 64)/C4.
f o i l thickness ( in * • )
uexp G4 AG4
1.270 * I0"3 1.000 0.922 • 8.4
3.810 * 10"2 0.788 0.500 •57.6
5.080 x !0"2 0.700 0.460 •52.2
These experimental values were taken f roe the work by McElroy J8 | .

- 20 -
Annotation t o the f i g u r e s
The fo l lowing f i g u r e s show t h e FNDF/B LV c r o s s s e c t i o n curves for
the f o i l r e a c t i o n s .vrv-idcreii in t h i s r e p o r t .
The p l o t s were made t ro r . -data in the SAND-II group s t r u c t u r e and
«ere derived from the r'NDF-'S IV dos ime t ry f i l e us ing the programs
BARSKY and CSTAPE.
Curves a> r e f e r to th* u-v.-orrvoted c r o s s s e c t i o n da ta , and curves b)
r e f e r to the c r o s s . sect ion d a t a r o r r e c t e d for s e l f s h i e l d i n g .
Carves for the c o r r e c t e d c r o s s s e c t i o n d a t a were made for the
fo l lowing f o i l t h i c k n e s s .
Figure i 1 Foil material
i
Thickness t ( in no)
2 S
copper 0.5207
5 i g° i d 0.800
8 ' uranium 0.254
10 j cobalt 0.38!

10 10 10 10 10 10 10
ENERGY / HEV
rio* x a m OECTWN CURVE rm nc PORCTIQN CU63(T0TRL)
occfiON cuwc rai ne MNCTION CU63(N»0)CU64 • • •

10
te'
10
Ito'
i J to
10
w—1_J
TO.2
10 10 10
EN0W / HEV o n * fw nc MICTION CU63CN.0JCU64 ome PONTIC MICTION CU63(N.0)CU64 • • «

m.3
to 10 10
ENERGY / rCV
•ECTIOH curw rat THE «WCTWN flU197(N,G)flUl90

4>
FIB.*
so 10 10
ENERGY / MEV
CURVE f » TME ROCT10N RU197( TOTAL )

to
10
10
••10
«to
«10
10
10
1111 —r- - f — — — t 1 1- « .
*
s^ a i
1
• •
1 1 t 1
1
^1
•
™ F • ^ ^ ^
-!
i 4
10 10 10 10 10 10 10
no.5"
10 10 10
ENERGY / rCV
aECTioM ome rat nm NSCTION fHJl97(N.C)fllU98
OECTiw CURVE rat we MSCTION RU197(N.0)RU198 •
10 10 10
Is}
• •

10 10 tO 10 tO 10 tO
ENERGY / HEV r » . 6 cm» mcnm CURVE POK THE MICTION U23S(N»F)FP
10 10 10

ro«7
10 10 10
ENERGY / MEV
« T I M CURVE Pt» THE REICT10N U23S( TOTfiL)
io;

10 10
r i* 9
to to so to ENERGY / MEV
wmim cure rat nc WCTION U235tN.F)FP «cTiQM tarn. *m IM muctim U23S(N.F)FP • • •

10 10
FTO.9
10 10 10 10
ENERGY / MEV
SECTION cum* rm THE «BCTION C059( TOTAL)
«CTIONcurverm THERBRCTIOWC059(N.GJC060 • • •

10 10
no, lo
10 to to to
ENERGY / MEV « c u e » CURVE rm l ie meruit C059(N»t»C060 weenm CURVE FOR HC REACTION C0S91N.GJCO60 • • •