Embed Size (px)
Citation preview

Reactive Power Control - 53.AM
INOGATE Technical Secretariat and Integrated Programme in support of the
Baku Initiative and the Eastern Partnership energy objectives
Contract No 2011/278827
A project within the INOGATE Programme
Implemented by:
Ramboll Denmark A/S (lead partner)
EIR Development Partners Ltd.
The British Standards Institution
LDK Consultants S.A.
MVV decon GmbH
ICF International
Statistics Denmark
Energy Institute Hrvoje Požar
Document title Reactive Power Control - 53.AM
Document status Draft
Name Date
Prepared by Michael Emmerton 13/10/2014
Checked by John Swinscoe, Nikos Tsakalidis 12/11/2014, 10/01/2015
Approved by
This publication has been produced with the assistance of the European Union. The contents of this publication
are the sole responsibility of the authors and can in no way be taken to reflect the views of the European
Union.
1
Table of Contents
Abbreviations .....................................................................................................................................2
Executive Summary.............................................................................................................................3
1 Introduction ...................................................................................................................................5
1.1 Key Deliverables ...................................................................................................................5
1.2 Scope of Work......................................................................................................................5
1.3 Framework of the Report .....................................................................................................5
2 Power Factor .................................................................................................................................6
2.1 Reactive Power ....................................................................................................................6
2.2 Power Factor........................................................................................................................7
2.3 Technical Losses ...................................................................................................................7
3 Reactive Power Charges .................................................................................................................9
3.1 Electricity Charging Principles ...............................................................................................9
3.1.1 Basic Cost Components ............................................................................................ 9
3.1.2 Traditional Tariff Design ........................................................................................... 9
3.1.3 Liberalized Markets ............................................................................................... 10
3.2 Energy Tariffs in Armenia ................................................................................................... 11
4 Reactive Power Tariffs ................................................................................................................. 13
4.1 Background ........................................................................................................................ 13
4.1.1 ENA Daily Load Profiles .......................................................................................... 13
4.1.2 ENA Load Duration Curve ....................................................................................... 14
4.1.3 ENA Tariff Rates ..................................................................................................... 15
4.1.4 Large Customer Energy & Revenue Shares by Time-of-Use .................................... 15
4.1.5 Average Large Customer Profile ............................................................................. 16
4.2 Day / Night Energy Rate + Independent kVA Rate ............................................................... 16
4.3 ToU (3-Part) Energy Rate + Independent kVA Rate ............................................................. 21
4.4 Day / Night Energy Rate + kVA Rate Linked to kWh ............................................................ 22
4.5 Customers with Low Load Factor ........................................................................................ 23
5 Reactive Energy Metering ............................................................................................................ 25
5.1 Reactive Energy Metering .................................................................................................. 25
5.2 Automated Meter Reading Systems ................................................................................... 26
6 Annexes ....................................................................................................................................... 28
2
Abbreviations
AMD, AMD’m Armenian Dram, million Armenian Dram
BST Bulk supply tariff
ENA Electricity Networks of Armenia
EU European Union
HV High Voltage (6 (10)kV or 35kV)
kVA Kilo-Volt Ampere
kVArh Kilo-Volt Ampere Reactive hours
kW Kilo-Watt
kWh Kilo-Watt hours
LV Low Voltage (415V)
Network The electricity distribution system of ENA
NPV, PV Net Present Value, Present Value
PF Power Factor
PSRC xxxxxxxxxx
3
Executive Summary
The stated objectives of this technical assistance are as follows:-
• To propose a tariff methodology that compensates ENA for avoidable losses caused by
lower than normal power factors in the consumption of large consumers;
• To make recommendations regarding enabling modifications to legislation; and
• To propose an approach that would lead to a reduction in the technical losses in the
distribution system and consequent improvement in the security of supply.
These objectives have been met by way of demonstration of a tariff methodology that
includes a capacity charge. It has been estimated that the introduction of kVA demand
charges for ENA’s 6 (10)kV and 35kV customers, at a rate of around AMD 2 250 per kVA per
month, would provide those customers with a low power factor a proper incentive to
undertake power factor correction. Current energy tariff revenue for kVA demand customers
would need to be reduced by as much as 10% to ensure that customers would not pay more
than their current billed amount, so long as power factor correction was achieved.
It has been estimated that, if all large consumers were to correct their power factor, ENA’s
technical losses could be reduced by as much as 2.7% (on energy basis). ENA’s technical loss
has been reported by ENA to be 10.1%. ENA also reports that 10% of the distribution feeders
suffer from low voltage due to overloading; it follows that most of the uneconomic technical
loss can be attributed to these feeders. The potential to reduce technical losses by up to
2.7% is consistent with these statistics.
The implementation of a kVA demand tariff would not require modifications to existing
legislation. Under the Energy Law the PSRC has the power to implement tariffs without the
need for changes to the law. Implementation would however require a full roll-out of interval
meters across ENA’s large consumer segment. ENA reports that the count of installed
interval meters currently stands at 5,268. ENA plans to continue to install interval meters to
reach a total of around 17,000. Once the 3,900 customers supplied at 6 (10)kV and 35kV are
fitted with interval meters, and appropriate modifications are made to ENA’s billing system,
it will be feasible to introduce the kVA tariff described in this report.
In the EU countries, supply and distribution network services have been unbundled. Reactive
energy charges are levied in line with the reactive energy charges passed through by the grid
companies. The grid companies use such charges as a means of controlling power factor on
the transmission grid and thus improve their ability to maintain stable grid voltage. In
addition to energy charges, the distribution network operators apply distribution network
capacity charges in the form of use of system charges, measured according to consumer’s
peak kW demands. Taken together these reactive energy charges and kW demand charges
are equivalent to a reactive power demand charge.
At the present time when ENA provides bundled electricity services, and the grid company
does not impose reactive energy charges, the introduction of a kVA demand tariff would be

4
an appropriate step towards the practices of the EU countries. In the meantime, improved
power factor will benefit the electricity supply sector by deferring investments in new
capacity in the long-run, likewise for the transmission sector, and in the generation system
costs would be reduced at the margin.
This report quantifies the impact of a kVA demand tariff on ENA’s 6 (10)kV and 35kV
customers based on best available data. Whilst the analysis presented in this report provides
an indication of tariff rates, the input assumptions will likely need to be adjusted following
further load research undertaken by ENA. The PSRC would need to undertake a detailed
tariff design to ensure that the proposed tariff amendment would be fair and equitable for
the target group of customers.
However, the report demonstrates that, subject to the aforementioned assumptions, a tariff
structure that provides incentives for improving power factors is both practical and beneficial
to the sector. A basic kVA tariff model has been supplied as an Appendix to this report.
The following specific actions are recommended:-
1. Capture power factor data systematically for the large customers that are being
metered with interval meters;
2. Analyze the power factor data to test and improve the accuracy of the input
assumptions to the kVA tariff model;
3. Further quantify the cost of metering, meter reading, and billing system
modifications required to implement a kVA tariff; and
4. Submit a kVA tariff business case to the PSRC based on
5
1 Introduction
This Introduction contains a description of the key deliverables and the scope of work for this assignment.
1.1 Key Deliverables
The key deliverables extend to the following:-
• A proposal for a tariff methodology that compensates ENA for avoidable losses caused by lower than normal power factors in the consumption of large consumers;
• Recommendations regarding enabling modifications to legislation; and • A proposal that acts to reduce the technical losses in the distribution system with a consequent
improvement in the security of supply.
1.2 Scope of Work
The scope of this assignment extends to the following:-
• To analyse the existing regulations that cover the governance of tariff to identify any possible
barriers to the inclusion of reactive energy in the tariff structure and to recommend any required
modifications;
• To review the metering and measurement standards relevant to the premises of large
consumers;
• To analyse the rules governing metering in Armenia (the equivalent to the metering code chapter
in a standard grid code) to ensure that sufficient provision is made to capture the data required
for the measurement of reactive power, and to recommend any required modifications;
• To prepare an analysis of the mechanisms deployed in EU for the management and pricing of
reactive power, including market based strategies in countries which have deregulated the
supply function; and
• To recommend a tariff methodology that will provide an incentive for large consumers to
increase their power factor and will compensate the distribution company for avoidable
technical losses caused by inefficient consumption.
1.3 Framework of the Report
This report comprises an Executive Summary, Abbreviations, five sections and an Appendix.
The Executive Summary and Abbreviations are provided at the beginning of this report.
Section 1 comprises this brief introduction.
Section 2 discusses the basic relationships between working power, reactive power, apparent power
and power factor.
Section 3 discusses reactive power charges in the context of cost recovery principles and EU practice.
Section 4presents a reactive power tariff proposal that could potentially be applied in Armenia
Section 5 discusses reactive energy metering of large consumers.
The Appendix is in the form of an Excel spreadsheet – the spreadsheet is a demonstration kVA tariff
model.
6
2 Power Factor
In this section some theoretical concepts are discussed to explain what is meant by ‘power factor’ and ‘power factor correction’. The relationship between reactive power and power factor, and the role that reactive power plays in driving electricity demand and technical losses are explained.
2.1 Reactive Power
All electrical equipment has a predominant nature according to the materials from which its electrical circuits are made. The nature can be resistive, inductive or capacitive, and this is in turn a determining factor of the reactive power demand of electrical equipment.
In an alternating current or a.c. electrical circuit, the nature of the electrical circuit material causes an an angle between the sinusoidal voltage waveform and the sinusoidal current waveform of the circuit. If the waveforms are perfectly aligned and the angle is zero, the equipment is said to be purely resistive. If the current waveform lags 90 degrees behind the voltage waveform, the equipment is said to be inductive. If the current waveform leads 90 degrees ahead of the voltage waveform, then the equipment is said to capacitive. In practice electrical equipment is a mixture of resistive, inductive and capacitive elements, and so the angle varies across a range of 180 degrees; however most electrical equipment that provides useful work has a predominantly inductive nature, e.g. rotating equipment such as motors.
Electrical equipment with an inductive nature requires two kinds of power:-
• Working power performs the actual work in creating heat, light, motion, or whatever else is required. It is measured in kilowatts (kW); and
• Reactive power does not perform useful "work" but rather sustains an electromagnetic field needed for magnetizing certain components within the equipment. It is measured in kilovolt-amperes-reactive (kVAr).
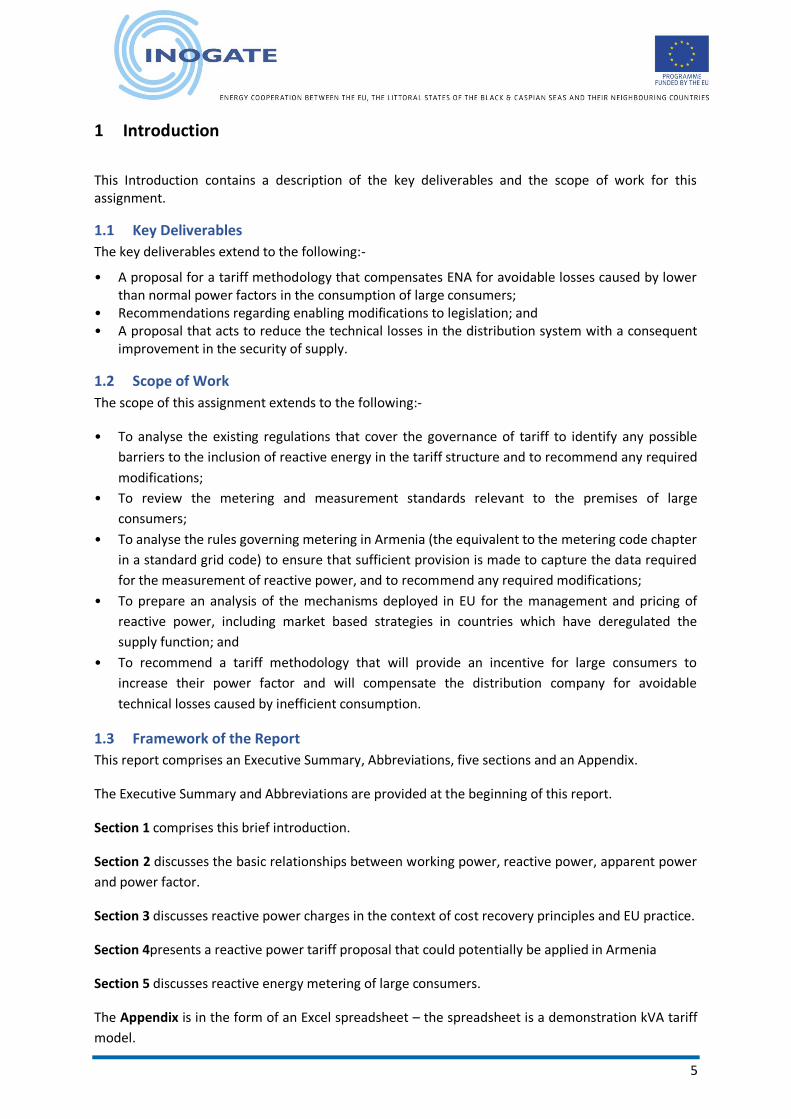
These two types of power combine to create the Apparent Power. It is measured in kilovolt-amperes (kVA). The three types of power are related though a “Power Triangle”.
Figure 1: Power Triangle
Simple trigonometry gives the relationship between the three Powers.
Figure 2: Power Equation
In order for electrical equipment to operate, its need for Apparent Power must be met. Assuming the equipment is not purely resistive, the Apparent Power is always greater than the Working Power,
7
which means that the current drawn by the equipment will always be higher than would be the case for the Working Power alone; therefore the electrical capacity of circuits and components must be also be higher. This additional capacity comes with a cost penalty; not only as the higher cost of electrical equipment, but also as a higher cost for the electrical network supplying the equipment.
2.2 Power Factor
Power Factor is a measure of how effectively the apparent power is being used in the conversion of electrical current to working power. The higher the power factor, the more effectively electrical power is utilised, conversely the lower the power factor the less effectively electrical power is utilised.
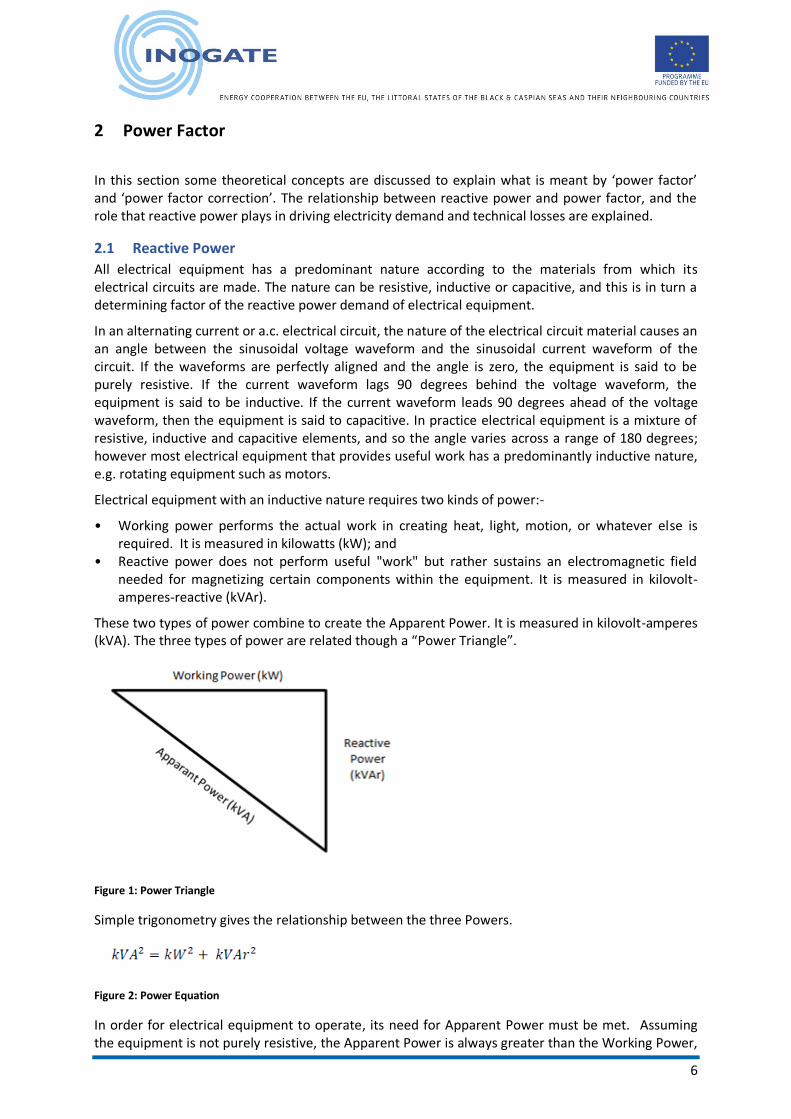
Power Factor is defined as the ratio of working power to apparent power.
Figure 3: Power Factor Equation
It can be seen from Figure 1 above that power factor can also be expressed as the cosine of the angle between kW and kVA.
As an example, assuming a working power is 400 kW and an apparent power is 500 kVA, the power factor would be 0.8. This power factor equates to an angle between kW and kVA of 36.8 degrees. These are useful mathematical relationships for calculating one type of power from another.
It is clear from the power factor equation that for any given electrical equipment, a low power factor is associated with a relatively high Apparent Power. A high power factor will have a relatively low Apparent Power.
2.3 Technical Losses
In an alternating current system, technical losses are a function of the square of the electrical current in a circuit and the effective resistance of the circuit. Such losses are actually heat losses that can be thought of as arising due to the friction that occurs when electrons pass along a conductor.
As it is the square of the current that drives technical losses, it means that for a given circuit resistance, the highest losses are incurred when the electrical load is highest, i.e. when the demand is highest. It follows from Section 2.2 that, for a given circuit, technical losses will be at their highest when power factor is lowest (the apparent power will be at its highest relative to the Working Power).
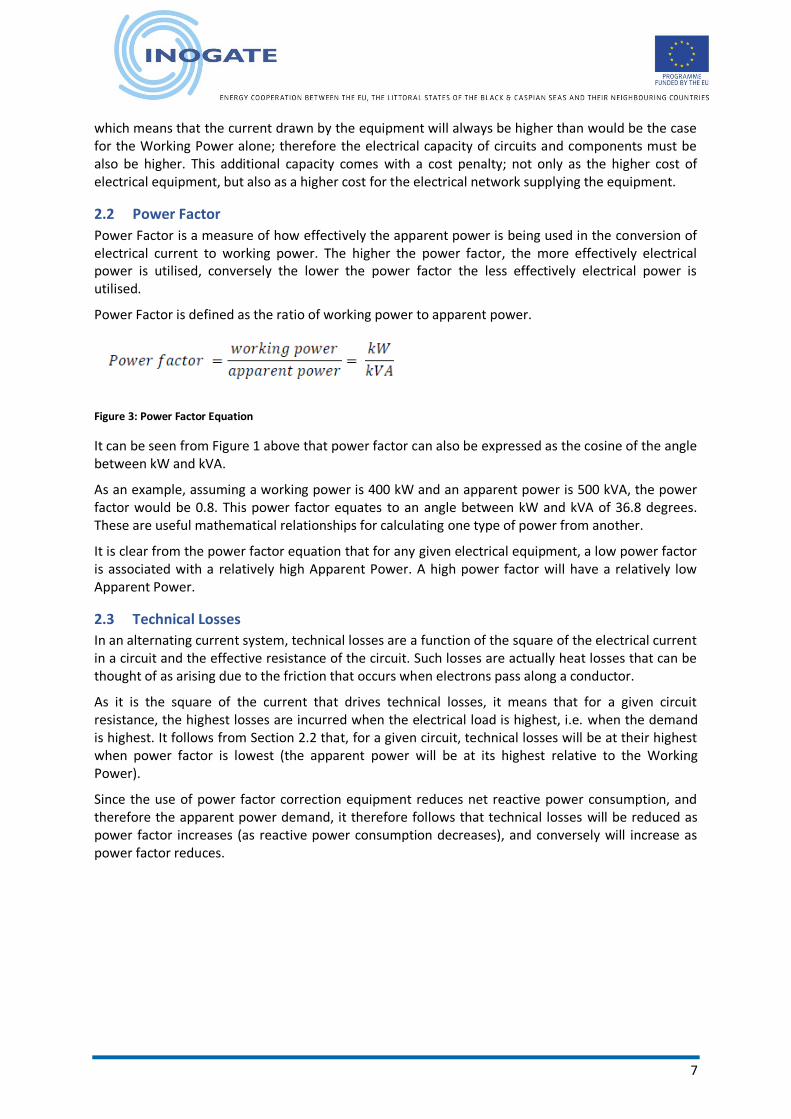
Since the use of power factor correction equipment reduces net reactive power consumption, and therefore the apparent power demand, it therefore follows that technical losses will be reduced as power factor increases (as reactive power consumption decreases), and conversely will increase as power factor reduces.
8
Figure 4: Power Factor Correction
More formally, the relationship between the technical losses of a circuit, the Apparent Power and the Voltage of the supply is expressed in the following equation:-
Figure 5: Technical Loss Equation
Where
• kfactor is a constant that comprises an equivalent resistance and loss load factor terms; • kVA is the Apparent Power; and • V is the supply voltage.
It can be seen from the equation that a reduction in kVA will yield a reduction in technical losses according to a square law, i.e. losses will reduce quickly as the kVA demand is reduced.
9
3 Reactive Power Charges
In this section we examine reactive power charges and their relationship to the range of charges that are observed to apply to electricity services. The discussion covers the practices employed by EU countries including tariffs. The legislative framework that governs tariff setting in Armenia is discussed briefly. Finally the form that a reactive power tariff could take in Armenia is considered.
3.1 Electricity Charging Principles
3.1.1 Basic Cost Components
The provision of electricity involves three basic cost components:-
a) Fixed Customer Charges (per customer per month)
Fixed Charges are charges that are not a function of the customer’s usage during a billing period and are often used to recover costs that vary with the number of customers being served.
Examples of such costs include:-
• Meter and meter services;
• Customer billing and accounting expenses; and
• Customer information and service expenses
b) Energy Charges
Energy charges are a function of the cost of energy supply and the rate is a cost per kWh.
c) Capacity Charges
Capacity charges are a function of the customer’s maximum monthly kVA, representing the relative share of the supply network used by the customer. The charging rate may be fixed according to the contracted supply capacity of the customer, or variable according to the maximum demand of the customer measured at the time of peak demand of the system.
The basic charge components do not include reactive power or reactive energy charges explicitly. This is because a capacity (kVA) charge is equivalent to a reactive power charge.
As explained in Section 2 above, for a given electrical load the Working Power is fixed, whereas the Reactive Power and Apparent Power will increase or decrease together as the power factor of electrical equipment changes. This means that a kVA tariff provides an incentive for customers to improve their power factor to reduce kVA demand and, due to the power equation, kVAr demand will also reduce.
3.1.2 Traditional Tariff Design
The charges described in the preceding section represent cost recovery components of a tariff. When designing tariffs, consideration must be given to how the components are recovered. This could be through an energy tariff alone, a capacity tariff alone, or by a mixture of energy and capacity tariff rates. A tariff component represents a measurement that requires a meter. This means that the cost of a tariff implementation varies according to the cost of metering.
In traditional markets, prior to liberalization, tariffs designs evolved when reliable, low cost metering technologies became available from the early 1980’s.
In the 1960’s and 1970’s it was common to find that cost recovery was made through an energy charge only. The tariff design was an electromechanical energy meter that had the advantage of low cost and simplicity. In the 1970’s and 80’s, this approach was extended to day / night energy rates;
10
the meter was equipped with two rate registers and a day / night timer that switched between the registers.
When low cost, reliable electronic meters became available in 90’s, time-of-use tariff designs were extended from the day / night structure to off-peak, shoulder and peak periods. These periods were matched to the rates passed through in bulk supply energy tariffs, reflecting the generation plant mix and associated marginal costs. Reactive power charges were also introduced to reflect the reactive power charges and penalties applied by grid companies in their efforts to maintain voltage stability on the main grid.
3.1.3 Liberalized Markets
The liberalization of electricity markets, and the adoption of electronic meters, has resulted in the development of new distribution network charging principles, along with more sophisticated tariff designs.
d) Network Energy Charges (kWh)
The design of a distribution network is based on a need to handle expected peak loads. Peak loads can occur at different times in different parts of the network, and at times other than the time of the peak demand of the electricity system as a whole. Since load growth at times when capacity is adequate does not require additional capacity, it is considered in many liberalized markets as important to recover network costs on a time-of-day usage basis for customers with time-of-use metering, and on a seasonal basis for customers with simple metering. As the exact time of the peaks on various facilities cannot be predicted with complete accuracy, it is appropriate to recover network costs on the basis of energy used within the critical periods when the peaks are likely to occur. These costs can be charged on the basis of time-differentiated energy throughput (kWh) or by maximum demand (kW used) at during the peak period.
e) Demand Charges (per kW of metered peak demand during the billing period)
An alternative to time-differentiated per-kWh network charges is time-differentiated (or seasonal) charges per kW of monthly-metered demand. ‘Maximum’ demand charging i.e. charging customers on the basis of their maximum demand in any given, say, quarter hour in a billing period has traditionally been used as a means to recover capacity costs described above in (d). The principle is that the maximum energy use of a customer in a billing period is a proxy for that customer’s contribution to the need to invest in capacity to cover peak demand. The disadvantage of this approach is that a customer’s peak demand does not necessarily coincide with peak demand on the high voltage distribution system. Also, once maximum demand has been reached in a billing period, the customer has little incentive to restrain demand at other times, which may be equally or more critical for the system.
Time-differentiating demand charging, or billing on the basis of maximum kW demand in various pricing periods, is a better approach. It requires meters capable of recording peak demand in particular periods. The more pricing periods there are the more similar is per-kWh and a per-kW billing.
f) Reactive Energy Charges (cosϕ (phi) or per kVArh)
Certain types of loads and generators consume (or produce) reactive power in addition to real power. As explained in Section 2 above, the relationship between real and reactive power is known as the Power Factor. If the network operator must compensate the grid operator for power factors outside a normal range, in order to keep voltage within safe limits, then it may be justified to penalize larger customers operating with a low power factor. One approach, that requires suitable metering, is to measure power factor against a target value. An alternative is to meter kVArh and to apply a charge for excessive reactive power consumption.
11
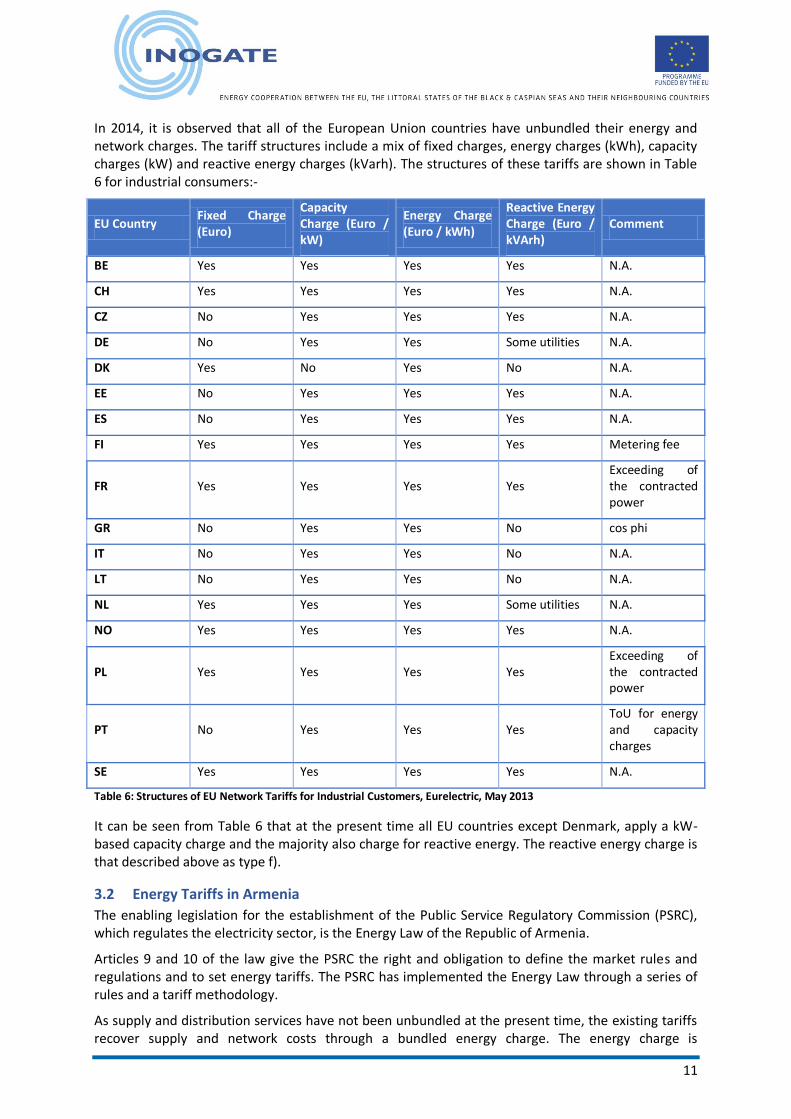
In 2014, it is observed that all of the European Union countries have unbundled their energy and network charges. The tariff structures include a mix of fixed charges, energy charges (kWh), capacity charges (kW) and reactive energy charges (kVarh). The structures of these tariffs are shown in Table 6 for industrial consumers:-
EU Country Fixed Charge (Euro)
Capacity Charge (Euro / kW)
Energy Charge (Euro / kWh)
Reactive Energy Charge (Euro / kVArh)
Comment
BE Yes Yes Yes Yes N.A.
CH Yes Yes Yes Yes N.A.
CZ No Yes Yes Yes N.A.
DE No Yes Yes Some utilities N.A.
DK Yes No Yes No N.A.
EE No Yes Yes Yes N.A.
ES No Yes Yes Yes N.A.
FI Yes Yes Yes Yes Metering fee
FR Yes Yes Yes Yes Exceeding of the contracted power
GR No Yes Yes No cos phi
IT No Yes Yes No N.A.
LT No Yes Yes No N.A.
NL Yes Yes Yes Some utilities N.A.
NO Yes Yes Yes Yes N.A.
PL Yes Yes Yes Yes Exceeding of the contracted power
PT No Yes Yes Yes ToU for energy and capacity charges
SE Yes Yes Yes Yes N.A.
Table 6: Structures of EU Network Tariffs for Industrial Customers, Eurelectric, May 2013
It can be seen from Table 6 that at the present time all EU countries except Denmark, apply a kW-based capacity charge and the majority also charge for reactive energy. The reactive energy charge is that described above as type f).
3.2 Energy Tariffs in Armenia
The enabling legislation for the establishment of the Public Service Regulatory Commission (PSRC), which regulates the electricity sector, is the Energy Law of the Republic of Armenia.
Articles 9 and 10 of the law give the PSRC the right and obligation to define the market rules and regulations and to set energy tariffs. The PSRC has implemented the Energy Law through a series of rules and a tariff methodology.
As supply and distribution services have not been unbundled at the present time, the existing tariffs recover supply and network costs through a bundled energy charge. The energy charge is
12
differentiated into day and night periods (2300 to 0700), providing an incentive for consumers to use energy outside of the peak day time hours. Four customer classes exist in Armenia today 1) customers connected at 35kV, 2) customers connected at 6kV and 10kV, 3) customers taking a three phase low voltage supply, and 4) residential customers.
Armenia’s existing tariff design is a traditional design that can be expected to evolve in time to more closely align with EU country practice where marginal cost-based tariffs are in place. In 2006 the World Bank suggested that Armenia would benefit from the introduction of marginal cost tariffs. The World Bank analysis quantified the difference between the marginal cost of generation in summer and winter and found a case for signalling the cost explicitly through a tariff mechanism. Furthermore, the World Bank recommended that efforts should be made to significantly improve the system load factor, to reduce the marginal cost of generation thereby extending generation plant life. In the latter case the World Bank recommended a change to the export / import regime. System load factor could also be improved by introducing a strong pricing signal at the time of peak demand. The first recommendation would require the existing energy tariffs to be modified for seasonality. The second recommendation could be supported by a capacity-based tariff of sufficient magnitude that peak demand of large customers would be reduced through power factor correction, or by introducing a three rate ToU tariff with high peak period rates.
Taking into account the charging principles and tariff designs of the EU countries, and the World Bank recommendations, it is reasonable to assume that Armenian electricity supply tariffs will evolve through the introduction of 1) an explicit capacity charge, 2) a further differentiation of time-of-use charging to reflect the marginal cost of generation; a seasonal formulation, and/or a peak/shoulder/off-peak formulation, and 3) a reactive energy charge imposed by the grid company.
In fact ENA has prepared a proposal for Option 1) for the 6 (10)kV customer class and this proposal was reviewed by the author of this report. ENA’s tariff methodology proposal would see the introduction of a capacity charge as explained in (c) of Section 5.1.2 above. ENA is proposing to fix the charging rate according to the contracted supply capacity of the customer, rather than according to the maximum demand of a customer measured at the time of peak demand of the system. The introduction of a capacity charge is a logical step in tariff reform; to charge according to connected capacity has an advantage of simplicity. On the other hand the introduction of interval meters provides an opportunity to charge according to measured demand, a practice that would more directly align the peak demand charges with the peak demand of the system.
Option 2) is supported by interval meters but involves a considerable increased in the workload associated with data collection and computation of time-of-use charges.
Option 3), a reactive energy charge, is examined in detail the next section.
13
4 Reactive Power Tariffs
In this section the introduction of an explicit capacity charge is examined for its impact on ENA’s large customer base. The impact of a capacity charge on the distribution network is also evaluated. Three tariff designs are considered 1) a kVA tariff added to the existing day / night energy tariff structure, 2) a kVA tariff with a peak / shoulder / off-peak energy tariff structure, and 3) a kVA tariff based on kW consumption added to the existing day / night energy tariff structure.
A reactive power charge (type f) has not been considered as a separate case. If Armenia’s grid company was to apply a reactive power charge or penalty regime, a kVA consumer tariff could be designed to recover grid company payments. Alternatively kVArh metering would be required; a cost / benefit evaluation of kVArh metering is beyond the scope of this study as this would first require a firm reactive power tariff proposal from the grid company, against which cost and benefits could be assessed.
4.1 Background
A kVA demand model has been prepared for the purpose of evaluating the potential costs and benefits of a kVA tariff for 6 (10)kV and 35kV customers supplied by ENA. The kVA model should not be mistaken as a tariff model despite that the model demonstrates a possible kVA tariff design. The introduction of a kVA tariff would require ENA to undertake further load research to firm up the assumptions made in this report, and a detailed tariff design by the PSRC to ensure that consumers are treated fairly and equitably.
The kVA charging model developed for this demonstration requires input data and assumptions for various parameters:-
1. ENA’s annual load duration curve; 2. ENA’s typical daily load profiles during the summer and winter peak period; 3. The count of ENA’s large customers by voltage level. The customers targeted for kVA charges
are the 6 (10)kV and 35kV customers; 4. kWh, kVArh and power factor of ENA’s 6 (10)kV and 35kV customers (or a statistically valid
sample); and 5. A technical loss estimate.
For items 1 and 2, information was gathered from two recent reports addressing load forecasting and tariff design. The first report is Armenia Electricity Demand Forecast: Assistance to Energy Sector to Strengthen Energy Security and Regional Integration, Contract No. EPP-I-08-03-00008-00: USAID: November 2012. The second report is Report No: ACS4845, Republic of Armenia: Power Sector Tariff Study: World Bank: June 2013.
For items 3 and 4, data was gathered from ENA. A sample of 100 customer billing records was requested with particular interest in determining the statistical distribution of power factor amongst ENA’s large customers. Unfortunately the statistics were not of sufficient quality to draw valid statistics that could be generalized for the large customer base. This resulted in the need to estimate the power factor based on the data that was provided, with reference to typical power factor distributions observed for large customers in developing countries. The ENA model results are therefore more approximate than would be the case if the input data was statistically valid.
For item 5, the technical loss estimate was based on the reported total loss of 12.9% comprising a 10.1% technical loss and a 2.8% commercial loss. A peak technical loss of 6% was assumed.
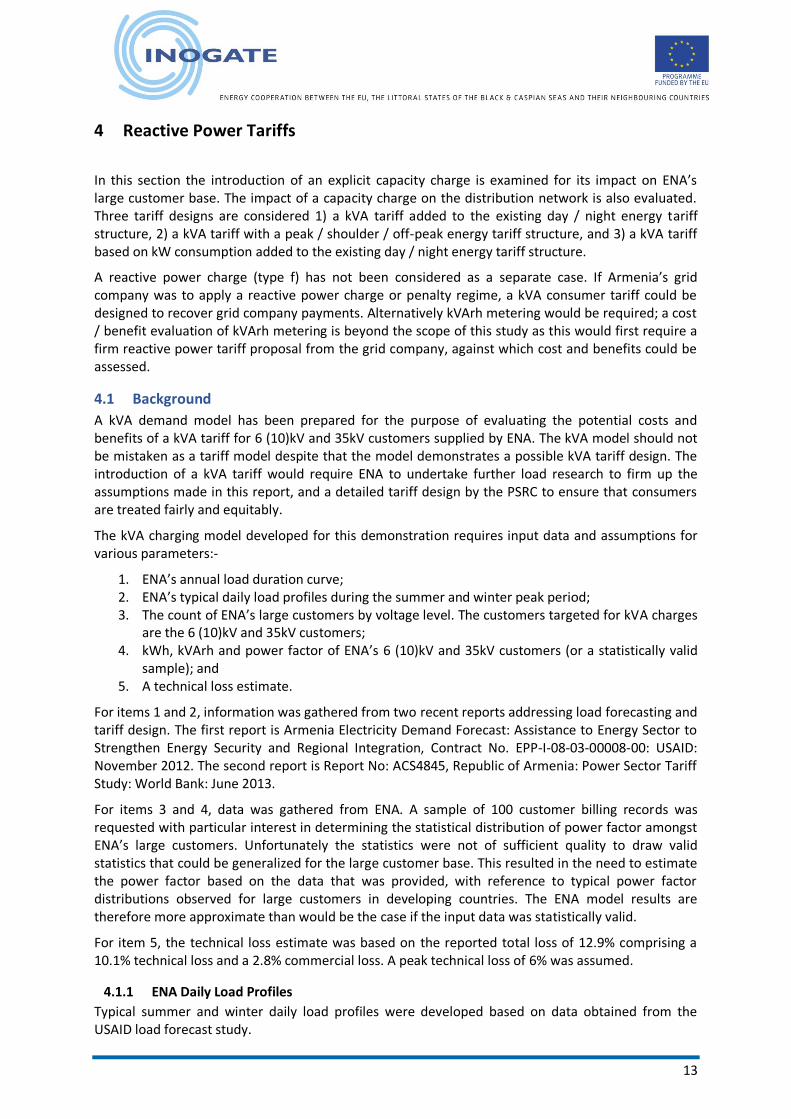
4.1.1 ENA Daily Load Profiles
Typical summer and winter daily load profiles were developed based on data obtained from the USAID load forecast study.
14
Figure 7: Typical Daily Load Profiles (1/2 hourly basis)
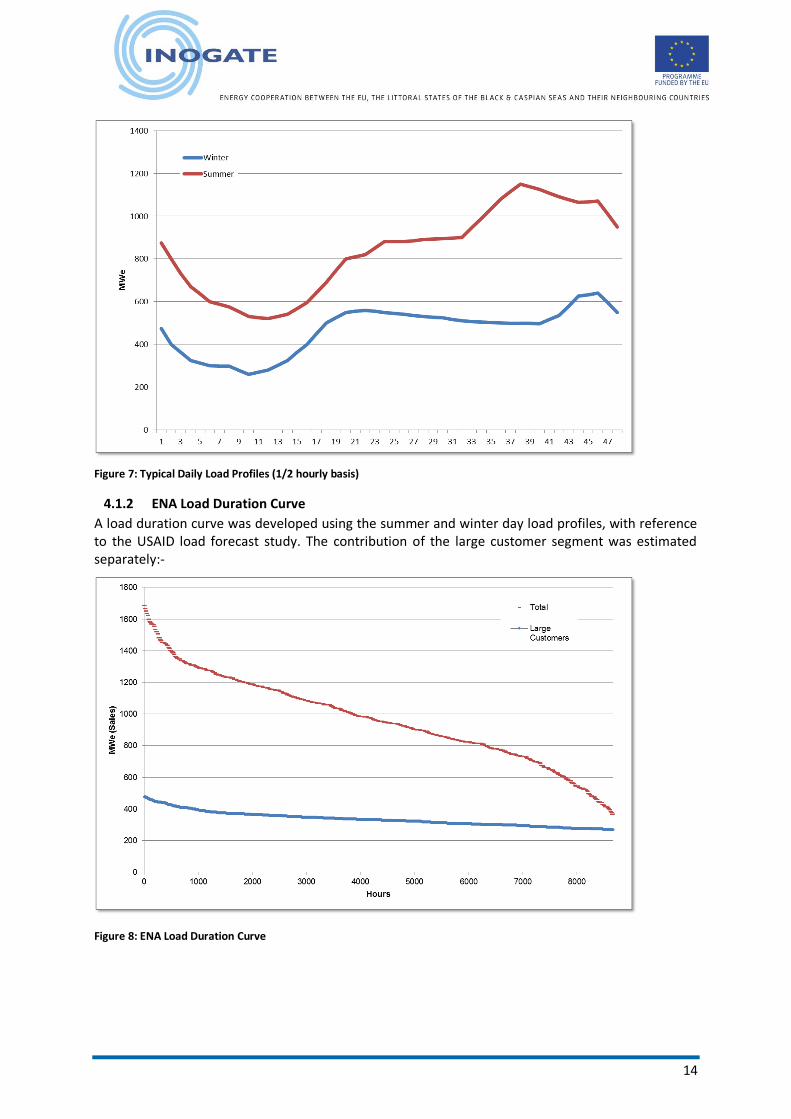
4.1.2 ENA Load Duration Curve
A load duration curve was developed using the summer and winter day load profiles, with reference to the USAID load forecast study. The contribution of the large customer segment was estimated separately:-
Figure 8: ENA Load Duration Curve
15
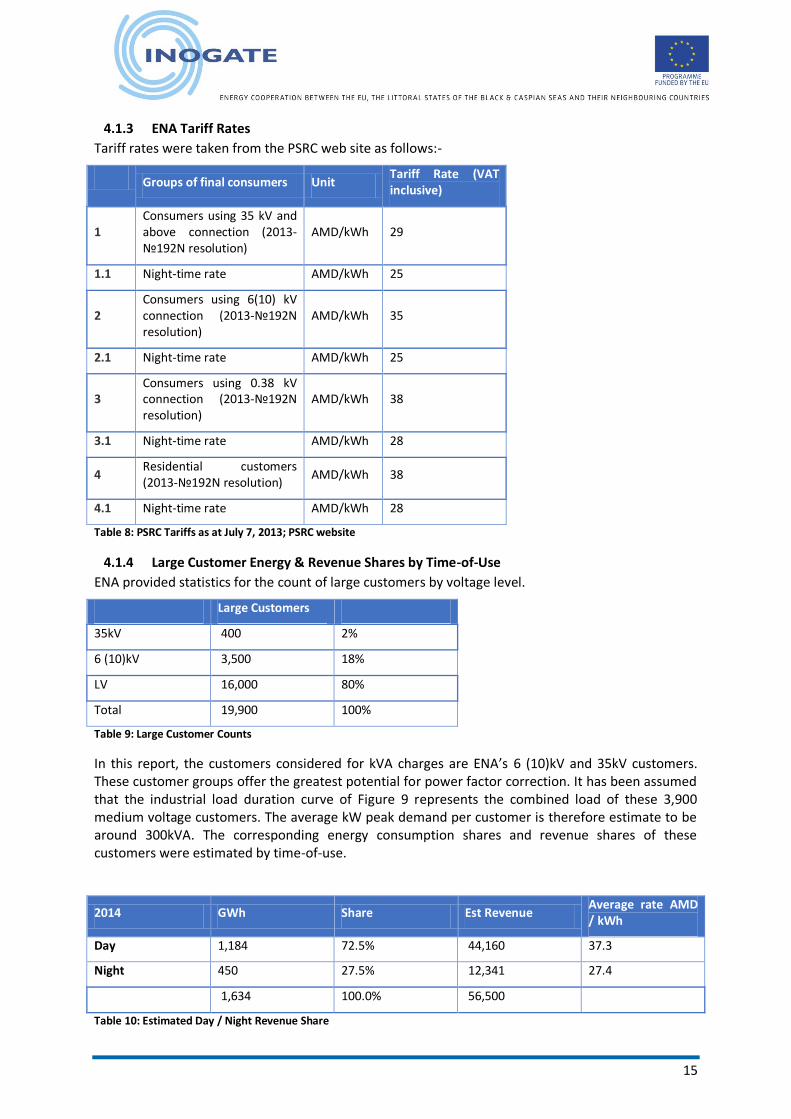
4.1.3 ENA Tariff Rates
Tariff rates were taken from the PSRC web site as follows:-
Groups of final consumers Unit
Tariff Rate (VAT inclusive)
1 Consumers using 35 kV and above connection (2013-№192N resolution)
AMD/kWh 29
1.1 Night-time rate AMD/kWh 25
2 Consumers using 6(10) kV connection (2013-№192N resolution)
AMD/kWh 35
2.1 Night-time rate AMD/kWh 25
3 Consumers using 0.38 kV connection (2013-№192N resolution)
AMD/kWh 38
3.1 Night-time rate AMD/kWh 28
4 Residential customers (2013-№192N resolution)
AMD/kWh 38
4.1 Night-time rate AMD/kWh 28
Table 8: PSRC Tariffs as at July 7, 2013; PSRC website
4.1.4 Large Customer Energy & Revenue Shares by Time-of-Use
ENA provided statistics for the count of large customers by voltage level.
Large Customers
35kV 400 2%
6 (10)kV 3,500 18%
LV 16,000 80%
Total 19,900 100%
Table 9: Large Customer Counts
In this report, the customers considered for kVA charges are ENA’s 6 (10)kV and 35kV customers. These customer groups offer the greatest potential for power factor correction. It has been assumed that the industrial load duration curve of Figure 9 represents the combined load of these 3,900 medium voltage customers. The average kW peak demand per customer is therefore estimate to be around 300kVA. The corresponding energy consumption shares and revenue shares of these customers were estimated by time-of-use.
2014 GWh Share Est Revenue Average rate AMD / kWh
Day 1,184 72.5% 44,160 37.3
Night 450 27.5% 12,341 27.4
1,634 100.0% 56,500
Table 10: Estimated Day / Night Revenue Share
16
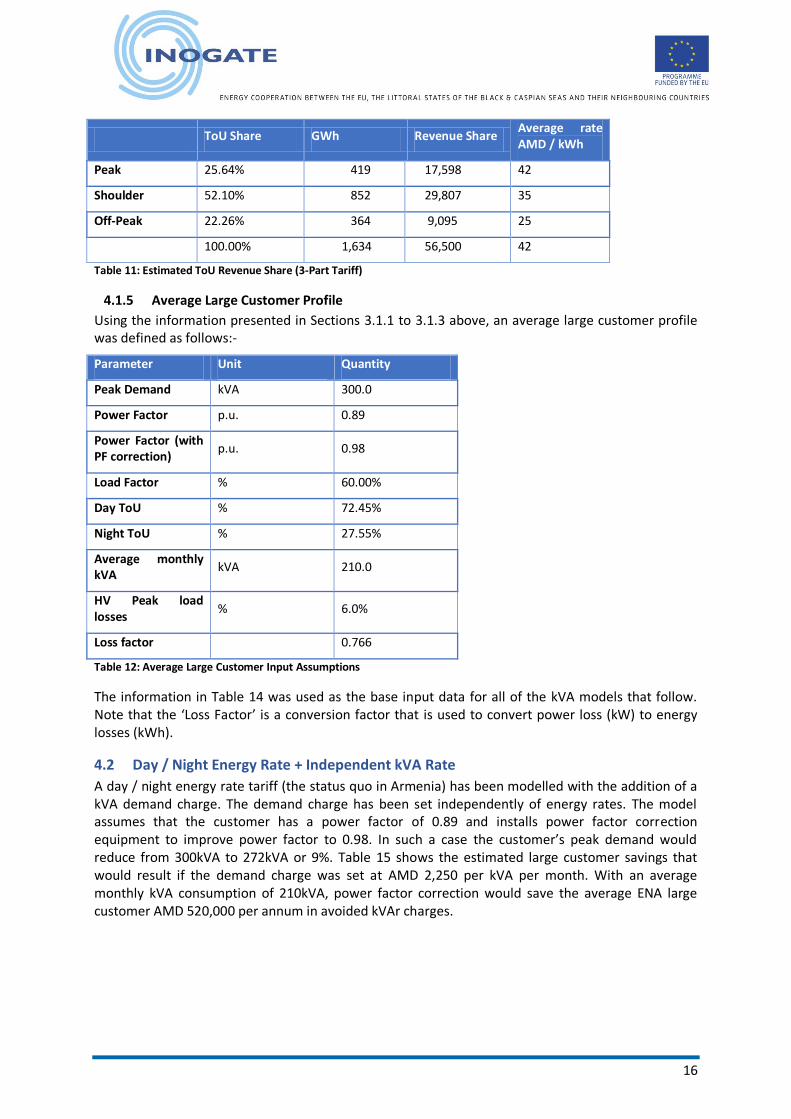
ToU Share GWh Revenue Share Average rate AMD / kWh
Peak 25.64% 419 17,598 42
Shoulder 52.10% 852 29,807 35
Off-Peak 22.26% 364 9,095 25
100.00% 1,634 56,500 42
Table 11: Estimated ToU Revenue Share (3-Part Tariff)
4.1.5 Average Large Customer Profile
Using the information presented in Sections 3.1.1 to 3.1.3 above, an average large customer profile was defined as follows:-
Parameter Unit Quantity
Peak Demand kVA 300.0
Power Factor p.u. 0.89
Power Factor (with PF correction)
p.u. 0.98
Load Factor % 60.00%
Day ToU % 72.45%
Night ToU % 27.55%
Average monthly kVA
kVA 210.0
HV Peak load losses
% 6.0%
Loss factor 0.766
Table 12: Average Large Customer Input Assumptions
The information in Table 14 was used as the base input data for all of the kVA models that follow. Note that the ‘Loss Factor’ is a conversion factor that is used to convert power loss (kW) to energy losses (kWh).
4.2 Day / Night Energy Rate + Independent kVA Rate
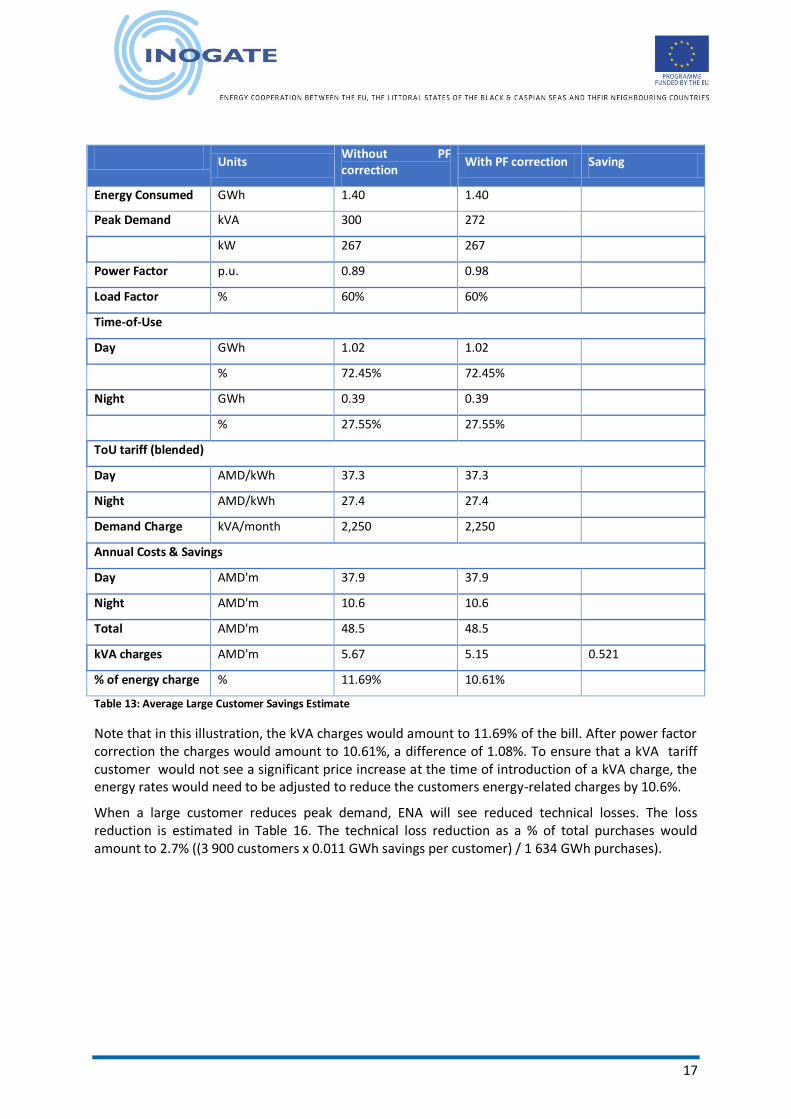
A day / night energy rate tariff (the status quo in Armenia) has been modelled with the addition of a kVA demand charge. The demand charge has been set independently of energy rates. The model assumes that the customer has a power factor of 0.89 and installs power factor correction equipment to improve power factor to 0.98. In such a case the customer’s peak demand would reduce from 300kVA to 272kVA or 9%. Table 15 shows the estimated large customer savings that would result if the demand charge was set at AMD 2,250 per kVA per month. With an average monthly kVA consumption of 210kVA, power factor correction would save the average ENA large customer AMD 520,000 per annum in avoided kVAr charges.
17
Units
Without PF correction
With PF correction Saving
Energy Consumed GWh 1.40 1.40
Peak Demand kVA 300 272
kW 267 267
Power Factor p.u. 0.89 0.98
Load Factor % 60% 60%
Time-of-Use
Day GWh 1.02 1.02
% 72.45% 72.45%
Night GWh 0.39 0.39
% 27.55% 27.55%
ToU tariff (blended)
Day AMD/kWh 37.3 37.3
Night AMD/kWh 27.4 27.4
Demand Charge kVA/month 2,250 2,250
Annual Costs & Savings
Day AMD'm 37.9 37.9
Night AMD'm 10.6 10.6
Total AMD'm 48.5 48.5
kVA charges AMD'm 5.67 5.15 0.521
% of energy charge % 11.69% 10.61%
Table 13: Average Large Customer Savings Estimate
Note that in this illustration, the kVA charges would amount to 11.69% of the bill. After power factor correction the charges would amount to 10.61%, a difference of 1.08%. To ensure that a kVA tariff customer would not see a significant price increase at the time of introduction of a kVA charge, the energy rates would need to be adjusted to reduce the customers energy-related charges by 10.6%.
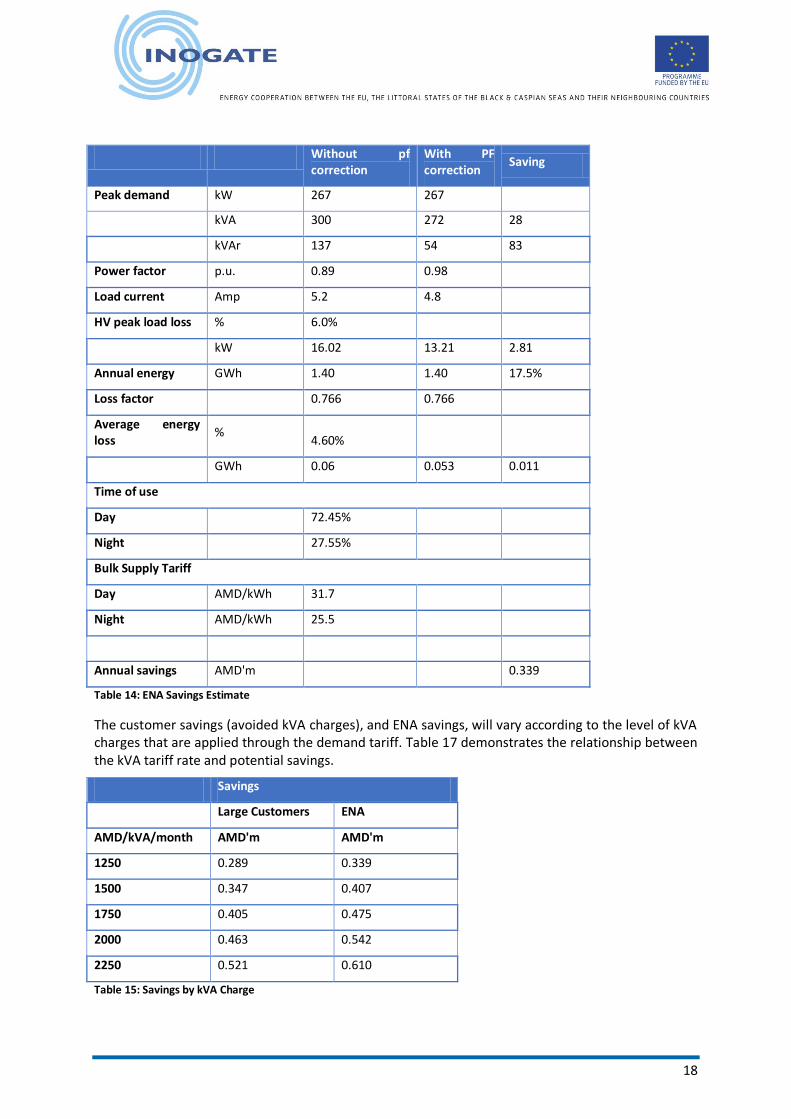
When a large customer reduces peak demand, ENA will see reduced technical losses. The loss reduction is estimated in Table 16. The technical loss reduction as a % of total purchases would amount to 2.7% ((3 900 customers x 0.011 GWh savings per customer) / 1 634 GWh purchases).
18
Without pf correction
With PF correction
Saving
Peak demand kW 267 267
kVA 300 272 28
kVAr 137 54 83
Power factor p.u. 0.89 0.98
Load current Amp 5.2 4.8
HV peak load loss % 6.0%
kW 16.02 13.21 2.81
Annual energy GWh 1.40 1.40 17.5%
Loss factor 0.766 0.766
Average energy loss
% 4.60%
GWh 0.06 0.053 0.011
Time of use
Day 72.45%
Night 27.55%
Bulk Supply Tariff
Day AMD/kWh 31.7
Night AMD/kWh 25.5
Annual savings AMD'm 0.339
Table 14: ENA Savings Estimate
The customer savings (avoided kVA charges), and ENA savings, will vary according to the level of kVA charges that are applied through the demand tariff. Table 17 demonstrates the relationship between the kVA tariff rate and potential savings.
Savings
Large Customers ENA
AMD/kVA/month AMD'm AMD'm
1250 0.289 0.339
1500 0.347 0.407
1750 0.405 0.475
2000 0.463 0.542
2250 0.521 0.610
Table 15: Savings by kVA Charge
19
The customer savings information in Table 17 is important because it defines the cost and benefits case supporting power factor correction. If the kVA charge is set too low, customers will have no incentive to correct their power factor as the payback period will be too long.
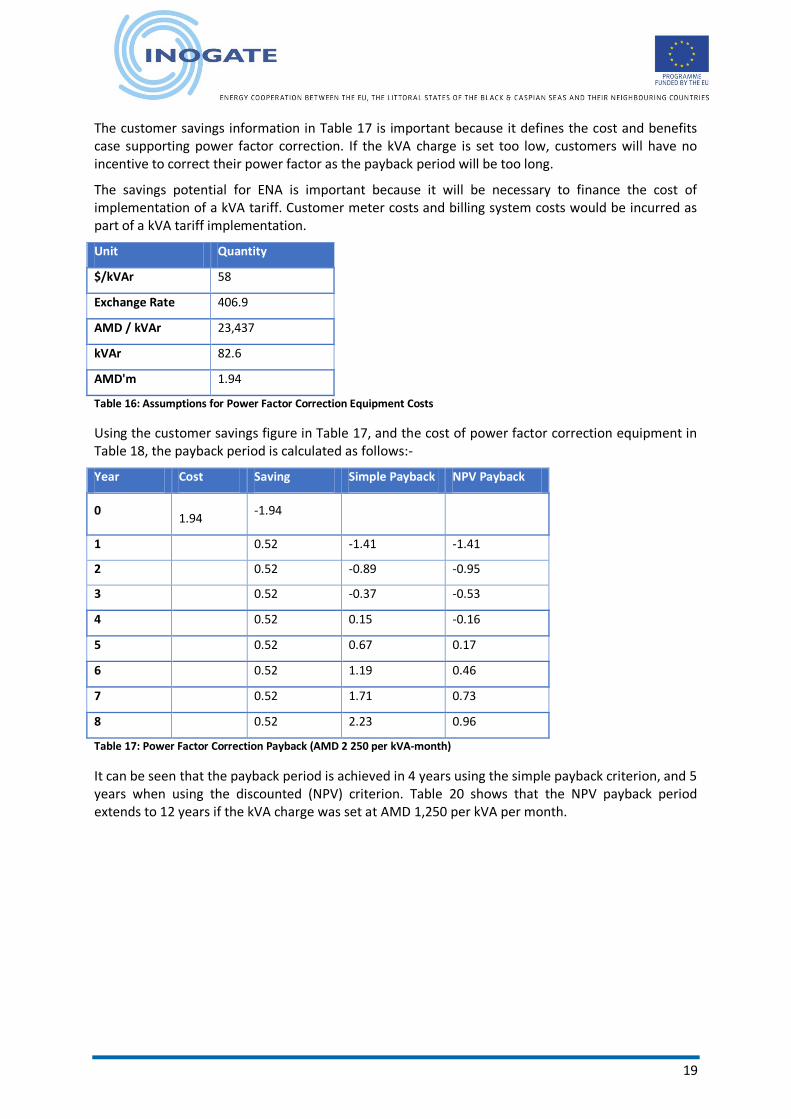
The savings potential for ENA is important because it will be necessary to finance the cost of implementation of a kVA tariff. Customer meter costs and billing system costs would be incurred as part of a kVA tariff implementation.
Unit Quantity
$/kVAr 58
Exchange Rate 406.9
AMD / kVAr 23,437
kVAr 82.6
AMD'm 1.94
Table 16: Assumptions for Power Factor Correction Equipment Costs
Using the customer savings figure in Table 17, and the cost of power factor correction equipment in Table 18, the payback period is calculated as follows:-
Year Cost Saving Simple Payback NPV Payback
0 1.94
-1.94
1 0.52 -1.41 -1.41
2 0.52 -0.89 -0.95
3 0.52 -0.37 -0.53
4 0.52 0.15 -0.16
5 0.52 0.67 0.17
6 0.52 1.19 0.46
7 0.52 1.71 0.73
8 0.52 2.23 0.96
Table 17: Power Factor Correction Payback (AMD 2 250 per kVA-month)
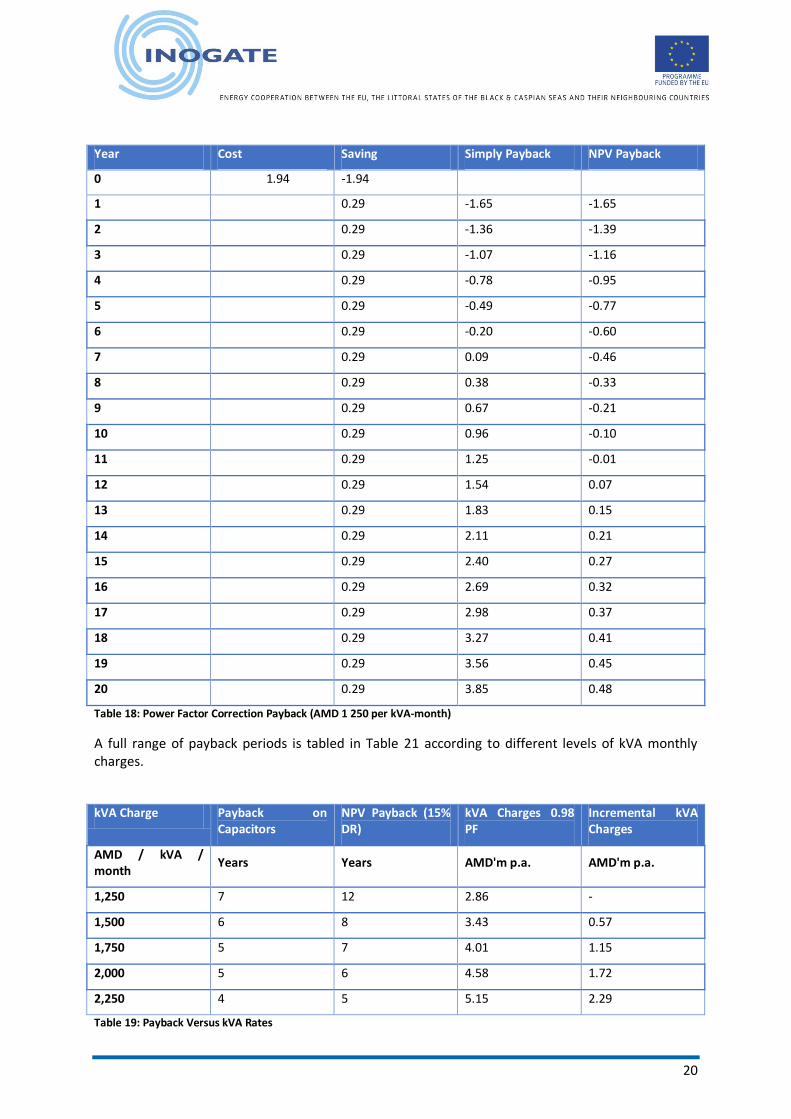
It can be seen that the payback period is achieved in 4 years using the simple payback criterion, and 5 years when using the discounted (NPV) criterion. Table 20 shows that the NPV payback period extends to 12 years if the kVA charge was set at AMD 1,250 per kVA per month.
20
Year Cost Saving Simply Payback NPV Payback
0 1.94 -1.94
1 0.29 -1.65 -1.65
2 0.29 -1.36 -1.39
3 0.29 -1.07 -1.16
4 0.29 -0.78 -0.95
5 0.29 -0.49 -0.77
6 0.29 -0.20 -0.60
7 0.29 0.09 -0.46
8 0.29 0.38 -0.33
9 0.29 0.67 -0.21
10 0.29 0.96 -0.10
11 0.29 1.25 -0.01
12 0.29 1.54 0.07
13 0.29 1.83 0.15
14 0.29 2.11 0.21
15 0.29 2.40 0.27
16 0.29 2.69 0.32
17 0.29 2.98 0.37
18 0.29 3.27 0.41
19 0.29 3.56 0.45
20 0.29 3.85 0.48
Table 18: Power Factor Correction Payback (AMD 1 250 per kVA-month)
A full range of payback periods is tabled in Table 21 according to different levels of kVA monthly charges.
kVA Charge Payback on Capacitors
NPV Payback (15% DR)
kVA Charges 0.98 PF
Incremental kVA Charges
AMD / kVA / month
Years Years AMD'm p.a. AMD'm p.a.
1,250 7 12 2.86 -
1,500 6 8 3.43 0.57
1,750 5 7 4.01 1.15
2,000 5 6 4.58 1.72
2,250 4 5 5.15 2.29
Table 19: Payback Versus kVA Rates
21
Table 21 shows that a minimum kVA monthly charge of AMD 2,250 would be required to incentivize large customers to invest in power factor correction equipment. Most private sector companies would consider a 5 year payback to be barely attractive and so a monthly charge of AMD 2,250 appears to be the minimum requirement.
The proportion of the kVA charges on kWh charges, shown in Table 15, highlights a potential problem in implementing a kVA tariff regime. Customers with high power factors could be unfairly penalized by a high kVA charge. This problem can be avoided by setting reduced energy rates for customers with high power factors. This issue is addressed in more detail under Section 4.4 below.
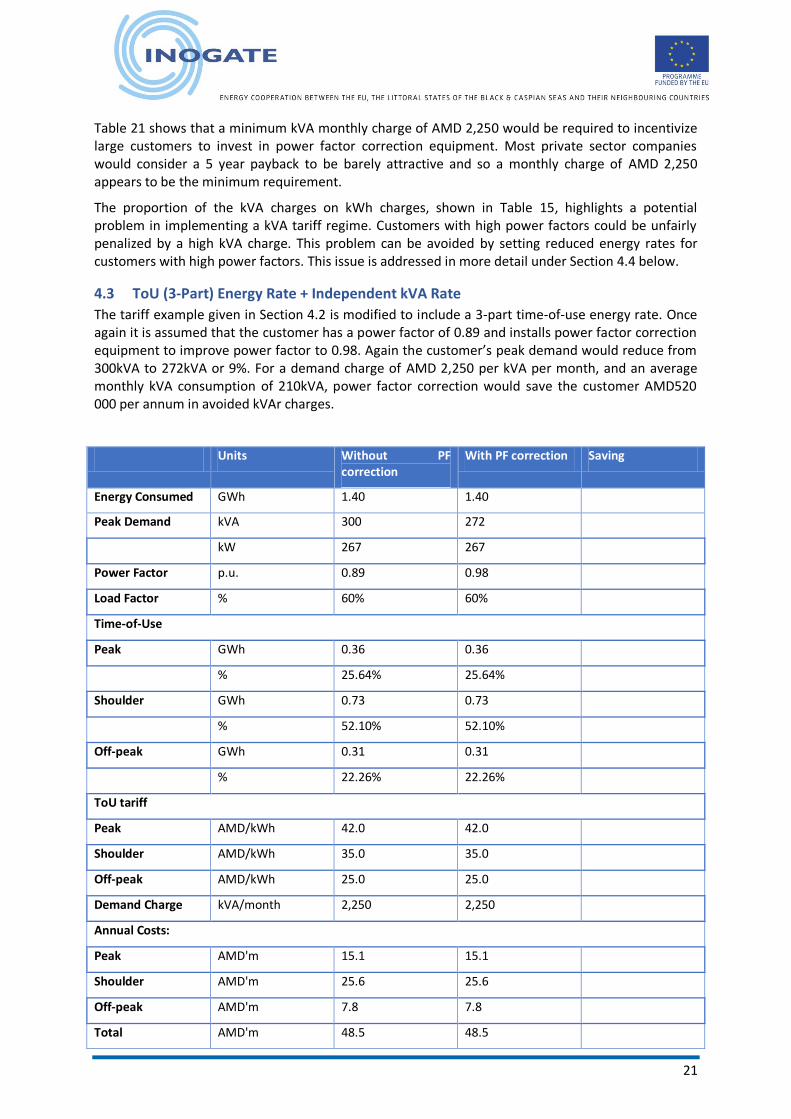
4.3 ToU (3-Part) Energy Rate + Independent kVA Rate
The tariff example given in Section 4.2 is modified to include a 3-part time-of-use energy rate. Once again it is assumed that the customer has a power factor of 0.89 and installs power factor correction equipment to improve power factor to 0.98. Again the customer’s peak demand would reduce from 300kVA to 272kVA or 9%. For a demand charge of AMD 2,250 per kVA per month, and an average monthly kVA consumption of 210kVA, power factor correction would save the customer AMD520 000 per annum in avoided kVAr charges.
Units Without PF correction
With PF correction Saving
Energy Consumed GWh 1.40 1.40
Peak Demand kVA 300 272
kW 267 267
Power Factor p.u. 0.89 0.98
Load Factor % 60% 60%
Time-of-Use
Peak GWh 0.36 0.36
% 25.64% 25.64%
Shoulder GWh 0.73 0.73
% 52.10% 52.10%
Off-peak GWh 0.31 0.31
% 22.26% 22.26%
ToU tariff
Peak AMD/kWh 42.0 42.0
Shoulder AMD/kWh 35.0 35.0
Off-peak AMD/kWh 25.0 25.0
Demand Charge kVA/month 2,250 2,250
Annual Costs:
Peak AMD'm 15.1 15.1
Shoulder AMD'm 25.6 25.6
Off-peak AMD'm 7.8 7.8
Total AMD'm 48.5 48.5
22
Units Without PF correction
With PF correction Saving
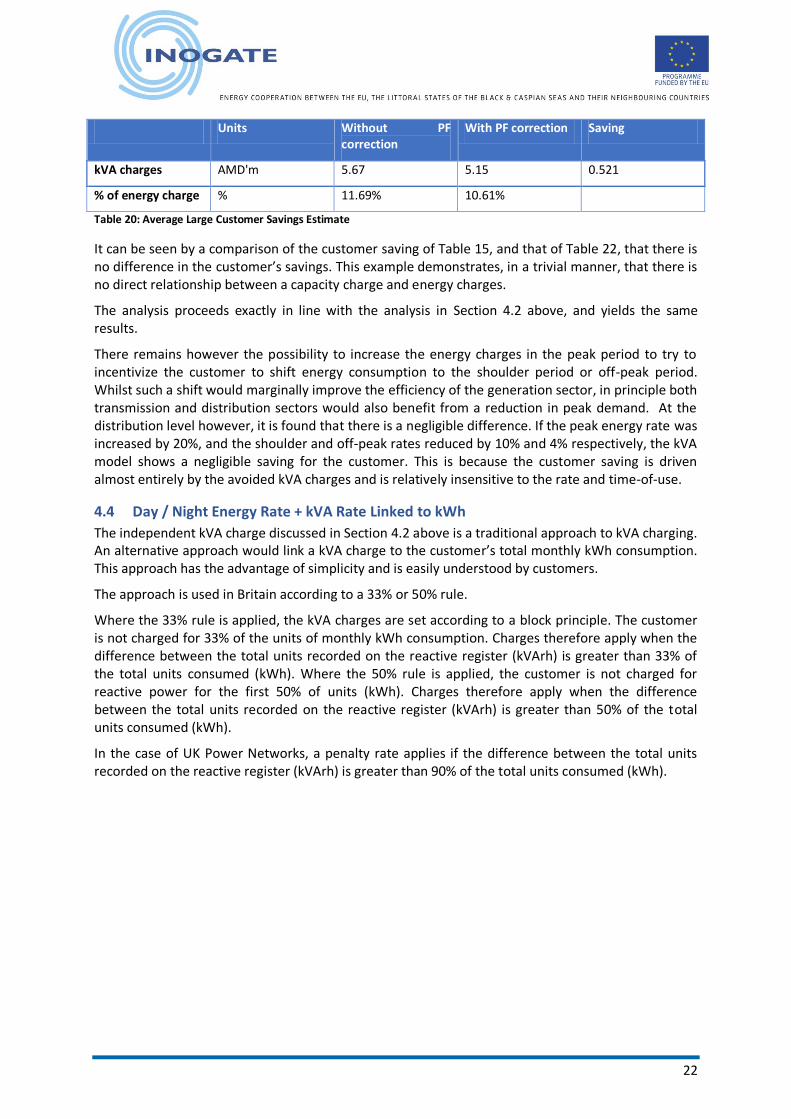
kVA charges AMD'm 5.67 5.15 0.521
% of energy charge % 11.69% 10.61%
Table 20: Average Large Customer Savings Estimate
It can be seen by a comparison of the customer saving of Table 15, and that of Table 22, that there is no difference in the customer’s savings. This example demonstrates, in a trivial manner, that there is no direct relationship between a capacity charge and energy charges.
The analysis proceeds exactly in line with the analysis in Section 4.2 above, and yields the same results.
There remains however the possibility to increase the energy charges in the peak period to try to incentivize the customer to shift energy consumption to the shoulder period or off-peak period. Whilst such a shift would marginally improve the efficiency of the generation sector, in principle both transmission and distribution sectors would also benefit from a reduction in peak demand. At the distribution level however, it is found that there is a negligible difference. If the peak energy rate was increased by 20%, and the shoulder and off-peak rates reduced by 10% and 4% respectively, the kVA model shows a negligible saving for the customer. This is because the customer saving is driven almost entirely by the avoided kVA charges and is relatively insensitive to the rate and time-of-use.
4.4 Day / Night Energy Rate + kVA Rate Linked to kWh
The independent kVA charge discussed in Section 4.2 above is a traditional approach to kVA charging. An alternative approach would link a kVA charge to the customer’s total monthly kWh consumption. This approach has the advantage of simplicity and is easily understood by customers.
The approach is used in Britain according to a 33% or 50% rule.
Where the 33% rule is applied, the kVA charges are set according to a block principle. The customer is not charged for 33% of the units of monthly kWh consumption. Charges therefore apply when the difference between the total units recorded on the reactive register (kVArh) is greater than 33% of the total units consumed (kWh). Where the 50% rule is applied, the customer is not charged for reactive power for the first 50% of units (kWh). Charges therefore apply when the difference between the total units recorded on the reactive register (kVArh) is greater than 50% of the total units consumed (kWh).
In the case of UK Power Networks, a penalty rate applies if the difference between the total units recorded on the reactive register (kVArh) is greater than 90% of the total units consumed (kWh).
23
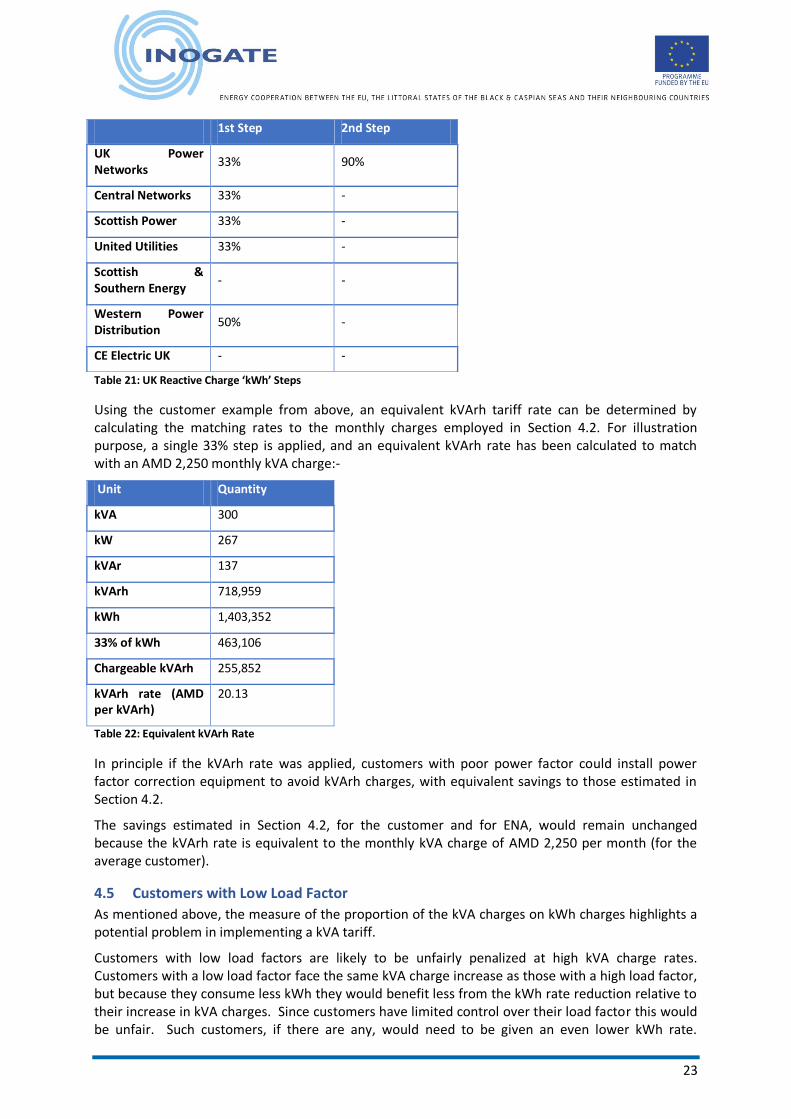
Table 21: UK Reactive Charge ‘kWh’ Steps
Using the customer example from above, an equivalent kVArh tariff rate can be determined by calculating the matching rates to the monthly charges employed in Section 4.2. For illustration purpose, a single 33% step is applied, and an equivalent kVArh rate has been calculated to match with an AMD 2,250 monthly kVA charge:-
Unit Quantity
kVA 300
kW 267
kVAr 137
kVArh 718,959
kWh 1,403,352
33% of kWh 463,106
Chargeable kVArh 255,852
kVArh rate (AMD per kVArh)
20.13
Table 22: Equivalent kVArh Rate
In principle if the kVArh rate was applied, customers with poor power factor could install power factor correction equipment to avoid kVArh charges, with equivalent savings to those estimated in Section 4.2.
The savings estimated in Section 4.2, for the customer and for ENA, would remain unchanged because the kVArh rate is equivalent to the monthly kVA charge of AMD 2,250 per month (for the average customer).
4.5 Customers with Low Load Factor
As mentioned above, the measure of the proportion of the kVA charges on kWh charges highlights a potential problem in implementing a kVA tariff.
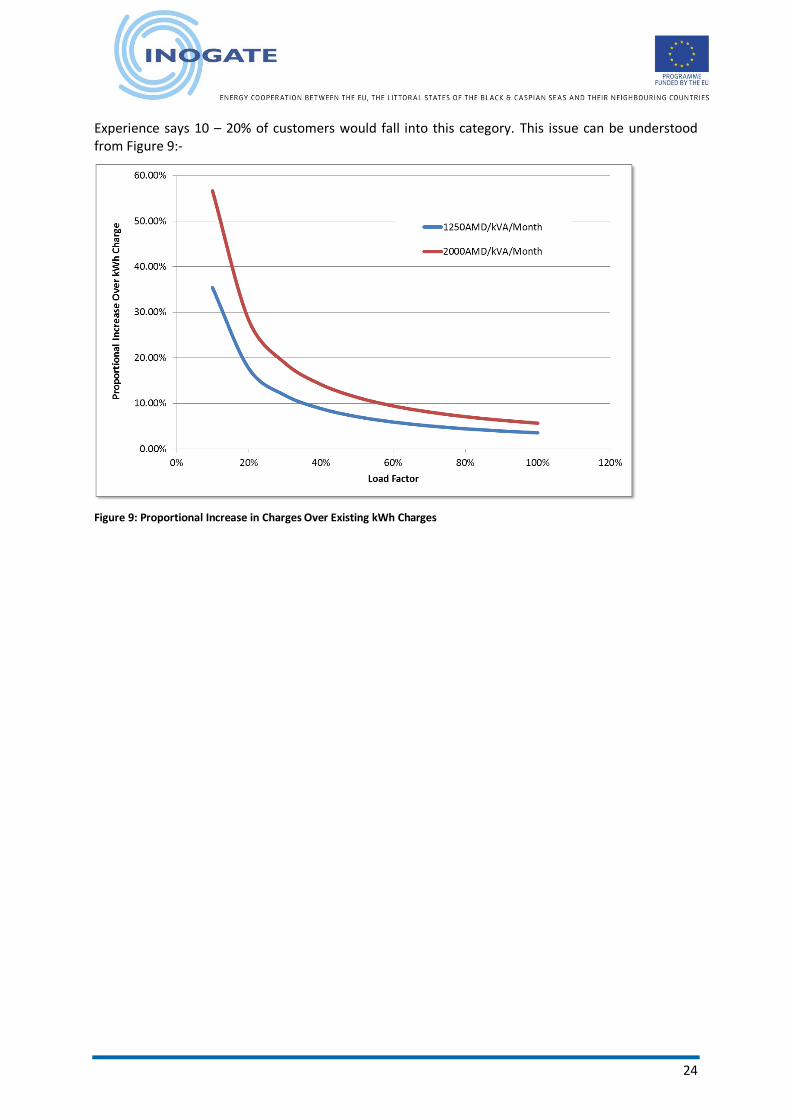
Customers with low load factors are likely to be unfairly penalized at high kVA charge rates. Customers with a low load factor face the same kVA charge increase as those with a high load factor, but because they consume less kWh they would benefit less from the kWh rate reduction relative to their increase in kVA charges. Since customers have limited control over their load factor this would be unfair. Such customers, if there are any, would need to be given an even lower kWh rate.
1st Step 2nd Step
UK Power Networks
33% 90%
Central Networks 33% -
Scottish Power 33% -
United Utilities 33% -
Scottish & Southern Energy
- -
Western Power Distribution
50% -
CE Electric UK - -
24
Experience says 10 – 20% of customers would fall into this category. This issue can be understood from Figure 9:-
Figure 9: Proportional Increase in Charges Over Existing kWh Charges
25
5 Reactive Energy Metering
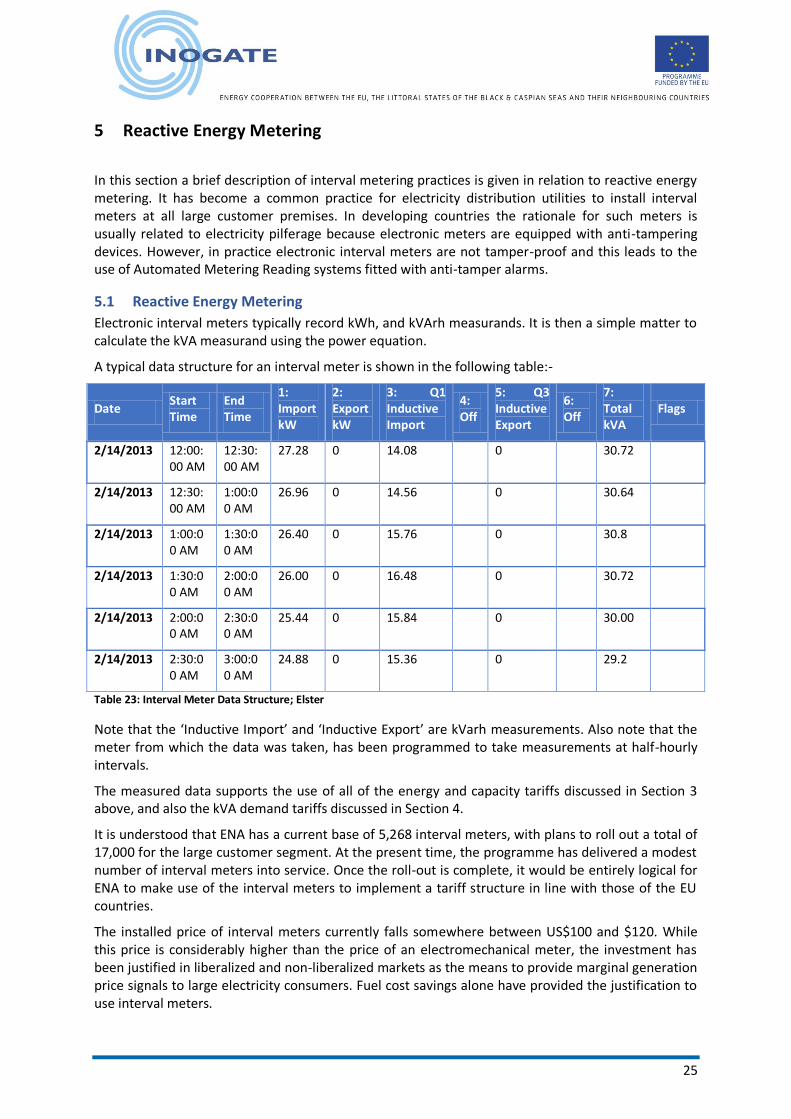
In this section a brief description of interval metering practices is given in relation to reactive energy metering. It has become a common practice for electricity distribution utilities to install interval meters at all large customer premises. In developing countries the rationale for such meters is usually related to electricity pilferage because electronic meters are equipped with anti-tampering devices. However, in practice electronic interval meters are not tamper-proof and this leads to the use of Automated Metering Reading systems fitted with anti-tamper alarms.
5.1 Reactive Energy Metering
Electronic interval meters typically record kWh, and kVArh measurands. It is then a simple matter to calculate the kVA measurand using the power equation.
A typical data structure for an interval meter is shown in the following table:-
Date Start Time
End Time
1: Import kW
2: Export kW
3: Q1 Inductive Import
4: Off
5: Q3 Inductive Export
6: Off
7: Total kVA
Flags
2/14/2013 12:00:00 AM
12:30:00 AM
27.28 0 14.08 0 30.72
2/14/2013 12:30:00 AM
1:00:00 AM
26.96 0 14.56 0 30.64
2/14/2013 1:00:00 AM
1:30:00 AM
26.40 0 15.76 0 30.8
2/14/2013 1:30:00 AM
2:00:00 AM
26.00 0 16.48 0 30.72
2/14/2013 2:00:00 AM
2:30:00 AM
25.44 0 15.84 0 30.00
2/14/2013 2:30:00 AM
3:00:00 AM
24.88 0 15.36 0 29.2
Table 23: Interval Meter Data Structure; Elster
Note that the ‘Inductive Import’ and ‘Inductive Export’ are kVarh measurements. Also note that the meter from which the data was taken, has been programmed to take measurements at half-hourly intervals.
The measured data supports the use of all of the energy and capacity tariffs discussed in Section 3 above, and also the kVA demand tariffs discussed in Section 4.
It is understood that ENA has a current base of 5,268 interval meters, with plans to roll out a total of 17,000 for the large customer segment. At the present time, the programme has delivered a modest number of interval meters into service. Once the roll-out is complete, it would be entirely logical for ENA to make use of the interval meters to implement a tariff structure in line with those of the EU countries.
The installed price of interval meters currently falls somewhere between US$100 and $120. While this price is considerably higher than the price of an electromechanical meter, the investment has been justified in liberalized and non-liberalized markets as the means to provide marginal generation price signals to large electricity consumers. Fuel cost savings alone have provided the justification to use interval meters.
26
5.2 Automated Meter Reading Systems
Automated Meter Reading systems are typically justified on the grounds of increased efficiency in meter data collection, and anti-tamper alarm functionality.
Large customer metering installations comprise an interval meter fitted with a radio communications device. AMR software is used to process the raw data retrieved from the meters for billing purposes, for pilferage detection, and sometimes for distribution planning activities.
Typically less than 0.5% of an electricity utility’s customers would qualify for inclusion in an AMR system. The justification is related to the amount of energy consumed by a customer and the peak demand; the kVA peak demand range of customer eligible to be included in an AMR system falls typically between 100 and 200kW.
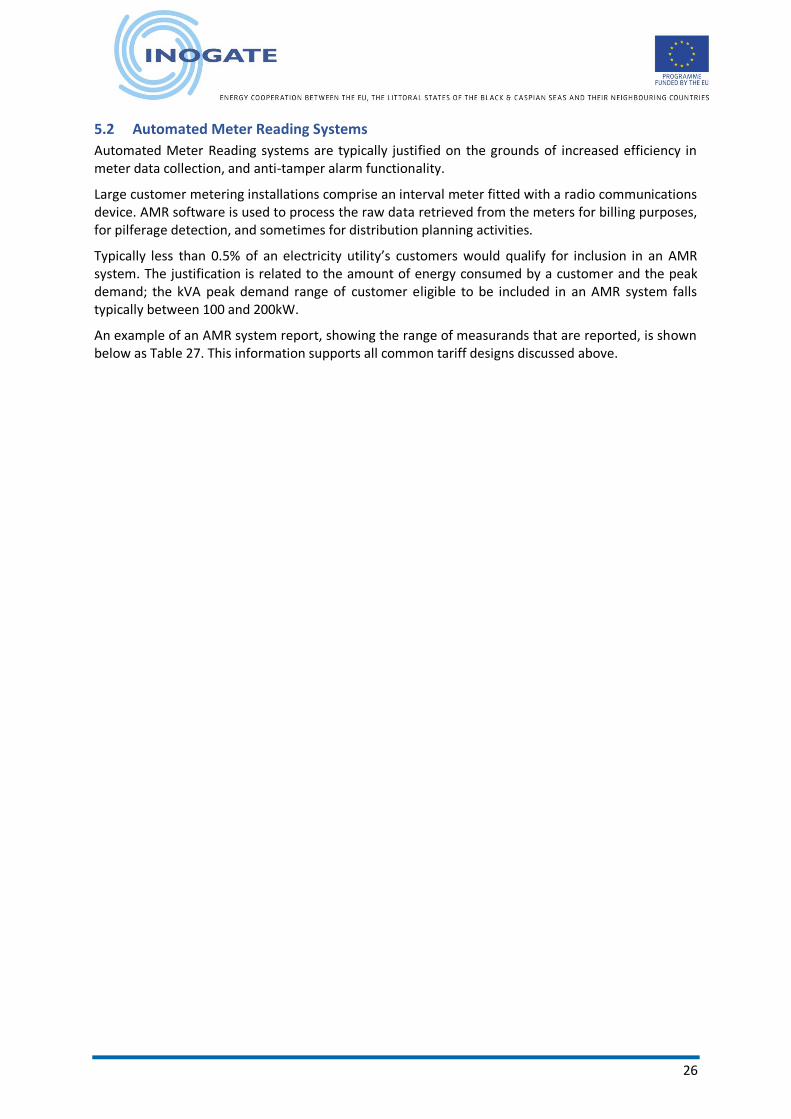
An example of an AMR system report, showing the range of measurands that are reported, is shown below as Table 27. This information supports all common tariff designs discussed above.
27
Reading_Start
Reading_End
Consumption_Peak
Consumption_OffPeak
Consumption_Shoulder
Consumption_MDkVA
Consumption_MDkW
Consumption_kVARh
Meter_Reg_Peak
Meter_Reg_OffPeak
Meter_Reg_Shoulder
Meter_Reg_MDkVA
Meter_Reg_kVARh
Meter_Reg_ImportkWH
1-Jul-12 31-Jul-12 1111.7684 293.5232 6221.9116 33.848999 31.360001 5580.8032 23023.318 7728.6976 132630.18 36.166398 125377.4 163382.61
1-Jul-12 31-Jul-12 4830.4251 4573.1975 14155.878 142.28 56.729 11937.664 616421.61 502839.12 1989607.4 65.241602 1408971.1 3108868.5
1-Jul-12 31-Jul-12 5496.352 5577.008 7581.392 54.639999 47.728001 4427.912 63894.008 63282.168 77676.442 53.296 70368.384 204852.62
1-Jul-12 31-Jul-12 403.1576 281.1517 3144.6505 97.356003 53.965 4936.4988 78153.888 100354.41 221206.51 75.763203 466284.48 507332.35
Table 24: Example Automated Meter Reading Report

28
6 Annexes See Attachement 1: kVA Tariff Demonstration Model (Excel spreadsheet


![OpenStackNeat: AFrameworkforDynamic ...Reactive versus proactive or lets be friends,” Computer Networks, vol. 53, pp. 2905–2922,2009. [10] VMware Inc., “VMware Distributed Power](https://img.pdfslide.us/doc/110x75/5fdf9f4b245ef85bfe5fc10a/openstackneat-aframeworkfordynamic-reactive-versus-proactive-or-lets-be-friendsa.jpg)


![Reactive and Functional Polymers - ntut.edu.tw · the electrochemical and electrochromic stability of the polymers [53–55]. As a continuation of our efforts in developing electrochromic](https://img.pdfslide.us/doc/110x75/5f0f556c7e708231d443a46e/reactive-and-functional-polymers-ntutedutw-the-electrochemical-and-electrochromic.jpg)


![Java High Performance Reactive Programmingiproduct.org/.../04/IPT_Reactive_Programming_Java.pdf · Reactive Programming. Functional Programing Reactive Programming [Wikipedia]: a](https://img.pdfslide.us/doc/110x75/5ec60814df097e0643499b13/java-high-performance-reactive-reactive-programming-functional-programing-reactive.jpg)