Embed Size (px)
Citation preview
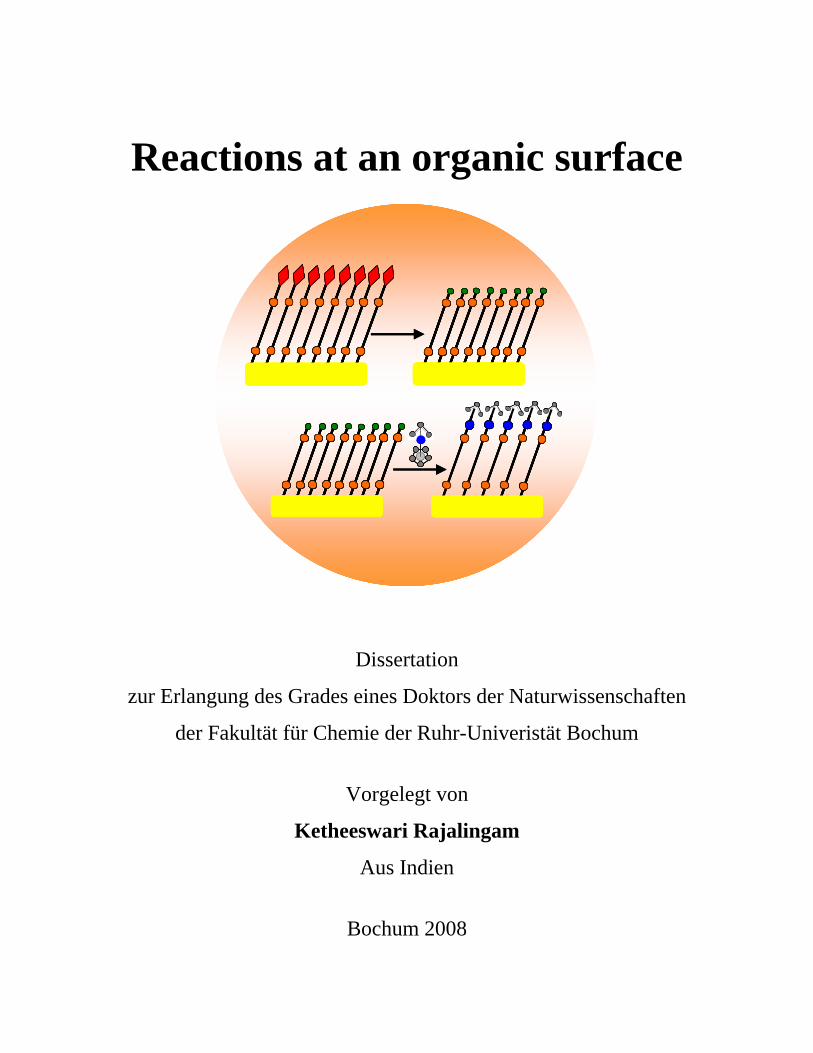
Reactions at an organic surface
Dissertation
zur Erlangung des Grades eines Doktors der Naturwissenschaften
der Fakultät für Chemie der Ruhr-Univeristät Bochum
Vorgelegt von
Ketheeswari Rajalingam
Aus Indien
Bochum 2008

Reactions at an organic surface
Tag der mündlichen Prüfung: 19.12.2008
Prüfungskommission:
Referent: Prof. Dr. Christof Wöll
Korreferent: Prof. Dr. Roland. A. Fischer
Vorsitzender: Prof. Dr. Rolf Heumann

Die vorliegende Arbeit wurde im Zeitraum von 2004 bis 2008 am Lehrstuhl
für Physikalische Chemie I der Fakultät für Chemie der Ruhr-Universität
Bochum unter Anleitung von Herrn Prof. Dr. Christof Wöll angefertigt.

Dedicated to my parents
A. Rajalingam and R. Sugunajothi
Abstract
Reactions at an organic surface
The chemical reactions on aromatic dithiol self-assembled monolayers (SAM) adsorbed on
the gold surface has been investigated by infrared reflection absorption spectroscopy
(IRRAS), near edge X-ray absorption fine structure spectroscopy (NEXAFS) and X-ray
photoelectron spectroscopy (XPS). The results show that the reactions on an organic surface
widely differ from the reactions in bulk. The studies on the deacylation reaction highlight the
importance of the quality of substrates used for SAM preparation. The results of the chemical
vapor deposition of palladium on SAMs demonstrate the acceleration of the reaction kinetics
due to the presence of defects. In addition, the results describe the catalytic activity of the
formed palladium metal nanoparticles. This study gives rise to a better understanding of the
chemical reactions on dithiol SAMs and the findings can be extended for the development and
optimization of a suitable surface for metallization purposes.
Reaktionen auf einer organischen Oberfläche
Chemische Reaktionen auf aromatischen Dithiolen, die als selbstorganisierende
Monoschichten (SAM) auf einer Goldoberfläche adsorbiert sind, wurden mittels Infrarot-
Reflexions-Absorptionsspektroskopie, Röntgen-Nahkanten-Absorptionsspektroskopie und
Röntgen-Photoelektronenspektroskopie untersucht. Die Ergebnisse zeigen, dass sich die
Reaktionen auf einer organischen Oberfläche stark unterscheiden von Reaktionen im
Volumen. Untersuchungen der Deacylations-Reaktion heben die Bedeutung der Qualität der
Substrate für die SAM-Bildung hervor. Die Ergebnisse der Gasphasenabscheidung von
Palladium auf SAMs zeigen eine Beschleunigung der Reaktionskinetik in Gegenwart von
Defekten. Außerdem beschreiben sie die katalytische Aktivität der gebildeten Pd-
Nanopartikel. Diese Arbeit führt zu einem besseren Verständnis der chemischen Reaktionen
auf Dithiol-SAMs und die Ergebnisse können für die Entwicklung und Optimierung einer
geeigneten Oberfläche für die Metallisierung eingesetzt werden.

1
Contents
1. Introduction ---------------------------------------------------------------------------------------3
1.1. Scope of the present work------------------------------------------------------------------3
1.2. Surfaces---------------------------------------------------------------------------------------5
1.3. Organic thin films ---------------------------------------------------------------------------6
1.4. Self-assembled monolayers (SAMs)------------------------------------------------------7
1.5. Thiols on Au(111)---------------------------------------------------------------------------8
1.5.1. SAM - Formation kinetics ------------------------------------------------------------9
1.5.2. SAM - Formation mechanism ------------------------------------------------------ 10
1.5.3. Au(111)-------------------------------------------------------------------------------- 10
1.5.4. Structure of thiolates on gold------------------------------------------------------- 11
1.6. Dithiols on Au(111)----------------------------------------------------------------------- 12
1.7. Chemical reactions on self-assembled monolayers ----------------------------------- 13
1.7.1. Deprotection strategy in dithiols --------------------------------------------------- 15
1.8. Metal deposition on SAMs--------------------------------------------------------------- 15
1.9. Palladium precursor----------------------------------------------------------------------- 22
1.9.1. Cyclopentadienyl(allyl)palladium ------------------------------------------------- 23
2. Sample preparation and analytical techniques ---------------------------------------------- 25
2.1. Chemicals ---------------------------------------------------------------------------------- 25
2.2. Preparation of the gold substrates ------------------------------------------------------- 25
2.3. Preparation of SAMs---------------------------------------------------------------------- 26
2.4. Deposition of Cp(allyl)Pd on SAMs --------------------------------------------------- 26
2.5. Spectroscopic methods used in this work ---------------------------------------------- 27
2.5.1. X-ray Photoelectron Spectroscopy------------------------------------------------- 27
2.5.2. Near Edge X-ray Absorption Fine Structure Spectroscopy--------------------- 31
2.5.3. Infrared Reflection Absorption Spectroscopy ------------------------------------ 34
2.6. Analytical equipment --------------------------------------------------------------------- 38

2
3. Self-assembled monolayers of thiol terminated surfaces---------------------------------- 41
3.1. Self-assembled monolayers of terphenyldimethyldithiol ---------------------------- 41
3.1.1. Preparation of TPDMT SAM------------------------------------------------------- 41
3.1.2. Characterization of TPDMT SAM------------------------------------------------- 41
3.2. Self-assembled monolayers of biphenyldimethyldithiol ----------------------------- 49
3.2.1. Preparation of deprotected BPDMAc-1 SAM------------------------------------ 49
3.2.2. Characterization of deprotected BPDMAc-1 SAM------------------------------ 49
3.3. Conclusion --------------------------------------------------------------------------------- 54
4. Deacylation reaction at an organic surface-------------------------------------------------- 55
4.1. Conversion of thioacetate to thiol ------------------------------------------------------- 56
4.2. Chemistry in confined geometries ------------------------------------------------------ 60
4.3. Conclusion --------------------------------------------------------------------------------- 68
5. Metallization of a thiol-terminated organic surface ---------------------------------------- 69
5.1. Deposition of palladium onto a TPDMT-SAM --------------------------------------- 72
5.1.1. XPS of Pd deposited TPDMT-SAM----------------------------------------------- 73
5.1.2. NEXAFS of Pd deposited TPDMT-SAM ---------------------------------------- 80
5.1.3. IRRAS of Pd deposited TPDMT-SAM ------------------------------------------- 83
5.2. Deposition of palladium onto a deprotected BPDMAc-1 SAM--------------------- 87
5.2.1. XPS of Pd deposited deprotected BPDMAc-1 SAM---------------------------- 89
5.2.2. NEXAFS of Pd deposited deprotected BPDMAc-1 SAM---------------------- 94
5.3. Conclusion --------------------------------------------------------------------------------107
5.4. Outlook ------------------------------------------------------------------------------------108
6. Summary----------------------------------------------------------------------------------------112
7. Appendix ---------------------------------------------------------------------------------------116
7.1. List of symbols and abbreviations -----------------------------------------------------116
7.2. List of figures -----------------------------------------------------------------------------117
7.3. List of tables ------------------------------------------------------------------------------120
8. References --------------------------------------------------------------------------------------121

3
1. Introduction
1.1. Scope of the present work The research work described in this thesis focuses on the surface chemical reactions on
aromatic dithiol self-assembled monolayers adsorbed on the gold surface. Self-assembled
monolayers (SAMs) are ordered molecular assemblies formed by the adsorption of
molecules with a specific affinity to a substrate (Fig. 1a). SAMs of �,�-bisfunctionalized
aromatic molecules on gold are a subject of increasing interest as they are robust and
highly stable under mild conditions. Thiols adsorb on gold via gold-thiolate covalent
bond formation. The terminal groups that are exposed to the surface determine the
interfacial properties of the layers. In order to control the surface properties of a SAM, a
variety of functional groups can be introduced.
SAMs with a specific end group pointing towards the ambient can be prepared by two
ways. The first method involves the direct self-assembly of the appropriate functionalized
thiol in a single step. The second route involves the self-assembly of a less reactive
bifunctional thiol followed by a subsequent chemical modification to the desired
functionality. The attachment of functional groups by surface reactions can be carried out
either in vapour phase or in solution phase. Many routine organic reactions have been
carried out on SAM surfaces [1-5]. Some of the reactions that work well in solution
appear to be difficult to perform on surfaces showing that solution chemistry widely
differs from surface chemistry. The presence of reactive thiol functional group at the
SAM-ambient interface in the SAMs made from dithiols offer the possibility to study the
reactions and interactions of such films with external reagents. In particular the
fabrication of thin metallic films on dithiol SAMs with free SH groups at the SAM-
ambient interface is important in organic electronic devices [6].
The main objectives of this work are the following: (a) to prepare thiol-terminated SAM
surfaces, (b) to study chemical reactions namely the conversion of thioester to thiol on
SAM surfaces and (c) to demonstrate the efficient use of organometallic chemical vapour
deposition (OMCVD) for metallization of SAMs. Experiments with thiol-functionalized
surfaces were mainly pursued with regard to the availability of the free thiol groups at the

4
SAM-ambient interface that can act as a suitable platform to perform metal deposition
reactions. The thiol molecules chosen for the present study are the following:
terphenyldimethyldithiol (TPDMT) and biphenyldimethyldithiol (deprotected BPDMAc-
1).The molecular structures are given in Figure 1.
(b)(a) (b)(a)
Figure 1: (a) Schematic of SAM and (b) structure of the molecules used in this study.
Terphenyldimethyldithiol is an oligophenyl dithiol molecule with two reactive thiol
functional groups. The SAMs formed from them are well ordered, highly oriented and
densely packed [7]. The TPDMT SAMs are also found to possess high resistance to
ionizing radiation [8]. Biphenyldimethyldithiol SAMs also belongs to the class of
oligophenyl dithiols. The preparation of high quality TPDMT SAMs by the
straightforward approach proves to be successful whereas the SAMs with a short
oligophenyl backbone (biphenyl) results in the formation of loops or bridge like
constructions [7]. SAMs of biphenyldimethyldithiol with a high degree of molecular
orientation was fabricated from its monoacylated derivative [9]. In the present study, the
first step is to prepare TPDMT and deprotected BPDMAc-1 SAM surfaces with thiol
termination. The next step is to deposit palladium on these thiol-terminated SAMs. The
allylcyclopentadienylpalladium [Cp(allyl)Pd] has been chosen as the precursor for the
deposition of palladium metal. The CVD of metals has significant advantages over
thermal evaporation methods. Palladium has many useful characteristics including
catalytic properties [10]. In this work, Cp(allyl)Pd was chosen for CVD as it is an ideal
precursor (high volatility and easy and high-yield preparation). In this work, various

5
spectroscopic techniques, including infrared reflection absorption spectroscopy (IRRAS),
X-ray photoelectron spectroscopy (XPS) and near edge X-ray absorption fine structure
(NEXAFS) spectroscopy have been used for the characterization purposes.
In spite of a lot of work that has been done on the chemical modifications of SAM
surfaces, a clear understanding of the difference in the reactivity of different surfaces is
lacking. Hence, it is worth putting efforts into the investigation of the reactivity of
organic surfaces. Many open questions on the reactivity of the organic surfaces have been
addressed in this thesis. How does the kinetics of the surface reaction differ from that in
the corresponding solution? Why is the reactivity of a thioester with a base significantly
delayed on the surface? How does the reaction between Cp(allyl)Pd and a thiol group
tethered to the surface proceed? What happens to the monolayer structure in the presence
of catalytically active metal particles? The answers to these questions are discussed in the
coming chapters.
This thesis is organized as follows: An overview of the self-assembled monolayers
(SAMs) and the idea of chemical modifications of the organic surfaces exposed by the
SAM including metal deposition on organic surfaces are given in Chapter 1. The sample
preparation and the analytical tools used in the present study are described in Chapter 2.
The preparation and characterization of the different thiol terminated surfaces are
discussed in Chapter 3. The kinetics of the deacylation reaction (-SCOCH3 to -SH) on a
thio-acetate terminated organic surface has been described in Chapter 4. The
metallization of thiol-terminated surfaces using a palladium precursor is discussed in
Chapter 5. Finally, the results are summarized in Chapter 6.
1.2. Surfaces Atoms or molecules at a surface experience a different environment from those in the
bulk. The effect of having no net force at the surface is that the whole surface region is at
a relatively high energy compared with the bulk. The binding of adsorbates is strongly
favored at the surface, either by the formation of chemical bonds (chemisorption) or by
weak van der Waals type interactions causing physical adsorption (physisorption) [11].
The adsorption of organic molecules on metals and metal oxides alters the interfacial
properties by lowering the free energy of the interface between the metal or metal oxide

6
and the ambient environment. Many chemical processes (such as corrosion and
heterogeneous catalysis) take place at the surface of solids. Organic materials (for
example, thiols and disulphides) adsorbed can resist corrosion, decrease the reactivity of
the surface atoms, or act as an electrically insulating film [12]. An understanding of
interactions at organic surfaces and interfaces is vital to the development of many
technologies like sensors [13], device reliability studies [14], and biological interfaces
[10].
1.3. Organic thin films The research on organic thin films has fairly old roots. In the eighteenth century,
Benjamin Franklin observed the spontaneous spreading of oil on the surface of a pond
[15]. In the nineteenth century, Agnes Pockles and Lord Rayleigh performed studies at
the air-water interface [16]. Irving Langmuir investigated monolayers of amphiphilic
molecules on the water surface [17] and Katherine Blodgett did the first study on the
deposition of long chain fatty acids on solid substrates [18]. Zisman conducted the first
systematic studies related to SAMs of primary aliphatic amines and monocarboxylic
acids on platinum and pyrex substrates [19]. In these earlier studies, the macroscopic
properties (such as surface tension and wetting properties) are explored largely when
compared to the processes at molecular level due to the lack of appropriate tools. With
the spectroscopic and microscopic tools available today, one can attempt to correlate
macroscopic and microscopic properties. There are different ways for the preparation of
organic thin films [20]. Langmuir films are formed by spreading amphiphilic molecules
on a liquid surface. Langmuir-Blodgett (LB) films are built-up monolayer assemblies
prepared by transferring Langmuir films (floating monolayer) onto a solid substrate [21].
The growth of organic thin films in ultrahigh vacuum is referred to as organic molecular
beam deposition or organic molecular beam epitaxy and has an advantage over other
methods in the purity of films formed [22, 23]. Self-assembled monolayers are another
class of organic thin films that can be from solution or from gas-phase. The research
work described within this thesis focuses completely on SAMs and the following is a
brief introduction to SAMs.

7
1.4. Self-assembled monolayers (SAMs) Self-assembly processes are common in nature. Examples include formation of lipid
bilayers, pairing of bases (adenine - thymine and cytosine - guanine), and folding of
proteins. According to Whitesides et al., self assembly are processes that involve pre-
existing components (separate or distinct parts of a disordered structure), are reversible,
and can be controlled by proper design of the components [24]. The process of self-
assembly is driven by both, specific molecular interactions and the drive to minimize the
energy of interaction between molecules. There are two types of self-assembly: static and
dynamic. Static self-assembly involves systems at equilibrium and do not dissipate
energy. In dynamic self-assembly, the formation of ordered state requires the dissipation
of energy. Examples for dynamic self-assembly include galaxies, solar systems, weather
patterns, swarms (ants) and schools (fish). SAMs belongs to the class of systems which
undergo static self-assembly [24].
Self-assembled monolayers (SAMs) are ordered molecular assemblies formed on a solid
substrate by spontaneous organization of molecules [25]. A self-assembling molecule is
defined by three chemical entities (Fig. 2), each of which plays an important role in the
assembly process [26].
Figure 2: Schematic view of SAM.
The first part is the surface-active head group which renders the chemisorption on the
substrate surface. The apparent pinning of the head group to a specific site through a
chemical bond (covalent or ionic) results from strong substrate-molecular interaction.
The second part is the spacer group. The spacer group can be an alkyl chain or an
aromatic backbone. The forces that come into play in simple alkyl molecules and

8
molecules containing polar aromatic groups are van der Waals interactions and
electrostatic interactions, respectively. The third part is the end group. This end group can
be of any desired functionality. The properties of this terminal group define the surface
properties of the assembled monolayer. The macroscopic properties like wettability,
biocompatibility and adhesion of the groups surface can be altered by changing the end
functional groups of molecules that form SAMs [27]. The interplay between the three
components within the molecule determines the order and stability of the final assembled
monolayer.
SAMs can be formed on different substrates like metals, semiconductors and oxides [28].
There are a number of combinations of headgroups and substrates used in the formation
of SAMs. Organic acids on metal oxides [29], alcohols, amines, and isonitriles on Pt,
alkylsilane derivatives on hydroxylated surfaces [25], dithiols, thioesters, dialkyl sulfides,
dialkyl disulfides, thiophenols, mercaptopyridines [30], mercaptoanilines, thiophenes,
cysteines, xanthates, thiocarbamates, thioureas and mercaptoimidazoles on Au, and
alkanethiols on metals such as Au, Ag, Pt, Pd, Hg and Cu, and nonmetals such as GaAs,
InP and InSn oxide [25] are some examples of adsorbate-substrate pairs commonly used
to generate SAMs.
1.5. Thiols on Au(111) Self-assembly of alkanethiols on gold was first reported earlier in 1983 by Ralph G.
Nuzzo and David L. Allara, who described the formation of organized monolayers of
alkyl disulfides and alkanethiols on gold [31]. Since their discovery, SAMs on gold have
been created from many sulfur-containing molecules including alkanethiols, aromatic
thiols, dialkyl disulfides, and dialkyl sulfides. Thiol molecules are good nucleophiles and
bind via strong S-Au interactions. Novel monolayer structures can be obtained using gold
substrates and simple thiol deposition procedures. Thiols are also used to protect metal
nanoclusters and the resulting monolayer protected nanoclusters (MPC) exhibit a great
stability [32].

9
1.5.1. SAM - Formation kinetics
Self-assembled monolayers can be formed from solution or from vapour phase. SAMs
investigated in this work are prepared from solution phase. For most alkanethiols, a
monolayer is formed after just a few minutes of immersion of the substrate into the
corresponding alkanethiol solution. The initial driving force for the assembly is the
chemical affinity between the adsorbates and the substrate. Once the monolayer is
formed, the layer still goes through changes as more alkanethiols pack into the layer and
the molecules rearrange to their optimal configuration. This healing of the monolayer can
take hours to days and will lead to a technically superior monolayer. The amount of time
required to obtain a given level of order within a monolayer will depend on the initial
solution concentration, the temperature, and the characteristics of the alkanethiols being
used. For most monolayers, immersion times of 1 to 2 days will result in an equilibrium
state, where the majority of the molecules are arranged in their final, optimal
configuration [20]. The schematic mechanism for the self-assembly of thiols on Au is
shown in Figure 3.The initial step is the adsorption of molecules onto the substrate and
formation of a lying-down phase or striped phase. The next step is the transition from
lying down to standing-up phase.
1 2 3 41 2 3 4
Figure 3: Schematic sketch of the different steps in SAM formation.
(1) Initial adsorption. (2) Striped phase or lying-down phase. (3) Transition from lying-
down to standing-up phase. (4) Formation of a complete SAM.

10
1.5.2. SAM - Formation mechanism
The adsorption of thiols and disulphides on clean gold gives monolayers through the
formation of gold-thiolate species. The reaction between thiols and gold surface is an
oxidative addition producing surface bound thiolates, followed by a reductive elimination
of the hydrogen (equation 1).
Au + R-SH � Au-SR + ½ H2 (1)
In the case of disulphides, the adsorption reaction is an oxidative addition which proceeds
via the S-S bond cleavage (equation 2).
2Au + RS-SR � 2Au-SR (2)
XPS of the sulphur 2p region have shown that the adsorption of thiols and disulphides on
gold produces thiolate (RS-) species. Raman and infrared spectra show the absence of
strong bands of S-S and S-H (~ 2600 cm-1) vibration. These observations are also
confirmed by laser desorption Fourier transform mass spectrometry and electrochemistry
[33]. Monolayers can be formed from the gas phase in the complete absence of oxygen
and this suggests the evolution of molecular hydrogen. However, the possibility of
formation of water cannot be ruled out in the experiments involving the immersion of the
substrates in solution [28].
1.5.3. Au(111)
Gold is the standard substrate for SAM preparation. There are special properties of gold
that make it a good choice as a substrate for studying SAMs. Gold is a relatively inert
metal. It can be easily manipulated in air with lessened concern for contamination. It does
not react with most chemicals and it does not react with atmospheric oxygen [34, 35]. It
is the most stable metals in the group 8 elements. Few functional groups (thiols or
disulfides) bind strongly to gold and SAMs on gold system is the most studied [36, 37].
As thiols have a high affinity for gold, they also displace adventitious materials from the
surface readily. Gold is easy to obtain as a thin film. It is straightforward to prepare thin
films of gold by physical vapor deposition, sputtering, or electrodeposition. Gold is easy
to pattern by a combination of lithographic tools and chemical etchants. Thin films of
gold are good substrates for spectroscopic studies and are compatible with cells and
organisms. Cells can adhere and function on gold surfaces without evidence of toxicity

11
[10]. Although bulk gold is very popular for being chemically inert, gold nanoparticles
has proven to have catalytic applications [38]. The low index surfaces of gold are (111),
(100) and (110). The thermodynamically stable lowest energy surface of gold is Au(111)
[35]. The reconstructed surface of bare Au(111) is characterized by a 4.3% uniaxial
lateral contraction relative to the bulk layers [39]. The stacking arrangement alternates
between faulted and unfaulted regions delineated by rows of bridging Au atoms. A
(�3x23) surface unit cell is formed and to further reduce the surface energy the pairs form
hyperdomains characterized by alternating 60° bends which is known as herringbone
reconstruction [40]. The nearest neighbour distance in Au(111) is 2.884 Å (Au lattice
constant).
1.5.4. Structure of thiolates on gold
The surface reconstruction of clean Au(111) can be lifted by molecular adsorption.
Alkanethiols adopt commensurate crystalline lattice characterized by a c(4x2)
superlattice of a (�3x�3)R30° consistent with a hexagonal lattice indicating that the
Au(111) reconstruction is lifted in the presence of adsorbates. There are controversies
regarding the specific adsorption site(s) at which the alkanethiolate molecules are placed
on the Au(111) lattice. The different possible adsorption sites for an alkanethiolate
molecule on the Au(111) unit cell are hollow, bridge and atop [41, 42]. The stable
adsorption site was between bridge and fcc hollow sites. Other favourable sites are bridge
and atop sites. The sulphur atoms occupying the hollow sites between the gold atoms are
schematically shown in Fig. 4. The distance between adjacent S atoms is 4.995Å.

12
2.884 Å
4.995 Å
2.884 Å2.884 Å
4.995 Å4.995 Å
Figure 4: Alkanethiolate adlayer (filled circles) on the Au(111) surface (empty circles).
Adapted from reference [43].
The defects in gold-thiol monolayers include domain boundaries, tilt boundaries, stacking
faults, rotational boundaries, antiphase boundaries, Au vacancy islands and molecular
vacancies. Au vacancy islands are pit like defects which were observed in the domain
boundary network. Edinger et al. have shown that the pit depth was �2.5 Å, equal to the
single-atom step height of the Au(111) substrate [44]. This suggests that the pits are
defects in the Au surface layer and not defects in the alkanethiol layer. Poirier et al. have
found evidence for the existence of mobile Au-adatoms during monolayer assembly,
suggesting that the vacancy islands form by ejection of excess Au atom density from the
surface during relaxation of the Au(111) herringbone reconstruction [43].
1.6. Dithiols on Au(111) Dithiols are compounds in which both the headgroup and the endgroup are available for
chemical reactions. SAMs of dithiols are extensively studied in the context of molecular
electronics [20]. Organic dithiols are used as a spacer to bridge nanoparticles and
functionalized nanoparticles results in a well ordered 3D hybrid nano network [45].
SAMs of dithiols are more difficult to handle experimentally than monothiols, because
they oxidize readily. They can form multilayers via disulphide linkages or they can form
looped structures where both ends of the molecule bind to the surface. Oxidation of thiols
to disulphides is the major problem that arises when using dithiols. Because of their high

13
reactivity, thiols need to be protected. The protection of one of the thiol group in dithiols
by an acetyl group is believed to promote the formation of good quality SAMs, suppress
the dimerization, and prevent the multilayer formation [9]. The dithiol SAMs formed
from terphenyldimethyldithiol (TPDMT) and monoacylated biphenlydimethyldithiol
(BPDMAc-1) were investigated in this work.
1.7. Chemical reactions on self-assembled monolayers The reactivity of thioester terminated SAMs on Au(111) towards base hydrolysis and the
reactivity of aromatic dithiol SAMs towards an OMCVD precursor, Cp(ally)Pd has been
investigated in this research work. The discussion that follows includes an overview of
the different chemical reactions that have been studied earlier, followed by a more
detailed look at the deprotection reaction of dithiols.
In principle, chemical reactions such as nucleophilic substitution, free radical
halogenation, oxidation/reduction, etc. can be performed on well-ordered, densely packed
self-assembled monolayers using reaction schemes similar to those observed in the liquid
phase [46-51]. Though chemistry can be done on the organic surfaces exposed by SAMs,
it is quite different from that found in solution. Many organic reactions that work well in
solution appear to be difficult to perform on surfaces. The reactions known from bulk
chemistry cannot simply be transferred to interfaces [1]. Dubois et al. have shown that,
the hydrogen bonding reactions of the surface tethered carboxylic acid with various
amines are perturbed [28]. On the other hand, in solution, simple carboxylic acids rapidly
undergo proton transfer reactions with amines [28]. Furthermore, it is difficult to separate
the product from the byproducts and unreacted materials attached to the surface. This
problem becomes especially acute when monolayers are subjected to a number of
successive reaction steps [3]. The formation of surface-attached by-products at each step
leads to accumulation of defects. Surface amino groups can be easily converted to amides
by coupling with a carboxylic acid in a single step [3]. The SAMs with surface carboxyl
group can be converted to the acid chloride by using gaseous thionyl chloride. These
surfaces can then be converted to an amide linkage by further reaction with an amine
[52]. In this case, the reaction involves two steps.

14
There are several factors affecting the reactivity of functional groups in a self-assembled
monolayer.
(a) Solvent effects: The solvation of functional groups embedded in a monolayer may
differ from the bulk. The local concentration of dissolved reagents near the surface can
also be different. This is especially true for charged surfaces (such as COO-, NH3+) [5].
(b) Steric effects: Many of the reactions show diminished reactivity because of steric
constraints. For example, in a densely packed monolayer, bimolecular nucleophilic
substitution (SN2) reactions may not take place because there is no room for a backside
attack. Reactions requiring penetration of a reagent through a densely packed monolayer
or reactions with bulky transition state may be hindered at surfaces. On the other hand,
enforced favorable orientation or conformation of the reactive functional group in a
monolayer could result in significant acceleration of reaction rates in monolayers.
(c) Electronic and anchimeric (neighbouring group participation) effects: Functional
groups adjacent to the reaction center in the monolayer may affect reactivity through field
effects, hydrogen bonding, or anchimeric participation [5, 53, 54].
Activation of the SAM surfaces for increased reactivity: The functional groups on the
SAM surface can be activated by different approaches. The reactivity can be enhanced by
using a mixed SAM. A molecular component in a mixed SAM can be made shorter
compared to the molecule with the reactive functional group. Microcontact printing is
also another method of adsorbing two different molecules on a substrate. Thus by diluting
the SAMs, the reactivity can be accelerated. Other ways of activation includes the use of
external stimuli, such as electrochemical potentials [55], photoradiation and mechanical
disruption by the SFM probe tip. The activation process transforms the unreactive
functional groups into reactive ones for the subsequent chemical modification [10]. Wang
et al. has investigated the base hydrolysis of a dithiobis(succinimido undecanoate)
monolayer on Au(111) [56]. The rate of the complete transformation of the succinimidyl
terminus to the corresponding carboxylate moiety is approximately 1000 times slower
than the corresponding reaction in solution. The low rate of conversion is explained by
the steric hindrance and the slow surface reaction has been accelerated by the tip-assisted
base hydrolysis. The steric barrier in the SAM is disrupted by the SFM probe tip which
15
facilitates the access of hydroxide ions to the buried acyl carbons. Reactions induced or
affected by the AFM tip belong to a quite different type of reactions, where also catalytic
effects of the perturbing AFM tip have to be considered.
1.7.1. Deprotection strategy in dithiols
There are various approaches to the protection of -SH bond in dithiols [12]. For SAMs,
the thiols have been most commonly protected as thioesters [57, 58]. The protected thiol
has to be deprotected when other functionalities are introduced or modified. The use of
many common protecting groups is limited by the fact that strongly basic conditions are
required for their introduction and acidic or basic conditions are needed in the
deprotection step. Formation of the corresponding disulphide is an expected side reaction
when the thiol group is deprotected under strong basic conditions. The hydrolysis of
thioester by means of a base yields thiols. Bases which are commonly used for
deprotecting thioesters are ammonium hydroxide, sodium hydroxide, triethyl amine,
potassium carbonate and sodium carbonate. Tour et al. investigated the SAMs of rigid
�,�-dithiols which could form assemblies in which one thiols group binds to the surface
while the second thiols moiety projects upward at the exposed surface of the SAM. In situ
deprotection has been performed using NH4OH [59]. Shaporenko et al. have used the in
situ deprotection method using either NH4OH or triethylamine as the deprotection agent
for acetyl-protected biphenyl based dithiol derivatives [60]. Stirling and coworkers have
studied the base catalyzed hydrolysis of esters. It has been shown that the esters which
have the carbonyl function close to the monolayer surface hydrolyze more rapidly
compared to the esters with the carbonyl group buried deeply below the surface [61].
When the access of an external reagent is blocked, the reaction is thought to start at
defect sites and domain boundaries [62].
1.8. Metal deposition on SAMsThe OMCVD of palladium on dithiol SAMs has been studied in this work. The following
sections contain a brief overview on metal deposition on SAMs.
In general, when unreactive metals are deposited on inert SAMs, the deposited metal
diffuse through the SAM to the gold-sulphur interface whereas metals that are more

16
reactive will stick to SAMs with coordinating head groups to form organometallic
complexes. Deposition of metal on organic surfaces involves the reaction between the
end functional group and the deposited metal atoms, the nucleation process and growth
mode of the metal on the modified surface and the final configuration of the deposited
metal with regard to the underlying SAM. In the first step, the metal atoms impinge on
the SAM surface and metal islands are formed on top of the SAM (Fig. 5). Eventually the
deposited metal atoms penetrate into the SAM layer and diffuse to the SAM-substrate
interface. The organic molecules then form SAMs on the buried layer. Diffusion occurs
via defects in the film for example domain boundaries. Surface defects are favored
nucleation centers.
SAM
Gold (111)
Metal atoms Metal islandson top
Metal diffusing to the substrate
Metal buried below SAM
SMetal
H
SAM
Gold (111)Gold (111)
Metal atoms Metal islandson top
Metal diffusing to the substrate
Metal buried below SAM
SMetal
H
Figure 5: Schematic illustration of the deposited metal with regard to the underlying
SAM on the Au(111) surface.
There are several deposition methods available for depositing metals on SAMs that
includes thermal evaporation, atomic layer deposition, physical vapour deposition,
chemical vapour deposition and electrochemical deposition. The following is a brief
description on the different deposition methods. Table 1 lists examples for different
deposition methods. More details can be found in the references quoted. Detailed
literature survey of metallization of SAMs is given in Chapter 5.
Physical vapor deposition: The physical vapor deposition technique is based on the
formation of vapor of the substance to be deposited as a thin film. Vapor deposition of

17
metals onto organothiolate self-assembled monolayers on Au(111) is a common approach
to prepare a metal/SAM/Au sandwich structure [63]. The amount of deposited metal is
commonly monitored by a quartz crystal microbalance. The metal to be deposited is
produced from a vaporization source in an ultra-high vacuum chamber. A variety of
metals can be deposited by this method.
Atomic layer deposition: Atomic layer deposition (ALD) is a process for depositing thin
films by exposing the surface to vapors of two or more reactants [64]. First, the substrate
surface is exposed to one precursor and the excess reactant is pumped away. Then the
system is exposed to the second reactant and the excess is pumped away. This cycle of
steps is repeated to form monolayers of thin films. The surface reactions must be
complementary and self-limiting. The thickness of the layers formed is reproducible as
the thickness depends on the number of reaction cycles. The method is also known as
atomic layer epitaxy.
Chemical vapor deposition: Chemical vapor deposition is a chemical process used for
the deposition of thin films of various materials. The process involves the condensation
of a compound or compounds from the gas phase on to a substrate where a chemical
reaction occurs to produce a solid deposit [65, 66]. The process is shown schematically in
Figure 6.
Figure 6: Schematic representation of a CVD process.
The temperature in the reaction part of the system is generally higher than the vapour
source but considerably below the melting temperature of the deposit. Chemical vapour
deposition of metals can be achieved via thermal decomposition or chemical reduction.

18
Examples for thermal decomposition (equation 3) and chemical reduction (equation 4)
are shown below.
Ni(CO)4(g) � Ni(s) + 2CO2(g) (3)
WF6(g) + 3H2(g) � W(s) + 6HF(g) (4)
In general, the CVD process involves the following key steps: (1) Generation of the
active gaseous reactant species and mass transport of the reactant in the bulk, (2) gaseous
reactants undergo gas phase reactions forming intermediate species, (3) mass transport to
the surface, (4) adsorption on the surface, (5) surface reactions, (6) surface migration, (7)
nucleation and growth of the film, (8) desorption of by-products and (9) mass transport of
by-products in bulk. The unreacted gaseous precursors and by-products will be
transported away from the deposition chamber [65]. Figure 7 shows a schematic
illustration of the reaction mechanism of a CVD process.
Figure 7: Mechanism of chemical vapour deposition.
There are different forms of CVD which can be classified by operating pressures
(atmospheric pressure CVD, low pressure CVD and UHVCVD) or by the energy sources
(thermal CVD, plasma enhanced CVD, microwave plasma assisted CVD, laser assisted
CVD, hot filament CVD, photo CVD, acoustic CVD, metal organic CVD and diamond
CVD).
Metal organic chemical vapor deposition: MOCVD is also referred to as
organometallic vapor phase epitaxy (OMVPE). The growth process occurs via the
19
pyrolysis of the organometallic compounds. The growth process constitutes the
transportation of one or more film constituents to the reaction zone in the form of metal
alkyls and the second constituent are transported as hydrides. The reactions are simple
and the reactants taking part in the reaction are gaseous in nature [67]. Highly pure metal
films have been achieved using special precursors [68]. Examples include M(�3C3H5)3, M
= Rh or Ir, (�5-CH3C5H4)2Ni, Pd(�3CH2CHCH2)2, Pd(�3-CH2C(CH3)CH2)2, (�5-C5H5)-
PtMe3, (�5-CH3C5H4)PtMe3 and �5-C5H5CuPMe3.
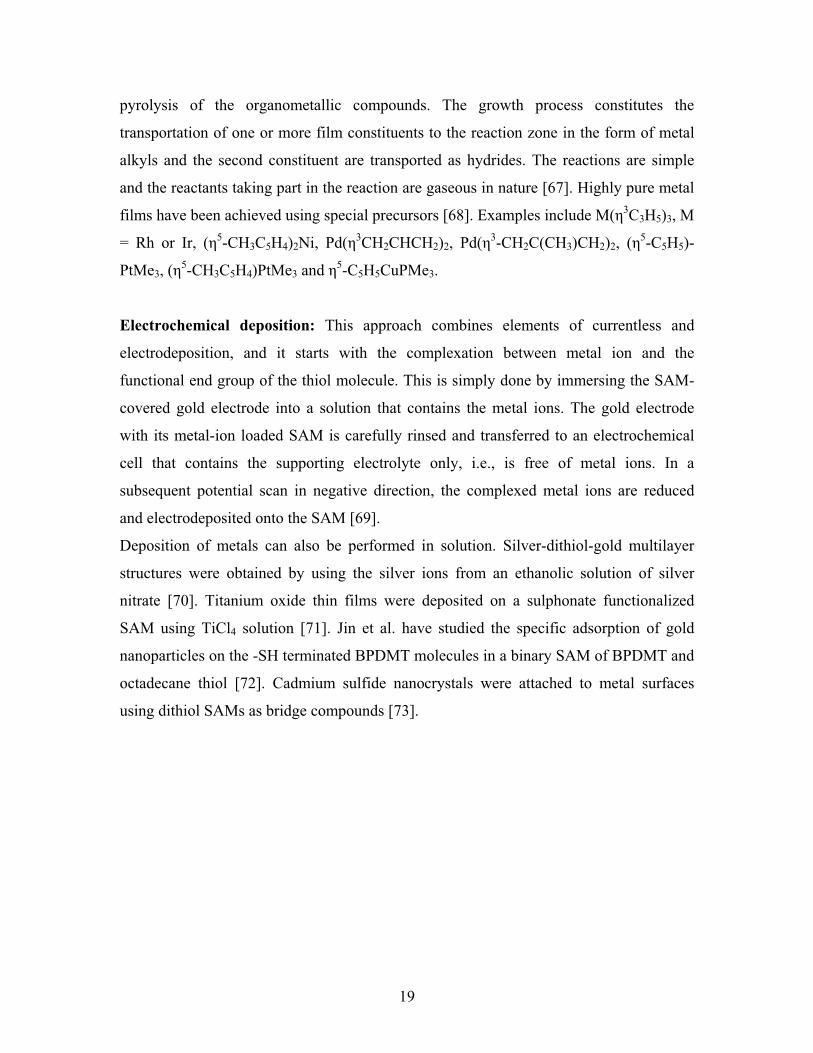
Electrochemical deposition: This approach combines elements of currentless and
electrodeposition, and it starts with the complexation between metal ion and the
functional end group of the thiol molecule. This is simply done by immersing the SAM-
covered gold electrode into a solution that contains the metal ions. The gold electrode
with its metal-ion loaded SAM is carefully rinsed and transferred to an electrochemical
cell that contains the supporting electrolyte only, i.e., is free of metal ions. In a
subsequent potential scan in negative direction, the complexed metal ions are reduced
and electrodeposited onto the SAM [69].
Deposition of metals can also be performed in solution. Silver-dithiol-gold multilayer
structures were obtained by using the silver ions from an ethanolic solution of silver
nitrate [70]. Titanium oxide thin films were deposited on a sulphonate functionalized
SAM using TiCl4 solution [71]. Jin et al. have studied the specific adsorption of gold
nanoparticles on the -SH terminated BPDMT molecules in a binary SAM of BPDMT and
octadecane thiol [72]. Cadmium sulfide nanocrystals were attached to metal surfaces
using dithiol SAMs as bridge compounds [73].

20
Table 1: Examples for different metal deposition methods on organic thin films.
Molecule / Substrate Metal Ref.
Thermal evaporation
octadecanethiol, hexanedithiol on Au Ag [74, 75]
octanethiol & HS(CH2)nSH on Au Au [76]
HS(CH2)15X on Au (X = -COOH,-COOCH3 & -CH3) Au, Ti, K [77]
benzenedimethanethiol on Au Au [78, 79]
dodecanethiol & mercaptoundecanoic acid on Au Au [80]
dimercapto-quaterphenyl, -terphenyl, -biphenyl,
monomercapto-terphenyl & hexadecanethiol on Au Au, Al, Ti [81]
HS(CH2)16OCH3 on Au Ti, Ca [82]
HS(CH2)nCOOH on Au Cu [83]
fluorene, biphenyl, nitrobiphenyl on carbon Cu [84]
mercaptohexadecanoate on Au Cr [85]
polyimide films on Pt(111) or Si(100) Au, Ag,
Cu,Pd,Cr,K [86]
phenyltricosanethiol on Au Cr [87]
methoxyhexadecanethiol on Au Mg [88]
TPDMT, BPDMT on Au Ni [6, 89]
Atomic layer deposition
tetrasulphide on SiO2 Pd [90]
Pulsed laser deposition
decanethiol & octadecanethiol on Au Au, Pt, Pd [91]
Metal organic chemical vapor deposition
octadecyltrichlorosilane on TiN, ITO, SiO2, Al2O3,
sapphire and glass Pt, Pd, Cu [92, 93]
Organometallic chemical vapor deposition
biphenyldithiol, biphenylthiol,
mercaptoundecanol & dodecanethiol on Ag Pd [94]

21
Electrochemical deposition
mercaptopyridine, dithiodipyridine on Au Pd, Pt, Rh [95-97]
benzenedimethanethiol on Au Pt [98, 99]
coadsorption of dodecanethiol and a thiolated
derivative of tetraphenylporphyrin on gold Pt [100]
mercaptoethanol, hexanedithiol, ethanethiol,
hexanethiol on Au Ag
[101,
102]
dodecanethiol on Au Rh [103]
(mercaptopropyl)trimethoxysilane on Ag Tl, Pb, Cd [104]
octanethiol, dodecanethiol on Au Cu [105]
aminothiol on Au Co [106]
aminopropyltriethoxysilane on hydroxylated Si Cu [107,
108]

22
1.9. Palladium precursor A major part of the work described in this thesis focuses on the palladium deposition on
SAMs of dithiols using the precursor Cp(allyl)Pd. The following section focuses on
palladium thin film deposition using different Pd precursors followed by a detailed
account on Cp(allyl)Pd.
Palladium is a steel-white, ductile metallic element which is commonly used in
microelectronic devices such as capacitors, resistors, and contacts [109]. It exists in three
states: Pd0, Pd2+ and Pd4+. It can be evaporated onto surfaces using standard techniques.
Palladium reacts reversibly with hydrogen gas to form PdHx. It can react readily with
thiols. SAM of alkanethiolates can be formed on the surface of palladium [110]. Yang et
al. demonstrated the reaction involving Pd2+ ion and alkanethiol ligands through the
synthesis of a Pd-thiolate complex, [Pd(SC12H25)2]6 [111]. Pd is catalytically active and is
used in many hydrogenation reactions [112].
Palladium thin-film deposition was carried out from the known precursors like Pd(allyl)2,
[Pd(Cp)2], Cp(allyl)Pd, Pd(CH3allyl)2, allyl(�-diketonato)Pd, Pd(hfac)(allyl), Pd(hfac)2
and Pd(acac)2 [113-117]. The use of a reactive gas such as dihydrogen led to unexpected
low temperatures of deposition (30-60°C). Catalytic selective hydrogenation reaction of
allylpalladium complexes with H2 has been studied by Carturan et al. [118]. The allyl
groups usually can be removed by hydrogenation. This reaction proceeds readily with the
allyl compounds of nickel, palladium, and platinum when treated with dihydrogen gas at
normal pressure. The products are the free metals and propane. The cyclopentadienyl
(C5H5) and allyl (C3H5) groups are two of the most important ligands in inorganic and
organometallic chemistry [119]. Allyl-transition metal systems can be compared with
cyclopentadienyl-transition metal systems. Cyclopentadienyl metal systems (except
ferrocene) have low catalytic activities because of significant stabilities. Allyl metal
systems are not very stable and as a result the complexes have high catalytic activity
[120].

23
1.9.1. Cyclopentadienyl(allyl)palladium
Cp(allyl)Pd is a labile organopalladium compound useful for preparations of various Pd0
complexes. B.L.Shaw was the first to synthesize Cp(allyl)Pd [121]. It forms red
needlelike crystals and the melting point is around 60 °C. It is diamagnetic and has a low
dipole moment. In the solid state it is fairly stable, although it decomposes gradually at
room temperature to give a black solid. It is an easily sublimed compound with
unpleasant odour [122].
Figure 8: Synthesis of Cp(allyl)Pd precursor.
Preparation of cyclopentadienyl(allyl)palladium: The Cp(allyl)Pd complex (2) was
prepared by the treatment of the bridged complex allyl palladium chloride (1) with
cyclopentadienyl sodium in tetrahydrofuran (Fig. 8). The allyl palladium chloride (1) was
prepared by the reaction of sodium chloropalladate with allyl chloride [123]. All the
cyclopentadienyl and all the allylic carbons are equidistant from the central metal atom
(2.25 and 2.05 Å, respectively). The palladium atom forms two equivalent pi-bonds with
the delocalized one and a half bonds of the allyl group and this interaction is substantially
stronger than with the cyclopentadienyl ring [124, 125]. Particular interest is evoked in
this compound because of its peculiar behavior in chemical reactions. The
cyclopentadienyl ligand is easily eliminated under the influence of a series of
electrophilic and nucleophilic agents, whereas the link with the �-allyl group is stable
even in comparatively severe conditions [126]. The thermal decomposition of
cyclopentadienyl(allyl)palladium is an autocatalytic process [127]. In the first step,
metallic Pd is formed and the liberated Pd0 catalyzes the subsequent process. The allyl
24
radical decomposes to propane, propylene, biallyl and benzene. The cyclopentadienyl
radical decomposes to cyclopentadiene and bicyclopentadiene. Thermolysis of the
Cp(allyl)Pd precursor in the absence of any reactive gas was reported to give a mixture of
propene, cyclopentadiene and traces of hexadiene [128]. Cp(allyl)Pd reacts rapidly with
hydrogen at room temperature to form palladium crystallites [129]. The sandwich
structure of the cyclopentadienyl and the allyl ligands was shown by nuclear magnetic
resonance and IR spectra [130, 131]. The photoelectron spectra (between 21.2 and 60 eV)
of Cp(allyl)Pd has been recorded [132]. The mass spectral data shows evidence for the
relative weakness of the bonding of cyclopentadienyl ring to palladium [133].
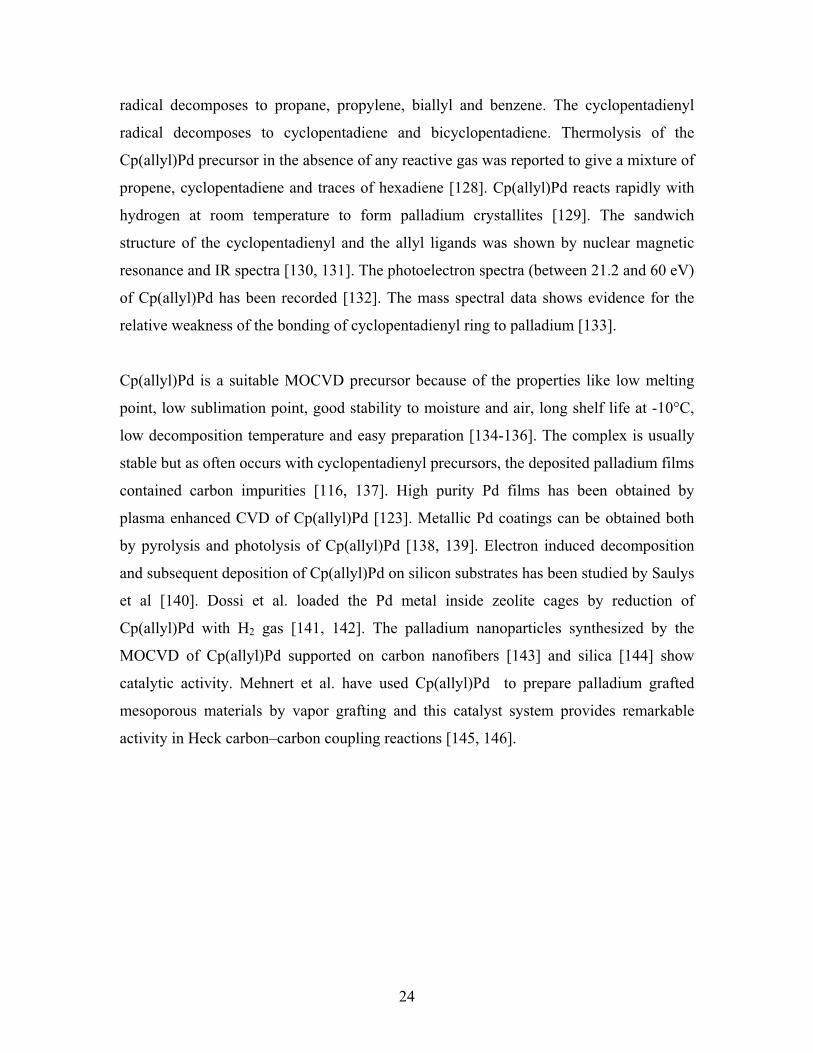
Cp(allyl)Pd is a suitable MOCVD precursor because of the properties like low melting
point, low sublimation point, good stability to moisture and air, long shelf life at -10°C,
low decomposition temperature and easy preparation [134-136]. The complex is usually
stable but as often occurs with cyclopentadienyl precursors, the deposited palladium films
contained carbon impurities [116, 137]. High purity Pd films has been obtained by
plasma enhanced CVD of Cp(allyl)Pd [123]. Metallic Pd coatings can be obtained both
by pyrolysis and photolysis of Cp(allyl)Pd [138, 139]. Electron induced decomposition
and subsequent deposition of Cp(allyl)Pd on silicon substrates has been studied by Saulys
et al [140]. Dossi et al. loaded the Pd metal inside zeolite cages by reduction of
Cp(allyl)Pd with H2 gas [141, 142]. The palladium nanoparticles synthesized by the
MOCVD of Cp(allyl)Pd supported on carbon nanofibers [143] and silica [144] show
catalytic activity. Mehnert et al. have used Cp(allyl)Pd to prepare palladium grafted
mesoporous materials by vapor grafting and this catalyst system provides remarkable
activity in Heck carbon–carbon coupling reactions [145, 146].

25
2. Sample preparation and analytical techniques
This chapter describes the experimental details including the sample preparation and
provides a brief description of the analytical techniques used in this work.
2.1. Chemicals The following reagents were used without further purification. Ethanol (Merck),
dichloromethane (Merck), chloroform (Merck) and sodium hydroxide (J. T. Baker). The
thiols, TPDMT and BPDMAc-1 [7, 9] and the organometallic precursor, Cp(allyl)Pd
[121, 122] were synthesized according to the reported procedures. The palladium
precursor and BPDMAc-1 has been provided by Prof. Roland A. Fischer, Anorganische
Chemie II, Ruhr-Universität Bochum. TPDMT has been provided by Prof. Andreas
Terfort, Fachbereich Chemie, Philipps-Universität Marburg.
2.2. Preparation of the gold substrates The gold surfaces were prepared by slow thermal evaporation of pure gold onto a clean
flat surface in ultrahigh vacuum. For the IRRAS, NEXAFS and XPS measurements,
polycrystalline gold substrates were prepared by evaporating 5 nm of titanium with a rate
of 0.5 nm s-1 (99.8%, Chempur) and subsequently 100 nm of gold with a rate of 2 nm s-1
(99.995%, Chempur) onto polished (100) oriented silicon wafers (Wacker) in an
evaporation chamber operated at a base pressure of 10-7 mbar. A thin layer of titanium is
used to promote the adhesion between gold and the silicon substrate. These substrates
were stored in vacuum desiccator until the adsorption experiments were carried out. For
the microscopic measurements, the substrates were prepared by evaporating 150 nm of
gold onto freshly cleaved mica, which had previously been heated to 500 K for 2 days in
the evaporation chamber. After the metal evaporation, the substrates were allowed to
slowly cool down. The substrates were stored in the evaporation chamber and flame
annealed in a propane/oxygen flame immediately before the adsorption experiments were
carried out. This procedure yields gold substrates with very large, atomically flat terraces
exhibiting a (111) surface.

26
When a gold surface is exposed to air, it will be coated with a layer of adventitious
hydrocarbon. The gold surfaces are always rinsed with ethanol before the SAM
preparation. Standard alkanethiols can easily remove the surface contaminants such as
oils, other metals and polymers like polydimethylsiloxane. In this work, freshly prepared
gold surfaces have been used for monolayer formation.
2.3. Preparation of SAMs A typical protocol is described for preparing self-assembled monolayers. Fresh gold
substrates are immersed in to a solution of the appropriate thiol for a period of several
hours to few days. This general protocol is appropriate for most of the thiols, but some
compounds require modifications to the protocol to obtain well ordered SAMs. The most
common solvent is ethanol. Other solvents such as water, dichloromethane, chloroform
and hexane can also be used. Diluted solutions of thiols (mM to μM) are generally used.
The gold substrates were removed from the solution after the incubation time and rinsed
thoroughly with the solvent to remove physisorbed overlayers. Finally, the substrates
were dried in a stream of nitrogen gas. Glass bottles are used and only one sample is
prepared from a bottle in order to prevent substrates from covering or scratching each
other’s surfaces. The labwares used in SAM preparation should be free from
contaminations. The apparatuses to be cleaned are immersed in a base bath [1 kg of KOH
in 15 litres of H2O and 10 litres of isopropanol] for 24 h followed by the immersion in an
acid bath [0.5% HNO3 in 25 litres of H2O] for 24 h. Between the immersion steps
thorough rinsing with water followed by ethanol is performed. Finally, the equipments
are stored in an oven at 60 °C.
2.4. Deposition of Cp(allyl)Pd on SAMs The palladium precursor, [(�3-allyl)Pd(�5-Cp)] was prepared according to the previously
reported procedures and stored at low (-10 °C) temperatures in an inert gas atmosphere
[122]. A schlenk flask has been used for the metal deposition experiment (Fig. 9). The
SAMs were exposed to the precursor (~ 7 - 10 mg) in an Ar atmosphere. The exposure
time was varied between 1 and 24 hours. For the reduction experiments, hydrogen gas

27
has been used. In all the experiments performed, the precursor sublimes without
decomposition.
SAM on Au(111) PrecursorSAM on Au(111) Precursor Figure 9: Schlenk apparatus used for metal deposition.
2.5. Spectroscopic methods used in this work The main surface science techniques employed in this work are infrared reflection
absorption spectroscopy, X-ray photoelectron spectroscopy and near edge X-ray
absorption fine structure spectroscopy. The principles underlying the operation of the
experimental tools are explained. Beside these methods other techniques, namely,
secondary electron microscopy and atomic force microscopy are also used.
2.5.1. X-ray Photoelectron Spectroscopy
Electron spectroscopy is a powerful technique for surface characterization because the
mean free path of electrons in solids is very short and all the signals given by this
technique can give information about the surface [147]. Electron spectroscopic methods
include photoelectron spectroscopy (PES), auger electron spectroscopy (AES), electron
energy loss spectroscopy (EELS) and inelastic electron tunneling spectroscopy (IETS)
[148]. Photoelectron spectroscopy is a technique which frequently involves the
measurement of the kinetic energy of electrons photoionized from a probe of interest by a
monoenergetic photon beam. A photoelectron spectrum is a plot of the number of
electrons emitted versus their kinetic energy. PES has been divided into two areas,

28
depending on the energy of the photon beam used. X-ray photoelectron spectroscopy
(XPS) uses a relatively high energy photon source and involves the ionization of core
electrons. Ultraviolet photoelectron spectroscopy (UPS) uses low energy sources and
involves ionization of valence electrons. Al K� (1486.6 eV) and Mg K� (1253.6 eV) are
the widely used photon sources for XPS. The UPS source is usually the He I and He II
lines at 21.22 eV and 40.80 eV respectively. XPS gives information about non-interacting
core electrons and UPS gives information about chemical bonding valence electrons.
XPS was developed by K.Siegbahn and he was awarded the Nobel Prize for Physics in
1981. The phenomenon is based on the photoelectric effect outlined by Einstein in 1905.
XPS, also called electron spectroscopy for chemical analysis (ESCA), works by
irradiating a sample material with monoenergetic soft X-rays causing electrons to be
ejected ( M h M e� � � � ). Identification of the elements in the sample can be made
directly from the kinetic energies of these ejected photoelectrons. The relative
concentrations of elements can be determined from the photoelectron intensities.
The relationship governing the interaction of a photon with a core level is
KE h BE� � where, KE = Kinetic Energy of ejected photoelectron; h� =
characteristic energy of the X-ray photon; BE = Binding Energy of the atomic orbital
from which the electron originates and � = spectrometer work function. The X-ray
induced electron emission is illustrated in Figure 10.

29
Figure 10: X-ray induced electron emission process.
XPS is not sensitive to hydrogen and helium (H and He have no core electrons) but can
detect all other elements. The XPS technique is surface specific due to the short range of
the photoelectrons that are excited from the solid. The energy of the photoelectrons
leaving the sample is determined using a concentric hemispherical analyzer and this gives
a spectrum with a series of photoelectron peaks. The binding energy of the peaks is
characteristic of each element. The peak areas can be used to determine the composition
of the materials on the surface. The shape of each peak and binding energy can be
slightly altered by the chemical state of the emitting atom. Hence, XPS can provide
chemical bonding information as well. XPS is the most common technique for the
characterization of the chemical composition of surfaces [149-153].
XPS is a widely used experimental tool for the characterization of the molecular structure
of organic films [154]. XPS has been used to characterize the film-substrate bonding. The
terminal groups at the SAM/vacuum interface can be differentiated from the groups lying
on the SAM/gold substrate interface by angular dependent XPS. The typical XPS survey
spectra of BPDMAc-1 SAM on Au(111) is displayed in Figure 11.

30
800 700 600 500 400 300 200 100 0
0
30000
60000
90000
S 2p
Au 4f
Au 4d
Au 4s
Au 4p Inte
nsity
(Cps
)
Binding Energy (eV)
C 1s
Figure 11: XP spectra of BPDMAc-1 SAM on Au(111).
The peaks corresponding to the gold substrate can be easily identified. The elements like
carbon, oxygen and sulphur present in the SAM molecule can also be observed. The
assignment of the photoelectron lines (binding energies, BE) to the corresponding species
is given in Table 2.
Table 2: Assignment of the photoelectron lines.
BE (eV) Assignment BE (eV) Assignment763 Au 4s 165 S 2p1/2 643 Au 4p1/2 164 S 2p3/2 547 Au 4p3/2 110 Au 5s 532 O 1s 88 Au 4f5/2 353 Au 4d3/2 84 Au 4f7/2 335 Au 4d5/2 74 Au 5p1/2 285 C 1s 57 Au 5p3/2
XPS can be used to determine the thickness of the self-assembled monolayers. The
intensities of C 1s and Au 4f7/2 lines have been used to estimate the thickness of the
monolayers. A SAM of known thickness is used as a reference system. The film
thickness is given by the following equation where dreference is the thickness of a known
SAM and dsample is the thickness of the SAM under investigation.
31
� �
� �
sample reference
C1sC AuAu 4f
C1s sample referenceAu 4f
Au C
d d1 exp expI (sample)II d d(reference) exp 1 expI
� � � �� � � �� �� �� � � � � � � �
� � � �� �� � � �
(5)
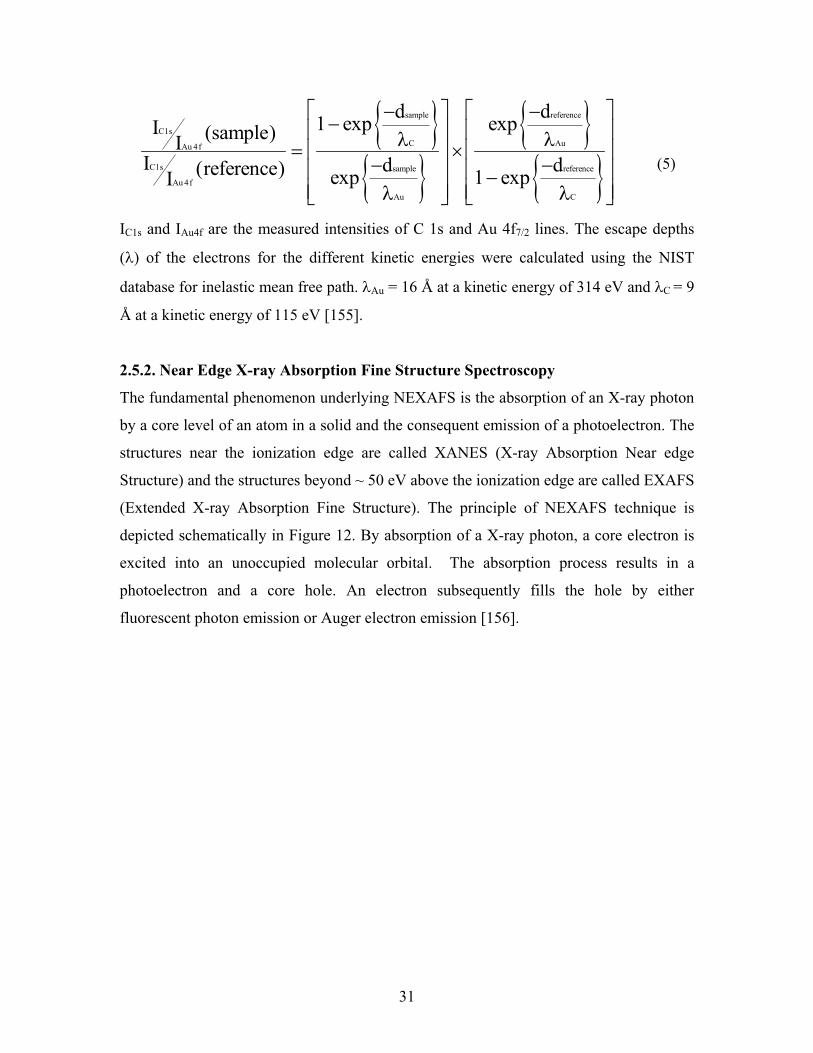
IC1s and IAu4f are the measured intensities of C 1s and Au 4f7/2 lines. The escape depths
(�) of the electrons for the different kinetic energies were calculated using the NIST
database for inelastic mean free path. �Au = 16 Å at a kinetic energy of 314 eV and �C = 9
Å at a kinetic energy of 115 eV [155].
2.5.2. Near Edge X-ray Absorption Fine Structure Spectroscopy
The fundamental phenomenon underlying NEXAFS is the absorption of an X-ray photon
by a core level of an atom in a solid and the consequent emission of a photoelectron. The
structures near the ionization edge are called XANES (X-ray Absorption Near edge
Structure) and the structures beyond ~ 50 eV above the ionization edge are called EXAFS
(Extended X-ray Absorption Fine Structure). The principle of NEXAFS technique is
depicted schematically in Figure 12. By absorption of a X-ray photon, a core electron is
excited into an unoccupied molecular orbital. The absorption process results in a
photoelectron and a core hole. An electron subsequently fills the hole by either
fluorescent photon emission or Auger electron emission [156].

32
Figure 12: Principle of NEXAFS.
NEXAFS has particular application to chemisorbed molecules on surfaces [157, 158].
Information concerning the orientation of the molecule can be inferred from the
polarization dependence [159, 160]. The information on molecular orientation can be
derived from the experimental data. The intensity of the �* resonance (I) can be
monitored as a function of the X-ray incidence angle (�). The resulting dependence can
be evaluated according to the following equation, where A is a constant, P is a
polarization factor of the X-rays, and � is the average tilt angle of the molecular orbital.
� �� � � � �2 2 2P 1 1I( , ) = A 1+ 3cos 1 3cos 1 1 P sin3 2 2� �� � � � � �� � (6)
NEXAFS spectra are frequently dominated by intra-molecular resonances of � or �
symmetry. The energy, intensity and polarization dependence of these resonances can be

33
used to determine the orientation and intra molecular bond lengths of the molecule on the
surface. Figure 13 displays the NEXAFS spectra of dodecanethiol SAM and TPDMT
SAM. The NEXAFS data for the alkanethiol (C12SH) SAM is dominated by the R*
resonance at 288 eV [161] and the spectra for the aromatic thiol (TPDMT) SAM is
dominated by the intense �* resonance of the phenyl rings at 285 eV and 289 eV. Several
broad �* resonances at higher photon energies are observed for both the thiols.
285
289
288
280 285 290 295 300 305 310 315
0
1
2
3
Solid line - TPDMTDashed line - C12SH
Photon Energy (eV)
Nor
mal
ized
PEY
Figure 13: NEXAFS spectra for C12SH [161] and terphenyldimethyldithiol (TPDMT)
SAMs on gold surface.
NEXAFS can be recorded in different ways which include fluorescent yield (FY), partial
electron yield (PEY), total electron yield (TEY) and Auger electron yield (AEY) [162].
The FY detection requires an appropriate fluorescence detector. The electrons that
emerge from the outermost surface region are detected PEY method. PEY detection is
advantageous over TEY method, where all electrons that emerge from the surface are
detected. In AEY detection method only elastically scattered Auger electrons are
recorded.

34
2.5.3. Infrared Reflection Absorption Spectroscopy
The molecules vibrate and such vibrations can be observed by irradiating the molecules
with infrared light. Different functional groups in a molecule will adsorb IR photons with
specific energies, allowing IR to be used for functional group analysis. The infrared
spectrum is generally acquired using the FTIR technique [163]. Vibrations of molecules
on surfaces can also be investigated by using other methods like electron energy loss
spectroscopy (EELS), surface enhanced Raman spectroscopy (SERS) and surface
electromagnetic wave spectroscopy (SEW). A polyatomic molecule with n atoms has 3n
degrees of freedom. The internal degrees of freedom correspond to normal modes of
vibration. There are 3n-6 modes of vibration for non-linear molecules and 3n-5 modes of
vibration for linear molecules. The vibration of a simple diatomic molecule can be
described in terms of simple harmonic motion. This assumes that the chemical bond
joining the two atoms with atomic masses m1 and m2 acts like a Hooke’s law spring, with
a force constant (k). The vibration frequency () is given by:
1 k2
�� �
and the reduced mass (�) is defined by 1 2
1 2
m mm m
�� �
�.
The vibrational energy levels are given by Ev = (v + ½) h with v = 0, 1, 2,… where v is
the vibrational quantum number. The selection rule for a vibrational transition in the
simple harmonic oscillator is v 1� � � . In practice, the molecule does not always behave
like a simple harmonic oscillator and an anharmonicity results. Because of anharmonicity
the transitions corresponding to v 2� � � , �3, etc., are also observed in the IR spectra.
These are called overtones. The fundamental vibrational frequency (v = 0 to v = 1) is
highly intense and the overtones are of low intensity. The vibration may result in the
stretching and bending of the bonds. The various vibrational modes of H2O and CO2
molecules are shown in Figure 14.

35
Figure 14: Vibrational modes of H2O and CO2.
A molecule is infrared active only if the dipole moment of the molecule changes during
the vibration. IR spectroscopy is also possible on a surface, where the IR beam can be
either reflected off (IRRAS) or introduced via a crystal to give multiple reflections on the
back of a thin metal substrate (attenuated total reflection). The same principal (change in
the dipole moment) as IR in bulk, gas or liquid apply on surfaces. Additionally, the
vibrations which are perpendicular to the surface can only be detected [164]. The
requirements for RAIRS are (a) p-polarized radiation, (b) grazing angles of incidence and
(c) transition dipole arranged along surface normal [165-169]. The oscillating electric
vector of the p-polarized radiation is parallel to the plane of incidence and for the s-
polarized radiation; the electric vector is perpendicular to the plane of incidence. The s-
polarized light is canceled by reflection as it experiences a phase change of 180. The
reflection coefficient for metals is one. The resultant electric field parallel to the surface
is zero (Fig. 15). The p-polarized light is almost doubled by reflection. Only the
vibrations with component dynamic dipole moment aligned perpendicular to surface
plane can interact with (p-polarized) incident light.

36
Surface
E�p
E�s
Ep Es
Plane of incidence
(a)
Ex = 0Ez
-+
+
-
+
-
Ex-+ -
+
Ex will be cancelled outEz will be amplified
Metal Surface
E
Ex
Ez(b)
-180
-90
00 45 90
!
Angle of incidence in degrees
Ph
ase
chan
ge o
n re
flect
ion
in d
egre
es
""
(c)
Surface
E�p
E�s
Ep Es
Plane of incidence
(a)
Ex = 0Ez
-+
+
-
+
-
Ex-+ -
+
Ex will be cancelled outEz will be amplified
Metal Surface
E
Ex
Ez(b)
Ex = 0Ez
-+
+
-
+
-
Ex-+ -
+
Ex will be cancelled outEz will be amplified
Metal Surface
E
Ex
Ez
Ex = 0Ez
-+
+
-
+
-
Ex-+ -
+
Ex will be cancelled outEz will be amplified
Ex = 0Ez
--++
++
--
++
--
Ex-+ -
+Ex-+ -
Ex-+ -
+
Ex will be cancelled outEz will be amplified
Metal Surface
E
Ex
Ez
Metal Surface
E
Ex
Ez
Metal Surface
E
Ex
Ez(b)
-180
-90
00 45 90
!
Angle of incidence in degrees
Ph
ase
chan
ge o
n re
flect
ion
in d
egre
es
""
(c)
-180
-90
00 45 90
!
Angle of incidence in degrees
Ph
ase
chan
ge o
n re
flect
ion
in d
egre
es
""
(c)
Figure 15: (a) Electric vectors of the p- and s-components of radiation incident at a
metal surface. Reflected rays - primed vectors; incident rays-unprimed vectors. (b) The
image-charge effect - parallel dipole (EX) cancellation and perpendicular dipole (EZ)
enhancement. (c) Phase shift for light reflected from surface.
Adapted from reference [168].

37
Figure 16 displays an example for IRRAS of SAMs. The high frequency region (3000
cm-1 to 2800 cm-1) and the low frequency region (2500 cm-1 to 900 cm-1) of decanethiol
SAM on Au substrate are shown in Figure 16. The bands observed at 1382 cm-1 and 1461
cm-1 corresponds to the -CH3 and -CH2 symmetric bending vibration respectively. The -
CH2 symmetric and asymmetric stretching vibrations are observed at 2851 cm-1 and 2921
cm-1 respectively. The -CH3 symmetric and asymmetric stretching vibrations are
observed at 2879 cm-1 and 2966 cm-1 respectively. The negative bands at 2088 cm-1 and
2193 cm-1 correspond to the symmetric and asymmetric stretching of -CD2 (from
perdeuterated docosanethiol) respectively. The band at around 2360 cm-1 corresponds to
CO2 in the sample compartment of the IR spectrometer.
1382
1461
3000 2950 2900 2850 2800
2851
2879
2921
2937
2966
0.002
0.0002
Abs
orba
nce
2400 2200 2000 1800 1600 1400 1200 1000
2339
2361
2074
2088
219322
20
SAM of decanethiol
Wavenumber (cm-1) Figure 16: IRRAS of decanethiol SAM.

38
2.6. Analytical equipment The techniques, XPS, NEXAFS, IRRAS, and SEM were used to characterize the
monolayer films. SEM data were obtained using a LEO 1530 Gemini scanning
microscope. The XPS experiments were performed in two different UHV systems. The
multichamber UHV apparatus located in Bochum was equipped with a modified Leybold
XPS system, an EA11 hemispherical electron energy analyzer, and an Omicron LEED
system. The base pressure of the apparatus was below 1 x 10⁻¹⁰ mbar. X-ray
photoelectron spectra were acquired using a aluminum K� (h = 1486.6 eV) source. The
overview spectra were acquired at pass energy of 199.95 eV and the C 1s, O 1s, S 2p, Pd
3d and Au 4f narrow scan spectra were collected at pass energy of 46.14 eV.
The NEXAFS and some of the XPS measurements were performed in an UHV-system
operated at the HE-SGM beamline of the synchrotron facility BESSY II in Berlin. The
UHV-system consists of a loadlock, a preparation chamber, and an analysis chamber. The
base pressure of the analysis chamber of the UHV-system at BESSY was below 1 x 10⁻¹⁰
mbar. It was equipped with a LEED-optics (Vacuum Generators), a quadrapole mass
spectrometer (Balzer), an ion sputter gun, an Al/Mg twin anode X-ray source (VG), an
energy analyzer (Clam2, VG), and a homemade electron detector based on a double
channel plate (Galileo). The XPS data were acquired at photon energies of 280.0 eV,
400.0 eV and 480.0 eV for the S 2p, C 1s and Pd 3d regions, respectively. The energy
scale of the XPS data was referenced to the Au 4f7/2 peak at 84.0 eV. The XPS data were
fitted using the PeakFit software (Gaussian). The S 2p3/2, 1/2 doublet was fitted using two
peaks with the same full width at half-maximum (FWHM), with a separation fixed at
1.18 eV and a relative ratio of 2. The Pd 3d5/2, 3/2 doublet has been fixed at a separation of
5.3 eV. The same fit parameters were used for identical spectral regions.
The NEXAFS spectra were recorded at the carbon K-edge in the partial electron yield
mode with a retarding voltage of -150 V. The partial electron yield mode was chosen for
its surface sensitivity. The NEXAFS spectra for a particular sample were obtained at
three different angles, 30° (E-vector near surface normal), 55° (Magic angle) and 90° (E-

39
vector in surface plane). Simultaneously with each NEXAFS spectrum, the photocurrent
of a carbon contaminated gold-grid was recorded.
The raw NEXAFS data has to be processed [170, 171]. Normalization of the intensities to
a common scale helps quantitative comparison between different spectra. The substrate
signal is intense in the X-ray absorption spectra of monolayer films with thickness below
10 Å [170]. The following procedure is used in order to separate the adsorbate signal
from the substrate contribution.
In the first step, the raw NEXAFS spectra were normalized to the incident photon flux by
division through a reference spectrum of a clean gold sample recorded at the C K-edge.
This process is performed in order to eliminate the effect of incident beam intensity
fluctuations and monochromator absorption features. Gold has no absorption features in
the operational energy region (Fig. 17). Such a reference spectrum can be considered as a
direct measurement of the number of photons hitting the sample.
280 290 300 310 320
0.50.6
0.7
0.80.9
Ele
ctro
n Y
ield Au transmission
Photon Energy (eV)
Figure 17: Carbon K-edge NEXAFS spectrum of a clean gold substrate as reference.
In the next step, the pre-edge signal at 275 eV is normalized to zero (by subtraction) and
the edge jump at 315 eV is normalized to unity (by division). Finally, the pre-edge and
post-edge signals will be at 0 and 1, respectively (Fig. 18).
For the energy calibration, the spectra were referenced to a characteristic peak at 284.9
eV in the photocurrent spectra of the carbon contaminated gold-grid. The position of this

40
peak was calibrated against the strong �*-resonance of HOPG (highly oriented pyrolitic
graphite) which is located at 285.38 eV.
284.35
270 280 290 300 310 320
0
1
2
3
4
Raw data
C contaminated Au-grid
Ele
ctro
n Y
ield
Photon Energy (eV)270 280 290 300 310 320
0
1
2
3
4
5
Pre-edge normalization
Edge jump normalization
Photon Energy (eV) Figure 18: NEXAFS data treatment.
IRRAS spectra were recorded using a Bio-Rad Excalibur FTS-300 Fourier transform
infrared spectrometer equipped with a grazing incidence reflection unit (Biorad Uniflex)
and a narrow band MCT detector. All spectra were recorded with 2 cm-1 resolution at an
angle of incidence of 80° relative to the surface normal. The baseline correction was done
using the commercial software package. The spectra are presented in absorbance units
which is equal to log(I0/I) where I0 is the intensity of the reference sample and I is the
intensity of the sample under investigation. According to the Lambert-Beer law, the band
intensities are proportional to the concentration and layer thickness.
The two detectors in the spectrometer are MCT and DTGS. The IR spectra for
monolayers are recorded with a liquid nitrogen cooled MCT detector and the spectra for
bulk samples are measured with DTGS detector. The IR spectrometer was purged by dry
air delivered from a commercial purge gas generator. Purging was done to remove the
H2O and CO2 present inside the IR chamber [172]. A perdeuterated docosanethiolate film
on Au was used as a reference sample.
41
3. Self-assembled monolayers of thiol terminated surfaces
This chapter presents the preparation and characterization of thiol-terminated self-
assembled monolayers of oligophenyl dithiols on Au(111). IRRAS, XPS, NEXAFS and
contact angle techniques were used for characterization.
3.1. Self-assembled monolayers of terphenyldimethyldithiol Terphenyldimethyldithiol (TPDMT) belongs to the class of oligophenyldithiols and has a
long aromatic backbone (terphenyl unit). The rigid molecular backbone along with the
methylene (CH2) linkage between the thiol group and terphenyl unit lead to the formation
of highly oriented films on gold substrate. The molecular orientation for the terphenyl
backbone of TPDMT is upright but structural and conformational changes have been
observed upon metal evaporation [89] and on heating the SAM [173]. TPDMT was
synthesized from 4,4��-bis(bromomethyl)-p-terphenyl as previously reported [174]. The
dibromide was converted to dithiol by treatment with an excess of thiourea in ethanol
under reflux and subsequent alkaline hydrolysis in boiling water.
3.1.1. Preparation of TPDMT SAM
Self-assembled monolayers of TPDMT were prepared by immersion of the gold
substrates into a 50 M solution of the aromatic thiol in chloroform at room temperature
[7]. After 1 day of immersion, the sample was thoroughly rinsed with pure chloroform
and dried in a stream of nitrogen. TPDMT is completely soluble in chloroform.
3.1.2. Characterization of TPDMT SAM
(a) Infrared reflection absorption spectroscopy
In Figure 19, the low frequency (1850 cm-1 to 900 cm-1) region of the calculated IR, the
pellet IR and the SAM spectrum of TPDMT are shown (more experimental details can be
found in Section 2.6). For the TPDMT SAM, the in plane parallel bands are located at
1004 cm-1 and 1492 cm-1. Comparison of the SAM spectra with the bulk IR data of
TPDMT reveals the upright orientation of the terphenyl units. The modes with a
transition dipole moment (TDM) oriented parallel to the ring plane and the molecular

42
axis of phenyl unit are present whereas the modes with a TDM oriented perpendicularly
to the ring plane and the molecular axis of the phenyl unit, are absent [174].
1800 1600 1400 1200 1000
1800 1600 1400 1200 1000
1004
1492
100111071396
1481
1595
10011088
1243
1378
1482
1587
1800 1600 1400 1200 1000
(c) TPDMT - SAMA
bsor
banc
e
Wavenumber (cm-1)
0.001
0.4(b) TPDMT - Bulk
0.4(a) TPDMT - Calc.
Figure 19: Low-frequency regions of (a) the calculated spectrum of TPDMT (b) the bulk
spectrum of TPDMT and (c) the SAM spectrum of TPDMT.
The vibrational frequencies have been computed using commercial program package
(Gaussian 98, DFT calculations using the B3LYP-functional) and scaled by a factor of
0.9617. This normalization factor was deduced by comparing the theoretical and
experimental value for the in plane parallel band [Experimental value/Theoretical value =
1481 cm-1/1540 cm-1 = 0.9617].

43
Search for SH stretching mode in IRRAS of TPDMT SAM:
Self-assembled monolayer of TPDMT is SH terminated and the presence of free SH
group is confirmed by IRRAS. The detection of SH in a SAM has difficulties including
oxidation processes and hydrogen bonding with water molecules. The SH signal is broad
and weak [175]. This broadness arises because there are many species apart from the SH
stretching. Perfect SAM background and an environment with less water are needed in
order to observe this peak. Thiols undergoing hydrogen-bonding interactions can shift
their stretching vibration to significantly lower frequencies. This is consistent with the
studies by Long et al, which reported a value of 2412 cm-1 to an induced SH stretching
vibration from associated water at the sulphur atom [176]. The IRRAS experiments in the
following section were carried out in ultra high vacuum (UHV) using Vertex 80v FTIR
spectrometer from Bruker. Molecules like water, carbon dioxide and other hydrocarbons
from ambient can be easily adsorbed on reactive surfaces (like SH terminated SAMs). In
UHV conditions because of the absence of these adsorbates the SH vibrational band can
be observed.
The SH stretching vibrational band is generally observed in the region between 2600 cm-1
and 2500 cm-1 [175]. In Figure 20, the pellet IR of terphenyldimethyldithiol is compared
with terphenyldimethylthiol. The peak at 2555 cm-1 corresponds to the SH stretch of the
thiol functionality of the terphenyldimethyldithiol molecule (Fig. 20a). In the case of
terphenyldimethylthiol, two bands are observed at 2562 cm-1 and 2602 cm-1. The band at
2562 cm-1 is assigned to the SH stretching mode and the peak at around 2602 cm-1 could
be assigned to SH groups bound with molecules from the atmosphere. Intensities of the in
plane parallel band located at 1492 cm-1 is compared with the SH stretching band. In
TPDMT, the intensity of SH band is about 20 times smaller than the in plane parallel
band. In TPMT, the intensity of SH band is about 40 times smaller than the main peak.
The intensity ratios are consistent with the presence of two SH groups in TPDMT and
one SH group in TPMT.
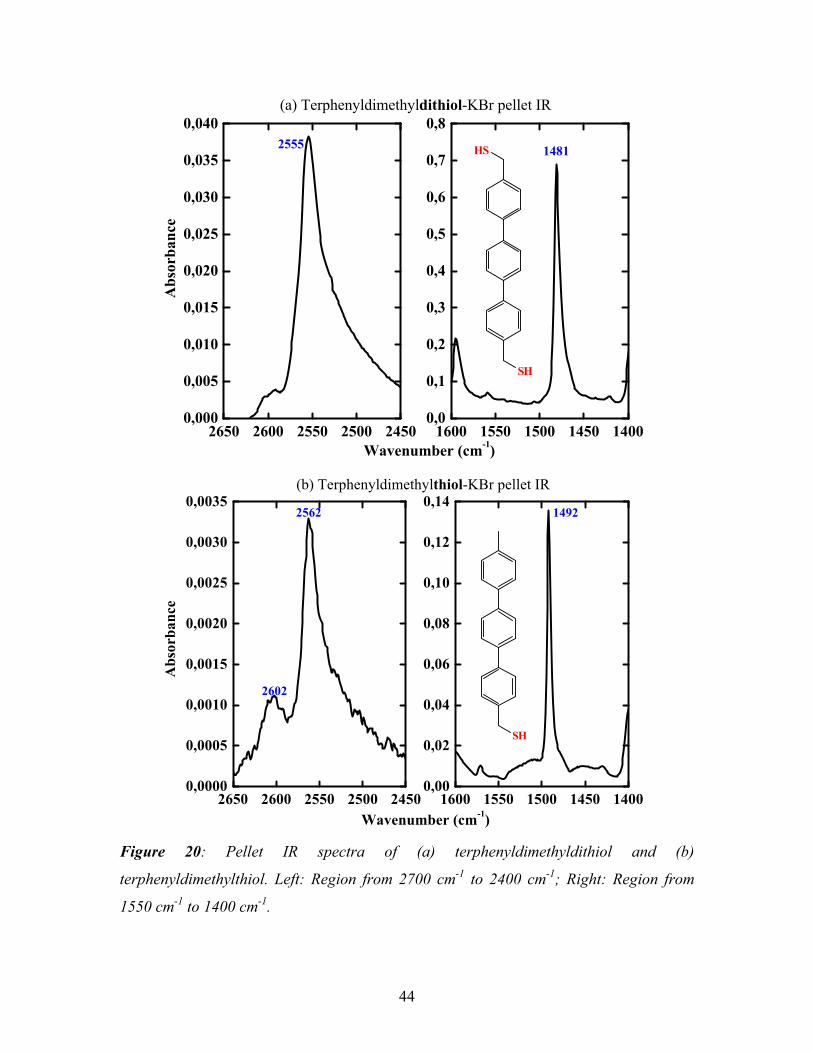
44
14812555
1600 1550 1500 1450 14000,0
0,1
0,2
0,3
0,4
0,5
0,6
0,7
0,8
Wavenumber (cm-1)2650 2600 2550 2500 2450
0,000
0,005
0,010
0,015
0,020
0,025
0,030
0,035
0,040
HS
SH
(a) Terphenyldimethyldithiol-KBr pellet IR
Abs
orba
nce
14922562
2602
1600 1550 1500 1450 14000,00
0,02
0,04
0,06
0,08
0,10
0,12
0,14
Wavenumber (cm-1)2650 2600 2550 2500 2450
0,0000
0,0005
0,0010
0,0015
0,0020
0,0025
0,0030
0,0035
SH
(b) Terphenyldimethylthiol-KBr pellet IR
Abs
orba
nce
Figure 20: Pellet IR spectra of (a) terphenyldimethyldithiol and (b)
terphenyldimethylthiol. Left: Region from 2700 cm-1 to 2400 cm-1; Right: Region from
1550 cm-1 to 1400 cm-1.
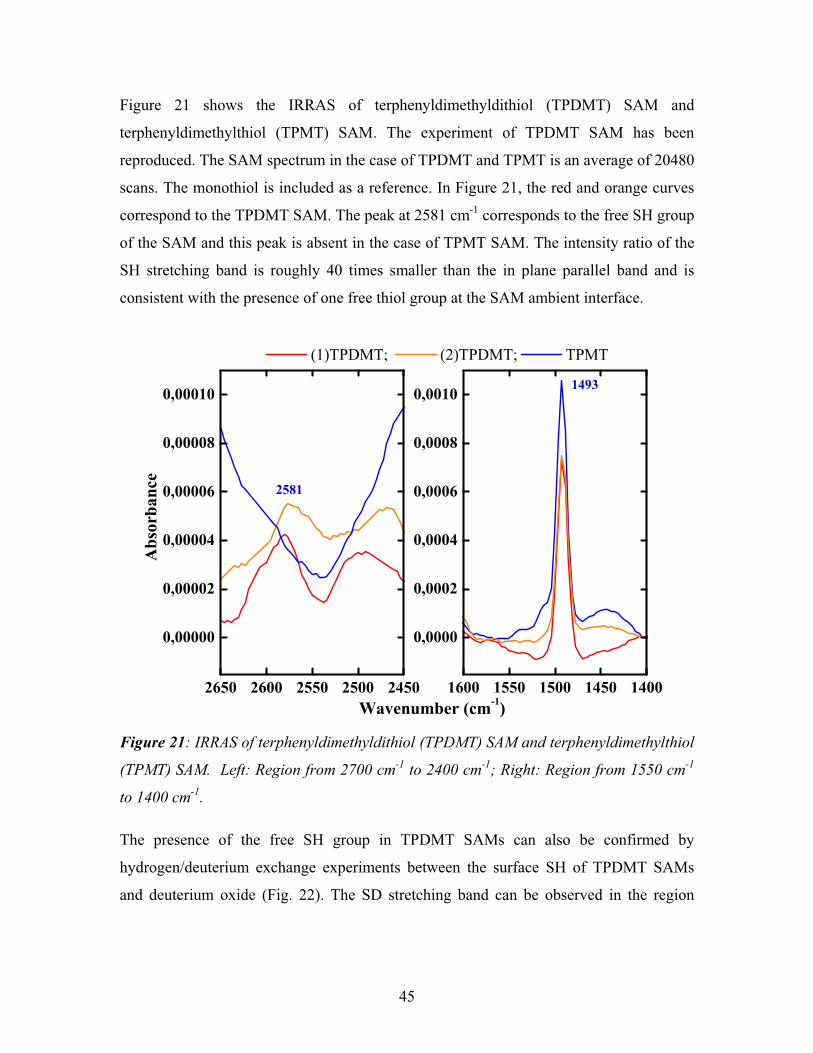
45
Figure 21 shows the IRRAS of terphenyldimethyldithiol (TPDMT) SAM and
terphenyldimethylthiol (TPMT) SAM. The experiment of TPDMT SAM has been
reproduced. The SAM spectrum in the case of TPDMT and TPMT is an average of 20480
scans. The monothiol is included as a reference. In Figure 21, the red and orange curves
correspond to the TPDMT SAM. The peak at 2581 cm-1 corresponds to the free SH group
of the SAM and this peak is absent in the case of TPMT SAM. The intensity ratio of the
SH stretching band is roughly 40 times smaller than the in plane parallel band and is
consistent with the presence of one free thiol group at the SAM ambient interface.
2581
1493
2650 2600 2550 2500 2450
0,00000
0,00002
0,00004
0,00006
0,00008
0,00010
Wavenumber (cm-1)
Abs
orba
nce
1600 1550 1500 1450 1400
0,0000
0,0002
0,0004
0,0006
0,0008
0,0010
(1)TPDMT; (2)TPDMT; TPMT
Figure 21: IRRAS of terphenyldimethyldithiol (TPDMT) SAM and terphenyldimethylthiol
(TPMT) SAM. Left: Region from 2700 cm-1 to 2400 cm-1; Right: Region from 1550 cm-1
to 1400 cm-1.
The presence of the free SH group in TPDMT SAMs can also be confirmed by
hydrogen/deuterium exchange experiments between the surface SH of TPDMT SAMs
and deuterium oxide (Fig. 22). The SD stretching band can be observed in the region

46
between 1800 cm-1 and 1900 cm-1. Future experiments involving H/D exchange process
will provide more evidence for the presence of free SH in TPDMT SAM.
Figure 22: Schematic diagram showing the H/D exchange between TPDMT-SAM and
D2O.
(b) X-ray photoelectron spectroscopy
C 1s and S 2p XP spectra of TPDMT SAM are presented in Figure 23. The spectra were
acquired at photon energies of 400 eV (C 1s) and 280 eV (S 2p). The C 1s spectra reveal
a main peak at 284.6 eV and a shoulder at slightly higher binding energies (286.2 eV).
The main peak is assigned to the aromatic TPDMT backbone. In accordance with
previous work the shoulder is assigned to the shake-up processes [174]. The S 2p XPS
data exhibits two doublets at 162.0 eV and 163.2 eV (Fig. 23b). In accordance with
previous work [174], these peaks are assigned to Au-thiolate (-SAu) and to thiol sulphur
species (-SH) exposed at the vacuum side of the SAM. A S 2p3/2 signal centered at 167.3
eV is observed for the TPDMT SAM and this peak is assigned to oxidized sulphur
species. The experimental details and the description of the fit parameters are discussed
in Section 2.6.
Table 3: C 1s and S 2p peak fit data of TPDMT SAM.
BE in eV (total area %) Assignment Colour Carbon 1s (FWHM � 1.3)
284.6 (95.7) Aromatic backbone Black 286.2 (4.3) Shake up process Blue
Sulphur 2p 3/2 (FWHM � 1.1) 161.96 (7.8) S-Au Red
163.20 (80.1) S-H Blue 167.30 (12.1) Oxidized sulphur Gray

47
292 290 288 286 284 282 2800
10000
20000
30000 (a) C 1s XPS region
Inte
nsity
(Cps
)
Binding Energy (eV)
172 170 168 166 164 162 160 1580
400
800
1200
1600(b) S 2p XPS region
Inte
nsity
(Cps
)
Binding Energy (eV)
Expt.Fitted161.96163.20167.30
Figure 23: C 1s and S 2p - XPS of TPDMT SAM.
(c) Near edge X-ray absorption spectroscopy
Figure 24 shows C 1s NEXAFS data recorded for a TPDMT SAM on gold substrate
acquired at different incidence angles of the light with respect to the surface (30°, 55° and
90°). The spectra are dominated by the intense �*-resonance of the phenyl rings at 285.0
eV, another �*-resonance at 289.0 eV and several broad #*-resonances at higher photon
energies. The NEXAFS spectra reveal a pronounced dichroism which suggest a high
degree of orientational order. The difference between the spectra collected at incidence
angles 90° and 30° is also shown in Figure 24. This difference spectrum also highlights
the dichroism. The intensity of the peaks in difference spectrum is the fingerprint of the
molecular orientation.

48
280 285 290 295 300 305 310 315
0
2
4
6
8
10
90° - 30°
Photon Energy (eV)
Nor
mal
ized
PE
YTPDMT
90°
55°
30°
Figure 24: NEXAFS spectra of TPDMT SAM
(d) Contact angle measurements
The water contact angle is 78° for TPDMT SAM on gold. The values are in accordance
with the literature [174]. Low solid-liquid contact angles were observed for hydrophilic
terminated SAMs (e.g., hydroxyl and carboxylic acid) whereas higher contact angles
were observed for more hydrophobic surfaces (e.g., methyl). The contact angle value of
TPDMT SAM is relatively high when compared to acid and alcohol terminated SAMs
and less than the methyl terminated SAMs. The thiol terminated surface can form
hydrogen bonding with water like the -OH terminated SAMs but the high contact angle is
related to the high quality of SAMs.

49
3.2. Self-assembled monolayers of biphenyldimethyldithiol Biphenyldithiol and biphenyldimethyldithiol (BPDMT) has been studied in connection to
molecular electronic devices. However, these molecules do not form well oriented
monolayers. Earlier studies from our group show that they form oligomers with the
biphenyl units linked together by disulphide bond [7]. Due to the presence of disulphide
species the films formed from these molecules are sensitive to oxidation. The straight
forward approach of preparing the BPDMT SAMs leads to disordered monolayers. High
quality monolayers of BPDMT can be prepared by using the monoacetylated derivative
of BPDMT. After SAM formation, the protective thioester group can be deprotected by
using a base. The SAM formed by deprotection method will be mentioned by the term
deprotected BPDMAc-1. The resulting deprotected BPDMAc-1 SAM will be
biphenyldimethyldithiol self-assembled monolayers. BPDMAc-1 (monoacetylated) was
obtained by treating BPDMT with acetyl chloride [9].
3.2.1. Preparation of deprotected BPDMAc-1 SAM
Self-assembled monolayer of BPDMAc-1 was prepared by immersing the gold substrates
into a 50 �M BPDMAc-1 solution in dichloromethane (DCM) at room temperature (RT).
After 4 hours of immersion, the sample was thoroughly rinsed with the solvent (DCM)
and dried in a stream of nitrogen. After formation of the organothiolate adlayer, the
protecting group can be removed by immersion into NaOH solution. The BPDMAc-1
gold SAM was immersed into a 0.01 M NaOH solution in (1:1) ethanol + water mixture
for 3.5 days (~ 84 hours) at room temperature. After removal of the sample from the
solution, it was thoroughly rinsed with ethanol and then dried in a stream of nitrogen.
3.2.2. Characterization of deprotected BPDMAc-1 SAM
(a) Infrared reflection absorption spectroscopy
In Figure 25, the low frequency (1850 cm-1 to 900 cm-1) region of the calculated IR, the
pellet IR and the SAM spectrum of BPDMAc-1 SAM are displayed. The calculated IR
and the SAM spectrum of deprotected BPDMAc-1 are also included in Figure 25. For the
deprotected BPDMAc-1 SAM, the in plane parallel bands are located at 1006 cm-1 and

50
1497 cm-1. The respective spectra of TPDMT look very similar. The band at 1605 cm-1 is
also observed in the BPDMT SAM prepared directly from the corresponding solution.
1800 1600 1400 1200 1000
1006
1497
1605
10051094
1251
1393
1497
1599
1800 1600 1400 1200 1000
(e) deprotected BPDMAc-1 - SAMA
bsor
banc
e
0.0005
Wavenumber (cm-1)
0.4(d) deprotected BPDMAc-1 - Calc.
1800 1600 1400 1200 1000
1800 1600 1400 1200 1000
9591005
1143
13571497
1695
962
100511
40
1261
135313
981497
1699
9621039
1150
130114371549
1694
1800 1600 1400 1200 1000
(c) BPDMAc-1 - SAM
Abs
orba
nce
Wavenumber (cm-1)
0.001
0.4(b) BPDMAc-1 - Bulk
0.4(a) BPDMAc-1 - Calc.
Figure 25: Low-frequency regions of (a) the calculated spectrum of BPDMAc-1 SAM, (b)
the bulk spectrum of BPDMAc-1 SAM, (c) the SAM spectrum of BPDMAc-1 SAM, (d) the
calculated spectrum of deprotected BPDMAc-1 SAM and (e) the SAM spectrum of
deprotected BPDMAc-1.

51
The vibrational frequencies have been computed using commercial program package
(Gaussian 98, DFT calculations using the B3LYP-functional) and scaled by a factor of
0.9677. This normalization factor was deduced by comparing the theoretical and
experimental value for the in plane parallel band [Experimental value/Theoretical value =
1497 cm-1/1547 cm-1 = 0.9677].
(b) X-ray photoelectron spectroscopy
Figure 26 shows the C 1s XPS data. The deprotected BPDMAc-1 SAM shows a peak at
284.5 eV which is assigned to the aromatic biphenyl backbone. S 2p XPS data recorded
for a deprotected BPDMAc-1 SAM is also shown in Figure 26. The peaks at 162.0 eV
and 163.3 eV are assigned to Au-thiolate and to the thiol tail group, respectively.
Oxidation of the organic surface is observed as indicated by the appearance of the peaks
at higher binding energies (168.0 eV, oxidized sulphur species). The details of the fit
parameters are discussed in Section 2.6.
292 290 288 286 284 282 2800
10000
20000 (a) C 1s XPS region
Inte
nsity
(Cps
)
Binding Energy (eV)
172 170 168 166 164 162 160 1580
400
800
1200
1600(b) S 2p XPS region
Inte
nsity
(Cps
)
Binding Energy (eV)
Expt.Fitted161.96 163.35 168.04
Figure 26: XPS of deprotected BPDMAc-1 SAM.

52
Table 4: C 1s and S 2p peak fit data of deprotected BPDMAc-1 SAM.
BE in eV (total area %) Assignment Colour Carbon 1s (FWHM � 1.3)
284.5 (96.0) Aromatic backbone Black 286.3 (4.0) Shake up process Blue
Sulphur 2p3/2 (FWHM � 1.1) 161.96 (18.4) S-Au Red 163.35 (76.0) S-H Blue 168.04 (5.6) Oxidized sulphur Gray
(c) Near edge X-ray absorption spectroscopy
Figure 27 shows C 1s NEXAFS data recorded for a deprotected BPDMAc-1 SAM on
gold substrate acquired at different incidence angles. The spectra are dominated by the
intense �*-resonance of the phenyl rings at 285.0 eV, another �*-resonance at 289.0 eV
and several broad #*-resonances at higher photon energies. The intensities of the
resonances depend on the relative orientation of the corresponding transition dipole
moment relative to the polarization direction of the light. The dichroism is again visible
in the difference spectra shown in Figure 27.
280 285 290 295 300 305 310 315
0
2
4
6
8
10
Nor
mal
ized
PE
Y
Photon Energy (eV)
90°- 30°
30°
55°
90°
Deprotected BPDMAc-1
Figure 27: NEXAFS of deprotected BPDMAc-1 SAM.

53
The monolayer thickness can be estimated from the edge jump in C K-edge NEXAFS.
The change in the edge jump can be used to control the thickness in evaporation
experiments. The edge jump increases with increasing amount of carbon up to saturation.
In Figure 28, the different SAMs, TPDMT, deprotected BPDMAc-1 and BPDMAc-1 are
compared. The gold transmission line is also included. The chemical modification
involves the transformation of -SCOCH3 to -SH. The height of both the deprotected
BPDMAc-1 and BPDMAc-1 should be almost the same. It is clear from the plot that
there is no decrease in the thickness of the BPDMAc-1 thiol film after the treatment with
NaOH solution to remove the acetate group. The thickness estimation clearly shows that
the orientation and the packing density are retained even after the treatment with a strong
base. The edge jump for the TPDMT with three phenyl rings is found to be greater than
deprotected BPDMAc-1 with two phenyl rings.
280 285 290 295 300 305 310 315 320
1
2
3
4
5
6
Deprotected BPDMAc-1
Au transmission
TPDMT
BPDMAc-1
Photon Energy (eV)
Nor
mal
ized
PE
Y
Figure 28: Thickness estimation from the edge jump in C K-edge NEXAFS.

54
3.3. Conclusion The self-assembled monolayers of TPDMT on Au(111) surface were prepared directly
from the TPDMT solution and the SAMs of biphenlydimethyldithiol was fabricated using
a deprotection strategy. A well ordered SAM with a thioester protecting group was
obtained by the self-assembly of BPDMAc-1 which was then deprotected under basic
conditions. This deprotection method yields biphenlydimethyldithiol SAM with high
degree of molecular orientation. The SAMs were characterized with XPS, IRRAS and
NEXAFS. The introduction of aliphatic linker into the aromatic backbone plays an
important role to achieve the high structural quality of the films. The XPS results provide
evidence to the presence of free thiol group at the SAM-ambient interface in both
TPDMT and deprotected BPDMAc-1 SAMs. These free thiol groups are well-suited for
further chemical modifications.

55
4. Deacylation reaction at an organic surface
In this part of the thesis, the kinetics of the reaction involving the conversion of
thioacetate to thiol on an organic surface exposed by a SAM is discussed.
The fabrication of the organic surface exposed by the SAM is attracting an increasing
amount of attention, e.g. in connection with a coupling of biomolecules [177], model
studies regarding biomineralization [178] and to anchor zeolites [179] or metal-organic
frameworks (MOFs) [180-182]. The self-assembled monolayer of thiols adsorbed on
solid substrates offers the possibility to create organic surfaces which can be tailored
easily [28]. The desired organic surface can be obtained by using an appropriately �-
functionalized organothiol and the functional groups at the �-position control the surface
physico-chemical properties. For example, the wettability can be varied smoothly
between hydrophobic and hydrophilic. However, often there are complications resulting
from undesired interactions between either the corresponding functions or the function
and the Au-substrate. The amino, hydroxyl and carboxyl functional groups interact
strongly with themselves via hydrogen bonding. Earlier studies on
mercaptomethylterphenylcarboxylic acid reveal the presence of bilayers in which the first
and the second layers are linked by hydrogen bonds [183]. The formation of monolayers
required the addition of acetic acid. On the other hand, the SAM of
mercaptohexadecanoic acid has significant amount of disorder induced by the hydrogen
bonding between the COOH groups [184]. The interaction of the end functional group
with the gold substrate has been observed in the case of dithiols. In this case, the
formation of disulphide bonds induces the disorder in the SAMs [7]. In order to avoid
such problems, SAMs can be first formed from protected organothiols and a subsequent
deprotection will yield an organic surface with the desired functionality [9].
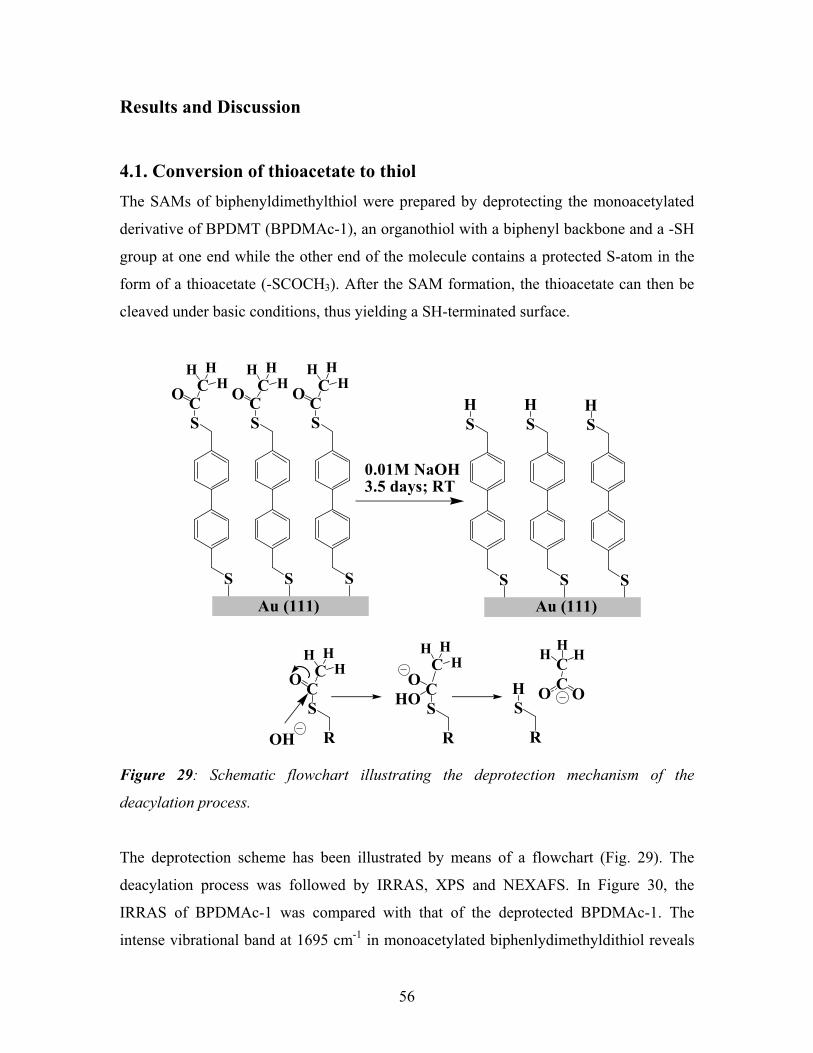
56
Results and Discussion
4.1. Conversion of thioacetate to thiol The SAMs of biphenyldimethylthiol were prepared by deprotecting the monoacetylated
derivative of BPDMT (BPDMAc-1), an organothiol with a biphenyl backbone and a -SH
group at one end while the other end of the molecule contains a protected S-atom in the
form of a thioacetate (-SCOCH3). After the SAM formation, the thioacetate can then be
cleaved under basic conditions, thus yielding a SH-terminated surface.
S
S
HS
S
S
S
H HSCO C
S
SCO C
S
SCO C
S
HH
H HH
H HH
H
Au (111) Au (111)
0.01M NaOH3.5 days; RT
OH
SCO CH
HH
SH
SC
C HH H
C OOO
HO
CH
HH
R R R
Figure 29: Schematic flowchart illustrating the deprotection mechanism of the
deacylation process.
The deprotection scheme has been illustrated by means of a flowchart (Fig. 29). The
deacylation process was followed by IRRAS, XPS and NEXAFS. In Figure 30, the
IRRAS of BPDMAc-1 was compared with that of the deprotected BPDMAc-1. The
intense vibrational band at 1695 cm-1 in monoacetylated biphenlydimethyldithiol reveals

57
the presence of the carbonyl group. Apart from the C=O stretching vibration, two more
bands, 1143 cm-1 and 1357 cm-1 are related to thioester. The bands at 1497 cm-1 and 1005
cm-1 corresponds to the ring modes of the phenyl units. The absence of the C=O
stretching vibration of the acetate group and other bands related to thioester of BPDMAc-
1 indicates the conversion of thioacetate to thiol.
1006
1497
1605
9591005
1143
1357
14971695
1800 1650 1500 1350 1200 1050 900
Dep. BPDMAc-1
Wavenumber (cm-1)
Abs
orba
nce
0.001
BPDMAc-1
Figure 30: IRRAS of BPDMAc-1 and deprotected BPDMAc-1.
In Figure 31a, the NEXAFS spectra recorded at the C 1s edge for gold substrates, which
were immersed into solutions of BPDMAc-1 and also the spectrum recorded for a
BPDMAc-1 monolayer, after deprotection are displayed. The spectra displayed in Figure
31a was recorded at an incidence angle of 55°. The BPDMAc-1 SAM spectrum exhibits
strong resonances at 285.2, 287.4, 289.1 and 293.8 eV. The deprotection procedure was
followed by the disappearance of the �*-resonance of C=O of BPDMAc-1 at 287.4 eV.

58
The NEXAFS results show only changes at the NEXAFS resonance related to the
carbonyl carbon atom, all other resonances remain unchanged upon deacylation. This
suggests that the deacylation process involves only the uppermost part of the thiol
molecules, i.e., the thioester unit of the BPDMAc-1 molecule whereas the
biphenyldimethyl backbone of the thiol molecule is essentially not affected by the
deacylation process. Furthermore, the NEXAFS results indicate a constant tilt angle for
the molecular backbone of 19�5° relative to the surface normal for both acylated and
deacylated molecules.
280 285 290 295 300 305 310 3150
2
4
6C1s NEXAFS
BPDMAc-1 (55°)
Deprotected BPDMAc-1 (55°)Nor
mal
ized
PEY
Photon Energy (eV)
287.4
Figure 31a: NEXAFS spectra of BPDMAc1 and deprotected BPDMAc-1.

59
280 285 290 295 300 305 310 315
0
2
4
6
8
10 BPDMAc-1
90°
55°
30°
90°- 30°
Nor
mal
ized
PE
Y
Photon Energy (eV)Figure 31b: NEXAFS spectrum of BPDMAc1 at different incidence angles.
NEXAFS data of BPDMAc-1 SAM at different angles are displayed along with the
difference spectrum (90°-30°) in Figure 31b. The blue line corresponds to spectrum
recorded at an incidence angle (angle between the E�
vector of the polarized synchrotron
light and the surface normal) of 30°, whereas the black line represents spectrum taken at
normal incidence of the synchrotron light (angle between the E�
vector of the synchrotron
light and the surface normal of 90°). The intensities of the resonances depend on the
relative orientation of the corresponding transition dipole moment relative to the
polarization direction of the light. The NEXAFS spectra of both BPDMAc-1 (Fig 31b)
and the deprotected BPDMAc-1 (Fig. 27) show a pronounced dichroism, which suggests
good orientational order in these SAMs.
The deprotection was also followed by XPS. The main peak at 284.5 eV corresponds to
the aromatic backbone. The peak at higher binding energy 287.6 eV corresponds to the
C=O of BPDMAc-1. The disappearance of the peak at 287.6 eV in the deprotected
BPDMAc-1 clearly indicates the cleavage of the acetate group (Fig. 32).

60
284.4
287.6
292 290 288 286 284 282 280
BPDMAc-1Deprotected BPDMAc-1
Inte
nsity
(Cps
)
Binding Energy (eV)
5000
Figure 32: XP spectra of BPDMAc1 and deprotected BPDMAc-1.
4.2. Chemistry in confined geometries The chemical reactions at the organic surface of the SAM may proceed quite differently
than the corresponding reaction in solution. The deacylation reaction, which is standard
in solution chemistry, is significantly hindered when confined to a surface. Whereas the
reaction in solution proceeds in minutes [59] the corresponding reaction at the organic
surfaces requires, depending on the conditions, up to 84 hours.
The kinetics of reactions on a SAM is influenced by various factors [10]. The structure of
the SAM influences the reactivity on surfaces. The molecules on the surface are subjected
to certain geometric constraints and environmental variations that are not present in the
solution. The nature of the solution at the interface differs significantly from the bulk
solution [185]. The surface can limit the accessibility of interfacial functional groups to
external reagents. Poor reactivities have been observed for functional groups positioned
within highly ordered organic interfaces. Many studies have demonstrated that the rate of
hydrolysis for the terminal ester groups on well-ordered SAMs depends on the density
and orientation [186, 187]. The reactivity of monolayers was inferior to the
corresponding reactions in solution. The reactivity of a surface is also determined by the

61
steric crowding between the reactive sites within the SAM. The reactivity also depends
strongly on the type of reaction. Reactive sites embedded in the SAM can be less
accessible to reactants in the surrounding medium than the ones positioned at the termini
of the SAM [188, 189].
In the course of a systematic investigation of the surface deacylation reaction, it has been
observed that the time needed for a complete conversion showed an unexpected variation
from sample to sample. The samples were prepared from different gold substrates. The
gold substrates differ in the contact time with the ambient. Generally, freshly prepared
gold substrates are used for preparing SAMs. In order to understand the kinetics of the
deacylation reaction aged substrates are also investigated. The freshly prepared Au
substrates are exposed to ambient (lab conditions) for a considerable time and then the
substrates are used for SAM preparation.
The sample 1 was prepared by immersing a freshly evaporated Au(111) into the
BPDMAc-1 solution. In this case, the substrate was in contact with ambient for less than
30 minutes. The sample 2 was prepared by immersing an aged Au substrate (contact with
ambient for about three days) in the thioester solution. IRRAS were recorded for the two
different Au samples. The BPDMAc-1 SAMs prepared from both the Au samples
(sample 1 and 2) were treated with 0.01M sodium hydroxide solution and the IRRAS has
been recorded at different immersion time in the basic solution (Fig. 33).
The IR results show that in case of the sample 1 the thioester group is present after an
immersion time of 12, 24, 48 and 60 hours. The completion of the deacylation process
occurs after an immersion time of 84 hours. In the case of sample 2, the deacylation
process goes to completion after an immersion time of 60 hours. These observations can
be compared to those obtained for sample 3, a deprotected BPDMAc-1 SAM prepared
from a very aged gold substrate (contact with ambient for more than 3 days) [9].

62
1800 1600 1400 1200 1000
(a) Sample 1
Abs
orba
nce
Wavenumber (cm-1)
84 hrs
60 hrs
48 hrs
24 hrs
12 hrs
BPDMAc-1
0.002
1800 1600 1400 1200 1000Wavenumber (cm-1)
Abs
orba
nce
(b) Sample 2
84 hrs
60 hrs
48 hrs
24 hrs
12 hrs
BPDMAc-1
0.002
Figure 33: IRRAS showing the deacylation reaction at different immersion time in the
basic solution. (a) Sample 1 (Fresh gold substrate); (b) Sample 2 (Aged gold substrate).
The degree of deprotection was determined from the intensity of the acetate vibrational
band of BPDMAc-1 at 1695 cm-1. In Figure 34, the intensity of the CO stretching
vibration band as a function of the immersion time for different Au-samples has been
shown.

63
0 12 24 36 48 60 72 84
0.0
0.2
0.4
0.6
0.8
1.0H
eigh
t of t
he C
=O p
eak
Immersion Time / h
Sample -1 Sample -2 Sample -3
Figure 34: The difference in deprotection kinetics by the change in the nature of the gold
substrate.
Clearly, the kinetics is strongly different. On the most perfect gold surfaces the reaction is
significantly delayed. These results have been reproduced a number of times and they all
indicate that the reaction speed with which the SAM surface is converted depends
strongly on the quality of the substrate. It should be noted that in solution the kinetics of
the deprotection reaction is a fairly fast process, a complete removal of the protection
group in solution requires less than 10 minutes [59].
The base hydrolysis of thioester by sodium hydroxide is also examined by scanning
electron microscopy (Fig. 35). Scanning electron microscopy (SEM) is widely used to
image patterned SAMs. The secondary electron yield of a metal surface can be modulated
by the chemical modification at the surface via adsorption of thin films. The contrast
differences depends on the functionalization of the SAM used. The image contrast in
SEM requires surface regions that contain areas with different chemical composition

64
[190-193]. Mack et al. have examined the adsorption of fibrinogen on hexadecanethiol
SAM by SEM [192]. The image becomes darker on increasing the concentration of the
protein and the adsorption is followed by the increase in the intensity of the image
contrast.
The SEM image of a fresh BPDMAc-1 sample shows an essentially structureless,
homogeneous surface (Fig. 35a). After the samples have been immersed in the basic
solution for three hours small, approximately circular dark regions start to appear (Fig.
35b). This dark spots must correspond to deprotected areas. This observation of an
apparent contrast inversion for ultrathin organic adlayers is, however, in agreement with a
recent thorough study of the mechanism governing the contrast in SEM of SAMs on Au-
substrates [192]. The roundish dark features significantly grow in size for longer
immersion times. The total number of these dark spots also increases (Fig. 35c). This
observation reveals a growth accompanied by coalescence of the deprotected areas. The
process is similar to Ostwald ripening. After 25 hours again an essentially structureless
background is visible (Fig. 35d) indicating the presence of a homogeneous, completely
deprotected surface, in full agreement with the corresponding IR data. The immersion
time is only 25 hours and the deprotection process seems to have completed (Fig. 35d). It
should be noted here that the SEM experiments were done using Au on mica and the
defect density is higher compared to Au on silicon substrates and, accordingly, the
deprotection reaction is carried out faster. The morphological features formed in the
deprotection process closely resemble those seen during wet chemical anisotropic etching
of crystalline silicon, the most widely used processing technique in Si technology [194].
Simulations have shown that in this anisotropic etching process �m-sized, roundish pits
occur which nucleates to shallow features. This is very similar to those seen in the present
experiments. The results shown in Figure 35 clearly demonstrate that under the
conditions reported in Figure captions, the first morphological signs of deprotection can
be seen after three hours of contact time between the organic surface and the basic
solution. By correlating these results with the corresponding IR data, it can be concluded
that the black, spherical areas seen in Figure 35 must correspond to areas, where the

65
deprotection process has already been carried out, i.e. where the thioacetate groups have
been transformed to thiol groups.
Figure 35: SEM images of BPDMAc-1 and deprotected BPDMAc-1 SAM.
Image (a) was recorded for BPDMAc-1 SAM. Images (b) to (d) were recorded for the
deprotected samples prepared by the treatment of BPDMAc-1 SAM with 0.01M NaOH
for different immersion times (b) 3 hours (c) 5 hours and (d) 25 hours.
According to the SEM micrographs the process of hole formation is completed after
about five hours, after that the reaction is so fast that the whole process is completed and

66
SEM images recorded after 25 hours or more show a structure less surface as was the
case for the monolayers before immersion. The deprotection starts at defects within the
SAM, in particular at step-edges which occur e.g. at the edge of the etch-pits created
during the self-assembly process [195].
The rate deceleration can be demonstrated by the model in Figure 36. After a nucleation
center has been created by the removal of a few thioester groups the reaction then
proceeds essentially only at the edges between the deprotected area and the pristine SAM.
The reaction proceeding at the boundaries is much faster than the creation of new
nucleation centers. This is revealed by the SEM images recorded at longer times where
the roundish areas are absent. The reaction proceeds rapidly on low-quality substrates.
This is because of high density of defects in these low-quality substrates which serve as
starting points for the deacylation reaction.
The reaction investigated in the present study occurs at the otherwise unperturbed
interface of an organic surface exposed by a SAM and an aqueous solution. The
BPDMAc-1 SAMs used in the present investigation are not perturbed by any external
means. The difference in the rate of hydrolysis is observed only with the changes in the
nature of the underlying gold substrate. The high density of defects (in low quality
substrates) enhances the rate of the reaction and can be compared with the activation
processes explained in Section 1.7.
On the basis of these observations it can be shown that the removal of the thioester group
at the SAM surface is slower than deacetylation occurring in solution. From the fact that
the process is significantly delayed on very clean surfaces with only a very small content
of contaminations, it is proposed that there must be nucleation centers from which two-
dimensional reaction fronts originate.

67
Figure 36: Schematic model showing the possibility for the attack of the hydroxide ion.

68
4.3. Conclusion The biphenyldimethyldithiol SAM was fabricated from its monoacylated derivative by a
hydrolysis reaction. The reaction kinetics, endgroup chemical nature, and orientational
structure of the deprotected BPDMAc-1 films adsorbed on Au(111) were investigated
with multiple surface science techniques, IRRAS, XPS, NEXAFS and SEM. The
experimental results obtained allow for a better understanding of the chemical reactions
on an organic surface. The results demonstrate that chemical reactions, even simple ones,
can be significantly delayed when one of the reaction partners is confined to a densely
packed, highly ordered organic surface. In the present case of a deacetylation reaction,
the microscopic data suggest that the reaction starts at defects and proceeds at the border
(a one-dimensional entity) between unreacted and deprotected areas. The reaction thus
occurs at a one-dimensional reaction front, the analog to a two-dimensional reaction front
occurring in reactions in three dimensions. An important consequence is that the time
needed for a complete reaction on an organic surface depends strongly on the substrate
quality.

69
5. Metallization of a thiol-terminated organic surface
The deposition of noble metals on organic surfaces has received an increasing amount of
interest in recent years due to its importance for several technological applications [6, 90,
95, 96] e.g., the attachment of electrodes to organic semiconductors [196, 197]. Self-
assembled monolayers provide an ideal model system for the study of inorganic-organic
interface formation. In fact, in addition to serving as model organic substrates, SAMs
may actually be a permanent part of a device, e.g., in organic electronics [198-200].
SAMs are particularly useful in many applications due to their easy preparation methods,
low defect density and strong binding to the underlying substrate. The ability to tailor the
chemistry of the end group helps to determine the physicochemical properties of the
organic surface exposed by the SAM.
The main goal of this work was to deposit metallic palladium by chemical vapour
deposition on top of dithiol self-assembled monolayers. This chapter reports on the
deposition and the subsequent decomposition of Cp(allyl)Pd, on thiol-terminated SAMs
of oligophenyldithiols, terphenyldimethyldithiol (TPDMT) and biphenlydimethyldithiol
(deprotected BPDMAc-1), on Au(111). The interfacial chemical reactions of the vapor-
deposited metal precursor with the pendant thiol group of the SAMs have been studied in
detail using XPS, NEXAFS and IRRAS. This chapter begins by reviewing the metal
deposition on top of SAMs followed by the discussion of the results from the present
work.
Deposition of metal on top of SAMs is a challenging topic. In general, unreactive metals
that are deposited on inert SAMs diffuse through the SAM to the Au/S interface and
reactive metals will stick to SAMs with coordinating head groups to form organometallic
complexes [201]. The deposition of metal on top of passive thiol SAMs mostly results in
penetration of the deposited metal. In order to avoid the diffusion, deposition can be done
at low temperatures. Tarlov has observed the formation of Ag clusters on top of the
octadecanethiol (ODT) SAM, when the deposition was carried out at 90 K whereas at

70
300 K penetration through the film has been observed [75]. The use of reactive functional
groups (-NH2, -COOH, -SH) on the tail of the thiols is another way to prevent diffusion
of deposited metals. This was demonstrated by STM studies of gold deposition on top of
a carboxylate terminated SAM. The deposited gold atoms interacts with the acid group in
the monolayer and this leads to the formation of coalescing clusters on top of the
molecular layer [80, 83]. The penetrating efficiency of metals deposited on monothiol
SAMs has been compared with that of dithiol SAMs in several studies [76, 81]. Jung et
al. have observed the reactivity of the deposited Cr metal on -COOCH3 terminated SAM
resulting in a smooth layer on top of the SAM [85]. The penetration behaviour can be
controlled by modifying the end group and it has been shown that the ionic interactions in
K modified –COOH and –COCH3 SAMs were able to block the diffusion of thermally
evaporated gold [63]. The vapor deposition of K, Ca, Au and Ti atoms on several
alkanethiols and methoxy terminated alkanethiolate self-assembled monolayers was
investigated by Walker et al [82]. The heavy metal atoms generally results in the
penetration of metals toward the Au/S interface whereas the K atom forms a salt with
methoxy group [77, 82]. Czanderna et al. have found that when Cu is vacuum-deposited
on a carboxylic acid terminated SAM, some Cu reacts with the carboxylic acid groups,
although most Cu diffuses through the SAM. When faster deposition rates were used and
the substrate was cooled to 220 K during deposition, penetration of Cu could be slowed
down or even stopped [202-206]. Dronavajjala et al. have studied the ligand exchange
reaction between a cationic Pd organometallic complex, [(Pd(C2H5CN)4](BF4)2)] and a
cyanoterminated alkanethiol (mercaptohexadecanenitrile) SAM and it shows the route for
anchoring a Pd catalyst on a substrate and conducting the polymerization reaction [207].
Electrochemical deposition is also a valuable tool to deposit metals on top of SAMs.
Different metals like Rh, Pd and Pt have been deposited on mercaptopyridine SAMs by
this approach [69, 97, 208]. The metal deposition on SAMs with defects will result in
mushroom like growth [209]. Electroless metallization is also a promising method for
fabricating metal coatings [108]. Electroless deposition is a method in which a pre-
existing catalytically active species are used to form the desired metal on surfaces via
solution electrochemistry [210]. Cobalt islands has been grown by electroless deposition
method on a palladium deposited amine (-NH2) terminated SAM. In the first step, the

71
deposited Pd forms a complex with the amine SAM and later the Pd was reduced. The
presence of Pd islands facilitates the deposition of the second metal, cobalt [106].
Amidst the different functional groups, the thiol groups are promising. SAMs made from
dithiols offer the possibility that the free -SH group binds chemically to the deposited
metals and thus prevents metal diffusing through the SAM. Dithiols can be utilized as a
chemically sticky surface for attachment of metal clusters and layers [99, 211]. De Boer
et al. have demonstrated that Au and Al can penetrate a monothiol SAM whereas they
stick to dithiol SAMs [81]. Ti destroys both kinds of SAMs because of its high reactivity
towards the molecular backbone of the thiols. Oghi et al. have studied the gold deposition
on self-assembled monolayers of thiols and dithiols. In this case, the deposition was done
by evaporating gold [76]. They have observed the penetration of gold atoms in the case of
thiols and formation of gold particles on top of the dithiol SAMs.
The interaction of vapor deposited nickel with TPDMT and BPDMT has been studied
previously by Tai et al. A decrease in molecular tilt resulting in the diffusion of metal to
the SAM substrate interface has been observed. In this study, the deposition was done by
evaporating nickel [89]. Recently, an interesting approach to prevent the metal diffusion
has been demonstrated by Tai et al. The TPDMT SAMs have been irradiated with low
energy electrons to obtain chemical cross-linking between the molecular backbones. It
has been shown that only the cross-linked SAM layers provide an effective barrier for the
penetration of a metal adsorbate [6, 8, 212, 213]. The fabrication of gold nanoparticles on
mixed BPDMT and ODT SAM has shown that the density of nanoparticles can be
controlled by altering the availability of -SH groups [72]. The electrochemical deposition
of platinum on top of a benzenedimethanethiol (BDMT) SAM has been investigated by
Qu et al. [99]. Amidst the different metal deposition techniques, chemical vapor
deposition (CVD) has several advantages over physical vapor deposition processes [214,
215]. In general, the metal deposition on SAMs remains difficult because of the fragile
nature of the SAMs and diffusion of the metal through the SAMs.

72
In this work, an organometallic compound, (�3-allyl)(�5-cyclopentadienyl)palladium
[Cp(allyl)Pd] was used as a Pd precursor. The structure and the properties of Cp(ally)Pd
are given in Chapter 1.
Results
5.1. Deposition of palladium onto a TPDMT-SAM SAMs of terphenyldimethyldithiol (TPDMT) are particularly interesting for the
fabrication of electronic devices. TPDMT is a rigid, conjugated dithiol which can form
SAMs with a free reactive surface that can chemically bind to metals. For the preparation
of electronic devices, another advantage of dithiol SAMs over monothiol SAMs is that
these reactive surface groups will prevent metal diffusing through the SAM. The average
tilt angle of 28° was observed for the terphenyl backbone with respect to the surface
normal [216] and the thickness of the organic adlayer amounts to 19.4 Å [174]. The
intermolecular interaction between the terphenyl backbones favours the highly oriented
structure [217, 218]. Scanning tunneling microscopic (STM) studies on TPDMT SAMs
exhibits an inferior quality when compared to decanethiolate SAMs. The imaging
problems most likely arise from the interaction of the reactive -SH terminated surface
with a metal tip [7].
Figure 37: Illustration of the structure of a TPDMT SAM on gold.

73
In Chapter 3, the preparation and the characterization of TPDMT SAMs on Au(111) are
presented. For the TPDMT SAMs, the IRRAS and NEXAFS data reveal the presence of a
densely packed and highly oriented film with an upright orientation of the terphenyl
backbone (Fig. 37). XPS results strongly indicate that the TPDMT SAM is terminated by
thiol groups. The terphenyldimethyldithiol SAM was exposed to the palladium precursor
vapor at room temperature in a Schlenk flask for times between 1 and 24 hours according
to the procedures described in Chapter 2. Since the precursor is highly sensitive to
moisture and air, the exposures were performed in an Ar atmosphere.
5.1.1. XPS of Pd deposited TPDMT-SAM
The oxidation state of the Pd atom in the intact precursor is +2 and the XPS binding
energies recorded for precursor multilayer amount to 337.7 eV and 343.0 eV for the Pd
3d5/2 and 3d3/2 doublet, respectively [219, 220]. The XPS data recorded for thin films of
elemental palladium obtained from Cp(allyl)Pd exhibits peaks at 335.7 eV and 340.9 eV
for the Pd 3d5/2 and 3d3/2 doublet, respectively [137]. The palladium 3d lines of the intact
precursor are shifted by 2.0 eV toward higher binding energies as compared to the Pd 3d
lines of the metallic palladium. The Pd 3d5/2 line is located at around 338.0 eV for many
Pd(II) compounds. Lin et al. have observed a higher binding energy of 339.1 eV for
Pd(hfac)2 precursor [114]. The higher binding energy is consistent with a larger chemical
shift caused by the more electronegative ligand in the latter complex.
Palladium 3d XPS data: In Fig. 38a, the Pd 3d XPS data for the TPDMT SAM which
was exposed for a short time (one hour) to the precursor is presented. After the exposure
of the SAM to the precursor, the appearance of a Pd 3d signal is clearly visible. The Pd
3d doublet is located at 337.4 eV and 342.7 eV, demonstrating that the Pd is in the +2
oxidation state. Since Cp(allyl)Pd can be easily reduced by dihydrogen gas [94], the
TPDMT SAM which had been treated with the precursor vapor for 1 hour was exposed to
H2 at room temperature. The corresponding XPS data (Fig. 38b) did not reveal any
changes when compared to the data recorded prior to the H2 exposure; a reduction of the
Pd2+ clearly did not take place. In Fig. 39a, the XPS data recorded for the TPDMT SAM
which was exposed to the precursor for significantly longer times, approximately 24

74
hours is displayed. From the XPS results it is clear that again Pd2+ ions are deposited, but
for the longer exposures also Pd0 is present as evidenced by the peaks at 335.6 eV and
340.9 eV, which are a characteristic of metallic Pd [219]. A closer inspection reveals that
the total amount of Pd deposited on SAMs exposed to the precursor for 24 h is
significantly larger, nearly doubled, when compared to the SAMs of shorter (1 h)
exposure time. In contrast to short exposure times, in this case the Pd2+ deposited on the
TPDMT SAM is reduced to metallic Pd upon exposure to H2 as evidenced by the peaks at
335.6 eV and 340.9 eV (Fig. 39b). However, the reduction is not complete; Pd2+, about
25% (peaks at 337.6 and 342.9 eV), is still present after exposure to H2 (Table. 5).
348 344 340 336 332
0
400
800
1200
1600
2000(a)
Pd 3d5/2
337.4Pd 3d3/2
342.7
Binding Energy (eV)
Inte
nsity
(Cps
)
348 344 340 336 332
0
400
800
1200
1600
2000(b)
Pd 3d5/2
337.4Pd 3d3/2
342.7
Binding Energy (eV)
Inte
nsity
(Cps
)
Figure 38: XP spectra of the Pd 3d region of a TPDMT SAM exposed to Cp(allyl)Pd for
(a) 1 hour and (b) the same treated with hydrogen gas.

75
348 344 340 336 332
0
400
800
1200
1600
2000(a)
Pd 3d5/2
335.6
Pd 3d3/2
340.9
Pd 3d5/2
337.4Pd 3d3/2
342.7
Binding Energy (eV)
Inte
nsity
(Cps
)
348 344 340 336 332
0
400
800
1200
1600
2000(b) Pd 3d5/2
335.6
Pd 3d3/2
340.9Pd 3d5/2
337.6Pd 3d3/2
342.9
Binding Energy (eV)
Inte
nsity
(Cps
)
Figure 39: XP spectra of the Pd 3d region of a TPDMT SAM exposed to Cp(allyl)Pd for
(a) 24 hours and (b) the same treated with hydrogen gas.
Table 5: Pd 3d5/2 peak fit data of Pd deposited TPDMT SAM.
Sample Pd 3d5/2 - BE (total area) 1 h to precursor [FWHM � 1.4] 337.40 eV Pd2+ 1 h to precursor + H2 gas [FWHM � 1.4] 337.40 eV Pd2+
Pd2+ 24 h to precursor [FWHM � 1.4] 337.40 eV (84.9%) 335.60 eV (15.1%) Pd0
Pd2+ 24 h to precursor + H2 gas [FWHM � 1.6] 337.60 eV (25.2%) 335.60 eV (74.8%) Pd0

76
Sulphur 2p XPS data: The deposition of Pd is also reflected in the S 2p XPS data. The S
2p3/2, 1/2 doublet was fitted using two peaks with a separation fixed at 1.18 eV and a
relative ratio of 2. TPDMT SAM exhibits two doublets at 162.0 eV and 163.2 eV which
are assigned to Au-thiolate (-S-Au) and to thiol sulphur species (-SH) exposed at the
vacuum side of the SAM (Fig. 23b, Section 3.1.2). The S 2p spectra recorded after
exposure to the precursor for times varying between 1 and 24 hours, respectively are
shown in Figure 40a and 40c. After the exposure to the Pd precursor a new sulphur
species with a S 2p3/2 binding energy of 163.6 eV emerges. This species is assigned to the
sulphur atoms each bound to a single palladium atom (-S-Pd2+-Allyl). The XPS data
recorded after the reduction (exposure to H2) step is displayed in Fig. 40b and 40d. The S
2p XPS signals basically remain unchanged (Fig. 40b) on the sample exposed to
precursor for 1 h even after the reduction step. On the other hand, for the SAMs exposed
for a long time to the precursor, a peak at 162.3 eV is observed after the reduction (Fig.
40d). This species is assigned to palladium thiolate species with the palladium being in
the Pd0 oxidation state in a palladium cluster. Apart from the main peaks at 162.0 eV (-S-
Au), 162.3 eV (-S-Pd0), 163.2 eV (-SH) and 163.6 eV (-S-Pd2+), there are signals located
at higher binding energies which are assigned to oxidized sulphur species. A S 2p3/2
signal centered at 167.3 eV is observed for the TPDMT SAM. For SAMs exposed to Pd
precursor for 1 and 24 h, and for SAMs exposed to the precursor followed by the
treatment with hydrogen gas, a variety of S-O species are observed. The increase of the
signal corresponding to S-O species after H2 gas treatment agrees well with the decrease
of signal intensity at 163.2 eV (Fig. 40d). The decrease in intensity of the signal at 163.2
eV suggests a massive consumption of unbound SH groups by oxidation. The signals at
higher binding energies of 168.5 and 169.2 eV correspond to higher oxides of sulfur (two
and more O atoms per S atom) [221, 222].

77
0400800
12001600
(a)
0200400600800
S 2p XPS data
(c)
Binding Energy (eV)
Inte
nsity
(Cps
)
0200400600800
(b)
172 170 168 166 164 162 160 1580
100200300400
(d)
Figure 40: S 2p spectra of Pd covered TPDMT/Au and hydrogen gas exposed samples.
(a) STE, (b) STE + H2 gas, (c) LTE and (d) LTE + H2 gas. The spectra are decomposed
into the components associated with the S-Au (red), the S-H (blue), the S-Pd2+-allyl
(green), the S-Pd cluster (orange) and the oxidized S groups (see Table 6).

78
Table 6: S 2p peak fit data of Pd deposited TPDMT SAM
Binding energy in eV (total area %) FWHM � 1.1 (a) STE, (b) STE + H2 gas, (c) LTE and (d) LTE + H2 gas
SAM (a) (b) (c) (d) Assignment Colour 161.96 (7.8)
161.96 (13.8)
161.98 (17.9)
161.96 (9.6)
161.94 (6.6)
S-Au Red
163.20 (80.1)
163.00 (39.8)
162.88 (36.9)
162.88 (32.6)
163.00 (12.1)
S-H Blue
- - - 162.34 (15.3)
162.37 (25.2)
S-Pd0 Orange
- 163.60 (37.4)
163.63 (23.6)
163.60 (21.1)
163.70 (8.8)
S-Pd2+ Green
165.00 (7.9)
164.90 (6.1)
164.90 (4.4) Dark gray
166.70 (9.1)
166.70 (9.6)
166.20 (7.4) Gray
167.27 (7.7)
Light Gray
168.45 (13.1)
Light yellow
167.30 (12.1)
166.50 (8.9)
168.00 (4.6)
167.90 (5.7)
169.20 (14.7)
Oxidized sulphur
Magenta
Carbon 1s XPS data: C 1s spectra recorded for TPDMT SAM is presented in Chapter 3
(Fig. 23a, Section 3.1.2). The spectra reveal a main peak at 284.6 eV assigned to the
aromatic backbone and a shoulder at slightly higher binding energies (286.2 eV) assigned
to shake-up processes. The XPS data recorded after the exposure to the Pd precursor for 1
and 24 h are shown in Figure 41a and 41b respectively. The main peak for the aromatic
backbone (284.5 eV) is clearly visible in both cases. The sample which was exposed for
24 h to the precursor and which was subsequently subjected to a H2 gas treatment
exhibits a new peak at around 288.5 eV (Fig. 41d). This high-binding energy reveals the
presence of oxidized carbon species. The spectra are decomposed into a main peak
assigned to the aromatic backbone (black), a shoulder at high-binding energy (blue) and
oxidized carbon species (green) (Table 7).

79
0
10000
20000
30000 (a) TPDMT SAM + Pd (STE)
0
10000
20000 (b) TPDMT SAM + Pd (STE)+ H2 gas
Inte
nsity
(Cps
)
Binding Energy (eV)
0
10000
20000 (c) TPDMT SAM + Pd (LTE)
292 290 288 286 284 282 280
0
10000 (d) TPDMT SAM + Pd (LTE)+ H2 gas
Figure 41: C 1s spectra of Pd covered TPDMT/Au and hydrogen gas exposed samples.
Table 7: C 1s peak fit data of Pd deposited TPDMT SAM.
Binding energy in eV (total area %) (a) STE (FWHM � 1.4), (b) STE + H2 gas (FWHM � 1.4), (c) LTE (FWHM � 1.4) and
(d) LTE + H2 gas (FWHM � 1.5). For SAM the FWHM � 1.3 SAM (a) (b) (c) (d)
284.6 (95.7) 284.5 (92.6) 284.8 (95.9) 284.6 (95.1) 284.5 (72.1) 286.2 (4.3) 286.3 (7.4) 286.3 (4.1) 286.4 (4.9) 286.4 (20.1) - - - - 288.5 (7.8)

80
5.1.2. NEXAFS of Pd deposited TPDMT-SAM
The C K-edge NEXAFS data for a TPDMT SAM is discussed in Chapter 3 (Fig. 24,
Section 3.1.2). NEXAFS spectra of the Pd covered TPDMT SAM and hydrogen gas
exposed samples acquired at different incidence angles are presented in Figure 42. All the
spectra are dominated by the intense �*-resonance of the phenyl rings at 285.0 eV,
accompanied by several broad #*-resonances at higher binding energies.
280 285 290 295 300 305 310 315
0
2
4
6
8
10
12
Nor
mal
ized
PE
Y
Photon Energy (eV)
(a) TPDMT+Pd(STE)
90°
55°
30°
90°- 30°
280 285 290 295 300 305 310 315
0
2
4
6
8
10
Nor
mal
ized
PE
Y
Photon Energy (eV)
(b) TPDMT+Pd(LTE)
90°
55°
30°
90°- 30°
280 285 290 295 300 305 310 315
0
2
4
6
8
10
Nor
mal
ized
PE
Y
Photon Energy (eV)
(c) TPDMT+Pd(STE)+H2 gas
90°
55°
30°
90°- 30°
288.6
280 285 290 295 300 305 310 315
0
2
4
6
8
10
Nor
mal
ized
PE
Y
Photon Energy (eV)
(d) TPDMT+Pd(LTE)+H2 gas
90°
55°
30°
90°- 30°
Figure 42: NEXAFS spectra of Pd covered TPDMT/Au and hydrogen gas exposed
samples.

81
The linear dichroism of the different samples can be followed by the difference spectra.
The difference spectrum is the difference between the spectra acquired at a particular X-
ray incidence angle and another angle taken as a reference [212]. The 90°-30° difference
spectrum for the TPDMT SAM exposed to precursor for 1 and 24 hours and for hydrogen
gas exposed Pd covered SAMs are presented in Figure 42 (green curves). The amplitude
of the difference peaks is a fingerprint of molecular orientation. Comparing the spectra of
the SAMs exposed to the precursor for one hour (STE) with those for the SAMs exposed
to the precursor for 24 h (LTE), it is clear that the short time exposed sample exhibits
high orientational order. The amplitude of the difference peak decreases for the samples
subjected to hydrogen gas treatment. This implies a low orientational order in the films
subjected to reduction with H2 gas. The difference spectrum acquired using the magic
angle of X-ray incidence (55°) as a reference is shown in Figure 43. The intensity of the
absorption resonances decreased significantly, after hydrogen gas treatment of the Pd
covered TPDMT SAMs.
280 287 294 301 308 315
-1.2
-0.8
-0.4
0.0
0.4
0.8
1.2
Photon Energy (eV)
90°- 55°
30°- 55°
Nor
mal
ized
PE
Y
TPDMT
280 287 294 301 308 315Photon Energy (eV)
TPDMT+Pd(STE)
90°- 55°
30°- 55°
280 287 294 301 308 315Photon Energy (eV)
90°- 55°
30°- 55°
TPDMT+Pd(LTE)
280 287 294 301 308 315Photon Energy (eV)
90°- 55°
30°- 55°
TPDMT+Pd(STE)+ H2 gas
280 287 294 301 308 315Photon Energy (eV)
90°- 55°
30°- 55°
TPDMT+Pd(LTE)+ H2 gas
Figure 43: 90°-55° difference spectra of Pd covered TPDMT/Au and hydrogen gas
exposed samples.

82
284.9
286.4
280 285 290 295 300 305 310 315-0.8
-0.4
0.0
0.4
0.8
1.2(a)
Nor
mal
ized
PE
Y
[TPDMT+Pd(STE)] - [TPDMT]
30°55°90°
Photon energy (eV)
284.9
286.3
280 285 290 295 300 305 310 315-0.8
-0.4
0.0
0.4
0.8
1.2(b)
55°90°
30°
[TPDMT+Pd(LTE)] - [TPDMT]
Nor
mal
ized
PE
YPhoton energy (eV)
284.6
287.1
285.1
286.4
280 285 290 295 3000
2
4
6
8
10(d)
Nor
mal
ized
PE
Y
Photon Energy (eV)
C5H6
Cp(allyl)Pd
Figure 44: Difference spectra of precursor exposed samples and the TPDMT SAM.
(a) TPDMT SAM (1 h to precursor), (b) TPDMT SAM (24 h to precursor), (c) For better
presentation, the 55° difference spectra is highlighted and (d) NEXAFS spectrum of
Cp(allyl)Pd and cyclopentadiene (Adapted from reference [219]).

83
In Figure 44, the difference spectrum of precursor exposed samples and the TPDMT
SAM is displayed. The difference spectra is obtained after exposure to Cp(allyl)Pd and
subtracting the spectrum of the original SAM both normalized at the pre-edge. The
spectrum exhibits a resonance at 286.4 eV. On extending the exposure time to 24 hours,
the intensity of this peak increases. In following previous work [219], the resonance at
286.4 eV is assigned to the allyl ligand. The position of the �*-resonance of Cp (285.1
eV) matches the position of the �*-resonance of the phenyl ring (285.0 eV).
5.1.3. IRRAS of Pd deposited TPDMT-SAM
In Figure 45, the IR spectra recorded for the SAMs before and after exposure to the Pd
precursor are displayed. All IR spectra recorded for the Pd precursor treated samples
were normalized by division by the data recorded for a TPDMT SAM (background). The
samples exposed to precursor for one hour exhibit bands at 804 cm-1, 1265 cm-1 and 2932
cm-1. As the exposure of SAMs to the Pd precursor is increased to 24 hours, an increase
in the intensity of the vibration at 2932 cm-1 was observed along with the emergence of
new bands in the region between 2000-800 cm-1. Figure 46 shows the pellet IR and the
calculated IR spectrum of Cp(allyl)Pd. The KBr pellet IR data of Cp(allyl)Pd was
compared with the reported data [131]. The vibrational frequencies have been computed
using commercial program package (Gaussian 98, DFT calculations using the B3LYP-
functional) and scaled by a factor of 0.9339. This normalization factor was deduced by
comparing the theoretical and experimental value for the C-H stretching vibration
[Experimental value/Theoretical value = 3040 cm-1/3255 cm-1 = 0.9339].
Both the pellet IR and calculated spectrum of Cp(allyl)Pd were used to assign the
vibration bands in the SAMs exposed to Pd precursor (Table 8). The bands at 1265 cm-1
and 2932 cm-1 are assigned to the allyl ligand and -CH2 stretching vibrations,
respectively. Increase in the intensity of the vibrations at 2932 cm-1 in the long time
exposed samples indicates the presence of residual allyl and cyclopentadienyl ligands. In
case of the long-term exposed surface, the IRRAS data show new peaks at about 1103
and 1048 cm-1. These signals coincide with the vibrations of RSO2 (typically at about
1030-1100 cm-1) and RSO3 groups (typically at 1140-1250 cm-1), resulting from the Pd-
catalyzed oxidation of terminal thiol groups [223].

84
1600 1500 1400 1300 1200 1100 1000 900 800
1004
1492 TPDMT-SAM
Abs
orba
nce
Wavenumber (cm-1)
0.2
TPDMT+Pd (STE)
1263 804
0.02
82610481103
1265 805TPDMT+Pd (LTE)
0.2
(a)
3100 3050 3000 2950 2900 2850 2800
3030 29282859
TPDMT-SAM
0.02
28582930TPDMT+Pd (STE)
Abs
orba
nce
2965
(b)
2932TPDMT+Pd (LTE)
Wavenumber (cm-1)
0.02
0.2
Figure 45: Infrared spectroscopic data of TPDMT SAM and Pd precursor treated SAMs.
(a) The low frequency (1600 cm-1 to 750 cm-1) and (b) the high frequency regions (3100
cm-1 to 2800 cm-1).
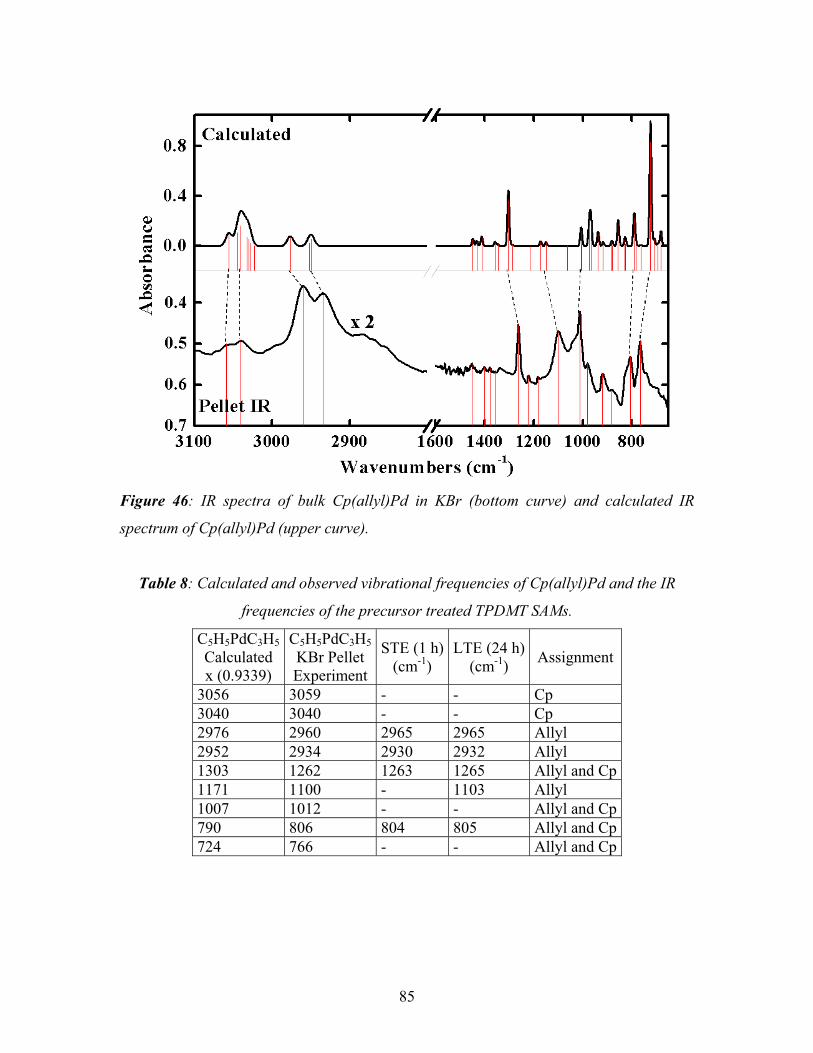
85
Figure 46: IR spectra of bulk Cp(allyl)Pd in KBr (bottom curve) and calculated IR
spectrum of Cp(allyl)Pd (upper curve).
Table 8: Calculated and observed vibrational frequencies of Cp(allyl)Pd and the IR
frequencies of the precursor treated TPDMT SAMs.
C5H5PdC3H5 Calculated x (0.9339)
C5H5PdC3H5KBr Pellet Experiment
STE (1 h)(cm-1)
LTE (24 h)(cm-1) Assignment
3056 3059 - - Cp 3040 3040 - - Cp 2976 2960 2965 2965 Allyl 2952 2934 2930 2932 Allyl 1303 1262 1263 1265 Allyl and Cp 1171 1100 - 1103 Allyl 1007 1012 - - Allyl and Cp 790 806 804 805 Allyl and Cp 724 766 - - Allyl and Cp

86
SEM of Pd deposited TPDMT-SAM
Figure 47 shows a SEM micrograph recorded for the TPDMT SAM exposed to
Cp(allyl)Pd for 24 hours followed by reduction using hydrogen gas. The SEM image
reveals that the surface is covered with Pd clusters (bright spots) with sizes up to 40 nm.
Figure 47b is a zoomed-up view of Figure 47a, where the Pd particles can be observed
clearly.
Figure 47: SEM image of Pd clusters on a TPDMT SAM exposed to Cp(allyl)Pd for 24
hours followed by the treatment with hydrogen gas.

87
5.2. Deposition of palladium onto a deprotected BPDMAc-1 SAM The fabrication of well-ordered SAMs with dithiols has many applications in molecular
electronics. Thiols have high affinity to metals and they can promote the growth of metal
films at the SAM ambient interface. The SAM formation in the case of alkanedithiols
results in stable lying-down arrangements, due to the flexibility of the molecular
backbone [20]. On the other hand, molecules such as oligophenyl dithiols or
oligophenyleneethynylene dithiols with a rigid molecular backbone can form ordered
SAMs. In order to have metal films at the SAM ambient interface, well-ordered SAM is
necessary. Earlier studies on biphenyldimethyldithiol (BPDMT) and biphenyldithiol
show that they do not form well oriented monolayers [7]. A structure with a highly
disordered multilayer, with a significant number of biphenyl units linked by S-S disulfide
bonds has been proposed for both the systems. The disordered structures are possible
through the formation of dimers or higher oligomers with S-S bonds (Fig. 48a). In this
study, chloroform is used as the solvent.
Figure 48a: Illustration of the formation of disordered layers via disulfide linkages for
the BPMDT molecule. Adapted from reference [7].
Tai et al. have demonstrated the formation of a highly oriented and densely packed SAMs
formed from BPDMT solution in tetrahydrofuran (stabilized with 0.1% hydroquinone)
[174]. The quality of the SAMs was related to the solvents used for monolayer
preparation. Poor quality SAMs were obtained when ethanol is used as the solvent
instead of tetrahydrofuran.

88
In the present work, a deprotection approach has been employed to fabricate high-quality
biphenyldimethyldithiol SAM from monoacylated dithiol in which a thioester group (Fig.
48b) protects one of the thiol groups.
Figure 48b: Illustration of the formation of a deprotected BPDMAc-1 SAM on gold.
The biphenyldimethyldithiol (deprotected BPDMAc-1) SAM was obtained by a
deacylation reaction using 0.01M sodium hydroxide. The BPDMAc-1 molecules forms
highly ordered SAM and the biphenyldimethyldithiol SAM formed from BPDMAc-1
SAM retains the quality after the hydrolysis process. The deprotected BPDMAc-1 SAMs
were characterized by IRRAS, XPS and NEXAFS. The results are presented in Chapter 3
and 4. The exposure of the deprotected BPDMAc-1 SAMs to the precursor vapor were
performed using the same procedure as described above for TPDMT.

89
5.2.1. XPS of Pd deposited deprotected BPDMAc-1 SAM
Pd 3d XPS data: Pd 3d region XPS data recorded for the deprotected BPDMAc-1 SAM
exposed to the precursor vapor for short times (1 h) is shown in Figure 49. In this case,
the amount of deposited Pd is considerably less than the amount deposited on TPDMT
SAMs for the same exposure time. In contrast, to the TPDMT SAMs, the reaction
between the precursor and the deprotected BPDMAc-1 SAM is significantly delayed.
348 344 340 336 332
0
100
200
300
400
500
Au 4f7/2
335.0Pd 3d3/2
340.9
Pd 3d5/2
335.6Pd 3d3/2
342.7
Pd 3d5/2
337.4
Inte
nsity
(Cps
)
Binding Energy (eV)
Figure 49: XP spectra of the Pd 3d region of a deprotected BPDMAc-1 SAM exposed to
Cp(allyl)Pd for 1 hour.
For longer exposures (24 h) a substantially larger amount of Pd2+ (Fig. 50a) is seen. After
exposure to dihydrogen gas reduction is observed similar to the case of Pd-deposition on
TPDMT SAMs (Fig. 50b). After contact with hydrogen gas along with metallic
palladium about 29% of Pd2+ is still present, which is possibly due to an oxidation of the
Pd0 clusters upon contact with air.

90
348 344 340 336 3320
500
10001500
2000
25003000
3500
Pd 3d3/2
340.9Pd 3d5/2
335.6
Pd 3d3/2
342.7
Pd 3d5/2
337.4
Inte
nsity
(Cps
)
Binding Energy (eV)
(a)
348 344 340 336 3320
500
10001500
2000
25003000
3500
Pd 3d3/2
340.9
Pd 3d5/2
335.6
Pd 3d3/2
342.7
Pd 3d5/2
337.4Inte
nsity
(Cps
)
Binding Energy (eV)
(b)
Figure 50: XP spectra of the Pd 3d region of a deprotected BPDMAc-1 SAM exposed to
Cp(allyl)Pd for (a) 24 hours and (b) the same treated with hydrogen gas.
Table 9: Pd 3d5/2 peak fit data of Pd deposited deprotected BPDMAc-1 SAM.
Sample Pd 3d5/2 - BE (total area) Pd2+ Pd 0 1 h to precursor [FWHM � 1.6]
337.40 eV (17.2%) 335.60 eV (24.8%) 335.00 eV (58.0%) Au 4d5/2
Pd2+ 24 h to precursor [FWHM � 1.4] 337.40 eV (84.6%) 335.60 eV (15.4%) Pd0
Pd2+ 24 h to precursor + H2 gas [FWHM � 1.6] 337.60 eV (28.8%) 335.60 eV (71.2%) Pd0

91
S 2p XPS data: S 2p XPS data recorded for deprotected BPDMAc-1 SAM is presented
in Chapter 3. The peaks at 161.96 eV and 163.3 eV are assigned to Au-thiolate and to the
thiol tail group, respectively. Figure 51a and 51b show the S 2p XPS data recorded after
exposure of the SAM to the Pd precursor for 1 and 24 hours respectively. In Figure 51c,
the spectra of 24 hour sample after exposure to dihydrogen gas is displayed. The peak at
163.6 eV is assigned to the sulphur-palladium bond formed after exposure to precursor.
Again, oxidation of the SAM surface is observed as indicated by the peaks at higher
binding energies (166.5 eV and 168.5 eV).
Table 10: S 2p peak fit data of Pd deposited deprotected BPDMAc-1 SAM.
Binding energy in eV (total area %) FWHM � 1.1 (a) STE, (b) LTE and (c) LTE + H2 gas
SAM (a) (b) (c) Assignment Colour 161.96 (18.4)
161.96 (19.9) 161.96 (8.5) 161.96 (7.7) S-Au Red
163.35 (76.0)
163.25 (40.1) 163.02 (32.4) 163.02 (12.8) S-H Blue
- - 162.34 (12.2) 162.34 (35.5) S-Pd0 cluster Orange - 163.56 (15.0) 163.70 (17.1) 163.60 (10.9) S-Pd2+ Green
164.90 (5.4) 164.90 (8.9) Dark gray 166.70 (11.0) 166.70 (3.8) Gray
167.90 (5.1) Light Gray
168.04 (5.6)
165.00 (5.4) 166.70 (5.9) 168.20 (13.6) 167.90 (13.4)
168.80 (15.2)
Oxidized sulphur
Light yellow
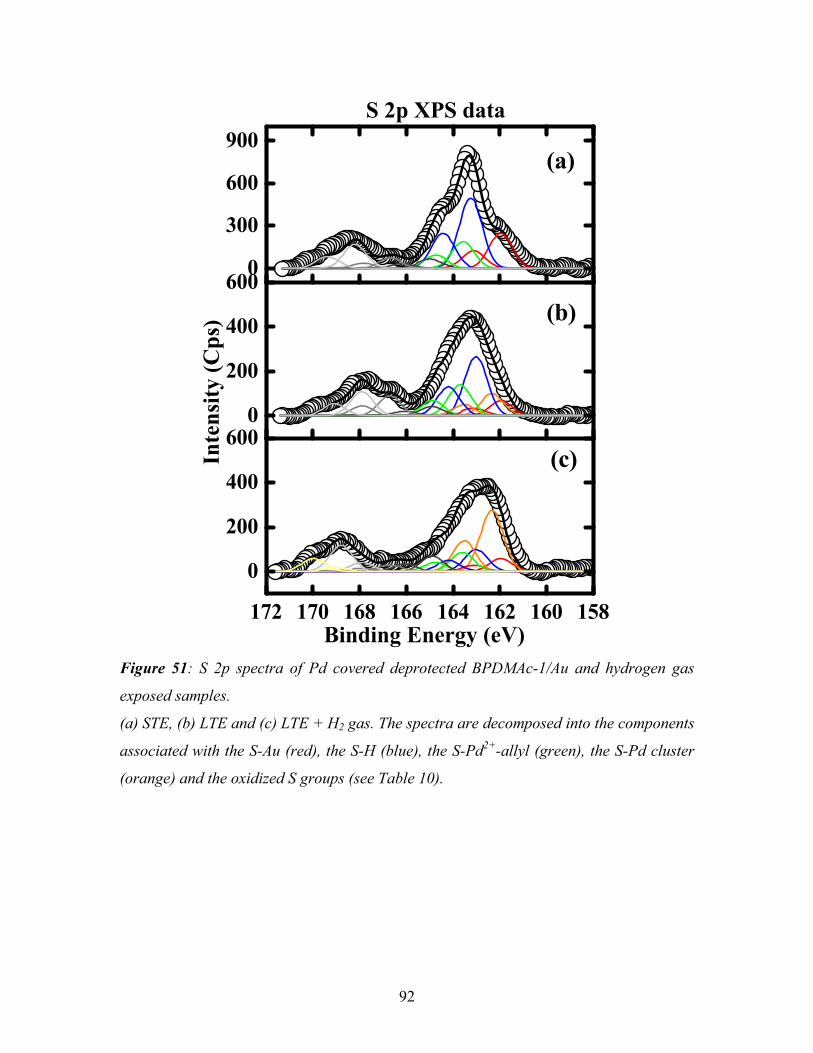
92
0
300
600
900(a)
172 170 168 166 164 162 160 158
0
200
400
600(c)
0
200
400
600
S 2p XPS data
(b)
Inte
nsity
(Cps
)
Binding Energy (eV) Figure 51: S 2p spectra of Pd covered deprotected BPDMAc-1/Au and hydrogen gas
exposed samples.
(a) STE, (b) LTE and (c) LTE + H2 gas. The spectra are decomposed into the components
associated with the S-Au (red), the S-H (blue), the S-Pd2+-allyl (green), the S-Pd cluster
(orange) and the oxidized S groups (see Table 10).

93
C1s XPS data: Figure 52 shows the C 1s XPS data. The deprotected BPDMAc-1 SAM
and the SAMs exposed to the precursor vapor show a peak at 284.5 eV which is assigned
to the aromatic biphenyl backbone. The samples treated for a long time with the
precursor vapor followed by hydrogen treatment show a peak at around 288.5 eV which
indicates the presence of oxidized carbon species.
0
10000
20000 (a) dep. BPDMAc-1 SAM+ Pd (STE)
0
10000
20000
(c) dep. BPDMAc-1 SAM+ Pd (LTE)+ H2 gas
292 290 288 286 284 282 2800
10000
20000
(b) dep. BPDMAc-1 SAM + Pd (LTE)
Inte
nsity
(Cps
)
Binding Energy (eV) Figure 52: C 1s spectra of Pd covered deprotected BPDMAc-1/Au and hydrogen gas
exposed samples.
Table 11: C 1s peak fit data of Pd deposited deprotected BPDMAc-1 SAM.
Binding energy in eV (total area %) (a) STE (FWHM � 1.4), (b) LTE (FWHM � 1.4) and
(c) LTE + H2 gas (FWHM � 1.4). For SAM the FWHM � 1.3 SAM (a) (b) (c)
284.5 (96.0) 284.6 (89.7) 284.8 (94.4) 284.6 (77.4) 286.3 (4.0) 286.3 (10.3) 286.3 (5.6) 286.3 (15.3) - - - 288.4 (7.3)

94
5.2.2. NEXAFS of Pd deposited deprotected BPDMAc-1 SAM
The C 1s NEXAFS data recorded for the deprotected BPDMAc-1 show a marked linear
dichroism (discussed in Chapter 3). Figure 53 presents the NEXAFS spectra of the Pd
covered deprotected BPDMAc-1 SAM and hydrogen gas exposed samples acquired at
different incidence angles.
280 285 290 295 300 305 310 315 320
0
2
4
6
8
10
Nor
mal
ized
PE
Y
Photon Energy (eV)
90°-30°
30°
55°
90°
(a) dep. BPDMAc-1+Pd(STE)
280 285 290 295 300 305 310 315 320
0
2
4
6
8
10
Nor
mal
ized
PEY
90°
55°
30°
90°-30°
Photon Energy (eV)
(b) dep. BPDMAc-1+ Pd(LTE)
285.2
288.6
280 285 290 295 300 305 310 315
0
2
4
6
8
10 (c) dep. BPDMAc-1+Pd(LTE)+H2 gas
90°
55°
30°
90°-30°
Nor
mal
ized
PE
Y
Photon Energy (eV) Figure 53: NEXAFS spectra of Pd covered deprotected BPDMAc-1/Au and hydrogen gas
exposed samples.

95
As observed in the case of TPDMT, the spectra of samples exposed to precursor for 1 and
24 hours, are dominated by the �*-resonance of the phenyl rings at 285.0 eV,
accompanied by several broad and less intense #*-resonances at higher binding energies.
The difference spectrum (90°-30°) for the dep. BPDMAc-1 SAM exposed to precursor
for 1 and 24 hours and for hydrogen gas exposed Pd covered SAMs are included in
Figure 53 (green curves). The amplitude of the difference peak for the short time exposed
sample is high when compared to the long time exposed sample.
280 287 294 301 308 315-1.2
-1.0
-0.8
-0.6
-0.4
-0.2
0.0
0.2
0.4
0.6
0.8
1.0
1.2
30°- 55°
Nor
mal
ized
PEY
Photon Energy (eV)
90°- 55°
dep. BPDMAc-1
280 287 294 301 308 315
30°- 55°
Photon Energy (eV)
90°- 55°
dep. BPDMAc-1 + Pd(STE)
280 287 294 301 308 315
30°- 55°
90°- 55°
Photon Energy (eV)
dep. BPDMAc-1 + Pd(LTE)
280 287 294 301 308 315
30°- 55°
dep. BPDMAc-1 + Pd(LTE) +H2 gas
90°- 55°
Photon Energy (eV) Figure 54: 90°-55° difference spectra of Pd covered deprotected BPDMAc-1/Au and
hydrogen gas exposed samples.

96
284.9
280 285 290 295 300 305 310 315-0.4
0.0
0.4
0.8
1.2
1.6 (a)N
orm
aliz
ed P
EY
[dep. BPDMAc-1+Pd(STE)] - [dep. BPDMAc-1]
30°55°90°
Photon energy (eV)
285.0
286.4
280 285 290 295 300 305 310 315-0.4
0.0
0.4
0.8
1.2
1.6(b)
55°90°
30°
[dep. BPDMAc-1+Pd(LTE)] - [dep. BPDMAc-1]
Nor
mal
ized
PE
YPhoton energy (eV)
Figure 55: Difference spectrum of precursor exposed samples and the deprotected
BPDMAc-1 SAM.
The difference peak for the sample subjected to hydrogen gas treatment is shown in
Figure 53c. The results suggest a low orientational order in the films subjected to
reduction with H2 gas. The difference spectrum acquired using the magic angle of X-ray
incidence (55°) as a reference is shown in Figure 54. This difference spectrum is also
shows the decrease in the intensity of the absorption resonances after hydrogen gas
treatment of the Pd covered TPDMT SAMs. In Figure 55, the difference spectrum of
precursor exposed samples and the deprotected BPDMAc-1 SAM is displayed. A
resonance at 284.9 eV is observed for the samples exposed to the precursor for one hour.
On extending, the exposure time to 24 h the intensity of the peak at 285 eV increases and
the resonance at 286.4 eV is clearly visible. This peak at 286.4 eV is assigned to the allyl
ligand.

97
Discussion:
The experimental data presented above on the chemical vapor deposition of Cp(allyl)Pd
on dithiol SAMs provide valuable insight to the metallization of SAMs. The reactivity of
Cp(allyl)Pd with terphenyldimethyldithiol (TPDMT) and biphenyldimethyldithiol (dep.
BPDMAc-1) SAMs are discussed in this section.
The analysis of the experimental results reveals that the deposition of palladium on
SAMs exposing a thiol terminated surface using Cp(allyl)Pd consists of two steps. The
initial step is a reaction of the precursor with the free thiol (-SH) groups exposed at the
SAM surface. This complexation reaction proceeds as observed in the bulk. The
reactivity of Cp(allyl)Pd with various thiols in solution has been studied by Weckenmann
et al [94, 224].
Pd Pd
S
S
Pd
R
R
R-SH
R = tBu, [p-CH3C6H4] or p-tolyl
Figure 56: Schematic reaction of Cp(allyl)Pd with thiols in solution.
When the precursor is treated with the solution of t-butyl thiol and p-thiocresol, the
formation of dimeric (allyl)(-thiolato)palladium is observed. Schematic reaction of
Cp(allyl)Pd leading to the formation of dimeric allylpalladiumthiolato complexes is
shown in Figure 56 (Adapted from the reference [94]).
The XPS data (Fig. 38a) conclusively unravel the mechanism of the reaction between the
precursor and the free thiol groups at the SAM surface. When the precursor comes in
contact with the -SH groups on the SAM surface, a Pd2+-S bond is formed leading to the
appearance of a Pd 3d5/2 XPS signal at 337.4 eV. This binding energy is in agreement

98
with the previously reported value of 337.7 eV for the Pd 3d5/2 signal in Cp(allyl)Pd
multilayer deposited on Pd(111) [219]. With regard to the multilayer data, the XPS
results for the monolayer reveal a downshift of 0.3 eV in binding energy. This is
consistent with the presence of different ligands bound to palladium. In the precursor, the
Pd atom is bound to the allyl and to the cyclopentadienyl ligand (337.7 eV) whereas after
the reaction with dithiol SAMs, the Pd atom is bound to the allyl ligand and to the sulfur
from the thiol (337.4 eV). Additionally, the reaction between the thiol and the precursor
leads to a shift in the S 2p signal. It is well-known that the sulfur atoms bound to metal
appear at lower binding energy when compared to the sulfur atoms in the free thiol
groups [94]. In the present study, the S 2p peaks at 162.0 and 163.6 eV are assigned to
Au-S and -S-Pd2+-allyl. The free SH group appears at 163.2 eV.
The allyl-Pd2+ covered TPDMT SAM surface prepared by exposing the SAM to the Pd
precursor for 1 hour (STE) is stable against reduction by dihydrogen gas. The XPS data
do not reveal a significant amount of Pd0 species (Fig. 38b). This is an interesting and
somewhat unexpected observation since the precursor, Cp(allyl)Pd, can be readily
reduced with dihydrogen gas at room temperature [180]. On the other hand the dimeric
(allyl)(-thiolato)palladium complexes (Fig. 56) are stable against reduction [94].
The reactivity of Cp(allyl)Pd with different electrophilic and nucleophilic agents was
studied by Gubin et al [126]. It was shown that the cyclopentadienyl ligand is readily
eliminated whereas the bond of palladium to the allyl group is stable [126]. Bogdanovic
et al. have observed the selective cleavage of the cyclopentadienyl group in a reaction
between hydrogensulphide and Cp(allyl)Pd [225]. The product of this reaction is �3-
allylhydrogensulfidopalladium (similar structure as the product in Fig. 56, R = H). It has
been observed that further reaction of Cp(allyl)Pd with �3-allylhydrogensulfidopalladium
yields an allyl compound with the elimination of Cp ligand [226]. The reaction of
Cp(allyl)Pd with thiols in solution also yields an allyl palladium complex of which the
structure was characterized by single crystal X-ray diffraction studies [94].

99
In the present study, the IRRAS and NEXAFS results show the presence of allyl groups
on the SAM surface. For the TPDMT samples exposed to the precursor for 1 h, the
vibrational bands at 1265 cm-1 and 2932 cm-1 are observed which are assigned to the allyl
ligand. Additionally, in the NEXAFS difference spectra of the samples exposed to
precursor for one hour, a resonance at 286.4 eV is observed which is assigned to the allyl
ligand. In addition, the allyl covered SAM surface is not reduced when treated with
dihydrogen gas similar to the dimeric (allyl)(-thiolato)palladium complexes. This
observation along with the IRRAS and NEXAFS results suggest the cleavage of the
cyclopentadienyl ligand. The cyclopentadienyl ligand is replaced by the sulfur from the
thiol, whereas the allyl ligand is retained (see Fig.59).
On extending the exposure time of the SAMs to the Pd precursor to about 24 h (LTE),
some of the precursor molecules spontaneously decompose on the allyl-terminated SAM
resulting in the formation of a small amount of metallic Pd as is evident from the Pd 3d
XPS data (335.6 eV) (Fig. 39a). However, the amount of metallic Pd formed in this case
is rather small. Once such Pd particles are formed, they can decompose the remaining
Pd2+ centers autocatalytically in the presence of hydrogen gas as has been reported earlier
[127]. The sample exposed to precursor for 24 hours and treated with dihydrogen gas is
found to be readily reduced to metallic Pd. The Pd0 already present before exposure to H2
act as an active site and provides H atoms facilitating the reduction. The XPS data reveal
a small amount of Pd2+ present on the surface after the reduction process. This
observation can be explained either by an incomplete reduction or, more likely, by an
oxidation of the Pd0 particles upon contact with air (during the transfer process into the
spectrometer). After the reduction process, a new S 2p3/2 XPS signal is observed at 162.3
eV which is assigned to S bound to the metal (Pd-thiolate). The SEM micrographs show
Pd clusters in accordance with the Pd0 featured in the XPS data. The particles grow up to
40 nm indicating the occurrence of nucleation and diffusion processes of the reduced
palladium. As the exposure time to the Pd precursor is increased, the catalytic activity of
the small Pd0 particles causes a more unspecific decomposition of the Pd precursor
leading to different carbon residues.

100
Thickness of the monolayers: The relative intensities of the C 1s and Au 4f7/2 lines of
the XPS data have been used to estimate the thickness of the monolayers [216]. XPS data
recorded for a freshly prepared TPDMT and deprotected BPDMAc-1 SAM was used as
reference system for palladium deposited TPDMT and deprotected BPDMAc-1 SAM
samples respectively.
The film thickness is obtained by the following equation. In this equation, dsample is the
thickness of the sample under investigation. In the case of TPDMT SAM samples,
dreference is the thickness of the TPDMT SAM (19.4 Å) and for deprotected BPDMAc-1
SAM samples, dreference is the thickness of the BPDMT SAM (15.5 Å) [7, 174].
� �
� �
sample referenceC1s
C AuAu4f
C1s sample referenceAu4f
Au C
d d1 exp expI (sample)II d d(reference) exp 1 expI
� � � �� � � �� �� �� � � � � � � �
� � � �� �� � � �
(5)
IC1s and IAu4f are the measured intensities of C 1s and Au 4f7/2 lines. The escape depths
�Au = 16 Å at a kinetic energy of 314 eV and �C = 9 Å at a kinetic energy of 115 eV are
used [155]. The thicknesses of the different TPDMT and deprotected BPDMAc-1 SAM
samples are listed in Table 12 and Table 13.
Sample C1s
Au 4f
II dsample (Å)
(a) TPDMT SAM 2.3 19.4
(b) TPDMT SAM + Cp(allyl)Pd for 1 h 1.7 16.0
(c) TPDMT SAM + Cp(allyl)Pd for 1 h + H2 gas 2.4 19.6
(d) TPDMT SAM + Cp(allyl)Pd for 24 h 3.5 25.0 (e) TPDMT SAM + Cp(allyl)Pd for 24 h + H2 gas 0.5 5.6
a b c d e --0
1
2
3
4
5
a b c d e --0
10
20
30
C 1
s/A
u 4f
Thi
ckne
ss
Table 12: Thickness of the Pd covered TPDMT SAM samples.

101
Sample C1s
Au 4f
II dsample (Å)
(a) deprotected BPDMAc-1 SAM 0.33 15.5 (b) deprotected BPDMAc-1 SAM + Cp(allyl)Pd for 1 h 0.28 13.8
(c) deprotected BPDMAc-1 SAM + Cp(allyl)Pd for 24 h 5.14 56.0
(d) deprotected BPDMAc-1 SAM + Cp(allyl)Pd for 24 h + H2 gas 1.86 40
a b c d -- --0123456
a b c d -- --0
102030405060
C 1
s/A
u 4f
Thi
ckne
ss
Table 13: Thickness of the Pd covered deprotected BPDMAc-1 SAM samples.
According to the Table 12, the thickness of the TPDMT SAM sample exposed to
precursor for 1 h is 16.0 Å and after the hydrogen treatment, the thickness is about 19.6
Å. It should be noted that the XPS spectra have been recorded with monochromatized
synchrotron radiation (BESSY). The XPS signal is proportional to the ring current which
varies typically from 250 mA (directly after injection) to 100 mA after 8 hours.
Therefore, absolute intensities will always vary from spectra to spectra. Since the
intensity of the synchrotron radiation changes with time it is rather difficult to provide an
absolute scale for the XPS data. The intensity ratios C 1s/Au 4f, S 2p/Au 4f are plotted in
order to make sure that there are no artifacts in the data (Fig. 57).
SAM
STE
STE+
H
LTE
LTE+
H
0
2
4
6
SAM
STE
LTE
LTE+
H
0
2
4
6 C1s/Au4f S2p/Au4f
Inte
nsity
Rat
io
Dep.BPDMAc-1TPDMT
C1s/Au4f S2p/Au4f
Figure 57: Plot of intensity ratios (C 1s/Au 4f, S 2p/Au 4f).
102
The plot of this intensity ratio shows that within each spectrum the data can be compared.
The difference in the thickness values for the TPDMT SAM sample exposed to precursor
for 1 h is due the variation in the intensity of the synchrotron radiation with time. Taking
this in to consideration it can be concluded that there is no change in the thicknesses for
the TPDMT SAM exposed for 1 h to the precursor and after exposing to hydrogen gas.
Upon extending the exposure time to the palladium precursor to 24 h, an increase in
thickness (~ 5 Å) is observed. Since this increase in thickness cannot be attributed to
deposition of the intact precursor molecule, this increase must be due to a deposition of
palladium/hydrocarbon species on the surface caused by partial decomposition of the
precursor. When the TPDMT SAM exposed to the precursor for 24 h is treated with
hydrogen gas, a prominent decrease of the SAM thickness is observed. This observation
directly demonstrates that a large amount of molecules comprising the SAM has been
removed.
The thicknesses for the palladium covered deprotected BPDMAc-1 samples are displayed
in Table 13. The thickness of the deprotected BPDMAc-1 SAM sample exposed to
precursor for 1 h is 13.8 Å and that of the clean deprotected BPDMAc-1 SAM is 15.5 Å.
There is no change in the thicknesses for the deprotected BPDMAc-1 SAM and the
sample exposed for 1 h to the precursor. The intensity plots (Fig. 57) shows that the
difference in the thickness values for the SAM sample exposed to precursor for 1 h is due
the variation in the intensity of the synchrotron radiation with time. When the exposure
time to the Pd precursor is extended to 24 hours, drastic increase in the thickness is
observed (Table. 13). As in the case of TPDMT SAM, this increase can be attributed to a
deposition of palladium/hydrocarbon species on the surface caused by partial
decomposition of the precursor. When the deprotected BPDMAc-1 SAM exposed to the
precursor for 24 h is treated with hydrogen gas, a decrease of the SAM thickness is
observed.
The thickness results of TPDMT and deprotected BPDMAc-1 SAM samples are
comparable only in the case of samples exposed to palladium precursor for 1 h. In the
case of deprotected BPDMAc-1 sample exposed to precursor for 24 h, thick layers (56 Å)
of palladium/hydrocarbon species is observed whereas in the case of TPDMT sample the
thickness is about 25 Å. Upon extending the exposure time to 24 h, the behaviour differs.

103
This result is also supported by NEXAFS data (Fig. 58). The change in the edge jump is
used to estimate the thickness. In Figure 58a, the SAM samples, TPDMT, TPDMT
exposed to precursor for 1 h (STE) and TPDMT exposed to precursor for 24 h (LTE) are
compared. The gold transmission line is also included. In the case of STE, the chemical
modification involves the transformation of -SH to -S-Pd-Allyl. The height of both does
not differ much. It is clear from the plot that there is no decrease in the thickness of the
TPDMT thiol film after the treatment with Pd precursor (1 h). Figure 58b displays the
deprotected BPDMAc-1 SAM samples, clean SAM, SAM exposed to precursor for 1 h
(STE) and SAM exposed to precursor for 24 h (LTE). There is no decrease in the
thickness of the deprotected BPDMAc-1 thiol film after the treatment with Pd precursor
for one hour. The edge jump for the samples exposed to the precursor for 24 h is found to
be greater than the samples exposed for 1 h (blue curves in Fig. 58b). The results are
consistent with the thickness information obtained from the XPS data.
280 290 300 310 3200
1
2
3
4
5
6
7
8
(b)dep.BPDMAc1+Pd (LTE)dep.BPDMAc1+Pd (STE)dep.BPDMAc1Au transmission
TPDMT+Pd (LTE)TPDMT+Pd (STE)TPDMTAu transmission
Nor
mal
ized
Par
tial E
lect
ron
Yie
ld
Photon Energy (eV)
(a)
280 290 300 310 3200
1
2
3
4
5
6
7
8
Figure 58: Thickness estimation from the edge jump in C K-edge NEXAFS. (a) TPDMT
samples and (b) dep.BPDMAc-1 samples.

104
The decomposition of the precursor molecules and later the SAM molecules itself can be
explained by the catalytic activity of the palladium nanoparticles formed during the
exposure to palladium precursor. Palladium nanoparticles are used as catalysts in
numerous organic and inorganic reactions [227, 228]. Palladium-catalyzed oxidation
reactions are well known in the literature, and effective catalytic activity was observed at
room temperature in ambient environment [229, 230]. Cleavage of the carbon-sulfur
bond from certain thiols and dithioethers can be caused by oxygen by means of a
palladium catalyst in the presence of a co-reductant, either carbon monoxide or hydrogen
[231]. In the present case, the Pd clusters on the surface slowly oxidize first the sulfur
atoms and then the very backbone of the SAM constituents resulting in defect formation.
The oxidation of the aromatic SAM molecules by Pd0 clusters observed here can also be
compared to the oxidation of alkanethiols SAMs formed on a palladium substrate [110].
In principle, the oxidation, decomposition, and subsequent desorption of fragments
leading to a reduction of the SAM thickness can be either caused by the hydrogen gas or
by the ambient since during the transfer of the SAM samples to the XPS apparatuses the
samples are exposed to the ambient for several minutes. With the present experimental
setup, it is not possible to make a final decision. The overall process of the reaction of
Cp(allyl)Pd on TPDMT SAM is summarized in Figure 59. The chemical vapor
deposition of Cp(allyl)Pd on SAMs fabricated from TPDMT results in the formation of
Pd2+-allyl capped surfaces. Clearly, the interaction of the precursor with the SH
terminated surface leads to a break of the Pd-Cp bond. The cyclopentadienyl ligand
leaves the system as cyclopentadiene, and the Pd2+ forms a bond to the surface S atoms.
The Pd2+-allyl capped SAM surface does not react with H2, and metallic Pd can only be
obtained in the presence of small Pd0 particles produced, for example, by prolonged
exposures (24 h) to the Pd precursor. In this process, the allyl ligand is probably
hydrogenated to yield either propene or propane.

105
(b)H2 gas
(d)H2 gas
Pd2+ Pd0
Decomposed Pd precursor molecules
Oxidized TPDMT SAM molecules
(a)Exposure to Cp(allyl)Pd
1 h
(c)Exposure to Cp(allyl)Pd
24 hTPDMT SAM
(b)H2 gas
(d)H2 gas
Pd2+Pd2+ Pd0Pd0
Decomposed Pd precursor molecules
Oxidized TPDMT SAM molecules
(a)Exposure to Cp(allyl)Pd
1 h
(c)Exposure to Cp(allyl)Pd
24 hTPDMT SAM
(a)Exposure to Cp(allyl)Pd
1 h
(c)Exposure to Cp(allyl)Pd
24 hTPDMT SAM
Figure 59: Schematic model showing the deposition of Cp(allyl)Pd and the subsequent
reduction to metallic palladium on TPDMT-SAM.

106
The aromatic dithiols used in the present investigation are analogues to each other. The
reactivity of both TPDMT and deprotected BPDMAc-1 SAM towards the palladium
precursor is expected to be the same. Unexpectedly, the deprotected BPDMAc-1 SAMs
were found to behave quite differently upon exposure to the Pd precursor. After exposure
to the precursor for the same amount of time (1 h), the amount of Pd deposited is
considerably less compared to the TPDMT SAM. It has to be noted here that the SAM
preparation procedures were different. The TPDMT SAM was prepared directly by
immersion of Au substrate in to TPDMT solution whereas biphenyldimethyldithiol SAM
was prepared by a deacylation reaction of BPDMAc-1 SAM. Both the TPDMT and
deprotected BPDMAc-1 SAM surfaces are thiol terminated and this is confirmed by the S
2p XPS data of the respective SAMs. NEXAFS results of the two SAMs shows that they
are highly oriented. No chemical differences are observed between these two SAMs.
Therefore, the reduced reactivity of the deprotected BPDMAc-1 SAMs can be explained
by a very small density of surface defects acting as nucleation centers for the Pd
precursor deposition. The process of formation of palladium thiolate on exposure of the
SAM to the Pd precursor depends on the availability of the –SH units exposed at the
surface, and the density of defects in the SAM accelerates the reaction. Earlier studies
show that the presence of surface H atom was essential for the decomposition of the Pd
precursor on silicon substrates. Clean Si surfaces exhibit the least reactivity whereas the
hydrogen terminated Si surface was highly active [220]. Therefore, the availability of the
hydrogen atoms at the surface is important for the decomposition reaction to take place.
The dependency of reaction speed on surface defect density has been discussed in
Chapter 4. The deacylation reaction on an organic surface by a basic agent was found to
be significantly delayed when the number of defects was reduced. So the efficiency of the
reaction between the Pd precursor and the thiol is mutually related with the availability of
hydrogen atoms on the SAM surface which in turn depends on the packing density of the
SAMs. When the exposure time to the Pd precursor is extended to 24 h, deprotected
BPDMAc-1 exhibits a behavior similar to that observed for TPDMT SAMs. When
treated with hydrogen gas, again a reduction of the Pd2+ species is observed.

107
5.3. Conclusion The experimental results from XPS, IRRAS and NEXAFS spectroscopy presented above
demonstrate that the exposure of thiol terminated organic surfaces fabricated from
terphenyldimethyldithiol to Cp(allyl)Pd results in the formation of an allyl-Pd2+-thiolate
termination. The reaction is found to be similar to analogous reactions in solution.
Exposure of this surface to dihydrogen did not result in a reduction of the Pd2+. It is
concluded that the presence of metallic Pd is required to catalyze the reduction process.
This conclusion is supported by experiments with TPDMT surfaces that were exposed to
the precursor for rather long periods of time, so that small amounts of Pd0 are
spontaneously formed. Such surfaces were found to be readily reduced by exposure to H2
gas, and small metal clusters are formed on the surface. The catalytic activity of the small
Pd cluster, however, also causes the decomposition of the self-assembled monolayer. The
reaction between Cp(allyl)Pd and the deprotected BPDMAc-1 surface is significantly
delayed otherwise, the behavior was found to be rather similar to that of the TPDMT
SAMs. The thiol (-SH) terminated SAMs are thus well suited for a CVD based
metallization.

108
5.4. Outlook The overall process of the reaction of Cp(allyl)Pd on SAMs fabricated from TPDMT is
well understood and the experimental results give a clear picture of the reaction pathway.
On the other hand, the reaction between the precursor and the deprotected BPDMAc-1
surface is delayed. To understand the delay in the reaction time further experiments are
required.
In the present work, the reduced reactivity of deprotected BPDMAc-1 SAM with
Cp(allyl)Pd is explained by the small number of defects in the SAM. In order to have
further evidence, the deposition of Cp(allyl)Pd can be carried out on a diluted deprotected
BPDMAc-1 SAM surface. Diluted SAM of deprotected BPDMAc-1 can be prepared by
mixing it with another thiol with terminal groups that are not reactive with Cp(allyl)Pd.
Methyl terminated thiols can be chosen, as they are inert towards the precursor. Mixed
SAMs can be prepared by displacement or exchange reactions or they can also be
prepared by co-adsorption method. The critical point is to avoid phase separation. On the
other hand, diluting SAMs can be done in a controlled means by microcontact printing.
Microcontact printing (�CP) is a surface patterning technique, which transfers by contact,
a thiol ink from an elastomeric (polydimethylsiloxane, PDMS) stamp to a gold surface,
and if the stamp is patterned, a patterned SAM is formed [232, 233]. Patterned SAMs of
alkanethiols are extensively studied [234-236]. On the other hand, only few studies are
available for the �CP of systems with higher molecular weight. For example,
microcontact printing with heavyweight inks such as calixarene and cavitand tetra
(thioether) derivatives has been studied by Liebau et al [237]. Aromatic inks are not
investigated in detail.
Prior to use, the PDMS stamp (3 �m quadrate) was thoroughly rinsed with ethanol and
dried under a stream of nitrogen. In the present study, two inks, BPDMAc-1 (molecular
weight: 288 g mol-1) and TPDMT (molecular weight: 322.49 g mol-1) are used. The
stamp is inked by the thiol by exposing the stamp to a 1mM solution of either BPDMAc-
1 or TPDMT in ethanol. Both BPDMAc-1 and TPDMT are sparingly soluble in ethanol.
In order to increase the solubility, the solution is subjected to sonication. BPDMAc-1 and
TPDMT molecules are completely soluble in dichloromethane and chloroform but these
organic solvents can diffuse into the PDMS material and cause it to swell. Lee et al have

109
studied the compatibility of polydimethylsiloxane (PDMS) with organic solvents and
ethanol is one among the best solvent for microcontact printing [238].
Then the stamp is taken out of the solution rinsed with ethanol and dried in gentle
nitrogen stream. Before stamping, the stamp is inked again with the inking solution using
a dropper. The stamp is dried until no liquid was visible by eye on the surface of the
stamp, either under ambient conditions, or by exposure to a gentle stream of nitrogen gas.
Following inking, the stamp was applied by hand to a gold surface. Very light hand
pressure aided in complete contact between the stamp and the surface. The stamp was
then peeled gently from the surface. The thiol is transferred to the substrate such that after
removing the stamp thiols are adsorbed exclusively within the contact area. Further
derivatization of unstamped areas can be accomplished by immersing the entire substrate
in a different thiol. In this study, decanethiol is used.
Patterned SAMs terminated by -SCOCH3 are prepared by �CP of BPDMAc-1 on Au on
silicon wafer. Immersing the patterned surface in decanethiol solution results in CH3
terminated SAMs in regions of the gold surface not derivatized by �CP of BPDMAc-1.
Later the patterned SAM surface is treated with a base (0.01M NaOH for 84 h) to
facilitate the conversion of -SCOCH3 to -SH. The scanning electron micrographs showed
a pronounced contrast. The stamped features of the patterned SAM appear bright in the
SEM image (Fig. 60a). The patterned SAMs are exposed to the palladium precursor for
one hour. The SEM micrograph does not reveal any difference after the treatment with
precursor. It is difficult to observe the Pd2+ covered with allyl groups. Only metal clusters
are observed because of edge effect (SEM image not shown here). Control experiments
with TPDMT stamps have also been performed. The SEM images of sample with
stamped TPDMT and backfilled decanethiol show a pronounced contrast. The stamped
features (TPDMT SAM) appear bright in the SEM image (Fig. 60b). In this case, also
after the exposure to Pd precursor for one hour the SEM images do not show any
differences.

110
Figure 60: SEM image of a patterned SAM formed by �CP. Dark squares corresponded
to SAMs terminated by SH; light regions corresponded to CH3 terminated SAMs.
(a) Patterned SAMs of deprotected BPDMAc-1 and (b) patterned SAMs of TPDMT.
The reactivity of the SAMs can be related to the surface defects acting as nucleation
centers. In the patterned SAMs, more defects are expected on the edges of the dark
squares and after exposure to precursor, the edges of the dark squares are expected to be
decorated with Pd precursor molecules. No contrast has been observed inside the dark
squares. Therefore, from the SEM images, no conclusions can be drawn. The thickness
information from XPS and NEXAFS data also confirms that there is no difference in
height before and after exposure to precursor (1 h).
The patterned samples were also characterized by atomic force microscopy (AFM). The
AFM technique has been useful for observing the spatial distribution of different
adsorbates on a surface that differ in terminal functional groups and it can provide
excellent chemical contrast between different molecules. No features are observed in the
height mode AFM images for the patterned SAMs of BPDMAc-1. On the other hand,
height mode AFM of TPDMT SAMs that has been patterned amongst methyl-terminated
decanethiol SAMs (Fig. 61a) shows a pronounced contrast. The thiol-terminated regions
appear brighter when compared to the backfilled decanethiol regions.

111
(a) (b)(a) (b)
Figure 61: AFM images of (a) a patterned SAM of TPDMT after backfilling with
decanethiol and (b) after treatment with Cp(allyl)Pd for one hour.
Figure 61b displays the height mode AFM image obtained after treatment with palladium
precursor for one hour. A height difference of 9.3 Å and 13 Å is observed for patterned
TPDMT SAM backfilled with decanethiol and the same after treatment with precursor
respectively. The expected values are around 3.5 Å and 6.5 Å (Fig. 62). The height
results obtained from AFM are not in accordance with the expected values.
Figure 62: Schematic model illustrating the height difference before and after exposure
to Cp(allyl)Pd for One hour.
These preliminary experiments are encouraging as the patterns are clearly noticeable in
SEM. Future work has to be directed towards finding the appropriate conditions to obtain
patterned SAMs with prominent height difference between the two thiol molecules. For
example, adamantanethiol can be used for backfilling instead of decanethiol. AFM height
mode measurements can be then used to follow the reaction of Cp(allyl)Pd on the SH
terminated surface and the results can provide a better understanding on the reduced
reactivity in the case of deprotected BPDMAc-1 SAMs.

112
6. Summary
The main objective of the research reported in this dissertation is on the investigation of
the chemical reactions on the self-assembled monolayer surface. The topics described in
this thesis can be divided into the analysis of the chemical reaction on a SAM surface in
solution (deacylation reaction) and the interaction of the thiol terminated surface with an
organometallic precursor in vapor phase.
The combination of surface science techniques, infrared reflection absorption
spectroscopy (IRRAS), near edge X-ray absorption fine structure spectroscopy
(NEXAFS) and X-ray photoelectron spectroscopy (XPS) has been used in this work to
investigate the chemical reactions on organic surfaces. These techniques reveal
information about the chemical composition of the monolayers, the oxidation state of the
elements present, the orientational order and the nature of substrate-molecule binding.
The self-assembled monolayers were fabricated from two molecules namely
terphenyldimethyldithiol (TPDMT) and biphenyldimethyldithiol (deprotected BPDMAc-
1). TPDMT is known to form well-ordered SAMs on gold whereas there are some
controversies with the preparation of biphenyldimethyldithiol SAMs.
In this work, the biphenyldimethyldithiol SAMs were prepared from its monoacylated
derivative. The hydrolysis reaction condition for the formation of thiol from thioester was
optimized. The deacylation process (–SCOCH3 to –SH) was performed using a base,
sodium hydroxide. The complete conversion of the thioacetate to thiol required 84 hours.
The reaction was monitored by following the decrease of the infrared intensities of the
CO band 1695 cm-1, on removal of the acyl moieties of the thioester. The conversion of
the thioacetate to thiol was also followed by XPS and NEXAFS. Scanning electron
microscopy (SEM) is also used to follow the deprotection reaction on self-assembled
monolayers adsorbed on gold on mica. This work shows the use of SEM as an analytical
tool for understanding the reactions on SAM surfaces.

113
The deacylation reaction, which is standard in solution chemistry, is significantly
hindered when confined to a surface. Whereas the reaction in solution proceeds in
minutes, the corresponding reaction at the organic surfaces requires, depending on the
conditions, up to 84 hours. The reasons of this unexpected behavior are unraveled using
IRRAS and SEM. The experiments demonstrate that the reaction mainly occurs at
nucleation centers (e.g. defects and step edges) and the edges of reacted regime regions
and that an attack on the perfect organic surface is strongly hindered. The kinetics of the
reaction that is the time needed for the complete conversion of thioester to thiol on an
organic surface strongly depends on the substrate quality.
The metallization of an organic surface with palladium is demonstrated using the self-
assembled monolayers of terphenyldimethyldithiol and biphenyldimethyldithiol. An
organometallic precursor, (�3-allyl)(�5-cyclopentadienyl)palladium [Cp(allyl)Pd] was
used as the palladium source. The deposition and the subsequent decomposition of the
precursor on the thiol terminated self-assembled monolayers were studied using XPS,
NEXAFS and IRRAS.
The experimental results demonstrate that the chemical vapor deposition of Cp(allyl)Pd
on TPDMT SAMs result in the formation of allyl-Pd2+ covered surfaces. The presence of
palladium in the +2 oxidation state was confirmed by XPS measurements. The interaction
of the precursor with the SH terminated surface results in the elimination of the
cyclopentadienyl ligand and the allyl group is retained on the surface. The palladium
forms a bonding between the allyl group and the surface sulphur atoms. The evidence for
the presence of allyl ligand comes from the IRRAS and NEXAFS data. The allyl
terminated surface does not undergo reduction with dihydrogen gas. The reduction was
only observed in the presence of small metallic palladium particles. In this study, the Pd0
particles are formed in-situ by prolonged exposures to the Pd precursor.
The deprotected BPDMAc-1 SAMs were found to behave quite differently upon
exposure to the Pd precursor. The SAM surface was less reactive and considerably a

114
lower amount of palladium was deposited on this surface which is confirmed by XPS. As
TPDMT and dep. BPDMAc-1 are analogues, the reactivity of Cp(allyl)Pd with these
surfaces is expected to be the same. The difference between the two SAMs lies in the
preparation procedures. The terphenyldimethyldithiol SAM was prepared by a
straightforward approach (directly from the TPDMT solution in chloroform) whereas a
deprotection route was employed to prepare the biphenlydimethyldithiol SAM. Apart
from the difference in preparation methods, both surfaces should be similar. The less
reactivity of the SH terminated deprotected BPDMAc-1 surface can be accounted in
terms of small density of surface defects. Upon prolonged exposure to the precursor, the
deprotected BPDMAc-1 SAM exhibits a behavior similar to that observed for TPDMT
SAMs. A Pd2+ surface is obtained which when treated with hydrogen gas, reduction is
observed. The close packing and the steric demands for the availability of the SH groups
can hinder the surface reaction between the palladium precursor and the dep. BPDMAc-1
SAM. The formation of palladium thiolate on exposure of the SAM to the Pd precursor
depends on the availability of the hydrogen exposed at the surface, and presence of
surface H atom was found to be essential for the removal of the Cp group.
The CVD is more advantageous over thermal evaporation methods for metallization of
soft surfaces (SAMs). Generally, the diffusion of metal occurs through the structural
defects in the monolayers. The usage of high quality SAMs (e.g. TPDMT) and
introduction of chemically reactive tail groups (e.g. –SH), which can bind the metal
atoms at the SAM-ambient interface can minimize the penetration of metals. The results
from the present work shows that the deposited metal nanoparticles can be catalytically
active and can destroy the SAM resulting in the accumulation of the metal on the
substrate surface. In the present investigation, a prominent decrease of the SAM thickness
was observed for the SAM samples exposed to the precursor for 24 h followed by
reduction. Large amount of molecules comprising the SAMs has been removed. The
decomposition of the SAM molecules is catalyzed by the metallic palladium particles
formed during prolonged exposure to the palladium precursor. The CVD allows a soft
reaction when compared to physical vapour deposition methods. However, the catalytic
nature of the nanoparticles formed can oxidize the organic SAM molecules.
115
A deeper understanding of the self-assembled monolayer systems is essential in
fabricating functionalized surfaces. The results of the work described in this thesis show
that the reactions on an organic surface widely differs from the reactions in bulk. The
studies on the deacylation reaction highlight the importance of the quality of substrates
used for SAM preparation. The defects in the substrates accelerate the reaction. The
results of the chemical vapor deposition of palladium on SAMs demonstrate the
acceleration of the reaction kinetics due to the presence of defects. In addition, the results
describe the catalytic activity of the formed palladium metal nanoparticles. These
fundamental studies on the chemical reactions on dithiol SAMs widen the understanding
of the molecular behaviour of such surfaces and the findings can be extended for the
development and optimization of a suitable surface for metallization purposes.
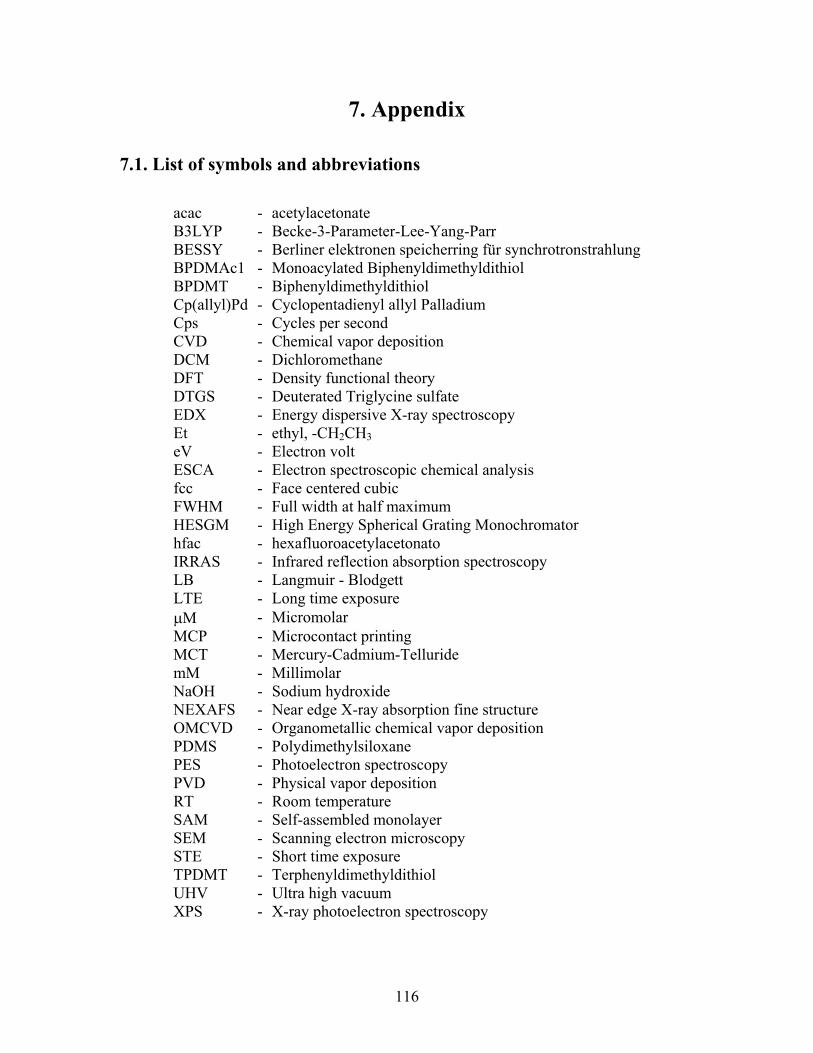
116
7. Appendix 7.1. List of symbols and abbreviations
acac - acetylacetonate B3LYP - Becke-3-Parameter-Lee-Yang-Parr BESSY - Berliner elektronen speicherring für synchrotronstrahlung BPDMAc1 - Monoacylated Biphenyldimethyldithiol BPDMT - Biphenyldimethyldithiol Cp(allyl)Pd - Cyclopentadienyl allyl Palladium Cps - Cycles per second CVD - Chemical vapor deposition DCM - Dichloromethane DFT - Density functional theory DTGS - Deuterated Triglycine sulfate EDX - Energy dispersive X-ray spectroscopy Et - ethyl, -CH2CH3 eV - Electron volt ESCA - Electron spectroscopic chemical analysis fcc - Face centered cubic FWHM - Full width at half maximum HESGM - High Energy Spherical Grating Monochromator hfac - hexafluoroacetylacetonato IRRAS - Infrared reflection absorption spectroscopy LB - Langmuir - Blodgett LTE - Long time exposure �M - Micromolar MCP - Microcontact printing MCT - Mercury-Cadmium-Telluride mM - Millimolar NaOH - Sodium hydroxide NEXAFS - Near edge X-ray absorption fine structure OMCVD - Organometallic chemical vapor deposition PDMS - Polydimethylsiloxane PES - Photoelectron spectroscopy PVD - Physical vapor deposition RT - Room temperature SAM - Self-assembled monolayer SEM - Scanning electron microscopy STE - Short time exposure TPDMT - Terphenyldimethyldithiol UHV - Ultra high vacuum XPS - X-ray photoelectron spectroscopy

117
7.2. List of figures Figure 1: (a) Schematic of SAM and (b) structure of the molecules used in this study. ---4
Figure 2: Schematic view of SAM. ----------------------------------------------------------------7
Figure 3: Schematic sketch of the different steps in SAM formation. ------------------------9
Figure 4: Alkanethiolate adlayer (filled circles) on the Au(111) surface (empty circles).
------------------------------------------------------------------------------------------------------- 12
Figure 5: Schematic illustration of the deposited metal with regard to the underlying
SAM on the Au(111) surface. -------------------------------------------------------------------- 16
Figure 6: Schematic representation of a CVD process.-------------------------------------- 17
Figure 7: Mechanism of chemical vapour deposition. --------------------------------------- 18
Figure 8: Synthesis of Cp(allyl)Pd precursor. ------------------------------------------------ 23
Figure 9: Schlenk apparatus used for metal deposition.------------------------------------- 27
Figure 10: X-ray induced electron emission process. ---------------------------------------- 29
Figure 11: XP spectra of BPDMAc-1 SAM on Au(111).------------------------------------- 30
Figure 12: Principle of NEXAFS.--------------------------------------------------------------- 32
Figure 13: NEXAFS spectra for C12SH [161] and terphenyldimethyldithiol (TPDMT)
SAMs on gold surface. ---------------------------------------------------------------------------- 33
Figure 14: Vibrational modes of H2O and CO2. ---------------------------------------------- 35
Figure 15: (a) Electric vectors of the p- and s-components of radiation incident at a
metal surface. Reflected rays - primed vectors; incident rays-unprimed vectors. (b) The
image-charge effect - parallel dipole (EX) cancellation and perpendicular dipole (EZ)
enhancement. (c) Phase shift for light reflected from surface. ------------------------------ 36
Figure 16: IRRAS of decanethiol SAM. -------------------------------------------------------- 37
Figure 17: Carbon K-edge NEXAFS spectrum of a clean gold substrate as reference. - 39
Figure 18: NEXAFS data treatment. ----------------------------------------------------------- 40
Figure 19: Low-frequency regions of (a) the calculated spectrum of TPDMT (b) the bulk
spectrum of TPDMT and (c) the SAM spectrum of TPDMT. -------------------------------- 42
Figure 20: Pellet IR spectra of (a) terphenyldimethyldithiol and (b)
terphenyldimethylthiol. Left: Region from 2700 cm-1 to 2400 cm-1; Right: Region from
1550 cm-1 to 1400 cm-1. --------------------------------------------------------------------------- 44

118
Figure 21: IRRAS of terphenyldimethyldithiol (TPDMT) SAM and terphenyldimethylthiol
(TPMT) SAM. Left: Region from 2700 cm-1 to 2400 cm-1; Right: Region from 1550 cm-1
to 1400 cm-1. --------------------------------------------------------------------------------------- 45
Figure 22: Schematic diagram showing the H/D exchange between TPDMT-SAM and
D2O. ------------------------------------------------------------------------------------------------- 46
Figure 23: C 1s and S 2p - XPS of TPDMT SAM. -------------------------------------------- 47
Figure 24: NEXAFS spectra of TPDMT SAM------------------------------------------------- 48
Figure 25: Low-frequency regions of (a) the calculated spectrum of BPDMAc-1 SAM, (b)
the bulk spectrum of BPDMAc-1 SAM, (c) the SAM spectrum of BPDMAc-1 SAM, (d) the
calculated spectrum of deprotected BPDMAc-1 SAM and (e) the SAM spectrum of
deprotected BPDMAc-1.-------------------------------------------------------------------------- 50
Figure 26: XPS of deprotected BPDMAc-1 SAM. -------------------------------------------- 51
Figure 27: NEXAFS of deprotected BPDMAc-1 SAM.--------------------------------------- 52
Figure 28: Thickness estimation from the edge jump in C K-edge NEXAFS. ------------- 53
Figure 29: Schematic flowchart illustrating the deprotection mechanism of the
deacylation process.------------------------------------------------------------------------------- 56
Figure 30: IRRAS of BPDMAc-1 and deprotected BPDMAc-1. ---------------------------- 57
Figure 31a: NEXAFS spectra of BPDMAc1 and deprotected BPDMAc-1. --------------- 58
Figure 31b: NEXAFS spectrum of BPDMAc1 at different incidence angles. ------------- 59
Figure 32: XP spectra of BPDMAc1 and deprotected BPDMAc-1.------------------------ 60
Figure 33: IRRAS showing the deacylation reaction at different immersion time in the
basic solution.-------------------------------------------------------------------------------------- 62
Figure 34: The difference in deprotection kinetics by the change in the nature of the gold
substrate. ------------------------------------------------------------------------------------------- 63
Figure 35: SEM images of BPDMAc-1 and deprotected BPDMAc-1 SAM. -------------- 65
Figure 36: Schematic model showing the possibility for the attack of the hydroxide ion.67
Figure 37: Illustration of the structure of a TPDMT SAM on gold. ------------------------ 72
Figure 38: XP spectra of the Pd 3d region of a TPDMT SAM exposed to Cp(allyl)Pd for
(a) 1 hour and (b) the same treated with hydrogen gas.-------------------------------------- 74
Figure 39: XP spectra of the Pd 3d region of a TPDMT SAM exposed to Cp(allyl)Pd for
(a) 24 hours and (b) the same treated with hydrogen gas. ----------------------------------- 75

119
Figure 40: S 2p spectra of Pd covered TPDMT/Au and hydrogen gas exposed samples.77
Figure 41: C 1s spectra of Pd covered TPDMT/Au and hydrogen gas exposed samples.79
Figure 42: NEXAFS spectra of Pd covered TPDMT/Au and hydrogen gas exposed
samples.--------------------------------------------------------------------------------------------- 80
Figure 43: 90°-55° difference spectra of Pd covered TPDMT/Au and hydrogen gas
exposed samples. ---------------------------------------------------------------------------------- 81
Figure 44: Difference spectra of precursor exposed samples and the TPDMT SAM. --- 82
Figure 45: Infrared spectroscopic data of TPDMT SAM and Pd precursor treated SAMs.
------------------------------------------------------------------------------------------------------- 84
Figure 46: IR spectra of bulk Cp(allyl)Pd in KBr (bottom curve) and calculated IR
spectrum of Cp(allyl)Pd (upper curve). -------------------------------------------------------- 85
Figure 47: SEM image of Pd clusters on a TPDMT SAM exposed to Cp(allyl)Pd for 24
hours followed by the treatment with hydrogen gas.------------------------------------------ 86
Figure 48a: Illustration of the formation of disordered layers via disulfide linkages for
the BPMDT molecule. Adapted from reference [7]. ------------------------------------------ 87
Figure 48b: Illustration of the formation of a deprotected BPDMAc-1 SAM on gold. -- 88
Figure 49: XP spectra of the Pd 3d region of a deprotected BPDMAc-1 SAM exposed to
Cp(allyl)Pd for 1 hour. --------------------------------------------------------------------------- 89
Figure 50: XP spectra of the Pd 3d region of a deprotected BPDMAc-1 SAM exposed to
Cp(allyl)Pd for (a) 24 hours and (b) the same treated with hydrogen gas.---------------- 90
Figure 51: S 2p spectra of Pd covered deprotected BPDMAc-1/Au and hydrogen gas
exposed samples. ---------------------------------------------------------------------------------- 92
Figure 52: C 1s spectra of Pd covered deprotected BPDMAc-1/Au and hydrogen gas
exposed samples. ---------------------------------------------------------------------------------- 93
Figure 53: NEXAFS spectra of Pd covered deprotected BPDMAc-1/Au and hydrogen gas
exposed samples. ---------------------------------------------------------------------------------- 94
Figure 54: 90°-55° difference spectra of Pd covered deprotected BPDMAc-1/Au and
hydrogen gas exposed samples. ----------------------------------------------------------------- 95
Figure 55: Difference spectrum of precursor exposed samples and the deprotected
BPDMAc-1 SAM. ---------------------------------------------------------------------------------- 96
Figure 56: Schematic reaction of Cp(allyl)Pd with thiols in solution. --------------------- 97

120
Figure 57: Plot of intensity ratios (C 1s/Au 4f, S 2p/Au 4f).--------------------------------101
Figure 58: Thickness estimation from the edge jump in C K-edge NEXAFS. (a) TPDMT
samples and (b) dep.BPDMAc-1 samples. ----------------------------------------------------103
Figure 59: Schematic model showing the deposition of Cp(allyl)Pd and the subsequent
reduction to metallic palladium on TPDMT-SAM.-------------------------------------------105
Figure 60: SEM image of a patterned SAM formed by �CP. Dark squares corresponded
to SAMs terminated by SH; light regions corresponded to CH3 terminated SAMs.------110
(a) Patterned SAMs of deprotected BPDMAc-1 and (b) patterned SAMs of TPDMT. --110
Figure 61: AFM images of (a) a patterned SAM of TPDMT after backfilling with
decanethiol and (b) after treatment with Cp(allyl)Pd for one hour. -----------------------111
Figure 62: Schematic model illustrating the height difference before and after exposure
to Cp(allyl)Pd for One hour. --------------------------------------------------------------------111
7.3. List of tables Table 1: Examples for different metal deposition methods on organic thin films.-------- 20
Table 2: Assignment of the photoelectron lines.----------------------------------------------- 30
Table 3: C 1s and S 2p peak fit data of TPDMT SAM. --------------------------------------- 46
Table 4: C 1s and S 2p peak fit data of deprotected BPDMAc-1 SAM. -------------------- 52
Table 5: Pd 3d5/2 peak fit data of Pd deposited TPDMT SAM.------------------------------ 75
Table 6: S 2p peak fit data of Pd deposited TPDMT SAM ----------------------------------- 78
Table 7: C 1s peak fit data of Pd deposited TPDMT SAM. ---------------------------------- 79
Table 8: Calculated and observed vibrational frequencies of Cp(allyl)Pd and the IR
frequencies of the precursor treated TPDMT SAMs. ----------------------------------------- 85
Table 9: Pd 3d5/2 peak fit data of Pd deposited deprotected BPDMAc-1 SAM.----------- 90
Table 10: S 2p peak fit data of Pd deposited deprotected BPDMAc-1 SAM.-------------- 91
Table 11: C 1s peak fit data of Pd deposited deprotected BPDMAc-1 SAM.-------------- 93
Table 12: Thickness of the Pd covered TPDMT SAM samples. ----------------------------100
Table 13: Thickness of the Pd covered deprotected BPDMAc-1 SAM samples. ---------101
121
8. References
1. O. Dannenberger, K. Weiss, C. Wöll, M. Buck, Phys. Chem. Chem. Phys., 2000,
2, (1509-1514). Reactivity of self-assembled monolayers: formation of organized amino functionalities.
2. V. Chechik, C. M. Stirling, Langmuir, 1997, 13, (6354-6356). Reactivity in Monolayers versus Bulk Media: Intra- and Intermolecular Aminolysis of Esters.
3. X. M. Li, J. Huskens, D. N. Reinhoudt, J. Mater. Chem., 2004, 14, (2954-2971). Reactive self-assembled monolayers on flat and nanoparticle surfaces, and their application in soft and scanning probe lithographic nanofabrication technologies.
4. T. P. Sullivan, W. T. S. Huck, Eur. J. Org. Chem., 2003, (17-29). Reactions on Monolayers: Organic Synthesis in Two Dimensions.
5. V. Chechik, R. M. Crooks, C. M. Stirling, Adv. Mater., 2000, 12, (1161-1171). Reactions and Reactivity in Self-Assembled Monolayers.
6. Y. Tai, A. Shaporenko, H. Noda, M. Grunze, M. Zharnikov, Adv. Mater., 2005, 17, (1745-1749). Fabrication of stable metal films on the surface of self assembled monolayers.
7. W. Azzam, B. I. Wehner, R. A. Fischer, A. Terfort, C. Wöll, Langmuir, 2002, 18, (7766-7769). Bonding and Orientation in Self-Assembled Monolayers of Oligophenyldithiols on Au Substrates.
8. Y. Tai, A. Shaporenko, M. Grunze, M. Zharnikov, J. Phys. Chem. B, 2005, 109, (19411-19415). Effect of Irradiation Dose in Making an Insulator from a Self-Assembled Monolayer.
9. A. Niklewski, W. Azzam, T. Strunskus, R. A. Fischer, C. Wöll, Langmuir 2004, 20, (8620-8624). Fabrication of Self-Assembled Monolayers Exhibiting a Thiol-Terminated Surface.
10. J. C. Love, L. A. Estroff, J. K. Kriebel, R. G. Nuzzo, G. M. Whitesides, Chem.Rev., 2005, 105, (1103-1169). Self-Assembled Monolayers of Thiolates on Metals as a Form of Nanotechnology.
11. E. M. McCash, Oxford Universtiy Press Inc., New York, 2001. Surface Chemistry.
12. D. Witt, R. Klajn, P. Barski, B. A. Grzybowski, Curr. Org. Chem., 2004, 8, (1763-1797). Applications, Properties and Synthesis of �-Functionalized n-Alkanethiols and Disulfides - the Building Blocks of Self-Assembled Monolayers.
13. J. Wang, H. Wu, L. Angnes, Anal. Chem., 1993, 65, (1893-1896). On-line monitoring of hydrophobic compounds at self-assembled monolayer modified amperometric flow detectors.
14. D. L. Angst, G. W. Simmons, Langmuir, 1991, 7, (2236-2242). Moisture absorption characteristics of organosiloxane self-assembled monolayers.
15. B. Franklin, W. Brownrigg, M. Farish, Philos. Trans. R. Soc. London, 1774, 64, (445-460). Of the Stilling of Waves by means of Oil. Extracted from Sundry Letters between Benjamin Franklin, William Brownrigg and the Reverend Mr. Farish.
16. A. Pockels, Nature, 1891, 43, (437-439). Surface tension.

122
17. I. Langmuir, J. Am. Chem. Soc., 1848, 39, (1848-1906). The constitution and fundamental properties of solids and liquids. $$. Liquids.
18. K. Blodgett, J. Am. Chem. Soc., 1934, 56, (495). Monomolecular films of fatty acids on glass.
19. W. C. Bigelow, D. L. Pickett, W. A. Zisman, J. Colloid Interface Sci., 1946, 1, (513-538). Oleophobic monolayers. I. Films adsorbed from solution in non-polar liquids.
20. F. Schreiber, Prog. Surf. Sci., 2000, 65, (151-256). Structure and growth of self-assembling monolayers.
21. G. G. Roberts, Contemp. Phys., 1984, 25, (109-128). Langmuir-Blodgett Films. 22. G. Witte, C. Wöll, J. Mater. Res., 2004, 19, (1889-1916). Growth of aromatic
molecules on solid substrates for applications in organic electronics. 23. S. R. Forrest, Chem. Rev., 1997, 97, (1793-1896). Ultrathin Organic Films Grown
by Organic Molecular Beam Deposition and Related Techniques. 24. G. M. Whitesides, B. Grzyboski, Science, 2002, 295, (2418-2421). Self-Assembly
at All Scales. 25. A. Ulman, Chem. Rev., 1996, 96, (1533-1554). Formation and Structure of Self-
Assembled Monolayers. 26. A. Ulman, Academic Press Inc., San Diego, 1991. An Introduction to Ultrathin
Organic Films: From Langmuir-Blodgett to Self Assembly. 27. E. Delamarche, B. Michel, H. A. Biebuyck, C. Gerber, Adv. Mater., 1996, 8,
(719-&). Golden interfaces: The surface of self-assembled monolayers. 28. L. H. Dubois, R. G. Nuzzo, Annu. Rev. Phys. Chem., 1992, 43, (437-463).
Synthesis, Structure, and Properties of Model Organic Surfaces. 29. A. Badia, R. B. Lennox, L. Reven, Acc. Chem. Res., 2000, 33, (475-481). A
dynamic view of self-assembled monolayers. 30. Q. Jin, J. A. Rodriguez, C. Z. Li, Y. Darci, N. J. Tao, Surf. Sci., 1999, 425, (101-
111). Self-assembly of aromatic thiols on Au(111). 31. R. G. Nuzzo, D. L. Allara, J. Am. Chem. Soc., 1983, 105, (4481-4483).
Adsorption of Bifunctional Organic Disulfides on Gold Surfaces. 32. K. Stolarczyk, R. Bilewicz, Electrochim. Acta, 2006, 51, (2358-2365). Electron
transport through alkanethiolate films decorated with monolayer protected gold clusters.
33. V. Chechick, C. M. Stirling, John Wiley & Sons. Ltd., England, 1999. Gold-thiol self assembled monolayers.
34. M. A. Chesters, G. A. Somorjai, Surf. Sci., 1975, 52, (21-28). The chemisorption of oxygen, water and selected hydrocarbons on the (111) and stepped gold surfaces.
35. M. J. Ford, C. Masens, M. B. Cortie, Surf. Rev. Lett., 2006, 13, (297–307). The application of gold surfaces and particles in nanotechnology.
36. C. D. Bain, E. B. Troughton, Y.-T. Tao, J. Evall, G. M. Whitesides, R. G. Nuzzo, J. Am. Chem. Soc., 1989, 111, (321-335). Formation of monolayer films by the spontaneous assembly of organic thiols from solution onto gold.
37. R. G. Nuzzo, F. A. Fusco, D. L. Allara, J. Am. Chem. Soc., 1987, 109, (2358). Spontaneously Organized Molecular Assemblies. 3.Preparation and Properties of Solution Adsorbed Monolayers of Organic Disulfides on Gold Surfaces.

123
38. M. C. Daniel, D. Astruc, Chem. Rev., 2004, 104, (293-346). Gold Nanoparticles: Assembly, Supramolecular Chemistry,Quantum-Size-Related Properties, and Applications toward Biology, Catalysis, and Nanotechnology.
39. C. Wöll, S. Chiang, R. J. Wilson, P. H. Lippel, Phys. Rev. B 1989, 39, (7988-7991). Determination of atom positions at stacking-fault dislocations on Au(111) by scanning tunneling microscopy.
40. C. B. Carter, R. Q. Hwang, Phys. Rev. B, 1995, 51, (4730-4733). Dislocations and reconstruction of (111) fcc metal surfaces.
41. C. Vericat, M. E. Vela, G. A. Benitez, J. A. M. Gago, X. Torrelles, R. C. Salvarezza, J. Phys.: Condens. Matter, 2006, 18, (R867-R900). Surface characterization of sulfur and alkanethiol self-assembled monolayers on Au(111).
42. C. Vericat, M. E. Vela, R. C. Salvarezza, Phys. Chem. Chem. Phys., 2005, 7, (3258-3268). Self-assembled monolayers of alkanethiols on Au(111): surface structures, defects and dynamics.
43. G. E. Poirier, Chem. Rev., 1997, 97, (1117-1127). Characterization of organosulfur molecular monolayers on Au(111) using scanning tunneling microscopy.
44. K. Edinger, A. Gölzhäuser, K. Demota, C. Wöll, M. Grunze, Langmuir, 1993, 9, (4-8). Formation of Self-Assembled Monolayers of n-Alkanethiols on Gold: A Scanning Tunneling Microscopy Study on the Modification of Substrate Morphology.
45. C. R. Mayer, S. Neveu, V. Cabuil, Adv. Mater., 2002, 14, (595-597). 3D Hybrid nanonetworks from gold funtionalized nanoparticles.
46. N. Balachander, C. N. Sukenik, Langmuir, 1990, 6, (1621-1627). Monolayer transformation by nucleophilic substitution: Applications to the creation of new monolayer assemblies.
47. G. E. Fryxell, P. C. Rieke, L. L. Wood, M. H. Engelhard, R. E. Williford, G. L. Graff, A. A. Campbell, R. J. Wiacek, L. Lee, A. Halverson, Langmuir, 1996, 12, (5064 - 5075). Nucleophilic Displacements in Mixed Self-Assembled Monolayers.
48. T. Vallant, W. Simanko, H. Brunner, U. Mayer, H. Hoffmann, R. Schmid, K. Kirchner, R. Svagera, G. Schügerl, M. Ebel, Organometallics, 1999, 18, (3744-3749). Comparing Reactivities of Metal Complexes in Solution and on Surfaces by IR Spectroscopy and Time-Resolved in Situ Ellipsometry.
49. T. Lummerstorfer, H. Hoffmann, J. Phys. Chem. B, 2004, 108, (3963-3966). Click Chemistry on Surfaces: 1,3-Dipolar Cycloaddition Reactions of Azide-Terminated Monolayers on Silica.
50. J. Luo, S. S. Isied, Langmuir, 1998, 14, (3602-3606). Ruthenium Tetraammine Chemistry of Self-Assembled Monolayers on Gold Surfaces: Substitution and Reactivity at the Monolayer Interface.
51. I. S. Choi, Y. S. Chi, Angew. Chem. Int. Ed., 2006, 45, (4894-4897). Surface Reactions On Demand: Electrochemical Control of SAM-Based Reactions.
52. V. Chechik, C. M. Stirling, John Wiley & Sons. Ltd., England, 1999. Gold-thiol self assembled monolayers.
53. C. J. Michejda, S. R. Koepke, J. Am. Chem. Soc., 1978, 100, (1959-1960). Powerful anchimeric effect of the N-nitroso group.

124
54. F. Ruff, Á. Kucsman, J. Chem. Soc., Perkin Trans. II, 1988, (1123-1128). Electronic effect, steric hindrance, and anchimeric assistance in oxidation of sulphides. Neighbouring-group participation through sulphur-oxygen non-bonded interaction.
55. M. N. Yousaf, E. W. L. Chan, M. Mrksich, Angew. Chem. Int. Ed., 2000, 39, (1943-1946). The kinetic order of an interfacial Diels-Alder reaction depends on the environment of the immolized dienophile.
56. J. Wang, J. R. Kenseth, V. W. Jones, J. D. Green, M. T. McDermott, M. D. Porter, J. Am. Chem. Soc., 1997, 119, (12796-12799). SFM Tip assisted Hydrolyis of a Dithiobis(succinimidoundecanoate) Monplaer Chemisorbed on a Au(111) Surface.
57. D. A. Krapchetov, H. Ma, A. K. Y. Jen, D. A. Fischer, Y. L. Loo, Langmuir, 2005, 21, (5887-5893). Solvent-Dependent Assembly of Terphenyl- and Quaterphenyldithiol on Gold and Gallium Arsenide.
58. Y. Wolman, John Wiley & Sons. Ltd., England, 1974. Protection of the thiol group.
59. J. M. Tour, L. JonesII, D. L. Pearson, J. J. S. Lamba, T. P. Burgin, G. M. Whitesides, D. L. Allara, A. N. Parikh, S. V. Atre, J. Am. Chem. Soc., 1995, 117, (9529-9534). Self- Assembled Monolayers and Multilayers of Conjugated Thiols,Dithiols, and Thioacetyl-Containing Adsorbates.Understanding Attachments between Potential Molecular Wires and Gold Surfaces.
60. A. Shaporenko, M. Elbing, A. Baszczyk, C. Hanisch, M. Mayor, M. Zharnikov, J.Phys. Chem. B, 2006, 110, (4307-4317). Self-assembled monolayers from biphenyldithiol derivatives: Optimization of the deprotection procedure and effect of the molecular conformation.
61. P. Neogi, S. Neogi, C. M. Stirling, J. Chem. Soc., Chem. Commun., 1993, (1134-1136). Reactivity of carboxy esters in gold-thiol monolayers.
62. H. Schönherr, V. Chechik, C. M. Stirling, G. J. Vancso, J. Am. Chem. Soc., 2000, 122, (3679-3687). Monitoring surface reactions at an AFM tip: An approach to follow reaction kinetics in self-assembled monolayers on the nanometer scale.
63. Z. Zhu, T. A. Daniel, M. Maitani, O. M. Cabarcos, D. L.Allara, N. Winograd, J.Am. Chem. Soc., 2006, 128, (13710-13719). Controlling Gold Atom Penetration through Alkanethiolate Self-Assembled Monolayers on Au{111} by Adjusting Terminal Group Intermolecular Interactions.
64. B. S. Lim, A. Rahtu, R. G. Gordon, Nat. Mater., 2003, 2, (749-754). Atomic layer deposition of transition metals.
65. K. L. Choy, Prog. Mater. Sci, 2003, 48, (57-170). Chemical vapour deposition of coatings.
66. W. A. Bryant, J. Mater. Sci., 1977, 12, (1285-1306). The fundamentals of chemical vapour deposition.
67. P. D. Dapkus, Ann. Rev. Mater. Sci., 1982, 12, (243-269). Metal organic Chemical Vapor Deposition.
68. A. Zinn, B. Niemer, H. D. Kaesz, Adv. Mater., 1992, 4, (375-378). Reaction Pathways in Organometallic Chemical Vapor Deposition (OMCVD).

125
69. M. Manolova, V. Ivanova, D. M. Kolb, H.-G. Boyen, P. Ziemann, M. Büttner, A. Romanyuk, P. Oelhafen, Surf. Sci., 2005, 590, (146-153). Metal deposition onto thiol-covered gold: Platinum on a 4-mercaptopyridine SAM.
70. W. Deng, L. Yang, D. Fujita, H. Nejoh, C. Bai, Appl. Phys. A: Mater. Sci. Process, 2000, 71, (639-642). Silver ions adsorbed to self-assembled monolayers of alkanedithiols on gold surfaces form Ag-dithiol-Au multilayer structures.
71. X. Zhongdang, X. Minhua, G. Jianhua, H. Dang, L. Zuhong, Mater. Chem. Phys., 1998, 52, (170-174). Ti-based oxide thin films deposited from solution on self-assembly monolayer.
72. B. Jin, S. Ding, K. Kametani, T. Nakamura, Chem. Lett., 2005, 34, (302-303). The Preparation and Electrochemical Behavior of Density-controlled Gold Nano-particle Self-assembled Interface.
73. V. L. Colvin, A. N. Goldstein, A. P. Alivisatos, J. Am. Chem. Soc., 1992, 114, (5221-5230). Semiconductor Nanocrystals Covalently Bound to Metal Surfaces with Self-Assembled Monolayers.
74. M. J. Esplandiu, P. L. M. Noeske, Appl. Surf. Sci., 2002, 199, (166-182). XPS investigations on the interactions of 1,6-hexanedithiol/Au(111) layers with metallic and ionic silver species.
75. M. J. Tarlov, Langmuir, 1992, 8, (80-89). Silver Metalization of Octadecanethiol Monolayers Self -Assembled on Gold.
76. T. Ohgi, H.-Y. Sheng, H. Nejoh, Appl. Surf. Sci., 1998, 130-132, (919-924). Au particle deposition onto self-assembled monolayers of thiol and dithiol molecules.
77. Z. Zhu, D. L. Allara, N. Winograd, Appl. Surf. Sci., 2006, 252, (6686-6688). Chemistry of metal atoms reacting with alkanethiol self-assembled monolayers.
78. K. Schouteden, N. Vandamme, E. Janssens, P. Lievens, C. V. Haesendonck, Surf.Sci., 2008, 602, (552-558). Single-electron tunneling phenomena on preformed gold clusters deposited on dithiol self-assembled monolayers.
79. N. Vandamme, J. Snauwaert, E. Janssens, E. Vandeweert, P. Lievens, C. V. Haesendonck, Surf. Sci., 2004, 558, (57-64). Visualization of gold clusters deposited on a dithiol self-assembled monolayer by tapping mode atomic force microscopy.
80. Q. Guo, X. Sun, Y. Chen, R. E. Palmer, Surf. Sci., 2002, 497, (269–274). Controlling the formation of Au nanoparticles using functionalized molecular buffer layers.
81. B. deBoer, M. M. Frank, Y. J. Chabal, W. Jiang, E. Garfunkel, Z. Bao, Langmuir2004, 20, (1539-1542). Metallic Contact Formation for Molecular Electronics: Interactions between Vapor-Deposited Metals and Self-Assembled Monolayers of Conjugated Mono- and Dithiols.
82. A. V. Walker, T. B. Tighe, B. C. Haynie, S. Uppili, N. Winograd, D. L. Allara, J.Phys. Chem. B, 2005, 109, (11263-11272). Chemical Pathways in the Interactions of Reactive Metal Atoms with Organic Surfaces: Vapor Deposition of Ca and Ti on a Methoxy-Terminated Alkanethiolate Monolayer on Au.
83. E. L. Smith, C. A. Alves, J. W. Anderegg, M. D. Porter, L. M. Siperko, Langmuir, 1992, 8, (2707-2714). Deposition of Metal Overlayers at End-Group-Functionalized Thiolate Monolayers Adsorbed at Au. 1. Surface and Interfacial
126
Chemical Characterization of Deposited Cu Overlayers at Carboxylic Acid-Terminated Structures.
84. F. Anariba, J. K. Steach, R. L. McCreery, J. Phys. Chem. B, 2005, 109, (11163-11172). Strong Effects of Molecular Structure on Electron Transport in Carbon/Molecule/Copper Electronic Junctions.
85. D. R. Jung, A. W. Czanderna, Appl. Surf. Sci., 1996, 99, (161-168). X-ray photoelectron spectroscopy of Cr/COOCH3 interfaces on self-assembled monolayers of 16-mercaptohexadecanoate.
86. T. Strunskus, M. Grunze, G. Kochendoerfer, C. Wöll, Langmuir, 1996, 12, (2712-2725). Identification of Physical and Chemical Interaction Mechanisms for the Metals Gold, Silver, Copper, Palladium, Chromium and Potassium with Polyimide Surfaces.
87. D. Wacker, K. Weiss, U. Kazmaier, C. Wöll, Langmuir 1997, 13, (6689-6696). Realization of a Phenyl-Terminated Organic Surface and Its Interaction with Chromium Atoms.
88. A. V. Walker, T. B. Tighe, O. Cabarcos, B. C. Haynie, D. L. Allara, N. Winograd, J. Phys. Chem. C, 2007, 111, (765-772). Dynamics of Interaction of Magnesium Atoms on Methoxy-Terminated Self-Assembled Monolayers: An Example of a Reactive Metal with a Low Sticking Probability.
89. Y. Tai, A. Shaporenko, W. Eck, M. Grunze, M. Zharnikov, Appl. Phys. Lett., 2004, 85, (6257-6259). Abrupt change in the structure of self-assembled monolayers upon metal evaporation.
90. J. J. Senkevich, F. Tang, D. Rogers, J. T. Drotar, C. Jezewski, W. A. Lanford, G. C. Wang, T. M. Lu, Chem. Vap. Deposition, 2003, 9, (258-264). Substrate-independent palladium atomic layer deposition.
91. E. A. Speets, B. Dordi, B. J.Ravoo, N. Oncel, A. S. Hallbaeck, H. J. W. Zandvliet, B. Poelsema, G. Rijnders, D. H. A. Blank, D. N. Reinhoudt, Small, 2005, 1, (395-398). Noble metal nanoparticles deposited on self-assembled monolayers by pulsed laser deposition show Coulomb blockade at room temperature.
92. N. L. Jeon, W. Lin, M. K. Erhardt, G. S. Girolami, R. G. Nuzzo, Langmuir, 1997, 13, (3833-3838). Selective Chemical Vapor Deposition of Platinum and Palladium Directed by Monolayers Patterned Using Microcontact Printing.
93. N. L. Jeon, P. G. Clem, D. A. Payne, R. G. Nuzzo, Langmuir, 1996, 12, (5350-5355). A Monolayer-Based Lift-Off Process for Patterning Chemical Vapor Deposition Copper Thin Films.
94. U. Weckenmann, S. Mittler, S. Krämer, A. K. A. Aliganga, R. A. Fischer, Chem.Mater., 2004, 16, (621-628). A Study on the Selective Organometallic Vapor Deposition of Palladium onto Self-assembled Monolayers of 4,4'-Biphenyldithiol, 4-Biphenylthiol, and 11-Mercaptoundecanol on Polycrystalline Silver.
95. O. Shekhah, C. Busse, A. Bashir, F. Turcu, X. Yin, P. Cyganik, A. Birkner, W. Schuhmann, C. Wöll, Phys. Chem. Chem. Phys., 2006, 8, (3375–3378). Electrochemically deposited Pd islands on an organic surface: the presence of Coulomb blockade in STM I(V) curves at room temperature.
96. T. Baunach, V. Ivanova, D. M. Kolb, H. G. Boyen, P. Ziemann, M. Büttner, P. Oelhafen, Adv. Mater., 2004, 16, (2024-2028). A new approach to the

127
electrochemical metallization of organic monolayers:Palladium deposition onto a 4,4' dithiodipyridine self assembled monolayer.
97. M. Manolova, M. Kayser, D. M. Kolb, H.-G. Boyen, P. Ziemann, D. Mayer, A. Wirth, Electrochim. Acta, 2007, 52, (2740-2745). Rhodium deposition onto a 4-mercaptopyridine SAM on Au(111).
98. D. Qu, K. Uosaki, J. Phys. Chem. B, 2006, 110, (17570-17577). Electrochemical Metal Deposition on Top of an Organic Monolayer.
99. D. Qu, K. Uosaki, Chem. Lett., 2006, 35, (258-259). Platinum Layer Formation on a Self-assembled Monolayer by Electrochemical Deposition.
100. T. Hirsch, M. Zharnikov, A. Shaporenko, J. Stahl, D. Weiss, O. S. Wolfbeis, V. M. Mirsky, Angew. Chem. Int. Ed. , 2005, 44, (6775 –6778). Size-Controlled Electrochemical Synthesis of Metal Nanoparticles on Monomolecular Templates.
101. H. Hagenström, M. J. Esplandiu, D. M. Kolb, Langmuir, 2001, 17, Functionalized Self-Assembled Alkanethiol Monolayers on Au(111) Electrodes: 2. Silver Electrodeposition.
102. M. J. Esplandiu, H. Hagenström, Solid State Ionics, 2002, 150, (39– 52). Functionalized self-assembled monolayers and their influence on silver electrodeposition.
103. S. Langerock, H. Menard, P. Rowntree, L. Heerman, Langmuir, 2005, 21, (5124-5133). Electrocrystallization of Rhodium Clusters on Thiolate-Covered Polycrystalline Gold.
104. J. W. F. Robertson, D. J. Tiani, J. E. Pemberton, Langmuir, 2007, 23, (4651-4661). Underpotential Deposition of Thallium, Lead, and Cadmium at Silver Electrodes Modified with Self-Assembled Monolayers of (3-Mercaptopropyl)trimethoxysilane.
105. J. B. Nelson, D. T. Schwartz, Langmuir, 2007, 23, (9661-9666). Electrochemical Factors Controlling the Patterning of Metals on SAM-Coated Substrates.
106. H. Kind, A. M. Bittner, O. Cavalleri, K. Kern, T. Greber, J. Phys. Chem. B, 1998, 102, (7582-7589). Electroless Deposition of Metal Nanoislands on Aminothiolate-Functionalized Au(111) Electrodes.
107. L. N. Xu, J. H. Liao, L. Huang, D. L. Ou, Z. R. Guo, H. Q. Zhang, C. W. Ge, N. Gu, J. Z. Liu, Thin Solid Films, 2003, 434, (121-125). Surface-bound nanoparticles for initiating metal deposition.
108. L. N. Xu, J. H. Liao, L. Huang, N. Gu, H. Q. Zhang, J. Z. Liu, Appl. Surf. Sci., 2003, 211, (184-188). Pendant thiol groups-attached Pd(II) for initiating metal deposition.
109. D. B. Wolfe, J. C. Love, K. E. Paul, M. L. Chabinyc, G. M. Whitesides, Appl.Phys. Lett., 2002, 80, (2222-2224). Fabrication of palladium-based microelectronic devices by microcontact printing.
110. J. C. Love, D. B. Wolfe, R. Haasch, M. L. Chabinyc, K. E. Paul, G. M. Whitesides, R. G. Nuzzo, J. Am. Chem. Soc., 2003, 125, (2597-2609). Formation and structure of self-assembled monolayers of alkanethiolates on palladium.
111. Z. Yang, A. B. Smetana, C. M. Sorensen, K. J. Klabunde, Inorg. Chem., 2007, 46, (2427-2431). Synthesis and Characterization of a New Tiara Pd(II) Thiolate Complex and Its Solution-Phase Thermolysis to Prepare Nearly Monodisperse Palladium Sulfide Nanoparticles.
128
112. A. Tungler, G. Fogassy, J. Mol. Catal. A, 2001, 173, (231-247). Catalysis with supported palladium metal, selectivity in the hydrogenation of C=C, C=O and C=N bonds,from chemo- to enantioselectivity.
113. V. K. Wunder, S. Schmid, N. Popovska, G. Emig, Surf. Coat. Technol., 2002, 151, (96–99). MOCVD of palladium films: kinetic aspects and film properties.
114. W. Lin, T. H. Warren, R. G. Nuzzo, G. S. Girolami, J. Am. Chem. Soc., 1993, 115, (11644-11645). Surface-Selective Deposition of Palladium and Silver Films from Metal-Organic Precursors: A Novel Metal-Organic Chemical Vapor Deposition Redox Transmetalation Process.
115. A. Zinn, L. Brandt, H. D. Kaesz, R. F. Hicks, Wiley-VCH, New York, 1994. Chemical vapor deposition of Platinum, Palladium and Nickel - Chapter 7 of The Chemistry of Metal CVD.
116. Z. Yuan, R. L. Puddephat, Adv. Mater., 1994, 6, (51-54). Allyl(%-diketonato)palladium($$) Complexes as Precursors for Palladium Films.
117. A. Gräfe, R. Heinen, F. Klein, T. Kruck, M. Scherer, M. Schober, Appl. Surf. Sci., 1995, 91, (187-191). Precursor development for the chemical vapor deposition of aluminium, copper and palladium.
118. G. Carturan, G. Strukul, J. Organomet. Chem., 1978, 157, (475-481). Activation of molecular hydrogen with allylpalladium(II) derivatives. Selective catalytic hydrogenation of allene to propene. .
119. R. D. Ernst, Acc. Chem. Res., 1985, 18, (56-62). Metal-Pentadienyl Chemistry. 120. G. Wilke, B. Bogdanovic, P. Hardt, P. Heimbach, W. Keim, M. Kroner, W.
Oberkirch, K. Tanaka, E. Steinrucke, D. Walter, H. Zimmermann, Angew. Chem. Int. Ed., 1966, 5, (151-266). Allyl Transition Metal Systems.
121. B. L. Shaw, Proc. Chem. Soc., 1960, (247). Allyl(cyclopentadienyl)palladium($$). 122. Y. Tatsuno, T. Yoshida, S. Otsuka, Inorg. Synthesis, 1979, 19, (220-223). (�3-
Allyl)palladium($$) complexes. 123. E. Feurer, H. Suhr, Thin Solid Films, 1988, 157, (81-86). Thin Palladium Films
prepared by metal-organic plasma-enhanced chemical vapour deposition. 124. M. K. Minasyan, S. P. Gubin, Y. T. Struchkov, Zh. Strukt. Khim., 1966, 7, (906-
907). Structure of&allylcyclopentadienylpalladium. 125. M. K. Minasyants, Y. T. Struchkov, Zh. Strukt. Khim., 1968, 9, (481-487). Crystal
and molecular structures of allylcyclopentadienylpalladium. 126. S. P. Gubin, A. Z. Rubezhow, B. L. Winch, A. N. Nesmeyanov, Tetrahedron
Lett., 1964, 39, (2881-2887). Cleavage of the cyclopentadienyl-palladium bond in cyclopentadienylallylpalladium.
127. K. G. Shalnova, O. F. Rachkova, I. A. Teplova, G. A. Razuvaev, G. A. Abakumov, Izv. Akad. Nauk SSSR., Ser. Khim., 1978, 10, (2422-2424). Reactivity of allylcyclopentadienylpalladium.
128. J. E. Gozum, D. M. Pollina, J. A. Jensen, G. S. Girolami, J. Am. Chem. Soc., 1988, 110, (2688-2689). Tailored organometallics as precursors for the chemical vapor deposition of high purity Palladium and Platinum thin films.
129. C. S. Jun, K. H. Lee, J. Membr. Sci., 1999, 157, (107-115). Preparation of palladium membranes from the reaction of Pd(C3H5)(C5H5) with H2: wet-impregnated deposition.

129
130. L. A. Leites, V. J. Aleksanyan, T. B. Chenskaya, Dokl. Akad. Nauk SSSR. Phys. Chem., 1974, 215, (634-637). Analysis of �-allyl ligand vibrations in spectra of �-allyl complexes of transition metals.
131. H. P. Fritz, Chem. Ber., 1961, 94, (1217-1224). Spectroscopic investigations on organometallic compounds. IV. Infrared spectra of complexes of some allyl derivatives.
132. X. R. Li, J. S. Tse, G. M. Bancroft, R. J. Puddephatt, K. H. Tan, Organometallics, 1995, 14, (4513-4520). Variable Energy Photoelectron Spectroscopy of (C5H5)M(C3H5) (M=Ni and Pd): Molecular Orbital Assignments.
133. R. B. King, Appl. Spectrosc., 1969, 23, (148-156). Mass spectra of organometallic compounds. V. Some �-Cyclopentadienyl derivatives not contaning carbonyl groups.
134. J. C. Hierso, P. Serp, R. Feurer, P. Kalck, Appl. Organometal. Chem., 1998, 12, (161-172). MOCVD of rhodium, palladium and platinum complexes on fluidized divided substrates:Novel process for one-step preparation of noble-metal catalysts.
135. J. C. Hierso, R. Feurer, P. Kalck, Chem. Mater., 2000, 12, (390-399). Platinum and Palladium Films Obtained by Low-Temperature MOCVD for the Formation of Small Particles on Divided Supports as Catalytic Materials.
136. J. C. Hierso, R. Feurer, P. Kalck, Coord. Chem. Rev., 1998, 178–180, (1811–1834). Platinum, palladium and rhodium complexes as volatile precursors for depositing materials.
137. J. C. Hierso, C. Satto, R. Feurer, P. Kalck, Chem. Mater., 1996, 8, (2481-2485). Organometallic Chemical Vapor Deposition of Palladium under Very Mild Conditions of Temperature in the Presence of a Low Reactive Gas Partial Pressure.
138. G. T. Stauf, P. A. Dowben, K. Emrich, S. Barfuss, W. Hirschwald, N. M. Boag, J.Phys. Chem., 1989, 93, (749-753). Stability and Decomposition of Gaseous Allylcyclopentadienylpalladium.
139. Y. Kim, S. Bialy, G. T. Stauf, R. W. Miller, J. T. Spencer, P. A. Dowben, S. Datta, J. Micromech. Microeng., 1991, 1, (42-45). Photoassisted deposition of conducting palladium films.
140. D. S. Saulys, A. Ermakov, E. L. Garfunkel, P. A. Dowben, J. Appl. Phys., 1994, 76, (7639-7641). Electron-beam-induced patterned deposition of allylcyclopentadienyl palladium using scanning tunneling microscopy.
141. L. Sordelli, G. Martra, R. Psaro, C. Dossi, S. Coluccia, J. Chem. Soc., Dalton Trans., 1996, (765-770). Intrazeolite large palladium clusters prepared by organometallic chemical vapour deposition.
142. C. Dossi, A. Fusi, S. Recchia, M. Anghileri, R. Psaro, J. Chem. Soc., Chem. Commun., 1994, (1245). Novel palladium on magnesium oxide catalysts for alkane aromatisation.
143. C. Liang, W. Xia, H. S. Ahmadi, O. Schlüter, R. A. Fischer, M. Muhler, Chem.Commun., 2005, (282-284). The two-step chemical vapor deposition of Pd(allyl)Cp as an atom efficient route to synthesize highly dispersed palladium nanoparticles on carbon nanofibers.

130
144. S. N. Reifsnyder, H. H. Lamb, Catal. Lett., 1996, 40, (155-161). Pd/silica cluster catalysts: synthesis and reactivity with H2 and C2H4.
145. C. P. Mehnert, J. Y. Ying, Chem. Commun., 1997, (2215-2216). Palladium-grafted mesoporous MCM-41 material as heterogeneous catalyst for Heck reactions.
146. C. P. Mehnert, D. W. Weaver, J. Y. Ying, J. Am. Chem. Soc., 1998, 120, (12289-12296). Heterogeneous Heck Catalysis with Palladium-Grafted Molecular Sieves.
147. S. Ikeda, Trends Anal. Chem., 1984, 3, (115-120). Electron spectroscopy for surface analysis.
148. H. Bubert, J. C. Riviere, Wiley-VCH Verlag GmbH, Germany, 2002. Surface and thin film analysis: Principle, instrumentation, applications - 2. Electron detection.
149. D. M. Hercules, Anal. Chem., 1976, 48, (294R-313R). Electron Spectroscopy: X-ray and Electron Excitation.
150. C. Nordling, Angew. Chem. Int. Ed., 1972, 11, (83-92). ESCA : Electron Spectroscopy for Chemical Analysis.
151. E. I. Solomon, L. Basumallick, P. Chen, P. Kennepohl, Coord. Chem. Rev., 2005, 249, (229–253). Variable energy photoelectron spectroscopy: electronic structure and electronic relaxation.
152. J. M. Hollander, D. A. Shirley, Annu. Rev. Nucl. Sci., 1970, 20, (435-466). Chemical information from Photoelectron and conversion electron spectroscopy.
153. W. E. Swartz, Anal. Chem., 1973, 45, (788A-800A). X-Ray Photoelectron Spectroscopy.
154. A. S. Duwez, J. Electron. Spectrosc. Relat. Phenom., 2004, 134, (97-138). Exploiting electron spectroscopies to probe the structure and organization of self-assembled monolayers: a review.
155. L. Hallmann, A. Bashir, T. Strunskus, R. Adelung, V. Staemmler, C. Wöll, F. Tuczek, Langmuir, 2008, 24, (5726-5733). Self-Assembled Monolayers of Benzylmercaptan and p-Cyanobenzylmercaptan on Au(111) Surfaces: Structural and Spectroscopic Characterization.
156. P. Behrens, Trends Anal. Chem., 1992, 11, (237-244). X-ray absorption spectroscopy in chemistry : II. X-ray absorption near edge structure.
157. G. Haehner, Chem. Soc. Rev., 2006, 35, (1244-1255). Near edge X-ray absorption fine structure spectroscopy as a tool to probe electronic and structural properties of thin organic films and liquids.
158. G. Hähner, M. Kinzler, C. Thümmler, C. Wöll, M. Grunze, J. Vac. Sci. Technol. A, 1992, 10, (2758-2763). The structure of self-organizing organic films: A NEXAFS investigation of thiol-layers adsorbed on gold.
159. J. Stöhr, D. A. Outka, Phys. Rev. B, 1987, 36, (7891-7905). Determination of molecular orientations on surfaces from the angular dependance of near edge x-ray absorption fine structure spectra.
160. J. Stöhr, Springer-Verlag, Berlin, 1996. NEXAFS spectroscopy. 161. M. Badin, A. Bashir, S. Krakert, T. Strunskus, A. Terfort, C. Wöll, Angew. Chem.
Int. Ed., 2007, 46, (3762-3764). Kinetically Stable, Flat-Lying Thiolate Monolayers.

131
162. J. Kawai, S. Hayakawa, Y. Kitajima, Y. Gohshi, Anal. Sci., 1995, 11, (519-524). X-Ray Absorption and Photoelectron Spectroscopies Using Total Reflection X-rays.
163. J. M. Hollas, John Wiley & Sons Ltd., England, 2004. Modern Spectroscopy. 164. A. M. Bradshaw, N. V. Richardson, Pure Appl. Chem., 1996, 68, (457-467).
Symmetry, selection rules and nomenclature in surface spectroscopies. 165. P. Hollins, Vacuum, 1994, 45, (705-714). Surface infrared spectroscopy. 166. V. G. Gregoriou, S. E. Rodman, Mater. Sci., 2002, (1-24). Vibrational
Spectroscopy of Thin Organic Films. 167. F. M. Hoffmann, Surf. Sci. Rep., 1983, 3, (107-192). Infrared reflection-
absorption spectroscopy of adsorbed molecules. 168. R. G. Greenler, J. Chem. Phys., 1966, 44, (310–315). Infrared study of adsorbed
molecules on metal surfaces by reflection techniques. 169. E. M. McCash, Vacuum, 1990, 40, (423-427). Surfaces and vibrations. 170. K. Weiss, J. Weckesser, C. Wöll, J. Mol. Struct., 1999, 458, (143–150). An X-ray
absorption study of saturated hydrocarbons physisorbed on metal surfaces. 171. G. Hähner, M. Kinzler, C. Wöll, M. Grunze, M. K. Scheller, L. S. Cederbaum,
Phys. Rev. Lett., 1991, 67, (851-854). Near Edge X-Ray-Absorption Fine-Structure Determination of Alkyl-Chain Orientation: Breakdown of the "Building-Block" Scheme.
172. R. Arnold, Ph.D. Thesis, Ruhr-Universität Bochum, Germany, 2001. Struktur und Ordnung selbstordnender Monolagen aliphatischer und aromatischer Thiole auf Goldoberflächen.
173. D. Q. Feng, D. Wisbey, Y. Tai, Y. B. Losovyj, M. Zharnikov, P. A. Dowben, J.Phys. Chem. B 2006, 110, (1095-1098). Abnormal Temperature Dependence of Photoemission Intensity Mediated by Thermally Driven Reorientation of a Monomolecular Film.
174. Y. Tai, A. Shaporenko, H. T. Rong, M. Buck, W. Eck, M. Grunze, M. Zharnikov, J. Phys. Chem. B, 2004, 108, (16806-16810). Fabrication of Thiol-Terminated Surfaces Using Aromatic Self-Assembled Monolayers.
175. K. Fathe, J. S. Holt, S. P. Oxley, C. J. Pursell, J. Phys. Chem. A, 2006, 110, (10793-10798). Infrared Spectroscopy of Solid Hydrogen Sulfide and Deuterium Sulfide.
176. D. P. Long, J. L. Lazorcik, B. A. Mantooth, M. H. Moore, M. A. Ratner, A. Troisi, Y. Yao, J. W. Ciszek, J. M. Tour, R. Shashidhar, Nat. Mater., 2006, 5, (901-). Effects of hydration on molecular junction transport. .
177. E. A. Smith, M. J. Wanat, Y. Cheng, S. V. P. Barreira, A. G. Frutos, R. M. Corn, Langmuir, 2001, 17, (2502-2507). Formation, Spectroscopic Characterization, and Application of Sulfhydryl-Terminated Alkanethiol Monolayers for the Chemical Attachment of DNA onto Gold Surfaces.
178. J. Küther, R. Seshadri, W. Knoll, W. Tremela, J. Mater. Chem., 1998, 8, (641-650). Templated growth of calcite, vaterite and aragonite crystals onself-assembled monolayers of substituted alkylthiols on gold.
179. A. Kulak, Y. S. Park, Y. J. Lee, Y. S. Chun, K. Ha, K. B. Yoon, J. Am. Chem. Soc., 2000, 122, (9308-9309). Polyamines as Strong Molecular Linkers for Monolayer Assembly of Zeolite Crystals on Flat and Curved Glass.

132
180. S. Hermes, F. Schröder, R. Chelmowski, C. Wöll, R. A. Fischer, J. Am. Chem. Soc., 2005, 127, (13744-13745). Selective Nucleation and Growth of Metal-Organic Open Framework Thin Films on Patterned COOH/CF3-Terminated Self-Assembled Monolayers on Au(111).
181. O. Shekhah, H. Wang, T. Strunskus, P. Cyganik, D. Zacher, R. Fischer, C. Wöll, Langmuir, 2007, 23, (7440-7442). Layer-by-Layer Growth of Oriented Metal Organic Polymers on a Functionalized Organic Surface.
182. O. Shekhah, H. Wang, S. Kowarik, F. Schreiber, M. Paulus, M. Tolan, C. Sternemann, F. Evers, D. Zacher, R. A. Fischer, C. Wöll, J. Am. Chem. Soc., 2007, 129, (15118-15119). Step-by-Step Route for the Synthesis of Metal-Organic Frameworks.
183. H. J. Himmel, A. Terfort, C. Wöll, J. Am. Chem. Soc., 1998, 120, (12069-12074). Fabrication of a Carboxyl-Terminated Organic Surface with Self-Assembly of Functionalized Terphenylthiols: The Importance of Hydrogen Bond Formation.
184. R. Arnold, W. Azzam, A. Terfort, C. Wöll, Langmuir, 2002, 18, (3980-3992). Preparation, Modification and Crystallinity of Aliphatic and Aromatic Carboxylic Acid Terminated Self-Assembled Monolayers.
185. S. E. Creager, J. Clarke, Langmuir, 1994, 10, (3675-3683). Contact-Angle Titrations of Mixed �Mercaptoalkanoic Acid/Alkanethiol Monolayers on Gold. Reactive Vs Nonreactive Spreading, and Chain Length Effects on Surface pKa values.
186. B. Vaidya, J. Chen, M. D. Porter, R. J. Angelici, Langmuir, 2001, 17, (6569-6576). Effects of Packing and Orientation on the Hydrolysis of Ester Monolayers on Gold.
187. B. Dordi, H. Schönherr, G. J. Vancso, Langmuir, 2003, 19, (5780-5786). Reactivity in the Confinement of Self-Assembled Monolayers: Chain Length Effects on the Hydrolysis of N-Hydroxysuccinimide Ester Disulfides on Gold.
188. Y. Kwon, M. Mrksich, J. Am. Chem. Soc., 2002, 124, (806-812). Dependence of the Rate of an Interfacial Diels-Alder Reaction on the Steric Environment of the Immobilized Dienophile: An Example of Enthalpy-Entropy Compensation.
189. V. Chechik, C. M. Stirling, Langmuir, 1998, 14, (99-105). Reactivity in Self-Assembled Monolayers: Effect of the Distance from the Reaction Center to the Monolayer-Solution Interface.
190. N. Saito, Y. Wu, K. Hayashi, H. Sugimura, O. Takai, J. Phys. Chem. B, 2003, 107, (664-667). Principle in Imaging Contrast in Scanning Electron Microscopy for Binary Microstructures Composed of Organosilane Self-Assembled Monolayers.
191. G. P. Lopez, H. A. Biebuyck, G. M. Whitesides, Langmuir, 1993, 9, (1513-1516). Scanning electron microscopy can form images of patterns in self-assembled monolayers.
192. N. H. Mack, R. Dong, R. G. Nuzzo, J. Am. Chem. Soc., 2006, 128, (7871-7881). Quantitative Imaging of Protein Adsorption on Patterned Organic Thin-Film Arrays Using Secondary Electron Emission.
193. E. W. Wollman, C. D. Frisbie, M. S. Wrighton, Langmuir, 1993, 9, (1617-1620). Scanning electron microscopy for imaging photopatterned self-assembled monolayers on gold.

133
194. M. A. Gosalvez, R. M. Nieminen, New J. Phys., 2003, 5, (100.1-100.28). Surface morphology during anisotropic wet chemical etching of crystalline silicon.
195. E. Cooper, G. J. Leggett, Langmuir, 1999, 15, (1024-1032). Influence of Tail-Group Hydrogen Bonding on the Stabilities of Self-Assembled Monolayers of Alkylthiols on Gold.
196. I. H. Campbell, J. D. Kress, R. L. Martin, D. L. Smith, N. N. Barashkov, J. P. Ferraris, Appl. Phys. Lett., 1997, 71, (3528-3530). Controlling charge injection in organic electronic devices using self-assembled monolayers.
197. D. Bethell, M. Brust, D. J. Schiffrin, C. Kiely, J. Electroanal. Chem., 1996, 409, (137-143). From monolayers to nanostructured materials: an organic chemist's view of self-assembly.
198. C. A. Mirkin, M. A. Ratner, Annu. Rev. Phys. Chem., 1992, 43, (719-754). Molecular electronics.
199. J. M. Tour, Acc. Chem. Res., 2000, 33, (791-804). Molecular Electronics. Synthesis and Testing of Components.
200. J. H. Fendler, Chem. Mater., 2001, 13, (3196-3210). Chemical Self-assembly for Electronic Applications.
201. A. M. Bittner, Surf. Sci. Rep., 2006, 61, (383–428). Clusters on soft matter surfaces.
202. D. R. Jung, A. W. Czanderna, G. C. Herdt, J. Vac. Sci. Technol., A, 1996, 14, (1779-1787). Interactions and penetration at metal/self-assembled organic monolayer interfaces.
203. D. R. Jung, A. W. Czanderna, Crit. Rev. Solid State Mater. Sci., 1994, 19, (1-54). Chemical and physical interactions at metal/self-assembled organic monolayer interfaces.
204. G. C. Herdt, D. E. King, A. W. Czanderna, Z. Phys. Chem., 1997, 202, (163-196). Penetration of deposited Au, Cu, and Ag overlayers through alkanethiol self-assembled monolayers on gold or silver.
205. G. C. Herdt, D. R. Jung, A. W. Czanderna, J. Adhes., 1997, 60, (197-222). Penetration of deposited Ag and Cu overlayers through alkanethiol self-assembled monolayers on gold.
206. G. C. Herdt, A. W. Czanderna, J. Vac. Sci. Technol., A, 1997, 15, (513-519). Metal overlayers on organic functional groups of self-organized molecular assemblies .7. Ion scattering spectroscopy and x-ray photoelectron spectroscopy of Cu/CH3 and Cu/COOCH3.
207. K. D. Dronavajjala, R. Rajagopalan, S. Uppili, A. Sen, D. L. Allara, H. C. Foley, J. Am. Chem. Soc., 2006, 128, (13040-13041). A Simple Technique To Grow Polymer Brushes Using in Situ Surface Ligation of an Organometallic Initiator.
208. V. Ivanova, T. Baunach, D. A. Kolb, Electrochim. Acta, 2005, 50, (4283-4288). Metal deposition onto a thiol-covered gold surface: A new approach.
209. P. L. Schilardi, P. Dip, P. C. dosSantosClaro, G. A. Benitez, M. H. Fonticelli, O. Azzaroni, R. C. Salvarezza, Chem. Eur. J., 2006, 12, Electrochemical Deposition onto Self-Assembled Monolayers: New Insights into Micro- and Nanofabrication.
210. E. A. Speets, P. teRiele, M. A. F. vandenBoogaart, L. M. Doeswijk, B. J. Ravoo, G. Rijnders, J. Brugger, D. N. Reinhoudt, D. H. A. Blank, Adv. Funct. Mater., 2006, 16, (1337–1342). Formation of Metal Nano- and Micropatterns on Self-
134
Assembled Monolayers by Pulsed Laser Deposition Through Nanostencils and Electroless Deposition.
211. J. I. Henderson, S. Feng, G. M. Ferrence, T. Bein, C. P. Kubiak, Inorg. Chim. Acta, 1996, 242, (115-124). Self-assembled monolayers of dithiols,diisocyanides,and isocyanothiols on gold : Chemically sticky surfaces for covalent attachment of metal clusters and studies of interfacial electron transfer.
212. Y. Tai, A. Shaporenko, W. Eck, M. Grunze, M. Zharnikov, Langmuir, 2004, 20, (7166-7170). Depth Distribution of Irradiation-Induced Cross-Linking in Aromatic Self-Assembled Monolayers.
213. H. Noda, Y. Tai, A. Shaporenko, M. Grunze, M. Zharnikov, J. Phys. Chem. B, 2005, 109, (22371-22376). Electrochemical Characterizations of Nickel Deposition on Aromatic Dithiol Monolayers on Gold Electrodes.
214. J. Weiss, H. J. Himmel, R. A. Fischer, C. Wöll, Chem. Vap. Deposition, 1998, 4, (17-21). Self-Terminated CVD-Functionalization of Organic Self-Assembled Monolayers (SAMs) with Trimethylamine Alane (TMAA).
215. P. Serp, P. Kalck, R. Feurer, Chem. Rev., 2002, 102, (3085-3128). Chemical Vapor Deposition Methods for the Controlled Preparation of Supported Catalytic Materials.
216. C. Fuxen, W. Azzam, R. Arnold, G. Witte, A. Terfort, C. Wöll, Langmuir, 2001, 17, (3689-3695). Structural characterization of organothiolate adlayers on gold: The case of rigid, aromatic backbones.
217. D. Q. Feng, Y. B. Losovyj, Y. Tai, M. Zharnikov, P. A. Dowben, J. Mater. Chem., 2006, 16, (4343–4347). Engineering of the electronic structure in an aromatic dithiol monomolecular organic insulator.
218. D. Q. Feng, D. Wisbey, Y. B. Losovyj, Y. Tai, M. Zharnikov, P. A. Dowben, Phys. Rev. B, 2006, 74, (165425-1-165425-11). Electronic structure and polymerization of a self-assembled monolayer with multiple arene rings.
219. A. Niklewski, T. Strunskus, G. Witte, C. Wöll, Chem. Mater., 2005, 17, (861-868). Metal Organic Chemical Vapor Deposition of Palladium: Spectroscopic Study of Cyclopentadienyl-allyl-palladium Deposition on a Palladium Substrate.
220. Q. H. Wu, M. Gunia, T. Strunskus, G. Witte, M. Muhler, C. Wöll, Chem. Vap. Deposition, 2005, 11, (355-361). Deposition of palladium from cyclopentadienyl-allyl-palladium precurser on differently pretreated Sibased substrates: The role of surface Si-OH and Si-H species studied by x-ray photoelectron spectroscopy .
221. M. T. Lee, C. C. Hsueh, M. S. Freund, G. S. Ferguson, Langmuir, 1998, 14, (6419-6423). Air Oxidation of Self-Assembled Monolayers on Polycrystalline Gold: The Role of the Gold Substrate.
222. M. C. Wang, J. D. Liao, C. C. Weng, R. Klauser, A. Shaporenko, M. Grunze, M. Zharnikov, Langmuir, 2003, 19, (9774-9780). Modification of Aliphatic Monomolecular Films by Free Radical Dominant Plasma: The Effect of the Alkyl Chain Length and the Substrate.
223. E. Pretsch, T. Clerc, J. Seibl, W. Simon, Springer-Verlag New York, 1989. Tables of Spectral Data for Structure Determination of Organic Compounds.
224. U. Weckenmann, Ph. D. Thesis, Ruhr-Universität Bochum, Germany, 2002. Selektive Metallorganische Chemische Dampfabscheidung von Gold und Palladium auf Selbstorganisierten Monolagen.
135
225. B. Bogdanovic, M. Rubach, K. Seevogel, Z. Naturforsch., B: Chem. Sci, 1983, 38, (592-598). �'-Allylmetall-Schwefel-Komplexe, IV [1] �'-Allyl-hydrogensulfidopalladium-und -platin-Komplexe.
226. B. Bogdanovic, P. Göttsch, M. Rubach, Z. Naturforsch., B: Chem. Sci, 1983, 38, (599-603). �'-Allylmetall-Schwefel-Komplexe, V [1] Mono- und bimetallische, mehrkernige �'-Allylmetall-Schwefel-Komplexe des Nickels, Palladiums und Platins.
227. Y. Tsuji, T. Fujihara, Inorg. Chem., 2007, 46, (1895-1902). Homogeneous Nanosize Palladium Catalysts.
228. R. Umeda, H. Awaji, T. Nakahodo, H. Fujihara, J. Am. Chem. Soc., 2008, 130, (3240-3241). Nanotube Composites Consisting of Metal Nanoparticles and Polythiophene from Electropolymerization of Terthiophene-Functionalized Metal (Au, Pd)Nanoparticles.
229. M. J. Schultz, C. C. Park, M. S. Sigman, Chem. Commun., 2002, (3034-3035). A convenient palladium-catalyzed aerobic oxidation of alcohols at room temperature.
230. S. S. Stahl, Science, 2005, 309, (1824-1826). Palladium-Catalyzed Oxidation of Organic Chemicals with O2.
231. J. E. Remias, L. E. Grove, A. Sen, Dalton Trans., 2003, (3067-3070). Carbon-sulfur bond cleavage and reduction of thiols and dithioethers under oxidative conditions.
232. S. A. Ruiz, C. S. Chen, Soft Matter, 2007, 3, (168–177). Microcontact printing: A tool to pattern.
233. J. L. Wilbur, A. Kumar, H. A. Biebuyck, E. Kim, G. M. Whitesides, Nanotechnology, 1996, 7, (452-457). Microcontact printing of self-assembled monolayers: applications in microfabrication.
234. G. M. Whitesides, E. Ostuni, S. Takayama, X. Jiang, D. E. Ingber, Annu. Rev. Biomed. Eng., 2001, 3, (335-373). Soft lithography in biology and biochemistry.
235. Y. Xia, G. M. Whitesides, Annu. Rev. Mater. Sci., 1998, 28, (153-184). Soft lithography.
236. R. K. Smith, P. A. Lewis, P. S. Weiss, Prog. Surf. Sci., 2004, 75, (1-68). Patterning self-assembled monolayers.
237. M. Liebau, J. Huskens, D. N. Reinhoudt, Adv. Funct. Mater., 2001, 11, (147-150). Microcontact Printing with Heavyweight Inks.
238. J. N. Lee, C. Park, G. M. Whitesides, Anal. Chem., 2003, 75, (6544-6554). Solvent Compatibility of Poly(dimethylsiloxane)-Based Microfluidic Devices.

Acknowledgments
This thesis would not have been possible without the help and support from a number of
people and I would like to acknowledge all those who have contributed to the realization
of this thesis. First, I would like to express my sincere thanks and gratitude to my thesis
advisor Prof. Christof Wöll for providing me the opportunity to work on this project and
for his encouragement and guidance throughout the course of this work. Thank you for
teaching me many things even beyond science. I would like to thank Prof. Roland A.
Fischer for willingly accepting to be my second referee. Special thanks to his valuable
advices and for the palladium precursor provided by his lab. I owe a great deal of
gratitude to Dr. Thomas Strunskus for his support during the entire course of this work.
He always had time for my questions and problems. I extend my cordial thanks to Dr.
Gregor Witte for inspiring me through his thought-provoking discussions, which have
been valuable to my professional development. I would like to convey my thanks to Dr.
Alexander Birkner (the first person I met from this department) for his friendliness and
fruitful discussions related to microscopic methods. Thanks to Dr. Franziska Traeger and
Dr. Martin Kind for their enormous help in proofreading my thesis. I wish to thank Dr.
Osama Shekhah and Dr. Yuemin Wang for their help in UHV measurements. I would
like to express my deepest gratitude to Dr. P. Engels.
I would like to convey my thanks to Dr. Andreas Terfort for his suggestions and for the
thiol molecules rendered by his lab. Special thanks to Dr. Rolf Neuser who helped me
with the SEM measurements. I am grateful to all the members of Inorganic Chemistry II
and special thanks to Felicitas Schröder who always helped me with the palladium
precursor. I am very grateful to the technicians of the Physical Chemistry I, Mr. Volker
Ader, Mr. Reiner Krause, Mr. Theo Wasmuth, Mr. Gerd Humme, Jennifer Haag and Mr.
Heinz Zwingmann, for their superior technical supports. Thanks to the entire staff at the
Berlin synchrotron facility BESSY II for the excellent technical and scientific support. I
kindly acknowledge the financial support of the IMPRS-SurMat. I am grateful for the
help offered by Mrs. Gundula Talbot, Dr. Angela Buettner and Dr. Rebekka Loschen in
many administrative matters. I would also like to acknowledge my teachers who have
encouraged me all these years.

Many thanks especially to all my colleagues for the friendly working atmosphere and for
their support during my stay in the group. Mihaela Badin, thank you for your company. I
won’t forget our searches for your missing things (tweezers, ethanol, etc,). Kathrin Hänel,
thanks for your friendly mails. Deler Langenberg and Daniel Käfer, thanks for your help
in solving computer problems. Asif Bashir and Rolf Chelmowski, I will never forget our
trip to Italy. Rolf, thanks for sharing a lot of your PDMS stamps with me. David Silber,
Lutz Stratmann, Xia Stammer, Vadim Schott, Jan Götzen, Mira and Sasha - for the
lunchtime chats. Hui Wang, thanks for unforgettable times at Heidelberg. I thank all my
colleagues from SurMat. All of you make me feel at home and this has made life much
easier for me to live in Germany. I want also to thank all my friends in India.
I thank Mrs. Ursula Uhde, Mrs. Bärbel van Eerd, Mrs. Ruth Knödlseder-Mutschler and
Mrs. Angelika Kruse-Fernkorn for all the love and emotional support you have given me
during these years. Special thanks to Mrs. van Eerd, for cheering me up when things were
at low ebb. Thank you for all the happy moments that will stay in my memories for years
to come. I owe special thanks to my friend Kathirvel for his moral support during this
work and for helping me to face challenges in all aspects of my life. Finally, I thank my
parents and my brother for their support throughout these years and for helping me to
realize my dreams. Without their prayers and encouragement, I would not be the person
that I am today. They have made everything possible.
ï¡P

List of publications
1. Chemistry in confined geometries: Reactions at an organic surface
Ketheeswari Rajalingam, Asif Bashir, Mihaela Badin, Felicitas Schröder, Ned
Hardman, Thomas Strunskus, Roland A. Fischer, Christof Wöll
ChemPhysChem, 8, 2007, (657-660)
2. Metallization of a thiol-terminated organic surface using chemical vapor deposition
Ketheeswari Rajalingam, Thomas Strunskus, Andreas Terfort, Roland A. Fischer,
Christof Wöll
Langmuir, 24, 2008, (7986-7994)

Ketheeswari Rajalingam
Date of birth: 01.12.1981
Nationality: Indian
Ph.D. candidate: Chemistry (2004 - 2008)
Ph.D. thesis under the guidance of Professor Dr. Christof Wöll, Physical Chemistry I,
Ruhr University Bochum, Bochum, Germany.
Thesis title: "Reactions at an organic surface".
IMPRS- SurMat Scholarship (2004 - 2007).
Master of Science: Chemistry (2001 - 2003)
Master thesis under the guidance of Professor Dr. S. Arunachalam, School of Chemistry,
Bharathidasan University, Tiruchirappalli, India.
Thesis title: "Studies on emission quenching of *Ru(phen)32+ ion by Cobalt(III) amine
complexes and also studies on various DNA".
Second Rank in M.Sc. degree. Marks obtained: 73%
Summer research fellow (May to June in 2002 & July to August in 2003)
Work under the guidance of late Professor Dr. Bhaskar G. Maiya, School of Chemistry,
University of Hyderabad, Hyderabad, India. Topics include the synthesis of a second-
generation photosensitizer for photodynamic therapy and study on the interactions of
cationic porphyrins with DNA. Summer research fellowship by Jawaharlal Nehru Center
for Advanced Scientific Research, Bangalore, India.
Bachelor of Science: Chemistry (1998 - 2001)
Holy Cross College (Autonomous), Tiruchirappalli, India.
Gold medal for first rank in B.Sc., Chemistry. Marks obtained: 91%
Higher Secondary (1996 - 1998) and Secondary School (1987 - 1996)
Holy Cross Girls Higher Secondary School, Tiruchirappalli, India.