Embed Size (px)
Citation preview
REACTION KINETICS OF RARE EARTH AND ACTINIDE MATERIALS
by
Brian Jon Jaques
A dissertation
submitted in partial fulfillment
of the requirements for the degree of
Doctor of Philosophy in Materials Science and Engineering
Boise State University
May 2015

© 2015
Brian Jon Jaques
ALL RIGHTS RESERVED
BOISE STATE UNIVERSITY GRADUATE COLLEGE
DEFENSE COMMITTEE AND FINAL READING APPROVALS
of the dissertation submitted by
Brian Jon Jaques
Dissertation Title: Reaction Kinetics of Rare Earth and Actinide Materials Date of Final Oral Examination: 24 February 2015 The following individuals read and discussed the dissertation submitted by student Brian Jon Jaques, and they evaluated his presentation and response to questions during the final oral examination. They found that the student passed the final oral examination. Darryl Butt, Ph.D. Chair, Supervisory Committee Amy J. Moll, Ph.D. Member, Supervisory Committee Dmitri Tenne, Ph.D. Member, Supervisory Committee Kenneth McClellan, Ph.D. Member, Supervisory Committee
The final reading approval of the dissertation was granted by Darryl Butt, Ph.D., Chair of the Supervisory Committee. The dissertation was approved for the Graduate College by John R. Pelton, Ph.D., Dean of the Graduate College.

DEDICATION
This dissertation is dedicated to my wife and three children.
Rachel: Your constant words of encouragement, support, and patience has truly been
testament of your support and our love. I love you. In ways, your commitment through
this process has dwarfed mine, and for that I could not be more appreciative.
Trenton, Devin, and Allie: Simply your presence, curiosity, and compassion brightens my
day, every day. You are unaware of the inspiration that you provide me day in and day
out through your inquisitive nature, your love to learn, and your pure innocence. Thank
you. You each have so much to learn, so much to see, and so much to do in this huge
world; it is my vow to teach you, to show you, and to take you there.
I love you and am excited for the future.
Live as if you were to die tomorrow. Learn as if you were to live forever.
~ Mahatma Gandhi
Strive not to be a success, but rather to be of value.
~ Albert Einstein
iv
ACKNOWLEDGEMENTS
My journey towards this dissertation was guided by people, both past and present,
who have inspired, challenged, or supported me in one way or another. There are more
people than I can list that have helped guide me and that have made my journey possible,
but I wish to acknowledge a few of the instrumental ones here.
First and foremost, I would like to express my deepest appreciation to my
committee chair, advisor, professor, mentor, and friend, Dr. Darryl Butt. Without his
tireless guidance and support, this dissertation would not have been possible. Dr. Butt has
provided me with opportunities I have never dreamed to have had and has significantly
influenced the direction of my career. From my initial graduate fellowship to a graduate
research assistant to an instructor to a research engineer, Dr. Butt has provided
opportunities and inspiration to excel in my academics, my career, and my life. I do not
think there is any way I could ever repay him, nor would he accept, so I can only hope
that my plan to pay it forward is as fruitful to someone in my future as he has been for
me.
I would like to thank Dr. Amy Moll and Dr. Don Plumlee for giving me an
opportunity as an undergraduate research assistant in the Ceramic-MEMS laboratory. The
mentoring and experience that you gave to me has served as both inspiration to pursue
higher education and research as well as opening doors to opportunities that may not have
v

otherwise been available. You both continue to be very influential people that I admire
very much.
Much of the research presented in this dissertation was conducted in affiliation
with the Center for Advanced Energy Studies (CAES) and was partially funded by DOE
NEUP grant #00120690. Of course, this work would not have been possible if the MSE
department at BSU had not facilitated lab space nor presented such a great opportunity
for me to continue my education. The MSE department has been committed to me and its
students by providing a very positive, competent, and ambitious staff that everyone can
grow and prosper from.
In addition to the acknowledgements presented at the end of each chapter, there
are a few others that deserve recognition due to their assistance they have provided for
me on this journey. I would like to acknowledge and thank my dissertation advisory
committee members, Drs. Alex Punnoose, Dmitri Tenne, and Kenneth McClellan for
their commitment and guidance throughout this research. I would also like to thank
everyone in the Advanced Materials Laboratory, both past and present. A few of the folks
that I would like to specifically acknowledge for their assistance in the lab or engaging in
fruitful discussions include: Gordon Alanko, Daniel Osterberg, Jennifer Watkins, Joe
Croteau, Joshua Heuther, Kelci Lester, Nicole Leraas, Sumit Tamrakar, Mike Hurley,
John Youngsman, and Patrick Price. Additionally, I would like to acknowledge Jatu
Burns, Kerry Allahar, and Bryan Forsmann at CAES. This dissertation was also made
possible with support from many people within in the college of engineering, which
include: Peter Mullner, Phil Boysen, Chad Watson, Dena Ross, Brittany Archuleta, Jane
Hokanson, Paul Roberston, and Karthik Chinnathambi. Acknowledgement is also due to
vi

folks outside of the college of engineering, which include Madhu Kongora, Jodi Chilson,
and Marion Lytle.
Lastly, I would like to acknowledge my family and friends for the support they
have provided. My parents, Jon and Renae, have always believed in me, fostered my
curiosities, and have been supportive of my pursuit of education. My in-laws, Dennis and
Bonita, have provided more for me than they are aware. They allowed me to take their
daughter’s hand in marriage, trusted me, and supported me and my family throughout this
process. Lastly, but most important, I would like to thank my wife and our three children
for the support, drive, and patience that I needed to see this through the end. This journey
has been challenging, but with the support of all of those listed above, has been both
enjoyable and rewarding.
vii
ABSTRACT
This dissertation presents the effects of atmosphere, time, and energy input
(thermal and mechanical) on the kinetics of gas-solid and solid-solid reactions in systems
of dysprosium, uranium, oxygen, and nitrogen. Accordingly, Chapter Two presents a
novel synthesis technique used to form DyN via a gas-solid reaction between dysprosium
and nitrogen. DyN was rapidly formed through a mechanochemical process in a high
energy ball mill at ambient temperatures. The progress of the reaction was quantified
using in situ temperature and pressure measurements coupled with microscopy and x-ray
diffraction. It was found that the rate of the nitridation reaction is controlled by the
creation of fresh dysprosium surfaces, which is a function of milling intensity and the
number of milling media.
Chapter Three describes how UN was synthesized prior to mixing with UO2 in the
fabrication of accident tolerant nitride fuels for nuclear reactor applications. High purity
and carbon free UN was synthesized using a hydride-dehydride-nitride thermal synthesis
route. In order to fabricate an accident tolerant nitride fuel, it is postulated that the
addition of small amounts of UO2 (up to 10 w%) to UN will significantly increase its
corrosion resistance. UN-UO2 composite pellets were sintered in Ar-(0-1 at%) N2 to
study the effects of nitrogen concentration on the evolved phases and microstructures.
Further studies were conducted where UN and UN-UO2 composites were sintered in Ar-
100 ppm N2 for five hours at various temperatures (1700-2000 °C) and the final grain
viii
morphologies and phase concentrations were compared. Electron micrographs showed
that the oxide inclusions remained homogenously dispersed throughout the
microstructure and were located on UN grain boundaries. Increasing UO2 additions
resulted in microstructural coarsening, as did the sintering temperature. Higher sintering
temperatures also resulted in lower sintered densities, presumably due to a preferential
formation of oxygen-stabilized nitrides or uranium oxynitrides.
The high temperature oxidation kinetics of dysprosium is presented in Chapter
Four. Dysprosium particles were isothermally oxidized from 500 - 1000 °C in N2 - (2, 20,
and 50%) O2 and Ar - 20% O2 using simultaneous thermal analysis techniques. Two
distinct oxidation regions were identified at each isothermal temperature in each
oxidizing atmosphere. Initially, the oxidation kinetics are very fast until the reaction
enters a slower, intermediate region of oxidation. The two regions are defined and the
kinetics of each are assessed to show an apparent activation energy of 8 - 25 kJ/mol in the
initial region and 80 - 95 kJ/mol in the intermediate oxidation reaction region. The effects
of varying the oxygen partial pressure on the reaction rate constant is used to show that
dysprosium oxide (Dy2O3) generally acts as a p-type semiconductor in both regions of
oxidation (with an exception above 750 °C in the intermediate region).
ix
TABLE OF CONTENTS
DEDICATION ......................................................................................................................... iv
ACKNOWLEDGEMENTS ...................................................................................................... v
ABSTRACT ........................................................................................................................... viii
LIST OF TABLES ................................................................................................................. xiii
LIST OF FIGURES ............................................................................................................... xiv
LIST OF ABBREVIATIONS ................................................................................................. xx
CHAPTER ONE: INTRODUCTION ....................................................................................... 1
CHAPTER TWO: IN SITU CHARACTERIZATION OF THE NITRIDATION OF DYSPROSIUM DURING MECHANOCHEMICAL PROCESSING* ................................... 3
Abstract ......................................................................................................................... 5
2.1 Introduction ............................................................................................................. 5
2.2 Experimental Details ............................................................................................... 8
2.3 Results ................................................................................................................... 11
2.4 Discussion ............................................................................................................. 14
2.5 Conclusions ........................................................................................................... 20
Acknowledgements ..................................................................................................... 21
Author Justification ..................................................................................................... 21
References ................................................................................................................... 22
Figures......................................................................................................................... 26
Tables .......................................................................................................................... 36
x

CHAPTER THREE: SYNTHESIS AND SINTERING OF UN-UO2 FUEL COMPOSITES ........................................................................................................................ 39
Abstract ....................................................................................................................... 42
3.1 Introduction ........................................................................................................... 42
3.2 Material and Methods ........................................................................................... 45
3.3 Results and Discussion ......................................................................................... 48
3.4 Conclusions ........................................................................................................... 57
Acknowledgements ..................................................................................................... 58
Author Justification ..................................................................................................... 58
References ................................................................................................................... 60
Figures......................................................................................................................... 63
CHAPTER FOUR: HIGH TEMPERATURE OXIDATION KINETICS OF DYSPROSIUM PARTICLES ................................................................................................ 72
Abstract ....................................................................................................................... 74
4.1 Introduction ........................................................................................................... 75
4.2 Experimental Details ............................................................................................. 76
4.3 Results and Discussion ......................................................................................... 78
4.4 Conclusions ........................................................................................................... 89
Acknowledgements ..................................................................................................... 90
References ................................................................................................................... 91
Figures......................................................................................................................... 94
Tables ........................................................................................................................ 104
CHAPTER FIVE: CONCLUSIONS .................................................................................... 106
APPENDIX ........................................................................................................................... 111
xi
Kinetics of the Nitridation of Dysprosium during Mechanochemical Processing ............... 112
Abstract ..................................................................................................................... 114
A.1 Introduction ........................................................................................................ 115
A.1.1 Dysprosium and Dysprosium Nitride ............................................... 115
A.1.2 Ball Milling Modeling ...................................................................... 116
A.1.3 Energy Requirements for Surface Formation ................................... 118
A.2 Materials and Methods ....................................................................................... 120
A.2.1 Gas-Solid Reactive Milling Experiments ......................................... 120
A.2.2 Milling Media Energetics ................................................................. 121
A.3 Results and Discussion....................................................................................... 121
A.4 Kinetics Analysis ............................................................................................... 125
A.4.1 Reaction Model Development .......................................................... 126
A.4.2 Analytical Reaction Model ............................................................... 130
A.5 Conclusions ........................................................................................................ 132
References ................................................................................................................. 133
Figures....................................................................................................................... 137
xii
LIST OF TABLES
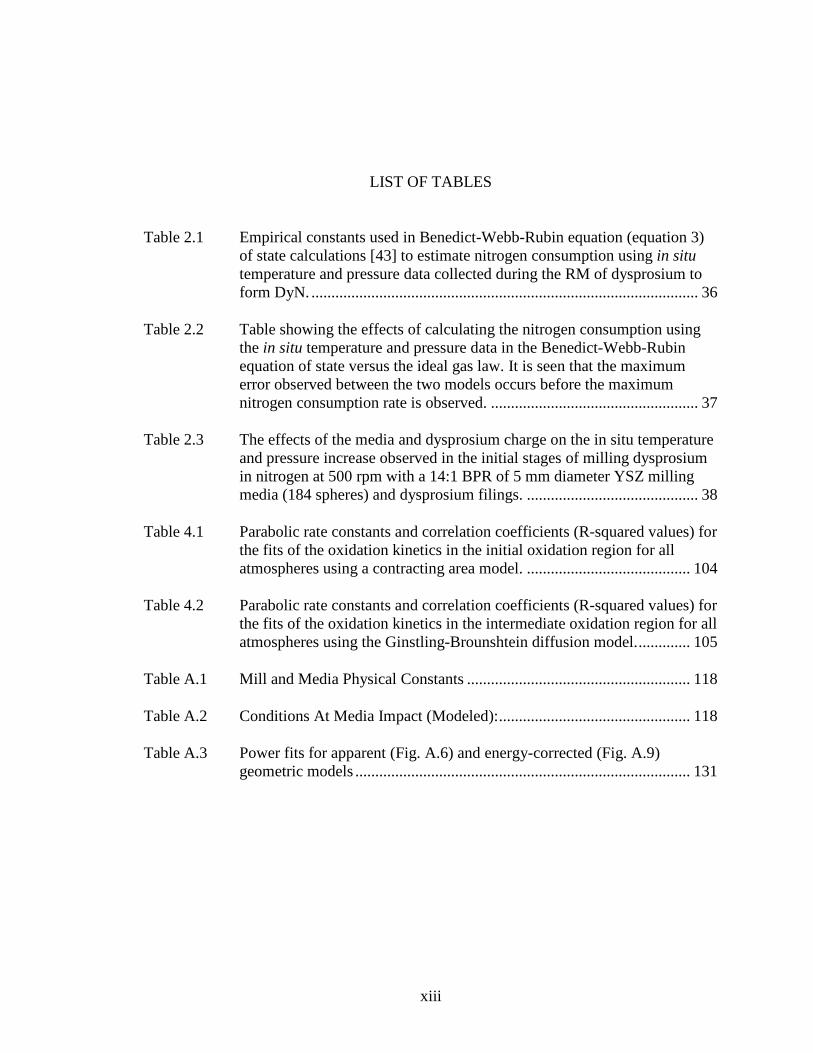
Table 2.1 Empirical constants used in Benedict-Webb-Rubin equation (equation 3) of state calculations [43] to estimate nitrogen consumption using in situ temperature and pressure data collected during the RM of dysprosium to form DyN. ................................................................................................. 36
Table 2.2 Table showing the effects of calculating the nitrogen consumption using the in situ temperature and pressure data in the Benedict-Webb-Rubin equation of state versus the ideal gas law. It is seen that the maximum error observed between the two models occurs before the maximum nitrogen consumption rate is observed. .................................................... 37
Table 2.3 The effects of the media and dysprosium charge on the in situ temperature and pressure increase observed in the initial stages of milling dysprosium in nitrogen at 500 rpm with a 14:1 BPR of 5 mm diameter YSZ milling media (184 spheres) and dysprosium filings. ........................................... 38
Table 4.1 Parabolic rate constants and correlation coefficients (R-squared values) for the fits of the oxidation kinetics in the initial oxidation region for all atmospheres using a contracting area model. ......................................... 104
Table 4.2 Parabolic rate constants and correlation coefficients (R-squared values) for the fits of the oxidation kinetics in the intermediate oxidation region for all atmospheres using the Ginstling-Brounshtein diffusion model. ............. 105
Table A.1 Mill and Media Physical Constants ........................................................ 118
Table A.2 Conditions At Media Impact (Modeled): ................................................ 118
Table A.3 Power fits for apparent (Fig. A.6) and energy-corrected (Fig. A.9) geometric models .................................................................................... 131
xiii

LIST OF FIGURES
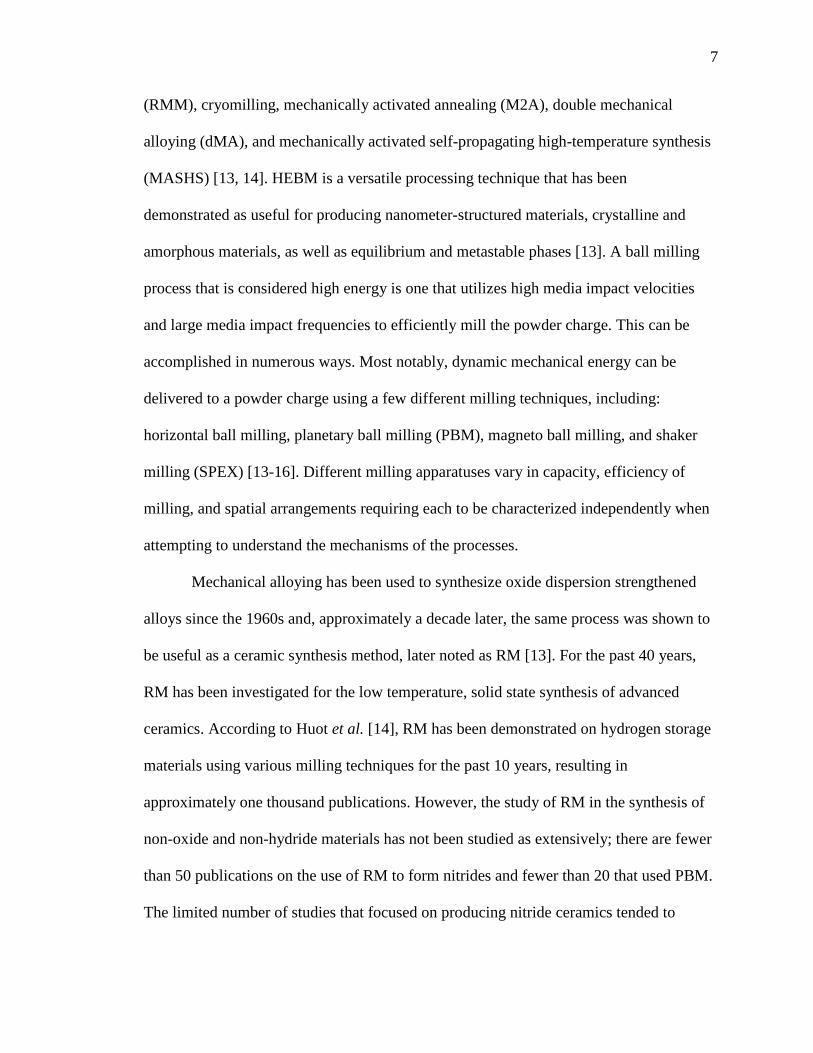
Figure 2.1 Images of the dysprosium filings used as the starting materials for the kinetics study of the nitridation reaction to form DyN using a dry planetary ball milling process in nitrogen atmosphere. The filings have a surface area of 0.196 ± 0.058 m2/g. .......................................................... 26
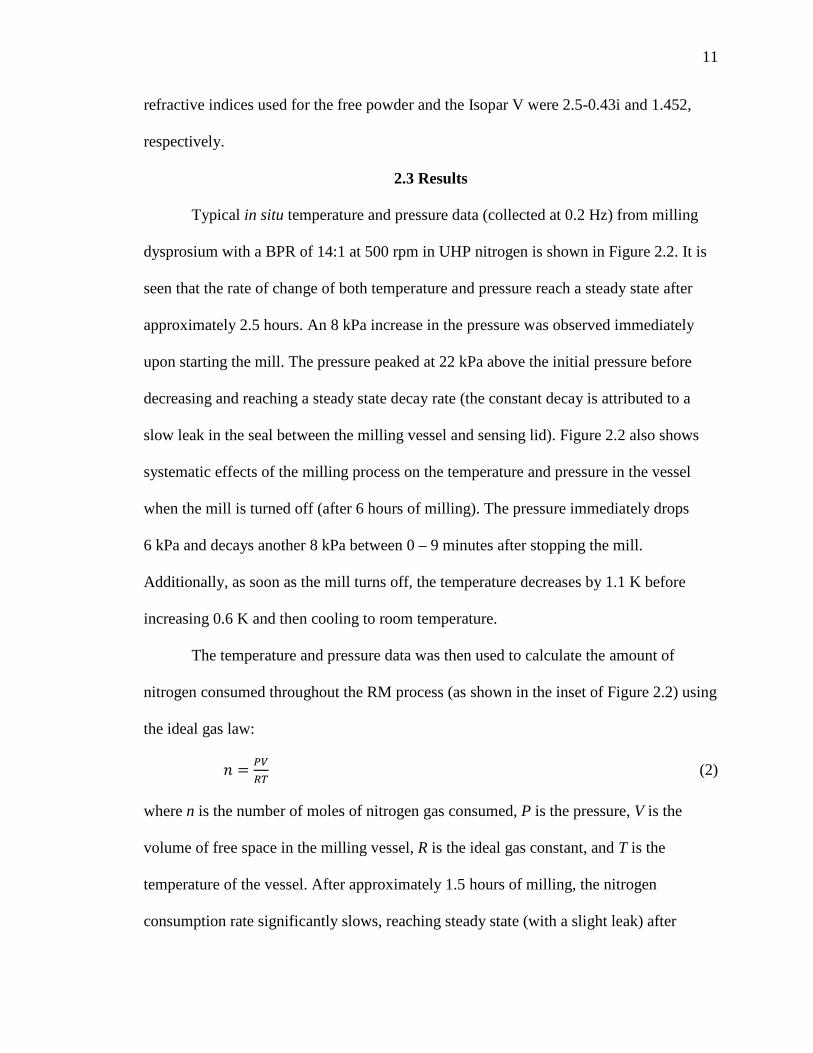
Figure 2.2 Typical temperature and pressure data as recorded in situ (0.2 Hz) throughout the reactive ball milling of five grams of elemental dysprosium in dry nitrogen to form DyN at 500 rpm and a BPR of 14:1. The mill was shut off after 6 hours of milling. The inset shows the nitrogen consumption calculated using the in situ temperature and pressure data in the ideal gas law. ....................................................................................... 27
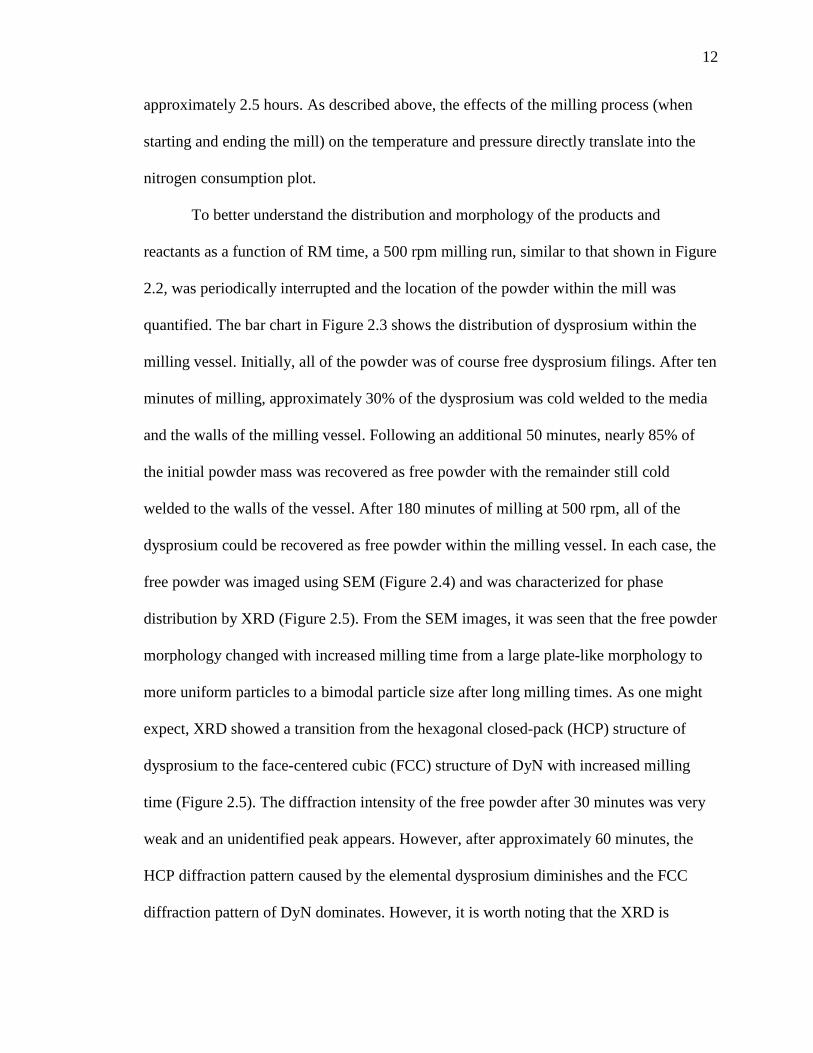
Figure 2.3 Bar chart showing the distribution of dysprosium with time throughout planetary ball milling in dry nitrogen at 500 rpm. It is seen that the dysprosium initially “cold welds” to the vessel walls and milling media but after 50 minutes, nearly 85% of the original mass is recovered and after 180 minutes, all of the powder is free from the vessel walls and media in the form of a nitride. .................................................................. 28
Figure 2.4 SEM images of the free powder recovered throughout planetary ball milling elemental dysprosium in dry nitrogen at 500 rpm for a) 10 minutes, b) 30 minutes, c) 50 minutes, and d) 24 hours. .......................... 29
Figure 2.5 X-ray diffraction patterns of the free powders resulting from reactive milling elemental dysprosium in dry nitrogen at 500 rpm up to 12 hours. It can be seen that after approximately 1 hour of milling, the only crystalline phase of the free powder is DyN. However, as seen in Figure 2.2, the conversion was not yet complete because nearly 15% of the original mass was cold welded to the milling vessel, which was found to be primarily elemental dysprosium. .............................................................................. 30
Figure 2.6 Normalized nitrogen consumption during the reactive ball milling of five grams of elemental dysprosium in dry nitrogen for six hours in a planetary ball mill at various milling intensities. The uptake was calculated using the ideal gas law and the in situ temperature and pressure data recorded at 0.2 Hz. It is seen that the reaction kinetics decrease with milling intensity.................................................................................................................... 31
xiv
Figure 2.7 X-ray diffraction patterns of the powders resulting from reactive milling elemental dysprosium in dry nitrogen for six hours at various milling intensities. In each case, a phase pure DyN was formed. ......................... 32
Figure 2.8 The particle size distribution (a) and morphology (b) obtained from free powder resulting from reactive milling elemental dysprosium in dry nitrogen for six hours at various milling intensities. The particle size distribution suggests that, regardless of the milling intensity, the average particle size was approximately 2.6 μm, which is supported by the SEM images. ...................................................................................................... 33
Figure 2.9 Plot showing the variance in the nitrogen consumption calculated using the ideal gas law and the Benedict-Webb-Rubin equation of state throughout the reactive ball milling of five grams of elemental dysprosium in dry nitrogen to form DyN at 500 rpm and a BPR of 14:1. The variance from the two calculations varies from 1.9% at 350 rpm to 3.5% at 650 rpm, with the ideal gas law always predicting less nitrogen consumption. ............................................................................................. 34
Figure 2.10 Temperature and pressure behavior sensed by the sensing lid when the milling vessel assembly is placed on a constant heat source of 332 K and removed after 2.5 hours. The inset shows the effects of the readings on the apparent change in nitrogen content as calculated using the ideal gas law. Note: the effects are an order of magnitude less than the consumption in the Dy + N2 → DyN reaction. ................................................................... 35
Figure 3.1 Scanning electron images of precursor powders for the nitride composite pellet fabrication: a) As-received UO2 from bioanalytical industries, b) as-received atomized uranium, c) UN after hydriding and nitriding the atomized uranium via the thermal route shown in Figure 3.2, and d) UN-UO2 composite powder after milling for 1 hour at 400 RPM in a planetary ball mill. .................................................................................................... 63
Figure 3.2 Thermal process used to hydride prior to nitride the atomized depleted uranium shown in Figure 3.1. ................................................................... 64
Figure 3.3 X-ray diffraction patterns of precursor powders for composite nitride fuel pellet fabrication, including the as-received atomized D-U and UO2 as well as the UN after hydriding and nitriding D-U via the thermal route shown in Figure 3.2................................................................................... 65
Figure 3.4 X-ray diffraction patterns of nominal compositions of UN, UN-5 w% UO2, and UN-10 w% UO2 after milling for 1 hour in a planetary ball mill at 400 RPM. .............................................................................................. 66
xv

Figure 3.5 SE-SEM image of the ground surface of a UN pellet sintered at 1550 °C for 5 hours in a pure argon atmosphere showing a distinct dense layer around the circumference of the pellet. The “coring” effect is due to the low nitrogen pressure in the sintering environment, causing a dissociation of the nitrogen and uranium, leading to the formation of a liquid phase and localized densification. ............................................................................. 67
Figure 3.6 BSE SEM images of the microstructures of UN (left) and UN-UO2 composite (center and right) pellets showing the effects of nitrogen concentration on phase formation during sintering for 5 hours at 1900 °C. In each case, the density was determined using Archimedes’ principle in water. ......................................................................................................... 68
Figure 3.7 X-ray diffraction showing the effects of nitrogen concentration on phase formation after sintering UN (left) and UN-UO2 composites (center and right) for 5 hours at 1900 °C. .................................................................... 69
Figure 3.8 BSE SEM images of the microstructures of UN (left) and UN - UO2 composite (center and right) pellets showing the coarsening of features and increase of porosity with increasing temperature. All samples were sintered for 5 hours in Ar - 100 ppm N2 and densities were determined using Archimedes’ principle in water. ...................................................... 70
Figure 3.9 X-ray diffraction showing the effects of temperature on the phase formation after sintering UN (left) and UN-UO2 composites (center and right) for 5 hours in Ar - 100 ppm N2. ...................................................... 71
Figure 4.1 Images of the dysprosium particles used as the starting materials for the high temperature oxidation reaction study. The particles have a surface area of 0.196 ± 0.058 m2g-1 as determined via gas adsorption techniques.................................................................................................................... 94
Figure 4.2 X-ray diffraction patterns of the dysprosium particles used as the starting material for the high temperature oxidation study and of a sample that was isothermally oxidized in N2 - 20% O2. As seen in the figure, the starting material is primarily a HCP dysprosium phase although there does exist a very small fraction of the FCC phase. The oxidized sample is a cubic Dy2O3 phase and is representative of all of the oxidized powder diffraction patterns (including all environments investigated here). .......................... 95
Figure 4.3 Non-isothermal oxidation traces of the oxidation of dysprosium particles. The simultaneous TGA and DSC behavior is shown for each of the oxidation atmospheres investigated (N2 - (2, 20, or 50%) O2 and Ar - 20% O2). ............................................................................................................ 96
xvi
Figure 4.4 Typical isothermal TGA traces used for the kinetics assessment of the oxidation of dysprosium particles. The traces shown are of multiple runs at the indicated temperatures to show the variability of the data. Average curves were calculated and used for the subsequent kinetics assessment. 97
Figure 4.5 Isothermal TGA traces describing the oxidation of dysprosium particles in clean air (N2 - 20% O2) from 500-950 °C. An inflection is observed in each data set at the beginning of the reaction (b) after an initial region of oxidation where the mechanism is presumed to change into an intermediate region of oxidation. Similar behavior occurs in each of the oxidation atmospheres investigated, as demonstrated in Figure 5.6. ........ 98
Figure 4.6 Isothermal thermogravimetric traces describing the oxidation of dysprosium particles at 700 and 800 °C in each of the atmospheres investigated (N2 - (2, 20, or 50%) O2 and Ar - 20% O2)........................... 99
Figure 4.7 Plot showing the effect of isothermal oxidation temperature on the extent of reaction where the initial oxidation kinetics change to the intermediate kinetics of the oxidation reaction for each of the oxidation atmospheres investigated (N2 - (2, 20, or 50%) O2 and Ar - 20% O2)......................... 100
Figure 4.8 Arrhenius plot for the initial isothermal oxidation region of dysprosium particles in each of the atmospheres investigated using a contracting area kinetics model. The apparent activation energy is calculated from the linear relation and is labeled for each atmosphere. ................................. 101
Figure 4.9 Arrhenius plots for the intermediate isothermal oxidation region of dysprosium particles in each of the atmospheres investigated using Ginstling-Brounshtein diffusion model. The intermediate region of oxidation of dysprosium in N2 - 50% O2 was isolated from the others due to its interesting behavior, as seen in (b). In each case, the apparent activation energy is calculated from the linear relation and is labeled on each fit. .................................................................................................... 102
Figure 4.10 Kroeger-Vink diagram of the isothermal oxidation of the dysprosium particles showing the dependence of oxygen partial pressure (with a nitrogen carrier gas) on the rate constant in the initial (a) and intermediate (b) regions of oxidation, as described in Figure 5.7. The slopes for each linear fit are identified and provide insight into the oxidation mechanism.................................................................................................................. 103
Figure A.1 This figure (a-c) shows a schematic of an impact event renewing the reactive surface. (a) media approaches the vessel wall (b) media impact transfers energy to the impact area πrh
2 (c) media rebound exposes activated surfaces on the wall and media. Part (d) shows a schematic of the
xvii
impact event between a dysprosium-coated media and the coated vessel. Listed quantities in (d) are defined in the text. ....................................... 137
Figure A.2 This figure shows x-ray diffraction plots collected after milling Dy in N2 at 500 rpm. Milling times are indicated on plot. The inset shows the average DyN crystallite size calculated by the Scherrer equation from the FWHM of five simultaneously-fit peaks. ............................................... 138
Figure A.3 This SEM micrograph shows a secondary electron image of DyN formed by milling dysprosium for 6 hours at 500 rpm in nitrogen. .................... 139
Figure A.4 This plot tracks the disposition of Dy and DyN during reactive milling at 500 rpm. Before the start of RM, ductile Dy was coated onto the media and walls by premilling in argon. The media and wall traces (red circles and green down arrows) show consumption of Dy and formation of free DyN powder (blue up arrows). Total mass in the vessel (black squares) decreases as coated media are removed for further characterization. Color online....................................................................................................... 140
Figure A.5 This plot shows the variation of the coefficient of restitution CR (black open squares) and media mass m (blue circles) with extent of reaction α during reactive milling of Dy in nitrogen. Equations for the best fit lines are shown. Color online. ......................................................................... 141
Figure A.6 This figure shows plots of reaction extent data (black traces) fit to the generic power law formula α = A0 + Btm (dashed red traces). The fit coefficients and adjusted r2 value are tabulated in Table A.3. Color online.................................................................................................................. 142
Figure A.7 This figure plots the power law fit coefficients Ma and m versus the angular frequency of the milling vessel. Equations for the best fit lines are shown. ..................................................................................................... 143
Figure A.8 This figure shows fitted values for Ma plotted versus the milling intensity per media νEb/N. The equation for the best fit line is shown, and the very good correlation indicates a reaction rate that depends on the milling intensity. .................................................................................................. 144
Figure A.9 This figure shows the graphical determination of the reaction model g(α) from Eq. 17 with experimental data from Fig. A.5. The red dashes are best fits to the model. The inset table lists the obtained exponents from a fit to 1/E(α) = A + G(α1/m)n, and the inset plot shows the reaction model g(a) = α1/n. .......................................................................................................... 145
xviii

Figure A.10 This figure shows the energy-corrected reaction model g(α) plotted against the normalized milling dose (vEt)rpm / (vEt)650. The linear slope outside of the initiation region provides support for the assumed model. ............... 146
xix
LIST OF ABBREVIATIONS
AmN Americium nitride
α Reaction extent
α-U Alpha phase uranium
Ar Argon gas
at% Atomic percent
atm Atmosphere
ATF Accident tolerant nuclear fuel
BDB Beyond design basis
BET Brunauer-Emmett-Teller
BPR Ball to powder ratio
BSE Backscattered electron
BWR Boiling water nuclear reactor
BWREoS Benedict-Webb-Rubin equation of state
°C Degrees Celsius
C Carbon
CAES Center for Advanced Energy Studies
CR Coefficient of restitution
DB Design basis
dMA Double mechanical alloying
xx
DOE Department of Energy
DSC Differential scanning calorimetry
Dy Dysprosium
Dy2O3 Dysprosium oxide
DyN Dysprosium nitride
Ea Activation energy
EBR-II Experimental breeder reactor-II
EDS Energy dispersive X-ray spectroscopy
eV Electron volt
FCC Face centered cubic
FCM Fully ceramic microencapsulated fuel
FFTF Fast flux test facility
GWd/t Gigawatt-days per ton of uranium
H2 Hydrogen gas
HCP Hexagonal close-packed
HEBM High energy ball milling
HRC Rockwell hardness C
Hz Hertz
ICPMS Inductively coupled plasma mass spectrometer
ICDD International Centre for Diffraction Data
ICSD Inorganic Crystal Structure Database
J Joule
K Kelvin
xxi
k Kinetics rate constant
kJ Kilojoule
kg Kilogram
kp Parabolic rate constant
kPa Kilopascal
ktons Kilotons
LWR Light water nuclear reactor
M2A Mechanically activated annealing
MA Mechanical alloying
MASHS Mechanically activated self-propagating high-temperature synthesis
MD Mechanical disordering
MEMS Micro-electromechanical systems
MG Mechanical grinding
MM Mechanical mixing
mMoles Millimoles
MPa Megapascal
MSE Materials Science and Engineering
n Number of moles
N Nitrogen
N-15 Nitrogen isotope with a mass of 15 grams per mole
N2 Nitrogen gas
NERI Nuclear Energy Research Initiative
NEUP Nuclear Energy University Programs
xxii

nm Nanometer
O Oxygen
O2 Oxygen gas
P Pressure
PBM Planetary ball milling
ppm Parts per million
ppb Parts per billion
PSA Particle size analysis
PSD Particle size distribution
PVDC Polyvinylidene chloride
RM Reactive milling
RMM Reactive mechanical milling
rpm Revolutions per minute
R Universal gas constant
Ru Universal gas constant
SEM Scanning electron microscopy
SiO2 Silicon dioxide
SPEX Shaker milling
T Temperature
t time
TD Theoretical density
TGA Thermogravimetric analysis
Torr Torr
xxiii
XRD X-ray diffraction
U Uranium
U2N3 Uranium sesquinitride
U3O8 Triuranium octoxide
U-235 Uranium isotope with a mass of 235 grams per mole
UC Uranium monocarbide
UHP Ultra high purity
μg Microgram
μL Microliter
μm Micrometer
UN Uranium mononitride
UN1+x Hyperstoichiometric uranium nitride
UO2 Uranium dioxide
USix Compound of uranium and silicon
USDOE United States Department of Energy
V Volume
�̅� Molar volume
YSZ Yttria stabilized zirconia
W Watt
w% Weight percent
ZrC Zirconium carbide
xxiv
1
CHAPTER ONE: INTRODUCTION
The work presented in this dissertation highlights research that has been accepted
for publication, or published through four publications in two separate journals: the
Journal of Nuclear Materials and the Journal of Alloys and Compounds. Chapter Two
describes the experimental preparation of dysprosium nitride (DyN) using a
mechanochemical reaction method. The research described in Chapter Two is part of a
larger effort in the understanding of reactive milling (also referred to as a
mechanochemical synthesis or a mechanically induced gas-solid reaction) by high energy
planetary ball milling elemental dysprosium in a nitrogen atmosphere to form DyN. The
mechanochemical reaction was monitored (as a function of milling intensity and time)
using in situ temperature and pressure measurements to calculate the extent of the
reaction. A more detailed kinetics study is presented on the nitridation of dysprosium in a
planetary ball mill in the Appendix (also published in the Journal of Alloys and
Compounds), where a fundamental milling dynamics model is used to describe the
behavior of the RM process.
Similar to Chapter Two, Chapter Three presents a synthesis technique to produce
a nitride ceramic. However, instead of using mechanical energy to cause the reaction to
proceed, the reaction was induced via thermal energy. Accordingly, Chapter Three
describes the preparation of uranium mononitride (UN) using a thermal synthesis
technique that avoids excessive carbon impurities. The UN powder was then used in the
2
fabrication of UN-UO2 (up to 10 wt% UO2) composite pellets for sintering atmosphere
and temperature studies. The research presented in Chapter Three has been accepted for
publication in the Journal of Nuclear Materials.
Another gas-solid kinetics study is presented in Chapter Four where elemental
dysprosium particles were reacted with various oxygen containing atmospheres.
Dysprosium was reacted in the temperature range of 450 – 1000 °C in N2 - (2%, 20%,
and 50%) O2 and Ar - 20% O2 process gas streams and monitored using simultaneous
thermal analysis techniques. The rate of mass change in each gas stream was used in
various kinetics models to determine apparent activation energies for oxidation in two
defined regions of oxidation. In order to gain further insight into the oxidation
mechanisms, Kroger-Vink plots were created and an inert marker experiment was
conducted on a cast dysprosium rod. The research presented in Chapter Four has also
been accepted for publication in the Journal of Alloys and Compounds.
Each chapter presents a conclusive study but are each related by the central theme
of reaction kinetics. Accordingly, a detailed introduction to each article (each kinetics
study and materials system) is provided at the beginning of each individual chapter.
3
CHAPTER TWO: IN SITU CHARACTERIZATION OF THE NITRIDATION OF
DYSPROSIUM DURING MECHANOCHEMICAL PROCESSING*
This chapter is published by Elsevier in Journal of Alloys and Compounds and should be
referenced appropriately.
Reference:
B. J. Jaques, D. D. Osterberg, G. A. Alanko, S. Tamrakar, C. R. Smith, M. F. Hurley, D.
P. Butt, “In situ characterization of the nitridation of dysprosium during
mechanochemical processing.” Journal of Alloys and Compounds. 619 253-261 (2015).
Reproduced/modified by permission of Elsevier.
*This chapter includes modifications from the originally published version.
4
In Situ Characterization of the Nitridation of Dysprosium
During Mechanochemical Processing
Brian J. Jaquesa,b
Daniel D. Osterberga,b
Gordon A. Alankoa,b
Sumit Tamrakara,b
Cole R. Smitha,b
Michael F. Hurleya,b
Darryl P. Butta,b
Accepted for publication in:
Journal of Alloys and Compounds
January 2015
aDepartment of Materials Science and Engineering, Boise State University,
1910 University Dr., Boise, ID 83725, USA
bCenter for Advanced Energy Studies,
995 University Blvd, Idaho Falls, ID 83415.

5
Abstract
Processing of advanced nitride ceramics traditionally requires long durations at
high temperatures and, in some cases, in hazardous atmospheres. In this study,
dysprosium mononitride (DyN) was rapidly formed from elemental dysprosium in a
closed system at ambient temperatures. An experimental procedure was developed to
quantify the progress of the nitridation reaction during mechanochemical processing in a
high energy planetary ball mill (HEBM) as a function of milling time and intensity using
in situ temperature and pressure measurements, SEM, XRD, and particle size analysis.
No intermediate phases were formed. It was found that the creation of fresh dysprosium
surfaces dictates the rate of the nitridation reaction, which is a function of milling
intensity and the number of milling media. These results show clearly that high purity
nitrides can be synthesized with short processing times at low temperatures in a closed
system requiring a relatively small processing footprint.
Keywords: Nitride materials, Rare earth alloys and compounds, Gas-solid reactions,
Mechanochemical processing, Inorganic materials, Ceramics
2.1 Introduction
Interest in rare earth element production and management has increased
significantly in the United States (US) in the past few years. Such “strategic materials”
have substantially increased the US dependence on the Republic of China, which
exported 99% of the approximately $186 million worth of rare earths to the US in 2008
for use in metallurgical applications and alloys, electronics, catalysts, and cathode ray
6
tubes [1]. Compared to the light rare earth metals, relatively little published literature
exists for praseodymium, promethium, thulium, lutetium, and dysprosium although
scientific interest in these metals is on the rise. In the next forty years, Hoenderdaal et al.
[2] project that the demand for dysprosia (Dy2O3) and other dysprosium compounds will
increase to between 7-25 times (to 14-50 ktons) the 2010 demand. This increase in
projected demand largely stems from magnetic applications in electric motors due to
dysprosium’s exceptional magnetic moment of 10.6 Bohr magnetrons, which is second
only to holmium, and its ability to induce coercivity as an alloying agent or dopant [3].
DyN has also been investigated as a material for ferromagnetic and semiconductor
superlattice structures for spintronic applications [4-6]. Dysprosium’s isotopes strongly
absorb neutrons and could be applied as moderator materials in nuclear reactors.
Additionally, due to its physical attributes and high vapor pressure, dysprosium
mononitride (DyN) has been postulated as a suitable surrogate for americium
mononitride (AmN) in studying its sintering and alloying effects in spent nuclear fuel
reprocessing [7-12].
Traditional synthesis routes to advanced nitride ceramics are based on thermal
treatments, which can require large amounts of infrastructure, long processing times, and
can introduce excessive amounts of anion impurities. High energy ball milling (HEBM)
is an alternative technique that can be used to synthesize high purity nitride ceramics in
relatively short times in a sealed and controlled environment, which reduces exposure to
unwanted atmospheres. HEBM is used in many processes that have been described in
literature: Mechanical alloying (MA), mechanical milling (MM) and mechanical grinding
(MG), mechanical disordering (MD), reactive milling (RM), reactive mechanical milling
7
(RMM), cryomilling, mechanically activated annealing (M2A), double mechanical
alloying (dMA), and mechanically activated self-propagating high-temperature synthesis
(MASHS) [13, 14]. HEBM is a versatile processing technique that has been
demonstrated as useful for producing nanometer-structured materials, crystalline and
amorphous materials, as well as equilibrium and metastable phases [13]. A ball milling
process that is considered high energy is one that utilizes high media impact velocities
and large media impact frequencies to efficiently mill the powder charge. This can be
accomplished in numerous ways. Most notably, dynamic mechanical energy can be
delivered to a powder charge using a few different milling techniques, including:
horizontal ball milling, planetary ball milling (PBM), magneto ball milling, and shaker
milling (SPEX) [13-16]. Different milling apparatuses vary in capacity, efficiency of
milling, and spatial arrangements requiring each to be characterized independently when
attempting to understand the mechanisms of the processes.
Mechanical alloying has been used to synthesize oxide dispersion strengthened
alloys since the 1960s and, approximately a decade later, the same process was shown to
be useful as a ceramic synthesis method, later noted as RM [13]. For the past 40 years,
RM has been investigated for the low temperature, solid state synthesis of advanced
ceramics. According to Huot et al. [14], RM has been demonstrated on hydrogen storage
materials using various milling techniques for the past 10 years, resulting in
approximately one thousand publications. However, the study of RM in the synthesis of
non-oxide and non-hydride materials has not been studied as extensively; there are fewer
than 50 publications on the use of RM to form nitrides and fewer than 20 that used PBM.
The limited number of studies that focused on producing nitride ceramics tended to

8
investigate transition metals and class IIIA elements such as: Al, B, Cr, Fe, Ga, Nb, Si,
Ta, Ti, V, and Zr [13, 17-33]. To the best of the authors’ knowledge, the synthesis of
lanthanide or actinide nitrides via RM has not been published other than the earlier work
of this group [7-10]. In particular, to study nitridation reaction kinetics during RM in a
PBM using in situ temperature and pressure data is very limited; there are no studies
found in the literature on RM in a PBM to form nitrides with in situ temperature and
pressure measuring capabilities. The only studies found that have demonstrated such
capabilities during PBM are limited and stem from the research on hydrogen storage
materials [34-40].
The work described here is part of a larger effort in the understanding of RM (also
referred to as a mechanochemical synthesis or a mechanically induced gas-solid reaction)
by high energy planetary ball milling elemental dysprosium in a nitrogen atmosphere to
form dysprosium mononitride (DyN), as follows:
𝐷𝑦 + 12𝑁2 → 𝐷𝑦𝑁 (1)
The mechanochemical reaction was monitored (as a function of milling intensity
and time) using in situ temperature and pressure measurements to calculate the extent of
the reaction. A more detailed kinetics study is presented on the nitridation of dysprosium
in a PBM in our concurrent publication [41], where a fundamental milling dynamics
model is used to describe the behavior of the RM process.
2.2 Experimental Details
To study the RM during PBM of the nitridation reaction, milling experiments
were performed in ultra-high purity (UHP) nitrogen with high purity dysprosium filings
(99.9% purity, ESPI) sieved through a 40 mesh (420 μm) sieve (Figure 2.1). The filings
9
had a surface area of 0.196 ± 0.058 m2g-1, as determined by nitrogen adsorption
Brunauer-Emmett-Teller (BET) techniques. In order to gain insight into the reaction
kinetics, the internal temperature and pressure of the milling vessel were monitored
during milling in a Retsch planetary ball mill (PM100) at milling intensities varying from
350 – 650 rpm. Each milling run was completed using a Retsch 250 mL hardened steel
milling vessel (85Fe, 12Cr, 2.2C, 0.45Mn, 0.4Si) and 5 mm diameter, spherical yttria
stabilized zirconia media (Tosoh, Tokyo, Japan). According to the respective vendors, the
milling vessel and milling media had a hardness of 62 HRC and 72 HRC, respectively.
The ball to powder ratio (BPR) was held constant at 14:1 with a total dysprosium mass of
5 grams (70 grams of YSZ media, which equates to 184 spheres). The temperature and
pressure were monitored using a Retsch sensing lid (PM GrindControl), which has
capabilities of 273 – 473 K, 0 – 500 kPa, and can wirelessly send data at 200 Hz to a
remote computer. The temperature (measured by a thermistor) and pressure sensors are
integrated into recessed locations in the steel sensing lid.
During each run, the milling vessels were loaded with media and dysprosium and
sealed with the temperature and pressure monitoring lid in an argon atmosphere
glovebox. It was then charged to approximately 450 kPa with oxygen-gettered UHP
nitrogen (oxygen content less than 0.1 ppb as measured by a Neutronics OA-1 oxygen
analyzer). The vessel was charged to 450 kPa and relieved (3 cycles) prior to a final
charge of 450 kPa in order to ensure a pure nitrogen milling atmosphere.
The stages of the milling process were observed through mass measurements,
SEM imaging, and powder X-ray diffraction (XRD) during a 500 rpm milling run. The
500 rpm milling run was periodically interrupted between 0 – 6 hours of milling. Each

10
time the process was halted, the milling vessel was transferred into an argon atmosphere
glovebox where the lid was removed and the measurements or representative powders
were taken. The same powder and media was then sealed, evacuated and charged with
nitrogen, and secured to the mill for subsequent milling.
The effect of milling intensity was assessed by milling for 6 hours at different
intensities from 350 – 650 rpm. After milling, the powder was separated from the milling
media in the argon-filled glovebox and characterized using SEM imaging, laser-
scattering particle size analysis (PSA), and XRD. Additionally, temperature and pressure
data were used to assess the reaction kinetics at each milling intensity.
In each case, XRD was performed at room temperature on a Bruker D8 Discover
using Cu-Kα radiation (λ = 0.15418 nm). However, some of the patterns were collected
with a scintillation counter and some were collected with a 2-dimensional area detector.
Due to the oxygen sensitivity of the material, the XRD samples were prepared in an
argon glovebox and a semi- X-ray transparent film was placed over the powder filled
sample holders in order to prevent oxidation during the XRD scans.
The particle morphology after 6 hours of milling at 350 – 650 rpm was
investigated using a Hitachi (S-3400N) thermionic cathode scanning electron microscope
(SEM) as well as a Horiba (LA-950) laser scattering particle size analyzer (PSA). The
powders were first adhered to carbon tape prior to carbon coating in order to obtain SEM
images with reduced electron charging. For PSA, the DyN powders were dispersed in an
isoparaffinic fluid (Isopar V, ExxonMobil) by external ultrasonication using a 750 W
sonication probe prior to loading into the mixing chamber of the Horiba analyzer. The
11
refractive indices used for the free powder and the Isopar V were 2.5-0.43i and 1.452,
respectively.
2.3 Results
Typical in situ temperature and pressure data (collected at 0.2 Hz) from milling
dysprosium with a BPR of 14:1 at 500 rpm in UHP nitrogen is shown in Figure 2.2. It is
seen that the rate of change of both temperature and pressure reach a steady state after
approximately 2.5 hours. An 8 kPa increase in the pressure was observed immediately
upon starting the mill. The pressure peaked at 22 kPa above the initial pressure before
decreasing and reaching a steady state decay rate (the constant decay is attributed to a
slow leak in the seal between the milling vessel and sensing lid). Figure 2.2 also shows
systematic effects of the milling process on the temperature and pressure in the vessel
when the mill is turned off (after 6 hours of milling). The pressure immediately drops
6 kPa and decays another 8 kPa between 0 – 9 minutes after stopping the mill.
Additionally, as soon as the mill turns off, the temperature decreases by 1.1 K before
increasing 0.6 K and then cooling to room temperature.
The temperature and pressure data was then used to calculate the amount of
nitrogen consumed throughout the RM process (as shown in the inset of Figure 2.2) using
the ideal gas law:
𝑛 = 𝑃𝑉𝑅𝑇
(2)
where n is the number of moles of nitrogen gas consumed, P is the pressure, V is the
volume of free space in the milling vessel, R is the ideal gas constant, and T is the
temperature of the vessel. After approximately 1.5 hours of milling, the nitrogen
consumption rate significantly slows, reaching steady state (with a slight leak) after
12
approximately 2.5 hours. As described above, the effects of the milling process (when
starting and ending the mill) on the temperature and pressure directly translate into the
nitrogen consumption plot.
To better understand the distribution and morphology of the products and
reactants as a function of RM time, a 500 rpm milling run, similar to that shown in Figure
2.2, was periodically interrupted and the location of the powder within the mill was
quantified. The bar chart in Figure 2.3 shows the distribution of dysprosium within the
milling vessel. Initially, all of the powder was of course free dysprosium filings. After ten
minutes of milling, approximately 30% of the dysprosium was cold welded to the media
and the walls of the milling vessel. Following an additional 50 minutes, nearly 85% of
the initial powder mass was recovered as free powder with the remainder still cold
welded to the walls of the vessel. After 180 minutes of milling at 500 rpm, all of the
dysprosium could be recovered as free powder within the milling vessel. In each case, the
free powder was imaged using SEM (Figure 2.4) and was characterized for phase
distribution by XRD (Figure 2.5). From the SEM images, it was seen that the free powder
morphology changed with increased milling time from a large plate-like morphology to
more uniform particles to a bimodal particle size after long milling times. As one might
expect, XRD showed a transition from the hexagonal closed-pack (HCP) structure of
dysprosium to the face-centered cubic (FCC) structure of DyN with increased milling
time (Figure 2.5). The diffraction intensity of the free powder after 30 minutes was very
weak and an unidentified peak appears. However, after approximately 60 minutes, the
HCP diffraction pattern caused by the elemental dysprosium diminishes and the FCC
diffraction pattern of DyN dominates. However, it is worth noting that the XRD is
13
performed on only the free powder obtained from the milling vessel and therefore the
nitride conversion via XRD overestimates the actual conversion of the dysprosium charge
(which is due to material (primarily elemental dysprosium) that is cold welded to the
vessel walls, as depicted in Figure 2.3). As milling time was increased, there exists a
slight shift in the lattice parameters, but no new phases appear to have formed.
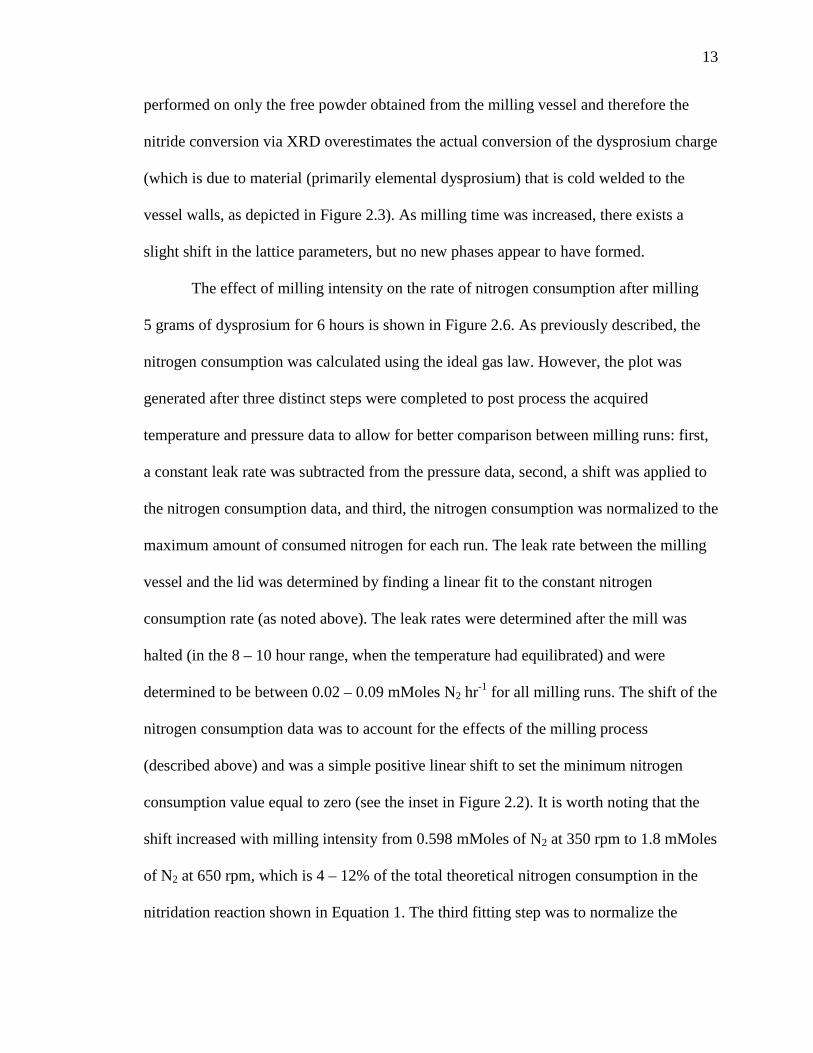
The effect of milling intensity on the rate of nitrogen consumption after milling
5 grams of dysprosium for 6 hours is shown in Figure 2.6. As previously described, the
nitrogen consumption was calculated using the ideal gas law. However, the plot was
generated after three distinct steps were completed to post process the acquired
temperature and pressure data to allow for better comparison between milling runs: first,
a constant leak rate was subtracted from the pressure data, second, a shift was applied to
the nitrogen consumption data, and third, the nitrogen consumption was normalized to the
maximum amount of consumed nitrogen for each run. The leak rate between the milling
vessel and the lid was determined by finding a linear fit to the constant nitrogen
consumption rate (as noted above). The leak rates were determined after the mill was
halted (in the 8 – 10 hour range, when the temperature had equilibrated) and were
determined to be between 0.02 – 0.09 mMoles N2 hr-1 for all milling runs. The shift of the
nitrogen consumption data was to account for the effects of the milling process
(described above) and was a simple positive linear shift to set the minimum nitrogen
consumption value equal to zero (see the inset in Figure 2.2). It is worth noting that the
shift increased with milling intensity from 0.598 mMoles of N2 at 350 rpm to 1.8 mMoles
of N2 at 650 rpm, which is 4 – 12% of the total theoretical nitrogen consumption in the
nitridation reaction shown in Equation 1. The third fitting step was to normalize the
14
reaction extent in each milling run. This was completed by normalizing nitrogen
consumption to the maximum apparent nitrogen consumption for each milling run, which
was 92 ± 5% of the theoretical nitrogen consumption.
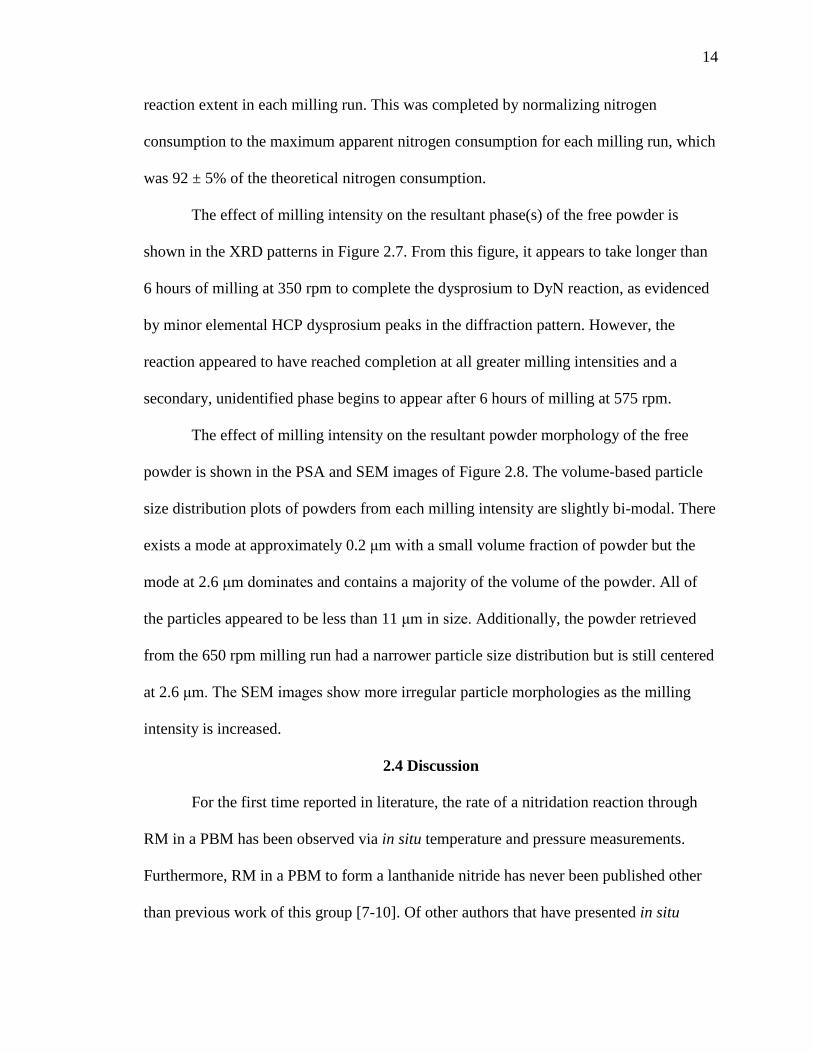
The effect of milling intensity on the resultant phase(s) of the free powder is
shown in the XRD patterns in Figure 2.7. From this figure, it appears to take longer than
6 hours of milling at 350 rpm to complete the dysprosium to DyN reaction, as evidenced
by minor elemental HCP dysprosium peaks in the diffraction pattern. However, the
reaction appeared to have reached completion at all greater milling intensities and a
secondary, unidentified phase begins to appear after 6 hours of milling at 575 rpm.
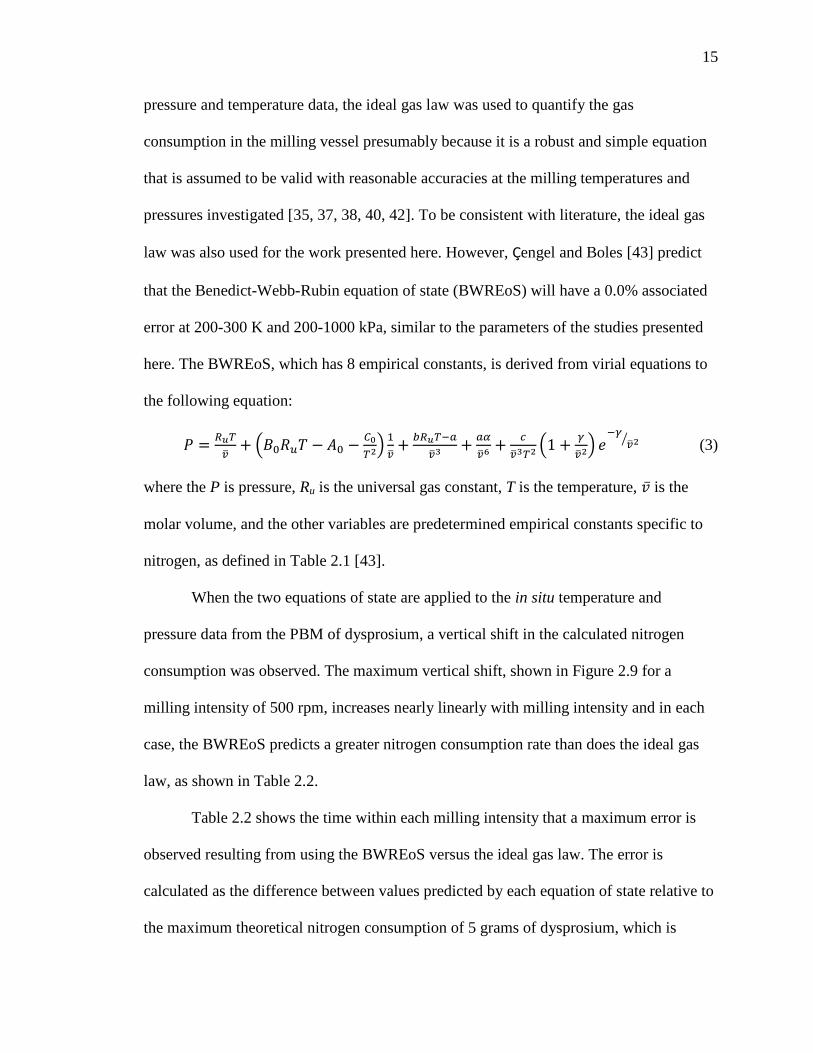
The effect of milling intensity on the resultant powder morphology of the free
powder is shown in the PSA and SEM images of Figure 2.8. The volume-based particle
size distribution plots of powders from each milling intensity are slightly bi-modal. There
exists a mode at approximately 0.2 μm with a small volume fraction of powder but the
mode at 2.6 μm dominates and contains a majority of the volume of the powder. All of
the particles appeared to be less than 11 μm in size. Additionally, the powder retrieved
from the 650 rpm milling run had a narrower particle size distribution but is still centered
at 2.6 μm. The SEM images show more irregular particle morphologies as the milling
intensity is increased.
2.4 Discussion
For the first time reported in literature, the rate of a nitridation reaction through
RM in a PBM has been observed via in situ temperature and pressure measurements.
Furthermore, RM in a PBM to form a lanthanide nitride has never been published other
than previous work of this group [7-10]. Of other authors that have presented in situ
15
pressure and temperature data, the ideal gas law was used to quantify the gas
consumption in the milling vessel presumably because it is a robust and simple equation
that is assumed to be valid with reasonable accuracies at the milling temperatures and
pressures investigated [35, 37, 38, 40, 42]. To be consistent with literature, the ideal gas
law was also used for the work presented here. However, Ҫengel and Boles [43] predict
that the Benedict-Webb-Rubin equation of state (BWREoS) will have a 0.0% associated
error at 200-300 K and 200-1000 kPa, similar to the parameters of the studies presented
here. The BWREoS, which has 8 empirical constants, is derived from virial equations to
the following equation:
𝑃 = 𝑅𝑢𝑇𝑣�
+ �𝐵0𝑅𝑢𝑇 − 𝐴0 −𝐶0𝑇2� 1𝑣�
+ 𝑏𝑅𝑢𝑇−𝑎𝑣�3
+ 𝑎𝛼𝑣�6
+ 𝑐𝑣�3𝑇2
�1 + 𝛾𝑣�2� 𝑒
−𝛾𝑣�2� (3)
where the P is pressure, Ru is the universal gas constant, T is the temperature, �̅� is the
molar volume, and the other variables are predetermined empirical constants specific to
nitrogen, as defined in Table 2.1 [43].
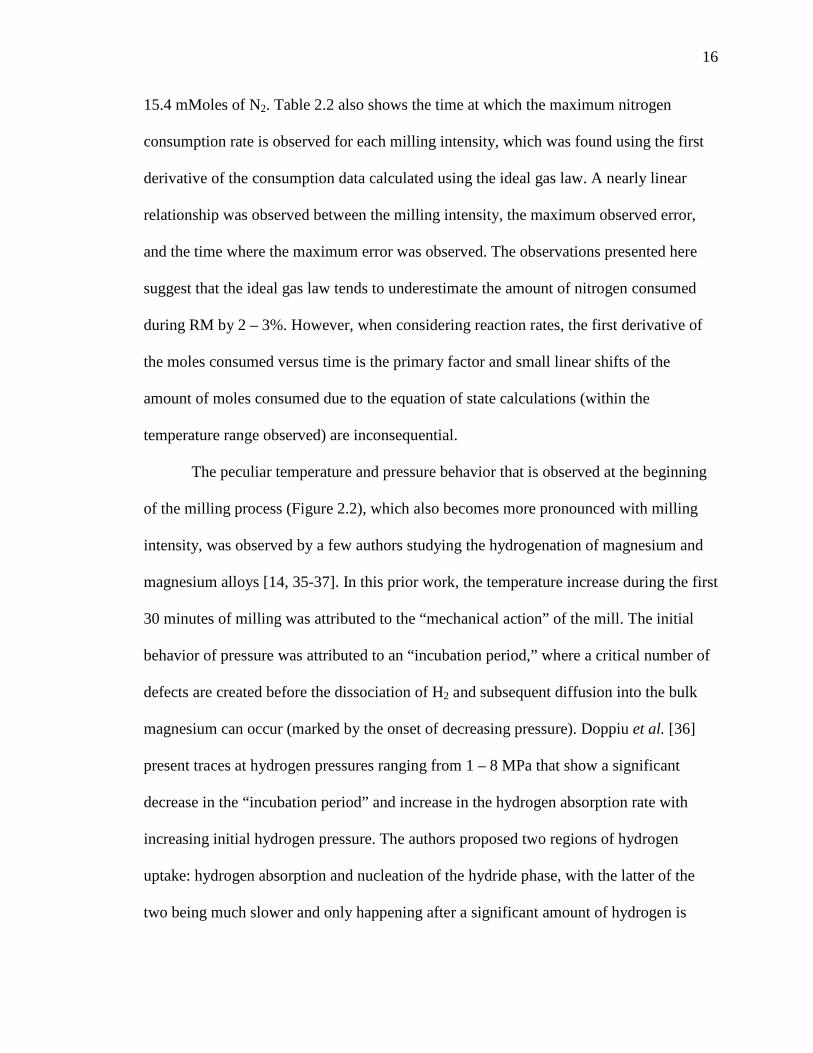
When the two equations of state are applied to the in situ temperature and
pressure data from the PBM of dysprosium, a vertical shift in the calculated nitrogen
consumption was observed. The maximum vertical shift, shown in Figure 2.9 for a
milling intensity of 500 rpm, increases nearly linearly with milling intensity and in each
case, the BWREoS predicts a greater nitrogen consumption rate than does the ideal gas
law, as shown in Table 2.2.
Table 2.2 shows the time within each milling intensity that a maximum error is
observed resulting from using the BWREoS versus the ideal gas law. The error is
calculated as the difference between values predicted by each equation of state relative to
the maximum theoretical nitrogen consumption of 5 grams of dysprosium, which is
16
15.4 mMoles of N2. Table 2.2 also shows the time at which the maximum nitrogen
consumption rate is observed for each milling intensity, which was found using the first
derivative of the consumption data calculated using the ideal gas law. A nearly linear
relationship was observed between the milling intensity, the maximum observed error,
and the time where the maximum error was observed. The observations presented here
suggest that the ideal gas law tends to underestimate the amount of nitrogen consumed
during RM by 2 – 3%. However, when considering reaction rates, the first derivative of
the moles consumed versus time is the primary factor and small linear shifts of the
amount of moles consumed due to the equation of state calculations (within the
temperature range observed) are inconsequential.
The peculiar temperature and pressure behavior that is observed at the beginning
of the milling process (Figure 2.2), which also becomes more pronounced with milling
intensity, was observed by a few authors studying the hydrogenation of magnesium and
magnesium alloys [14, 35-37]. In this prior work, the temperature increase during the first
30 minutes of milling was attributed to the “mechanical action” of the mill. The initial
behavior of pressure was attributed to an “incubation period,” where a critical number of
defects are created before the dissociation of H2 and subsequent diffusion into the bulk
magnesium can occur (marked by the onset of decreasing pressure). Doppiu et al. [36]
present traces at hydrogen pressures ranging from 1 – 8 MPa that show a significant
decrease in the “incubation period” and increase in the hydrogen absorption rate with
increasing initial hydrogen pressure. The authors proposed two regions of hydrogen
uptake: hydrogen absorption and nucleation of the hydride phase, with the latter of the
two being much slower and only happening after a significant amount of hydrogen is
17
absorbed and dissolved into the magnesium. However, in the case of rare earth elements,
the tendency for nitrogen dissolution is low and it has been shown that diatomic nitrogen
will preferentially dissociatively chemisorb on clean dysprosium surfaces at 300 K rather
than be adsorbed and subsequently dissolved into the metal [44]. It is therefore postulated
that as fresh surface is created through the milling process, nitrogen will spontaneously
dissociate on the dysprosium surfaces. Since it is thought that the dissolution of nitrogen
in dysprosium is low, it will nearly instantaneously form DyN at a rate that is directly
proportional to the creation of fresh, clean surfaces (which is a dependent on the number
of media, the media impact frequency, and the media impact energy) and is further
described and modeled in our concurrent publication [41]. This is a concept also
discussed by Bab et al. [42] in the nitridation of hafnium in a vibratory mill.
To better understand the influence of the milling process on the apparent nitrogen
consumption behavior, the effects observed in temperature and pressure traces during the
early stages of RM were investigated. The first experiment to sort out discrepancies in the
early stages of the milling process was to better understand the lag in sensing between the
temperature and pressure monitors. It is assumed that a large fraction of the heat input
into the milling vessel is contributed by the electrical motor and the mill itself via
conduction through the bottom of the milling vessel where the mill and the vessel were in
contact. Accordingly, a milling vessel that was loaded, sealed, and pressurized was
placed on a hot plate preheated to 332 K while temperature and pressure data were
recorded with the sensor lid. The resultant data from the sensing lid is shown in Figure
2.10 (the apparent change in nitrogen content is shown in the inset and was calculated
using the ideal gas law).

18
The temperature sensed at the top of the vessel (where the temperature sensor is
located) reached an equilibrium in 2.5 hours at a temperature of 314 K, or 18 K cooler
than that of the heat source. Once the temperature and pressure were both near
equilibrium, the vessel was removed from the heat source and placed on an insulated
bench at room temperature, where it took an additional 4.5 hours to cool back to room
temperature. From the collected data, a 5 minute lag was observed in the temperature
reading compared to the pressure reading even under static conditions. The temperature
discrepancy between the source and the sensor is presumed to be due to natural
convective losses to the surrounding environment causing a temperature gradient from
the heat source at the bottom of the vessel to the temperature sensor at the top of the
vessel. Additionally, by assuming the heat source is at the bottom of the vessel and that
the convection is the main source of heat loss resulting in a temperature gradient, it is
reasonable to assume that the temperature gradient will increase with milling intensity.
As the mill is rotating faster, a higher flow of air is passed over the milling vessel and
convective cooling becomes more prominent. In any case, it is presumed that the
temperature of the atmosphere within the milling vessel is at an intermediate temperature
value that falls between the value at the heat source and that of the sensor.
The rise in pressure during the constant heat source experiment is the result of gas
expansion with increasing temperature in a constant volume. The discrepancy in
temperature (as described above and shown in the inset of Figure 2.10) between the mean
temperature of the vessel and that measured by the sensor in the milling lid results in an
apparent consumption of nitrogen, as calculated by the ideal gas law. This apparent
19
nitrogen consumption was solely the effect of non-equilibrium conditions (temperature)
within the vessel.
To quantify the relative contributions of the mill, milling media impacts, and
mechanical deformation of dysprosium to the heat generation measured by the pressure
and temperature sensors, the milling process was duplicated with and without milling
media and dysprosium. The results are shown in Table 2.3, with the error determined
from the standard deviation of at least 3 milling runs. When a sealed vessel was milled
with no media and no dysprosium, the average temperature and pressure increases were
11 K and 1 kPa, respectively. The temperature and pressure both increased with the
addition of milling media and again with addition of dysprosium. The data collected with
the YSZ media and the 5 grams of dysprosium to create the 18 K and 22 kPa increases in
temperature and pressure are seen in Figure 2.2.
From these experiments, it was found that approximately 61% of the heat
measured during milling is due to the mill itself balanced with the heat dissipation by
convection and conduction during the milling process. The addition of media alone
causes an additional 31% increase, and the addition of dysprosium to the milling process
accounts for only the remaining 8% of the measured heat generation, or a statistical
increase of approximately 1.5 K when 5 grams of dysprosium is added to the milling
vessel. The additional heat increase from the addition of dysprosium can be explained by
a decrease in coefficient of restitution of the milling media as dysprosium cold welds to
the media and vessel walls in the early stages of milling, as shown in Figure 2.3 (a
concept that is more thoroughly explained and modeled in a concurrent publication [41]).
As the coefficient of restitution of the milling media decreases, it suggests that collisions
20
become less elastic and result in greater energy transfer to the milling vessel during
media impact events, further increasing the temperature measured. These results indicate
that, contrary to publications on hydrogenation of metals, most of the pressure and
temperature increase at the beginning of a milling run may be attributed to the mill itself
along with heat dissipation from milling media rather than any specific “mechanical
action” on the milled material.
2.5 Conclusions
An experimental method has been developed and implemented to quantitatively
assess the in situ nitrogen consumption during RM elemental dysprosium in a PBM to
form DyN at ambient temperatures. To the best of the authors’ knowledge, in situ
nitrogen consumption in a PBM has not been presented for any element in the literature
to date, although there are publications that have used in situ monitoring to study
hydrogen uptake in the synthesis of hydrogen storage materials in a PBM. This study
presents an understanding of the effects of the mill on the apparent rate of nitrogen
consumption at the beginning and end of the milling cycle to allow future researchers to
deduce these effects from the RM process. The Dy-N system is a model system to
develop an understanding of RM in a PBM due to the fact that no intermediate phases are
known to exist in the Dy-N system other than stoichiometric DyN. However, the lack of
thermodynamic data available in the literature for the Dy-N system complicates the
assessment. From the work presented here and our concurrent publication [41], it is
presumed that the rate of the nitridation reaction of dysprosium is limited by the creation
of fresh, reactive surfaces that catalyze the dissociation of diatomic nitrogen and allow
for the spontaneous formation of DyN. The rate of creation of such fresh surfaces can be
21
controlled by the milling intensity or the number of media, which are both related to the
number of impacts per unit time.
The results of this investigation demonstrate that advanced nitride ceramics,
which traditionally require long durations at high temperatures in hazardous atmospheres,
can be synthesized in short times, at low temperatures, and in a closed system. This
scalable process produces a final product that has a homogenous and fine microstructure
that can be easily shaped and consolidated using conventional sintering processes.
Acknowledgements
This work was partially funded through a Nuclear Energy Research Initiative
contract (NERI – DE-FC07 – 05ID14650).
Author Justification
The research presented in this publication was carried out by Brian Jaques, Daniel
Osterberg, Dr. Gordon Alanko, Sumit Tamrakar, Cole Smith, Dr. Michael Hurley, and
Dr. Darryl Butt. Brian coordinated much of the experimental work, collected
experimental data, and authored the manuscript. Much of the experimental work was
completed by Daniel under the direction of Brian, Dr. Hurley and Dr. Butt. Sumit and
Cole both contributed to foundational studies as well as particle size analysis. Dr. Alanko
contributed additional experimental data. Dr. Alanko, Dr. Hurley, and Dr. Butt
contributed fruitful discussions and ideas. Work done by Brian Jaques was in partial
fulfillment of the requirements for a Doctoral degree in Materials Science and
Engineering at Boise State University, under the advisement and supervision of Dr.
Darryl Butt. Dr. Butt contributed greatly in terms vision, ideas, advisement, critical
review of the article throughout the writing process, and financial support.
22
References
[1] J.S. Thomason, R.J. Atwell, Y. Bajraktari, J.P. Bell, D.S. Barnett, N.S.J. Karvonides, M.F. Niles, E.L. Schwartz, From national defense stockpile (NDS) to strategic materials security program (SMSP): evidence and analytic support, in, Institute for Defense Analysis, 2010.
[2] S. Hoenderdaal, L.T. Espinoza, F. Marscheider-Weidemann, W. Graus, Can a dysprosium shortage threaten green energy technologies?, Energy, 49 (2013) 344-355.
[3] B.T. Kilbourn, A Lanthanide Lanthology: Part I, A-L, Molycorp, Inc., Fairfield, NJ USA, 1993.
[4] Y.K. Zhou, M.S. Kim, N. Teraguchi, A. Suzuki, Y. Nanishi, H. Asahi, Optical and magnetic properties of the DyN/GaN superlattice, Phys. Status Solidi B-Basic Res., 240 (2003) 440-442.
[5] T.B. Thiede, M. Krasnopolski, A.P. Milanov, T. de los Arcos, A. Ney, H.W. Becker, D. Rogalla, J. Winter, A. Devi, R.A. Fischeri, Evaluation of Homoleptic Guanidinate and Amidinate Complexes of Gadolinium and Dysprosium for MOCVD of Rare-Earth Nitride Thin Films, Chem. Mat., 23 (2011) 1430-1440.
[6] X.J. Li, Y.K. Zhou, M. Kim, S. Kimura, N. Teraguchi, S. Emura, S. Hasegawa, H. Asahi, Magnetic and transport properties of ferromagnetic semiconductor GaDyN thin film, Chin. Phys. Lett., 22 (2005) 463-465.
[7] D.P. Butt, B.J. Jaques, D.D. Osterberg, B.M. Marx, P.G. Callahan, A.S. Hamdy, New routes to lanthanide and actinide nitrides, in: GLOBAL 2009: The Nuclear Fuel Cylcle: Sustainable Options and Industrial Perspectives, September 6, 2009 - September 11, 2009, Paris, France, 2009.
[8] B. Jaques, D.P. Butt, B.M. Marx, A.S. Hamdy, D. Osterberg, G. Balfour, Synthesis and characterization of actinide nitrides, in: GLOBAL 2007: Advanced Nuclear Fuel Cycles and Systems, September 9, 2007 - September 13, 2007, American Nuclear Society, Boise, ID, United states, 2007, pp. 591-596.
[9] B.J. Jaques, B.M. Marx, A.S. Hamdy, D.P. Butt, Synthesis of Uranium Nitride by a Mechanically Induced Gas-Solid Reaction, Journal of Nuclear Materials, 381 (2008) 309.311.
[10] P.G. Callahan, B.J. Jaques, B.M. Marx, A.S. Hamdy, D.P. Butt, Synthesis of Dysprosium and Cerium Nitrides by a Mechanically Induced Gas-Solid Reaction, Journal of Nuclear Materials, 392 (2009) 121-124.
[11] M. Takano, A. Itoh, M. Akabori, K. Minato, Hydrolysis reactions of rare-earth and americium mononitrides, Journal of Physics and Chemistry of Solids, 66 (2005) 697-700.
23
[12] M. Takano, S. Tagami, K. Minato, T. Kozaki, S. Sato, Lattice thermal expansions of (Dy, Zr)N solid solutions, Journal of Alloys and Compounds, 439 (2007) 215-220.
[13] C. Suryanarayana, Mechanical alloying and milling, Progress in Materials Science, 46 (2001) 1-184.
[14] J. Huot, D.B. Ravnsbæk, J. Zhang, F. Cuevas, M. Latroche, T.R. Jensen, Mechanochemical synthesis of hydrogen storage materials, Progress in Materials Science, 58 (2013) 30-75.
[15] P. Baláz, Mechanochemistry in nanoscience and minerals engineering, in, Springer, Berlin; London, 2008.
[16] A. Calka, J.I. Nikolov, Direct synthesis of AlN and Al-AlN composites by room temperature magneto ball milling: the effect of milling condition on formation of nanostructures, Nanostructured Materials, 6 (1995) 409-412.
[17] L. Liu, L. Lu, L. Chen, Y. Qin, L.D. Zhang, Solid-gas reactions driven by mechanical alloying of niobium and tantalum in nitrogen, Metall. Mater. Trans. A-Phys. Metall. Mater. Sci., 30 (1999) 1097-1100.
[18] Y. Chen, C.P. Li, H. Chen, Y.J. Chen, One-dimensional nanomaterials synthesized using high-energy ball milling and annealing process, Sci. Technol. Adv. Mater., 7 (2006) 839-846.
[19] Y. Chen, J. Fitz Gerald, J.S. Williams, S. Bulcock, Synthesis of boron nitride nanotubes at low temperatures using reactive ball milling, Chemical Physics Letters, 299 (1999) 260.
[20] Y. Chen, T. Halstead, J.S. Williams, Influence of milling temperature and atmosphere on the synthesis of iron nitrides by ball milling, Materials Science and Engineering A (Structural Materials: Properties, Microstructure and Processing), 206 (1996) 24-29.
[21] J.F. Sun, M.Z. Wang, Y.C. Zhao, X.P. Li, B.Y. Liang, Synthesis of titanium nitride powders by reactive ball milling of titanium and urea, Journal of Alloys and Compounds, 482 (2009) L29-L31.
[22] J.F. Sun, X.P. Li, B.Y. Liang, Y.C. Zhao, M.Z. Wang, Study on reaction mechanism of reactive ball milling of Ti with urea to prepare TiN powder, Journal of Inorganic Materials, 24 (2009) 759-763.
[23] M.S. El-Eskandarany, A.H. Ashour, Mechanically induced gas-solid reaction for the synthesis of nanocrystalline ZrN powders and their subsequent consolidations, Journal of Alloys and Compounds, 313 (2000) 224-234.
24
[24] F.J. Gotor, M.D. Alcala, C. Real, J.M. Criado, Combustion synthesis of TiN induced by high-energy ball milling of Ti under nitrogen atmosphere, Journal of Materials Research, 17 (2002) 1655-1663.
[25] C. Real, M.A. Roldan, M.D. Alcala, A. Ortega, Synthesis of nanocrystalline chromium nitride powder by mechanical processing, Journal of the American Ceramic Society, 90 (2007) 3085-3090.
[26] M.A. Roldan, V. Lopez-Flores, M.D. Alcala, A. Ortega, C. Real, Mechanochemical synthesis of vanadium nitride, Journal of the European Ceramic Society, 30 (2010) 2099-2107.
[27] Y. Qin, L. Liu, L. Chen, Characterization of nanocrystalline tantalum nitride formed by solid-gas reaction during mechanical alloying, Journal of Alloys and Compounds, 269 (1998) 238-240.
[28] J.I. Nikolov, J.S. Williams, D.J. Llewellyn, A. Calka, Phase evolution during ball milling of Al in NH3 and subsequent annealing, in, Mater. Res. Soc, Warrendale, PA, USA, 1998, pp. 649-654.
[29] P.-Y. Lee, C.-K. Lin, C.-L. Chang, Y. Hwu, T.-S. Chin, Preparation of Iron nitride powders through mechanical alloying and atmospheric heat treatment, in, IEEE, Kyongju, South Korea, 1999, pp. 13.
[30] M. Lee, S. Endoh, H. Iwata, Basic study on the solid-state nitriding of aluminum by mechanical alloying using a planetary ball mill, Advanced Powder Technology, 8 (1997) 291-299.
[31] Q. Yuan, Y. Zheng, H. Yu, Synthesis of nanocrystalline Ti(C,N) powders by mechanical alloying and influence of alloying elements on the reaction, International Journal of Refractory Metals and Hard Materials, 27 (2009) 121-125.
[32] J.Y. Kano, E. Kobayashi, W. Tongamp, F. Saito, Preparation of GaN powder by mechanochemical reaction between Ga2O3 and Li3N, Journal of Alloys and Compounds, 464 (2008) 337-339.
[33] Y. Kameshima, M. Irie, A. Yasumori, K. Okada, Mechanochemical effect on low temperature synthesis of AlN by direct nitridation method, in: 15th International Symposium on the Reactivity of Solids (ISRS), 9-13 Nov. 2003, Elsevier, Netherlands, 2004, pp. 185-190.
[34] J. Trapp, B. Kieback, Solid-state reactions during high-energy milling of mixed powders, Acta Materialia, 61 (2013) 310-320.
[35] J.X. Zhang, F. Cuevas, W. Zaidi, J.P. Bonnet, L. Aymard, J.L. Bobet, M. Latroche, Highlighting of a Single Reaction Path during Reactive Ball Milling of Mg and
25
TM by Quantitative H-2 Gas Sorption Analysis To Form Ternary Complex Hydrides (TM = Fe, Co, Ni), J. Phys. Chem. C, 115 (2011) 4971-4979.
[36] S. Doppiu, L. Schultz, O. Gutfleisch, In situ pressure and temperature monitoring during the conversion of Mg into MgH2 by high-pressure reactive ball milling, Journal of Alloys and Compounds, 427 (2007) 204-208.
[37] S. Deledda, B.C. Hauback, The formation mechanism and structural characterization of the mixed transition-metal complex hydride Mg2(FeH6)0.5(CoH5)0.5 obtained by reactive milling, Nanotechnology, 20 (2009) 204010 (204017 pp.).
[38] S. Deledda, B.C. Hauback, Hydride formation in Mg-based systems processed by reactive milling, Faraday Discussions, 151 (2011) 315-326.
[39] Z. Junxian, M.A. Pilette, F. Cuevas, T. Charpentier, F. Mauri, M. Latroche, X-ray Diffraction and NMR Studies of Na3-nLin AlH6 (n = 0, 1, 2) Alanates Synthesized by High-Pressure Reactive Ball Milling, J. Phys. Chem. C, 113 (2009) 21242-21252.
[40] F. Cuevas, D. Korablov, M. Latroche, Synthesis, structural and hydrogenation properties of Mg-rich MgH2-TiH2 nanocomposites prepared by reactive ball milling under hydrogen gas, Physical Chemistry Chemical Physics, 14 (2012) 1200-1211.
[41] G.A. Alanko, D.D. Osterberg, B.J. Jaques, M.F. Hurley, D.P. Butt, Kinetics of the Reactive Milling of Dysprosium Nitride, Journal of Alloys and Compounds, Accepted (2014).
[42] M.A. Bab, L. Mendoza-Zelis, L.C. Damonte, Nanocrystalline HfN produced by mechanical milling: Kinetic aspects, Acta Materialia, 49 (2001) 4205-4213.
[43] Y.A. Çengel, M.A. Boles, Thermodynamics: an engineering approach, McGraw-Hill, Boston, 2002.
[44] J.A. Schreifels, J.E. Deffeyes, L.D. Neff, J.M. White, An X-ray photo-electron spectroscopic study of the adsorption of N2, NH3, NO, AND N2O on dysprosium, Journal of Electron Spectroscopy and Related Phenomena, 25 (1982) 191-209.
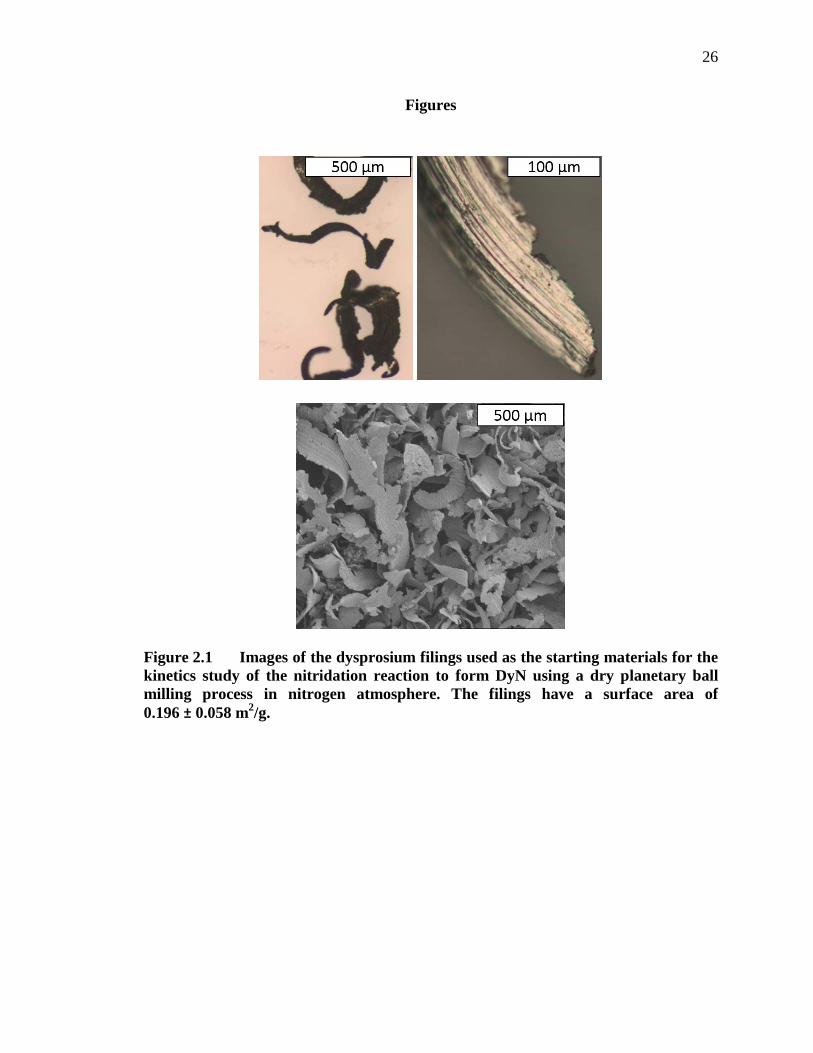
26
Figures
Figure 2.1 Images of the dysprosium filings used as the starting materials for the kinetics study of the nitridation reaction to form DyN using a dry planetary ball milling process in nitrogen atmosphere. The filings have a surface area of 0.196 ± 0.058 m2/g.
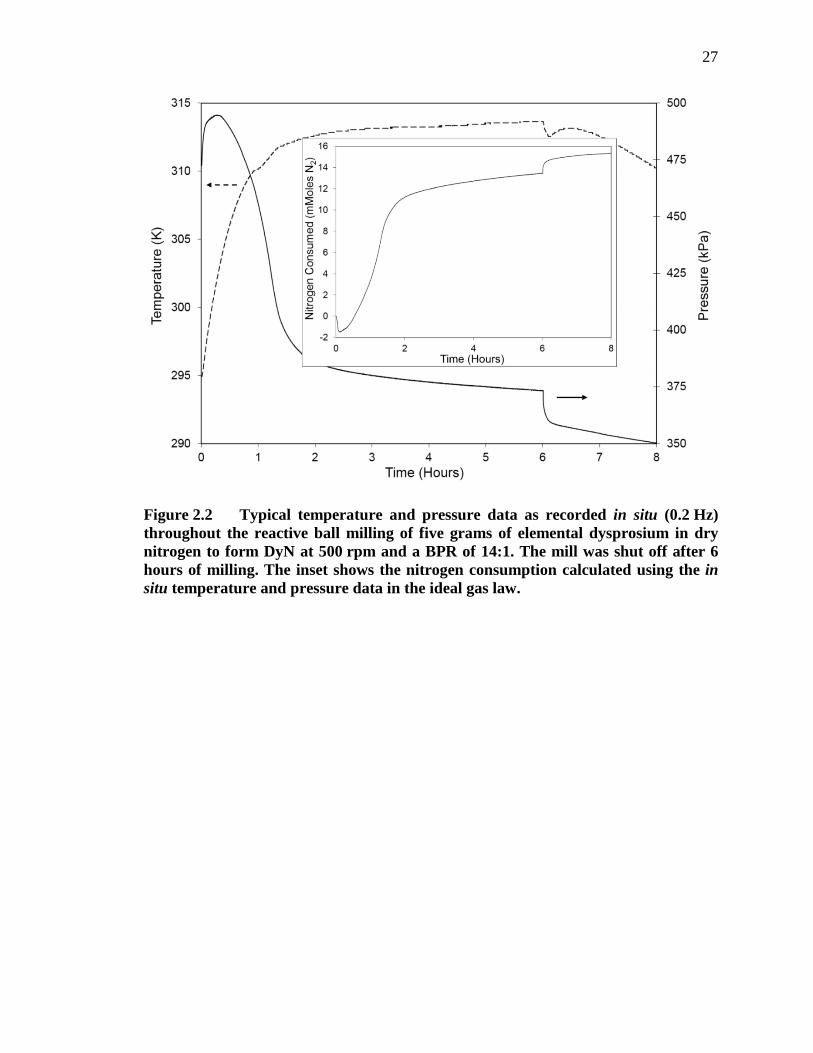
27
Figure 2.2 Typical temperature and pressure data as recorded in situ (0.2 Hz) throughout the reactive ball milling of five grams of elemental dysprosium in dry nitrogen to form DyN at 500 rpm and a BPR of 14:1. The mill was shut off after 6 hours of milling. The inset shows the nitrogen consumption calculated using the in situ temperature and pressure data in the ideal gas law.
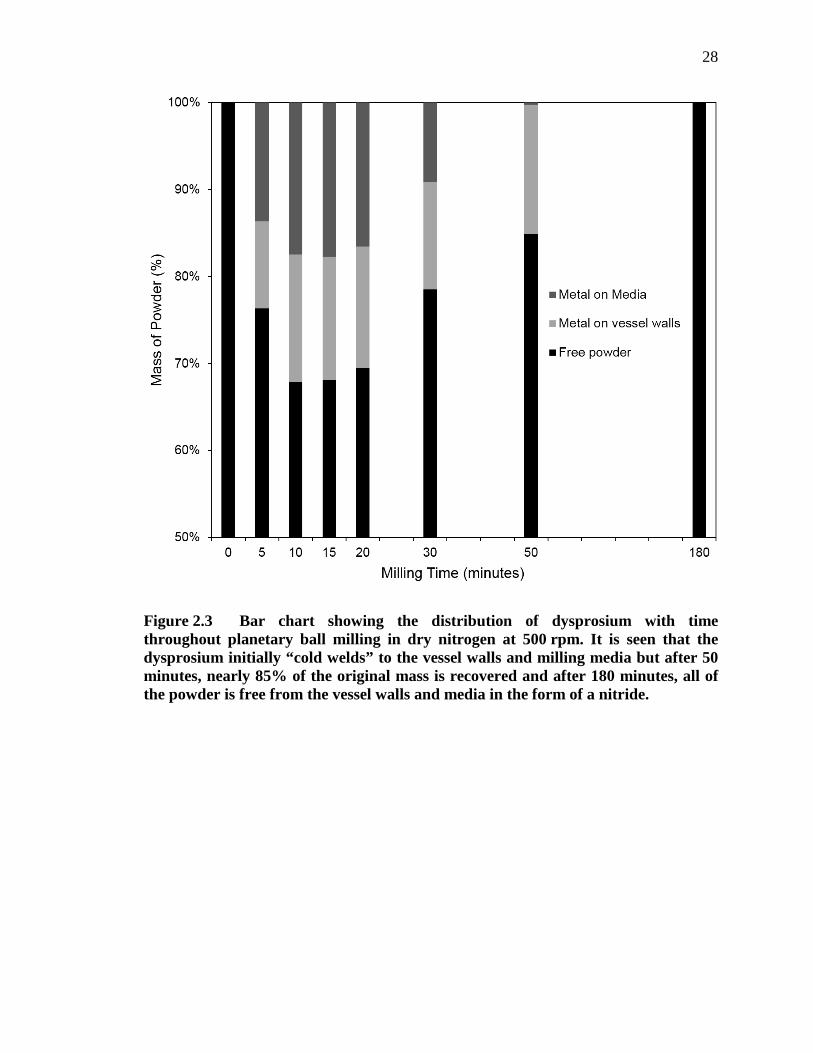
28
Figure 2.3 Bar chart showing the distribution of dysprosium with time throughout planetary ball milling in dry nitrogen at 500 rpm. It is seen that the dysprosium initially “cold welds” to the vessel walls and milling media but after 50 minutes, nearly 85% of the original mass is recovered and after 180 minutes, all of the powder is free from the vessel walls and media in the form of a nitride.
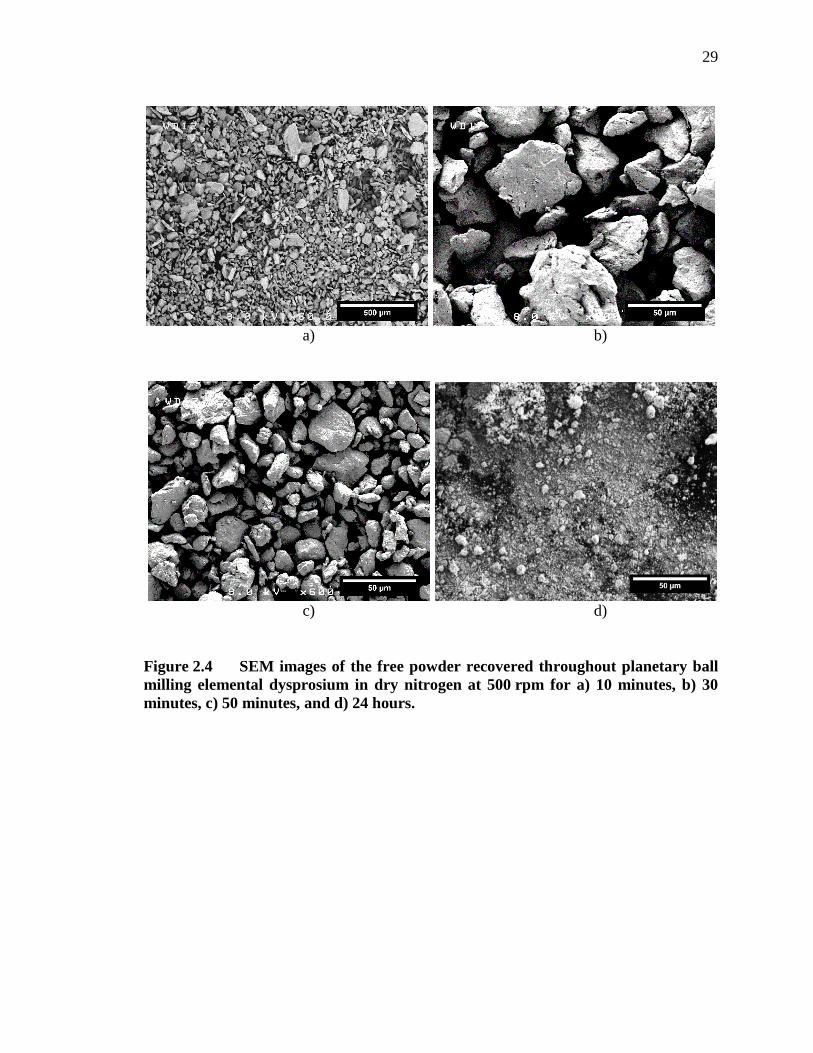
29
a) b)
c) d)
Figure 2.4 SEM images of the free powder recovered throughout planetary ball milling elemental dysprosium in dry nitrogen at 500 rpm for a) 10 minutes, b) 30 minutes, c) 50 minutes, and d) 24 hours.

30
Figure 2.5 X-ray diffraction patterns of the free powders resulting from reactive milling elemental dysprosium in dry nitrogen at 500 rpm up to 12 hours. It can be seen that after approximately 1 hour of milling, the only crystalline phase of the free powder is DyN. However, as seen in Figure 2.2, the conversion was not yet complete because nearly 15% of the original mass was cold welded to the milling vessel, which was found to be primarily elemental dysprosium.
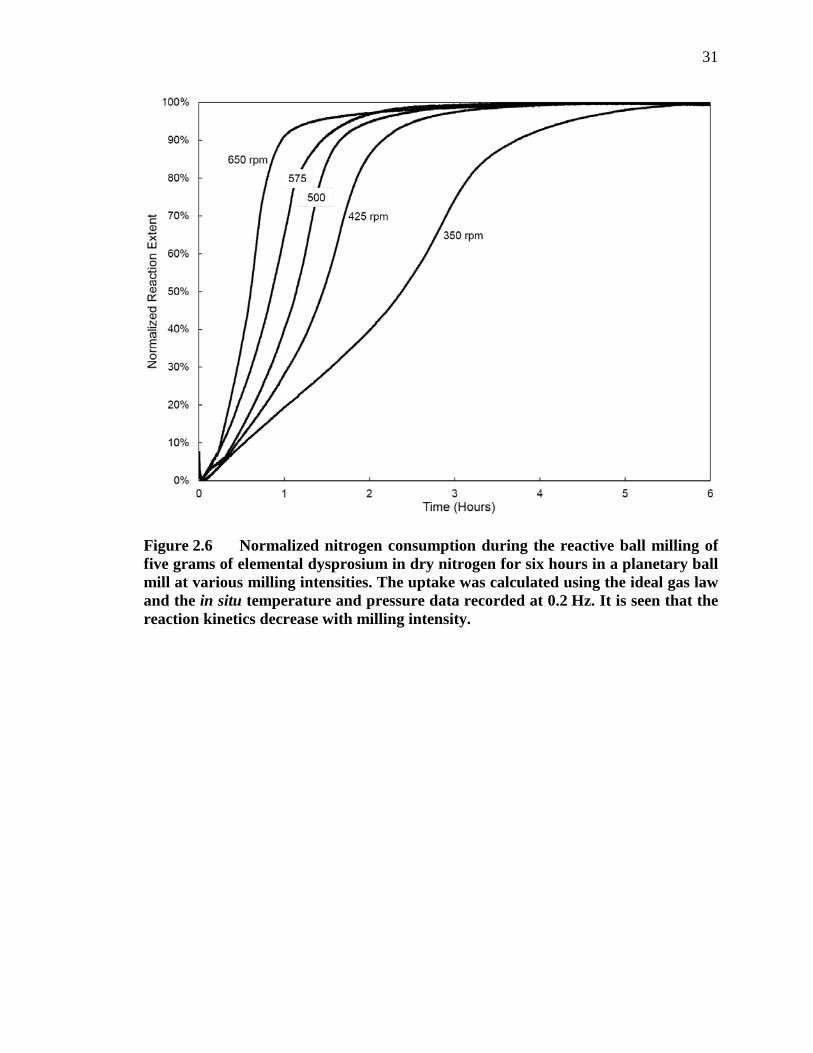
31
Figure 2.6 Normalized nitrogen consumption during the reactive ball milling of five grams of elemental dysprosium in dry nitrogen for six hours in a planetary ball mill at various milling intensities. The uptake was calculated using the ideal gas law and the in situ temperature and pressure data recorded at 0.2 Hz. It is seen that the reaction kinetics decrease with milling intensity.
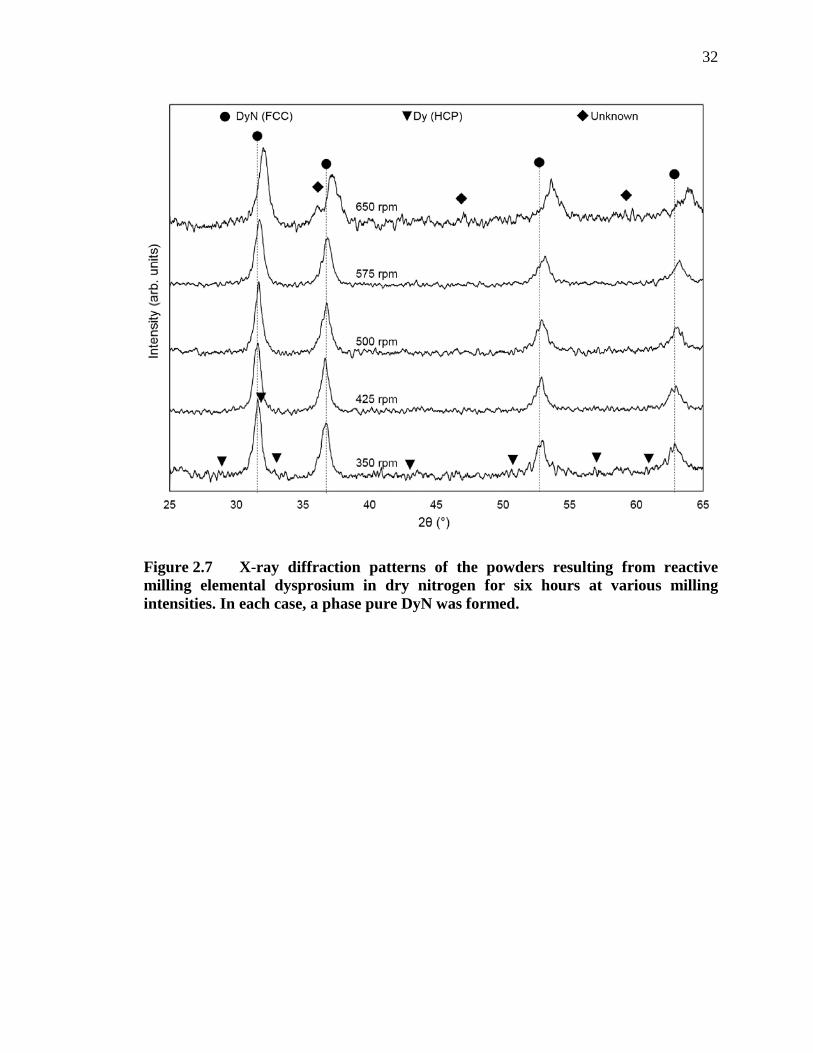
32
Figure 2.7 X-ray diffraction patterns of the powders resulting from reactive milling elemental dysprosium in dry nitrogen for six hours at various milling intensities. In each case, a phase pure DyN was formed.
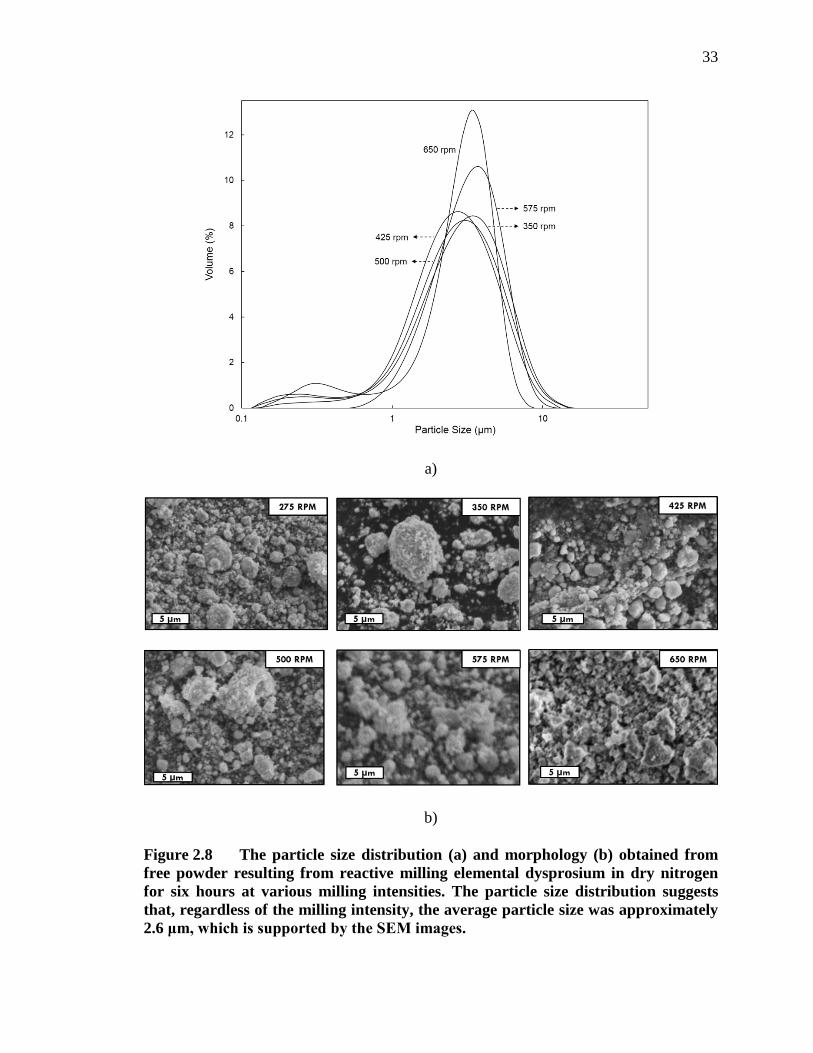
33
a)
b)
Figure 2.8 The particle size distribution (a) and morphology (b) obtained from free powder resulting from reactive milling elemental dysprosium in dry nitrogen for six hours at various milling intensities. The particle size distribution suggests that, regardless of the milling intensity, the average particle size was approximately 2.6 μm, which is supported by the SEM images.
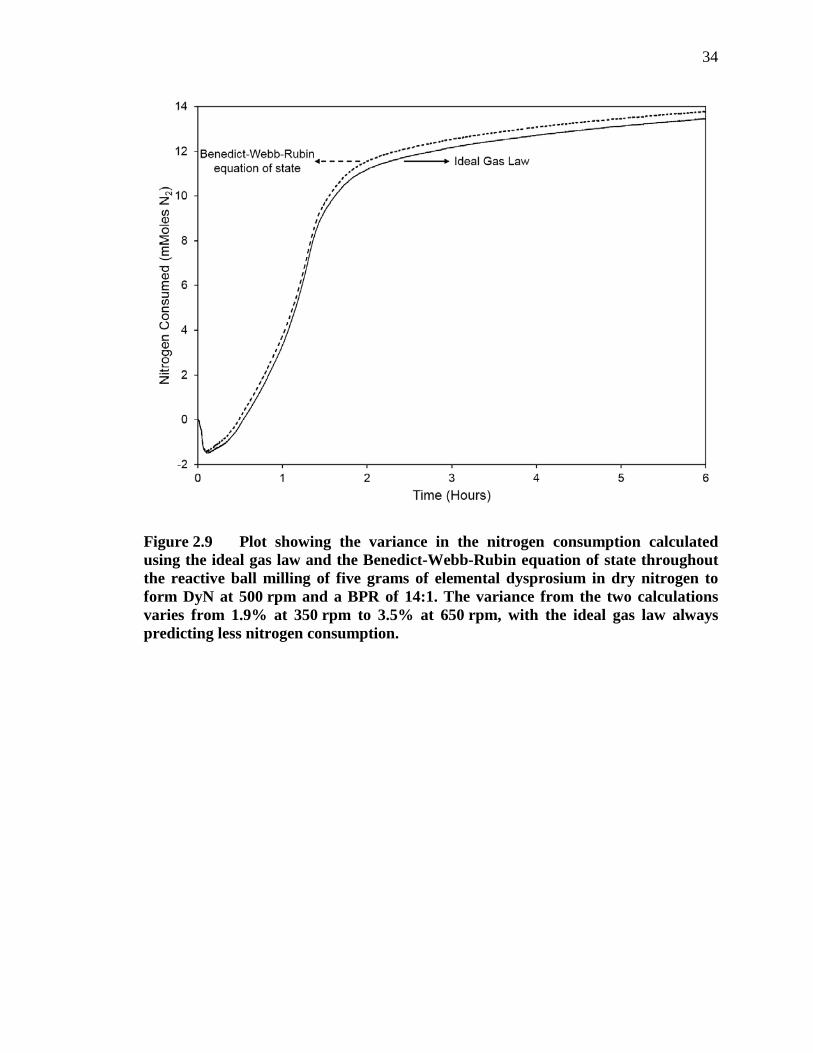
34
Figure 2.9 Plot showing the variance in the nitrogen consumption calculated using the ideal gas law and the Benedict-Webb-Rubin equation of state throughout the reactive ball milling of five grams of elemental dysprosium in dry nitrogen to form DyN at 500 rpm and a BPR of 14:1. The variance from the two calculations varies from 1.9% at 350 rpm to 3.5% at 650 rpm, with the ideal gas law always predicting less nitrogen consumption.
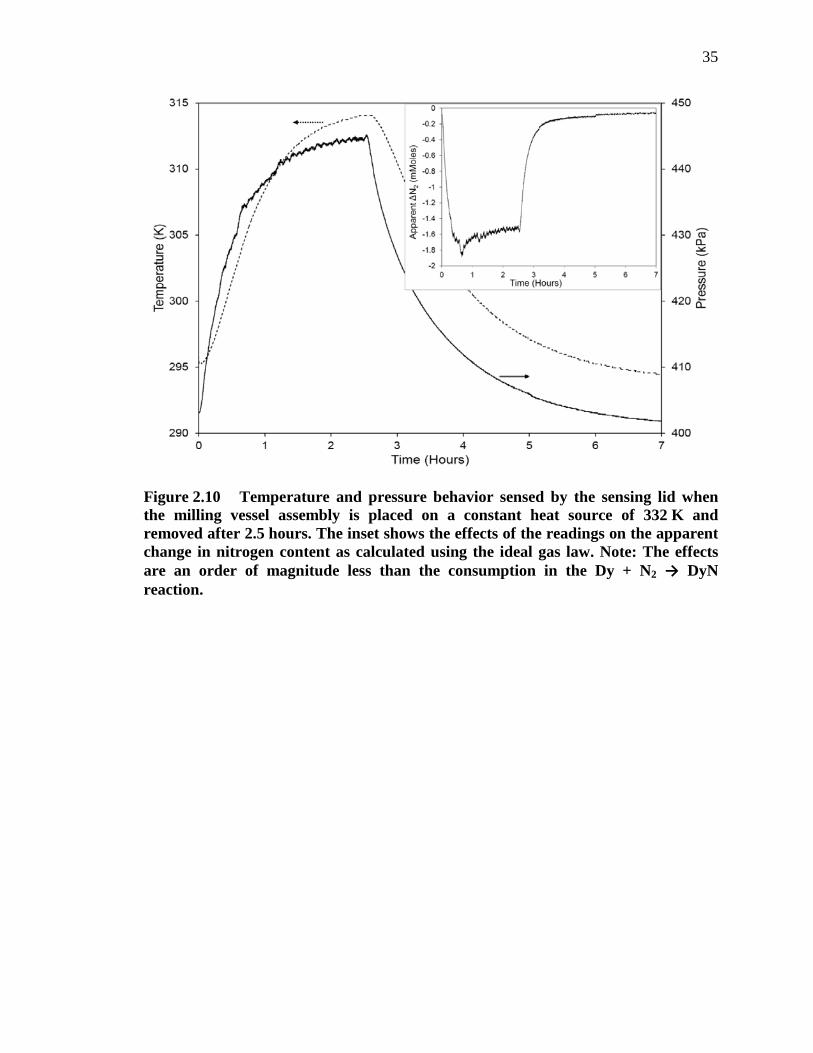
35
Figure 2.10 Temperature and pressure behavior sensed by the sensing lid when the milling vessel assembly is placed on a constant heat source of 332 K and removed after 2.5 hours. The inset shows the effects of the readings on the apparent change in nitrogen content as calculated using the ideal gas law. Note: The effects are an order of magnitude less than the consumption in the Dy + N2 → DyN reaction.

36
Tables
Table 2.1 Empirical constants used in Benedict-Webb-Rubin equation (Equation 3) of state calculations [43] to estimate nitrogen consumption using in situ temperature and pressure data collected during the RM of dysprosium to form DyN.
a A0 b B0 c C0 α γ 2.54 106.73 0.002328 0.04074 7.379*104 8.164*105 1.272*10-4 0.0053
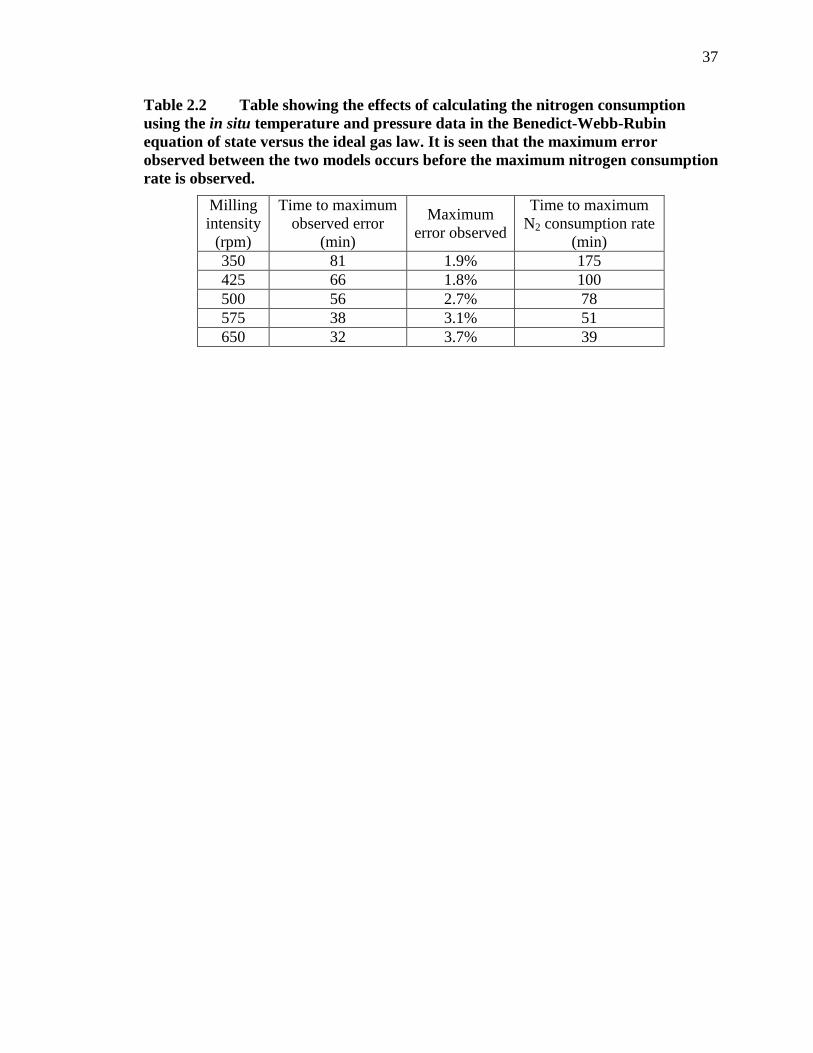
37
Table 2.2 Table showing the effects of calculating the nitrogen consumption using the in situ temperature and pressure data in the Benedict-Webb-Rubin equation of state versus the ideal gas law. It is seen that the maximum error observed between the two models occurs before the maximum nitrogen consumption rate is observed.
Milling intensity
(rpm)
Time to maximum observed error
(min)
Maximum error observed
Time to maximum N2 consumption rate
(min) 350 81 1.9% 175 425 66 1.8% 100 500 56 2.7% 78 575 38 3.1% 51 650 32 3.7% 39
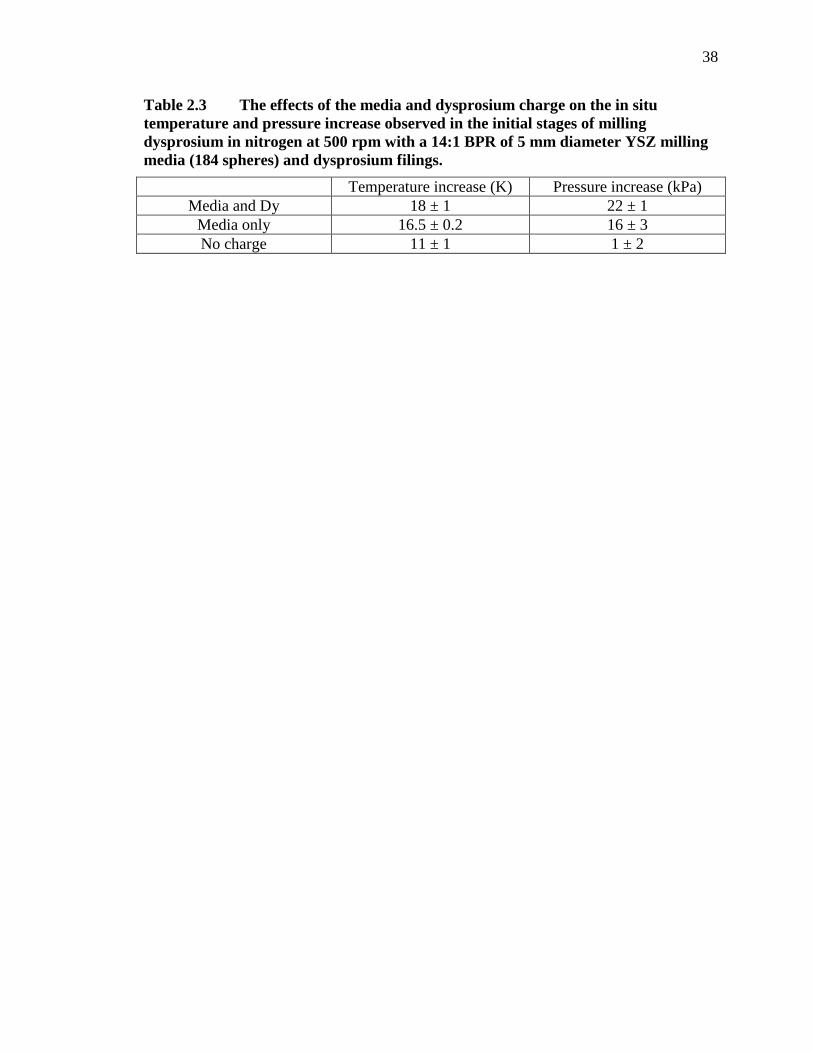
38
Table 2.3 The effects of the media and dysprosium charge on the in situ temperature and pressure increase observed in the initial stages of milling dysprosium in nitrogen at 500 rpm with a 14:1 BPR of 5 mm diameter YSZ milling media (184 spheres) and dysprosium filings.
Temperature increase (K) Pressure increase (kPa) Media and Dy 18 ± 1 22 ± 1
Media only 16.5 ± 0.2 16 ± 3 No charge 11 ± 1 1 ± 2
39
CHAPTER THREE: SYNTHESIS AND SINTERING OF UN-UO2 FUEL
COMPOSITES
This chapter has been accepted to the Journal of Nuclear Materials.

40
Synthesis and Sintering of UN-UO2 Fuel Composites
Brian J. Jaquesa,b
Jennifer Watkinsa,b
Joseph R. Croteau a,b
Gordon A. Alankoa,b
Beata Tyburska-Pueschelc
Mitch Meyerd
Peng Xue
Edward J. Lahodae
Darryl P. Butta,b
Accepted for publication in:
Journal of Nuclear Materials
March 2015
a Department of Materials Science and Engineering, Boise State University, 1910
University Dr., Boise, ID 83725, USA
b Center for Advanced Energy Studies, 995 University Blvd., Idaho Falls, ID 83401, USA
c Department of Engineering Physics, University of Wisconsin-Madison, 1500
Engineering Dr., Madison, WI 53706
d Idaho National Laboratory, Idaho Falls, ID 83415, USA
e Westinghouse Electric Company LLC, Pittsburgh, PA 15235, USA

41
NOTICE: This is the author’s version of a work that was accepted for publication in the Journal of Nuclear Materials. Changes resulting from the publishing process, such as peer review, editing, corrections, structural formatting, and other quality control mechanisms are not reflected in this document. Changes may have been made to this work since it was submitted for publication.
42
Abstract
The design and development of an economical, accident tolerant fuel for use in the
current light water reactor fleet is essential for the future of nuclear power. Uranium
mononitride has been identified as an alternative fuel with higher uranium density and
thermal conductivity when compared to the benchmark, UO2, which would provide
significant economic benefits. However, UN by itself reacts with water at reactor
operating temperatures. In order to reduce its reactivity, the addition of UO2 to UN has
been suggested. In order to avoid carbon impurities, UN was synthesized from elemental
uranium using a hydride-dehydride-nitride thermal synthesis route prior to mixing with
up to 10 w% UO2 in a planetary ball mill. UN and UN - UO2 composite pellets were
sintered in Ar - (0-1 at%) N2 to study the effects of nitrogen concentration on the evolved
phases and microstructure. UN and UN-UO2 composite pellets were also sintered in Ar -
100 ppm N2 to assess the effects of temperature (1700 - 2000 °C) on the final grain
morphology and phase concentration.
3.1 Introduction
The United States Department of Energy (USDOE) has always emphasized safe,
reliable, and economical nuclear reactor designs for sustainable operations. However,
following the Fukushima-Daiichi accident in 2011, the Consolidated Appropriations Act
of 2012 (report 112-75) directed the Nuclear Energy branch of the USDOE to give
“special technical emphasis and funding priority to activities aimed at the development
and near-term qualification of meltdown-resistant, accident tolerant nuclear fuels (ATFs)
that would enhance the safety of present and future generations of light water reactors
(LWRs)” [1, 2]. In the wake of this Act, ATFs have been internationally defined as fuel-
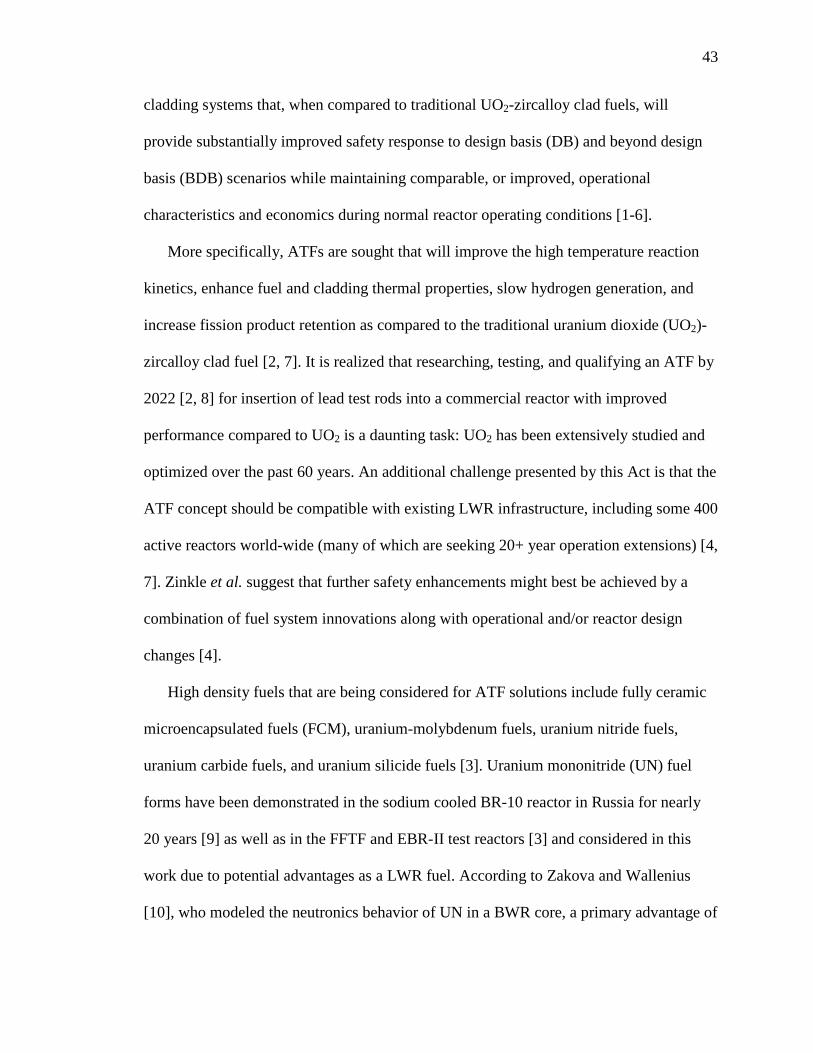
43
cladding systems that, when compared to traditional UO2-zircalloy clad fuels, will
provide substantially improved safety response to design basis (DB) and beyond design
basis (BDB) scenarios while maintaining comparable, or improved, operational
characteristics and economics during normal reactor operating conditions [1-6].
More specifically, ATFs are sought that will improve the high temperature reaction
kinetics, enhance fuel and cladding thermal properties, slow hydrogen generation, and
increase fission product retention as compared to the traditional uranium dioxide (UO2)-
zircalloy clad fuel [2, 7]. It is realized that researching, testing, and qualifying an ATF by
2022 [2, 8] for insertion of lead test rods into a commercial reactor with improved
performance compared to UO2 is a daunting task: UO2 has been extensively studied and
optimized over the past 60 years. An additional challenge presented by this Act is that the
ATF concept should be compatible with existing LWR infrastructure, including some 400
active reactors world-wide (many of which are seeking 20+ year operation extensions) [4,
7]. Zinkle et al. suggest that further safety enhancements might best be achieved by a
combination of fuel system innovations along with operational and/or reactor design
changes [4].
High density fuels that are being considered for ATF solutions include fully ceramic
microencapsulated fuels (FCM), uranium-molybdenum fuels, uranium nitride fuels,
uranium carbide fuels, and uranium silicide fuels [3]. Uranium mononitride (UN) fuel
forms have been demonstrated in the sodium cooled BR-10 reactor in Russia for nearly
20 years [9] as well as in the FFTF and EBR-II test reactors [3] and considered in this
work due to potential advantages as a LWR fuel. According to Zakova and Wallenius
[10], who modeled the neutronics behavior of UN in a BWR core, a primary advantage of
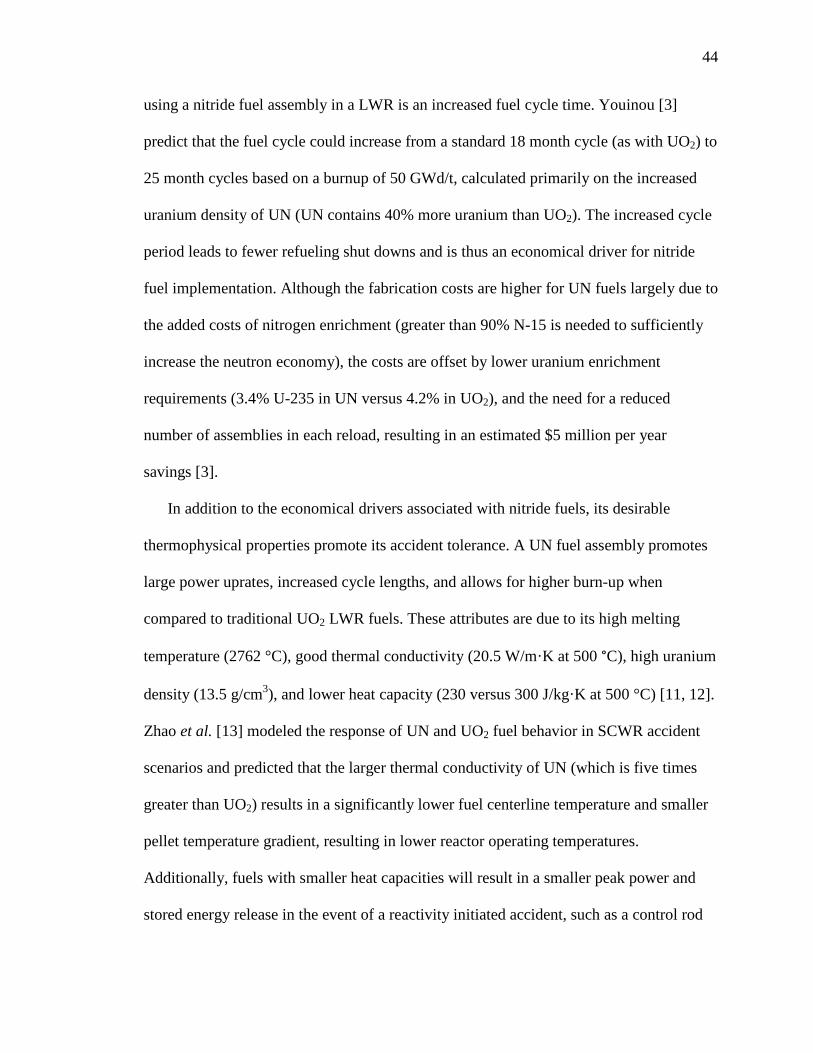
44
using a nitride fuel assembly in a LWR is an increased fuel cycle time. Youinou [3]
predict that the fuel cycle could increase from a standard 18 month cycle (as with UO2) to
25 month cycles based on a burnup of 50 GWd/t, calculated primarily on the increased
uranium density of UN (UN contains 40% more uranium than UO2). The increased cycle
period leads to fewer refueling shut downs and is thus an economical driver for nitride
fuel implementation. Although the fabrication costs are higher for UN fuels largely due to
the added costs of nitrogen enrichment (greater than 90% N-15 is needed to sufficiently
increase the neutron economy), the costs are offset by lower uranium enrichment
requirements (3.4% U-235 in UN versus 4.2% in UO2), and the need for a reduced
number of assemblies in each reload, resulting in an estimated $5 million per year
savings [3].
In addition to the economical drivers associated with nitride fuels, its desirable
thermophysical properties promote its accident tolerance. A UN fuel assembly promotes
large power uprates, increased cycle lengths, and allows for higher burn-up when
compared to traditional UO2 LWR fuels. These attributes are due to its high melting
temperature (2762 °C), good thermal conductivity (20.5 W/m·K at 500 °C), high uranium
density (13.5 g/cm3), and lower heat capacity (230 versus 300 J/kg·K at 500 °C) [11, 12].
Zhao et al. [13] modeled the response of UN and UO2 fuel behavior in SCWR accident
scenarios and predicted that the larger thermal conductivity of UN (which is five times
greater than UO2) results in a significantly lower fuel centerline temperature and smaller
pellet temperature gradient, resulting in lower reactor operating temperatures.
Additionally, fuels with smaller heat capacities will result in a smaller peak power and
stored energy release in the event of a reactivity initiated accident, such as a control rod

45
ejection. Since the temperature will rise faster in the UN fuel, the temperature feedback
will be faster and the power pulse height will be reduced [3, 13]. The combination of both
the larger thermal conductivity and lower heat capacity lead to a significantly larger
safety margin in DB and BDB accident scenarios.
An additional advantage of nitride fuels are their compatibility with most
potential cladding materials, their good irradiation stability, and fission product retention
[3]. However, the major drawback to UN fuels are their low oxidation resistance; UN
powder readily oxidizes in air and pellets in super-heated steam [14-16]. Three primary
methods have been postulated to improve its oxidation resistance: Addition of USix to
UN powder followed by liquid phase sintering, alloying UN with compounds that will
increase its oxidation resistance, and coating UN with a more inert material (such as ZrC)
to produce a chemical barrier [3, 9, 17]. The focus of the work presented here is to use a
nitride synthesis technique that avoids excessive carbon impurities and to develop an
accident tolerant fuel. The effects of adding small amounts of UO2 (up to 10 w%) to UN
fuel forms is presented. Additionally, the influence of atmosphere and temperature on the
final grain morphology and stoichiometry of uranium nitride composite fuels are
demonstrated.
3.2 Material and Methods
This study was completed with depleted uranium sources. UO2 (99.8%, 50 mesh) was
obtained from International Bio-Analytical Industries Incorporated (Boca Raton, FL),
which was synthesized by reduction of U3O8 prepared via a uranyl acetate dihydrate
solution route. The UN in this study was prepared from atomized elemental uranium
(99.4%, 50 mesh) received from the Idaho National Laboratory (INL). The morphology

46
of each starting material is shown in the scanning electron microscopy (SEM) image in
Figure 3.1a and b. The powders were mixed with a vacuum grease to avoid excessive
oxidation during the ambient X-ray diffraction (XRD) characterization. Each of the XRD
patterns were background subtracted and diffraction peaks were identified using the
Inorganic Crystal Structure Database (ICSD) [18].
UN was synthesized using a thermal synthesis route in which elemental uranium was
hydrided and dehydrided prior to nitridation. The thermal profile used in this work
(Figure 3.2) was adapted from a series of previously published techniques [19-25]. Prior
to loading into a tungsten-lined alumina crucible in an argon filled glovebox, the
atomized uranium was cleaned in a 50% nitric acid solution and rinsed in methanol to
remove any present oxides. A 16 gram batch was loaded into a high temperature alumina
tube furnace (CM Furnaces Inc., Bloomfield, NJ, USA), which was immediately vacuum
purged. As shown in Figure 3.2, the reaction was initiated by flowing ultra-high purity
(UHP) hydrogen gas (H2) over the uranium while ramping the temperature to 500 °C to
“crack” the oxide barrier and form a hydride. Argon was then introduced to dehydride the
powder, according to reaction 1 below. The temperature was then reduced to 225 °C and
the atmosphere was switched back to UHP-H2 where the hydrogen uptake is most rapid
[25]. The hydride-dehydride process was completed 2 more times in order to remove any
residual oxygen. The dehydrided uranium was then converted to nitride according to
reaction 2 by introducing UHP-N2 and ramping the temperature to 850 °C. In order to
reduce the U2N3 to UN as described in reaction 3, argon with a reduced N2 concentration
was introduced and the temperature was briefly raised to 1200 °C before ramping to room
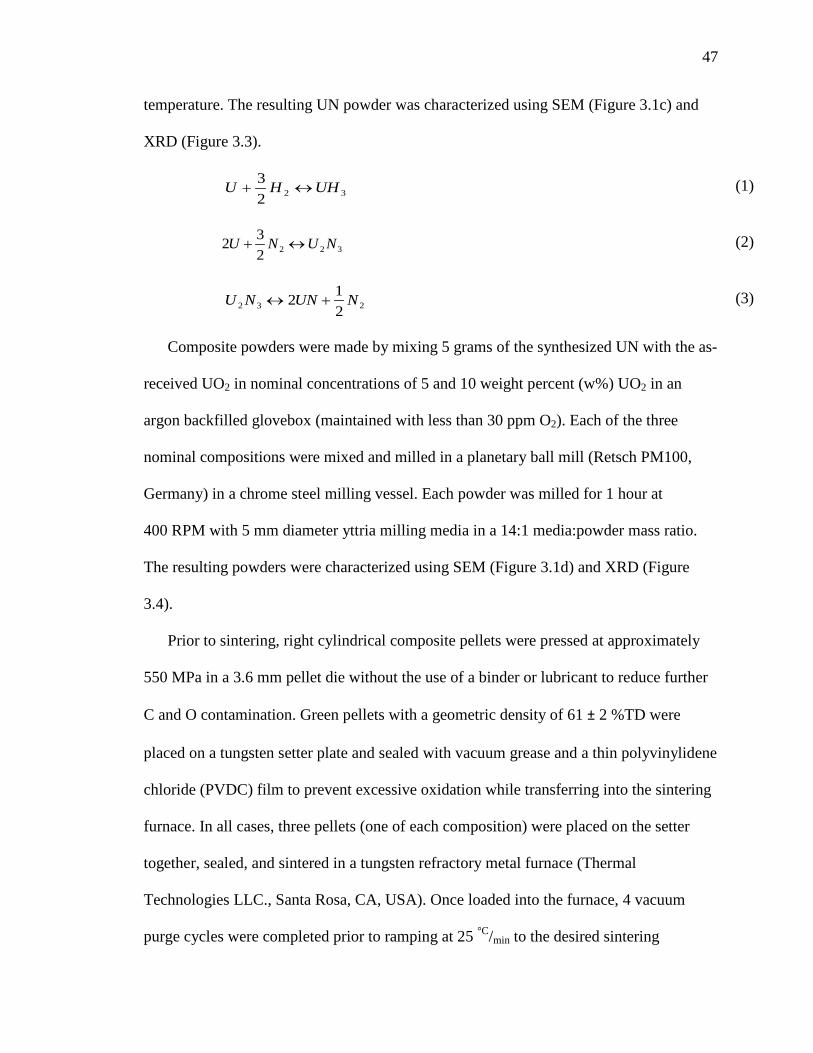
47
temperature. The resulting UN powder was characterized using SEM (Figure 3.1c) and
XRD (Figure 3.3).
3223 UHHU ↔+ (1)
322232 NUNU ↔+ (2)
232 212 NUNNU +↔ (3)
Composite powders were made by mixing 5 grams of the synthesized UN with the as-
received UO2 in nominal concentrations of 5 and 10 weight percent (w%) UO2 in an
argon backfilled glovebox (maintained with less than 30 ppm O2). Each of the three
nominal compositions were mixed and milled in a planetary ball mill (Retsch PM100,
Germany) in a chrome steel milling vessel. Each powder was milled for 1 hour at
400 RPM with 5 mm diameter yttria milling media in a 14:1 media:powder mass ratio.
The resulting powders were characterized using SEM (Figure 3.1d) and XRD (Figure
3.4).
Prior to sintering, right cylindrical composite pellets were pressed at approximately
550 MPa in a 3.6 mm pellet die without the use of a binder or lubricant to reduce further
C and O contamination. Green pellets with a geometric density of 61 ± 2 %TD were
placed on a tungsten setter plate and sealed with vacuum grease and a thin polyvinylidene
chloride (PVDC) film to prevent excessive oxidation while transferring into the sintering
furnace. In all cases, three pellets (one of each composition) were placed on the setter
together, sealed, and sintered in a tungsten refractory metal furnace (Thermal
Technologies LLC., Santa Rosa, CA, USA). Once loaded into the furnace, 4 vacuum
purge cycles were completed prior to ramping at 25 °C/min to the desired sintering
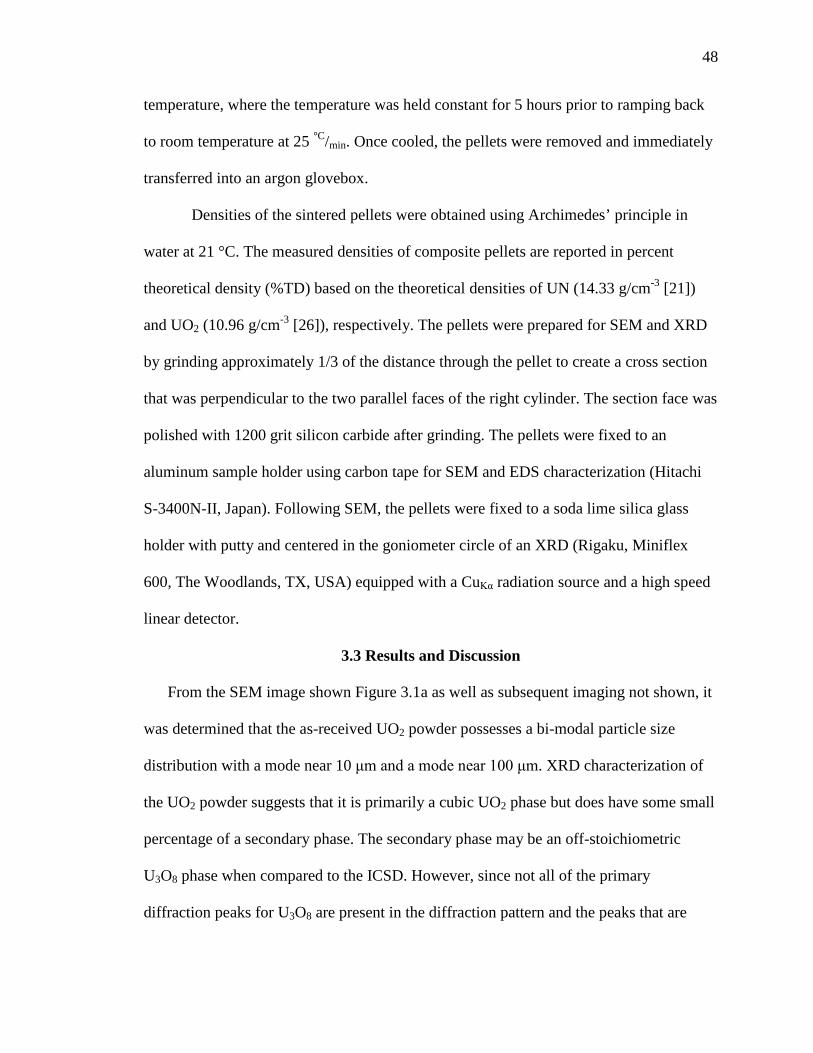
48
temperature, where the temperature was held constant for 5 hours prior to ramping back
to room temperature at 25 °C/min. Once cooled, the pellets were removed and immediately
transferred into an argon glovebox.
Densities of the sintered pellets were obtained using Archimedes’ principle in
water at 21 °C. The measured densities of composite pellets are reported in percent
theoretical density (%TD) based on the theoretical densities of UN (14.33 g/cm-3 [21])
and UO2 (10.96 g/cm-3 [26]), respectively. The pellets were prepared for SEM and XRD
by grinding approximately 1/3 of the distance through the pellet to create a cross section
that was perpendicular to the two parallel faces of the right cylinder. The section face was
polished with 1200 grit silicon carbide after grinding. The pellets were fixed to an
aluminum sample holder using carbon tape for SEM and EDS characterization (Hitachi
S-3400N-II, Japan). Following SEM, the pellets were fixed to a soda lime silica glass
holder with putty and centered in the goniometer circle of an XRD (Rigaku, Miniflex
600, The Woodlands, TX, USA) equipped with a CuKα radiation source and a high speed
linear detector.
3.3 Results and Discussion
From the SEM image shown Figure 3.1a as well as subsequent imaging not shown, it
was determined that the as-received UO2 powder possesses a bi-modal particle size
distribution with a mode near 10 μm and a mode near 100 μm. XRD characterization of
the UO2 powder suggests that it is primarily a cubic UO2 phase but does have some small
percentage of a secondary phase. The secondary phase may be an off-stoichiometric
U3O8 phase when compared to the ICSD. However, since not all of the primary
diffraction peaks for U3O8 are present in the diffraction pattern and the peaks that are
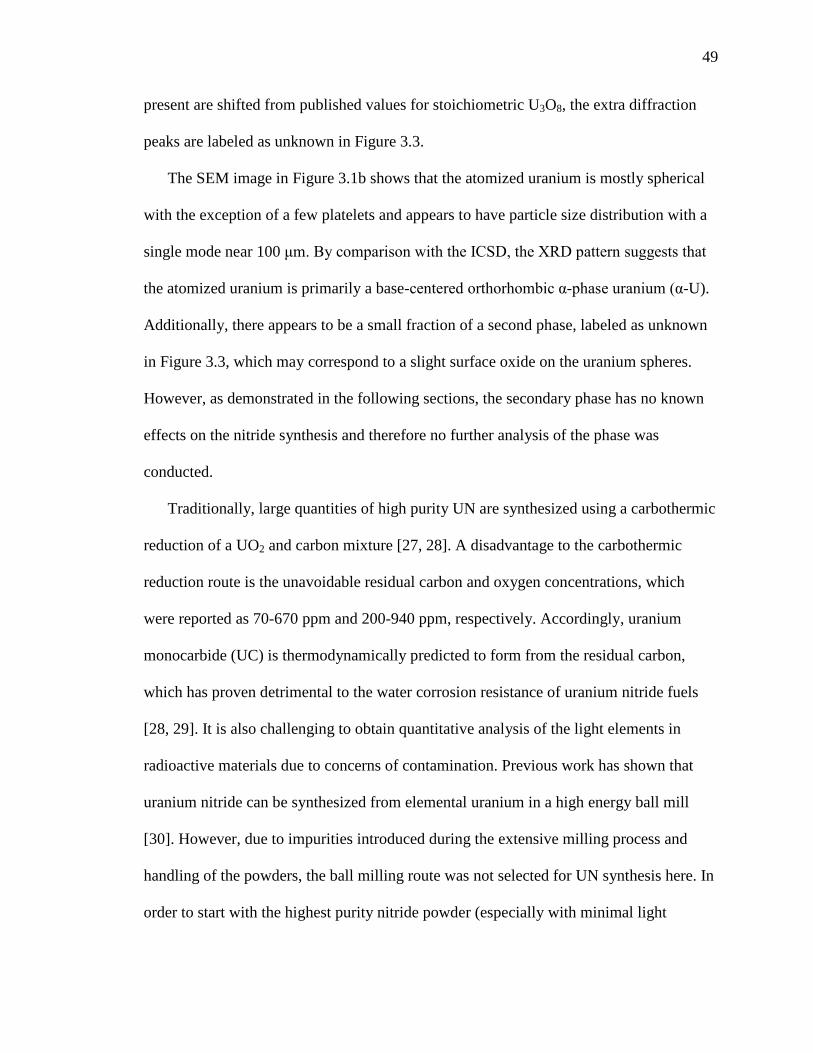
49
present are shifted from published values for stoichiometric U3O8, the extra diffraction
peaks are labeled as unknown in Figure 3.3.
The SEM image in Figure 3.1b shows that the atomized uranium is mostly spherical
with the exception of a few platelets and appears to have particle size distribution with a
single mode near 100 μm. By comparison with the ICSD, the XRD pattern suggests that
the atomized uranium is primarily a base-centered orthorhombic α-phase uranium (α-U).
Additionally, there appears to be a small fraction of a second phase, labeled as unknown
in Figure 3.3, which may correspond to a slight surface oxide on the uranium spheres.
However, as demonstrated in the following sections, the secondary phase has no known
effects on the nitride synthesis and therefore no further analysis of the phase was
conducted.
Traditionally, large quantities of high purity UN are synthesized using a carbothermic
reduction of a UO2 and carbon mixture [27, 28]. A disadvantage to the carbothermic
reduction route is the unavoidable residual carbon and oxygen concentrations, which
were reported as 70-670 ppm and 200-940 ppm, respectively. Accordingly, uranium
monocarbide (UC) is thermodynamically predicted to form from the residual carbon,
which has proven detrimental to the water corrosion resistance of uranium nitride fuels
[28, 29]. It is also challenging to obtain quantitative analysis of the light elements in
radioactive materials due to concerns of contamination. Previous work has shown that
uranium nitride can be synthesized from elemental uranium in a high energy ball mill
[30]. However, due to impurities introduced during the extensive milling process and
handling of the powders, the ball milling route was not selected for UN synthesis here. In
order to start with the highest purity nitride powder (especially with minimal light

50
element impurities), the hydride-dehydride-nitride thermal route to UN synthesis was
selected as the ATF fuel fabrication route in this study.
Although difficult to scale-up to meet industry production needs, the hydride-
dehydride-nitride route is a thermal synthesis route with the potential to form high purity
UN with little residual oxygen and carbon, ideal for ATF applications. Many process
iterations have led to the thermal profile shown in Figure 3.2. Throughout the thermal
process, the atomized uranium lost its spherical shape and resulted in powder with a more
irregular morphology and a significantly reduced particle size, as seen in Figure 3.1c.
Further characterization via XRD suggests that the powder is a phase-pure cubic UN
when compared to the ICSD, as shown in Figure 3.3.
Ball milling the nominal compositions of UN, UN - 5 w% UO2, and UN - 10 w%
UO2 was primarily completed for two reasons: to obtain a homogenous mixture and to
increase the sinterability of the green pellets. As seen in the SEM image of Figure 3.1c
and d, the milling process significantly reduced the particle size from 5-10 μm to less
than 1 μm, increasing the sintered density by 5% of the theoretical density (TD) at
1900 °C for 5 hours, when compared to as synthesized UN. Additionally, milling
significantly reduced the crystallite size of the powder from 95 ± 10 nm down to 27 ±
5 nm, as determined using the Scherrer equation and the first two UN diffraction peaks
shown in Figures 3.3 and 3.4. However, the high energy milling process reduced the
crystallinity of the powder, thus reducing the amount of information that can be inferred
from XRD analysis. In the diffraction pattern for pure UN in Figure 3.4, a clear second
phase formed from the milling process, noted by broad diffraction peaks at approximately
29, 47.5, and 57 °2θ. Thermodynamics predict that milling a nitride in a pure argon
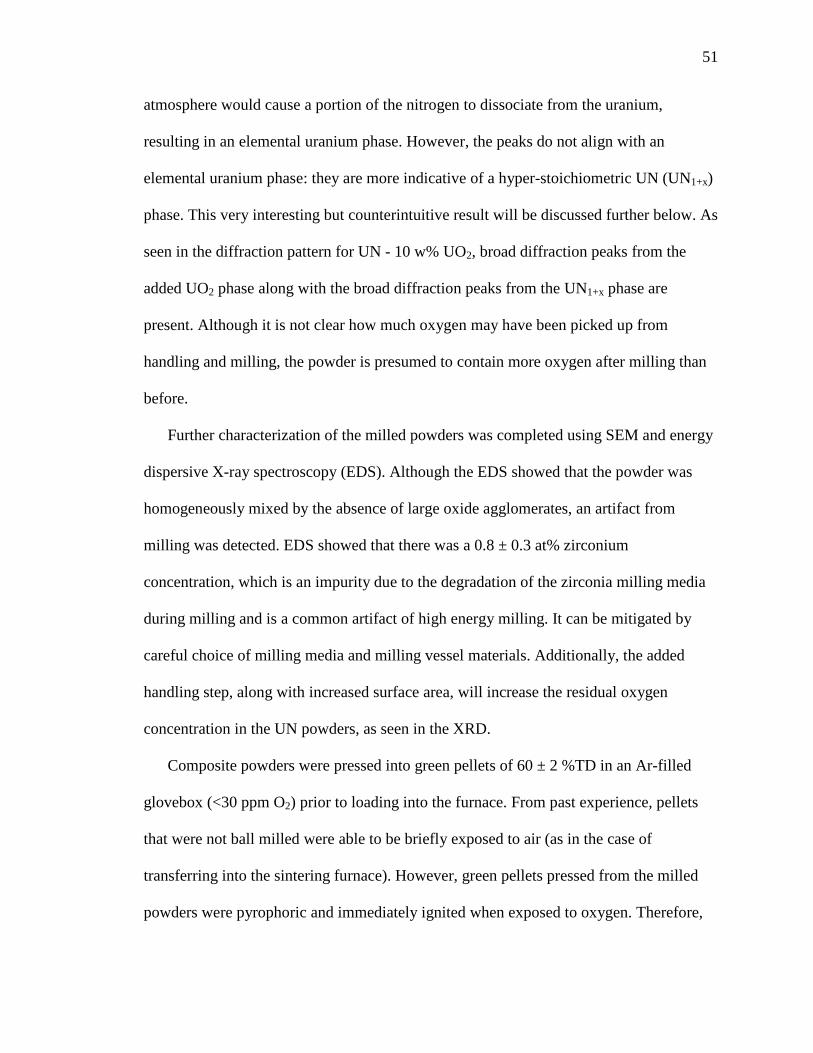
51
atmosphere would cause a portion of the nitrogen to dissociate from the uranium,
resulting in an elemental uranium phase. However, the peaks do not align with an
elemental uranium phase: they are more indicative of a hyper-stoichiometric UN (UN1+x)
phase. This very interesting but counterintuitive result will be discussed further below. As
seen in the diffraction pattern for UN - 10 w% UO2, broad diffraction peaks from the
added UO2 phase along with the broad diffraction peaks from the UN1+x phase are
present. Although it is not clear how much oxygen may have been picked up from
handling and milling, the powder is presumed to contain more oxygen after milling than
before.
Further characterization of the milled powders was completed using SEM and energy
dispersive X-ray spectroscopy (EDS). Although the EDS showed that the powder was
homogeneously mixed by the absence of large oxide agglomerates, an artifact from
milling was detected. EDS showed that there was a 0.8 ± 0.3 at% zirconium
concentration, which is an impurity due to the degradation of the zirconia milling media
during milling and is a common artifact of high energy milling. It can be mitigated by
careful choice of milling media and milling vessel materials. Additionally, the added
handling step, along with increased surface area, will increase the residual oxygen
concentration in the UN powders, as seen in the XRD.
Composite powders were pressed into green pellets of 60 ± 2 %TD in an Ar-filled
glovebox (<30 ppm O2) prior to loading into the furnace. From past experience, pellets
that were not ball milled were able to be briefly exposed to air (as in the case of
transferring into the sintering furnace). However, green pellets pressed from the milled
powders were pyrophoric and immediately ignited when exposed to oxygen. Therefore,
52
oxygen exposure was minimized by sealing the sintering crucible with vacuum grease
and a PVDC film prior to removal from the glovebox for insertion into the sintering
furnace. Both the vacuum grease and the PVDC film were subsequently burned off in the
furnace while ramping to the sintering temperature, contributing to light element impurity
concentration in the final sintered product.
Although the effects of nitrogen concentration in the sintering environment have been
studied for UN and (U,Pu)N in the past [28, 31-34], it has not been studied in the
fabrication of UN-UO2 composites, to the best of the authors’ knowledge. It is well
known that the concentration of nitrogen in the processing environment affects the final
microstructure and stoichiometry of the fuel pellets. Secondary phases can be detrimental
to the fuel performance; the presence of a liquid uranium phase is undesirable because if
heated and irradiated it would cause the fuel to swell, creep, and react with the fuel
cladding. Additionally, the presence of U2N3 is undesirable because, upon heating in
reduced nitrogen conditions, it will dissociate according to Equation 2. Not only will the
nitrogen evolution cause the fuel pin to pressurize and result in undesirable cladding
embrittlement, it can also cause fuel to crack during sintering or irradiation [28].
As noted in the U-N binary equilibrium phase diagram [28], UN is a line compound
at low temperatures and has a small phase field with increased temperature. However,
previous work predicts that the UN phase field is much larger when considering
equilibrium nitrogen concentrations. It has been estimated that the nitrogen pressure can
span nine orders of magnitude during sintering within the UN phase field at 1550 °C [32,
33]. Additionally, it is stated that the nitrogen concentration during sintering is best kept
in a narrow range near the UN dissociation boundary (Equation 4) to reduce the amount
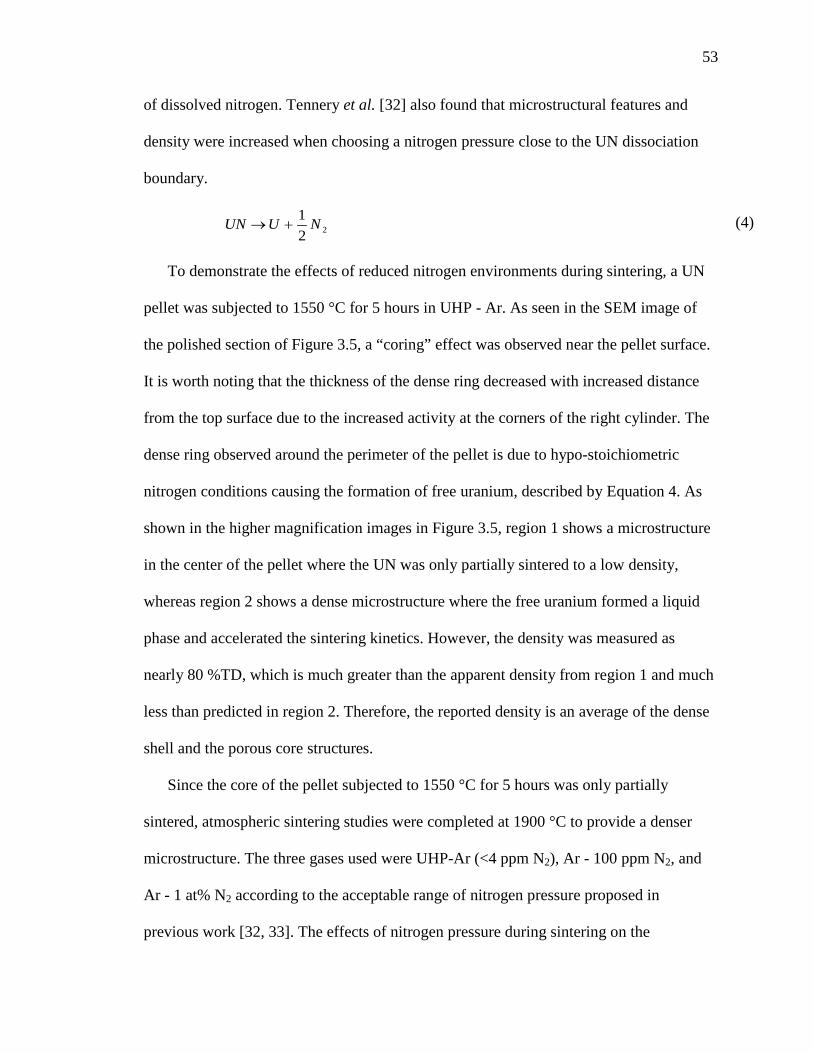
53
of dissolved nitrogen. Tennery et al. [32] also found that microstructural features and
density were increased when choosing a nitrogen pressure close to the UN dissociation
boundary.
221 NUUN +→ (4)
To demonstrate the effects of reduced nitrogen environments during sintering, a UN
pellet was subjected to 1550 °C for 5 hours in UHP - Ar. As seen in the SEM image of
the polished section of Figure 3.5, a “coring” effect was observed near the pellet surface.
It is worth noting that the thickness of the dense ring decreased with increased distance
from the top surface due to the increased activity at the corners of the right cylinder. The
dense ring observed around the perimeter of the pellet is due to hypo-stoichiometric
nitrogen conditions causing the formation of free uranium, described by Equation 4. As
shown in the higher magnification images in Figure 3.5, region 1 shows a microstructure
in the center of the pellet where the UN was only partially sintered to a low density,
whereas region 2 shows a dense microstructure where the free uranium formed a liquid
phase and accelerated the sintering kinetics. However, the density was measured as
nearly 80 %TD, which is much greater than the apparent density from region 1 and much
less than predicted in region 2. Therefore, the reported density is an average of the dense
shell and the porous core structures.
Since the core of the pellet subjected to 1550 °C for 5 hours was only partially
sintered, atmospheric sintering studies were completed at 1900 °C to provide a denser
microstructure. The three gases used were UHP-Ar (<4 ppm N2), Ar - 100 ppm N2, and
Ar - 1 at% N2 according to the acceptable range of nitrogen pressure proposed in
previous work [32, 33]. The effects of nitrogen pressure during sintering on the

54
microstructure and phase evolution is shown in Figures 3.6 and 3.7, respectively. Edge
effects are pronounced in the pellets sintered in pure Ar; therefore, for comparison
purposes, only cross sections of the pellet cores (near the middle of the pellet cross
section) are compared using SEM, EDS, and XRD. EDS was used to identify the dark
regions in the backscattered electron (BSE) SEM images as a U-O phase, shown in
Figure 3.6 and 3.8. Further quantification of the U-O phase is not reported here because
the relative error for C, N, and O concentrations using EDS is relatively large and
stoichiometry can only be inferred.
EDS was primarily used to detect the presence of oxygen and nitrogen, not their
concentrations. Accordingly, small oxygen concentrations were detected in the UN phase
in all of the samples in this study. It is unknown if the oxygen detected was formed on the
surface of the polished section or if it is dissolved oxygen but it has been shown that the
oxygen solubility in pure UN can reach values in excess of 5 at% and can be determined
by a slight lattice expansion in XRD [35-37]. Dissolved oxygen and surface oxides were
likely detected on these samples due to the very reactive nature of the powders and green
pellets after milling. Comparing Figure 3.7 with Figure 3.4 shows that the broad peaks
observed in the milled powders evolved into relatively well-defined diffraction peaks
after sintering. XRD shows UN as the primary phase in all cases although, as expected,
there are prominent UO2 peaks, which increase with nominal UO2 additions. Peaks are
also present which correspond slightly to hyper-stoichiometric UN (UN1+x) as compared
to the ICSD along with unidentified peaks in each diffraction pattern. Furthermore, the
unidentified peaks are generally positioned between closely spaced UN and UO2 peaks.
Since the UN powders were milled and sintered in virtually nitrogen free environments
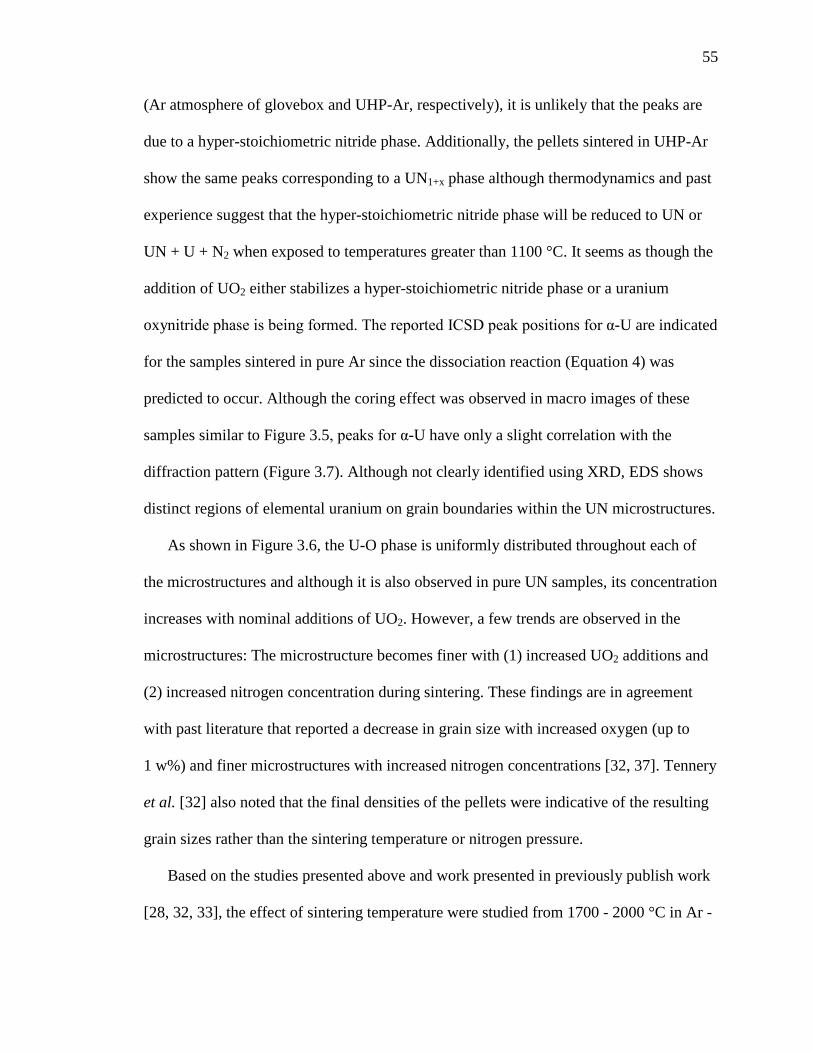
55
(Ar atmosphere of glovebox and UHP-Ar, respectively), it is unlikely that the peaks are
due to a hyper-stoichiometric nitride phase. Additionally, the pellets sintered in UHP-Ar
show the same peaks corresponding to a UN1+x phase although thermodynamics and past
experience suggest that the hyper-stoichiometric nitride phase will be reduced to UN or
UN + U + N2 when exposed to temperatures greater than 1100 °C. It seems as though the
addition of UO2 either stabilizes a hyper-stoichiometric nitride phase or a uranium
oxynitride phase is being formed. The reported ICSD peak positions for α-U are indicated
for the samples sintered in pure Ar since the dissociation reaction (Equation 4) was
predicted to occur. Although the coring effect was observed in macro images of these
samples similar to Figure 3.5, peaks for α-U have only a slight correlation with the
diffraction pattern (Figure 3.7). Although not clearly identified using XRD, EDS shows
distinct regions of elemental uranium on grain boundaries within the UN microstructures.
As shown in Figure 3.6, the U-O phase is uniformly distributed throughout each of
the microstructures and although it is also observed in pure UN samples, its concentration
increases with nominal additions of UO2. However, a few trends are observed in the
microstructures: The microstructure becomes finer with (1) increased UO2 additions and
(2) increased nitrogen concentration during sintering. These findings are in agreement
with past literature that reported a decrease in grain size with increased oxygen (up to
1 w%) and finer microstructures with increased nitrogen concentrations [32, 37]. Tennery
et al. [32] also noted that the final densities of the pellets were indicative of the resulting
grain sizes rather than the sintering temperature or nitrogen pressure.
Based on the studies presented above and work presented in previously publish work
[28, 32, 33], the effect of sintering temperature were studied from 1700 - 2000 °C in Ar -
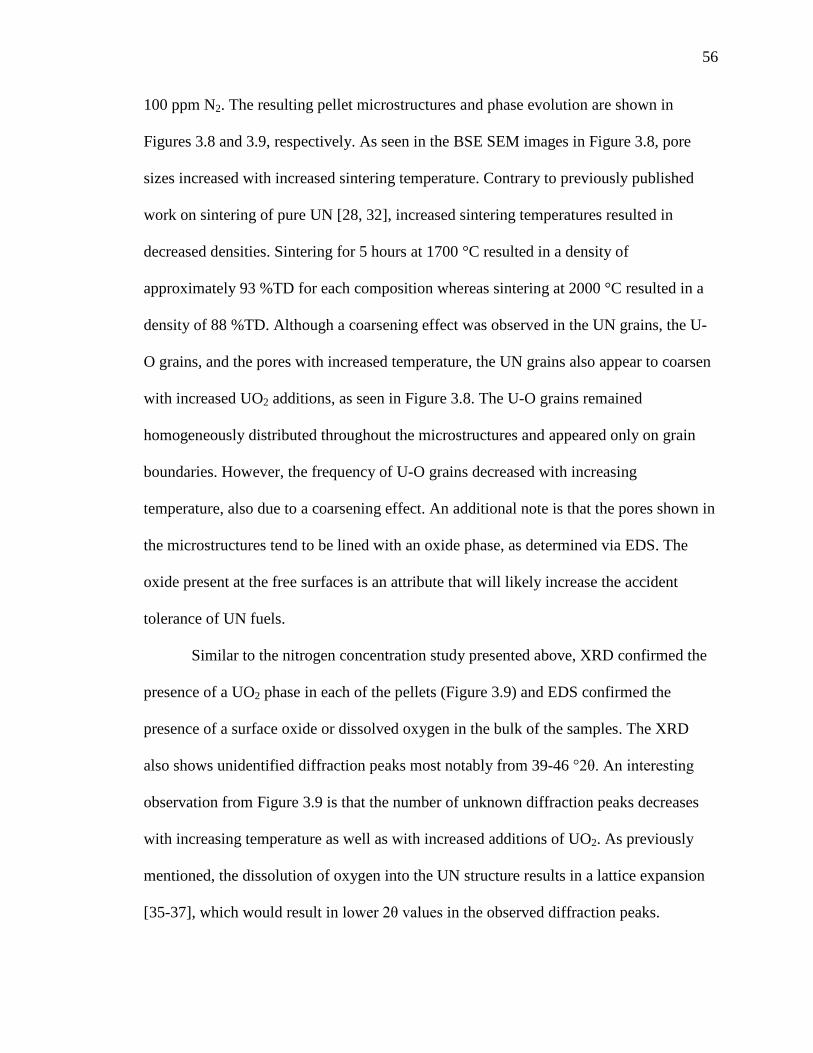
56
100 ppm N2. The resulting pellet microstructures and phase evolution are shown in
Figures 3.8 and 3.9, respectively. As seen in the BSE SEM images in Figure 3.8, pore
sizes increased with increased sintering temperature. Contrary to previously published
work on sintering of pure UN [28, 32], increased sintering temperatures resulted in
decreased densities. Sintering for 5 hours at 1700 °C resulted in a density of
approximately 93 %TD for each composition whereas sintering at 2000 °C resulted in a
density of 88 %TD. Although a coarsening effect was observed in the UN grains, the U-
O grains, and the pores with increased temperature, the UN grains also appear to coarsen
with increased UO2 additions, as seen in Figure 3.8. The U-O grains remained
homogeneously distributed throughout the microstructures and appeared only on grain
boundaries. However, the frequency of U-O grains decreased with increasing
temperature, also due to a coarsening effect. An additional note is that the pores shown in
the microstructures tend to be lined with an oxide phase, as determined via EDS. The
oxide present at the free surfaces is an attribute that will likely increase the accident
tolerance of UN fuels.
Similar to the nitrogen concentration study presented above, XRD confirmed the
presence of a UO2 phase in each of the pellets (Figure 3.9) and EDS confirmed the
presence of a surface oxide or dissolved oxygen in the bulk of the samples. The XRD
also shows unidentified diffraction peaks most notably from 39-46 °2θ. An interesting
observation from Figure 3.9 is that the number of unknown diffraction peaks decreases
with increasing temperature as well as with increased additions of UO2. As previously
mentioned, the dissolution of oxygen into the UN structure results in a lattice expansion
[35-37], which would result in lower 2θ values in the observed diffraction peaks.
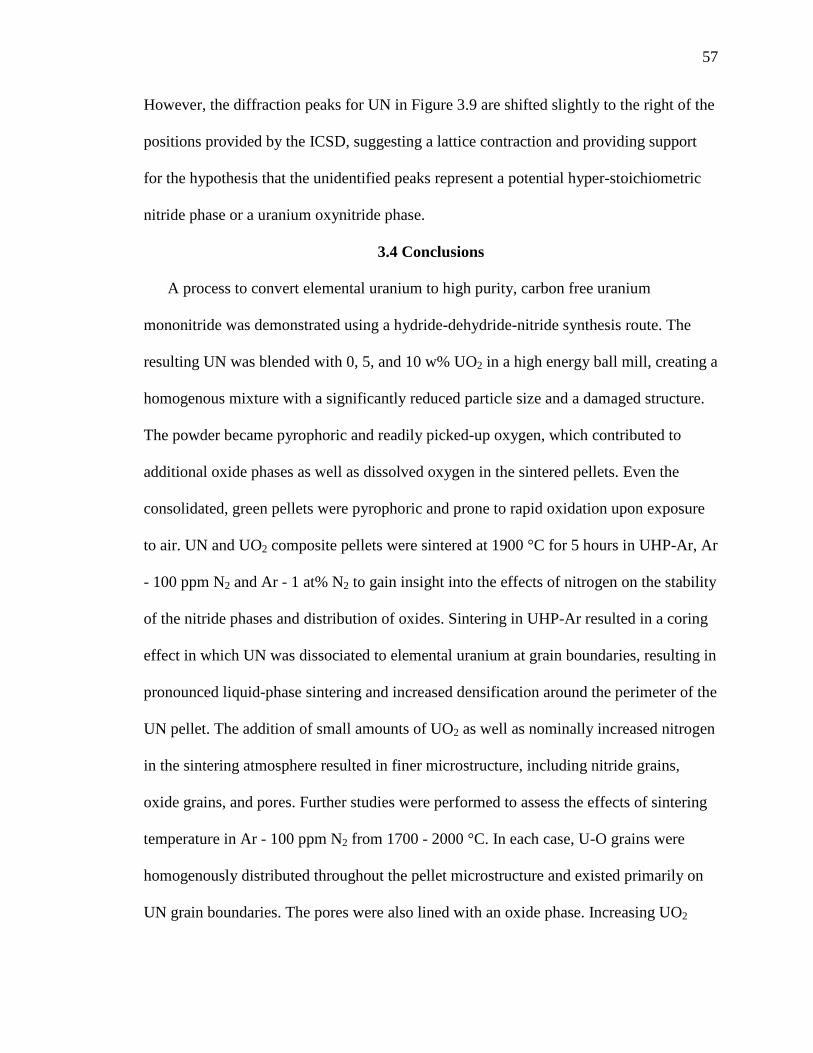
57
However, the diffraction peaks for UN in Figure 3.9 are shifted slightly to the right of the
positions provided by the ICSD, suggesting a lattice contraction and providing support
for the hypothesis that the unidentified peaks represent a potential hyper-stoichiometric
nitride phase or a uranium oxynitride phase.
3.4 Conclusions
A process to convert elemental uranium to high purity, carbon free uranium
mononitride was demonstrated using a hydride-dehydride-nitride synthesis route. The
resulting UN was blended with 0, 5, and 10 w% UO2 in a high energy ball mill, creating a
homogenous mixture with a significantly reduced particle size and a damaged structure.
The powder became pyrophoric and readily picked-up oxygen, which contributed to
additional oxide phases as well as dissolved oxygen in the sintered pellets. Even the
consolidated, green pellets were pyrophoric and prone to rapid oxidation upon exposure
to air. UN and UO2 composite pellets were sintered at 1900 °C for 5 hours in UHP-Ar, Ar
- 100 ppm N2 and Ar - 1 at% N2 to gain insight into the effects of nitrogen on the stability
of the nitride phases and distribution of oxides. Sintering in UHP-Ar resulted in a coring
effect in which UN was dissociated to elemental uranium at grain boundaries, resulting in
pronounced liquid-phase sintering and increased densification around the perimeter of the
UN pellet. The addition of small amounts of UO2 as well as nominally increased nitrogen
in the sintering atmosphere resulted in finer microstructure, including nitride grains,
oxide grains, and pores. Further studies were performed to assess the effects of sintering
temperature in Ar - 100 ppm N2 from 1700 - 2000 °C. In each case, U-O grains were
homogenously distributed throughout the pellet microstructure and existed primarily on
UN grain boundaries. The pores were also lined with an oxide phase. Increasing UO2
58
additions resulted in microstructural coarsening, as did the sintering temperature. Higher
sintering temperatures also resulted in lower sintered densities, presumably due to a
preferential formation of oxygen-stabilized nitrides or uranium oxynitrides.
The work presented here demonstrates a viable synthesis process for fabricating
carbon free UN-UO2 accident tolerant fuels for the current fleet of LWRs. Although a
new fuel concept has been developed, there is a lengthy process in order to demonstrate
its improved accident tolerance. Further work must be completed to determine if
controlled UO2 additions enhance the accident tolerance of UN to high temperature
oxygen and steam exposures while maintaining thermophysical properties comparable or
better than the benchmark LWR fuel, UO2.
Acknowledgements
This project was supported by the Department of Energy Nuclear Energy
University Program (DOE-NEUP) grant #00120690. The authors would also like to
acknowledge Joshua Heuther and Daniel Osterberg from Boise State University, Todd
Allen, Doug Toomer, Curtis Clark, Jason Harp, and Paul Lessing from the Idaho National
Laboratory and Ken McClellan from Los Alamos National Laboratory for fruitful
discussions, support, and materials procurement.
Author Justification
The research presented in this publication was carried out by Brian Jaques,
Jennifer Watkins, Joseph Croteau, Dr. Gordon Alanko, and Dr. Darryl Butt. Brian
coordinated the work, synthesized the materials, collected much of the experimental data,
and authored the manuscript. Jennifer and Joseph assisted in materials preparation and
characterization. Dr. Alanko provided foundational studies and insight. Dr. Alanko, Dr.
59
Beata Tyburska-Pueschel, Dr. Mitch Meyer, Dr. Peng Xu, Dr. Edward Lahoda, and Dr.
Butt all contributed fruitful discussions, ideas, and vision. Work done by Brian Jaques
was in partial fulfillment of the requirements for a Doctoral degree in Materials Science
and Engineering at Boise State University, under the advisement and supervision of Dr.
Butt. Dr. Butt contributed greatly in terms vision, ideas, advisement, critical review of the
article throughout the writing process, and financial support.
60
References
[1] L.J. Ott, K.R. Robb, D. Wang, Journal of Nuclear Materials, 448 (2014) 520-533.
[2] F. Goldner, Development Strategy for Advanced LWR Fuels with Enhanced Accident Tolerance, in: Enhanced Accident Tolerant LWR Fuels National Metrics Workshop, Germantown, MD, 2012.
[3] G.J. Youinou, R.S. Sen, Nuclear Technology, 188 (2014) 123-138.
[4] S.J. Zinkle, K.A. Terrani, J.C. Gehin, L.J. Ott, L.L. Snead, Journal of Nuclear Materials, 448 (2014) 374-379.
[5] D.M. Wachs, N. Woolstenhulme, Transactions of the American Nuclear Society, 110 (2014) 42-46.
[6] K. Yang-Hyun, Y. Jae-Ho, P. Jeong-Yong, K. Keon-Sik, K. Hyun-Gil, K. Dong-Joo, J. Yang-Il, S. Kun-Woo, Nuclear Technology, 186 (2014) 295-304.
[7] N.R. Brown, A. Aronson, M. Todosow, R. Brito, K.J. McClellan, Nucl. Eng. Des., 275 (2014) 393-407.
[8] S. Bragg-Sitton, B. Merrill, M. Teague, L.J. Ott, K.R. Robb, M. Farmer, M. Billone, R. Montgomery, C. Stanek, M. Todosow, N.R. Brown, Advanced fuels campaign: Enhanced LWR accident tolerant fuel performance metrics, INL/LTD-13-30226, FCRD-FUEL-2013-000264, Idaho National Laboratories, 2013.
[9] P.A. Lessing, Oxidation protection of uranium nitride fuel using liquid phase sintering, INL/EXT-12-24974, Idaho National Laboratories, 2012.
[10] J. Zakova, J. Wallenius, Ann. Nucl. Energy, 47 (2012) 182-191.
[11] S.L. Hayes, J.K. Thomas, K.L. Peddicord, Journal of Nuclear Materials, 171 (1990) 289-299.
[12] S.L. Hayes, J.K. Thomas, K.L. Peddicord, Journal of Nuclear Materials, 171 (1990) 300-318.
[13] H. Zhao, D.H. Zhu, K.S. Chaudri, S.Z. Qiu, W.X. Tian, G.H. Su, Prog. Nucl. Energy, 71 (2014) 152-159.
[14] S. Sugihara, S. Imoto, J Nucl Sci Technol-T, 6 (1969) 237.
[15] S. Sunder, N.H. Miller, Journal of Alloys and Compounds, 271 (1998) 568-572.
[16] G.A.R. Rao, S.K. Mukerjee, V.N. Vaidya, V. Venugopal, D.D. Sood, Journal of Nuclear Materials, 185 (1991) 231-241.
61
[17] K.S. Chaudri, W.X. Tian, Y.L. Su, H. Zhao, D.H. Zhu, G.H. Su, S.Z. Qiu, Prog. Nucl. Energy, 63 (2013) 57-65.
[18] Inorganic crystal structure database, in, FIZ Karlsruhe Karlsruh, Germany.
[19] A.A. Bauer, Reactor Technology, 15 (1972) 87-104.
[20] J.M. Cleveland, G.H. Bryan, C.R. Heiple, R.J. Sironen, Nuclear Technology, 25 (1975) 541-545.
[21] H. Matzke, Science of Advanced LMFBR Fuels, Elsevier Science Publishing Company, Inc., Amsterdam, The Netherlands, 1986.
[22] N.H. Olschewski, J.-P. Glatz, H. Bokelund, M.J.-F. Leroy, Journal of Nuclear Materials, 188 (1992) 244-248.
[23] N. Oi, S. Hirayama, I. Tanabe, A. Muramatsu, T. Kawada, Journal of Nuclear Science and Technology, 9 (1972) 521-527.
[24] M. Paljevic, Z. Despotovic, Journal of Nuclear Materials, 57 (1975) 253-257.
[25] W.D. Wilkinson, Uranium Metallurgy: Uranium Process Metallurgy, Interscience Publishers, New York, 1962.
[26] D.J. Kim, Y.S. Kim, S.H. Kim, J.H. Kim, J.H. Yang, Y.W. Lee, H.S. Kim, Thermochimica Acta, 441 (2006) 127-131.
[27] T. Muromura, H. Tagawa, Journal of Nuclear Materials, 71 (1977) 65-72.
[28] R.B. Matthews, K.M. Chidester, C.W. Hoth, R.E. Mason, R.L. Petty, Journal of Nuclear Materials, 151 (1988) 334.
[29] J. Bugl, A.A. Bauer, Corrosion and oxidation characteristics of uranium mononitride, 13, Nuclear Metallurgy, Ann Arbor, MI, 1964.
[30] B.J. Jaques, B.M. Marx, A.S. Hamdy, D.P. Butt, Journal of Nuclear Materials, 381 (2008) 309.311.
[31] V.J. Tennery, E.S. Bomar, Transactions of the American Nuclear Society, 19 (1974) 101-102.
[32] V.J. Tennery, T.G. Godfrey, R.A. Potter, Journal of the American Ceramic Society, 54 (1971) 327-331.
[33] H. Matzke, Journal of the Chemical Society Faraday Transactions, 86 (1990) 1243-1256.
[34] H. Inouye, J.M. Leitnake, Journal of the American Ceramic Society, 51 (1968) 6.

62
[35] N.A. Javed, Journal of the Less-Common Metals, 29 (1972) 155.
[36] G.C. Jain, C. Ganguly, Journal of Nuclear Materials, 202 (1993) 245-251.
[37] Y. Arai, M. Morihira, T. Ohmichi, Journal of Nuclear Materials, 202 (1993) 70-78.
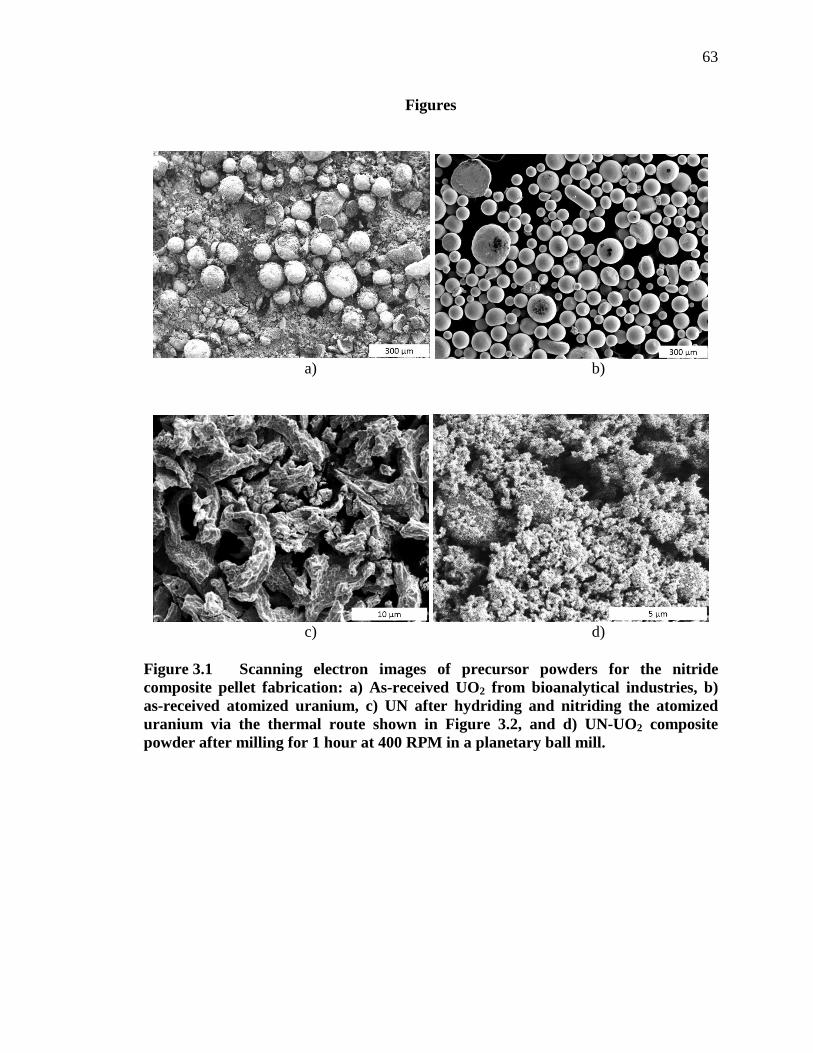
63
Figures
a) b)
c) d)
Figure 3.1 Scanning electron images of precursor powders for the nitride composite pellet fabrication: a) As-received UO2 from bioanalytical industries, b) as-received atomized uranium, c) UN after hydriding and nitriding the atomized uranium via the thermal route shown in Figure 3.2, and d) UN-UO2 composite powder after milling for 1 hour at 400 RPM in a planetary ball mill.
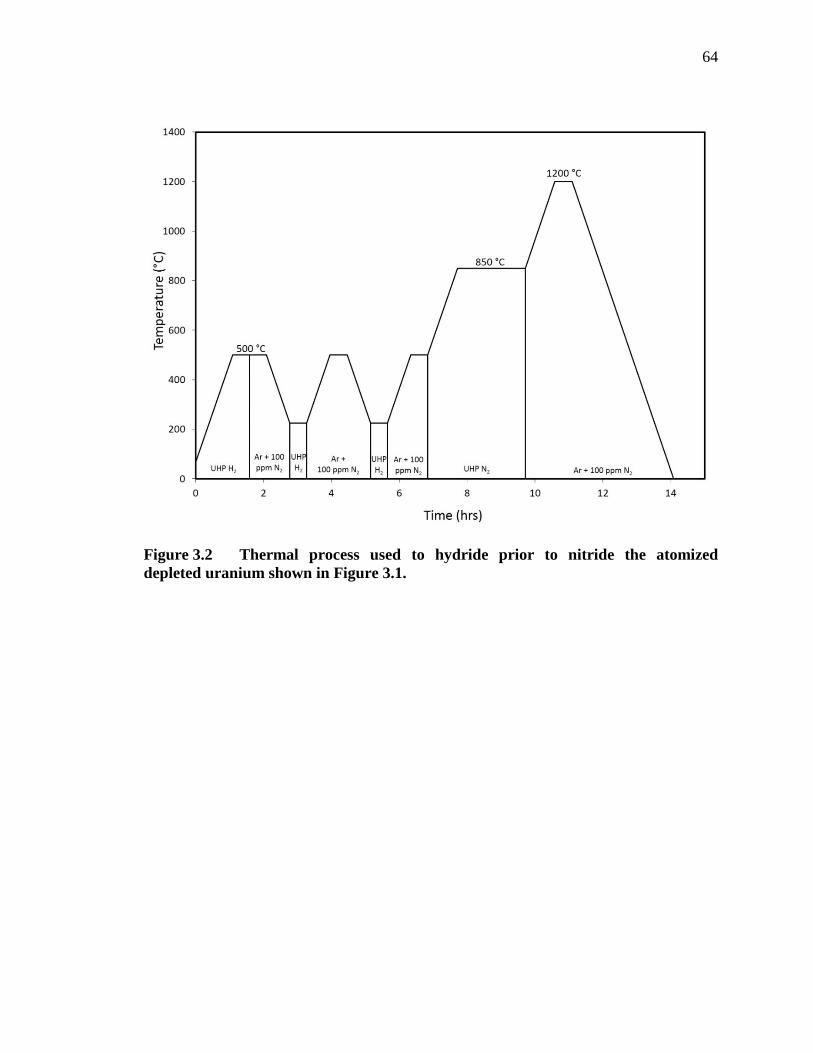
64
Figure 3.2 Thermal process used to hydride prior to nitride the atomized depleted uranium shown in Figure 3.1.
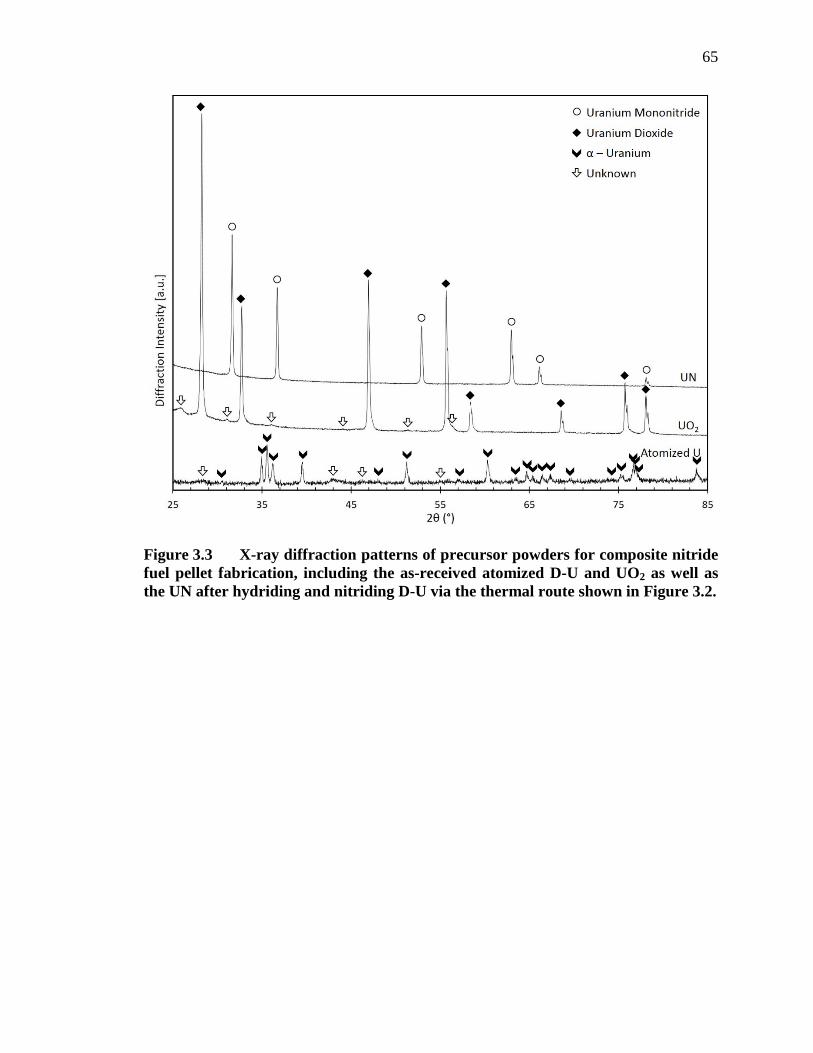
65
Figure 3.3 X-ray diffraction patterns of precursor powders for composite nitride fuel pellet fabrication, including the as-received atomized D-U and UO2 as well as the UN after hydriding and nitriding D-U via the thermal route shown in Figure 3.2.

66
Figure 3.4 X-ray diffraction patterns of nominal compositions of UN, UN-5 w% UO2, and UN-10 w% UO2 after milling for 1 hour in a planetary ball mill at 400 RPM.
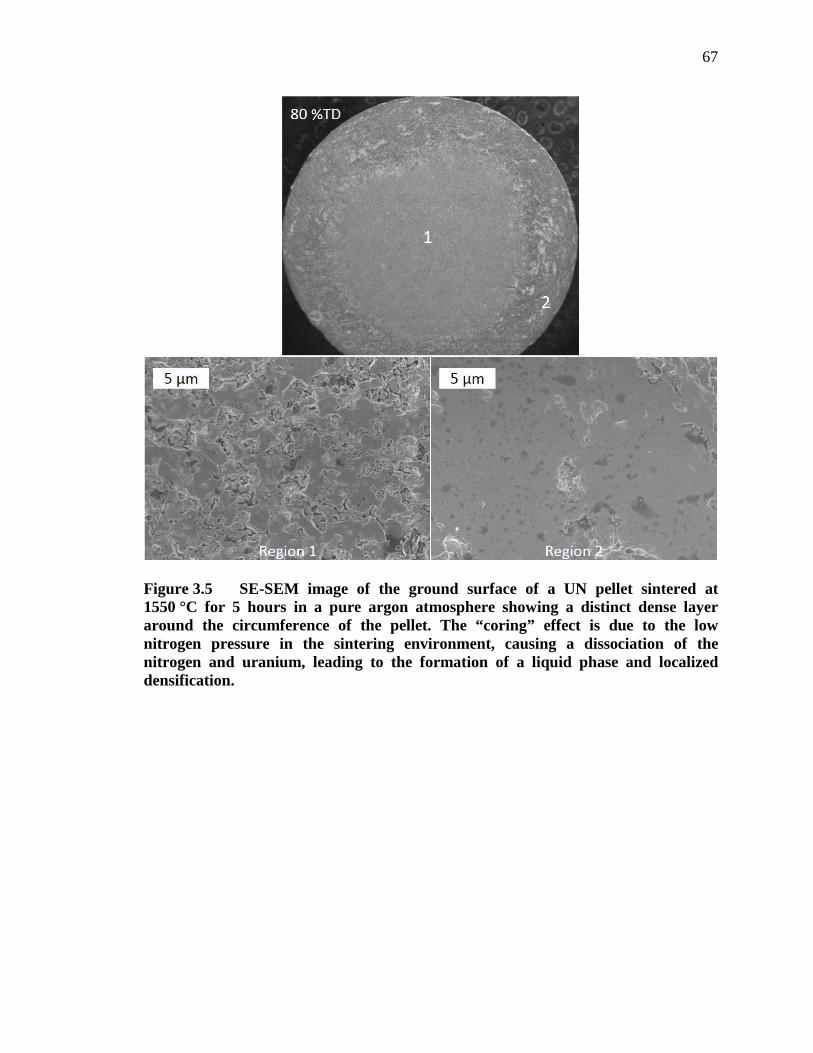
67
Figure 3.5 SE-SEM image of the ground surface of a UN pellet sintered at 1550 °C for 5 hours in a pure argon atmosphere showing a distinct dense layer around the circumference of the pellet. The “coring” effect is due to the low nitrogen pressure in the sintering environment, causing a dissociation of the nitrogen and uranium, leading to the formation of a liquid phase and localized densification.
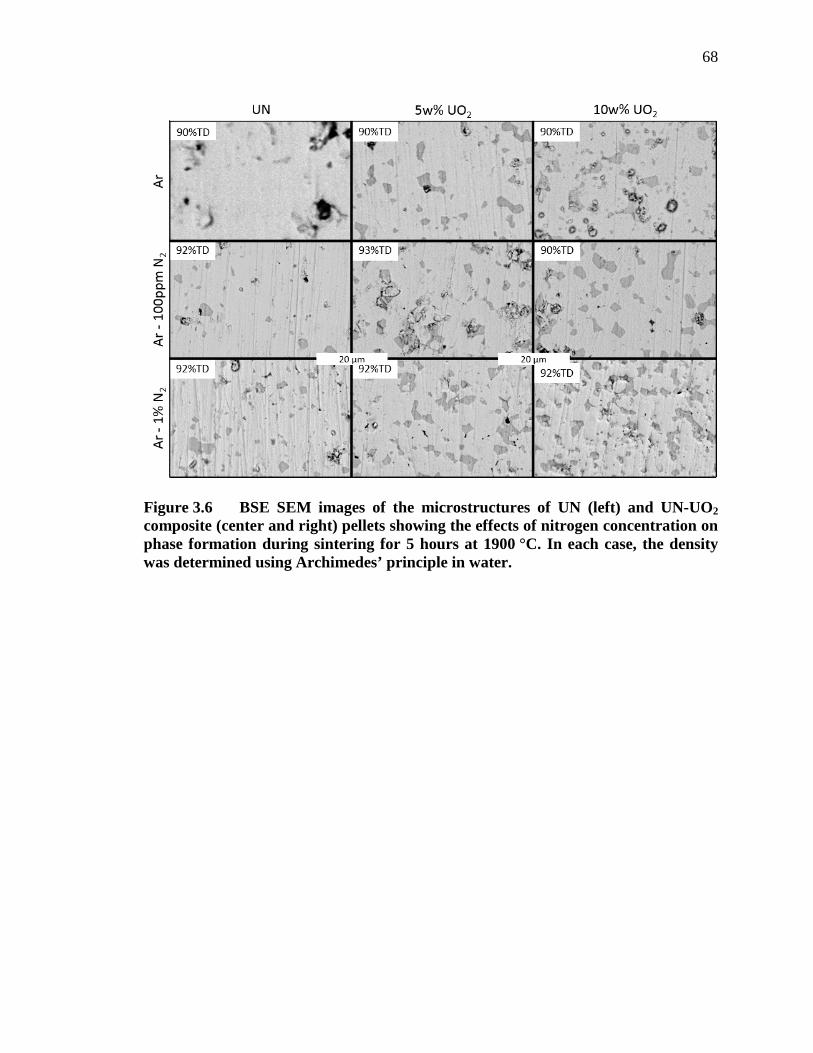
68
Figure 3.6 BSE SEM images of the microstructures of UN (left) and UN-UO2 composite (center and right) pellets showing the effects of nitrogen concentration on phase formation during sintering for 5 hours at 1900 °C. In each case, the density was determined using Archimedes’ principle in water.
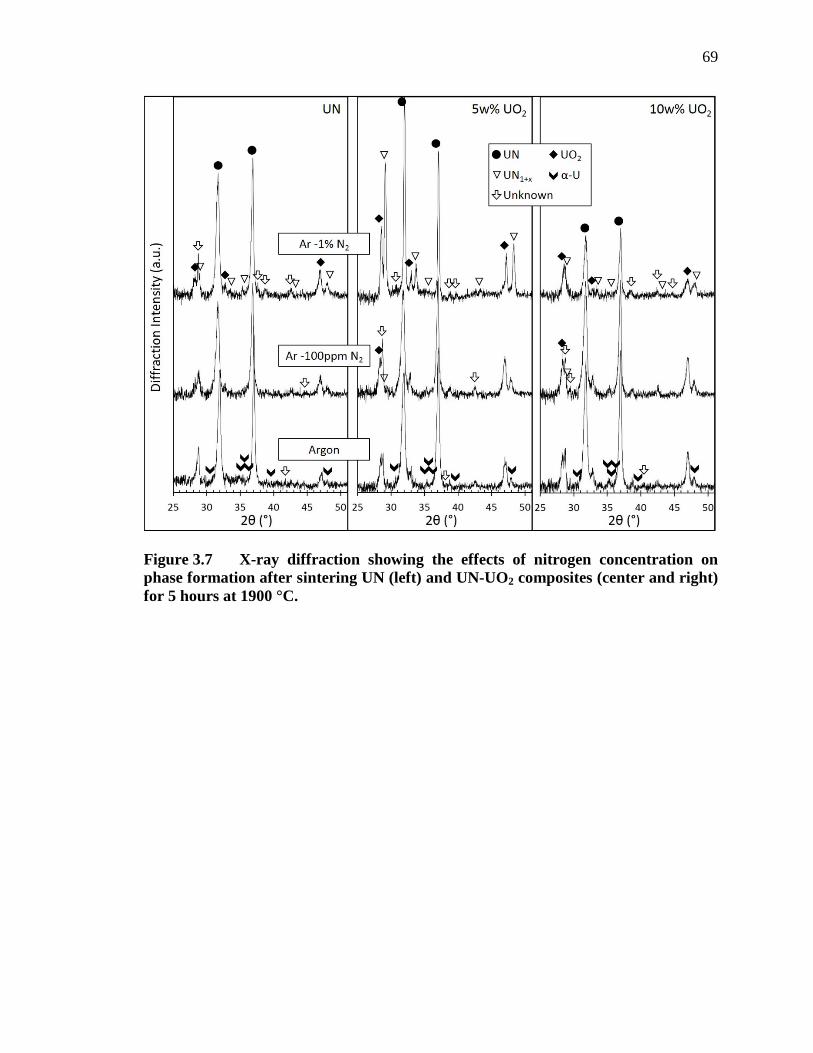
69
Figure 3.7 X-ray diffraction showing the effects of nitrogen concentration on phase formation after sintering UN (left) and UN-UO2 composites (center and right) for 5 hours at 1900 °C.
70
Figure 3.8 BSE SEM images of the microstructures of UN (left) and UN - UO2 composite (center and right) pellets showing the coarsening of features and increase of porosity with increasing temperature. All samples were sintered for 5 hours in Ar - 100 ppm N2 and densities were determined using Archimedes’ principle in water.
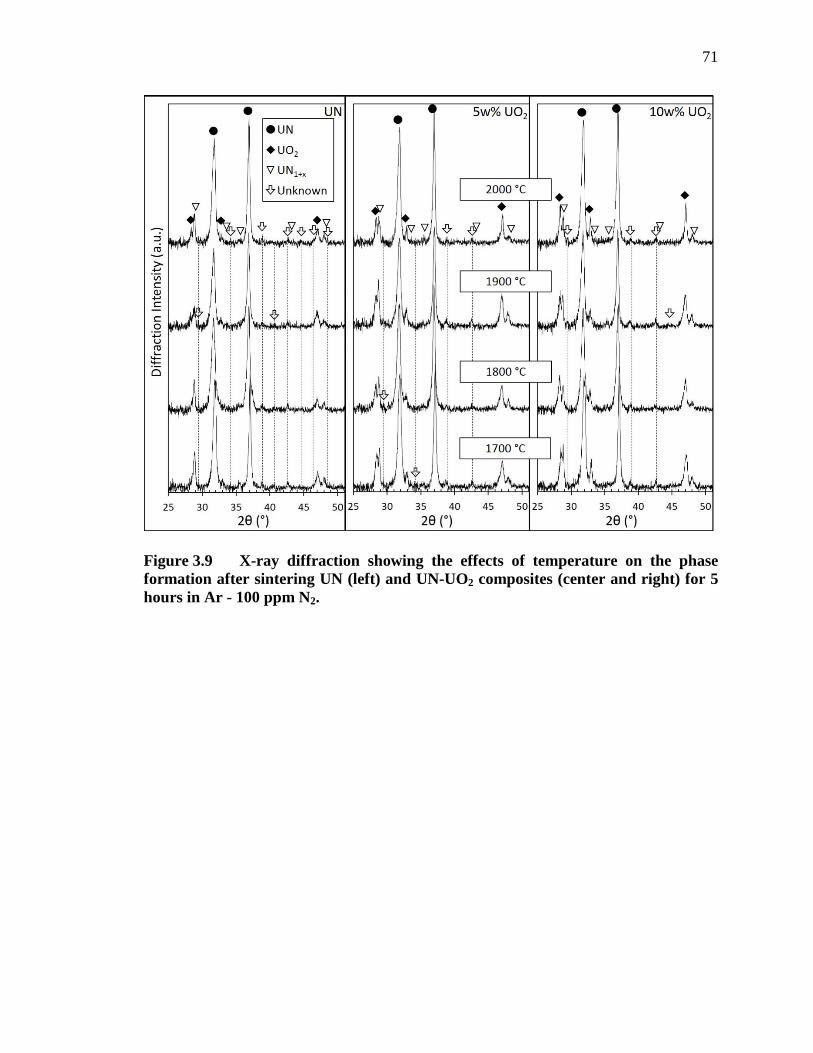
71
Figure 3.9 X-ray diffraction showing the effects of temperature on the phase formation after sintering UN (left) and UN-UO2 composites (center and right) for 5 hours in Ar - 100 ppm N2.
72
CHAPTER FOUR: HIGH TEMPERATURE OXIDATION KINETICS
OF DYSPROSIUM PARTICLES
This chapter has been accepted to the Journal of Alloys and Compounds.
73
High Temperature Oxidation Kinetics of Dysprosium Particles
Brian J. Jaquesa,b
Darryl P. Butta,b
Accepted for publication in:
Journal of Alloys and Compounds
March 2015
aDepartment of Materials Science and Engineering, Boise State University,
1910 University Drive, Boise, ID 83725.
bCenter for Advanced Energy Studies,
995 University Blvd, Idaho Falls, ID 83415.
NOTICE: This is the author’s version of a work that was accepted for publication in the Journal of Alloys and Compounds. Changes resulting from the publishing process, such as peer review, editing, corrections, structural formatting, and other quality control mechanisms are not reflected in this document. Changes may have been made to this work since it was submitted for publication.
74
Abstract
Rare earth elements have been recognized as critical materials for the
advancement of green technology. Recently, the United States has invested 100s of
millions of dollars to enhance, protect, and forecast their production and management.
The work presented here attempts to clarify the limited and contradictory literature on the
oxidation behavior of the rare earth metal, dysprosium. Dysprosium particles were
isothermally oxidized from 500 - 1000 °C in N2 - (2, 20, and 50%) O2 and Ar - 20% O2
using simultaneous thermal analysis techniques. Two distinct oxidation regions were
identified at each isothermal temperature in each oxidizing atmosphere. Initially, the
oxidation kinetics are very fast until the reaction enters a slower, intermediate region of
oxidation. The two regions are defined and the kinetics of each are assessed to show an
apparent activation energy of 8 - 25 kJ/mol in the initial region and 80 - 95 kJ/mol in the
intermediate oxidation reaction region. The effects of varying the oxygen partial pressure
on the reaction rate constant is used to show that dysprosium oxide (Dy2O3) generally
acts as a p-type semiconductor in both regions of oxidation (with an exception above
750 °C in the intermediate region).
Keywords: Dysprosium, Oxidation, Kinetics, Gas-solid reactions, Rare earth alloys and
compounds, Corrosion
75
4.1 Introduction
Global interest in rare earth element production and management has significantly
increased in the past few years. In the year 2008, nearly $190 million worth of rare earth
materials were imported and used in the U.S. alone. Such “strategic materials” are sought
after for use in metallurgical applications and alloys, electronics, catalysts, and cathode
ray tubes [1]. Compared to the light rare earth metals, relatively little published literature
exists for praseodymium, promethium, thulium, lutetium, and dysprosium (also known as
the heavy rare earths) although scientific interest in these metals is on the rise. In the next
forty years, Hoenderdaal et al. [2] project that the demand for dysprosia (Dy2O3) and
other dysprosium compounds will increase to between 7-25 times (to 14-50 ktons) from
the 2010 demand. Although dysprosium was once thought to be one of the scarcer
elements available in the earth’s crust, it has recently been reported to be more abundant
than once thought (5.2 mg/kg, which is greater than 44 other elements [3]), making its
utility more available for emerging materials technologies.
According to Hoenderdaal et al. [2], the proposed increase in demand is due to the
future of magnetic applications (electric motors) due to dysprosium’s exceptional
magnetic moment of 10.8 Bohr magnetrons, which is second only to holmium [3], and its
ability to induce coercivity as an alloying agent or dopant [3, 4]. However, the demand
for dysprosium has become more prevalent in other applications due to its many other
interesting properties. For instance, dysprosium’s isotopes strongly absorb neutrons,
which lead to its use in nuclear reactor control rod moderator materials [3, 5-7], and
Dy2O3 has been considered as a substitute for SiO2 in high-k dielectric applications due to
its large band gap (4.9 eV) and dielectric constant (14) [8, 9]. Additionally, dysprosium
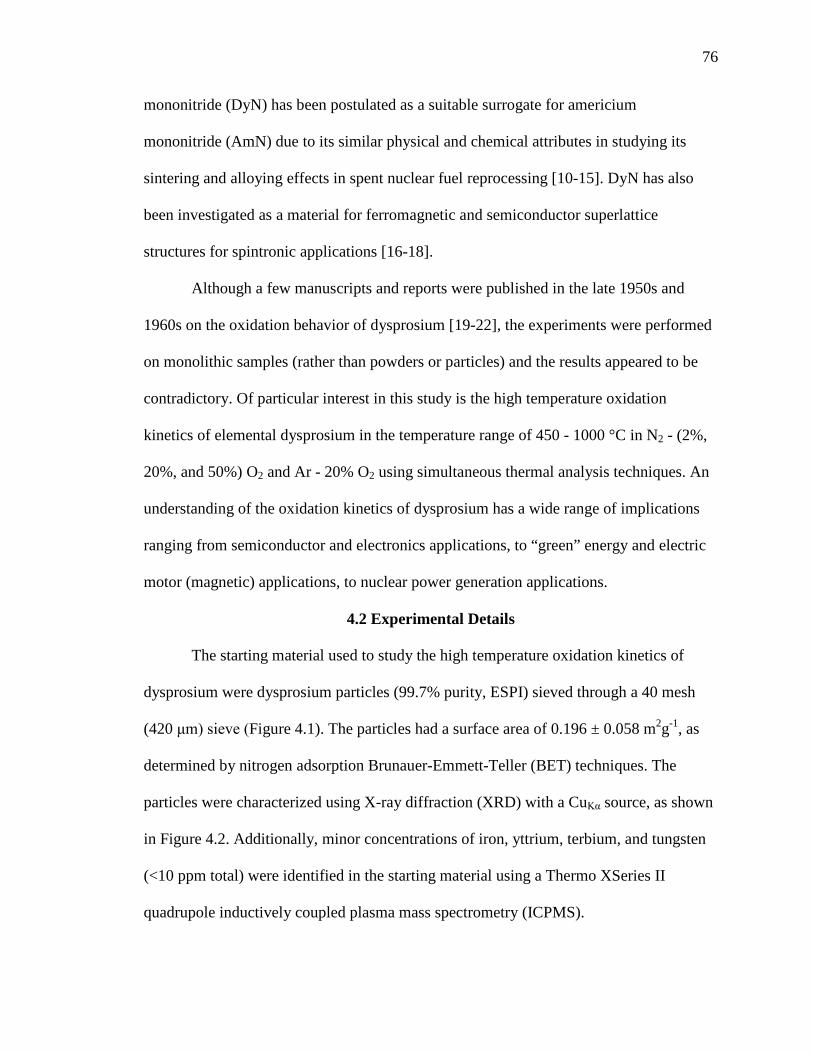
76
mononitride (DyN) has been postulated as a suitable surrogate for americium
mononitride (AmN) due to its similar physical and chemical attributes in studying its
sintering and alloying effects in spent nuclear fuel reprocessing [10-15]. DyN has also
been investigated as a material for ferromagnetic and semiconductor superlattice
structures for spintronic applications [16-18].
Although a few manuscripts and reports were published in the late 1950s and
1960s on the oxidation behavior of dysprosium [19-22], the experiments were performed
on monolithic samples (rather than powders or particles) and the results appeared to be
contradictory. Of particular interest in this study is the high temperature oxidation
kinetics of elemental dysprosium in the temperature range of 450 - 1000 °C in N2 - (2%,
20%, and 50%) O2 and Ar - 20% O2 using simultaneous thermal analysis techniques. An
understanding of the oxidation kinetics of dysprosium has a wide range of implications
ranging from semiconductor and electronics applications, to “green” energy and electric
motor (magnetic) applications, to nuclear power generation applications.
4.2 Experimental Details
The starting material used to study the high temperature oxidation kinetics of
dysprosium were dysprosium particles (99.7% purity, ESPI) sieved through a 40 mesh
(420 μm) sieve (Figure 4.1). The particles had a surface area of 0.196 ± 0.058 m2g-1, as
determined by nitrogen adsorption Brunauer-Emmett-Teller (BET) techniques. The
particles were characterized using X-ray diffraction (XRD) with a CuKα source, as shown
in Figure 4.2. Additionally, minor concentrations of iron, yttrium, terbium, and tungsten
(<10 ppm total) were identified in the starting material using a Thermo XSeries II
quadrupole inductively coupled plasma mass spectrometry (ICPMS).
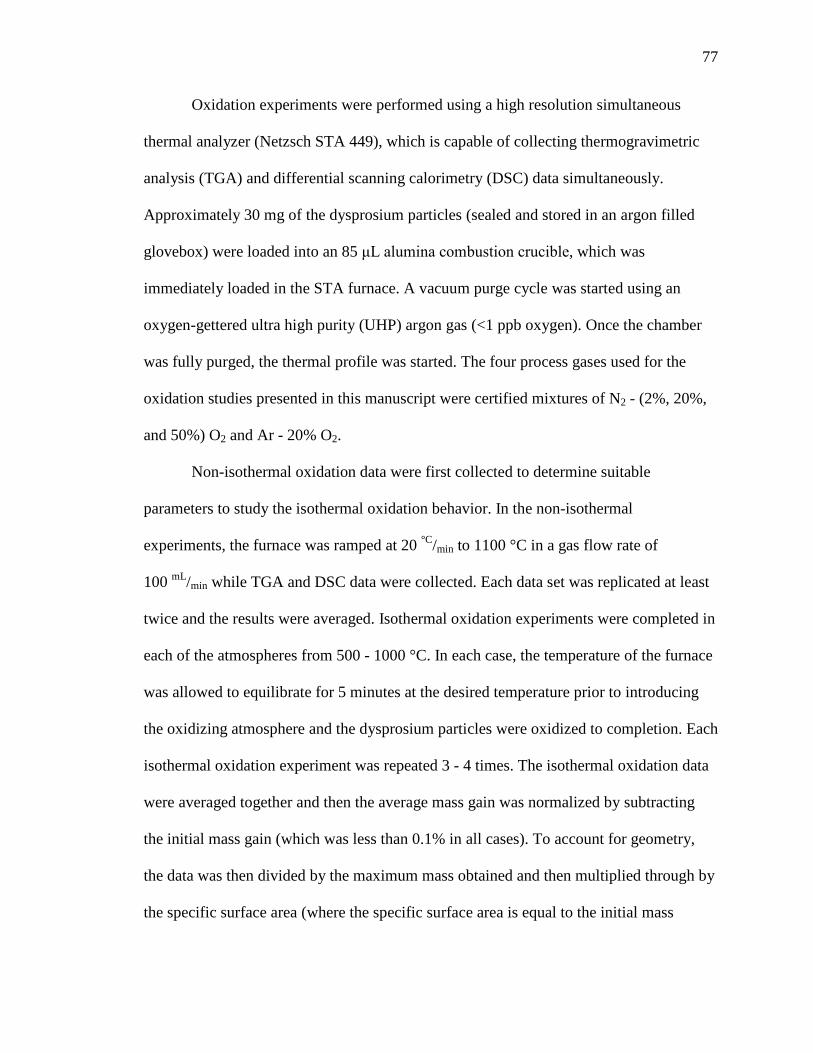
77
Oxidation experiments were performed using a high resolution simultaneous
thermal analyzer (Netzsch STA 449), which is capable of collecting thermogravimetric
analysis (TGA) and differential scanning calorimetry (DSC) data simultaneously.
Approximately 30 mg of the dysprosium particles (sealed and stored in an argon filled
glovebox) were loaded into an 85 μL alumina combustion crucible, which was
immediately loaded in the STA furnace. A vacuum purge cycle was started using an
oxygen-gettered ultra high purity (UHP) argon gas (<1 ppb oxygen). Once the chamber
was fully purged, the thermal profile was started. The four process gases used for the
oxidation studies presented in this manuscript were certified mixtures of N2 - (2%, 20%,
and 50%) O2 and Ar - 20% O2.
Non-isothermal oxidation data were first collected to determine suitable
parameters to study the isothermal oxidation behavior. In the non-isothermal
experiments, the furnace was ramped at 20 °C/min to 1100 °C in a gas flow rate of
100 mL/min while TGA and DSC data were collected. Each data set was replicated at least
twice and the results were averaged. Isothermal oxidation experiments were completed in
each of the atmospheres from 500 - 1000 °C. In each case, the temperature of the furnace
was allowed to equilibrate for 5 minutes at the desired temperature prior to introducing
the oxidizing atmosphere and the dysprosium particles were oxidized to completion. Each
isothermal oxidation experiment was repeated 3 - 4 times. The isothermal oxidation data
were averaged together and then the average mass gain was normalized by subtracting
the initial mass gain (which was less than 0.1% in all cases). To account for geometry,
the data was then divided by the maximum mass obtained and then multiplied through by
the specific surface area (where the specific surface area is equal to the initial mass

78
multiplied by the surface area of the particles obtained from B.E.T., as described above).
This allowed for a direct comparison of data and accurate kinetics analysis using the
specific mass gain with units of μg/cm2.
4.3 Results and Discussion
Dysprosium is reported to have a hexagonal close packed (HCP) crystal structure
and a melting temperature of 1412 °C [3], although there also exists two other allotropes:
a low temperature (< -187 °C) orthorhombic phase (Cmcm) and a high temperature (>
1381 °C) face-centered cubic (FCC) phase (Im3�m) [3]. As seen in Figure 4.2, the starting
material for the oxidation studies presented here is primarily a HCP dysprosium phase
(P63/mmc) with a small fraction of the high temperature FCC phase. The HCP and FCC
cubic phases were identified using X-ray diffraction data from the International Centre
for Diffraction Data (ICDD) database provided by Spedding et al. [23] and Curzon and
Chlebek [24], respectively. Additionally, it is important to note that the diffraction peaks
were slightly shifted from the reported positions (depicted by the diamonds and circles in
Figure 4.2), which is discussed in more detail later in this manuscript. Although the
authors understand that the geometry and morphology of the particles are not ideal for an
oxidation kinetics study, the authors were unable to identify a vendor to provide single
phase dysprosium particles (with minimal oxide). However, the dysprosium particles
from ESPI were nearly single phase and had a low surface area, which reduced un-
wanted oxidation during handling.
Figure 4.2 also shows a typical diffraction pattern obtained from a fully oxidized
dysprosium sample in each of the atmospheres and temperatures investigated. The
particular diffraction pattern shown is the result of oxidizing the dysprosium particles
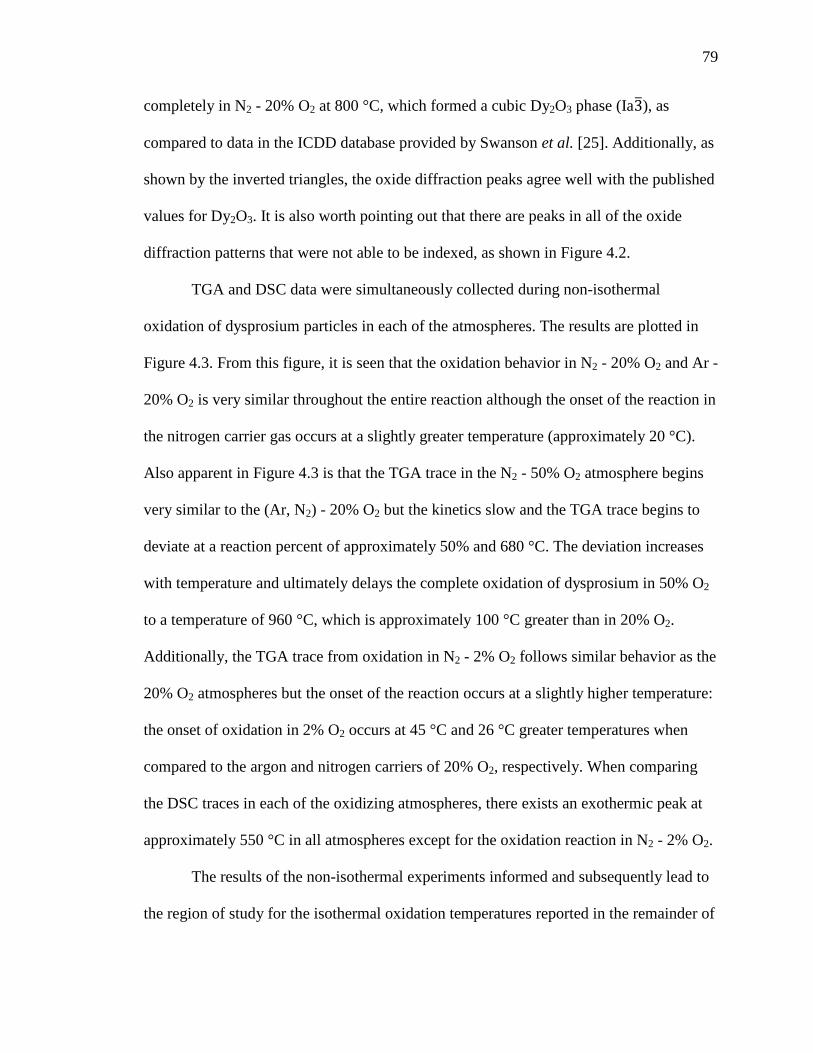
79
completely in N2 - 20% O2 at 800 °C, which formed a cubic Dy2O3 phase (Ia3�), as
compared to data in the ICDD database provided by Swanson et al. [25]. Additionally, as
shown by the inverted triangles, the oxide diffraction peaks agree well with the published
values for Dy2O3. It is also worth pointing out that there are peaks in all of the oxide
diffraction patterns that were not able to be indexed, as shown in Figure 4.2.
TGA and DSC data were simultaneously collected during non-isothermal
oxidation of dysprosium particles in each of the atmospheres. The results are plotted in
Figure 4.3. From this figure, it is seen that the oxidation behavior in N2 - 20% O2 and Ar -
20% O2 is very similar throughout the entire reaction although the onset of the reaction in
the nitrogen carrier gas occurs at a slightly greater temperature (approximately 20 °C).
Also apparent in Figure 4.3 is that the TGA trace in the N2 - 50% O2 atmosphere begins
very similar to the (Ar, N2) - 20% O2 but the kinetics slow and the TGA trace begins to
deviate at a reaction percent of approximately 50% and 680 °C. The deviation increases
with temperature and ultimately delays the complete oxidation of dysprosium in 50% O2
to a temperature of 960 °C, which is approximately 100 °C greater than in 20% O2.
Additionally, the TGA trace from oxidation in N2 - 2% O2 follows similar behavior as the
20% O2 atmospheres but the onset of the reaction occurs at a slightly higher temperature:
the onset of oxidation in 2% O2 occurs at 45 °C and 26 °C greater temperatures when
compared to the argon and nitrogen carriers of 20% O2, respectively. When comparing
the DSC traces in each of the oxidizing atmospheres, there exists an exothermic peak at
approximately 550 °C in all atmospheres except for the oxidation reaction in N2 - 2% O2.
The results of the non-isothermal experiments informed and subsequently lead to
the region of study for the isothermal oxidation temperatures reported in the remainder of

80
this manuscript. As previously stated, isothermal oxidation experiments of dysprosium
particles were completed 3-4 times at each temperature and atmosphere to arrive at
average behaviors, which was used for the kinetics analysis. Figure 4.4 shows typical
TGA data variability between duplicated oxidation experiments. In this figure, TGA data
obtained from oxidizing dysprosium particles from 650 - 800 °C in N2 - 20% O2 are used
to show the typical data variability, which is minimal. The variability that is present is
due to the cumulative effects of several factors, including: irregular and non-uniform
particle morphology (Figure 4.1), the presence of a slight amount of secondary phase in
the starting material (Figure 4.2), the presumed presence of a native oxide and
unquantified amounts of dissolved oxygen, the likelihood of residual stresses in the
starting material due to vendor processing (as indicated by the slight leftward shift in the
diffraction peaks when compared to the published values [23] shown in Figure 4.2), as
well as the sampling technique used (i.e., a scoop sampling technique was used whereas a
more effective and representative sampling technique could have been used, such as
powder riffling). However, since multiple data sets were averaged for all of the analysis,
the assumption is that the results are representative. It should also be noted that although
the effects of particle size distribution will influence the kinetics of thermal oxidation, no
effort was made in this investigation to de-convolute such effects other than to account
for the starting surface area and a nominal shrinking core.
Figure 4.5 shows the isothermal oxidation behavior of dysprosium particles in N2
- 20% O2 from 500 - 950 °C. Two interesting observations from Figure 4.5 are that there
is a distinct inflection where the oxidation kinetics slow after some reaction extent, α, and
the specific mass gain that is defined by the onset of the inflection increases with
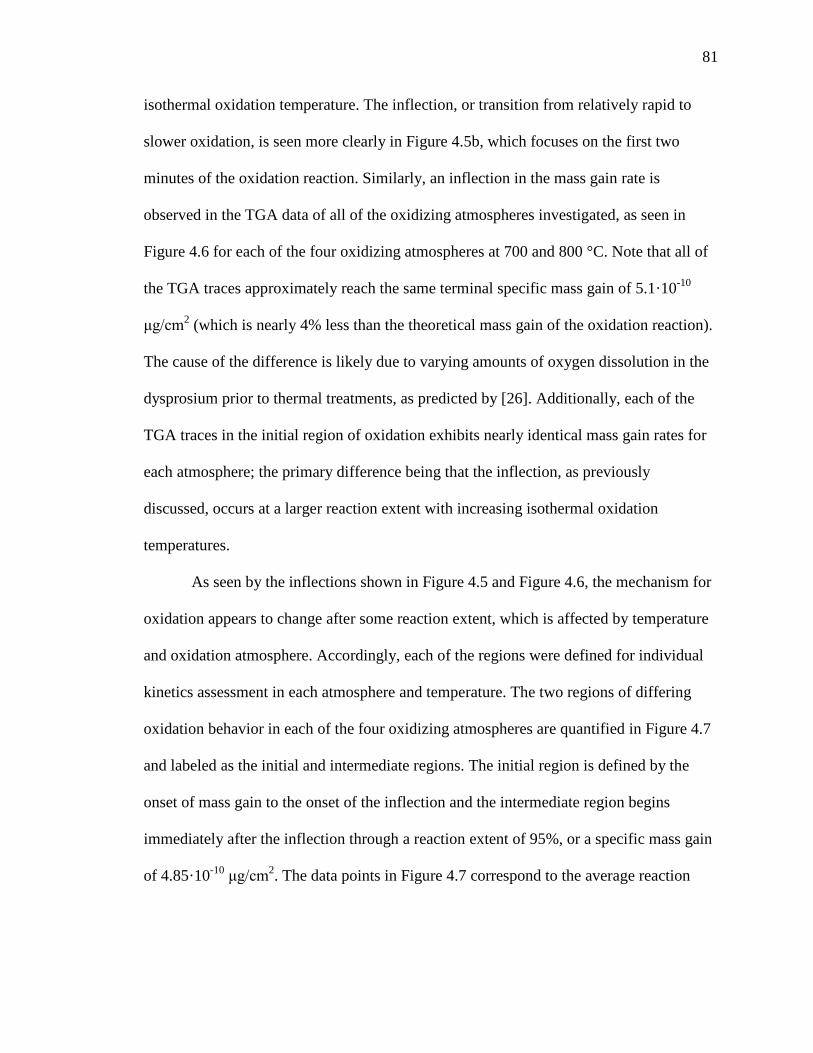
81
isothermal oxidation temperature. The inflection, or transition from relatively rapid to
slower oxidation, is seen more clearly in Figure 4.5b, which focuses on the first two
minutes of the oxidation reaction. Similarly, an inflection in the mass gain rate is
observed in the TGA data of all of the oxidizing atmospheres investigated, as seen in
Figure 4.6 for each of the four oxidizing atmospheres at 700 and 800 °C. Note that all of
the TGA traces approximately reach the same terminal specific mass gain of 5.1·10-10
μg/cm2 (which is nearly 4% less than the theoretical mass gain of the oxidation reaction).
The cause of the difference is likely due to varying amounts of oxygen dissolution in the
dysprosium prior to thermal treatments, as predicted by [26]. Additionally, each of the
TGA traces in the initial region of oxidation exhibits nearly identical mass gain rates for
each atmosphere; the primary difference being that the inflection, as previously
discussed, occurs at a larger reaction extent with increasing isothermal oxidation
temperatures.
As seen by the inflections shown in Figure 4.5 and Figure 4.6, the mechanism for
oxidation appears to change after some reaction extent, which is affected by temperature
and oxidation atmosphere. Accordingly, each of the regions were defined for individual
kinetics assessment in each atmosphere and temperature. The two regions of differing
oxidation behavior in each of the four oxidizing atmospheres are quantified in Figure 4.7
and labeled as the initial and intermediate regions. The initial region is defined by the
onset of mass gain to the onset of the inflection and the intermediate region begins
immediately after the inflection through a reaction extent of 95%, or a specific mass gain
of 4.85·10-10 μg/cm2. The data points in Figure 4.7 correspond to the average reaction

82
extent defined at the end of the initial region to the beginning of the intermediate region
and are nearly centered on the inflection in the mass gain data.
An interesting observation from Figure 4.7 is that the change in oxidation kinetics
occurs at lower reaction extents (i.e., the initial oxidation region is a smaller percentage
of the overall reaction) in the Ar - 20% O2 oxidizing atmosphere when compared to the
nitrogen carrier gases. Additionally, the oxidation reaction is nearly fully defined by the
initial reaction region at temperatures equal to and greater than 900, 950, and 1000 °C in
N2 - 2% O2, N2 - 50% O2, N2 - 20% O2, respectively, whereas the initial reaction region
comprises only 30-40% of the oxidation reaction at the same temperatures in Ar - 20%
O2.
As previously stated, the published literature on the oxidation kinetics of
dysprosium is limited; very few publications were found that describe the oxidation
kinetics of bulk materials and none were found describing the behavior of powders or
finely distributed particles. Of the literature found, the mechanism of the oxidation
reaction is presumed to remain constant over the entire reaction at each temperature,
contrary to the results presented here. In a report written by Love [20] in 1959, the rate of
dysprosium oxidation was best fit to linear kinetics from 200 - 600 °C in clean air (nearly
20% O2). However, in the late 1960s Pethe et al. [21] and Greene and Hodge [22]
reported that the oxidation kinetics follow a parabolic model. Greene and Hodge present
dysprosium oxidation in temperatures of 300 - 800 °C in clean air (N2 - 20% O2) and
Pethe et al. from 500 - 800 °C in an atmosphere with an oxygen pressure of 100 Torr
(13% O2 at 1 atm total pressure).
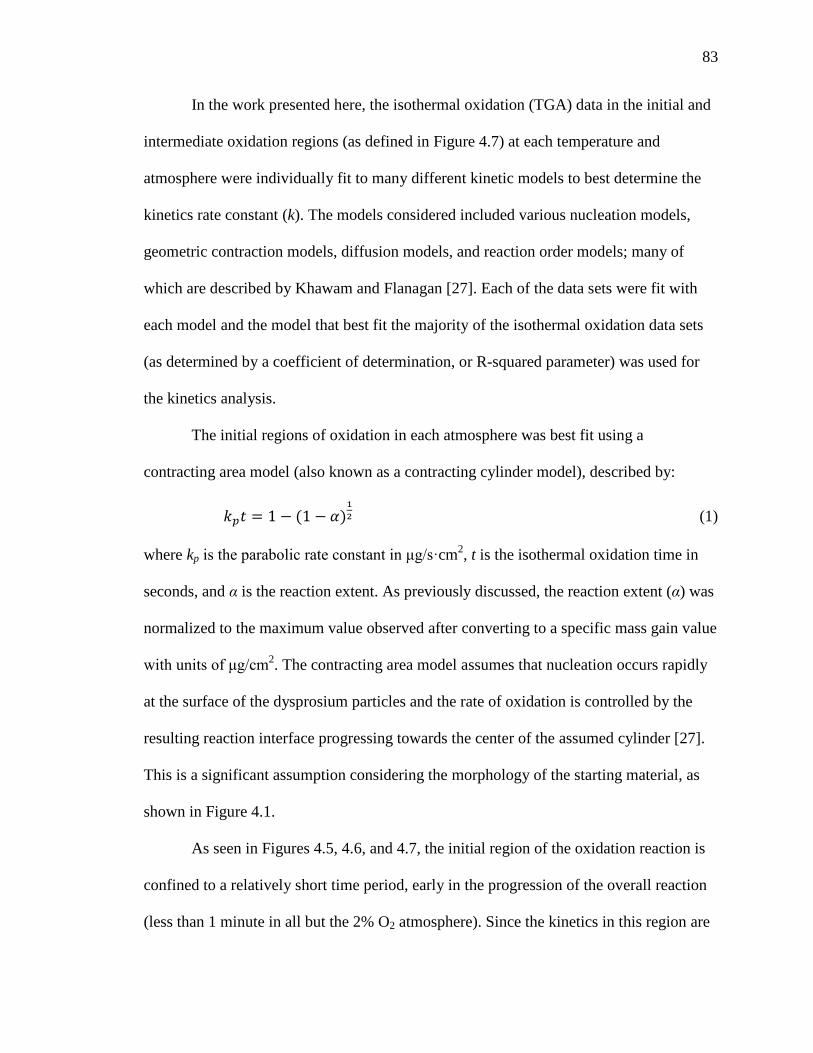
83
In the work presented here, the isothermal oxidation (TGA) data in the initial and
intermediate oxidation regions (as defined in Figure 4.7) at each temperature and
atmosphere were individually fit to many different kinetic models to best determine the
kinetics rate constant (k). The models considered included various nucleation models,
geometric contraction models, diffusion models, and reaction order models; many of
which are described by Khawam and Flanagan [27]. Each of the data sets were fit with
each model and the model that best fit the majority of the isothermal oxidation data sets
(as determined by a coefficient of determination, or R-squared parameter) was used for
the kinetics analysis.
The initial regions of oxidation in each atmosphere was best fit using a
contracting area model (also known as a contracting cylinder model), described by:
𝑘𝑝𝑡 = 1 − (1 − 𝛼)12 (1)
where kp is the parabolic rate constant in μg/s·cm2, t is the isothermal oxidation time in
seconds, and α is the reaction extent. As previously discussed, the reaction extent (α) was
normalized to the maximum value observed after converting to a specific mass gain value
with units of μg/cm2. The contracting area model assumes that nucleation occurs rapidly
at the surface of the dysprosium particles and the rate of oxidation is controlled by the
resulting reaction interface progressing towards the center of the assumed cylinder [27].
This is a significant assumption considering the morphology of the starting material, as
shown in Figure 4.1.
As seen in Figures 4.5, 4.6, and 4.7, the initial region of the oxidation reaction is
confined to a relatively short time period, early in the progression of the overall reaction
(less than 1 minute in all but the 2% O2 atmosphere). Since the kinetics in this region are
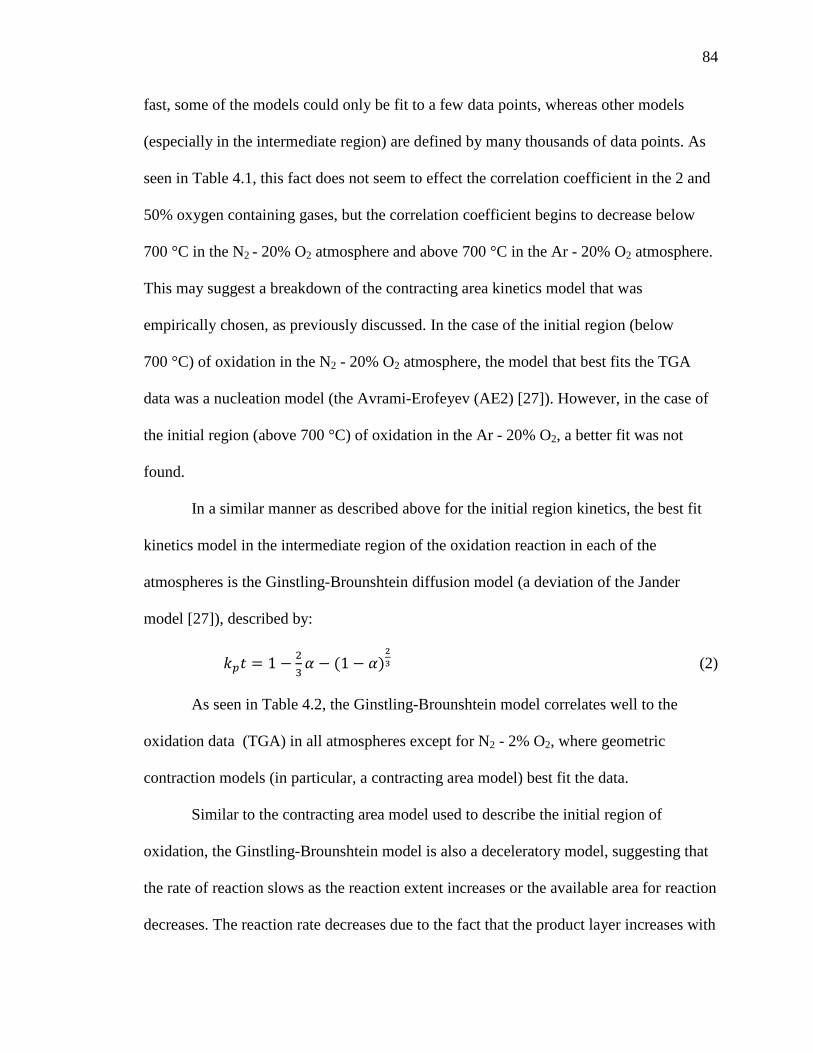
84
fast, some of the models could only be fit to a few data points, whereas other models
(especially in the intermediate region) are defined by many thousands of data points. As
seen in Table 4.1, this fact does not seem to effect the correlation coefficient in the 2 and
50% oxygen containing gases, but the correlation coefficient begins to decrease below
700 °C in the N2 - 20% O2 atmosphere and above 700 °C in the Ar - 20% O2 atmosphere.
This may suggest a breakdown of the contracting area kinetics model that was
empirically chosen, as previously discussed. In the case of the initial region (below
700 °C) of oxidation in the N2 - 20% O2 atmosphere, the model that best fits the TGA
data was a nucleation model (the Avrami-Erofeyev (AE2) [27]). However, in the case of
the initial region (above 700 °C) of oxidation in the Ar - 20% O2, a better fit was not
found.
In a similar manner as described above for the initial region kinetics, the best fit
kinetics model in the intermediate region of the oxidation reaction in each of the
atmospheres is the Ginstling-Brounshtein diffusion model (a deviation of the Jander
model [27]), described by:
𝑘𝑝𝑡 = 1 − 23𝛼 − (1 − 𝛼)
23 (2)
As seen in Table 4.2, the Ginstling-Brounshtein model correlates well to the
oxidation data (TGA) in all atmospheres except for N2 - 2% O2, where geometric
contraction models (in particular, a contracting area model) best fit the data.
Similar to the contracting area model used to describe the initial region of
oxidation, the Ginstling-Brounshtein model is also a deceleratory model, suggesting that
the rate of reaction slows as the reaction extent increases or the available area for reaction
decreases. The reaction rate decreases due to the fact that the product layer increases with
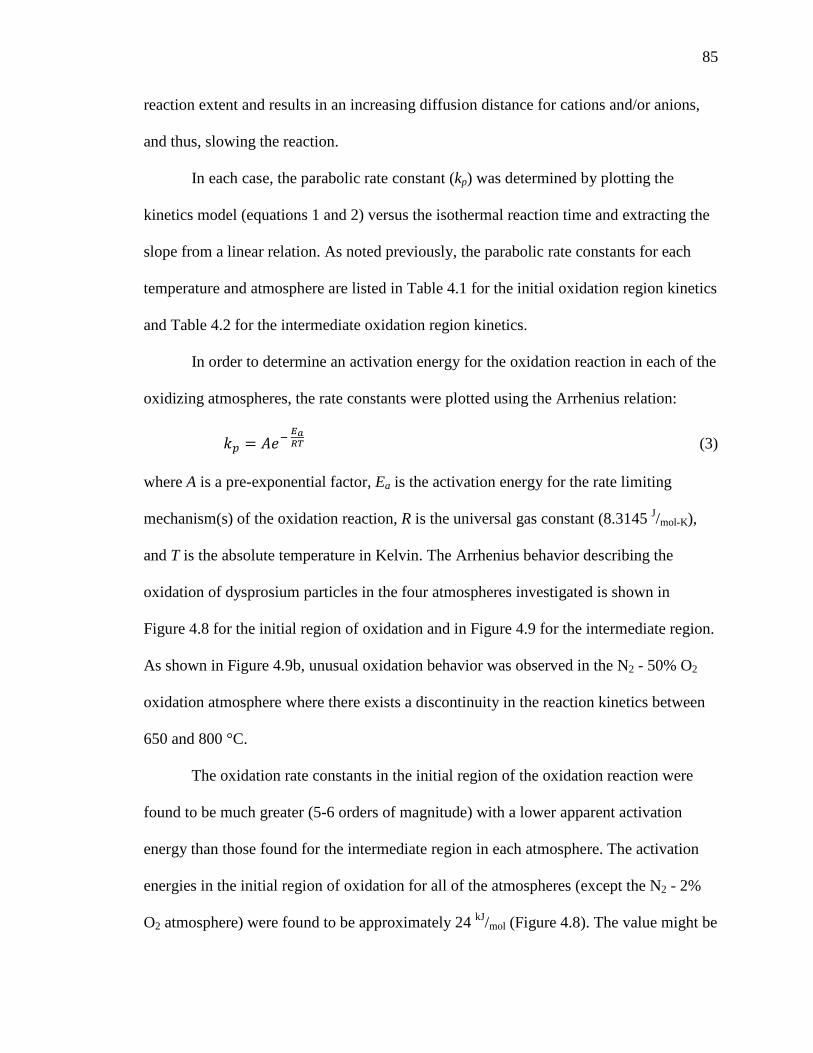
85
reaction extent and results in an increasing diffusion distance for cations and/or anions,
and thus, slowing the reaction.
In each case, the parabolic rate constant (kp) was determined by plotting the
kinetics model (equations 1 and 2) versus the isothermal reaction time and extracting the
slope from a linear relation. As noted previously, the parabolic rate constants for each
temperature and atmosphere are listed in Table 4.1 for the initial oxidation region kinetics
and Table 4.2 for the intermediate oxidation region kinetics.
In order to determine an activation energy for the oxidation reaction in each of the
oxidizing atmospheres, the rate constants were plotted using the Arrhenius relation:
𝑘𝑝 = 𝐴𝑒− 𝐸𝑎𝑅𝑇 (3)
where A is a pre-exponential factor, Ea is the activation energy for the rate limiting
mechanism(s) of the oxidation reaction, R is the universal gas constant (8.3145 J/mol-K),
and T is the absolute temperature in Kelvin. The Arrhenius behavior describing the
oxidation of dysprosium particles in the four atmospheres investigated is shown in
Figure 4.8 for the initial region of oxidation and in Figure 4.9 for the intermediate region.
As shown in Figure 4.9b, unusual oxidation behavior was observed in the N2 - 50% O2
oxidation atmosphere where there exists a discontinuity in the reaction kinetics between
650 and 800 °C.
The oxidation rate constants in the initial region of the oxidation reaction were
found to be much greater (5-6 orders of magnitude) with a lower apparent activation
energy than those found for the intermediate region in each atmosphere. The activation
energies in the initial region of oxidation for all of the atmospheres (except the N2 - 2%
O2 atmosphere) were found to be approximately 24 kJ/mol (Figure 4.8). The value might be
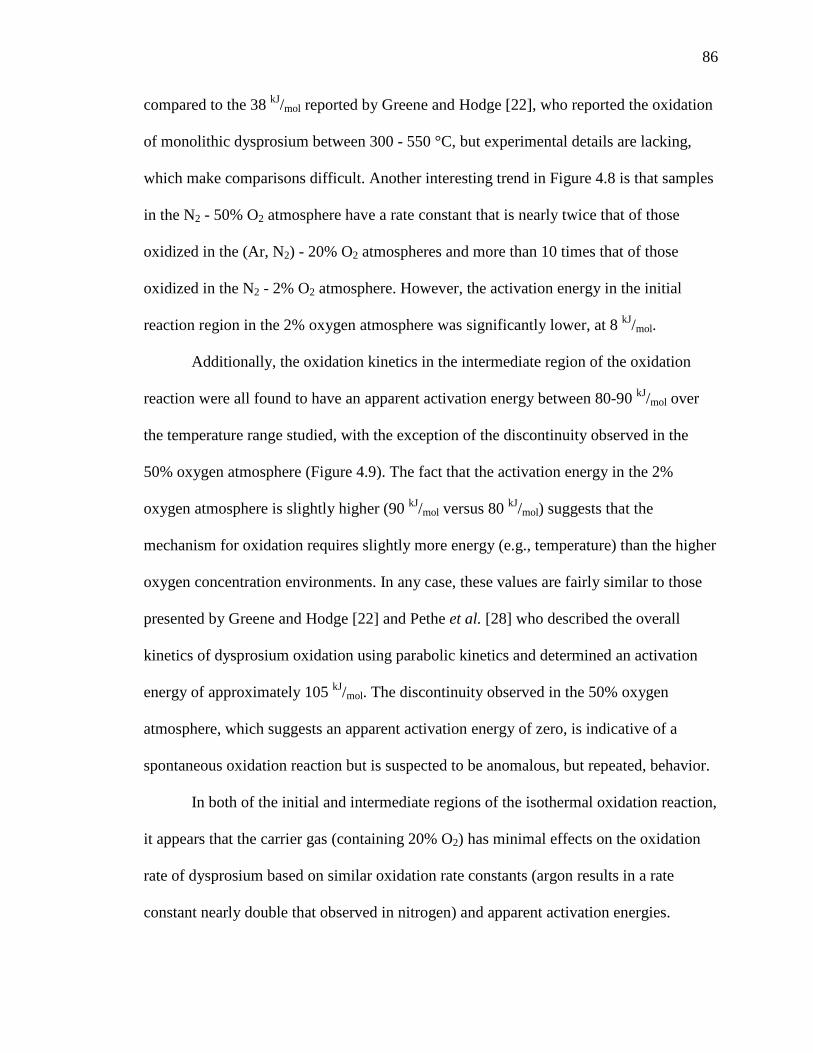
86
compared to the 38 kJ/mol reported by Greene and Hodge [22], who reported the oxidation
of monolithic dysprosium between 300 - 550 °C, but experimental details are lacking,
which make comparisons difficult. Another interesting trend in Figure 4.8 is that samples
in the N2 - 50% O2 atmosphere have a rate constant that is nearly twice that of those
oxidized in the (Ar, N2) - 20% O2 atmospheres and more than 10 times that of those
oxidized in the N2 - 2% O2 atmosphere. However, the activation energy in the initial
reaction region in the 2% oxygen atmosphere was significantly lower, at 8 kJ/mol.
Additionally, the oxidation kinetics in the intermediate region of the oxidation
reaction were all found to have an apparent activation energy between 80-90 kJ/mol over
the temperature range studied, with the exception of the discontinuity observed in the
50% oxygen atmosphere (Figure 4.9). The fact that the activation energy in the 2%
oxygen atmosphere is slightly higher (90 kJ/mol versus 80 kJ/mol) suggests that the
mechanism for oxidation requires slightly more energy (e.g., temperature) than the higher
oxygen concentration environments. In any case, these values are fairly similar to those
presented by Greene and Hodge [22] and Pethe et al. [28] who described the overall
kinetics of dysprosium oxidation using parabolic kinetics and determined an activation
energy of approximately 105 kJ/mol. The discontinuity observed in the 50% oxygen
atmosphere, which suggests an apparent activation energy of zero, is indicative of a
spontaneous oxidation reaction but is suspected to be anomalous, but repeated, behavior.
In both of the initial and intermediate regions of the isothermal oxidation reaction,
it appears that the carrier gas (containing 20% O2) has minimal effects on the oxidation
rate of dysprosium based on similar oxidation rate constants (argon results in a rate
constant nearly double that observed in nitrogen) and apparent activation energies.
87
However, by comparing the non-isothermal oxidation behavior (Figure 4.3) and the
selected isothermal behavior (Figure 4.6), it is clear that the argon carrier gas promotes
more rapid overall oxidation kinetics. This is likely due to the fact that the argon carrier
gas induces a transition into the intermediate stage of oxidation at an earlier reaction
extent (Figure 4.7) than nitrogen atmospheres. Being that the transition occurs at a lower
reaction extent suggests that the initial oxidation layer is thinner, reducing the diffusion
length of the oxygen ions, and resulting in faster kinetics in the intermediate region, as
observed in Table 4.2.
A brief, additional study investigating the effects of gas flow rate on the oxidation
reaction was performed. In the study, the gas flow rate was increased from 100-250 mL/min
in an isothermal oxidation temperature range of 650-850 °C. The intermediate region
reaction rate and the transition reaction extent (Figure 4.7) remained constant, but an
effect on the initial region oxidation rate was observed. Although the trends were similar
for the initial region oxidation rates, the reaction onset occurred more quickly and the rate
of oxidation reaction increased with increased gas flow rate. The findings suggest that
there is a time delay for the furnace reaction chamber to reach the nominal oxygen
concentration of the gas stream. However, the fact that the transition reaction extent
remained constant suggests that a critical volume or surface area must be consumed in
order for the reaction mechanism to change.
To gain insight into the mechanism of dysprosium oxidation, it is helpful to
understand the type of defects present in the oxide. Accordingly, Brouwer diagrams (also
referred to as Kroeger-Vink plots [29]) were constructed in each of the identified
oxidation regions using the three partial pressures of oxygen used to oxidize dysprosium.
88
As seen in Figure 4.10a, the log-log plot in the initial region of oxidation shows a nearly
linear dependence of oxygen partial pressure on the rate constant for each temperature
studied (600 - 800 °C). The slope gradually changes from +3/4 to +1 with increasing
temperature. Due to the positive slopes over the entire range of temperatures, it is
presumed that the oxide behaves as a p-type semiconductor and suggests that the
oxidation mechanism is either due to diffusion of oxygen through interstitial sites or
dysprosium through vacancies. However, the effects of oxygen pressure on the rate
constant in the intermediate region of oxidation is more complicated. As seen in
Figure 4.10b, which also shows nearly linear correlations, the slope changes from +1/5 to
-1/5 from 550 - 850 °C, respectively, with a near zero slope at 750 °C. As was observed
in the initial oxidation region, the positive slope suggests that the oxide acts as a p-type
semiconductor in the lower temperature range and as an n-type semiconductor in the high
temperature range, with competing defects counteracting each other’s charge near
750 °C. An n-type semiconductor suggests that the oxidation mechanism is either due to
diffusion of dysprosium through interstitial sites or oxygen through vacancies. Oxygen
diffusion is more likely due to the very large size of the dysprosium ions. The n-type
behavior was also observed by Tare and Schmalzried [30] from 667 - 860 °C while a later
report by Lal and Gaur [31] suggests that Dy2O3 is a p-type semiconductor at 627 °C with
a 0.011 cm-2V-1s-1 hole mobility and 0.010 cm-2V-1s-1 electron mobility. Pethe et al. [21]
also notes that the parabolic rate constant remains constant (within the experimental
error) from 1-13% O2 at 600 °C. However, it is known that minor concentrations of
impurities in the starting materials can significantly alter the semiconducting behavior of
the oxide. Since impurity concentrations were neither identified nor quantified in
89
previously reported oxidation behavior, comparisons with the work presented here may
not be valid. Further work in this area needs to be completed.
To provide further insight into the mechanism of oxidation, an inert marker
experiment was performed. A thin gold wire was fixed to a monolithic dysprosium
sample, which was subsequently oxidized in N2 - 20% O2 at 650 °C for 45 hours. The
gold marker remained at the oxide/gas interface after oxidation, suggesting that growth
occurs at the metal/oxide interface. This observation is consistent with the work of Pethe
et al. who found similar behavior via an inert (silver) marker experiment at 800 °C. The
results of the marker experiments suggest that when the oxide behaves as a p-type
semiconductor, the primary defect mechanism is most likely the diffusion of oxygen via
dysprosium vacancies in the oxide and when the oxide behaves as an n-type
semiconductor, the primary defect mechanism is likely oxygen diffusion through oxygen
vacancies in the oxide.
4.4 Conclusions
The high temperature oxidation of dysprosium particles in 2 - 50% oxygen
atmospheres in both nitrogen and argon carrier gases was studied from 450 - 1000 °C
using both non-isothermal and isothermal techniques. The results of this study have
identified two distinct regions of oxidation in each of the four atmospheres investigated,
termed the initial and intermediate stages. The reaction rates at 800 °C in the initial
oxidation region in N2 - 2% O2, N2 - 20% O2, Ar - 20% O2, and N2 - 50% O2, were found
using a contracting area model as 10-7*(3.77, 32.8, 31, and 60.2 g2/cm4s), respectively.
The reaction rates at 800 °C in the intermediate oxidation region in N2 - 2% O2, N2 - 20%
O2, Ar - 20% O2, and N2 - 50% O2, were found using the Ginstling-Brounshtein diffusion
90
model as 10-11*(15.5, 17.2, 33.2, and 9.87) g2/cm4s, respectively. The apparent activation
energy was found to be much lower in the initial stages (8 kJ/mol in 2% oxygen and
25 kJ/mol in the 20 and 50% oxygen atmospheres) than in the intermediate stages (80 -
90 kJ/mol).
Insight into the defect mechanism limiting the kinetics of the oxidation reaction
was provided by an inert marker experiment as well as identifying the effects of oxygen
pressure on the kinetics rate constant via Kroeger-Vink diagrams. It was determined that
oxide growth occurs at the metal/oxide interface, most likely via oxygen diffusion. With
the exception of above 750 °C in the intermediate oxidation region, the oxide behaves as
a p-type semiconductor. The conclusion drawn from the evidence provided is that the rate
limiting oxidation mechanism is oxygen diffusion via dysprosium vacancies to grow at
the Dy/Dy2O3 interface. In the cases where the oxide behaves as an n-type
semiconductor, oxidation is primarily rate limited by oxygen ion diffusion via oxygen
vacancies to the Dy/Dy2O3 interface. However, further studies are needed to better
understand the effects of impurity types and concentrations on the semiconducting
properties of the oxide layer.
Acknowledgements
The authors would also like to acknowledge Nicole Leraas and Kelci Lester for
their contributions and helpful discussions.
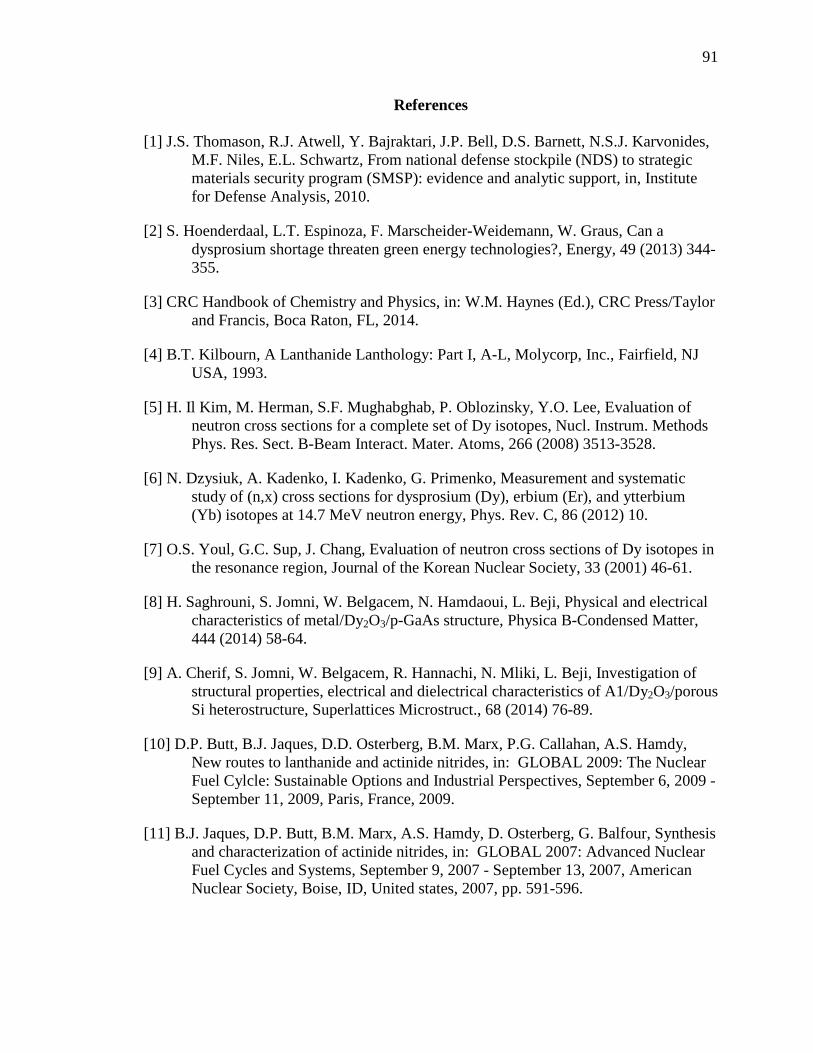
91
References
[1] J.S. Thomason, R.J. Atwell, Y. Bajraktari, J.P. Bell, D.S. Barnett, N.S.J. Karvonides, M.F. Niles, E.L. Schwartz, From national defense stockpile (NDS) to strategic materials security program (SMSP): evidence and analytic support, in, Institute for Defense Analysis, 2010.
[2] S. Hoenderdaal, L.T. Espinoza, F. Marscheider-Weidemann, W. Graus, Can a dysprosium shortage threaten green energy technologies?, Energy, 49 (2013) 344-355.
[3] CRC Handbook of Chemistry and Physics, in: W.M. Haynes (Ed.), CRC Press/Taylor and Francis, Boca Raton, FL, 2014.
[4] B.T. Kilbourn, A Lanthanide Lanthology: Part I, A-L, Molycorp, Inc., Fairfield, NJ USA, 1993.
[5] H. Il Kim, M. Herman, S.F. Mughabghab, P. Oblozinsky, Y.O. Lee, Evaluation of neutron cross sections for a complete set of Dy isotopes, Nucl. Instrum. Methods Phys. Res. Sect. B-Beam Interact. Mater. Atoms, 266 (2008) 3513-3528.
[6] N. Dzysiuk, A. Kadenko, I. Kadenko, G. Primenko, Measurement and systematic study of (n,x) cross sections for dysprosium (Dy), erbium (Er), and ytterbium (Yb) isotopes at 14.7 MeV neutron energy, Phys. Rev. C, 86 (2012) 10.
[7] O.S. Youl, G.C. Sup, J. Chang, Evaluation of neutron cross sections of Dy isotopes in the resonance region, Journal of the Korean Nuclear Society, 33 (2001) 46-61.
[8] H. Saghrouni, S. Jomni, W. Belgacem, N. Hamdaoui, L. Beji, Physical and electrical characteristics of metal/Dy2O3/p-GaAs structure, Physica B-Condensed Matter, 444 (2014) 58-64.
[9] A. Cherif, S. Jomni, W. Belgacem, R. Hannachi, N. Mliki, L. Beji, Investigation of structural properties, electrical and dielectrical characteristics of A1/Dy2O3/porous Si heterostructure, Superlattices Microstruct., 68 (2014) 76-89.
[10] D.P. Butt, B.J. Jaques, D.D. Osterberg, B.M. Marx, P.G. Callahan, A.S. Hamdy, New routes to lanthanide and actinide nitrides, in: GLOBAL 2009: The Nuclear Fuel Cylcle: Sustainable Options and Industrial Perspectives, September 6, 2009 - September 11, 2009, Paris, France, 2009.
[11] B.J. Jaques, D.P. Butt, B.M. Marx, A.S. Hamdy, D. Osterberg, G. Balfour, Synthesis and characterization of actinide nitrides, in: GLOBAL 2007: Advanced Nuclear Fuel Cycles and Systems, September 9, 2007 - September 13, 2007, American Nuclear Society, Boise, ID, United states, 2007, pp. 591-596.
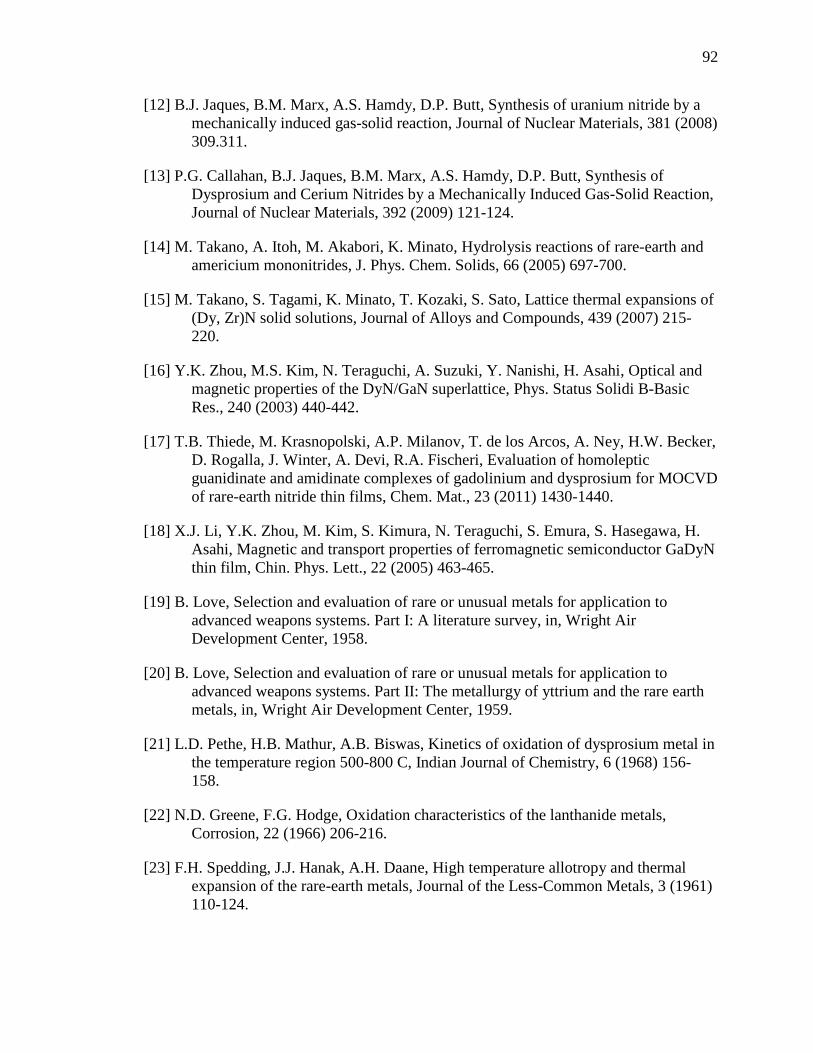
92
[12] B.J. Jaques, B.M. Marx, A.S. Hamdy, D.P. Butt, Synthesis of uranium nitride by a mechanically induced gas-solid reaction, Journal of Nuclear Materials, 381 (2008) 309.311.
[13] P.G. Callahan, B.J. Jaques, B.M. Marx, A.S. Hamdy, D.P. Butt, Synthesis of Dysprosium and Cerium Nitrides by a Mechanically Induced Gas-Solid Reaction, Journal of Nuclear Materials, 392 (2009) 121-124.
[14] M. Takano, A. Itoh, M. Akabori, K. Minato, Hydrolysis reactions of rare-earth and americium mononitrides, J. Phys. Chem. Solids, 66 (2005) 697-700.
[15] M. Takano, S. Tagami, K. Minato, T. Kozaki, S. Sato, Lattice thermal expansions of (Dy, Zr)N solid solutions, Journal of Alloys and Compounds, 439 (2007) 215-220.
[16] Y.K. Zhou, M.S. Kim, N. Teraguchi, A. Suzuki, Y. Nanishi, H. Asahi, Optical and magnetic properties of the DyN/GaN superlattice, Phys. Status Solidi B-Basic Res., 240 (2003) 440-442.
[17] T.B. Thiede, M. Krasnopolski, A.P. Milanov, T. de los Arcos, A. Ney, H.W. Becker, D. Rogalla, J. Winter, A. Devi, R.A. Fischeri, Evaluation of homoleptic guanidinate and amidinate complexes of gadolinium and dysprosium for MOCVD of rare-earth nitride thin films, Chem. Mat., 23 (2011) 1430-1440.
[18] X.J. Li, Y.K. Zhou, M. Kim, S. Kimura, N. Teraguchi, S. Emura, S. Hasegawa, H. Asahi, Magnetic and transport properties of ferromagnetic semiconductor GaDyN thin film, Chin. Phys. Lett., 22 (2005) 463-465.
[19] B. Love, Selection and evaluation of rare or unusual metals for application to advanced weapons systems. Part I: A literature survey, in, Wright Air Development Center, 1958.
[20] B. Love, Selection and evaluation of rare or unusual metals for application to advanced weapons systems. Part II: The metallurgy of yttrium and the rare earth metals, in, Wright Air Development Center, 1959.
[21] L.D. Pethe, H.B. Mathur, A.B. Biswas, Kinetics of oxidation of dysprosium metal in the temperature region 500-800 C, Indian Journal of Chemistry, 6 (1968) 156-158.
[22] N.D. Greene, F.G. Hodge, Oxidation characteristics of the lanthanide metals, Corrosion, 22 (1966) 206-216.
[23] F.H. Spedding, J.J. Hanak, A.H. Daane, High temperature allotropy and thermal expansion of the rare-earth metals, Journal of the Less-Common Metals, 3 (1961) 110-124.
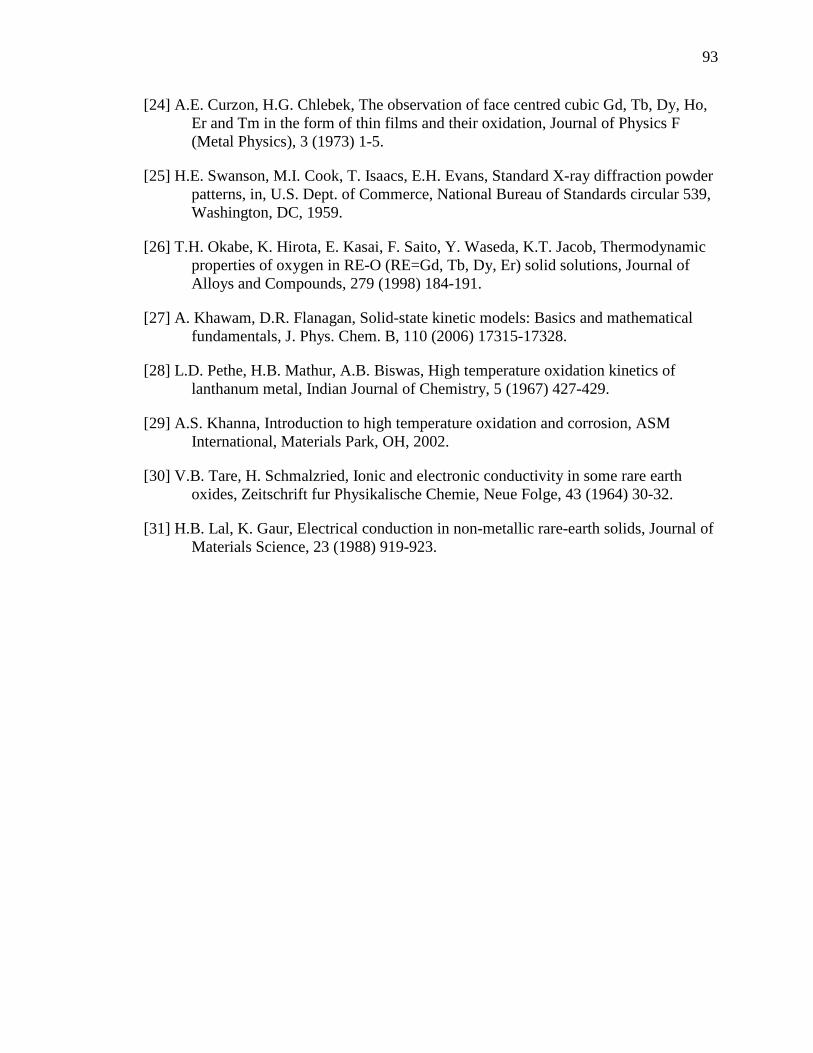
93
[24] A.E. Curzon, H.G. Chlebek, The observation of face centred cubic Gd, Tb, Dy, Ho, Er and Tm in the form of thin films and their oxidation, Journal of Physics F (Metal Physics), 3 (1973) 1-5.
[25] H.E. Swanson, M.I. Cook, T. Isaacs, E.H. Evans, Standard X-ray diffraction powder patterns, in, U.S. Dept. of Commerce, National Bureau of Standards circular 539, Washington, DC, 1959.
[26] T.H. Okabe, K. Hirota, E. Kasai, F. Saito, Y. Waseda, K.T. Jacob, Thermodynamic properties of oxygen in RE-O (RE=Gd, Tb, Dy, Er) solid solutions, Journal of Alloys and Compounds, 279 (1998) 184-191.
[27] A. Khawam, D.R. Flanagan, Solid-state kinetic models: Basics and mathematical fundamentals, J. Phys. Chem. B, 110 (2006) 17315-17328.
[28] L.D. Pethe, H.B. Mathur, A.B. Biswas, High temperature oxidation kinetics of lanthanum metal, Indian Journal of Chemistry, 5 (1967) 427-429.
[29] A.S. Khanna, Introduction to high temperature oxidation and corrosion, ASM International, Materials Park, OH, 2002.
[30] V.B. Tare, H. Schmalzried, Ionic and electronic conductivity in some rare earth oxides, Zeitschrift fur Physikalische Chemie, Neue Folge, 43 (1964) 30-32.
[31] H.B. Lal, K. Gaur, Electrical conduction in non-metallic rare-earth solids, Journal of Materials Science, 23 (1988) 919-923.
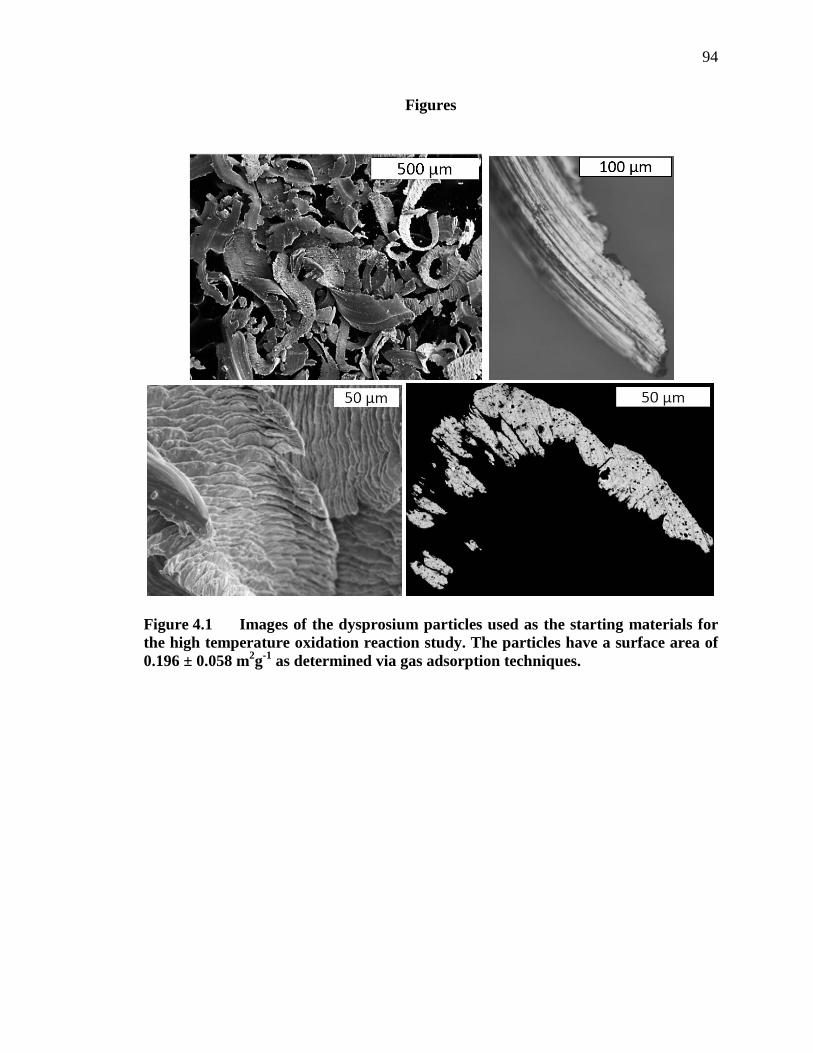
94
Figures
Figure 4.1 Images of the dysprosium particles used as the starting materials for the high temperature oxidation reaction study. The particles have a surface area of 0.196 ± 0.058 m2g-1 as determined via gas adsorption techniques.
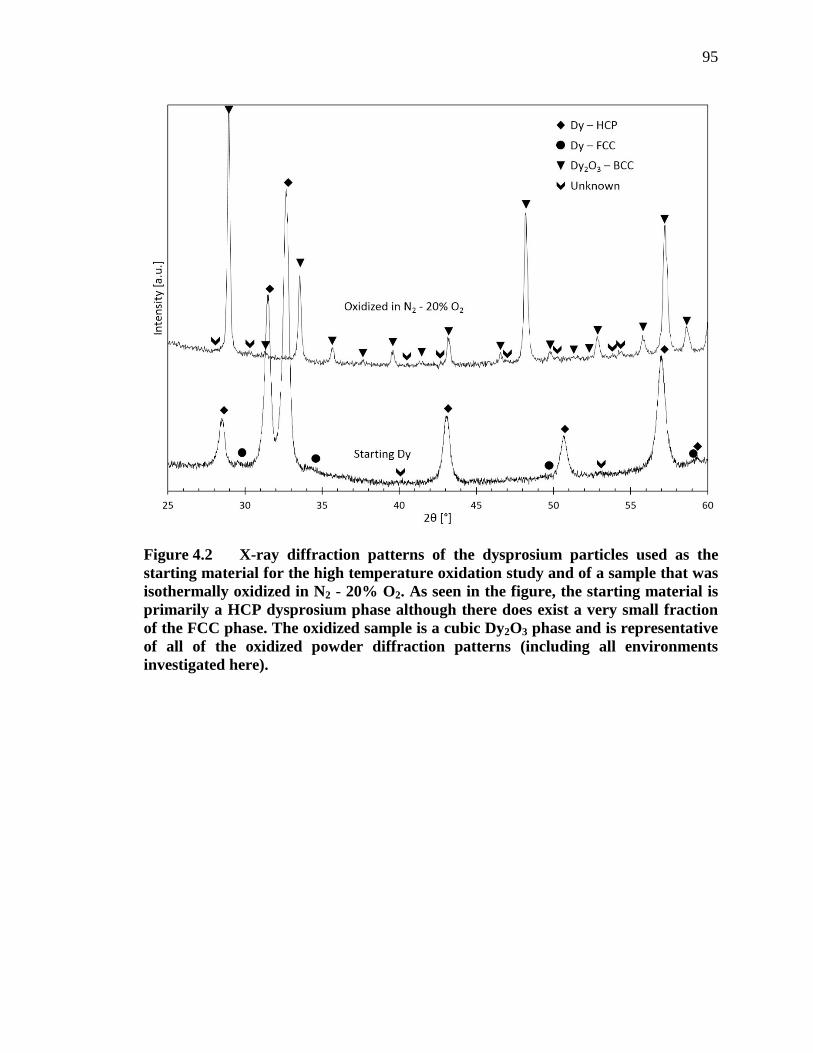
95
Figure 4.2 X-ray diffraction patterns of the dysprosium particles used as the starting material for the high temperature oxidation study and of a sample that was isothermally oxidized in N2 - 20% O2. As seen in the figure, the starting material is primarily a HCP dysprosium phase although there does exist a very small fraction of the FCC phase. The oxidized sample is a cubic Dy2O3 phase and is representative of all of the oxidized powder diffraction patterns (including all environments investigated here).
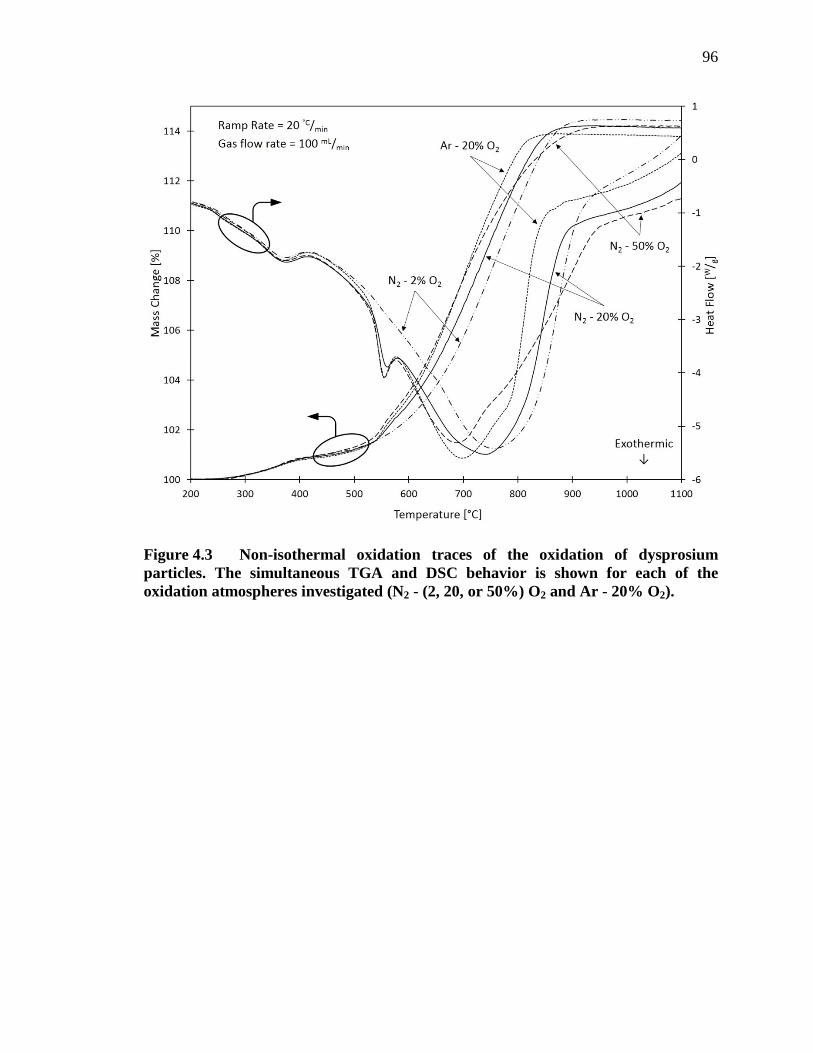
96
Figure 4.3 Non-isothermal oxidation traces of the oxidation of dysprosium particles. The simultaneous TGA and DSC behavior is shown for each of the oxidation atmospheres investigated (N2 - (2, 20, or 50%) O2 and Ar - 20% O2).
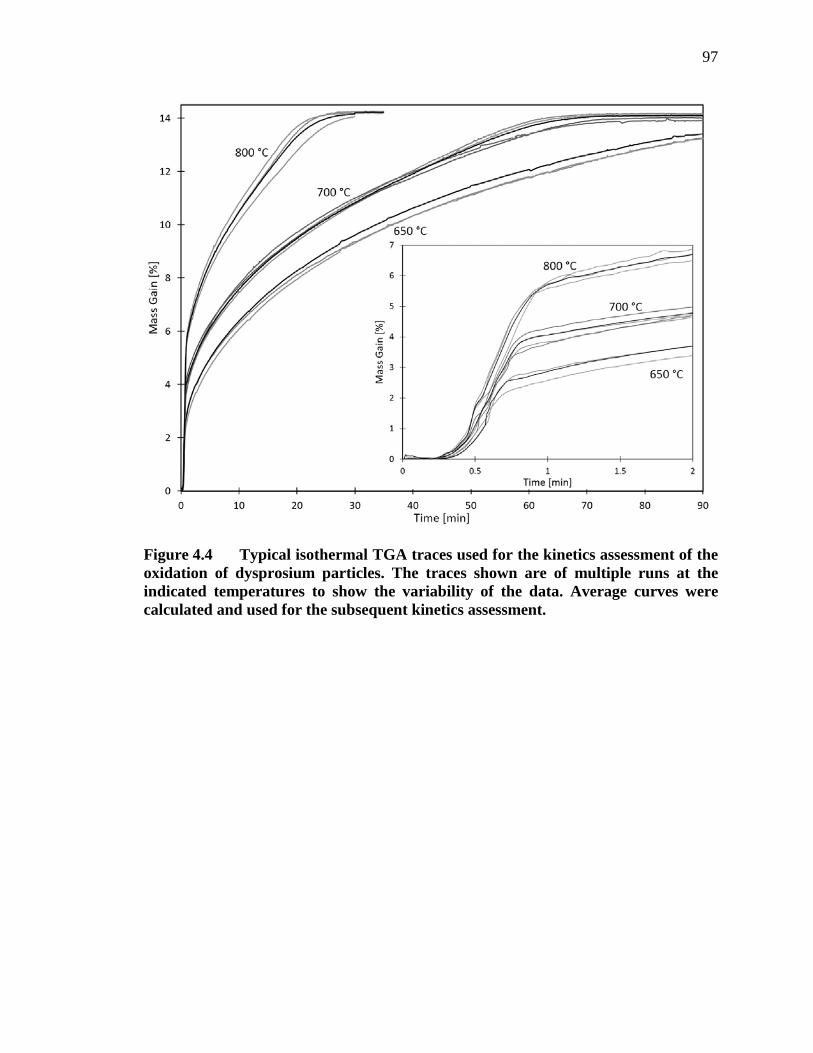
97
Figure 4.4 Typical isothermal TGA traces used for the kinetics assessment of the oxidation of dysprosium particles. The traces shown are of multiple runs at the indicated temperatures to show the variability of the data. Average curves were calculated and used for the subsequent kinetics assessment.
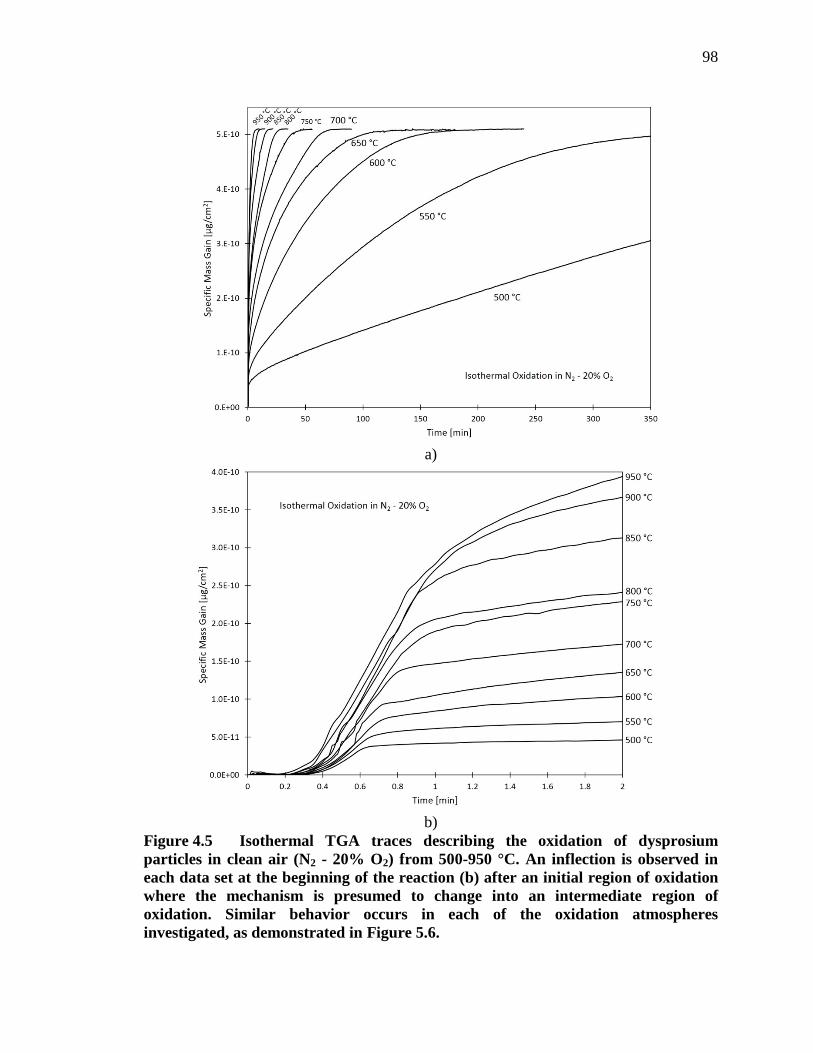
98
a)
b)
Figure 4.5 Isothermal TGA traces describing the oxidation of dysprosium particles in clean air (N2 - 20% O2) from 500-950 °C. An inflection is observed in each data set at the beginning of the reaction (b) after an initial region of oxidation where the mechanism is presumed to change into an intermediate region of oxidation. Similar behavior occurs in each of the oxidation atmospheres investigated, as demonstrated in Figure 5.6.
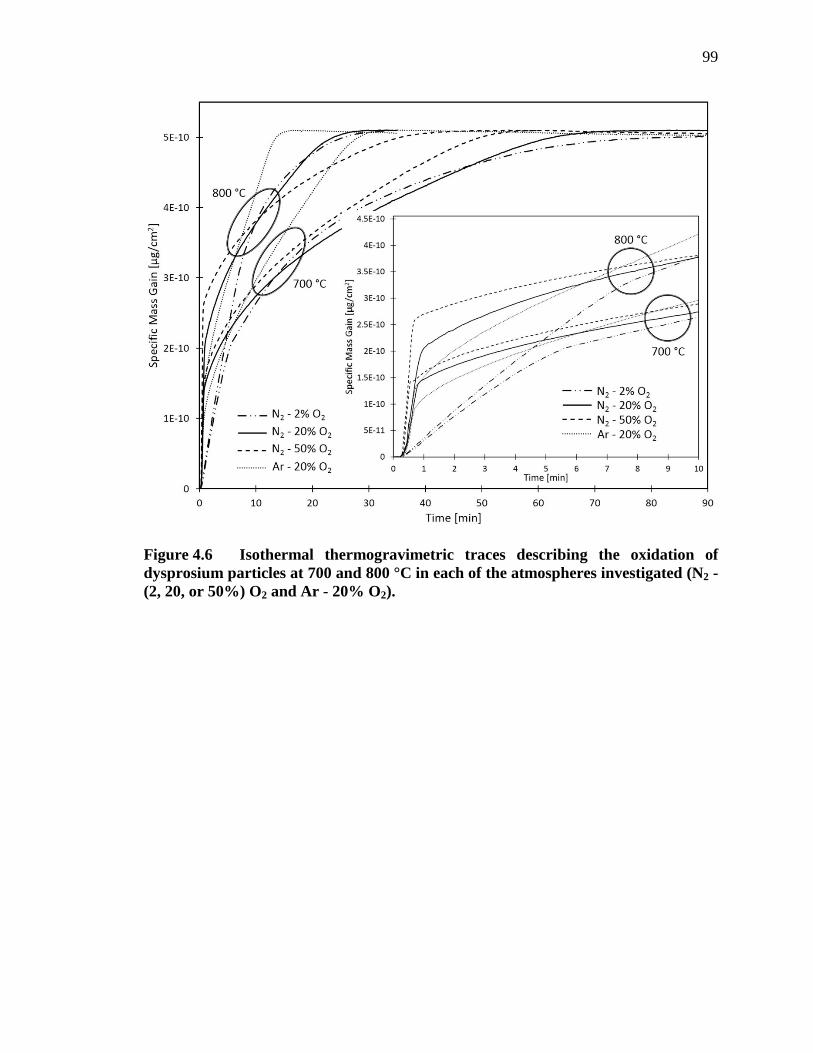
99
Figure 4.6 Isothermal thermogravimetric traces describing the oxidation of dysprosium particles at 700 and 800 °C in each of the atmospheres investigated (N2 - (2, 20, or 50%) O2 and Ar - 20% O2).
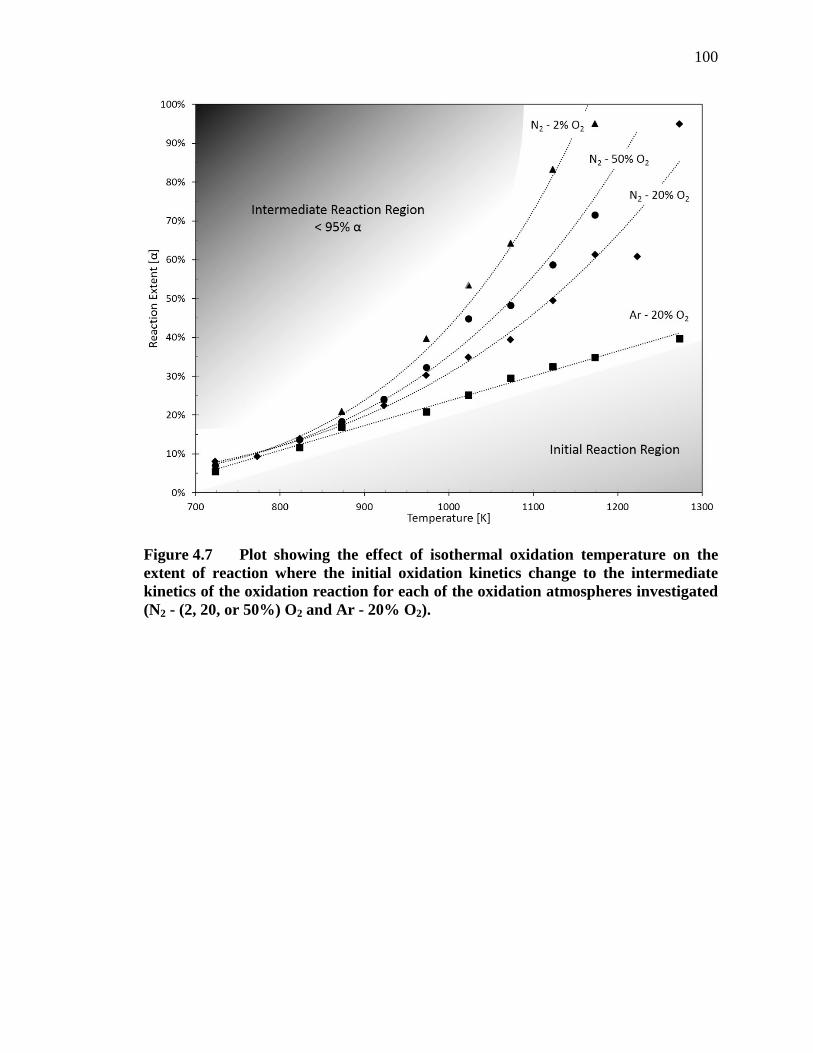
100
Figure 4.7 Plot showing the effect of isothermal oxidation temperature on the extent of reaction where the initial oxidation kinetics change to the intermediate kinetics of the oxidation reaction for each of the oxidation atmospheres investigated (N2 - (2, 20, or 50%) O2 and Ar - 20% O2).
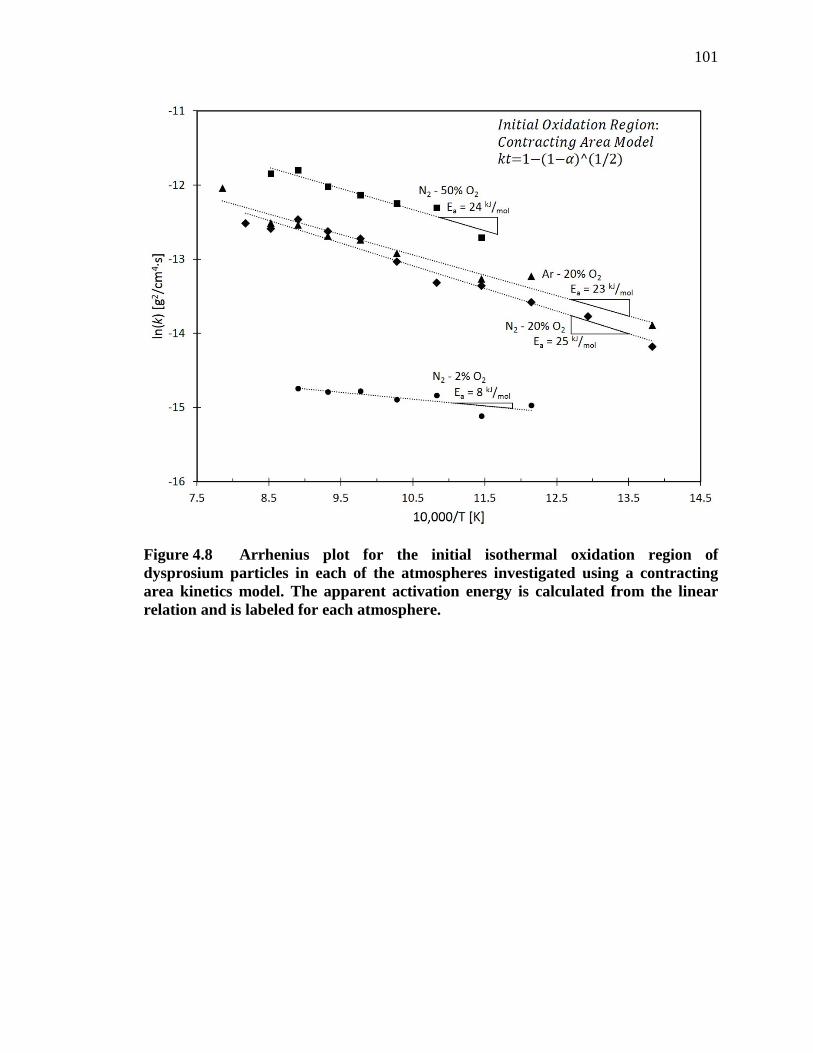
101
Figure 4.8 Arrhenius plot for the initial isothermal oxidation region of dysprosium particles in each of the atmospheres investigated using a contracting area kinetics model. The apparent activation energy is calculated from the linear relation and is labeled for each atmosphere.
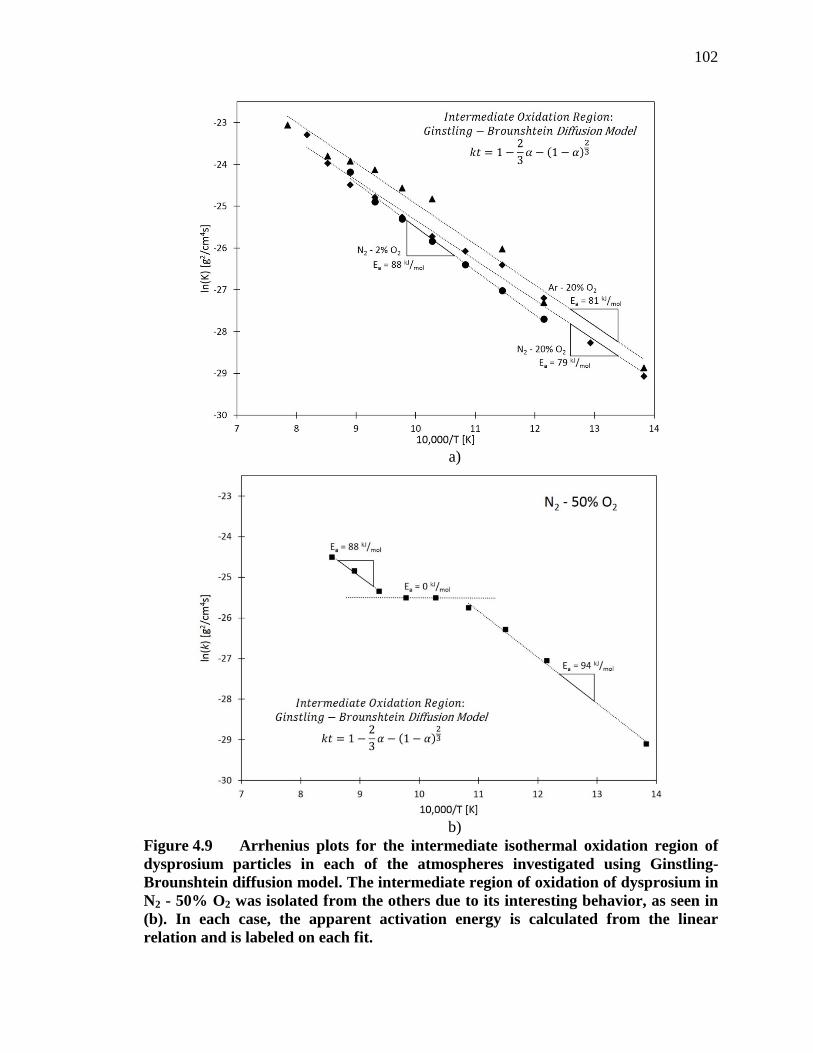
102
a)
b)
Figure 4.9 Arrhenius plots for the intermediate isothermal oxidation region of dysprosium particles in each of the atmospheres investigated using Ginstling-Brounshtein diffusion model. The intermediate region of oxidation of dysprosium in N2 - 50% O2 was isolated from the others due to its interesting behavior, as seen in (b). In each case, the apparent activation energy is calculated from the linear relation and is labeled on each fit.
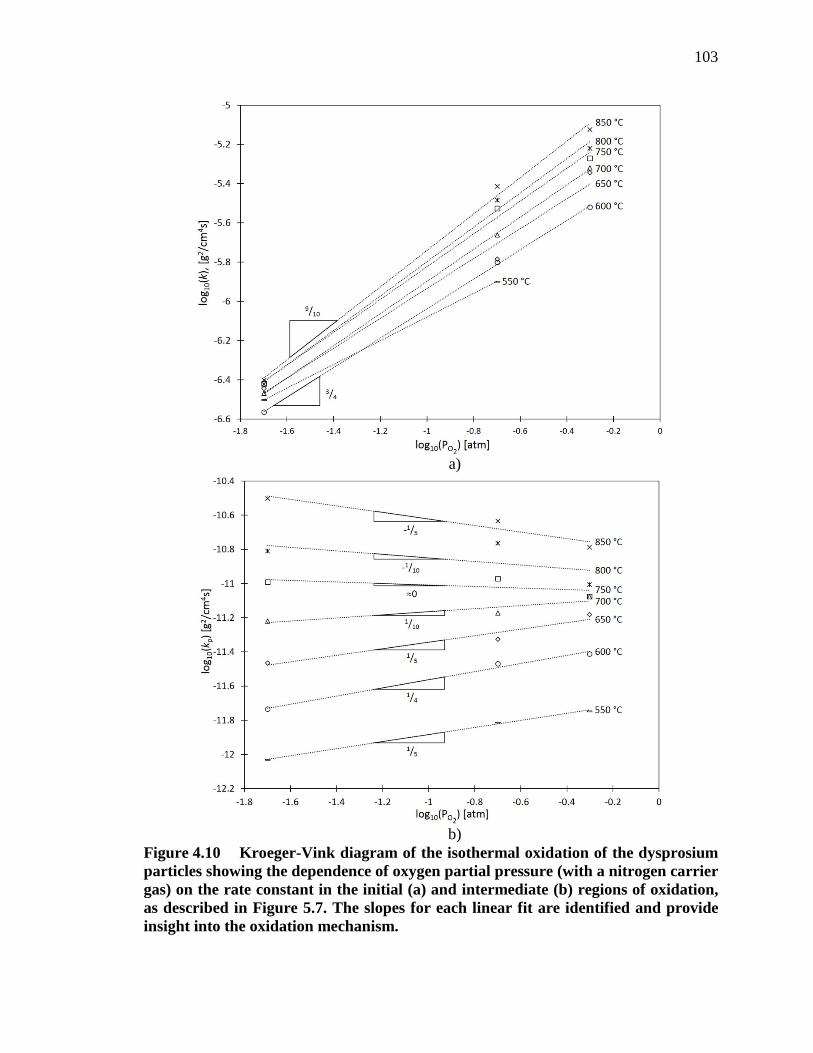
103
a)
b)
Figure 4.10 Kroeger-Vink diagram of the isothermal oxidation of the dysprosium particles showing the dependence of oxygen partial pressure (with a nitrogen carrier gas) on the rate constant in the initial (a) and intermediate (b) regions of oxidation, as described in Figure 5.7. The slopes for each linear fit are identified and provide insight into the oxidation mechanism.
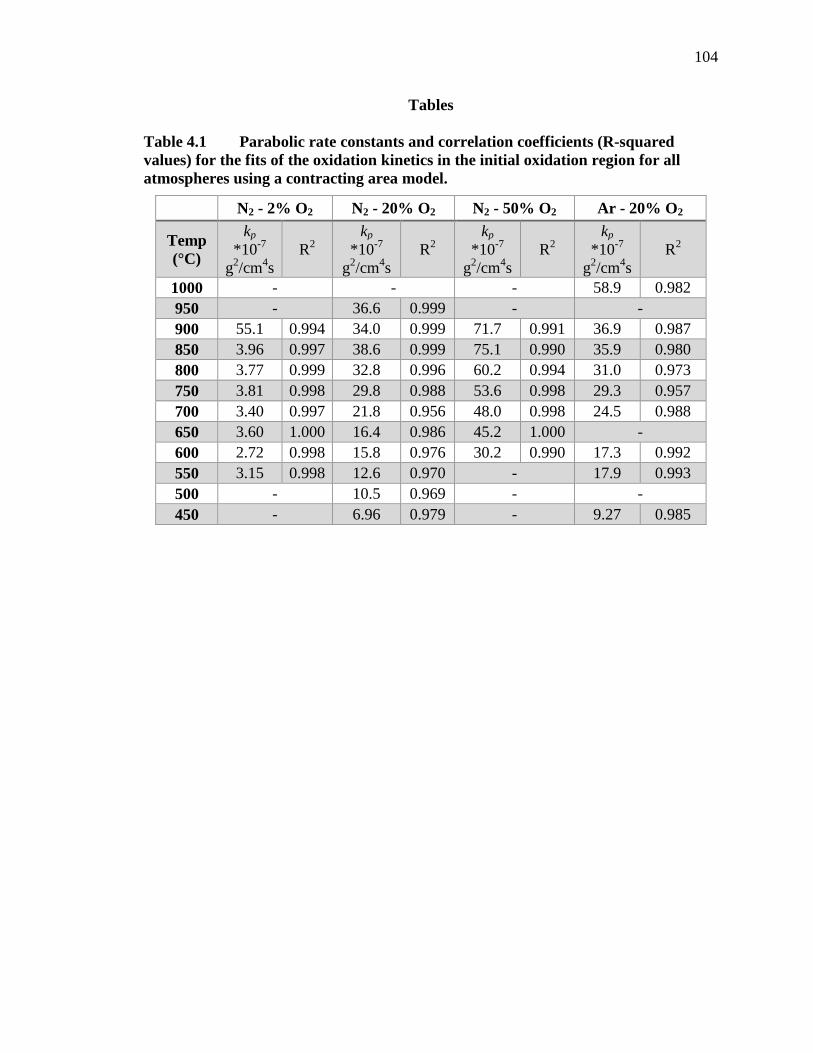
104
Tables
Table 4.1 Parabolic rate constants and correlation coefficients (R-squared values) for the fits of the oxidation kinetics in the initial oxidation region for all atmospheres using a contracting area model.
N2 - 2% O2 N2 - 20% O2 N2 - 50% O2 Ar - 20% O2
Temp (°C)
kp *10-7
g2/cm4s R2
kp *10-7
g2/cm4s R2
kp *10-7
g2/cm4s R2
kp *10-7
g2/cm4s R2
1000 - - - 58.9 0.982 950 - 36.6 0.999 - - 900 55.1 0.994 34.0 0.999 71.7 0.991 36.9 0.987 850 3.96 0.997 38.6 0.999 75.1 0.990 35.9 0.980 800 3.77 0.999 32.8 0.996 60.2 0.994 31.0 0.973 750 3.81 0.998 29.8 0.988 53.6 0.998 29.3 0.957 700 3.40 0.997 21.8 0.956 48.0 0.998 24.5 0.988 650 3.60 1.000 16.4 0.986 45.2 1.000 - 600 2.72 0.998 15.8 0.976 30.2 0.990 17.3 0.992 550 3.15 0.998 12.6 0.970 - 17.9 0.993 500 - 10.5 0.969 - - 450 - 6.96 0.979 - 9.27 0.985
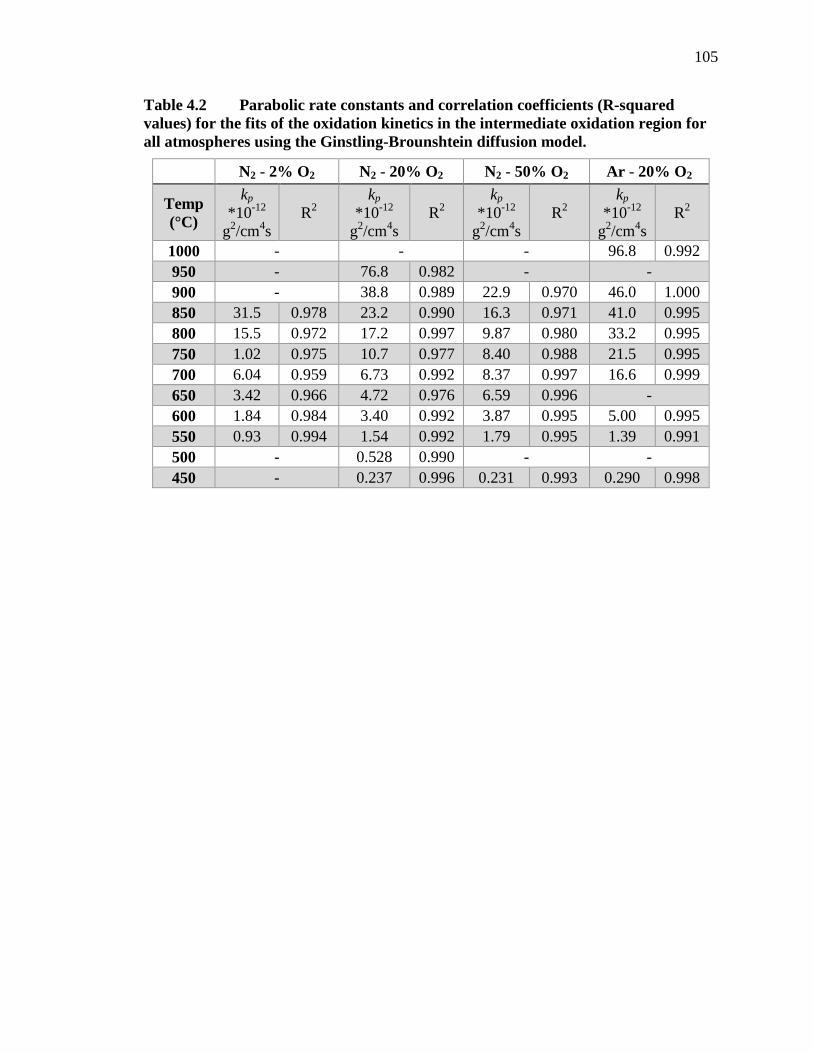
105
Table 4.2 Parabolic rate constants and correlation coefficients (R-squared values) for the fits of the oxidation kinetics in the intermediate oxidation region for all atmospheres using the Ginstling-Brounshtein diffusion model.
N2 - 2% O2 N2 - 20% O2 N2 - 50% O2 Ar - 20% O2
Temp (°C)
kp *10-12
g2/cm4s R2
kp *10-12
g2/cm4s R2
kp *10-12
g2/cm4s R2
kp *10-12
g2/cm4s R2
1000 - - - 96.8 0.992 950 - 76.8 0.982 - - 900 - 38.8 0.989 22.9 0.970 46.0 1.000 850 31.5 0.978 23.2 0.990 16.3 0.971 41.0 0.995 800 15.5 0.972 17.2 0.997 9.87 0.980 33.2 0.995 750 1.02 0.975 10.7 0.977 8.40 0.988 21.5 0.995 700 6.04 0.959 6.73 0.992 8.37 0.997 16.6 0.999 650 3.42 0.966 4.72 0.976 6.59 0.996 - 600 1.84 0.984 3.40 0.992 3.87 0.995 5.00 0.995 550 0.93 0.994 1.54 0.992 1.79 0.995 1.39 0.991 500 - 0.528 0.990 - - 450 - 0.237 0.996 0.231 0.993 0.290 0.998
106
CHAPTER FIVE: CONCLUSIONS
Unlike traditional Materials Science and Engineering dissertations, the work
presented in the preceding chapters encompasses diverse reactions in multiple materials
systems; however, the commonality between each chapter is a discussion and
understanding of a form of chemical reaction kinetics. This dissertation displays a broad
understanding of the effects of atmosphere, time, and energy input (thermal and
mechanical) in various gas-solid and solid-solid reactions. Accordingly, Chapter Two
presents work in which mechanical energy is used to synthesize a high temperature
ceramic, DyN and Chapters Three and Four both present work in which thermal energy is
used to form high temperature ceramics (UN and Dy2O3, respectively). Additionally in
Chapter Three, the effects of thermal energy and atmosphere on solid-solid reaction
kinetics in the sintering UN and UN-UO2 composites were investigated. The perceived
understanding of gas-solid and solid-solid reaction kinetics presented in each chapter
were also noteworthy contributions to the scientific community and warranted
communication in peer-reviewed journal publications. Although each chapter (and
publication) presents inclusive conclusions, this section is aimed to demonstrate
commonality.
Chapters Two and Four both present gas-solid interactions between dysprosium
and a non-metal, nitrogen and oxygen, respectively. Although possessing desirable
attributes for many industrial applications, the behavior of dysprosium and dysprosium

107
compounds in any environment is not well documented in the literature and very limited
thermodynamic data is available. Not only is the behavior of dysprosium in the presence
of nitrogen investigated in Chapter Two, but the kinetics of a novel gas-solid synthesis
technique is presented. Unlike traditional gas-solid reaction studies, mechanical energy
was provided by a planetary ball mill to allow the reaction to proceed. The kinetics of the
reaction were monitored using in situ temperature and pressure data to calculate the
nitrogen consumption, which to the best of the author’s knowledge has never been
presented for any element in the literature to date. Additionally, the dysprosium-nitrogen
system is an excellent system to deduce milling effects during reactive milling since no
known intermediate phases to DyN exist. From the work presented in Chapter Two and
the Appendix, the rate of the nitridation reaction of dysprosium is presumed to be limited
by the creation of fresh, reactive surfaces that catalyze the dissociation of diatomic
nitrogen and allow for the spontaneous formation of DyN. The rate of creation of such
fresh surfaces can be controlled by the milling intensity or the number of media, which
are both related to the number of impacts per unit time.
Similar to Chapter Two, Chapter Four focuses on the behavior of dysprosium in
the presence a non-metal. However, Chapter Four uses thermal energy to allow the
oxidation reaction to proceed rather than mechanical energy. The high temperature
oxidation of dysprosium was studied in 2 - 50% oxygen atmospheres in both nitrogen and
argon carrier gases at temperatures ranging from 450 - 1000 °C. The gas-solid reaction
kinetics were monitored using in situ mass changes collected by a simultaneous thermal
analzyer. The results of this study have identified two distinct regions of oxidation in
each of the four atmospheres investigated, termed the initial and intermediate stages. The
108
kinetics of the gas-solid reaction in the initial and intermediate oxidation regions were
best described using a contracting area model and a Ginstling-Brounshtein diffusion
model, respectively. The parabolic rate constants were extracted and used to find
apparent activation energies to be much lower in the initial regions (8 - 25 kJ/mol) than in
the intermediate regions (80 - 90 kJ/mol). Additionally, insight into the defect mechanism
limiting the kinetics of the oxidation reaction was inferred from the combination of an
inert marker experiment and the dependence of oxide growth rate on oxygen pressure
(Kroger-Vink plots). It was determined that oxide growth occurs at the metal/oxide
interface, most likely via oxygen diffusion. With the exception of above 750 °C in the
intermediate oxidation region, the oxide behaves as a p-type semiconductor. The
conclusion drawn from the evidence provided is that the rate limiting oxidation
mechanism is oxygen diffusion via dysprosium vacancies to grow at the Dy/Dy2O3
interface. In the cases where the oxide behaves as an n-type semiconductor, oxidation is
primarily rate limited by oxygen ion diffusion via oxygen vacancies to the Dy/Dy2O3
interface. However, further studies are needed to better understand the effects of impurity
types and concentrations on the semiconducting properties of the oxide layer.
Similar to Chapters Two and Four, Chapter Three presents a reaction between a
metal and non-metal in a gas-solid reaction resulting in a ceramic powder. However, the
difference being that thermal energy (rather than mechanical energy) is used to form a
nitride (rather than an oxide). Accordingly, Chapter Three presents a reaction between
uranium and nitrogen, forming UN, prior to sintering into a dense accident-tolerant fuel
pellet. Although the thermal treatment was more complicated than that presented in
Chapter Four, the overall reaction was similar. High purity UN was synthesized using a
109
hydride-dehydride-nitride synthesis route at high temperatures in various atmospheres
consisting of hydrogen and nitrogen. The resulting UN powder was blended with 0, 5,
and 10 w% UO2 in a planetary ball mill creating a homogeneous and pyrophoric
composite powder. Even the consolidated, green pellets were pyrophoric and prone to
rapid oxidation upon exposure to air. UN and UO2 composite pellets were sintered at
1900 °C for 5 hours in UHP-Ar, Ar - 100 ppm N2 and Ar - 1 at% N2 to gain insight into
the effects of nitrogen on the stability of the nitride phases and distribution of oxides.
Sintering in UHP-Ar resulted in a coring effect in which UN was dissociated to elemental
uranium at grain boundaries, resulting in pronounced liquid-phase sintering and increased
densification around the perimeter of the UN pellet. The addition of small amounts of
UO2 as well as nominally increased nitrogen in the sintering atmosphere resulted in finer
microstructure, including nitride grains, oxide grains, and pores. Further studies were
performed to assess the effects of sintering temperature in Ar - 100 ppm N2 from 1700 -
2000 °C. In each case, U-O grains were homogenously distributed throughout the pellet
microstructure and existed primarily on UN grain boundaries. Increasing UO2 additions
resulted in microstructure coarsening, as did the sintering temperature. Higher sintering
temperatures also resulted in lower sintered densities, presumably due to a preferential
formation of oxygen-stabilized nitrides or uranium oxynitrides. The work presented in
Chapter Three demonstrates a viable synthesis process for fabricating carbon free UN-
UO2 accident tolerant fuels for the current fleet of LWRs. Although a new fuel concept
has been developed, there is a lengthy process in order to demonstrate its improved
accident tolerance. Further work must be completed to determine if controlled UO2
additions enhance the accident tolerance of UN to high temperature oxygen and steam

110
exposures while maintaining thermophysical properties comparable or better than the
benchmark LWR fuel, UO2.
111
APPENDIX
Kinetics of the Nitridation of Dysprosium during Mechanochemical Processing
112
Kinetics of the Nitridation of Dysprosium during Mechanochemical Processing
This Appendix is published by Elsevier in Journal of Alloys and Compounds and should
be referenced appropriately.
Reference:
G. A. Alanko. D. D. Osterberg, B. J. Jaques, M. F. Hurley, D. P. Butt, “Kinetics of the
nitridation of dysprosium during mechanochemical processing.” Journal of Alloys and
Compounds. 620 413-420 (2015).
Reproduced/modified by permission of Elsevier.
*This chapter includes modifications from the originally published version.

113
Kinetics of the Nitridation of Dysprosium
During Mechanochemical Processing
Gordon A. Alankoa
Daniel D. Osterberga
Brian J. Jaquesa
Michael F. Hurleya,b
Darryl P. Butta,b
Accepted for publication in:
Journal of Alloys and Compounds
January 2015
aDepartment of Materials Science and Engineering, Boise State University,
1910 University Drive, Boise, ID 83725.
bCenter for Advanced Energy Studies,
995 University Blvd, Idaho Falls, ID 83415.
114
Abstract
Dysprosium nitride was synthesized by the reactive milling of the rare earth metal
under 400 kPa nitrogen gas in a planetary ball mill. The nitrogen consumption rate was
calculated from in situ temperature and pressure measurements to find the reaction extent
as a function of milling time at milling speeds from 350-650 rpm. The results are
analyzed in terms of a fundamental milling dynamics model in which the input milling
energy is the primary driving force for reaction and the rate limiting step of the
nitridation kinetics is the formation of chemically active surfaces. The model differs from
traditional gas-solid reactions, which are often limited by diffusion of a species through a
surface layer or by dissociation of the gas molecule. These results give fresh insight into
reactive gas-solid milling kinetics.
Keywords: mechanochemistry; nitrides; rare earths; high energy ball milling; reaction
kinetics

115
A.1 Introduction
Reactive milling is an adaptation of the high-energy ball milling techniques that
have been used for materials processing for some 50 years [1]. In reactive milling,
sometimes termed mechanochemical synthesis, the system is designed to use the energy
imparted by the milling tools to assist in driving a chemical reaction. The reaction may be
solid-solid, solid-liquid, or solid-gas. The latter is often applied in studies of hydrogen
storage materials [2-4]. There has been some work done describing the kinetics of gas-
solid reactions during reactive milling, in which observed kinetics have included
nucleation accelerated by grain refinement in transition metal-doped MgH2 [3],
autocatalysis/self-propagation in Zr and Hf hydrides [4], and nucleation and growth in
HfN [5], ZrN [6], and ZrO2/ZrC [7, 8]. While many closed-form analytical models have
been developed to describe the mechanical energy imparted during high energy milling
[9-14], very few reactive milling investigations explicitly consider this energy while
discussing reaction kinetics, and to the best of the author’s knowledge no investigation
has analyzed how the rate of energy transfer could change during reactive milling.
Reactive milling is interesting from both a fundamental standpoint and with a
view to applications, as the self-contained, low temperature nature of the process could
enable the synthesis of many materials that are difficult or hazardous to prepare [15-17]
as well as reducing the environmental impact of synthesis [18].
A.1.1 Dysprosium and Dysprosium Nitride
Dysprosium, like the other rare earth metals, displays extreme reactivity on fresh
surfaces with most gasses [19, 20]. An X-ray photoelectron spectroscopy study of the

116
reaction of nitrogen on clean dysprosium demonstrated that nitrogen dissociatively
chemisorbs with the formation of one or two monolayers of nitride at 300 K [21]. Gas
phase reactions arrested in frozen argon provide evidence for direct scisson of the N≡N
bond by adjacent dysprosium atoms and do not indicate high complexation of the nitride
by molecular nitrogen [22]. Similar behavior is observed for the early lanthanides [23] in
contrast to the higher tendency of light transition [24] and some actinide [25] metals and
nitrides to complex molecular nitrogen. Although the kinetics of the dysprosium
nitridation reaction have not yet been reported in any detail, the demonstrated tendency
for dissociative chemisorption over physisorption or dissolution of nitrogen suggests that
the rate limiting step in the nitridation process will be either gas transport to the metal or
through the nitride. This makes DyN an interesting model system for a reactive milling
study: since milling is widely understood to break up and disperse surface films, nitride
formation during reactive milling under a high nitrogen pressure might be expected to be
kinetically limited by the formation of fresh chemically active surfaces rather than by
transport mechanisms or nitrogen dissociation. A schematic of this proposed process is
found in Fig. A.1a-c. The impact event diagrammed in Fig. A.1d is analyzed in terms of a
kinematic model in order to determine the energy available for material refinement.
A.1.2 Ball Milling Modeling
The planetary ball milling model developed by Chattopadhay et al. [14] was used
as a starting point for analysis of milling mechanics. The model includes assumptions that
limit the applicability to the stochastic process of ball milling. Modeled media move in a
no-slip condition, being governed by the normal force while “attached” to the vessel wall,
by rigid body mechanics while not attached, and stick without slip on impact. Modeled
117
impact is described by Hertzian mechanics [26] and assumes perfectly elastic impacts
rather than the elastic-plastic behavior found in real milling systems. Even considering
these limitations, the milling model provides a helpful point of reference and was
employed to extract the angular frequency dependencies of various process variables. The
physical constants of the planetary ball mill and milling media used are provided in Table
A.1, and the dependencies of impact conditions on milling speed are summarized in
Table A.2. The kinetics analysis considered here is specific to counterrevolving planetary
ball mills, although the analysis could be extended to other high-energy mill geometries
by modifying the model.
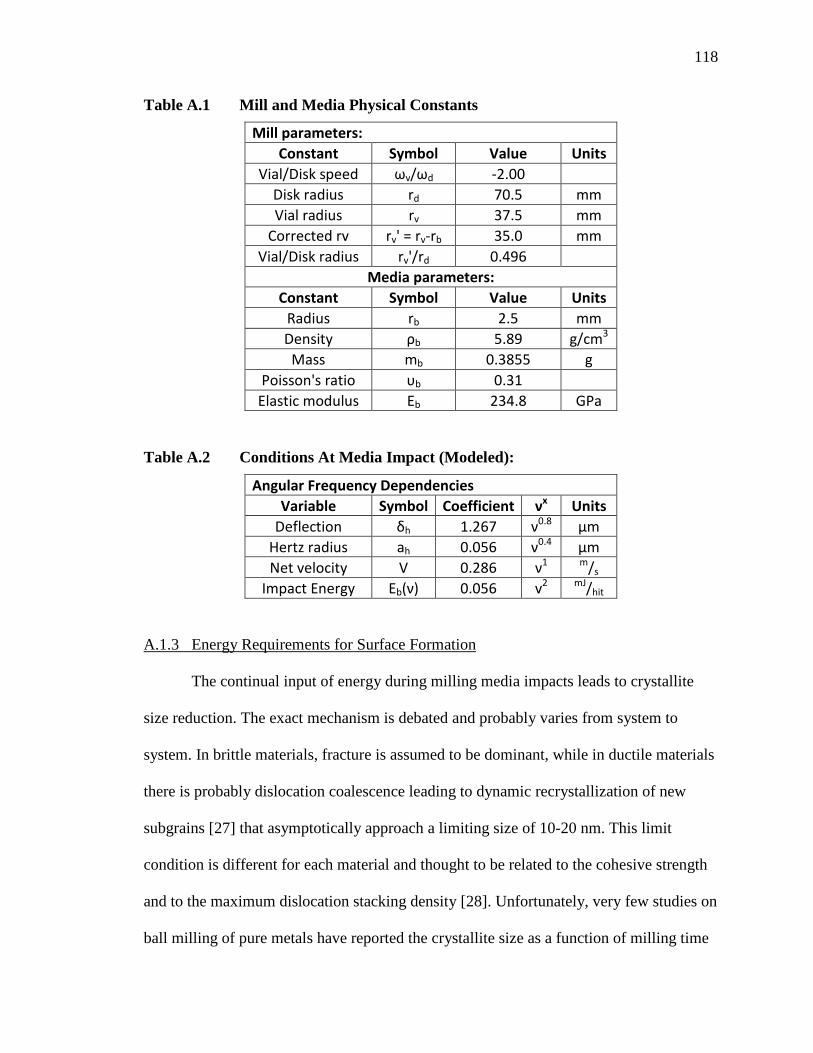
118
Table A.1 Mill and Media Physical Constants
Mill parameters: Constant Symbol Value Units
Vial/Disk speed ωv/ωd -2.00 Disk radius rd 70.5 mm Vial radius rv 37.5 mm
Corrected rv rv' = rv-rb 35.0 mm Vial/Disk radius rv'/rd 0.496
Media parameters: Constant Symbol Value Units
Radius rb 2.5 mm Density ρb 5.89 g/cm3
Mass mb 0.3855 g Poisson's ratio υb 0.31
Elastic modulus Eb 234.8 GPa
Table A.2 Conditions At Media Impact (Modeled):
Angular Frequency Dependencies Variable Symbol Coefficient νx Units
Deflection δh 1.267 ν0.8 µm Hertz radius ah 0.056 ν0.4 µm Net velocity V 0.286 ν1 m/s
Impact Energy Eb(ν) 0.056 v2 mJ/hit
A.1.3 Energy Requirements for Surface Formation
The continual input of energy during milling media impacts leads to crystallite
size reduction. The exact mechanism is debated and probably varies from system to
system. In brittle materials, fracture is assumed to be dominant, while in ductile materials
there is probably dislocation coalescence leading to dynamic recrystallization of new
subgrains [27] that asymptotically approach a limiting size of 10-20 nm. This limit
condition is different for each material and thought to be related to the cohesive strength
and to the maximum dislocation stacking density [28]. Unfortunately, very few studies on
ball milling of pure metals have reported the crystallite size as a function of milling time
119
[29, 30], while most studies report only ending crystallite size. The reduction of
dimension with increasing milling energy dose is a well known relationship in mineral
processing typically represented by the empirical laws of Rittinger, Kick, or Bond, which
were proposed by Hukki [31] to be approximations to a size-dependent energy
consumption of the general form:
𝑑𝐸 = −𝐶 𝑑𝑥𝑥𝑓(𝑥) (1)
where x is the critical dimension of a comminuted material, C is a material constant, and
f(x) describes some dependence of dE on the current size. Rittinger’s law makes the
approximation f(x) = 2 in Eq. 1 and predicts the energy required for size reduction in very
small (< 10 μm) particles to be proportional to the area of new surface created. Fractal
analysis has suggested f(x) = 2.3 + x ln(x) with x measured in micrometers [32]. Thus,
reactions in milled systems that are kinetically limited by surface formation or surface
reactions should be expected to display a linear or nearly linear dependence on the
mechanical energy imparted to the reacting material.
Closed form milling theory based on Hertzian contact solutions generally assumes
completely elastic impacts, although the obtained solutions are sometimes modified by a
constant scalar to correct for an assumed value of the coefficient of restitution CR. In the
case of normal impact with negligible spin, the energy state of the media after impact
may be described solely by CR = vf/vi, 0 ≤ CR ≤ 1. A value of 1 indicates a completely
elastic impact as described by Hertzian impact theory, while a value of 0 represents
completely plastic impact. In high energy milling, both theory and experiment call for
values in the range 0.5-0.9. In general, the value of CR for a given media at a given
moment depends on the thickness of material coating the media (and thus the volume
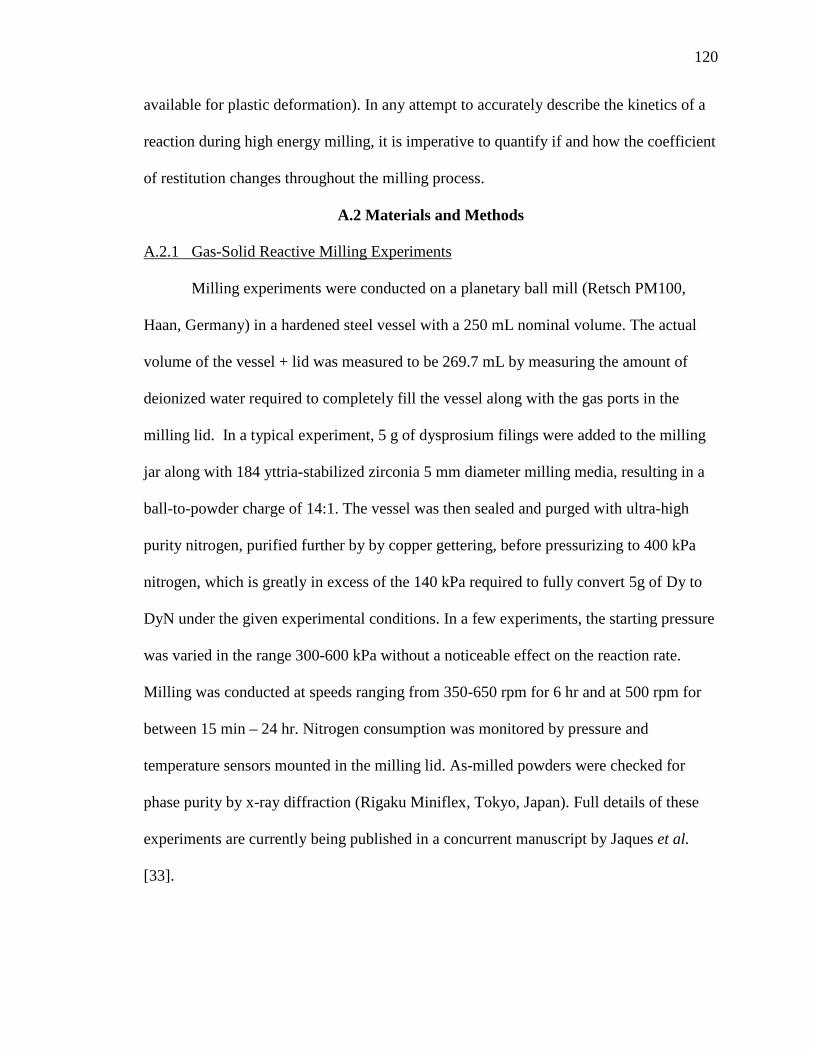
120
available for plastic deformation). In any attempt to accurately describe the kinetics of a
reaction during high energy milling, it is imperative to quantify if and how the coefficient
of restitution changes throughout the milling process.
A.2 Materials and Methods
A.2.1 Gas-Solid Reactive Milling Experiments
Milling experiments were conducted on a planetary ball mill (Retsch PM100,
Haan, Germany) in a hardened steel vessel with a 250 mL nominal volume. The actual
volume of the vessel + lid was measured to be 269.7 mL by measuring the amount of
deionized water required to completely fill the vessel along with the gas ports in the
milling lid. In a typical experiment, 5 g of dysprosium filings were added to the milling
jar along with 184 yttria-stabilized zirconia 5 mm diameter milling media, resulting in a
ball-to-powder charge of 14:1. The vessel was then sealed and purged with ultra-high
purity nitrogen, purified further by by copper gettering, before pressurizing to 400 kPa
nitrogen, which is greatly in excess of the 140 kPa required to fully convert 5g of Dy to
DyN under the given experimental conditions. In a few experiments, the starting pressure
was varied in the range 300-600 kPa without a noticeable effect on the reaction rate.
Milling was conducted at speeds ranging from 350-650 rpm for 6 hr and at 500 rpm for
between 15 min – 24 hr. Nitrogen consumption was monitored by pressure and
temperature sensors mounted in the milling lid. As-milled powders were checked for
phase purity by x-ray diffraction (Rigaku Miniflex, Tokyo, Japan). Full details of these
experiments are currently being published in a concurrent manuscript by Jaques et al.
[33].
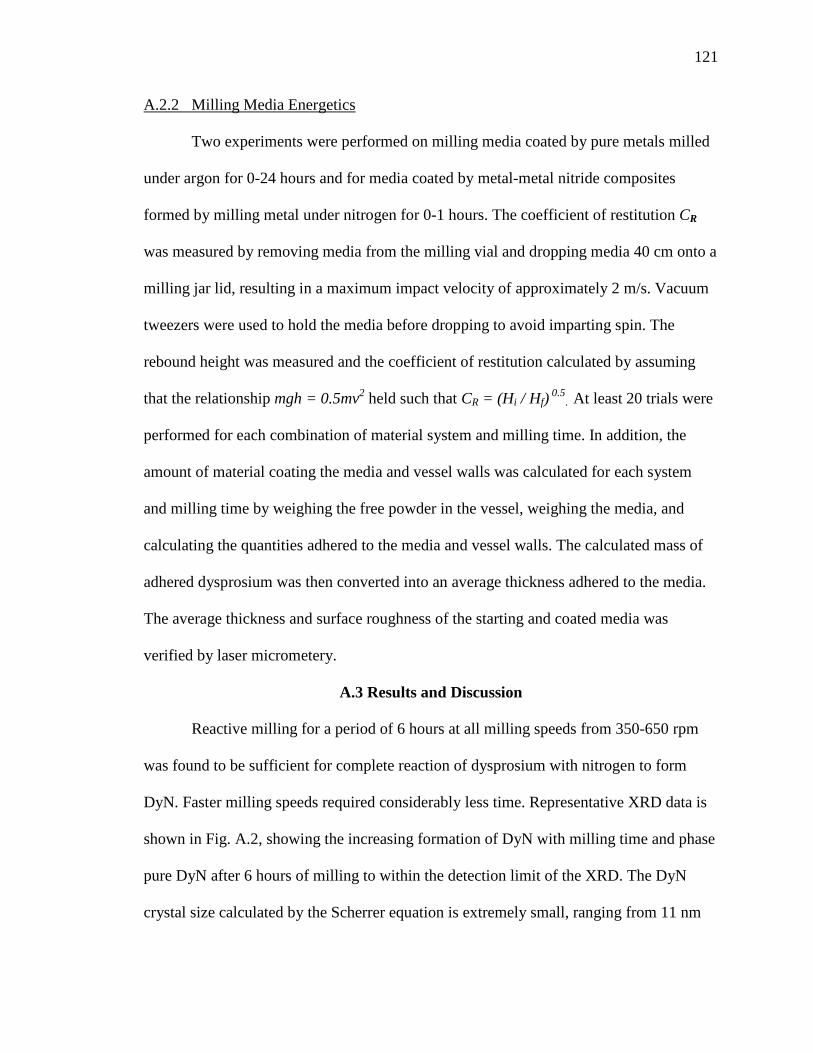
121
A.2.2 Milling Media Energetics
Two experiments were performed on milling media coated by pure metals milled
under argon for 0-24 hours and for media coated by metal-metal nitride composites
formed by milling metal under nitrogen for 0-1 hours. The coefficient of restitution CR
was measured by removing media from the milling vial and dropping media 40 cm onto a
milling jar lid, resulting in a maximum impact velocity of approximately 2 m/s. Vacuum
tweezers were used to hold the media before dropping to avoid imparting spin. The
rebound height was measured and the coefficient of restitution calculated by assuming
that the relationship mgh = 0.5mv2 held such that CR = (Hi / Hf) 0.5. At least 20 trials were
performed for each combination of material system and milling time. In addition, the
amount of material coating the media and vessel walls was calculated for each system
and milling time by weighing the free powder in the vessel, weighing the media, and
calculating the quantities adhered to the media and vessel walls. The calculated mass of
adhered dysprosium was then converted into an average thickness adhered to the media.
The average thickness and surface roughness of the starting and coated media was
verified by laser micrometery.
A.3 Results and Discussion
Reactive milling for a period of 6 hours at all milling speeds from 350-650 rpm
was found to be sufficient for complete reaction of dysprosium with nitrogen to form
DyN. Faster milling speeds required considerably less time. Representative XRD data is
shown in Fig. A.2, showing the increasing formation of DyN with milling time and phase
pure DyN after 6 hours of milling to within the detection limit of the XRD. The DyN
crystal size calculated by the Scherrer equation is extremely small, ranging from 11 nm
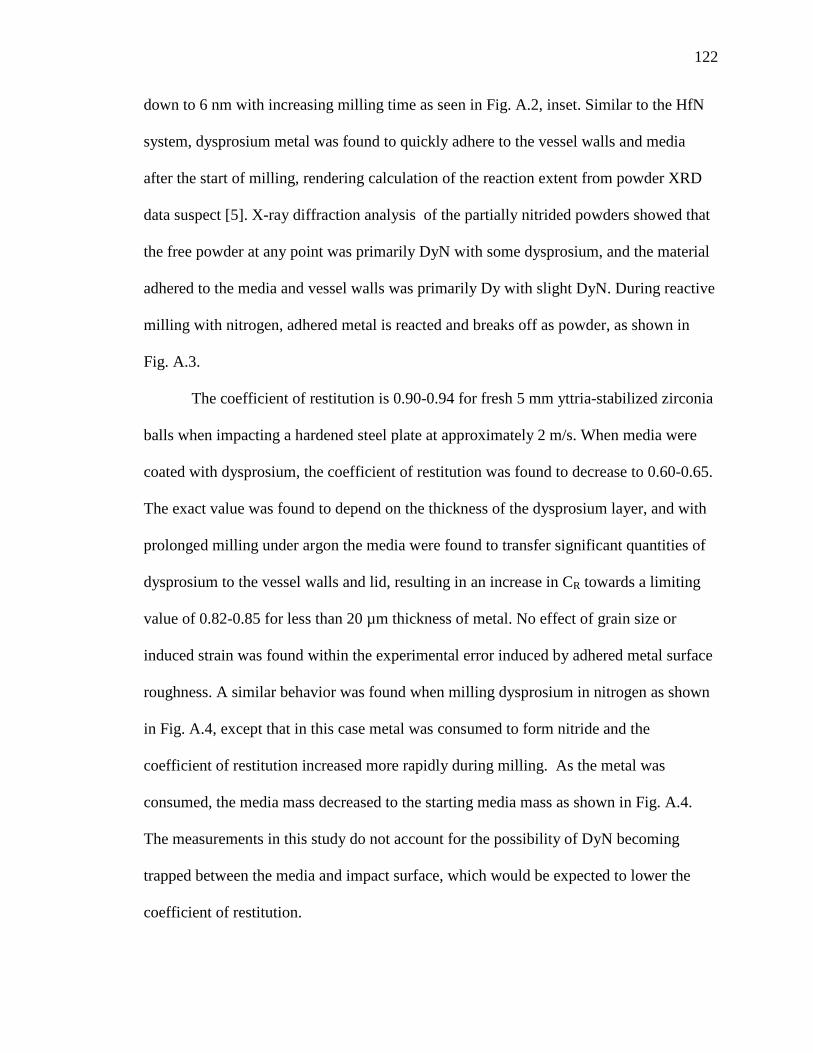
122
down to 6 nm with increasing milling time as seen in Fig. A.2, inset. Similar to the HfN
system, dysprosium metal was found to quickly adhere to the vessel walls and media
after the start of milling, rendering calculation of the reaction extent from powder XRD
data suspect [5]. X-ray diffraction analysis of the partially nitrided powders showed that
the free powder at any point was primarily DyN with some dysprosium, and the material
adhered to the media and vessel walls was primarily Dy with slight DyN. During reactive
milling with nitrogen, adhered metal is reacted and breaks off as powder, as shown in
Fig. A.3.
The coefficient of restitution is 0.90-0.94 for fresh 5 mm yttria-stabilized zirconia
balls when impacting a hardened steel plate at approximately 2 m/s. When media were
coated with dysprosium, the coefficient of restitution was found to decrease to 0.60-0.65.
The exact value was found to depend on the thickness of the dysprosium layer, and with
prolonged milling under argon the media were found to transfer significant quantities of
dysprosium to the vessel walls and lid, resulting in an increase in CR towards a limiting
value of 0.82-0.85 for less than 20 µm thickness of metal. No effect of grain size or
induced strain was found within the experimental error induced by adhered metal surface
roughness. A similar behavior was found when milling dysprosium in nitrogen as shown
in Fig. A.4, except that in this case metal was consumed to form nitride and the
coefficient of restitution increased more rapidly during milling. As the metal was
consumed, the media mass decreased to the starting media mass as shown in Fig. A.4.
The measurements in this study do not account for the possibility of DyN becoming
trapped between the media and impact surface, which would be expected to lower the
coefficient of restitution.
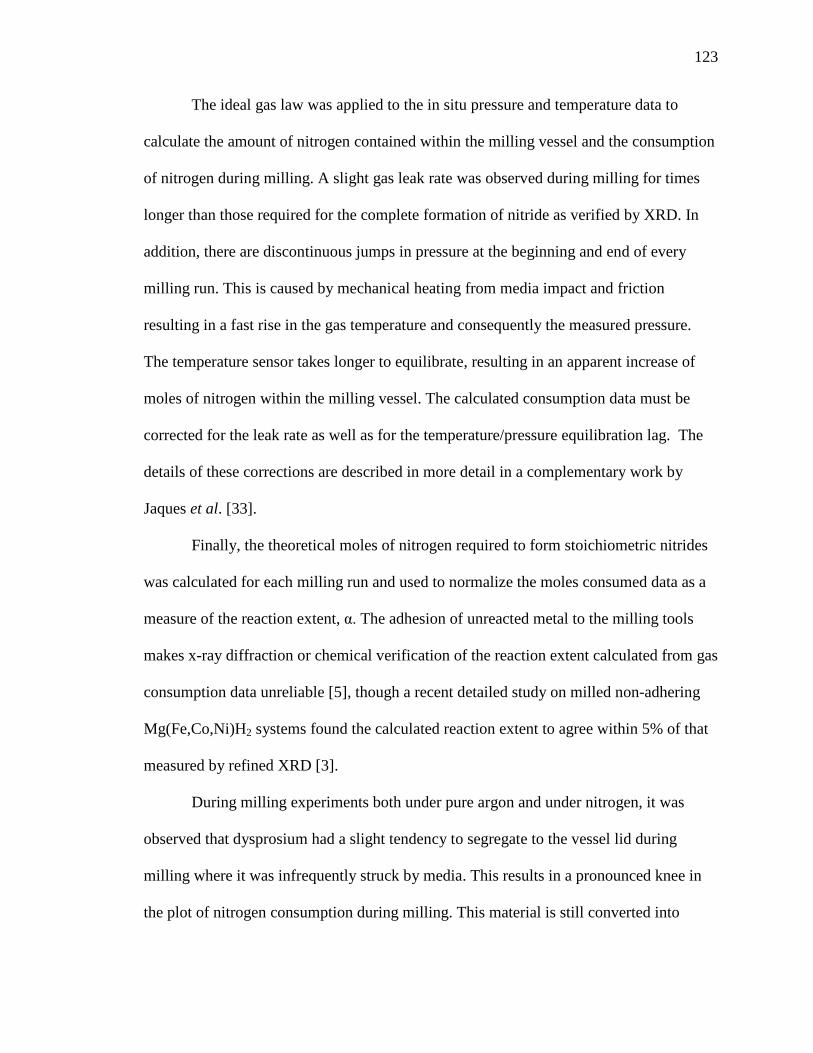
123
The ideal gas law was applied to the in situ pressure and temperature data to
calculate the amount of nitrogen contained within the milling vessel and the consumption
of nitrogen during milling. A slight gas leak rate was observed during milling for times
longer than those required for the complete formation of nitride as verified by XRD. In
addition, there are discontinuous jumps in pressure at the beginning and end of every
milling run. This is caused by mechanical heating from media impact and friction
resulting in a fast rise in the gas temperature and consequently the measured pressure.
The temperature sensor takes longer to equilibrate, resulting in an apparent increase of
moles of nitrogen within the milling vessel. The calculated consumption data must be
corrected for the leak rate as well as for the temperature/pressure equilibration lag. The
details of these corrections are described in more detail in a complementary work by
Jaques et al. [33].
Finally, the theoretical moles of nitrogen required to form stoichiometric nitrides
was calculated for each milling run and used to normalize the moles consumed data as a
measure of the reaction extent, α. The adhesion of unreacted metal to the milling tools
makes x-ray diffraction or chemical verification of the reaction extent calculated from gas
consumption data unreliable [5], though a recent detailed study on milled non-adhering
Mg(Fe,Co,Ni)H2 systems found the calculated reaction extent to agree within 5% of that
measured by refined XRD [3].
During milling experiments both under pure argon and under nitrogen, it was
observed that dysprosium had a slight tendency to segregate to the vessel lid during
milling where it was infrequently struck by media. This results in a pronounced knee in
the plot of nitrogen consumption during milling. This material is still converted into
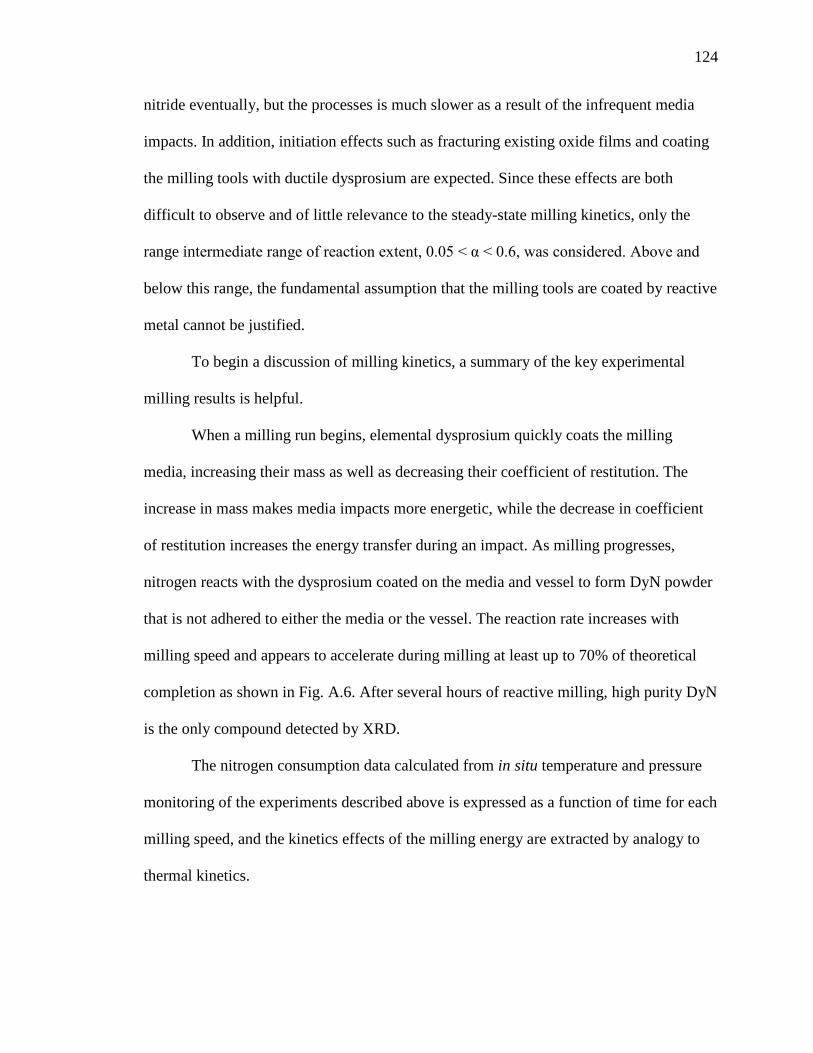
124
nitride eventually, but the processes is much slower as a result of the infrequent media
impacts. In addition, initiation effects such as fracturing existing oxide films and coating
the milling tools with ductile dysprosium are expected. Since these effects are both
difficult to observe and of little relevance to the steady-state milling kinetics, only the
range intermediate range of reaction extent, 0.05 < α < 0.6, was considered. Above and
below this range, the fundamental assumption that the milling tools are coated by reactive
metal cannot be justified.
To begin a discussion of milling kinetics, a summary of the key experimental
milling results is helpful.
When a milling run begins, elemental dysprosium quickly coats the milling
media, increasing their mass as well as decreasing their coefficient of restitution. The
increase in mass makes media impacts more energetic, while the decrease in coefficient
of restitution increases the energy transfer during an impact. As milling progresses,
nitrogen reacts with the dysprosium coated on the media and vessel to form DyN powder
that is not adhered to either the media or the vessel. The reaction rate increases with
milling speed and appears to accelerate during milling at least up to 70% of theoretical
completion as shown in Fig. A.6. After several hours of reactive milling, high purity DyN
is the only compound detected by XRD.
The nitrogen consumption data calculated from in situ temperature and pressure
monitoring of the experiments described above is expressed as a function of time for each
milling speed, and the kinetics effects of the milling energy are extracted by analogy to
thermal kinetics.
125
A.4 Kinetics Analysis
In a traditional approach to kinetics analysis, one often begins by parameterizing
the functional dependence of α on the experimental conditions in terms of separated
variables [34]:
𝑑𝛼𝑑𝑡
= 𝑓(𝛼)ℎ(𝑃) 𝑘(𝑇) (2)
Here f(α) describes the geometry of the reaction, k(T) is the familiar Arrhenius
temperature dependence of the kinetics determined by some activation energy, EA, and
the prexponential k, and h(P) denotes the possible effect of partial pressure in reactions
involving gasses. Separating and integrating Eq. 2 yields the integral form, g(α):
∫ 𝑑𝛼𝑓(𝛼)
𝛼0 = 𝑔(𝛼) = ℎ(𝑃) 𝑘(𝑇)𝑡 (3)
In Eq. 3, g(α) describes the manner in which changing the extent of reaction
affects the continuing propagation of the reaction. In classic kinetics, g(α) is often termed
the “geometric reaction model.”
In the present analysis, the gas-solid reaction is assumed to be primarily driven by
milling media impacts with a rate related to the energy of an impact instead of being
driven by thermal energy, similar to previous investigations [6, 35]. In addition, the
experimental work presented here holds the nitrogen pressure PN2 in large excess, which
limits pressure effects. The average milling temperature varies over only a small range in
which thermally activated diffusion is assumed to be small. Thus, Eq. 3 is rewritten to
reduce the effects of pressure h(PN2) and temperature k(T) to a constant, A, and to
accommodate the temperature-analogous effects of mechanical work, M(Eb). The impact
energy, Eb, will depend on the angular frequency, ν, of the mill, the mass of the media,
mb, and the elasticity of the impact, CR [14, 26]:
126
𝑔(𝛼) = 𝐴 𝑀(𝐸) 𝑡 𝐴(𝑇,𝑃𝑁2), 𝐸(𝜈,𝑚𝑏 ,𝐶𝑅) (4)
The apparent mechanical rate constant, M(E), describes the effect of the
mechanical milling energy on the reaction rate. The geometric reaction model, g(α)takes
into account the time-independent effects of the extent of reaction. In a milling system,
the progression of the reaction may change the mechanical properties of the milled
material, and g(α) must therefore also account for the changes in milling energetics.
Therefore, g(α) in Eq. 4 is rewritten as g’(α) to explicitly account for a yet to be
determined effect of reaction extent on energy transfer, E(α):
𝑔′(𝛼) = 𝐴 𝑀(𝐸) 𝐸(𝛼)𝑡 (5)
In the following sections, g’(α) and M(E) will be obtained by fitting nitrogen
consumption data from milling runs conducted at speeds of 350-650 rpm. The variation
of impact energy transfer E(α) will be determined from media mass data and drop tests.
Finally, the obtained expressions for g’(α) and E(α) will be employed to determine the
reaction model g(α).
A.4.1 Reaction Model Development
A.4.1.1 Empirical Reaction Model
The reaction extent versus milling time at various speeds, calculated from the gas
consumption data, is shown in Fig. A.6. The data clearly shows an accelerating rate over
the range of interest 0.05 < α < 0.6. Kinetics data of unknown form but accelerating rate
is often fit by a power law model, usually given as [36]:
𝛼(𝑡) = (𝑘𝑡)𝑛 ↔ 𝛼1/𝑛 = (𝑘𝑡) (6)
where on the right side of Eq. 6 the expression has been rearranged into an expression for
the reaction extent as a function of time. In the present case of reaction kinetics that
127
accelerate with increasing milling time, a power law expression analogous to Eq. 6 was
used to derive fitting parameters:
𝛼(𝑡) = 𝐵𝑡𝑚 (7)
This empirical model is not assumed to have physical meaning in the milling system.
Rather, Eq. 7 is used to separate the reaction rate dependence on the milling parameters
from the milling-time independent effects such as reaction geometry. Fits to the data are
shown as dashed red lines in Fig. A.6, and obtained values of B and m are summarized in
Table A.3. Rearranging Eq. 7 as in Eq. 6:
𝛼1/𝑚 ≅ �𝐵1 𝑚⁄ 𝑡� (8)
Since this study is concerned with the effects of mechanical energy on milling
reaction rate, the apparent thermal rate constant, k, is replaced in Eq. 6 by the apparent
mechanical rate constant, Ma. Substituting Eq. 7 into Eq. 4 produces the empirical
reaction model:
𝑔′(𝛼) ≅ 𝛼1𝑚 = 𝐴 𝑀𝑎(𝐸) 𝐸(𝛼)𝑡 (9)
Eq. 9 allows the graphical evaluation of the mechanical rate dependence of the reactive
milling kinetics by plotting B1/m = A Ma versus milling speed as shown in Fig. A.7.
A.4.1.2 Dependence of Reaction Rate on Milling Energy
The values of m and B obtained from the data fitting shown in Fig. A.6 are both
plotted versus the angular frequency of the mill in Fig. A.7 along with best fit lines. From
Fig. A.7, it can be seen that the value of m decreases slightly with increasing milling
speed, while Ma depends on the cube of the angular frequency:
𝑀𝑎(𝐸) = 𝑀0 𝜈3 (10)
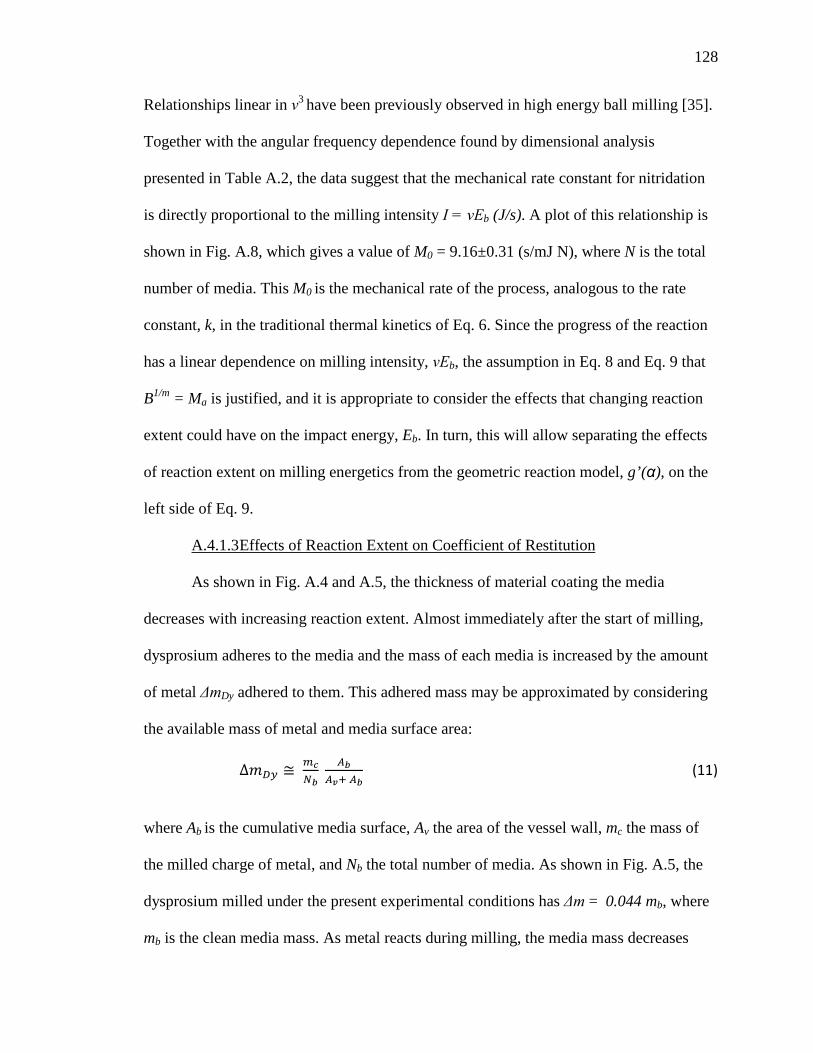
128
Relationships linear in ν3 have been previously observed in high energy ball milling [35].
Together with the angular frequency dependence found by dimensional analysis
presented in Table A.2, the data suggest that the mechanical rate constant for nitridation
is directly proportional to the milling intensity I = νEb (J/s). A plot of this relationship is
shown in Fig. A.8, which gives a value of M0 = 9.16±0.31 (s/mJ N), where N is the total
number of media. This M0 is the mechanical rate of the process, analogous to the rate
constant, k, in the traditional thermal kinetics of Eq. 6. Since the progress of the reaction
has a linear dependence on milling intensity, νEb, the assumption in Eq. 8 and Eq. 9 that
B1/m = Ma is justified, and it is appropriate to consider the effects that changing reaction
extent could have on the impact energy, Eb. In turn, this will allow separating the effects
of reaction extent on milling energetics from the geometric reaction model, g’(α), on the
left side of Eq. 9.
A.4.1.3 Effects of Reaction Extent on Coefficient of Restitution
As shown in Fig. A.4 and A.5, the thickness of material coating the media
decreases with increasing reaction extent. Almost immediately after the start of milling,
dysprosium adheres to the media and the mass of each media is increased by the amount
of metal ΔmDy adhered to them. This adhered mass may be approximated by considering
the available mass of metal and media surface area:
∆𝑚𝐷𝑦 ≅ 𝑚𝑐𝑁𝑏
𝐴𝑏𝐴𝑣+ 𝐴𝑏
(11)
where Ab is the cumulative media surface, Av the area of the vessel wall, mc the mass of
the milled charge of metal, and Nb the total number of media. As shown in Fig. A.5, the
dysprosium milled under the present experimental conditions has Δm = 0.044 mb, where
mb is the clean media mass. As metal reacts during milling, the media mass decreases
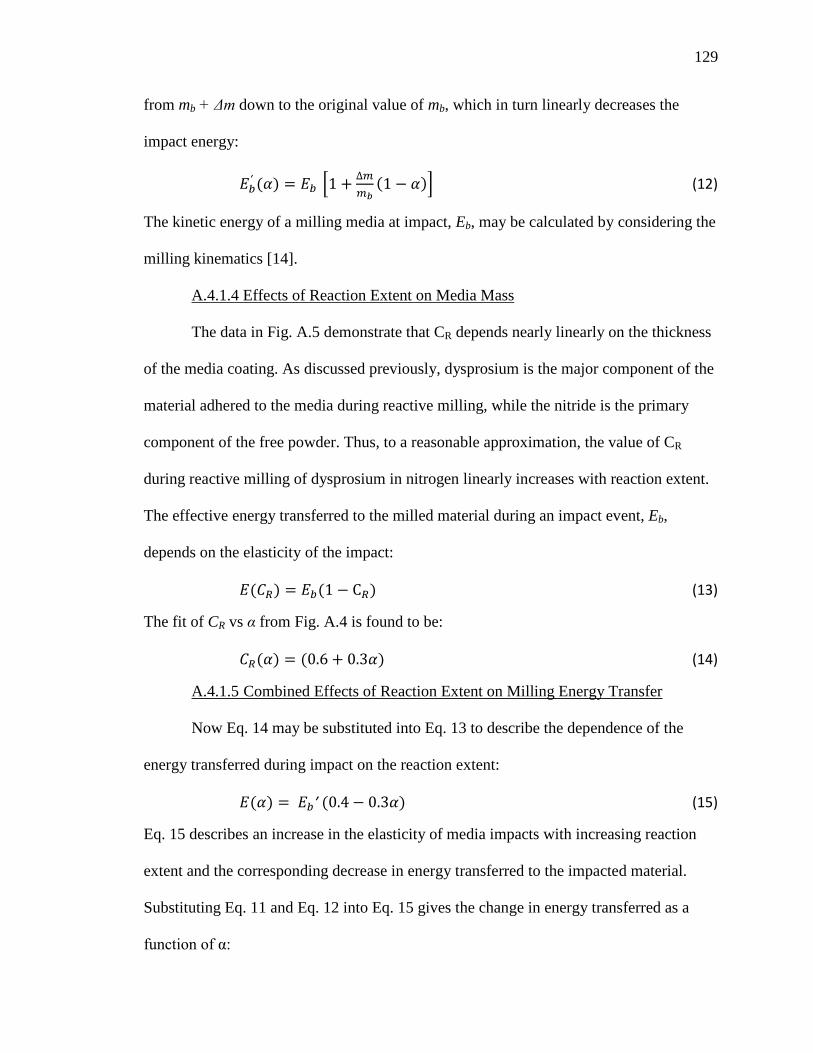
129
from mb + Δm down to the original value of mb, which in turn linearly decreases the
impact energy:
𝐸𝑏ʹ (𝛼) = 𝐸𝑏 �1 + ∆𝑚𝑚𝑏
(1 − 𝛼)� (12)
The kinetic energy of a milling media at impact, Eb, may be calculated by considering the
milling kinematics [14].
A.4.1.4 Effects of Reaction Extent on Media Mass
The data in Fig. A.5 demonstrate that CR depends nearly linearly on the thickness
of the media coating. As discussed previously, dysprosium is the major component of the
material adhered to the media during reactive milling, while the nitride is the primary
component of the free powder. Thus, to a reasonable approximation, the value of CR
during reactive milling of dysprosium in nitrogen linearly increases with reaction extent.
The effective energy transferred to the milled material during an impact event, Eb,
depends on the elasticity of the impact:
𝐸(𝐶𝑅) = 𝐸𝑏(1 − C𝑅) (13)
The fit of CR vs α from Fig. A.4 is found to be:
𝐶𝑅(𝛼) = (0.6 + 0.3𝛼) (14)
A.4.1.5 Combined Effects of Reaction Extent on Milling Energy Transfer
Now Eq. 14 may be substituted into Eq. 13 to describe the dependence of the
energy transferred during impact on the reaction extent:
𝐸(𝛼) = 𝐸𝑏ʹ (0.4− 0.3𝛼) (15)
Eq. 15 describes an increase in the elasticity of media impacts with increasing reaction
extent and the corresponding decrease in energy transferred to the impacted material.
Substituting Eq. 11 and Eq. 12 into Eq. 15 gives the change in energy transferred as a
function of α:
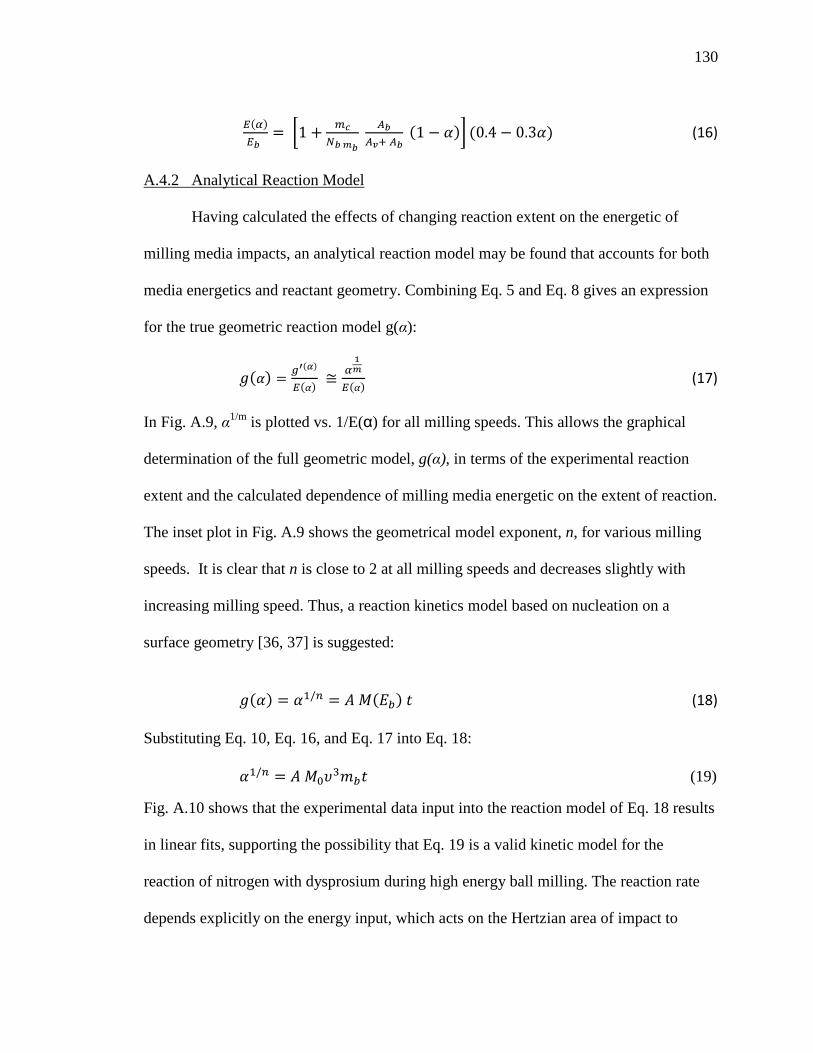
130
𝐸(𝛼)𝐸𝑏
= �1 + 𝑚𝑐𝑁𝑏 𝑚𝑏
𝐴𝑏𝐴𝑣+ 𝐴𝑏
(1 − 𝛼)� (0.4 − 0.3𝛼) (16)
A.4.2 Analytical Reaction Model
Having calculated the effects of changing reaction extent on the energetic of
milling media impacts, an analytical reaction model may be found that accounts for both
media energetics and reactant geometry. Combining Eq. 5 and Eq. 8 gives an expression
for the true geometric reaction model g(α):
𝑔(𝛼) = 𝑔′(𝛼)
𝐸(𝛼) ≅ 𝛼1𝑚
𝐸(𝛼) (17)
In Fig. A.9, α1/m is plotted vs. 1/E(α) for all milling speeds. This allows the graphical
determination of the full geometric model, g(α), in terms of the experimental reaction
extent and the calculated dependence of milling media energetic on the extent of reaction.
The inset plot in Fig. A.9 shows the geometrical model exponent, n, for various milling
speeds. It is clear that n is close to 2 at all milling speeds and decreases slightly with
increasing milling speed. Thus, a reaction kinetics model based on nucleation on a
surface geometry [36, 37] is suggested:
𝑔(𝛼) = 𝛼1/𝑛 = 𝐴 𝑀(𝐸𝑏) 𝑡 (18)
Substituting Eq. 10, Eq. 16, and Eq. 17 into Eq. 18:
𝛼1/𝑛 = 𝐴 𝑀0𝜐3𝑚𝑏𝑡 (19)
Fig. A.10 shows that the experimental data input into the reaction model of Eq. 18 results
in linear fits, supporting the possibility that Eq. 19 is a valid kinetic model for the
reaction of nitrogen with dysprosium during high energy ball milling. The reaction rate
depends explicitly on the energy input, which acts on the Hertzian area of impact to
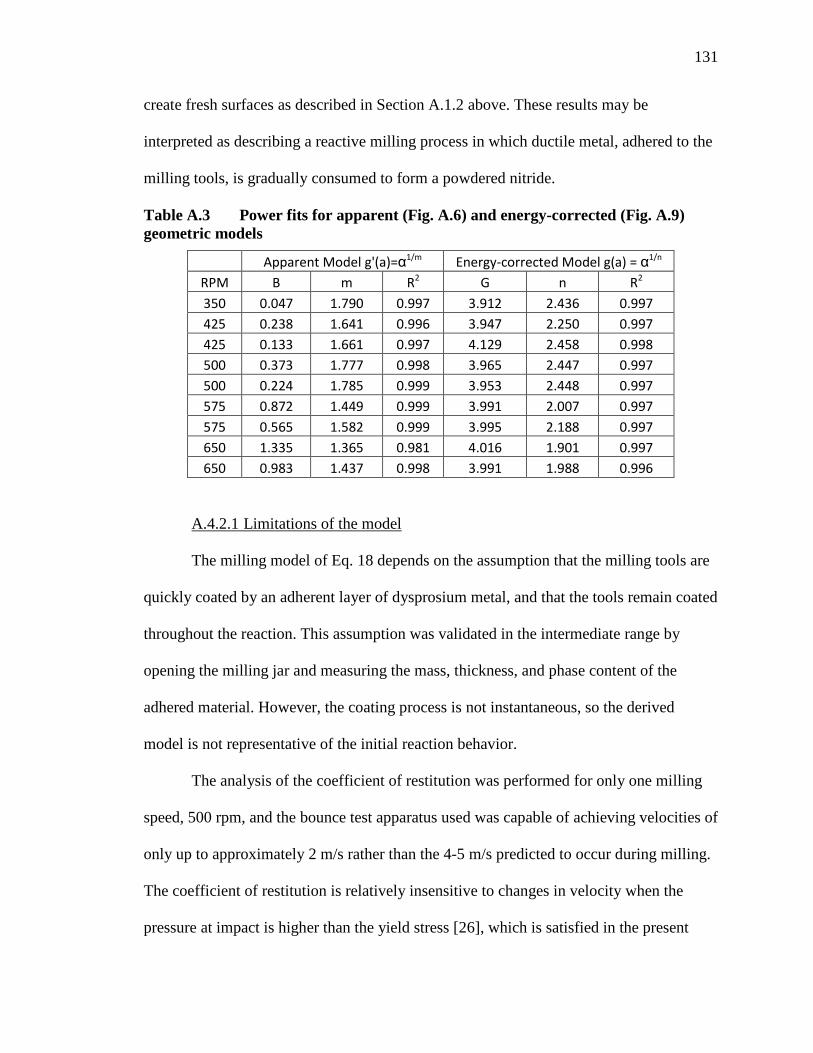
131
create fresh surfaces as described in Section A.1.2 above. These results may be
interpreted as describing a reactive milling process in which ductile metal, adhered to the
milling tools, is gradually consumed to form a powdered nitride.
Table A.3 Power fits for apparent (Fig. A.6) and energy-corrected (Fig. A.9) geometric models
Apparent Model g'(a)=α1/m Energy-corrected Model g(a) = α1/n
RPM B m R2 G n R2
350 0.047 1.790 0.997 3.912 2.436 0.997 425 0.238 1.641 0.996 3.947 2.250 0.997 425 0.133 1.661 0.997 4.129 2.458 0.998 500 0.373 1.777 0.998 3.965 2.447 0.997 500 0.224 1.785 0.999 3.953 2.448 0.997 575 0.872 1.449 0.999 3.991 2.007 0.997 575 0.565 1.582 0.999 3.995 2.188 0.997 650 1.335 1.365 0.981 4.016 1.901 0.997 650 0.983 1.437 0.998 3.991 1.988 0.996
A.4.2.1 Limitations of the model
The milling model of Eq. 18 depends on the assumption that the milling tools are
quickly coated by an adherent layer of dysprosium metal, and that the tools remain coated
throughout the reaction. This assumption was validated in the intermediate range by
opening the milling jar and measuring the mass, thickness, and phase content of the
adhered material. However, the coating process is not instantaneous, so the derived
model is not representative of the initial reaction behavior.
The analysis of the coefficient of restitution was performed for only one milling
speed, 500 rpm, and the bounce test apparatus used was capable of achieving velocities of
only up to approximately 2 m/s rather than the 4-5 m/s predicted to occur during milling.
The coefficient of restitution is relatively insensitive to changes in velocity when the
pressure at impact is higher than the yield stress [26], which is satisfied in the present
132
case, but the work presented here is necessarily an approximation. Variation in the true
value of CR with milling speed may account for the change seen in the reaction order, n,
in Fig. A.9 and Eq. 18.
Reactive milling should be expected to constantly disrupt the reacting surface by
comminuting surface films. However, as the 2Dy +N2 → 2DyN reaction progresses,
increasing amounts of DyN will be trapped in media impacts. This will result in some
impact energy dissipation by the trapped nitride powder and reduce the effective metal
surface refinement. The potential for energy dissipation by nitride products increasing
with reaction extent is not considered in the model.
Finally, at high reaction extents, the adherent metal coating will be consumed and
eventually wear through, reducing the number of media-dysprosium-wall impacts in
favor of direct media-wall or media-nitride-wall impacts. This apparent slowing of
reaction rate should be properly understood as a decrease in the number of effective
impacts and thus a decrease in reactive milling dose, rather than as indicative of a process
controlled by the growth of nuclei or similar decelerating process.
A.5 Conclusions
The reaction of dysprosium metal during high energy milling under nitrogen
atmosphere has been quantified by monitoring the temperature and pressure in situ. A
model of reactive milling kinetics for the formation of dysprosium nitride has been
developed that predicts the rate of nitride formation in reactive milling to be limited by
the areal energy input of media impacts. This novel result is explained in terms of
generation of atomically rough chemically active sites within the hertzian impact area
followed by dissociative chemisorbtion of nitrogen on the active surface with consequent
133
formation of nitride. Equivalently, impacts could be seen as comminuting thin films of
nitride within the impact area to allow for fast diffusion to the surface. Gas-solid
reactions during reactive milling of other rare earths are predicted to follow the model so
long as the following conditions are met:
a. The solid is ductile and coats the milling tools b. There is a low activation energy barrier for dissociative chemisorbtion on
the solid c. There is low solubility of the gas in the solid
These conditions should be met by many if not all of the lanthanides. These
results help to demonstrate the reactive milling as a viable approach to synthesis of the
rare earth and actinide nitrides. In addition, the demonstrated importance of considering
the coefficient of restitution variability during mechanochemical synthesis provides a
foundation for further study of the gas-solid reactions during high energy milling.
References
[1] C. Suryanarayana, Mechanical alloying and milling, Prog. Mater. Sci. 46[1-2] (2001) 1-184.
[2] J. M. Bellosta von Colbe, M. Felderhoff, B. Bogdanovic, F. Schuth, and C. Weidenthaler, One step direct synthesis of a Ti-doped sodium alanate hydrogen storage material, Chem. Comm. [37] (2005) 4732-34.
[3] J. Zhang, F. Cuevas, W. Zaïdi, J. Bonnet, L. Aymard, J. Bobet, and M. Latroche, Highlighting of a single reaction path during reactive ball milling of Mg and TM by quantitative H2 gas sorption analysis to form ternary complex hydrides (TM = Fe, Co, Ni), J. Phys. Chem. C, 115 [11] (2011) 4971–4979
[4] M. A. Bab, L. A. Baum, and L. Mendoza-Zelis, Autocatalytic effects in the mechanically induced hydriding of refractory metals, Physica. B. 389[1] (2007) 193-97.
[5] M.A. Bab, L. Mendoza-Zelis, and L.C. Damonte, Nanocrystalline HfN produced by
mechanical milling: Kinetic aspects, Acta Mater. 49 [20] (2001) 4205-4213.
134
[6] M. A. Bab and L. Mendoza-Zelis, A model for the kinetics of mechanically assisted gas-solid reactions, Scripta Mater. 50[1] (2004) 99-104.
[7] A. N. Streletskii, P. Y. Butyagin, and A. V. Leonov, Mechanochemical solid-gas reactions: Kinetics and products of interaction between Zr and CO, Colloid J. 58[2] (1996) 238-45.
[8] A. N. Streletskii, A. V. Leonov, and P. Y. Butyagin, On the role of intergrain boundaries in solid/gas mechanochemical synthesis, Ismanam-96, 235[2] (1997) 181-86.
[9] A. Yazdani, M. J. Hadianfard, and E. Salahinejad, A system dynamics model to estimate energy, temperature, and particle size in planetary ball milling, J. Alloy. Compds. 555 (2013) 108-11.
[10] A. Iasonna and M. Magini, Power measurements during mechanical milling. An experimental way to investigate the energy transfer phenomena, Acta Mater. 44[3] (1996) 1109-17.
[11] M. Magini, A. Iasonna, and F. Padella, Ball milling: An experimental support to the energy transfer evaluated by the collision model, Scripta Mater. 34[1] (1996) 13-19.
[12] P. Bellon and R. S. Averback, "Nonequilibrium Roughening of Interfaces in Crystals Under Shear – Application to Ball-milling, Phys. Rev. Lett. 74[10] (1995) 1819-22.
[13] M. Magini, C. Colella, A. Iasonna, and F. Padella, Power measurements during mechanical milling - II. The case of "single path cumulative" solid state reaction, Acta Mater. 46[8] (1998) 2841-50.
[14] P. P. Chattopadhyay, I. Manna, S. Talapatra, and S. K. Pabi, A mathematical analysis of milling mechanics in a planetary ball mill, Mater. Chem. Phys. 68[1-3] (2001) 85-94.
[15] B. J. Jaques, B. M. Marx, A. S. Hamdy, and D. P. Butt, Synthesis of uranium nitride by a mechanically induced gas-solid reaction, J. Nucl. Mater. 381[3] (2008) 309-11.
[16] P. G. Callahan, B. J. Jaques, B. M. Marx, A. S. Hamdy, D. D. Osterberg, and D. P. Butt, Synthesis of dysprosium and cerium nitrides by a mechanically induced gas-solid reaction, J. Nucl. Mater. 392[1] (2009) 121-24.
[17] G. Alanko and D. Butt, Mechanochemical Synthesis of Cerium Monosulfide, J. Amer. Ceram.Soc. (2014) In Press.
[18] G. Kaupp, Reactive milling with metals for environmentally benign sustainable production, Crys. Eng. Comm. 13[9] (2011) 3108-21.

135
[19] F. P. Netzer and J. A. D. Matthew, Surfaces of Rare Earth Metals, Rep. Prog. Phys. 49[6] (1986) 621-81.
[20] Z. Bastl, S. Cerny, and M. Kovar, Calorimetric and XPS Study of the Effect of Copper on the Sorption Properties of Dysprosium, Appl. Surf. Sci. 68[2] (1993) 275-83.
[21] J. A. Schreifels, J. E. Deffeyes, L. D. Neff, and J. M. White, An X-Ray Photo-electron Spectroscopic Study of the Adsorption of N2, NH3, NO, AND N2O on Dysprosium, J. Electron Spectrosc. Relat. Phenom. 25[2-3] (1982) 191-209.
[22] S. P. Willson and L. Andrews, Characterization of the reaction products of laser-ablated late lanthanide metal atoms with dinitrogen. Matrix IR spectra of LnN, (LnN)(2), and Ln(NN)(x) molecules, J. Phys. Chem. A 103[10] (1999) 1311-21.
[23] S. P. Willson and L. Andrews, Characterization of the reaction products of laser-ablated early lanthanide metal atoms with dinitrogen. Infrared spectra of LnN, LnN(2), (LnN)(2), and Ln(NN)(x) molecules, J. Phys. Chem. A 102[50] (1998) 10238-49.
[24] G. P. Kushto, P. F. Souter, G. V. Chertihin, and L. Andrews, An infrared spectroscopic and density functional investigation of dinitrogen activation by group IV metal atoms, J. Chem. Phys. 110[18] (1999) 9020-31.
[25] G. P. Kushto, P. F. Souter, and L. Andrews, An infrared spectroscopic and quasirelativistic theoretical study of the coordination and activation of dinitrogen by thorium and uranium atoms, J. Chem. Phys. 108[17] (1998) 7121-30.
[26] K. L. Johnson, "Contact Mechanics," pp. 452 First (paperback) ed. Cambridge University Press: Cambridge, (1985).
[27] J. Y. Huang, Y. K. Wu, and H. Q. Ye, "Ball-milling of Ductile Metals, Mater. Sci. Eng. A. 199[2] (1995) 165-72.
[28] H. J. Fecht, E. Hellstern, Z. Fu, and W. L. Johnson, "Nanocrystalline Metals Prepared by High-energy Ball Milling, Metall. Trans. A. 21[9] (1990) 2333-37.
[29] P. Y. Butyagin, Y. V. Zhernovenkova, and I. V. Povstugar, Work of formation of grain boundaries upon metal plastic deformation, Colloid J. 65[2] (2003) 141-44.
[30] P. Y. Butyagin and A. N. Streletskii, The kinetics and energy balance of mechanochemical transformations, Phys. Solid State 47[5] (2005) 856-62.
[31] R. T. Hukki, "Proposal for a Solomonic Settlement Between the Theories of von Rittinger, Kick, and Bond, Trans. Am. Inst. Min. Metall. Eng. 220 (1961) 403-08.
136
[32] A. Thomas and L. O. Filippov, Fractures, fractals and breakage energy of mineral particles, Int. J. Miner. Process. 57[4] (1999) 285-301.
[33] B. Jaques, G. Alanko, D. Osterberg, S. Tamrakar, C. Smith, M. Hurley, and D.P. Butt, In-situ Characterization During Reactive Milling of Dysprosium Nitride, In revision. J. Alloys Compds.
[34] M. E. Brown, M. Maciejewski, S. Vyazovkin, R. Nomen, J. Sempere, A. Burnham, J. Opfermann, R. Strey, H. L. Anderson, A. Kemmler, R. Keuleers, J. Janssens, H. O. Desseyn, C. R. Li, T. B. Tang, B. Roduit, J. Malek, and T. Mitsuhashi, Computational aspects of kinetic analysis Part A: The ICTAC kinetics project-data, methods and results, Thermochim. Acta 355[1-2] (2000) 125-43.
[35] F. J. Gotor, M. Achimovicova, C. Real, and P. Balaz, Influence of the milling parameters on the mechanical work intensity in planetary mills, Powder Technol. 233 (2013) 1-7.
[36] W. E. Brown, D. Dollimore, and A. K. Galwey, Reactions in the Solid State, pp. 340 1 ed. Vol. 22. Elsevier Scientific: New York, NY, (1980).
[37] A. K. Galwey and M. E. Brown, Isothermal kinetic analysis of solid-state reactions using plots of rate against derivative function of the rate equation, Thermochim. Acta 269 (1995) 1-25.
137
Figures
Figure A.1 This figure (a-c) shows a schematic of an impact event renewing the reactive surface. (a) media approaches the vessel wall (b) media impact transfers energy to the impact area πrh
2 (c) media rebound exposes activated surfaces on the wall and media. Part (d) shows a schematic of the impact event between a dysprosium-coated media and the coated vessel. Listed quantities in (d) are defined in the text.
138
Figure A.2 This figure shows x-ray diffraction plots collected after milling Dy in N2 at 500 rpm. Milling times are indicated on plot. The inset shows the average DyN crystallite size calculated by the Scherrer equation from the FWHM of five simultaneously-fit peaks.
139
Figure A.3 This SEM micrograph shows a secondary electron image of DyN formed by milling dysprosium for 6 hours at 500 rpm in nitrogen.
140
Figure A.4 This plot tracks the disposition of Dy and DyN during reactive milling at 500 rpm. Before the start of RM, ductile Dy was coated onto the media and walls by premilling in argon. The media and wall traces (red circles and green down arrows) show consumption of Dy and formation of free DyN powder (blue up arrows). Total mass in the vessel (black squares) decreases as coated media are removed for further characterization. Color online.
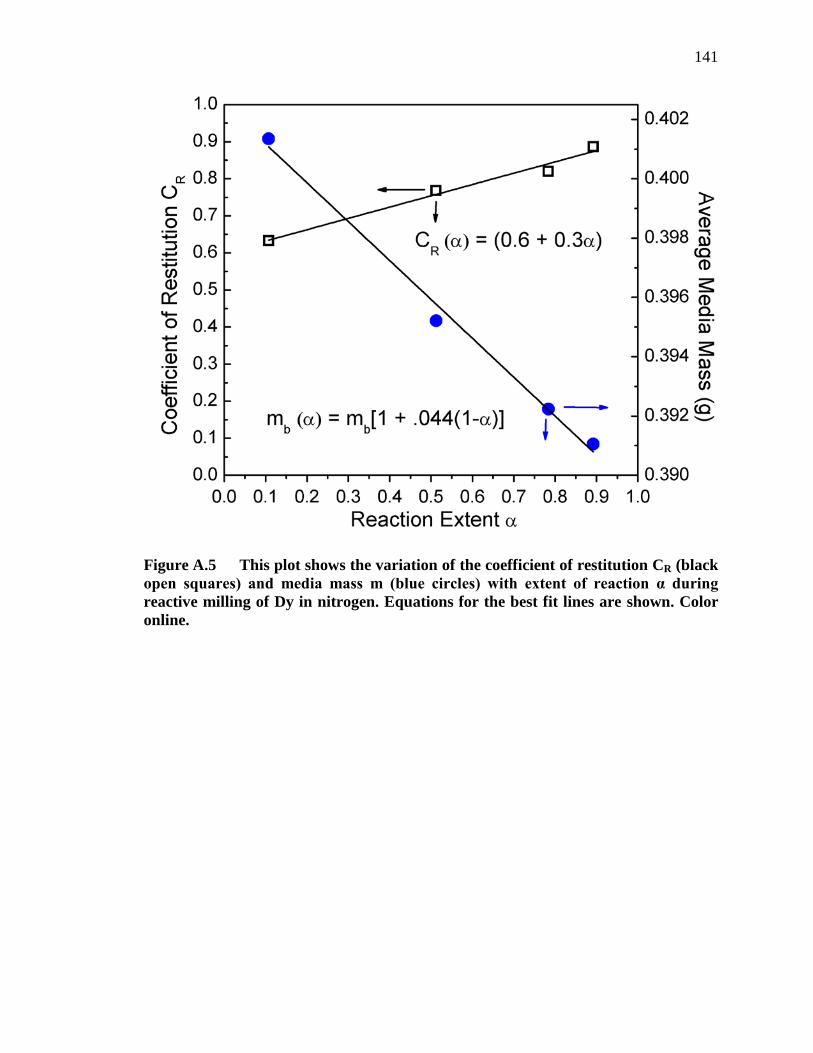
141
Figure A.5 This plot shows the variation of the coefficient of restitution CR (black open squares) and media mass m (blue circles) with extent of reaction α during reactive milling of Dy in nitrogen. Equations for the best fit lines are shown. Color online.
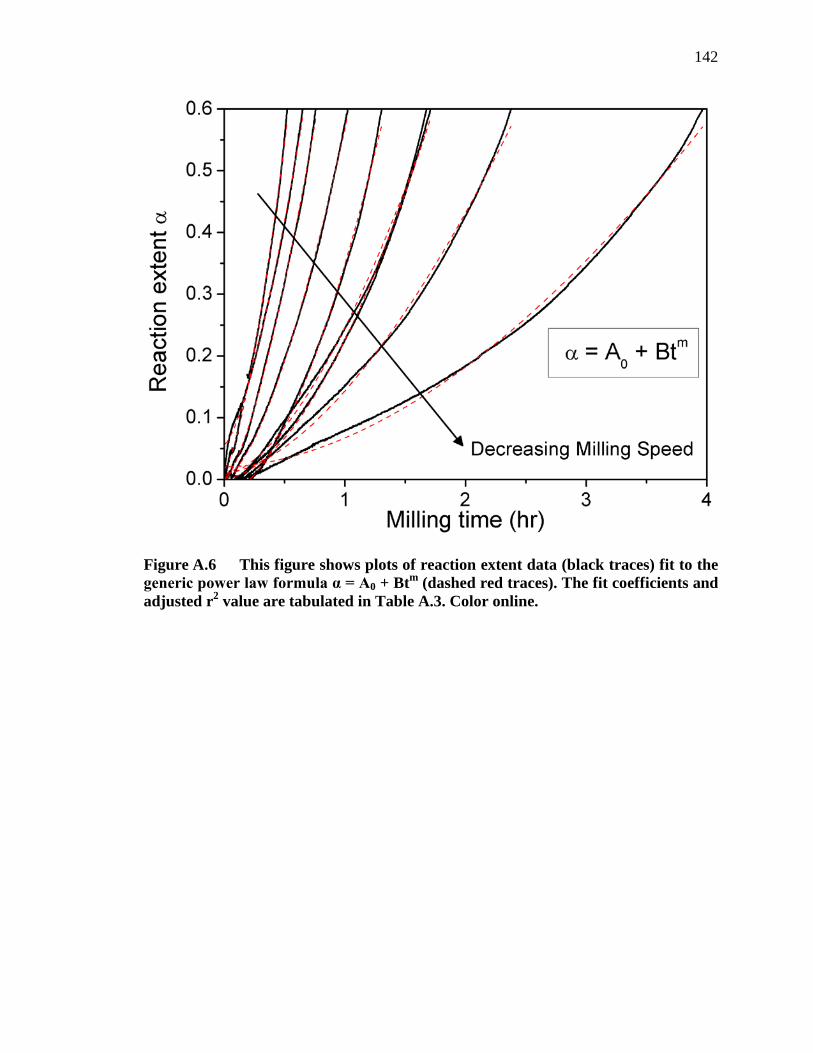
142
Figure A.6 This figure shows plots of reaction extent data (black traces) fit to the generic power law formula α = A0 + Btm (dashed red traces). The fit coefficients and adjusted r2 value are tabulated in Table A.3. Color online.
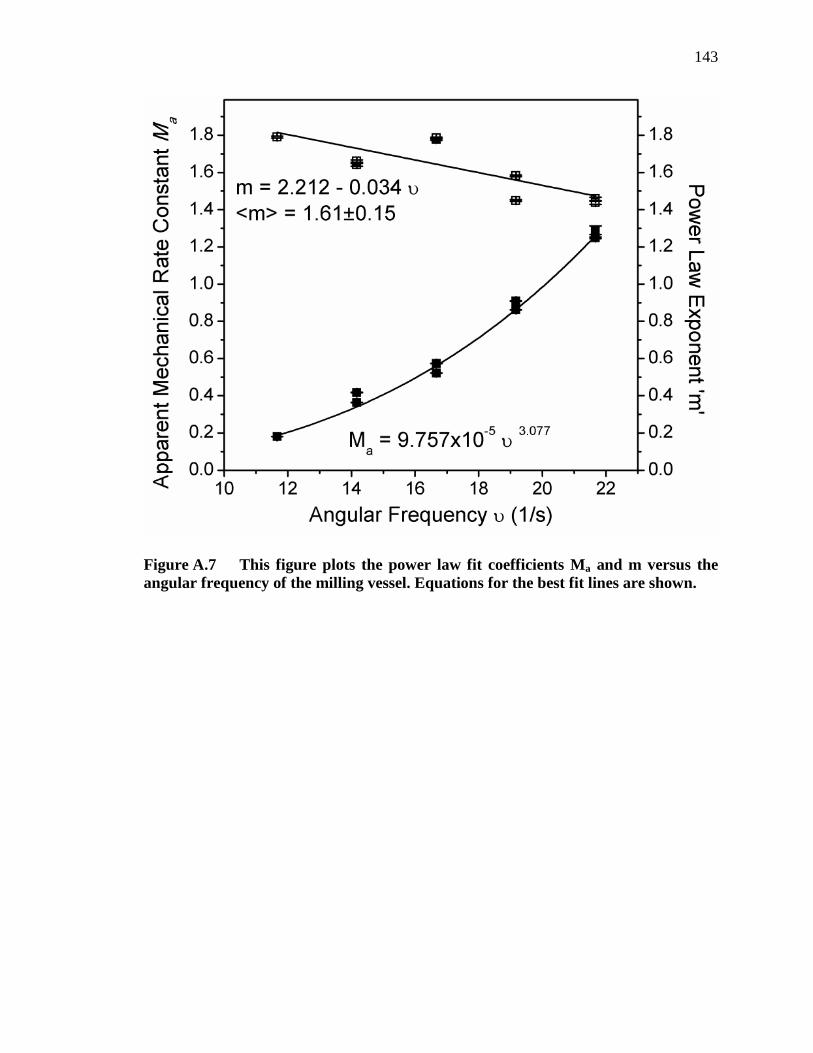
143
Figure A.7 This figure plots the power law fit coefficients Ma and m versus the angular frequency of the milling vessel. Equations for the best fit lines are shown.
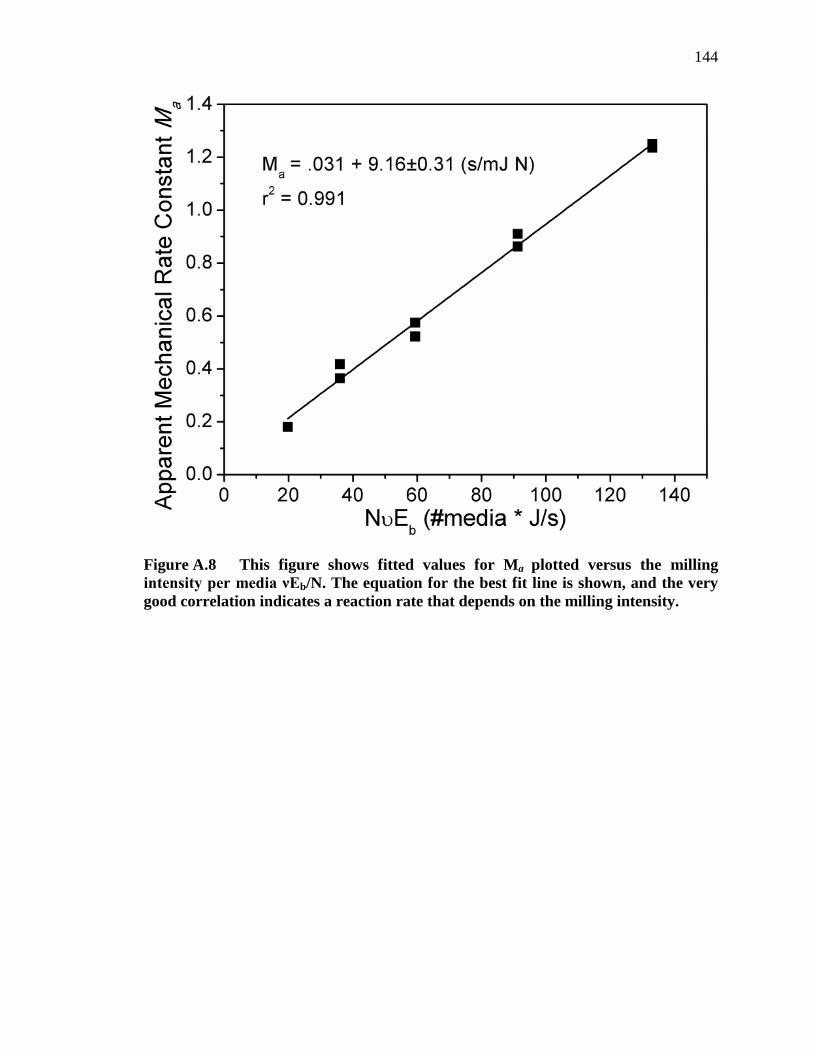
144
Figure A.8 This figure shows fitted values for Ma plotted versus the milling intensity per media νEb/N. The equation for the best fit line is shown, and the very good correlation indicates a reaction rate that depends on the milling intensity.
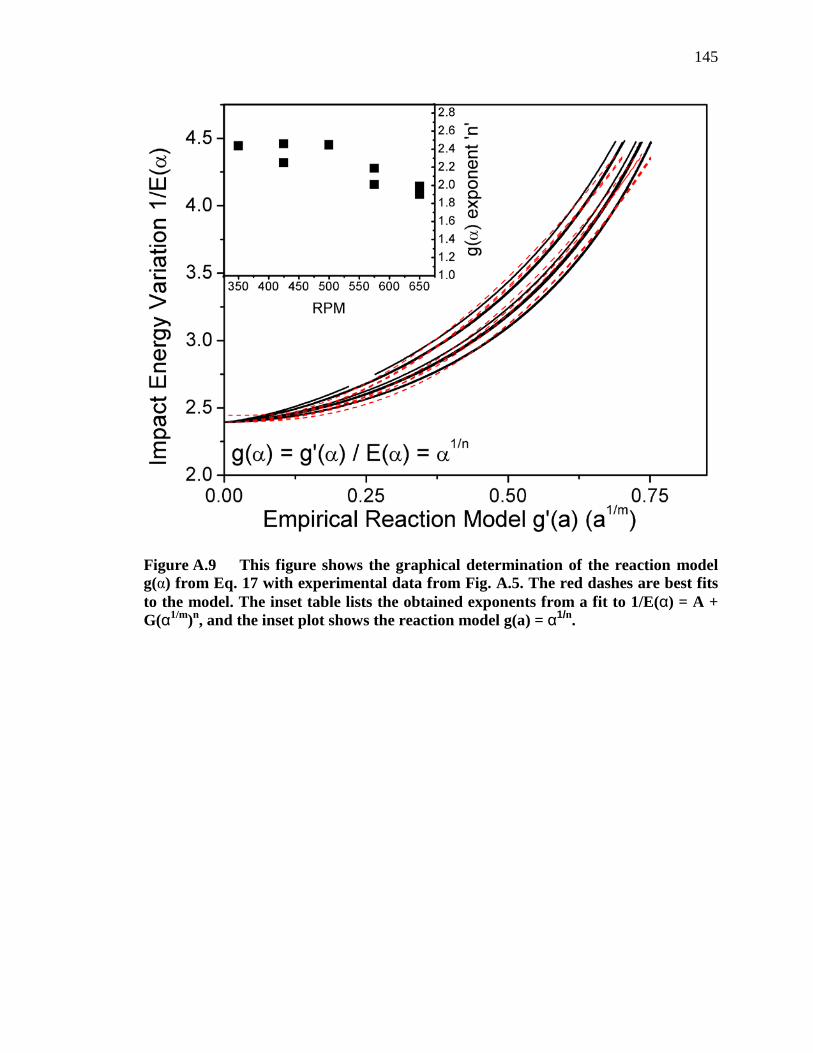
145
Figure A.9 This figure shows the graphical determination of the reaction model g(α) from Eq. 17 with experimental data from Fig. A.5. The red dashes are best fits to the model. The inset table lists the obtained exponents from a fit to 1/E(α) = A + G(α1/m)n, and the inset plot shows the reaction model g(a) = α1/n.
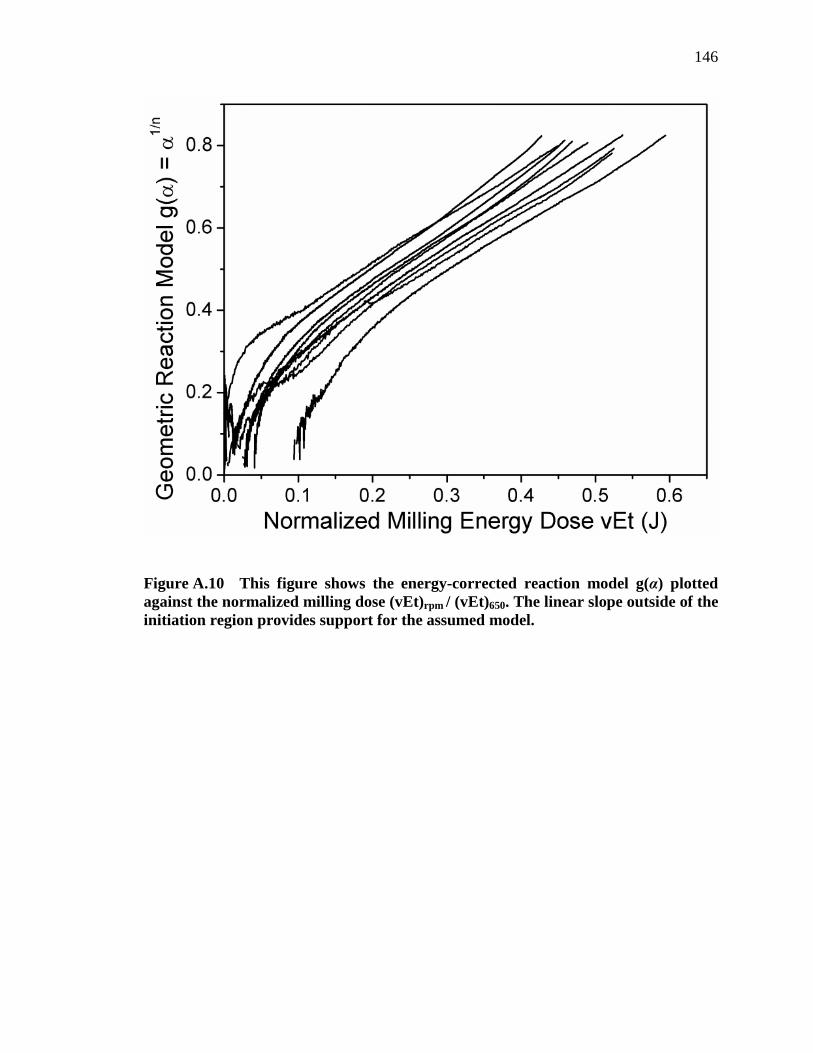
146
Figure A.10 This figure shows the energy-corrected reaction model g(α) plotted against the normalized milling dose (vEt)rpm / (vEt)650. The linear slope outside of the initiation region provides support for the assumed model.