Embed Size (px)
Citation preview

ReactionChemistry &Engineering
PAPER
Cite this: React. Chem. Eng., 2016, 1,
96
Received 20th October 2015,Accepted 25th November 2015
DOI: 10.1039/c5re00083a
rsc.li/reaction-engineering
Online quantitative mass spectrometry for therapid adaptive optimisation of automated flowreactors†
Nicholas Holmes,a Geoffrey R. Akien,ab Robert J. D. Savage,c Christian Stanetty,d
Ian R. Baxendale,d A. John Blacker,ac Brian A. Taylor,e Robert L. Woodward,e
Rebecca E. Meadowse and Richard A. Bourne*ace
An automated continuous reactor for the synthesis of organic compounds, which uses online mass
spectrometry (MS) for reaction monitoring and product quantification, is presented. Quantitative and rapid
MS monitoring was developed and calibrated using HPLC. The amidation of methyl nicotinate with aque-
ous MeNH2 was optimised using design of experiments and a self-optimisation algorithm approach to pro-
duce >93% yield.
Introduction
Flow reactors are increasing in popularity for the synthesis oforganic compounds. Their advantages over batch reactorsinclude higher reproducibility; safer operating conditions(particularly at increased temperatures and pressures); ease ofautomation; and facile integration of analysis. Therefore greatsuccess has been achieved for the optimisation of chemicalsystems using continuous reactors.1 Automated flow reactorstypically combine online analysis with a feedback loop or PCinterface to carry out reactions without any further human inter-ference.2 This technology has been used for the optimisation ofreactions using evolutionary algorithms (self-optimisation),3–8
design of experiments (DoE)9,10 and kinetic parameters.10,11
Process analytical technologies (PAT) for automated flowreactors include UV-vis,3 IR,6,8,11,12 Raman13 and NMRspectroscopy;7 gas chromatography5 and high performanceliquid chromatography (HPLC).4 Spectroscopy benefits fromrapid analytical method times, which can be used as real-time feedback to assess the steady state of a continuous reac-tor.6 However, vibrational spectroscopy generates complexspectra, which may require extensive deconvolution, and can
be difficult to calibrate for multi-component systems. NMRspectroscopy is typically easier to analyse and provides morestructural information than IR. The resolution and sensitivityof miniaturized low-field bench-top NMR spectrometers,which due to their small size can be used for inline analysis,means that subtle chemical transformations may not bedetected and accurate quantification of low level impuritiesmay prove difficult.7 Chromatography generates data that iseasy to analyse and can provide structural information ifcombined with mass spectrometry (MS) detection. Howeverthe long method times significantly decrease throughput.
To overcome the issues in analysis duration, demandingcalibration and sensitivity in these PAT techniques, in thiscommunication we explore the use of online MS to enablerapid quantification (<1 min analysis duration). Online MShas been used to qualitatively monitor continuous reactorsfor the identification of compounds and intermediates14 oranalysis of relative composition.15 MS can provide structuralinformation and product composition, all in real-time due toits short method times. Therefore it could be the ideal analyt-ical technique for optimising an automated flow reactor as itcan determine steady state and then calculate a product yieldwith minimal data manipulation.
This hypothesis was tested by carrying out a self-optimisation and DoE, to optimise the synthesis of N′-methylnicotinamide 2 by reacting methyl nicotinate 1 with aqueousmethylamine in methanol (Scheme 1). 1 can also hydrolyse toform niacin 3. This reaction was selected due to the presenceof an easily ionisable pyridine nitrogen, loss of selectivity dueto the presence of water in the aqueous methylamine and therequirement of high loadings of methylamine which may causesuppression effects. Overcoming such suppression effects is animportant factor if direct MS is used for quantitative analysis.
96 | React. Chem. Eng., 2016, 1, 96–100 This journal is © The Royal Society of Chemistry 2016
a Institute of Process Research and Development, School of Chemistry,
University of Leeds, Leeds, LS2 9JT, UK. E-mail: [email protected] of Chemistry, Faraday Building, Lancaster University, Lancaster,
LA1 4YB, UKc School of Chemical and Process Engineering, University of Leeds, Leeds,
LS2 9JT, UKdDepartment of Chemistry, Durham University, South Road, Durham,
DH1 3LE, UKe AstraZeneca Pharmaceutical Development, Silk Road Business Park,
Macclesfield, SK10 2NA, UK
† Electronic supplementary information (ESI) available. See DOI: 10.1039/c5re00083a
Publ
ishe
d on
01
Dec
embe
r 20
15. D
ownl
oade
d on
04/
03/2
016
17:0
6:54
.
View Article OnlineView Journal | View Issue
React. Chem. Eng., 2016, 1, 96–100 | 97This journal is © The Royal Society of Chemistry 2016
Results and discussionReactor set-up
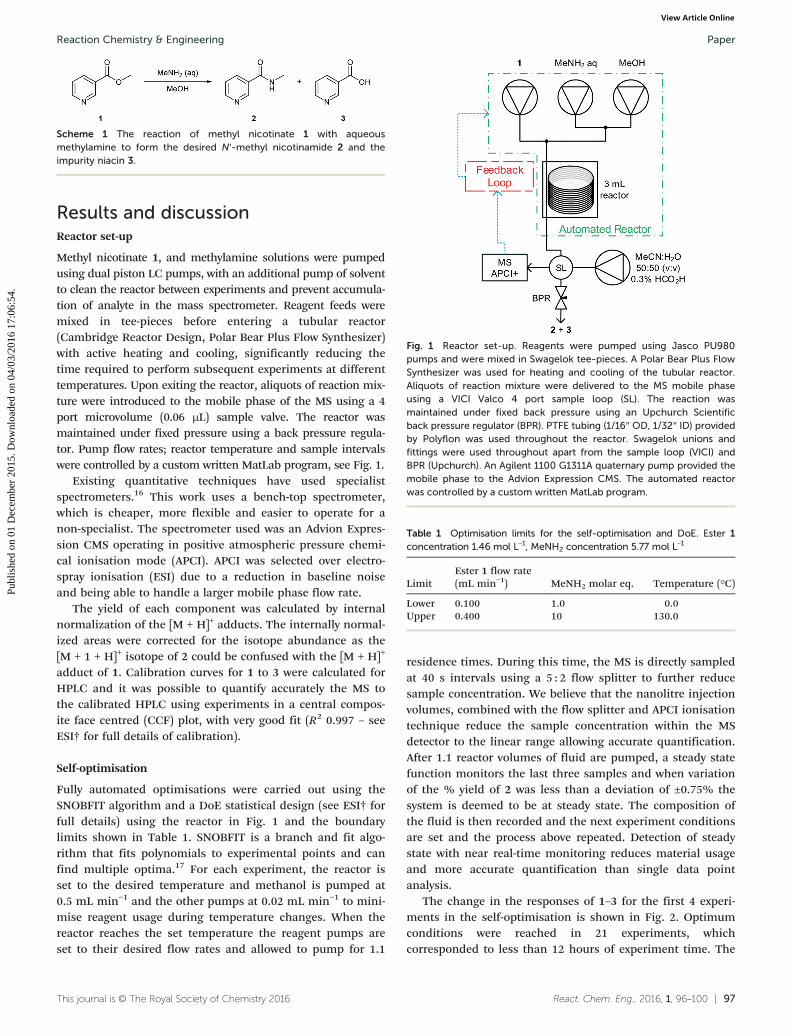
Methyl nicotinate 1, and methylamine solutions were pumpedusing dual piston LC pumps, with an additional pump of solventto clean the reactor between experiments and prevent accumula-tion of analyte in the mass spectrometer. Reagent feeds weremixed in tee-pieces before entering a tubular reactor(Cambridge Reactor Design, Polar Bear Plus Flow Synthesizer)with active heating and cooling, significantly reducing thetime required to perform subsequent experiments at differenttemperatures. Upon exiting the reactor, aliquots of reaction mix-ture were introduced to the mobile phase of the MS using a 4port microvolume (0.06 μL) sample valve. The reactor wasmaintained under fixed pressure using a back pressure regula-tor. Pump flow rates; reactor temperature and sample intervalswere controlled by a custom written MatLab program, see Fig. 1.
Existing quantitative techniques have used specialistspectrometers.16 This work uses a bench-top spectrometer,which is cheaper, more flexible and easier to operate for anon-specialist. The spectrometer used was an Advion Expres-sion CMS operating in positive atmospheric pressure chemi-cal ionisation mode (APCI). APCI was selected over electro-spray ionisation (ESI) due to a reduction in baseline noiseand being able to handle a larger mobile phase flow rate.
The yield of each component was calculated by internalnormalization of the [M + H]+ adducts. The internally normal-ized areas were corrected for the isotope abundance as the[M + 1 + H]+ isotope of 2 could be confused with the [M + H]+
adduct of 1. Calibration curves for 1 to 3 were calculated forHPLC and it was possible to quantify accurately the MS tothe calibrated HPLC using experiments in a central compos-ite face centred (CCF) plot, with very good fit (R2 0.997 – seeESI† for full details of calibration).
Self-optimisation
Fully automated optimisations were carried out using theSNOBFIT algorithm and a DoE statistical design (see ESI† forfull details) using the reactor in Fig. 1 and the boundarylimits shown in Table 1. SNOBFIT is a branch and fit algo-rithm that fits polynomials to experimental points and canfind multiple optima.17 For each experiment, the reactor isset to the desired temperature and methanol is pumped at0.5 mL min−1 and the other pumps at 0.02 mL min−1 to mini-mise reagent usage during temperature changes. When thereactor reaches the set temperature the reagent pumps areset to their desired flow rates and allowed to pump for 1.1
residence times. During this time, the MS is directly sampledat 40 s intervals using a 5 : 2 flow splitter to further reducesample concentration. We believe that the nanolitre injectionvolumes, combined with the flow splitter and APCI ionisationtechnique reduce the sample concentration within the MSdetector to the linear range allowing accurate quantification.After 1.1 reactor volumes of fluid are pumped, a steady statefunction monitors the last three samples and when variationof the % yield of 2 was less than a deviation of ±0.75% thesystem is deemed to be at steady state. The composition ofthe fluid is then recorded and the next experiment conditionsare set and the process above repeated. Detection of steadystate with near real-time monitoring reduces material usageand more accurate quantification than single data pointanalysis.
The change in the responses of 1–3 for the first 4 experi-ments in the self-optimisation is shown in Fig. 2. Optimumconditions were reached in 21 experiments, whichcorresponded to less than 12 hours of experiment time. The
Table 1 Optimisation limits for the self-optimisation and DoE. Ester 1concentration 1.46 mol L−1, MeNH2 concentration 5.77 mol L−1
LimitEster 1 flow rate(mL min−1) MeNH2 molar eq. Temperature (°C)
Lower 0.100 1.0 0.0Upper 0.400 10 130.0
Scheme 1 The reaction of methyl nicotinate 1 with aqueousmethylamine to form the desired N′-methyl nicotinamide 2 and theimpurity niacin 3.
Fig. 1 Reactor set-up. Reagents were pumped using Jasco PU980pumps and were mixed in Swagelok tee-pieces. A Polar Bear Plus FlowSynthesizer was used for heating and cooling of the tubular reactor.Aliquots of reaction mixture were delivered to the MS mobile phaseusing a VICI Valco 4 port sample loop (SL). The reaction wasmaintained under fixed back pressure using an Upchurch Scientificback pressure regulator (BPR). PTFE tubing (1/16″ OD, 1/32″ ID) providedby Polyflon was used throughout the reactor. Swagelok unions andfittings were used throughout apart from the sample loop (VICI) andBPR (Upchurch). An Agilent 1100 G1311A quaternary pump provided themobile phase to the Advion Expression CMS. The automated reactorwas controlled by a custom written MatLab program.
Reaction Chemistry & Engineering Paper
Publ
ishe
d on
01
Dec
embe
r 20
15. D
ownl
oade
d on
04/
03/2
016
17:0
6:54
. View Article Online

98 | React. Chem. Eng., 2016, 1, 96–100 This journal is © The Royal Society of Chemistry 2016
optimum conditions generate 2 in 93% yield (ester 1 flowrate 0.1 mL min−1, MeNH2 10 eq., 10.6 °C, Fig. 3).
Design of experiments
A DoE statistical design was constructed using a CCF design,which enables curvature of the response surface to bemodelled statistically. The reaction conditions were rankedinto blocks of ascending temperature and then randomisedwithin these blocks. Traditionally, statistical experimentsrequire full randomisation to eliminate systematic errors thatcan create bias in the results.18 However, we have found thatwaiting for heating and cooling of the reactor is the biggestcontributor to the total optimisation time, and thatrandomisation did not lead to any difference in experimentalresults. Therefore it was decided that a higher intensification
of experiments could be achieved with ascending ordering oftemperature.
Models for the composition of compounds 1–3 were gen-erated by creating a saturated model including all square andinteraction terms and then manually removing any non-significant terms.19 The yield of 2 for each data point isshown in Fig. 4, and further model information can be foundin the ESI.† These models were generated using experimentsconducted over a period of 5.5 hours with excellent fit andpredictability (R2 = 0.999 and Q2 = 0.977). An optimum for 2was predicted by minimizing 1 and 3 and maximizing 2,which predicted conditions to generate 2 in 96% yield (ester1 flow 0.1 mL min−1, MeNH2 9.7 eq., 7 °C, Fig. 5).
Fig. 2 MS plot for the first 4 experiments in the self-optimisationwhere red is 1, green is 2 and blue is 3. The filled points show the lastthree points where steady state was reached.
Fig. 3 Optimisation plot for the SNOBFIT self-optimisation of amide 2.Optimum point highlighted by the star, ester 1 flow rate 0.1 mL min−1,MeNH2 10 eq., 10.6 °C.
Fig. 5 Contour plot for the optimum conditions derived from the CCFmodel, generated in MODDE. Temperature fixed at 7 °C, optimumpoint highlighted by the crosshair.
Fig. 4 3-D plot showing the yield of 2 for each experimental datapoint in the CCF DoE.
Reaction Chemistry & EngineeringPaper
Publ
ishe
d on
01
Dec
embe
r 20
15. D
ownl
oade
d on
04/
03/2
016
17:0
6:54
. View Article Online

React. Chem. Eng., 2016, 1, 96–100 | 99This journal is © The Royal Society of Chemistry 2016
Conclusions
Online MS has been shown to optimise a model reactionusing an automated continuous reactor. It was possible tocalibrate the MS signal to HPLC using linear relativeresponse values, with minimal effort in data manipulation. Itwas also possible to distinguish between product adductsand isotope patterns. The MS was subsequently used to deter-mine steady state and calculate the yield in two separate opti-misations. The optimum conditions achieved match very wellshowing the high reproducibility using this approach(Table 1) and either approach could be used to optimise thereaction system. It is important to consider that SNOBFITexperimentally verifies the optimum as part of the algorithmprocess giving higher confidence but took significantly longer(12 hours vs. 5.5 hours) than the structured DoE optimisationas these experiments were ordered to minimize reactor tem-perature changes. However it should be noted that a fullyrandomised statistical design would take considerablylonger.
In addition, statistical modelling of the SNOBFIT datacould also be performed to generate similar response surfacemodels to the DoE model due to good coverage of the reac-tion space. It is also possible to verify model performance byinputting the SNOBFIT dataset into the DoE model. Forexample the optimal SNOBFIT data point from Table 2 waspredicted to have a yield of 96% by the DoE model.
MS has the potential to be a powerful process analyticaltechnology. Discrete separation and product quantificationcan be achieved with minimal method development, and sig-nificantly reduced method times when compared to chroma-tography. Therefore rapid analysis with detailed molecularcharacterization information can be obtained. This has beenexploited to enable rapid optimisation using both a black-boxalgorithm and statistical optimisation of an automated flowreactor and we aim to extend the scope to more complexchemistries using compounds that are difficult to analyseusing other techniques.
Acknowledgements
We would like to thank Tony Bristow and Andy Ray from AZfor MS experimental set-up advice and Andy Baker, MarkAllen and Clive Aldcroft from Advion. We would also like tothank Matthew Broadbent for technical support as well as
Katherine Jolley, William Reynolds and Mary Gunn. Financialsupport was provided by AstraZeneca, EPSRC DTG fundingand the University of Leeds.
Notes and references
1 N. Holmes and R. A. Bourne, in Chemical ProcessTechnology for a Sustainable Future, ed. T. M. Letcher, J.L. Scott and D. A. Paterson, RSC Publishing, 1st edn,2014, ch. 3, pp. 28–45; C. Henry, D. Bolien, B. Ibanescu,S. Bloodworth, D. C. Harrowven, X. L. Zhang, A. Craven,H. F. Sneddon and R. J. Whitby, Eur. J. Org. Chem.,2015, 1491–1499; B. Gutmann, P. Elsner, A. O'Kearney-McMullan, W. Goundry, D. M. Roberge and C. O. Kappe,Org. Process Res. Dev., 2015, 19, 1062–1067; S. C. Stouten,T. Noel, Q. Wang and V. Hessel, Chem. Eng. J.,2015, 279, 143–148; C. J. Smith, N. Nikbin, S. V. Ley, H.Lange and I. R. Baxendale, Org. Biomol. Chem., 2011, 9,1938–1947.
2 R. A. Skilton, R. A. Bourne, Z. Amara, R. Horvath, J. Jin, M. J.Scully, E. Streng, S. L. Y. Tang, P. A. Summers, J. Wang, E.Perez, N. Asfaw, G. L. P. Aydos, J. Dupont, G. Comak, M. W.George and M. Poliakoff, Nat. Chem., 2015, 7, 1–5; M.Rasheed and T. Wirth, Angew. Chem., Int. Ed., 2011, 50,357–358; S. V. Ley, D. E. Fitzpatrick, R. J. Ingham and R. M.Myers, Angew. Chem., Int. Ed., 2015, 54, 3449–3464; S. V. Ley,D. E. Fitzpatrick, R. M. Myers, C. Battilocchio and R. J.Ingham, Angew. Chem., Int. Ed., 2015, 54, 10122–10136.
3 S. Krishnadasan, R. J. C. Brown, A. J. de Mello and J. C. deMello, Lab Chip, 2007, 7, 1434–1441.
4 J. P. McMullen and K. F. Jensen, Org. Process Res. Dev.,2010, 14, 1169–1176.
5 A. J. Parrott, R. A. Bourne, G. R. Akien, D. J. Irvine and M.Poliakoff, Angew. Chem., Int. Ed., 2011, 50, 3788–3792; R. A.Bourne, R. A. Skilton, A. J. Parrott, D. J. Irvine and M.Poliakoff, Org. Process Res. Dev., 2011, 15, 932–938; D. N.Jumbam, R. A. Skilton, A. J. Parrott, R. A. Bourne and M.Poliakoff, J. Flow Chem., 2012, 2, 24–27.
6 R. A. Skilton, A. J. Parrott, M. W. George, M. Poliakoff andR. A. Bourne, Appl. Spectrosc., 2013, 67, 1127–1131.
7 V. Sans, L. Porwol, V. Dragone and L. Cronin, Chem. Sci.,2015, 6, 1258–1264.
8 J. S. Moore and K. F. Jensen, Org. Process Res. Dev., 2012, 16,1409–1415.
9 J. P. McMullen and K. F. Jensen, Org. Process Res. Dev.,2011, 15, 398–407.
10 B. J. Reizman and K. F. Jensen, Org. Process Res. Dev.,2012, 16, 1770–1782.
11 J. S. Moore and K. F. Jensen, Angew. Chem., Int. Ed.,2014, 53, 470–473.
12 C. J. Smith, N. Nikbin, S. V. Ley, H. Lange and I. R.Baxendale, Org. Biomol. Chem., 2011, 9, 1938–1947; C. F.Carter, H. Lange, S. V. Ley, I. R. Baxendale, B. Wittkamp,J. G. Goode and N. L. Gaunt, Org. Process Res. Dev., 2010, 14,393–404.
Table 2 Comparison of the optimum conditions obtained through theCCF (predicted) and self-optimisation (experimental)
Optimisation
Ester 1flow rate(mL min−1)
MeNH2
molar eq.Temperature(°C)
Amide2 yield (%)
DoE predicted 0.100 9.7 7 96 (predicted)ExperimentalSNOBFIT
0.100 10 10.6 93(experimental)
Reaction Chemistry & Engineering Paper
Publ
ishe
d on
01
Dec
embe
r 20
15. D
ownl
oade
d on
04/
03/2
016
17:0
6:54
. View Article Online

100 | React. Chem. Eng., 2016, 1, 96–100 This journal is © The Royal Society of Chemistry 2016
13 S. A. Leung, R. F. Winkle, R. C. R. Wootton and A. J. deMello,Analyst, 2005, 130, 46–51; M. F. Roberto, T. I. Dearing, S.Martin and B. J. Marquardt, J. Pharm. Innov., 2012, 7, 69–75;O. Bleie, M. F. Roberto, T. I. Dearing, C. W. Branham, O. M.Kvalheim and B. J. Marquardt, J. Flow Chem., 2015, 5, 183–189.
14 D. L. Browne, S. Wright, B. J. Deadman, S. Dunnage, I. R.Baxendale, R. M. Turner and S. V. Ley, Rapid Commun. MassSpectrom., 2012, 26, 1999–2010; T. W. T. Bristow, A. D. Ray,A. O'Kearney-McMullan, L. Lim, B. McCullough and A.Zammataro, J. Am. Soc. Mass Spectrom., 2014, 25, 1794–1802;K. M. Roscioli, X. Zhang, S. X. Li, G. H. Goetz, G. Cheng, Z.Zhang, W. F. Siems and H. H. Hill Jr., Int. J. Mass Spectrom.,2013, 336, 27–36.
15 J. S. Mathieson, M. H. Rosnes, V. Sans, P. J. Kitson and L.Cronin, Beilstein J. Nanotechnol., 2013, 4, 285–291; D. E.
Fitzpatrick, C. Battilocchio and S. V. Ley, Org. Process Res.Dev., 2015, DOI: 10.1021/acs.oprd.5b00313.
16 W. Zhao, Z. Jusys and R. J. Behm, Anal. Chem., 2010, 82,2472–2479; Z. Zhu, J. E. Bartmess, M. E. McNally, R. M.Hoffman, K. D. Cook and L. Song, Anal. Chem., 2012, 84,7547–7554; A. W. Owen, E. A. J. McAulay, A. Nordon, D.Littlejohn, T. P. Lynch, J. S. Lancaster and R. G. Wright,Anal. Chim. Acta, 2014, 849, 12–18.
17 W. Huyer and A. Neumaier, ACM Trans. Math. Softw.,2008, 35, 1–25.
18 M. R. Owen, C. Luscombe, Lai, S. Godbert, D. L. Crookesand D. Emiabata-Smith, Org. Process Res. Dev., 2001, 5,308–323.
19 DoE models were analysed and optimised using MODDEv10.1.1 (Umetrics).
Reaction Chemistry & EngineeringPaper
Publ
ishe
d on
01
Dec
embe
r 20
15. D
ownl
oade
d on
04/
03/2
016
17:0
6:54
. View Article Online
![Reaction rates for mesoscopic reaction-diffusion … rates for mesoscopic reaction-diffusion kinetics ... function reaction dynamics (GFRD) algorithm [10–12]. ... REACTION RATES](https://img.pdfslide.us/doc/110x75/5b33d2bc7f8b9ae1108d85b3/reaction-rates-for-mesoscopic-reaction-diffusion-rates-for-mesoscopic-reaction-diffusion.jpg)