Embed Size (px)
Citation preview
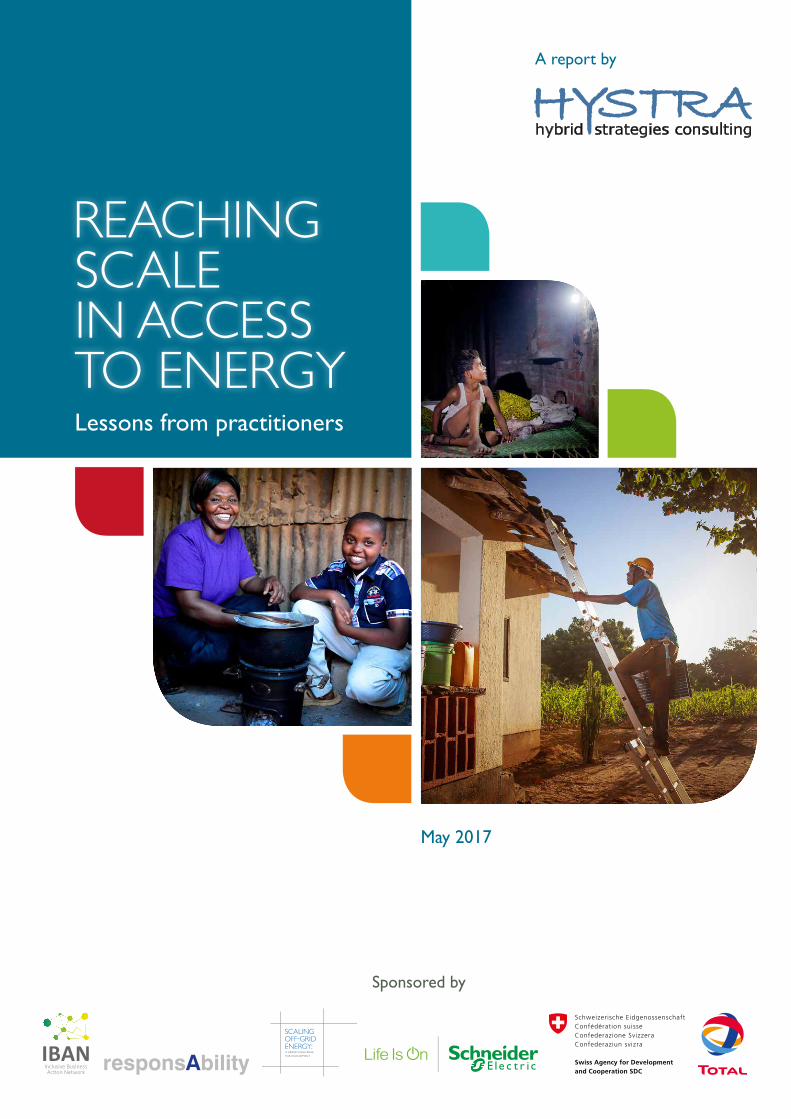
Lessons from practitioners
May 2017
A report by
Sponsored by
REACHING SCALE IN ACCESS TO ENERGY
About Hystra
Hystra is a global consulting firm that works with business and social sector pioneers to design and implement inclusive business approaches that are profitable, scalable and eradicate social and environmental problems. In order to “be the change we want to see in the world”, Hystra itself is a hybrid consulting firm – a for-profit tool for social change. Since its creation in 2009, Hystra has conducted in-depth sectorial studies on clean energy, safe water, sanitation, affordable housing, nutrition and ICT-based business models for development, analyzed winning sales and marketing strategies in micro-distribution, prepared business plans for pioneering inclusive businesses and supported the creation of a social impact fund. In eight years Hystra has worked in over 20 countries serving about 60 clients, including large corporations, international aid agencies, foundations, and governments, to support business models that change the lives of low-income communities across the globe.
For more information on Hystra and our publications, visit www.hystra.com
Hystra is the sole author of this report. Analyses and conclusions reported here do not necessarily reflect the views and policies of the sponsors. The sponsors do not guarantee the accuracy of the data included in this publication and accept no responsibility for any consequence of their use. By making any designation of or reference to a particular territory or geographic area, or by using the term “country” in this document, the sponsors do not intend to make any judgments as to the legal or other status of any territory or area.
Authors: François Lepicard (Network Partner), Olivier Kayser (Founding Partner), Jessica Graf (Network Partner), Simon Brossard (Project Manager), Adrien Darodes de Tailly (Consultant), Lucie Klarsfeld McGrath (Expert in marketing and distribution at the BoP)
Contributors: Capucine Collin, Héloïse Zimmermann, Louis Wouters (Junior Consultants)
Please direct queries about this report to: [email protected], [email protected] and [email protected]
Cover picture credits (clockwise from the left)
1 Mera Gao Power
2 Envirofit
3 © 2017 Off-Grid Electric, Ltd.
REACHING SCALE IN ACCESS TO ENERGY: Lessons from best practitioners 1
All case studies are available on www.hystra.com
CONTENTS1. FOREWORD 3
2. ACKNOWLEDGEMENTS 4
3. EXECUTIVE SUMMARY 5
4. SCOPE AND METHODOLOGY 12Scope 12Methodology 14
5. LANDSCAPE OF ENERGY SOLUTIONS 17Access to electricity 17Access to improved cook stoves 21Social impact 24
6. SOLAR LANTERNS 27Market outlook and opportunities 27Business models and challenges 30Recommendations 35
7. SOLAR HOME SYSTEMS 39Market outlook and opportunities 39Business models and challenges 41Recommendations 50
8. CLEAN ENERGY MICROGRIDS 55Market outlook and opportunities 55Business models and challenges 58Recommendations 65
9. SOLAR IRRIGATION PUMPS 69Market outlook and opportunities 69Business models and challenges 72Survey of micro-pump users 76Recommendations 79
10. IMPROVED COOK STOVES 83Market outlook and opportunities 83Business models and challenges 84Recommendations 88
11. CONCLUSION 92
Credit: Blue Sky
REACHING SCALE IN ACCESS TO ENERGY: Lessons from best practitioners 3
1. FOREWORDWhen we concluded Hystra’s previous report on access to energy in 20091, we shared the views of most observers, considering technology trends and the promising business models in various regions of the world, that the number of people without access to electricity or efficient cooking stoves would decrease significantly by 2017.
The technologies and designs, in particular for alternatives to the grid, have held their promise and are keeping their momentum. Numerous entrepreneurs have courageously jumped into the fray with no shortage of successes, and still with ample room for improvement.
Yet, while energy access has increased as a proportion of the population, in absolute numbers there are still almost as many households without access as there were 8 years ago2. More than one billion people still do not have access to electricity, and about three times as many to harmless cooking facilities. Specifically, the poorest people living in rural areas are not yet reached, or only with minimal, low-power, and often short-lived devices. The Sustainable Development Goals – SDG 7: Ensure access to affordable, reliable, sustainable and modern energy for all – are calling for an acceleration in the deployment of energy access solutions.
So why are existing proven solutions not reaching markets fast enough? Why do so few projects provide affordable energy at a scale that can support productive equipment, or higher capacity? Problems such as last mile distribution (e.g. challenges of rural sales and service models for solar systems), financing (e.g. lack of early-stage venture capital with sufficient risk appetite, or local currency debt for companies with high foreign exchange risk exposure), regulation (e.g. limiting the viability of microgrids, or increasing the cost of imports), market distortions (e.g. give-away programs competing with cook stoves distribution businesses), all hinder the efforts of the relatively small companies serving the energy access markets.
While all of these obstacles are real, we wanted to take a closer look and listen to what practitioners could tell us. Successful entrepreneurs –whose projects had reached a significant size and/or developed particularly innovative approaches– have unique insights. We asked them to share what they had learned and what was holding them back. This collaborative approach allowed us to craft recommendations on how to unlock their growth potential.
We focused on market-based approaches, because we believe that only sustainable business models can reach the millions who lack access to energy, i.e. where low-income people are seen as customers instead of beneficiaries, and where goods and services are sold to them at a price that could make the value chains economically sustainable. This however does not exclude donors’ roles as initiators, seed, support and coaches of these businesses, nor governments’ role as long-term investors looking for positive externalities.
In order to define the best of lessons learnt from entrepreneurs, we picked among those approaches that had the highest volumes or innovation dynamics, namely solar lanterns, improved cook stoves, solar home systems, clean energy microgrids, and solar irrigation pumps. This set of solutions has the potential not only to provide energy access, but also to support customers in “moving up the energy ladder”, to acquire supplementary power as their income improves and new opportunities emerge.
This report is intended for entrepreneurs, as well as large companies, investors, donors, and governments who are open to learn from inspiring practitioners, and who believe that market-based approaches have a major role to play in the sustainable provision of energy for all.
1 Hystra (2009), Access to Energy for the Base of the Pyramid2 For electricity access, the World Energy Outlook database records 450 million people who gained access to electricity between 2009 and 2013 however
this is largely compensated by population growth hence the global electrified population was only reduced by 126 million people. Looking at cooking, the number of people using solid fuel as their primary cooking source increased by 135 million over the same period
REACHING SCALE IN ACCESS TO ENERGY: Lessons from best practitioners4
2. ACKNOWLEDGEMENTSWe would like to give special thanks to the teams without whom this study would not have been possible, who have welcomed us and given us their time and insights over the past few months. We would also like to thank the experts who took the time to answer our questions and review this report.
CASE STUDY TEAMSBaobab+: Alexandre Coster, Sandrine MarmolejoBioLite: Ethan Kay, Jan de GraafBURN: Boston NyerClaro Energy: Soumitra Mishra, Kartik Wahi, Pravin Tiwari, Gaurav Chaudhary, Akshay Aggarwal, Praveen Sinha, Anirban Banerjeed.light: Ned Tozun, Rohit Jain, Vishesh Gupta, Kamal Lath, Viney SharmaDevergy: Fabio De Pascale, Gianluca Cescon, Witek LukaszynskiEnvirofit: Jessica Alderman, Tim BauerFenix: Caitlin Burton, Erin BoehmerGERES: Julien JacquotGreenlight Planet: Anish Thakkar, Radhika Thakkar, Melissa Lo, Patrick MuriukiHusk: Manoj Sinha, Col. Baljit SinghJAIN: Anil Jain, Sanjeev Phadnis, Anupkumar AgiwalLumos: Ron Margalit, Yuri Tsitrinbaum, Yaniv ShoshanM-KOPA: Chad LarsonMera Gao Power: Nikhil Jaisinghani, Sandeep PandeyMobisol: Thomas Duveau, Klara Lindner, Sjors Martens, Saad Latif, Tim Kasperidus, Helen Tiemann, Fasil Eyassu, Robert ZeidlerOff Grid Electric: Xavier HelgesenOMC Power: Sarraju Narasinga Rao, Andreas Dahl-JorgensenPowerGen: Johannes Holst, Brian Jaoko, Aaron Cheng, Eve Meyer, Ben CornellPowerHive: Christopher Hornor, Rik WutsRafiki Power: Gerrit Wiezoreck, Sebastian Rieger, Daniel BeckerRenewit: Richard AtwalSolar Energy Foundation: Harald SchutzeichelSimpa Networks: Piyush Mathur, Mitali SahniSolarNow: Willem Nolens, Ronald Schuurhuizen, Javier OlaguibelToyola: Suraj Wahab
SPONSORSTotal: Philippe Cabus, Gregory Durand, Helena Delessy Dorvillius, Arnaud Rouget Schneider Electric: Gilles Vermot-Desroches, Thomas André, Christophe PolineresponsAbility: Antonia Schaeli, Stefan Issler, Magdalena Gampp, Andre LottersbergerUSAID: Sarah Bieber, Maurice Kent, Kristina Kempkey ADB: Yukito ItoIBAN: Christian Jahn, Markus DietrichSDC: Peter Beez, Reto Thoenen
EXPERTS INTERVIEWEDNicolas Guichard (AFD), Mark Hankins (African Solar Design), Lindsay Caldwell (Angaza Design), Alexandre Tourre (Azimuth Solar), Nico Tyabji (Bloomberg New Energy Finance), Dipal Barua (Bright Green Energy Foundation), Saul Morris (CIFF), Hari Natarajan (CLEAN), Phil La Rocco (Columbia University), Jake Cusack (CrossBoundary Energy), Aurélie Lepage (Ecosur Afrique), Marcel Raats (ENDEV, RVO), Elina Weber (ENDEV), Ada Marmion (Energy4Impact), Adam Mwambo (Energy4Impact), Simon Collings (Energy4Impact), Shashank Verma (Energy4Impact), Mukund Deogaonkar (First Energy), Toby Hammond (Futurepump), Bozhil Kondev (GIZ), Markus Dietrich (GIZ), Koen Peters (GOGLA), Jim Ayala (Hybrid Network), Russell Sturm (IFC), Thomas Plagge (The Impact Lab), Leo Schiefermueller (Jumeme), Alan Spybey (Kickstart), Juan Jose Estrada Toledo (Kingo), Chris Aidun (Persistent Energy Partners), Stephan Abric (Practica), Laure Vincotte (Rassembleurs d’Energies), Martin Hullin (REN21), Jordan Broadbent (Shell Foundation), Lisa Conibear (Shell Foundation), Emma Miller (Shell Foundation), Josh Sebastian (SNV), Andreas Spiess (SolarKiosk), Debajit Palit (TERI), Neil Bellefeuille (The Paradigm project), Dean Cooper (UNEP), Anne Maassen (WRI)
EXEC
UT
IVE
SUM
MA
RY
5REACHING SCALE IN ACCESS TO ENERGY: Lessons from best practitioners
3. EXECUTIVE SUMMARYThis report investigates barriers and solutions to scale for market-based approaches offering cleaner energy access to low-income customers in developing countries, for home and small scale productive uses.
The objective is not to provide an exhaustive view across all technologies and geographies, but rather to learn from a selection of the most innovative and successful practitioners, representing solutions with high potential and innovation dynamics: solar lanterns, solar home systems, clean energy microgrids, solar irrigation pumps, and improved cook stoves.
The findings are based on an in-depth review of the performance and work of 26 practitioners, selected after a global scan of over 300 organizations. While the lessons drawn from them may not be applicable in all situations, they will hopefully inspire other practitioners, as well as donors, investors, companies, and policy makers, in their efforts to provide access to energy for all.
LANDSCAPE OF ENERGY SOLUTIONS
Access to electricity
• Market-based approaches have flourished for 240 million off-grid and 200 million poor-grid households, who spend altogether over US$20 billion annually in non-cooking energy (i.e. mainly lighting and phone charging), hence representing a significant market opportunity.
• Using population density and energy intensity as driving criteria, solar lanterns are estimated to have the largest reach potential (130-150 million households), followed by solar home systems (90-110 million) and clean energy microgrids (50-60 million). Lastly, 30-50 million very poor and 100-120 million isolated rural households would remain un-addressed by current market-based approaches.
Access to improved cook stoves
• Over 600 million households use solid fuels as their primary fuel source for cooking, with serious health, economic, and environmental consequences. A range of improved cook stoves (ICS) have emerged to provide more efficient and cleaner cooking.
The best suited products and business models vary greatly across customer segments, based on whether households purchase or collect their fuel, their cooking and fuel habits, and income levels.
• Considering the 250-270 million fuel purchasers as potential buyers of ICS, the attainable market is US$1.4 billion annually, for stoves only. Cooking fuels represent a significantly larger opportunity. The 350-360 million fuel collectors, who have little economic incentives for buying ICS, are unlikely to be reached by current market-based approaches.
Social impact
• The quantification of impact requires significant caution. Taking a number of caveats into account, this report goes through an extrapolation process to estimate that – if their full market potential was addressed – energy access solutions combined would save 200-230 million tons of CO2 and 500-570 thousand lives every year. Other major social impact areas include development opportunities through productive uses, educational benefits, time saving, and financial inclusion.
6 REACHING SCALE IN ACCESS TO ENERGY: Lessons from best practitioners
EXEC
UT
IVE SU
MM
ARY
SOLAR LANTERNS
Market outlook and opportunities
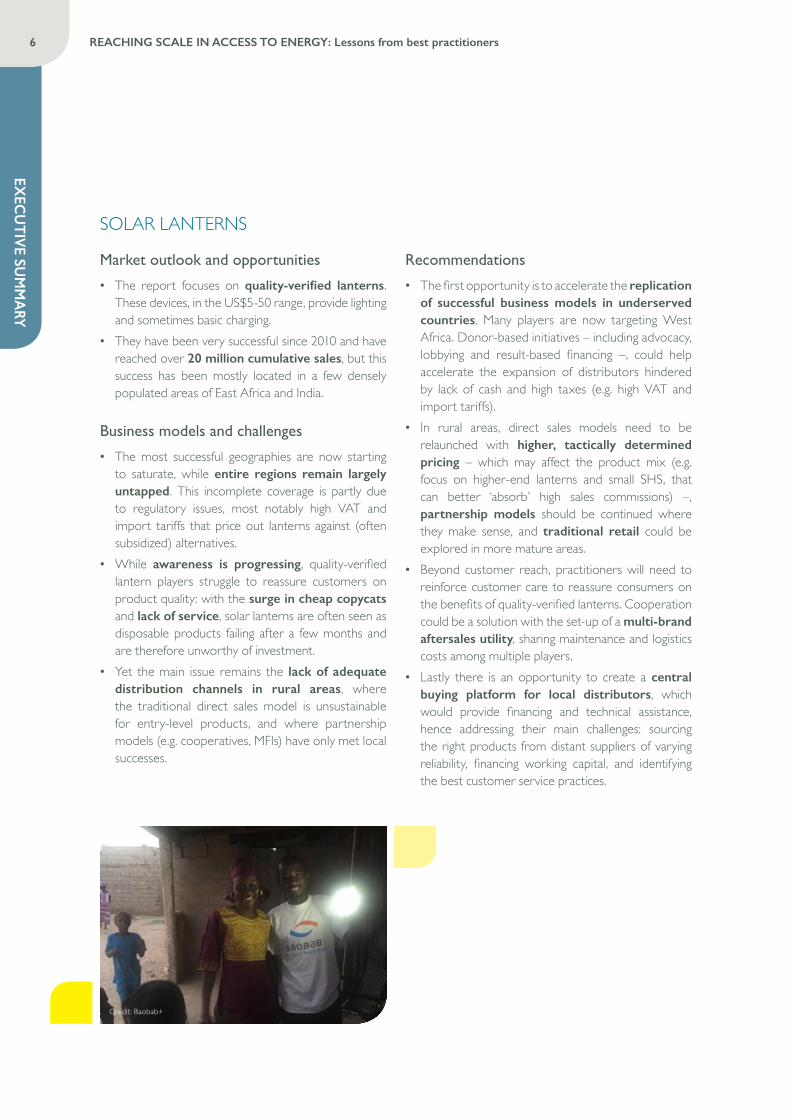
• The report focuses on quality-verified lanterns. These devices, in the US$5-50 range, provide lighting and sometimes basic charging.
• They have been very successful since 2010 and have reached over 20 million cumulative sales, but this success has been mostly located in a few densely populated areas of East Africa and India.
Business models and challenges
• The most successful geographies are now starting to saturate, while entire regions remain largely untapped. This incomplete coverage is partly due to regulatory issues, most notably high VAT and import tariffs that price out lanterns against (often subsidized) alternatives.
• While awareness is progressing, quality-verified lantern players struggle to reassure customers on product quality: with the surge in cheap copycats and lack of service, solar lanterns are often seen as disposable products failing after a few months and are therefore unworthy of investment.
• Yet the main issue remains the lack of adequate distribution channels in rural areas, where the traditional direct sales model is unsustainable for entry-level products, and where partnership models (e.g. cooperatives, MFIs) have only met local successes.
Recommendations
• The first opportunity is to accelerate the replication of successful business models in underserved countries. Many players are now targeting West Africa. Donor-based initiatives – including advocacy, lobbying and result-based financing –, could help accelerate the expansion of distributors hindered by lack of cash and high taxes (e.g. high VAT and import tariffs).
• In rural areas, direct sales models need to be relaunched with higher, tactically determined pricing – which may affect the product mix (e.g. focus on higher-end lanterns and small SHS, that can better ‘absorb’ high sales commissions) –, partnership models should be continued where they make sense, and traditional retail could be explored in more mature areas.
• Beyond customer reach, practitioners will need to reinforce customer care to reassure consumers on the benefits of quality-verified lanterns. Cooperation could be a solution with the set-up of a multi-brand aftersales utility, sharing maintenance and logistics costs among multiple players.
• Lastly there is an opportunity to create a central buying platform for local distributors, which would provide financing and technical assistance, hence addressing their main challenges: sourcing the right products from distant suppliers of varying reliability, financing working capital, and identifying the best customer service practices.
Credit: Baobab+
EXEC
UT
IVE
SUM
MA
RY
7REACHING SCALE IN ACCESS TO ENERGY: Lessons from best practitioners
SOLAR HOME SYSTEMS (SHS)
Market outlook and opportunities
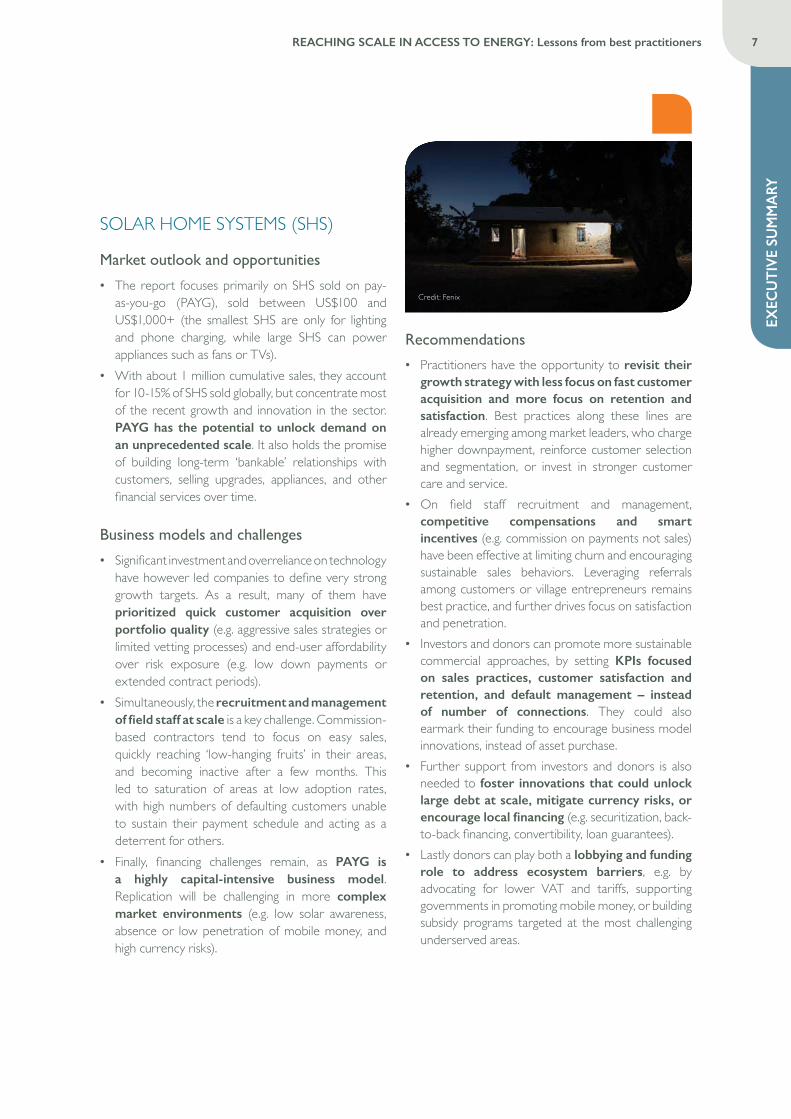
• The report focuses primarily on SHS sold on pay-as-you-go (PAYG), sold between US$100 and US$1,000+ (the smallest SHS are only for lighting and phone charging, while large SHS can power appliances such as fans or TVs).
• With about 1 million cumulative sales, they account for 10-15% of SHS sold globally, but concentrate most of the recent growth and innovation in the sector. PAYG has the potential to unlock demand on an unprecedented scale. It also holds the promise of building long-term ‘bankable’ relationships with customers, selling upgrades, appliances, and other financial services over time.
Business models and challenges
• Significant investment and overreliance on technology have however led companies to define very strong growth targets. As a result, many of them have prioritized quick customer acquisition over portfolio quality (e.g. aggressive sales strategies or limited vetting processes) and end-user affordability over risk exposure (e.g. low down payments or extended contract periods).
• Simultaneously, the recruitment and management of field staff at scale is a key challenge. Commission-based contractors tend to focus on easy sales, quickly reaching ‘low-hanging fruits’ in their areas, and becoming inactive after a few months. This led to saturation of areas at low adoption rates, with high numbers of defaulting customers unable to sustain their payment schedule and acting as a deterrent for others.
• Finally, financing challenges remain, as PAYG is a highly capital-intensive business model. Replication will be challenging in more complex market environments (e.g. low solar awareness, absence or low penetration of mobile money, and high currency risks).
Recommendations
• Practitioners have the opportunity to revisit their growth strategy with less focus on fast customer acquisition and more focus on retention and satisfaction. Best practices along these lines are already emerging among market leaders, who charge higher downpayment, reinforce customer selection and segmentation, or invest in stronger customer care and service.
• On field staff recruitment and management, competitive compensations and smart incentives (e.g. commission on payments not sales) have been effective at limiting churn and encouraging sustainable sales behaviors. Leveraging referrals among customers or village entrepreneurs remains best practice, and further drives focus on satisfaction and penetration.
• Investors and donors can promote more sustainable commercial approaches, by setting KPIs focused on sales practices, customer satisfaction and retention, and default management – instead of number of connections. They could also earmark their funding to encourage business model innovations, instead of asset purchase.
• Further support from investors and donors is also needed to foster innovations that could unlock large debt at scale, mitigate currency risks, or encourage local financing (e.g. securitization, back-to-back financing, convertibility, loan guarantees).
• Lastly donors can play both a lobbying and funding role to address ecosystem barriers, e.g. by advocating for lower VAT and tariffs, supporting governments in promoting mobile money, or building subsidy programs targeted at the most challenging underserved areas.
Credit: Fenix
8 REACHING SCALE IN ACCESS TO ENERGY: Lessons from best practitioners
EXEC
UT
IVE SU
MM
ARY
CLEAN ENERGY MICROGRIDS
Market outlook and opportunities
• The report focuses on AC, 5-100kW microgrids, serving groups of 25-500 customers and relying principally on renewable generation. They are a promising solution for small businesses and emerging middle-class households in dense off-grid areas, and the only short-term option for medium to high-load productive equipment in most villages. They are also more cost-efficient than diesel grids, and beat the economics of main grids in many rural contexts.
• Clean microgrids yet remain a very young sector with limited track record. Most players are less than 5 years old, with less than 10 thousand connections, and not yet profitable. As a rule of thumb, average revenues per user per month (ARPU) of about US$10 per month are required to breakeven, which most companies haven’t reached yet.
Business models and challenges
• Operators are required to master the risks of a long-term investment (declared payback without subsidies of 5 to 10 years) in a highly uncertain environment: competition with grid extension, regulation instability, technology risk, customer churn, or unstable consumption.
• In an asset-intensive industry, focusing on number of connections is counterproductive. Governments and donors have too often prioritized this objective and will encourage initiatives that yield the highest number of connections per dollar.
• That and the high level of uncertainty encourage operators and investors to focus on quick returns and high numbers, by restraining investment and market activation per site. A strategy which goes against long-term revenue development and profitability.
• Financing remains hard to secure because of the relatively small size of all actors. Debt is out of reach and equity investors are moving cautiously at this early stage.
Recommendations
• Companies should adopt more intensive ‘harvesting’ approaches, with stronger focus on ARPUs, e.g. through higher flexibility in value propositions, and market activation. This means targeting productive uses more systematically, and connecting households at the margin.
• Across sites, operators should also look at working in clusters, both to enable lower service costs, and to attract financing by aggregating several sites with different risk profiles.
• Donors should foster better investments rather than more, by setting standards, thresholds for main grid, acting as a guarantor, setting up multi-operator country level SPVs. Subsidies are still needed in many cases, to enable operators to invest more on generation and market activation.
• Governments also have a key role to play to de-risk the environment: beyond tariff exemptions, holistic regulatory approaches are needed to integrate microgrids in electricity extension strategies (e.g. feed-in, land regulation, anti-corruption measures). Lastly, regulators can set at least a level-playing field with politically and subsidy supported utilities.
Note on clean energy nanogrids
• Nanogrids (less than 5kW) cater to a totally different market, providing basic DC solutions for lighting and phone charging for clusters of 5-30 low-income households.
• They are sometimes dismissed as a toned-down version of SHS and a futureless transitory solution. They actually deserve more interest and support from investors and donors, because they are the only solution catering to the forgotten segment of access to energy.
• A number of uncertainties remain for this very young sector, e.g. on the relevant pricing models which could also cater to richer households, the strategies to maintain high usage rate and low churn, cost efficient operations and maintenance, and reduction of overheads with scale.
EXEC
UT
IVE
SUM
MA
RY
9REACHING SCALE IN ACCESS TO ENERGY: Lessons from best practitioners
SOLAR IRRIGATION PUMPS
Market outlook and opportunities
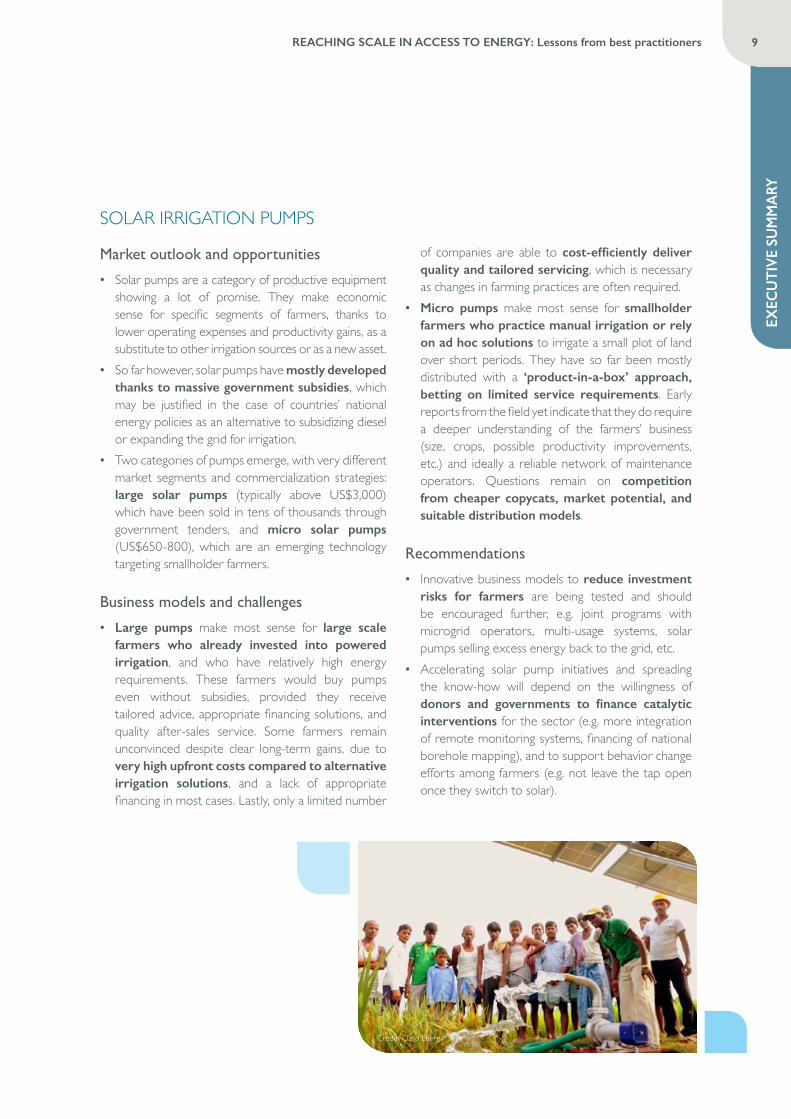
• Solar pumps are a category of productive equipment showing a lot of promise. They make economic sense for specific segments of farmers, thanks to lower operating expenses and productivity gains, as a substitute to other irrigation sources or as a new asset.
• So far however, solar pumps have mostly developed thanks to massive government subsidies, which may be justified in the case of countries’ national energy policies as an alternative to subsidizing diesel or expanding the grid for irrigation.
• Two categories of pumps emerge, with very different market segments and commercialization strategies: large solar pumps (typically above US$3,000) which have been sold in tens of thousands through government tenders, and micro solar pumps (US$650-800), which are an emerging technology targeting smallholder farmers.
Business models and challenges
• Large pumps make most sense for large scale farmers who already invested into powered irrigation, and who have relatively high energy requirements. These farmers would buy pumps even without subsidies, provided they receive tailored advice, appropriate financing solutions, and quality after-sales service. Some farmers remain unconvinced despite clear long-term gains, due to very high upfront costs compared to alternative irrigation solutions, and a lack of appropriate financing in most cases. Lastly, only a limited number
of companies are able to cost-efficiently deliver quality and tailored servicing, which is necessary as changes in farming practices are often required.
• Micro pumps make most sense for smallholder farmers who practice manual irrigation or rely on ad hoc solutions to irrigate a small plot of land over short periods. They have so far been mostly distributed with a ‘product-in-a-box’ approach, betting on limited service requirements. Early reports from the field yet indicate that they do require a deeper understanding of the farmers’ business (size, crops, possible productivity improvements, etc.) and ideally a reliable network of maintenance operators. Questions remain on competition from cheaper copycats, market potential, and suitable distribution models.
Recommendations
• Innovative business models to reduce investment risks for farmers are being tested and should be encouraged further, e.g. joint programs with microgrid operators, multi-usage systems, solar pumps selling excess energy back to the grid, etc.
• Accelerating solar pump initiatives and spreading the know-how will depend on the willingness of donors and governments to finance catalytic interventions for the sector (e.g. more integration of remote monitoring systems, financing of national borehole mapping), and to support behavior change efforts among farmers (e.g. not leave the tap open once they switch to solar).
Credit: Claro Energy
10 REACHING SCALE IN ACCESS TO ENERGY: Lessons from best practitioners
EXEC
UT
IVE SU
MM
ARY
IMPROVED COOK STOVES (ICS)
Market outlook and opportunities
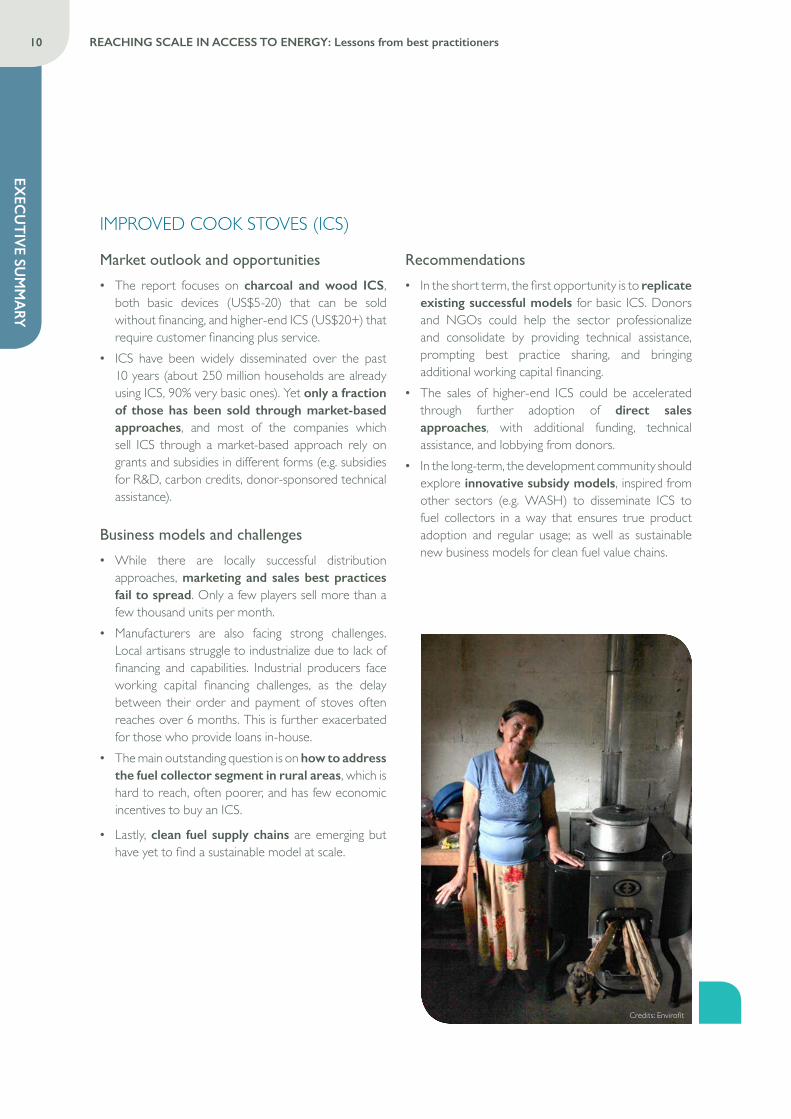
• The report focuses on charcoal and wood ICS, both basic devices (US$5-20) that can be sold without financing, and higher-end ICS (US$20+) that require customer financing plus service.
• ICS have been widely disseminated over the past 10 years (about 250 million households are already using ICS, 90% very basic ones). Yet only a fraction of those has been sold through market-based approaches, and most of the companies which sell ICS through a market-based approach rely on grants and subsidies in different forms (e.g. subsidies for R&D, carbon credits, donor-sponsored technical assistance).
Business models and challenges
• While there are locally successful distribution approaches, marketing and sales best practices fail to spread. Only a few players sell more than a few thousand units per month.
• Manufacturers are also facing strong challenges. Local artisans struggle to industrialize due to lack of financing and capabilities. Industrial producers face working capital financing challenges, as the delay between their order and payment of stoves often reaches over 6 months. This is further exacerbated for those who provide loans in-house.
• The main outstanding question is on how to address the fuel collector segment in rural areas, which is hard to reach, often poorer, and has few economic incentives to buy an ICS.
• Lastly, clean fuel supply chains are emerging but have yet to find a sustainable model at scale.
Recommendations
• In the short term, the first opportunity is to replicate existing successful models for basic ICS. Donors and NGOs could help the sector professionalize and consolidate by providing technical assistance, prompting best practice sharing, and bringing additional working capital financing.
• The sales of higher-end ICS could be accelerated through further adoption of direct sales approaches, with additional funding, technical assistance, and lobbying from donors.
• In the long-term, the development community should explore innovative subsidy models, inspired from other sectors (e.g. WASH) to disseminate ICS to fuel collectors in a way that ensures true product adoption and regular usage; as well as sustainable new business models for clean fuel value chains.
Credits: Envirofit
EXEC
UT
IVE
SUM
MA
RY
11REACHING SCALE IN ACCESS TO ENERGY: Lessons from best practitioners
CONCLUSIONThis report looked at very different solutions, serving specific segments and needs. Because they stand at various stages of maturity, each solution is confronted with unique growth challenges and opportunities. However, presented in this conclusion are three transversal insights, relevant across the board.
• There are multiple dimensions to achieving ‘scale’ which could be summarized with the following questions: How many people are you reaching? Are you reaching the population segments with the greatest need? Are your distribution channels sustainable and replicable? How are your solutions solving the problem in terms of uses enabled and value created? Reaching scale under these different dimensions will require companies to stretch, and build solutions for the unreached, with innovative distribution models and partnerships, and solutions that can ‘grow’ with customers. Investors will have to encourage focus on commercial discipline, long-term profitability, and reliability, before expansion. Donors will need to continue supporting experimentation and players in underserved areas, beyond quick connections. And governments will have a role to play in integrating off-grid and microgrid solutions into their national energy plans, regulations and policies.
• Customer care, is and will remain the key lever to sustainable scale. Great technologies such as efficient lights, mobile money, or smart meters, have contributed to accelerate the development of energy access, and have turned many low-income consumers into potential clients. But this is not enough, and there are multiple examples where overreliance on technology has actually led companies to underestimate the risk of default, underinvest in behavior change, in service, or in maintenance operations. Successful organizations need more than great products and financing solutions: they need to unlock affordability, access, and reliability. And this requires strong customer care driven organizations in the field, as only they can build long-term relationships with satisfied customers and drive word-of-mouth, loyalty, and repeat sales.
• The ‘green ocean’, i.e. the hundreds of millions of low-income rural families that could be reached by cleaner energies, remains largely untapped by market-based approaches and calls for more action from large corporates, donors and governments. It is unlikely that individual practitioners will be able to overcome the obstacles in the near future without support. Large corporates with extended rural network (e.g. FMCG companies, or agro companies buying from smallholder farmers) are in a unique position to leverage their reach to build distribution and aftersales logistics networks. Donors and governments also have a role to play – and ongoing subsidies may be required – with targeted interventions at the micro-level, e.g. supporting individual companies with financing and technical assistance; meso-level, e.g. result-based financing programs targeting remote areas; and macro-level, e.g. government tariff policies in rural sites, public-private partnerships.
12 REACHING SCALE IN ACCESS TO ENERGY: Lessons from best practitioners
SCO
PE AN
D M
ETH
OD
OLO
GY
4. SCOPE AND METHODOLOGYThis report aims to understand barriers and solutions to scale for market-based approaches3 offering cleaner energy access to low-income customers in developing countries, for home and small scale productive uses4. It follows a methodology developed and refined by Hystra in previous studies and publications. The fundamental idea is that there is more to learn from analyzing successes than analyzing problems. The objective is not to provide an exhaustive view of the energy access sector, across technologies and geographies, but rather to learn from a selection of the most innovative and successful practitioners.
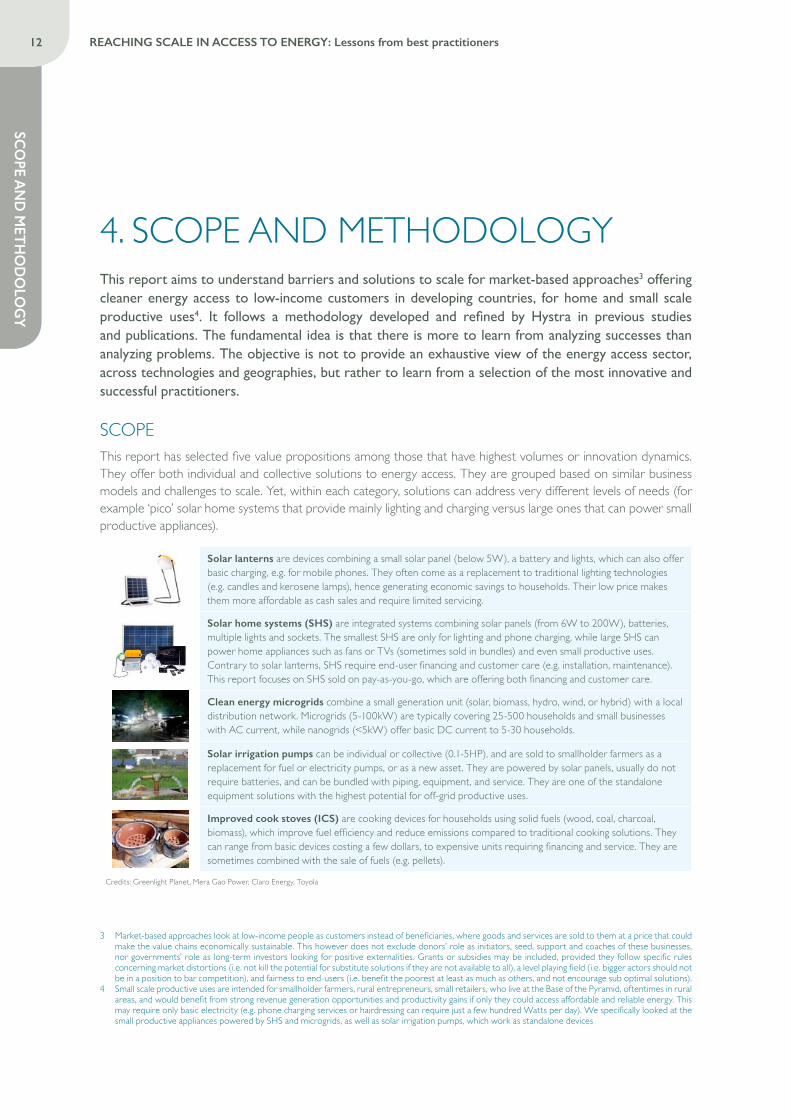
SCOPEThis report has selected five value propositions among those that have highest volumes or innovation dynamics. They offer both individual and collective solutions to energy access. They are grouped based on similar business models and challenges to scale. Yet, within each category, solutions can address very different levels of needs (for example ‘pico’ solar home systems that provide mainly lighting and charging versus large ones that can power small productive appliances).
Solar lanterns are devices combining a small solar panel (below 5W), a battery and lights, which can also offer basic charging, e.g. for mobile phones. They often come as a replacement to traditional lighting technologies (e.g. candles and kerosene lamps), hence generating economic savings to households. Their low price makes them more affordable as cash sales and require limited servicing.
Solar home systems (SHS) are integrated systems combining solar panels (from 6W to 200W), batteries, multiple lights and sockets. The smallest SHS are only for lighting and phone charging, while large SHS can power home appliances such as fans or TVs (sometimes sold in bundles) and even small productive uses. Contrary to solar lanterns, SHS require end-user financing and customer care (e.g. installation, maintenance). This report focuses on SHS sold on pay-as-you-go, which are offering both financing and customer care.
Clean energy microgrids combine a small generation unit (solar, biomass, hydro, wind, or hybrid) with a local distribution network. Microgrids (5-100kW) are typically covering 25-500 households and small businesses with AC current, while nanogrids (<5kW) offer basic DC current to 5-30 households.
Solar irrigation pumps can be individual or collective (0.1-5HP), and are sold to smallholder farmers as a replacement for fuel or electricity pumps, or as a new asset. They are powered by solar panels, usually do not require batteries, and can be bundled with piping, equipment, and service. They are one of the standalone equipment solutions with the highest potential for off-grid productive uses.
Improved cook stoves (ICS) are cooking devices for households using solid fuels (wood, coal, charcoal, biomass), which improve fuel efficiency and reduce emissions compared to traditional cooking solutions. They can range from basic devices costing a few dollars, to expensive units requiring financing and service. They are sometimes combined with the sale of fuels (e.g. pellets).
Credits: Greenlight Planet, Mera Gao Power, Claro Energy, Toyola
3 Market-based approaches look at low-income people as customers instead of beneficiaries, where goods and services are sold to them at a price that could make the value chains economically sustainable. This however does not exclude donors’ role as initiators, seed, support and coaches of these businesses, nor governments’ role as long-term investors looking for positive externalities. Grants or subsidies may be included, provided they follow specific rules concerning market distortions (i.e. not kill the potential for substitute solutions if they are not available to all), a level playing field (i.e. bigger actors should not be in a position to bar competition), and fairness to end-users (i.e. benefit the poorest at least as much as others, and not encourage sub optimal solutions).
4 Small scale productive uses are intended for smallholder farmers, rural entrepreneurs, small retailers, who live at the Base of the Pyramid, oftentimes in rural areas, and would benefit from strong revenue generation opportunities and productivity gains if only they could access affordable and reliable energy. This may require only basic electricity (e.g. phone charging services or hairdressing can require just a few hundred Watts per day). We specifically looked at the small productive appliances powered by SHS and microgrids, as well as solar irrigation pumps, which work as standalone devices
SCO
PE A
ND
MET
HO
DO
LOG
Y
13REACHING SCALE IN ACCESS TO ENERGY: Lessons from best practitioners
Note on energy access solutions not reviewed in this report
• This report provides only a partial view of the improved cooking sector, as it focuses on cook stoves for wood and charcoal. The lessons learnt may not be applied to users of coal, or other biomass. Other solutions outside of the research scope are promising too. In particular, two would deserve further analysis: (i) clean fuels like bio-ethanol or LPG are aspirational for many in developing countries, but have so far experienced slow adoption notably given the high upfront costs of cylinders. Recent innovations turned this cost into recurring payments (e.g. PayGo Energy in Kenya), (ii) bio-digesters, which make economic sense in particular for farmers with poultry and cattle, but also require high upfront investment and heavy works. Innovations to reduce cost and installation time are emerging (e.g. Sistema Biobolsa in Latin America).
• This report also provides a partial view of solar devices and equipment, as it focuses on the perspectives of ‘quality-verified’ solar lanterns companies, and ‘pay-as-you-go’ SHS providers respectively. Non quality-verified solar lanterns are discussed as they play a role in the industry dynamics. Other distribution and financing models for SHS are briefly mentioned, but would require further analysis in particular partnership models (e.g. with MFIs, rural banks, or government programs) although they have not recently experienced the same growth, innovation, and financing traction as the PAYG players.
• The gas and electricity grids, larger minigrid solutions (above 100kW) have been excluded from the scope, despite their powerful momentum (some would say too powerful, as the focus on increasing the number of connections led to abundant financing). While these solutions provide significant opportunities in access to energy, they are government- or national utility-sponsored and their business models depend mainly on BtoB considerations. All decentralized energy solutions that focus exclusively on intensive commercial and industrial uses have also been excluded. However, this report looks at microgrid models that work with energy-intensive clients serving as anchor loads for community infrastructures.
• Lastly the ‘energy kiosk’ business model is also excluded. It consists of powering an electricity “hub” in a village to deliver energy services to the local community (e.g. charging of batteries, phones, lamps, internet access, cooling, movie theater, health information center, etc.). This model has gained momentum in recent years (with players such as Solakiosk, TERI, HERI), however their scale remains limited (very few players have more than 100 kiosks and none has more than 200) and their commercial sustainability is still facing a number of challenges given high infrastructure costs (in the range of US$30-100,000 per kiosk) high maintenance/running costs, and limited revenue opportunities in rural communities with highly constrained budgets. Interestingly, this model can be associated with microgrids, with lines extended around the central hub (see Rafiki
Power case study).
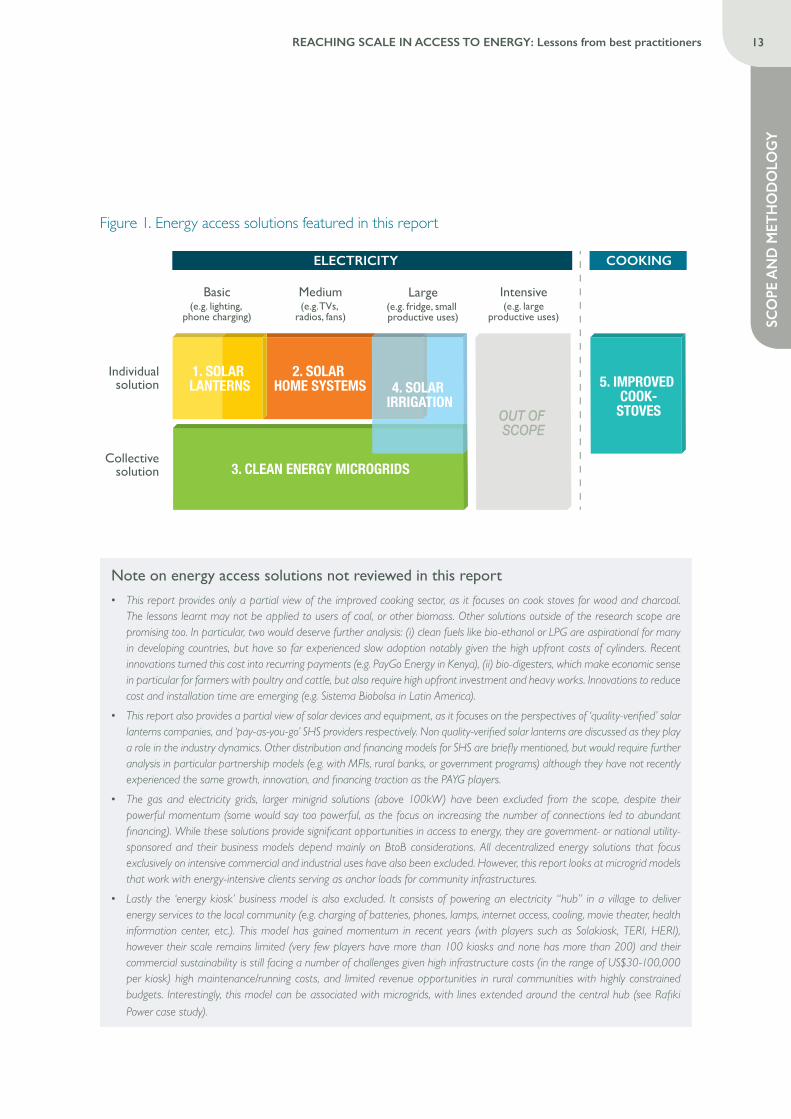
Figure 1. Energy access solutions featured in this report
Basic(e.g. lighting,
phone charging)
ELECTRICITY
Individualsolution
Collectivesolution
COOKING
Medium(e.g. TVs,
radios, fans)
Large(e.g. fridge, small productive uses)
Intensive(e.g. large
productive uses)
5. IMPROVED COOK-
STOVES
3. CLEAN ENERGY MICROGRIDS
OUT OF SCOPE
2. SOLAR HOME SYSTEMS
1. SOLAR LANTERNS 4. SOLAR
IRRIGATION
14 REACHING SCALE IN ACCESS TO ENERGY: Lessons from best practitioners
SCO
PE AN
D M
ETH
OD
OLO
GY
METHODOLOGYToday, many pioneering organizations around the world have found innovative, market-based solutions to energy access and overcome many challenges in doing so. The findings here are based on an in-depth review of the performance and work of 26 practitioners, selected after a global scan. While these lessons may not be applicable in all situations, they will hopefully provide inspiration for other practitioners and motivate investors, companies, donors, and governments to support them. This approach can be broken down into three broad steps:
1. Mapping off-grid energy initiatives and classifying them into five categories. Through extensive research and interviews with over 30 experts from think tanks and development agencies, 328 organizations and projects have been identified and classified.
2. Shortlisting organizations within each category to select 26 among the more innovative, successful, and sustainable ones. The case studies featured in this report are not necessarily the ‘best’ ones, but rather a sample of the organizations that developed innovative approaches to energy access, which we could learn from. The selection is balanced between established companies, which already have demonstrated their ability to scale, and more recent ones, which bring new solutions to well-known challenges.
3. Analyzing case studies in-depth. 11 case studies are based on two to three day in situ visits of field operations and customers, as well as numerous discussions and interviews with both the management and field teams. The remaining 15 case studies are based on a series of phone interviews with the practitioners. A consistent template was used to investigate each case study, focusing on the organization’s history, operations and business model, social impact, operational and financial performance, and potential for scale and replication (see all case studies, organized along this template). In total, information was collected on more than 50 qualitative and quantitative indicators. Such an approach allowed comparative analyses on a number of focus points, to understand why some performed better in some aspects than others, and extract best practices. Whenever possible, data across case studies was used to conduct analyses. When the required data was not available, the results were extracted from smaller samples and anecdotal evidence, as shown in the various figures and tables throughout the report.
Disclaimers
• Conclusions are drawn from a limited set of 26 case studies. In an effort to illustrate the common features among best practices, some nuances had to be overlooked. It is possible that not all lessons summarized here are relevant to all products and geographies.
• While this report does not claim that the 26 organizations featured in this report are the best worldwide, they are representative of successful approaches scaled up in many different countries, across various solutions. Comparing their performance, approach, and learning from both their successes (and failures) has brought many insights on what works and why.
• The selection of case studies did not aim at obtaining a geographically representative sample, but rather at gathering set of innovative and successful business models allowing for comparisons within and across categories, and at identifying global best practices. While all regions of the world are represented (some of the global organizations are present in LATAC and South East Asia), most of the cases are in sub-Saharan Africa and South Asia, where all the field visits were conducted.
• This report paid close attention to the social and environmental impact that the case studies had, and how each organization was ensuring appropriate use of their solution (e.g. monitoring usage of improved cook stoves, recycling and disposal of old batteries, etc.). However, this aspect was not the focus, which in any case is not a proponent of any given technology featured in the case studies. The case studies were selected in light of the best practices that readers could draw from.
SCO
PE A
ND
MET
HO
DO
LOG
Y
15REACHING SCALE IN ACCESS TO ENERGY: Lessons from best practitioners
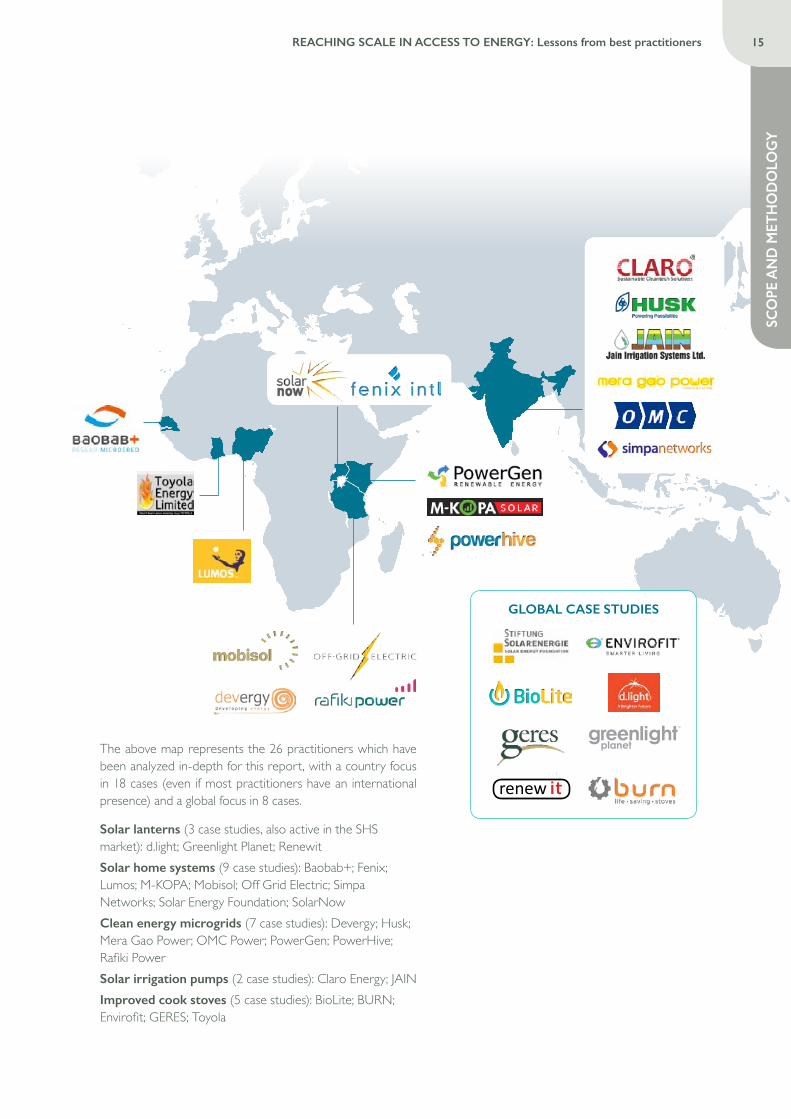
The above map represents the 26 practitioners which have been analyzed in-depth for this report, with a country focus in 18 cases (even if most practitioners have an international presence) and a global focus in 8 cases.
Solar lanterns (3 case studies, also active in the SHS market): d.light; Greenlight Planet; RenewitSolar home systems (9 case studies): Baobab+; Fenix; Lumos; M-KOPA; Mobisol; Off Grid Electric; Simpa Networks; Solar Energy Foundation; SolarNowClean energy microgrids (7 case studies): Devergy; Husk; Mera Gao Power; OMC Power; PowerGen; PowerHive; Rafiki PowerSolar irrigation pumps (2 case studies): Claro Energy; JAINImproved cook stoves (5 case studies): BioLite; BURN; Envirofit; GERES; Toyola
GLOBAL CASE STUDIES
Credit: © 2017 Off-Grid Electric, Ltd.
LAN
DSC
APE
OF
ENER
GY
SOLU
TIO
NS
17REACHING SCALE IN ACCESS TO ENERGY: Lessons from best practitioners
5. LANDSCAPE OF ENERGY SOLUTIONS
Market-based approaches for energy access have been around for more than 20 years. They have developed into a wide range of technologies and models, addressing specific segments and needs. This section is organized into three parts: the first two parts present market segmentations and market potential estimates for access to electricity and improved cook stoves respectively. The third part discusses the social impact of each solution.
ACCESS TO ELECTRICITY
SEGMENTATION
Market-based approaches to electricity access have flourished for the 240 million off-grid households and 200 million poor-grid households worldwide (note: while the off-grid population often concentrates most attention, energy access is also any issue for poor-grid families with extremely unreliable grid service). Each solution, from basic devices to large networks, has a ‘sweet spot’, i.e. a customer segment for which it is competitive. The segmentation is driven in particular by energy intensity and population density.
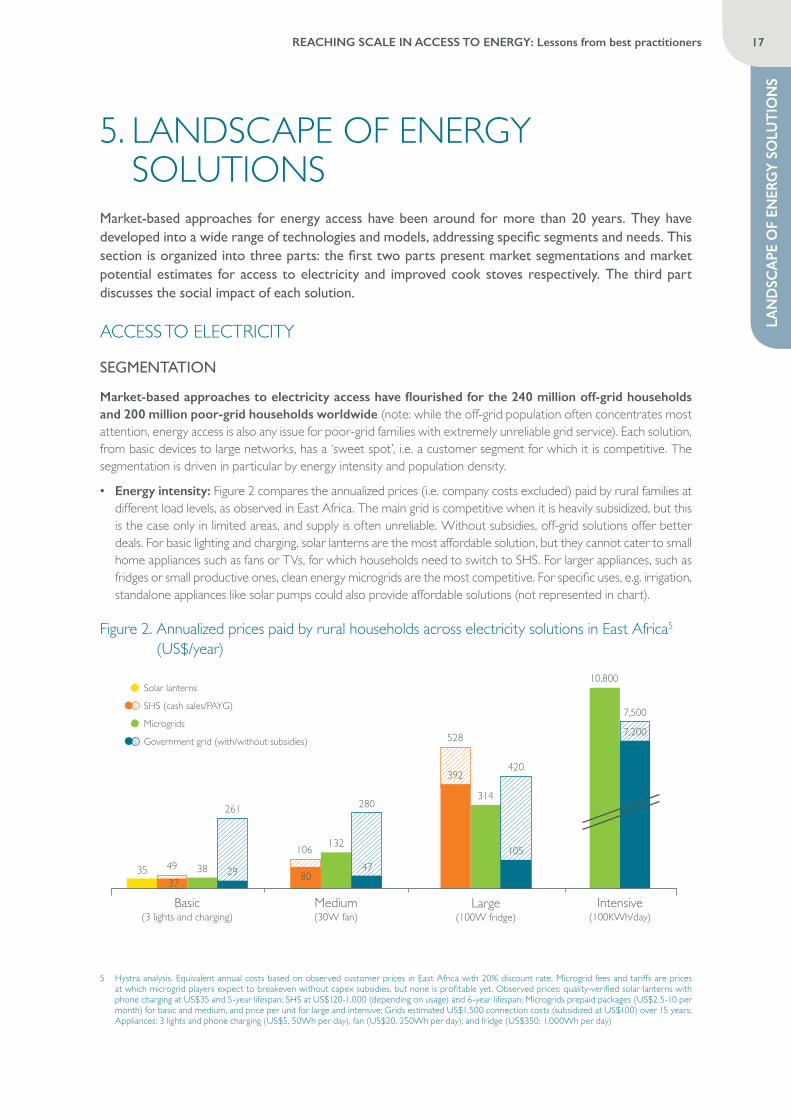
• Energy intensity: Figure 2 compares the annualized prices (i.e. company costs excluded) paid by rural families at different load levels, as observed in East Africa. The main grid is competitive when it is heavily subsidized, but this is the case only in limited areas, and supply is often unreliable. Without subsidies, off-grid solutions offer better deals. For basic lighting and charging, solar lanterns are the most affordable solution, but they cannot cater to small home appliances such as fans or TVs, for which households need to switch to SHS. For larger appliances, such as fridges or small productive ones, clean energy microgrids are the most competitive. For specific uses, e.g. irrigation, standalone appliances like solar pumps could also provide affordable solutions (not represented in chart).
Figure 2. Annualized prices paid by rural households across electricity solutions in East Africa5 (US$/year)
Basic(3 lights and charging)
Medium(30W fan)
Large(100W fridge)
Intensive(100KWh/day)
528
392
314
420
105106 132
47
280
80
10,800
7,500
7,200
35 49 37
38
261
29
Microgrids
Solar lanterns
SHS (cash sales/PAYG)
Government grid (with/without subsidies)
5 Hystra analysis. Equivalent annual costs based on observed customer prices in East Africa with 20% discount rate. Microgrid fees and tariffs are prices at which microgrid players expect to breakeven without capex subsidies, but none is profitable yet. Observed prices: quality-verified solar lanterns with phone charging at US$35 and 5-year lifespan; SHS at US$120-1,000 (depending on usage) and 6-year lifespan; Microgrids prepaid packages (US$2.5-10 per month) for basic and medium, and price per unit for large and intensive; Grids estimated US$1,500 connection costs (subsidized at US$100) over 15 years; Appliances: 3 lights and phone charging (US$5, 50Wh per day), fan (US$20, 250Wh per day); and fridge (US$350; 1,000Wh per day)
18 REACHING SCALE IN ACCESS TO ENERGY: Lessons from best practitioners
LAN
DSC
APE O
F ENERG
Y SOLU
TIO
NS
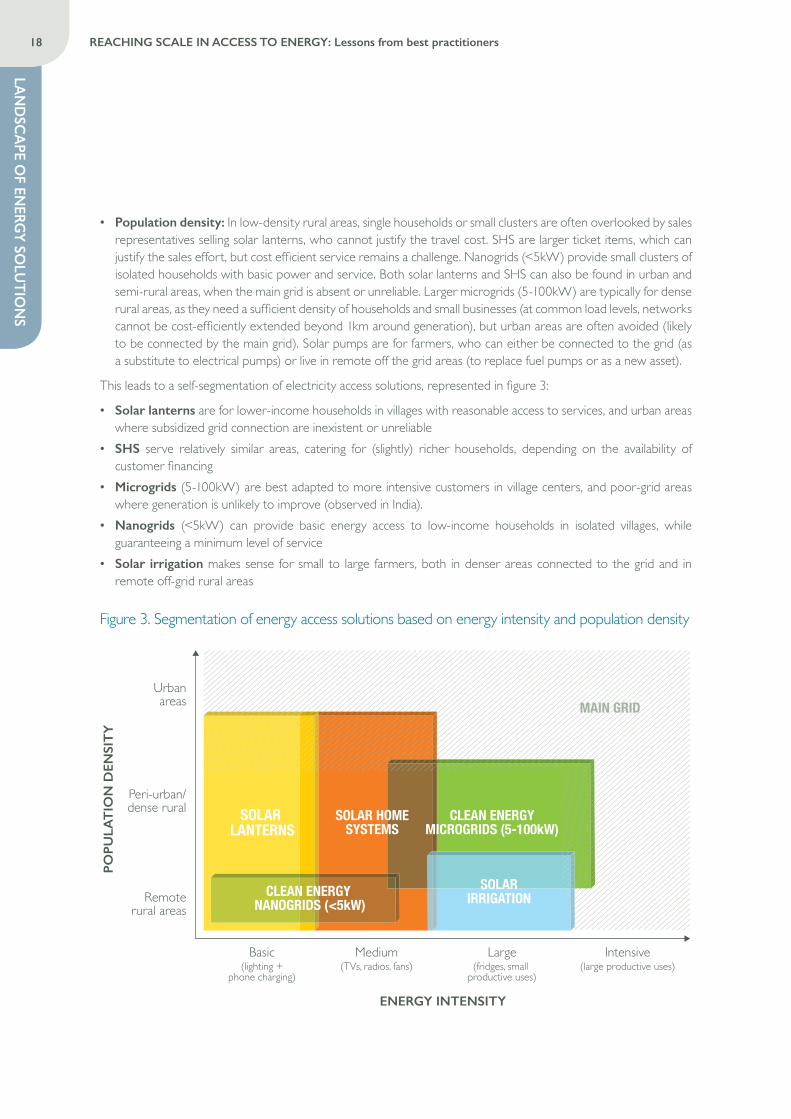
• Population density: In low-density rural areas, single households or small clusters are often overlooked by sales representatives selling solar lanterns, who cannot justify the travel cost. SHS are larger ticket items, which can justify the sales effort, but cost efficient service remains a challenge. Nanogrids (<5kW) provide small clusters of isolated households with basic power and service. Both solar lanterns and SHS can also be found in urban and semi-rural areas, when the main grid is absent or unreliable. Larger microgrids (5-100kW) are typically for dense rural areas, as they need a sufficient density of households and small businesses (at common load levels, networks cannot be cost-efficiently extended beyond 1km around generation), but urban areas are often avoided (likely to be connected by the main grid). Solar pumps are for farmers, who can either be connected to the grid (as a substitute to electrical pumps) or live in remote off the grid areas (to replace fuel pumps or as a new asset).
This leads to a self-segmentation of electricity access solutions, represented in figure 3:
• Solar lanterns are for lower-income households in villages with reasonable access to services, and urban areas where subsidized grid connection are inexistent or unreliable
• SHS serve relatively similar areas, catering for (slightly) richer households, depending on the availability of customer financing
• Microgrids (5-100kW) are best adapted to more intensive customers in village centers, and poor-grid areas where generation is unlikely to improve (observed in India).
• Nanogrids (<5kW) can provide basic energy access to low-income households in isolated villages, while guaranteeing a minimum level of service
• Solar irrigation makes sense for small to large farmers, both in denser areas connected to the grid and in remote off-grid rural areas
Figure 3. Segmentation of energy access solutions based on energy intensity and population density
Basic(lighting +
phone charging)
Urbanareas
Peri-urban/dense rural
Remoterural areas
Medium(TVs, radios, fans)
Large(fridges, small
productive uses)
ENERGY INTENSITY
POPU
LAT
ION
DEN
SIT
Y
Intensive(large productive uses)
SOLAR HOMESYSTEMS
SOLAR LANTERNS
SOLARIRRIGATION
MAIN GRID
CLEAN ENERGY NANOGRIDS (<5kW)
CLEAN ENERGYMICROGRIDS (5-100kW)
LAN
DSC
APE
OF
ENER
GY
SOLU
TIO
NS
19REACHING SCALE IN ACCESS TO ENERGY: Lessons from best practitioners
The boundaries of this segmentation will undoubtedly evolve:
• Households can upgrade over time: these solutions help them improve their livelihood (e.g. with fuel savings, income generation opportunities) and there is some evidence of families “moving up the energy ladder” (e.g. from solar lanterns to SHS) although the timing required and causality effects can be debated.
• Electricity access solutions often co-exist, for example SHS owners that get connected to the grid often continue using their SHS as a back-up, or for specific appliances. SHS then act as a cap on the maximum tariff the microgrid can charge.
• The relative competitiveness of technologies is changing, e.g. with the decrease in the cost of generation and storage. However, this factor is secondary in explaining the expansion of each solution, since most clean energy technologies are already an improvement on baseline solutions. The key determinant is hence the sustainability and scalability of business models, which this report focuses on.
MARKET POTENTIAL
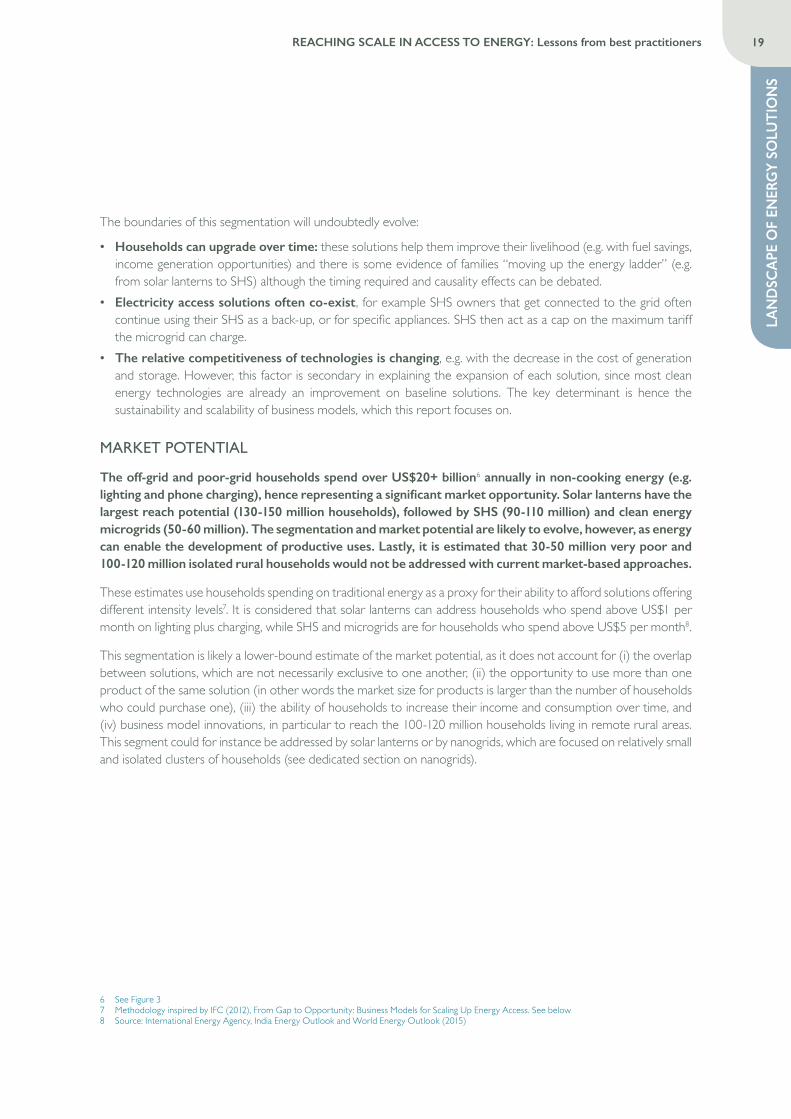
The off-grid and poor-grid households spend over US$20+ billion6 annually in non-cooking energy (e.g. lighting and phone charging), hence representing a significant market opportunity. Solar lanterns have the largest reach potential (130-150 million households), followed by SHS (90-110 million) and clean energy microgrids (50-60 million). The segmentation and market potential are likely to evolve, however, as energy can enable the development of productive uses. Lastly, it is estimated that 30-50 million very poor and 100-120 million isolated rural households would not be addressed with current market-based approaches.
These estimates use households spending on traditional energy as a proxy for their ability to afford solutions offering different intensity levels7. It is considered that solar lanterns can address households who spend above US$1 per month on lighting plus charging, while SHS and microgrids are for households who spend above US$5 per month8.
This segmentation is likely a lower-bound estimate of the market potential, as it does not account for (i) the overlap between solutions, which are not necessarily exclusive to one another, (ii) the opportunity to use more than one product of the same solution (in other words the market size for products is larger than the number of households who could purchase one), (iii) the ability of households to increase their income and consumption over time, and (iv) business model innovations, in particular to reach the 100-120 million households living in remote rural areas. This segment could for instance be addressed by solar lanterns or by nanogrids, which are focused on relatively small and isolated clusters of households (see dedicated section on nanogrids).
6 See Figure 37 Methodology inspired by IFC (2012), From Gap to Opportunity: Business Models for Scaling Up Energy Access. See below8 Source: International Energy Agency, India Energy Outlook and World Energy Outlook (2015)
20 REACHING SCALE IN ACCESS TO ENERGY: Lessons from best practitioners
LAN
DSC
APE O
F ENERG
Y SOLU
TIO
NS
Figure 4. Global electricity access potential by market segments, among 240 million off-grid and 200 million poor-grid households9
<$1/month $1-5/month >$5/monthCURRENT SPENDING ON ENERGY (excluding cooking)
Access to electricity addressable market segments among off-grid and poor-grid households
<30-50> <230-270><million households>, <$billion annual spending>
<140-170>
POPU
LAT
ION
DEN
SIT
Y
CLEAN ENERGYMICROGRIDS<50-60>, <5+>
SOLAR HOMESYSTEMS
<90-110>, <8+>
SOLAR LANTERNS<130-150>, <5+>
SOLAR IRRIGATION PUMPS<2-5>, not estimated
NO M
ARKE
T PO
TENT
IAL
UNCLEAR MARKET POTENTIAL(solar lanterns?, nanogrids?)
<100-120>, <4+>
9 Hystra analysis. Data sources: Global LEAP, Dalberg, BNEF, World Bank Povcalnet, WDI. US$1 and US$5 correspond respectively to the rounded monthly costs of solar lanterns displayed in figure 4. The analysis starts with a segmentation of households based on their income level and energy access (off-grid, poor-grid, on-grid) in Bangladesh, Cambodia, India, Indonesia, Kenya, Pakistan, Uganda. It uses data energy spending as a share of income, for each income quintile, to extrapolate a distribution of households based on their energy expenditure. This is applied to the global 1.2 billion off-grid and 1 billion poor-grid population. The ‘no market potential’ segment is the population that spends less than US$1 per month on non-cooking energy. The ‘unclear market potential’ segment is the rural off-grid population that spends between US$1 and US$5 per month. The ‘solar lanterns’ segment is the urban population and poor grid population that the same amount. The ‘SHS’ and ‘microgrids’ segments includes both the off-grid rural and urban, and the poor-grid population spending more than US$5 per month. The split between the two is then estimated using projections from the International Energy Agency. Solar irrigation pumps estimates based on IRENA and Grand View Research, annual spending has not been estimated as many of the potential customers do not irrigate their land today or through grid-connected electrical pumps supplied with highly subsidized (but often unreliable) power
LAN
DSC
APE
OF
ENER
GY
SOLU
TIO
NS
21REACHING SCALE IN ACCESS TO ENERGY: Lessons from best practitioners
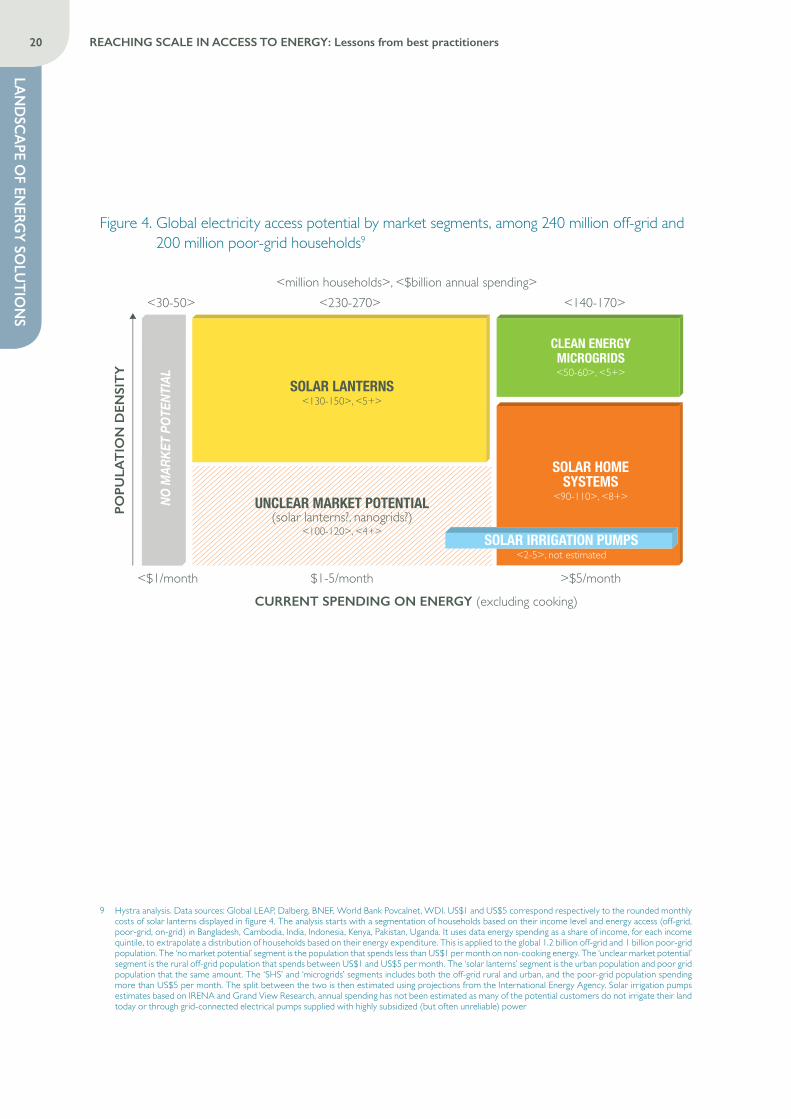
ACCESS TO IMPROVED COOK STOVES
SEGMENTATION
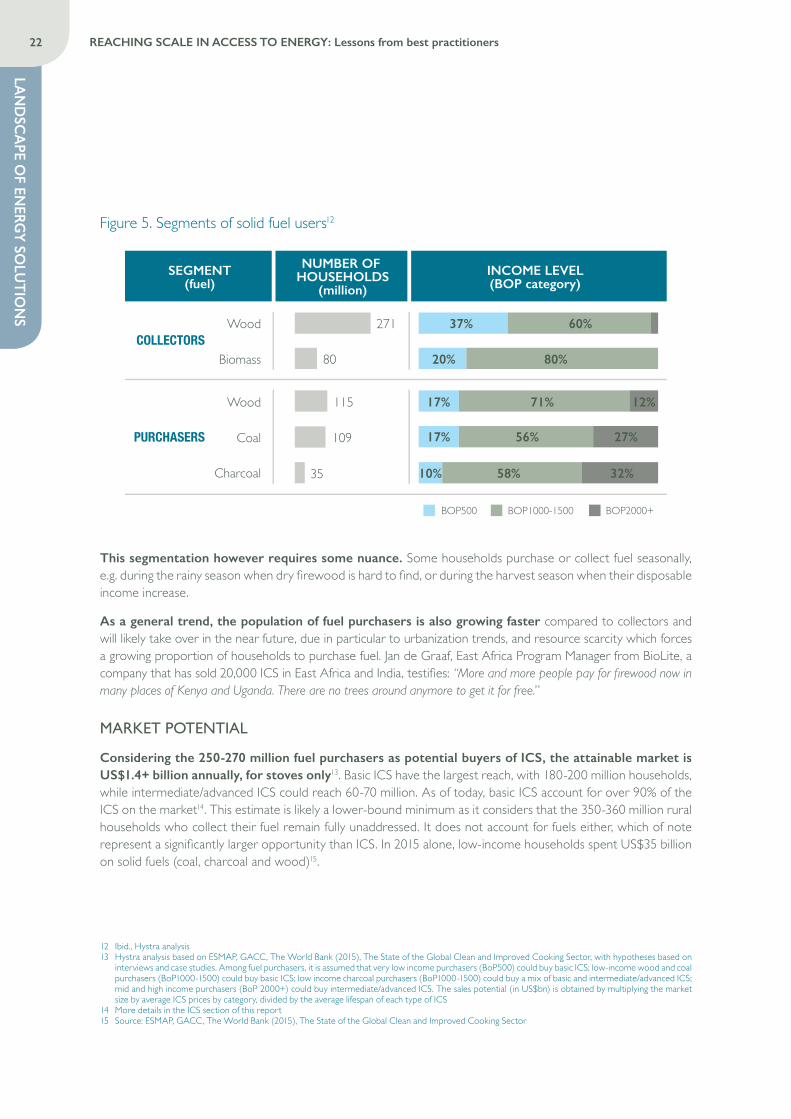
Over 600 million households use solid fuels as their primary source of cooking, with health, economic, and environmental consequences. A range of ICS have emerged to provide more efficient and cleaner cooking. The best suited products and business models vary greatly across customer segments. The market is segmented based on three criteria: whether households purchase or collect their fuel, their cooking and fuel habits, and income levels.
• Collection versus purchase: Successful market based approaches have been concentrated on the segment of households, urban or rural, who purchase their fuels and for whom ICS generate direct economic benefits (e.g. up to US$5 savings per month observed in Ghana, with a US$10 charcoal ICS). The other segment is that of fuel collectors, for which women and children can spend 30-90 minutes per day collecting free wood or biomass (e.g. cow dung). They live almost exclusively in rural areas. Although they account for 60% of solid fuel users, market-based approaches have barely reached them10.
• Cooking and fuel habits: Contrary to solar lanterns, for which the same product will match the needs of clients from different continents, ICS need to be tailored to local cooking habits, and in particular to the fuel which households use in a given region, and to the utensils required to cook the staple food. Families suffer from different pain points depending on the fuel they use, and will hence value different attributes for their ICS. Similarly, they will require different stove shapes and functions depending on what they cook (e.g. tortillas in Latin America require a large surface while most types of pap in Africa only need a pan on a focused heating source). Lastly, most families use more than a single type of fuel for cooking different meals.
• Income levels: Two broad categories of ICS can be differentiated, corresponding to two very different price points and affordability. Basic ICS (definitions based on the Energy Sector Management Assistance Program and the Global Alliance for Clean Cookstoves11), are usually artisanal devices which retail between US$5 and US$20. These are the natural solution for (very) low-income households. They provide limited improvements over traditional solutions (e.g. reduced combustion chamber, basic chimney improvements, ceramic liner), resulting in 20-40% fuel reduction and 10-50% emission reduction. Intermediate/advanced ICS are more expensive, modern-looking devices for richer households and often require financing. They include rocket stoves, retailing at US$20-60, and gasifiers and forced air stoves that start at US$50. They allow 40-70% fuel reduction and 50-90% emission reduction.
10 Anecdotal evidence shows that some minimally improved ICS (typically less than US$10) have been sold to collectors, but very marginally. These stoves provide limited efficiency gains compared to traditional stoves but stronger gains compared to open fires
11 Source : ESMAP, GACC, The World Bank (2015), The State of the Global Clean and Improved Cooking Sector. Basic ICS include portable charcoal and wood ICS (e.g. Jiko stoves in East Africa, Jambar stove in West Africa, or New Lao stove in Cambodia) or chimney stoves (e.g. basic planchas in Latin America)
22 REACHING SCALE IN ACCESS TO ENERGY: Lessons from best practitioners
LAN
DSC
APE O
F ENERG
Y SOLU
TIO
NS
Figure 5. Segments of solid fuel users12
SEGMENT(fuel)
COLLECTORS
PURCHASERS
Biomass 20% 80%80
Wood 17% 71% 12%115
Coal 17% 56% 27%109
Charcoal 10% 58% 32%35
NUMBER OF HOUSEHOLDS
(million)INCOME LEVEL(BOP category)
Wood 271 37% 60%
SEGMENT(fuel)
COLLECTORS
PURCHASERS
Biomass 20% 80%80
Wood 17% 71% 12%115
Coal 17% 56% 27%109
Charcoal 10% 58% 32%35
NUMBER OF HOUSEHOLDS
(million)INCOME LEVEL(BOP category)
Wood 271 37% 60%
BOP500 BOP1000-1500 BOP2000+
BOP500 BOP1000-1500 BOP2000+
SEGMENT(fuel)
COLLECTORS
PURCHASERS
Biomass 20% 80%80
Wood 17% 71% 12%115
Coal 17% 56% 27%109
Charcoal 10% 58% 32%35
NUMBER OF HOUSEHOLDS
(million)INCOME LEVEL(BOP category)
Wood 271 37% 60%
BOP500 BOP1000-1500 BOP2000+
This segmentation however requires some nuance. Some households purchase or collect fuel seasonally, e.g. during the rainy season when dry firewood is hard to find, or during the harvest season when their disposable income increase.
As a general trend, the population of fuel purchasers is also growing faster compared to collectors and will likely take over in the near future, due in particular to urbanization trends, and resource scarcity which forces a growing proportion of households to purchase fuel. Jan de Graaf, East Africa Program Manager from BioLite, a company that has sold 20,000 ICS in East Africa and India, testifies: “More and more people pay for firewood now in many places of Kenya and Uganda. There are no trees around anymore to get it for free.”
MARKET POTENTIAL
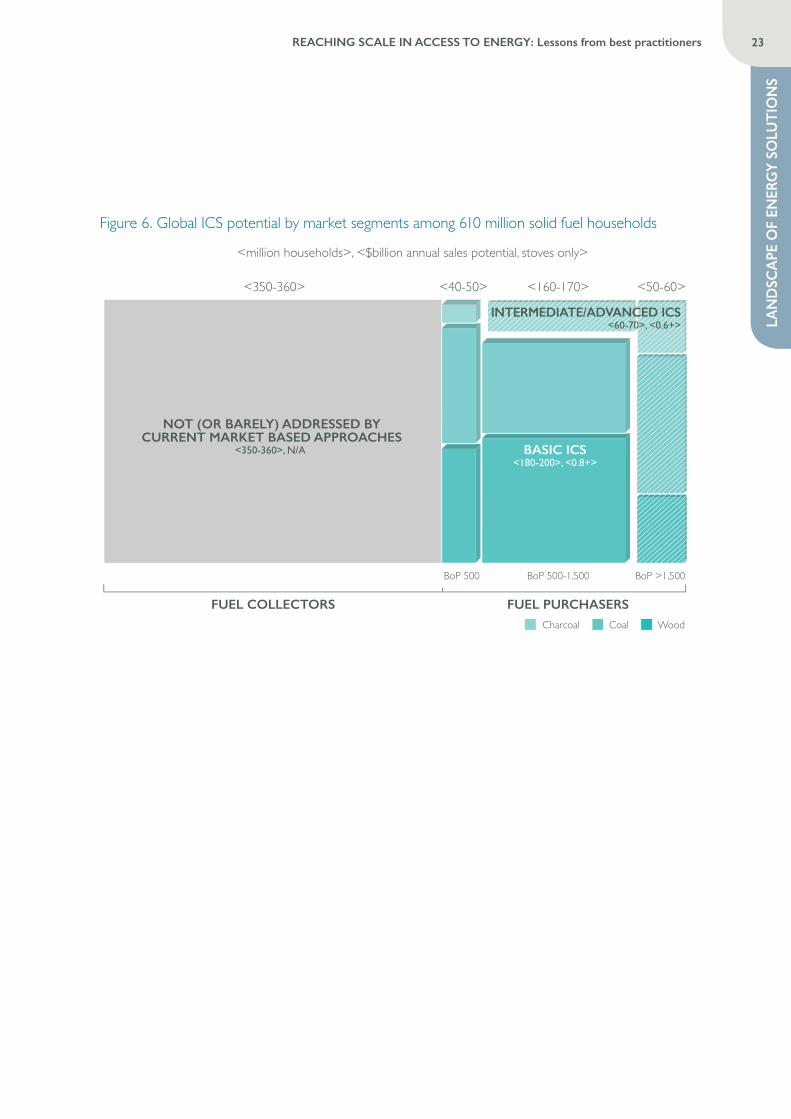
Considering the 250-270 million fuel purchasers as potential buyers of ICS, the attainable market is US$1.4+ billion annually, for stoves only13. Basic ICS have the largest reach, with 180-200 million households, while intermediate/advanced ICS could reach 60-70 million. As of today, basic ICS account for over 90% of the ICS on the market14. This estimate is likely a lower-bound minimum as it considers that the 350-360 million rural households who collect their fuel remain fully unaddressed. It does not account for fuels either, which of note represent a significantly larger opportunity than ICS. In 2015 alone, low-income households spent US$35 billion on solid fuels (coal, charcoal and wood)15.
12 Ibid., Hystra analysis13 Hystra analysis based on ESMAP, GACC, The World Bank (2015), The State of the Global Clean and Improved Cooking Sector, with hypotheses based on
interviews and case studies. Among fuel purchasers, it is assumed that very low income purchasers (BoP500) could buy basic ICS; low-income wood and coal purchasers (BoP1000-1500) could buy basic ICS; low income charcoal purchasers (BoP1000-1500) could buy a mix of basic and intermediate/advanced ICS; mid and high income purchasers (BoP 2000+) could buy intermediate/advanced ICS. The sales potential (in US$bn) is obtained by multiplying the market size by average ICS prices by category, divided by the average lifespan of each type of ICS
14 More details in the ICS section of this report15 Source: ESMAP, GACC, The World Bank (2015), The State of the Global Clean and Improved Cooking Sector
LAN
DSC
APE
OF
ENER
GY
SOLU
TIO
NS
23REACHING SCALE IN ACCESS TO ENERGY: Lessons from best practitioners
Figure 6. Global ICS potential by market segments among 610 million solid fuel households
<million households>, <$billion annual sales potential, stoves only>
NOT (OR BARELY) ADDRESSED BYCURRENT MARKET BASED APPROACHES
<350-360>, N/A
FUEL COLLECTORS FUEL PURCHASERS
BoP 500 BoP 500-1,500 BoP >1,500
Charcoal Coal Wood
<350-360> <40-50> <160-170> <50-60>
BASIC ICS<180-200>, <0.8+>
INTERMEDIATE/ADVANCED ICS<60-70>, <0.6+>
24 REACHING SCALE IN ACCESS TO ENERGY: Lessons from best practitioners
LAN
DSC
APE O
F ENERG
Y SOLU
TIO
NS
SOCIAL IMPACTEnergy access is intertwined with development needs. As reminded by the UN, “Energy is crucial for achieving almost all of the Sustainable Development Goals, from its role in the eradication of poverty through advancements in health, education, water supply and industrialization, to combating climate change”. Yet the quantification of impact requires significant caution, and can sometimes be controversial. Taking a number of caveats into account, this report goes through a simple extrapolation exercise and estimates that – if their full market potential was addressed – energy access solutions combined would save approximately 200-230 million tons of CO2 and 500-570,000 lives every year. Other major social impact areas include development opportunities through productive uses, educational benefits and time saving.
The development community has invested significant efforts in evaluating the respective impact of the solutions featured in this report. Quantifying and comparing impact is yet a challenging exercise:
• Many benefits are indirect, intangible, and long-term. For example, one solar lantern not only generates direct economic savings in kerosene or CO2 emission. It also reduces in-house smoke, the risks of burns and accidental fires in homes, and enables children to study longer every day16. For more advanced solutions, like SHS or microgrids, impact is even harder to evaluate, because of the many intangible and long-term benefits associated with productive uses (e.g. increased disposable income can increase spending on food and education).
• Various studies report a wide range of outcomes, and there are some controversies in the development community. For example, the environmental and health impacts of ICS, in particular the basic models, has often been questioned. A recent study conducted in Malawi in 2015 and 2016 over 10,000 children in 150 villages shows that smoke reductions thanks to ICS had some impact on the incidence of chronic coughs, but were not sufficient to reduce incidence of childhood pneumonia17. Another example: there are very wide ranges of economic savings from using solar lanterns, between US$1 and US$5 per month18, which make a totally different economic case for customers.
• The quantification of impact is highly sensitive to context and detailed specs of each product/service. For example, charcoal ICS, in comparison with firewood ICS, make a larger difference on economic savings (because charcoal is expensive) but lower health difference (because charcoal has limited particulate matter emissions). The environmental impact of charcoal ICS depends on the upstream value chains19. Another example: small (pico) SHS and large SHS can generate a very different impact. The small ones are mostly for lighting and charging, while the larger ones can power small productive appliances, hence generating significantly larger development opportunities. However, large SHS can be ten times more expensive hence not available to the same income segments.
• These categories of solutions are not always targeting the same customer segments or addressing the same needs, which can question the relevance of comparisons.
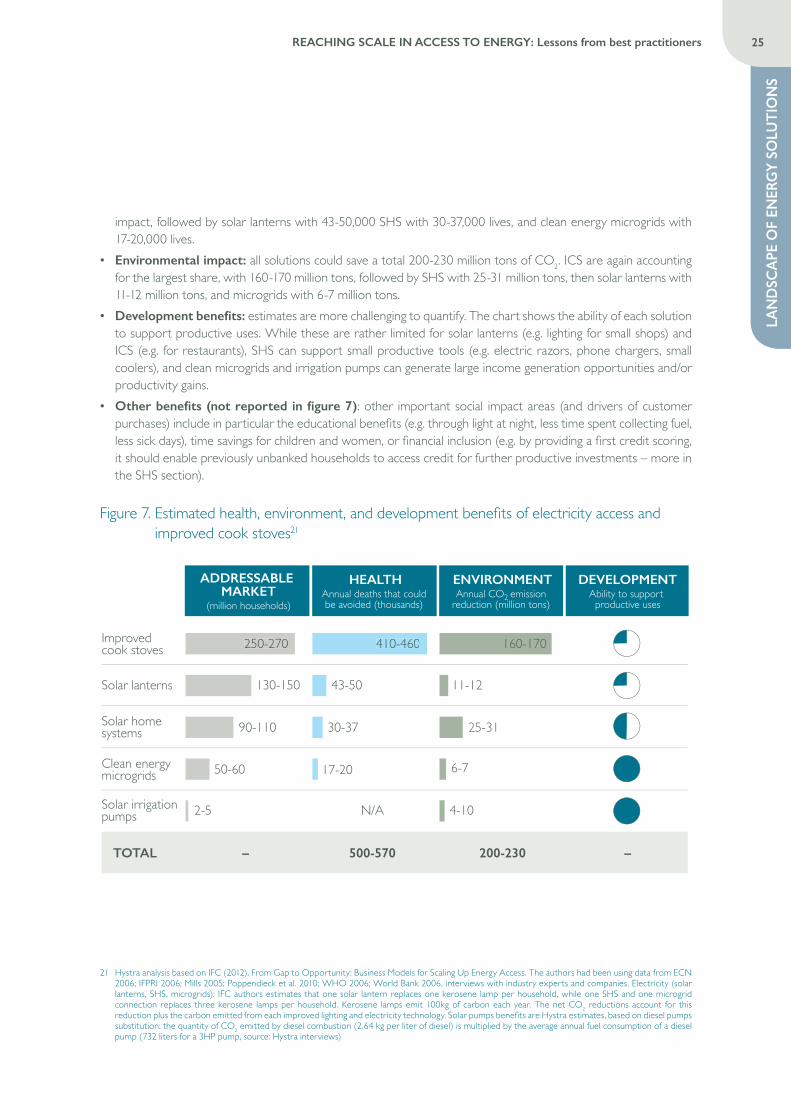
Taking these caveats into account, this report goes through a quantification exercise, evaluating the potential health and environmental benefits for each energy solution. It extrapolates from the methodology and ratios developed in a 2012 report from the IFC, and applies them to the updated market size estimates from the previous sections. As displayed in figure 7:
• Health impact, energy solutions combined could save 500-570,000 lives every year if they reached their full theoretical market potential20. The 250-270 million ICS would save 410-460,000 lives, i.e. about 80% of total
16 Powering Education (2014), SolarAid impact report (2015)17 Dr Kevin Mortimer (Liverpool School of Tropical Medicine), “A cleaner burning biomass-fueled cook stove intervention to prevent pneumonia in children
under 5 years old in rural Malawi (the Cooking and Pneumonia Study): a cluster randomized controlled trial”, 06 December 201618 Kat Harrison, Andrew Scott and Ryan Hogarth (ODI), “Accelerating access to electricity in Africa with off-grid solar: The impact of solar household
solutions”, January 201619 Source: Interview, GERES20 Note: this is not equivalent to Disability Adjusted Life Years, which is another common measure of social impact
LAN
DSC
APE
OF
ENER
GY
SOLU
TIO
NS
25REACHING SCALE IN ACCESS TO ENERGY: Lessons from best practitioners
impact, followed by solar lanterns with 43-50,000 SHS with 30-37,000 lives, and clean energy microgrids with 17-20,000 lives.
• Environmental impact: all solutions could save a total 200-230 million tons of CO2. ICS are again accounting for the largest share, with 160-170 million tons, followed by SHS with 25-31 million tons, then solar lanterns with 11-12 million tons, and microgrids with 6-7 million tons.
• Development benefits: estimates are more challenging to quantify. The chart shows the ability of each solution to support productive uses. While these are rather limited for solar lanterns (e.g. lighting for small shops) and ICS (e.g. for restaurants), SHS can support small productive tools (e.g. electric razors, phone chargers, small coolers), and clean microgrids and irrigation pumps can generate large income generation opportunities and/or productivity gains.
• Other benefits (not reported in figure 7): other important social impact areas (and drivers of customer purchases) include in particular the educational benefits (e.g. through light at night, less time spent collecting fuel, less sick days), time savings for children and women, or financial inclusion (e.g. by providing a first credit scoring, it should enable previously unbanked households to access credit for further productive investments – more in the SHS section).
Figure 7. Estimated health, environment, and development benefits of electricity access and improved cook stoves21
DEVELOPMENTAbility to support
productive uses
ENVIRONMENTAnnual CO2 emission
reduction (million tons)
HEALTHAnnual deaths that could be avoided (thousands)
ADDRESSABLE MARKET
(million households)
Improved cook stoves 250-270 410-460 160-170
11-12
25-31
6-7
4-10
43-50
30-37
17-20
N/A
130-150
90-110
50-60
2-5
– –500-570 200-230
Solar lanterns
Solar homesystems
Clean energymicrogrids
Solar irrigationpumps
TOTAL
250-270 410-460
21 Hystra analysis based on IFC (2012), From Gap to Opportunity: Business Models for Scaling Up Energy Access. The authors had been using data from ECN 2006; IFPRI 2006; Mills 2005; Poppendieck et al. 2010; WHO 2006; World Bank 2006, interviews with industry experts and companies. Electricity (solar lanterns, SHS, microgrids): IFC authors estimates that one solar lantern replaces one kerosene lamp per household, while one SHS and one microgrid connection replaces three kerosene lamps per household. Kerosene lamps emit 100kg of carbon each year. The net CO2 reductions account for this reduction plus the carbon emitted from each improved lighting and electricity technology. Solar pumps benefits are Hystra estimates, based on diesel pumps substitution: the quantity of CO2 emitted by diesel combustion (2.64 kg per liter of diesel) is multiplied by the average annual fuel consumption of a diesel pump (732 liters for a 3HP pump, source: Hystra interviews)
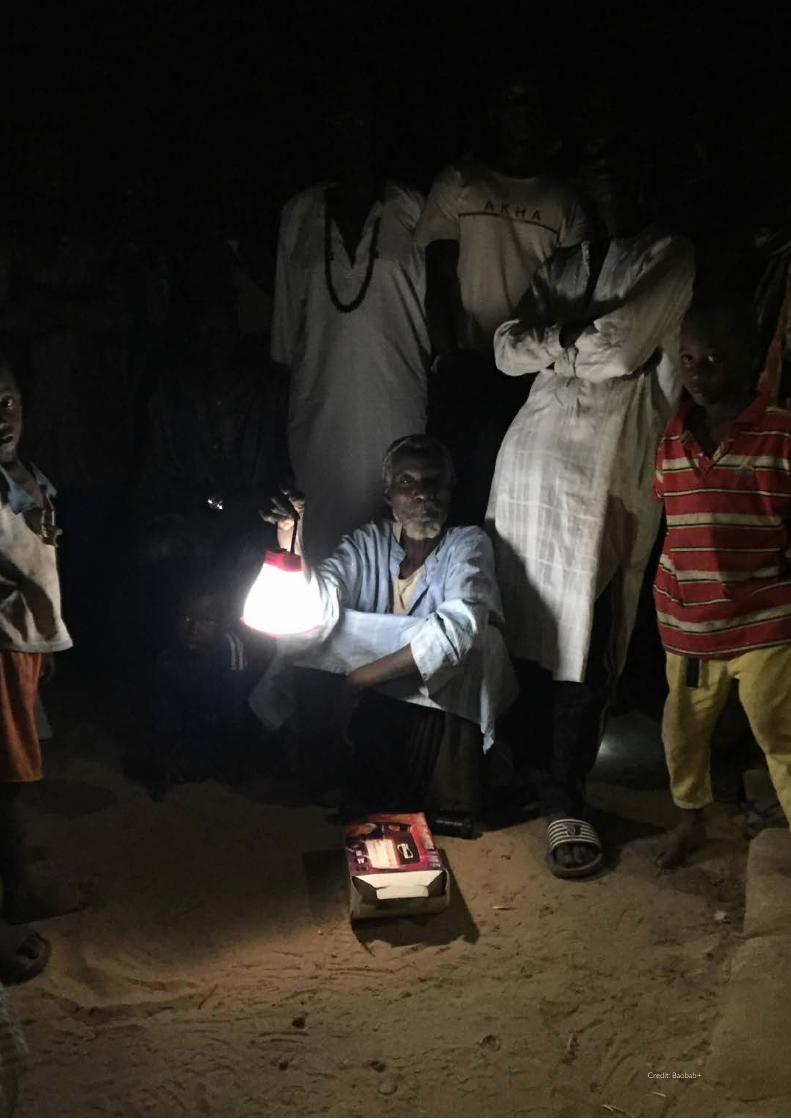
Credit: Baobab+
SOLA
R LA
NT
ERN
S
27REACHING SCALE IN ACCESS TO ENERGY: Lessons from best practitioners
6. SOLAR LANTERNSThis section focuses on quality-verified lanterns22. Solar lanterns have been very successful since 2010 and reached over 20 million cumulative sales, but this success has been mostly located in a few densely populated regions of East Africa and India. Sales are now starting to saturate in these areas, while entire regions remain largely untapped, rural areas in particular. Lantern players will need to reinvent their distribution models, both to strive in saturating areas and address untapped markets.
MARKET OUTLOOK AND OPPORTUNITIESSince 2010, quality-verified solar lanterns have experienced rapid growth and developed into a vibrant industry, with world leading players and constant technology improvement. From 100,000 in 2010, yearly sales of quality-verified lanterns have reached 5.3 million units in 2015 and 6.6 million in 201623 (i.e. a compound annual growth rate of 121%). Leading manufacturers have emerged, such as d.light and Greenlight Planet, which together account for over half of global market shares24. Manufacturers of electronic and LED lighting devices such as Renewit have also entered the market. Technological innovations (e.g. lithium-ion batteries, LED lights) have enabled these players to improve cost-efficiency, but also expand product range with higher-quality as well as ultra-affordable products (Table 1). Overall, the breakthrough of the lantern industry was largely fostered by the creation in 2012 of GOGLA, the industry association, which now counts more than 80 members.
Table 1. Two examples of solar lanterns25
A1 by d.light
Sun King Pro 2 by Greenlight Planet
Price (USD) 5 40Capacity (W) 0.3 3Max. brightness (lumen) 20 160Battery run time (hours) 4-5 6-13Other features N/A 1-2 USB ports
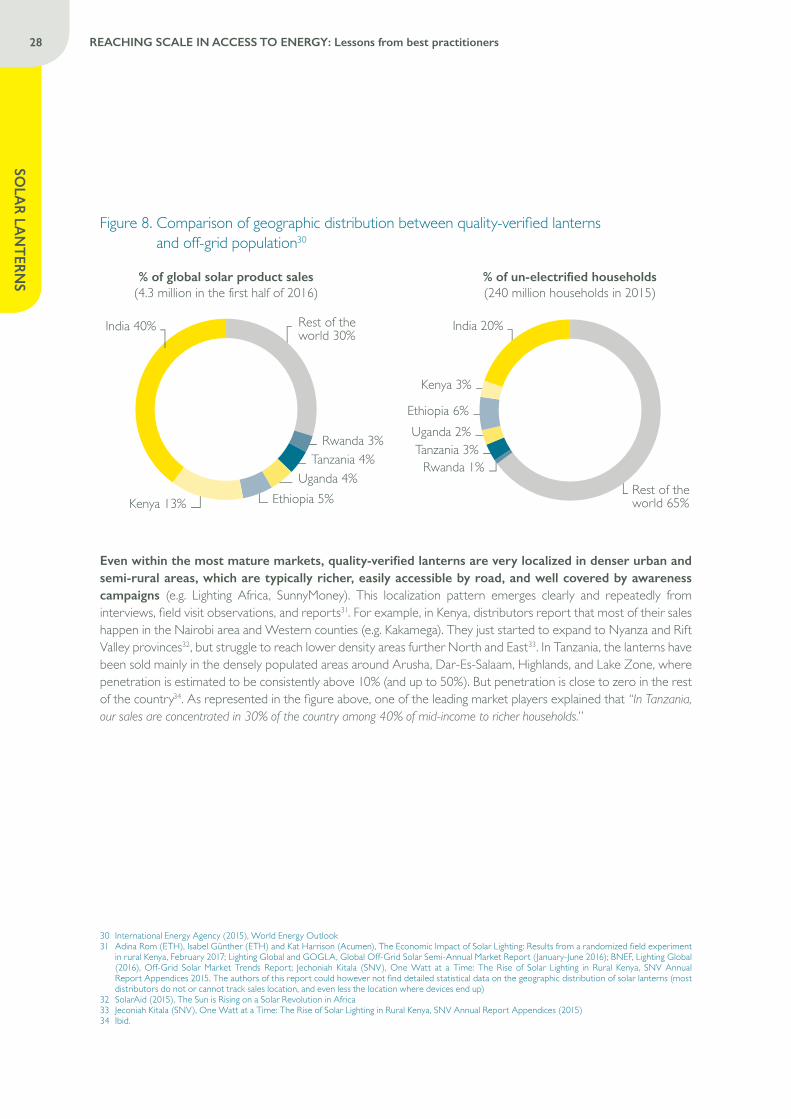
This success occurred mainly within a few countries in East Africa and a few Indian states, while West African countries are just about to pick up. Until recently, India and Kenya represented the bulk of global sales volume. Today, India and five East African countries still account for 70% of global sales, although they account for only 35% of the global off-grid population26 (figure 8). Countries where sales have historically been slow are now starting to gather pace, such as Nigeria (+73% between the second half of 2015 and the first of 2016)27. They nonetheless remain more complex markets, either with small off-grid populations (e.g. Togo, Senegal, Ivory Coast), lower population density (e.g. the population density in Zambia is one third of that in Tanzania28) or a less conducive environment (e.g. uncertainty on sustainability of VAT exemptions, import tariffs and standards, local currency fluctuations like in Nigeria in 201629). Hence sales pick up in these markets remains to be confirmed in the coming semesters.
22 Quality-verified lanterns are products that have met quality standards in terms of durability, advertising of performance, and warranty, set by the Quality Assurance Program by Lighting Global. See standard details here (http://bit.ly/2rua9aw) and full list of quality-verified products here (http://bit.ly/2rhoL0m)
23 Lighting Global and GOGLA, Global Off-Grid Solar Semi-Annual Market Report (January-June 2016); BNEF, Lighting Global (2016), Off-Grid Solar Market Trends Report. This excludes the sales of branded lanterns that are not quality-verified (1.7 million in 2015) and unbranded (copycats, counterfeits and low-cost white-label products) accounting for at least half of the market
24 d.light and Greenlight Planet have sold 16 million and 7 million solar lanterns respectively since inception25 d.light and Greenlight Planet both have wide ranges if products, from entry-level to high-end lanterns, of which these two products are not a representative
illustration26 In India, mostly in Uttar Pradesh, Odisha, Bihar, and Karnataka27 Lighting Global and GOGLA, Global Off-Grid Solar Semi-Annual Market Report (January-June 2016)28 ODI (2016), Zambia country briefing29 http://bit.ly/2pZa6lW
28 REACHING SCALE IN ACCESS TO ENERGY: Lessons from best practitioners
SOLA
R LAN
TERN
S
Figure 8. Comparison of geographic distribution between quality-verified lanterns and off-grid population30
India 40% Rest of theworld 30%
Rwanda 3%Tanzania 4%
Uganda 4%Ethiopia 5%Kenya 13%
% of global solar product sales(4.3 million in the first half of 2016)
% of un-electrified households(240 million households in 2015)
India 20%
Rest of theworld 65%
Rwanda 1%Tanzania 3%Uganda 2%
Ethiopia 6%
Kenya 3%
Even within the most mature markets, quality-verified lanterns are very localized in denser urban and semi-rural areas, which are typically richer, easily accessible by road, and well covered by awareness campaigns (e.g. Lighting Africa, SunnyMoney). This localization pattern emerges clearly and repeatedly from interviews, field visit observations, and reports31. For example, in Kenya, distributors report that most of their sales happen in the Nairobi area and Western counties (e.g. Kakamega). They just started to expand to Nyanza and Rift Valley provinces32, but struggle to reach lower density areas further North and East33. In Tanzania, the lanterns have been sold mainly in the densely populated areas around Arusha, Dar-Es-Salaam, Highlands, and Lake Zone, where penetration is estimated to be consistently above 10% (and up to 50%). But penetration is close to zero in the rest of the country34. As represented in the figure above, one of the leading market players explained that “In Tanzania, our sales are concentrated in 30% of the country among 40% of mid-income to richer households.”
30 International Energy Agency (2015), World Energy Outlook 31 Adina Rom (ETH), Isabel Gunther (ETH) and Kat Harrison (Acumen), The Economic Impact of Solar Lighting: Results from a randomized field experiment
in rural Kenya, February 2017; Lighting Global and GOGLA, Global Off-Grid Solar Semi-Annual Market Report (January-June 2016); BNEF, Lighting Global (2016), Off-Grid Solar Market Trends Report; Jechoniah Kitala (SNV), One Watt at a Time: The Rise of Solar Lighting in Rural Kenya, SNV Annual Report Appendices 2015. The authors of this report could however not find detailed statistical data on the geographic distribution of solar lanterns (most distributors do not or cannot track sales location, and even less the location where devices end up)
32 SolarAid (2015), The Sun is Rising on a Solar Revolution in Africa 33 Jeconiah Kitala (SNV), One Watt at a Time: The Rise of Solar Lighting in Rural Kenya, SNV Annual Report Appendices (2015)34 Ibid.
SOLA
R LA
NT
ERN
S
29REACHING SCALE IN ACCESS TO ENERGY: Lessons from best practitioners
The most successful areas are now reaching saturation. For instance, based on socio-economic and demographic data, as well as company and expert interviews, it can be estimated that about two thirds of the Western Kenyan core market is already equipped with solar lanterns35. In these areas, quality-verified lanterns are now facing increased competition, both from the low-cost copycats which have flooded the market (often imported from China, without warranty)36, and from small SHS which are more attractive to higher income segments. As a result, it can be anticipated that —barring technological innovations— sales in these historical markets will slow down moving forward, confined to new consumers and replacements. Market trends already suggest that exponential growth is slowing down significantly in Kenya, Tanzania or Ethiopia37, although other factors could explain sales slowdowns (e.g. working capital challenges, economic downturn, or changes in regulation38).
Interview with Patrick Muriuki, Global Partnerships Manager for East and Southern Africa, Greenlight Planet
Is the lantern market getting saturated in most advanced East African markets?
“In Kenya, the market is extremely geographically concentrated. 50% of sales of quality-verified products occur in three counties (where both density and un-electrification are high). In these areas, we can observe a saturation effect. The rest of the Kenyan market is however still growing, and there are high potential areas which are yet untapped, like the Rift Valley. In Tanzania, saturation resulted in an observable slowdown, combined with a price competition. Historical distributors of quality-verified lanterns have been struggling to compete with low-cost products and counterfeits. “
Are SHS distributors directly competing with lantern distributors?
“SHS are not really competing with lanterns since most SHS owners also buy lanterns. The lantern is actually often the first step for people to buy a SHS, although it is true that they may not buy many more lanterns once they have a SHS. PAYG companies are entering in priority the areas where the lantern market is already developed.”
How are low-cost products reaching such high penetration levels?
“Low-cost non-quality-verified products represent a growing segment of the market. First, they are significantly cheaper: the end user price of a low-cost lantern is often lower than the wholesale price of a quality-verified one! Second, in remote areas it is often easier to find a low-quality product than a quality-verified one. Small village shop owners travel to the main cities and buy cheap products at the wholesale markets (e.g. Kariako in Dar-es-Salaam). But if you live in a remote village and want a quality-verified lantern, you need to have an agent knocking to your door, or know someone who knows where you can get one…”
35 World Bank; National statistics; company interviews36 BNEF, Lighting Global (2016), Off-Grid Solar Market Trends Report37 “Between H2 2015 and H1 2016, overall pico-PV/SHS unit sales volumes dropped by almost 12% in Sub-Saharan Africa. This reflected a drop in sales in
the core-market East African countries. In Ethiopia, overall sales have seen a 37% decrease (363,950 to 231,097 units) although categories of larger pico-PV products have actually increased over the same period. The 60% overall decrease in unit sales in Tanzania is mainly concentrated in lower sales of the smallest category of pico-PV products in comparison to H2 2015 (80% decrease). Although less pronounced, a similar trend is visible in Kenya. However, in Kenya the sales of larger products have increased enough to result in an overall increase of 19% in the reported volume of products sold.” Lighting Global and GOGLA, Global Off-Grid Solar Semi-Annual Market Report (January-June 2016)
38 Ibid.
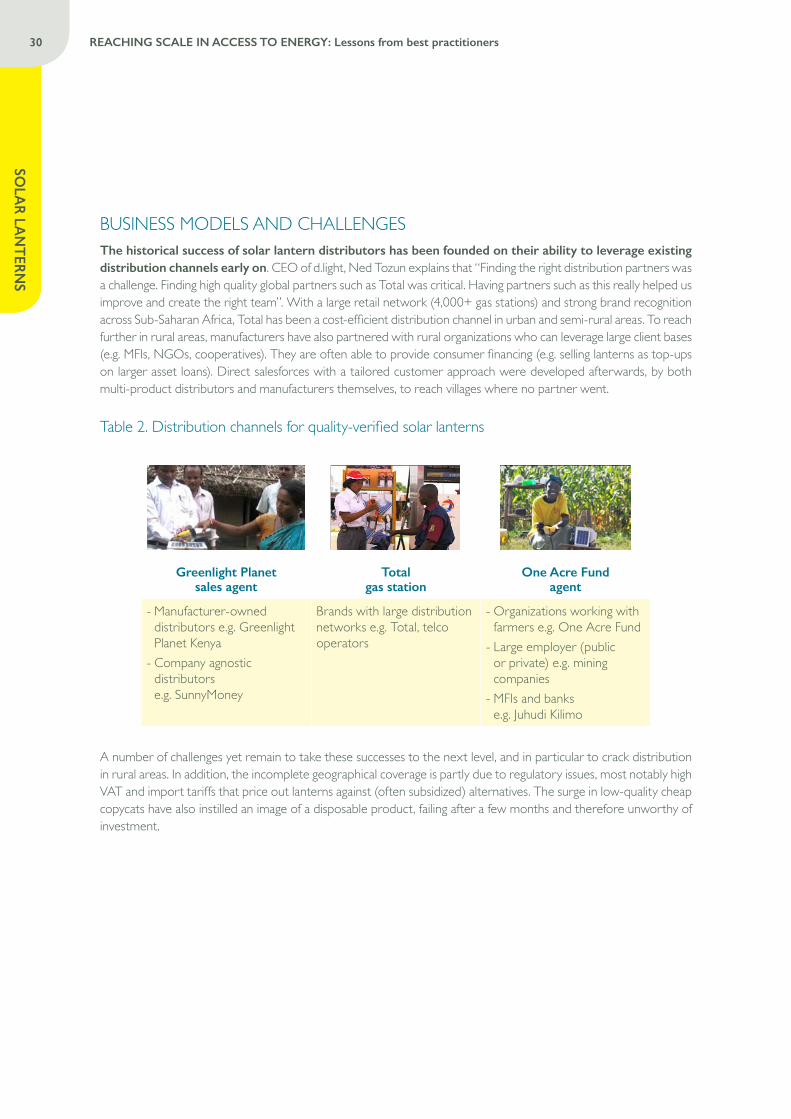
30 REACHING SCALE IN ACCESS TO ENERGY: Lessons from best practitioners
SOLA
R LAN
TERN
S
BUSINESS MODELS AND CHALLENGESThe historical success of solar lantern distributors has been founded on their ability to leverage existing distribution channels early on. CEO of d.light, Ned Tozun explains that “Finding the right distribution partners was a challenge. Finding high quality global partners such as Total was critical. Having partners such as this really helped us improve and create the right team”. With a large retail network (4,000+ gas stations) and strong brand recognition across Sub-Saharan Africa, Total has been a cost-efficient distribution channel in urban and semi-rural areas. To reach further in rural areas, manufacturers have also partnered with rural organizations who can leverage large client bases (e.g. MFIs, NGOs, cooperatives). They are often able to provide consumer financing (e.g. selling lanterns as top-ups on larger asset loans). Direct salesforces with a tailored customer approach were developed afterwards, by both multi-product distributors and manufacturers themselves, to reach villages where no partner went.
Table 2. Distribution channels for quality-verified solar lanterns
Greenlight Planet sales agent
Total gas station
One Acre Fund agent
- Manufacturer-owned distributors e.g. Greenlight Planet Kenya - Company agnostic distributors e.g. SunnyMoney
Brands with large distribution networks e.g. Total, telco operators
- Organizations working with farmers e.g. One Acre Fund - Large employer (public or private) e.g. mining companies - MFIs and banks e.g. Juhudi Kilimo
A number of challenges yet remain to take these successes to the next level, and in particular to crack distribution in rural areas. In addition, the incomplete geographical coverage is partly due to regulatory issues, most notably high VAT and import tariffs that price out lanterns against (often subsidized) alternatives. The surge in low-quality cheap copycats have also instilled an image of a disposable product, failing after a few months and therefore unworthy of investment.
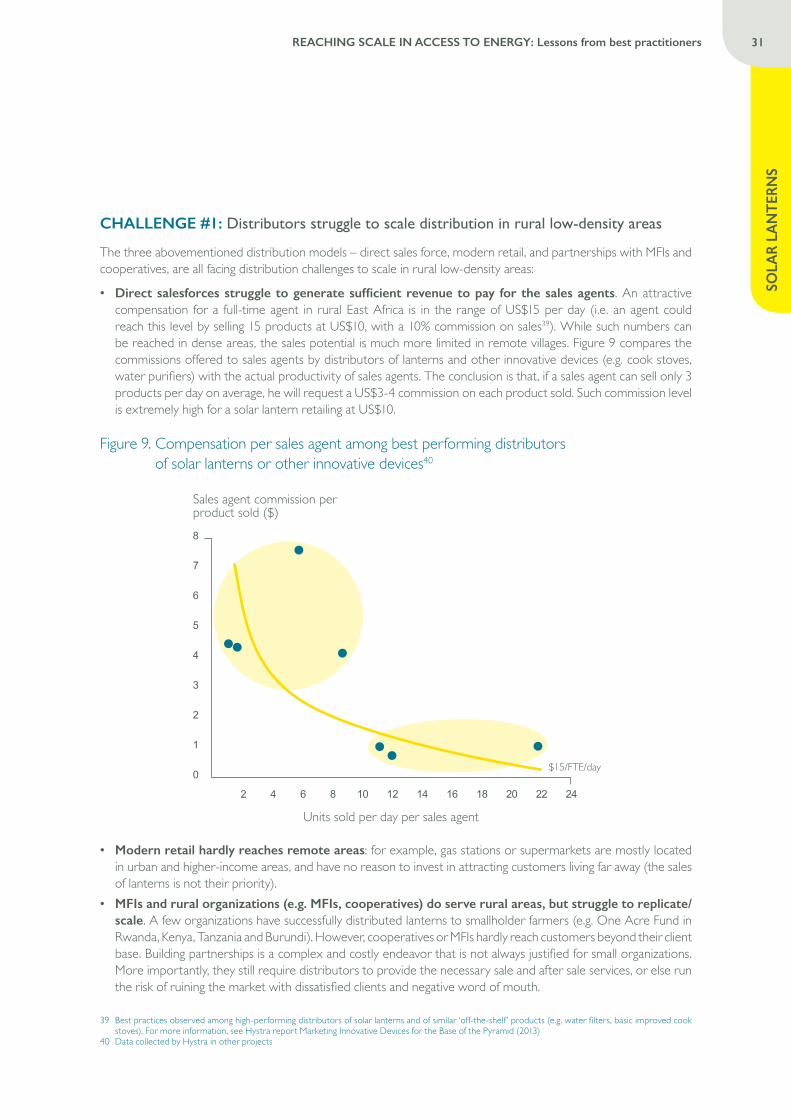
SOLA
R LA
NT
ERN
S
31REACHING SCALE IN ACCESS TO ENERGY: Lessons from best practitioners
CHALLENGE #1: Distributors struggle to scale distribution in rural low-density areas
The three abovementioned distribution models – direct sales force, modern retail, and partnerships with MFIs and cooperatives, are all facing distribution challenges to scale in rural low-density areas:
• Direct salesforces struggle to generate sufficient revenue to pay for the sales agents. An attractive compensation for a full-time agent in rural East Africa is in the range of US$15 per day (i.e. an agent could reach this level by selling 15 products at US$10, with a 10% commission on sales39). While such numbers can be reached in dense areas, the sales potential is much more limited in remote villages. Figure 9 compares the commissions offered to sales agents by distributors of lanterns and other innovative devices (e.g. cook stoves, water purifiers) with the actual productivity of sales agents. The conclusion is that, if a sales agent can sell only 3 products per day on average, he will request a US$3-4 commission on each product sold. Such commission level is extremely high for a solar lantern retailing at US$10.
Figure 9. Compensation per sales agent among best performing distributors of solar lanterns or other innovative devices40
8
7
6
5
4
3
2
1
0
2 4 6 8 10 12 14 16 18 20 22 24
Sales agent commission per product sold ($)
Units sold per day per sales agent
$15/FTE/day
• Modern retail hardly reaches remote areas: for example, gas stations or supermarkets are mostly located in urban and higher-income areas, and have no reason to invest in attracting customers living far away (the sales of lanterns is not their priority).
• MFIs and rural organizations (e.g. MFIs, cooperatives) do serve rural areas, but struggle to replicate/scale. A few organizations have successfully distributed lanterns to smallholder farmers (e.g. One Acre Fund in Rwanda, Kenya, Tanzania and Burundi). However, cooperatives or MFIs hardly reach customers beyond their client base. Building partnerships is a complex and costly endeavor that is not always justified for small organizations. More importantly, they still require distributors to provide the necessary sale and after sale services, or else run the risk of ruining the market with dissatisfied clients and negative word of mouth.
39 Best practices observed among high-performing distributors of solar lanterns and of similar ‘off-the-shelf ’ products (e.g. water filters, basic improved cook stoves). For more information, see Hystra report Marketing Innovative Devices for the Base of the Pyramid (2013)
40 Data collected by Hystra in other projects
32 REACHING SCALE IN ACCESS TO ENERGY: Lessons from best practitioners
SOLA
R LAN
TERN
S
CHALLENGE #2: Quality-verified lantern players suffer from competition of low-quality cheap copycats and struggle to reassure customer on the quality of their products
Low-quality products, mostly imported from East Asia have surged in the past few years. Non-quality-verified lanterns, often copycats from large brands, are estimated to represent at least half of the cumulated sales in Sub-Saharan Africa (and over two thirds in Tanzania41). Their prices are significantly lower, as they use lower quality materials and do not provide any warranty or service. One company mentioned that the retail price of its copycats was equivalent to its landed cost. These low-quality copycats are also reaching rural areas through traditional wholesale and retail channels42. As a result, “in many rural areas, it is easy to get a low-quality product but hard to get hold of quality products”43, which was confirmed by field visits conducted for this report in Kenya and Tanzania, where not a single quality-verified solar lantern could be seen in remote rural areas.
While awareness is progressing, low-quality products and lack of service have affected customer trust in solar lanterns. The review of existing literature discussing awareness of solar among off-grid households shows awareness of solar products progressing much faster than their penetration across all geographies, even in rural West Africa, and particularly in urban/peri-urban East Africa44 (see Table 3). As d.light’s management puts it, “It is not about educating the market anymore. In Kenya, 80% of our target market is aware of our brand.” Solar lanterns are becoming a very competitive market in most advanced areas, where the main barrier to their adoption has hence shifted from awareness to trust. Evidence from the field indeed indicates widespread quality and trust issues with solar lanterns45,46. The Greenlight Planet team explained “In some areas of Tanzania, the perception of solar is so poor that people are not looking for durability anymore: they just look for the best deal in terms of price and brightness, and assume they will buy another product in six months.” Are products breaking down because of consumer misuse, or because of poor manufacturing, or is just an over-reaction from customers? In any case, dissatisfaction generates a negative word-of-mouth that is spoiling the market for distributors of quality-verified solar lanterns.
41 BNEF, Lighting Global - Off-grid Solar Market Trend Report (2016); ODI country reports (2016)42 Expert interviews; Lighting Global (2015), The Rise of Solar: Market Evolution of Off-Grid Lighting in Three Kenyan Towns; ODI (2016), Kenya report; Niti
Bhan, Deconstructing the solar lighting market hype, September 2, 201243 ODI (2016), Ethiopia report44 “The majority of adults in the research (89%) mentioned that they had seen a solar light before; most commonly they reported encountering a solar light for the first
time at a relative’s or neighbor’s house“: Adina Rom, Isabel Gunther, Kat Harrison, The Economic Impact of Solar Lighting, 201745 A pilot survey run across 9 counties of Kenya found that 18% of lanterns were broken 1.5 year after purchase, a proportion that increases to 52% after 2.5
years. 58% of surveyed households declared having issues with their lantern over the past year. Solar and other stories46 “About a tenth of the lights are broken after 7 months“: Adina Rom, Isabel Gunther, Kat Harrison, The Economic Impact of Solar Lighting, (2017)
“Over recent years we have seen a change in the type of customers we work with. Farming union and co-operatives, local distributors and even local retailers have moved into the space. They have access to some finance and also understand their customers’ needs allowing us to tailor make solutions for them. They have direct access to the customer cutting out much of the “old chain of supply” ultimately meaning the product is more affordable. Also organizations such as banks and MFIs are giving direct loans for home systems more and more they are partnering with local distributors to make these projects a success.”
Richard Atwal, CEO of Renewit
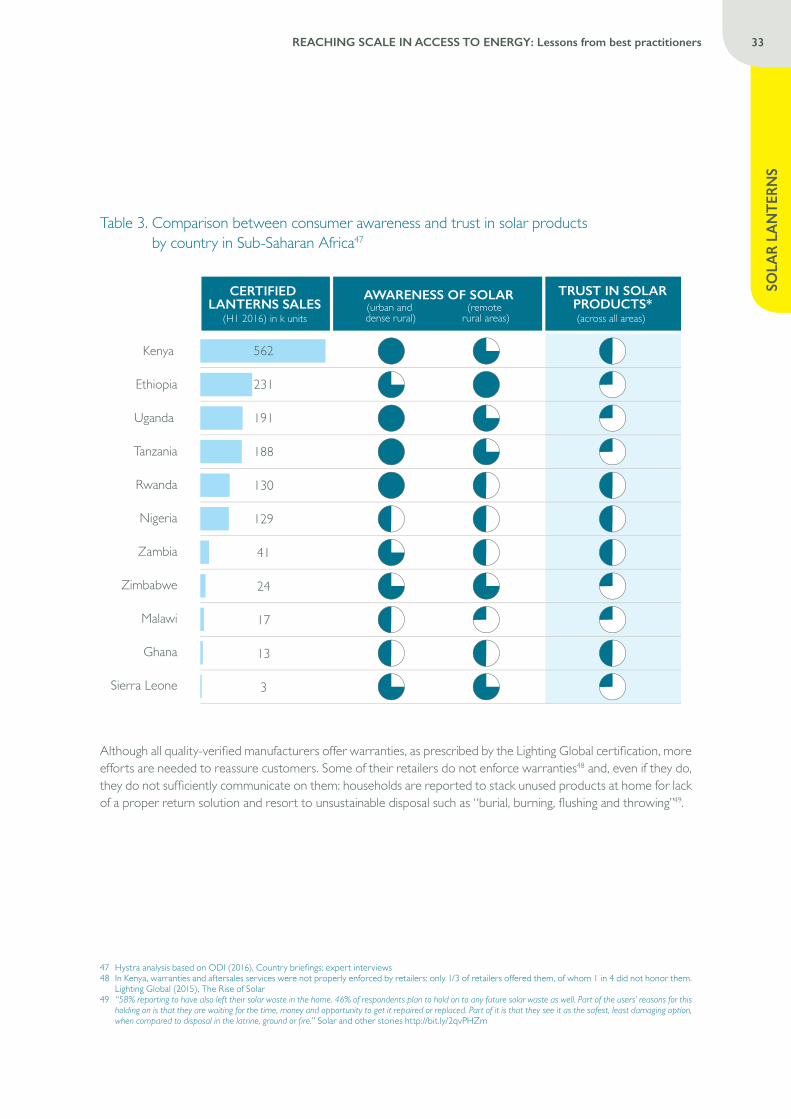
SOLA
R LA
NT
ERN
S
33REACHING SCALE IN ACCESS TO ENERGY: Lessons from best practitioners
Table 3. Comparison between consumer awareness and trust in solar products by country in Sub-Saharan Africa47
Kenya
Ethiopia
Uganda
Tanzania
Rwanda
Nigeria
Zambia
Zimbabwe
Malawi
Ghana
Sierra Leone
562
231
191
188
130
129
41
24
17
13
3
CERTIFIED LANTERNS SALES
(H1 2016) in k units
AWARENESS OF SOLAR(urban and dense rural)
(remote rural areas)
TRUST IN SOLARPRODUCTS*(across all areas)
Although all quality-verified manufacturers offer warranties, as prescribed by the Lighting Global certification, more efforts are needed to reassure customers. Some of their retailers do not enforce warranties48 and, even if they do, they do not sufficiently communicate on them: households are reported to stack unused products at home for lack of a proper return solution and resort to unsustainable disposal such as “burial, burning, flushing and throwing”49.
47 Hystra analysis based on ODI (2016), Country briefings; expert interviews48 In Kenya, warranties and aftersales services were not properly enforced by retailers: only 1/3 of retailers offered them, of whom 1 in 4 did not honor them.
Lighting Global (2015), The Rise of Solar49 “58% reporting to have also left their solar waste in the home. 46% of respondents plan to hold on to any future solar waste as well. Part of the users’ reasons for this
holding on is that they are waiting for the time, money and opportunity to get it repaired or replaced. Part of it is that they see it as the safest, least damaging option, when compared to disposal in the latrine, ground or fire.” Solar and other stories http://bit.ly/2qvPHZm
34 REACHING SCALE IN ACCESS TO ENERGY: Lessons from best practitioners
SOLA
R LAN
TERN
S
Interview with Ned Tozun, CEO & Founder of d.light
What challenges have you faced on the way to become a market leader?
“Product awareness was a challenge earlier. We have spent a lot of time raising awareness on solar, and on our brand. Finding the right distribution partners was a challenge. Finding high quality global partners such as Total was critical. Having partners such as this really helped us improve and create the right team. Putting the right team together was also difficult. We fortunately managed to get a global team with the right people. This was more difficult at the beginning, and easier today.”
Is the market commoditized with low-cost competitors? How can manufacturers of quality products like d.light react?
“There are lot of newcomers from China but they don’t have teams on the ground, so they focus on one-off sales, not sustainable solutions. We are concerned with copycats and counterfeits, about a dozen companies are producing low-quality products that look very similar to ours. We are working on certification that could be better enforced with GOGLA and others.”
CHALLENGE #3: The emergence of local distributors has been limited due to challenges in sourcing quality products, lack of financing, and slow dissemination of best practices
As CEO of Renewit (a company which supplies many distributors in the industry) Richard Atwal explains, “Financing for local distributors is the main barrier to scale. Today global manufacturers like us can find international financing, but the bottleneck is really the distribution in the field. Local banks should be willing to lend to these companies, but have little knowledge of the products and the companies.” Local distributors are facing major challenges in sourcing products, such as:
• Selecting the right products and suppliers, due to a lack of knowledge of the range of good products and suppliers available globally.
• Sourcing products reliably from distant suppliers that require cash payments and minimum order size representing several months of sales. This, combined with the months required for transportation and customs clearance, creates a huge need for working capital (commonly 6 months of sales).
• Anticipating litigation issues if the products delivered do not work or do not meet the quality standards anticipated. • Managing the excessive costs to conduct due diligence in supplier manufacturing plants (that are generally
outsourced in China) for socially and environmentally conscious distributors.
In addition, they struggle in designing tailored effective management systems and providing the full suite of services (social marketing, training, financing, and maintenance) needed to address the concerns that deter BoP clients to buy these products.
CHALLENGE #4: Regulatory issues remain in many countries.
In particular, higher VAT and import tariffs remain on solar products (or unreliable exemptions). As d.light management explains “Regulations and policy are a major issue: in Kenya the market exploded after they removed import duties. This is not the case everywhere, and for example the penetration is much lower in Nigeria, where customs duties are higher. Subsidies on kerosene have also delayed market penetration.” Product certification is another challenge. CEO of Renewit, Richard Atwal explains that “In some countries, you need some sort of certification to move products in the country. Kenya and Ethiopia are moving to Lighting Global certification. The World Bank has had successes in regulatory framework negotiation with governments but things are moving slowly. And even if countries set regulations in place, it will be difficult to enforce. Chinese products come in low quantities and are hard to stop.”
SOLA
R LA
NT
ERN
S
35REACHING SCALE IN ACCESS TO ENERGY: Lessons from best practitioners
RECOMMENDATIONSSolar lanterns are the most advanced energy access solution observed in this report, in terms of practitioners’ learning curve, sales volume and overall industry maturity. A new market phase appears to be emerging in historical markets, featuring saturation and commoditization trends. The challenges for practitioners there do not relate to energy access anymore, but rather to the complexities of creating brand equity to drive repeat sales and customer loyalty.
From an energy access perspective, two questions remain: how to reach the complex geographies that are underserved? And how to ensure that solar lanterns deliver on their promise of creating real economic savings and tangible impact from development indicators? In other words, how to ensure that purchasers of solar lanterns effectively reach the second step of the energy ladder?
To address these two strategic questions, four opportunities emerge:
OPPORTUNITY #1: Accelerate replication of successful business models in underserved countries.
Practitioners have historically overlooked most markets in Asia and Sub Saharan Africa, focusing on a few regions of East Africa and India where market conditions were more conducive. Practitioners have strengthened their value proposition, and distribution and revenue models there, while donors and policy makers seek to create a more enabling environment in underserved markets. They have significantly reduced barriers to entry in these markets (e.g. lower VAT and tariffs on solar products, higher awareness, decreasing kerosene subsidies). In West Africa and in Nigeria, sales are starting to pick up, and it seems to be the right time for practitioners to jump on the bandwagon.
Donors have their work cut out to promote in a very large number of non-covered markets the very successful market activation programs which took place in East Africa, and keep fighting regulation creep (import tariffs rising again?50).
OPPORTUNITY #2: Explore new distribution channels and expand product range to increase penetration in low-density areas.
Practitioners should continue ongoing efforts with partners in rural areas (e.g. farmer cooperatives, savings groups, MFIs, community health worker networks), but this alone will not be sufficient to reach a majority of the market. Structured organizations off all types indeed only reach a minority of the rural off-grid population.
They will have to set up professional direct salesforce to reassure customers in rural areas with low awareness and trust. However, given the complexity of sales, higher commissions will be required, likely in the US$3-4 range per product. Tactical pricing will hence be required for sustainability (i.e. increase end-user price as compared to denser areas), which may have an impact on current product mixes (higher end solar products better absorbing higher commissions)51.
Traditional retail will be leveraged in a second phase, when brands are recognized and can justify quality premiums52. It would be by far the most cost efficient channel.
Equity investors can impulse these strategic changes through governance and funding:
• Promoting significant sales overhead investments (CRM, management) • Injecting sufficient equity to finance growth in volume • Fostering consolidation now that growth is slowing down and best practices are better accounted for
50 Lighting Global and GOGLA, Global Off-Grid Solar Semi-Annual Market Report (July-December 2016): “ In the East African Community (EAC), companies faced a policy change resulting in increased import tariffs on solar products and appliances”
51 The combination of cash sales lanterns and PAYG SHS in the same sales agent’s basket should be handled with caution/tested further, as they require different sales skills, sales pitches, and attention
52 See Toyola strategy in the chapter on improved cook stoves
36 REACHING SCALE IN ACCESS TO ENERGY: Lessons from best practitioners
SOLA
R LAN
TERN
S
OPPORTUNITY #3: Cooperate to provide customer care in rural areas, either directly or by setting up a multi-brand aftersales utility for selected quality-verified products.
Aftersales service is often critically missing in rural areas, which contributes to the lack of customer trust in solar products. However, the costs of setting up a dedicated service would not be justified for a single player (low density and affordability, high logistical costs, lack of properly qualified staff).
Hence, there could be an opportunity, for large corporates or multi-product distributors with a large rural reach, to create a multi-brand aftersales utility, which would provide the necessary critical mass of products. This utility could offer customer return and/or repair points (and possibly more services e.g. recycling) for a selection of quality-verified lanterns, and possibly other devices with similar challenges (e.g. water filters, improved cook stoves). It could leverage existing reverse logistics networks of large companies or SHS players for instance. However, a number of questions remain: What business model? What criteria for product selection? How is the responsibility of customer relationships shared between the utility and the brands? Need for subsidies?
Investors can also help by promoting commercial approaches focused on customer satisfaction, not on sales volume. They could also earmark funding to encourage business model innovations, instead of asset purchase. Setting the right milestones and KPIs will be key to direct managers to make the right decisions.
Interview with Jon Blashford, Head of Operations, One Acre Fund
What are your views on solar lanterns in the field?
“We had quite a bit of fine tuning on lanterns. Our first products proved to have very high breaking rates, which took a great deal of time from our field officers, were disappointing for our clients, and led to challenges in managing of our reserve stocks. Today we have a better product and processing solution, but it still remains dependant on our field officers who receive notice from customers, ask a few questions and perform basic tests, and then bring the device to the weekly meeting. The lamp is then transported to our processing team where it undergoes more comprehensive tests and before replacement is transported back out to the field. The broken lamps are picked up by Greenlight Planet. Greenlight Planet is able to recycle the plastic, but they don’t seem to have a solution in Kenya for recycling the battery yet. A new Rwanda plant is expected to open later this year and is supposed to be able to recycle lithium batteries.
We have 250,000 clients in Kenya, and this provides for a full-time team though they do carry out some additional duties. These areas seem to be challenging for the manufacturers to serve directly. I believe, Greenlight Planet has considered setting their own aftersales team given the numbers, but haven’t proceeded.”
Have you considered offering this service to other manufacturers?
“After the first trials, we have set up a testing lab for lanterns, and we would only vouch for quality lanterns, knowing how disruptive and disappointing low quality devices can be. I think it is very unlikely that we would support any random supplier.”
SOLA
R LA
NT
ERN
S
37REACHING SCALE IN ACCESS TO ENERGY: Lessons from best practitioners
OPPORTUNITY #4: Create a platform supporting a network of local distributors.
This opportunity was identified after discussions with practitioners, who identify the same series of bottlenecks for local distributors across sectors (not just energy, but also water and sanitation, housing, nutrition, agriculture, etc.). These distributors may sell different products (e.g. solar lanterns, improved cook stoves, water filters), but they face the same major distribution challenges: sourcing the right products from distant suppliers of varying reliability, financing working capital, and identifying the best customer service practices.
The first player able to create a platform addressing most of these challenges at once would have a strong competitive advantage as the first entrant, aggregating demand from an ever-growing base of distributors. This platform would support a selected network of multiproduct distributors with three tightly integrated activities:
• Aggregated purchase from certified manufacturers in partnership with existing organizations and certified standards. The platform would select products and suppliers, evaluate technologies, conduct operational, environmental and social due diligence, guarantee quality of products, and negotiate best prices by aggregating orders.
• Technical assistance, for instance through best practice workshops to promote experience sharing among members (social marketing, recruitment, impact measurement capabilities, etc.), or common management information systems.
• Financing of working capital (payment options, bundled shipments, etc.)
The following issues would still need to be addressed: - What are the core roles to be played initially? Which ones should only come in later? - What is the appropriate governance structure? Who are the core group of committed distributors? - Should the platform seek to build a partnership with an existing global retail group, in order to leverage its expertise, scale and resources?
- What would priority geographies and product lines be? - What should be the revenue model of this new intermediary? Key operational risks? Amount and structure of capital required, as well as possible investors?
- Should the platform remain independent over the long term or is it designed to be acquired?

Credit : © 2017 Off-Grid Electric, Ltd.
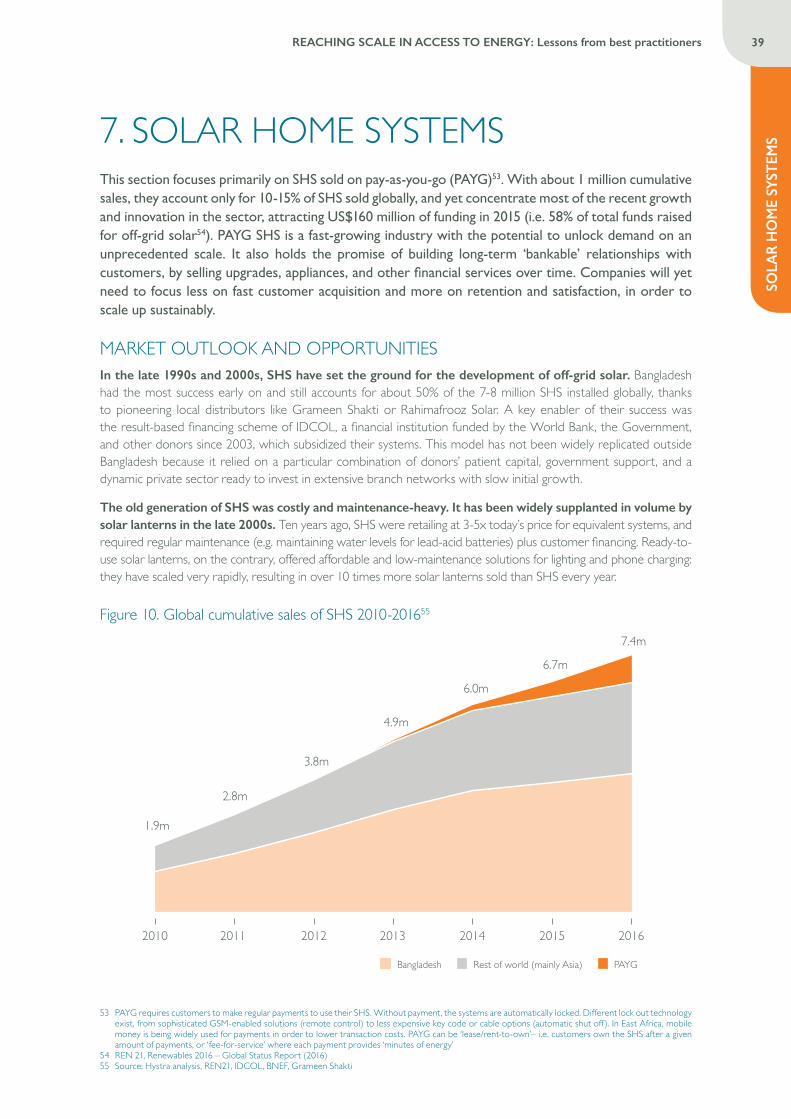
SOLA
R H
OM
E SY
STEM
S
39REACHING SCALE IN ACCESS TO ENERGY: Lessons from best practitioners
7. SOLAR HOME SYSTEMSThis section focuses primarily on SHS sold on pay-as-you-go (PAYG)53. With about 1 million cumulative sales, they account only for 10-15% of SHS sold globally, and yet concentrate most of the recent growth and innovation in the sector, attracting US$160 million of funding in 2015 (i.e. 58% of total funds raised for off-grid solar54). PAYG SHS is a fast-growing industry with the potential to unlock demand on an unprecedented scale. It also holds the promise of building long-term ‘bankable’ relationships with customers, by selling upgrades, appliances, and other financial services over time. Companies will yet need to focus less on fast customer acquisition and more on retention and satisfaction, in order to scale up sustainably.
MARKET OUTLOOK AND OPPORTUNITIESIn the late 1990s and 2000s, SHS have set the ground for the development of off-grid solar. Bangladesh had the most success early on and still accounts for about 50% of the 7-8 million SHS installed globally, thanks to pioneering local distributors like Grameen Shakti or Rahimafrooz Solar. A key enabler of their success was the result-based financing scheme of IDCOL, a financial institution funded by the World Bank, the Government, and other donors since 2003, which subsidized their systems. This model has not been widely replicated outside Bangladesh because it relied on a particular combination of donors’ patient capital, government support, and a dynamic private sector ready to invest in extensive branch networks with slow initial growth.
The old generation of SHS was costly and maintenance-heavy. It has been widely supplanted in volume by solar lanterns in the late 2000s. Ten years ago, SHS were retailing at 3-5x today’s price for equivalent systems, and required regular maintenance (e.g. maintaining water levels for lead-acid batteries) plus customer financing. Ready-to-use solar lanterns, on the contrary, offered affordable and low-maintenance solutions for lighting and phone charging: they have scaled very rapidly, resulting in over 10 times more solar lanterns sold than SHS every year.
Figure 10. Global cumulative sales of SHS 2010-201655
2010 2011 2012 2013 2014 2015 2016
7.4m
6.7m
6.0m
4.9m
3.8m
2.8m
1.9m
Bangladesh Rest of world (mainly Asia) PAYG
53 PAYG requires customers to make regular payments to use their SHS. Without payment, the systems are automatically locked. Different lock out technology exist, from sophisticated GSM-enabled solutions (remote control) to less expensive key code or cable options (automatic shut off ). In East Africa, mobile money is being widely used for payments in order to lower transaction costs. PAYG can be ‘lease/rent-to-own’– i.e. customers own the SHS after a given amount of payments, or ‘fee-for-service’ where each payment provides ‘minutes of energy’
54 REN 21, Renewables 2016 – Global Status Report (2016)55 Source: Hystra analysis, REN21, IDCOL, BNEF, Grameen Shakti
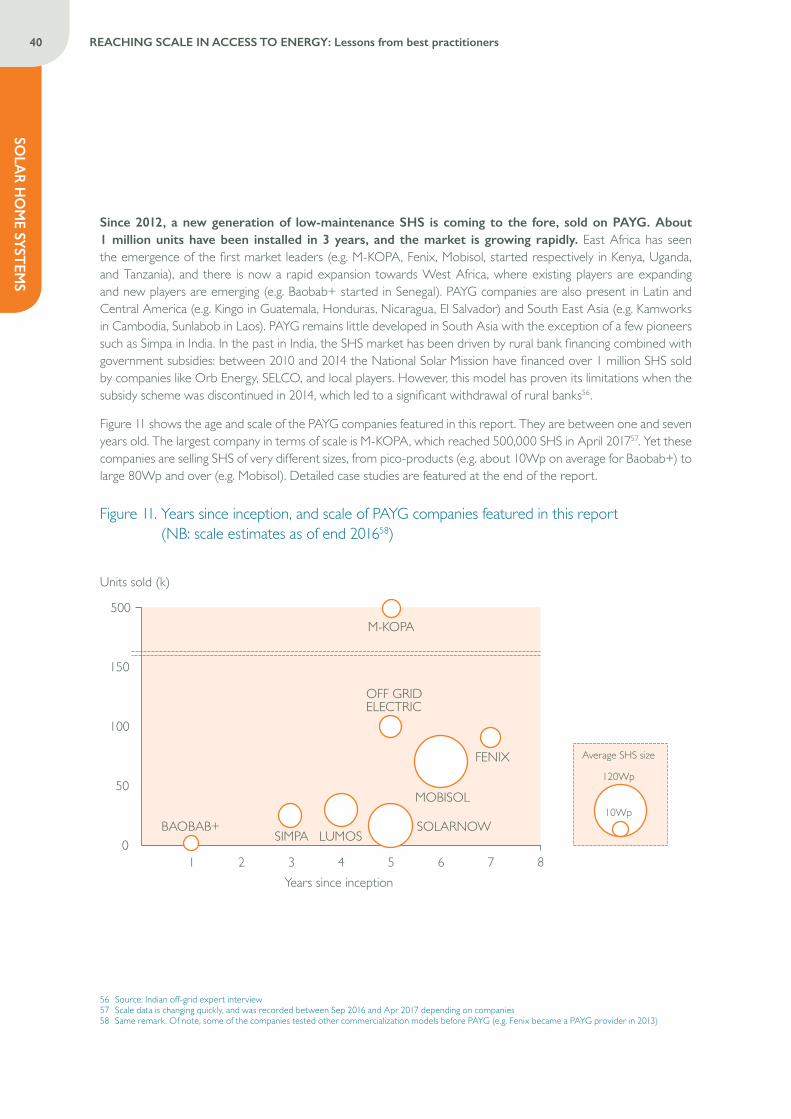
40 REACHING SCALE IN ACCESS TO ENERGY: Lessons from best practitioners
SOLA
R HO
ME SYST
EMS
Since 2012, a new generation of low-maintenance SHS is coming to the fore, sold on PAYG. About 1 million units have been installed in 3 years, and the market is growing rapidly. East Africa has seen the emergence of the first market leaders (e.g. M-KOPA, Fenix, Mobisol, started respectively in Kenya, Uganda, and Tanzania), and there is now a rapid expansion towards West Africa, where existing players are expanding and new players are emerging (e.g. Baobab+ started in Senegal). PAYG companies are also present in Latin and Central America (e.g. Kingo in Guatemala, Honduras, Nicaragua, El Salvador) and South East Asia (e.g. Kamworks in Cambodia, Sunlabob in Laos). PAYG remains little developed in South Asia with the exception of a few pioneers such as Simpa in India. In the past in India, the SHS market has been driven by rural bank financing combined with government subsidies: between 2010 and 2014 the National Solar Mission have financed over 1 million SHS sold by companies like Orb Energy, SELCO, and local players. However, this model has proven its limitations when the subsidy scheme was discontinued in 2014, which led to a significant withdrawal of rural banks56.
Figure 11 shows the age and scale of the PAYG companies featured in this report. They are between one and seven years old. The largest company in terms of scale is M-KOPA, which reached 500,000 SHS in April 201757. Yet these companies are selling SHS of very different sizes, from pico-products (e.g. about 10Wp on average for Baobab+) to large 80Wp and over (e.g. Mobisol). Detailed case studies are featured at the end of the report.
Figure 11. Years since inception, and scale of PAYG companies featured in this report (NB: scale estimates as of end 201658)
Average SHS size
120Wp
10Wp
Units sold (k)
M-KOPA
OFF GRID ELECTRIC
0
50
100
150
1 2 3 4 5 6 7 8 Years since inception
MOBISOL
FENIX
SIMPA LUMOS BAOBAB+
500
SOLARNOW
56 Source: Indian off-grid expert interview57 Scale data is changing quickly, and was recorded between Sep 2016 and Apr 2017 depending on companies58 Same remark. Of note, some of the companies tested other commercialization models before PAYG (e.g. Fenix became a PAYG provider in 2013)
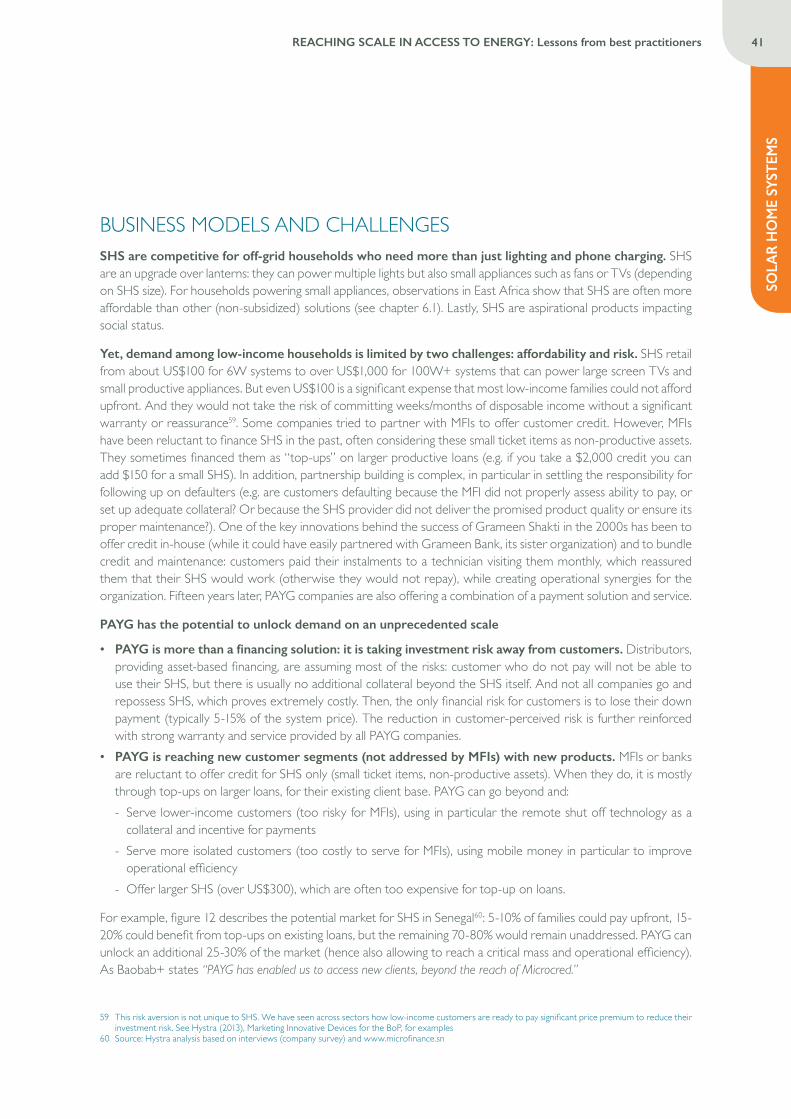
SOLA
R H
OM
E SY
STEM
S
41REACHING SCALE IN ACCESS TO ENERGY: Lessons from best practitioners
BUSINESS MODELS AND CHALLENGES SHS are competitive for off-grid households who need more than just lighting and phone charging. SHS are an upgrade over lanterns: they can power multiple lights but also small appliances such as fans or TVs (depending on SHS size). For households powering small appliances, observations in East Africa show that SHS are often more affordable than other (non-subsidized) solutions (see chapter 6.1). Lastly, SHS are aspirational products impacting social status.
Yet, demand among low-income households is limited by two challenges: affordability and risk. SHS retail from about US$100 for 6W systems to over US$1,000 for 100W+ systems that can power large screen TVs and small productive appliances. But even US$100 is a significant expense that most low-income families could not afford upfront. And they would not take the risk of committing weeks/months of disposable income without a significant warranty or reassurance59. Some companies tried to partner with MFIs to offer customer credit. However, MFIs have been reluctant to finance SHS in the past, often considering these small ticket items as non-productive assets. They sometimes financed them as “top-ups” on larger productive loans (e.g. if you take a $2,000 credit you can add $150 for a small SHS). In addition, partnership building is complex, in particular in settling the responsibility for following up on defaulters (e.g. are customers defaulting because the MFI did not properly assess ability to pay, or set up adequate collateral? Or because the SHS provider did not deliver the promised product quality or ensure its proper maintenance?). One of the key innovations behind the success of Grameen Shakti in the 2000s has been to offer credit in-house (while it could have easily partnered with Grameen Bank, its sister organization) and to bundle credit and maintenance: customers paid their instalments to a technician visiting them monthly, which reassured them that their SHS would work (otherwise they would not repay), while creating operational synergies for the organization. Fifteen years later, PAYG companies are also offering a combination of a payment solution and service.
PAYG has the potential to unlock demand on an unprecedented scale
• PAYG is more than a financing solution: it is taking investment risk away from customers. Distributors, providing asset-based financing, are assuming most of the risks: customer who do not pay will not be able to use their SHS, but there is usually no additional collateral beyond the SHS itself. And not all companies go and repossess SHS, which proves extremely costly. Then, the only financial risk for customers is to lose their down payment (typically 5-15% of the system price). The reduction in customer-perceived risk is further reinforced with strong warranty and service provided by all PAYG companies.
• PAYG is reaching new customer segments (not addressed by MFIs) with new products. MFIs or banks are reluctant to offer credit for SHS only (small ticket items, non-productive assets). When they do, it is mostly through top-ups on larger loans, for their existing client base. PAYG can go beyond and: - Serve lower-income customers (too risky for MFIs), using in particular the remote shut off technology as a collateral and incentive for payments
- Serve more isolated customers (too costly to serve for MFIs), using mobile money in particular to improve operational efficiency
- Offer larger SHS (over US$300), which are often too expensive for top-up on loans.
For example, figure 12 describes the potential market for SHS in Senegal60: 5-10% of families could pay upfront, 15-20% could benefit from top-ups on existing loans, but the remaining 70-80% would remain unaddressed. PAYG can unlock an additional 25-30% of the market (hence also allowing to reach a critical mass and operational efficiency). As Baobab+ states “PAYG has enabled us to access new clients, beyond the reach of Microcred.”
59 This risk aversion is not unique to SHS. We have seen across sectors how low-income customers are ready to pay significant price premium to reduce their investment risk. See Hystra (2013), Marketing Innovative Devices for the BoP, for examples
60 Source: Hystra analysis based on interviews (company survey) and www.microfinance.sn
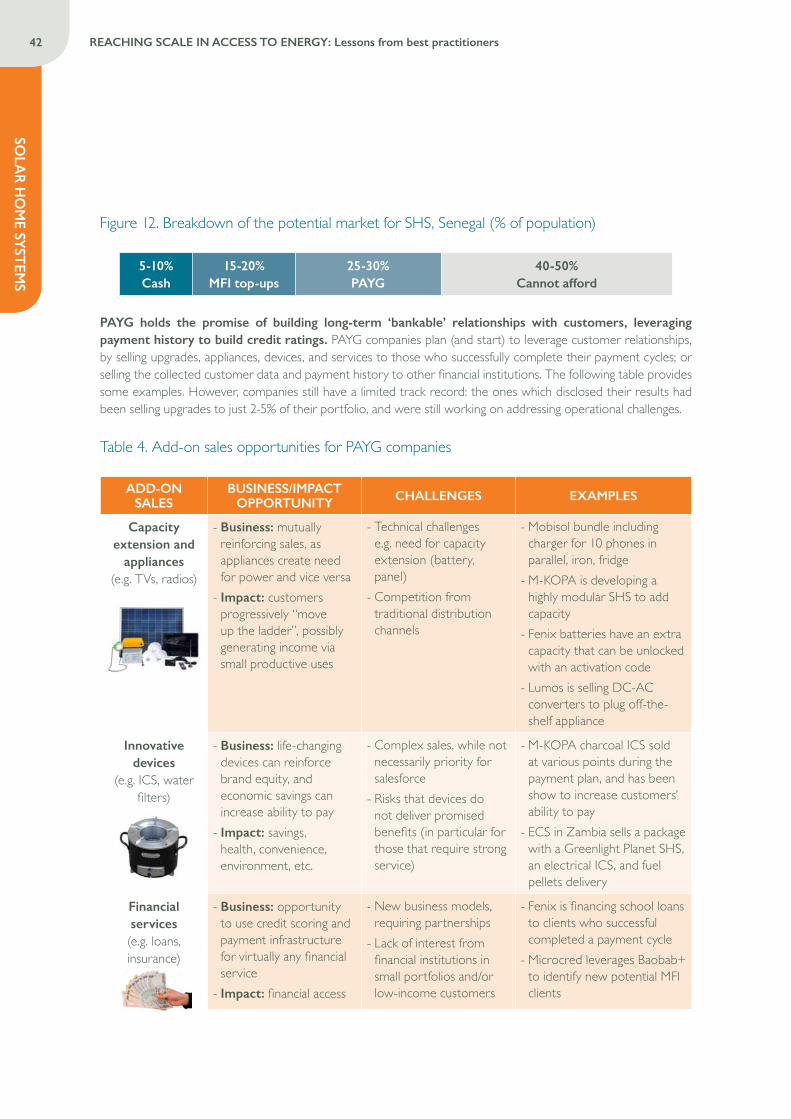
42 REACHING SCALE IN ACCESS TO ENERGY: Lessons from best practitioners
SOLA
R HO
ME SYST
EMS
Figure 12. Breakdown of the potential market for SHS, Senegal (% of population)
5-10% Cash
15-20% MFI top-ups
25-30% PAYG
40-50% Cannot afford
PAYG holds the promise of building long-term ‘bankable’ relationships with customers, leveraging payment history to build credit ratings. PAYG companies plan (and start) to leverage customer relationships, by selling upgrades, appliances, devices, and services to those who successfully complete their payment cycles; or selling the collected customer data and payment history to other financial institutions. The following table provides some examples. However, companies still have a limited track record: the ones which disclosed their results had been selling upgrades to just 2-5% of their portfolio, and were still working on addressing operational challenges.
Table 4. Add-on sales opportunities for PAYG companies
ADD-ON SALES
BUSINESS/IMPACT OPPORTUNITY CHALLENGES EXAMPLES
Capacity extension and
appliances (e.g. TVs, radios)
- Business: mutually reinforcing sales, as appliances create need for power and vice versa - Impact: customers progressively “move up the ladder”, possibly generating income via small productive uses
- Technical challenges e.g. need for capacity extension (battery, panel) - Competition from traditional distribution channels
- Mobisol bundle including charger for 10 phones in parallel, iron, fridge - M-KOPA is developing a highly modular SHS to add capacity - Fenix batteries have an extra capacity that can be unlocked with an activation code - Lumos is selling DC-AC converters to plug off-the-shelf appliance
Innovative devices
(e.g. ICS, water filters)
- Business: life-changing devices can reinforce brand equity, and economic savings can increase ability to pay - Impact: savings, health, convenience, environment, etc.
- Complex sales, while not necessarily priority for salesforce - Risks that devices do not deliver promised benefits (in particular for those that require strong service)
- M-KOPA charcoal ICS sold at various points during the payment plan, and has been show to increase customers’ ability to pay - ECS in Zambia sells a package with a Greenlight Planet SHS, an electrical ICS, and fuel pellets delivery
Financial services (e.g. loans, insurance)
- Business: opportunity to use credit scoring and payment infrastructure for virtually any financial service - Impact: financial access
- New business models, requiring partnerships - Lack of interest from financial institutions in small portfolios and/or low-income customers
- Fenix is financing school loans to clients who successful completed a payment cycle - Microcred leverages Baobab+ to identify new potential MFI clients
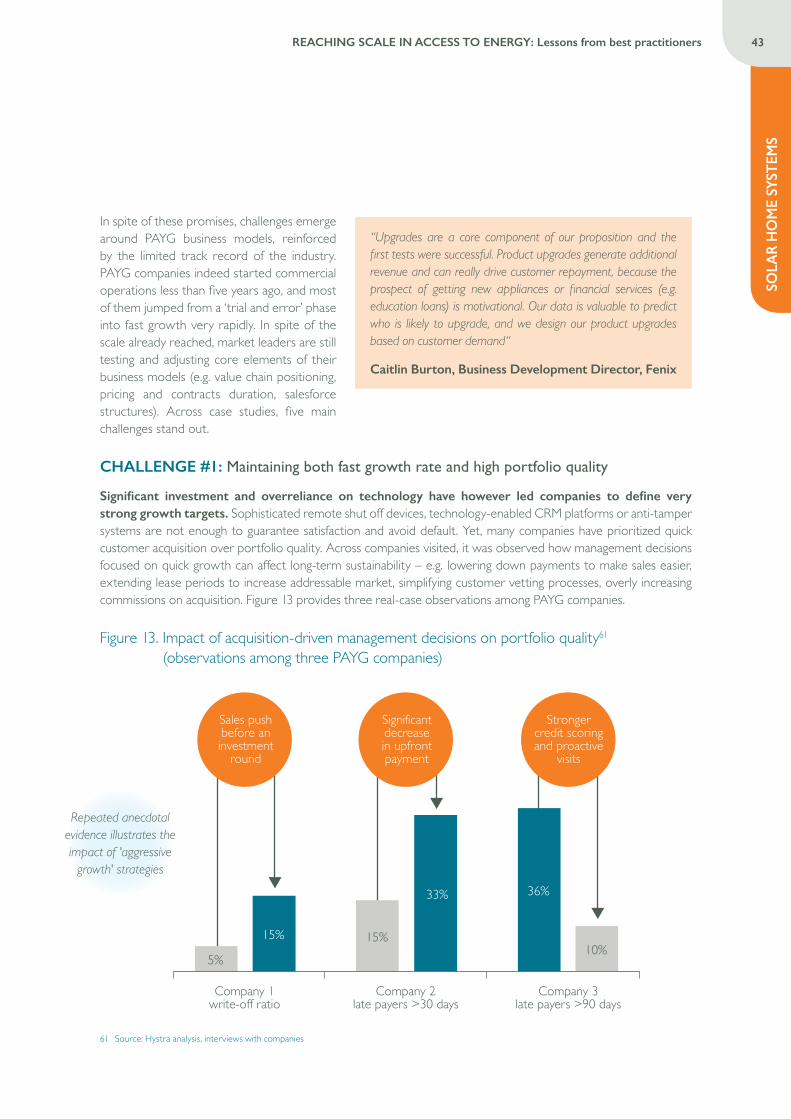
SOLA
R H
OM
E SY
STEM
S
43REACHING SCALE IN ACCESS TO ENERGY: Lessons from best practitioners
In spite of these promises, challenges emerge around PAYG business models, reinforced by the limited track record of the industry. PAYG companies indeed started commercial operations less than five years ago, and most of them jumped from a ‘trial and error’ phase into fast growth very rapidly. In spite of the scale already reached, market leaders are still testing and adjusting core elements of their business models (e.g. value chain positioning, pricing and contracts duration, salesforce structures). Across case studies, five main challenges stand out.
CHALLENGE #1: Maintaining both fast growth rate and high portfolio quality
Significant investment and overreliance on technology have however led companies to define very strong growth targets. Sophisticated remote shut off devices, technology-enabled CRM platforms or anti-tamper systems are not enough to guarantee satisfaction and avoid default. Yet, many companies have prioritized quick customer acquisition over portfolio quality. Across companies visited, it was observed how management decisions focused on quick growth can affect long-term sustainability – e.g. lowering down payments to make sales easier, extending lease periods to increase addressable market, simplifying customer vetting processes, overly increasing commissions on acquisition. Figure 13 provides three real-case observations among PAYG companies.
Figure 13. Impact of acquisition-driven management decisions on portfolio quality61 (observations among three PAYG companies)REPEATED ANECDOTAL EVIDENCE ILLUSTRATES THE
IMPACT OF ‘AGGRESSIVE GROWTH’ STRATEGIES
Company 1 write-off ratio
Company 2late payers >30 days
Company 3late payers >90 days
5%
15%
Sales push before an investment
round
15%
33%
Significant decrease in upfront payment
10%
36%
Stronger credit scoring and proactive
visits
61 Source: Hystra analysis, interviews with companies
“Upgrades are a core component of our proposition and the first tests were successful. Product upgrades generate additional revenue and can really drive customer repayment, because the prospect of getting new appliances or financial services (e.g. education loans) is motivational. Our data is valuable to predict who is likely to upgrade, and we design our product upgrades based on customer demand“
Caitlin Burton, Business Development Director, Fenix
Repeated anecdotal evidence illustrates the impact of 'aggressive
growth' strategies
44 REACHING SCALE IN ACCESS TO ENERGY: Lessons from best practitioners
SOLA
R HO
ME SYST
EMS
Emerging best practices
• Reinforced customer selection to ensure that only customers who can actually afford (and are willing) to pay will be connected, e.g. with increased down payments, reinforced vetting processes, or shortened contract periods. For example, M-KOPA’s deposits are carefully calibrated by the credit team to maintain repayment rates, and sales agents are trained to make sure the customer has sufficient savings on kerosene to afford the daily payments. Mobisol has also developed a sophisticated two-stage credit check, which combines an online credit app (rather than just a phone call) credit algorithms and credit scoring.
• Differentiated value proposition based on customer segmentation: companies are increasingly able to identify the risk levels of their different customer segments, by collecting and analyzing data. Some of them are adapting their value proposition and processes, to be able to serve riskier segments among the lowest-income groups but also to promote larger products and appliances among the more bankable customers.
• Focus on impeccable service and satisfaction: Customers have high expectations on PAYG SHS and are likely to default if those expectations are not matched. Indeed, PAYG SHS are premium products, compared to the low-cost, no-warranty SHS than can be found in many city markets at a price 2-3x lower. As one company explains, “We chose to control our supply chain entirely to ensure we could deliver very high quality products and service“62. For instance, while SolarNow products are sold in 24 months contract, the company offers 5-year after-sales service through branches settled all over Uganda.
• Reminders and incentives to increase payment rates: many companies are now sending reminders to avoid that customers simply ‘forget’ to top-up their account (e.g. SMS before credit expiration), but also offering early repayment discounts that encourage customers to pay in bulk when they have cash at hand (e.g. if you pay in advance you get a discount)
• Tighter monitoring of late payers, by putting together dedicated teams (escalation from call centers to field interventions), by offering incentives to sales agents on portfolio quality, or by encouraging self-monitoring of customers with voluntary returns, where they can decide to bring back their SHS in good conditions in exchange for a partial or total refund (e.g. implemented by M-KOPA and Fenix). A majority of defaulters can be identified early (multiple practitioners mentioned the first 60-90 days).
• Measures against hacking – while little hacking cases have been observed, fraud can be catastrophic in a trust-based business – by reinforcing hardware against tampering (e.g. anti-tamper screws), but also by tacking strong measures against customers (or staff) who fraud. As M-KOPA mentioned “fraud attempts are rare and we have taken strong measures against those“
“The most important contribution of Microcred to Baobab+ is the conviction, based on years of MFI experience across the world, that there can be no sustainable growth without a relentless focus on keeping default rates very low. This focus on ‘quality’ vs. ‘quantity’ permeates our whole organization“
Alexandre Coster, Managing Director, Baobab+
62 Most companies have significantly improved the quality of their products in 3-4 iterations. There could be an outstanding risk with batteries, which are the weak component in SHS (4-6 year expected lifetime only) and may create strong need for customer attention when a lot of these start failing 2-3 years from now
“Remote shut-off is definitely not enough to avoid customer default. Companies also need to do credit scoring and require down payments to ensure customers have the ability and willingness to pay“
Xavier Helgesen, CEO and co-founder, Off-Grid Electric
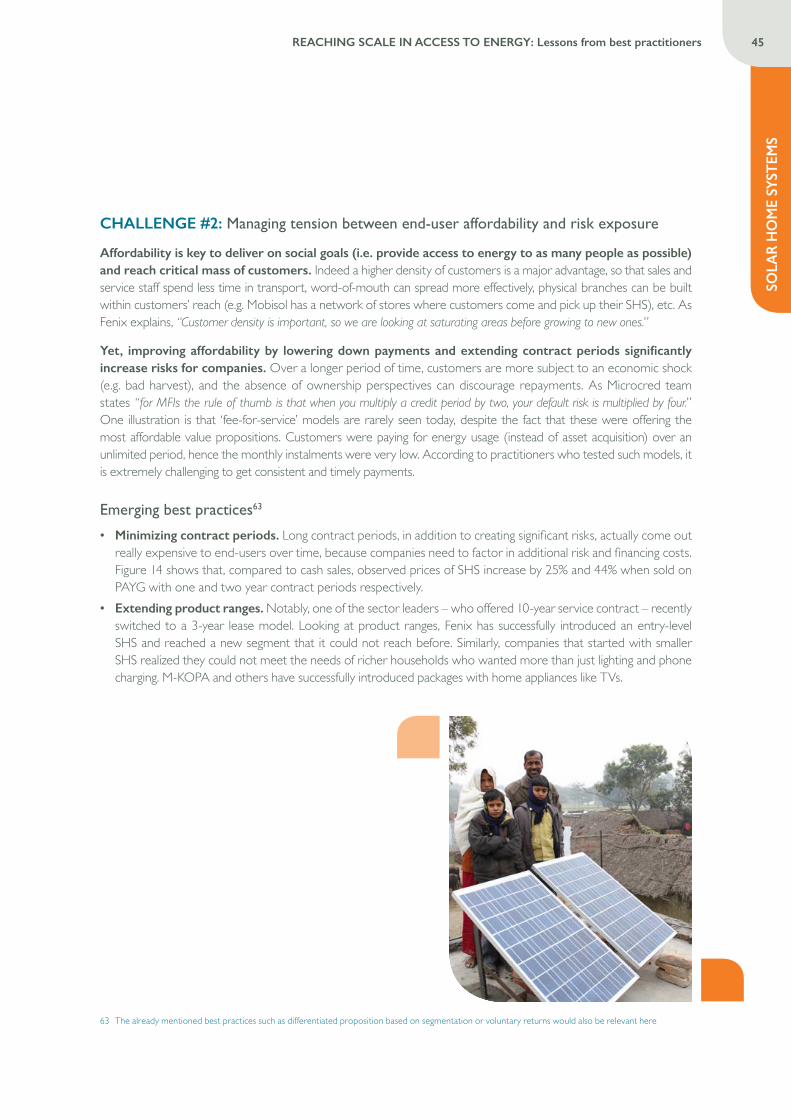
SOLA
R H
OM
E SY
STEM
S
45REACHING SCALE IN ACCESS TO ENERGY: Lessons from best practitioners
CHALLENGE #2: Managing tension between end-user affordability and risk exposure
Affordability is key to deliver on social goals (i.e. provide access to energy to as many people as possible) and reach critical mass of customers. Indeed a higher density of customers is a major advantage, so that sales and service staff spend less time in transport, word-of-mouth can spread more effectively, physical branches can be built within customers’ reach (e.g. Mobisol has a network of stores where customers come and pick up their SHS), etc. As Fenix explains, “Customer density is important, so we are looking at saturating areas before growing to new ones.”
Yet, improving affordability by lowering down payments and extending contract periods significantly increase risks for companies. Over a longer period of time, customers are more subject to an economic shock (e.g. bad harvest), and the absence of ownership perspectives can discourage repayments. As Microcred team states “for MFIs the rule of thumb is that when you multiply a credit period by two, your default risk is multiplied by four.” One illustration is that ‘fee-for-service’ models are rarely seen today, despite the fact that these were offering the most affordable value propositions. Customers were paying for energy usage (instead of asset acquisition) over an unlimited period, hence the monthly instalments were very low. According to practitioners who tested such models, it is extremely challenging to get consistent and timely payments.
Emerging best practices63
• Minimizing contract periods. Long contract periods, in addition to creating significant risks, actually come out really expensive to end-users over time, because companies need to factor in additional risk and financing costs. Figure 14 shows that, compared to cash sales, observed prices of SHS increase by 25% and 44% when sold on PAYG with one and two year contract periods respectively.
• Extending product ranges. Notably, one of the sector leaders – who offered 10-year service contract – recently switched to a 3-year lease model. Looking at product ranges, Fenix has successfully introduced an entry-level SHS and reached a new segment that it could not reach before. Similarly, companies that started with smaller SHS realized they could not meet the needs of richer households who wanted more than just lighting and phone charging. M-KOPA and others have successfully introduced packages with home appliances like TVs.
63 The already mentioned best practices such as differentiated proposition based on segmentation or voluntary returns would also be relevant here
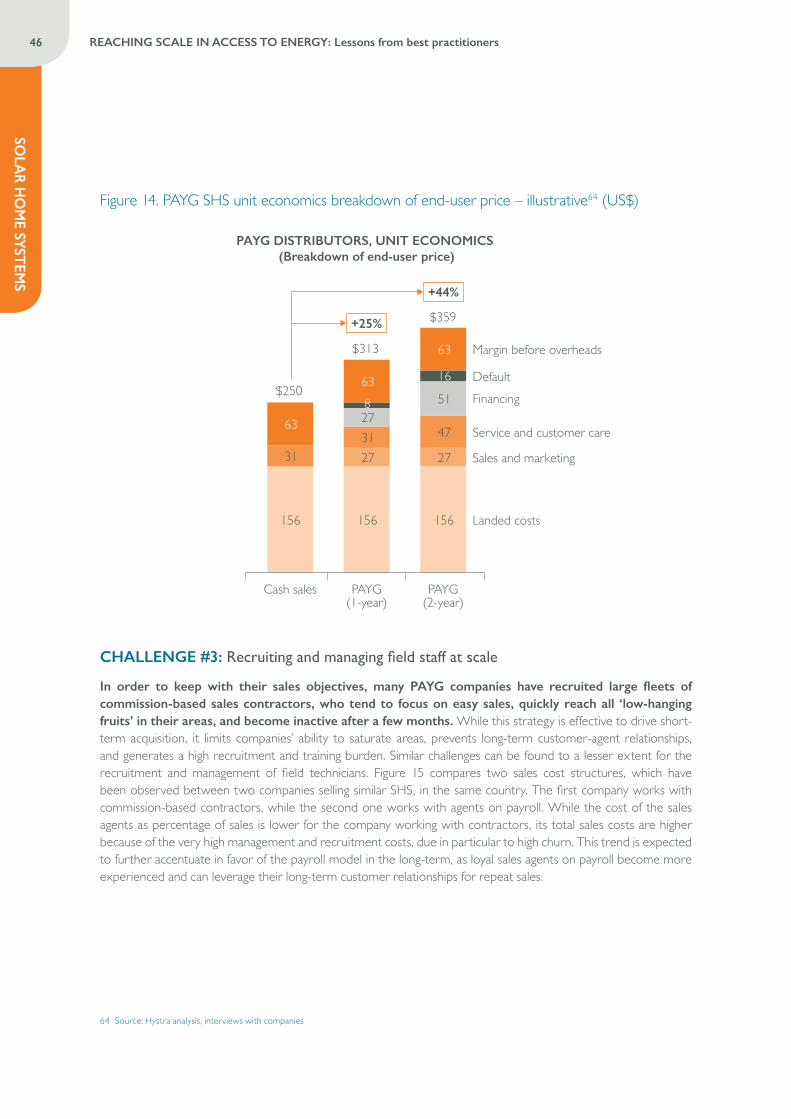
46 REACHING SCALE IN ACCESS TO ENERGY: Lessons from best practitioners
SOLA
R HO
ME SYST
EMS
Figure 14. PAYG SHS unit economics breakdown of end-user price – illustrative64 (US$)
PAYG DISTRIBUTORS, UNIT ECONOMICS (Breakdown of end-user price)
Cash sales PAYG(1-year)
PAYG(2-year)
156 156 156
31 27 27 31 47 27
51 8
16
63
63
63
$250
$313
$359 +25%
+44%
Landed costs
Sales and marketing
Financing
Service and customer care
Margin before overheads
Default
CHALLENGE #3: Recruiting and managing field staff at scale
In order to keep with their sales objectives, many PAYG companies have recruited large fleets of commission-based sales contractors, who tend to focus on easy sales, quickly reach all ‘low-hanging fruits’ in their areas, and become inactive after a few months. While this strategy is effective to drive short-term acquisition, it limits companies’ ability to saturate areas, prevents long-term customer-agent relationships, and generates a high recruitment and training burden. Similar challenges can be found to a lesser extent for the recruitment and management of field technicians. Figure 15 compares two sales cost structures, which have been observed between two companies selling similar SHS, in the same country. The first company works with commission-based contractors, while the second one works with agents on payroll. While the cost of the sales agents as percentage of sales is lower for the company working with contractors, its total sales costs are higher because of the very high management and recruitment costs, due in particular to high churn. This trend is expected to further accentuate in favor of the payroll model in the long-term, as loyal sales agents on payroll become more experienced and can leverage their long-term customer relationships for repeat sales.
64 Source: Hystra analysis, interviews with companies
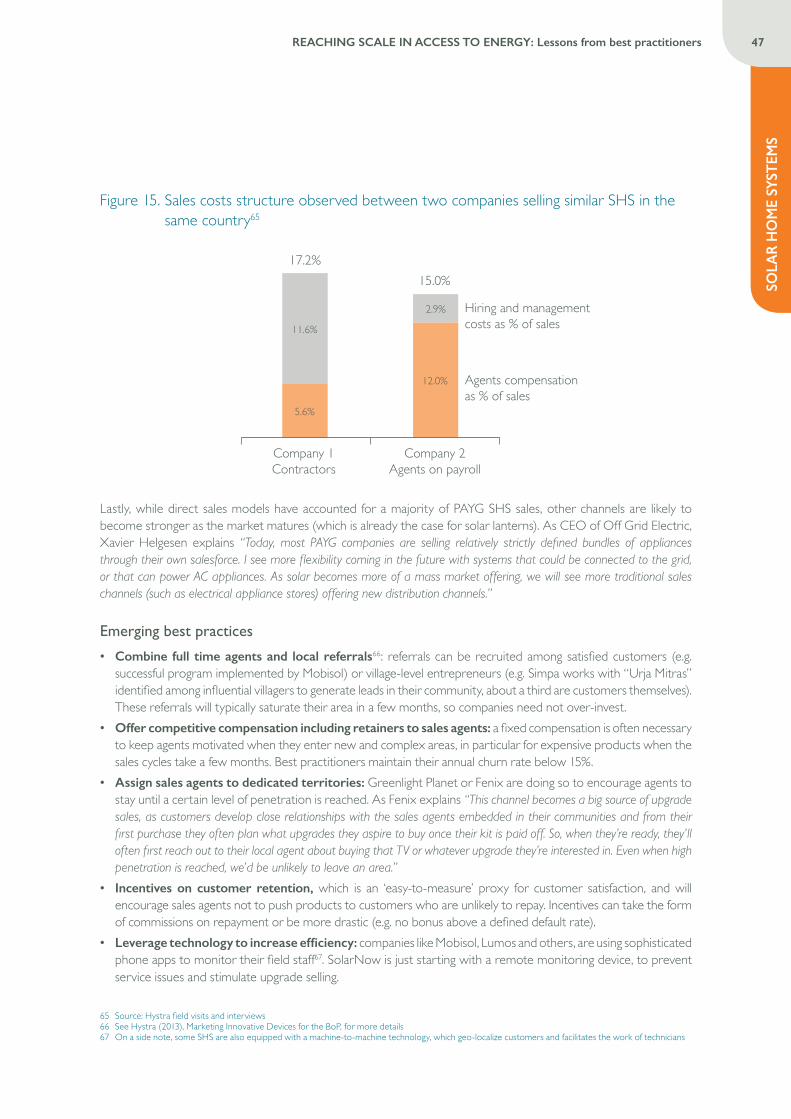
SOLA
R H
OM
E SY
STEM
S
47REACHING SCALE IN ACCESS TO ENERGY: Lessons from best practitioners
Figure 15. Sales costs structure observed between two companies selling similar SHS in the same country65
Company 2 Agents on payroll
12.0%
2.9%
15.0%
Company 1 Contractors
5.6%
11.6%
17.2%
Hiring and management costs as % of sales
Agents compensation as % of sales
Lastly, while direct sales models have accounted for a majority of PAYG SHS sales, other channels are likely to become stronger as the market matures (which is already the case for solar lanterns). As CEO of Off Grid Electric, Xavier Helgesen explains “Today, most PAYG companies are selling relatively strictly defined bundles of appliances through their own salesforce. I see more flexibility coming in the future with systems that could be connected to the grid, or that can power AC appliances. As solar becomes more of a mass market offering, we will see more traditional sales channels (such as electrical appliance stores) offering new distribution channels.”
Emerging best practices
• Combine full time agents and local referrals66: referrals can be recruited among satisfied customers (e.g. successful program implemented by Mobisol) or village-level entrepreneurs (e.g. Simpa works with “Urja Mitras” identified among influential villagers to generate leads in their community, about a third are customers themselves). These referrals will typically saturate their area in a few months, so companies need not over-invest.
• Offer competitive compensation including retainers to sales agents: a fixed compensation is often necessary to keep agents motivated when they enter new and complex areas, in particular for expensive products when the sales cycles take a few months. Best practitioners maintain their annual churn rate below 15%.
• Assign sales agents to dedicated territories: Greenlight Planet or Fenix are doing so to encourage agents to stay until a certain level of penetration is reached. As Fenix explains “This channel becomes a big source of upgrade sales, as customers develop close relationships with the sales agents embedded in their communities and from their first purchase they often plan what upgrades they aspire to buy once their kit is paid off. So, when they’re ready, they’ll often first reach out to their local agent about buying that TV or whatever upgrade they’re interested in. Even when high penetration is reached, we’d be unlikely to leave an area.”
• Incentives on customer retention, which is an ‘easy-to-measure’ proxy for customer satisfaction, and will encourage sales agents not to push products to customers who are unlikely to repay. Incentives can take the form of commissions on repayment or be more drastic (e.g. no bonus above a defined default rate).
• Leverage technology to increase efficiency: companies like Mobisol, Lumos and others, are using sophisticated phone apps to monitor their field staff67. SolarNow is just starting with a remote monitoring device, to prevent service issues and stimulate upgrade selling.
65 Source: Hystra field visits and interviews66 See Hystra (2013), Marketing Innovative Devices for the BoP, for more details67 On a side note, some SHS are also equipped with a machine-to-machine technology, which geo-localize customers and facilitates the work of technicians
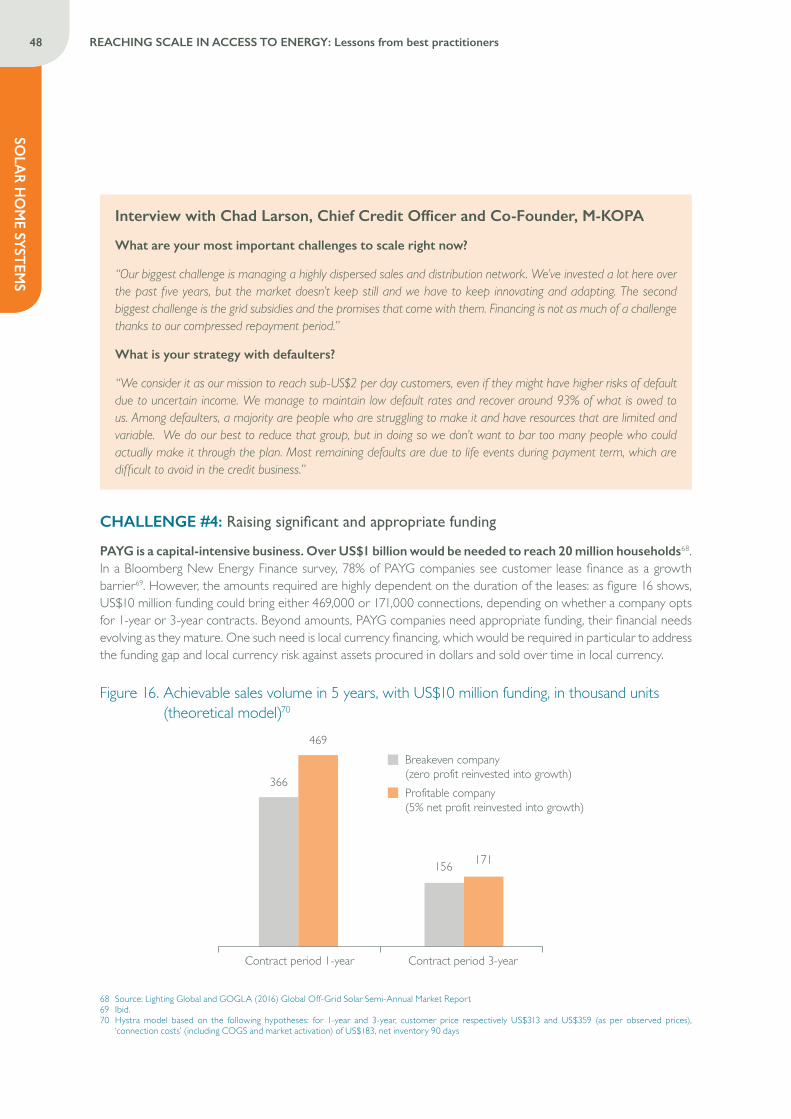
48 REACHING SCALE IN ACCESS TO ENERGY: Lessons from best practitioners
SOLA
R HO
ME SYST
EMS
Interview with Chad Larson, Chief Credit Officer and Co-Founder, M-KOPA
What are your most important challenges to scale right now?
“Our biggest challenge is managing a highly dispersed sales and distribution network. We’ve invested a lot here over the past five years, but the market doesn’t keep still and we have to keep innovating and adapting. The second biggest challenge is the grid subsidies and the promises that come with them. Financing is not as much of a challenge thanks to our compressed repayment period.”
What is your strategy with defaulters?
“We consider it as our mission to reach sub-US$2 per day customers, even if they might have higher risks of default due to uncertain income. We manage to maintain low default rates and recover around 93% of what is owed to us. Among defaulters, a majority are people who are struggling to make it and have resources that are limited and variable. We do our best to reduce that group, but in doing so we don’t want to bar too many people who could actually make it through the plan. Most remaining defaults are due to life events during payment term, which are difficult to avoid in the credit business.”
CHALLENGE #4: Raising significant and appropriate funding
PAYG is a capital-intensive business. Over US$1 billion would be needed to reach 20 million households68. In a Bloomberg New Energy Finance survey, 78% of PAYG companies see customer lease finance as a growth barrier69. However, the amounts required are highly dependent on the duration of the leases: as figure 16 shows, US$10 million funding could bring either 469,000 or 171,000 connections, depending on whether a company opts for 1-year or 3-year contracts. Beyond amounts, PAYG companies need appropriate funding, their financial needs evolving as they mature. One such need is local currency financing, which would be required in particular to address the funding gap and local currency risk against assets procured in dollars and sold over time in local currency.
Figure 16. Achievable sales volume in 5 years, with US$10 million funding, in thousand units (theoretical model)70
68 Source: Lighting Global and GOGLA (2016) Global Off-Grid Solar Semi-Annual Market Report 69 Ibid.70 Hystra model based on the following hypotheses: for 1-year and 3-year, customer price respectively US$313 and US$359 (as per observed prices),
‘connection costs’ (including COGS and market activation) of US$183, net inventory 90 days
Contract period 1-year Contract period 3-year
366
156
469
171
Breakeven company (zero profit reinvested into growth) Profitable company (5% net profit reinvested into growth)
SOLA
R H
OM
E SY
STEM
S
49REACHING SCALE IN ACCESS TO ENERGY: Lessons from best practitioners
CHALLENGE #5: Replicating in more complex geographies
The strongest growth of PAYG companies occurred in East Africa, which has relatively favorable conditions, e.g. strong penetration of mobile money, high solar awareness, and limited currency risks. In more complex markets, companies may require external support, partnerships, and innovations. The absence of mobile money is major obstacle to replication, because the costs of sending credit officers to go and collect cash at each customer’s place adds up significant costs, and because this limits companies’ ability to collect and use mobile data. Innovations emerge, e.g. in Nigeria, where mobile money has a low penetration, Lumos partnered with MTN and designed a customized payment platform which enables customers to pay in airtime. In India, SHS companies are looking forward to the fast development of mobile payments since the government engaged its “demonetization” effort. Beyond mobile money, PAYG companies are also wary of high VAT and import duties (or un-enforced exemptions), and more generally speaking, of unstable environments (e.g. unpredictable grid deployment, price volatility of kerosene, currency fluctuations, etc.).
Interview with Yuri Tsitrinbaum, CEO Nigeria, Lumos
How is the economic downturn in Nigeria affecting your business?
“The downturn has lowered disposable incomes, hence shifting our market potential to higher income households. It is difficult to know the exact income-level of customers, which would vary across regions and cultural habits. Yet, most of our customers have stable incomes of at least 60-70,000 NRN* per month. We are thinking of launching smaller systems with the vision of increasing affordability, but not before 2018.”
How is the competitive landscape evolving in Nigeria?
“Our main competition today comes from local solutions: petrol generators (prices have increased recently, but they allow irregular use) and government grid (subsidized but offering very poor service). Other PAYG companies may be coming but our country experience and exclusive partnership with MTN will provide long-term competitive advantage.”
* US$200-230 as of early 2017
“Our initial funding gave us sufficient time to adjust and refine our model before rolling out. This was helpful, because it allowed us to make the unavoidable mistakes during our pilot in Tanzania and Kenya, and gave us time to get an excellent product ready for commercialization. Had we been pushed to sell earlier, the product would have been less well thought through, which would have been harmful and would have made growing a good reputation with customers more difficult. In later stages of growth, donors should concentrate on helping solve the real barriers to growth, i.e. provide credit guarantees that work, first loss pieces to mobilize more debt and local currency loans.”
Thomas Duveau, Head of Business Development, Mobisol
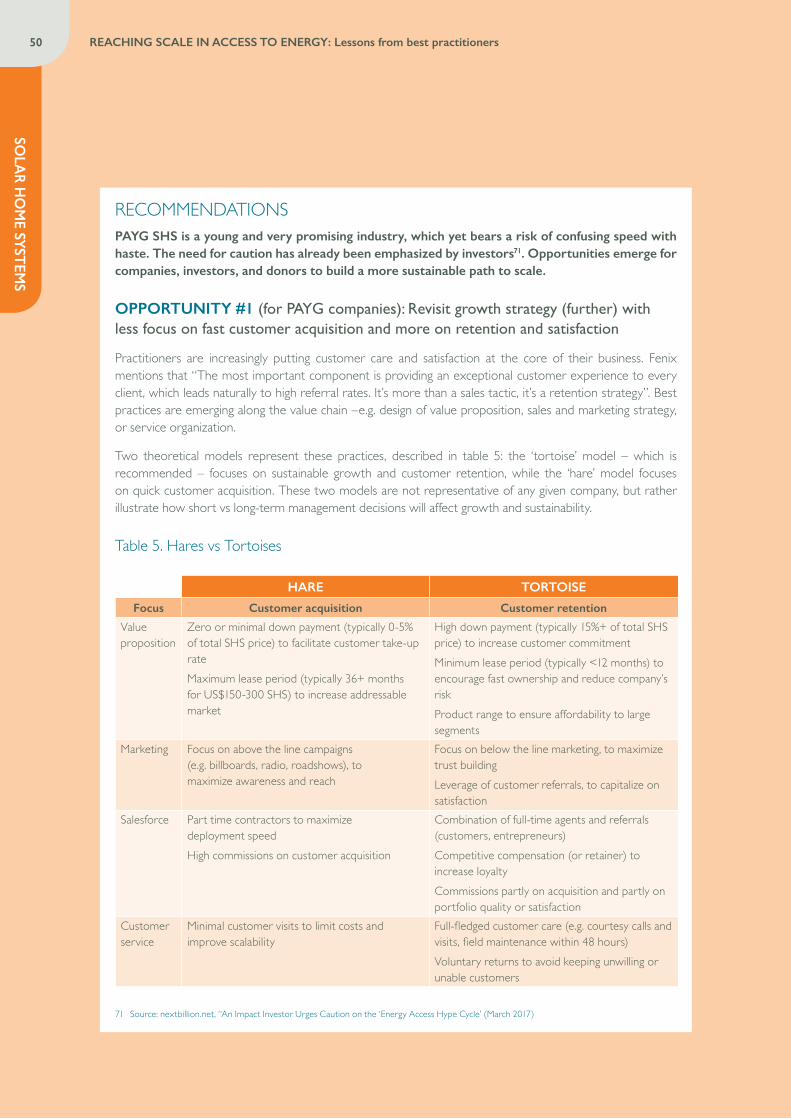
50 REACHING SCALE IN ACCESS TO ENERGY: Lessons from best practitioners
SOLA
R HO
ME SYST
EMS
RECOMMENDATIONSPAYG SHS is a young and very promising industry, which yet bears a risk of confusing speed with haste. The need for caution has already been emphasized by investors71. Opportunities emerge for companies, investors, and donors to build a more sustainable path to scale.
OPPORTUNITY #1 (for PAYG companies): Revisit growth strategy (further) with less focus on fast customer acquisition and more on retention and satisfaction
Practitioners are increasingly putting customer care and satisfaction at the core of their business. Fenix mentions that “The most important component is providing an exceptional customer experience to every client, which leads naturally to high referral rates. It’s more than a sales tactic, it’s a retention strategy”. Best practices are emerging along the value chain –e.g. design of value proposition, sales and marketing strategy, or service organization.
Two theoretical models represent these practices, described in table 5: the ‘tortoise’ model – which is recommended – focuses on sustainable growth and customer retention, while the ‘hare’ model focuses on quick customer acquisition. These two models are not representative of any given company, but rather illustrate how short vs long-term management decisions will affect growth and sustainability.
Table 5. Hares vs Tortoises
HARE TORTOISE
Focus Customer acquisition Customer retention
Value proposition
Zero or minimal down payment (typically 0-5% of total SHS price) to facilitate customer take-up rateMaximum lease period (typically 36+ months for US$150-300 SHS) to increase addressable market
High down payment (typically 15%+ of total SHS price) to increase customer commitmentMinimum lease period (typically <12 months) to encourage fast ownership and reduce company’s riskProduct range to ensure affordability to large segments
Marketing Focus on above the line campaigns (e.g. billboards, radio, roadshows), to maximize awareness and reach
Focus on below the line marketing, to maximize trust buildingLeverage of customer referrals, to capitalize on satisfaction
Salesforce Part time contractors to maximize deployment speedHigh commissions on customer acquisition
Combination of full-time agents and referrals (customers, entrepreneurs)Competitive compensation (or retainer) to increase loyaltyCommissions partly on acquisition and partly on portfolio quality or satisfaction
Customer service
Minimal customer visits to limit costs and improve scalability
Full-fledged customer care (e.g. courtesy calls and visits, field maintenance within 48 hours)Voluntary returns to avoid keeping unwilling or unable customers
71 Source: nextbillion.net, “An Impact Investor Urges Caution on the ‘Energy Access Hype Cycle’ (March 2017)
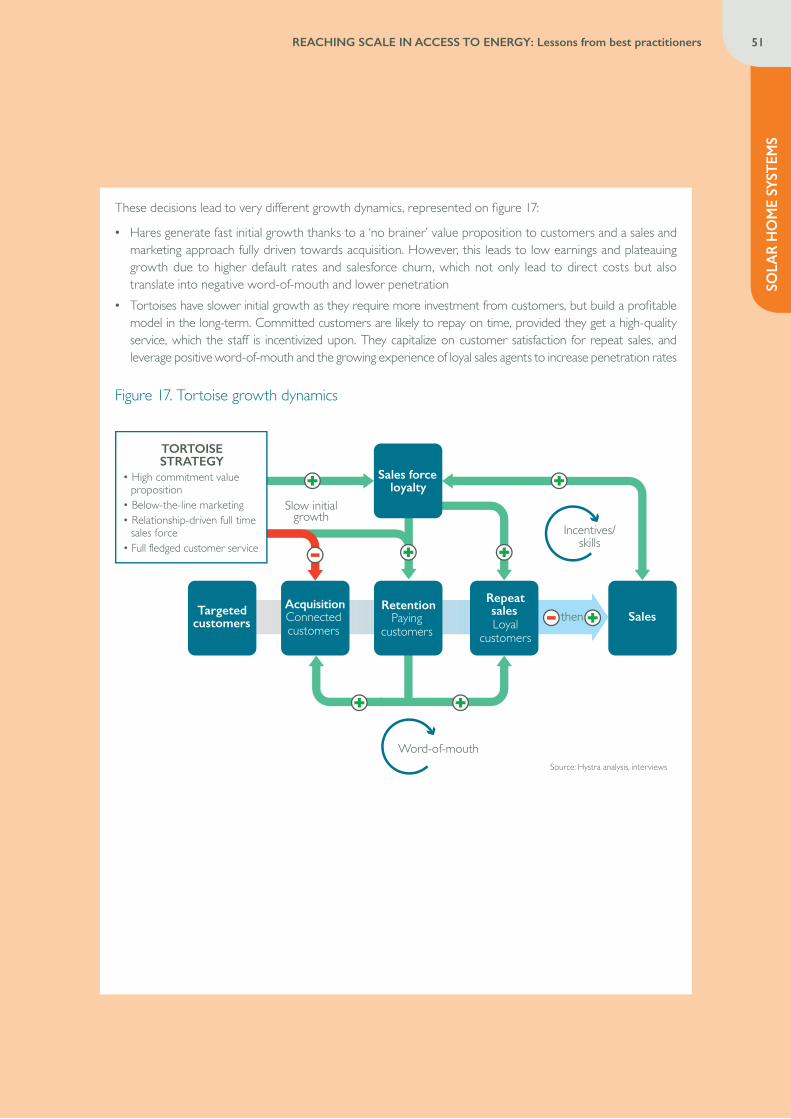
SOLA
R H
OM
E SY
STEM
S
51REACHING SCALE IN ACCESS TO ENERGY: Lessons from best practitioners
These decisions lead to very different growth dynamics, represented on figure 17:
• Hares generate fast initial growth thanks to a ‘no brainer’ value proposition to customers and a sales and marketing approach fully driven towards acquisition. However, this leads to low earnings and plateauing growth due to higher default rates and salesforce churn, which not only lead to direct costs but also translate into negative word-of-mouth and lower penetration
• Tortoises have slower initial growth as they require more investment from customers, but build a profitable model in the long-term. Committed customers are likely to repay on time, provided they get a high-quality service, which the staff is incentivized upon. They capitalize on customer satisfaction for repeat sales, and leverage positive word-of-mouth and the growing experience of loyal sales agents to increase penetration rates
Figure 17. Tortoise growth dynamics
Sales Targeted customers
Sales force loyalty
AcquisitionConnected customers
RetentionPaying
customers
Repeat salesLoyal
customers
Word-of-mouth
Slow initialgrowth
Source: Hystra analysis, interviews
then
Incentives/ skills
TORTOISE STRATEGY
• High commitment value proposition
• Below-the-line marketing• Relationship-driven full time
sales force• Full fledged customer service
52 REACHING SCALE IN ACCESS TO ENERGY: Lessons from best practitioners
SOLA
R HO
ME SYST
EMS
OPPORTUNITY #2 (for investors and donors): Foster further commercial discipline and low-risk approaches (versus rush for scale) in the definition of milestones and KPIs
Investors and donors can promote more sustainable commercial approaches, by setting milestones and KPIs that are focused on sales and selection practices, customer satisfaction and retention, and default management – instead of number of connections. They could also earmark their funding to encourage business model innovations, instead of asset purchase. As one company mentioned, “More concessional or incentive-based financing would be needed: a large majority of our funding goes to financing assets, but we still want to improve on our segmentation, value proposition, R&D, etc. and this learning curve cannot be put only on our equity investors.”
The World Bank and GOGLA have launched a very promising initiative – which could serve as a basis for donors and investors willing to set up benchmarks – to develop harmonized performance metrics for PAYG solar companies, and help them improve their customer targeting and risk assessment.
Less focus on quick acquisition is not contradictory with long-term growth. Ensuring high satisfaction of early adopters is actually the key to exponential growth. Grameen Shakti, which is still the largest distributor of SHS globally, has had a relatively stable year-on-year growth between 40% and 80% in its first 12 years. While growth was relatively slow initially – the company had only sold 80,000 units after nine years – it reached the 500,000 cap three years later.
OPPORTUNITY #3 (for investors): Continue supporting and testing innovations that can unlock debt and local currency loans
Investors, together with donors and PAYG companies, have been testing a number of innovations (well-documented by Persistent Energy Capital or Bloomberg New Energy Finance for instance72) that could unlock large debt at scale, mitigate currency risks, or encourage local bank financing. These range from the creation of funding vehicles (e.g. securitization of receivables, back-to-back financing), lobbying for regulation (e.g. increased convertibility), or leverage of loan guarantees.
72 See in particular: Persistent Energy Capital (2016), Securitization: Unnecessary Complexit or Key to Financing the DESCO Sector? and Bloomberg New Energy Finance (2016), How can Pay-As-You Go Solar be Financed?
“This sector is seeing a massive inflow of soft equity that has led to companies buying their growth rather than earning it. What is needed instead, is hardcore commercial discipline and accountability for results, and a focus on profitability first, prior to expanding into other markets. Most importantly, senior managers need time to ‘live their model’, constantly improve it, before replicating it.”
Willem Nolens, CEO, SolarNow
SOLA
R H
OM
E SY
STEM
S
53REACHING SCALE IN ACCESS TO ENERGY: Lessons from best practitioners
Interview with Piyush Mathur, CEO of Simpa Networks
What is distinctive in the recent partnership with the Indian bank RBL?
“With RBL, Simpa is developing a third-party asset financing model that could define how energy devices are bought and financed around the world. Under the partnership, Simpa identifies the customers under pre-agreed credit norms, and RBL Bank provides financing directly to the customers for their purchase of solar systems. Simpa continues to act as the Bank’s field agent, providing service and making collections from collections to deposit with the bank. This solves a number of challenges in the sector: engages mainstream lending banks into the sector, opens sustainable domestic financing channels, includes rural people out of formal finance channels into mainstream banking, mitigates currency risk from overseas borrowing. The RBL arrangement creates more incentives for customers to repay as good payment behavior can help build their credit histories and get them follow on loans.”
How scalable is this model?
“We believe this model can scale well to account for a majority of our financed sales. This is because in this model we are not limited by transaction time tables and costs. Also, unlike a term loan, the size of the project is scalable as track record builds and confidence in the risk increases. Once this happens, this relationship can provide a template that other practitioners can replicate with other banks around the world. Once the risk is well understood, adaptations of this model are also possible e.g. securitization, which has increased capital efficiency for the MFI sector.”
What role do you see for donors in building these innovative financing models?
“Donors can help bridge the gap between the expectations of commercial banks and what companies like us can actually provide. For instance, RBL was requiring a high down payment, (not including the first month of payment, also charged upfront). This would have been prohibitive for most of our customers, and USAID DIV helped us bridge the gap in initial phases. For securitization – provided donors consider the sector as mature enough (which I know is not the case for some DFIs) – there will be a role to play for donors in providing guarantees on portfolios, or financing the riskiest assets.”
OPPORTUNITY #4 (for donors and governments): Address ecosystem challenges and barriers to entry in complex markets
In the same way as for solar lanterns, donors can play a lobbying role to improve regulation. For instance, Lumos explains, “Advocacy with the government would be helpful, and there are two bottlenecks which affect the sector (not only Lumos) in Nigeria: lack of priority on certificates of capital importation, and import duties that are officially exempted on solar products but in reality, comes at a high cost.” For complex markets, they could also help for instance with temporary result-based financing (RBF) in the most challenging areas. Under the global Energizing Development (EnDev) program, SNV (the Netherlands Development Organization) has launched a RBF program in the previously unserved Lake zone area of Tanzania. It provides support based on net portfolio growth (to reward high portfolio quality), decreased subsidies year-on-year (to ensure companies were not building them into retail prices), and professional management support from Tanzania Investment Bank. While evaluation is still ongoing, this has been referred by practitioners as the type of ‘best-in-class’ programs that donors could replicate to open complex areas.
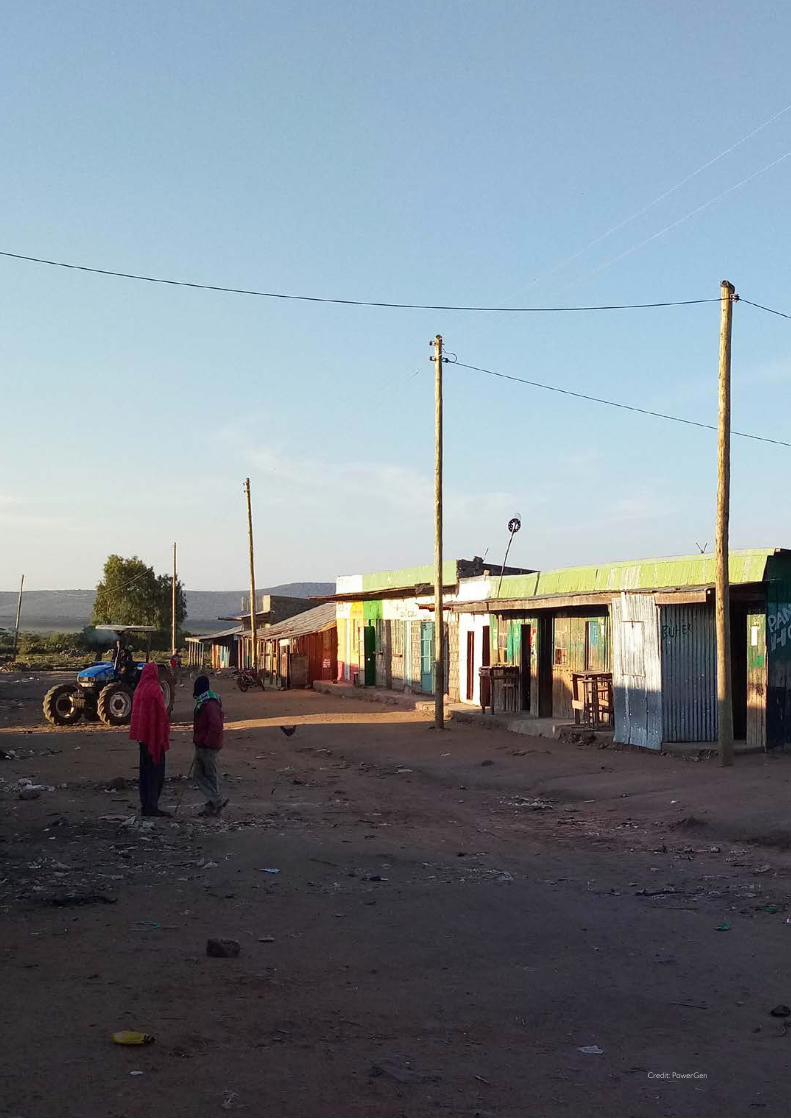
Credit: PowerGen
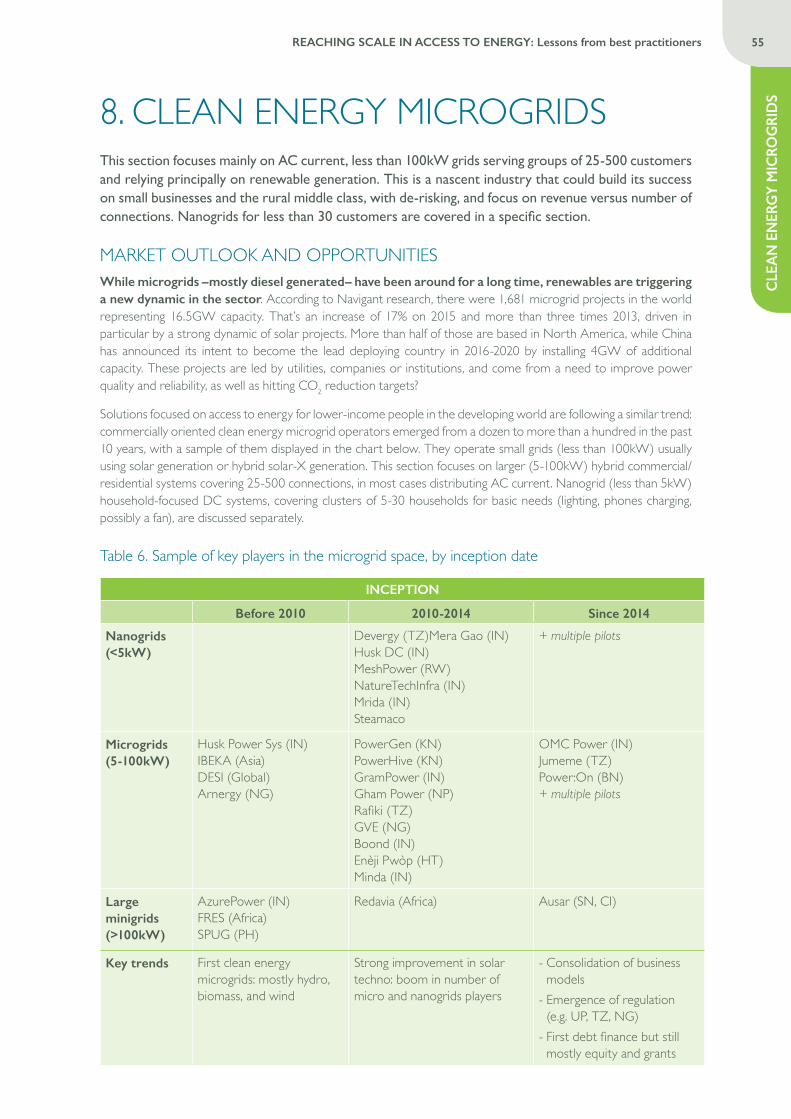
CLE
AN
EN
ERG
Y M
ICRO
GRI
DS
55REACHING SCALE IN ACCESS TO ENERGY: Lessons from best practitioners
8. CLEAN ENERGY MICROGRIDSThis section focuses mainly on AC current, less than 100kW grids serving groups of 25-500 customers and relying principally on renewable generation. This is a nascent industry that could build its success on small businesses and the rural middle class, with de-risking, and focus on revenue versus number of connections. Nanogrids for less than 30 customers are covered in a specific section.
MARKET OUTLOOK AND OPPORTUNITIESWhile microgrids –mostly diesel generated– have been around for a long time, renewables are triggering a new dynamic in the sector. According to Navigant research, there were 1,681 microgrid projects in the world representing 16.5GW capacity. That’s an increase of 17% on 2015 and more than three times 2013, driven in particular by a strong dynamic of solar projects. More than half of those are based in North America, while China has announced its intent to become the lead deploying country in 2016-2020 by installing 4GW of additional capacity. These projects are led by utilities, companies or institutions, and come from a need to improve power quality and reliability, as well as hitting CO2 reduction targets?
Solutions focused on access to energy for lower-income people in the developing world are following a similar trend: commercially oriented clean energy microgrid operators emerged from a dozen to more than a hundred in the past 10 years, with a sample of them displayed in the chart below. They operate small grids (less than 100kW) usually using solar generation or hybrid solar-X generation. This section focuses on larger (5-100kW) hybrid commercial/residential systems covering 25-500 connections, in most cases distributing AC current. Nanogrid (less than 5kW) household-focused DC systems, covering clusters of 5-30 households for basic needs (lighting, phones charging, possibly a fan), are discussed separately.
Table 6. Sample of key players in the microgrid space, by inception date
INCEPTION
Before 2010 2010-2014 Since 2014
Nanogrids (<5kW)
Devergy (TZ)Mera Gao (IN)Husk DC (IN)MeshPower (RW)NatureTechInfra (IN)Mrida (IN)Steamaco
+ multiple pilots
Microgrids (5-100kW)
Husk Power Sys (IN)IBEKA (Asia)DESI (Global)Arnergy (NG)
PowerGen (KN)PowerHive (KN)GramPower (IN)Gham Power (NP)Rafiki (TZ)GVE (NG)Boond (IN)Enèji Pwòp (HT)Minda (IN)
OMC Power (IN)Jumeme (TZ)Power:On (BN)+ multiple pilots
Large minigrids (>100kW)
AzurePower (IN)FRES (Africa)SPUG (PH)
Redavia (Africa) Ausar (SN, CI)
Key trends First clean energy microgrids: mostly hydro, biomass, and wind
Strong improvement in solar techno: boom in number of micro and nanogrids players
- Consolidation of business models - Emergence of regulation (e.g. UP, TZ, NG) - First debt finance but still mostly equity and grants
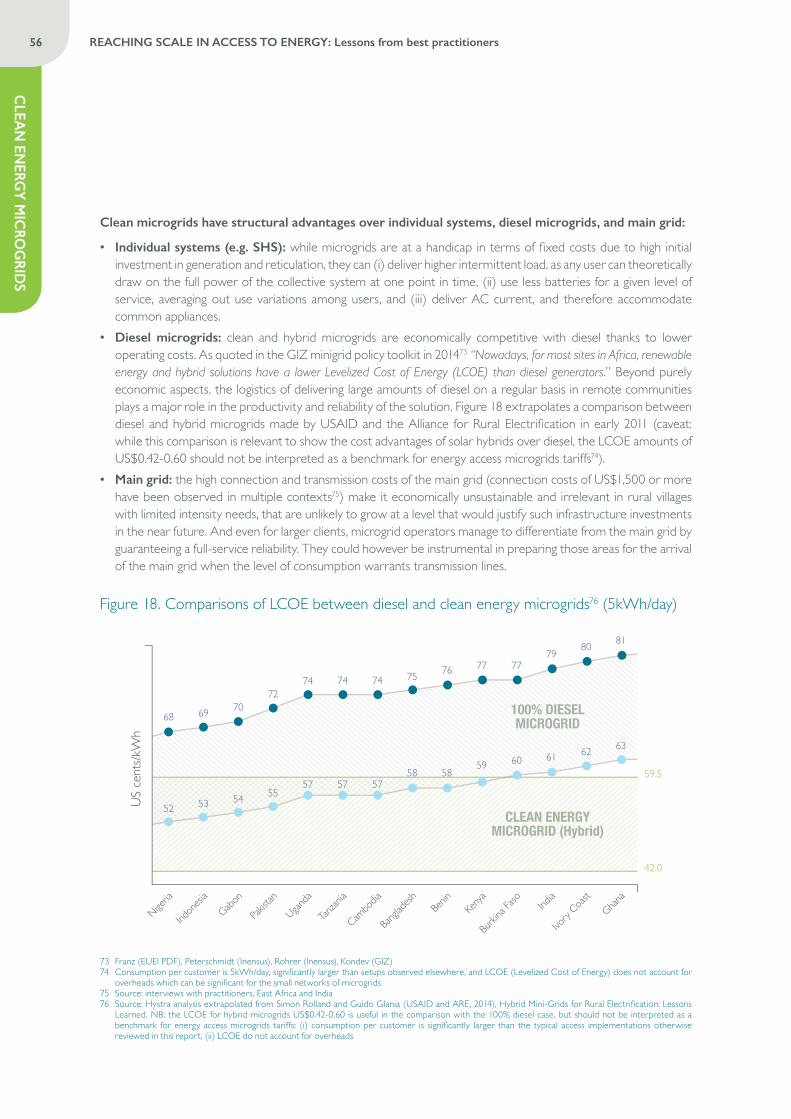
56 REACHING SCALE IN ACCESS TO ENERGY: Lessons from best practitioners
CLEA
N EN
ERGY M
ICRO
GRID
S
Clean microgrids have structural advantages over individual systems, diesel microgrids, and main grid:
• Individual systems (e.g. SHS): while microgrids are at a handicap in terms of fixed costs due to high initial investment in generation and reticulation, they can (i) deliver higher intermittent load, as any user can theoretically draw on the full power of the collective system at one point in time, (ii) use less batteries for a given level of service, averaging out use variations among users, and (iii) deliver AC current, and therefore accommodate common appliances.
• Diesel microgrids: clean and hybrid microgrids are economically competitive with diesel thanks to lower operating costs. As quoted in the GIZ minigrid policy toolkit in 201473 “Nowadays, for most sites in Africa, renewable energy and hybrid solutions have a lower Levelized Cost of Energy (LCOE) than diesel generators.” Beyond purely economic aspects, the logistics of delivering large amounts of diesel on a regular basis in remote communities plays a major role in the productivity and reliability of the solution. Figure 18 extrapolates a comparison between diesel and hybrid microgrids made by USAID and the Alliance for Rural Electrification in early 2011 (caveat: while this comparison is relevant to show the cost advantages of solar hybrids over diesel, the LCOE amounts of US$0.42-0.60 should not be interpreted as a benchmark for energy access microgrids tariffs74).
• Main grid: the high connection and transmission costs of the main grid (connection costs of US$1,500 or more have been observed in multiple contexts75) make it economically unsustainable and irrelevant in rural villages with limited intensity needs, that are unlikely to grow at a level that would justify such infrastructure investments in the near future. And even for larger clients, microgrid operators manage to differentiate from the main grid by guaranteeing a full-service reliability. They could however be instrumental in preparing those areas for the arrival of the main grid when the level of consumption warrants transmission lines.
Figure 18. Comparisons of LCOE between diesel and clean energy microgrids76 (5kWh/day)
US ce
nts/k
Wh
Nigeria
Indon
esia
Gabon
Pakista
n
Uganda
Tanzan
ia
Cambo
dia
Bangla
desh
Benin
Kenya
Burkin
a Faso Ind
ia
Ivory
Coast
Ghana
52 53 54 55 57 57 57
58 58 59 60 61 62 63
68 69 70 72
74 74 74 75 76 77 77 79
80 81
42.0
59.5
CLEAN ENERGYMICROGRID (Hybrid)
100% DIESELMICROGRID
100% diesel microgrid
73 Franz (EUEI PDF), Peterschmidt (Inensus), Rohrer (Inensus), Kondev (GIZ)74 Consumption per customer is 5kWh/day, significantly larger than setups observed elsewhere, and LCOE (Levelized Cost of Energy) does not account for
overheads which can be significant for the small networks of microgrids75 Source: interviews with practitioners, East Africa and India76 Source: Hystra analysis extrapolated from Simon Rolland and Guido Glania (USAID and ARE, 2014), Hybrid Mini-Grids for Rural Electrification: Lessons
Learned. NB: the LCOE for hybrid microgrids US$0.42-0.60 is useful in the comparison with the 100% diesel case, but should not be interpreted as a benchmark for energy access microgrids tariffs: (i) consumption per customer is significantly larger than the typical access implementations otherwise reviewed in this report, (ii) LCOE do not account for overheads
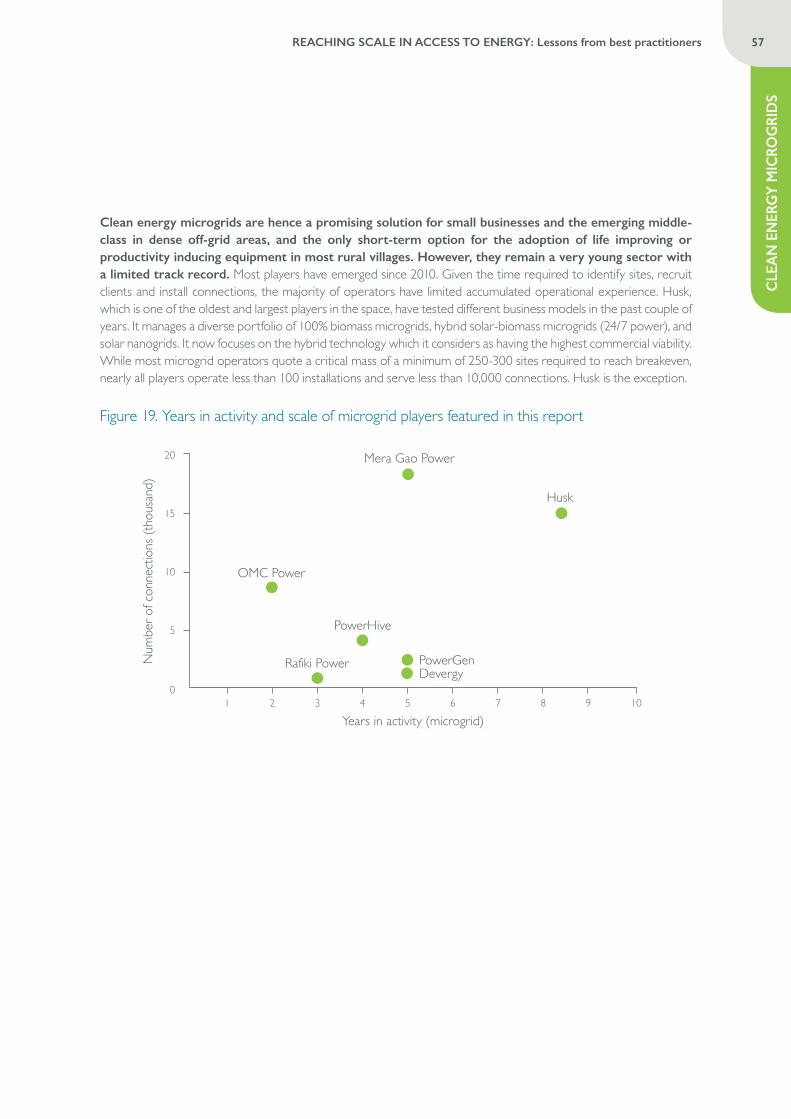
CLE
AN
EN
ERG
Y M
ICRO
GRI
DS
57REACHING SCALE IN ACCESS TO ENERGY: Lessons from best practitioners
Clean energy microgrids are hence a promising solution for small businesses and the emerging middle-class in dense off-grid areas, and the only short-term option for the adoption of life improving or productivity inducing equipment in most rural villages. However, they remain a very young sector with a limited track record. Most players have emerged since 2010. Given the time required to identify sites, recruit clients and install connections, the majority of operators have limited accumulated operational experience. Husk, which is one of the oldest and largest players in the space, have tested different business models in the past couple of years. It manages a diverse portfolio of 100% biomass microgrids, hybrid solar-biomass microgrids (24/7 power), and solar nanogrids. It now focuses on the hybrid technology which it considers as having the highest commercial viability. While most microgrid operators quote a critical mass of a minimum of 250-300 sites required to reach breakeven, nearly all players operate less than 100 installations and serve less than 10,000 connections. Husk is the exception.
Figure 19. Years in activity and scale of microgrid players featured in this report
PowerHive
PowerGen
Husk
Devergy
OMC Power
Rafiki Power
Mera Gao Power
Years in activity (microgrid)
0
5
10
15
20
Num
ber o
f con
nect
ions
(tho
usan
d)
2 1 4 6 8 10 3 5 7 9
58 REACHING SCALE IN ACCESS TO ENERGY: Lessons from best practitioners
CLEA
N EN
ERGY M
ICRO
GRID
S
BUSINESS MODELS AND CHALLENGESMicrogrids have developed into many business models, which are often tailored per site. Tariff structures, price levels and service are determined by the actual consumption of the whole subscriber group. Figure 20 describes the many models that come under the umbrella of microgrids:
• Site selection
- Anchor client models rely on a (relatively) energy intensive customer (e.g. a telecom tower operator) that will provide the bulk of revenues for a guaranteed period of time in exchange for favorable (and therefore not very profitable) conditions, and additional customers will pay a relatively higher price given the marginal cost they trigger. While this model has strong advantages in risk reduction, it requires the presence of a high load business (e.g. telecom tower) near the targeted village, which can significantly reduce the addressable market (depending on geographies). According to one company that investigated 400 sites in Tanzania, “anchors exist in less than 5% of cases”.
- Generalist models will be more focused on averaging out costs.
• Market activation
- Focus on number of connections, i.e. on building a large base of (on average) low consumption clients, will increase operations and management costs (O&M) but limits variability in revenue and investment per user.
- Focus on bankable clients is the opposite: high average revenue per user (ARPU), high average investment per user (AIPU), lower O&M but few clients per site.
• Network building (reticulation)
- The choice in generation technology, beyond its influence on payback (e.g. solar is a long-term investment while diesel or biomass pay back rapidly but have high opex), drives the ability to provide 24/7 power (e.g. OMC uses diesel generators to guarantee 99% service) and to upgrade easily as demand increases.
- Beyond the choice in technology, the dimensioning of the sites is critical with an arbitrage between building less sites with over capacity to allow for market activation and demand growth, or more sites with tighter dimensioning.
• Tariff options
- Currently, many operators have a very tactical view of pricing, setting different tariffs for each site. The challenge is in mixing different ingredients while preserving the consumers understanding of what he or she is paying for, and projecting tariff evolution over time to encourage maximum ramp up of consumption while insuring early payback.
- Flat rates subscriptions encourage consumption, load bands follow the level of equipment - Consumption-based prepaid models encourage responsible energy management and, due to their similarity with telecom practices, are easily understood by subscribers.
- Postpaid models are often difficult to master by customers.
• Operations and management:
- Smart technologies (e.g. remote shut off, smart meters, mobile money) have made operations more efficient but skilled field staff remains key to deliver a high-quality service.
- Efficiency gains can be significant. Microgrids in Africa, like those of PowerHive or PowerGen, have reduced staff by 2-3 full-time equivalent per plant (observed in other set ups) to 0.25 FTE per plant, by leveraging remote control technologies and mobile money.
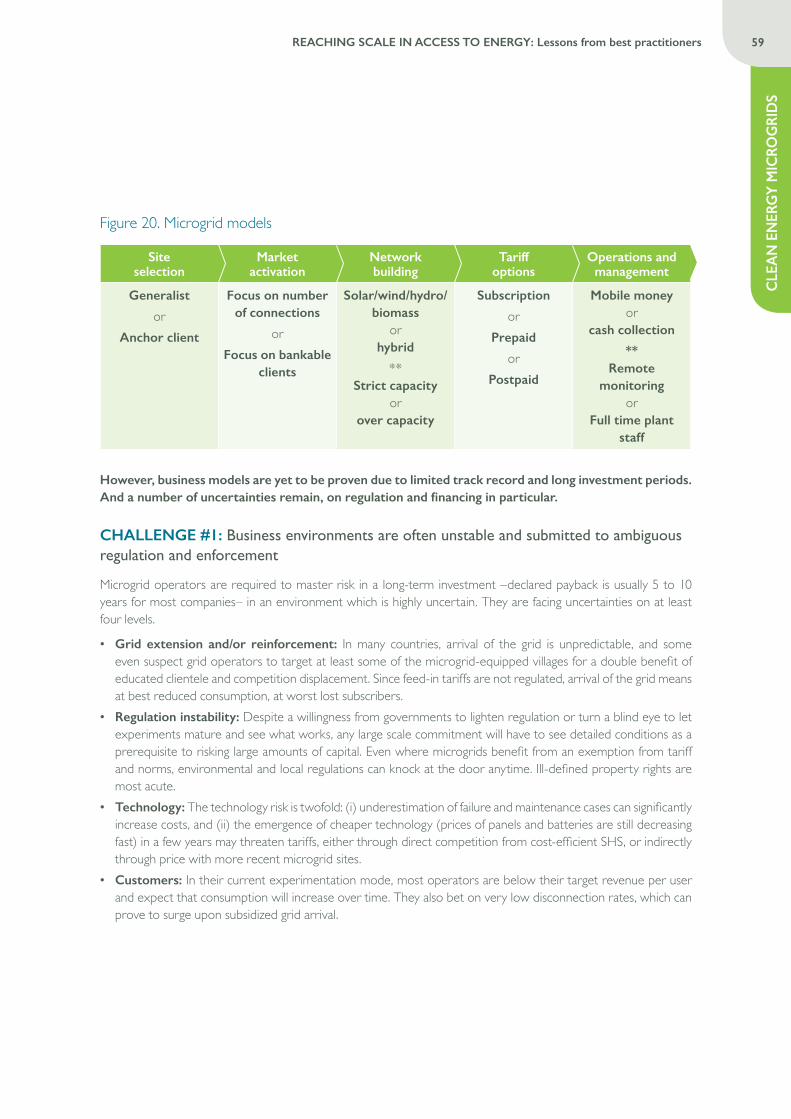
CLE
AN
EN
ERG
Y M
ICRO
GRI
DS
59REACHING SCALE IN ACCESS TO ENERGY: Lessons from best practitioners
Figure 20. Microgrid models
Site selection
Market activation
Network building
Tariff options
Operations and management
Generalist or
Anchor client
Focus on number of connections
or Focus on bankable
clients
Solar/wind/hydro/biomass
or hybrid
** Strict capacity
or over capacity
Subscription
orPrepaid
or Postpaid
Mobile money or
cash collection
** Remote
monitoring or
Full time plant staff
However, business models are yet to be proven due to limited track record and long investment periods. And a number of uncertainties remain, on regulation and financing in particular.
CHALLENGE #1: Business environments are often unstable and submitted to ambiguous regulation and enforcement
Microgrid operators are required to master risk in a long-term investment –declared payback is usually 5 to 10 years for most companies– in an environment which is highly uncertain. They are facing uncertainties on at least four levels.
• Grid extension and/or reinforcement: In many countries, arrival of the grid is unpredictable, and some even suspect grid operators to target at least some of the microgrid-equipped villages for a double benefit of educated clientele and competition displacement. Since feed-in tariffs are not regulated, arrival of the grid means at best reduced consumption, at worst lost subscribers.
• Regulation instability: Despite a willingness from governments to lighten regulation or turn a blind eye to let experiments mature and see what works, any large scale commitment will have to see detailed conditions as a prerequisite to risking large amounts of capital. Even where microgrids benefit from an exemption from tariff and norms, environmental and local regulations can knock at the door anytime. Ill-defined property rights are most acute.
• Technology: The technology risk is twofold: (i) underestimation of failure and maintenance cases can significantly increase costs, and (ii) the emergence of cheaper technology (prices of panels and batteries are still decreasing fast) in a few years may threaten tariffs, either through direct competition from cost-efficient SHS, or indirectly through price with more recent microgrid sites.
• Customers: In their current experimentation mode, most operators are below their target revenue per user and expect that consumption will increase over time. They also bet on very low disconnection rates, which can prove to surge upon subsidized grid arrival.
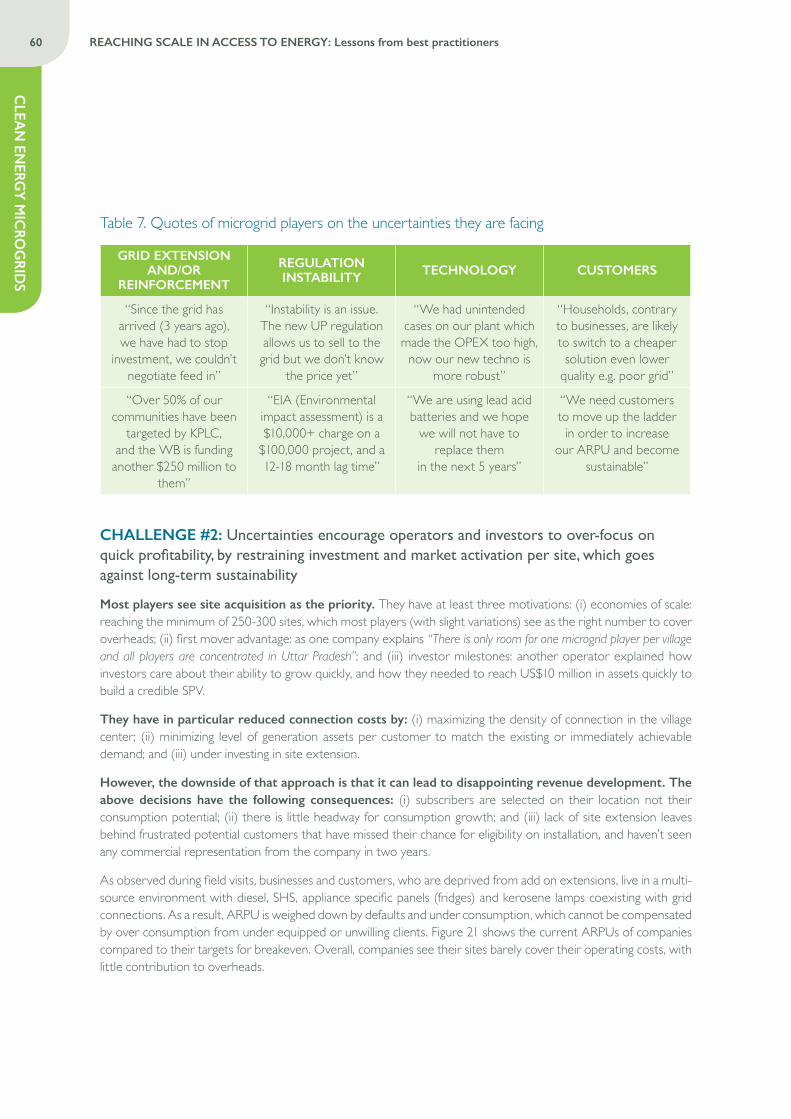
60 REACHING SCALE IN ACCESS TO ENERGY: Lessons from best practitioners
CLEA
N EN
ERGY M
ICRO
GRID
S
Table 7. Quotes of microgrid players on the uncertainties they are facing
GRID EXTENSION AND/OR
REINFORCEMENT
REGULATION INSTABILITY TECHNOLOGY CUSTOMERS
“Since the grid has arrived (3 years ago), we have had to stop
investment, we couldn’t negotiate feed in”
“Instability is an issue. The new UP regulation allows us to sell to the grid but we don’t know
the price yet”
“We had unintended cases on our plant which made the OPEX too high,
now our new techno is more robust”
“Households, contrary to businesses, are likely to switch to a cheaper solution even lower
quality e.g. poor grid”
“Over 50% of our communities have been
targeted by KPLC, and the WB is funding
another $250 million to them”
“EIA (Environmental impact assessment) is a $10,000+ charge on a
$100,000 project, and a 12-18 month lag time”
“We are using lead acid batteries and we hope
we will not have to replace them
in the next 5 years”
“We need customers to move up the ladder in order to increase
our ARPU and become sustainable”
CHALLENGE #2: Uncertainties encourage operators and investors to over-focus on quick profitability, by restraining investment and market activation per site, which goes against long-term sustainability
Most players see site acquisition as the priority. They have at least three motivations: (i) economies of scale: reaching the minimum of 250-300 sites, which most players (with slight variations) see as the right number to cover overheads; (ii) first mover advantage: as one company explains “There is only room for one microgrid player per village and all players are concentrated in Uttar Pradesh”; and (iii) investor milestones: another operator explained how investors care about their ability to grow quickly, and how they needed to reach US$10 million in assets quickly to build a credible SPV.
They have in particular reduced connection costs by: (i) maximizing the density of connection in the village center; (ii) minimizing level of generation assets per customer to match the existing or immediately achievable demand; and (iii) under investing in site extension.
However, the downside of that approach is that it can lead to disappointing revenue development. The above decisions have the following consequences: (i) subscribers are selected on their location not their consumption potential; (ii) there is little headway for consumption growth; and (iii) lack of site extension leaves behind frustrated potential customers that have missed their chance for eligibility on installation, and haven’t seen any commercial representation from the company in two years.
As observed during field visits, businesses and customers, who are deprived from add on extensions, live in a multi-source environment with diesel, SHS, appliance specific panels (fridges) and kerosene lamps coexisting with grid connections. As a result, ARPU is weighed down by defaults and under consumption, which cannot be compensated by over consumption from under equipped or unwilling clients. Figure 21 shows the current ARPUs of companies compared to their targets for breakeven. Overall, companies see their sites barely cover their operating costs, with little contribution to overheads.
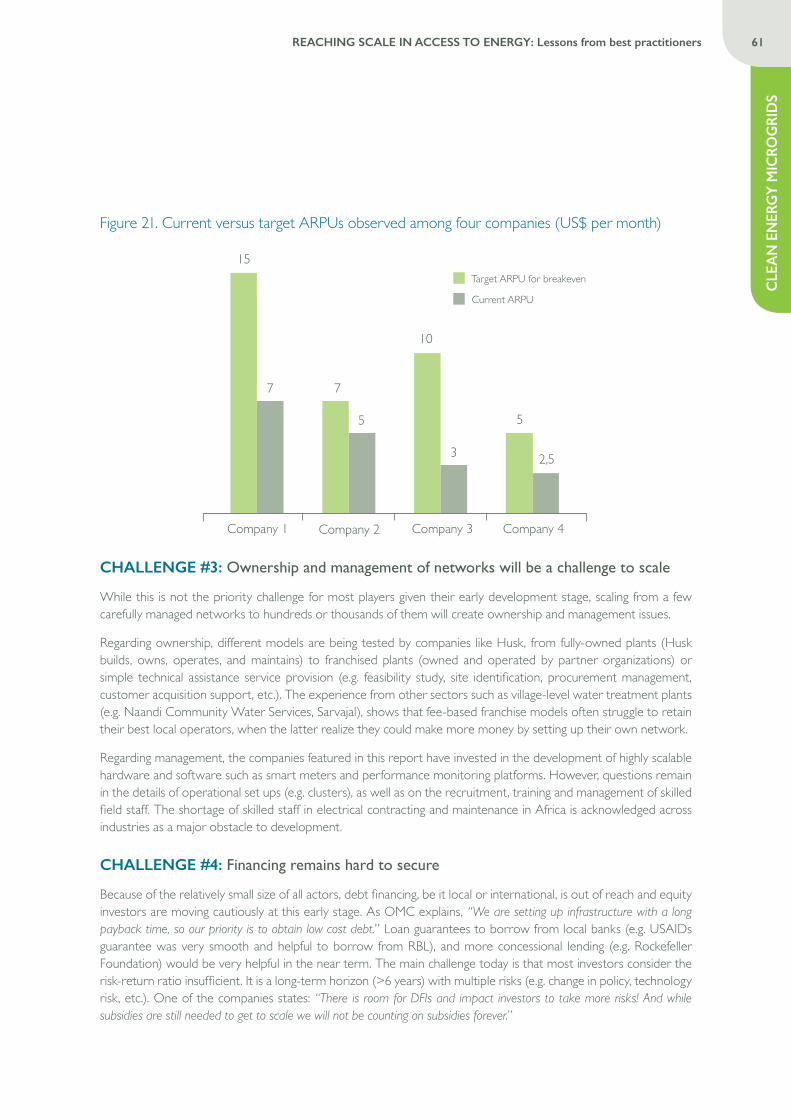
CLE
AN
EN
ERG
Y M
ICRO
GRI
DS
61REACHING SCALE IN ACCESS TO ENERGY: Lessons from best practitioners
Figure 21. Current versus target ARPUs observed among four companies (US$ per month)
Target ARPU for breakeven
Current ARPU
2,5
5
3
10
5
7 7
15
Company 1 Company 2 Company 3 Company 4
CHALLENGE #3: Ownership and management of networks will be a challenge to scale
While this is not the priority challenge for most players given their early development stage, scaling from a few carefully managed networks to hundreds or thousands of them will create ownership and management issues.
Regarding ownership, different models are being tested by companies like Husk, from fully-owned plants (Husk builds, owns, operates, and maintains) to franchised plants (owned and operated by partner organizations) or simple technical assistance service provision (e.g. feasibility study, site identification, procurement management, customer acquisition support, etc.). The experience from other sectors such as village-level water treatment plants (e.g. Naandi Community Water Services, Sarvajal), shows that fee-based franchise models often struggle to retain their best local operators, when the latter realize they could make more money by setting up their own network.
Regarding management, the companies featured in this report have invested in the development of highly scalable hardware and software such as smart meters and performance monitoring platforms. However, questions remain in the details of operational set ups (e.g. clusters), as well as on the recruitment, training and management of skilled field staff. The shortage of skilled staff in electrical contracting and maintenance in Africa is acknowledged across industries as a major obstacle to development.
CHALLENGE #4: Financing remains hard to secure
Because of the relatively small size of all actors, debt financing, be it local or international, is out of reach and equity investors are moving cautiously at this early stage. As OMC explains, “We are setting up infrastructure with a long payback time, so our priority is to obtain low cost debt.” Loan guarantees to borrow from local banks (e.g. USAIDs guarantee was very smooth and helpful to borrow from RBL), and more concessional lending (e.g. Rockefeller Foundation) would be very helpful in the near term. The main challenge today is that most investors consider the risk-return ratio insufficient. It is a long-term horizon (>6 years) with multiple risks (e.g. change in policy, technology risk, etc.). One of the companies states: “There is room for DFIs and impact investors to take more risks! And while subsidies are still needed to get to scale we will not be counting on subsidies forever.”
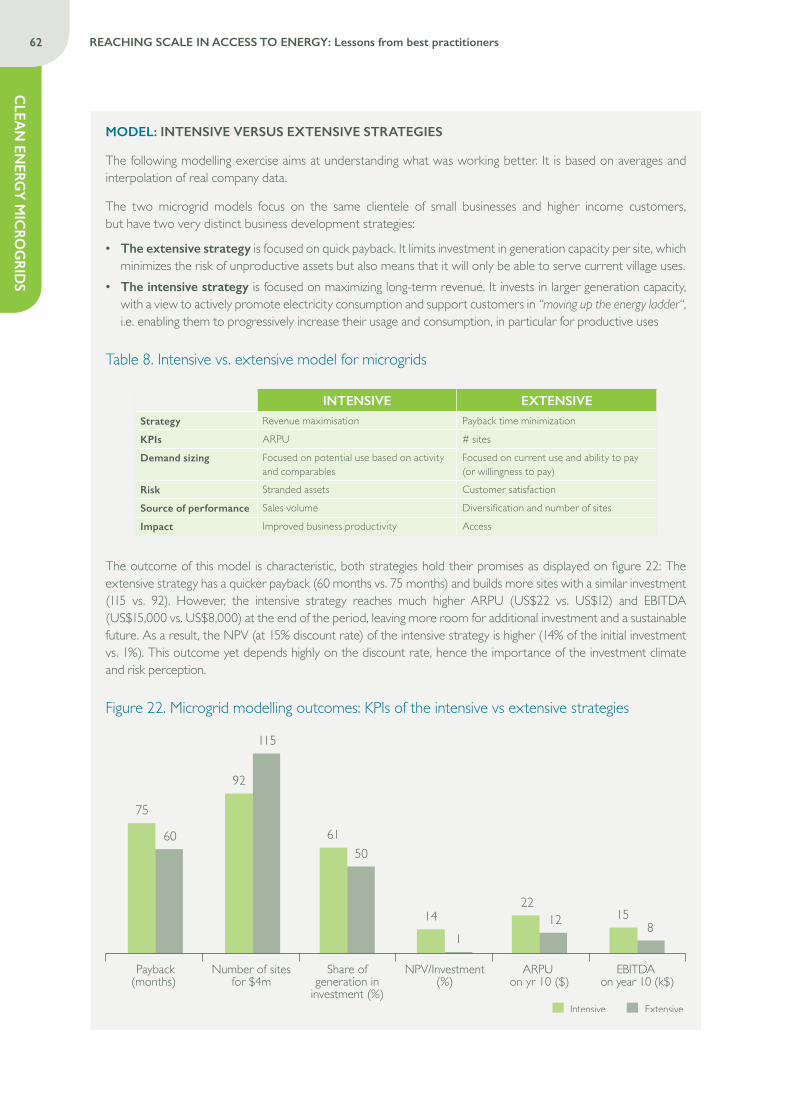
62 REACHING SCALE IN ACCESS TO ENERGY: Lessons from best practitioners
CLEA
N EN
ERGY M
ICRO
GRID
S
MODEL: INTENSIVE VERSUS EXTENSIVE STRATEGIES
The following modelling exercise aims at understanding what was working better. It is based on averages and interpolation of real company data.
The two microgrid models focus on the same clientele of small businesses and higher income customers, but have two very distinct business development strategies:
• The extensive strategy is focused on quick payback. It limits investment in generation capacity per site, which minimizes the risk of unproductive assets but also means that it will only be able to serve current village uses.
• The intensive strategy is focused on maximizing long-term revenue. It invests in larger generation capacity, with a view to actively promote electricity consumption and support customers in “moving up the energy ladder“, i.e. enabling them to progressively increase their usage and consumption, in particular for productive uses
Table 8. Intensive vs. extensive model for microgrids
INTENSIVE EXTENSIVEStrategy Revenue maximisation Payback time minimization
KPIs ARPU # sites
Demand sizing Focused on potential use based on activity and comparables
Focused on current use and ability to pay (or willingness to pay)
Risk Stranded assets Customer satisfaction
Source of performance Sales volume Diversification and number of sites
Impact Improved business productivity Access
The outcome of this model is characteristic, both strategies hold their promises as displayed on figure 22: The extensive strategy has a quicker payback (60 months vs. 75 months) and builds more sites with a similar investment (115 vs. 92). However, the intensive strategy reaches much higher ARPU (US$22 vs. US$12) and EBITDA (US$15,000 vs. US$8,000) at the end of the period, leaving more room for additional investment and a sustainable future. As a result, the NPV (at 15% discount rate) of the intensive strategy is higher (14% of the initial investment vs. 1%). This outcome yet depends highly on the discount rate, hence the importance of the investment climate and risk perception.
Figure 22. Microgrid modelling outcomes: KPIs of the intensive vs extensive strategies
Intensive Extensive
Payback(months)
75
60
Number of sites for $4m
92
115
Share ofgeneration in
investment (%)
61 50
NPV/Investment(%)
14 1
ARPU on yr 10 ($)
22 12
EBITDA on year 10 (k$)
15 8
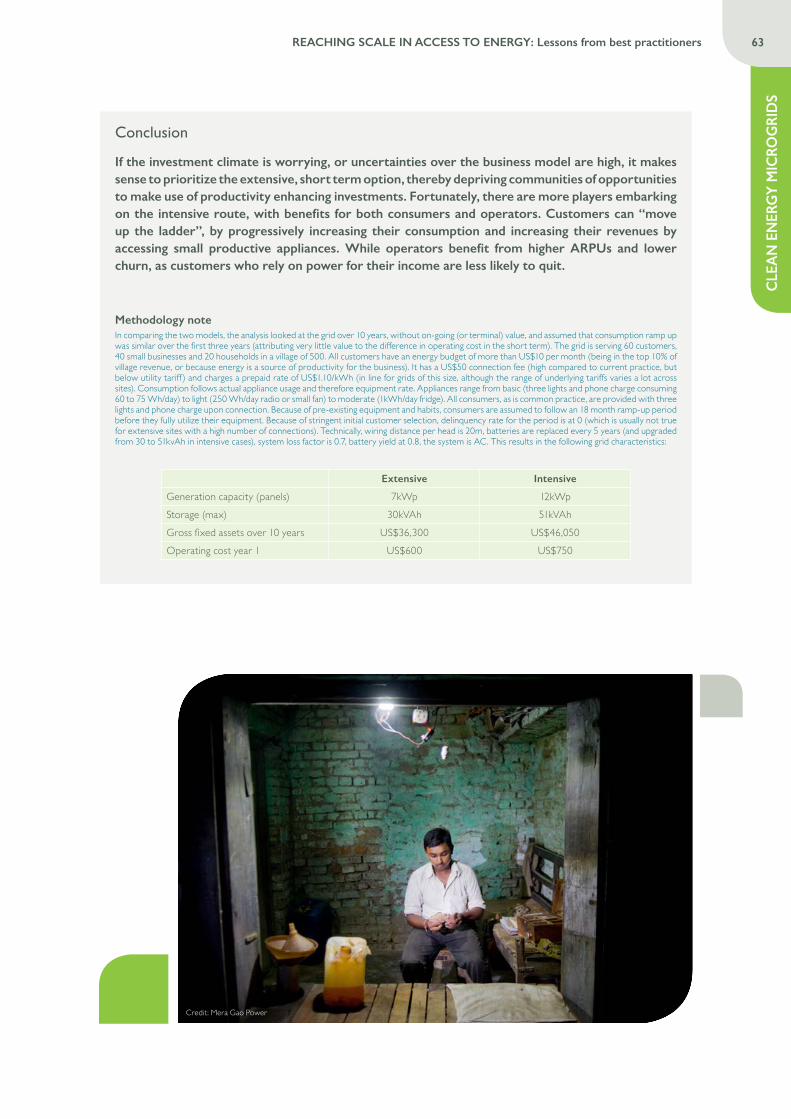
CLE
AN
EN
ERG
Y M
ICRO
GRI
DS
63REACHING SCALE IN ACCESS TO ENERGY: Lessons from best practitioners
Conclusion
If the investment climate is worrying, or uncertainties over the business model are high, it makes sense to prioritize the extensive, short term option, thereby depriving communities of opportunities to make use of productivity enhancing investments. Fortunately, there are more players embarking on the intensive route, with benefits for both consumers and operators. Customers can “move up the ladder”, by progressively increasing their consumption and increasing their revenues by accessing small productive appliances. While operators benefit from higher ARPUs and lower churn, as customers who rely on power for their income are less likely to quit.
Methodology noteIn comparing the two models, the analysis looked at the grid over 10 years, without on-going (or terminal) value, and assumed that consumption ramp up was similar over the first three years (attributing very little value to the difference in operating cost in the short term). The grid is serving 60 customers, 40 small businesses and 20 households in a village of 500. All customers have an energy budget of more than US$10 per month (being in the top 10% of village revenue, or because energy is a source of productivity for the business). It has a US$50 connection fee (high compared to current practice, but below utility tariff ) and charges a prepaid rate of US$1.10/kWh (in line for grids of this size, although the range of underlying tariffs varies a lot across sites). Consumption follows actual appliance usage and therefore equipment rate. Appliances range from basic (three lights and phone charge consuming 60 to 75 Wh/day) to light (250 Wh/day radio or small fan) to moderate (1kWh/day fridge). All consumers, as is common practice, are provided with three lights and phone charge upon connection. Because of pre-existing equipment and habits, consumers are assumed to follow an 18 month ramp-up period before they fully utilize their equipment. Because of stringent initial customer selection, delinquency rate for the period is at 0 (which is usually not true for extensive sites with a high number of connections). Technically, wiring distance per head is 20m, batteries are replaced every 5 years (and upgraded from 30 to 51kvAh in intensive cases), system loss factor is 0.7, battery yield at 0.8, the system is AC. This results in the following grid characteristics:
Extensive Intensive
Generation capacity (panels) 7kWp 12kWpStorage (max) 30kVAh 51kVAhGross fixed assets over 10 years US$36,300 US$46,050 Operating cost year 1 US$600 US$750
Credit: Mera Gao Power
64 REACHING SCALE IN ACCESS TO ENERGY: Lessons from best practitioners
CLEA
N EN
ERGY M
ICRO
GRID
S
Interview with Johannes Holst, Director of Business Development
What is your vision for the microgrid model?
“We see micro-grids are the most suitable solution to solving energy access in East Africa. PowerGen has developed a system that essentially provides a ‘future state’ energy infrastructure to African consumers, one that is in line with the model more established markets are heading towards (distributed generation, renewable energy, distributed storage and smart metering). In this way, the initial investment will provide enduring value to customers as their consumption increases and even after the main grid arrives.
Our model solves the near- and long-term challenges facing the African power sector. In the near term, we can finance last-mile connections for citizens without access to AC power and offers improved reliability through distributed storage. In the long term the use of local generation and storage supports a thinner grid, effectively deferring reinforcement investment and improving power quality; smart metering enables more efficient grid monitoring and maintenance as well as providing a platform for innovation; finally, the distributed architecture allows easier integration of further renewable generation.
That said, there will always be a role for the main grid and a degree of centralized generation. I do believe mini-grids will provide millions of new connections across Africa, but this will be alongside an efficient central grid, most likely interconnected.”
What have been your key challenges and how did you address them?
“The challenges can be broadly grouped into regulatory and financing issues, plus the constant need to understand our customers better.
1. Regulatory: The areas we are most often challenged on are the ‘what if ’ of grid arrival and our tariffs. In both instances regulators have made great strides, and the sector needs to continue to work with policymakers and regulators on the right frameworks with a clear expectations. Regarding tariff setting for example, companies can be licensed in a transparent way that gives comfort that consumers are being protected, while investors receive appropriate returns. Equally, understanding the menu of options available if and when the main grid reaches a mini-grid site allows the business to plan accordingly. Finally, permitting needs to be streamlined to allow projects to be developed within reasonable timescales and budgets. Current permitting rules have been designed with large scale projects in mind and are often out-of-step with the small, rapidly deployable and modular designs of our grids.
2. Financing: There are a lot of subsidies targeting energy access across East Africa, and these funds are helping national governments accelerate their electrification programs. At the same time, the subsidies are currently only available to governments; we would like to see greater subsidy parity, which would allow economic space for a private mini-grid sector to develop. Infrastructure financing also needs to be refined further, with tickets, tenors and return expectations aligned to the asset class being financed. Developers certainly have a role to play in enabling this, by driving more standardization of the assets, so that investors can assess investment opportunities more readily. The sector also needs to work harder to provide the data sets and frameworks necessary to demonstrate predictable, bankable cash flows from portfolios of customers. Finally, we encourage greater flexibility in allowing a degree of hybridization of generation, this increases reliability and reduces costs for consumers.
3. Customers: Above all, we need to deepen our customer insights, so that we can ensure we are always providing value. This means listening to our customers and constantly improving the proposition. We want our customers to be delighted and empowered by our service.”
CLE
AN
EN
ERG
Y M
ICRO
GRI
DS
65REACHING SCALE IN ACCESS TO ENERGY: Lessons from best practitioners
RECOMMENDATIONSThe take-off of microgrid solutions will depend on (i) growth opportunities and (ii) risk reduction opportunities. Growth opportunities are essentially dependent on players’ actions within sites and across areas that enable more sustainable business models to deepen penetration in existing sites and make more marginal sites profitable. While risk reduction opportunities, which should be the primary concern of investors, stem largely from outside support, notably from donors and governments.
OPPORTUNITY #1: Within sites, companies will need more intensive ‘harvesting’ approaches with stronger focus on productive uses (small businesses or industrial loads) and higher ARPUs
Utilities see growth rates of 25% per annum on connections. Microgrids, with their superior reliability should aim for at least as much:
• By not under-investing in generation or ensuring built in flexibility (e.g. OMC) in order to minimize capital investment while responding to increasing demand (including through tariff evolutions)
• Through innovations by recruiting customer care personnel, and partnering with market activation players for appliance and equipment based market activation (e.g. Rockefeller India with Husk and OMC)
• By focusing on a high proportion of business customers while recruiting households at the margin initially, even at the cost of lower connection numbers (e.g. Powergen focused on 50% business customers in village centers, OMC anchor client model). The focus on productive uses enables to secure minimum loads but also generate higher stability in revenue. As one company realized “Households are the most likely to switch to a cheap solution” (even low-quality grid), while businesses are more stable (and microgrids offer stronger structural advantages for them).
Interestingly, microgrid companies are in a unique position to offer customer financing to their customers, leveraging their customer knowledge (credit scoring) and payment infrastructure (bills, mobile money etc.) to reduce transaction costs. This model has been proven by large grid companies already. In Bogota, the electric company Codensa set up the ‘Crédito Facil’ program in 2002: offering microcredit to one million low-income customers, paid back on the utility bills. Initially, the program was intended to finance electrical appliances, which enabled to increase average electricity consumption per user. The program progressively diversified to customer financing for a broader range of goods and services. For 75% of customers, it represents their first formal loan experience77.
Lastly, donors have a role to play in encouraging microgrid players to not under-invest in their sites, as it makes sense from a macro and policy perspective “To build grids to standard and to last: this reduces the costs for future grid extension, the lifetime costs are lower, and it can provide appropriate user safety (e.g. proper earthing and breakers).”
OPPORTUNITY #2: Across sites, companies should look to work in clusters and work with investors to foster financing innovations
A high fixed asset, long term, stable revenue investment is an ideal debt vehicle. Whereas individual sites (approximately US$100,000 investments) have not been able to obtain bank financing, there could be a case for financing regional roll out programs in given areas, which would add value in three ways:
• Concentrating clusters of grids in a given area will enable lower service costs and higher quality of service (e.g. given current site dispersion, Powergen has to concentrate their Kenya maintenance staff in Nairobi, and most sites are a 4-hour drive away)
• Agreeing early on a financing plan will free up capital for additional sites • Aggregating several sites with different risk profiles will generate a more stable revenue stream • Local currency financing will reduce exposure to exchange rate fluctuation as most of the investment will
be covered early on.
77 http://corporativo.codensa.com.co/EN/PRENSA/COMUNICADOS/Pages/WithCréditoFacilCodensa,onemillionfamiliesinBogotahaveimprovedtheirqualityoflife.aspx
66 REACHING SCALE IN ACCESS TO ENERGY: Lessons from best practitioners
CLEA
N EN
ERGY M
ICRO
GRID
S
OPPORTUNITY #3: Donors and governments should help derisk the microgrid environment, by promoting more stable regulatory frameworks but also by offering subsidies which are still needed in many cases
As the developments in the US and China are demonstrating, microgrids are now an essential part of grid development strategy: (i) distributing supply stabilizes the network (notwithstanding islanding management complexities) (ii) generation proximity generates savings on transmission equipment (and high voltage lines are unpopular) (iii) multi-source systems increase reliability of supply. For countries with low intensity consumers, they have an additional advantage: they can be dimensioned closer to actual needs. This would require that:
• Governments establish regulatory frameworks and policy stability. Government tariff exemptions amount to turning a blind eye on microgrid experiments. But they are not enough to foster a real alternative to grid extension and need a more holistic approach that covers each step of microgrid development: - In the early stages, obtain fast track land attribution and blanket environmental vetting on the solution rather than each implementation, as well as some visibility on main grid extension plans
- During exploitation, determine automatic rule based feed in tariff agreements
- If independent operations have to be terminated, agree on the value at which the grid should be bought out by utilities or regional authorities, provided they satisfy minimum technical standards
• Donors can foster quality rather than quantity of investments, by setting standards, thresholds for the main grid, acting as a guarantor, setting up multi operators at national level SPVs
• Regulators set at least a level playing field with politically and subsidy supported utilities • Governments and/or donors put in place long term (8 to 10 years) repayable subsidies for the grid that enable
operators to invest more on generation and market activation. Some players in our sample would even argue that pure commercially viable models, which we have not seen yet, are unlikely to be reached except for some very anecdotal sites. As one of them explains “Given the high risk (country, policy, regulation) and serving an inherently poor population in most countries we do not believe that microgrids can be scaled without some form of subsidy/grant. Everywhere in the world, grids benefit from subsidies in some form, either directly or through cross subsidies (between cities and rural areas). If you build a stand-alone microgrid you cannot use cross subsidies and thus need direct subsidies”.
Interview with Daniel Becker, Managing Director of Rafiki Power
What have been the main challenges you discovered over the past three years?
“The biggest challenge was and still is the regulatory and policy environment. Even though microgrids are small investments for each site they have to adhere to regulatory standards which are often still vague and ill enforced. In order to make the model scalable, we work with regulators to solve several key issues: tariffs, grid arrival, subsidies, technical standards, permitting processes and simplification of sometimes lengthy and complicated processes. Managing customers, in particular planning for their consumption, is difficult too. A third challenge is to find qualified workers and electricians capable of cabling, controlling quality, rewiring batteries, etc. That is why we have built a strong network with local partners, suppliers, NGOs and universities to develop and work with trusted and well trained people.”
What would be needed to foster the development of sustainable microgrids?
“Microgrids are in many cases more economically than grid-extension while yielding the same benefits e.g. enable for productive use and load flexibility (compared to SHS). To foster the development mainly strong regulation and subsidies are needed. Operating in a high-risk environment and offering a complex solution requires clear rules and investor security to attract capital from private investors.”
CLE
AN
EN
ERG
Y M
ICRO
GRI
DS
67REACHING SCALE IN ACCESS TO ENERGY: Lessons from best practitioners
FOCUS: Clean energy nanogrids
Nanogrids are catering to a totally different market from microgrids, as they are providing basic DC solutions for lighting and phone charging for the poorer households.
• They provide basic infrastructure: a single 80-250W panel with basic wiring to a cluster 5-30 families, with a value proposition focused on lighting, phone charging, and very basic appliances. With monthly fees starting at around US$2, they are affordable by the poorer households.
• Nanogrid players have worked on very low investment solutions in the range of US$40-200 connection costs per household. This makes the payback period in best cases 2-3 years.
• Most players however, due to delinquencies, suboptimal site size, or random events bank on a 3-5 years payback period, which remains quicker than microgrids.
They are often dismissed as a toned-down version of the SHS and a futureless transitory solution before PAYG SHS take the market by storm. That may be a hasty view. Because they provide reliability and guarantee service to poor and remote customers, nanogrids could become a competitive solution for basic access in niche markets, where others lack credibility.
• The key factor is their ability to serve small sized communities with sufficient housing density (100 meters, although increases in voltage enable longer radius) profitably, reliably, and at a very low cost. In these remote villages, broken down lanterns and SHSs are gathering dust in the backyard as no help was available to correct ill use or to deliver on guarantees.
• The trust of the community is comforted by collective engagement (e.g. Devergy works with village leaders, Mera Gao Power builds joint liability groups inspired from MFIs) which means that a critical mass of customers warrants representation and the regular presence of staff for payment collection or maintenance
• To achieve reasonable service cost, nanogrid operators developed their coverage through clusters sharing O&M and customer care, and achieve reliability by keeping technology to its bare minimum. Overhead distribution lines using mostly existing roofs, no inverter and in many cases no meter - are characteristics for a robust, no frills grid. At these very low costs, Indian nanogrids have even been able to operate in grid-connected area on the promise of power quality and reliability alone.
It is still very early days for these solutions and it remains to be seen how many of the 100-120 million rural poor customers can be reached. A number of questions remain pending:
• What is the sustainable price point that will not draw in PAYG, especially when or if SHS with power reselling options come to the market?
• Given the exposure of these populations to adverse economic conditions, how can operators maintain high usage rate and low churn?
• While lighting and charging is only a bonus for currently underserved populations, how should wealthier households or small businesses be served? How should customers be helped in “moving up the energy ladder” (e.g. Devergy is developing a full range of DC appliances and payment plans to encourage consumption increase)
• If the offering becomes more complex, how do operators limit OPEX (maintenance demanding more sophisticated technicians and more frequent interventions, money collection moving towards microcredit which has found it difficult to penetrate rural areas)?
• As penetration increases, how do they maintain low overheads against a locally trained salesforce not finding enough opportunities and therefore churning. And against more sophisticated sites, both requiring more training and management?
***
Despite these uncertainties, nanogrids, because they cater to the forgotten segment of access to energy, would deserve more interest and support from investors and donors. It is one of the few models where number of connections is the key driving factor.
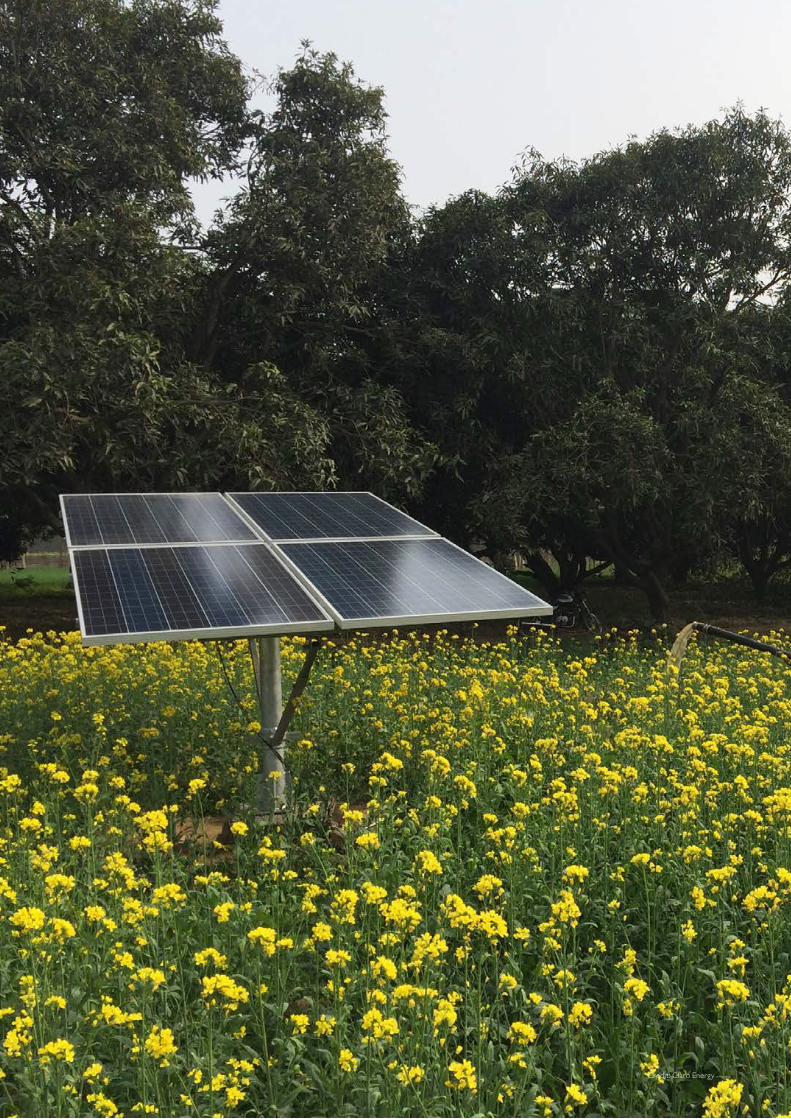
Credit: Claro Energy
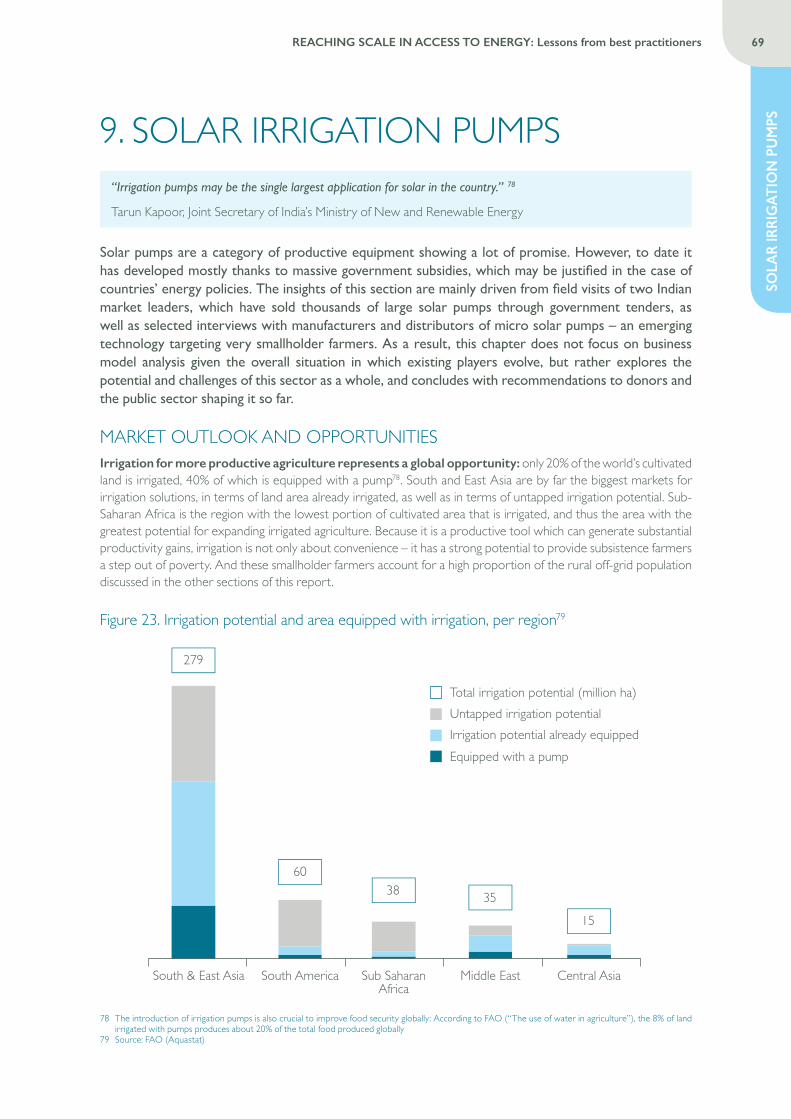
SOLA
R IR
RIG
ATIO
N P
UM
PS
69REACHING SCALE IN ACCESS TO ENERGY: Lessons from best practitioners
9. SOLAR IRRIGATION PUMPS
Solar pumps are a category of productive equipment showing a lot of promise. However, to date it has developed mostly thanks to massive government subsidies, which may be justified in the case of countries’ energy policies. The insights of this section are mainly driven from field visits of two Indian market leaders, which have sold thousands of large solar pumps through government tenders, as well as selected interviews with manufacturers and distributors of micro solar pumps – an emerging technology targeting very smallholder farmers. As a result, this chapter does not focus on business model analysis given the overall situation in which existing players evolve, but rather explores the potential and challenges of this sector as a whole, and concludes with recommendations to donors and the public sector shaping it so far.
MARKET OUTLOOK AND OPPORTUNITIES6
Irrigation for more productive agriculture represents a global opportunity: only 20% of the world’s cultivated land is irrigated, 40% of which is equipped with a pump78. South and East Asia are by far the biggest markets for irrigation solutions, in terms of land area already irrigated, as well as in terms of untapped irrigation potential. Sub-Saharan Africa is the region with the lowest portion of cultivated area that is irrigated, and thus the area with the greatest potential for expanding irrigated agriculture. Because it is a productive tool which can generate substantial productivity gains, irrigation is not only about convenience – it has a strong potential to provide subsistence farmers a step out of poverty. And these smallholder farmers account for a high proportion of the rural off-grid population discussed in the other sections of this report.
Figure 23. Irrigation potential and area equipped with irrigation, per region79
South & East Asia
279
Total irrigation potential (million ha) Untapped irrigation potential Irrigation potential already equippedEquipped with a pump
South America
60
Sub SaharanAfrica
38
Middle East
35
Central Asia
15
78 The introduction of irrigation pumps is also crucial to improve food security globally: According to FAO (“The use of water in agriculture”), the 8% of land irrigated with pumps produces about 20% of the total food produced globally
79 Source: FAO (Aquastat)
“Irrigation pumps may be the single largest application for solar in the country.” 78
Tarun Kapoor, Joint Secretary of India’s Ministry of New and Renewable Energy
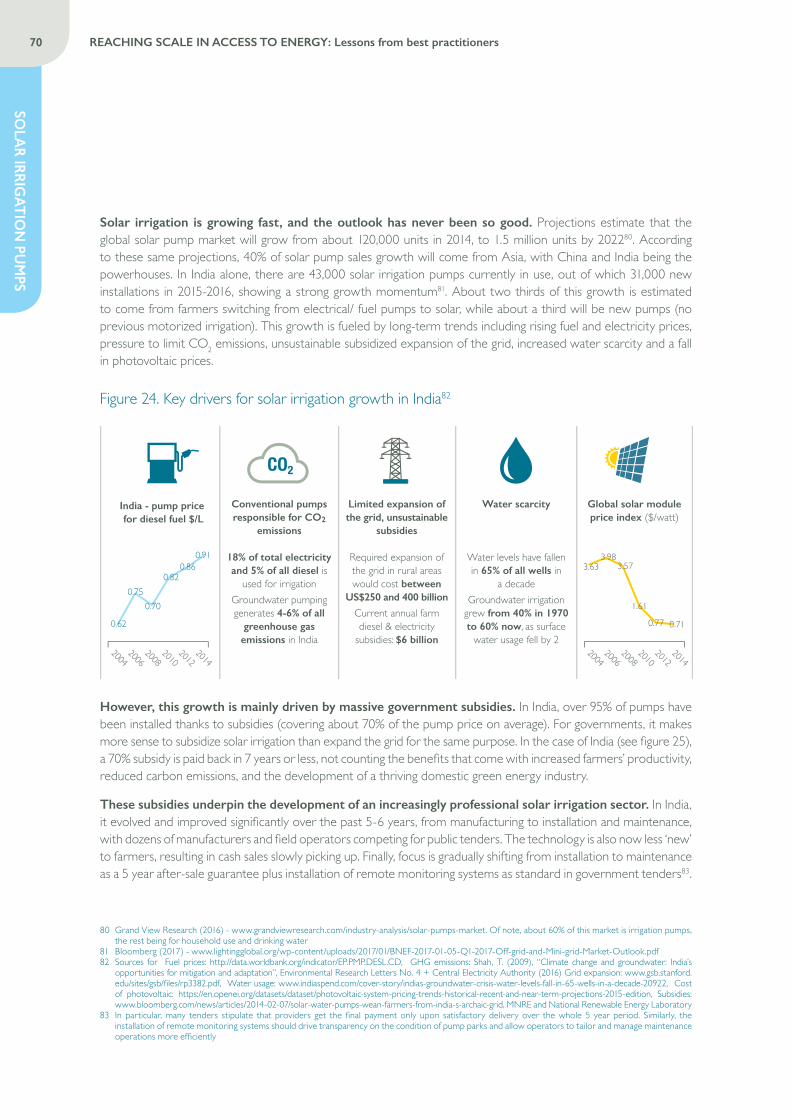
70 REACHING SCALE IN ACCESS TO ENERGY: Lessons from best practitioners
SOLA
R IRRIGAT
ION
PUM
PS
Solar irrigation is growing fast, and the outlook has never been so good. Projections estimate that the global solar pump market will grow from about 120,000 units in 2014, to 1.5 million units by 202280. According to these same projections, 40% of solar pump sales growth will come from Asia, with China and India being the powerhouses. In India alone, there are 43,000 solar irrigation pumps currently in use, out of which 31,000 new installations in 2015-2016, showing a strong growth momentum81. About two thirds of this growth is estimated to come from farmers switching from electrical/ fuel pumps to solar, while about a third will be new pumps (no previous motorized irrigation). This growth is fueled by long-term trends including rising fuel and electricity prices, pressure to limit CO2 emissions, unsustainable subsidized expansion of the grid, increased water scarcity and a fall in photovoltaic prices.
Figure 24. Key drivers for solar irrigation growth in India82
CO2
Conventional pumps responsible for CO2
emissions
18% of total electricity and 5% of all diesel is
used for irrigationGroundwater pumping generates 4-6% of all
greenhouse gas emissions in India
Limited expansion of the grid, unsustainable
subsidies
Required expansion of the grid in rural areas would cost between
US$250 and 400 billion
Current annual farm diesel & electricity
subsidies: $6 billion
Water scarcity
Water levels have fallen in 65% of all wells in
a decadeGroundwater irrigation
grew from 40% in 1970 to 60% now, as surface
water usage fell by 20.62
0.75 0.70
0.82 0.86
0.91
India - pump price for diesel fuel $/L
20042006
20082010
20122014
Global solar module price index ($/watt)
20042006
20082010
20122014
3.63 3.98
3.57
1.61
0.77 0.71
However, this growth is mainly driven by massive government subsidies. In India, over 95% of pumps have been installed thanks to subsidies (covering about 70% of the pump price on average). For governments, it makes more sense to subsidize solar irrigation than expand the grid for the same purpose. In the case of India (see figure 25), a 70% subsidy is paid back in 7 years or less, not counting the benefits that come with increased farmers’ productivity, reduced carbon emissions, and the development of a thriving domestic green energy industry.
These subsidies underpin the development of an increasingly professional solar irrigation sector. In India, it evolved and improved significantly over the past 5-6 years, from manufacturing to installation and maintenance, with dozens of manufacturers and field operators competing for public tenders. The technology is also now less ‘new’ to farmers, resulting in cash sales slowly picking up. Finally, focus is gradually shifting from installation to maintenance as a 5 year after-sale guarantee plus installation of remote monitoring systems as standard in government tenders83.
80 Grand View Research (2016) - www.grandviewresearch.com/industry-analysis/solar-pumps-market. Of note, about 60% of this market is irrigation pumps, the rest being for household use and drinking water
81 Bloomberg (2017) - www.lightingglobal.org/wp-content/uploads/2017/01/BNEF-2017-01-05-Q1-2017-Off-grid-and-Mini-grid-Market-Outlook.pdf82 Sources for Fuel prices: http://data.worldbank.org/indicator/EP.PMP.DESL.CD, GHG emissions: Shah, T. (2009), “Climate change and groundwater: India’s
opportunities for mitigation and adaptation”, Environmental Research Letters No. 4 + Central Electricity Authority (2016) Grid expansion: www.gsb.stanford.edu/sites/gsb/files/rp3382.pdf, Water usage: www.indiaspend.com/cover-story/indias-groundwater-crisis-water-levels-fall-in-65-wells-in-a-decade-20922, Cost of photovoltaic: https://en.openei.org/datasets/dataset/photovoltaic-system-pricing-trends-historical-recent-and-near-term-projections-2015-edition, Subsidies: www.bloomberg.com/news/articles/2014-02-07/solar-water-pumps-wean-farmers-from-india-s-archaic-grid, MNRE and National Renewable Energy Laboratory
83 In particular, many tenders stipulate that providers get the final payment only upon satisfactory delivery over the whole 5 year period. Similarly, the installation of remote monitoring systems should drive transparency on the condition of pump parks and allow operators to tailor and manage maintenance operations more efficiently
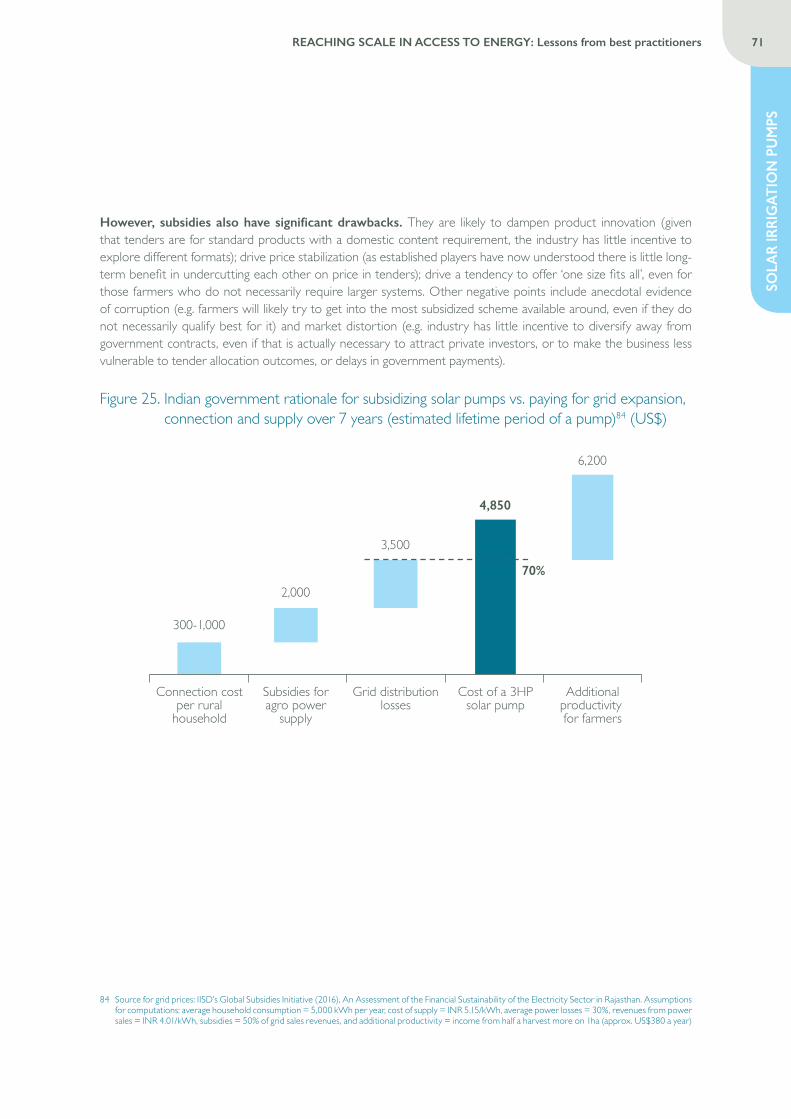
SOLA
R IR
RIG
ATIO
N P
UM
PS
71REACHING SCALE IN ACCESS TO ENERGY: Lessons from best practitioners
However, subsidies also have significant drawbacks. They are likely to dampen product innovation (given that tenders are for standard products with a domestic content requirement, the industry has little incentive to explore different formats); drive price stabilization (as established players have now understood there is little long-term benefit in undercutting each other on price in tenders); drive a tendency to offer ‘one size fits all’, even for those farmers who do not necessarily require larger systems. Other negative points include anecdotal evidence of corruption (e.g. farmers will likely try to get into the most subsidized scheme available around, even if they do not necessarily qualify best for it) and market distortion (e.g. industry has little incentive to diversify away from government contracts, even if that is actually necessary to attract private investors, or to make the business less vulnerable to tender allocation outcomes, or delays in government payments).
Figure 25. Indian government rationale for subsidizing solar pumps vs. paying for grid expansion, connection and supply over 7 years (estimated lifetime period of a pump)84 (US$)
Connection costper rural
household
Cost of a 3HPsolar pump
4,850
Additionalproductivity for farmers
6,200
Subsidies foragro power
supply
2,000
300-1,000
Grid distributionlosses
3,500
70%
84 Source for grid prices: IISD’s Global Subsidies Initiative (2016), An Assessment of the Financial Sustainability of the Electricity Sector in Rajasthan. Assumptions for computations: average household consumption = 5,000 kWh per year, cost of supply = INR 5.15/kWh, average power losses = 30%, revenues from power sales = INR 4.01/kWh, subsidies = 50% of grid sales revenues, and additional productivity = income from half a harvest more on 1ha (approx. US$380 a year)
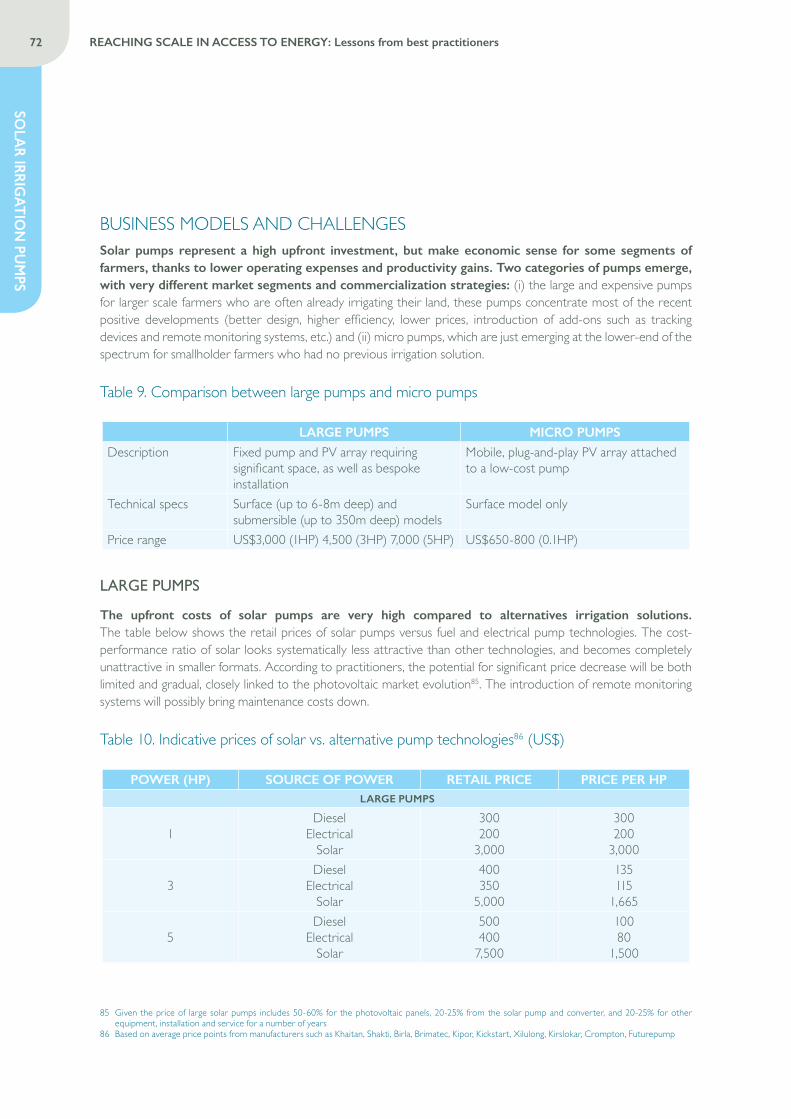
72 REACHING SCALE IN ACCESS TO ENERGY: Lessons from best practitioners
SOLA
R IRRIGAT
ION
PUM
PS
BUSINESS MODELS AND CHALLENGESSolar pumps represent a high upfront investment, but make economic sense for some segments of farmers, thanks to lower operating expenses and productivity gains. Two categories of pumps emerge, with very different market segments and commercialization strategies: (i) the large and expensive pumps for larger scale farmers who are often already irrigating their land, these pumps concentrate most of the recent positive developments (better design, higher efficiency, lower prices, introduction of add-ons such as tracking devices and remote monitoring systems, etc.) and (ii) micro pumps, which are just emerging at the lower-end of the spectrum for smallholder farmers who had no previous irrigation solution.
Table 9. Comparison between large pumps and micro pumps
LARGE PUMPS MICRO PUMPSDescription Fixed pump and PV array requiring
significant space, as well as bespoke installation
Mobile, plug-and-play PV array attached to a low-cost pump
Technical specs Surface (up to 6-8m deep) and submersible (up to 350m deep) models
Surface model only
Price range US$3,000 (1HP) 4,500 (3HP) 7,000 (5HP) US$650-800 (0.1HP)
LARGE PUMPS
The upfront costs of solar pumps are very high compared to alternatives irrigation solutions. The table below shows the retail prices of solar pumps versus fuel and electrical pump technologies. The cost-performance ratio of solar looks systematically less attractive than other technologies, and becomes completely unattractive in smaller formats. According to practitioners, the potential for significant price decrease will be both limited and gradual, closely linked to the photovoltaic market evolution85. The introduction of remote monitoring systems will possibly bring maintenance costs down.
Table 10. Indicative prices of solar vs. alternative pump technologies86 (US$)
POWER (HP) SOURCE OF POWER RETAIL PRICE PRICE PER HP LARGE PUMPS
1Diesel
Electrical Solar
300 200
3,000
300 200
3,000
3Diesel
Electrical Solar
400 350
5,000
135 115
1,665
5Diesel
Electrical Solar
500 400
7,500
100 80
1,500
85 Given the price of large solar pumps includes 50-60% for the photovoltaic panels, 20-25% from the solar pump and converter, and 20-25% for other equipment, installation and service for a number of years
86 Based on average price points from manufacturers such as Khaitan, Shakti, Birla, Brimatec, Kipor, Kickstart, Xilulong, Kirslokar, Crompton, Futurepump
SOLA
R IR
RIG
ATIO
N P
UM
PS
73REACHING SCALE IN ACCESS TO ENERGY: Lessons from best practitioners
When looking at payback economics, large pumps make most sense for farmers who already invested into powered irrigation, and who have relatively high energy requirements (due to depth of water table and water volume required), but depend on expensive or unreliable sources of power and therefore cannot cultivate or expand to full potential. These include in particular:
• Middle size to large farms (2ha and above) with diesel/petrol pumps. For them, solar irrigation would make sense both in terms of fuel savings, but also factoring in the additional productivity solar could potentially bring them: some farmers do not irrigate into the dry season given that the cost for fuel required goes through the roof87. For these farmers, the payback is estimated at around 2.5-4 years88 (smaller landholdings have longer paybacks given the cost-effectiveness of solar pumps decreases significantly for the smaller formats).
• Larger farms (3ha and above) operating in relatively arid countries, without access to the grid. These farmers are limited to cultivating land close to surface water sources. Water deeper than 8m can only be pumped by submersible electrical pumps powered by a generator (often very expensive), or by solar. This is the case for instance for some of the larger scale farmers in Niayes region in Senegal – which is located near the capital and concentrates about 80% of the Senegalese horticulture production. In this region, irrigation is currently exclusively done with ground water on 5,000ha of land while there is a potential of 13,000ha of new irrigated fields with water table depth under 20m89. For the larger farms, switching from generator to solar pays back in about three years, while introducing solar irrigation on virgin land pays back in about two to four years only (depending on pump size).
• Larger farms (3ha and above) connected to a poor grid. When the power supply is unreliable, this creates a risk of harvest loss and regular maintenance issues due to load problems. As a result, farmers cannot expand crops, go for another harvest cycle into the dry season, or switch to more sensitive and higher value-add crops. It is estimated that such farmers pay back the solar pump in about four years in India (given the heavily subsidized price of electricity). But the main draw is the increased productivity (a reported 30-50% across the farmers interviewed) and ability to cultivate more and change crops.
While large solar pumps have been most sold through subsidies so far, more sustainable business models could emerge, given the price of pumps includes relatively high gross margins to recoup costly after-sales operations. Many of the farmers in the segments mentioned above would likely still buy solar pumps once the subsidies stop, provided they are given tailored advice on the type of irrigation solution they need, appropriate financing solutions and quality after-sales.
87 This is, in particular, an occurrence that was reported to happen in South Asia and in East Africa.88 For all payback calculations it is considered that solar pumps provide additional productivity vs. fuel or electricity pumps because the energy source is more
reliable (vs. grid electricity) or there are less trade-offs in terms of fuel costs. In the model these productivity gains translate into additional productive capacity i.e. 2.5 crops with a solar pump vs. 2 crops with diesel/electric pump, 1.5 crops with treadle pump, 1 crop with no irrigation (rainfed). But solar pumps also produce on average less output in the course of a day (at same HP design), meaning the farmer must either purchase a bigger size or invest in a drip irrigation system (US$1,000/ha) to irrigate the same area. All recommendations are based on the latter scenario. Revenue assumptions takes the average crop revenue per ha in India (US$700, based on date from the NSSO 70th round Survey of Agricultural Households Key Indicators). Cost assumptions: average monthly expenses = 40% of total output (including 17% for seeds, fertilizer and pesticide, 8% for labor); Fuel costs = US$1/liter with 3.6 l/d for 1 HP, 6l/d for 3 HP, 9l/d for 5 HP, over 122 days a year (i.e. one additional growing season); Electricity costs = 6 units per HP per day, over 122 days a year, with 1 unit = INR 6 (USD 0.09)
89 Source: PRACTICA Foundation (2016), Intermediate depth solar pumps, Country assessment Senegal

74 REACHING SCALE IN ACCESS TO ENERGY: Lessons from best practitioners
SOLA
R IRRIGAT
ION
PUM
PS
CHALLENGE #1: Farmers typically prefer the least expensive and risk-prone option, even if the investment makes economic sense
Long payback periods and high upfront investments are two important barriers to adoption: farmers perceive they need to pay extra for a pump that will take longer to amortize, and they are not sure if the benefits will outweigh the cost in their case. In turn, pump providers need to convince farmers one by one.
“Large scale farmers perceive they need to pay extra, while they are merely amortizing their power bill over 3-4 years. If JAIN could provide some gradual payment facility together with the Electricity Boards, perhaps we could convince many more. For smallholder farmers, who never invested into irrigation and who do not trust how much more they can gain, this is a very tall investment that also requires to change their cultivation techniques and equipment. Without the subsidy, the payback period would be just too long.”
Anil Jain, Vice Chairman and MD of Jain Irrigation Systems
CHALLENGE #2: Adoption is further hindered by the lack of appropriate financing solutions
Financing solutions are a must, given most pumps cost more than US$3,000 and farmers may also need to invest into appropriate water application systems (e.g. drip irrigation) to cover a similar surface with even less water output.
CHALLENGE #3: A limited number of companies are able to deliver quality and tailored solutions with installation and maintenance services cost efficiently
Considerable field capabilities are required for site surveying, installation, training, and maintenance: pump providers have to assess the type of pump and possible additional equipment needed; then they must install the pump and train the farmer in its use (85-90% of the pump failures are due to mishandling of the pump, e.g. not cleaning the panels regularly, letting the pump sit in sand or mud, not running the pump a few minutes a day, tampering with the converter and wiring, etc.). Lastly, after-sales capabilities are crucial since an estimated 30-50% of the pumps fail once a year90.
These obstacles were observed many years ago in the SHS industry, but the commercialization of large solar pumps will likely prove even more difficult to crack: farmers need considerable training support – as it is often the case with the introduction of new agro-technologies, and given the water output is very different with solar pumps from that of a fuel or electrical pump, they may need to change their farming practices.
As a result, the sector will likely evolve towards further differentiation between manufacturers who will continue developing various types of pumps, and last-mile operators that should be able to deliver sophisticated and reliable last-mile support. This is for instance the case of Claro Energy in India, which focuses exclusively on field delivery, and started managing pump parks for other players that initially installed the pumps and realized they cannot deliver sufficient service levels over the required five year guarantee period. The only exception to this trend is JAIN Irrigation, a massive agro conglomerate whose strategy for decades has been to provide 360° support to farmers (including manufacturing of pumps and irrigation pipes, seed production, field delivery and maintenance teams, purchase of agro produce, etc.)
90 As reported by Claro and Jain who install and service a large array of Indian manufactured pumps
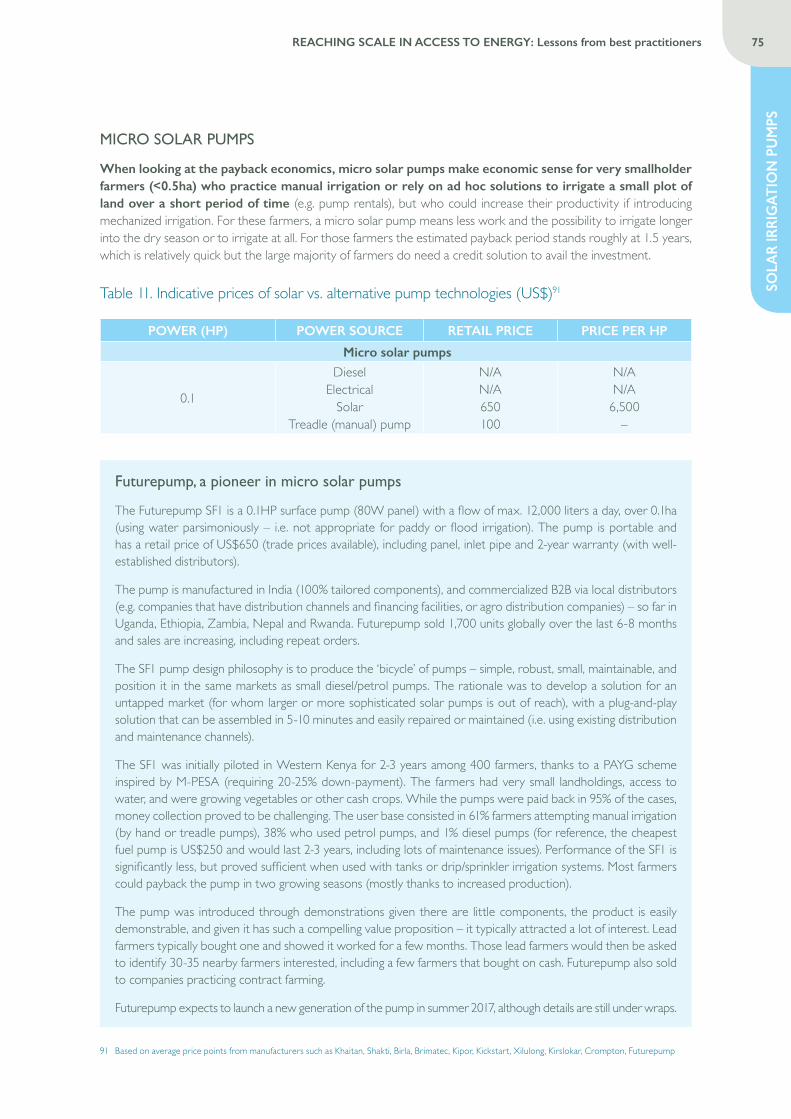
SOLA
R IR
RIG
ATIO
N P
UM
PS
75REACHING SCALE IN ACCESS TO ENERGY: Lessons from best practitioners
MICRO SOLAR PUMPS
When looking at the payback economics, micro solar pumps make economic sense for very smallholder farmers (<0.5ha) who practice manual irrigation or rely on ad hoc solutions to irrigate a small plot of land over a short period of time (e.g. pump rentals), but who could increase their productivity if introducing mechanized irrigation. For these farmers, a micro solar pump means less work and the possibility to irrigate longer into the dry season or to irrigate at all. For those farmers the estimated payback period stands roughly at 1.5 years, which is relatively quick but the large majority of farmers do need a credit solution to avail the investment.
Table 11. Indicative prices of solar vs. alternative pump technologies (US$)91
POWER (HP) POWER SOURCE RETAIL PRICE PRICE PER HP
Micro solar pumps
0.1
DieselElectrical
SolarTreadle (manual) pump
N/AN/A650100
N/AN/A
6,500–
Futurepump, a pioneer in micro solar pumps
The Futurepump SF1 is a 0.1HP surface pump (80W panel) with a flow of max. 12,000 liters a day, over 0.1ha (using water parsimoniously – i.e. not appropriate for paddy or flood irrigation). The pump is portable and has a retail price of US$650 (trade prices available), including panel, inlet pipe and 2-year warranty (with well-established distributors).
The pump is manufactured in India (100% tailored components), and commercialized B2B via local distributors (e.g. companies that have distribution channels and financing facilities, or agro distribution companies) – so far in Uganda, Ethiopia, Zambia, Nepal and Rwanda. Futurepump sold 1,700 units globally over the last 6-8 months and sales are increasing, including repeat orders.
The SF1 pump design philosophy is to produce the ‘bicycle’ of pumps – simple, robust, small, maintainable, and position it in the same markets as small diesel/petrol pumps. The rationale was to develop a solution for an untapped market (for whom larger or more sophisticated solar pumps is out of reach), with a plug-and-play solution that can be assembled in 5-10 minutes and easily repaired or maintained (i.e. using existing distribution and maintenance channels).
The SF1 was initially piloted in Western Kenya for 2-3 years among 400 farmers, thanks to a PAYG scheme inspired by M-PESA (requiring 20-25% down-payment). The farmers had very small landholdings, access to water, and were growing vegetables or other cash crops. While the pumps were paid back in 95% of the cases, money collection proved to be challenging. The user base consisted in 61% farmers attempting manual irrigation (by hand or treadle pumps), 38% who used petrol pumps, and 1% diesel pumps (for reference, the cheapest fuel pump is US$250 and would last 2-3 years, including lots of maintenance issues). Performance of the SF1 is significantly less, but proved sufficient when used with tanks or drip/sprinkler irrigation systems. Most farmers could payback the pump in two growing seasons (mostly thanks to increased production).
The pump was introduced through demonstrations given there are little components, the product is easily demonstrable, and given it has such a compelling value proposition – it typically attracted a lot of interest. Lead farmers typically bought one and showed it worked for a few months. Those lead farmers would then be asked to identify 30-35 nearby farmers interested, including a few farmers that bought on cash. Futurepump also sold to companies practicing contract farming.
Futurepump expects to launch a new generation of the pump in summer 2017, although details are still under wraps.
91 Based on average price points from manufacturers such as Khaitan, Shakti, Birla, Brimatec, Kipor, Kickstart, Xilulong, Kirslokar, Crompton, Futurepump
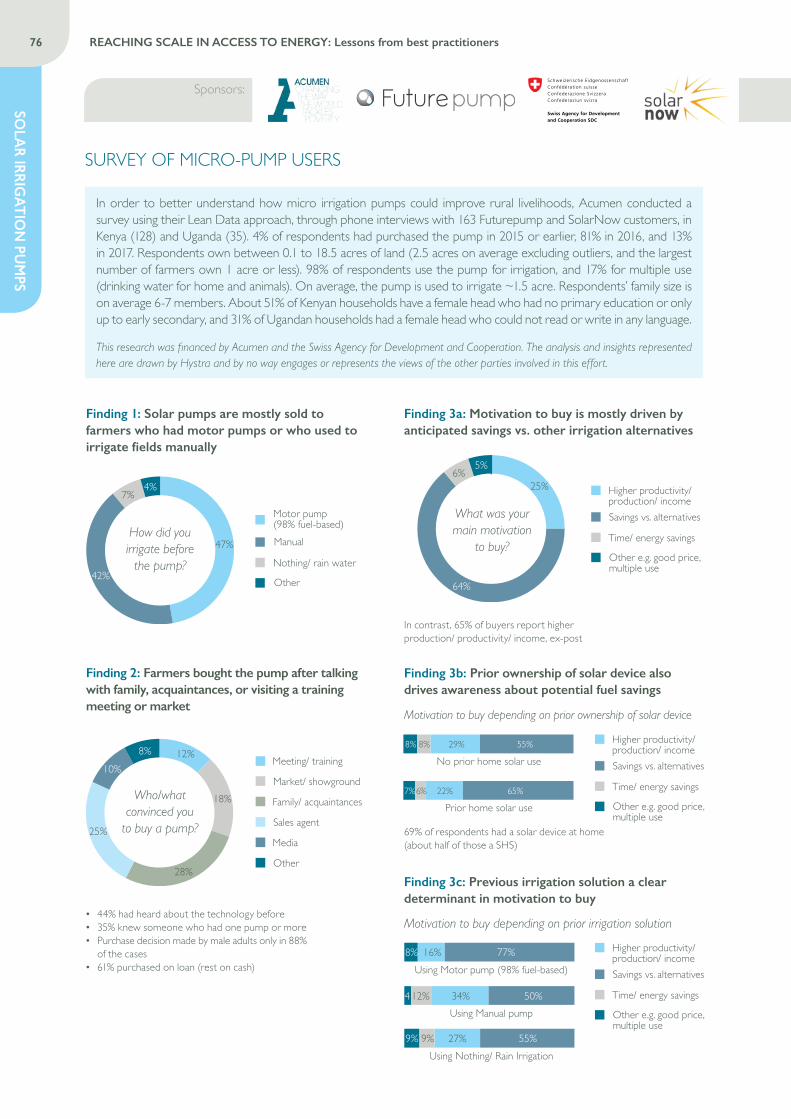
76 REACHING SCALE IN ACCESS TO ENERGY: Lessons from best practitioners
SOLA
R IRRIGAT
ION
PUM
PS
SURVEY OF MICRO-PUMP USERS
In order to better understand how micro irrigation pumps could improve rural livelihoods, Acumen conducted a survey using their Lean Data approach, through phone interviews with 163 Futurepump and SolarNow customers, in Kenya (128) and Uganda (35). 4% of respondents had purchased the pump in 2015 or earlier, 81% in 2016, and 13% in 2017. Respondents own between 0.1 to 18.5 acres of land (2.5 acres on average excluding outliers, and the largest number of farmers own 1 acre or less). 98% of respondents use the pump for irrigation, and 17% for multiple use (drinking water for home and animals). On average, the pump is used to irrigate ~1.5 acre. Respondents’ family size is on average 6-7 members. About 51% of Kenyan households have a female head who had no primary education or only up to early secondary, and 31% of Ugandan households had a female head who could not read or write in any language.
This research was financed by Acumen and the Swiss Agency for Development and Cooperation. The analysis and insights represented here are drawn by Hystra and by no way engages or represents the views of the other parties involved in this effort.
Finding 2: Farmers bought the pump after talking with family, acquaintances, or visiting a training meeting or market
• 44% had heard about the technology before • 35% knew someone who had one pump or more • Purchase decision made by male adults only in 88%
of the cases • 61% purchased on loan (rest on cash)
Meeting/ training
Market/ showground
Family/ acquaintances
Sales agent
Media
Other
12%
18%
25%
10%8%
28%
Finding 1: Solar pumps are mostly sold to farmers who had motor pumps or who used to irrigate fields manually
Motor pump(98% fuel-based)Manual
Nothing/ rain water
Other
4%7%
47%
42%
Finding 3c: Previous irrigation solution a clear determinant in motivation to buy
Motivation to buy depending on prior irrigation solution
Using Motor pump (98% fuel-based)8% 16% 77%
Using Manual pump4 12% 34% 50%
Using Nothing/ Rain Irrigation9% 9% 27% 55%
Higher productivity/ production/ incomeSavings vs. alternatives
Time/ energy savings
Other e.g. good price, multiple use
Finding 3a: Motivation to buy is mostly driven by anticipated savings vs. other irrigation alternatives
In contrast, 65% of buyers report higher production/ productivity/ income, ex-post
Higher productivity/ production/ incomeSavings vs. alternatives
Time/ energy savings
Other e.g. good price, multiple use
5%6%
25%
64%
Finding 3b: Prior ownership of solar device also drives awareness about potential fuel savings
Motivation to buy depending on prior ownership of solar device
69% of respondents had a solar device at home (about half of those a SHS)
No prior home solar use8%8% 29% 55%
Prior home solar use7%6% 22% 65%
Using Motor pump (98% fuel-based)8% 16% 77%
Using Manual pump4 12% 34% 50%
Using Nothing/ Rain Irrigation9% 9% 27% 55%
Higher productivity/ production/ incomeSavings vs. alternatives
Time/ energy savings
Other e.g. good price, multiple use
Using Motor pump (98% fuel-based)8% 16% 77%
Using Manual pump4 12% 34% 50%
Using Nothing/ Rain Irrigation9% 9% 27% 55%
Higher productivity/ production/ incomeSavings vs. alternatives
Time/ energy savings
Other e.g. good price, multiple use
Using Motor pump (98% fuel-based)8% 16% 77%
Using Manual pump4 12% 34% 50%
Using Nothing/ Rain Irrigation9% 9% 27% 55%
Higher productivity/ production/ incomeSavings vs. alternatives
Time/ energy savings
Other e.g. good price, multiple use
Sponsors:
How did you irrigate before
the pump?
Who/what convinced you
to buy a pump?
What was your main motivation
to buy?
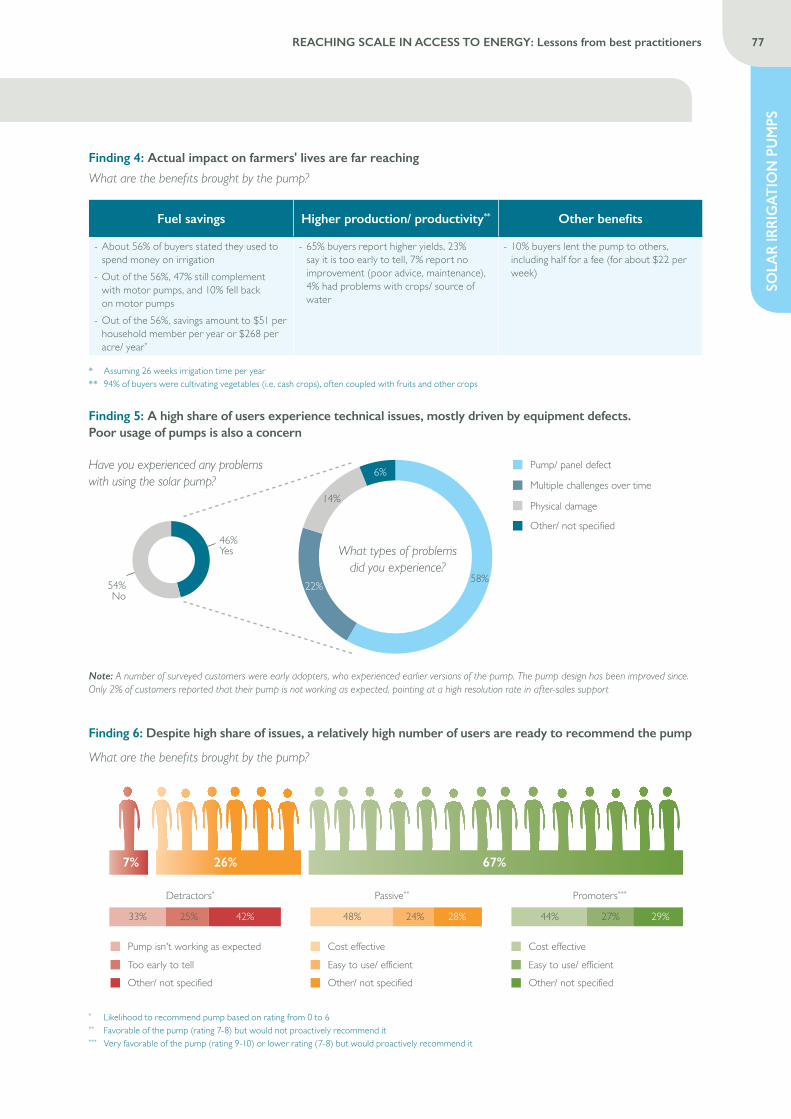
SOLA
R IR
RIG
ATIO
N P
UM
PS
77REACHING SCALE IN ACCESS TO ENERGY: Lessons from best practitioners
Finding 4: Actual impact on farmers' lives are far reaching
What are the benefits brought by the pump?
Fuel savings Higher production/ productivity** Other benefits
- About 56% of buyers stated they used to spend money on irrigation
- Out of the 56%, 47% still complement with motor pumps, and 10% fell back on motor pumps
- Out of the 56%, savings amount to $51 per household member per year or $268 per acre/ year*
- 65% buyers report higher yields, 23% say it is too early to tell, 7% report no improvement (poor advice, maintenance), 4% had problems with crops/ source of water
- 10% buyers lent the pump to others, including half for a fee (for about $22 per week)
Finding 5: A high share of users experience technical issues, mostly driven by equipment defects. Poor usage of pumps is also a concern
Finding 6: Despite high share of issues, a relatively high number of users are ready to recommend the pump
What are the benefits brought by the pump?
Note: A number of surveyed customers were early adopters, who experienced earlier versions of the pump. The pump design has been improved since. Only 2% of customers reported that their pump is not working as expected, pointing at a high resolution rate in after-sales support
* Assuming 26 weeks irrigation time per year** 94% of buyers were cultivating vegetables (i.e. cash crops), often coupled with fruits and other crops
* Likelihood to recommend pump based on rating from 0 to 6** Favorable of the pump (rating 7-8) but would not proactively recommend it*** Very favorable of the pump (rating 9-10) or lower rating (7-8) but would proactively recommend it
46%Yes
54%No
58%
14%
22%
6% Pump/ panel defect
Multiple challenges over time
Physical damage
Other/ not specified
What types of problems did you experience?
Have you experienced any problems with using the solar pump?
Pump isn't working as expectedToo early to tell Other/ not specified
Cost effectiveEasy to use/ efficientOther/ not specified
Cost effectiveEasy to use/ efficientOther/ not specified
Passive**
48% 24% 28%
Detractors*
33% 25% 42%
Promoters***
44% 27% 29%
67%26%7%
78 REACHING SCALE IN ACCESS TO ENERGY: Lessons from best practitioners
SOLA
R IRRIGAT
ION
PUM
PS
Micro solar pumps have been mostly distributed following a ‘product-in-a-box’ approach. Given the novelty of the technology, only a few thousand have been sold so far. While promising, the introduction of this technology raises a number of questions.
CHALLENGE #1: Limited margins are leaving little room for after-sales support, would it prove essential
The current players bet on the fact that minimal technical capabilities will be needed (e.g. the pumps should be sold and serviced like bicycles, i.e. standardized products that everyone knows more or less how to use and repair). However, early reports from the field indicate that selling the pump does require a deeper understanding of the farmers’ business (e.g. size, crops, possible productivity improvements) and possibly a reliable network of maintenance operators.
CHALLENGE #2: Risk of competition from cheaper copycats
Micro solar pumps are cheap and not made to last many years, hence lowering adoption barriers for farmers who are otherwise attracted to the fact the technology has no recurring fuel costs. This resembles a ‘made in China’ strategy somewhat. But the current incumbents risk to actually see ‘true’ Chinese competition soon flooding the market: given the strategy of the Chinese government to invest massively into the sector. One may wonder how long it will take before the market gets filled with cheaper copycats, displacing the current early movers such as Futurepump.
CHALLENGE #3: Unclear market potential
The size of the market for micro pumps, i.e. the number of farmers for whom this product is attractive, can be questioned, given the limited performance of the micro solar pumps (<8m water depth, only 0.1HP). Also because these pumps target farmers who, for the majority, have never used powered irrigation before and who are leap-frogging to a technology that is much less widespread and more expensive than what they know.
CHALLENGE #4: Distribution strategy
Who is best placed to offer financing and distribution? PAYG SHS distributors seeking to diversify their portfolio into productive equipment (e.g. Mobisol is currently conducting a pilot in Tanzania, SolarNow is distributing solar pumps)? Agro equipment dealers? Mini-grid operators? No clear model is emerging so far.
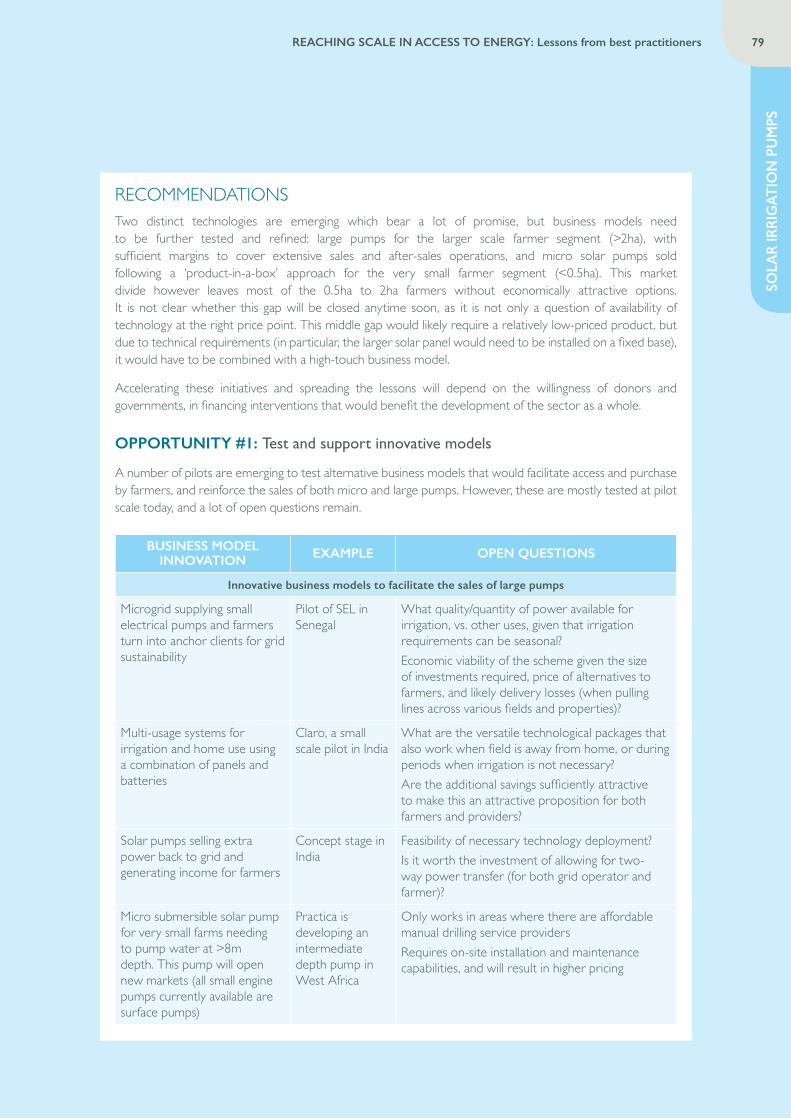
SOLA
R IR
RIG
ATIO
N P
UM
PS
79REACHING SCALE IN ACCESS TO ENERGY: Lessons from best practitioners
RECOMMENDATIONSTwo distinct technologies are emerging which bear a lot of promise, but business models need to be further tested and refined: large pumps for the larger scale farmer segment (>2ha), with sufficient margins to cover extensive sales and after-sales operations, and micro solar pumps sold following a ‘product-in-a-box’ approach for the very small farmer segment (<0.5ha). This market divide however leaves most of the 0.5ha to 2ha farmers without economically attractive options. It is not clear whether this gap will be closed anytime soon, as it is not only a question of availability of technology at the right price point. This middle gap would likely require a relatively low-priced product, but due to technical requirements (in particular, the larger solar panel would need to be installed on a fixed base), it would have to be combined with a high-touch business model.
Accelerating these initiatives and spreading the lessons will depend on the willingness of donors and governments, in financing interventions that would benefit the development of the sector as a whole.
OPPORTUNITY #1: Test and support innovative models
A number of pilots are emerging to test alternative business models that would facilitate access and purchase by farmers, and reinforce the sales of both micro and large pumps. However, these are mostly tested at pilot scale today, and a lot of open questions remain.
BUSINESS MODEL INNOVATION EXAMPLE OPEN QUESTIONS
Innovative business models to facilitate the sales of large pumps
Microgrid supplying small electrical pumps and farmers turn into anchor clients for grid sustainability
Pilot of SEL in Senegal
What quality/quantity of power available for irrigation, vs. other uses, given that irrigation requirements can be seasonal?Economic viability of the scheme given the size of investments required, price of alternatives to farmers, and likely delivery losses (when pulling lines across various fields and properties)?
Multi-usage systems for irrigation and home use using a combination of panels and batteries
Claro, a small scale pilot in India
What are the versatile technological packages that also work when field is away from home, or during periods when irrigation is not necessary?Are the additional savings sufficiently attractive to make this an attractive proposition for both farmers and providers?
Solar pumps selling extra power back to grid and generating income for farmers
Concept stage in India
Feasibility of necessary technology deployment?Is it worth the investment of allowing for two-way power transfer (for both grid operator and farmer)?
Micro submersible solar pump for very small farms needing to pump water at >8m depth. This pump will open new markets (all small engine pumps currently available are surface pumps)
Practica is developing an intermediate depth pump in West Africa
Only works in areas where there are affordable manual drilling service providersRequires on-site installation and maintenance capabilities, and will result in higher pricing
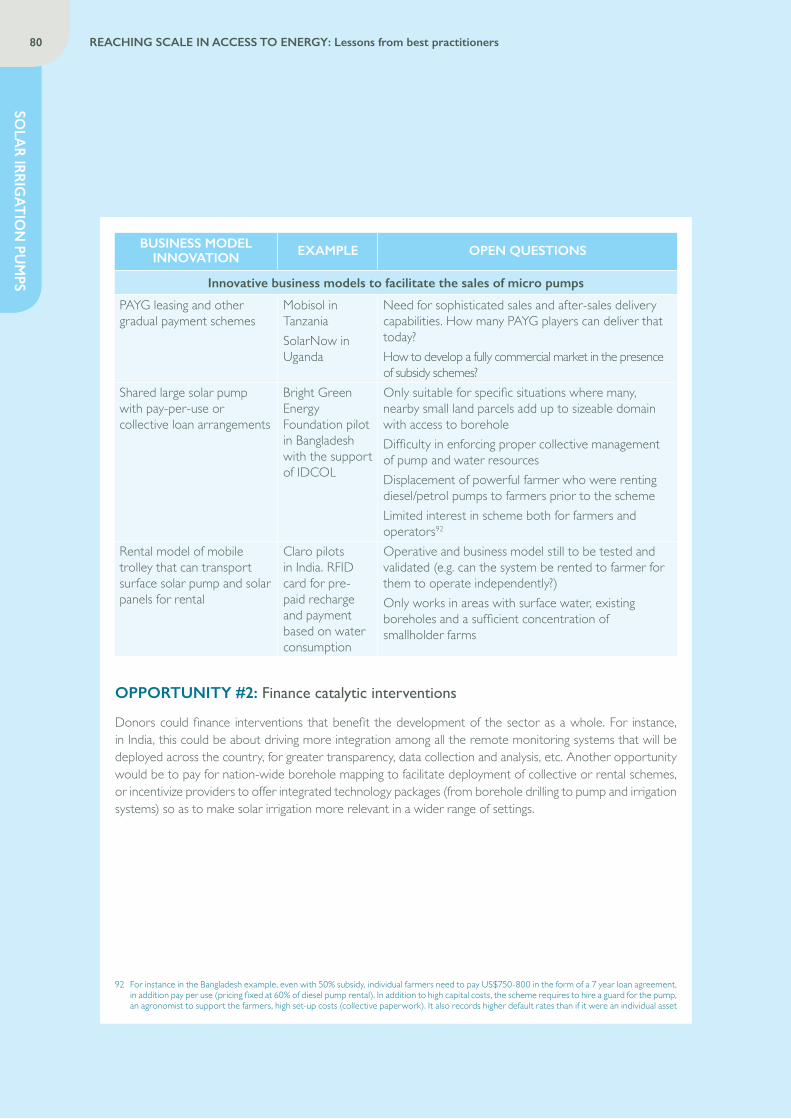
80 REACHING SCALE IN ACCESS TO ENERGY: Lessons from best practitioners
SOLA
R IRRIGAT
ION
PUM
PS
BUSINESS MODEL INNOVATION EXAMPLE OPEN QUESTIONS
Innovative business models to facilitate the sales of micro pumps
PAYG leasing and other gradual payment schemes
Mobisol in TanzaniaSolarNow in Uganda
Need for sophisticated sales and after-sales delivery capabilities. How many PAYG players can deliver that today?How to develop a fully commercial market in the presence of subsidy schemes?
Shared large solar pump with pay-per-use or collective loan arrangements
Bright Green Energy Foundation pilot in Bangladesh with the support of IDCOL
Only suitable for specific situations where many, nearby small land parcels add up to sizeable domain with access to boreholeDifficulty in enforcing proper collective management of pump and water resourcesDisplacement of powerful farmer who were renting diesel/petrol pumps to farmers prior to the schemeLimited interest in scheme both for farmers and operators92
Rental model of mobile trolley that can transport surface solar pump and solar panels for rental
Claro pilots in India. RFID card for pre-paid recharge and payment based on water consumption
Operative and business model still to be tested and validated (e.g. can the system be rented to farmer for them to operate independently?)Only works in areas with surface water, existing boreholes and a sufficient concentration of smallholder farms
OPPORTUNITY #2: Finance catalytic interventions92
Donors could finance interventions that benefit the development of the sector as a whole. For instance, in India, this could be about driving more integration among all the remote monitoring systems that will be deployed across the country, for greater transparency, data collection and analysis, etc. Another opportunity would be to pay for nation-wide borehole mapping to facilitate deployment of collective or rental schemes, or incentivize providers to offer integrated technology packages (from borehole drilling to pump and irrigation systems) so as to make solar irrigation more relevant in a wider range of settings.
92 For instance in the Bangladesh example, even with 50% subsidy, individual farmers need to pay US$750-800 in the form of a 7 year loan agreement, in addition pay per use (pricing fixed at 60% of diesel pump rental). In addition to high capital costs, the scheme requires to hire a guard for the pump, an agronomist to support the farmers, high set-up costs (collective paperwork). It also records higher default rates than if it were an individual asset
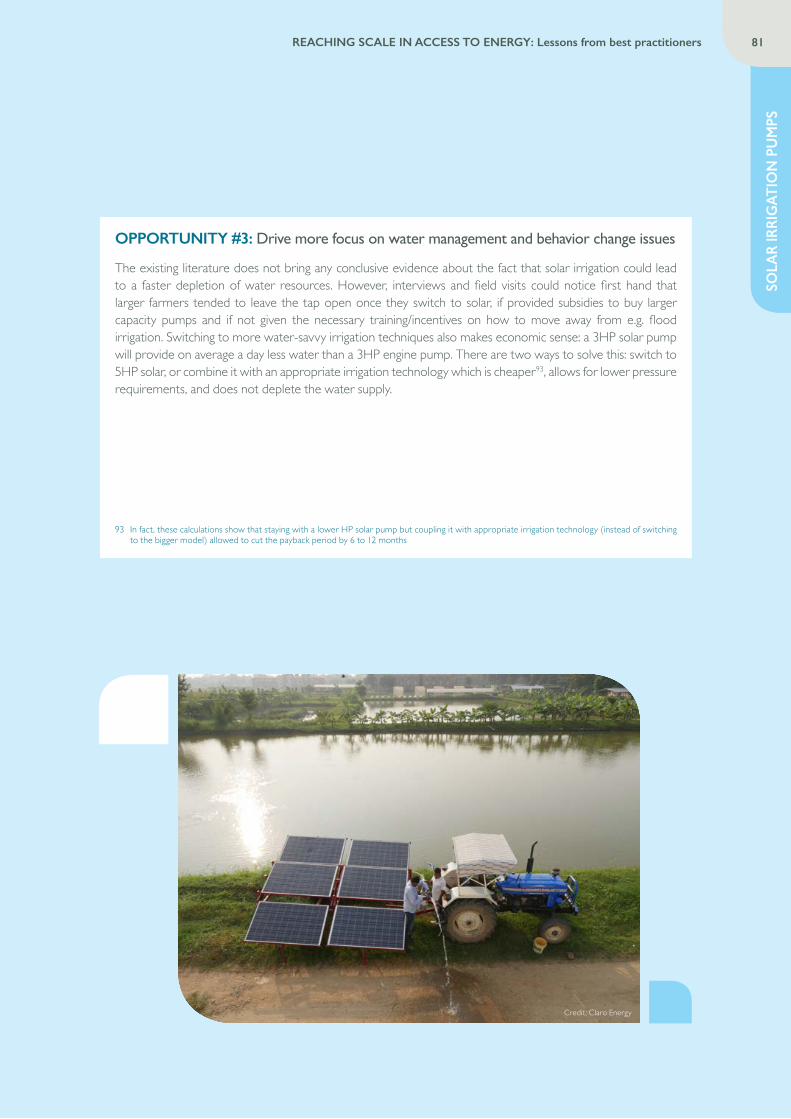
SOLA
R IR
RIG
ATIO
N P
UM
PS
81REACHING SCALE IN ACCESS TO ENERGY: Lessons from best practitioners
OPPORTUNITY #3: Drive more focus on water management and behavior change issues
The existing literature does not bring any conclusive evidence about the fact that solar irrigation could lead to a faster depletion of water resources. However, interviews and field visits could notice first hand that larger farmers tended to leave the tap open once they switch to solar, if provided subsidies to buy larger capacity pumps and if not given the necessary training/incentives on how to move away from e.g. flood irrigation. Switching to more water-savvy irrigation techniques also makes economic sense: a 3HP solar pump will provide on average a day less water than a 3HP engine pump. There are two ways to solve this: switch to 5HP solar, or combine it with an appropriate irrigation technology which is cheaper93, allows for lower pressure requirements, and does not deplete the water supply.
93 In fact, these calculations show that staying with a lower HP solar pump but coupling it with appropriate irrigation technology (instead of switching to the bigger model) allowed to cut the payback period by 6 to 12 months
Credit: Claro Energy
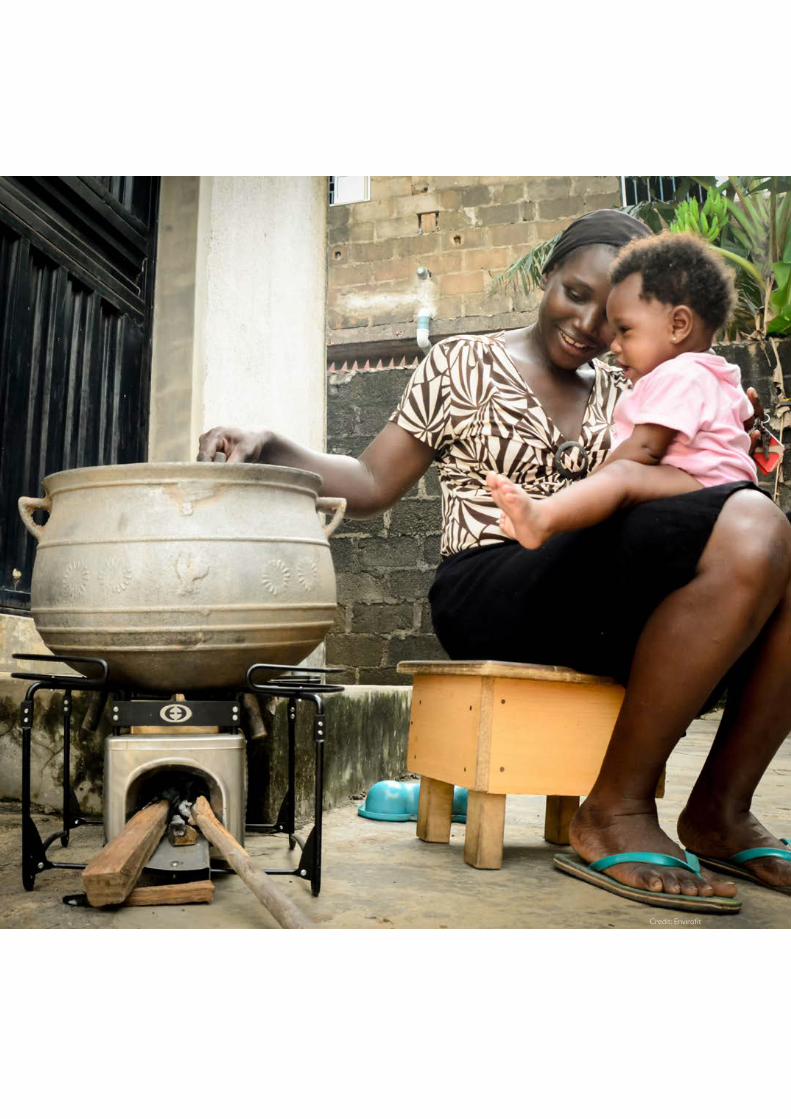
Credit: Envirofit
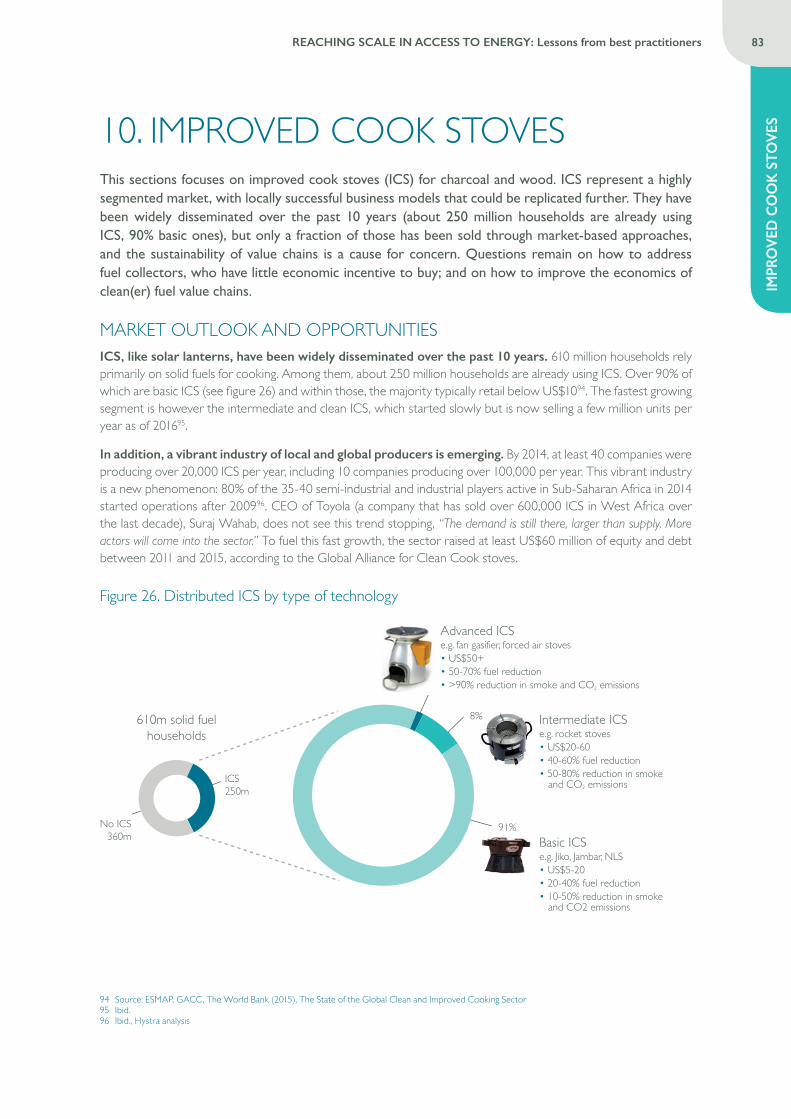
IMPR
OV
ED C
OO
K S
TOV
ES
83REACHING SCALE IN ACCESS TO ENERGY: Lessons from best practitioners
10. IMPROVED COOK STOVESThis sections focuses on improved cook stoves (ICS) for charcoal and wood. ICS represent a highly segmented market, with locally successful business models that could be replicated further. They have been widely disseminated over the past 10 years (about 250 million households are already using ICS, 90% basic ones), but only a fraction of those has been sold through market-based approaches, and the sustainability of value chains is a cause for concern. Questions remain on how to address fuel collectors, who have little economic incentive to buy; and on how to improve the economics of clean(er) fuel value chains.
MARKET OUTLOOK AND OPPORTUNITIESICS, like solar lanterns, have been widely disseminated over the past 10 years. 610 million households rely primarily on solid fuels for cooking. Among them, about 250 million households are already using ICS. Over 90% of which are basic ICS (see figure 26) and within those, the majority typically retail below US$1094. The fastest growing segment is however the intermediate and clean ICS, which started slowly but is now selling a few million units per year as of 201695.
In addition, a vibrant industry of local and global producers is emerging. By 2014, at least 40 companies were producing over 20,000 ICS per year, including 10 companies producing over 100,000 per year. This vibrant industry is a new phenomenon: 80% of the 35-40 semi-industrial and industrial players active in Sub-Saharan Africa in 2014 started operations after 200996. CEO of Toyola (a company that has sold over 600,000 ICS in West Africa over the last decade), Suraj Wahab, does not see this trend stopping, “The demand is still there, larger than supply. More actors will come into the sector.” To fuel this fast growth, the sector raised at least US$60 million of equity and debt between 2011 and 2015, according to the Global Alliance for Clean Cook stoves.
Figure 26. Distributed ICS by type of technology
Basic ICSe.g. Jiko, Jambar, NLS• US$5-20• 20-40% fuel reduction• 10-50% reduction in smoke and CO2 emissions
Advanced ICSe.g. fan gasifier, forced air stoves• US$50+• 50-70% fuel reduction• >90% reduction in smoke and CO2 emissions
Intermediate ICSe.g. rocket stoves• US$20-60• 40-60% fuel reduction• 50-80% reduction in smoke and CO2 emissions
8%
91%
ICS 250m
No ICS360m
610m solid fuelhouseholds
94 Source: ESMAP, GACC, The World Bank (2015), The State of the Global Clean and Improved Cooking Sector95 Ibid.96 Ibid., Hystra analysis
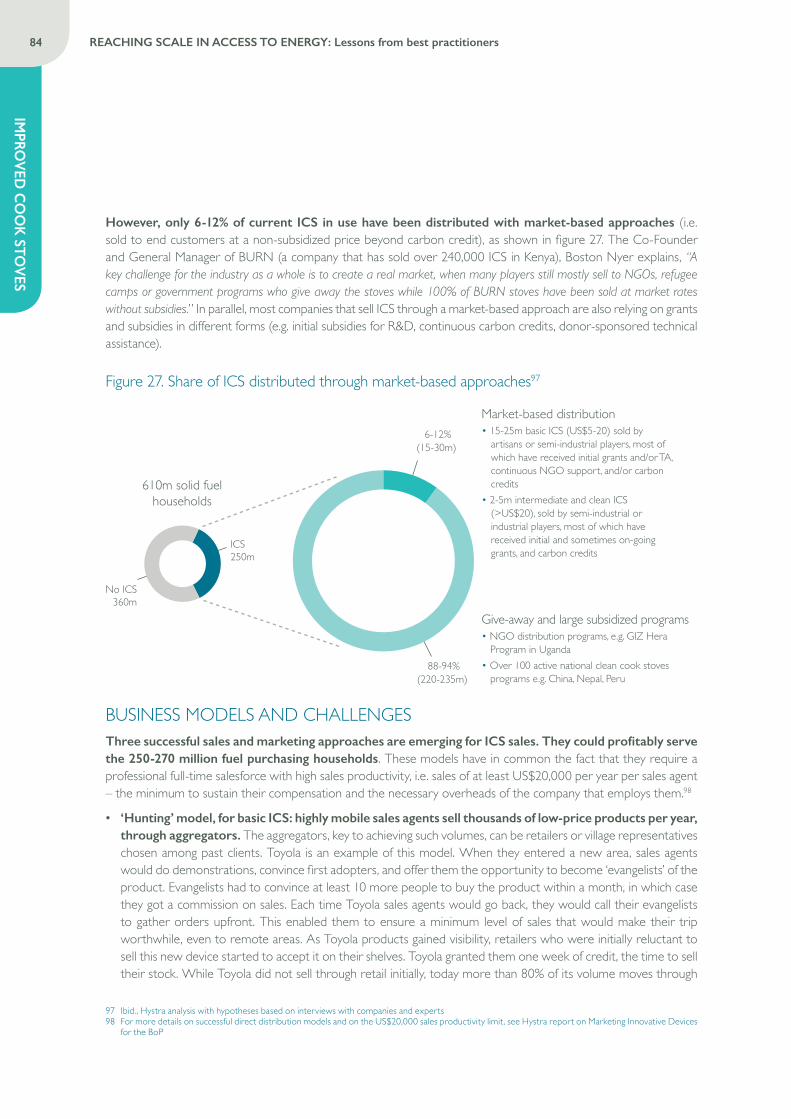
84 REACHING SCALE IN ACCESS TO ENERGY: Lessons from best practitioners
IMPRO
VED
CO
OK
STOV
ES
However, only 6-12% of current ICS in use have been distributed with market-based approaches (i.e. sold to end customers at a non-subsidized price beyond carbon credit), as shown in figure 27. The Co-Founder and General Manager of BURN (a company that has sold over 240,000 ICS in Kenya), Boston Nyer explains, “A key challenge for the industry as a whole is to create a real market, when many players still mostly sell to NGOs, refugee camps or government programs who give away the stoves while 100% of BURN stoves have been sold at market rates without subsidies.” In parallel, most companies that sell ICS through a market-based approach are also relying on grants and subsidies in different forms (e.g. initial subsidies for R&D, continuous carbon credits, donor-sponsored technical assistance).
Figure 27. Share of ICS distributed through market-based approaches97
ICS 250m
No ICS360m
610m solid fuelhouseholds
Market-based distribution• 15-25m basic ICS (US$5-20) sold by
artisans or semi-industrial players, most of which have received initial grants and/or TA, continuous NGO support, and/or carbon credits
• 2-5m intermediate and clean ICS (>US$20), sold by semi-industrial or industrial players, most of which have received initial and sometimes on-going grants, and carbon credits
Give-away and large subsidized programs • NGO distribution programs, e.g. GIZ Hera
Program in Uganda• Over 100 active national clean cook stoves
programs e.g. China, Nepal, Peru88-94%
(220-235m)
6-12%(15-30m)
BUSINESS MODELS AND CHALLENGESThree successful sales and marketing approaches are emerging for ICS sales. They could profitably serve the 250-270 million fuel purchasing households. These models have in common the fact that they require a professional full-time salesforce with high sales productivity, i.e. sales of at least US$20,000 per year per sales agent – the minimum to sustain their compensation and the necessary overheads of the company that employs them.98
• ‘Hunting’ model, for basic ICS: highly mobile sales agents sell thousands of low-price products per year, through aggregators. The aggregators, key to achieving such volumes, can be retailers or village representatives chosen among past clients. Toyola is an example of this model. When they entered a new area, sales agents would do demonstrations, convince first adopters, and offer them the opportunity to become ‘evangelists’ of the product. Evangelists had to convince at least 10 more people to buy the product within a month, in which case they got a commission on sales. Each time Toyola sales agents would go back, they would call their evangelists to gather orders upfront. This enabled them to ensure a minimum level of sales that would make their trip worthwhile, even to remote areas. As Toyola products gained visibility, retailers who were initially reluctant to sell this new device started to accept it on their shelves. Toyola granted them one week of credit, the time to sell their stock. While Toyola did not sell through retail initially, today more than 80% of its volume moves through
97 Ibid., Hystra analysis with hypotheses based on interviews with companies and experts98 For more details on successful direct distribution models and on the US$20,000 sales productivity limit, see Hystra report on Marketing Innovative Devices
for the BoP
IMPR
OV
ED C
OO
K S
TOV
ES
85REACHING SCALE IN ACCESS TO ENERGY: Lessons from best practitioners
retail, mostly as cash sales. Sales agents have become distributors managing their base of retailers. This model only works for products that require little or no credit, as sales agents are seldom on-site to make collections. Toyola does however, offer a one-month free trial, sales agents collect the money when going back to the designated area to make the next round of sales).99
• ‘Shifting cultivation’ through partners providing financing, for intermediate and advanced ICS: sales agents saturate the partner’s area, then move to the next. As intermediate and clean ICS typically cost US$25-80 and require financing (at least outside of urban areas), most companies try to sell via partners with financing capabilities, while their own sales agents still provide field support such as demonstrations and aftersales. Envirofit, BioLite and BURN have developed such partnerships with MFIs and cooperatives selling to their members, with large corporations selling to their employees or smallholder suppliers, or with PAYG SHS companies selling to their existing client base. Working through partners has its limitations however. Partnerships take a lot of (expensive) management time to take off, whether they work out or not. By definition, their reach is limited to that of the chosen partner. And maybe more importantly, these partnerships cannot be fully hands-off. They still require the ICS company to provide the necessary after sale service, or else run the risk of dissatisfied clients ruining the market with negative word of mouth.
• ‘Shifting cultivation’ with in-house loans, for intermediate and advanced ICS: sales agents saturate villages in one area, then move to the next. Some companies have instead chosen to provide loans in-house, in which case their sales agents organize their own demonstrations through opinion leaders or in public gatherings (e.g. market, public events). In addition to doing demonstration and aftersales, they use their time in the community to regularly collect payments. This solution is that of the Paradigm Project, which had sold 175,000 ICS in Kenya as of early 2016, including 40,000 through its own credit (it previously sold through partner MFIs).100
However, these successful approaches fail to spread. Today, only a few players sell beyond three thousand units per month through market-based approaches, as the two models described above. And more generally, marketing and sales best practices do not spread. An encouraging fact though, is that one of these best practices is starting to generalize: even companies that sell through partners are now realizing the importance of after sale and are setting up customer care services.
CHALLENGE #1: Further barriers remain on the manufacturing and financing side for local players.
Local artisans (manufacturing basic ICS) struggle to reach scale as they fail to industrialize, for the largest part due to a lack of capabilities. Many of these artisans would not know how to structure and run a larger business, Toyola being the exception that confirms the rule. For those with a real business acumen, lack of financing remains a major issue. They typically need loans of tens to hundreds of thousands of dollars in local currency that no one is ready to fund. The loan is too large for microfinance organizations; seen as too risky by local banks, wary of lending to these small, mostly informal local businesses; and too small for international investors who rarely provide local currency loans anyway.101
99 Ibid.100 Ibid.101 Toyola received early on loans from E+Co, the first impact investment fund in access to energy that no longer exists. The first loan allowed them to buy their
first truck and start the « hunting » sales model described above, that made their success
Interview with Jessica Alderman, Director of Communications, Envirofit
Envirofit is expanding its model to invest in field operations, piloting direct sales models in Kenya and India, and setting up consumer care services across Latin America and East Africa. What explains the recent changes in your business model?
“This is more an adjustment than a complete shift. Using the hybrid model allows us to maintain a closer relationship with our customers, better understand them, ensure they are satisfied, and build our brand. However, building a vast sales network is costly and difficult to manage at scale. It is only though partnerships and working with businesses who can reach different markets beyond our sales network, that we will truly be able to achieve a large scale impact.”
86 REACHING SCALE IN ACCESS TO ENERGY: Lessons from best practitioners
IMPRO
VED
CO
OK
STOV
ES
CHALLENGE #2: Global and local industrial producers (intermediate and clean ICS) also face financing challenges, plus VAT and tariff issues.
Those manufacturers have high working capital needs, as the delay between their order and payment of ICS (or parts of stoves) sales often reach over 6 months. This is further exacerbated for those who provide loans in-house, who then need a few additional months to recoup the money from their sales. As Boston Nyer explains, “A few industrial players are starting to need money to scale up, in particular flexible working capital, e.g. US$1-5 million per company. But few investors seem to offer this type of capital.” In addition, industrial producers struggle with taxes and tariffs, as only few countries have exempted ICS or their parts from taxes. Jan de Graaf from BioLite explains, “VAT (or the absence thereof) completely determines our viability.”
CHALLENGE #3: The 350 million households who are pure fuel collectors and hence do not pay for fuel, have barely been reached by market-based approaches.
These households have little economic incentive to purchase an ICS. Throughout Hystra’s cross-sector research, the same conclusion emerges: even with fantastic health or other social benefits, durable products that bring no or limited economic incentive are a very hard sell, as households have to forego other expenses to make such a purchase. Julien Jacquot, Stove+ Program manager at GERES, an NGO that has supported the sector of ICS for over 20 years, confirms: “Economic benefits are a key factor for purchase. In Cambodia, we have seen sales of charcoal ICS increase in 2011 when gas prices increased and forced households to go back to charcoal. In Ghana or in Mali, where charcoal is very expensive, the economic benefits of charcoal ICS explain their success.” Twelve ICS organizations featured in this report or interviewed over the past few years all confirmed the difficulty of convincing fuel collector households, over fuel purchasers.102 All recognized that the overwhelming majority of their users, if not all, were at least partial fuel purchasers. This does not mean that reaching fuel collectors with market-based approaches is impossible – but new approaches remain to be crafted that achieve this at scale.
CHALLENGE #4: Clean fuel supply chains – to replace traditional solid fuels – are emerging but have yet to find a sustainable model at scale.
Supply chains that produce traditional fuels in a more environmentally friendly way, such as firewood or charcoal from sustainable forests, or charcoal prepared in a more environmentally friendly way, struggle to compete with informal wood/charcoal supply chains. As Boston Nyer explains, “Charcoal is mostly made illegally here, by people who do not pay for the wood – so it’s difficult to compete on price if you do things properly.” New fuels (e.g. pellets, briquettes, bioethanol) in addition to competing on price, face behavior change barriers, even more so if coupled with a new ICS. New fuels at similar or lower prices than their traditional alternative—briquettes sold by Green BioEnergy in Uganda and the pellets of First Energy in India—have had some level of success with industrial or commercial clients (e.g. restaurants and hotels), even if they required some behavior change. Indeed, in the case of restaurants or hotels, the owners have a very strong financial incentive to switch fuel. And they do not bear the behavior change consequences of this switch– their cooks do. This explains why these markets have proved easier to capture. But such new fuels continue to struggle to find a sustainable model to serve individual BoP households. Even if the required behavior change is minimal, e.g. a different light-up (combustion?) delay or no visible reddening of the briquettes or pellets once hot, this has proven enough to deter clients from adopting the new fuel for the long term.
102 These include case studies featured in this report, and companies that Hystra has worked with or interviewed (in alphabetical order) BioLite in East Africa, BURN in East Africa, Biso na Bino in DRC, D&E Green Entreprises in Haiti, Estufa Doña Dora in Guatemala, Envirofit globally, First Energy (previously BP Oorja) in India, GERES in Cambodia, GreenBioEnergy in Uganda, Halt Bank in DRC, The Paradigm Project in Kenya, and Toyola in West Africa
IMPR
OV
ED C
OO
K S
TOV
ES
87REACHING SCALE IN ACCESS TO ENERGY: Lessons from best practitioners
FOCUS: Why has the ICS market not developed as fast as the solar lantern one?
In Hystra previous report on energy access, in 2009, ICS and solar lanterns had been grouped into one cluster of ‘clean energy devices’. At this time, both industries were at relatively similar levels of development: a few global players emerging, a lot of investment into R&D to create locally adapted products for less than US$50, and commercial sales of a few hundred thousand units for the largest players. Today, solar lanterns leaders like d.light and Greenlight Planet have sold over 10 million units, while only Envirofit has crossed the 1 million unit cap in the ICS market, which remains fragmented and largely driven by subsidies. How to explain such difference?
1) The unique fragmentation of cooking habits makes the ICS market more complex to serve
Cooking is culture-specific: people will not buy a product that does not cook easily the local staple food, with the same taste. This means that all ICS need to adapt to geographies and fuels, requiring significant investment to create a product that will only serve one market, as opposed to solar lanterns. This has forced companies to raise donor money in order to fund R&D, and design multiple products meeting the cultural requirements of consumers in various regions (e.g. Envirofit has developed adapted products for Asia, Africa and Latin America); sometimes doing it one market at a time (e.g. BURN focused first on charcoal ICS in Kenya, then on expansion in the region, and on a firewood ICS). This might explain why fewer global players have emerged in the ICS space than in the lighting space: the global market is simply more complex and the market potential for each product much smaller than that of a globally acceptable solar light.
2) Marketing ICS has often proved more complex than marketing lanterns
First, the majority of solid fuel users are fuel collectors who have little economic reason to buy an ICS, leaving ICS marketers deprived of their most convincing argument. Second, ICS benefits are less visible and tangible than those of solar lights, in two ways: (i) solar lights benefits are immediate and literally glaring, when compared to candles of kerosene lamps, while ICS benefits take time to show – at least the time to cook! –, and are not obvious in the main function of the ICS: a good ICS will cook as well as the previous one, while benefits will accrue (mostly) in terms of reduced smoke. (ii) Even though for fuel purchasers, ICS often pay back in fuel savings faster than solar lights, these savings are again less obvious: solar lanterns eliminate the need to purchase lighting fuel, while ICS reduce fuel expenses. It can hence be necessary to demonstrate this gain with further marketing tools. For example, Toyola provided its clients with a ‘Toyola box’, a piggybank in which sales agents advised clients to place their charcoal money every time they did not spend it. This allowed clients to see for themselves how much they were saving over time. This longer time needed to prove the products’ benefits means that the sales cycle to saturate an area with ICS will logically be longer than that needed for lanterns; that sales agents for ICS will need more time to become successful than solar light ones, and hence are more likely to get discouraged and leave. Taken together, this makes the task of selling these products more complicated, and the likelihood of a company succeeding in selling those products sustainably, thinner. This might explain why no company in the ICS space has yet reached the scale of the leaders of the solar light industry, who sell several million lanterns per year each. Their turn will probably come, but this will require a bit more patience.
3) VAT and tariffs exemptions have developed more rapidly for solar lanterns
As Ethan Kay, Managing Director Emerging Markets at BioLite, explains “One major barrier to scale is on the regulatory side. Import tariffs and VAT are substantially higher in Sub-Saharan Africa and India for cook stoves than for solar lanterns – even though cook stoves have greater health and climate impact. These taxes fundamentally skew the viability of clean cook stoves for low income households.”
88 REACHING SCALE IN ACCESS TO ENERGY: Lessons from best practitioners
IMPRO
VED
CO
OK
STOV
ES
RECOMMENDATIONSShort-term opportunities could help scale up existing approaches selling ICS to fuel purchasers, while longer term endeavors should focus on alternative fuels and cracking the market for fuel collectors (or finding non-market based ways to reach them while ensuring they use their ICS). Helping scale models that work is the ‘low-hanging fruit’ that would already allow to bring economic savings and health benefits to 260 million people. However, the remaining majority of solid fuel users, and fuel collectors, should not be forgotten. Finding a way to reach them effectively and efficiently would yield tremendous health and environmental impacts, justifying long-term efforts. Similarly, vast opportunities for impact lie with replacing current solid fuels with clean ones – and the potential market for those is an order of magnitude larger than that of ICS. While market-players as well as , NGOs, donors and investors, all have key roles to play in realizing these short-term opportunities, longer term ones require more research and probably more donor involvement are required before viable business opportunities emerge for the longer term.
SHORT-TERM OPPORTUNITY #1: Scale up artisanal or semi-industrial local players
• Artisans/companies selling ICS below US$20-25 could replicate the ‘hunting’ model described above • Donors and NGOs could help the sector professionalize and consolidate by:
- Providing technical assistance to local companies to learn from each other and replicate best practices. As an example, GERES has been organizing yearly workshops since 2014, called “Stove+ Academy”, that gather ICS entrepreneurs in various regions of the world (local and global players) for peer-to-peer sharing of best practices. These lead to very practical and ‘implementable’ discussions, around design and manufacturing (e.g. techniques to manufacture ceramic liners), value chains (e.g. how to select and negotiate with international suppliers), distribution models (e.g. how to build and adapt sales pitch to various segments), etc.
- Coupling such technical assistance with financing support for selected entrepreneurs, to serve their needs for growth (for industrialization and working capital) unanswered by MFIs, investors and banks (e.g. US$50-100,000 per entrepreneur). This is for example the approach of Adam Smith International in DRC, (sponsored by DFID) supporting clean energy players with both technical assistance on their marketing and sales strategy, and financial support to implement it
- Collaborating with Investors investors could collaborate with donors and NGOs on the approaches proposed above, e.g. to create their pipeline of future investments.
IMPR
OV
ED C
OO
K S
TOV
ES
89REACHING SCALE IN ACCESS TO ENERGY: Lessons from best practitioners
SHORT-TERM OPPORTUNITY #2: Accelerate the sales of higher end-ICS that require customer financing plus service (semi-industrial and industrial companies)
• Companies selling such ICS should test direct sales, i.e. the ‘shifting cultivation with in-house loans’ model; or at least set up appropriate customer care service for their distributors if they opt for the ‘shifting cultivation through partners’ model
• Donors and/ or large corporations could make use of their lobbying power to help lower regulatory barriers/ and taxes (import, VAT)
• Investors could provide working capital to producers (to overcome long custom delays) and distributors (so they can provide financing in-house), preferably in local currency
• Donors could provide funding for technical assistance on marketing and distribution to these companies, as well as funding to run the pilots of the ‘shifting cultivation’ approaches proposed above; and set up financing mechanisms (e.g. guarantees) to partially de-risk working capital loans in local currency for investors.
LONG-TERM OPPORTUNITY #1: Explore options to disseminate ICS to fuel collectors in a way that ensures true product adoption and regular usage
• Donors could fund studies that would draw lessons from past experiences on most effective and cost-efficient approaches to distribute clean cook stoves to fuel collectors, including subsidized approaches.103 It would be key not to assimilate effectiveness to the number of distributed ICS per initiative per year, but rather the number of adopted ICS104. Similarly, the cost efficiency should be computed as the cost per adopted ICS, not cost per distributed ICS
• Donors could fund the exploration of new models to promote ICS, learning from other sectors that similarly promote behaviors with social, health and environmental impact, but without economic benefits. For example, it would be of benefit to test the demand for ICS when opportunity costs are made tangible (e.g. under conditional cash transfers). Another sector whose experience could apply to ICS is Water, Sanitation and Hygiene (WASH). For example, BRAC WASH program in Bangladesh used peer pressure coupled with differentiated pricing, has led millions of households to purchase a toilet. Water filter distributors have also successfully leveraged aspirations to sell their product, e.g. Hydrologic in Cambodia.105
103 As such approaches have so far been subsidized, they were out of the scope of this research104 As seen throughout this research, government or heavily subsidized programs distributing ICS have often resulted in low adoption rates. 'The State
of the Global Clean and Improved Cooking Sector' sums it up “The distribution of improved or clean stoves will often be insufficient to guarantee impact without investment in behavior change“
105 For more details on BRAC WASH and Hydrologic Cambodia, see Hystra report on Marketing Innovative Devices for the BoP
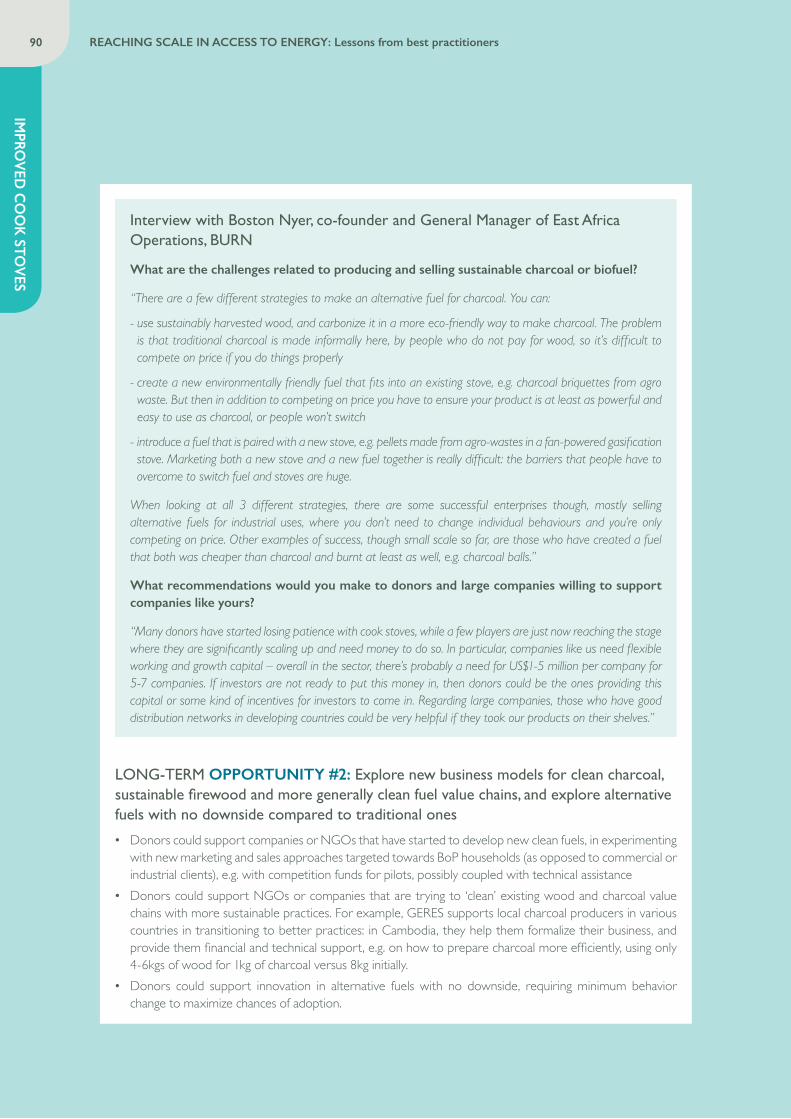
90 REACHING SCALE IN ACCESS TO ENERGY: Lessons from best practitioners
IMPRO
VED
CO
OK
STOV
ES
Interview with Boston Nyer, co-founder and General Manager of East Africa Operations, BURN
What are the challenges related to producing and selling sustainable charcoal or biofuel?
“There are a few different strategies to make an alternative fuel for charcoal. You can:
- use sustainably harvested wood, and carbonize it in a more eco-friendly way to make charcoal. The problem is that traditional charcoal is made informally here, by people who do not pay for wood, so it’s difficult to compete on price if you do things properly
- create a new environmentally friendly fuel that fits into an existing stove, e.g. charcoal briquettes from agro waste. But then in addition to competing on price you have to ensure your product is at least as powerful and easy to use as charcoal, or people won’t switch
- introduce a fuel that is paired with a new stove, e.g. pellets made from agro-wastes in a fan-powered gasification stove. Marketing both a new stove and a new fuel together is really difficult: the barriers that people have to overcome to switch fuel and stoves are huge.
When looking at all 3 different strategies, there are some successful enterprises though, mostly selling alternative fuels for industrial uses, where you don’t need to change individual behaviours and you’re only competing on price. Other examples of success, though small scale so far, are those who have created a fuel that both was cheaper than charcoal and burnt at least as well, e.g. charcoal balls.”
What recommendations would you make to donors and large companies willing to support companies like yours?
“Many donors have started losing patience with cook stoves, while a few players are just now reaching the stage where they are significantly scaling up and need money to do so. In particular, companies like us need flexible working and growth capital – overall in the sector, there’s probably a need for US$1-5 million per company for 5-7 companies. If investors are not ready to put this money in, then donors could be the ones providing this capital or some kind of incentives for investors to come in. Regarding large companies, those who have good distribution networks in developing countries could be very helpful if they took our products on their shelves.”
LONG-TERM OPPORTUNITY #2: Explore new business models for clean charcoal, sustainable firewood and more generally clean fuel value chains, and explore alternative fuels with no downside compared to traditional ones
• Donors could support companies or NGOs that have started to develop new clean fuels, in experimenting with new marketing and sales approaches targeted towards BoP households (as opposed to commercial or industrial clients), e.g. with competition funds for pilots, possibly coupled with technical assistance
• Donors could support NGOs or companies that are trying to ‘clean’ existing wood and charcoal value chains with more sustainable practices. For example, GERES supports local charcoal producers in various countries in transitioning to better practices: in Cambodia, they help them formalize their business, and provide them financial and technical support, e.g. on how to prepare charcoal more efficiently, using only 4-6kgs of wood for 1kg of charcoal versus 8kg initially.
• Donors could support innovation in alternative fuels with no downside, requiring minimum behavior change to maximize chances of adoption.
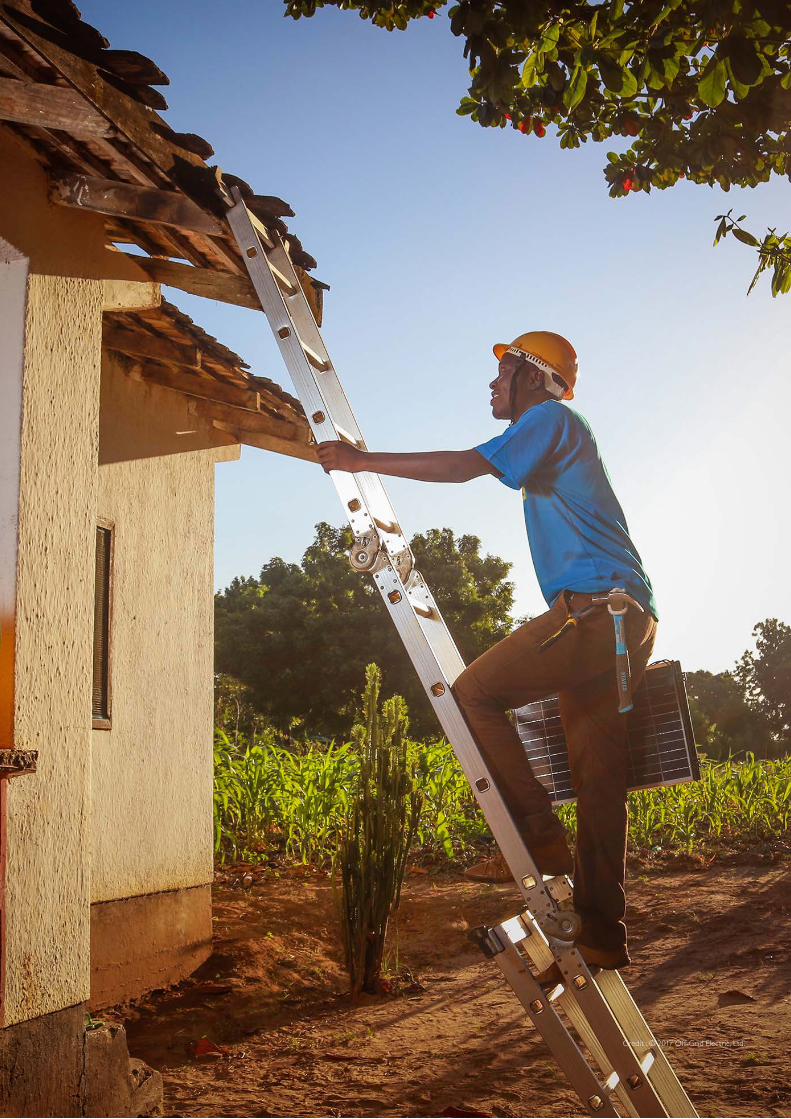
Credit : © 2017 Off-Grid Electric, Ltd.
92 REACHING SCALE IN ACCESS TO ENERGY: Lessons from best practitioners
CO
NC
LUSIO
N
11. CONCLUSIONThis report looked at very different solutions, serving specific segments and needs. Because they stand at various stages of maturity, each solution is confronted with unique growth challenges and opportunities. However, presented in this conclusion are three transversal insights, relevant across the board.
There are multiple dimensions to achieving ‘scale’. Addressing all of them can represent a stretch, and requires diverse and often holistic approaches
These different dimensions of scale could be summarized by the following questions to practitioners:
• How many people are you reaching? This is the most obvious dimension of scale. More than one billion people still do not have access to electricity, and about three times as many to harmless cooking facilities. So there is still an urgent need to identify and promote sustainable solutions, which can reach large numbers of people quickly.
• Are you reaching the population segments with the greatest need? Not all potential customers are equally easy to address. For example, competition of off-grid solar players is fierce among the emerging middle class in West Kenya – but only a few organizations have ventured to serve the lowest-income population in remote rural areas of West Africa.
• Are your distribution channels sustainable and replicable? Purchasing large bulk orders of cooking and lighting devices for giveaways programs is certainly a quick path to large impact. However, this is not enough and may even be counterproductive for solving core distribution and service challenges, which are limiting the expansion of energy access solutions.
• How are your solutions solving the problem in terms of uses enabled and value created? Intensity is critical to energy access. Selling one million solar lanterns is not the same as selling one million SHS or connecting one million families to microgrids. If lanterns are superior to candles or kerosene lamps, they are only a first step up the development ladder. SHS are more aspirational and may support small productive uses, whilst microgrids are capable of meeting even greater demand.
Addressing these multiple dimensions will require diverse and often holistic approaches:
• Practitioners looking for long-term competitive advantages will need to sell more than sophisticated products. They will need to develop value propositions reaching customers who are not reached otherwise, build innovative distribution models and partnerships, and offer solutions that can ‘grow’ with their customers’ needs.
• Investors looking for energy champions on sustainable growth paths will need to integrate the multiple dimensions of scale in their due diligences and milestones, and prioritize commercial discipline, profitability, and reliability of customer service over short-term expansion.
• Donors looking for catalytic interventions will need to extend their focus beyond the expansion of current models, support experimentation and innovation with the potential to improve (or disrupt) models, and set up targeted interventions for underserved areas and populations.
• Governments looking to promote clean energy access will need to integrate cleaner off-grid and microgrid solutions into their national energy policies. Consequently they must extend their focus beyond number of connections, promote a mix of evolving solutions, and develop adequate regulations.
CO
NC
LUSI
ON
93REACHING SCALE IN ACCESS TO ENERGY: Lessons from best practitioners
Great technologies are not enough: customer satisfaction, driven by high investments in customer care, is and will remain the key lever to sustainable growth
Continuous improvements in technologies have enabled market-based approaches to address low-income segments previously out-of-reach. They play a role at three levels:
• Improving product offering to the end-user, e.g. with continuous improvement in cost and brightness of solar products, or with the development of cook stoves that are increasingly affordable, efficient in fuel, and convenient to use
• Opening financing opportunities, e.g. by leveraging mobile payments and remote shut off technologies to develop PAYG value propositions that lower the investment risks for customers
• Increasing monitoring cost-efficiency, e.g. through sophisticated sales management and CRM apps for product distributors, or the development of smart meters and remote control technologies for microgrid companies.
However, technology alone is not enough. Angaza Design, a leader in the development of smart payment technologies for solar companies explains, “Our client companies should not be seen as just pure tech startups, as they need to rely on very strong teams on the ground.” There are multiple examples where overreliance on technology led solar lantern companies to bet too much on product instead of customer perception; PAYG companies to underestimate the risk of default; ICS companies to underinvest in behavior change; solar pump companies to underestimate servicing and maintenance costs; or microgrid operators building state-of-the-art networks without enough field engagement.
Successful organizations providing energy access need more than great products and financing solutions. They need strong customer care driven organizations to unlock the following barriers:
• Affordability: the affordability issue cannot be simply bypassed through credit or instalments, or it often backfires. Continuous engagement is needed to help customers build on the extended benefits of their purchase (e.g. time and fuel savings, income opportunities) to progressively “move up the ladder”
• Access: even though the awareness battle has been won in many areas, most people simply do not have the opportunity to buy, or to buy in the right conditions. A stable sales force, willing to invest in developing remote areas, or extended distribution channels are needed
• Reliability: for low-income families, committing to a SHS, a pump, or a microgrid connection represents a major investment decision for which they need to be reassured, for instance by checking with their neighbors. Reliability (and perception) can only be delivered with visible, and available aftersales and guarantee support organizations.
All in all, reaching scale in energy access will require investment in strong relationships with satisfied customers, as only they can drive the necessary word-of-mouth, loyalty, and repeat sales.
94 REACHING SCALE IN ACCESS TO ENERGY: Lessons from best practitioners
CO
NC
LUSIO
N
The ‘green ocean’, i.e. the hundreds of millions of low-income rural families that could be reached by cleaner energies, remains largely untapped by market-based approaches and calls for more action from companies, donors and governments
Across energy access solutions, the overwhelming majority of initiatives are focused on urban, peri-urban, and dense rural areas. Large segments remain unaddressed:
• 350-360 million solid fuel collector households remain without access to efficient cooking equipment. Except for the privileged ones who can afford to buy collection as a service from their less well-off neighbors, and the lucky ones who benefitted from give-away programs, these households send women or girls for 30-90 minutes per day on collection duty.106
• 130-170 million un-electrified households (strong overlap with fuel collectors) cannot buy solar systems in good conditions or cannot afford them. Distributors of lanterns are reluctant to enter remote areas: it is too costly for the time of an itinerant sales person, and the lack of cash means that the likely sales volume on the first visits will be small. In parallel, these households –because of their isolation– cannot rely on swift repairs or replacement if any equipment breaks down unexpectedly.
If you are part of the rural poor, you suffer a significant health penalty, and there is little likelihood that a company will come knocking at your door. Innovative distribution models targeting specifically rural areas are emerging (e.g. partnerships with rural cooperatives, direct distribution models with tactical pricing, nanogrids) but haven’t proven their ability to replicate at a significant scale yet. It is unlikely that individual companies will be able to overcome these obstacles in the near future without support. It is also unlikely (and would be uneconomical) that these areas would be targeted by the grid anytime soon.
So, if there is a clear need to continue fostering market-based approaches and consolidating business models for the ‘easiest’ customer segments, the rural poor should not be forgotten. For them, donors, governments, but also large companies have a role to play:
• The few large companies which have extended their network into the most remote areas (e.g. FMCG companies, or agro companies buying from smallholder farmers) are in a unique position to leverage their reach to build distribution and aftersales logistics networks, and possibly turn the unattractive customer segments into addressable markets.
• Donors and governments could help address these underserved population segments. Ongoing subsidies may be required, while one-off grants should be preferred in the easiest markets where commercial viability has been demonstrated):(i) at the micro-level, donors could for instance support local rural distributors with smart funding and technical
assistance, and promote pilots of innovative models e.g. nanogrids;(ii) at the meso-level, donors and governments could set up result-based financing programs targeting remote
areas, build public-private partnerships, or collaborate with other development programs e.g. to free up time for rural children and mothers and increase the opportunity costs of fuel collection, i.e. monetizing the time spent by women and children collecting wood or biomass fuel
(iii) at the macro-level, governments could build regulations and policies that encourage the development of off-grid and microgrid solutions in remote areas, e.g. Uttar Pradesh’s microgrid policy which provides subsidies to government-selected sites only.
106 Source WHO 2006
REACHING SCALE IN ACCESS TO ENERGY: Lessons from best practitioners 95
ABOUT SPONSORSThe Asian Development Bank is celebrating 50 years of working towards an Asia and the Pacific region that is free of poverty. ADB is committed to continuing this task by promoting inclusive and sustainable growth, and regional integration. Based in Manila, ADB is owned by 67 member-countries. Its main instruments for assisting developing member countries are policy dialogue and reform, sovereign and non-sovereign loans, equity investments, guarantees, grants, and technical assistance. ADB’s “Energy for All” Initiative began as a response to persistent, widespread energy poverty in the developing countries of Asia and the Pacific. Energy for All helped ADB increase its investments in energy access by increasing the number of modalities it can support energy access solutions, and by offering services to the private sector such as business development support, investment facilitation, and dissemination of best practices. Energy for All focuses on community-level and productive use interventions that can be scaled and replicated across the Asia Pacific region. This includes incubating and developing social enterprises that provide the poor the energy services they need; developing mini and micro grid solutions to reach off-grid communities; and working with development partners to leverage resources and increase impact.
The Inclusive Business Action Network (IBAN) is a global action platform supporting the scaling and replication of inclusive business models. It provides a platform for evidence-based and analytical knowledge on inclusive business models, a global IB directory, generates and facilitates partnerships that advance inclusive business solutions and conducts peer learning to build capacity on inclusive business practices. Supporting multi-stakeholder collaborations and experts research to draw from practitioners insights, lessons learnt and experiences, as in the case of the “Access to Energy Study”, is at IBAN’s core mission to advance inclusive business. IBAN is currently being financed through the German Ministry for Economic Cooperation and Development and the European Union.
responsAbility Investments AG is one of the world’s leading asset managers in the field of development investments and offers professionally-managed investment solutions to private, institutional and public investors. The company’s investment solutions supply debt and equity financing predominantly to non-listed firms in emerging and developing economies. responsAbility finances renewable energy, energy efficiency and energy access projects for SMEs and private households in developing countries, with organizations active in the energy access value chain being a key focus.
Scaling Off-Grid Energy is a global partnership founded by the U.S. Agency for International Development, Power Africa, the U.K. Department for International Development’s Energy Africa campaign, and the Shell Foundation. The Grand Challenge for Development aims to extend energy access to 20 million households across sub-Saharan Africa through off-grid household solar solutions.
Schneider Electric is the global specialist in energy management and automation. With revenues of ~€25 billion in FY2016, our 144,000 employees serve customers in over 100 countries, helping them to manage their energy and process in ways that are safe, reliable, efficient and sustainable. From the simplest of switches to complex operational systems, our technology, software and services improve the way our customers manage and automate their operations. Our connected technologies reshape industries, transform cities and enrich lives. At Schneider Electric, we call this Life Is On. Since 2009 Schneider Electric is dynamically engaged in providing off-grid areas with efficient, sustainable technologies that communities can maintain for years. Collaboration is key. To that end, our Access to Energy program actively involves local and global stakeholders. The collaborative efforts include: Offers and business models for the design and deployment of adequate electrical distribution offers via off-grid solutions; Impact investment funds for innovative local energy entrepreneurship; and Training en Entrepreneurship to address local skill shortage.
The Swiss Agency for Development and Cooperation (SDC) is Switzerland’s international cooperation agency within the Federal Department of Foreign Affairs (FDFA). The goal of Swiss development cooperation is that of reducing poverty and addressing global challenges. Amongst others this is meant to foster economic self-reliance, to contribute to the improvement of production conditions, and to help in finding solutions to environmental problems. Within SDC the Global Programme Climate Change and Environment division (GPCCE) supports different programmes in the fields of energy, climate change adaptation, and sustainable development. SDC is interested in identifying modes of intervention on how to engage the private sector in contributing massively to poverty alleviation. It is in particular interested in scalable businesses selling technologies with high impact for the beneficiaries, ideally in a combination of high outreach and profound depth of impact. Of special interest is the path out of poverty, i.e. should SDC interventions start with technologies providing quickly an absolute high net additional income or those with very high relative benefits.
Total is a global integrated energy producer and provider, a leading international oil and gas company, and a major player in solar energy with SunPower and Total Solar. Our 98,000 employees are committed to better energy that is safer, cleaner, more efficient, more innovative and accessible to as many people as possible. As a responsible corporate citizen, we focus on ensuring that our operations in more than 130 countries worldwide consistently deliver economic, social and environmental benefits. Since 2011, Total has been developing its off-grid solar product offering, and has already changed the lives of more than 10 million people in some forty developing countries, chiefly in Africa. For Total, being able to meet these needs is a key part of its climate strategy, as energy demand comes mainly from countries with a carbon-intensive energy mix due to their reliance on biomass and generators. This product offering, initially comprising individual solar lighting and phone charging systems, has evolved towards more comprehensive and powerful solutions, such as solar kits for powering radio and TV sets, and mini-grids for communities of 200 to 500 households. This constant expansion of the offering in off-grid energy solutions helps to meet growing needs in emerging countries.
REACHING SCALE IN ACCESS TO ENERGY: Lessons from best practitioners96
LIST OF FIGURES AND TABLESFigure 1. Energy access solutions featured in this report 13
Figure 2. Annualized prices paid by rural households across electricity solutions in East Africa (US$/year) 17
Figure 3. Segmentation of energy access solutions based on energy intensity and population density 18
Figure 4. Global electricity access potential by market segments, among 240 million off-grid and 200 million poor-grid households 20
Figure 5. Segments of solid fuel users 22
Figure 6. Global ICS potential by market segments among 610 million solid fuel households 23
Figure 7. Estimated health, environment, and development benefits of electricity access and improved cook stoves 25
Table 1. Two examples of solar lanterns 27
Figure 8. Comparison of geographic distribution between quality-verified lanterns and off-grid population 28
Table 2. Distribution channels for quality-verified solar lanterns 30
Figure 9. Compensation per sales agent among best performing distributors of solar lanterns or other innovative devices 31
Table 3. Comparison between consumer awareness and trust in solar products by country in Sub-Saharan Africa 33
Figure 10. Global cumulative sales of SHS 2010-2016 39
Figure 11. Years since inception, and scale of PAYG companies featured in this report (NB: scale estimates as of end 2016) 40
Figure 12. Breakdown of the potential market for SHS, Senegal (% of population) 42
Table 4. Add-on sales opportunities for PAYG companies 42
Figure 13. Impact of acquisition-driven management decisions on portfolio quality (observations among three PAYG companies) 43
Figure 14. PAYG SHS unit economics breakdown of end-user price – illustrative (US$) 46
Figure 15. Sales costs structure observed between two companies selling similar SHS in the same country 47
Figure 16. Achievable sales volume in 5 years, with US$10 million funding, in thousand units (theoretical model) 48
Table 5. Hares vs Tortoises 50
Figure 17. Tortoise growth dynamics 51
Table 6. Sample of key players in the microgrid space, by inception date 55
Figure 18. Comparisons of LCOE between diesel and clean energy microgrids (5kWh/day) 56
Figure 19. Years in activity and scale of microgrid players featured in this report 57
Figure 20. Microgrid models 59
Table 7. Quotes of microgrid players on the uncertainties they are facing 60
Figure 21. Current versus target ARPUs observed among four companies (US$ per month) 61
Table 8. Intensive vs. extensive model for microgrids 62
Figure 22. Microgrid modelling outcomes: KPIs of the intensive vs extensive strategies 62
Figure 23. Irrigation potential and area equipped with irrigation, per region 69
Figure 24. Key drivers for solar irrigation growth in India 70
Figure 25. Indian government rationale for subsidizing solar pumps vs. paying for grid expansion, connection and supply over 7 years (estimated lifetime period of a pump) (US$) 71
Table 9. Comparison between large pumps and micro pumps 72
Table 10. Indicative prices of solar vs. alternative pump technologies (US$) 72
Table 11. Indicative prices of solar vs. alternative pump technologies (US$) 75
Figure 26. Distributed ICS by type of technology 83
Figure 27. Share of ICS distributed through market-based approaches 84
REACHING SCALE IN ACCESS TO ENERGY: Lessons from best practitioners 97
SOURCESAdina Rom (ETH), Isabel Gunther (ETH) and Kat Harrison (Acumen), The Economic Impact of Solar Lighting: Results from a randomized field experiment in rural Kenya, February 2017
Advanced Energy Economy (2016), This Is Advanced Energy: 52 Technologies That Are Powering the U.S. Economy, Modernizing Our Energy System, and Lowering Costs for Consumers
Africa-EU Renewable Energy Cooperation Program (2014), Etude sur l’électrification rurale à base d’énergies renouvelables en Afrique Subsaharienne ; Etude sur le développement de l’hydroélectricité de petite et moyenne puissance en Afrique subsaharienne ; Mini-grid Policy Toolkit: Policy and Business Frameworks for Successful Mini-grid Roll-outs
African Union (2016), Africa Strategy for Green Mini-Grids: Executive Summary
Alejandro Moreno and Asta Bareisaite (2015), Scaling Up Access to Electricity: Pay-as-You-Go Plans in Off-Grid Energy Services, Live Wire, World Bank
Alliance for Rural Electrification (2011), Hybrid Mini-Grids for Rural Electrification: Lessons Learned
Amol Phadke, Arne Jacobson, Won Young Park, Ga Rick Lee, Peter Alstone and Amit Khare (2015), Powering a Home with Just 25 Watts of Solar PV: Super-Efficient Appliances Can Enable Expanded Off-Grid Energy Service Using Small Solar Power Systems, Lawrence Berkeley National Laboratory
Amy Ahearn (Acumen), “The Pain of Paying — Pitfalls of the “Pay-As-You-Go” model”, Sept 22, 2016
Andrew Scott and Charlie Miller (ODI), Accelerating access to electricity in Africa with off-grid solar: The market for household solutions, January 2016
Anjali Garg and Pepukaye Bardouille (IFC) and Richa Goyal (Schatz Energy Research Center), Solar Mini-grids: Emerging trends and business models, Power Line, page 52-54, July 2016
Archana Chaudhary (2014) “Grundfos to Increase Solar Water Pumps Business in India”, Bloomberg
Arthur Contejean and Louis Verin (2016), Integrating Productive Uses of Electricity within Private Clean Energy Mini-Grids Business Models: The case of Tanzania and Jumeme, Master thesis, HEC Paris Msc. Sustainability and Social Innovation
Bhattacharyya, Subhes C., “To Regulate or Not to Regulate Off-Grid Electricity Access in Developing Countries” (August 30, 2013). Energy Policy, 2013, DOI: 10.1016
Berkeley Air Monitoring Group (2012), Stove Performance Inventory Report (Prepared for the Global Alliance for Clean Cookstoves)
Bloomberg New Energy Finance (2017), Q1 2017 Off-Grid and Mini-Grid Market Outlook
Bloomberg New Energy Finance (2016), Off-grid Solar Market Trends Report; How can Pay-As-You Go Solar be Financed?
Bloomberg New Energy Finance (2015), Off-grid Solar Lighting Market Trends, 4th International Off-Grid Lighting Conference
Carbon Africa, Trama TecnoAmbiental, Research Solutions Africa and ECN (2015), Kenya Market Assessment for Off-Grid Electrification, Final Report
Chris Aidun and Dirk Muench (2016), Securitization: Unnecessary Complexity or Key to Financing the DESCO Sector? – GOGLA
Christine Eibs-Singer and Marcus Wiemann (2016), Renewable mini-grids: Unlocking Africa’s Rural Powerhouse, ESI Africa Issue 1
Christopher Ruud (2013), Why Not Go Green? An Analysis of the Viability of Solar PV Mini-Grids in Tanzania, Master Thesis, Norwegian University of Life Sciences, Department of Mathematical Sciences and Technology
Clean Energy Access Network (2015), Policy Brief on Solar Off Grid
The Climate Group (2015), The Business Case for Off-Grid Energy in India
REACHING SCALE IN ACCESS TO ENERGY: Lessons from best practitioners98
Debajit Palit and Kaushik Ranjan Bandyopadhyay, “Regulating Off-grid Electricity Delivery. Exploring the Grey Areas”, Economic and Political Weekly, Vol. 50, Issue No. 10, 07 Mar, 2015
Declan Murray (PhD researcher), blog “Solar and other stories”
ENEA Consulting (2014), L’accès à l’énergie. Etat des lieux, enjeux et perspectives, Facts & Figures
Energising Development Partnership (2016), Results-Based Financing (RBF)
Energising Development, Progress Report 2015. Energising Development – Phase 2 (Draft Version for the Governing Board)
Energy for All (2013), Global Tracking Framework
Enrique Crousillat, Richard Hamilton, and Pedro Antmann (World Bank), Addressing the Electricity Access Gap: Background Paper for the World Bank Group Energy Sector Strategy, June 2010
ESMAP, GACC, The World Bank (2015), The State of the Global Clean and Improved Cooking Sector
ESMAP (2015), Accelerating Energy Access for the Urban Poor
Evan Mills, Jennifer L. Tracy, Peter Alstone, Arne Jacobson and Patrick Avato, “Low-cost LED flashlights and market spoiling in Kenya’s off-grid lighting market”, Springer, January 26, 2014
ECA, TTA and Access Energy (2014), Project Design Study on the Renewable Energy Development for Off-Grid Power Supply in Rural Regions of Kenya, Final Report
FAO, The use of water in agriculture, Aquastat
Fast-Track Carbon (2014), Summary Statistics: Cooking Fuel Consumption Baseline Survey
Frankfurt School – UNEP Collaborating Centre for Climate and Sustainable Energy Finance (2015), Renewable Energy in Hybrid Mini-Grids and Isolated Grids: Economic Benefits and Business Cases
GEA (2012): Global Energy Assessment - Toward a Sustainable Future, Cambridge University Press, chapter 23: “Policies for Energy Access”
GIZ (2016), Photovoltaics for Productive Use Applications. A Catalogue of DC-Appliances; Frequently Asked Questions on Solar Powered Irrigation Pumps, Indo-German Energy Program - Access to Energy in Rural Areas (IGEN-Access)
GIZ (2013), “Solar Water Pumping for Irrigation. Potential and Barriers in Bihar, India”, factsheet as part of the Solar Water Pumping for Irrigation study commissioned by the Indo-German Energy Program - Renewable Energy (IGEN-RE)
GIZ’s Promotion of Renewable Energy and Energy Efficiency Program (2011), Solar Lamps Field Test Uganda, Final Report
GIZ Mini-Grid Policy Toolkit, a joint initiative by the EUEI PDF, REN21 and ARE: http://minigridpolicytoolkit.euei-pdf.org/
GIZ-HERA and StovePlus (2014), Building Business Cases to Reach Scale: A Study on Biomass Cookstove Business Models in Asia and Africa
GIZ (2013), Clean and Efficient Cooking Energy for 100 Million Homes: Results from the Bonn International Cooking Energy Forum 26–28 June 2013
Global LEAP (2016) Lighting and Energy Access Partnership, The State of the Off-Grid Appliance Market
Global LEAP (2014) Awards 2014 Outstanding Off-Grid Appliances, Buyer’s Guide and Factsheet on TV Competition
GNESD (2014), Renewable energy-based rural electrification: The Mini-Grid Experience from India. New Delhi. Prepared by TERI for the Global Network on Energy for Sustainable Development (GNESD)
GOGLA, Company Profiles
Grand View Research (2016), Solar Pumps Market Analysis by Product (key findings)
GVEP International (2016), Crowd Power: Mapping the Market for Energy Access
GVEP International (2015), How do Energy Micro-Businesses Grow, Part2: A Study Of Factors Influencing Survival
REACHING SCALE IN ACCESS TO ENERGY: Lessons from best practitioners 99
and Growth of Informal Sector Energy Businesses in Kenya
GVEP International (2011), Policy briefing: The history of mini-grid development in developing countries
Han HOUMIN, Renewable Energy Policies and the Solar. Home System in Cambodia, ERIA Discussion Paper 2015-64, September 2015
Hystra (2009) Access to Energy for the Base of the Pyramid
IRENA (2016), Solar pumping for irrigation: Improving livelihoods and sustainability, The International Renewable Energy Agency, Abu Dhabi
IFC (2017), Operational and Financial Performance of Mini-Grid Descos: Findings and Insights from Pioneer Benchmarking of this Emerging Sector
IFC (2014), Lighting Asia: Market Presence of Off-Grid Lighting Products, Insights from a study in Bihar and Odisha
IFC (2012), From Gap to Opportunity: Business Models for Scaling Up Energy Access; Lighting Asia: Solar Off-Grid Lighting. Market analysis of India, Bangladesh, Nepal, Pakistan, Indonesia, Cambodia and Philippines
IMF (2013), African Department, Energy subsidy reform in Sub-Saharan Africa: experiences and lessons
IEA (2015), Southeast Asia Energy Outlook, World Energy Outlook Special Report
IEA (2014), Innovative Business Models and Financing Mechanisms for PV Deployment in Emerging Regions (Report IEA-PVPS T9-14:2014); Africa Energy Outlook, World Energy Outlook Special Report
IEA Photovoltaic Power Systems Program (2013), Rural Electrification with PV Hybrid Systems: Overview and Recommendations for Further Deployment, Report IEA-PVPS T9-13:2013
IEA (2011), Energy for all. Financing access for the poor, special early excerpt of the World Energy Outlook 2011
IISD’s Global Subsidies Initiative (2016), An Assessment of the Financial Sustainability of the Electricity Sector in Rajasthan
Jechoniah Kitala (SNV), One Watt at a Time: The Rise of Solar Lighting in Rural Kenya, SNV Annual Report Appendices 2015
Jennifer A. Burney, Rosamond L. Naylor, and Sandra L. Postel, “The case for distributed irrigation as a development priority in sub-Saharan Africa”, PNAS Direct Submission, July 2013
John J. Mason (NCRC, Accra), Charcoal Production in Ghana. Building a Sustainable Model based on Community Management and Payments for Ecosystem Services, September 2008
Johanna Diecker, Susie Wheeldon and Andrew Scott (ODI), Accelerating access to electricity in Africa with off-grid solar: Policies to expand the market for solar household solutions, January 2016
Jorge Fernandes and Vivek Chaturvedi (DSM), Off-grid Opportunity in India and Africa, Feasibility Proposal, June 2016
Kat Harrison, Andrew Scott and Ryan Hogarth (ODI), Accelerating access to electricity in Africa with off-grid solar: The impact of solar household solutions, January 2016
Kenya National Bureau of Statistics (2013), Exploring Kenya’s Inequality: Pulling Apart or Pooling Together? Abridged Report
Koen Peters (GOGLA), “Scaling the off-grid lighting and household electrification industry”
Practical Impact Alliance –MIT Working Group “Pilots to Scale”, August 25, 2016
Lighting Africa (2013), A Growing and Evolving Market for Off-grid Lighting: Market Presence of Off-Grid Lighting Products in the Kenyan Towns of Kericho, Kapkugerwet (Brooke), and Talek
Lighting Global and GOGLA, Global Off-Grid Solar Semi-Annual Market Report (January-June 2016 and July- December 2015)
Lighting Global (2015), Quality Communication: Quality assurance in Kenya’s off-grid lighting market; Off-Grid Power and Connectivity: Pay-As-You-Go financing and digital supply chains for Pico-Solar; The Rise of Solar: Market Evolution of Off-Grid Lighting in Three Kenyan Towns
Maximo Torero (International Food Policy Research Institute), The Impact of Rural Electrification.
REACHING SCALE IN ACCESS TO ENERGY: Lessons from best practitioners100
Challenges and Ways Forward, Paper prepared for the 11th Conference AFD PROPARCO/EUDN: Energy for Development, November 2014
Miller Center for Social Entrepreneurship (2015), Universal Energy Access: An Enterprise System Approach
Ministry of Statistics and Programme Implementation of India, National Sample Survey Office (NSSO) 70th round Survey of Agricultural Households Key Indicators, January- December 2013
Mollie Bloudoff-Indelicato, “The Scaled-Down Solar Pump”, DEMAND-ASME Global Development Review, p 24-29, spring 2016
Muriithi Micheni, “Five lessons from Kenya’s energy access boom”, Thompson Reuters Trust Foundation News, September 14, 2016
ODI (2015), Accelerating access to electricity in Africa with off-grid solar. Country briefing: Ethiopia, Ghana, Kenya, Malawi, Mozambique, Nigeria, Rwanda, Sierra Leone, Somalia, Tanzania, Uganda, Zambia, Zimbabwe
Pepukaye Bardouille (IFC) and Dirk Muench (PEP), How a New Breed of Distributed Energy Services Companies can reach 500m energy-poor customers within a decade: A commercial solution to the energy access challenge, June 2014
Persistent Energy Capital (2016), Securitization: Unnecessary Complexit Or Key to Financing the DESCO Sector?
Peter Alstone, Dimitry Gershenson and Daniel M. Kammen, “Decentralized energy systems for clean electricity access”, Perspective, March 25, 2015, DOI: 10.1038/NCLIMATE2512
PwC (2016), Electricity beyond the grid: Accelerating access to sustainable power for all
PwC (2015), Power in Indonesia. Investment and Taxation Guide, 3RD Edition
PRACTICA Foundation (2016), Intermediate depth solar pumps, Country assessment Senegal
Proparco (2015), Financer les énergies et le développement durables
REN21, Renewables Global Status Report (2016, 2014)
Renewable Energy Microfinance and Microenterprise Program (2014), Briefing Notes “In-House Asset Finance for Small-Scale Renewable Energy” and “Pay-As-You-Go Technologies in Consumer Energy Finance”
Rocky Mountain Institute, Homer Energy and Cohn Reznick Think Energy (2014), The Economics of Grid Defection. When and Where Distributed Solar Generation Plus Storage Competes with Traditional Utility Service
SE4All (2015), Clean Energy Mini-Grids High Impact Opportunity (Annual Report); High Impact Opportunity Clean Energy Mini-grids: Mapping of clean energy mini-grid support providers and programs, First Edition
Simon Rolland and Guido Glania (USAID and ARE, 2014), Hybrid Mini-Grids for Rural Electrification: Lessons Learned
Shahid Mohammad, “Urban, Peri-Urban, Slum Electrification Kenyan Experience”, Kenyan Power and Lighting Company, June 10, 2009
Shell Foundation (2014) Accelerating Access to Energy: Lessons learned from efforts to build inclusive energy markets in developing countries
SolarAid (2015), Impact report; “The sun is rising on a solar revolution in Africa”
Stephen D. Comello, Stefan J. Reichelstein, Anshuman Sahoo and Tobias S. Schmidt (2015), Enabling Mini-grid Development in Rural India, Stanford Graduate School of Business working paper
Terri Walters, Neha Rai, Sean Esterly, Sadie Cox, and Tim Reber (2015) “Policies to Spur Energy Access: Executive Summary.” Golden, CO: National Renewable Energy Laboratory
The WBCSD Access to Energy Initiative (2012), Business solutions to enable energy access for all
UN-Habitat (2013), Enhanced Energy Access for the Urban Poor: Best Practice Casebook
Varun Mehra, “Solar Pumps: India’s Potential to Link Electricity Access and Irrigation Needs?” The Energy Collective, February 26, 2015
Veolia Institute (2016), Decentralized electrification and development - Special Issue 15, FACTS Reports

Contact us:
François Lepicard – [email protected] Simon Brossard – [email protected] Graf – [email protected]
Like us:
facebook.com/HYSTRA
Tweet us:
@HYSTRAinsights


![HP Image Zone Print Job [15/10/2008 12:17 59.673] - CDEcde.be/certification/vincotte-ba5.pdf · VINCOTTE ACADEMY A TTESTA TION DE PARTICIPA TION JE SOUSSIGNE, MICHEL VANDEGARD, DIRECTEUR,](https://img.pdfslide.us/doc/110x75/60aab0667a9ad207c62e9a72/hp-image-zone-print-job-15102008-1217-59673-vincotte-academy-a-ttesta-tion.jpg)