Embed Size (px)
Citation preview

REACH-CRC
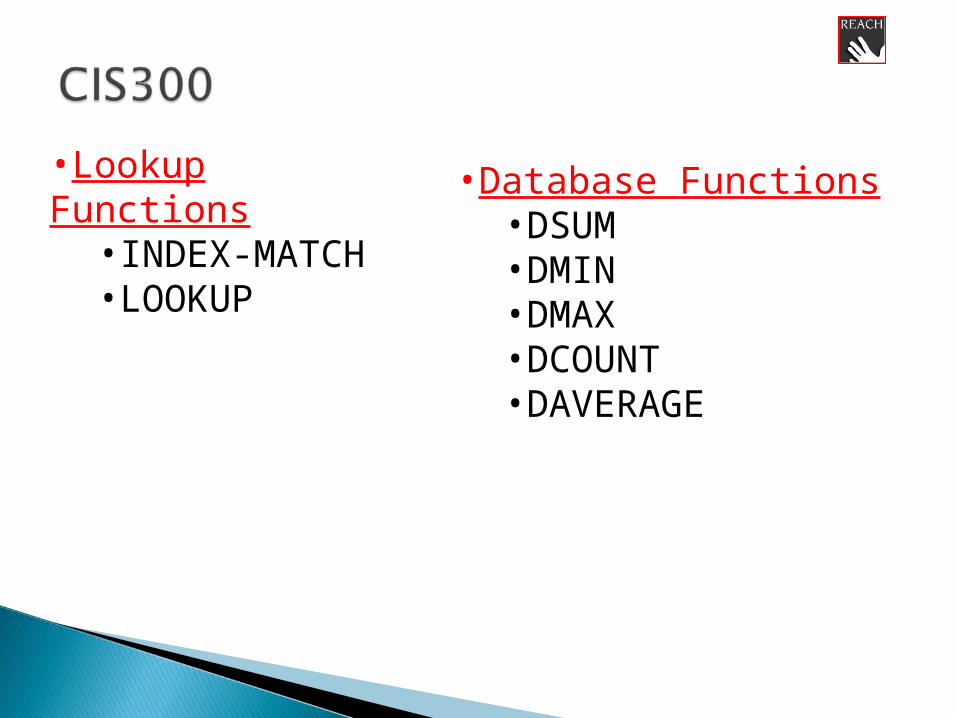
•Lookup Functions•INDEX-MATCH•LOOKUP
•Database Functions•DSUM•DMIN•DMAX•DCOUNT•DAVERAGE
Lookup Functions
Microsoft® Excel® Lookup Functions
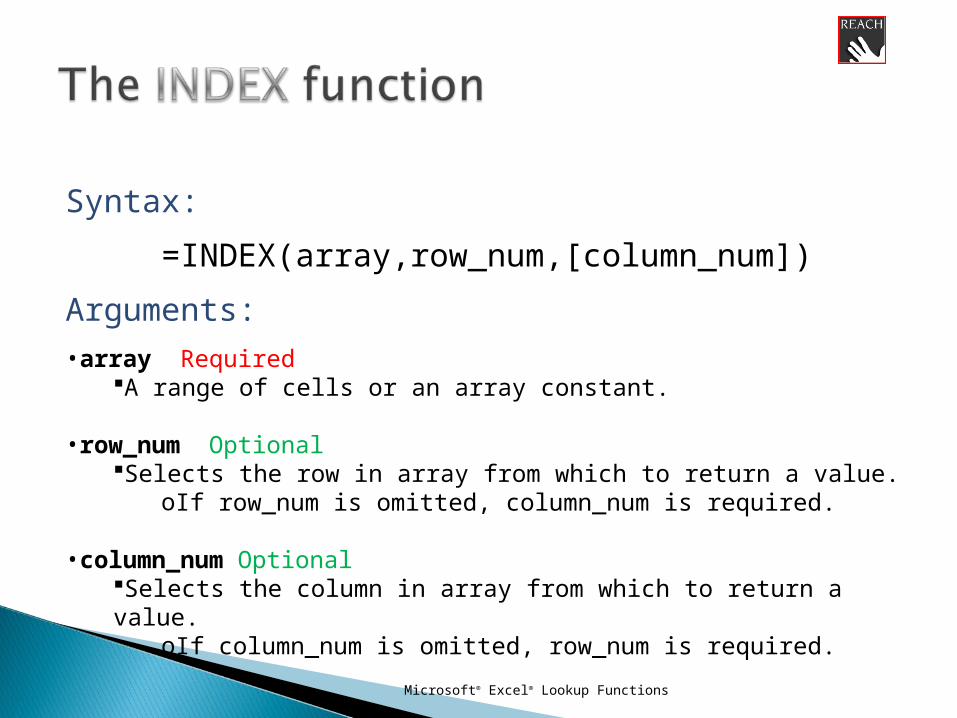
Syntax:
=INDEX(array,row_num,[column_num])
Arguments:
•array RequiredA range of cells or an array constant.
•row_num OptionalSelects the row in array from which to return a value.
oIf row_num is omitted, column_num is required.
•column_num OptionalSelects the column in array from which to return a value.
oIf column_num is omitted, row_num is required.
Microsoft® Excel® Lookup Functions
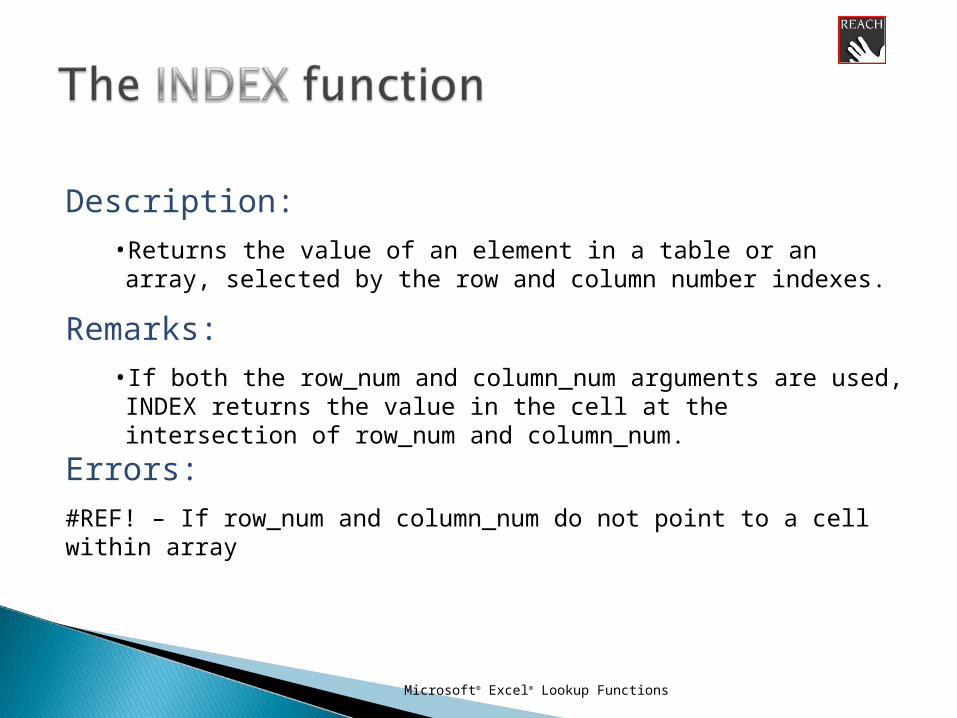
Description:
• Returns the value of an element in a table or an array, selected by the row and column number indexes.
Remarks:
• If both the row_num and column_num arguments are used, INDEX returns the value in the cell at the intersection of row_num and column_num.
Errors:
#REF! – If row_num and column_num do not point to a cell within array
Microsoft® Excel® Lookup Functions
Microsoft® Excel® Lookup Functions
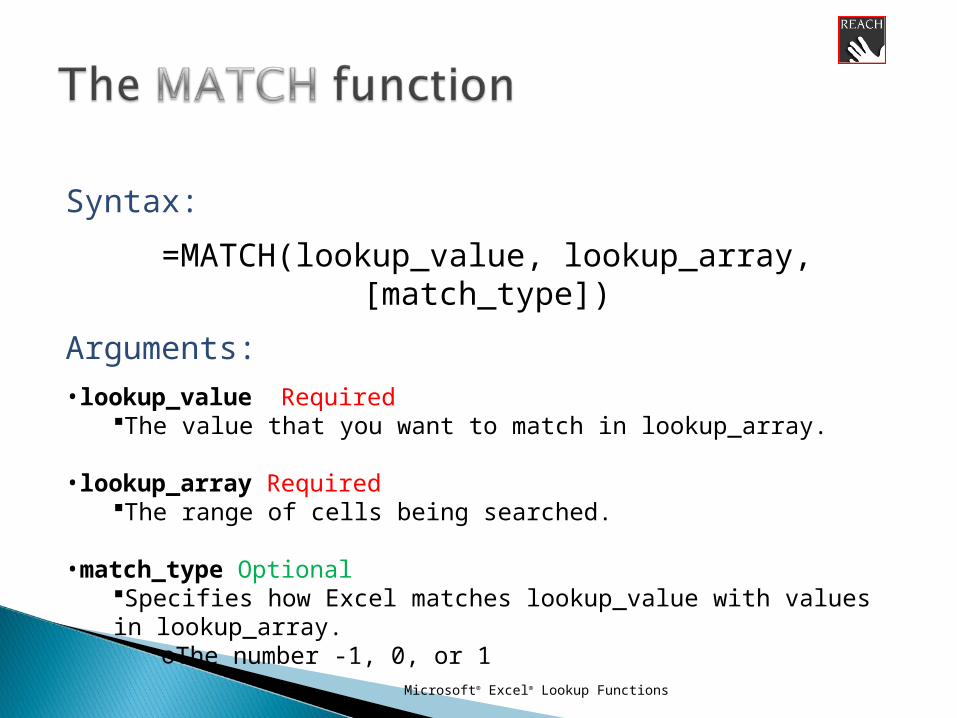
Syntax:
=MATCH(lookup_value, lookup_array, [match_type])
Arguments:
•lookup_value RequiredThe value that you want to match in lookup_array.
•lookup_array RequiredThe range of cells being searched.
•match_type OptionalSpecifies how Excel matches lookup_value with values in lookup_array.
oThe number -1, 0, or 1
Microsoft® Excel® Lookup Functions
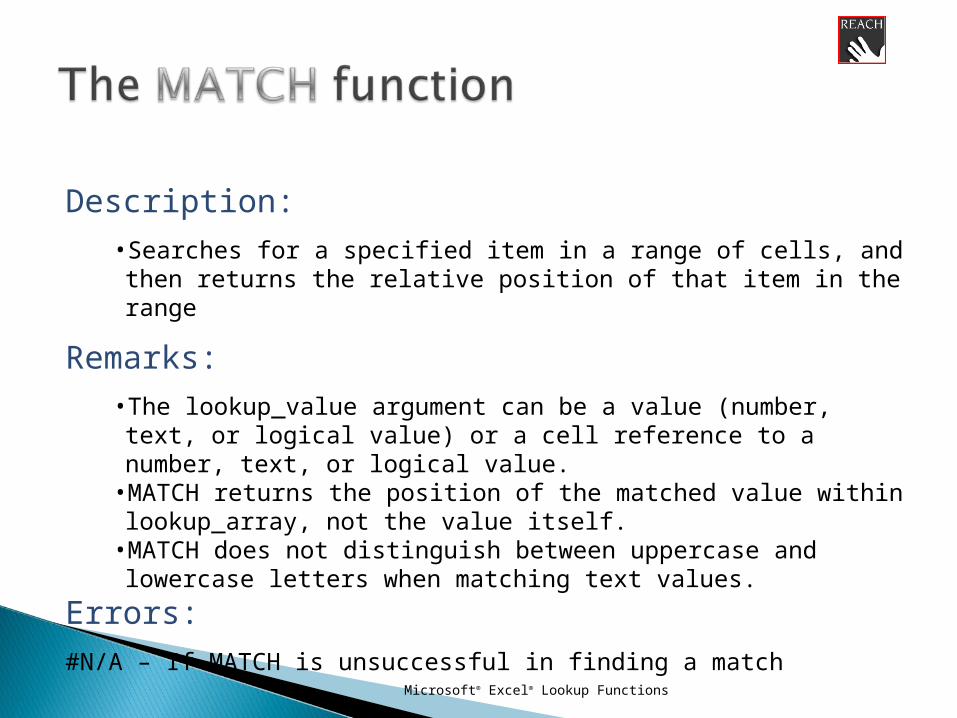
Description:
• Searches for a specified item in a range of cells, and then returns the relative position of that item in the range
Remarks:
• The lookup_value argument can be a value (number, text, or logical value) or a cell reference to a number, text, or logical value.
• MATCH returns the position of the matched value within lookup_array, not the value itself.
• MATCH does not distinguish between uppercase and lowercase letters when matching text values.
Errors:
#N/A – If MATCH is unsuccessful in finding a match
Microsoft® Excel® Lookup Functions
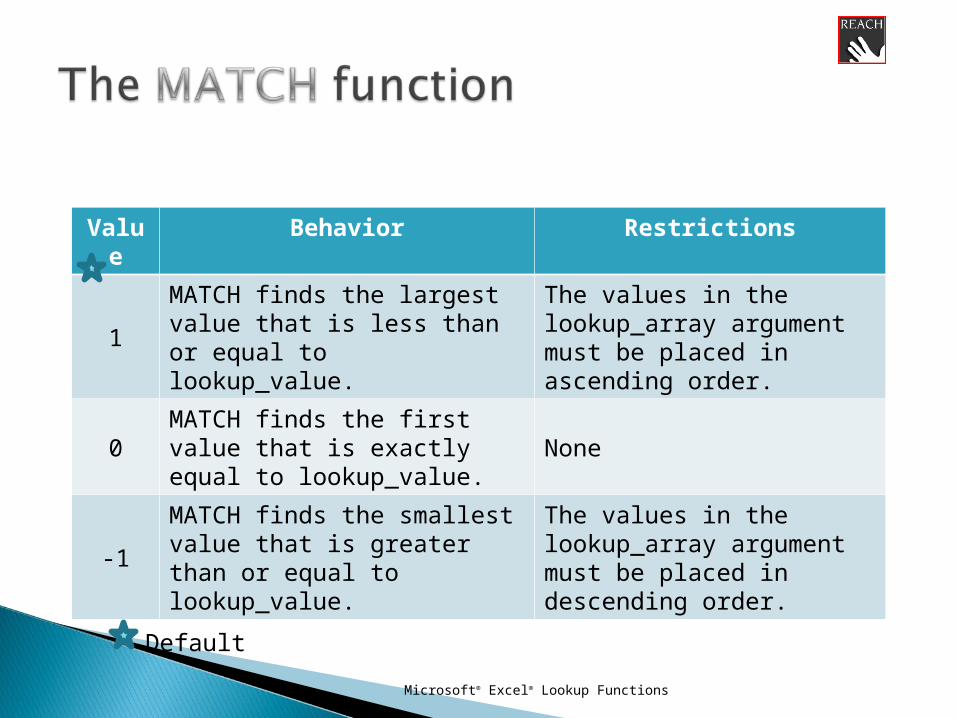
Value
Behavior Restrictions
1
MATCH finds the largest value that is less than or equal to lookup_value.
The values in the lookup_array argument must be placed in ascending order.
0MATCH finds the first value that is exactly equal to lookup_value.
None
-1
MATCH finds the smallest value that is greater than or equal to lookup_value.
The values in the lookup_array argument must be placed in descending order.
Default
Microsoft® Excel® Lookup Functions
Microsoft® Excel® Information Functions
Description:
•A combination of INDEX and MATCH can be used as a form of table lookup.
•It is similar to the VLOOKUP and HLOOKUP function but more flexible.
•It is usually of the form:
=INDEX(some_array, MATCH(some_value, some_array, criteria), [MATCH(some_value, some_array, criteria)])
Microsoft® Excel® Information Functions
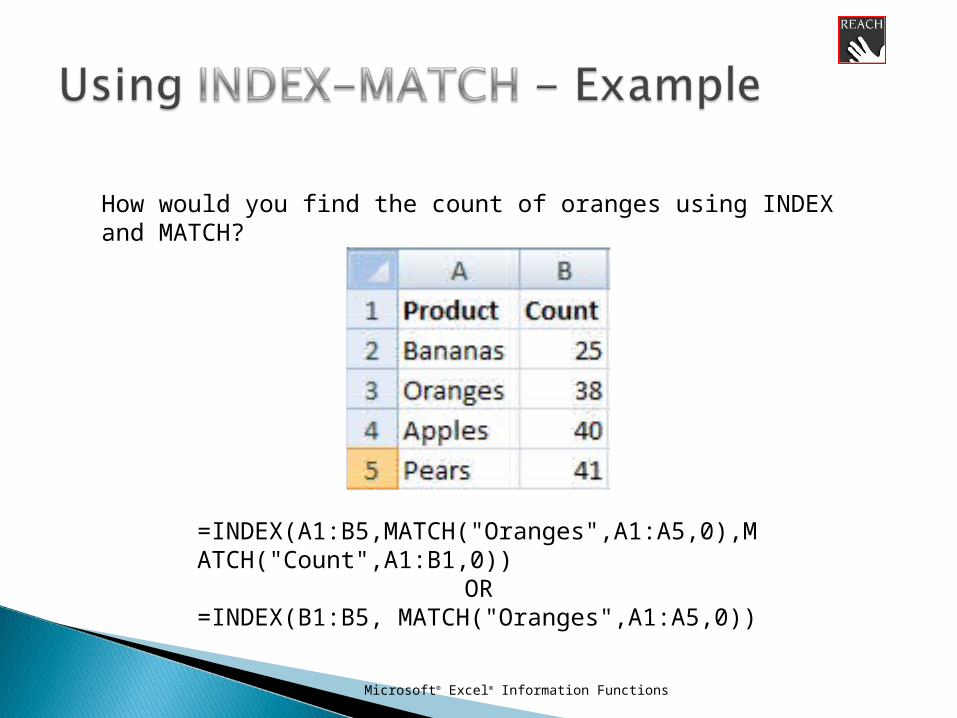
=INDEX(A1:B5,MATCH("Oranges",A1:A5,0),MATCH("Count",A1:B1,0))
OR=INDEX(B1:B5, MATCH("Oranges",A1:A5,0))
How would you find the count of oranges using INDEX and MATCH?
Microsoft® Excel® Lookup Functions
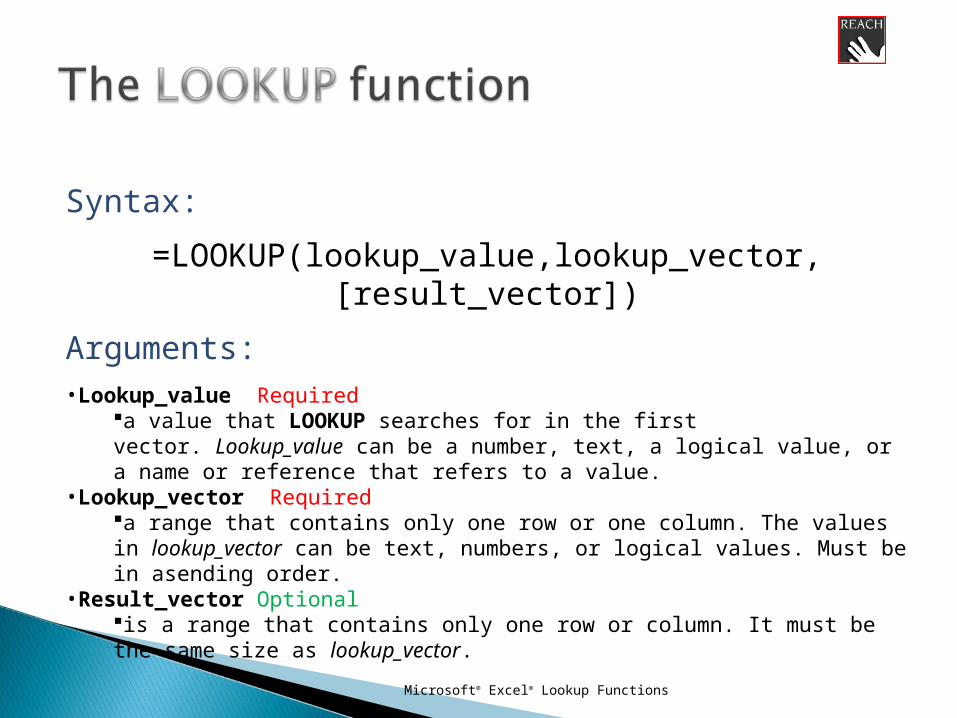
Syntax:
=LOOKUP(lookup_value,lookup_vector, [result_vector])
Arguments:•Lookup_value Required
a value that LOOKUP searches for in the first vector. Lookup_value can be a number, text, a logical value, or a name or reference that refers to a value.
•Lookup_vector Requireda range that contains only one row or one column. The values in lookup_vector can be text, numbers, or logical values. Must be in asending order.
•Result_vector Optionalis a range that contains only one row or column. It must be the same size as lookup_vector.
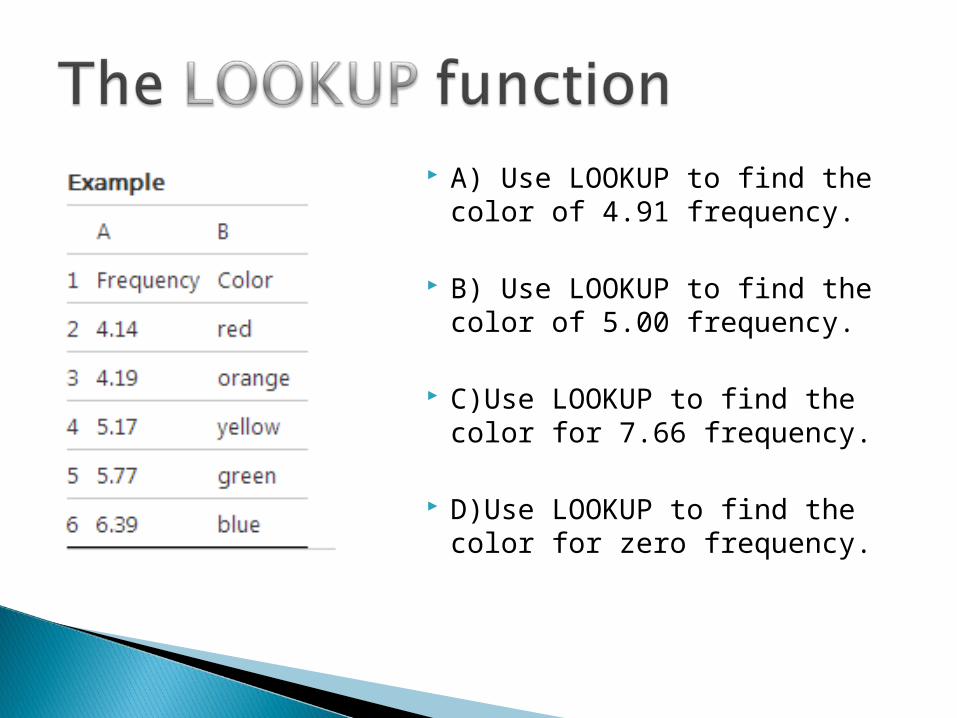
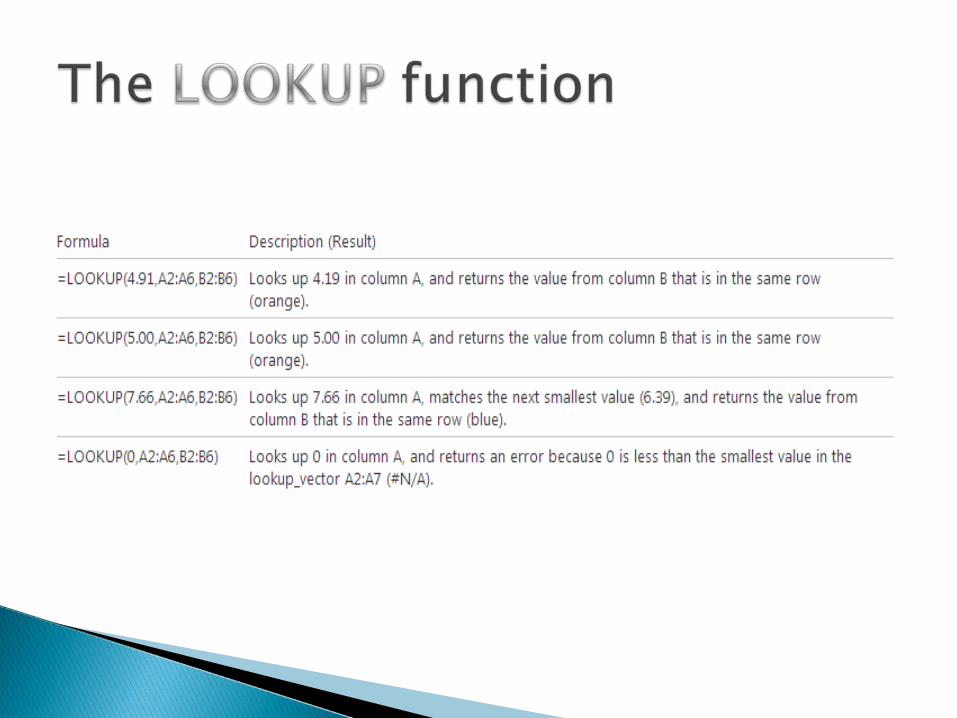
A) Use LOOKUP to find the color of 4.91 frequency.
B) Use LOOKUP to find the color of 5.00 frequency.
C)Use LOOKUP to find the color for 7.66 frequency.
D)Use LOOKUP to find the color for zero frequency.
Database Functions
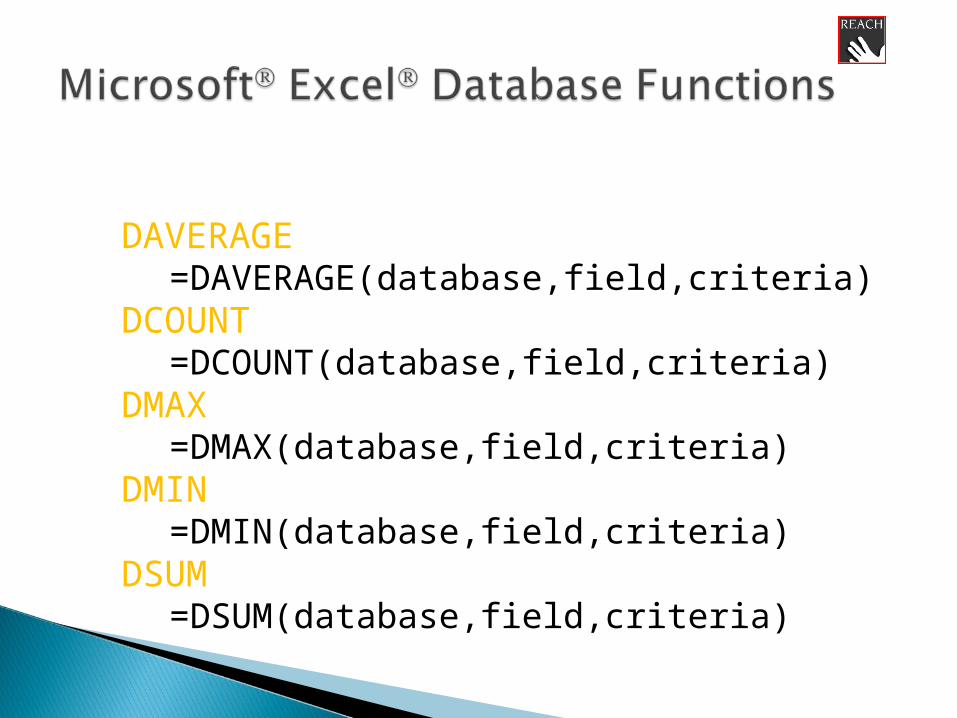
DAVERAGE=DAVERAGE(database,field,criteria)
DCOUNT=DCOUNT(database,field,criteria)
DMAX=DMAX(database,field,criteria)
DMIN=DMIN(database,field,criteria)
DSUM=DSUM(database,field,criteria)
Microsoft® Excel® Database Functions
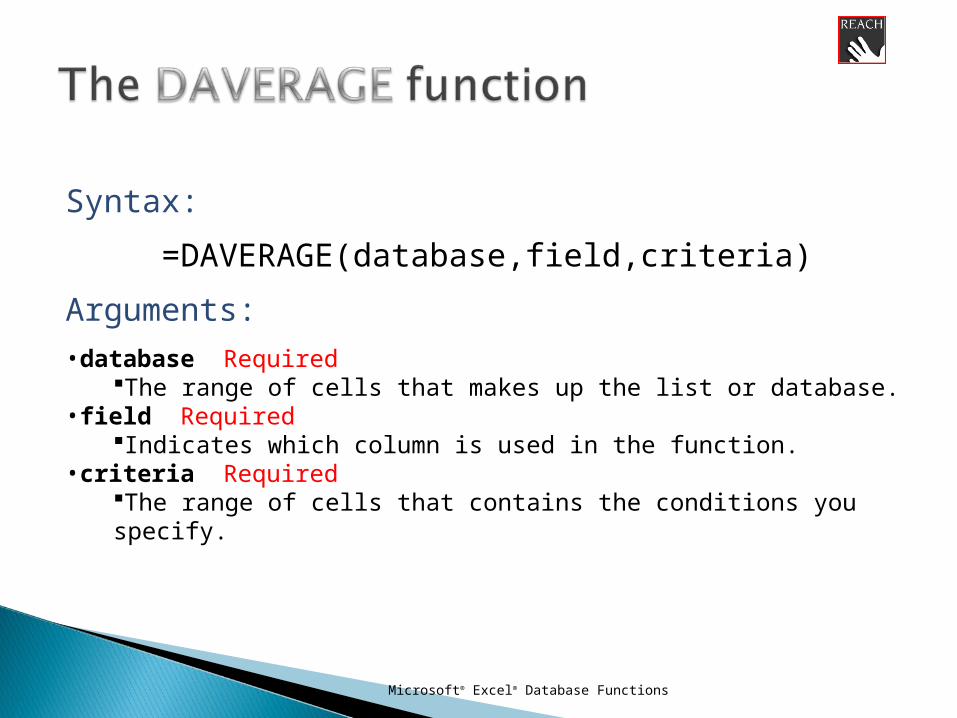
Syntax:
=DAVERAGE(database,field,criteria)
Arguments:
•database RequiredThe range of cells that makes up the list or database.
•field RequiredIndicates which column is used in the function.
•criteria RequiredThe range of cells that contains the conditions you specify.
Microsoft® Excel® Database Functions
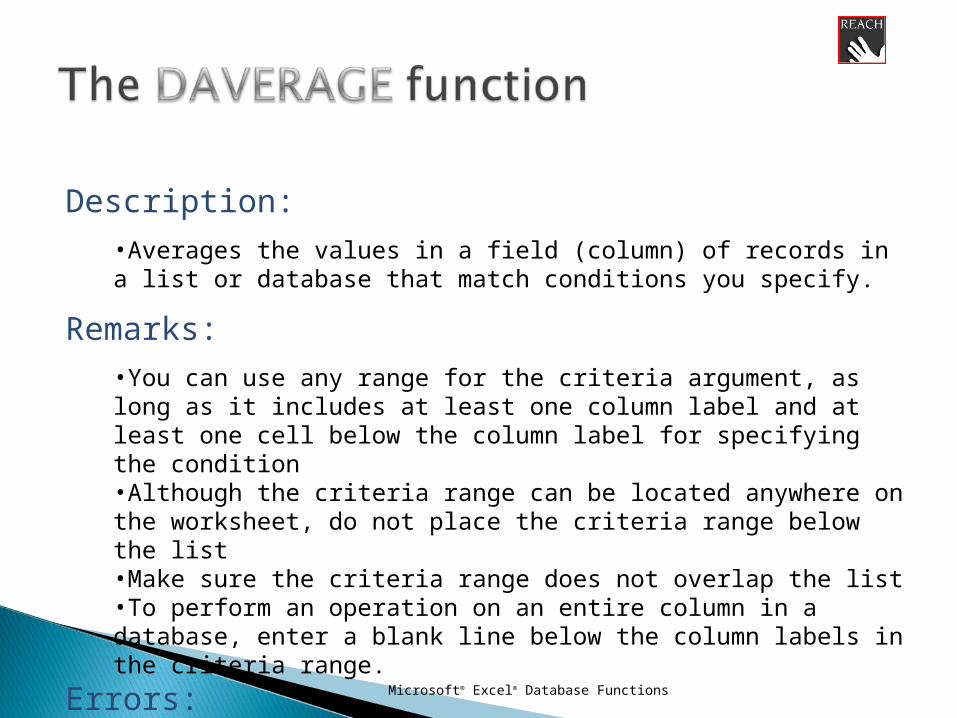
Description:
•Averages the values in a field (column) of records in a list or database that match conditions you specify.
Remarks:
•You can use any range for the criteria argument, as long as it includes at least one column label and at least one cell below the column label for specifying the condition•Although the criteria range can be located anywhere on the worksheet, do not place the criteria range below the list•Make sure the criteria range does not overlap the list•To perform an operation on an entire column in a database, enter a blank line below the column labels in the criteria range.
Errors:
None specified

Microsoft® Excel® Database Functions
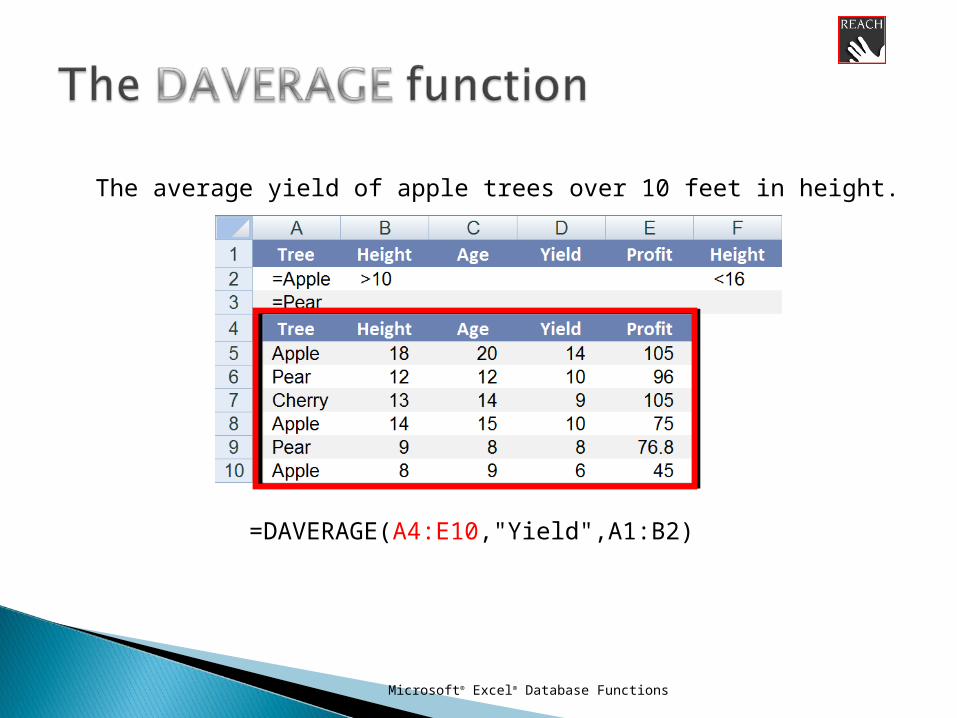
=DAVERAGE(A4:E10,"Yield",A1:B2)
The average yield of apple trees over 10 feet in height.
Microsoft® Excel® Database Functions
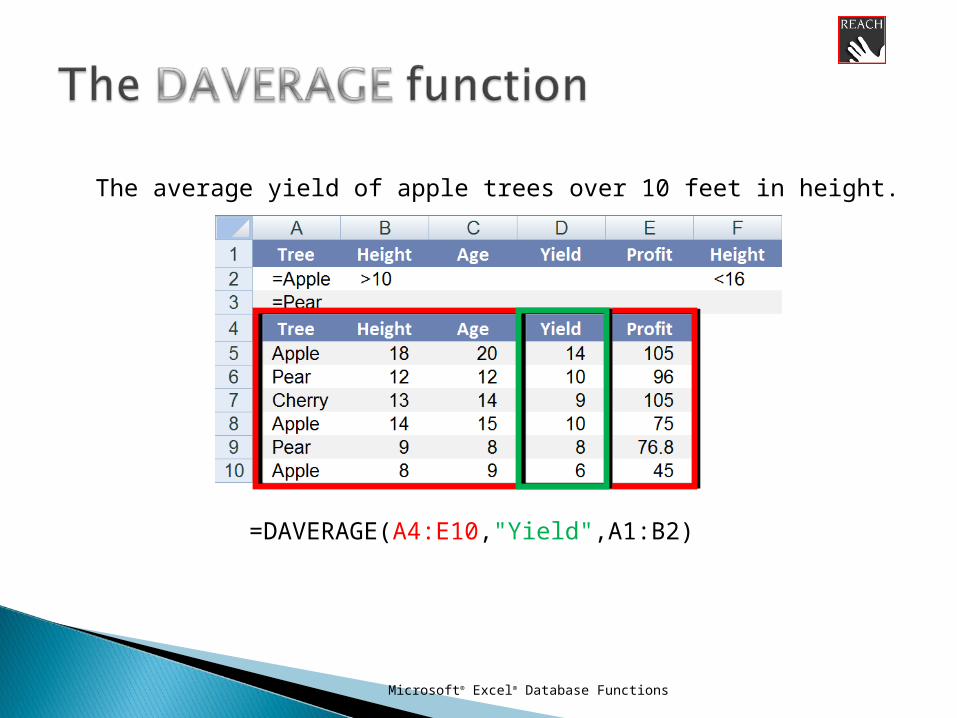
=DAVERAGE(A4:E10,"Yield",A1:B2)
The average yield of apple trees over 10 feet in height.
Microsoft® Excel® Database Functions
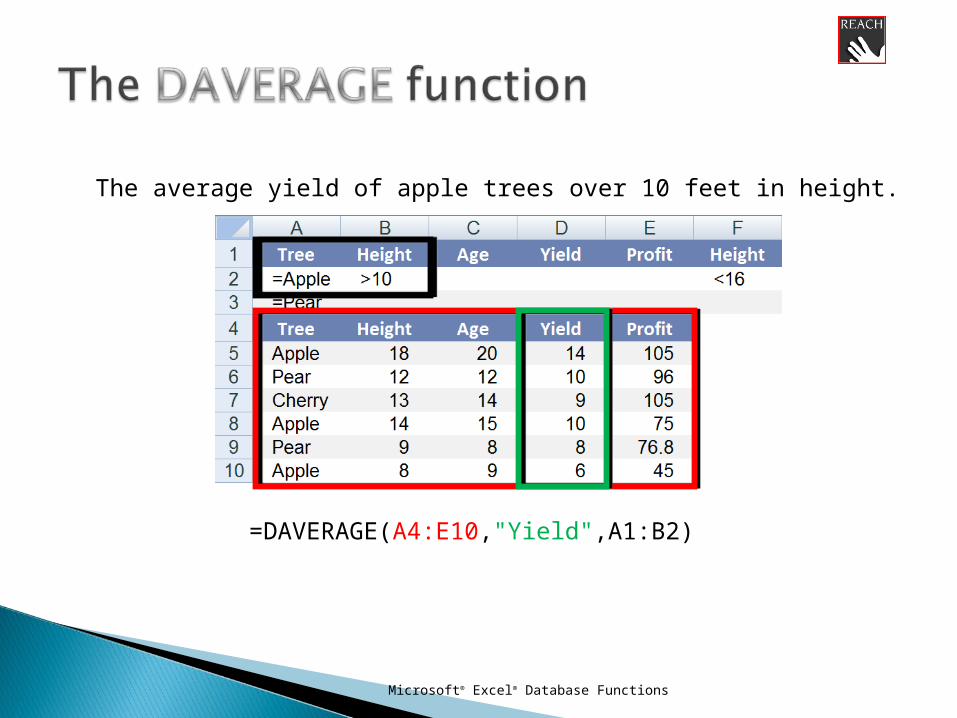
=DAVERAGE(A4:E10,"Yield",A1:B2)
The average yield of apple trees over 10 feet in height.
Microsoft® Excel® Database Functions
=DAVERAGE(A4:E10,"Yield",A1:B2)
The average yield of apple trees over 10 feet in height.

Microsoft® Excel® Database Functions
=DAVERAGE(A4:E10,"Yield",A1:B2)=12
The average yield of apple trees over 10 feet in height.
Microsoft® Excel® Database Functions
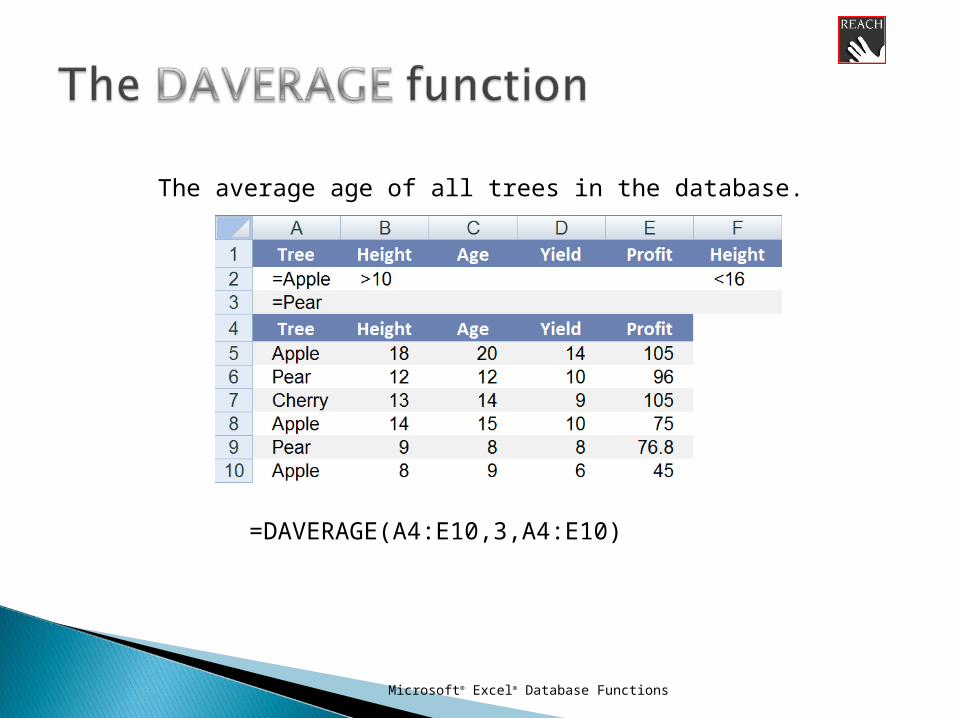
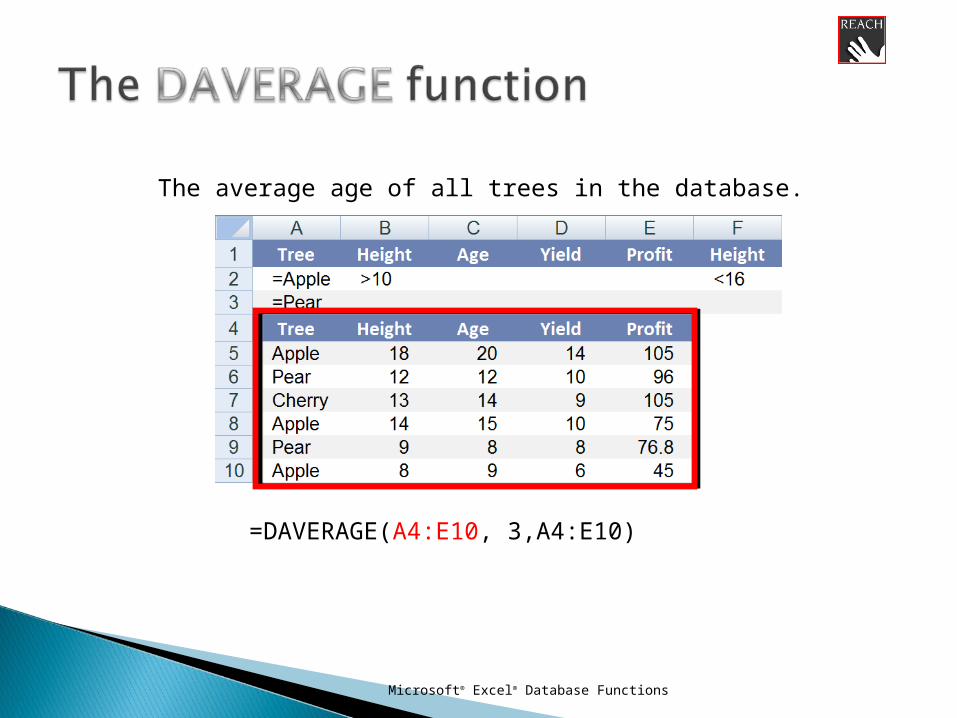
=DAVERAGE(A4:E10,3,A4:E10)
The average age of all trees in the database.
Microsoft® Excel® Database Functions
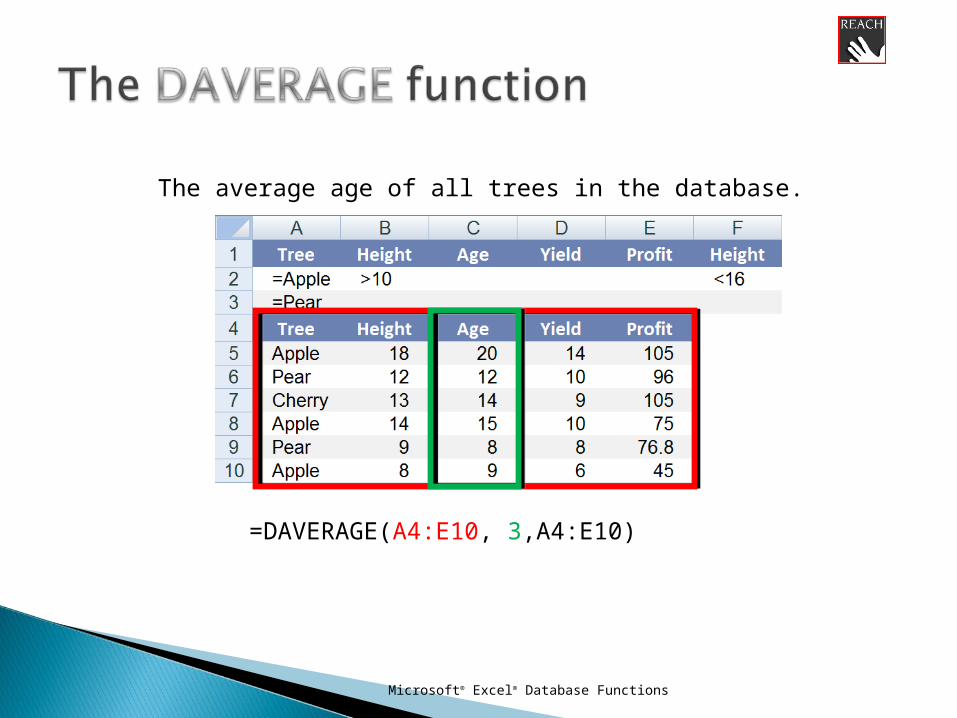
=DAVERAGE(A4:E10, 3,A4:E10)
The average age of all trees in the database.

Microsoft® Excel® Database Functions
=DAVERAGE(A4:E10, 3,A4:E10)
The average age of all trees in the database.
Microsoft® Excel® Database Functions
=DAVERAGE(A4:E10, 3,A4:E10)
The average age of all trees in the database.

Microsoft® Excel® Database Functions
=DAVERAGE(A4:E10, 3,A4:E10)=13
The average age of all trees in the database.

Microsoft® Excel® Database Functions
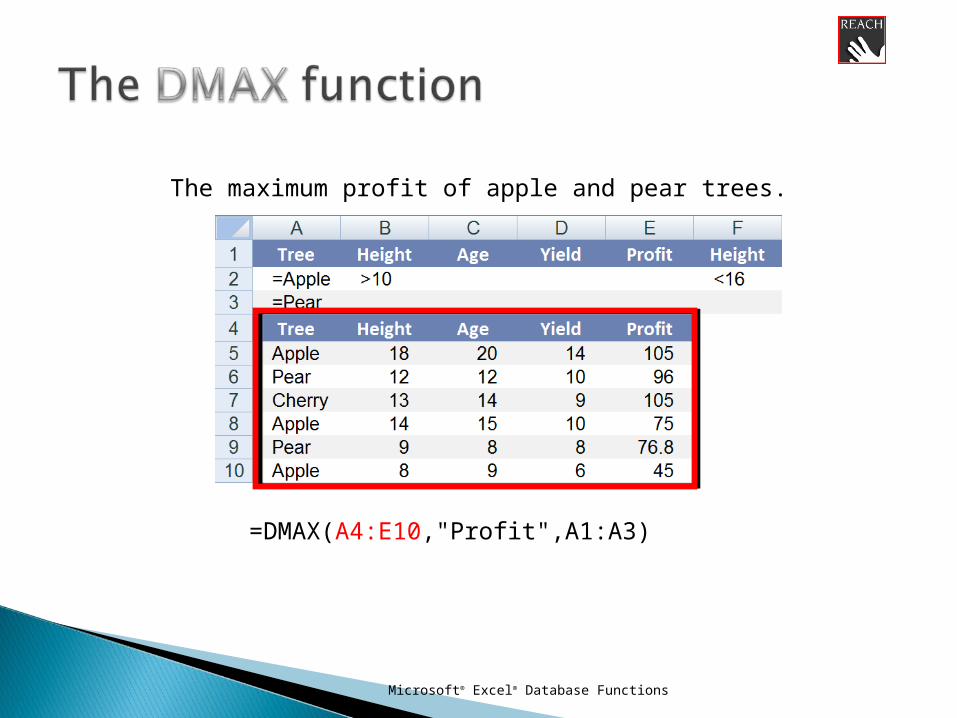
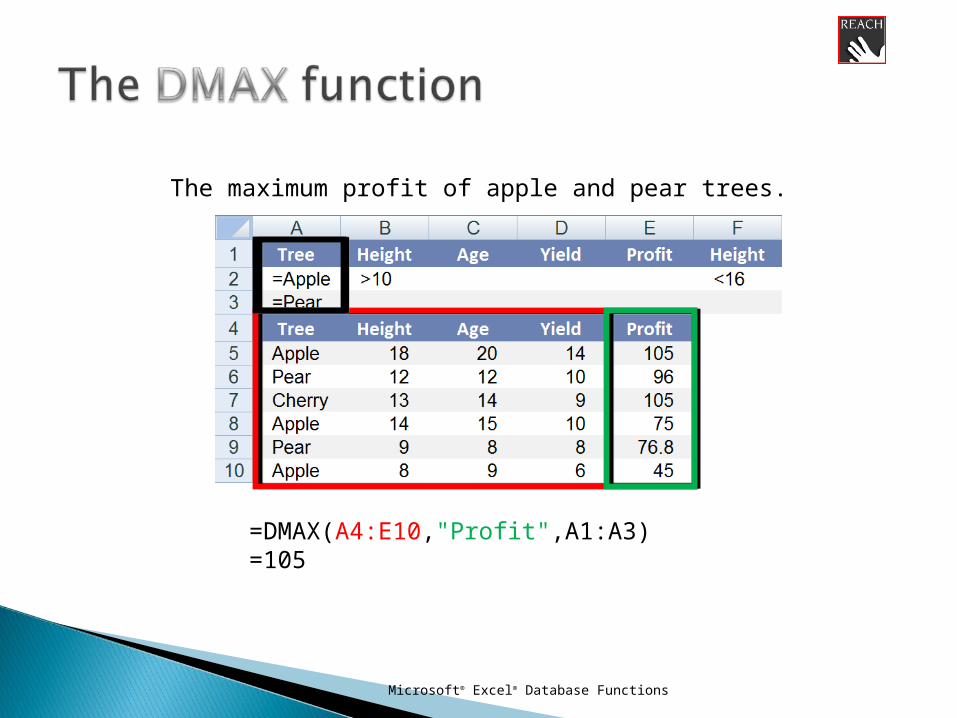
=DMAX(A4:E10,"Profit",A1:A3)
The maximum profit of apple and pear trees.
Microsoft® Excel® Database Functions
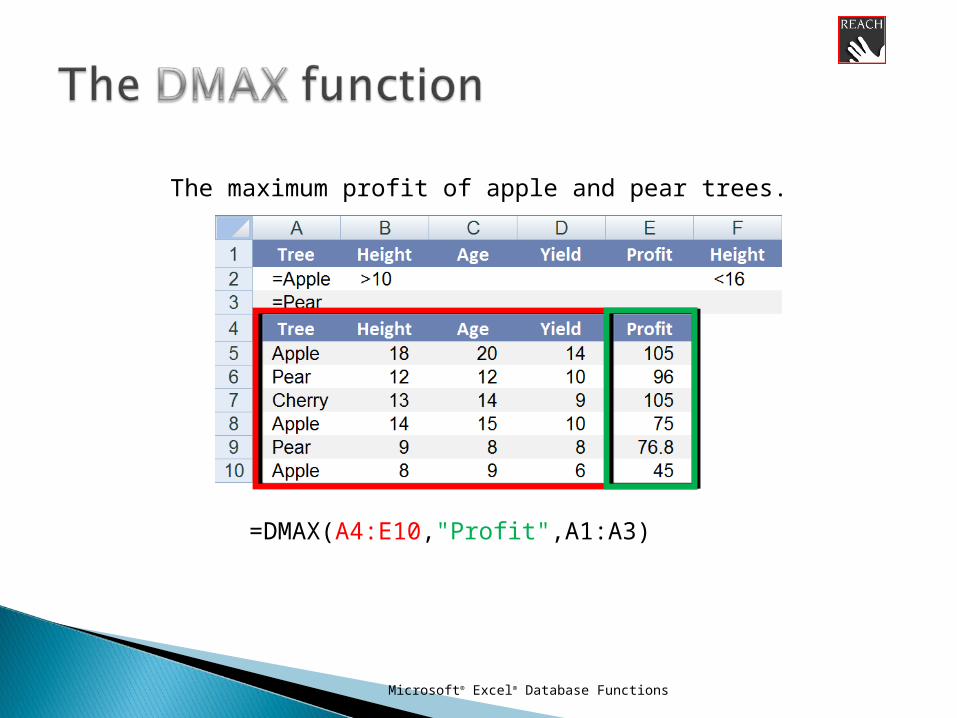
=DMAX(A4:E10,"Profit",A1:A3)
The maximum profit of apple and pear trees.
Microsoft® Excel® Database Functions
=DMAX(A4:E10,"Profit",A1:A3)
The maximum profit of apple and pear trees.

Microsoft® Excel® Database Functions
=DMAX(A4:E10,"Profit",A1:A3)
The maximum profit of apple and pear trees.
Microsoft® Excel® Database Functions
=DMAX(A4:E10,"Profit",A1:A3)=105
The maximum profit of apple and pear trees.
Microsoft® Excel® Database Functions
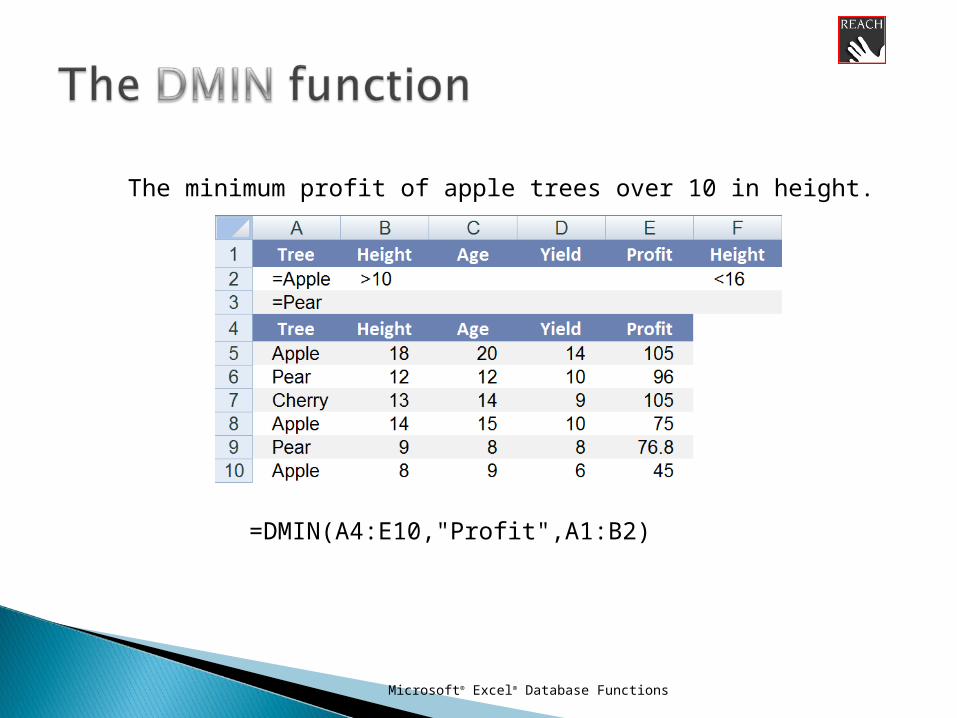
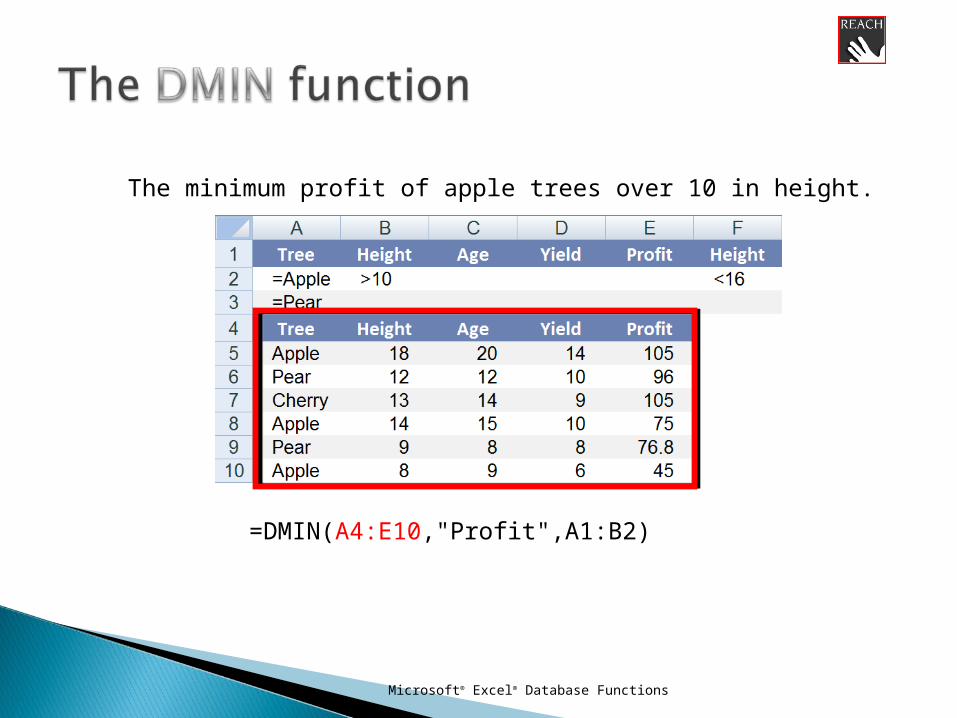
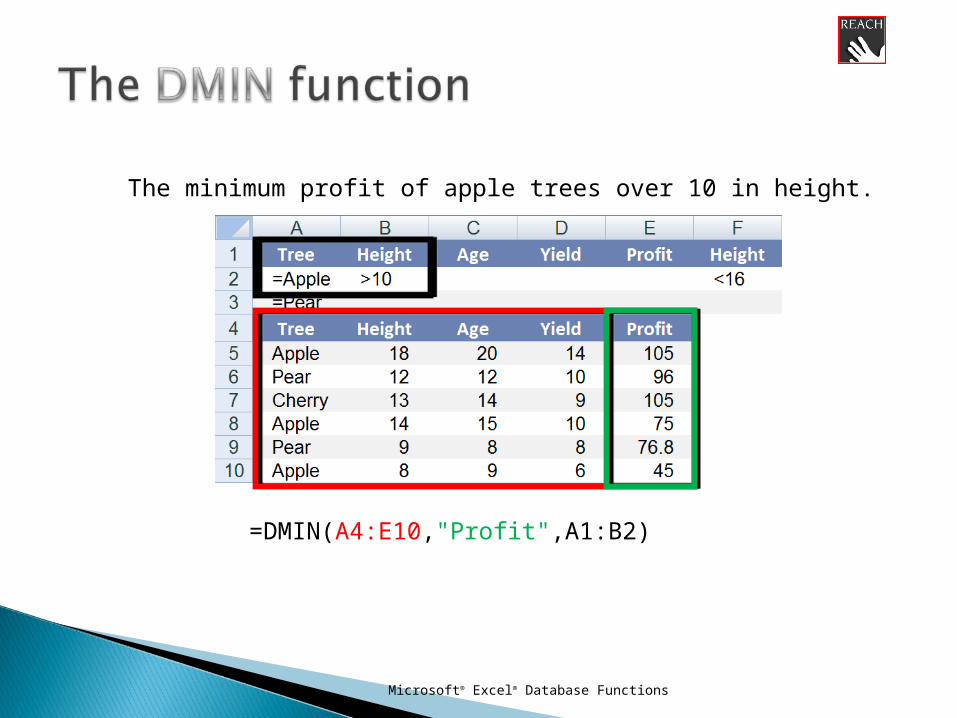
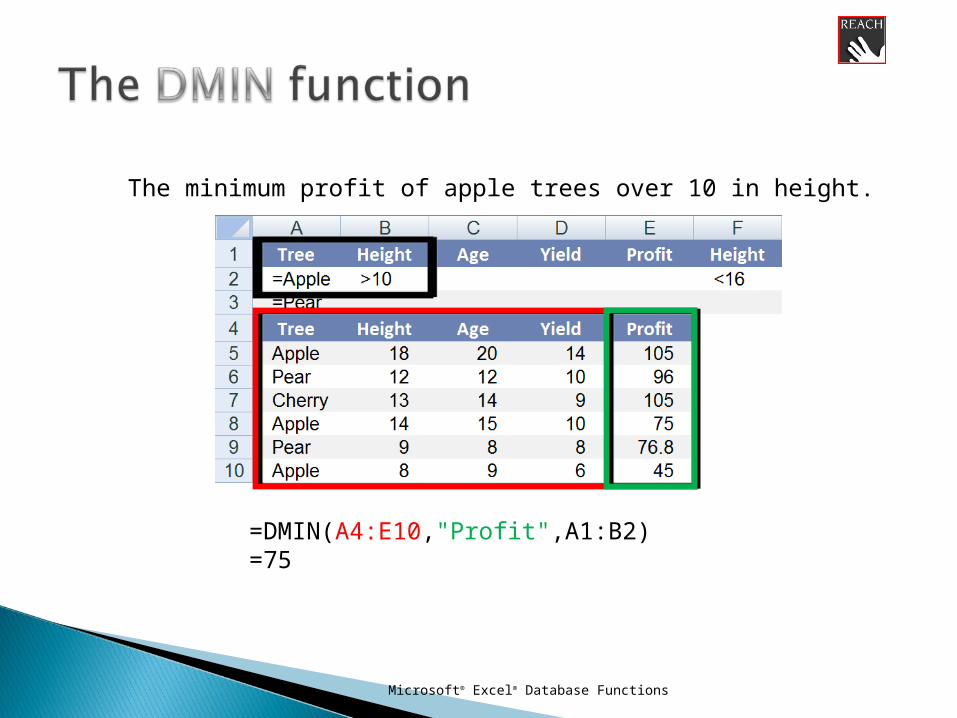
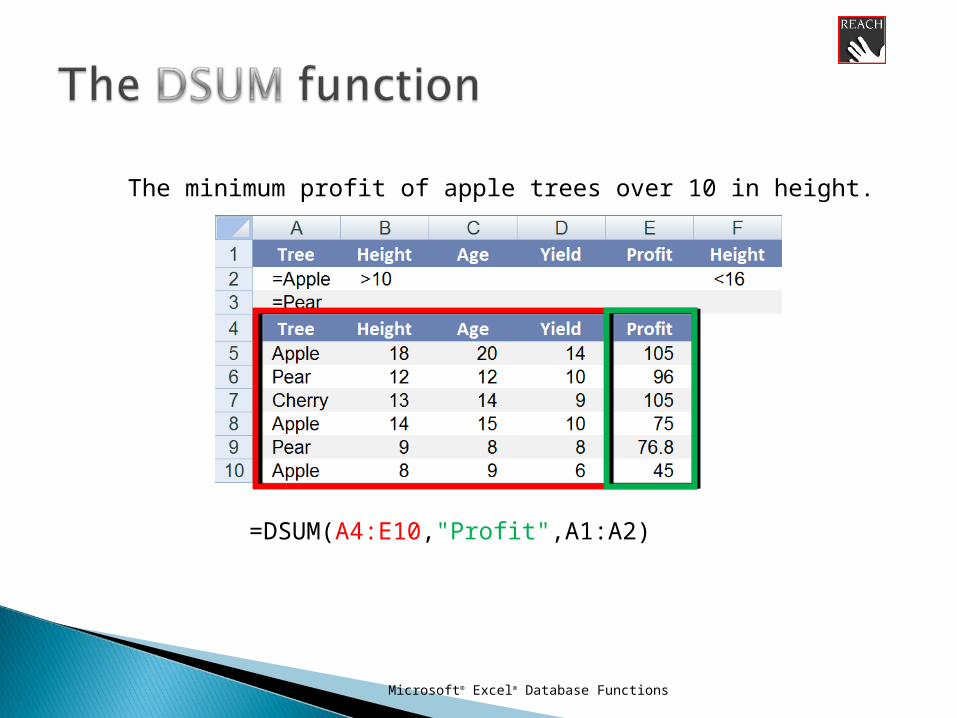
=DMIN(A4:E10,"Profit",A1:B2)
The minimum profit of apple trees over 10 in height.
Microsoft® Excel® Database Functions
=DMIN(A4:E10,"Profit",A1:B2)
The minimum profit of apple trees over 10 in height.

Microsoft® Excel® Database Functions
=DMIN(A4:E10,"Profit",A1:B2)
The minimum profit of apple trees over 10 in height.
Microsoft® Excel® Database Functions
=DMIN(A4:E10,"Profit",A1:B2)
The minimum profit of apple trees over 10 in height.
Microsoft® Excel® Database Functions
=DMIN(A4:E10,"Profit",A1:B2)=75
The minimum profit of apple trees over 10 in height.
Microsoft® Excel® Database Functions
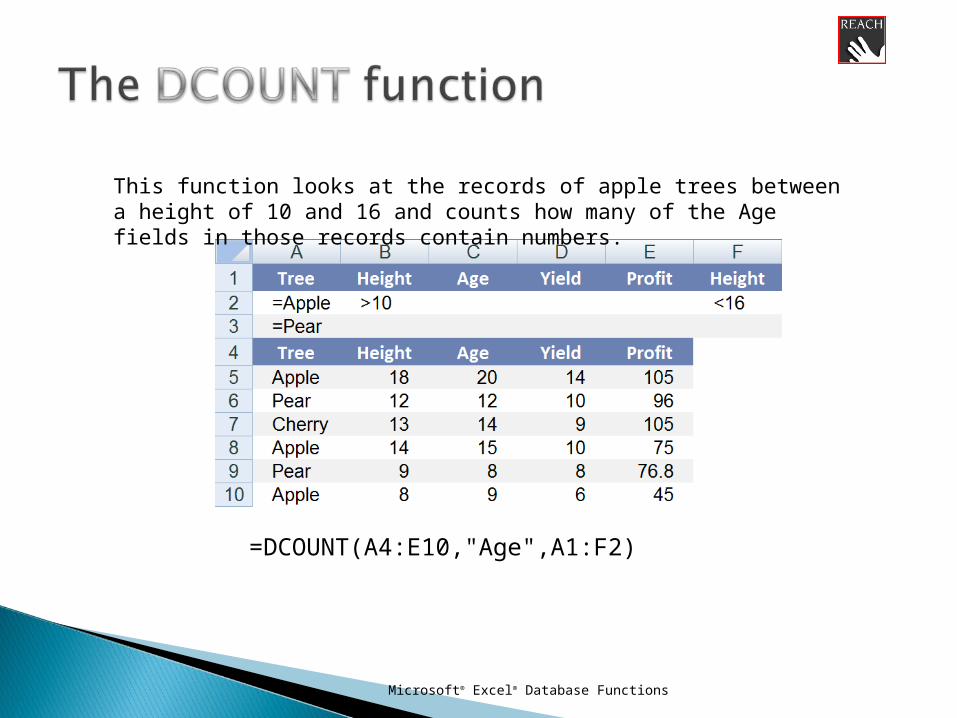
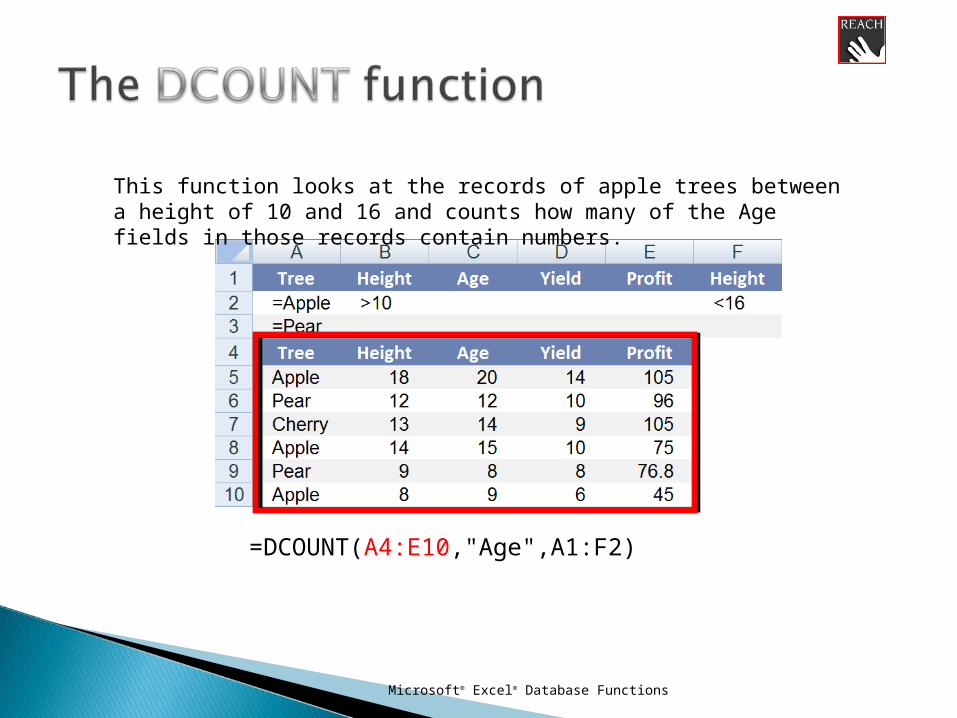
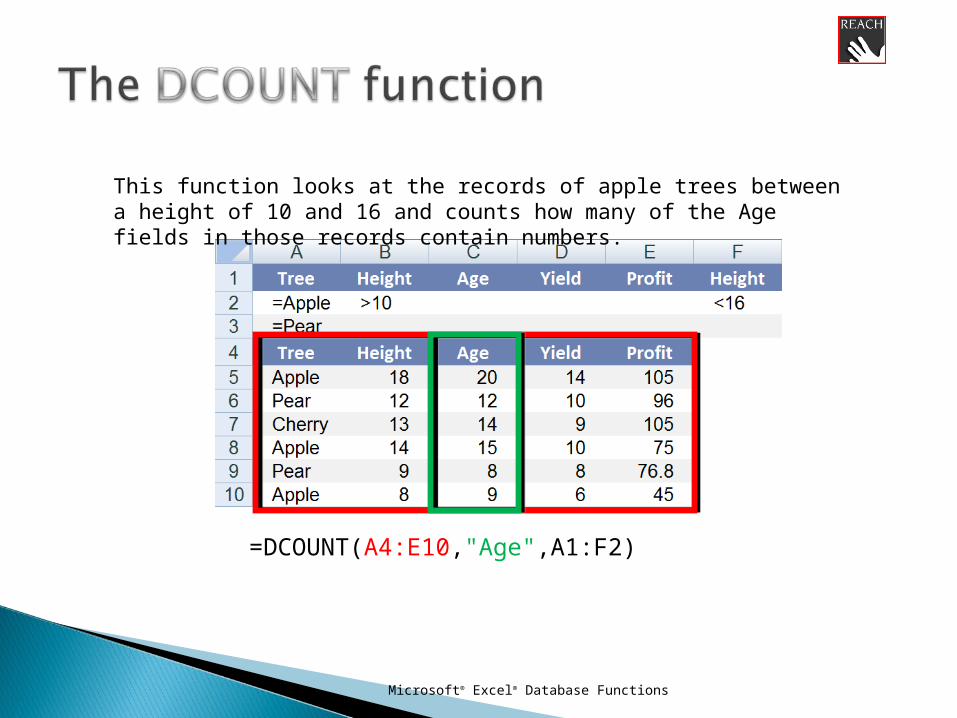
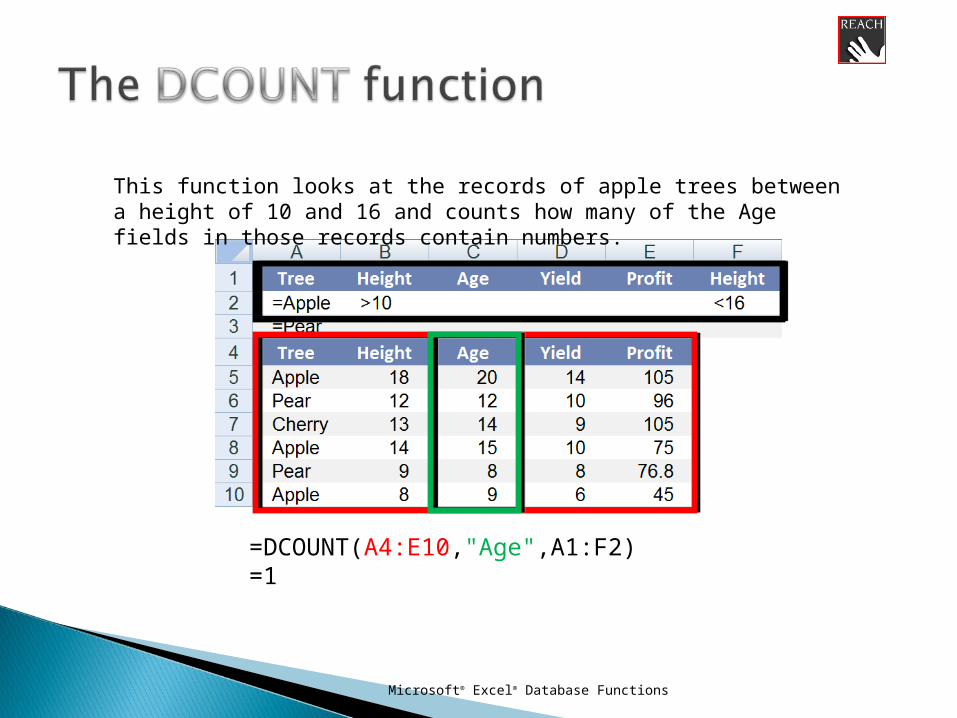
=DCOUNT(A4:E10,"Age",A1:F2)
This function looks at the records of apple trees between a height of 10 and 16 and counts how many of the Age fields in those records contain numbers.
Microsoft® Excel® Database Functions
=DCOUNT(A4:E10,"Age",A1:F2)
This function looks at the records of apple trees between a height of 10 and 16 and counts how many of the Age fields in those records contain numbers.
Microsoft® Excel® Database Functions
=DCOUNT(A4:E10,"Age",A1:F2)
This function looks at the records of apple trees between a height of 10 and 16 and counts how many of the Age fields in those records contain numbers.

Microsoft® Excel® Database Functions
=DCOUNT(A4:E10,"Age",A1:F2)
This function looks at the records of apple trees between a height of 10 and 16 and counts how many of the Age fields in those records contain numbers.
Microsoft® Excel® Database Functions
=DCOUNT(A4:E10,"Age",A1:F2)=1
This function looks at the records of apple trees between a height of 10 and 16 and counts how many of the Age fields in those records contain numbers.
Microsoft® Excel® Database Functions
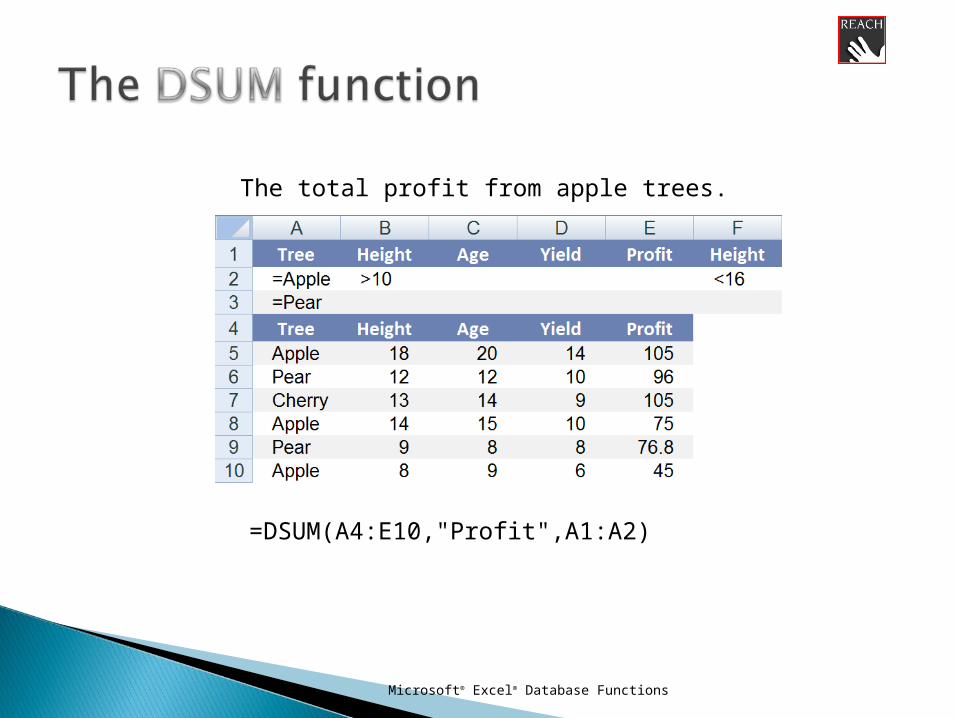
=DSUM(A4:E10,"Profit",A1:A2)
The total profit from apple trees.

Microsoft® Excel® Database Functions
=DSUM(A4:E10,"Profit",A1:A2)
The minimum profit of apple trees over 10 in height.
Microsoft® Excel® Database Functions
=DSUM(A4:E10,"Profit",A1:A2)
The minimum profit of apple trees over 10 in height.

Microsoft® Excel® Database Functions
=DSUM(A4:E10,"Profit",A1:A2)
The minimum profit of apple trees over 10 in height.

Microsoft® Excel® Database Functions
=DSUM(A4:E10,"Profit",A1:A2)=225
The minimum profit of apple trees over 10 in height.
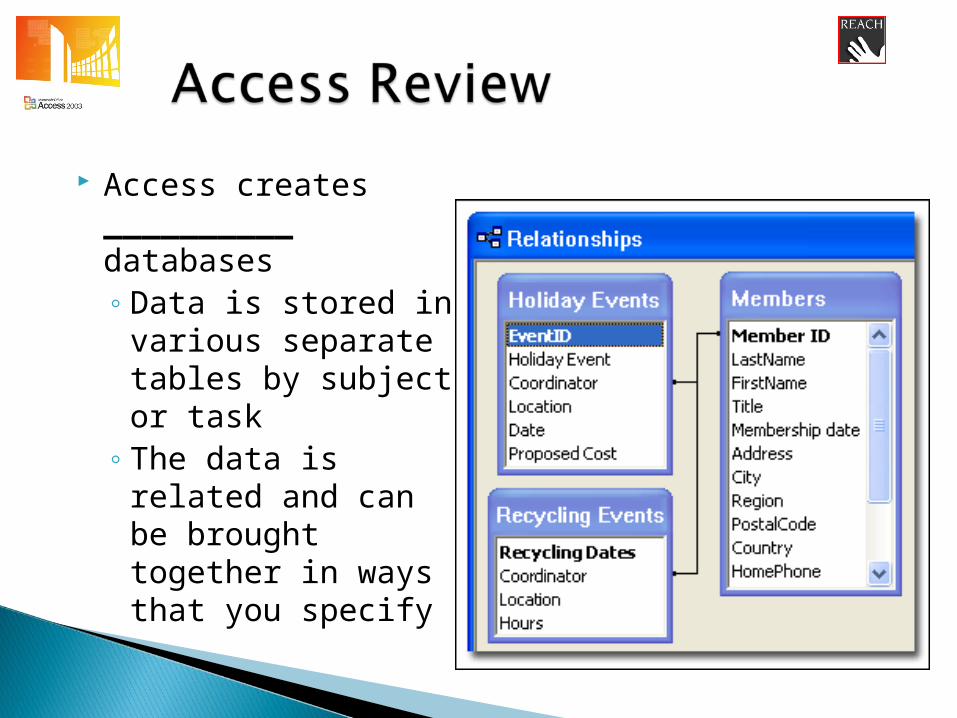
Access creates __________ databases ◦ Data is stored in
various separate tables by subject or task
◦ The data is related and can be brought together in ways that you specify
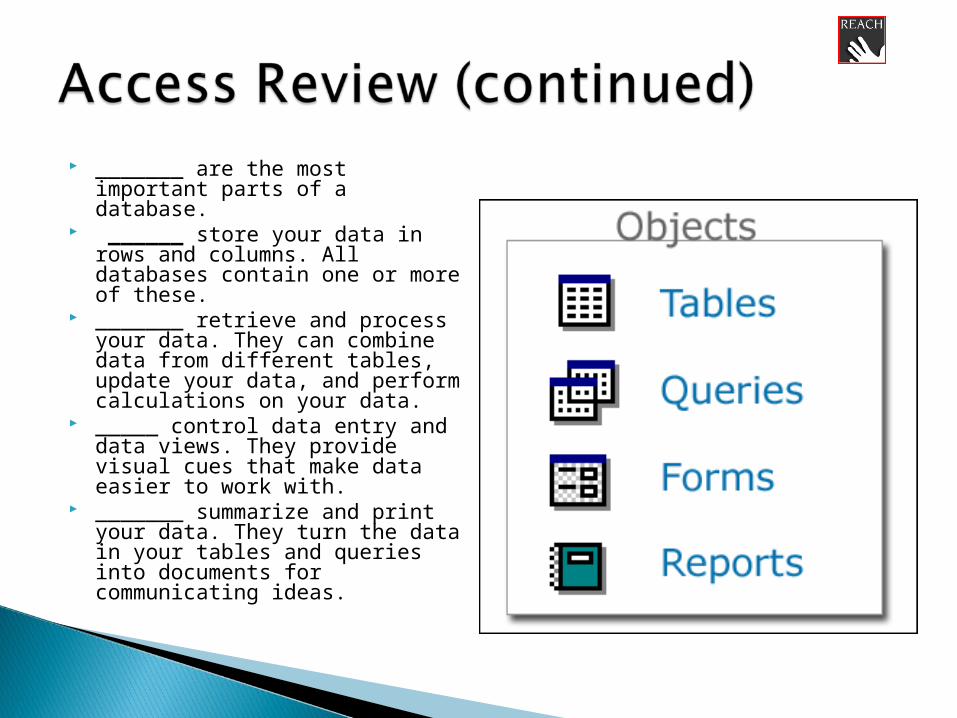
_______ are the most important parts of a database.
______ store your data in rows and columns. All databases contain one or more of these.
_______ retrieve and process your data. They can combine data from different tables, update your data, and perform calculations on your data.
_____ control data entry and data views. They provide visual cues that make data easier to work with.
_______ summarize and print your data. They turn the data in your tables and queries into documents for communicating ideas.
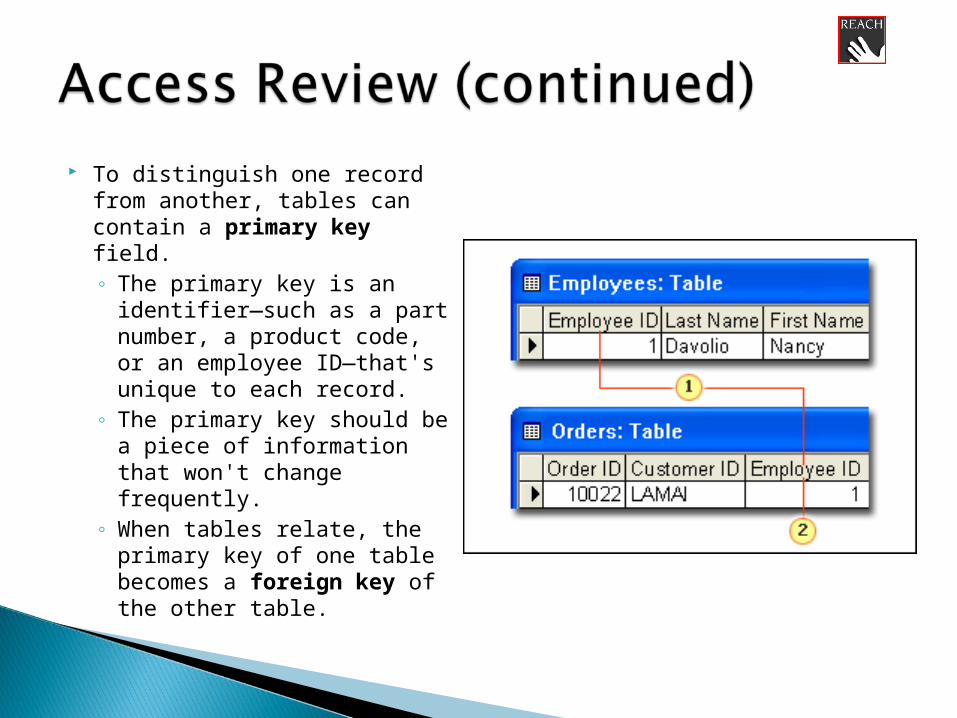
To distinguish one record from another, tables can contain a primary key field. ◦ The primary key is an
identifier—such as a part number, a product code, or an employee ID—that's unique to each record.
◦ The primary key should be a piece of information that won't change frequently.
◦ When tables relate, the primary key of one table becomes a foreign key of the other table.
Goal Seeking function Can work through multiple scenarios Can have Data tables Example:
◦ Find the interest rate that is needed to finance $20,000 car over 5 years (60 months) with a payment no more than $400.
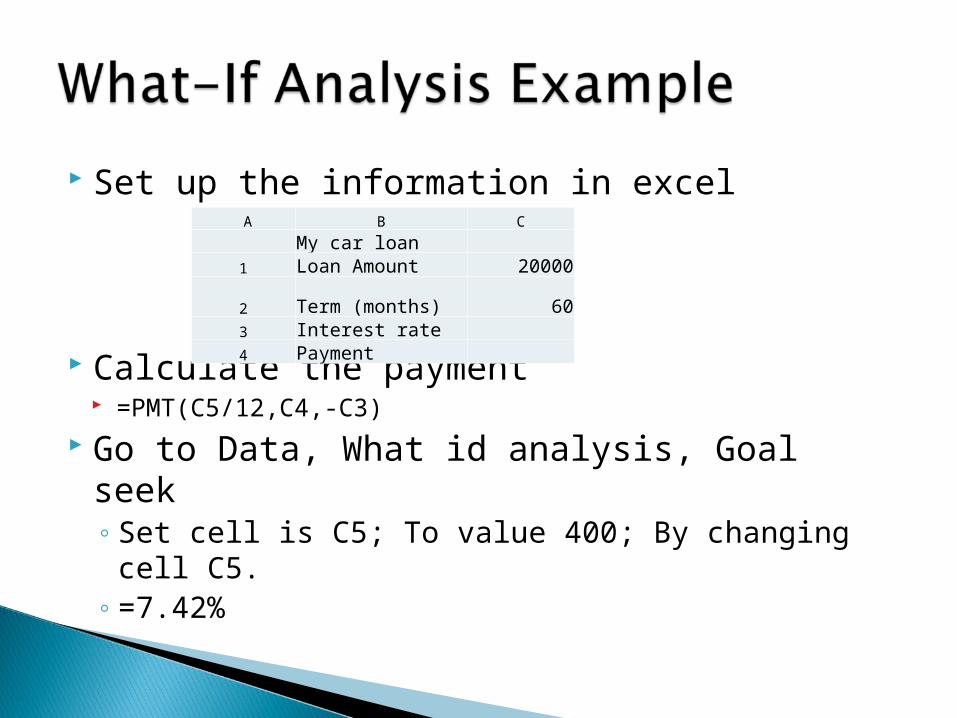
Set up the information in excel
Calculate the payment =PMT(C5/12,C4,-C3)
Go to Data, What id analysis, Goal seek◦ Set cell is C5; To value 400; By changing cell
C5.◦ =7.42%
A B C
My car loan1 Loan Amount 20000
2 Term (months) 603 Interest rate4 Payment
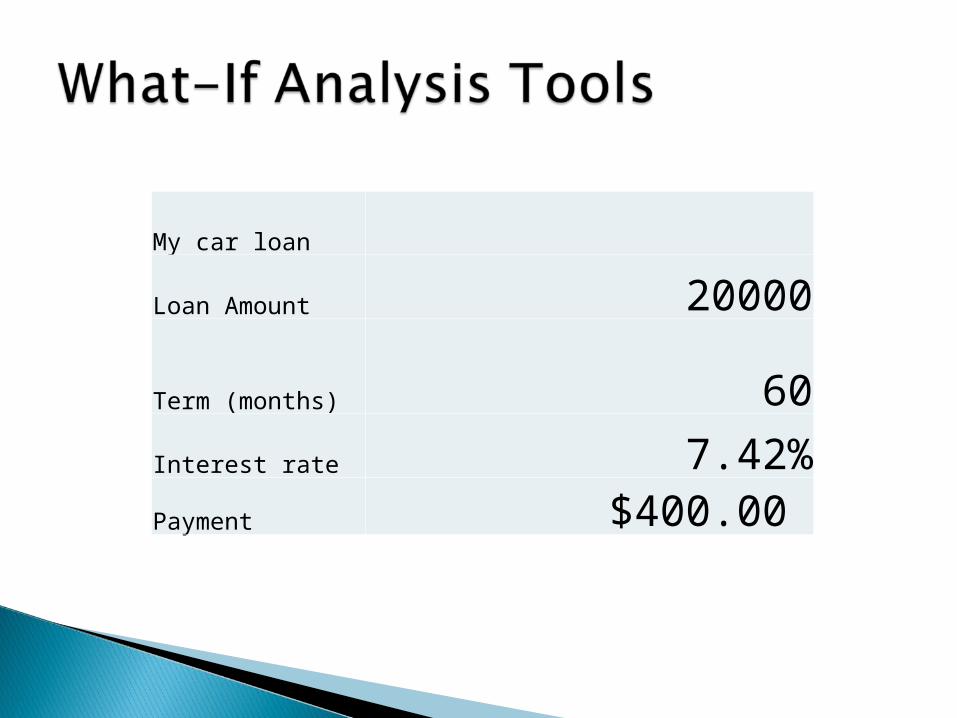
My car loan
Loan Amount 20000
Term (months) 60
Interest rate 7.42%Payment $400.00