Embed Size (px)
Citation preview
REACCION DE MAILLARD
M.S.c. Br. LUIS ARTICA M.
17
A. INTRODUCCIÓN GENERAL
El procesado de alimentos se puede considerar como el conjunto de prácticas que utilizan
tecnologías y técnicas para transformar los alimentos crudos o productos intermedios en
alimentos listos para el consumo (Lineback y Stadler, 2009). La salazón y el secado fueron dos
de los primeros métodos utilizados por el hombre para transformar alimentos con el fin de
preservarlos y mejorar su sabor. El procesamiento de los alimentos ha permitido avanzar en el
abastecimiento alimentario al prolongar su vida útil y aumentar la variedad de los productos
disponibles. Sin embargo, tanto los hábitos alimentarios como las técnicas de procesado de
alimentos han ido evolucionando a lo largo de los años. Se ha pasado de cubrir meramente las
necesidades basadas en la supervivencia del hombre, a cubrir las demandas que los
ciudadanos plantean en las sociedades desarrolladas: calidad nutricional, sensorial y seguridad
alimentaria.
El tratamiento térmico es uno de los procesos más ampliamente utilizados como método de
preparación de los alimentos tanto en la industria alimentaria como en el hogar. La forma en la
que el alimento es procesado, directamente sobre el fuego, hervido, asado, frito, etc., así
como la temperatura y la duración del mismo influyen drásticamente sobre los cambios
químicos y la naturaleza de los productos originados. Debido a este proceso, los consituyentes
de los alimentos experimentan una serie de reacciones, muchas de las cuales son responsables
del aroma, color, textura y sabor, pero otras están asociadas con la generación de compuestos
potencialmente tóxicos. Aunque la presencia de estas sustancias tóxicas puede ser causa de
alarma, siempre es necesario evaluar en un contexto amplio los beneficios y riesgos que
presentan los alimentos procesados para llegar a una evaluación de riesgo eficaz y realista
hacia la población. En este sentido, el Comité Científico de la Agencia Europea de Seguridad
Alimentaria (EFSA) desarrolló una guía en el año 2010 cuyo propósito es la evaluación de los
riesgos y beneficios de los alimentos con respecto a la salud humana (EFSA, 2010).
18
B. REACCIÓN DE MAILLARD EN ALIMENTOS
1. Aspectos generales
La RM ha sido reconocida durante más de 60 años como la principal ruta implicada en las
propiedades organolépticas de los alimentos tratados térmicamente, y en general, en la
aceptabilidad de los mismos (Kawamura, 1983). Se inicia por la condensación entre un grupo
amino libre de un aminoácido, péptido o proteína y el grupo carbonilo de azúcares reductores
o de lípidos oxidados. Posteriormente, y mediante una serie de reacciones complejas da lugar
a los denominados, de manera genérica, productos de la reacción de Maillard (PRM). Los PRM
están presentes en la mayoría de los alimentos que se consumen en la dieta de países
occidentales. La RM es especialmente importante para la industria alimentaria, ya que se
desarrolla durante los procesos de tostado, horneado o cocinado entre otros, confiriendo a los
alimentos nuevos aromas, sabores y colores agradables para el consumidor (Hodge, 1967;
Mottram, 1994).
Se estima que aproximadamente el 80‐90% de los alimentos consumidos en los hogares son
procesados en alguna medida, de ahí la importancia de considerar los efectos beneficiosos del
tratamiento sobre la seguridad y la calidad de los productos (Van Boekel y col., 2010). Aparte
de su influencia en las propiedades organolépticas, la RM está implicada en otros aspectos
entre los que se incluyen el deterioro de los alimentos durante su procesado y
almacenamiento y el efecto protector de determinados PRM con propiedades antioxidantes y
antimicrobianas. Sin embargo, la RM también está implicada en la formación de sustancias
perjudiciales, como las aminas heterocíclicas o el furano que se describen en el siguiente
capítulo, así como en la formación de HMF y acrilamida, objeto de estudio en la presente
Memoria.
2. Química de la reacción de Maillard
La RM fue descrita por primera vez en 1912 por el químico francés Louis Camille Maillard
(Maillard, 1912). Sin embargo, fue John Hodge quien en 1953 propuso por primera vez un
REACCIÓN DE MAILLARD ……..……………………………………………........
19
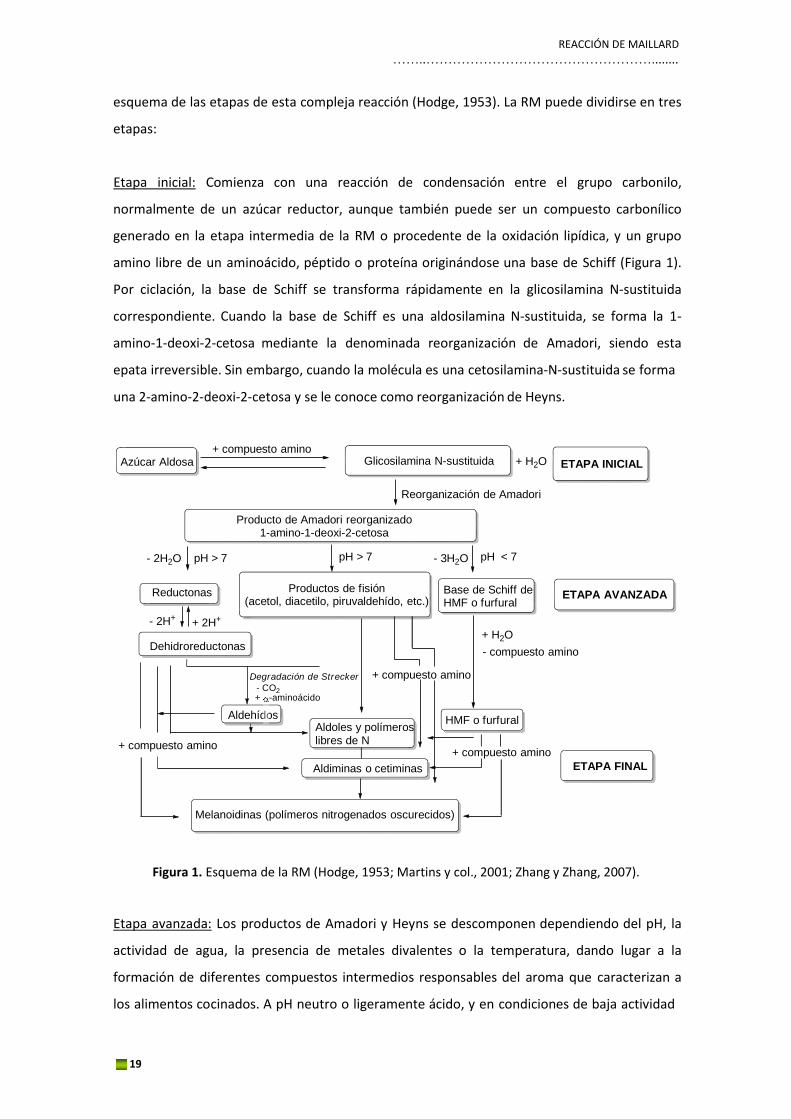
Azúcar Aldosa Glicosilamina N-sustituida
Producto de Amadori reorganizado 1-amino-1-deoxi-2-cetosa
Reductonas
Productos de fisión (acetol, diacetilo, piruvaldehído, etc.)
Base de Schiff de HMF o furfural
Dehidroreductonas
Aldehídos HMF o furfural Aldoles y polímeros libres de N
Aldiminas o cetiminas
Melanoidinas (polímeros nitrogenados oscurecidos)
ETAPA INICIAL
ETAPA AVANZADA
ETAPA FINAL
esquema de las etapas de esta compleja reacción (Hodge, 1953). La RM puede dividirse en tres
etapas:
Etapa inicial: Comienza con una reacción de condensación entre el grupo carbonilo,
normalmente de un azúcar reductor, aunque también puede ser un compuesto carbonílico
generado en la etapa intermedia de la RM o procedente de la oxidación lipídica, y un grupo
amino libre de un aminoácido, péptido o proteína originándose una base de Schiff (Figura 1).
Por ciclación, la base de Schiff se transforma rápidamente en la glicosilamina N‐sustituida
correspondiente. Cuando la base de Schiff es una aldosilamina N‐sustituida, se forma la 1‐
amino‐1‐deoxi‐2‐cetosa mediante la denominada reorganización de Amadori, siendo esta
epata irreversible. Sin embargo, cuando la molécula es una cetosilamina‐N‐sustituida se forma
una 2‐amino‐2‐deoxi‐2‐cetosa y se le conoce como reorganización de Heyns.
+ compuesto amino + H2O
Reorganización de Amadori
- 2H2O pH > 7 pH > 7 - 3H2O pH < 7
- 2H+
+ 2H+
Degr adación de Str ecker
- CO2
+ compuesto amino
+ H2O
- compuesto amino
+ -aminoácido
+ compuesto amino
+ compuesto amino
Figura 1. Esquema de la RM (Hodge, 1953; Martins y col., 2001; Zhang y Zhang, 2007).
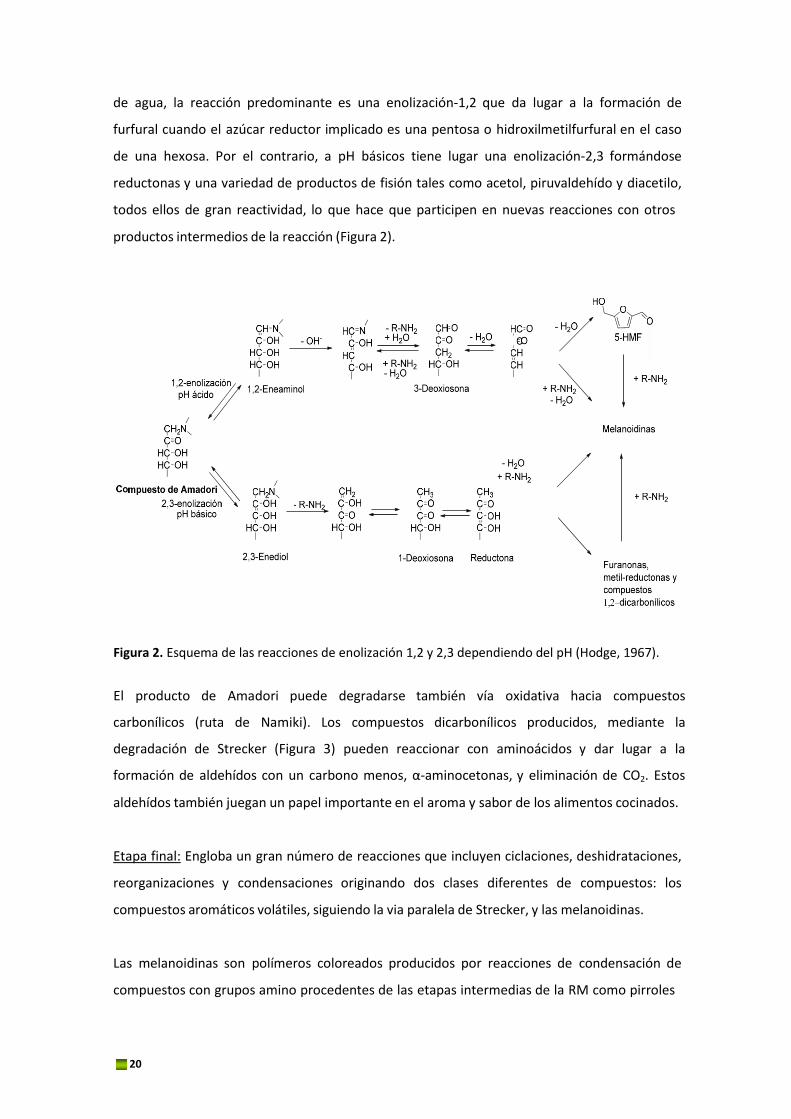
Etapa avanzada: Los productos de Amadori y Heyns se descomponen dependiendo del pH, la
actividad de agua, la presencia de metales divalentes o la temperatura, dando lugar a la
formación de diferentes compuestos intermedios responsables del aroma que caracterizan a
los alimentos cocinados. A pH neutro o ligeramente ácido, y en condiciones de baja actividad
20
de agua, la reacción predominante es una enolización‐1,2 que da lugar a la formación de
furfural cuando el azúcar reductor implicado es una pentosa o hidroxilmetilfurfural en el caso
de una hexosa. Por el contrario, a pH básicos tiene lugar una enolización‐2,3 formándose
reductonas y una variedad de productos de fisión tales como acetol, piruvaldehído y diacetilo,
todos ellos de gran reactividad, lo que hace que participen en nuevas reacciones con otros
productos intermedios de la reacción (Figura 2).
Figura 2. Esquema de las reacciones de enolización 1,2 y 2,3 dependiendo del pH (Hodge, 1967).
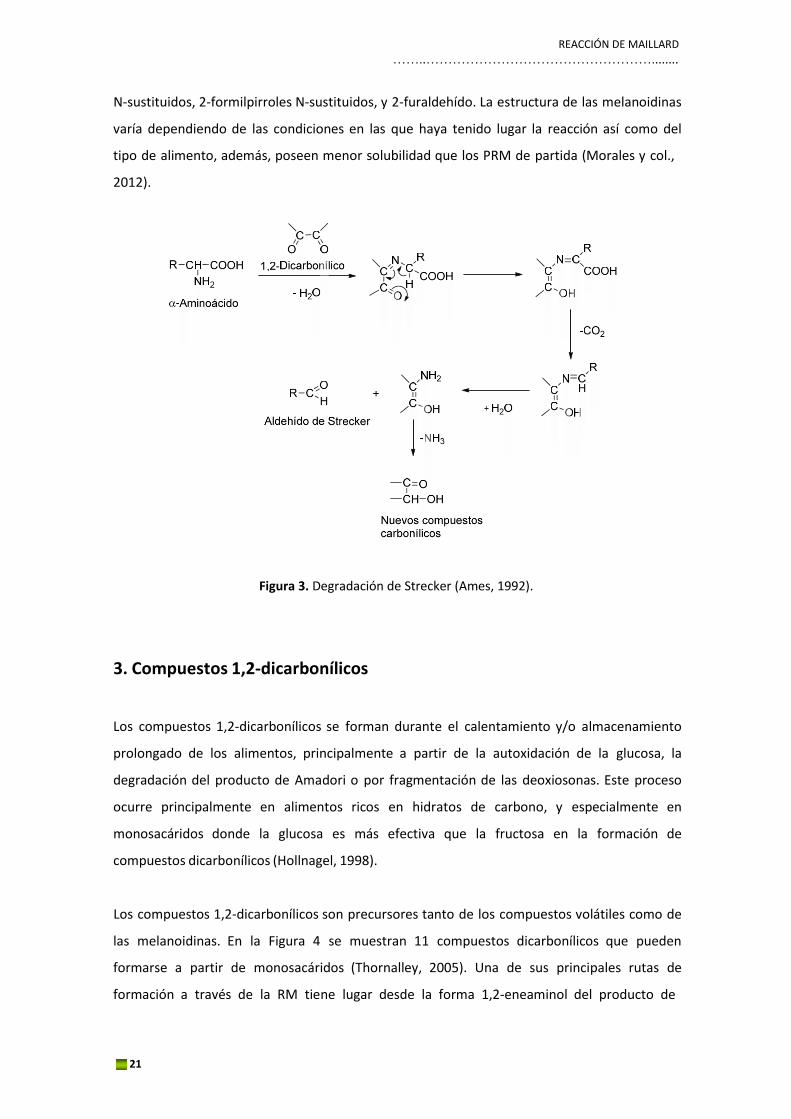
El producto de Amadori puede degradarse también vía oxidativa hacia compuestos
carbonílicos (ruta de Namiki). Los compuestos dicarbonílicos producidos, mediante la
degradación de Strecker (Figura 3) pueden reaccionar con aminoácidos y dar lugar a la
formación de aldehídos con un carbono menos, α‐aminocetonas, y eliminación de CO2. Estos
aldehídos también juegan un papel importante en el aroma y sabor de los alimentos cocinados.
Etapa final: Engloba un gran número de reacciones que incluyen ciclaciones, deshidrataciones,
reorganizaciones y condensaciones originando dos clases diferentes de compuestos: los
compuestos aromáticos volátiles, siguiendo la via paralela de Strecker, y las melanoidinas.
Las melanoidinas son polímeros coloreados producidos por reacciones de condensación de
compuestos con grupos amino procedentes de las etapas intermedias de la RM como pirroles
REACCIÓN DE MAILLARD ……..……………………………………………........
21
N‐sustituidos, 2‐formilpirroles N‐sustituidos, y 2‐furaldehído. La estructura de las melanoidinas
varía dependiendo de las condiciones en las que haya tenido lugar la reacción así como del
tipo de alimento, además, poseen menor solubilidad que los PRM de partida (Morales y col.,
2012).
Figura 3. Degradación de Strecker (Ames, 1992).
3. Compuestos 1,2‐dicarbonílicos
Los compuestos 1,2‐dicarbonílicos se forman durante el calentamiento y/o almacenamiento
prolongado de los alimentos, principalmente a partir de la autoxidación de la glucosa, la
degradación del producto de Amadori o por fragmentación de las deoxiosonas. Este proceso
ocurre principalmente en alimentos ricos en hidratos de carbono, y especialmente en
monosacáridos donde la glucosa es más efectiva que la fructosa en la formación de
compuestos dicarbonílicos (Hollnagel, 1998).
Los compuestos 1,2‐dicarbonílicos son precursores tanto de los compuestos volátiles como de
las melanoidinas. En la Figura 4 se muestran 11 compuestos dicarbonílicos que pueden
formarse a partir de monosacáridos (Thornalley, 2005). Una de sus principales rutas de
formación a través de la RM tiene lugar desde la forma 1,2‐eneaminol del producto de
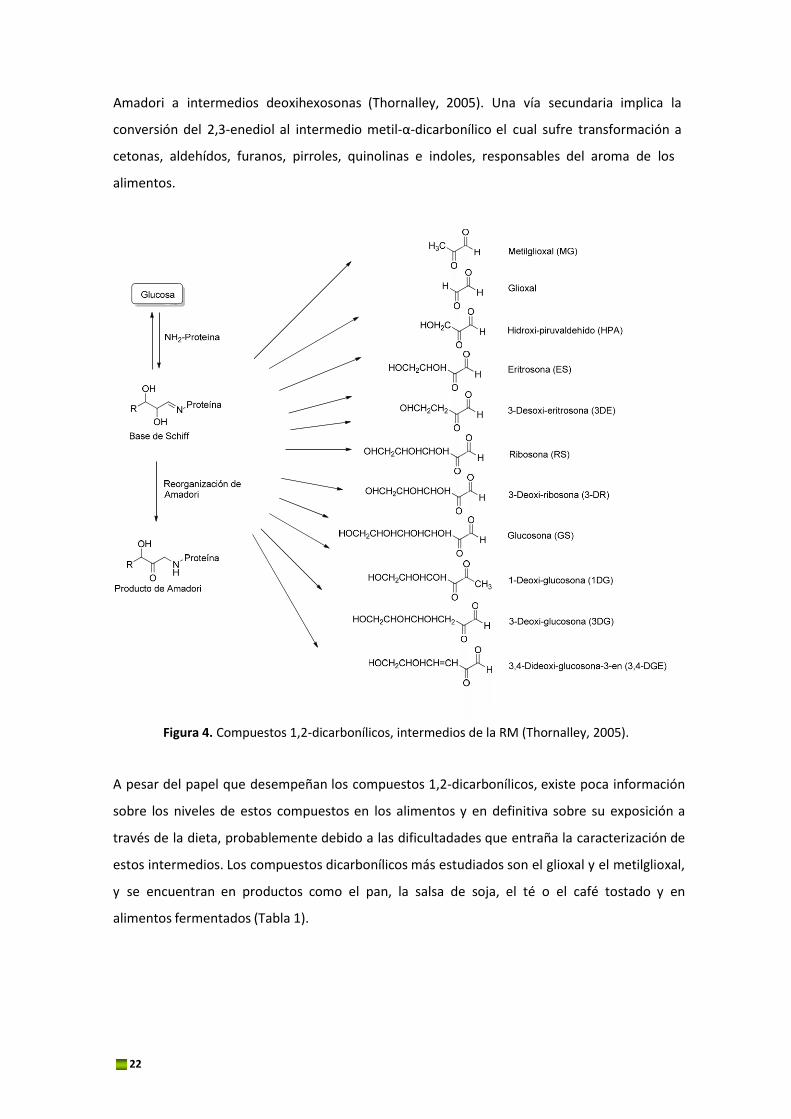
22
Amadori a intermedios deoxihexosonas (Thornalley, 2005). Una vía secundaria implica la
conversión del 2,3‐enediol al intermedio metil‐α‐dicarbonílico el cual sufre transformación a
cetonas, aldehídos, furanos, pirroles, quinolinas e indoles, responsables del aroma de los
alimentos.
Figura 4. Compuestos 1,2‐dicarbonílicos, intermedios de la RM (Thornalley, 2005).
A pesar del papel que desempeñan los compuestos 1,2‐dicarbonílicos, existe poca información
sobre los niveles de estos compuestos en los alimentos y en definitiva sobre su exposición a
través de la dieta, probablemente debido a las dificultadades que entraña la caracterización de
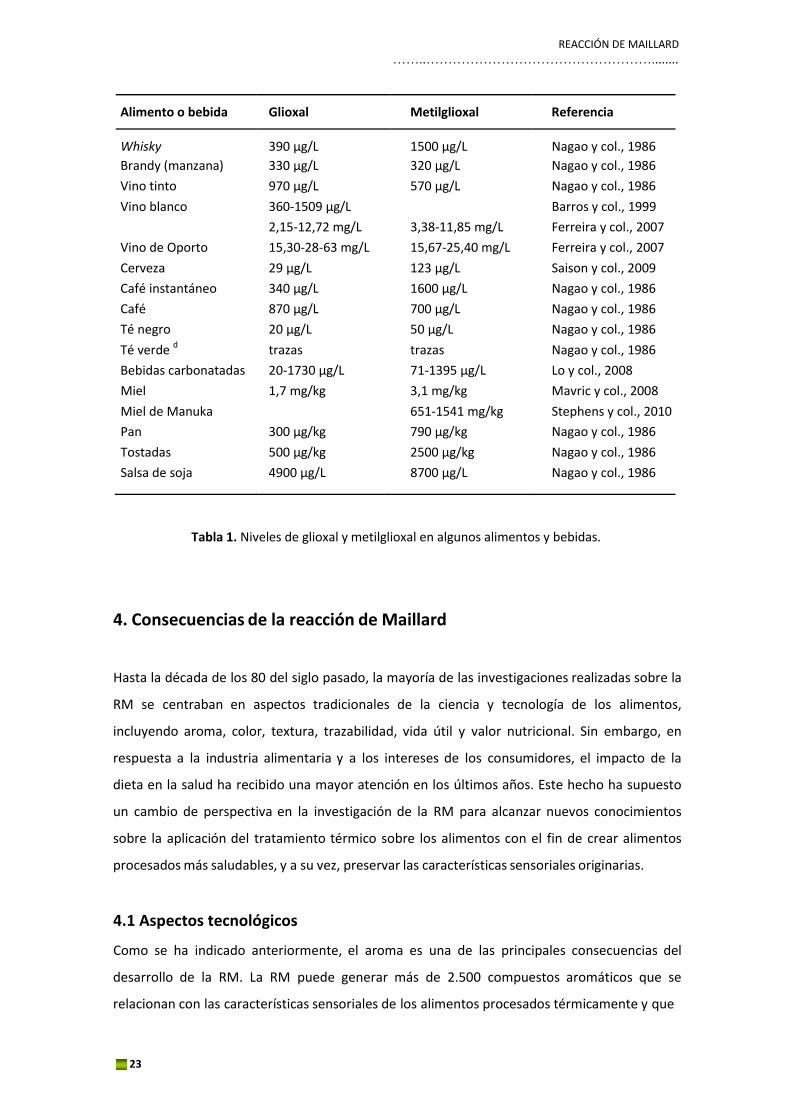
estos intermedios. Los compuestos dicarbonílicos más estudiados son el glioxal y el metilglioxal,
y se encuentran en productos como el pan, la salsa de soja, el té o el café tostado y en
alimentos fermentados (Tabla 1).
REACCIÓN DE MAILLARD ……..……………………………………………........
23
Alimento o bebida
Glioxal
Metilglioxal
Referencia
Whisky
390 μg/L
1500 μg/L
Nagao y col., 1986
Brandy (manzana) 330 μg/L 320 μg/L Nagao y col., 1986
Vino tinto 970 μg/L 570 μg/L Nagao y col., 1986
Vino blanco 360‐1509 μg/L Barros y col., 1999
2,15‐12,72 mg/L 3,38‐11,85 mg/L Ferreira y col., 2007
Vino de Oporto 15,30‐28‐63 mg/L 15,67‐25,40 mg/L Ferreira y col., 2007
Cerveza 29 μg/L 123 μg/L Saison y col., 2009
Café instantáneo 340 μg/L 1600 μg/L Nagao y col., 1986
Café 870 μg/L 700 μg/L Nagao y col., 1986
Té negro
Té verde d
20 μg/L
trazas
50 μg/L
trazas
Nagao y col., 1986
Nagao y col., 1986
Bebidas carbonatadas 20‐1730 μg/L 71‐1395 μg/L Lo y col., 2008
Miel 1,7 mg/kg 3,1 mg/kg Mavric y col., 2008
Miel de Manuka 651‐1541 mg/kg Stephens y col., 2010
Pan 300 μg/kg 790 μg/kg Nagao y col., 1986
Tostadas 500 μg/kg 2500 μg/kg Nagao y col., 1986
Salsa de soja 4900 μg/L 8700 μg/L Nagao y col., 1986
Tabla 1. Niveles de glioxal y metilglioxal en algunos alimentos y bebidas.
4. Consecuencias de la reacción de Maillard
Hasta la década de los 80 del siglo pasado, la mayoría de las investigaciones realizadas sobre la
RM se centraban en aspectos tradicionales de la ciencia y tecnología de los alimentos,
incluyendo aroma, color, textura, trazabilidad, vida útil y valor nutricional. Sin embargo, en
respuesta a la industria alimentaria y a los intereses de los consumidores, el impacto de la
dieta en la salud ha recibido una mayor atención en los últimos años. Este hecho ha supuesto
un cambio de perspectiva en la investigación de la RM para alcanzar nuevos conocimientos
sobre la aplicación del tratamiento térmico sobre los alimentos con el fin de crear alimentos
procesados más saludables, y a su vez, preservar las características sensoriales originarias.
4.1 Aspectos tecnológicos
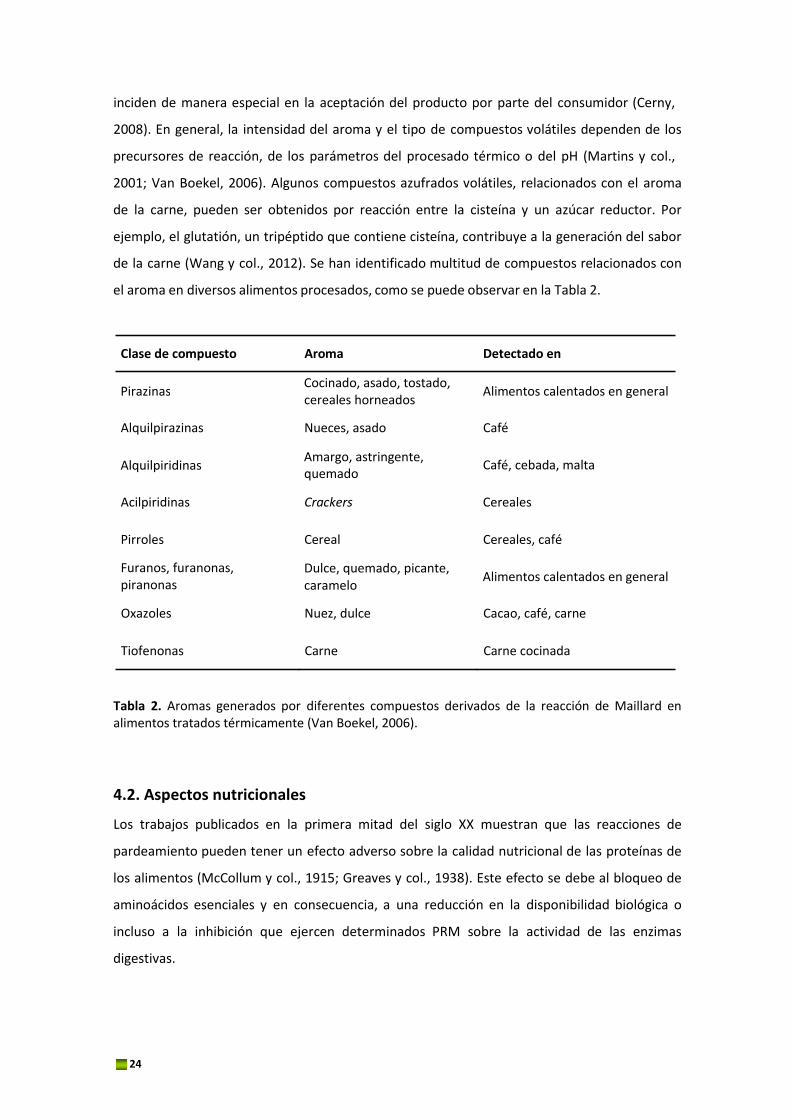
Como se ha indicado anteriormente, el aroma es una de las principales consecuencias del
desarrollo de la RM. La RM puede generar más de 2.500 compuestos aromáticos que se
relacionan con las características sensoriales de los alimentos procesados térmicamente y que
24
Pirazinas
Alquilpiridinas
inciden de manera especial en la aceptación del producto por parte del consumidor (Cerny,
2008). En general, la intensidad del aroma y el tipo de compuestos volátiles dependen de los
precursores de reacción, de los parámetros del procesado térmico o del pH (Martins y col.,
2001; Van Boekel, 2006). Algunos compuestos azufrados volátiles, relacionados con el aroma
de la carne, pueden ser obtenidos por reacción entre la cisteína y un azúcar reductor. Por
ejemplo, el glutatión, un tripéptido que contiene cisteína, contribuye a la generación del sabor
de la carne (Wang y col., 2012). Se han identificado multitud de compuestos relacionados con
el aroma en diversos alimentos procesados, como se puede observar en la Tabla 2.
Clase de compuesto Aroma Detectado en
Cocinado, asado, tostado,
cereales horneados Alimentos calentados en general
Alquilpirazinas Nueces, asado Café
Amargo, astringente,
quemado Café, cebada, malta
Acilpiridinas Crackers Cereales
Pirroles Cereal Cereales, café
Furanos, furanonas, piranonas
Dulce, quemado, picante,
caramelo Alimentos calentados en general
Oxazoles Nuez, dulce Cacao, café, carne
Tiofenonas Carne Carne cocinada
Tabla 2. Aromas generados por diferentes compuestos derivados de la reacción de Maillard en alimentos tratados térmicamente (Van Boekel, 2006).
4.2. Aspectos nutricionales
Los trabajos publicados en la primera mitad del siglo XX muestran que las reacciones de
pardeamiento pueden tener un efecto adverso sobre la calidad nutricional de las proteínas de
los alimentos (McCollum y col., 1915; Greaves y col., 1938). Este efecto se debe al bloqueo de
aminoácidos esenciales y en consecuencia, a una reducción en la disponibilidad biológica o
incluso a la inhibición que ejercen determinados PRM sobre la actividad de las enzimas
digestivas.
REACCIÓN DE MAILLARD ……..……………………………………………........
25
La lisina es el aminoácido comúnmente más reactivo hacia la RM y su pérdida de disponibilidad,
pudiendo llegar hasta un 50%, es la consecuencia más significativa del progreso de la RM
(Rerat y col., 2002). Esta consecuencia es importante en los alimentos en los cuales la lisina es
el aminoácido limitante (Meade y col., 2005). Por ejemplo, Rufián‐Henares y col. estimaron
desde un 0,1 hasta un 36,7% el contenido de lisina no disponible en suplementos para
deportistas a base de proteínas lácteas (Rufián‐Henares y col., 2007). Durante el tratamiento
térmico, se produce también la oxidación y la destrucción de otros aminoácidos esenciales
como la metionina y el triptófano y la participación de los restos arginina e histidina en el
entrecruzamiento de proteínas (Morales y col., 2007).
Las vitaminas también pueden verse afectadas por la RM. En muestras de leche infantiles se ha
comprobado que las condiciones de almacenamiento promovieron la RM provocando pérdidas
de determinadas vitaminas como la tiamina, el ácido pantoténico, y las vitaminas B6 y B12. En lo
que a la vitamina C se refiere, es particularmente propensa a la degradación tanto durante el
almacenamiento, debido a su alta susceptibilidad a la oxidación, como durante el tratamiento
térmico generando diferentes compuestos, especialmente el furano. Sin embargo, en
muestras de leche infantiles fortificadas no se observó ningún efecto significativo en la
degradación de la vitamina C durante el almacenamiento (Gliguem y col., 2005).
El efecto de los PRM sobre la biodisponibilidad mineral se atribuye a su comportamiento como
agentes quelantes de metales. En 1976, Hrdlicka observó que cuando sales de Fe3+ o Cu2+ se
calientan junto a una mezcla de glucosa‐glicina o fructosa‐glicina originan pigmentos
(melanoidinas) capaces de formar complejos estables con estos cationes, pudiendo influir en
su biodisponibilidad (Hrdlicka, 1976). Del mismo modo, se ha comprobado en animales de
experimentación y en humanos, que los PRM modifican la excreción urinaria del zinc y también
de otros elementos como el cobre, hierro y calcio. En concreto, ensayos llevados a cabo en
ratas, han mostrado la relación entre los PRM y algunos minerales como el calcio, magnesio
(Delgado‐Andrade y col., 2007a), zinc (Navarro y col., 2000), hierro y cobre (Hurrel, 1990).
El tratamiento térmico produce cambios estructurales en las proteínas, lo cual provoca una
menor solubilidad y una menor susceptibilidad a la acción de las enzimas digestivas. Además,
determinados PRM pueden inhibir la actividad de la carboxipeptidasa A y aminopeptidasa N
(Öste y col., 1986). En concreto, se ha descrito que el HMF es un inhibidor de la
carboxipeptidasa A (Öste y col., 1987).
26
Los PRM, como las melanoidinas, son capaces de inhibir el crecimiento microbiano influyendo,
de esta manera, en la vida útil de los alimentos (Rufián‐Henares y Morales, 2007). Los primeros
estudios fueron realizados utilizando sistemas modelo, constituidos por azúcares, aminoácidos
y café. Daglia y col. demostraron que la actividad antibacteriana de las melanoidinas del café
depende del grado de tueste y no del procedimiento aplicado para prepararlo (Daglia y col.,
1994). Las melanoidinas pueden ejercer acción antimicrobiana mediante una actividad tanto
bacteriostática como bactericida dependiendo de la concentración de melanoidinas, del pH y
de la temperatura del medio, así como del peso molecular y la estructura de los PRM (Rufián‐
Henares y de la Cueva, 2009).
CONTAMINANTES QUÍMICOS DE PROCESADO ……..……………………………………………........
27
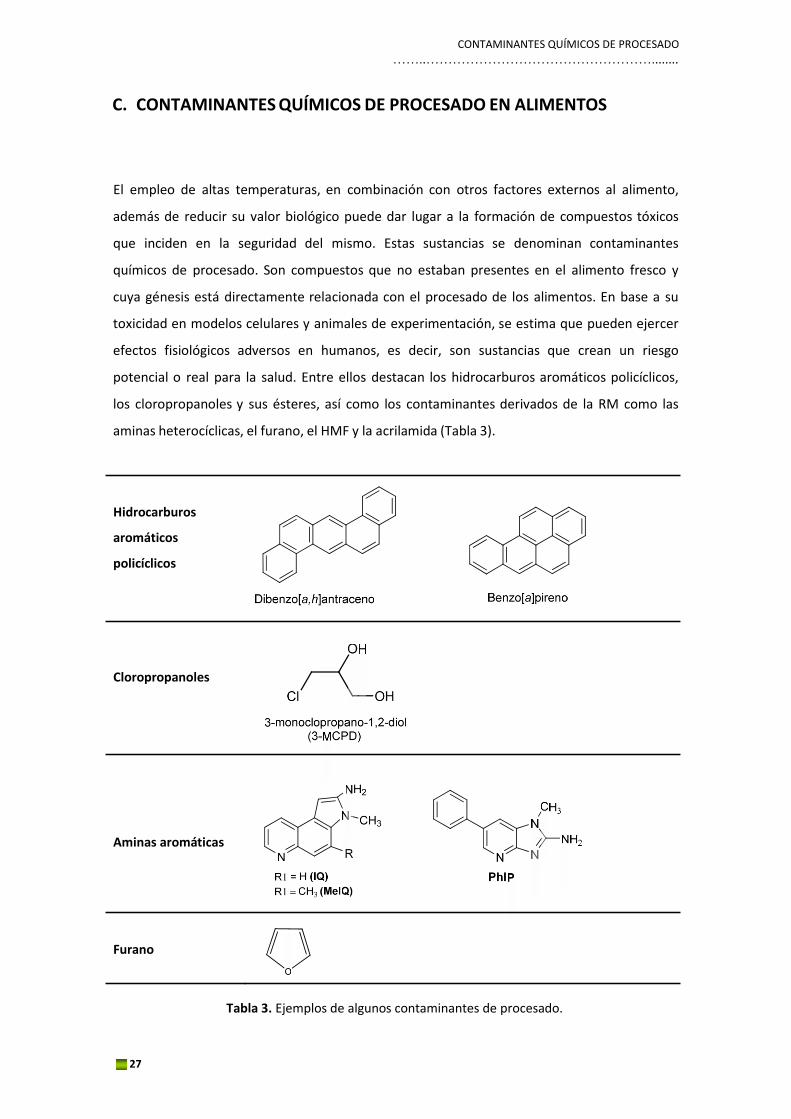
C. CONTAMINANTES QUÍMICOS DE PROCESADO EN ALIMENTOS
El empleo de altas temperaturas, en combinación con otros factores externos al alimento,
además de reducir su valor biológico puede dar lugar a la formación de compuestos tóxicos
que inciden en la seguridad del mismo. Estas sustancias se denominan contaminantes
químicos de procesado. Son compuestos que no estaban presentes en el alimento fresco y
cuya génesis está directamente relacionada con el procesado de los alimentos. En base a su
toxicidad en modelos celulares y animales de experimentación, se estima que pueden ejercer
efectos fisiológicos adversos en humanos, es decir, son sustancias que crean un riesgo
potencial o real para la salud. Entre ellos destacan los hidrocarburos aromáticos policíclicos,
los cloropropanoles y sus ésteres, así como los contaminantes derivados de la RM como las
aminas heterocíclicas, el furano, el HMF y la acrilamida (Tabla 3).
Hidrocarburos
aromáticos
policíclicos
Cloropropanoles
Aminas aromáticas
Furano
Tabla 3. Ejemplos de algunos contaminantes de procesado.
28
1. Hidrocarburos aromáticos policíclicos
Los hidrocarburos aromáticos políciclicos constituyen un grupo de más de cien compuestos
que se caracterizan por poseer en su estructura dos o más anillos de benceno unidos entre sí.
La mayoría contienen solamente carbono e hidrógeno y son siempre estructuras polinucleares
de tipo aromático. Se forman por condensación de compuestos orgánicos tanto por pirólisis
como por pirosíntesis. A altas temperaturas, los compuestos orgánicos se fragmentan
fácilmente (pirólisis) y los radicales libres producidos se unen para formar compuestos
aromáticos polinucleares estables (pirosíntesis) mediante reacciones tipo Diles‐Alder. A
temperaturas inferiores a 400 ºC se forman en pequeñas cantidades, pero entre 400 y 1000 ºC,
los niveles producidos aumentan linealmente con la temperatura (Jägerstad y Skog, 2005).
Entre los alimentos donde se han encontrado mayores niveles destacan la carne asada, el
pescado ahumado, los quesos ahumados, curados y semicurados, el té y el café. Los
hidrocarburos aromáticos policícliclos se han incluido en las listas de contaminantes orgánicos
prioritarios de la Agencia de Protección Medioambiental de Estados Unidos (Environmental
Protection Agency, EPA) (U.S. EPA, 2002) y de la Unión Europea (UE) (Commission
Recommendation, 2005) debido a su actividad carcinogénica. Además el benzo[a]pireno,
originalmente definido como probable carcinogénico en humanos (grupo 2A), ha sido
recientemente clasificado como carcinogénico en humanos (grupo 1) (IARC, 2010).
2. Cloropropanoles y cloroésteres
Los cloropropanoles y los ésteres de sus ácidos grasos (cloroésteres) son contaminantes que se
forman durante el procesado y elaboración de determinados alimentos e ingredientes. En
1978 el grupo de trabajo del profesor Velíšek fue el primero en demostrar que se formaban
mediante hidrólisis ácida de la proteína vegetal hidrolizada (Velíšek y col., 1978). El 3‐
monocloropropano‐1,2‐diol (3‐MCPD) es el cloropropanol de mayor presencia en esta proteína.
Las proteínas vegetales hidrolizadas son un ingrediente muy utilizado en diversos alimentos
como las salsas de soja, las sopas, las comidas preparadas, los aperitivos salados o los fideos
instantáneos (Xu y col., 2006). Los cloropropanoles se han detectado también en otros
alimentos que no son sometidos a hidrólisis ácida durante la fabricación. Entre dichos
productos se encuentran la fruta y las hortalizas elaboradas, los productos a base de cereales y
de panadería, las carnes procesadas, el pescado ahumado y la cerveza. También el 3‐MCPD
puede migrar de ciertos tipos de resinas resistentes a la humedad a base de epiclorohidrina,

CONTAMINANTES QUÍMICOS DE PROCESADO ……..……………………………………………........
29
utilizadas en cubiertas de papel y celulosa como por ejemplo cubiertas de salchichas, bolsitas
de té y filtros de papel para el café. La presencia de cloropropanoles en los alimentos es
preocupante debido a sus propiedades toxicológicas. En la UE se han fijado niveles máximos
permitidos de 20 µg/kg para proteína vegetal hidrolizada y salsa de soja.
Los ésteres del 3‐MCPD son ácidos grasos del 3‐MCPD. Estudios recientes describen la
presencia de estos compuestos en varios productos alimenticios, principalmente en aceites de
oliva refinados y productos elaborados con estos aceites. Actualmente, no se dispone de
suficiente información sobre su presencia en los alimentos ni sobre su toxicidad para poder
evaluar su importancia sobre la salud. Sin embargo, hay que tener en cuenta que los
cloroésteres representan una nueva fuente de 3‐MCPD en los alimentos, puesto que de ellos
se puede liberar 3‐MCPD in vivo por la reacción de hidrólisis catalizada por la enzima lipasa.
Hamlet y col. encontraron este tipo de ésteres en cereales procesados y mostraron que podían
ser generados como intermedios estables o como productos de formación a partir de mono y
diacilgleroles (Hamlet y col., 2004).
Contaminantes químicos derivados de la reacción de Maillard
3. Aminas heterocíclicas
Las aminas aromáticas heterocíclicas son una familia de compuestos que han atraído el interés
de muchos científicos debido a su posible relación con el cáncer. El descubrimiento realizado
en 1977 por Sugimura y col. reveló que, en determinadas condiciones, el humo procedente
del procesado y cocinado de alimentos ricos en proteínas contenía cantidades apreciables de
sustancias mutagénicas (Sugimura y col., 1977). Actualmente, se han identificado más de 20
derivados de estas sustancias. Dependiendo del mecanismo de formación se pueden dividir en
dos grandes grupos.
El primero, las carbolinas, se forma a elevadas temperaturas y se conocen como aminas
pirolíticas. Se generan durante la pirólisis (> 250 ºC) de aminoácidos (triptófano, ácido
glutámico, fenilalanina y ornitina) o bien de proteínas (caseína y globulina de soja).
30
El segundo grupo son los aminoimidazoazarenos, llamados también aminas térmicas, los
cuales han recibido una mayor antención por ser extremadamente mutagénicos en
comparación con el primer grupo. Se forman en alimentos ricos en proteínas como la carne o
el pescado a temperaturas inferiores a 300 ºC. Las concentraciones encontradas en algunos
tipos de alimentos se han recogido en diversos artículos de revisión (Felton y col., 2000; Skog y
Solyakov, 2002).
Aunque existen grandes variaciones debido a las condiciones de cocinado o a los diferentes
tipos de carne, en general, los valores más elevados corresponden a alimentos tratados a
temperaturas elevadas y con un tiempo de cocción prolongado. Generalmente, los tipos de
cocción (hervido o al vapor) que implican temperaturas alrededor de los 100 ºC generan pocos
agentes mutagénicos. Sin embargo, los tratamientos térmicos que suponen un calentamiento
mediante procesos conductivos, como freír o asar, provocan un aumento de la actividad
mutagénica. Algunos estudios también han identificado la presencia de estos compuestos en
extractos de carne, condimentos y aromatizantes; así como en los residuos que quedan en las
sartenes o las planchas después de la cocción, generalmente en las mismas cantidades que en
el correspondiente alimento e incluso, en algunos casos, en concentraciones
considerablemente más elevadas (Skog y col., 1998).
4. Furano
El furano es un compuesto que se forma durante el tratamiento de los alimentos con calor y
contribuye a las propiedades sensoriales del producto. Se han propuesto múltiples
mecanismos para su formación durante el tratamiento térmico, incluyendo la degradación de
los derivados del ácido ascórbico, degradación de carbohidratos, degradación térmica de
aminoácidos en presencia o ausencia de azúcares reductores, y oxidación de ácidos grasos
poliinsaturados, carotenoides y ácidos orgánicos (Becalski y Seaman, 2005). Según el último
Informe Científico de la EFSA sobre el furano, los alimentos que más contribuyen a la
exposición humana a través de los alimentos son los potitos infantiles y el café (EFSA, 2011).

CONTAMINANTES QUÍMICOS DE PROCESADO ……..……………………………………………........
31
5. Hidroximetilfurfural y acrilamida
El estudio de los contaminantes en los alimentos ha crecido considerablemente en los últimos
años convirtiéndose en una cuestión fundamental para el mantenimiento de la seguridad
alimentaria a nivel mundial. Esto ha hecho que se descubran nuevos riesgos como es el caso
del HMF y la acrilamida, considerados los más importantes contaminates químicos de
procesado en productos de panadería y galletería además del café, debido a su alto potencial
toxicológico y a su concentración elevada en estos alimentos. Esta Tesis se centrará en estos
dos nuevos contaminantes.
32
D. NUEVOS CONTAMINANTES QUÍMICOS DE PROCESADO EN
ALIMENTOS
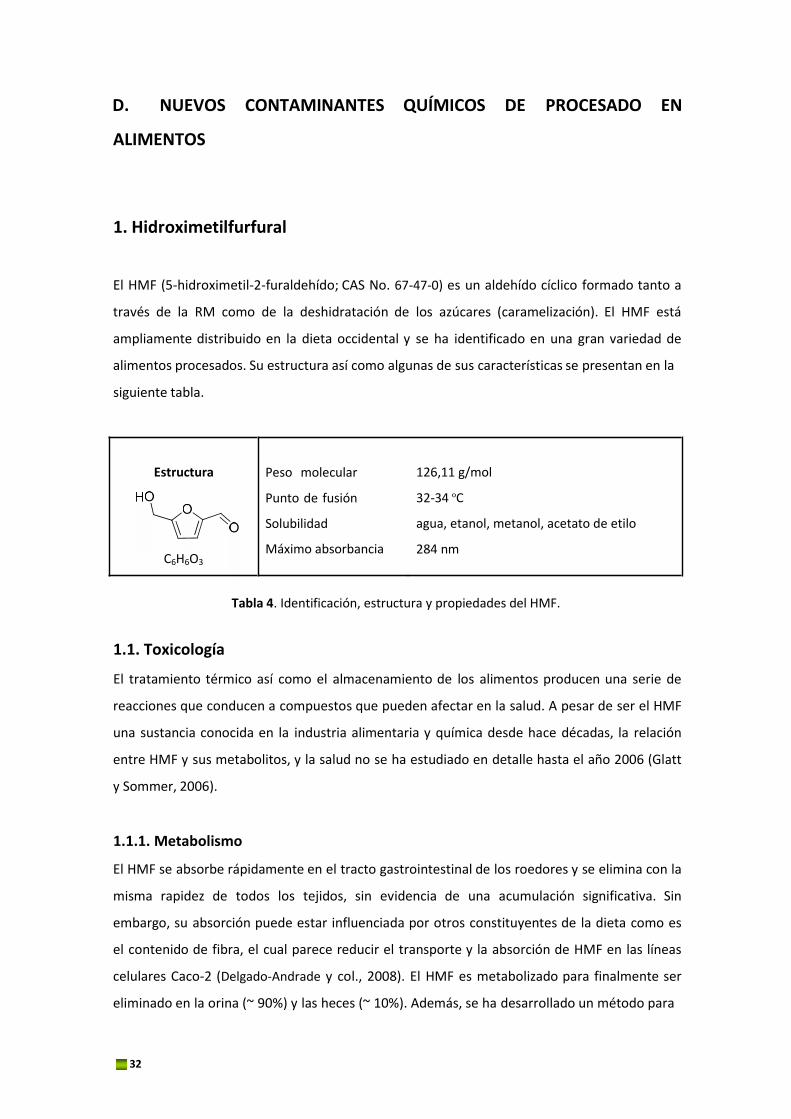
1. Hidroximetilfurfural
El HMF (5‐hidroximetil‐2‐furaldehído; CAS No. 67‐47‐0) es un aldehído cíclico formado tanto a
través de la RM como de la deshidratación de los azúcares (caramelización). El HMF está
ampliamente distribuido en la dieta occidental y se ha identificado en una gran variedad de
alimentos procesados. Su estructura así como algunas de sus características se presentan en la
siguiente tabla.
Estructura
C6H6O3
Peso molecular
Punto de fusión
Solubilidad
Máximo absorbancia
126,11 g/mol
32‐34 ºC
agua, etanol, metanol, acetato de etilo
284 nm
Tabla 4. Identificación, estructura y propiedades del HMF.
1.1. Toxicología
El tratamiento térmico así como el almacenamiento de los alimentos producen una serie de
reacciones que conducen a compuestos que pueden afectar en la salud. A pesar de ser el HMF
una sustancia conocida en la industria alimentaria y química desde hace décadas, la relación
entre HMF y sus metabolitos, y la salud no se ha estudiado en detalle hasta el año 2006 (Glatt
y Sommer, 2006).
1.1.1. Metabolismo
El HMF se absorbe rápidamente en el tracto gastrointestinal de los roedores y se elimina con la
misma rapidez de todos los tejidos, sin evidencia de una acumulación significativa. Sin
embargo, su absorción puede estar influenciada por otros constituyentes de la dieta como es
el contenido de fibra, el cual parece reducir el transporte y la absorción de HMF en las líneas
celulares Caco‐2 (Delgado‐Andrade y col., 2008). El HMF es metabolizado para finalmente ser
eliminado en la orina (~ 90%) y las heces (~ 10%). Además, se ha desarrollado un método para
HIDROXIMETILFURFURAL ……..……………………………………………........
33
cuantificar los aductos de HMF a partir de aldehídos unidos como bases de Schiff al nitrógeno
terminal de la hemoglobina. Dichos aductos pueden ser utilizados como biomarcadores de
exposición (Davies y col., 2009).
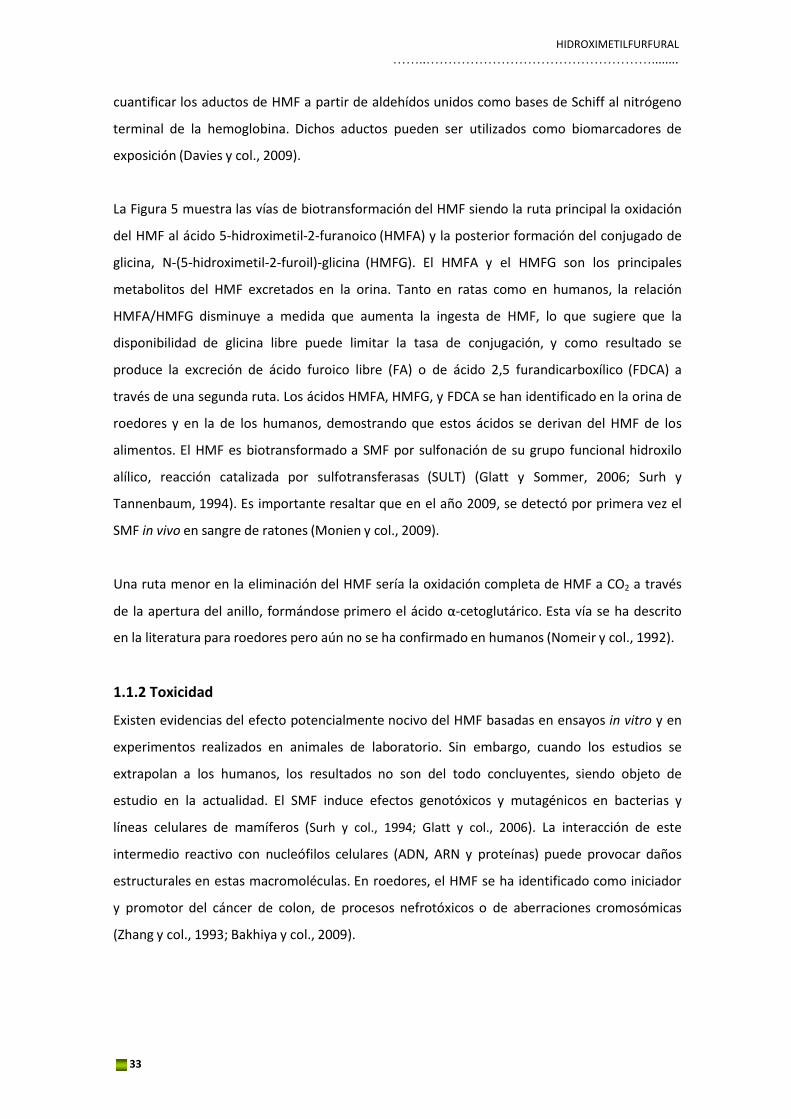
La Figura 5 muestra las vías de biotransformación del HMF siendo la ruta principal la oxidación
del HMF al ácido 5‐hidroximetil‐2‐furanoico (HMFA) y la posterior formación del conjugado de
glicina, N‐(5‐hidroximetil‐2‐furoil)‐glicina (HMFG). El HMFA y el HMFG son los principales
metabolitos del HMF excretados en la orina. Tanto en ratas como en humanos, la relación
HMFA/HMFG disminuye a medida que aumenta la ingesta de HMF, lo que sugiere que la
disponibilidad de glicina libre puede limitar la tasa de conjugación, y como resultado se
produce la excreción de ácido furoico libre (FA) o de ácido 2,5 furandicarboxílico (FDCA) a
través de una segunda ruta. Los ácidos HMFA, HMFG, y FDCA se han identificado en la orina de
roedores y en la de los humanos, demostrando que estos ácidos se derivan del HMF de los
alimentos. El HMF es biotransformado a SMF por sulfonación de su grupo funcional hidroxilo
alílico, reacción catalizada por sulfotransferasas (SULT) (Glatt y Sommer, 2006; Surh y
Tannenbaum, 1994). Es importante resaltar que en el año 2009, se detectó por primera vez el
SMF in vivo en sangre de ratones (Monien y col., 2009).
Una ruta menor en la eliminación del HMF sería la oxidación completa de HMF a CO2 a través
de la apertura del anillo, formándose primero el ácido α‐cetoglutárico. Esta vía se ha descrito
en la literatura para roedores pero aún no se ha confirmado en humanos (Nomeir y col., 1992).
1.1.2 Toxicidad
Existen evidencias del efecto potencialmente nocivo del HMF basadas en ensayos in vitro y en
experimentos realizados en animales de laboratorio. Sin embargo, cuando los estudios se
extrapolan a los humanos, los resultados no son del todo concluyentes, siendo objeto de
estudio en la actualidad. El SMF induce efectos genotóxicos y mutagénicos en bacterias y
líneas celulares de mamíferos (Surh y col., 1994; Glatt y col., 2006). La interacción de este
intermedio reactivo con nucleófilos celulares (ADN, ARN y proteínas) puede provocar daños
estructurales en estas macromoléculas. En roedores, el HMF se ha identificado como iniciador
y promotor del cáncer de colon, de procesos nefrotóxicos o de aberraciones cromosómicas
(Zhang y col., 1993; Bakhiya y col., 2009).
34
CO2
O
O O S
O HO OH HO
O
O O SULT OH
Ácido cetoglutárico O O
5-Sulfoximetilfurfural (SMF)
OH
5-Hidroximetilfurfural (HMF)
HO O O
O OH
HO O
O OH
Ácido 2,5-furandicarboxílico (FDCA) Ácido 5-hidroximetil-2-furoico (HMFA)
O
CoA S
HS-CoA
O
OH
Glicina HO
O
O
O
N OH H
HMFA-CoA
O OH O
H3C N OH H
N-(5-Hidroximetil-2-furoil)glicina
(HMFG)
O OH
HO O N OH
O H
(Ácido 5-carboxílico-2-furoil)amino-metano
(CAFAM)
(Ácido 5-carboxílico-2-furoil)glicina
(CAFG)
Figura 5. Metabolismo del 5‐hidroximetilfurfural (EFSA, 2005a).
La toxicidad aguda por vía oral del HMF como compuesto puro es relativamente baja, siendo la
dosis letal (DL50) de 2,5 g/kg de peso corporal en ratas (U.S. EPA, 1992). El Programa Nacional
de Toxicología de Estados Unidos llevó a cabo un estudio durante 2 años encontrando que el
HMF aumentaba la incidencia de adenomas hepatocelulares en ratones hembra de la línea
B6C3F1. Sin embargo, no se ha encontrado evidencia científica de carcinogenicidad en ratas de
la línea F344/N (NTP, 2008). Más tarde, el HMF ha demostrado ser un carcinógeno débil en
ratones debido al aumento significativo del número de pequeños adenomas intestinales
(Svendsen y col., 2009).
HIDROXIMETILFURFURAL ……..……………………………………………........
35
1.1.3. Evaluación de riesgos
En el año 2005, el comité científico de la EFSA estimó una ingesta diaria de HMF de 1,6
mg/persona (EFSA, 2005a). Este valor es muy superior al valor de 0,54 mg/persona/día
calculado a partir de una amplia base de datos sobre estudios crónicos y subcrónicos
realizados con animales (JECFA, 1996). Sin embargo la preocupación sobre el riesgo viene
asociada por la conversión del HMF a SMF. El SMF es capaz de reaccionar con el ADN y otras
macromoléculas y dar lugar a efectos tóxicos y mutagénicos. Aunque el SMF es muy inestable,
se ha detectado recientemente en la sangre de los ratones tratados con HMF, lo que indica su
metabolización in vivo a SMF. Además, las SULT se manifiestan más extensamente en los
tejidos extrahepáticos de los humanos que en el de los roedores siendo su actividad mayor.
Esto sugiere que los riesgos asociados a la exposición del HMF podrían ser aún mayores para
los humanos que los descritos para los roedores (Monien y col., 2009), aumentando las
incertidumbres sobre si la exposición a HMF podría suponer un riesgo real para la salud
(Gökmen y Morales, 2012).
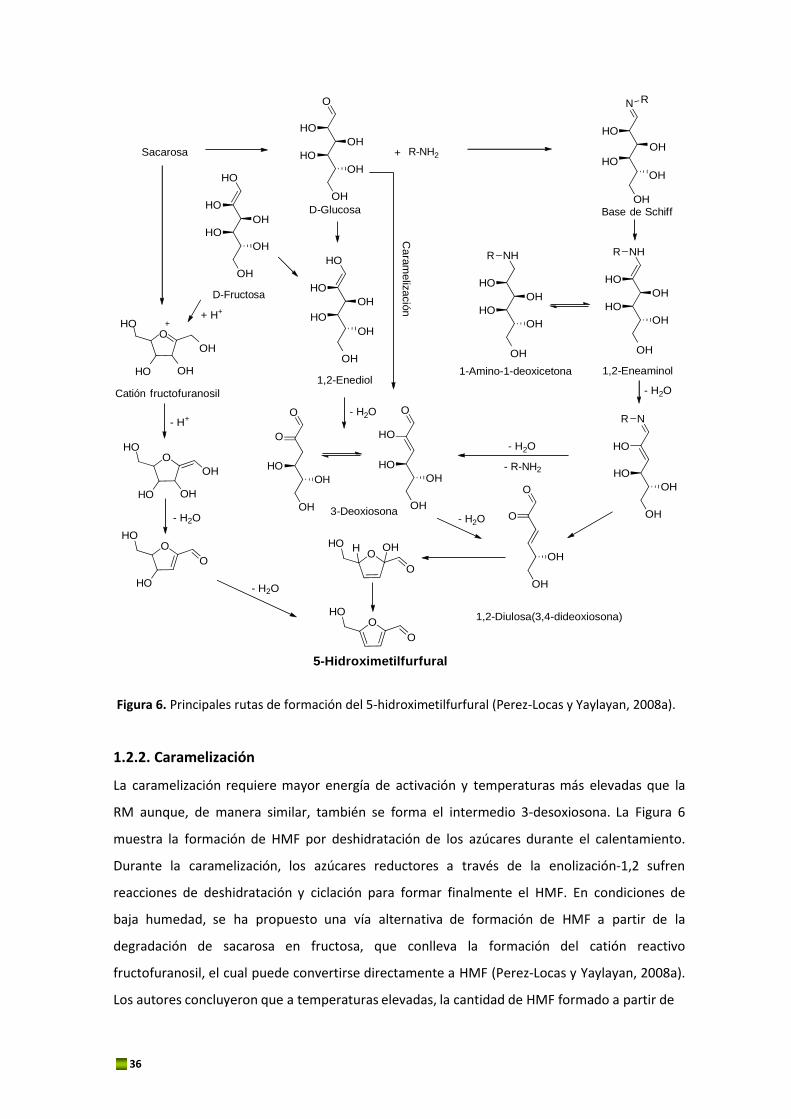
1.2. Mecanismos de formación
El HMF es un compuesto intermedio en la RM que se produce cuando las hexosas reductoras
se calientan en presencia de aminoácidos o proteínas. Una ruta alternativa consiste en la
deshidratación térmica directa de fructosa, sacarosa, y en menor medida, de glucosa. Esta
reacción no requiere la presencia de grupos amino y está catalizada en condiciones ácidas. En
la Figura 6 se representan las principales rutas de formación del HMF en los alimentos.
1.2.1. Reacción de Maillard
El HMF se forma por degradación del producto de Amadori a través de una enolización‐1,2,
siendo la 3‐deoxiosona el intermedio clave en la reacción. El compuesto de Amadori es capaz
de generar, en las mismas condiciones de reacción, aproximadamente 10 veces más HMF que
el respectivo azúcar y aminoácido. Si el medio de reacción y las condiciones térmicas son
apropiados, el compuesto de Amadori se degradará hacia los PRM. A pH neutro o ligeramente
ácido, el producto de Amadori forma el 1,2‐eneaminol, el cual pierde un grupo hidroxilo en el
C‐3 y sufre una desaminación en el C‐1 y una hidratación para formar un compuesto
intermedio denominado 3‐deoxisona. La 3‐deoxiosona sufre ciclicación y genera un hemiacetal
el cual se deshidrata para formar finalmente HMF. Esta ruta se la conoce como enolización 1,2.
36
Ca
ram
eliz
ació
n
Sacarosa
HO
O
HO
OH
HO +
OH
N R
HO
R-NH2 OH
HO
OH
OH HO D-Glucosa
OH
HO
OH Base de Schiff
OH
HO
OH
D-Fructosa HO
OH
+ H+ HO
HO O OH
R NH
HO
OH
HO
OH
R NH
HO
OH
HO
OH
OH
HO OH
OH
1,2-Enediol
OH
1-Amino-1-deoxicetona
OH
1,2-Eneaminol
Catión fructofuranosil
- H+
HO
O
O - H2O O
O HO
- H2O
- H2O
R N
HO
OH
HO OH
HO HO
OH OH
OH OH
- R-NH2 HO
O OH
- H2O
HO
3-Deoxiosona - H2O O OH
O
O
HO - H2O
HO H HO
O OH
O
O
O
OH
OH
1,2-Diulosa(3,4-dideoxiosona)
5-Hidroximetilfurfural
Figura 6. Principales rutas de formación del 5‐hidroximetilfurfural (Perez‐Locas y Yaylayan, 2008a).
1.2.2. Caramelización
La caramelización requiere mayor energía de activación y temperaturas más elevadas que la
RM aunque, de manera similar, también se forma el intermedio 3‐desoxiosona. La Figura 6
muestra la formación de HMF por deshidratación de los azúcares durante el calentamiento.
Durante la caramelización, los azúcares reductores a través de la enolización‐1,2 sufren
reacciones de deshidratación y ciclación para formar finalmente el HMF. En condiciones de
baja humedad, se ha propuesto una vía alternativa de formación de HMF a partir de la
degradación de sacarosa en fructosa, que conlleva la formación del catión reactivo
fructofuranosil, el cual puede convertirse directamente a HMF (Perez‐Locas y Yaylayan, 2008a).
Los autores concluyeron que a temperaturas elevadas, la cantidad de HMF formado a partir de
HIDROXIMETILFURFURAL ……..……………………………………………........
37
sacarosa es mayor que a partir de fructosa o glucosa. Esto es debido a que este catión
intermedio se convierte de manera más eficiente a temperaturas más bajas en HMF en
comparación con la 3‐deoxiglucosona, vía glucosa y fructosa.
1.3. Métodos analíticos
Uno de los aspectos más estudiados ha sido el tratamiento de la muestra, y en concreto la
extracción del HMF de la matriz del alimento. En el caso de matrices sencillas, como miel,
bebidas alcohólicas y zumos de frutas, se realiza una extracción acuosa seguida de una
filtración. Sin embargo, para el café se recomienda el uso de técnicas más selectivas como la
extracción en fase sólida (SPE) para obtener extractos libres de interferentes (Murkovic y
Pichler, 2006).
En los alimentos de base láctea, el extracto, después de la adición de ácido oxálico, se calienta
durante 25 min para realizar el cálculo del denominado HMF total. En otros casos, se ha
conseguido mejorar la extracción con el empleo de disolventes como metanol o acetato de
etilo, seguido de evaporación y reconstitución del extracto en un medio acuoso antes de su
análisis.
En los productos a base de cereales y vegetales se recomienda la utilización de soluciones
clarificantes como Carrez, K4[Fe(CN)6] + ZnSO4.7H2O, en lugar de ácidos como tricloroacético,
metafosfórico o sulfosalicílico, debido a que es posible que a pH bajo se genere HMF in situ a
partir de la glucosa presente en la matriz. Sin embargo, Ait‐Ameur y col. demostraron que el
uso del ácido tricloroacético durante la extracción de cereales no condujo de nuevo a la
formación de HMF (Ait‐Ameur y col., 2006).
Con respecto a la purificación de la muestra, la SPE es el método más utilizado. Lee y col. (Lee y
col., 1986) emplearon cartuchos de extracción de octadecil sílice (C18) seguido de un lavado
con hexano en extractos de naranja. Gökmen y col. utilizaron también cartuchos de extracción
Oasis HLB para clarificar el extracto acuoso antes del análisis por LC‐MS (Gökmen y col., 2006a).
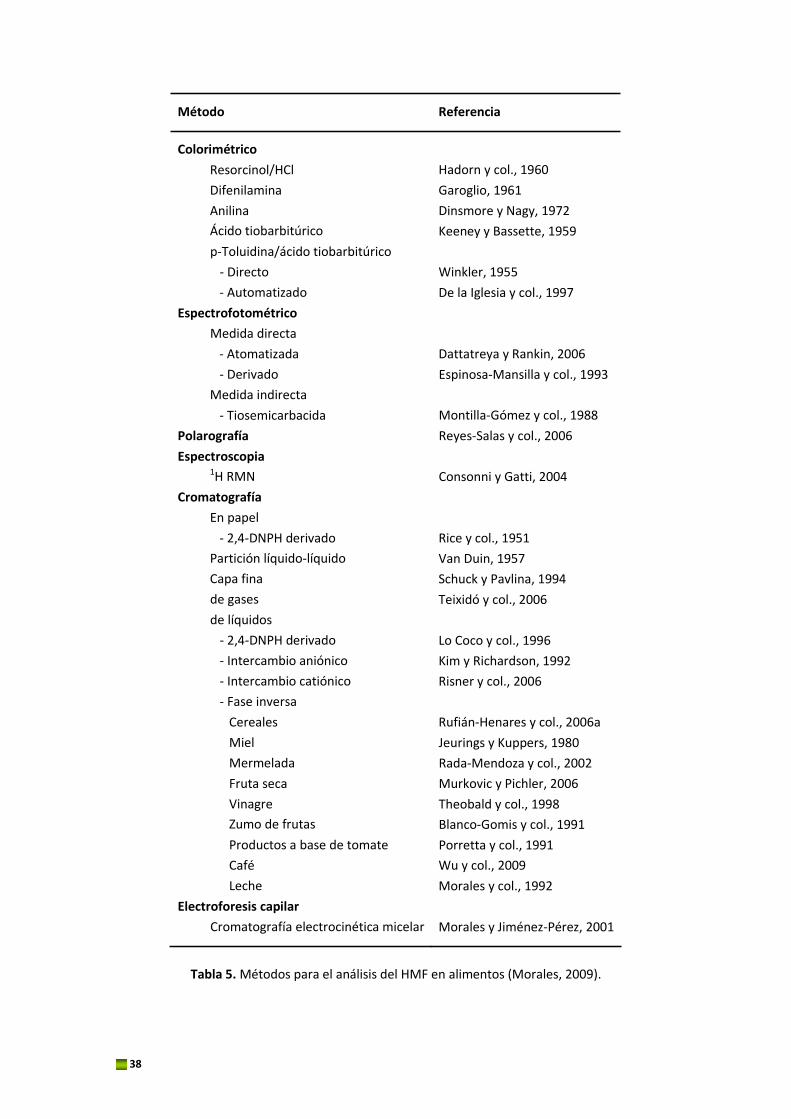
En la literatura se ha descrito una amplia variedad de técnicas analíticas para detectar HMF en
los alimentos, que incluyen la colorimetría, espectrofotometría y cromatografía (Tabla 5).
38
Método Referencia
Colorimétrico
Resorcinol/HCl
Difenilamina
Anilina
Ácido tiobarbitúrico
p‐Toluidina/ácido tiobarbitúrico
‐ Directo
‐ Automatizado
Espectrofotométrico
Medida directa
‐ Atomatizada
‐ Derivado
Medida indirecta
‐ Tiosemicarbacida
Polarografía
Espectroscopia 1H RMN
Cromatografía
En papel
‐ 2,4‐DNPH derivado
Partición líquido‐líquido
Capa fina
de gases
de líquidos
‐ 2,4‐DNPH derivado
‐ Intercambio aniónico
‐ Intercambio catiónico
‐ Fase inversa
Cereales
Miel
Mermelada
Fruta seca
Vinagre
Zumo de frutas
Productos a base de tomate
Café
Leche
Electroforesis capilar
Cromatografía electrocinética micelar
Hadorn y col., 1960
Garoglio, 1961
Dinsmore y Nagy, 1972
Keeney y Bassette, 1959
Winkler, 1955
De la Iglesia y col., 1997
Dattatreya y Rankin, 2006
Espinosa‐Mansilla y col., 1993
Montilla‐Gómez y col., 1988
Reyes‐Salas y col., 2006
Consonni y Gatti, 2004
Rice y col., 1951
Van Duin, 1957
Schuck y Pavlina, 1994
Teixidó y col., 2006
Lo Coco y col., 1996
Kim y Richardson, 1992
Risner y col., 2006
Rufián‐Henares y col., 2006a
Jeurings y Kuppers, 1980
Rada‐Mendoza y col., 2002
Murkovic y Pichler, 2006
Theobald y col., 1998
Blanco‐Gomis y col., 1991
Porretta y col., 1991
Wu y col., 2009
Morales y col., 1992
Morales y Jiménez‐Pérez, 2001
Tabla 5. Métodos para el análisis del HMF en alimentos (Morales, 2009).
HIDROXIMETILFURFURAL ……..……………………………………………........
39
En la actualidad, la cromatrografía líquida de fase inversa es la técnica más utilizada para
analizar de forma precisa y fiable la presencia de compuestos furánicos en alimentos como los
zumos de manzana y concentrados, brandys y otras bebidas alcohólicas, café, leche, fórmulas
infantiles, cereales de desayuno, productos a base de tomate, y mermeladas. Esta técnica
puede determinar directamente HMF, furfural y furfuril alcohol sin necesidad de la formación
de un derivado coloreado debido a la fuerte absorción en el UV (280 nm aproximadamente) de
los furfurales.
La elución del HMF normalmente se lleva a cabo empleando una separación isocrática con
fases móviles conteniendo 5‐10% de acetonitrilo o metanol en agua, agua acidificada o
tampón acetato (ácido acético‐acetato sódico, pH 3,6).
Algunos autores utilizaron un derivado de la 2,4‐DNPH para el análisis del HMF con el fin de
mejorar tanto la selectividad como la sensibilidad del método en matrices como zumo de
frutas y cerveza, debido a la alta especificidad que presenta la reacción entre la DNPH y los
compuestos carbonílicos. Yuan y col. (Yuan y col., 1998) aplicaron la cromatografía líquida de
intercambio iónico con detector fotodiodo array para la separación del HMF, 2,5‐dimetil‐4‐
hidroxi‐3(2H)‐furanona (DMHF), ácido furoico, furfural, 2‐acetilfurano y furfuril alcohol en
zumos de frutas. Posteriormente, Gökmen y col. han utilizado LC‐MS con ionización química a
presión atmosférica (APCI) en alimentos infantiles (Gökmen y col., 2006a). Finalmente, cabe
comentar que, aunque en menor medida, también se han empleado técnicas de cromatografía
de gases acoplada a espectrometría de masas (GC‐MS) (Teixidó y col., 2006) para la
determinación de HMF en alimentos.
1.4. Niveles en alimentos
Aunque el HMF no se encuentra presente en productos frescos o no procesados térmicamente,
se acumula rápidamente durante el calentamiento y el almacenamiento de alimentos ricos en
hidratos de carbono, y en algunos casos puede exceder el valor de 1 g/kg, como ocurre en
frutos secos y productos a base de caramelo. El HMF está ampliamente reconocido como un
índice válido para estimar el deterioro generado en el alimento como resultado de un
calentamiento excesivo o durante condiciones inadecuadas de almacenamiento. De la misma
manera, se ha utilizado como marcador para controlar el procesado térmico de algunos
productos elaborados a base de cereales como pasta, galletas, pan, cereales de desayuno y
pan tostado.
40
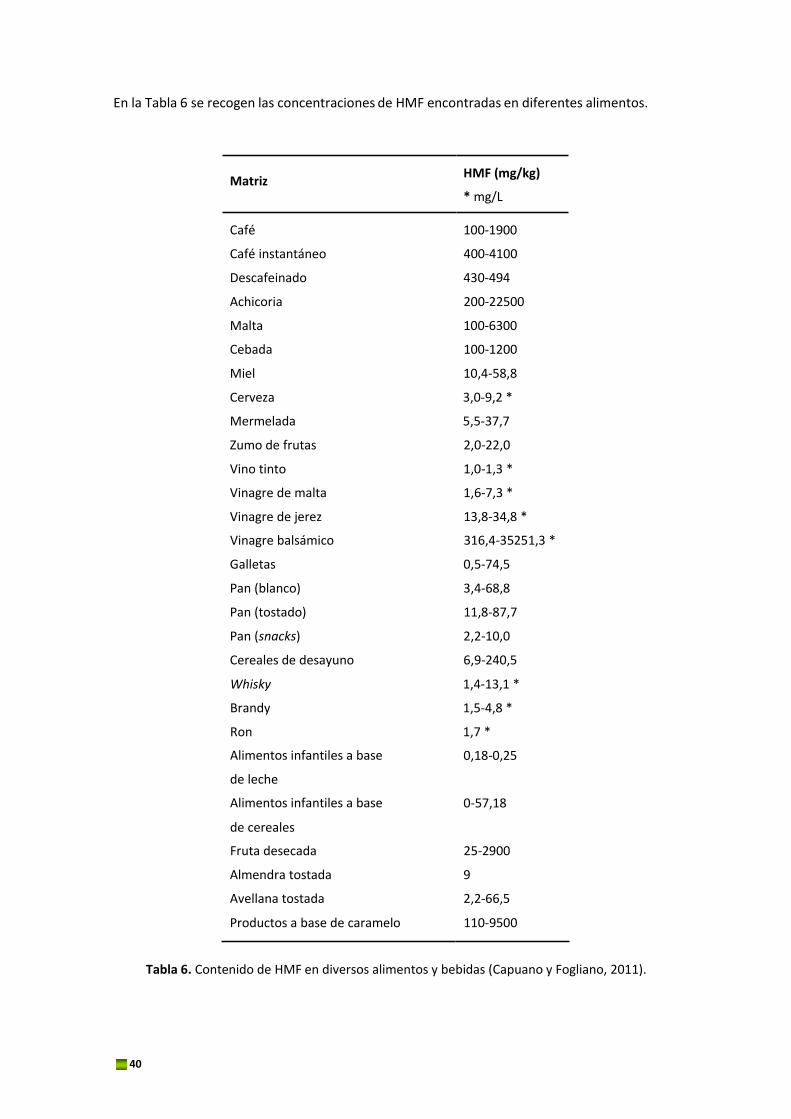
En la Tabla 6 se recogen las concentraciones de HMF encontradas en diferentes alimentos.
Matriz HMF (mg/kg)
* mg/L
Café 100‐1900
Café instantáneo 400‐4100
Descafeinado 430‐494
Achicoria 200‐22500
Malta 100‐6300
Cebada 100‐1200
Miel 10,4‐58,8
Cerveza 3,0‐9,2 *
Mermelada 5,5‐37,7
Zumo de frutas 2,0‐22,0
Vino tinto 1,0‐1,3 *
Vinagre de malta 1,6‐7,3 *
Vinagre de jerez 13,8‐34,8 *
Vinagre balsámico 316,4‐35251,3 *
Galletas 0,5‐74,5
Pan (blanco) 3,4‐68,8
Pan (tostado) 11,8‐87,7
Pan (snacks) 2,2‐10,0
Cereales de desayuno 6,9‐240,5
Whisky 1,4‐13,1 *
Brandy 1,5‐4,8 *
Ron 1,7 *
Alimentos infantiles a base
de leche
Alimentos infantiles a base
de cereales
0,18‐0,25 0‐57,18
Fruta desecada 25‐2900
Almendra tostada 9
Avellana tostada 2,2‐66,5
Productos a base de caramelo 110‐9500
Tabla 6. Contenido de HMF en diversos alimentos y bebidas (Capuano y Fogliano, 2011).
HIDROXIMETILFURFURAL ……..……………………………………………........
41
1.5. Estimación de ingesta
Como se ha descrito anteriormente, los niveles de HMF encontrados en fruta desecada,
caramelo y vinagre balsámico son extremadamente elevados. Sin embargo, los alimentos que
más contribuyen a la ingesta de HMF en la población son el café y el pan. Se ha estimado una
ingesta aproximada de entre 30 y 150 mg de HMF por día (2,5 mg/peso corporal/día) (Ulbricht
y col., 1984). Más recientemente, Rufián Henares y de la Cueva estimaron una ingesta diaria
para la población española de 2,1 mg, 9,7 mg y 23,0 mg, valor mínimo, medio y máximo,
respectivamente, de HMF en los alimentos (Rufián‐Henares y de la Cueva, 2008). Estos
resultados están de acuerdo con los publicados en el año 2007 por Delgado‐Andrade y col.
(Delgado‐Andrade y col., 2007b), quienes calcularon una ingesta diaria de 5,1 mg para los
adolescentes españoles, pero por debajo de aquellos expuestos por otros autores (Ulbricht y
col., 1984). La diferencia podría explicarse a que en la investigación realizada en 1984 por
Ulbricht se emplearon métodos espectrofotométricos poco precisos habiéndose producido
una sobreestimación en el contenido de HMF. En cualquier caso, la exposición estimada es
varios órdenes de magnitud más alta que para otros contaminantes de procesado tales como
la acrilamida o el furano. Aún así, los datos que existen en la bibliografía sobre la exposición a
HMF son muy limitados, de ahí la necesidad de llevar a cabo estudios adicionales para evaluar
tanto el contenido medio como el máximo en las diferentes poblaciones. Además, se ha de
tener en cuenta que el almacenamiento y las condiciones de cocinado de los propios alimentos
podrían afectar a la exposición real de HMF como ocurre con otras sustancias tóxicas (Gökmen
y Morales, 2012).
1.6. Estrategias de mitigación
El HMF se forma por el tratamiento térmico y se encuentra en alimentos procesados, de ahí la
necesidad de desarrollar estrategias para reducir su formación durante el cocinado. Hasta la
fecha se dispone de abundante información sobre la cinética de las reacciones implicadas y las
energías de activación en sistemas modelo que simulan procesos en diferentes matrices
alimentarias. Sin embargo, es importante tener en cuenta el balance riesgo/beneficio y la
calidad global del producto final. Resultaría útil establecer una base de datos para conocer qué
familia de alimentos contribuyen más a la ingesta diaria de HMF, y considerar a partir de ahí
métodos prácticos para reducir el contenido en aquellos productos prioritarios. Teniendo en
cuenta los posibles mecanismos de formación, previamente comentados, los factores que
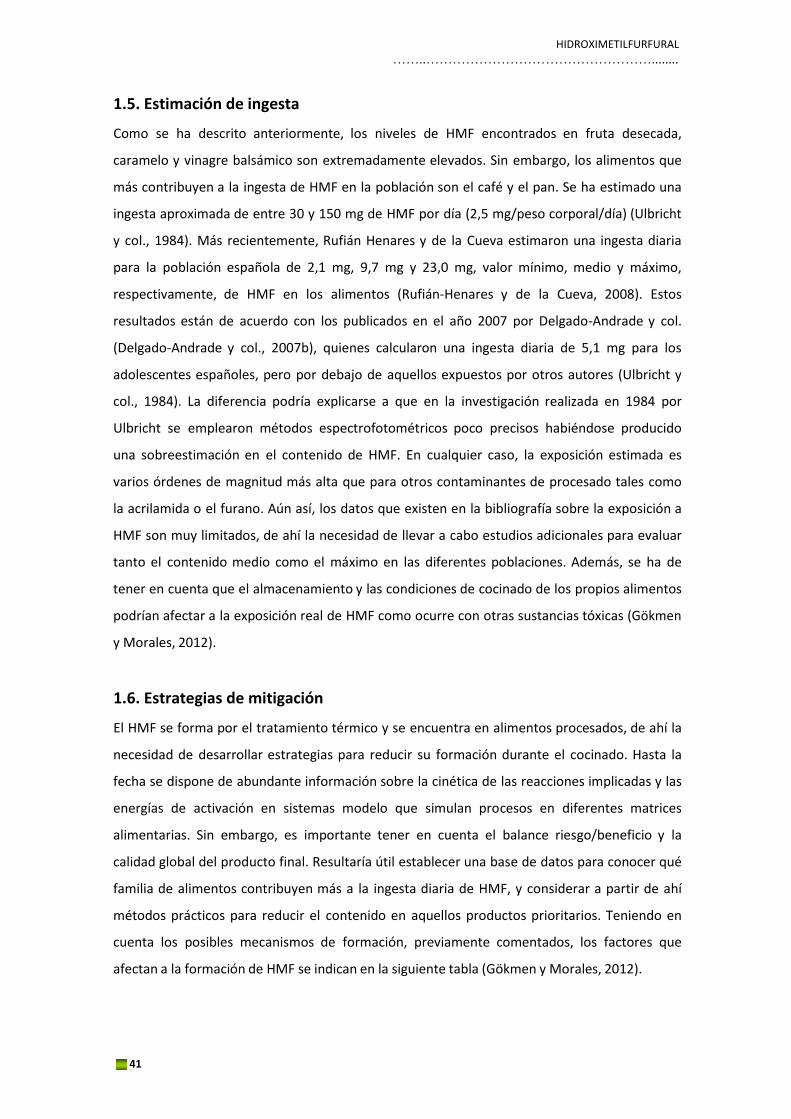
afectan a la formación de HMF se indican en la siguiente tabla (Gökmen y Morales, 2012).
42
Factores Correlación
Precursores (azúcares, aminoácidos)
Temperatura
Tiempo
pH
Humedad
Positiva
Positiva
Positiva
Negativa
Negativa
Tabla 7. Factores que afectan a la formación de HMF en los alimentos.
A continuación se describen algunas estrategias de mitigación, teniendo en cuenta que en la
actualidad no es posible una eliminación completa sin afectar a las propiedades organolépticas
y a la seguridad de los propios alimentos.
1.6.1. Selección de materia prima
Los azúcares (hexosas) y los aminoácidos son los principales precursores de la formación de
HMF. Los alimentos ricos en hidratos de carbono son, por tanto, los productos donde se
encontrarán los mayores niveles de HMF. Limitando el contenido de azúcares reductores se
reducirá a su vez su formación. Sin embargo, cuando se sustituye, por ejemplo, en las galletas
la glucosa o fructosa por sacarosa, se produce paradójicamente un aumento en los niveles de
HMF a temperaturas superiores a 250 ºC. Además, utilizando bicarbonato amónico como
gasificante, la sacarosa se descompone muy rápidamente y por consiguiente produce mayores
niveles de HMF (Gökmen y col., 2007).
El uso de ingredientes con un elevado contenido de HMF como jarabe de azúcar o miel,
incrementarían las concentraciones en el producto final. Sin embargo, estos ingredientes
reforzarían la aceptabilidad del consumidor, de ahí la necesidad de alcanzar un equilibrio
riesgo/beneficio. En ciertos casos es posible variar algunos componentes antes del tratamiento
térmico, como por ejemplo la composición de la masa durante el procesado de los cereales y
de las fórmulas infantiles. Generalmente, si se aumenta el pH de la masa en productos de
panadería, los niveles de HMF disminuyen (Gökmen y col., 2007).
1.6.2. Selección de variables de procesado
La RM y la carmelización se ven favorecidas en gran medida por la relación
temperatura/tiempo y las condiciones del medio de reacción (contenido de agua, acidez,
cationes divalentes). De esta manera, disminuyendo la temperatura durante el procesamiento

HIDROXIMETILFURFURAL ……..……………………………………………........
43
y/o almacenamiento se consigue disminuir la formación de HMF de una manera sencilla. En
general, el aumento del tiempo de almacenamiento también aumenta la cantidad de HMF
formado. Condiciones de baja y moderada humedad se asocian a un aumento en la formación
de HMF, debido a que la RM se ve acelerada por la deshidratación del azúcar.
1.6.3. Eliminación tras el procesado
En condiciones extremas de procesado se ha observado un descenso del HMF en galletas
debido a la degradación de éste a productos secundarios, la mayor parte volátiles (Ameur y
col., 2006). Sin embargo, estas condiciones afectarán de forma drástica a la calidad del
producto pudiendo llegar a generarse otros compuestos indeseados como la acrilamida.
44
2. Acrilamida
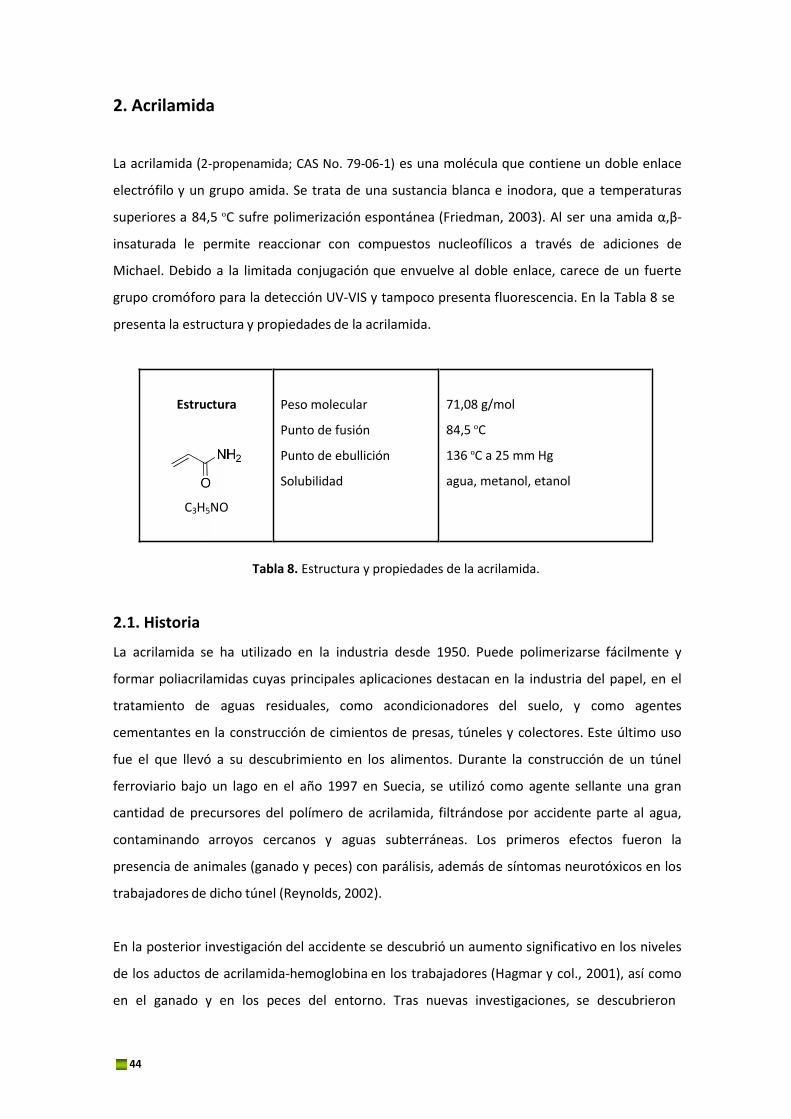
La acrilamida (2‐propenamida; CAS No. 79‐06‐1) es una molécula que contiene un doble enlace
electrófilo y un grupo amida. Se trata de una sustancia blanca e inodora, que a temperaturas
superiores a 84,5 ºC sufre polimerización espontánea (Friedman, 2003). Al ser una amida α,β‐
insaturada le permite reaccionar con compuestos nucleofílicos a través de adiciones de
Michael. Debido a la limitada conjugación que envuelve al doble enlace, carece de un fuerte
grupo cromóforo para la detección UV‐VIS y tampoco presenta fluorescencia. En la Tabla 8 se
presenta la estructura y propiedades de la acrilamida.
Estructura
C3H5NO
Peso molecular
Punto de fusión
Punto de ebullición
Solubilidad
71,08 g/mol
84,5 ºC
136 ºC a 25 mm Hg
agua, metanol, etanol
Tabla 8. Estructura y propiedades de la acrilamida.
2.1. Historia
La acrilamida se ha utilizado en la industria desde 1950. Puede polimerizarse fácilmente y
formar poliacrilamidas cuyas principales aplicaciones destacan en la industria del papel, en el
tratamiento de aguas residuales, como acondicionadores del suelo, y como agentes
cementantes en la construcción de cimientos de presas, túneles y colectores. Este último uso
fue el que llevó a su descubrimiento en los alimentos. Durante la construcción de un túnel
ferroviario bajo un lago en el año 1997 en Suecia, se utilizó como agente sellante una gran
cantidad de precursores del polímero de acrilamida, filtrándose por accidente parte al agua,
contaminando arroyos cercanos y aguas subterráneas. Los primeros efectos fueron la
presencia de animales (ganado y peces) con parálisis, además de síntomas neurotóxicos en los
trabajadores de dicho túnel (Reynolds, 2002).
En la posterior investigación del accidente se descubrió un aumento significativo en los niveles
de los aductos de acrilamida‐hemoglobina en los trabajadores (Hagmar y col., 2001), así como
en el ganado y en los peces del entorno. Tras nuevas investigaciones, se descubrieron
ACRILAMIDA ……..……………………………………………........
45
cantidades inesperadas de aductos en personas que vivían fuera de la zona contaminada
(Tareke y col., 2002). El hallazgo en animales y ganados expuestos a la fuga de concentraciones
de aductos inferiores a las de las personas no relacionadas con el accidente, hizo que se
considerara la posibilidad de que la exposición en los humanos proviniera de otra fuente: los
alimentos cocinados. Para ello, se llevaron a cabo una serie de investigaciones en animales de
experimentación alimentados durante semanas con alimentos fritos, lo que permitió observar
que aquéllos que consumieron una dieta rica en fritos presentaban mayores niveles de los
aductos hemoglobina‐acrilamida (Tareke y col., 2000). No fue hasta abril de 2002, cuando la
Administración Nacional de Alimentos de Suecia anunció concentraciones de acrilamida en
una amplia variedad de alimentos fritos y horneados (SNFA, 2002). Este anuncio fue seguido
rápidamente por otras publicaciones, informando de concentraciones hasta del orden de
partes por millón en alimentos ricos en hidratos de carbono tratados a altas temperaturas (U.S.
FDA, 2002). Estos resultados fueron confirmados por otros investigadores, de modo que
comenzaron los esfuerzos internacionales para comprender y, finalmente, reducir, el riesgo de
la presencia de acrilamida en los alimentos.
2.2. Toxicología
El descubrimiento de la acrilamida en los alimentos provocó un debate público debido a la
relativa falta de datos toxicológicos en humanos y al conocimiento de la genotoxicidad de la
acrilamida en células y animales de experimentación.
2.2.1. Absorción, distribución, metabolismo y excreción
‐ Absorción y distribución
A partir de estudios toxicocinéticos llevados a cabo con acrilamida marcada isotópicamente
(13C y 14C) se ha demostrado que su absorción puede ocurrir a través de diferentes rutas como
la exposición oral, dérmica o por inhalación. Debido a su polaridad, solubilidad en agua y a su
bajo peso molecular, la acrilamida se absorbe muy fácilmente (Shipp y col., 2006). Una vez
absorbida, la acrilamida se distribuye rápidamente a través de la sangre a los diferentes tejidos
y órganos, como el muscular, la piel, el hígado, los riñones, el corazón, el cerebro o el pulmón y
se ha detectado también en la placenta y en la leche materna (Schettgen y col., 2004).
‐ Metabolismo
Posteriormente, la acrilamida se convierte rápidamente en su epóxido genotóxico: glicidamida.
Esta epoxidación tiene lugar en el hígado por la acción del citocromo P450 2E1 monooxigenasa
46
- - - - - - - - - - - - - -
(CYP2E1) mediante la oxigenación del doble enlace de la acrilamida (Friedman, 2003).
Posteriormente, la glicidamida y la acrilamida pueden formar conjugados con el glutatión (GSH)
a través de la enzima glutatión‐S‐transferasa (GST) (Paulsson y col., 2005). Una visión general
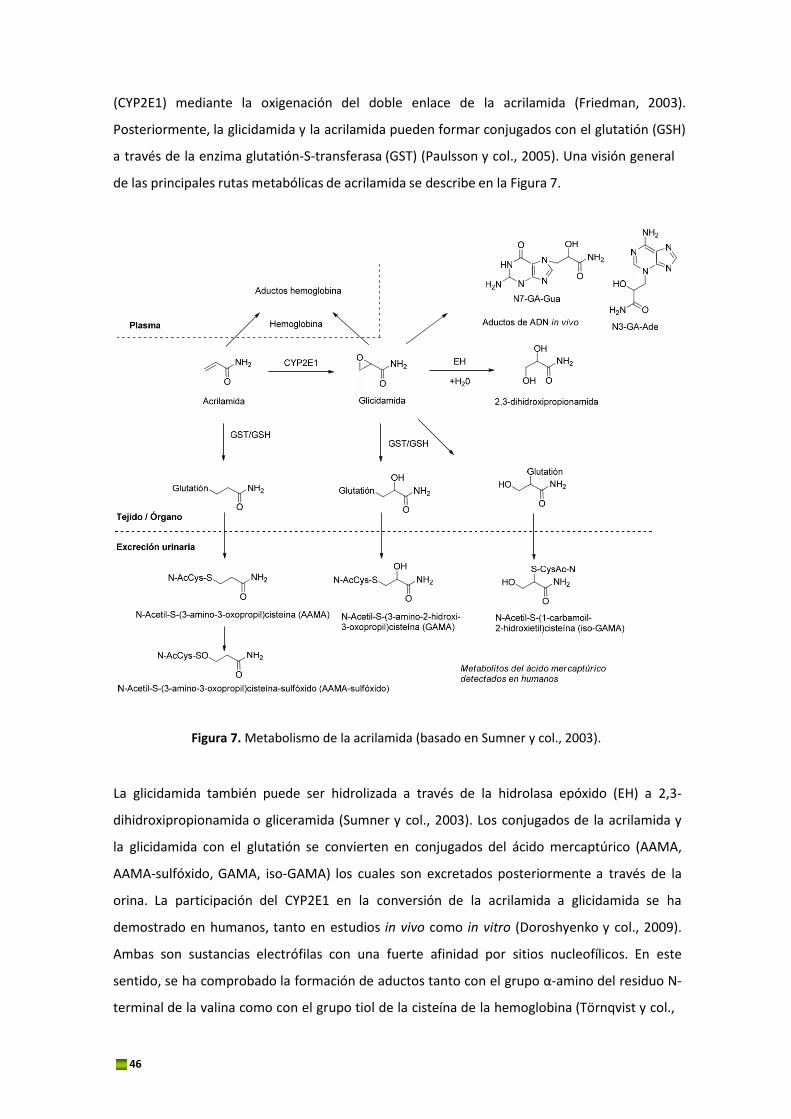
de las principales rutas metabólicas de acrilamida se describe en la Figura 7.
Figura 7. Metabolismo de la acrilamida (basado en Sumner y col., 2003).
La glicidamida también puede ser hidrolizada a través de la hidrolasa epóxido (EH) a 2,3‐
dihidroxipropionamida o gliceramida (Sumner y col., 2003). Los conjugados de la acrilamida y
la glicidamida con el glutatión se convierten en conjugados del ácido mercaptúrico (AAMA,
AAMA‐sulfóxido, GAMA, iso‐GAMA) los cuales son excretados posteriormente a través de la
orina. La participación del CYP2E1 en la conversión de la acrilamida a glicidamida se ha
demostrado en humanos, tanto en estudios in vivo como in vitro (Doroshyenko y col., 2009).
Ambas son sustancias electrófilas con una fuerte afinidad por sitios nucleofílicos. En este
sentido, se ha comprobado la formación de aductos tanto con el grupo α‐amino del residuo N‐
terminal de la valina como con el grupo tiol de la cisteína de la hemoglobina (Törnqvist y col.,

ACRILAMIDA ……..……………………………………………........
47
2008), siendo la glicidamida más reactiva hacia las proteínas y el ADN que la propia acrilamida.
Sin embargo, la epoxidación de la acrilamida a glicidamida parece ser menos importante en los
humanos que en los roedores (Fennell y col, 2006).
‐ Excreción
La eliminación se produce principalmente en la orina como conjugados del ácido mercaptúrico
(Figura 7). La mayor parte (40‐70%) de la acrilamida marcada, que es absorbida en ratas, se
excreta en la orina como metabolitos (Shipp y col., 2006) La excreción de acrilamida en forma
de metabolitos urinarios comienza poco después de la exposición y cerca del 50% es excretado
en 24 horas (Fennell y col, 2006). A diferencia de los aductos de hemoglobina, los metabolitos
urinarios del ácido mercaptúrico pueden dar idea de una exposición a corto plazo (que va
desde horas hasta unos días). Además hay que tener en cuenta que estos metabolitos están
muy influenciados por factores como el estilo de vida y la edad, ya que se ha demostrado que
los niños y adolescentes excretan concentraciones significativamente mayores del metabolito
glicidamida (Hartmann y col., 2008).
2.2.2. Toxicidad
‐ Neurotoxicidad
Los estudios sobre neurotoxicidad en humanos se refieren a la exposición ocupacional de
trabajadores a través de la absorción por vía cutánea o por inhalación. Afecta tanto al sistema
nervioso central y periférico como a las terminaciones nerviosas, produciendo la inhibición de
la liberación de neurotransmisores y la degeneración del nervio terminal (LoPachin y col.,
2008). Recientemente, se ha sintetizado un derivado de la melatonina que ha demostrado
tener efecto protector frente a la neurotoxicidad causada por la acrilamida (Ahmed y col.,
2010). En estudios realizados con ratas y ratones, el nivel sin efecto observable (NOEL) para el
efecto neurotóxico se ha estimado entre 0,2 y 10 mg/kg peso corporal/día, muy por encima de
la exposición dietética. Sin embargo, se ha encontrado que la neurotoxicidad de la acrilamida
podría ser acumulativa, por lo que la exposición dietética podría no ser insignificante (LoPachin,
2004).
‐ Carcinogenicidad
Desde 1994, la Agencia Internacional de Investigación sobre el Cáncer (IARC) ha clasificado a la
acrilamida como sustancia probablemente carcinogénica en humanos. Varios estudios
realizados en roedores apoyan dicha evidencia, ya que puede causar tumores en diversos
órganos como el pulmón, útero, piel, cerebro, etc. Además puede afectar a la reparación del
48
ADN y provocar la síntesis no programada del mismo tanto en las células mamarias humanas
como en los tejidos de las ratas (Lafferty y col., 2004).
La oxidación de la acrilamida a glicidamida es un requisito previo para estimar su
genotoxicidad debido a que esta última presenta mayor reactividad para formar aductos con el
ADN (Rice, 2005; Tareke y col., 2006). Aunque la acrilamida y la glicidamida reaccionan
directamente con la hemoglobina, sólo la glicidamida lo hace extensamente con el ADN,
formando el aducto N7‐GA‐Gua (N7‐(2‐carbamoil‐2‐hidroxietil)guanina) y en menor
proporción el aducto N3‐GA‐Ade (N3‐(2‐carbamoil‐2‐hidroxiethil)adenina) (Figura 7) (Dybing y
col., 2005; Doerge y col., 2005). Por todo ello, la glicidamida ha demostrado ser mutagénica y
genotóxica in vitro e in vivo. Sin embargo, en un estudio realizado en bacterias y líneas
celulares de mamíferos se ha demostrado que la acrilamida no es genotóxica in vitro ya que no
se activó metabólicamente a glicidamida (Koyama y col., 2011). Por otra parte, la extrapolación
de estos resultados a los humanos no es tan evidente, entre otras cosas por los elevados
niveles de exposición utilizados en los estudios llevados a cabo con animales y células en
comparación con la exposición a través de los alimentos, las diferencias en las vías de
exposición así como en el metabolismo (Dybing y col., 2005).
Hasta ahora, los estudios epidemiológicos no han respondido de forma clara y sin ningún tipo
de ambigüedad a la pregunta de si la exposición dietética a la acrilamida puede aumentar el
riesgo de cáncer en los humanos. Algunos resultados coinciden en señalar que no hay
asociación entre la ingesta total de acrilamida en la dieta y el riesgo de contraer algunos tipos
de cáncer (revisión de Mucci y col., 2009), mientras que para tipos de cáncer como el renal, de
esófago, de ovario o de mama, los resultados epidemiológicos son contradictorios (Wilson y
col., 2010; Larsson y col., 2009; Hogervorst y col., 2008; Lin y col., 2011). Sin embargo, de
forma general los estudios epidemiológicos suelen tener limitaciones, ya sea en la evaluación
de la exposición (generalmente con cuestionarios de frecuencia de consumo de alimentos), las
co‐exposiciones o la capacidad limitada para detectar pequeños aumentos en la incidencia de
tumores (Mucci y col., 2006). Por tanto, la asociación real entre la exposición a acrilamida a
través de los alimentos y el riesgo de algunos tipos de cáncer podría ser mayor que los riesgos
relativos estimados a través de los estudios epidemiológicos.
‐ Evaluación de riesgos
El Reglamento (CE) Nº 1272/2008 sobre sustancias de riesgo ha clasificado el monómero de
acrilamida como carcinógeno de categoría 1B‐H350 y mutágeno de categoría 1B‐340 en
ACRILAMIDA ……..……………………………………………........
49
humanos (Reglamento (CE) Nº 1272/2008). La acrilamida, como carcinógeno genotóxico, se
considera que no tiene umbral límite de exposición para su reacción con el ADN y por lo tanto,
efectos adversos (O'Brien y col., 2006). En el área de seguridad alimentaria, tales compuestos
son tratados principalmente por el principio "ALARA", lo que significa que los niveles deben ser
"tan bajos como sean razonablemente posibles". Sin embargo, este enfoque se basa
únicamente en la identificación del peligro y no tiene en cuenta ni el potencial cancerígeno ni
la exposición humana.
Otra de las técnicas generalmente empleadas para caracterizar el riesgo para los seres
humanos es la extrapolación de la relación dosis‐respuesta. Los datos obtenidos con animales
deben extrapolarse a dosis muy inferiores a las estudiadas para poder compararlos con los
niveles de exposición en humanos. En consecuencia, podría estimarse el número de cánceres
adicionales causados por exposición debido a la acrilamida (O'Brien y col., 2006). La estimación
del potencial carcinógeno varía según los modelos matemáticos utilizados para la
extrapolación. Comúnmente, en los métodos de extrapolación lineal a dosis bajas no se tienen
en cuenta los procesos biológicos involucrados en la carcinogénesis y la biodisponibilidad,
dando lugar probablemente a una sobreestimación del riesgo real (Dybing y col., 2003).
Como se ha comentado, las dosis empleadas de acrilamida en los experimentos con animales
están muy por encima de la exposición dietética para los humanos. Por tanto, el grado de
conversión de acrilamida a glicidamida, así como mecanismos de reparación de ADN y
apoptosis, pueden ser muy diferentes a dosis bajas (FAO/WHO, 2005). En una revisón reciente
se ha discutido la evidencia sobre la carcinogenicidad de la ingesta dietética de acrilamida a
partir de estudios epidemiológicos y en ensayos realizados con roedores (Hogervorst y col.,
2010). Los resultados demuestran que algunos tipos de cáncer se encontraron tanto en ratas
como en humanos mientras que otros exclusivamente en humanos, indicando que la
genotoxicidad no puede ser el único mecanismo por el que la acrilamida causa cáncer, sino
que ésta podría influir en el sistema hormonal, en el cual los roedores no son buenos modelos.
Otro enfoque diferente de evaluación recomendado por la EFSA para la evaluación del riesgo
es el Margen de Exposición (MOE) (EFSA, 2005b). El valor del MOE indica el nivel de riesgo y es
de utilidad en el establecimiento de prioridades para la implementación de medidas que
protejan la salud pública. Se le considera como la aproximación más apropiada para
compuestos genotóxicos y cancerígenos como es el caso de la acrilamida. Cuanto menor sea el
valor MOE, mayor potencial de riesgo para la salud tendrá la sustancia objeto de estudio.
50
Teniendo en cuenta que un MOE > 10.000 indicaría una baja preocupación, para el caso de la
acrilamida se ha calculado un MOE entre 300 para los consumidores medios (1 μg/kg peso/día)
y 75 para los consumidores de riesgo (4 μg/kg peso/día). Es de destacar que el MOE de la
acrilamida está muy por debajo del calculado para el caso de otros contaminates de procesado
como son los hidrocarburos aromáticos policíclicos (25.000 para los consumidores medio) y la
amina heterocíclica PhIP (260.000 para el consumidor medio). Por tanto, la ingesta diaria de
acrilamida puede ser considerada como un riesgo potencial para la salud del consumidor
(O'Brien y col., 2006).
‐ Exposición
A través de fuentes diferentes a la dieta
Desde mediados de 1950, se produce acrilamida a partir de acrilonitrilo en las plantas
industriales. Básicamente, la acrilamida es polimerizada para formar poliacrilamida cuyo
principal uso es el tratamiento de aguas residuales y de consumo, con la finalidad de eliminar
partículas sólidas y otras impurezas. El propio polímero no es tóxico, pero puede existir algún
residuo del monómero que justifica su estricto control. La acrilamida también se utiliza en
materiales de construcción y en la fabricación de pegamentos, papel, en agentes
acondicionadores del suelo y en el procesado de minerales. También puede utilizarse en la
producción de plásticos, textiles y pintura. Los utensilios domésticos, los materiales de
construcción así como ciertas partes de los automóviles están revestidos con resinas de
acrilamida. Algunos cosméticos contienen también acrilamida monomérica residual debido al
hecho que la poliacrilamida se utiliza por ejemplo en los champús como agente espumante, y
como lubricante en los maquillajes, jabones y lociones. En la Tabla 9 se recoge la legislación
referente a la exposición a acrilamida a través de las diferentes fuentes.
La acrilamida puede ser absorbida a través de la piel, a través de las membranas mucosas así
como en el tracto gastrointestinal. La exposición humana a acrilamida es principalmente
ocupacional en el caso del contacto dérmico con el monómero sólido, y por inhalación de
polvo y vapores. Otra fuente importante de exposición es a través del humo del tabaco,
detectándose entre 1 y 2 μg en cada cigarrillo (Friedman, 2003).
ACRILAMIDA ……..……………………………………………........
51
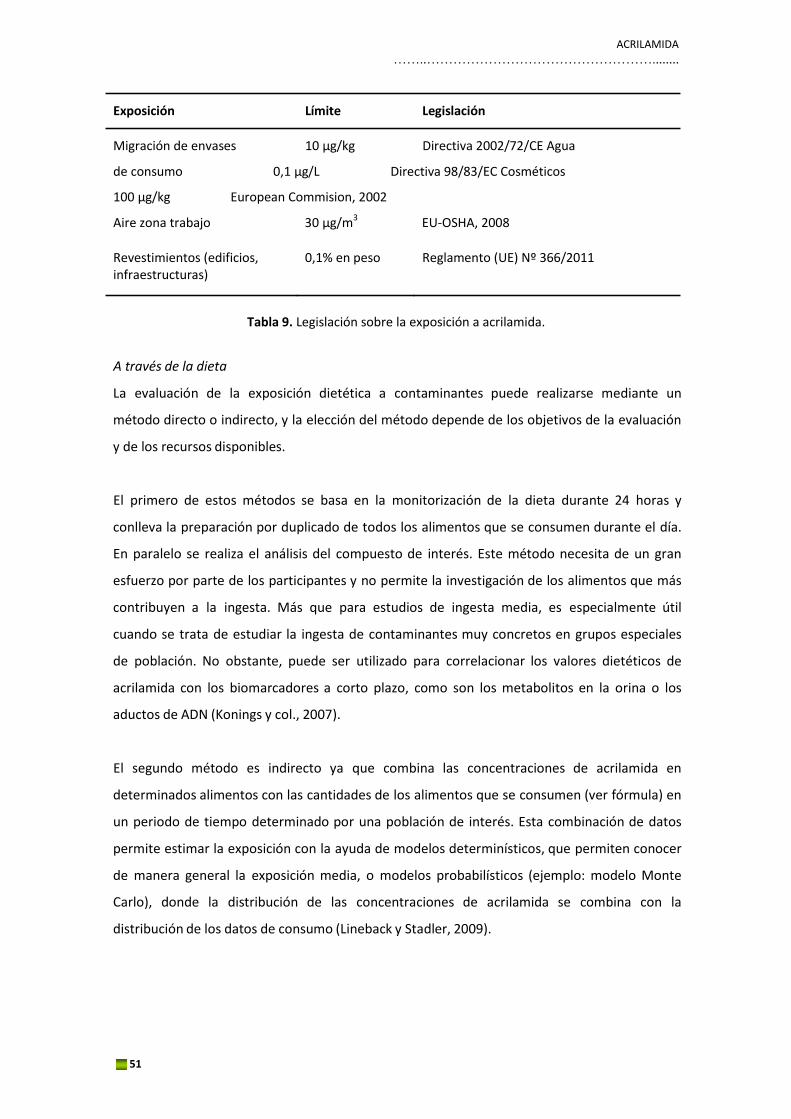
Exposición Límite Legislación
Migración de envases 10 μg/kg Directiva 2002/72/CE Agua
de consumo 0,1 μg/L Directiva 98/83/EC Cosméticos
100 μg/kg European Commision, 2002
Aire zona trabajo 30 μg/m3 EU‐OSHA, 2008
Revestimientos (edificios, infraestructuras)
0,1% en peso Reglamento (UE) Nº 366/2011
Tabla 9. Legislación sobre la exposición a acrilamida.
A través de la dieta
La evaluación de la exposición dietética a contaminantes puede realizarse mediante un
método directo o indirecto, y la elección del método depende de los objetivos de la evaluación
y de los recursos disponibles.
El primero de estos métodos se basa en la monitorización de la dieta durante 24 horas y
conlleva la preparación por duplicado de todos los alimentos que se consumen durante el día.
En paralelo se realiza el análisis del compuesto de interés. Este método necesita de un gran
esfuerzo por parte de los participantes y no permite la investigación de los alimentos que más
contribuyen a la ingesta. Más que para estudios de ingesta media, es especialmente útil
cuando se trata de estudiar la ingesta de contaminantes muy concretos en grupos especiales
de población. No obstante, puede ser utilizado para correlacionar los valores dietéticos de
acrilamida con los biomarcadores a corto plazo, como son los metabolitos en la orina o los
aductos de ADN (Konings y col., 2007).
El segundo método es indirecto ya que combina las concentraciones de acrilamida en
determinados alimentos con las cantidades de los alimentos que se consumen (ver fórmula) en
un periodo de tiempo determinado por una población de interés. Esta combinación de datos
permite estimar la exposición con la ayuda de modelos determinísticos, que permiten conocer
de manera general la exposición media, o modelos probabilísticos (ejemplo: modelo Monte
Carlo), donde la distribución de las concentraciones de acrilamida se combina con la
distribución de los datos de consumo (Lineback y Stadler, 2009).
52
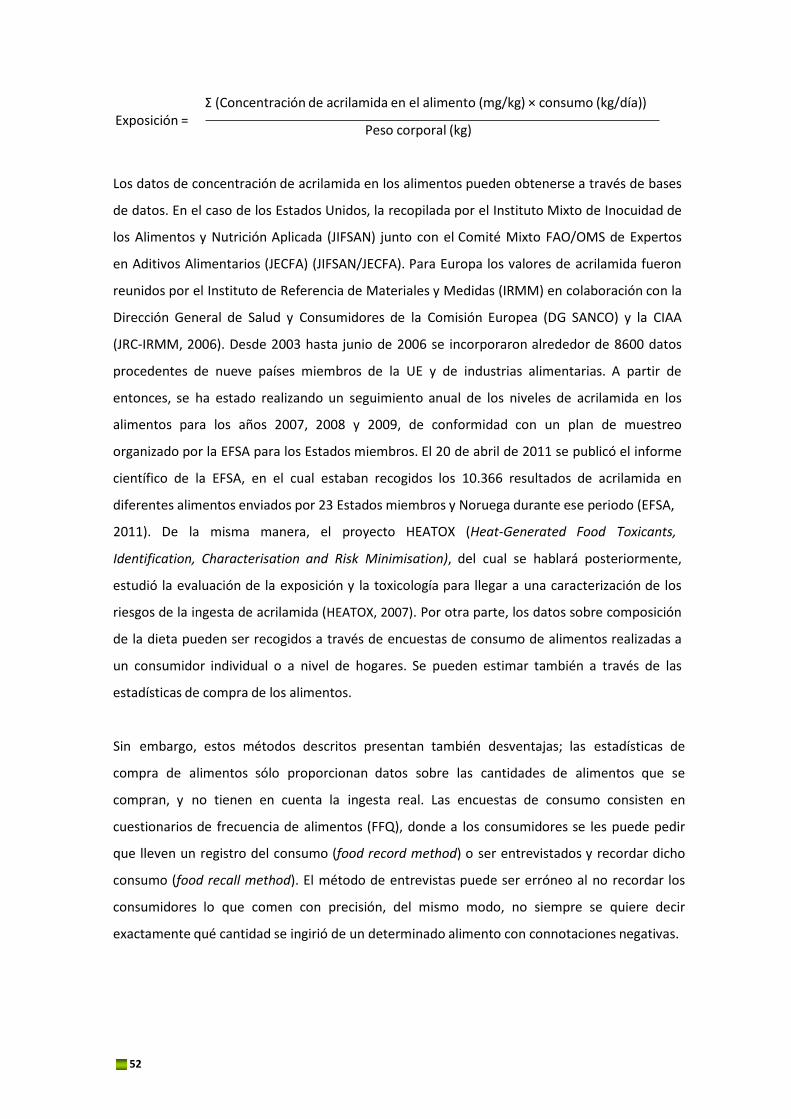
Exposición =
Σ (Concentración de acrilamida en el alimento (mg/kg) × consumo (kg/día))
Peso corporal (kg)
Los datos de concentración de acrilamida en los alimentos pueden obtenerse a través de bases
de datos. En el caso de los Estados Unidos, la recopilada por el Instituto Mixto de Inocuidad de
los Alimentos y Nutrición Aplicada (JIFSAN) junto con el Comité Mixto FAO/OMS de Expertos
en Aditivos Alimentarios (JECFA) (JIFSAN/JECFA). Para Europa los valores de acrilamida fueron
reunidos por el Instituto de Referencia de Materiales y Medidas (IRMM) en colaboración con la
Dirección General de Salud y Consumidores de la Comisión Europea (DG SANCO) y la CIAA
(JRC‐IRMM, 2006). Desde 2003 hasta junio de 2006 se incorporaron alrededor de 8600 datos
procedentes de nueve países miembros de la UE y de industrias alimentarias. A partir de
entonces, se ha estado realizando un seguimiento anual de los niveles de acrilamida en los
alimentos para los años 2007, 2008 y 2009, de conformidad con un plan de muestreo
organizado por la EFSA para los Estados miembros. El 20 de abril de 2011 se publicó el informe
científico de la EFSA, en el cual estaban recogidos los 10.366 resultados de acrilamida en
diferentes alimentos enviados por 23 Estados miembros y Noruega durante ese periodo (EFSA,
2011). De la misma manera, el proyecto HEATOX (Heat‐Generated Food Toxicants,
Identification, Characterisation and Risk Minimisation), del cual se hablará posteriormente,
estudió la evaluación de la exposición y la toxicología para llegar a una caracterización de los
riesgos de la ingesta de acrilamida (HEATOX, 2007). Por otra parte, los datos sobre composición
de la dieta pueden ser recogidos a través de encuestas de consumo de alimentos realizadas a
un consumidor individual o a nivel de hogares. Se pueden estimar también a través de las
estadísticas de compra de los alimentos.
Sin embargo, estos métodos descritos presentan también desventajas; las estadísticas de
compra de alimentos sólo proporcionan datos sobre las cantidades de alimentos que se
compran, y no tienen en cuenta la ingesta real. Las encuestas de consumo consisten en
cuestionarios de frecuencia de alimentos (FFQ), donde a los consumidores se les puede pedir
que lleven un registro del consumo (food record method) o ser entrevistados y recordar dicho
consumo (food recall method). El método de entrevistas puede ser erróneo al no recordar los
consumidores lo que comen con precisión, del mismo modo, no siempre se quiere decir
exactamente qué cantidad se ingirió de un determinado alimento con connotaciones negativas.
ACRILAMIDA ……..……………………………………………........
53
Los métodos mencionados anteriormente se han aplicado en diversos países de todo el mundo.
Sin embargo, la mayoría de los estudios realizados hasta la fecha se basan en el método
indirecto.
El JECFA estimó una ingesta diaria de acrilamida comprendida entre 0,3 y 2,0 μg/kg peso
corporal para la población general y hasta 5,1 μg/kg peso corporal para los grandes
consumidores (percentil 99). Los alimentos que más contribuyen a la exposición total fueron
las patatas fritas (french fries) (16‐30%), las patatas fritas de aperitivo (crisps) (6‐46%), el café
(13‐39%), las galletas (10‐20%), el pan y los productos de bollería (10‐30%). El resto de los
alimentos contribuyen menos del 10%. Los valores de ingesta de 1 y 4 μg/kg peso corporal
(asumiendo un peso corporal de 60 kg) fueron seleccionados por el JECFA para representar a la
población en general y a los grandes consumidores (incluidos los niños), respectivamente (FAO,
WHO, 2005).
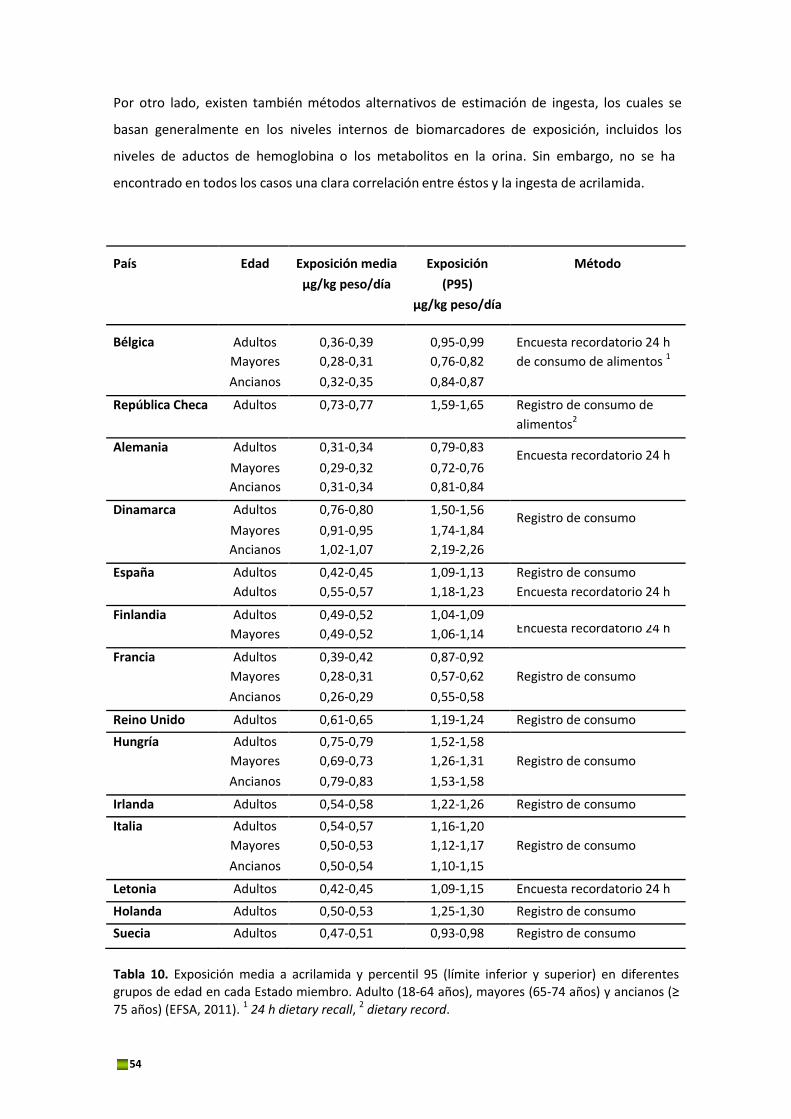
El informe de la EFSA del 2011 incluye una evaluación de la estimación de exposición a la
acrilamida en Europa para diferentes grupos de edad. La ingesta media (límite superior) para
las personas mayores de 18 años se estima que oscila entre 0,31 y 1,07 μg/kg peso
corporal/día y para el percentil 95 entre 0,58 y 2,26 μg/kg de peso corporal/día (Tabla 10). Las
patatas fritas, el pan y el café tostado fueron identificados como las principales fuentes de
exposición (Tabla 11).
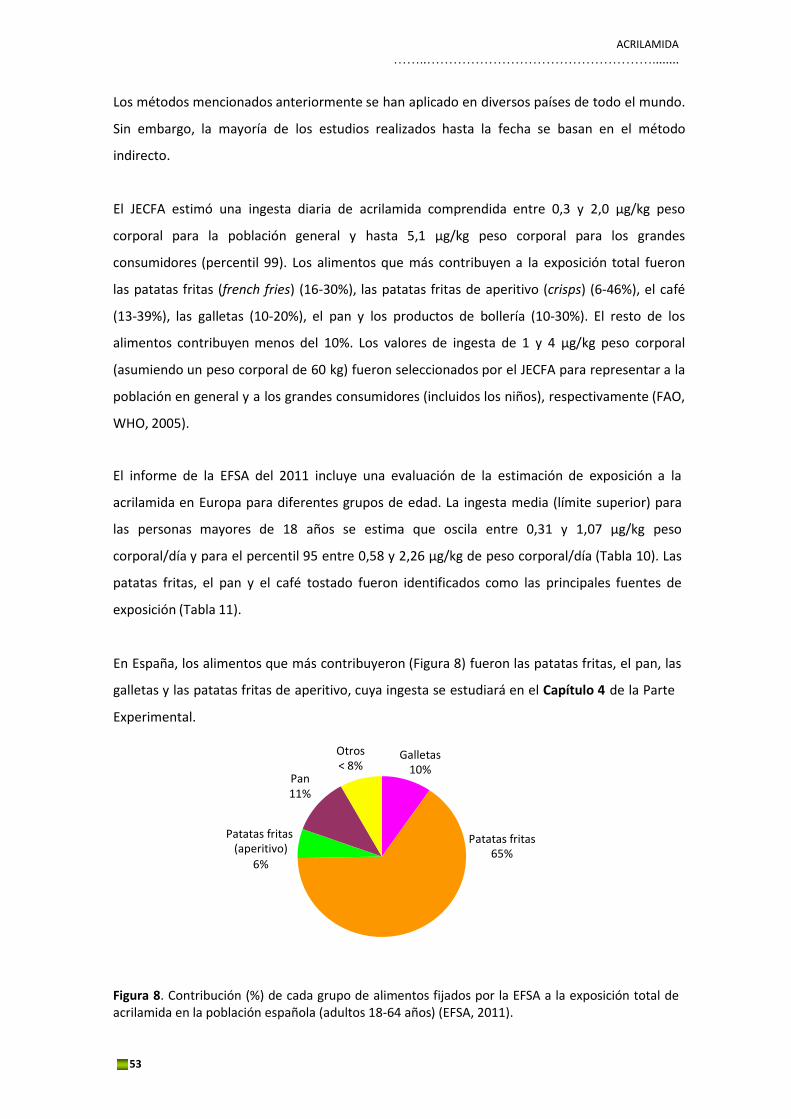
En España, los alimentos que más contribuyeron (Figura 8) fueron las patatas fritas, el pan, las
galletas y las patatas fritas de aperitivo, cuya ingesta se estudiará en el Capítulo 4 de la Parte
Experimental.
Pan 11%
Otros < 8%
Galletas 10%
Patatas fritas
(aperitivo) 6%
Patatas fritas 65%
Figura 8. Contribución (%) de cada grupo de alimentos fijados por la EFSA a la exposición total de acrilamida en la población española (adultos 18‐64 años) (EFSA, 2011).
54
Por otro lado, existen también métodos alternativos de estimación de ingesta, los cuales se
basan generalmente en los niveles internos de biomarcadores de exposición, incluidos los
niveles de aductos de hemoglobina o los metabolitos en la orina. Sin embargo, no se ha
encontrado en todos los casos una clara correlación entre éstos y la ingesta de acrilamida.
País
Edad
Exposición media
μg/kg peso/día
Exposición
(P95)
μg/kg peso/día
Método
Bélgica
Adultos
0,36‐0,39
0,95‐0,99
Encuesta recordatorio 24 h
Mayores 0,28‐0,31 0,76‐0,82 de consumo de alimentos 1
Ancianos 0,32‐0,35 0,84‐0,87
República Checa Adultos 0,73‐0,77 1,59‐1,65 Registro de consumo de alimentos2
Alemania Adultos
Mayores
0,31‐0,34
0,29‐0,32
0,79‐0,83
0,72‐0,76
Encuesta recordatorio 24 h
Ancianos 0,31‐0,34 0,81‐0,84
Dinamarca Adultos
Mayores
0,76‐0,80
0,91‐0,95
1,50‐1,56
1,74‐1,84
Registro de consumo
Ancianos 1,02‐1,07 2,19‐2,26
España Adultos 0,42‐0,45 1,09‐1,13 Registro de consumo
Adultos 0,55‐0,57 1,18‐1,23 Encuesta recordatorio 24 h
Finlandia Adultos 0,49‐0,52 1,04‐1,09
Mayores 0,49‐0,52 1,06‐1,14 Encuesta recordatorio 24 h
Francia Adultos 0,39‐0,42 0,87‐0,92
Mayores 0,28‐0,31 0,57‐0,62 Registro de consumo
Ancianos 0,26‐0,29 0,55‐0,58
Reino Unido Adultos 0,61‐0,65 1,19‐1,24 Registro de consumo
Hungría Adultos 0,75‐0,79 1,52‐1,58
Mayores 0,69‐0,73 1,26‐1,31 Registro de consumo
Ancianos 0,79‐0,83 1,53‐1,58
Irlanda Adultos 0,54‐0,58 1,22‐1,26 Registro de consumo
Italia Adultos 0,54‐0,57 1,16‐1,20
Mayores 0,50‐0,53 1,12‐1,17 Registro de consumo
Ancianos 0,50‐0,54 1,10‐1,15
Letonia Adultos 0,42‐0,45 1,09‐1,15 Encuesta recordatorio 24 h
Holanda Adultos 0,50‐0,53 1,25‐1,30 Registro de consumo
Suecia Adultos 0,47‐0,51 0,93‐0,98 Registro de consumo
Tabla 10. Exposición media a acrilamida y percentil 95 (límite inferior y superior) en diferentes grupos de edad en cada Estado miembro. Adulto (18‐64 años), mayores (65‐74 años) y ancianos (≥ 75 años) (EFSA, 2011). 1 24 h dietary recall, 2 dietary record.
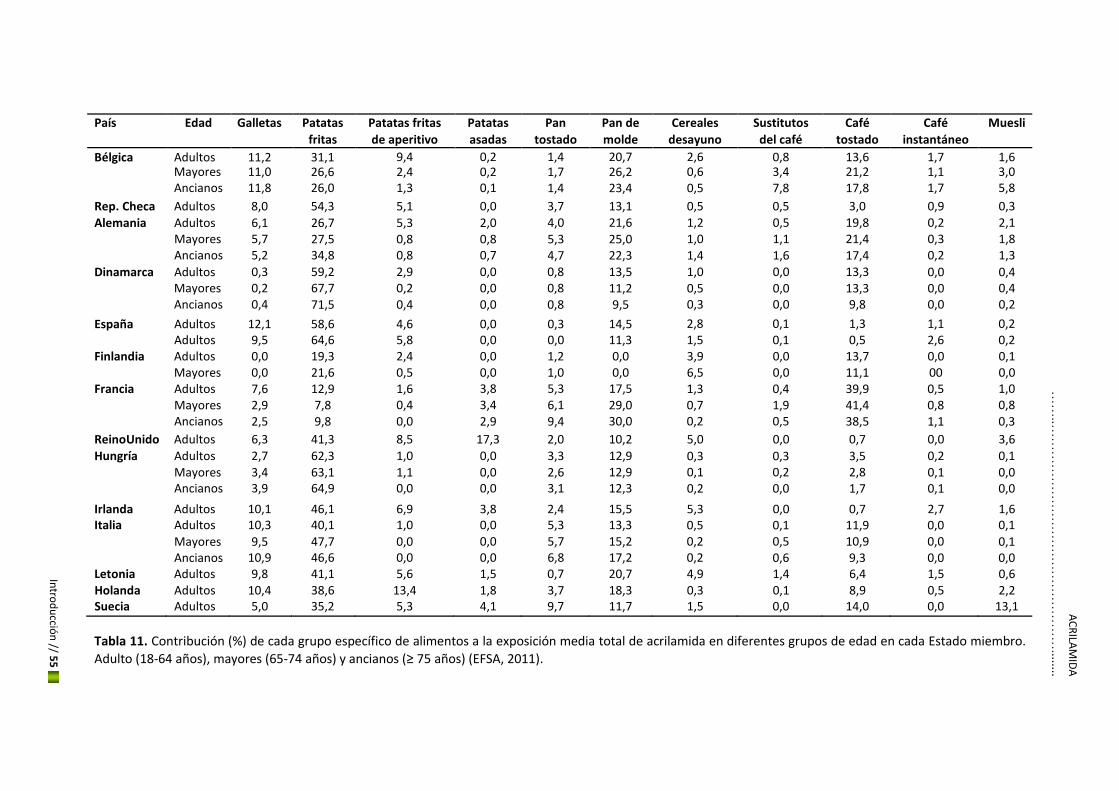
AC
RILA
MID
A
……
..……
……
……
……
……
……
……
……
…........
Intro
du
cción
// 55
País Edad Galletas Patatas fritas
Patatas fritas de aperitivo
Patatas asadas
Pan tostado
Pan de molde
Cereales desayuno
Sustitutos del café
Café tostado
Café instantáneo
Muesli
Bélgica Adultos 11,2 31,1 9,4 0,2 1,4 20,7 2,6 0,8 13,6 1,7 1,6 Mayores 11,0 26,6 2,4 0,2 1,7 26,2 0,6 3,4 21,2 1,1 3,0
Ancianos 11,8 26,0 1,3 0,1 1,4 23,4 0,5 7,8 17,8 1,7 5,8 Rep. Checa Adultos 8,0 54,3 5,1 0,0 3,7 13,1 0,5 0,5 3,0 0,9 0,3 Alemania Adultos 6,1 26,7 5,3 2,0 4,0 21,6 1,2 0,5 19,8 0,2 2,1
Mayores 5,7 27,5 0,8 0,8 5,3 25,0 1,0 1,1 21,4 0,3 1,8
Ancianos 5,2 34,8 0,8 0,7 4,7 22,3 1,4 1,6 17,4 0,2 1,3 Dinamarca Adultos 0,3 59,2 2,9 0,0 0,8 13,5 1,0 0,0 13,3 0,0 0,4
Mayores 0,2 67,7 0,2 0,0 0,8 11,2 0,5 0,0 13,3 0,0 0,4
Ancianos 0,4 71,5 0,4 0,0 0,8 9,5 0,3 0,0 9,8 0,0 0,2
España Adultos 12,1 58,6 4,6 0,0 0,3 14,5 2,8 0,1 1,3 1,1 0,2
Adultos 9,5 64,6 5,8 0,0 0,0 11,3 1,5 0,1 0,5 2,6 0,2 Finlandia Adultos 0,0 19,3 2,4 0,0 1,2 0,0 3,9 0,0 13,7 0,0 0,1
Mayores 0,0 21,6 0,5 0,0 1,0 0,0 6,5 0,0 11,1 00 0,0 Francia Adultos 7,6 12,9 1,6 3,8 5,3 17,5 1,3 0,4 39,9 0,5 1,0
Mayores 2,9 7,8 0,4 3,4 6,1 29,0 0,7 1,9 41,4 0,8 0,8
Ancianos 2,5 9,8 0,0 2,9 9,4 30,0 0,2 0,5 38,5 1,1 0,3 ReinoUnido Adultos 6,3 41,3 8,5 17,3 2,0 10,2 5,0 0,0 0,7 0,0 3,6 Hungría Adultos 2,7 62,3 1,0 0,0 3,3 12,9 0,3 0,3 3,5 0,2 0,1
Mayores 3,4 63,1 1,1 0,0 2,6 12,9 0,1 0,2 2,8 0,1 0,0
Ancianos 3,9 64,9 0,0 0,0 3,1 12,3 0,2 0,0 1,7 0,1 0,0
Irlanda Adultos 10,1 46,1 6,9 3,8 2,4 15,5 5,3 0,0 0,7 2,7 1,6 Italia Adultos 10,3 40,1 1,0 0,0 5,3 13,3 0,5 0,1 11,9 0,0 0,1
Mayores 9,5 47,7 0,0 0,0 5,7 15,2 0,2 0,5 10,9 0,0 0,1
Ancianos 10,9 46,6 0,0 0,0 6,8 17,2 0,2 0,6 9,3 0,0 0,0 Letonia Adultos 9,8 41,1 5,6 1,5 0,7 20,7 4,9 1,4 6,4 1,5 0,6 Holanda Adultos 10,4 38,6 13,4 1,8 3,7 18,3 0,3 0,1 8,9 0,5 2,2 Suecia Adultos 5,0 35,2 5,3 4,1 9,7 11,7 1,5 0,0 14,0 0,0 13,1
Tabla 11. Contribución (%) de cada grupo específico de alimentos a la exposición media total de acrilamida en diferentes grupos de edad en cada Estado miembro.
Adulto (18‐64 años), mayores (65‐74 años) y ancianos (≥ 75 años) (EFSA, 2011).
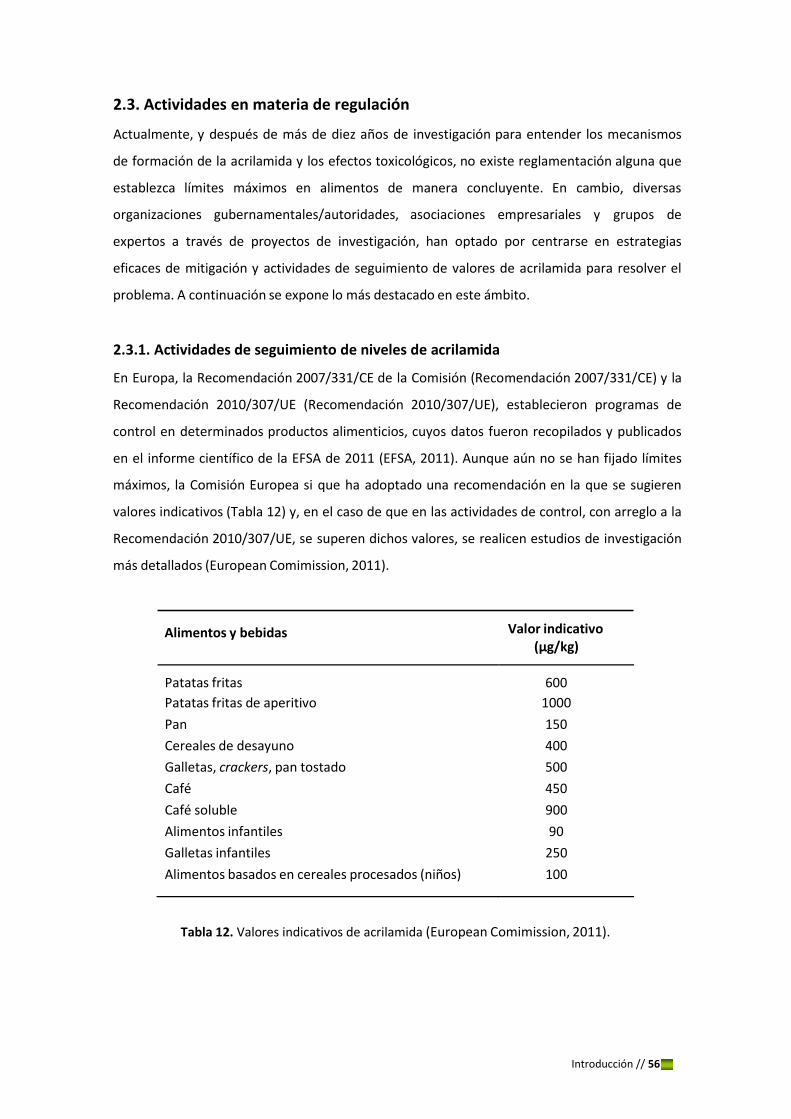
Introducción // 56
(μg/kg)
Patatas fritas
600
Patatas fritas de aperitivo 1000
Pan 150
Cereales de desayuno 400
Galletas, crackers, pan tostado 500
Café 450
Café soluble 900
Alimentos infantiles 90
Galletas infantiles 250
Alimentos basados en cereales procesados (niños) 100
2.3. Actividades en materia de regulación
Actualmente, y después de más de diez años de investigación para entender los mecanismos
de formación de la acrilamida y los efectos toxicológicos, no existe reglamentación alguna que
establezca límites máximos en alimentos de manera concluyente. En cambio, diversas
organizaciones gubernamentales/autoridades, asociaciones empresariales y grupos de
expertos a través de proyectos de investigación, han optado por centrarse en estrategias
eficaces de mitigación y actividades de seguimiento de valores de acrilamida para resolver el
problema. A continuación se expone lo más destacado en este ámbito.
2.3.1. Actividades de seguimiento de niveles de acrilamida
En Europa, la Recomendación 2007/331/CE de la Comisión (Recomendación 2007/331/CE) y la
Recomendación 2010/307/UE (Recomendación 2010/307/UE), establecieron programas de
control en determinados productos alimenticios, cuyos datos fueron recopilados y publicados
en el informe científico de la EFSA de 2011 (EFSA, 2011). Aunque aún no se han fijado límites
máximos, la Comisión Europea si que ha adoptado una recomendación en la que se sugieren
valores indicativos (Tabla 12) y, en el caso de que en las actividades de control, con arreglo a la
Recomendación 2010/307/UE, se superen dichos valores, se realicen estudios de investigación
más detallados (European Comimission, 2011).
Alimentos y bebidas Valor indicativo
Tabla 12. Valores indicativos de acrilamida (European Comimission, 2011).
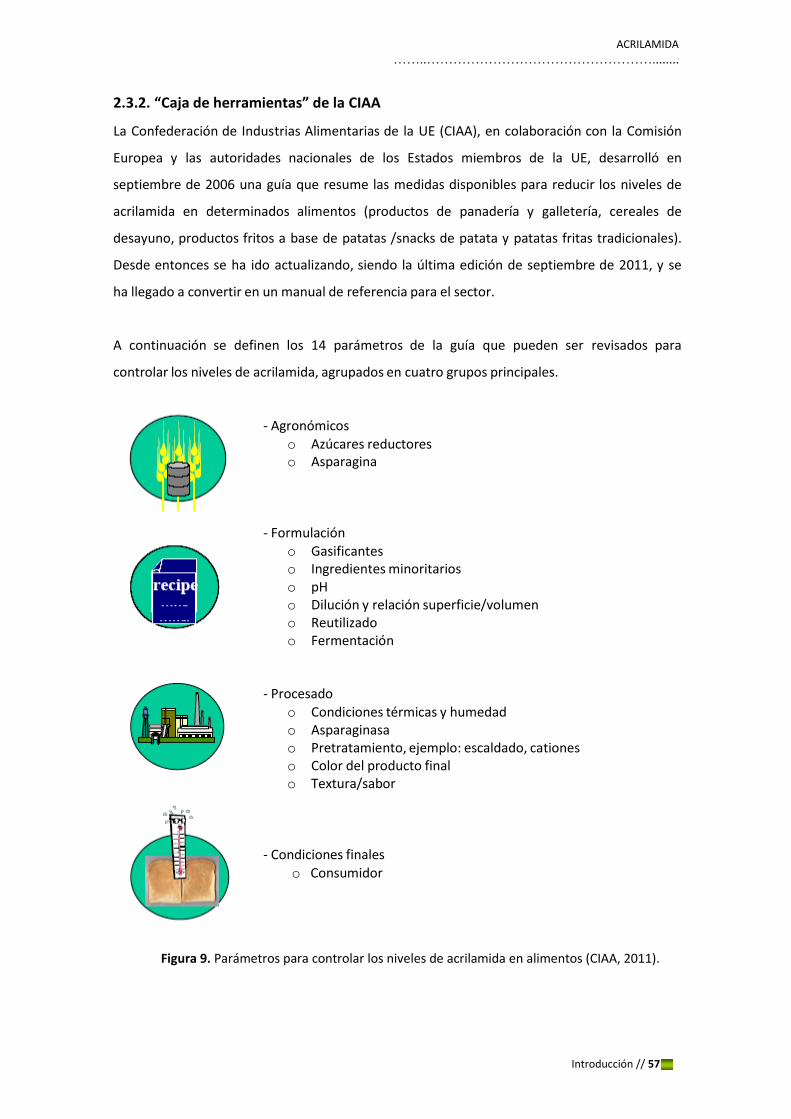
Introducción // 57
ACRILAMIDA ……..……………………………………………........
2.3.2. “Caja de herramientas” de la CIAA
La Confederación de Industrias Alimentarias de la UE (CIAA), en colaboración con la Comisión
Europea y las autoridades nacionales de los Estados miembros de la UE, desarrolló en
septiembre de 2006 una guía que resume las medidas disponibles para reducir los niveles de
acrilamida en determinados alimentos (productos de panadería y galletería, cereales de
desayuno, productos fritos a base de patatas /snacks de patata y patatas fritas tradicionales).
Desde entonces se ha ido actualizando, siendo la última edición de septiembre de 2011, y se
ha llegado a convertir en un manual de referencia para el sector.
A continuación se definen los 14 parámetros de la guía que pueden ser revisados para
controlar los niveles de acrilamida, agrupados en cuatro grupos principales.
‐ Agronómicos o Azúcares reductores o Asparagina
‐ Formulación
o Gasificantes o Ingredientes minoritarios o pH o Dilución y relación superficie/volumen o Reutilizado o Fermentación
‐ Procesado o Condiciones térmicas y humedad o Asparaginasa o Pretratamiento, ejemplo: escaldado, cationes o Color del producto final o Textura/sabor
‐ Condiciones finales o Consumidor
Figura 9. Parámetros para controlar los niveles de acrilamida en alimentos (CIAA, 2011).
Introducción // 58
Con objeto de ayudar a las industrias alimentarias en la apliación de esta “caja de
herramientas”, se ha desarrollado una serie de folletos informativos que proporcionan
recomendaciones eficaces para evitar la formación de acrilamida, así como pautas necesarias
para ponerlas en práctica. En junio de 2012, FoodDrinkEurope (anteriormente CIAA) ha
publicado estos folletos revisados en los cuales se ha incluido información sobre el principio
"ALARA" con respecto a los niveles de este contaminante en los alimentos, una estructura
mejorada y más fácil de usar y nuevas herramientas de mitigación. Estos folletos están
disponibles en más de 20 idiomas en la siguiente página web:
http://ec.europa.eu/food/food/chemicalsafety/contaminants/acrylamide_en.htm
2.3.3. Proyecto HEATOX
El proyeto HEATOX desarrollado entre el 2003 y el 2007, fue financiado por la Comisión
Europea, con el objetivo de investigar los riesgos para la salud que suponen la acrilamida y
otros compuestos que se forman con el tratamiento térmico de los alimentos, como son el
HMF y los furanos. El informe final incluyó una serie de recomendaciones para minimizar la
formación de acrilamida en diferentes alimentos que fueron publicadas en el documento
“Guidelines to authorities and consumer organisations on home cooking and consumption”
(HEATOX, 2007).
2.3.4. Valor señal
En agosto de 2002, se puso en marcha en Alemania una estrategia de monitorización y
minimización de los niveles de acrilamida en los alimentos. Para ello, se definió un parámentro
denominado valor señal (signal value) para cada uno de los grupos de alimentos básicos. Este
valor señal identifica el 10% de los productos de cada grupo que tienen los niveles más altos de
acrilamida y es revisado y publicado anualmente (BVL, 2002). Las empresas que alcancen ese
valor en sus productos, se les piden que revisen el proceso de elaboración y tomen las medidas
oportunas. Sin embargo, no se toma ninguna acción legal en el caso de que las empresas no
cumplan con las peticiones, aunque los resultados se hacen públicos. En el Capítulo 4, Artículo
4.1 se verá aplicado este concepto para el caso de las patatas fritas de aperitivo en España.
2.3.5. Organismos internacionales y otros
‐ Comisión del Codex Alimentarius
La Comisión del Codex Alimentarius es una organización internacional que fue establecida en
1963 por la FAO y la OMS con el propósito de proteger la salud de los consumidores. En el año
ACRILAMIDA ……..……………………………………………........
59
2009 presentó un Código de Prácticas (CAC/RCP 67‐2009) con la finalidad de orientar a las
autoridades de los países y a los fabricantes, así como a otros organismos pertinentes, para
prevenir y reducir la formación de acrilamida en productos a base de patata y de cereales. Para
llevar a cabo dicho cometido, es necesario que no se produzca incremento de otros
contaminantes, ni cambios negativos en las propiedades organolépticas y que no se
comprometa la estabilidad microbiológica del producto final.
‐ FAO/OMS
En junio de 2002, la OMS organizó una reunión conjunta FAO/OMS, en la cual se recomendó
que se estableciera una red informática internacional sobre acrilamida en los alimentos y se
invitara a todas las partes interesadas a compartir los datos pertinentes, así como las
investigaciones en curso. Como consecuencia de ello, se creó una red informática sobre
acrilamida en los alimentos (Acrylamide Infonet, 2002). Posteriormente, a solicitud del Codex
Alimentarius, el JECFA llevó a cabo una evaluación de riesgos en febrero de 2005 en Roma,
donde se alcanzaron las mismas conclusiones que en la anterior reunión de la OMS.
‐ FDA
En Estados Unidos, la Agencia de Alimentos y Medicamentos (FDA) en el año 2002, publicó su
Proyecto de Plan de Acción para hacer frente al tema de la acrilamida en los alimentos, la
última versión salió publicada en el año 2004. Actualmente, la FDA continúa estudiando los
efectos sobre la salud de la acrilamida en los alimentos y no ha impuesto acción regulatoria
alguna. Tampoco ha recomendado dejar de comer productos que contengan acrilamida, sino
que por el momento el mejor consejo es simplemente seguir una dieta saludable, escogiendo
una variedad de alimentos bajos en grasas trans y saturadas, y ricos en fibra, además del
consumo de frutas y verduras.
‐ Propuesta 65 de California
La Propuesta 65 o el Acta de Aplicación de Seguridad en Agua Potable y Tóxicos de 1986, es
una ley estatal de los Estados Unidos que solicita que los negocios en California informen a los
ciudadanos de las exposiciones significativas a los compuestos que potencialmente pueden
causar cáncer o daño reproductivo. Los negocios pueden reformular sus productos hacia
exposiciones menores que se encuentren por debajo de los niveles estimados por el Estado, o
pueden advertir a los ciudadanos de la exposición por medio de un etiquetado en sus
productos o colocando un aviso de advertencia.
60
Con respecto a la acrilamida, desde 1990 California ya incluía esta sustancia en la lista de los
carcinógenos enumerados en la Propuesta 65, es decir, 12 años antes de que se descubriera su
presencia en los alimentos. Tras este descubrimiento, se exigió a los negocios alimentarios,
incluyendo a fabricantes, tiendas y restaurantes, que colocaran advertencias cuando vendieran
productos que contuviese acrilamida. En febrero de 2011, la Oficina de Evaluación de Riesgos
de la Salud y el Medio Ambiente (OEHHA) de California ha introducido también en la Propuesta
65 la acrilamida como un compuesto que produce efectos tóxicos en la reproducción (OEHHA,
2011).
‐ Canadá
El Gobierno de Canadá incluyó la acrilamida en su Plan de Gestión de Productos Químicos.
Dicho plan toma medidas inmediatas para regular las sustancias que son perjudiciales para la
salud o el medio ambiente. El 21 de febrero de 2009, el Gobierno de Canadá dio a conocer su
informe de evaluación. Para garantizar que la exposición a la acrilamida a través de las
diferentes fuentes de alimentos sea lo más baja posible, Canadá se ha comprometido a
trabajar con las autoridades sanitarias de otros países para comprender mejor cómo se forma,
los alimentos que contienen las cantidades más altas, y el impacto que tiene en la salud. Por
otro lado, ha preparado una serie de recomendaciones con el fin de minimizar la formación de
acrilamida en los alimentos preparados en los hogares. Algunos ejemplos son: no almacenar
las patatas por debajo de 8 ºC, lavar o remojar las patatas frescas cortadas en agua durante
varios minutos antes de freír, y utilizar temperaturas máximas de 175 ºC, en el caso de la
fritura, o 230 ºC en el caso del horneado, siempre dejando las patatas con un color final dorado
claro. Además, aconseja limitar los alimentos altos en grasa (como las patatas fritas), el azúcar
o la sal y seguir una alimentación saludable (Health Canada).
2.4. Mecanismos de formación
A continuación se discuten las diferentes vías de formación de la acrilamida en los alimentos,
junto con los principales precursores y productos intermedios, siendo la RM la ruta principal.
2.4.1. Reacción de Maillard
Como se muestra en la Figura 10, el primer paso de la RM conlleva la condensación de un
aminoácido (por ejemplo, asparagina) con el grupo carbonilo de un azúcar reductor para
formar un conjugado N‐glicosil (por ejemplo, N‐glicosilasparagina) que está en equilibrio con
su base de Schiff. La N‐glicosilasparagina genera grandes cantidades de acrilamida, lo que
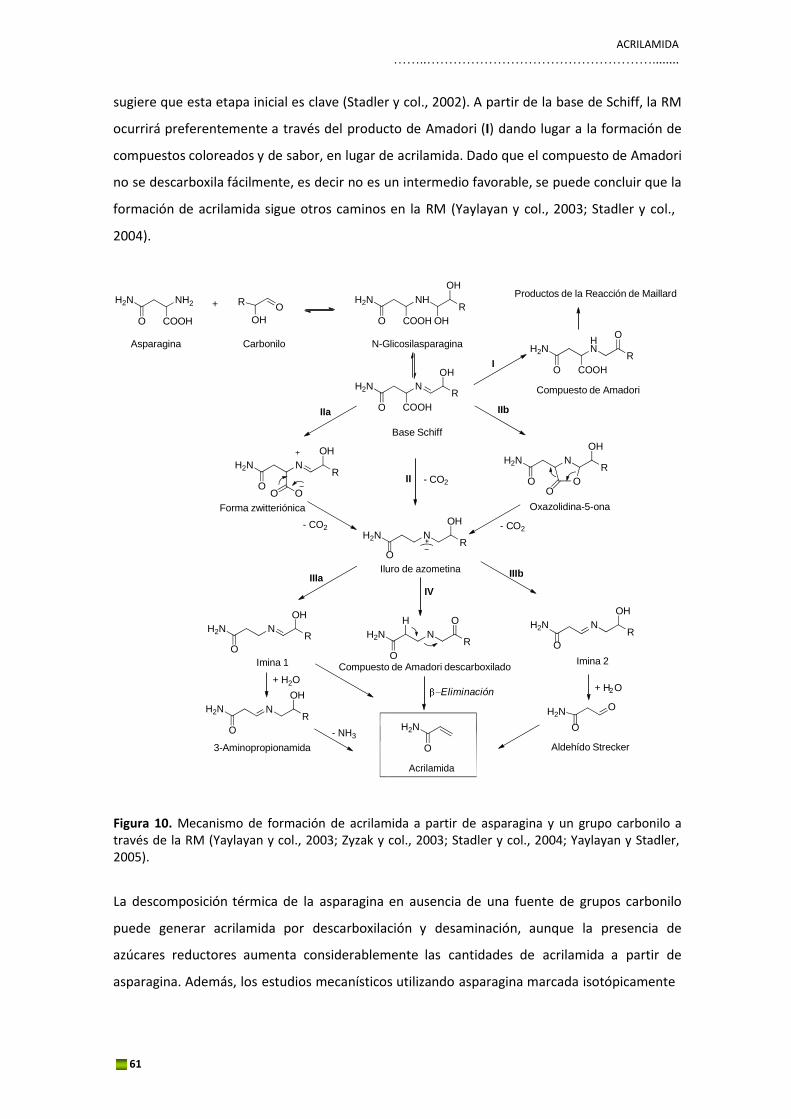
ACRILAMIDA ……..……………………………………………........
61
IIIb
sugiere que esta etapa inicial es clave (Stadler y col., 2002). A partir de la base de Schiff, la RM
ocurrirá preferentemente a través del producto de Amadori (I) dando lugar a la formación de
compuestos coloreados y de sabor, en lugar de acrilamida. Dado que el compuesto de Amadori
no se descarboxila fácilmente, es decir no es un intermedio favorable, se puede concluir que la
formación de acrilamida sigue otros caminos en la RM (Yaylayan y col., 2003; Stadler y col.,
2004).
H2N
NH2 + R
O
OH
H2N NH R
Productos de la Reacción de Maillard
O COOH OH O COOH OH
O
Asparagina Carbonilo N-Glicosilasparagina
I OH
H2N
O
H N
R
COOH
IIa
H2N
O
N R
COOH
IIb
Compuesto de Amadori
OH
H2N N R
Base Schiff
OH
H2N N R
O II - CO2 O O
O O O
Forma zwitteriónica
- CO2
OH
H2N N R
O
- CO2
Oxazolidina-5-ona
Iluro de azometina IIIa
IV
OH OH
H2N N R
O
H O
H2N N R
O
H2N N R
O
Imina 1 Compuesto de Amadori descarboxilado Imina 2
+ H2O + H O
H2N
O
OH
N R
- NH3
H2N
Eliminación 2
H2N O
O
3-Aminopropionamida O
Acrilamida
Aldehído Strecker
Figura 10. Mecanismo de formación de acrilamida a partir de asparagina y un grupo carbonilo a través de la RM (Yaylayan y col., 2003; Zyzak y col., 2003; Stadler y col., 2004; Yaylayan y Stadler, 2005).
La descomposición térmica de la asparagina en ausencia de una fuente de grupos carbonilo
puede generar acrilamida por descarboxilación y desaminación, aunque la presencia de
azúcares reductores aumenta considerablemente las cantidades de acrilamida a partir de
asparagina. Además, los estudios mecanísticos utilizando asparagina marcada isotópicamente
62
con 15N y 13C, confirmaron que el nitrógeno del grupo amida y los tres átomos de carbono de la
acrilamida derivan de la molécula de asparagina (Zyzak y col., 2003).
Varios estudios proporcionaron más evidencias sobre estas posibles rutas de formación. La
base de Schiff puede decarboxilar al intermedio iluro de azometina (II) a través de la forma
zwitteriónica (IIa) (Zyzak y col., 2003), o a través del intermedio oxazolidina‐5‐ona por ciclación
intramolecular (IIb) (Yaylayan y col., 2003). El iluro de azometina puede sufrir fácilamente
prototropía 1,2 conduciendo a las iminas 1 y 2 y como esta prototropía es irreversible, las dos
aminas no son interconvertibles. La imina 1 puede hidrolizarse (IIIa) y formar el aminoácido
descarboxilado 3‐aminopropionamida (Stadler y col., 2004). Granvogl y Schieberle han
demostrado que se forma acrilamida a partir de 3‐aminopropionamida mediante eliminación
del amoníaco (Granvogl y Schieberle, 2006). Por otro lado, la tautomerización del iluro de
azometina (IV) conduce al producto de Amadori descarboxilado, seguido de la rotura del
enlace carbono‐nitrógeno como consecuencia de una β‐eliminación y formación posterior de
acrilamida (Stadler y col., 2004). La imina 2 por hidrólisis (IIIb) proporciona el aldehído de
Strecker de la asparagina (3‐oxopropanamida). Sin embargo, este aldehído no produce
cantidades elevadas de acrilamida (Stadler y col., 2004).
No sólo los azúcares reductores pueden actuar como fuente de grupo carbonilo para formar
acrilamida, también los α‐dicarbonílicos o cualquier otro compuesto carbonílico (Mottram y
col., 2002; Zyzak y col., 2003; Schieberle y col., 2005; Amrein y col., 2006a). La naturaleza del
compuesto carbonílico es importante para determinar el grado en que se producen las
diferentes vías de formación y por tanto, el rendimiento. En sistemas modelo se ha
demostrado que los compuestos α‐hidroxicarbonílicos (como la fructosa o la glucosa) son
mucho más eficientes en convertir asparagina a acrilamida que los α‐dicarbonílicos (como la
butanodiona o el glioxal). Esto puede explicarse porque la presencia de un grupo hidroxilo en
posición β al átomo de nitrógeno de la base de Schiff favorece la reorganización de la imina 1
(tautomerización) al producto de Amadori descarboxilado (IV). Para los compuestos α‐
dicarbonílicos, la vía IIIb está mucho más favorecida que la IIIa, debido a la tendencia del grupo
carbonilo en la posición β al átomo de nitrógeno a deslocalizar la carga negativa. Como se
mencionó anteriormente, la vía IIIb, no libera grandes cantidades de acrilamida (Stadler y col.,
2004). Amrein y col., mostraron resultados opuestos, encontrando 300 veces más cantidad de
acrilamida en el sistema modelo glioxal‐asparagina que en otro similar con glucosa o fructosa
(Amrein y col., 2006a). Otro estudio ha confirmado que el glioxal también es muy reactivo
frente a la asparagina para producir acrilamida (Koutsidis y col., 2008). Más recientemente se
ACRILAMIDA ……..……………………………………………........
63
ha publicado la contribución del HMF a la formación de acrilamida en presencia de asparagina.
Los investigadores observaron que el sistema modelo glucosa‐HMF genera acrilamida más
eficientemente que los sistemas glucosa‐asparagina (Glu‐Asn), sugiriendo que el HMF es un
compuesto carbonílico capaz de acelerar la formación de acrilamida en sistemas modelo de
baja humedad (Gökmen y col., 2012).
Como se ha comentado, el iluro de azometina y el producto de Amadori descarboxilado son
intermedios clave. Perez‐Locas y col. sintetizaron ambos compuestos y estudiaron su
capacidad para generar acrilamida tanto en condiciones de alta como de baja humedad (Perez‐
Locas y Yaylayan, 2008b). En ambas condiciones, la base de Schiff posee una elevada capacidad
para dar lugar a acrilamida. En el sistema modelo de baja humedad, el aumento es casi cuatro
veces mayor que el correspondiente producto de Amadori descarboxilado o la 3‐
aminopropionamida. Sin embargo, en condiciones de humedad, es de 2 veces en relación al
producto de Amadori descarboxilado, pero más de 20 veces con respecto a la 3‐
aminopropionamida.
Por último, cabe resaltar que el rendimiento de la reacción no es muy alto, menos del 1% de
asparagina libre se convierte a acrilamida (Becalski y col., 2003). Sin embargo, el bicarbonato
amónico podría aumentar la tasa de conversión hasta el 5% (Amrein y col., 2006a). No
obstante, los rendimientos de reacción son difíciles de predecir, ya que la acrilamida se puede
degradar tanto a través de reacciones de polimerización como de reacciones de adición tipo
Michael (Mottram y col., 2002; Koutsidis y col., 2009; Zamora y col., 2011). En este sentido, los
sistemas modelo cinéticos, que se explicarán en el apartado 2.8, se han utilizado como una
forma de cuantificar de manera simplificada la formación y la degradación de la acrilamida.
2.4.2. Rutas alternativas
Como se ha comentado anteriormente, el principal mecanismo para la formación de
acrilamida en los alimentos es la reacción de asparagina y azúcares reductores mediante la RM.
Sin embargo, hay otras rutas que juegan un papel menor y, por tanto, solo se describen
brevemente.
‐ Acroleína
La acroleína es un aldehído α,β‐insaturado que puede ser producido a partir de los lípidos
(triglicéridos) mediante tratamiento térmico fuerte. Se han encontrado pequeñas cantidades
64
de acroleína en algunos alimentos, tales como los fritos, los aceites de cocina y el café tostado.
Yasuhara y col. han demostrado que la acrilamida puede formarse a partir de la acroleína por
dos vías (Yasuhara y col., 2003). En la primera, el ácido acrílico producido a partir de acroleína
reacciona con el amoniaco (producido a partir de los α‐aminoácidos a través de la degradación
de Strecker en presencia de compuestos carbonílicos) y forma acrilamida. La segunda vía
conlleva la participación de radicales para generar acrilamida.
‐ Ácido acrílico
El ácido acrílico se puede formar por la descomposición térmica del ácido aspártico, carnosina
y β‐alanina (Stadler y col., 2003; Yaylayan y Stadler, 2005). Se puede generar indirectamente a
partir de la serina y la cisteína a través de la formación de ácido pirúvico. El ácido acrílico,
reacciona con el amoníaco disponible para formar acrilamida y su formación se ve limitada por
la disponibilidad del amoníaco en los alimentos (Yaylayan y col., 2005).
‐ 3‐Aminopropionamida
La 3‐aminopropionamida puede ser un intermediario en la RM entre la asparagina y los
azúcares reductores (Figura 10), como se comentará en el Artículo 3.1 del Capítulo 3, o puede
formarse también a partir de la descarboxilación enzimática de la asparagina, mediante la
descarboxilación de la base de Schiff, a través de la base de Schiff formada entre Asn y un
compuesto α‐hidroxicarbonílico o bien por reacción con el ácido pirúvico (Granvogl y col., 2006;
Schieberle y col., 2005). Además, es un precursor de la acrilamida muy eficaz en ausencia de
catalizadores como los compuestos carbonílicos (Granvogl y Schieberle, 2007).
‐ Oxidación lipídica
Diferentes estudios han demostrado que los lípidos oxidados compiten muy eficientemente
con los hidratos de carbono por las reacciones carbonil‐amina, y que los mismos productos se
producen generalmente tanto a partir de carbohidratos como a partir de lípidos a través de
reacciones idénticas o muy similares (Zamora e Hidalgo, 2005). Una amplia gama de lípidos
oxidados son capaces de degradar los aminoácidos a sus correspondientes aldehídos de
Strecker (Hidalgo y col., 2005; Zamora y col., 2007) y a sus derivados vinílogos (Zamora e
Hidalgo, 2008). Entre ellos, el 2,4‐decadienal es el que presenta un grado de reactividad mucho
mayor para convertir asparagina en acrilamida que otros lípidos oxidados. El mecanismo de
esta reacción parece tener lugar en dos etapas principales, la descarboxilación del aminoácido
asparagina (Hidalgo y col., 2010a) y la posterior desaminación de la 3‐aminopropionamida
(Zamora y col., 2009).
ACRILAMIDA ……..……………………………………………........
65
2.5. Métodos analíticos
Para cuantificar el grado de contaminación en el alimento y definir las posibles estrategias de
mitigación de la formación de acrilamida, es imprescindible disponer de métodos analíticos
fiables y selectivos para detectar su presencia en una gran variedad de alimentos. Todo ello
hace que el desarrollo de un método universal de análisis suponga un reto para la comunidad
científica.
Brevemente, el análisis de la acrilamida conlleva varias etapas: extracción, derivatización
(dependiendo del sistema de análisis), purificación, concentración y análisis instrumental, las
cuales se detallan a continuación.
2.5.1. Extracción y purificación
Debido a la alta solubilidad de la acrilamida en agua, se utiliza este medio para realizar su
extracción de los alimentos. De manera general, la extracción se lleva a cabo a temperatura
ambiente aunque también se ha realizado a 60‐80 ºC en el caso de matrices grasas como el
chocolate, con el fin de promover la dispersión y una extracción efectiva. No obstante,
temperaturas elevadas no suponen una mejora en los rendimientos de extracción e incluso
puede generarse un extracto que podría obstruir las columnas de SPE. Posteriormente, la
muestra es homogenizada con la fase acuosa mediante agitación horizontal, rotacional, o bien
mendiante vórtex o blender.
Para controlar los porcentajes de recuperación y realizar un seguimiento de posibles pérdidas
durante las etapas de extracción y purificación, es habitual incorporar un patrón interno a la
muestra. La mayoría de los trabajos publicados emplean [13C3]‐acrilamida aunque también se
han utilizado [13C1]‐acrilamida, [D3]‐acrilamida, N,N‐dimetilacrilamida, [2H3]‐acrilamida y
metacrilamida.
Antes de hablar del proceso de purificación, es preciso destacar que algunos autores incluyen
una etapa de desengrasado previa a la etapa de extracción o en combinación con ella, para
evitar la influencia de las grasas en el análisis, fundamentalmente en matrices como patatas
fritas, chocolate, café, etc. Ésta se lleva a cabo con disolventes orgánicos como hexano, éter de
petróleo o ciclohexano. Además, a los alimentos ricos en proteínas se les añade metanol,
acetonitrilo o una solución salina, K4[Fe(CN)6] + ZnSO4.7H2O, para desproteinizarlos. Después
de la extracción, la fase acuosa se centrifuga o se ultrafiltra (Keramat y col., 2011).
66
En cuanto a los procedimientos de purificación, la mayoría de ellos combina varias etapas de
SPE. Una alternativa interesante puede ser el empleo de un único cartucho de extracción,
como por ejemplo el Oasis HLB, basado en un relleno humectable de fase inversa con un
equilibrio hidrofílico‐lipofílico (Roach y col., 2003; Arribas‐Lorenzo y col., 2009) o el Oasis MCX
con modo mixto intercambio catónico‐fase inversa (Gökmen y col., 2009). El extracto obtenido
se analiza posteriormente, principalmente mediante GC‐MS o LC‐MS/MS.
A continuación se resumen los métodos cromatográficos para el análisis de acrilamida.
2.5.2. Cromatografía de gases‐espectrometría de masas
La acrilamida es un compuesto poco adecuado para el análisis por GC‐MS por varias razones.
En primer lugar, los disolventes polares, preferentemente agua, que se requieren para
efectuar una buena extracción de los alimentos no están bien adaptados para la
preconcentración y la inyección en una columna capilar. En segundo lugar, porque la
acrilamida es muy polar y tiene una baja volatilidad en comparación a su peso molecular. Y por
último, como es una molécula pequeña con un peso molecular de 71,08 g/mol proporciona un
espectro de masas pobre.
El análisis de acrilamida puede llevarse a cabo de forma directa sin derivatización de la
molécula o mediante bromación.
Los métodos mediante derivatización se remontan a la década de 1990 (Castle, 1993) y se
componen de una extracción acuosa a partir de la matriz seguida de la derivatización de la
acrilamida al 2,3‐dibromopropionamida:
Br2 + CH2=CH‐CONH2 → CH2Br‐CHBr‐CONH2
La derivatización podría hacerse con una solución acuosa de bromo elemental o mediante el
uso de KBrO3 y KBr que son más seguros. Posteriormente, el derivado se extrae con acetato de
etilo el cual puede ser inyectado directamente mediante GC‐MS o bien ser purificado o
preconcentrado para conseguir límites de detección más bajos. Aunque la derivatización es
larga y tediosa, esta metodología presenta múltiples ventajas entre las que destacan: mejora
en la selectividad y sensibilidad, eliminación de los interferentes co‐extractivos y aumento en
la volatilidad. Por lo general los iones monitorizados son m/z 150/152 [CH2CHBrCONH2]+ y m/z
106/108 [CH2CHBr]+. Algunos investigadores optan por convertir el dibromo derivado a 2‐
ACRILAMIDA ……..……………………………………………........
67
bromopropenamida por tratamiento con trietilamina. Este paso adicional evita el riesgo de
una deshidrobromación en el inyector o en la fuente de iones del MS sin disminuir la
selectividad o la sensibilidad del método. En cuanto a la separación, se realiza en columnas
capilares de polaridad media‐alta. El empleo de GC‐MS/MS o acoplamiento a un
espectrómetro de masas de alta resolución puede reducir el límite de detección para ciertos
alimentos, acercándose al rango de 1‐2 μg /kg.
No obstante, se han desarrollado métodos analíticos para su análisis de forma directa
(Biedermann y col., 2002a). En gran parte debido a que ofrecen un mayor rendimiento de
muestra, evitando el tiempo consumido en la etapa de bromación, además de reducir el uso
de productos corrosivos y peligrosos. El proceso consiste en la extracción del analito con
disolventes orgánicos seguido de una limpieza de la muestra mediante extracción líquido‐
líquido con o sin el uso de un absorbente. Las columnas para la separación cromatográficas y la
detección mediante monitorización de iones seleccionados (SIM) son polares del tipo
Carbowax. Una revisión extensa sobre los métodos basados en GC‐MS para el análisis de
acrilamida incluyendo la derivatización fue redactada por Castle y col. (Castle y col., 2005).
2.5.3. Cromatografía de líquidos‐espectrometría de masas
El primer método de LC‐MS para el análisis de acrilamida en alimentos se desarrolló a
principios del 2002 por Rosén y Hellenäs (Rosén y col., 2002) para verificar los resultados
iniciales obtenidos en Suecia mediante GC‐MS. Generalmente, conlleva la extracción acuosa de
acrilamida a partir de la matriz del alimento seguido de una o varias etapas de SPE utilizando
rellenos tanto de fase inversa como de intercambio iónico. Finalmente, la separación
cromatográfica se realiza mediante HPLC con columnas de grafito, fase inversa o intercambio
iónico. En cuanto al sistema de detección, la mayoría de los trabajos publicados emplean la
espectrometría de masas con un analizador de triple cuadruplo con ionización positiva por
electrospray (ESI) y en menor medida APCI. No obstante, y debido al alto coste de este sistema
ha sido necesario desarrollar métodos basados en un único cuadrupolo en modo SIM, con los
cuales se han obtenido también buenos límites de detección para la mayoría de las matrices
alimentarias.
Hay que tener en cuenta que debido al bajo peso molecular de la acrilamida y por tanto de sus
fragmentos iónicos, la confirmación se logra monitorizando más de una transición
característica. Sin embargo, ya que la acrilamida es una molécula muy polar con escasa
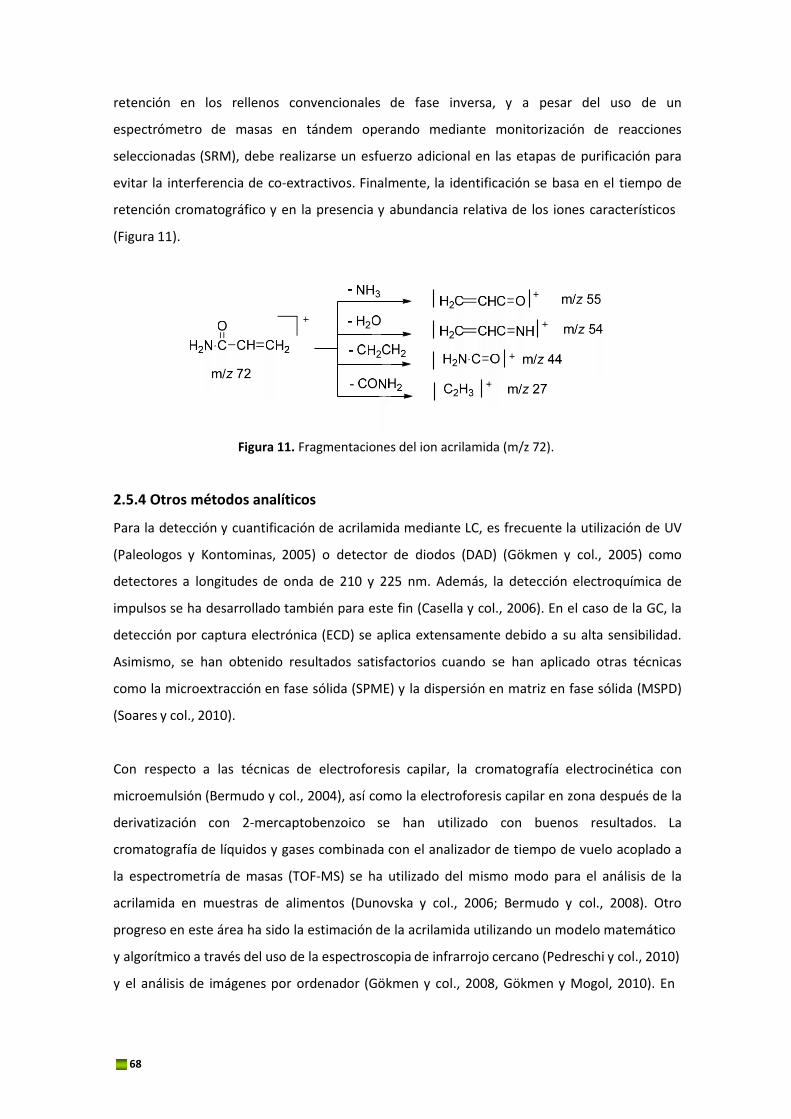
68
retención en los rellenos convencionales de fase inversa, y a pesar del uso de un
espectrómetro de masas en tándem operando mediante monitorización de reacciones
seleccionadas (SRM), debe realizarse un esfuerzo adicional en las etapas de purificación para
evitar la interferencia de co‐extractivos. Finalmente, la identificación se basa en el tiempo de
retención cromatográfico y en la presencia y abundancia relativa de los iones característicos
(Figura 11).
Figura 11. Fragmentaciones del ion acrilamida (m/z 72).
2.5.4 Otros métodos analíticos
Para la detección y cuantificación de acrilamida mediante LC, es frecuente la utilización de UV
(Paleologos y Kontominas, 2005) o detector de diodos (DAD) (Gökmen y col., 2005) como
detectores a longitudes de onda de 210 y 225 nm. Además, la detección electroquímica de
impulsos se ha desarrollado también para este fin (Casella y col., 2006). En el caso de la GC, la
detección por captura electrónica (ECD) se aplica extensamente debido a su alta sensibilidad.
Asimismo, se han obtenido resultados satisfactorios cuando se han aplicado otras técnicas
como la microextracción en fase sólida (SPME) y la dispersión en matriz en fase sólida (MSPD)
(Soares y col., 2010).
Con respecto a las técnicas de electroforesis capilar, la cromatografía electrocinética con
microemulsión (Bermudo y col., 2004), así como la electroforesis capilar en zona después de la
derivatización con 2‐mercaptobenzoico se han utilizado con buenos resultados. La
cromatografía de líquidos y gases combinada con el analizador de tiempo de vuelo acoplado a
la espectrometría de masas (TOF‐MS) se ha utilizado del mismo modo para el análisis de la
acrilamida en muestras de alimentos (Dunovska y col., 2006; Bermudo y col., 2008). Otro
progreso en este área ha sido la estimación de la acrilamida utilizando un modelo matemático
y algorítmico a través del uso de la espectroscopia de infrarrojo cercano (Pedreschi y col., 2010)
y el análisis de imágenes por ordenador (Gökmen y col., 2008, Gökmen y Mogol, 2010). En
Método Patrón
Matriz
Introducción // 69
comparación con los métodos experimentales, estos modelos son más rápidos y cómodos,
especialmente cuando son aplicados para realizar una estimación preliminar.
A modo de resumen, en las Tablas 13 y 14 se recogen las características más importantes de
los principales métodos descritos en la bibliografía aplicados al análisis de acrilamida, basados
tanto en la cromatografía líquida de alta eficacia como en la cromatografía de gases.
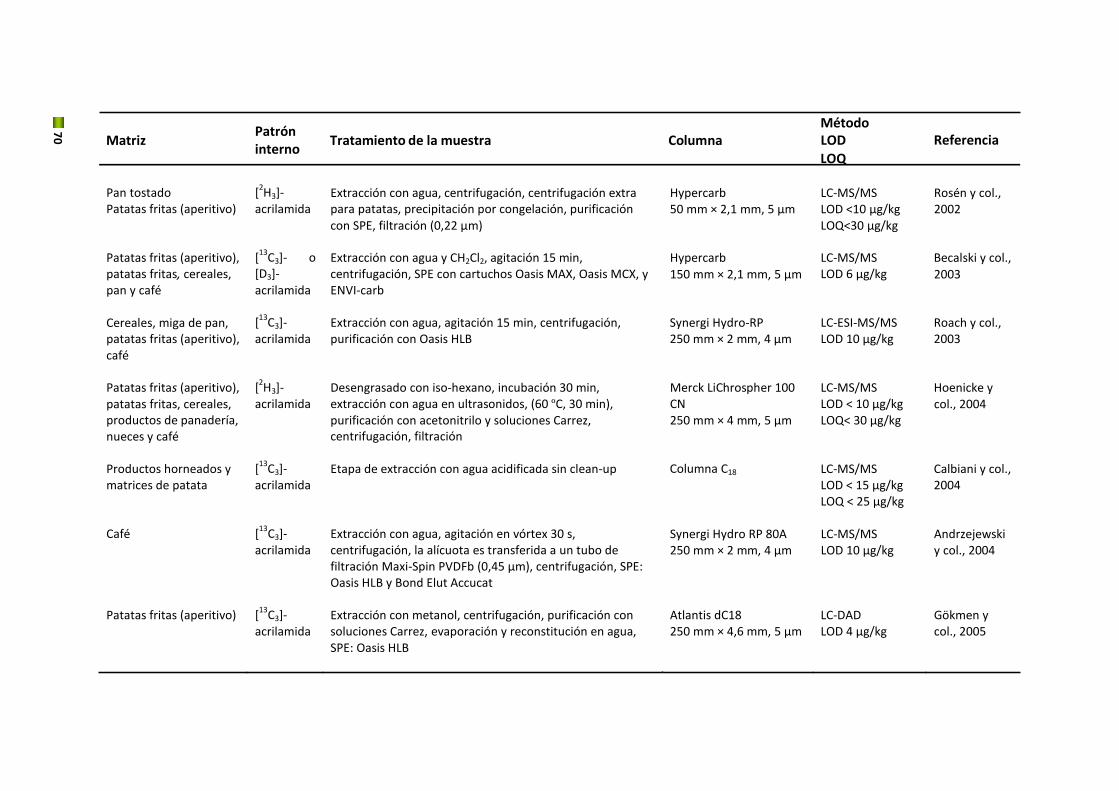
Método Patrón
Matriz
70
interno Tratamiento de la muestra Columna
LOD
Referencia
LOQ
Pan tostado [2H3]‐
Extracción con agua, centrifugación, centrifugación extra
Hypercarb
LC‐MS/MS
Rosén y col., Patatas fritas (aperitivo) acrilamida para patatas, precipitación por congelación, purificación
con SPE, filtración (0,22 μm) 50 mm × 2,1 mm, 5 μm LOD <10 μg/kg
LOQ<30 μg/kg 2002
Patatas fritas (aperitivo), patatas fritas, cereales,
[13
C3]‐ o [D3]‐
Extracción con agua y CH2Cl2, agitación 15 min, centrifugación, SPE con cartuchos Oasis MAX, Oasis MCX, y
Hypercarb
150 mm × 2,1 mm, 5 μm LC‐MS/MS LOD 6 μg/kg
Becalski y col.,
2003 pan y café acrilamida ENVI‐carb
Cereales, miga de pan, [13
C3]‐
Extracción con agua, agitación 15 min, centrifugación,
Synergi Hydro‐RP
LC‐ESI‐MS/MS
Roach y col., patatas fritas (aperitivo), acrilamida purificación con Oasis HLB 250 mm × 2 mm, 4 μm LOD 10 μg/kg 2003 café
Patatas fritas (aperitivo), [2H3]‐
Desengrasado con iso‐hexano, incubación 30 min,
Merck LiChrospher 100
LC‐MS/MS
Hoenicke y patatas fritas, cereales, acrilamida extracción con agua en ultrasonidos, (60 ºC, 30 min), CN LOD < 10 μg/kg col., 2004 productos de panadería, purificación con acetonitrilo y soluciones Carrez, 250 mm × 4 mm, 5 μm LOQ< 30 μg/kg nueces y café centrifugación, filtración
Productos horneados y [13
C3]‐
Etapa de extracción con agua acidificada sin clean‐up
Columna C18
LC‐MS/MS
Calbiani y col., matrices de patata acrilamida LOD < 15 μg/kg 2004
LOQ < 25 μg/kg
Café [13
C3]‐
Extracción con agua, agitación en vórtex 30 s,
Synergi Hydro RP 80A
LC‐MS/MS
Andrzejewski
acrilamida centrifugación, la alícuota es transferida a un tubo de 250 mm × 2 mm, 4 μm LOD 10 μg/kg y col., 2004
filtración Maxi‐Spin PVDFb (0,45 μm), centrifugación, SPE: Oasis HLB y Bond Elut Accucat
Patatas fritas (aperitivo) [13
C3]‐
Extracción con metanol, centrifugación, purificación con
Atlantis dC18
LC‐DAD
Gökmen y
acrilamida soluciones Carrez, evaporación y reconstitución en agua, 250 mm × 4,6 mm, 5 μm LOD 4 μg/kg col., 2005
SPE: Oasis HLB
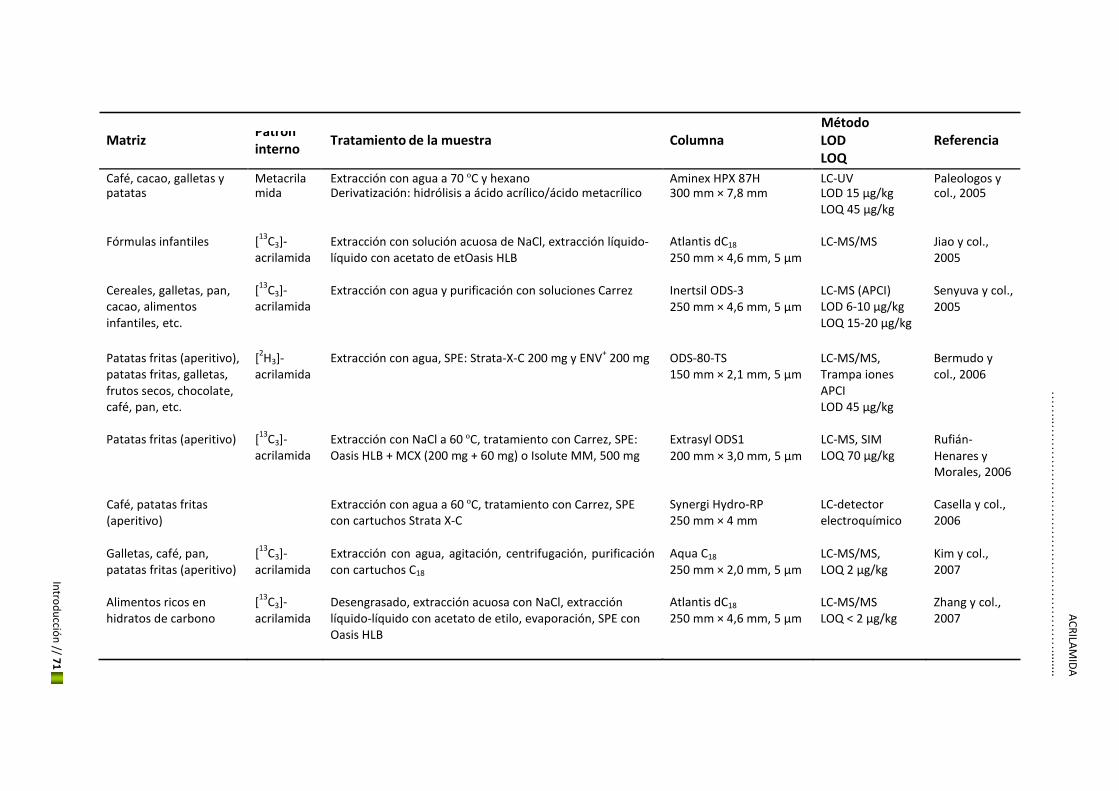
Matriz Patrón interno
Tratamiento de la muestra Columna LOD LOQ
Referencia
Café, cacao, galletas y Metacrila Extracción con agua a 70 ºC y hexano Aminex HPX 87H LC‐UV Paleologos y patatas mida Derivatización: hidrólisis a ácido acrílico/ácido metacrílico 300 mm × 7,8 mm LOD 15 μg/kg col., 2005
LOQ 45 μg/kg
Fórmulas infantiles [13
C3]‐ acrilamida
Extracción con solución acuosa de NaCl, extracción líquido‐ líquido con acetato de etOasis HLB
Atlantis dC18
250 mm × 4,6 mm, 5 μm
LC‐MS/MS
Jiao y col., 2005
Cereales, galletas, pan, cacao, alimentos
[13
C3]‐ acrilamida
Extracción con agua y purificación con soluciones Carrez
Inertsil ODS‐3 250 mm × 4,6 mm, 5 μm
LC‐MS (APCI) LOD 6‐10 μg/kg
Senyuva y col., 2005
infantiles, etc. LOQ 15‐20 μg/kg
Patatas fritas (aperitivo), patatas fritas, galletas,
[2H3]‐
acrilamida
Extracción con agua, SPE: Strata‐X‐C 200 mg y ENV+
200 mg
ODS‐80‐TS 150 mm × 2,1 mm, 5 μm
LC‐MS/MS, Trampa iones
Bermudo y col., 2006
frutos secos, chocolate, APCI café, pan, etc. LOD 45 μg/kg
Patatas fritas (aperitivo) [13
C3]‐ acrilamida
Extracción con NaCl a 60 ºC, tratamiento con Carrez, SPE: Oasis HLB + MCX (200 mg + 60 mg) o Isolute MM, 500 mg
Extrasyl ODS1
200 mm × 3,0 mm, 5 μm
LC‐MS, SIM LOQ 70 μg/kg
Rufián‐
Henares y
Morales, 2006
Café, patatas fritas
Extracción con agua a 60 ºC, tratamiento con Carrez, SPE
Synergi Hydro‐RP
LC‐detector
Casella y col., (aperitivo) con cartuchos Strata X‐C 250 mm × 4 mm electroquímico 2006
Galletas, café, pan, [13
C3]‐
Extracción con agua, agitación, centrifugación, purificación
Aqua C18
LC‐MS/MS,
Kim y col., patatas fritas (aperitivo) acrilamida con cartuchos C18 250 mm × 2,0 mm, 5 μm LOQ 2 μg/kg 2007
Alimentos ricos en [13
C3]‐
Desengrasado, extracción acuosa con NaCl, extracción
Atlantis dC18
LC‐MS/MS
Zhang y col., hidratos de carbono acrilamida líquido‐líquido con acetato de etilo, evaporación, SPE con 250 mm × 4,6 mm, 5 μm LOQ < 2 μg/kg 2007
Oasis HLB
AC
RILA
MID
A
……
..……
……
……
……
……
……
……
……
…........
Intro
du
cción
// 71
Método
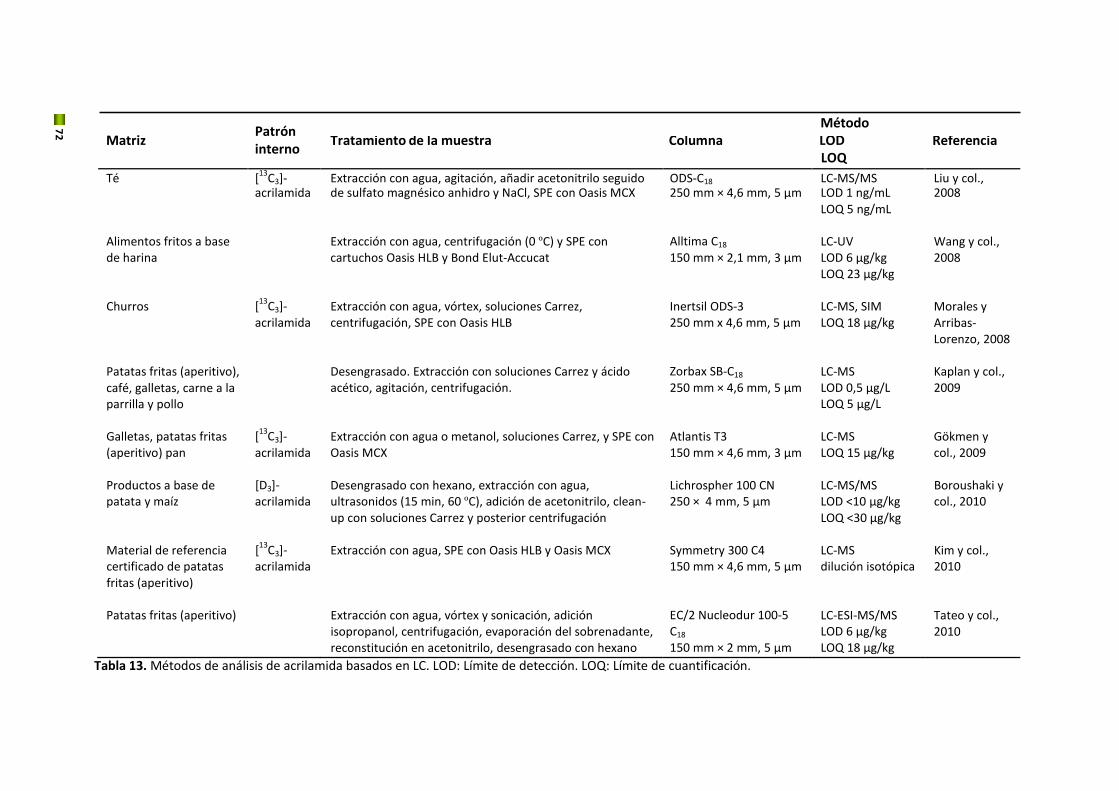
Método Patrón
Matriz
72
interno
Tratamiento de la muestra Columna LOD Referencia LOQ
Té [13
C3]‐ Extracción con agua, agitación, añadir acetonitrilo seguido ODS‐C18 LC‐MS/MS Liu y col., acrilamida de sulfato magnésico anhidro y NaCl, SPE con Oasis MCX 250 mm × 4,6 mm, 5 μm LOD 1 ng/mL 2008
LOQ 5 ng/mL
Alimentos fritos a base
Extracción con agua, centrifugación (0 ºC) y SPE con
Alltima C18
LC‐UV
Wang y col., de harina cartuchos Oasis HLB y Bond Elut‐Accucat 150 mm × 2,1 mm, 3 μm LOD 6 μg/kg 2008
LOQ 23 μg/kg
Churros [13
C3]‐
Extracción con agua, vórtex, soluciones Carrez,
Inertsil ODS‐3
LC‐MS, SIM
Morales y
acrilamida centrifugación, SPE con Oasis HLB 250 mm x 4,6 mm, 5 μm LOQ 18 μg/kg Arribas‐
Lorenzo, 2008
Patatas fritas (aperitivo),
Desengrasado. Extracción con soluciones Carrez y ácido
Zorbax SB‐C18
LC‐MS
Kaplan y col., café, galletas, carne a la acético, agitación, centrifugación. 250 mm × 4,6 mm, 5 μm LOD 0,5 μg/L 2009 parrilla y pollo LOQ 5 μg/L
Galletas, patatas fritas [13
C3]‐
Extracción con agua o metanol, soluciones Carrez, y SPE con
Atlantis T3
LC‐MS
Gökmen y (aperitivo) pan acrilamida Oasis MCX 150 mm × 4,6 mm, 3 μm LOQ 15 μg/kg col., 2009
Productos a base de
[D3]‐
Desengrasado con hexano, extracción con agua,
Lichrospher 100 CN
LC‐MS/MS
Boroushaki y patata y maíz acrilamida ultrasonidos (15 min, 60 ºC), adición de acetonitrilo, clean‐ 250 × 4 mm, 5 μm LOD <10 μg/kg col., 2010
up con soluciones Carrez y posterior centrifugación LOQ <30 μg/kg
Material de referencia [13
C3]‐
Extracción con agua, SPE con Oasis HLB y Oasis MCX
Symmetry 300 C4
LC‐MS
Kim y col., certificado de patatas acrilamida 150 mm × 4,6 mm, 5 μm dilución isotópica 2010 fritas (aperitivo)
Patatas fritas (aperitivo)
Extracción con agua, vórtex y sonicación, adición
EC/2 Nucleodur 100‐5
LC‐ESI‐MS/MS
Tateo y col.,
isopropanol, centrifugación, evaporación del sobrenadante, C18 LOD 6 μg/kg 2010
reconstitución en acetonitrilo, desengrasado con hexano 150 mm × 2 mm, 5 μm LOQ 18 μg/kg Tabla 13. Métodos de análisis de acrilamida basados en LC. LOD: Límite de detección. LOQ: Límite de cuantificación.
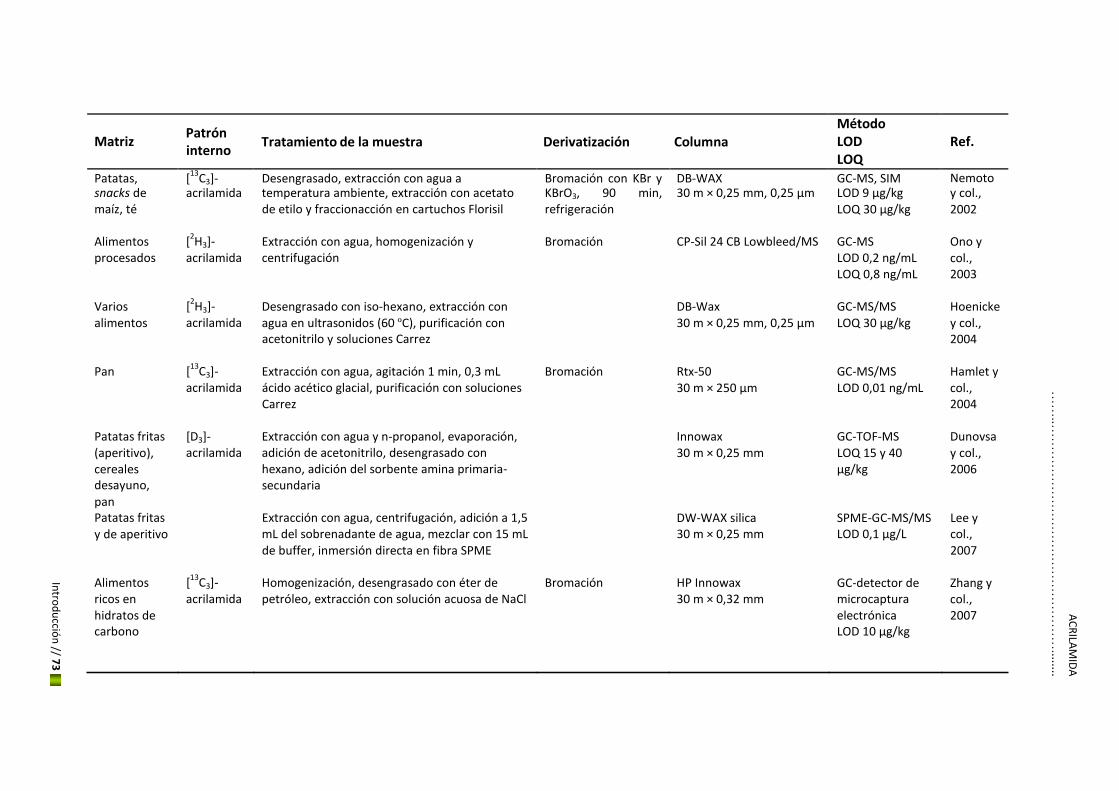
AC
RILA
MID
A
……
..……
……
……
……
……
……
……
……
…........
Intro
du
cción
// 73
Matriz Patrón interno
Tratamiento de la muestra Derivatización Columna
Método LOD LOQ
Ref.
Patatas, [13
C3]‐ Desengrasado, extracción con agua a Bromación con KBr y DB‐WAX GC‐MS, SIM Nemoto snacks de acrilamida temperatura ambiente, extracción con acetato KBrO3, 90 min, 30 m × 0,25 mm, 0,25 μm LOD 9 μg/kg y col., maíz, té de etilo y fraccionacción en cartuchos Florisil refrigeración LOQ 30 μg/kg 2002
Alimentos [2H3]‐
Extracción con agua, homogenización y
Bromación
CP‐Sil 24 CB Lowbleed/MS
GC‐MS
Ono y procesados acrilamida centrifugación LOD 0,2 ng/mL col.,
LOQ 0,8 ng/mL 2003
Varios [2H3]‐
Desengrasado con iso‐hexano, extracción con
DB‐Wax
GC‐MS/MS
Hoenicke alimentos acrilamida agua en ultrasonidos (60 ºC), purificación con 30 m × 0,25 mm, 0,25 μm LOQ 30 μg/kg y col.,
acetonitrilo y soluciones Carrez 2004
Pan [13
C3]‐
Extracción con agua, agitación 1 min, 0,3 mL
Bromación
Rtx‐50
GC‐MS/MS
Hamlet y
acrilamida ácido acético glacial, purificación con soluciones 30 m × 250 μm LOD 0,01 ng/mL col.,
Carrez 2004
Patatas fritas
[D3]‐
Extracción con agua y n‐propanol, evaporación,
Innowax
GC‐TOF‐MS
Dunovsa (aperitivo), acrilamida adición de acetonitrilo, desengrasado con 30 m × 0,25 mm LOQ 15 y 40 y col., cereales hexano, adición del sorbente amina primaria‐ μg/kg 2006 desayuno, secundaria pan Patatas fritas Extracción con agua, centrifugación, adición a 1,5 DW‐WAX silica SPME‐GC‐MS/MS Lee y y de aperitivo mL del sobrenadante de agua, mezclar con 15 mL 30 m × 0,25 mm LOD 0,1 μg/L col.,
de buffer, inmersión directa en fibra SPME 2007
Alimentos [13
C3]‐
Homogenización, desengrasado con éter de
Bromación
HP Innowax
GC‐detector de
Zhang y ricos en acrilamida petróleo, extracción con solución acuosa de NaCl 30 m × 0,32 mm microcaptura col., hidratos de electrónica 2007 carbono LOD 10 μg/kg
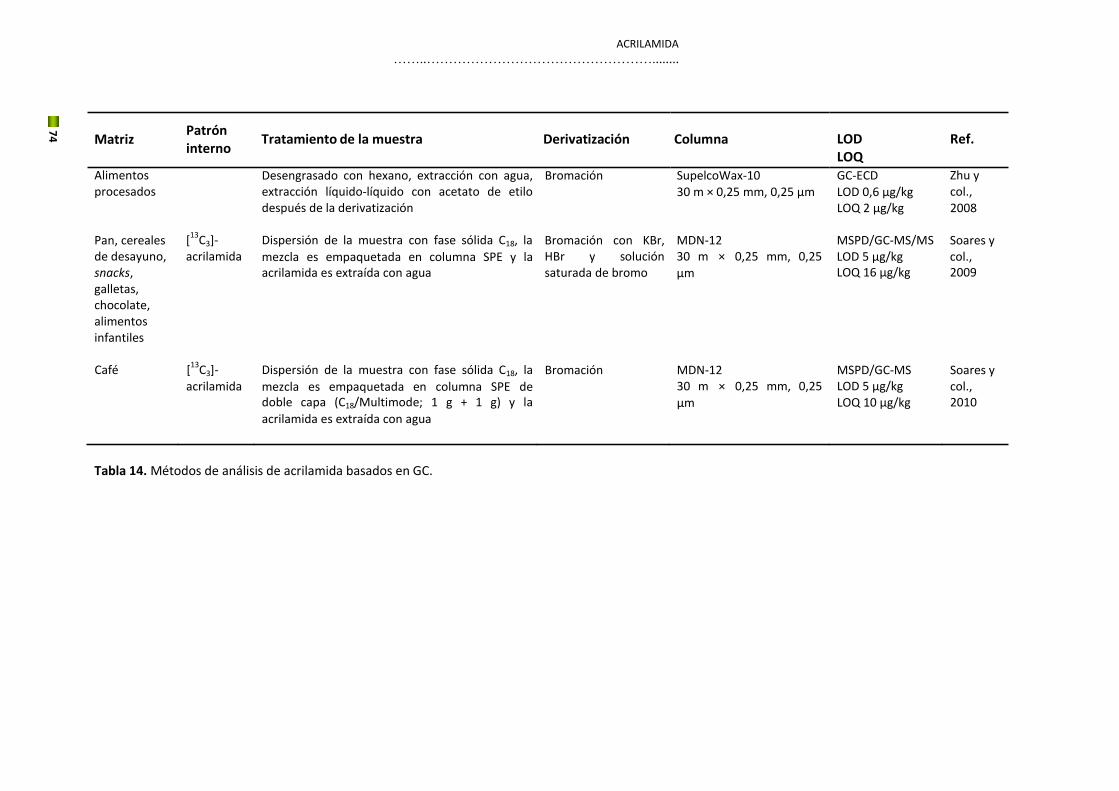
ACRILAMIDA ……..……………………………………………........
Matriz
74
Patrón
interno Tratamiento de la muestra Derivatización Columna
LOD LOQ
Ref.
Alimentos procesados
Desengrasado con hexano, extracción con agua, extracción líquido‐líquido con acetato de etilo después de la derivatización
Bromación SupelcoWax‐10 30 m × 0,25 mm, 0,25 μm
GC‐ECD LOD 0,6 μg/kg LOQ 2 μg/kg
Zhu y col., 2008
Pan, cereales de desayuno, snacks, galletas, chocolate, alimentos infantiles
[13
C3]‐ acrilamida
Dispersión de la muestra con fase sólida C18, la
mezcla es empaquetada en columna SPE y la acrilamida es extraída con agua
Bromación con KBr, HBr y solución saturada de bromo
MDN‐12 30 m × 0,25 mm, 0,25
μm
MSPD/GC‐MS/MS LOD 5 μg/kg LOQ 16 μg/kg
Soares y col., 2009
Café [13
C3]‐ acrilamida
Dispersión de la muestra con fase sólida C18, la
mezcla es empaquetada en columna SPE de doble capa (C18/Multimode; 1 g + 1 g) y la
acrilamida es extraída con agua
Bromación MDN‐12 30 m × 0,25 mm, 0,25
μm
MSPD/GC‐MS LOD 5 μg/kg LOQ 10 μg/kg
Soares y col., 2010
Tabla 14. Métodos de análisis de acrilamida basados en GC.
ACRILAMIDA ……..……………………………………………........
75
2.5.5. Materiales de referencia certificados
La comparación de los resultados analíticos y el aseguramiento de la precisión no es una tarea
fácil en el análisis de acrilamida en matrices complejas. De ahí que las autoridades
competentes hayan hecho especial hincapié en la necesidad de utilizar materiales de
referencia certificados (MRC) como herramienta útil para la precisión y la trazabilidad de los
resultados analíticos. Los MRC se pueden emplear para la validación de los métodos de análisis
desarrollados en los laboratorios con el fin de asegurar la calidad y la competencia técnica.
La producción de un material de referencia sigue principalmente la Guía ISO 34:2000 y la Guía
ISO 35:2006, las cuales incluyen el tratamiento de los materiales, la homogeneidad, la
evaluación de la estabilidad, la caracterización y la asignación del valor analítico (ISO Guide 34,
2000; ISO Guide 35, 2006). La organización FAPAS (Food Análisis Performance Assesment
Scheme) lleva organizando anualmente ejercicios de intercomparación en diferentes matrices
y analitos. La primera ronda de ensayos de aptitud sobre acrilamida (FAPAS 3001) se llevó a
cabo en julio de 2002 utilizando una muestra de pan tostado. De la misma manera, otras
organizaciones también han desarrollado pruebas de aptitud sobre acrilamida. El IRMM ha
llevado a cabo varios ensayos de intercomparación a nivel europeo desde julio de 2003.
Además, el Instituto Federal Alemán para la Evaluación de Riesgos (BfR) organizó su primera
prueba en abril de 2003 y la FDA‐JIFSAN organizó un ejercicio de control en la primavera de
2004.
Es preciso resaltar que nuestro grupo de investigación ha participado activamente en varios
ejercicios obteniendo resultados satisfactorios en las matrices alimentarias objeto de estudio
de la presente Memoria, como se describe en el Anexo I.
2.6. Efecto de la tecnología del procesado
2.6.1. Influencia de la materia prima
‐ Productos a base de patata
En las patatas, la asparagina es el aminoácido libre más abundante (~ 40%) y su concentración
(~ 3400 mg/kg) es más del doble del total de azúcares reductores (~ 1600 mg/kg) (Amrein y
col., 2004a). Varios investigadores observaron que los niveles de acrilamida están relacionados
con las concentraciones de glucosa y fructosa en las patatas (Becalski y col, 2004; Sanny y col.,
2010). Se han encontrado diferencias considerables en los niveles de azúcares entre patatas de
una misma variedad. Se ha establecido que el almacenamiento del producto a temperaturas

76
inferiores a 10 ºC produce un aumento en los azúcares reductores y por tanto, se favorece la
formación de acrilamida durante los procesos de fritura y durante el asado (Sanny y col., 2010).
Este efecto puede minimizarse mediante un reacondicionamiento después del
almacenamiento y siempre previo al procesado.
Por otro lado, la bibliografía describe una relación inversa entre la cantidad de fertilizante
nitrogenado empleado en el cultivo de patata y el contenido de acrilamida, ya que cuando se
utiliza una menor cantidad, los niveles de azúcares reductores se elevan mientras que la
proteína cruda y los niveles de aminoácidos libres disminuyen (De Wilde y col., 2006). Sin
embargo otros autores no observaron ninguna relación con el tipo de fertilizante empleado
(Amrein y col., 2004a).
Independientemente de la fertilización, las condiciones climáticas es otro factor que puede
influir en la formación de acrilamida. De forma general, y basándose en los diferentes trabajos
publicados hasta la fecha, se puede concluir que es posible reducir el contenido de acrilamida
de los productos de patata a través de unas buenas prácticas agrícolas así como seleccionando
cuidadosamente variedades de patata con bajos niveles de azúcares reductores.
‐ Productos a base de cereales
En los cereales, la asparagina es el factor limitante en la formación de acrilamida ya que la
concentración de azúcares reductores, dependiendo de la variedad, puede ser de 10 a 50
veces mayor que la de asparagina (Konings y col., 2007; Seal y col., 2008). En consecuencia, no
se ha encontrado correlación entre azúcares reductores y el contenido de acrilamida (Claus y
col., 2006a). Los niveles de asparagina varían dependiendo de la variedad y del tipo de cereal
utilizado. El centeno es el cereal que posee mayor contenido en asparagina, alrededor de
cuatro veces más que el trigo (centeno: 634 mg/kg; trigo: 174 mg/kg). Sin embargo el arroz es
el que menor contenido tiene (< 100 mg/kg), mientras que el maíz y la avena tienen un
contenido intermedio (150 mg/kg) (Seal y col., 2008). Además, los niveles de asparagina libre
varían dependiendo de la fracción del grano, con el nivel más bajo en el endospermo debido a
que el grano queda más refinado al eliminarse las capas más externas, siendo más alto en el
salvado (Springer y col., 2003, Claus y col., 2006b).
Los fertilizantes también tienen influencia. En el caso de los fertilizantes nitrogenados, su uso
durante el crecimiento de los cultivos de cereales provoca un aumento de los niveles de
aminoácidos y del contenido en proteína en el grano, lo que se traduce en un aumento de los
ACRILAMIDA ……..……………………………………………........
77
niveles de acrilamida en productos de panadería (Claus y col., 2006a). Por lo tanto, la
fertilización nitrogenada debe ajustarse a los requisitos mínimos de los cultivos. En el caso de
los fertilizantes sulfurados, se ha observado que cuando el trigo crece en condiciones de
deficiencia de azufre, las concentraciones de asparagina libre son mayores (Curtis y col., 2009).
‐ Café
El café está considerado como un producto de un solo ingrediente, se obtiene únicamente a
partir del tostado del grano de café verde, es decir, sin la adición de otros ingredientes. Las
concentraciones de asparagina se encuentran dentro de un rango muy estrecho, por lo general
de 20 a 100 mg/100 g (CIAA, 2011). En general, la variedad de café robusta contiene
cantidades ligeramente mayores de asparagina que la variedad arábica, y por tanto, la
concentración esperable de acrilamida es superior (Seal y col., 2008).
En cuanto a los azúcares, éstos están presentes en los granos de café verde (arábica, robusta)
en mayor abundancia que la asparagina libre. Los contenidos de sacarosa oscilan entre 30 y
100 g/100 g, mientras que los de la glucosa o la fructosa son inferiores a 1 g/100 g. Los
azúcares se descomponen rápidamente durante el proceso de tostado contribuyendo a la
formación de productos avanzados de la RM como las melanodinas. El efecto de las
melanoidinas del café sobre la absorción de acrilamida son objeto de estudio en la actualidad
(Pastoriza y col., 2012).
2.6.2. Proceso de fritura
Los factores de mayor importancia en la formación de acrilamida en los alimentos son la
temperatura y el contenido final de humedad. La formación de acrilamida se inicia a
temperaturas superiores a 120 ºC, y alcanza un máximo alrededor 170‐180 ºC (Tareke y col.,
2002). Sin embargo, a altas temperaturas (180 ºC‐200 ºC), el aumento drástico de los niveles de
acrilamida es seguido por una rápida disminución de éstos debido a las reacciones de
degradación de la acrilamida (Sanny y col., 2010). Obviamente, el descenso en la temperatura
de fritura se traduce en una menor cantidad de acrilamida, pero se producen efectos negativos
en la calidad del producto, como una mayor absorción de grasa y una peor textura (Romani y
col., 2008).
Como se ha comentado, controlar el contenido final de humedad en el producto es importante.
Diferentes autores han observado un aumento en la velocidad de formación de acrilamida a
78
bajos contenidos de humedad, mientras que a medida que estos aumentan disminuye la
velocidad de reacción (De Vleeschouwer y col., 2007). Tanto una temperatura elevada como
un tiempo de procesado mayor conlleva a un menor contenido de humedad en el producto.
Como resultado, la formación de acrilamida se concentra en la región exterior del alimento en
lugar de la región central (Gökmen y col., 2006b). Por ejemplo, en las patatas fritas, la tasa de
formación no es la misma en la superficie que en el interior, como consecuencia de la
diferente transferencia de calor y evaporación de agua. En realidad, la temperatura del interior
no llega a superar los 100 ºC, incluso durante un calentamiento prolongado a 190 ºC. Sin
embargo, en las patatas fritas de aperitivo la humedad en todo el producto es inferior al 2,5%,
con temperaturas centrales superiores a 120 ºC y por tanto, niveles más elevados de
acrilamida.
Existen otros aspectos que han de tenerse en cuenta. Por ejemplo, una elevada relación
superficie‐volumen conduce a niveles significativamente más altos de acrilamida, ya que no
sólo más precursores han estado expuestos a mayores temperaturas de superficie sino que
también, todo el volumen se calienta más rápido. Por otro lado, la cantidad de muestra
determina el descenso de temperatura que se produce al sumergirse el producto en el aceite y
el tiempo de fritura requerido para recuperar la temperatura inicial, y por tanto, la formación
de acrilamida. En general, los niveles de acrilamida disminuyen a medida que aumenta la
relación de masa entre la muestra y el aceite. Esta relación debe ajustarse con el objeto de que
la temperatura no baje de 140 ºC y obtener así una calidad óptima en el producto (textura y
sabor) a la vez que una baja concentración de acrilamida.
2.6.3. Proceso de horneado
Durante el proceso de horneado, ocurre simultáneamente una transferencia de calor y de
masa que produce cambios físicos y químicos en el alimento, como por ejemplo cambios de
volumen, evaporación del agua y formación de la corteza.
Al igual que en los procesos de fritura, la temperatura y la humedad son dos parámetros
cruciales en el proceso de horneado. Diversos estudios han demostrado que el 99% de la
acrilamida se forma en la corteza, y que los niveles aumentan con el tiempo y la temperatura
(Claus y col., 2005; Keramat y col., 2011). Por el contrario, solo pequeñas trazas se han
encontrado en el interior debido a que se alcanzan temperaturas de tan sólo 100 ºC (Sadd y
Hamlet, 2005).
ACRILAMIDA ……..……………………………………………........
79
Además de la temperatura, otro factor importante es la transferencia de calor a través de los
hornos a la superficie del alimento. Generalmente, se emplean dos tipos de hornos, los
convencionales cuya transferencia de calor se realiza mediante conducción y radiación, y los
de convección que se basan en la circulación forzada de aire. Claus y col. estudiaron la
influencia de estos dos hornos en la cocción de panes y observaron que los niveles de
acrilamida se incrementaron notablemente cuando se utilizó un horno de convección con
respecto a uno convencional (Claus y col., 2008). Esto es debido a que la circulación de aire
produce un secado más rápido e intenso de la corteza. Este efecto puede, al menos en parte,
evitarse mediante la aplicación de una alta humedad relativa durante el proceso de horneado
(CIAA, 2011). No hay que olvidar, sin embargo, que en la mayoría de los casos, la humedad
está estrechamente relacionada con el color de la superficie de la galleta, y por tanto, también
con las propiedades organolépticas.
Del mismo modo, la tecnología del proceso de extrusión utilizada en la elaboración de cereales
de desayuno también tiene influencia en la generación de acrilamida. Rufián‐Henares y col.
estudiaron el impacto de dos tecnologías diferentes de extrusión: extrusión con expansión
retardada (PFEC), utilizada en la elaboración de cereales de copos, y extrusión de expansión
directa (OCCS) (Rufián‐Henares y col., 2006b). Este último proceso, utilizado para producir
cereales de desayuno inflados, dio lugar a niveles más elevados de acrilamida comparados con
el proceso de PFEC. Esto puede deberse al intenso proceso de secado e hinchado y posterior
templado que tiene que ser aplicado en este tipo de cereales para equilibrar su alto contenido
de humedad en un 10%. Por el contrario, otros autores (CIAA, 2006; Stadler, 2006) informaron
que los niveles de acrilamida en cereales inflados se encontraban generalmente por debajo de
100 μg/kg. La extrusión gelatiniza el almidón pero apenas desarrolla color y sabor ya que el
agua del cereal se evapora en la etapa final, produciendo poco o ningún tostado.
Como se demostró en estudios previos (Fredriksson y col., 2004, Lindsay y Jang, 2005), la
fermentación de la masa es otro factor a tener en cuenta ya que consume elevadas cantidades
del precursor asparagina libre. Por ejemplo, Claus y col. y Fredriksson y col. obtuvieron una
disminución de la asparagina de un 60% y un 90%, respectivamente, en productos a base de
cereales (Claus y col., 2008; Fredriksson y col., 2004). En consecuencia, la acrilamida disminuyó
al mismo ritmo que la asparagina durante la primera hora de fermentación aunque
posteriormente se mantuvo constante. Por lo tanto, un tiempo de fermentación de, al menos,
una hora resultó ser suficiente para reducir la acrilamida en la producción de pan industrial,
mientras que un tiempo superior a tres horas, resultó inadecuado debido a la degradación del
80
gluten y posterior aplastamiento del pan (Fredriksson y col., 2004). Además hay que tener en
cuenta, que la capacidad de la levadura en la metabolización de la asparagina es limitada, por
lo que más tiempo de fermentación no se traduce en una mayor reducción de acrilamida.
2.6.4. Proceso de tostado
El tostado del café es un proceso complejo, que implica la transferencia de calor a través de la
estructura del grano, el transporte de vapor de agua, de CO2 y de compuestos volátiles, así
como cambios de volumen, estructura y composición. La acrilamida se forma rápidamente al
comienzo del tueste. Después de alcanzar un máximo en la primera mitad del ciclo, desciende
bruscamente a medida que avanza el proceso. Los niveles de acrilamida del producto final son
de tan solo 20‐30% del nivel máximo, por tanto, cabe esperar que un aumento en el grado de
tostación produzca un café más oscuro y con un contenido de acrilamida inferior. Sin embargo,
esta prolongación en los tiempos de tostado podría generar otros compuestos indeseables
además de un impacto negativo en las propiedades sensoriales del producto (CIAA, 2011).
A diferencia de los otros alimentos, la concentración de acrilamida en el café disminuye con el
aumento térmico y con un tostado más intenso. Esto podría deberse a las altas temperaturas
aplicadas (entre 220 y 250 °C), donde las reacciones que conducen a la
degradación/eliminación de la acrilamida son predominantes al final del ciclo de tostado. Sin
embargo, las reacciones y el mecanismo por el cual se produce la eliminación son aún
desconocidos aunque pueden ser explicados tanto por evaporación como por reacciones de
degradación/polimerización (Stadler, 2006) y condensación con productos finales de la RM
(Pastoriza y col., 2012).
Varios grupos de investigación han demostrado que la acrilamida no es estable en el café
almacenado a temperatura ambiente en su envase original (Delatour y col., 2004;
Andrzejewski y col., 2004), registrándose pérdidas que van del 40% al 60%. La pérdida es
mayor durante los primeros 2‐3 meses, y depende de la temperatura de almacenamiento. Un
aumento de temperatura (37 ºC) conduce a una disminución más rápida que bajas
temperaturas (‐ 18 a 4 ºC). Baum y col. a través de sus experimentos con 14C‐acrilamida
indicaron que la causa de la eliminación durante el almacenamiento podría ser debido a la
interacción covalente de la acrilamida con la matriz insoluble del café (Baum y col., 2008).
Estos autores no encontraron formación de aductos con los furantioles (componentes
abundantes del aroma del café tostado). Más recientemente, se ha sugerido que los grupos
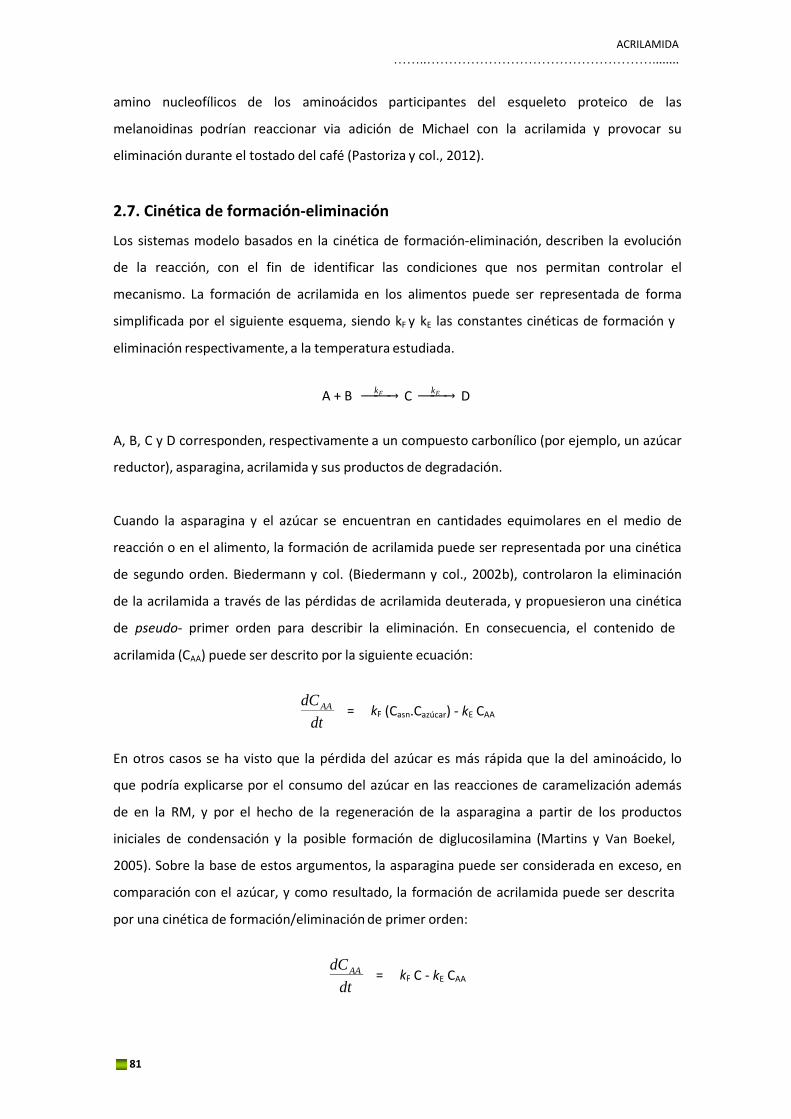
ACRILAMIDA ……..……………………………………………........
81
F
F
amino nucleofílicos de los aminoácidos participantes del esqueleto proteico de las
melanoidinas podrían reaccionar via adición de Michael con la acrilamida y provocar su
eliminación durante el tostado del café (Pastoriza y col., 2012).
2.7. Cinética de formación‐eliminación
Los sistemas modelo basados en la cinética de formación‐eliminación, describen la evolución
de la reacción, con el fin de identificar las condiciones que nos permitan controlar el
mecanismo. La formación de acrilamida en los alimentos puede ser representada de forma
simplificada por el siguiente esquema, siendo kF y kE las constantes cinéticas de formación y
eliminación respectivamente, a la temperatura estudiada.
A + B ⎯⎯kF → C ⎯⎯kE → D
A, B, C y D corresponden, respectivamente a un compuesto carbonílico (por ejemplo, un azúcar
reductor), asparagina, acrilamida y sus productos de degradación.
Cuando la asparagina y el azúcar se encuentran en cantidades equimolares en el medio de
reacción o en el alimento, la formación de acrilamida puede ser representada por una cinética
de segundo orden. Biedermann y col. (Biedermann y col., 2002b), controlaron la eliminación
de la acrilamida a través de las pérdidas de acrilamida deuterada, y propuesieron una cinética
de pseudo‐ primer orden para describir la eliminación. En consecuencia, el contenido de
acrilamida (CAA) puede ser descrito por la siguiente ecuación:
dC AA = k
(Casn.C azúcar
) ‐ kE
CAA
dt
En otros casos se ha visto que la pérdida del azúcar es más rápida que la del aminoácido, lo
que podría explicarse por el consumo del azúcar en las reacciones de caramelización además
de en la RM, y por el hecho de la regeneración de la asparagina a partir de los productos
iniciales de condensación y la posible formación de diglucosilamina (Martins y Van Boekel,
2005). Sobre la base de estos argumentos, la asparagina puede ser considerada en exceso, en
comparación con el azúcar, y como resultado, la formación de acrilamida puede ser descrita
por una cinética de formación/eliminación de primer orden:
dC AA = k
C ‐ kE
CAA
dt
82
La acrilamida empieza a formarse a temperaturas superiores a 120 ºC (Mottram y col., 2002).
En un principio, hay una fase de inducción en la cual no se observa acrilamida, lo que implica la
formación de un producto intermedio previo a la generación de ésta. Esta fase se reduce a
medida que aumenta la temperatura de reacción. A continuación, la concentración de
acrilamida aumenta exponencialmente con el tiempo hasta llegar a un máximo, después del
cual disminuye de nuevo, predominando por tanto en esta parte la eliminación sobre la
formación. Dependiendo de la composición del sistema y los tiempos de reacción, este
descenso se produce a diferentes temperaturas. Se puede observar alrededor de 140 ºC en
sistemas modelo de Glu‐Asn (De Vleeschouwer y col., 2009a), pero en la mayoría de los casos
sólo se produce a temperaturas superiores a 160 ºC (Mottram y col., 2002). Esta disminución
puede explicarse debido a que la acrilamida a través de su doble enlace, puede reaccionar
fácilmente mediante adiciones 1,4 con nucleófilos como los grupos SH o NH2, o los grupos de
las biomoléculas presentes en el alimento o sistema modelo. Asimismo, la eliminación de la
acrilamida puede deberse a la degradación de la molécula o a su polimerización (Stadler y col.,
2003).
En el Artículo 3.1 del Capítulo 3 de esta Tesis, se expone el comportamiento de la cinética de
formación‐eliminación de la acrilamida en un sistema modelo Glu‐Asn.
En general, la reactividad de los azúcares en la reacción de formación de acrilamida disminuye
con el aumento de temperatura. Desde el punto de vista químico, las aldosas (glucosa) son
más reactivas que los azúcares cetosas (fructosa) debido a su grupo aldehído. Los rendimientos
más bajos de acrilamida a partir de sacarosa, en comparación con la glucosa y la fructosa se
pueden atribuir al hecho de que la sacarosa no es un azúcar reductor y, como tal, no puede
reaccionar directamente con la asparagina para formar acrilamida, sino que primero ha de
descomponenerse (p.f. 190 ºC) a compuestos carbonílicos reactivos.
En condiciones de baja humedad, antes de que tenga lugar la RM, se producen primero los
cambios físicos. A medida que la humedad se reduce debido a la evaporación producida por el
proceso de calentamiento, los azúcares disueltos inicialmente en el agua empiezan a formar
una solución saturada y cristalizan. Después de la cristalización, la fusión es necesaria para
cambiar su estado a líquido, y que sean reactivos. Por tanto, los azúcares reductores con un
menor punto de fusión generan más acrilamida, de ahí que la fructosa (p.f. 126 ºC) sea más
reactiva que la glucosa (p.f. 157 ºC). Sin embargo, en los sistemas líquidos, la movilidad
molecular ya no es el factor limitante y la reactividad relativa del azúcar se ve determinada por
ACRILAMIDA ……..……………………………………………........
83
su reactividad química. Pero en general, los sistemas de reacción de baja humedad suelen ser
más realistas, ya que representan las últimas etapas de horneado y fritura de los alimentos (De
Vleeschouwer y col., 2009b).
Además de la temperatura y la humedad, el pH puede influir en la reactividad de los
precursores. A medida que transcurre la RM, se van formando H+ que hacen que disminuyan el
pH del sistema. En consecuencia, en la cinética de la acrilamida es necesario el uso de un
tampón para eliminar, en la medida de lo posible, las variaciones de pH ya que se ha
demostrado que si el pH disminuye se produce menos acrilamida. Esto se explica por el hecho
de que la reducción del pH provoca la conversión de los grupos α‐amino libres de la asparagina
en grupos amino protonados, impidiendo participar posteriormente en reacciones de adición
nucleofílica con compuestos carbonílicos (Zhang y Zhang, 2007) y bloqueando, por tanto, la
reacción de formación de acrilamida (De Vleeschouwer y col., 2006).
2.8. Estrategias de mitigación
Una vez que se constata la formación de acrilamida durante el cocinado de los alimentos,
surge la cuestión de cómo conseguir la disminución de su concentración o incluso su
eliminación. Hasta la fecha se han desarrollado una gran variedad de estrategias de mitigación,
la mayor parte de las cuales se han centrado principalmente en productos a base de patata
(Morales y col., 2008) y de cereales (Konings y col., 2007). Sin embargo, para el caso del café y
sus sucedáneos, como la achicoria, la malta o el centeno tostado, existen pocas alternativas
para reducir los niveles de acrilamida sin que afecte a la calidad del producto (CIAA, 2011).
2.8.1. Precursores
Ya que los azúcares reductores y la asparagina libre son los principales precursores de la
formación de acrilamida en los alimentos, una reducción de cualquiera de ellos supone una
inmediata disminución de los niveles de acrilamida. Es por ello que, tratamientos de lavado,
remojo y escaldado han resultado efectivos en los productos de patata (Pedreschi y col., 2007).
El escaldado, por ejemplo, se aplica para minimizar la formación de zonas más tostadas de las
patatas durante el calentamiento ya que extrae los azúcares reductores de la superficie
además de la asparagina.
El uso de asparaginasa, una enzima que hidroliza la asparagina en ácido aspártico y amoníaco,
es una de las estrategias más eficientes para reducir (hasta en un 90%) los niveles de
acrilamida en patatas (Zyzak y col., 2003; Pedreschi y col., 2011) y productos de panadería
84
(Anese y col., 2011), además de no observarse ninguna modificación en el sabor y apariencia
de los productos. Esto ha hecho que esté siendo utilizada en algunos productos a escala
industrial (CIAA, 2011) aunque el alto coste supone una gran limitación. Recientemente,
Pedreschi y col. han demostrado que el escaldado de patatas junto con el tratamiento con
asparaginasa es una combinación efectiva para la mitigación de acrilamida (hasta un 90%)
durante los procesos de fritura, ya que parece ser que provoca cambios en la microestructura
de la patata conduciendo a una difusión más fácil y eficaz de la enzima (Pedreschi y col., 2011).
Actualmente, están diponible dos preparaciones comerciales de asparaginasa: Acrylaway®
derivada del Aspergillus oryzae (Novozymes, Dinamarca) y Preventase™ producida por el
Aspergillus niger (DSM Food Specialties, Dinamarca). Ambas fueron evaluadas positivamente
por el Comité de Expertos de la FAO/OMS, y por la FDA respecto al reconocimiento GRAS
(Generally Recognized As Safe) de la enzima (JECFA, 2009).
Por otro lado, tiempos de fermentación de masa prolongados de hasta 2 h puede reducir la
concentración de acrilamida en el pan por eliminación de asparagina libre (Konings y col.,
2007). Sin embargo, también están asociados a un aumento en los niveles de 3‐MCPD (Hamlet
y Sadd, 2005).
Respecto a los azúcares reductores, se han identificado dos posibles estrategias para reducir
los niveles de azúcares en las patatas. Durante el almacenamiento, aumenta la cantidad de
azúcar, por tanto, la utilización de patatas frescas supone una reducción en los niveles de
acrilamida. Además, temperaturas de almacenamiento por debajo de 10 ºC incrementa la
formación de los azúcares por la degradación del almidón. Sin embargo, se ha demostrado que
por irradación (60 Gy) del brote de la patata y posterior almacenamiento a 4 y 14 ºC, se reduce
el contenido en azúcares reductores (11%), y por tanto de acrilamida (8%) (Mulla y col., 2011).
Variedades de patata con cantidades relativamente más bajas de azúcares reductores y
asparagina también afectarán a los niveles de acrilamida. Asimismo, se recomienda seleccionar
una variedad de patata con un contenido inferior a 3 g/kg de azúcares reductores para la
elaboración de patatas fritas de aperitivo (CIAA, 2006)
2.8.2. Condiciones/métodos de procesado
El control de los parámetros de procesado, como la temperatura, el tiempo de calentamiento,
el tipo de aceite, etc., podría ser considerado como el camino más directo para reducir la
acrilamida.
ACRILAMIDA ……..……………………………………………........
85
Los resultados encontrados en la bibliografía indican que no existe un simple aumento lineal
entre la concentración de acrilamida y la temperatura, pero sí con el tiempo de calentamiento
(Mottram y col., 2002). La selección de una adecuada temperatura y tiempos de calentamiento
no demasiado largos controlarían la formación de elevadas cantidades de acrilamida. Además,
el grado de pardeamiento de la superficie del alimento puede ser utilizado como un indicador
visual en la formación de acrilamida (Gökmen y col., 2008). No obstante, la RM también
garantiza el aroma y el sabor apetecible, la textura y el color en los alimentos procesados, por
lo que una reducción de tiempo y temperatura podrían comprometer esos aspectos tan
importantes para el consumidor.
No se ha encontrado unanimidad en los trabajos publicados respecto a si el tipo de aceite
empleado afecta a la formación de acrilamida. Por ejemplo, el origen de los aceites vegetales
empleados en fritura no parece afectar a los niveles de acrilamida en patatas (Mestdagh y col.,
2005). Sin embargo, se han encontrado concentraciones más elevadas de acrilamida cuando se
utilizan aceites que contengan silicona o de palma (Gertz, 2002).
En referencia a los métodos de procesado, son pocos los artículos que están dirigidos a la
reducción de la temperatura sin causar efectos negativos. Uno de los ejemplos más
representativos es la aplicación de técnicas de vacío en el proceso de fritura (Granda y col.,
2004). Asimismo, el empleo de microondas como pretratamiento resultó ser muy efectivo en
la reducción de acrilamida (hasta un 60%) en papatas fritas (Erdogdu y col., 2007). El cambio
en la estructura de la patata, como consecuencia del tratamiento previo de microondas,
produce temperaturas más bajas en la superficie y menores tiempos de fritura para lograr el
mismo producto final.
2.8.3. Composición
Otra de las estrategias de mitigación de la acrilamida es a través de la composición del
alimento: por sustitución de precursores que son altamente reactivos, por otros menos
propensos a reaccionar para formar acrilamida, o por adición de ingredientes que inhiban la
reacción de formación de acrilamida o favorezcan su eliminación.
‐ Sustitución de ingredientes
El empleo de sacarosa en lugar de miel o jarabe de azúcar invertido reduce la formación de
acrilamida en galletas, panes y pasteles (Amrein y col., 2004b). Este hecho se puede explicar
86
por la falta de compuestos carbonílicos reactivos, concretamente fructosa y glucosa, lo que
lleva a una fuerte disminución en el progreso de la RM. Se ha demostrado que el bicarbonato
amónico, utilizado como gasificante en la masa, aumenta en gran medida la formación de
acrilamida. La sustitución de este hidrogenocarbonato por su sal correspondiente causa una
disminución de hasta un 70% (Graf y col., 2006). También se puede sustituir por una mezcla de
diferentes agentes (bicarbonato de sodio y acidulantes, disódico difosfato, bicarbonato
potásico y bitartrato de potasio) aunque por lo general conduce a que los productos puedan
resultar inaceptables para el consumo, debido a que dejan residuos que pueden crear mal
sabor, textura, color y aroma. Por último, la sustitución de bicarbonato amónico por las sales
de sodio entra en conflicto directo con la los esfuerzos de la OMS para reducir la hipertensión
y enfermedades del corazón a través de la reducción de sodio en la dieta. Estos aspectos serán
desarrollados posteriormente en el Artículo 1.1 del Capítulo 1.
‐ Adición de ingredientes
Modificador del pH
El pH neutro es el óptimo para la formación de acrilamida en los alimentos. Se ha demostrado
que el ácido cítrico es el modificador más eficiente en la reducción de acrilamida en sistemas
modelo de patata (78%, pH 3,7), seguido por el láctico (62%, pH 4,2) y el acético (46%, pH 4,5)
comparado con el control (pH 5,4) (Mestdagh y col., 2008a). Vinci y col. estudiaron el efecto
del ácido cítrico y acético en la producción de patatas fritas a escala industrial observando
también mayor reducción en el caso del cítrico (Vinci y col., 2011). Sin embargo, la utilización
del ácido acético no es muy recomendable debido a los efectos negativos causados por su
volatilidad y por la alteración en el sabor de los alimentos.
Proteínas o aminoácidos
La adición de aminoácidos o ingredientes a base de proteínas en la alimentación, pueden
influir en la ruta de reacción de la acrilamida. Por ejemplo, la glicina y la lisina ejercen sus
efectos beneficiosos o bien al competir con la asparagina por el grupo carbonilo del azúcar o
bien al formar aductos con la propia acrilamida.
Entre los aminoácidos estudiados, la glicina ha resultado ser el más eficaz (Rydberg y col.,
2003). En derivados de patata, la reducción oscila desde el 30 al 90%, según la concentración
de glicina (0,3 a 1,0% p/p) y las condiciones de procesado utilizadas. Por el contrario, en
productos de panadería se ha logrado reducciones alrededor del 15‐20% mediante la adición
de los aminoácidos a la masa antes de hornear (en este caso, sin embargo, la concentración de
ACRILAMIDA ……..……………………………………………........
87
aminoácidos fue de tres a cuatro veces menor que en los estudios anteriores) (Sadd y col.,
2008).
De la misma manera la cisteína parece favorecer la eliminación de la acrilamida debido a la
reacción de ésta con los grupos SH de la cisteína, formando el cisteinil‐S‐β‐propionamida
(Friedman, 2003). Desafortunadamente, su uso está restringido debido a los olores
desagradables que puede generar en los alimentos.
En otro estudio llevado a cabo recientemente se mostró que la taurina, un aminoácido
semiesencial derivado de la cisteína y la metionina, ejerce su efecto inhibidor mediante la
reacción directa con la acrilamida formando aductos acrilamida‐taurina (Hao y col., 2011). De
la misma manera, las proteínas pueden actuar inhibiendo la reacción de formación o
eliminando la acrilamida formada mediante reacción con los grupos NH2 o SH de las cadenas
de los aminoácidos.
Cationes
La influencia de cationes mono o divalentes también se ha estudiado ya que no solo parecen
prevenir la formación de la base de Schiff de la asparagina, sino también exhibir efectos
catalíticos sobre la reacción de polimerización de la acrilamida (Kolek y col., 2007).
Los estudios sobre el efecto del NaCl en sistemas modelo y alimentos (galletas y pan) han
demostrado que, con concentraciones relativamente bajas de Na+ (1‐2%, p/p) se disminuyen
las cantidades de acrilamida, mientras que con niveles más altos, aumentan (Claus y col., 2008;
Levine y Smith, 2005). Gökmen y Şenyuva (Gökmen y Şenyuva, 2007) encontraron que la
adición de cationes divalentes (Ca2+) provoca la completa inhibición de la formación de
acrilamida tanto en sistemas modelo como en alimentos, mientras que los cationes
monovalentes (Na+) reducen las cantidades de acrilamida en un 70%. Asimismo, ha dado
buenos resultados la inmersión de patatas en soluciones salinas (Gökmen y Şenyuva, 2007), e
incluso mejores si se acompaña previamente de un lavado en agua caliente, ya que este
tratamiento favorece la difusión del NaCl (Pedreschi y col., 2010). Estos tratamientos fueron
capaces de reducir los niveles de acrilamida sin que se vieran afectadas las propiedades
sensoriales del alimento. Sin embargo, pueden producirse efectos negativos, por ejemplo,
cuando se añade CaCl2 (1,2%, p/p) a la masa de galletas y pastas, se reduce la acrilamida
aproximadamente en un 60% pero no deja que la masa se eleve adecuadamente (Sadd y col.,
2008).
88
Por otro lado, hay que tener en cuenta que aunque los cationes son capaces de reducir
acrilamida, pueden aumentar también las concentraciones de HMF debido a que previenen la
formación de la base de Schiff, y por tanto, cambian la ruta de reacción hacia la deshidratación
de la glucosa, la cual conduce a la formación de HMF y furfural (Quarta y Anese, 2010).
Antioxidantes
Los resultados publicados sobre los efectos de los antioxidantes en la formación de acrilamida
son contradictorios y no concluyentes.
Se observó un aumento en los valores de acrilamida cuando las patatas fueron empapadas en
un 1% p/v de extracto de arándano y de orégano antes de freirlas (Vattem y Shetty, 2003), así
como en carne adicionada con BHT, sésamo y vitamina E antes de su cocinado (Tareke, 2003).
En otros estudios, se observaron ligeras reducciones cuando se adicionó ácido ascórbico a
sistemas modelo de patatas (Biedermann y col., 2002c) o romero al aceite de fritura de patatas
(Becalski y col., 2003), mientras que la presencia de especias logró reducciones entre un 50 y
un 75% (Ciesarova y col., 2008). Resultados similares se obtuvieron mediante la adición de un
3% de ácido ferúlico a un sistema modelo de galletas (Levine y Smith, 2005).
Se ha demostrado que los antioxidantes pueden ejercer sus efectos beneficiosos debido a que
capturan los electrones libres de los radicales intermedios formados en la RM (Friedman y
Levin, 2008). En realidad, la eficacia de los antioxidantes parece ser dependiente de la
concentración. Rydberg y col. añadieron ascorbato sódico en muestras de patata y observaron
que a bajas concentraciones este compuesto produce un ligero aumento en las cantidades de
acrilamida, mientras que a concentraciones más altas el contenido disminuye (Rydberg y col.,
2003). De forma similar, otros autores mostraron que la adición de antioxidantes (compuestos
fenólicos) a partir de hojas de bambú y té verde, en un sistema modelo equimolar de Glu‐Asn,
reduce la formación de acrilamida dependiendo de la concentración (Zhang y Zhang, 2008).
Pero no solo la concentración juega un papel importante sino también el tipo de compuestos
fenólicos. En el Capítulo 1 de esta Tesis (Artículo 1.3) se estudia este efecto. Los compuestos
que contenían un grupo aldehído en su estructura, o no redujeron o aumentaron el contenido
de acrilamida (Kotsiou y col., 2010; Zeng y col., 2009). De la misma manera, la adición a
aceitunas maduras de extracto de orégano y compuestos antioxidantes naturalmente
presentes, como el hidroxitirosol y el 3,4‐dihidroxifenil glicol (contienen grupos aldehídos), no
redujo el contenido de acrilamida (Casado y col., 2010). Por tanto, este hecho está relacionado
ACRILAMIDA ……..……………………………………………........
89
con la estructura de cada uno de los compuestos fenólicos presentes en el aceite de oliva
virgen. En este sentido, los grupos funcionales (hidroxilo o aldehído) terminales de la cadena,
desempeñan un papel significativo en la capacidad de los compuestos fenólicos para
interrumpir o favorecer ciertas rutas del mecanismo de formación de la acrilamida (Kotsiou y
col., 2010; Kotsiou y col., 2011). El mecanismo por el cual se produce la reducción en los
valores de acrilamida, puede ser debido a la capacidad de los compuestos fenólicos de atrapar
compuestos intermedios de reacción (Kotsiu y col., 2011). A partir de la elucidación estructural
se ha comprobado que, efectivamente, la (‐)‐epigalocatequina‐3‐galato, el principal polifenol
bioactivo del té verde, y la naringenina, un flavonoide de los cítricos, atraparon compuestos
dicarbonílicos reactivos (Sang y col, 2007; Cheng y col., 2009).
Vitaminas
Dada la importancia de la vitamina B6 respecto a la inhibición de la acrilamida en el desarrollo
de esta Tesis, se ha considerado oportuno hacer referencia.
Diversos estudios demuestran el papel que tienen las vitaminas en la reducción de acrilamida.
Recientemente, nuestro grupo de investigación ha demostrado que especialmente la
piridoxamina, luego la piridoxina, y en menor medida, el piridoxal (vitámeros de la B6), son
eficaces a la hora de reducir la acrilamida en sistemas modelo (Capítulo 3. Artículo 3.1). Al
mismo tiempo, otros autores realizaron una investigación en sistemas modelo y patatas
confirmando nuestros resultados. Además, también estudiaron el efecto de otras vitaminas
como la vitamina A, otras del grupo B, vitaminas C, D, E y K. Los resultados demostraron que
las que son solubles en agua fueron mejores inhibidoras de la formación de acrilamida que las
que no lo son (Zeng y col., 2009).
En general, la actividad antioxidante se ha propuesto como uno de los mecanismos posibles
para explicar la inhibición de la acrilamida por efecto de las vitaminas, sin embargo, hay que
tener en cuenta las características estructurales de cada una de ellas. Por ejemplo, algunas
vitaminas contienen grupos nucleófilos, como es el caso de la piridoxamina que contiene un
grupo amino capaz de reaccionar con la acrilamida (compuesto α,β‐insaturado) y formar
aductos (Arribas‐Lorenzo y col., 2011) (Capítulo 3, Artículo 3.3) o bien atrapar compuestos
carbonílicos intermedios, interviniendo, por tanto, en el mecanismo de formación (Capítulo 3,
Artículo 3.2). Otras vitaminas como la niacina (Zeng y col., 2010) y el ácido ascórbico (Adams y
col., 2010) también formaron aductos con la acrilamida.
90
Eliminación de la molécula de acrilamida
Con respecto a las estrategias de mitigación, la eliminación de acrilamida es conceptualmente
diferente a las comentadas hasta ahora. De hecho, el objetivo no es reducir la formación de
acrilamida durante el procesado de los alimentos, sino eliminar físicamente la molécula
después de que el tratamiento térmico se haya completado. Esto puede llevarse a cabo gracias
a su bajo peso molecular, y al estudio de sus propiedades físicas y químicas. En principio, la
acrilamida puede ser retirada de los alimentos mediante aplicación de vacío con unas
condiciones adecuadas de temperatura y presión. Ya en el año 2003, Zhaoyang investigó esta
posibilidad física de eliminación mediante la introducción de patatas fritas en un dispositivo al
cual se le había aplicado un vacío de 1,33 Pa, durante 1 h a 85 ºC (Zhaoyang, 2003). Más tarde
experimentos llevados a cabo en sistemas modelo confirmaron dichos resultados (Nicoli y
Anese, 2006). Sin embargo, se ha comprobado que no sólo las condiciones de presión,
temperatura y tiempo influyen en la cantidad de acrilamida eliminada, sino también la
actividad de agua y la composición del alimento (Anese y col., 2010).
2.9. Niveles en alimentos
Desde el descubrimiento de la acrilamida en alimentos cocinados, la comunidad científica ha
realizado grandes esfuerzos para recopilar el mayor número de datos a este respecto.
Como ya se ha comentado, existen diferentes bases de datos, de las cuales la del Centro
Común de Investigación‐Instituto de Materiales y Medidas de Referencia (JRC‐IRMM) de la
Comisión Europea es la más importante, iniciándose en el año 2003. Más tarde, en 2007, la
Comisión Europea emitió una recomendación a los Estados miembros (Recomendación de la
Comisión 2007/331/CE) con la finalidad de emprender un seguimiento anual de los niveles de
acrilamida para los años 2007, 2008 y 2009 de acuerdo con un procedimiento de muestreo. En
el 2009, la EFSA comparó los resultados de la vigilancia de los niveles de acrilamida del año
2007 con los anteriores resultados recogidos en el período 2003‐2006 por el JRC‐IRMM.
Posteriormente, se emitió un informe actualizado respecto del seguimiento de los resultados
del 2008 en comparación con los del 2007. Y en abril del 2011 se publicó el informe final del
periodo de muestreo de los tres años (EFSA, 2011) donde aproximadamente el 52%, 42% y
40% de los resultados fueron aportados por Alemania en 2007, 2008 y 2009, respectivamente.
Un resumen de estos resultados se presenta en la Tabla 15.

ACRILAMIDA ……..……………………………………………........
91
Grupo
2007 2008 2009
(μg/kg) (μg/kg) (μg/kg)
Media
(Mediana) Máx.
Media
(Mediana) Máx.
Media
(Mediana) Máx.
Galletas
Crackers 291‐292 (195) 1526 203‐206 (185) 1042 195‐208 (98) 1320
Infantiles 197‐204 (100) 2300 98‐110 (64) 1200 88‐108 (80) 430
Sin especificar 299‐303 (173) 4200 213‐223 (126) 1940 128‐140 (76) 2640
Barquillos 206‐210 (118) 1378 251‐254 (109) 2353 244‐246 (213) 725
Pan
Tostado
221‐226 (116)
2430
229‐231 (107)
1538
219‐223 (186)
860
De molde 54‐68 (30) 910 31‐46 (30) 528 27‐37 (27) 364
Sin especificar 172‐190 (58) 2565 11‐23 (19) 86 54‐76 (49) 1460
Cereales de
desayuno
130‐150 (100)
1600
140‐156 (75)
2072
132‐142 (87)
1435
Cereales infantiles 48‐69 (38) 353 35‐51 (25) 660 55‐70 (25) 710
Café
Instantáneo 357 (188) 1047 499‐502 (482) 1373 591‐595 (584) 1470
Sin especificar 259‐261 (183) 1158 278‐286 (210) 734 551 (237) 2929
Tostado 245‐251 (197) 958 200‐204 (164) 1524 225‐231 (193) 2223
Patatas fritas 354‐357 (246) 2668 281‐285 (220) 2466 326‐328 (247) 3380
Potitos 22‐44 (30) 162 16‐35 (25) 297 32‐47 (25) 677
Otros productos
Pan de jengibre 423‐425 (226) 3615 432‐436 (227) 3307 376‐384 (132) 4095
Muesli y avena 205‐210 (156) 805 20‐41 (30) 112 53‐82 (50) 484
Sin especificar 232‐244 (134) 2529 160‐173 (60) 2592 182‐204 (100) 1650
Sucedáneo del 772‐775 (334) 4700 988 (702) 7095 1502‐1504 4300
café (1148)
Patatas de 574‐576 (413) 4180 626‐630 (436) 4382 689‐693 (394) 4804
aperitivo
Patatas caseras
Fritas 344‐354 (182) 1661 220‐228 (152) 1220 234‐241 (201) 1238
Sin especificar 266‐277 (150) 2175 175‐191 (75) 3025 257‐265 (104) 2762
Al horno 380‐385 (260) 941 275‐276 (172) 1439 317 (189) 1665
Tabla 15. Valor medio, mediana y máximo de acrilamida en los diferentes alimentos entre los años 2007‐2009 (EFSA, 2011).
Los mayores niveles de acrilamida en los años 2007 y 2008 se encontraron en los sucedáneos
del café como la malta o la achicoria en los cuales se llegaron a alcanzar valores de 7100 μg/kg,
92
mientras que en el año 2009 el valor más alto fue en las patatas fritas de aperitivo (4804
μg/kg). Por el contrario, el pan de molde, los cereales infantiles y los potitos son los que
presentaron los niveles de concentración más bajos, no superando los 70 μg/kg en los tres
años.
En general, el grupo de las patatas fritas de aperitivo ha sido uno de los más estudiados debido a
la importante contribución a la exposición a acrilamida en la población, basada tanto en el
alto consumo como en el elevado contenido de acrilamida. Los valores de acrilamida (mediana)
no mostraron ningún cambio estadísticamente significativo a lo largo de los tres años a pesar
de las medidas adoptadas por las industrias en solicitud de la CIAA con el fin de reducir los
niveles (CIAA, 2011). Por otra parte, las patatas fritas de aperitivo presentaron
concentraciones de acrilamida más altas que las patatas fritas problamente debido a su mayor
relación superficie/volumen. En el Artículo 4.1 del Capítulo 4 se discutirá sobre los valores de
acrilamida en las patatas fritas de aperitivo así como su estimación de ingesta en la población
española.
Un segundo gran grupo de alimentos que contribuyen a la exposición a acrilamida en adultos y
niños son los productos a base de cereales y, en particular el pan de molde y las galletas, a
pesar de que presentan niveles que están por debajo de los de las patatas fritas como se
observa en la Tabla 15.
Los valores correspondientes al pan de molde fueron muy diferentes en los diversos Estados
miembros en los años 2007 a 2009 por lo que la tendencia europea no se pudo determinar. Sin
embargo, se observó una tendencia creciente en los valores durante los tres años para el caso
del pan tostado, aunque este grupo de alimentos en general contribuye en menor medida a la
exposición media de acrilamida. Las únicas tendencias decrecientes en los tres años fueron
observados para el caso de los crackers (35%), las galletas infantiles (49%), y el pan de jengibre
(27%). En la bibliografía, los resultados de las actividades de vigilancia en los Países Bajos han
mostrado un descenso similar en los productos tipo pan de jengibre analizados en 2006,
probablemente debido a un cambio en el agente gasificante (Konings y col., 2007).
Otro grupo especialmente importante, debido a la elevada exposición a acrilamida por parte
de los adultos, es el café. Cabe recordar que las opciones disponibles para reducir los niveles
de acrilamida sin afectar a la calidad del producto son muy limitadas (CIAA, 2011). Cuando se
compararon los valores medios del año 2009 de los tres tipos de café analizados: tostado,
ACRILAMIDA ……..……………………………………………........
93
instantáneo y sucedáneos, con los de los dos años anteriores, se observó que aumentaron los
niveles en el caso del café instantáneo, mientras que para los dos grupos restantes la
tendencia no se pudo evaluar. Durante el periodo de muestreo, el café tostado presentó
concentraciones alrededor de dos veces inferiores con respecto al café instantáneo (Tabla 15).
Sin embargo, las concentraciones más elevadas de acrilamida se encontraron para el café de
malta o la achicoria (hasta tres veces superior). Afortunadamente, ni los sustitutos del café ni
el café instantáneo son los principales contribuyentes a la exposición a acrilamida media global
(menos del 2,7%) (EFSA, 2011).
A pesar de que estos grupos de alimentos son los más estudiados debido a su elevado
consumo y por tanto a su exposición, también se ha detectado acrilamida en otros productos
como por ejemplo en avellanas y almendras tostadas, en aceitunas de mesa y en alimentos
que no han sido sometidos a un calentamiento intenso como es el caso de las frutas desecadas
(ciruelas, peras, y albaricoques). Por ejemplo, en el caso de las almendras tostadas, éstas
contienen precursores de acrilamida en niveles apreciables. Así el contenido de asparagina
libre se encuentra comprendido en el rango 2000‐3000 mg/kg mientras que los niveles de
glucosa y fructosa entre 500‐1300 mg/kg y de sacarosa entre 2500‐5300 mg/kg (Zhang y col.,
2009). Como resultado de ello, las concentraciones de las almendras tostadas oscilan entre
260 a 1530 μg/kg (Becalski y col., 2003). Aunque la concentración en tales productos puede ser
muy alta, su contribución en general a la ingesta de acrilamida es marginal. Por último, los
alimentos de origen animal tratados térmicamente como la carne y el pescado, por lo general,
presentan niveles bajos o no cuantificables de acrilamida (EFSA, 2009).
Por otra parte, la FDA dispone de su propia base de datos (U.S. FDA, 2006) así como la OMS
(FAO/WHO, 2005). Los datos analizados desde 2002 hasta 2004 fueron proporcionados por 24
países siendo el número total de los resultados de 6752 (Tabla 16). Si se comparan los
resultados obtenidos a través de la OMS con los procedentes de la EFSA, puede observarse
que son similares, exceptuando los resultados del pan y las galletas cuyos valores son algo más
elevados en el caso de la OMS, y en los cereales de desayuno que ocurre justo al contrario.
Esta similitud es totalmente explicable ya que el 67,6% de los resultados de la OMS proviene
de Europa, y solo el resto de América del Norte (21,9%), Asia (8,9%) y del Pacífico (1,6%).
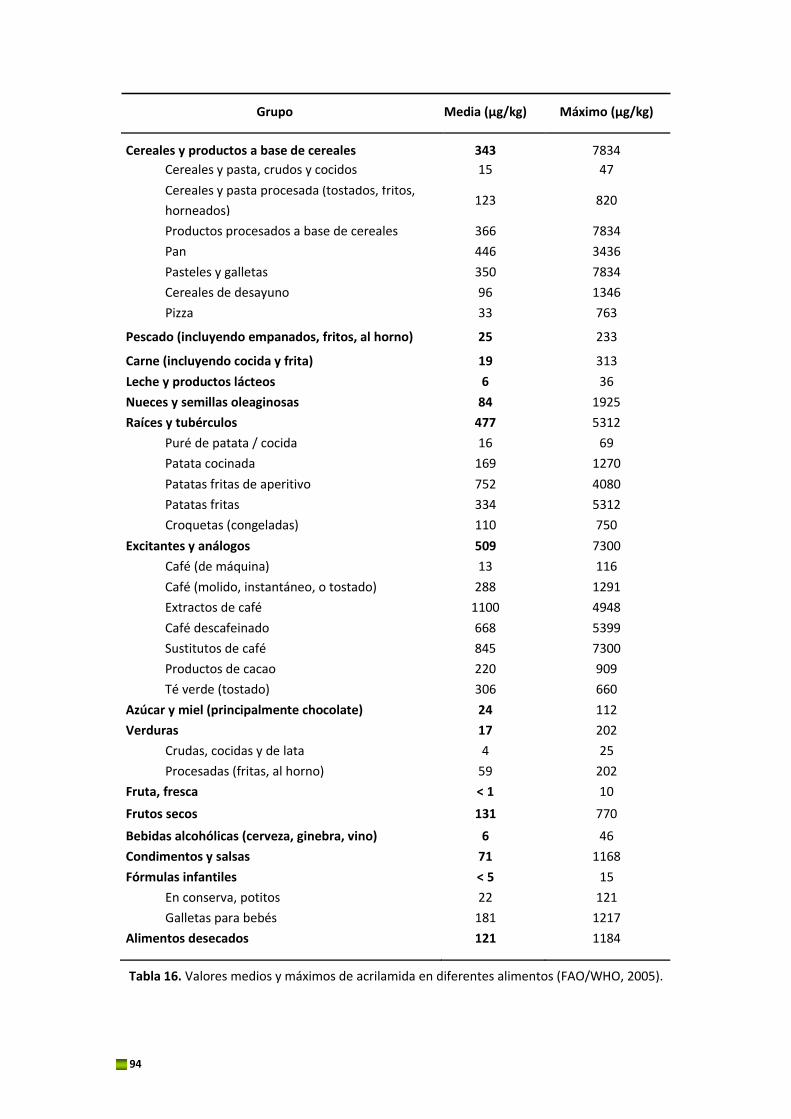
94
Grupo Media (μg/kg) Máximo (μg/kg)
Cereales y productos a base de cereales
343
7834
Cereales y pasta, crudos y cocidos 15 47
Cereales y pasta procesada (tostados, fritos,
horneados) 123 820
Productos procesados a base de cereales 366 7834
Pan 446 3436
Pasteles y galletas 350 7834
Cereales de desayuno 96 1346
Pizza 33 763
Pescado (incluyendo empanados, fritos, al horno) 25 233
Carne (incluyendo cocida y frita) 19 313
Leche y productos lácteos 6 36
Nueces y semillas oleaginosas 84 1925
Raíces y tubérculos 477 5312
Puré de patata / cocida 16 69
Patata cocinada 169 1270
Patatas fritas de aperitivo 752 4080
Patatas fritas 334 5312
Croquetas (congeladas) 110 750
Excitantes y análogos 509 7300
Café (de máquina) 13 116
Café (molido, instantáneo, o tostado) 288 1291
Extractos de café 1100 4948
Café descafeinado 668 5399
Sustitutos de café 845 7300
Productos de cacao 220 909
Té verde (tostado) 306 660
Azúcar y miel (principalmente chocolate) 24 112
Verduras 17 202
Crudas, cocidas y de lata 4 25
Procesadas (fritas, al horno) 59 202
Fruta, fresca < 1 10
Frutos secos 131 770
Bebidas alcohólicas (cerveza, ginebra, vino) 6 46
Condimentos y salsas 71 1168
Fórmulas infantiles < 5 15
En conserva, potitos 22 121
Galletas para bebés 181 1217
Alimentos desecados 121 1184
Tabla 16. Valores medios y máximos de acrilamida en diferentes alimentos (FAO/WHO, 2005).
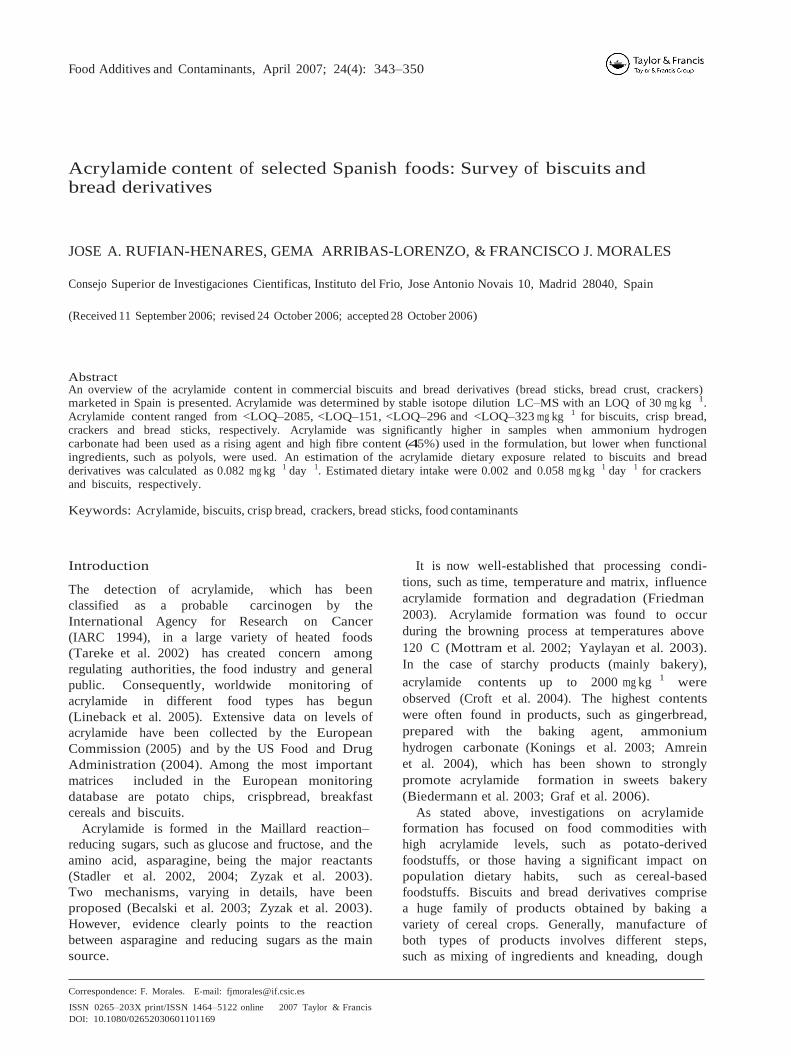
Food Additives and Contaminants, April 2007; 24(4): 343–350
Acrylamide content of selected Spanish foods: Survey of biscuits and bread derivatives
JOSE A. RUFIAN-HENARES, GEMA ARRIBAS-LORENZO, & FRANCISCO J. MORALES
Consejo Superior de Investigaciones Cientificas, Instituto del Frio, Jose Antonio Novais 10, Madrid 28040, Spain
(Received 11 September 2006; revised 24 October 2006; accepted 28 October 2006)
Abstract An overview of the acrylamide content in commercial biscuits and bread derivatives (bread sticks, bread crust, crackers) marketed in Spain is presented. Acrylamide was determined by stable isotope dilution LC–MS with an LOQ of 30 mg kg 1. Acrylamide content ranged from <LOQ–2085, <LOQ–151, <LOQ–296 and <LOQ–323 mg kg 1 for biscuits, crisp bread, crackers and bread sticks, respectively. Acrylamide was significantly higher in samples when ammonium hydrogen carbonate had been used as a rising agent and high fibre content (45%) used in the formulation, but lower when functional ingredients, such as polyols, were used. An estimation of the acrylamide dietary exposure related to biscuits and bread derivatives was calculated as 0.082 mg kg 1 day 1. Estimated dietary intake were 0.002 and 0.058 mg kg 1 day 1 for crackers and biscuits, respectively.
Keywords: Acrylamide, biscuits, crisp bread, crackers, bread sticks, food contaminants
Introduction
The detection of acrylamide, which has been
classified as a probable carcinogen by the
International Agency for Research on Cancer
(IARC 1994), in a large variety of heated foods
(Tareke et al. 2002) has created concern among
regulating authorities, the food industry and general
public. Consequently, worldwide monitoring of
acrylamide in different food types has begun
(Lineback et al. 2005). Extensive data on levels of
acrylamide have been collected by the European
Commission (2005) and by the US Food and Drug
Administration (2004). Among the most important
matrices included in the European monitoring
database are potato chips, crispbread, breakfast
cereals and biscuits.
Acrylamide is formed in the Maillard reaction–
reducing sugars, such as glucose and fructose, and the
amino acid, asparagine, being the major reactants
(Stadler et al. 2002, 2004; Zyzak et al. 2003).
Two mechanisms, varying in details, have been
proposed (Becalski et al. 2003; Zyzak et al. 2003).
However, evidence clearly points to the reaction
between asparagine and reducing sugars as the main
source.
It is now well-established that processing condi-
tions, such as time, temperature and matrix, influence
acrylamide formation and degradation (Friedman
2003). Acrylamide formation was found to occur
during the browning process at temperatures above
120 C (Mottram et al. 2002; Yaylayan et al. 2003).
In the case of starchy products (mainly bakery),
acrylamide contents up to 2000 mg kg 1
were
observed (Croft et al. 2004). The highest contents
were often found in products, such as gingerbread,
prepared with the baking agent, ammonium
hydrogen carbonate (Konings et al. 2003; Amrein
et al. 2004), which has been shown to strongly
promote acrylamide formation in sweets bakery
(Biedermann et al. 2003; Graf et al. 2006).
As stated above, investigations on acrylamide
formation has focused on food commodities with
high acrylamide levels, such as potato-derived
foodstuffs, or those having a significant impact on
population dietary habits, such as cereal-based
foodstuffs. Biscuits and bread derivatives comprise
a huge family of products obtained by baking a
variety of cereal crops. Generally, manufacture of
both types of products involves different steps,
such as mixing of ingredients and kneading, dough
Correspondence: F. Morales. E-mail: [email protected]
ISSN 0265–203X print/ISSN 1464–5122 online 2007 Taylor & Francis
DOI: 10.1080/02652030601101169
Acrylamide in biscuits and bread derivatives in Spain 344
fermentation (mainly in bread crust and bread
sticks), baking to 250 C for 15–30 min and, in
some cases, a final toasting step (Ramirez-Jimenez
et al. 2000). This last step favours the main
chemical reactions involved during biscuits or
bread derivatives manufacture, the Maillard reaction
and caramelisation, which are responsible for
the colour and flavour of these products
(Ramirez-Jimenez et al. 2000).
This study gives an overview of acrylamide levels
in commercial biscuits and bread derivatives
marketed in Spain. These products, due to their
relatively widespread consumption, could be a key
source of acrylamide in the Spanish diet. Therefore,
the relationship between acrylamide intake and
population factors is also presented. In addition,
the correlation among levels of acrylamide
and compositional parameters of the samples
(i.e. presence of ammonium hydrogen carbonate,
dietary fibre content and biscuit speciality) was
investigated.
Materials and methods
Samples
Experiments were conducted with a series of
commercial biscuits (62 samples), bread crust
(24 samples), bread sticks (10 samples) and crackers
(11 samples) randomly purchased in different
supermarkets from the Autonomous Community of
Madrid (Spain). The distribution of samples was
representative of the proportions of these food
commodities in the Spanish market. Samples
dissolving the compounds in Milli-Q water and
methanol, respectively. These solutions were then
appropriately diluted with Milli-Q water (Millipore
Corp., Madrid, Spain) to prepare working standards
at 1.0 mg ml 1
. All stock solutions and working
standards were stored light-protected in a refrigera-
tor at 4 C for up to 3 months. Carrez I solution was
prepared by dissolving 15 g of potassium ferrocianide
in 100 ml of water and Carrez II solution by
dissolving 30 g of zinc acetate in 100 ml of water.
Acrylamide analysis
Acrylamide was analysed as described by
Rufian-Henares et al. (2006) with some minor
modifications.
Sample extraction. Sample powder (0.75 g) was
weighed with a precision of 0.1 mg and suspended
with 8 ml of Milli-Q water in polypropylene centri-
fuge tubes. Mixture was spiked with 200 ml of a
5 mg ml 1
[13
C3]acrylamide methanolic solution as
internal standard and later homogenized. Acrylamide
extraction was performed at room temperature for
20 min, and a 10-s shaking every 10 min. To clarify
the solution, 0.5 ml of each Carrez I and Carrez II
solutions were added and finally the mixture was
centrifuged (9000 g; 10 min; 4 C).
Sample clean up. Isolute Multimode SPE
cartridges were preconditioned with 2 ml methanol,
2 ml water and 2 ml air to remove excessive water.
An aliquot of the clear supernatant (1 ml) was loaded 1.
(300–500 g) were mixed and finely ground to
ensure homogeneous distribution. Sub-samples
(20 g) were divided into four containers and stored
under vacuum and light-protected at 4 C until
analysis.
Chemicals and materials
[13
C3]acrylamide (isotopic purity 99%) was from
Cambridge Isotope Labs (Andover, MA, USA).
Acrylamide (99%), potassium ferrocianide
(Carrez I), zinc acetate (Carrez II) were from Sigma–
Aldrich (St. Louis, MO, USA). Acetic acid
(ultrapure grade) and Pronase E were from Merck
(Darmstadt, Germany). Methanol and acetonitrile
(HPLC grade) were from Scharlau (Barcelona,
onto the cartridge at a flow rate of 2 ml min
Then, 2 ml of air were passed and, finally, acryla-
mide was eluted with 1 ml of water at the same flow
rate. The solution was filtered through a 0.45 mm
filter into an amberlite LC–MS vial.
LC–MS analysis. Sample extracts and calibration
standards were analysed on an Agilent 1100 liquid
chromatograph coupled to an Agilent Quadrupole
MS detector (Agilent Technologies, Palo Alto, CA,
USA). Analytical separation was achieved with a
Luna ODS2 (25 0.46 cm, 5 mm; Phenomenex,
Torrance, CA, USA) at 32 C. Isocratic elution was
achieved with a mobile phase of acetic acid/
methanol/Milli-Q water (0.1:2.5:97.4, v/v) at a 1. The injection volume
Spain). The solid-phase extraction (SPE) cartridges
Isolute Multimode (500 mg, 3 ml) were from IST
(Hewgoed, Mid-Glamorgan, UK)
Acrylamide standard and reagents
Stock solutions of acrylamide (0.01 mg ml 1
) and
[13
C3]acrylamide (5 mg ml 1
) were prepared by
flow rate of 0.8 ml min
was 80 ml. Electrospray ionization in the positive
ionization mode was used. The MS detector
operated in selected ion monitoring (SIM) mode
at m/z ratios of 72.1 and 75.1 for acrylamide
and [13
C3]acrylamide, respectively. Under these
chromatographic conditions, acrylamide eluted at
6.8 min. A delay time of 3 min was selected to avoid
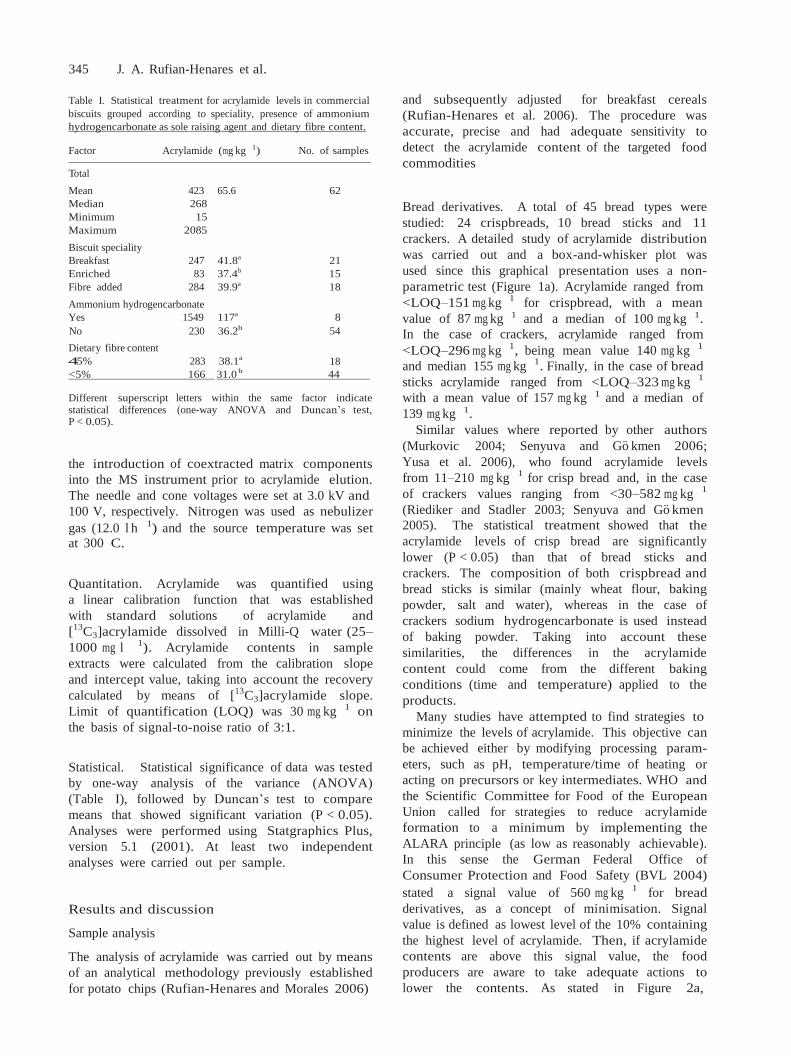
345 J. A. Rufian-Henares et al.
Table I. Statistical treatment for acrylamide levels in commercial
biscuits grouped according to speciality, presence of ammonium
hydrogencarbonate as sole raising agent and dietary fibre content.
Factor Acrylamide (mg kg 1) No. of samples
Total
Mean 423 65.6 62
Median 268
Minimum 15
Maximum 2085
Biscuit speciality
Breakfast 247 41.8a 21
Enriched 83 37.4b 15
Fibre added 284 39.9a 18
Ammonium hydrogencarbonate
Yes 1549 117a 8 b
and subsequently adjusted for breakfast cereals
(Rufian-Henares et al. 2006). The procedure was
accurate, precise and had adequate sensitivity to
detect the acrylamide content of the targeted food
commodities Bread derivatives. A total of 45 bread types were
studied: 24 crispbreads, 10 bread sticks and 11
crackers. A detailed study of acrylamide distribution
was carried out and a box-and-whisker plot was
used since this graphical presentation uses a non-
parametric test (Figure 1a). Acrylamide ranged from
<LOQ–151 mg kg 1
for crispbread, with a mean
value of 87 mg kg 1 and a median of 100 mg kg 1. No 230 36.2
Dietary fibre content
45% 283 38.1a
b
54 In the case of crackers, acrylamide ranged from
<LOQ–296 mg kg 1, being mean value 140 mg kg 1
18 and median 155 mg kg 1
. Finally, in the case of bread <5% 166 31.0 44
Different superscript letters within the same factor indicate statistical differences (one-way ANOVA and Duncan’s test, P < 0.05).
the introduction of coextracted matrix components
into the MS instrument prior to acrylamide elution.
The needle and cone voltages were set at 3.0 kV and
100 V, respectively. Nitrogen was used as nebulizer
gas (12.0 l h 1
) and the source temperature was set at 300 C.
Quantitation. Acrylamide was quantified using
a linear calibration function that was established
with standard solutions of acrylamide and
[13
C3]acrylamide dissolved in Milli-Q water (25–
1000 mg l 1
). Acrylamide contents in sample
extracts were calculated from the calibration slope
and intercept value, taking into account the recovery
calculated by means of [13
C3]acrylamide slope.
Limit of quantification (LOQ) was 30 mg kg 1
on
the basis of signal-to-noise ratio of 3:1.
Statistical. Statistical significance of data was tested
by one-way analysis of the variance (ANOVA)
(Table I), followed by Duncan’s test to compare
means that showed significant variation (P < 0.05).
Analyses were performed using Statgraphics Plus,
version 5.1 (2001). At least two independent
analyses were carried out per sample.
Results and discussion
Sample analysis
The analysis of acrylamide was carried out by means
of an analytical methodology previously established
for potato chips (Rufian-Henares and Morales 2006)
sticks acrylamide ranged from <LOQ–323 mg kg 1
with a mean value of 157 mg kg 1 and a median of
139 mg kg 1.
Similar values where reported by other authors
(Murkovic 2004; Senyuva and Go kmen 2006;
Yusa et al. 2006), who found acrylamide levels
from 11–210 mg kg 1
for crisp bread and, in the case
of crackers values ranging from <30–582 mg kg 1
(Riediker and Stadler 2003; Senyuva and Go kmen
2005). The statistical treatment showed that the
acrylamide levels of crisp bread are significantly
lower (P < 0.05) than that of bread sticks and
crackers. The composition of both crispbread and
bread sticks is similar (mainly wheat flour, baking
powder, salt and water), whereas in the case of
crackers sodium hydrogencarbonate is used instead
of baking powder. Taking into account these
similarities, the differences in the acrylamide
content could come from the different baking
conditions (time and temperature) applied to the
products.
Many studies have attempted to find strategies to
minimize the levels of acrylamide. This objective can
be achieved either by modifying processing param-
eters, such as pH, temperature/time of heating or
acting on precursors or key intermediates. WHO and
the Scientific Committee for Food of the European
Union called for strategies to reduce acrylamide
formation to a minimum by implementing the
ALARA principle (as low as reasonably achievable).
In this sense the German Federal Office of
Consumer Protection and Food Safety (BVL 2004)
stated a signal value of 560 mg kg 1
for bread
derivatives, as a concept of minimisation. Signal
value is defined as lowest level of the 10% containing
the highest level of acrylamide. Then, if acrylamide
contents are above this signal value, the food
producers are aware to take adequate actions to
lower the contents. As stated in Figure 2a,
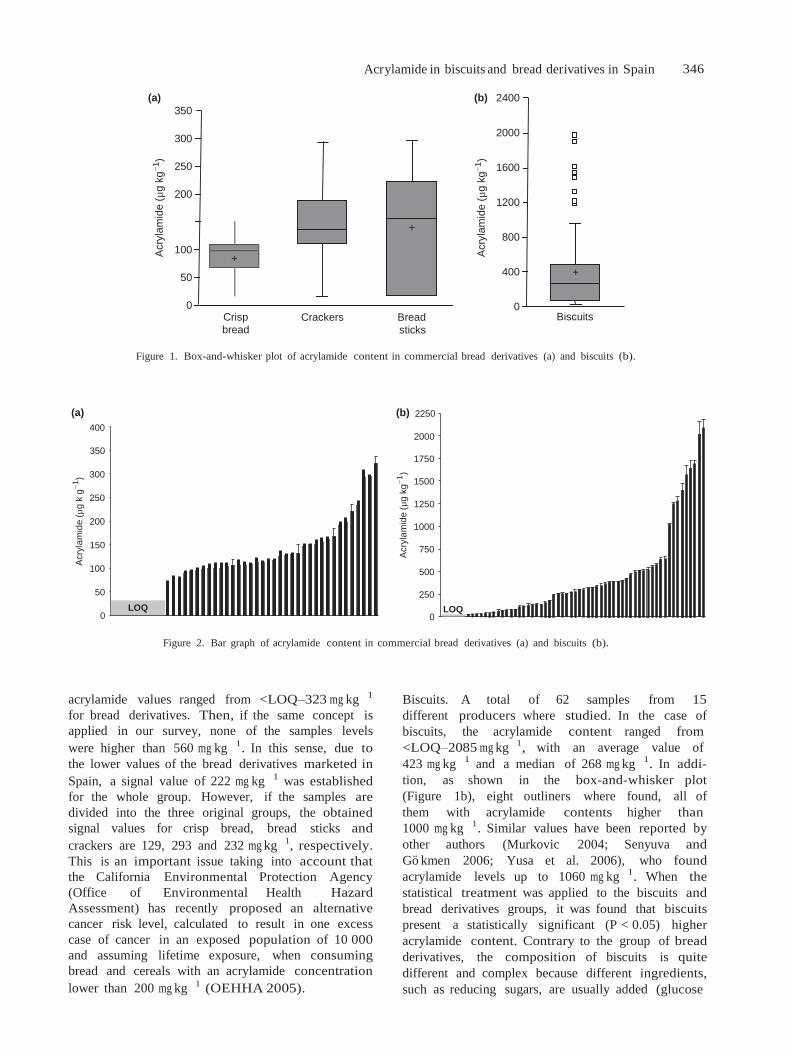
Acrylamide in biscuits and bread derivatives in Spain 346
+
+
+
+
+
+
+
+
+
+
+
+ + + + +
Acry
lam
ide
(µ
gk g
−1)
Acry
lam
ide (
µg k
g−1)
Acry
lam
ide
(µ
g k
g−
1)
Acry
lam
ide (
µg k
g−1)
(a) 350
300
250
200
100
50
0
+
Crisp
bread
+
Crackers Bread
sticks
(b) 2400
2000
1600
1200
800
400
0
+
Biscuits
Figure 1. Box-and-whisker plot of acrylamide content in commercial bread derivatives (a) and biscuits (b).
(a) (b) 2250
400
350
300
250
200
150
100
50
0
LOQ
2000
1750
1500
1250
1000
750
500
250
0
LOQ
Figure 2. Bar graph of acrylamide content in commercial bread derivatives (a) and biscuits (b).
acrylamide values ranged from <LOQ–323 mg kg 1
for bread derivatives. Then, if the same concept is
applied in our survey, none of the samples levels
were higher than 560 mg kg 1
. In this sense, due to
the lower values of the bread derivatives marketed in
Spain, a signal value of 222 mg kg 1
was established
for the whole group. However, if the samples are
divided into the three original groups, the obtained
signal values for crisp bread, bread sticks and
crackers are 129, 293 and 232 mg kg 1
, respectively.
This is an important issue taking into account that
the California Environmental Protection Agency
(Office of Environmental Health Hazard
Assessment) has recently proposed an alternative
cancer risk level, calculated to result in one excess
case of cancer in an exposed population of 10 000
and assuming lifetime exposure, when consuming
bread and cereals with an acrylamide concentration
lower than 200 mg kg 1
(OEHHA 2005).
Biscuits. A total of 62 samples from 15
different producers where studied. In the case of
biscuits, the acrylamide content ranged from
<LOQ–2085 mg kg 1
, with an average value of
423 mg kg 1
and a median of 268 mg kg 1
. In addi-
tion, as shown in the box-and-whisker plot
(Figure 1b), eight outliners where found, all of
them with acrylamide contents higher than
1000 mg kg 1
. Similar values have been reported by
other authors (Murkovic 2004; Senyuva and
Go kmen 2006; Yusa et al. 2006), who found
acrylamide levels up to 1060 mg kg 1
. When the
statistical treatment was applied to the biscuits and
bread derivatives groups, it was found that biscuits
present a statistically significant (P < 0.05) higher
acrylamide content. Contrary to the group of bread
derivatives, the composition of biscuits is quite
different and complex because different ingredients,
such as reducing sugars, are usually added (glucose
347 J. A. Rufian-Henares et al.
and fructose mainly added as corn syrups),
fats (including !3-PUFAs), technological agents
(ammonium and sodium hydrogencarbonate), etc.
It is well-established that one of the components that
promote the generation of acrylamide are reducing
sugars (Friedman 2003; Zyzak et al. 2003;
Stadler et al. 2004). In addition, it has been shown
that the baking agent ammonium hydrogen carbo-
nate strongly promotes acrylamide formation
(Biedermann et al. 2003; Konings et al. 2003;
Amrein et al. 2004; Graf et al. 2006). Then, owing
to the presence of a higher content of acrylamide
precursors in biscuits, their higher acrylamide
content is a logical consequence.
As described previously, biscuits comprise a
heterogeneous food commodities group because
they are composed of a great variety of ingredients.
Then, to ascertain the possible differences in the
acrylamide content, biscuits were grouped according
to biscuit speciality, presence of ammonium hydro-
gen carbonate and dietary fibre content. The results
of the statistical treatment are depicted in Table I.
At the beginning, the first analysis showed no
statistical differences (data not shown), but a wide
distribution was found among groups of outliers
in Figure 2b. Then, due to their high acrylamide
content, the mean values of the different
groups was slanted. According to the table of
composition – supplied by the manufacturers – it
was found that the outliers were just addressed to
samples with ammonium hydrogencarbonate as
the sole raising agent, in contrast with the other 54
samples where different proportions of sodium and
ammonium hydrogencarbonate were used. In this
sense, it is believed that a higher amount of
ammonium hydrogencarbonate was used by the
manufacture of the outliers and, because this raising
agent enhances the acrylamide generation
(Biedermann et al. 2003; Konings et al. 2003;
Amrein et al. 2004; Graf et al. 2006), a larger
amount of acrylamide was formed. This hypothesis
explains the statistically significant differences
(P < 0.05) between the group where ammonium
hydrogen carbonate is the unique raising agent and
those with other agents added (mean acrylamide
content of 1549 and 230.4 mg kg 1
, respectively).
Taking into account the explanation given above,
the outliers were removed for the rest of the
statistical treatment. Biscuits were classified into
three groups based on health orientation, which is
closely related to their composition: those mainly
used for breakfast (n ¼ 29), those enriched with
functional ingredients (n ¼ 15), such as conjugated
linoleic acid, !3-PUFA, polyols, soy extracts or
L-carnitine, and those fibre-enriched (n ¼ 18).
Enriched biscuits showed significantly (P < 0.05)
lower values of acrylamide (83 vs. 247 and
284 mg kg 1
for breakfast and fibre enriched biscuits,
respectively). It was found that most of the enriched
biscuits had polyols (such as maltitol or lactitol) and
potato starch replacing the addition of glucose and/
or fructose. This replacement gives rise to a decrease
in reducing sugar content and, thus, it is unfavour-
able to the generation of acrylamide. Moreover, the
enriched biscuits are elaborated by adding other
kinds of flours, such as rice or malt. In the case of
breakfast cereals, it has been shown that there is a
higher potential for acrylamide formation in wheat-
based cereals followed by corn, oat and rice (CIAA
2005; Rufian-Henares et al. 2006), therefore, it is
plausible that the decrease in wheat flour content
reduced acrylamide generation in biscuits.
Biscuits usually have dietary fibre contents of
3–4%, but when enriched with wheat-bran and/or
whole wheat flour, dietary fibre increases to 10–30%.
As illustrated in Table I, there were statistically
significant differences in acrylamide content between
the dietary fibre-added biscuits (283 38.1 mg kg 1
;
n ¼ 18; fibre content 45%) and those without dietary
fibre (166 31.0 mg kg 1
; n ¼ 44; fibre content
<5%), results which are in accordance to
those previously reported for breakfast cereals
(Rufian-Henares et al. 2006). Similar behaviour
was reported by Senyuva and Go kmen (2006),
who found that the acrylamide content of biscuits
with dietary fibre was higher than that of the usual
biscuits (486 and 261 mg kg 1
, respectively).
This could be explained by the fact that asparagine,
the main precursor of acrylamide in cereal products
(RHM Technologies 2005) is concentrated in the
bran, particularly in wheat-bran (CIAA 2005).
Finally, the relationship was studied between the
acrylamide content of biscuits and the signal value
stated by the German Federal Office of Consumer
Protection and Food Safety (BVL 2004).
This organization stated a signal value of
575 mg kg 1
for an adult population and
360 mg kg 1
for children. As depicted in Figure 2b,
when applying the same concept, most of the
samples (80%) are under the 575 mg kg 1
level.
Taking into account the results in this survey,
a signal level of 1283 mg kg 1
is found, although if
the eight outliers are omitted (due to the explanation
given above concerning to the addition of ammo-
nium hydrogen carbonate), a corrected level of
519 mg kg 1
is obtained, quite similar to the
German Office figure.
Acrylamide intake mediated by biscuits and
bread derivatives
Estimating consumer dietetic exposure to acryla-
mide is a high priority for governments and industry
alike. Extensive research is underway to determine
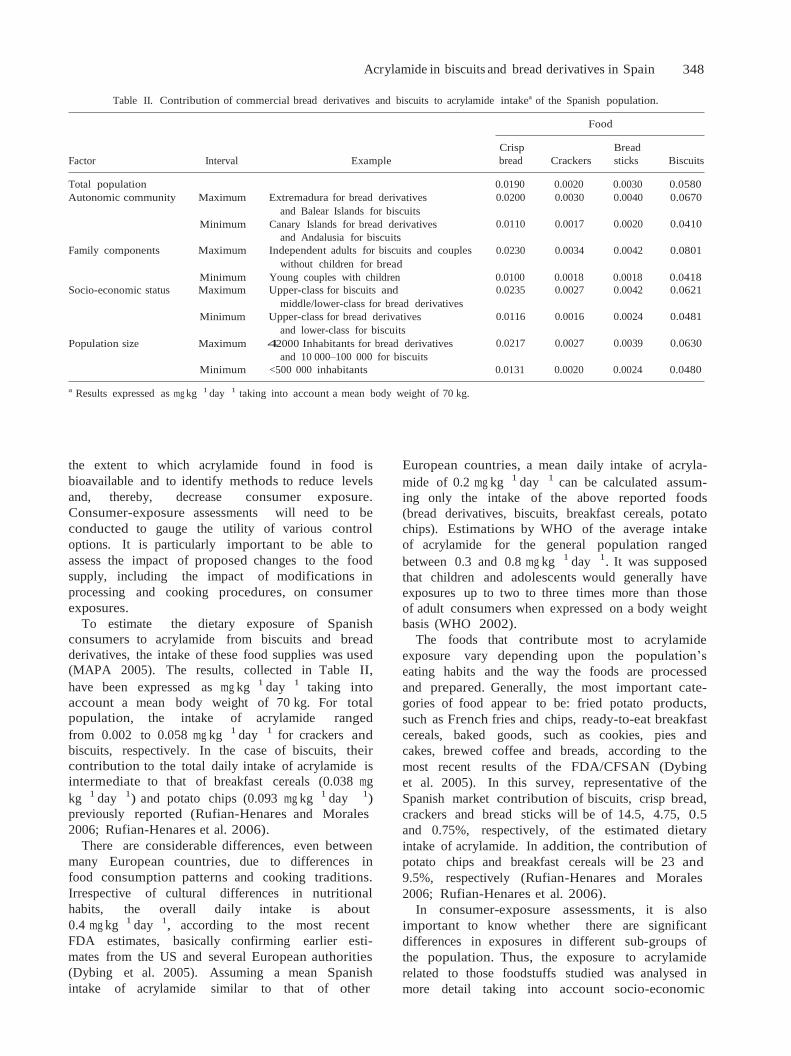
Acrylamide in biscuits and bread derivatives in Spain 348
Table II. Contribution of commercial bread derivatives and biscuits to acrylamide intakea of the Spanish population.
Food
Factor Interval Example
Crisp
bread Crackers
Bread
sticks Biscuits
Total population 0.0190 0.0020 0.0030 0.0580
Autonomic community Maximum Extremadura for bread derivatives
and Balear Islands for biscuits
Minimum Canary Islands for bread derivatives
and Andalusia for biscuits
Family components Maximum Independent adults for biscuits and couples
without children for bread
0.0200 0.0030 0.0040 0.0670
0.0110 0.0017 0.0020 0.0410
0.0230 0.0034 0.0042 0.0801
Minimum Young couples with children 0.0100 0.0018 0.0018 0.0418
Socio-economic status Maximum Upper-class for biscuits and
middle/lower-class for bread derivatives
Minimum Upper-class for bread derivatives
and lower-class for biscuits
Population size Maximum 42000 Inhabitants for bread derivatives
and 10 000–100 000 for biscuits
0.0235 0.0027 0.0042 0.0621
0.0116 0.0016 0.0024 0.0481
0.0217 0.0027 0.0039 0.0630
Minimum <500 000 inhabitants 0.0131 0.0020 0.0024 0.0480
a Results expressed as mg kg 1 day 1 taking into account a mean body weight of 70 kg.
the extent to which acrylamide found in food is
bioavailable and to identify methods to reduce levels
and, thereby, decrease consumer exposure.
Consumer-exposure assessments will need to be
conducted to gauge the utility of various control
options. It is particularly important to be able to
assess the impact of proposed changes to the food
supply, including the impact of modifications in
processing and cooking procedures, on consumer
exposures.
To estimate the dietary exposure of Spanish
consumers to acrylamide from biscuits and bread
derivatives, the intake of these food supplies was used
(MAPA 2005). The results, collected in Table II,
have been expressed as mg kg 1
day 1
taking into
account a mean body weight of 70 kg. For total
population, the intake of acrylamide ranged
from 0.002 to 0.058 mg kg 1
day 1
for crackers and
biscuits, respectively. In the case of biscuits, their
contribution to the total daily intake of acrylamide is
intermediate to that of breakfast cereals (0.038 mg
kg 1
day 1
) and potato chips (0.093 mg kg 1
day 1
)
previously reported (Rufian-Henares and Morales
2006; Rufian-Henares et al. 2006).
There are considerable differences, even between
many European countries, due to differences in
food consumption patterns and cooking traditions.
Irrespective of cultural differences in nutritional
habits, the overall daily intake is about
0.4 mg kg 1
day 1
, according to the most recent
FDA estimates, basically confirming earlier esti-
mates from the US and several European authorities
(Dybing et al. 2005). Assuming a mean Spanish
intake of acrylamide similar to that of other
European countries, a mean daily intake of acryla-
mide of 0.2 mg kg 1
day 1
can be calculated assum-
ing only the intake of the above reported foods
(bread derivatives, biscuits, breakfast cereals, potato
chips). Estimations by WHO of the average intake
of acrylamide for the general population ranged
between 0.3 and 0.8 mg kg 1
day 1
. It was supposed
that children and adolescents would generally have
exposures up to two to three times more than those
of adult consumers when expressed on a body weight
basis (WHO 2002).
The foods that contribute most to acrylamide
exposure vary depending upon the population’s
eating habits and the way the foods are processed
and prepared. Generally, the most important cate-
gories of food appear to be: fried potato products,
such as French fries and chips, ready-to-eat breakfast
cereals, baked goods, such as cookies, pies and
cakes, brewed coffee and breads, according to the
most recent results of the FDA/CFSAN (Dybing
et al. 2005). In this survey, representative of the
Spanish market contribution of biscuits, crisp bread,
crackers and bread sticks will be of 14.5, 4.75, 0.5
and 0.75%, respectively, of the estimated dietary
intake of acrylamide. In addition, the contribution of
potato chips and breakfast cereals will be 23 and
9.5%, respectively (Rufian-Henares and Morales
2006; Rufian-Henares et al. 2006).
In consumer-exposure assessments, it is also
important to know whether there are significant
differences in exposures in different sub-groups of
the population. Thus, the exposure to acrylamide
related to those foodstuffs studied was analysed in
more detail taking into account socio-economic
349 J. A. Rufian-Henares et al.
aspects (MAPA 2005). It was observed that there are
great differences in the intake of bread
derivatives depending on the socio-economic
community studied, almost doubling their intake.
When the number of family members was analysed,
it could be stated that the higher intakes was in
families composed of one or two independent adults,
whereas the lower intakes where found in young
couples with children. In the higher cases, the
contribution of biscuits changed from 14.5 to 20%
of the overall acrylamide intake. In the case of the
socio-economic status, the exposure to acrylamide is
higher in the upper-class due to their higher biscuit
intake. On the other hand, the lower-class showed
higher bread derivatives intake, whereas biscuit
consumption decreased. Finally, taking into account
population size, it was found that the lower
acrylamide intake was recorded in cities with more
than 500 000 inhabitants, whereas the maximum
intake was in localities with low to intermediate
number of inhabitants.
Conclusions
This work describes the determination of acrylamide
levels in biscuits and bread derivatives cereals
marketed in Spain, as a previous survey of foodstuffs
had indicated these to contain acrylamide.
The data were used to determine the dietary intake
of acrylamide for the Spanish population for
risk-assessment purposes. A mean daily dietary
intake of acrylamide of 0.082 mg kg 1
day 1
is
estimated, for which the contribution of biscuits
was higher than that of bread derivatives. It was also
shown that, in the case of biscuits, higher acrylamide
content was found in those manufactured with
ammonium hydrogen carbonate as the only raising
agent and in those biscuits with higher proportions
of dietary fibre. Conversely, lower acrylamide
content was found in biscuits enriched with
functional ingredients, such as polyols.
Acknowledgements
We are grateful to D. Gonez and M.A. Martinez-
Bartolome for technical assistance. Consejerıa de
Education y Ciencia (Comunidad Autonoma de
Madrid) is thanked for supporting a predoctoral
grant for G. Arribas-Arias. This research was
supported by the Commission of the European
Communities under project COLL-CT-2005-
516415. It does not necessarily reflect its views and
in no way anticipates the comission’s future policy in
this area.
References
Amrein TM, Scho nba chler B, Escher F, Amado R. 2004.
Acrylamide in gingerbread: Critical factors for formation and
possible ways for reduction. Journal of Agricultural and Food
Chemistry 52:4282–4288.
Becalski A, Lau BP, Lewis D, Seaman SW. 2003. Acrylamide in
foods: Occurrence, sources, and modelling. Journal of
Agricultural and Food Chemistry 51:802–808.
Biedermann M, Grob K. 2003. Model studies on acrylamide
formation in potato, wheat flour and corn starch; ways to
reduce acrylamide contents in bakery ware. Mitteilungen aus
Lebensmitteluntersuchung und Hygiene 94:406–422.
BVL 2004. German Federal Office of Consumer Protection
and Food Safety. Available: http://www.bvl.bund.de/cln_027/
nn_521172/EN/01__Food/04__Acrylamid__en/05__ Signal-
werte en/signalwerte node.html nnn¼true. Accessed:
2005 June.
CIAA 2005. Confederation of the Food and Drink Industries of
the UE. The CIAA acrylamide ‘‘toolbox’’, rev. 6, September.
Brussels: CIAA.
Croft M, Tong P, Fuentes D, Hambridge T. 2004. Australian
survey of acrylamide in carbohydrate-based foods. Food
Additives and Contaminants 21:721–736.
Dybing E, Farmer PB, Andersen M, Fennell TR, Lalljie SPD,
Mu ller DJG, Olin S, Petersen BJ, Schlatter J, Scholz G, et al.
2005. Human exposure and internal dose assessments of
acrylamide in food. Food and Chemical Toxicology
43:365–410.
European Commission 2005. Directorate General Joint Research
Centre, Institute for Reference Materials and Measurements.
Available: http://www.irmm.jrc.be/html activities/Acrylamide/
database.html. Accessed 2005 February 12.
Food and Drug Administration (FDA) 2004. Available: http://
www.cfsan.fda.gov/_dms/acrydata.html%20via. Accessed 2004
April.
Friedman M. 2003. Chemistry, biochemistry, and safety of
acrylamide. A review. Journal of Agricultural and Food
Chemistry 51:4504–4526.
Graf M, Amrein TM, Graf S, Szalay R, Escher F, Amado R.
2006. Reducing the acrylamide content of a semi-finished
biscuit on industrial scale. LWT Food Science and Technology
39:724–728.
IARC 1994. Some industrial chemicals. Monographs on
the evaluation of carcinogenic risk to humans. Lyon: IARC.
Vol 60.
Konings EJM, Baars AJ, van Klaveren JD, Spanjer MC, Rensen
PM, Hiemstra M, van Kooij JA, Peters PWJ. 2003. Acrylamide
exposure from foods of the Dutch population and an
assessment of the consequent risk. Food and Chemical
Toxicology 41:1569–1579.
Lineback D, Wenzl T, Ostermann OP, De La Calle B, Anklam E.
2005. Overview of acrylamide monitoring database. Journal of
AOAC International 88:246–252.
MAPA 2005. La alimentacio n en Espan a. Madrid: Ministerio de
Agricultura, Pesca y Alimentacio n.
Mottram DS, Wedzicha BL, Dodson AT. 2002. Acrylamide is
formed in the Maillard reaction. Nature 419:448–449.
Murkovic M. 2004. Acrylamide in Austrian foods. Journal of
Biochemical and Biophysical Methods 61:161–167.
OEHHA 2005. California Environmental Protection
Agency, Office of Environmental Health Hazard
Assessment. Available: www.oehha.org/prop65/law/pdf.zip/
Notice-%2012705eAltRiskrevised.pdf. Accessed 2005 June.
Ramırez-Jime nez A, Garcıa-Villanova B, Guerra-Herna ndez E.
2000. Hydroxymethylfurfural and methylfurfural content of
selected bakery products. Food Research International
33:833–838.
350 J. A. Rufian-Henares et al.
RHM Technologies 2005. Presentation at the FSA process
contaminants meeting. April, London, UK.
Riediker S, Stadler RH. 2003. Analysis of acrylamide in food by
isotope-dilution liquid chromatography coupled with electro-
spray ionization tandem mass spectrometry. Journal of
Chromatography A 1020:121–130.
Rufian-Henares JA, Morales FJ. 2006. Determination of acryla-
mide in potato chips by a reversed-phase LC–MS method
based on a stable isotope dilution assay. Food Chemistry 97:
555–562.
Rufian-Henares JA, Delgado-Andrade C, Morales FJ. 2006.
Relationship between acrylamide and thermal-processing
indexes in commercial breakfast cereals: A survey of Spanish
breakfast cereals. Molecular Nutrition and Food Research
50:756–762.
Senyuva HZ, Go kmen V. 2005. Survey of acrylamide in Turkish
foods by an in-house validated LC–MS method.
Food Additives and Contaminants 22:204–209.
Senyuva HZ, Go kmen V. 2006. Interference-free determination
of acrylamide in potato and cereal-based foods by a laboratory
validated liquid chromatography–mass spectrometry method.
Food Chemistry 97:539–545.
Stadler RH, Blank I, Varga N, Robert F, Hau J, Guy PA, Robert
MC, Riediker S. 2002. Acrylamide from Maillard reaction
products. Nature 419:449–450.
Stadler RH, Robert F, Riediker S, Varga N, Davidek T,
Devaud S, Goldmann T, Hau J, Blank I. 2004. In-depth
mechanistic study on the formation of acrylamide and other
vinylogous compounds by the Maillard reaction. Journal of
Agricultural and Food Chemistry 52:5550–5558.
Tareke E, Rydberg P, Karlsson P, Eriksson S, To rnqvist M.
2002. Analysis of acrylamide, a carcinogen formed in heated
foodstuffs. Journal of Agricultural and Food Chemistry
50:4998–5006.
WHO 2002. FAO/WHO Consultation of the health implications
of acrylamide in food. Summary report of a meeting held in
Geneva, 25–27 June 2002. Available: http://www.who.int/fsf/
Acrylamide. Accessed 2005 June.
Yaylayan VA, Wnrowski A, Perez LC. 2003. Why asparagine
needs carbohydrates to generate acrylamide. Journal of
Agricultural and Food Chemistry 51:1735–1757.
Yusa V, Quinta G, Pardo O, Marti P, Pastor A. 2006.
Determination of acrylamide in foods by pressurized
fluid extraction and liquid chromatography-tandem mass
spectrometry used for a survey of Spanish cereal-based foods.
Food Additives and Contaminants 23:237–244.
Zyzak DV, Sanders RA, Stojanovic M, Tallmadge DH, Eberhart
BL, Ewald DK, Gruber DC, Morsch TR, Strothers MA, Rizzi
GP, Villagran MD. 2003. Acrylamide formation mechanism in
heated foods. Journal of Agricultural and Food Chemistry
51:4782–4787.
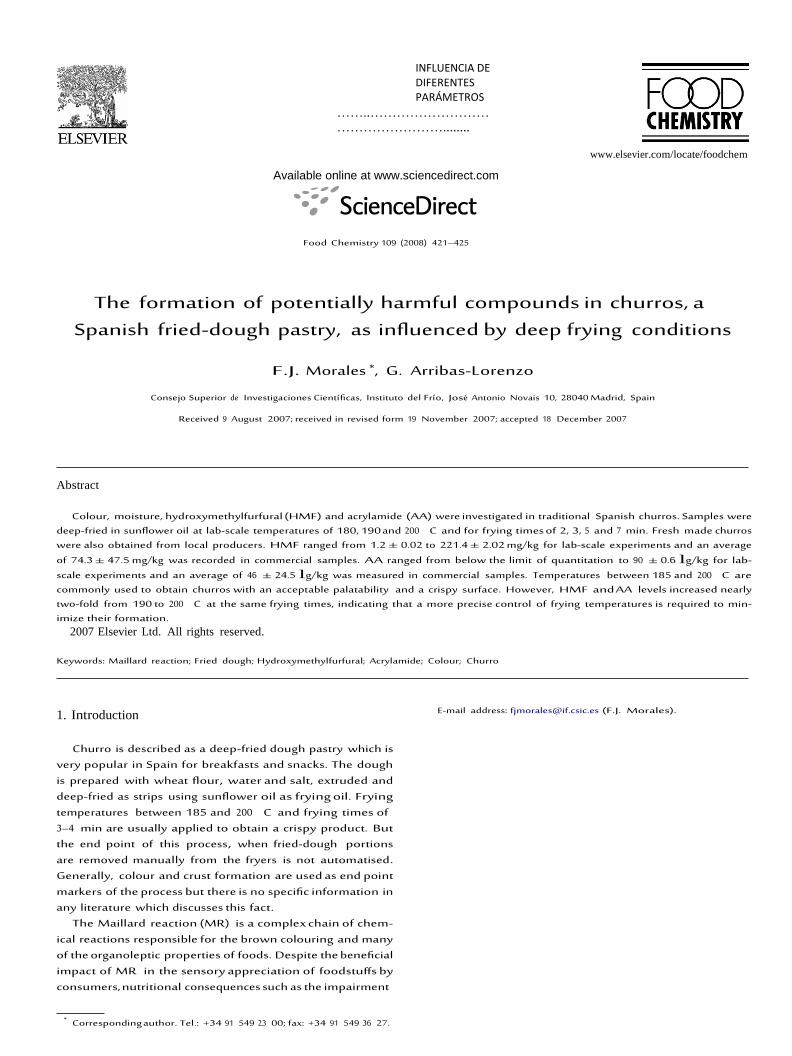
INFLUENCIA DE DIFERENTES PARÁMETROS
……..……………………………………………........
Available online at www.sciencedirect.com
Food Chemistry 109 (2008) 421–425
www.elsevier.com/locate/foodchem
The formation of potentially harmful compounds in churros, a Spanish fried-dough pastry, as influenced by deep frying conditions
F.J. Morales *, G. Arribas-Lorenzo
Consejo Superior de Investigaciones Cientıficas, Instituto del Frıo, Jose Antonio Novais 10, 28040 Madrid, Spain
Received 9 August 2007; received in revised form 19 November 2007; accepted 18 December 2007
Abstract
Colour, moisture, hydroxymethylfurfural (HMF) and acrylamide (AA) were investigated in traditional Spanish churros. Samples were
deep-fried in sunflower oil at lab-scale temperatures of 180, 190 and 200 C and for frying times of 2, 3, 5 and 7 min. Fresh made churros were also obtained from local producers. HMF ranged from 1.2 ± 0.02 to 221.4 ± 2.02 mg/kg for lab-scale experiments and an average
of 74.3 ± 47.5 mg/kg was recorded in commercial samples. AA ranged from below the limit of quantitation to 90 ± 0.6 lg/kg for lab-
scale experiments and an average of 46 ± 24.5 lg/kg was measured in commercial samples. Temperatures between 185 and 200 C are commonly used to obtain churros with an acceptable palatability and a crispy surface. However, HMF and AA levels increased nearly two-fold from 190 to 200 C at the same frying times, indicating that a more precise control of frying temperatures is required to min- imize their formation. 2007 Elsevier Ltd. All rights reserved.
Keywords: Maillard reaction; Fried dough; Hydroxymethylfurfural; Acrylamide; Colour; Churro
1. Introduction
Churro is described as a deep-fried dough pastry which is
very popular in Spain for breakfasts and snacks. The dough is prepared with wheat flour, water and salt, extruded and deep-fried as strips using sunflower oil as frying oil. Frying temperatures between 185 and 200 C and frying times of 3–4 min are usually applied to obtain a crispy product. But the end point of this process, when fried-dough portions are removed manually from the fryers is not automatised. Generally, colour and crust formation are used as end point markers of the process but there is no specific information in any literature which discusses this fact.
The Maillard reaction (MR) is a complex chain of chem- ical reactions responsible for the brown colouring and many of the organoleptic properties of foods. Despite the beneficial impact of MR in the sensory appreciation of foodstuffs by consumers, nutritional consequences such as the impairment
* Corresponding author. Tel.: +34 91 549 23 00; fax: +34 91 549 36 27.
E-mail address: [email protected] (F.J. Morales).
of lysine residues and the formation of potentially harmful compounds are to be expected (i.e. Friedman, 1996). The Maillard reaction has been shown to generate AA in ther- mally treated foods (Mottram, Wedicha, & Dodson, 2002; Stadler et al., 2002) and it is agreed that the main precursors are sugars and asparagine (Zyzak et al., 2003). AA has been classified as potentially carcinogenic to humans by IARC (1994). Hydroxymethylfurfural (HMF) is formed after 1–2 enolisation, dehydration and cyclization reactions from sugar caramelisation and Amadori product degradation at
the advanced stage of the MR (i.e. Friedman, 1996; Kroh, 1994). Recently, some concern has arisen regarding the tox- icological relevance of HMF, since in vitro studies of geno- toxicity and mutagenicity have given controversial results (Janzowski, Glaab, Samimi, Schlatter, & Eisenbrand, 2000; Surh & Tannenbaum, 1994).
International organisations aim to evaluate exposure and risk assessment from dietary intake of AA, and two databases, one from the IRMM and another from the FDA, have been designed to compile results from laborato- ries. However, levels of AA in local foods which are largely
0308-8146/$ - see front matter 2007 Elsevier Ltd. All rights reserved.
doi:10.1016/j.foodchem.2007.12.042
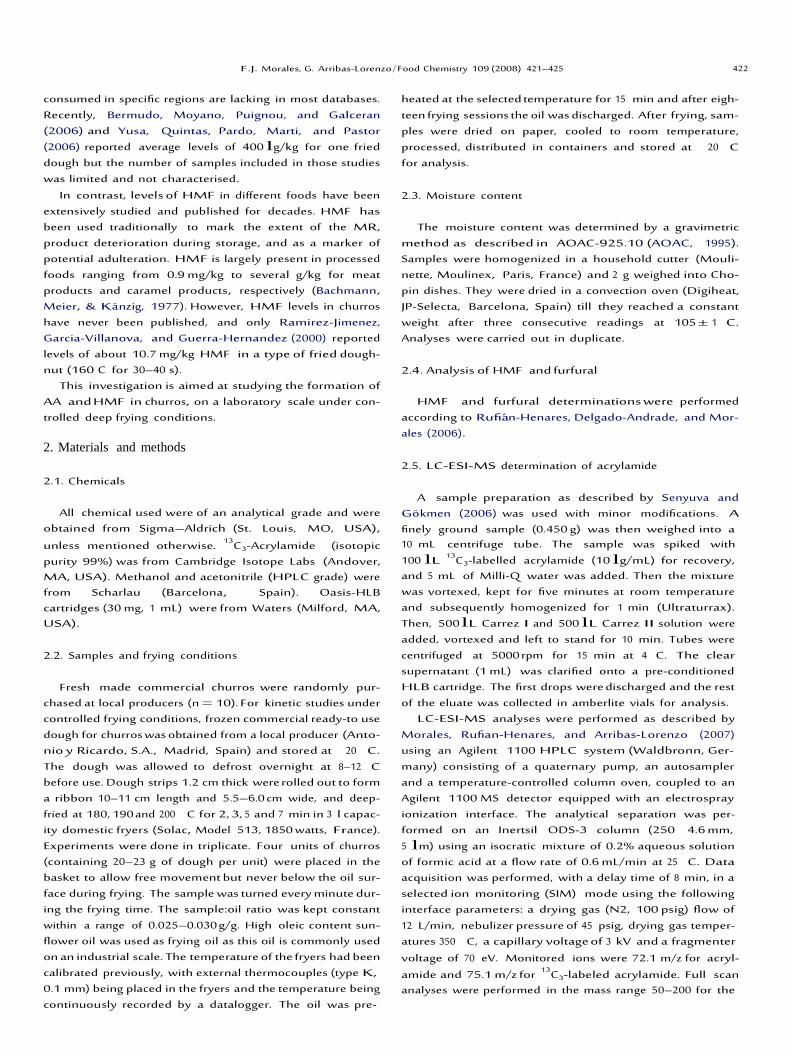
F.J. Morales, G. Arribas-Lorenzo / Food Chemistry 109 (2008) 421–425 422
consumed in specific regions are lacking in most databases. Recently, Bermudo, Moyano, Puignou, and Galceran (2006) and Yusa, Quintas, Pardo, Marti, and Pastor (2006) reported average levels of 400 lg/kg for one fried dough but the number of samples included in those studies was limited and not characterised.
In contrast, levels of HMF in different foods have been extensively studied and published for decades. HMF has been used traditionally to mark the extent of the MR, product deterioration during storage, and as a marker of potential adulteration. HMF is largely present in processed foods ranging from 0.9 mg/kg to several g/kg for meat products and caramel products, respectively (Bachmann, Meier, & Ka nzig, 1977). However, HMF levels in churros have never been published, and only Ramirez-Jimenez, Garcia-Villanova, and Guerra-Hernandez (2000) reported levels of about 10.7 mg/kg HMF in a type of fried dough- nut (160 C for 30–40 s).
This investigation is aimed at studying the formation of AA and HMF in churros, on a laboratory scale under con- trolled deep frying conditions.
2. Materials and methods
2.1. Chemicals
All chemical used were of an analytical grade and were
obtained from Sigma–Aldrich (St. Louis, MO, USA),
unless mentioned otherwise. 13C3-Acrylamide (isotopic purity 99%) was from Cambridge Isotope Labs (Andover, MA, USA). Methanol and acetonitrile (HPLC grade) were from Scharlau (Barcelona, Spain). Oasis-HLB cartridges (30 mg, 1 mL) were from Waters (Milford, MA, USA).
2.2. Samples and frying conditions
Fresh made commercial churros were randomly pur-
chased at local producers (n = 10). For kinetic studies under controlled frying conditions, frozen commercial ready-to use dough for churros was obtained from a local producer (Anto- nio y Ricardo, S.A., Madrid, Spain) and stored at 20 C. The dough was allowed to defrost overnight at 8–12 C before use. Dough strips 1.2 cm thick were rolled out to form a ribbon 10–11 cm length and 5.5–6.0 cm wide, and deep- fried at 180, 190 and 200 C for 2, 3, 5 and 7 min in 3 l capac- ity domestic fryers (Solac, Model 513, 1850 watts, France). Experiments were done in triplicate. Four units of churros (containing 20–23 g of dough per unit) were placed in the basket to allow free movement but never below the oil sur- face during frying. The sample was turned every minute dur- ing the frying time. The sample:oil ratio was kept constant within a range of 0.025–0.030 g/g. High oleic content sun- flower oil was used as frying oil as this oil is commonly used on an industrial scale. The temperature of the fryers had been calibrated previously, with external thermocouples (type K, 0.1 mm) being placed in the fryers and the temperature being continuously recorded by a datalogger. The oil was pre-
heated at the selected temperature for 15 min and after eigh- teen frying sessions the oil was discharged. After frying, sam- ples were dried on paper, cooled to room temperature, processed, distributed in containers and stored at 20 C for analysis.
2.3. Moisture content
The moisture content was determined by a gravimetric
method as described in AOAC-925.10 (AOAC, 1995). Samples were homogenized in a household cutter (Mouli- nette, Moulinex, Paris, France) and 2 g weighed into Cho- pin dishes. They were dried in a convection oven (Digiheat, JP-Selecta, Barcelona, Spain) till they reached a constant weight after three consecutive readings at 105 ± 1 C. Analyses were carried out in duplicate.
2.4. Analysis of HMF and furfural
HMF and furfural determinations were performed according to Rufia n-Henares, Delgado-Andrade, and Mor- ales (2006).
2.5. LC-ESI-MS determination of acrylamide
A sample preparation as described by S enyuva and
Go kmen (2006) was used with minor modifications. A finely ground sample (0.450 g) was then weighed into a 10 mL centrifuge tube. The sample was spiked with 100 lL 13C3-labelled acrylamide (10 lg/mL) for recovery, and 5 mL of Milli-Q water was added. Then the mixture was vortexed, kept for five minutes at room temperature and subsequently homogenized for 1 min (Ultraturrax). Then, 500 lL Carrez I and 500 lL Carrez II solution were added, vortexed and left to stand for 10 min. Tubes were centrifuged at 5000 rpm for 15 min at 4 C. The clear supernatant (1 mL) was clarified onto a pre-conditioned HLB cartridge. The first drops were discharged and the rest of the eluate was collected in amberlite vials for analysis.
LC-ESI-MS analyses were performed as described by Morales, Rufian-Henares, and Arribas-Lorenzo (2007) using an Agilent 1100 HPLC system (Waldbronn, Ger- many) consisting of a quaternary pump, an autosampler and a temperature-controlled column oven, coupled to an Agilent 1100 MS detector equipped with an electrospray ionization interface. The analytical separation was per- formed on an Inertsil ODS-3 column (250 4.6 mm, 5 lm) using an isocratic mixture of 0.2% aqueous solution of formic acid at a flow rate of 0.6 mL/min at 25 C. Data acquisition was performed, with a delay time of 8 min, in a selected ion monitoring (SIM) mode using the following interface parameters: a drying gas (N2, 100 psig) flow of 12 L/min, nebulizer pressure of 45 psig, drying gas temper- atures 350 C, a capillary voltage of 3 kV and a fragmenter voltage of 70 eV. Monitored ions were 72.1 m/z for acryl-
amide and 75.1 m/z for 13C3-labeled acrylamide. Full scan analyses were performed in the mass range 50–200 for the
423 F.J. Morales, G. Arribas-Lorenzo / Food Chemistry 109 (2008) 421–425
Mo
istu
re (%
)
Co
lou
r (Δ
E-v
alu
e)
spectral identification of acrylamide in samples apart from the retention time. An acrylamide calibration curve was built in the range of 2–100 lg/L and a quantitation limit was determined at 18 lg/kg.
2.6. Colour determination
Colour was measured as reflectance in a Konica Minolta
CM-3500d reflectance spectrophotometer (Konika Minolta Sensing INC, Japan) using the CIE Lab colour system, where L* is lightness, the a* parameter is redness and the b* parameter yellowness (CIE Colorimetric Committee, 1974). Samples (3 g) were defatted three times with hexane (6 mL). Colour was measured in defatted samples to avoid any interference with oil absorbed components on the
churro surface. The colour difference (DE) between pro- cessed and unprocessed samples was determined according to the following equation:
DE ¼ ðDL 2 þ Da 2 þ Db 2
Þ1=2
DL* being the brightness difference, Da* the redness differ- ence and Db* the yellowness difference (Francis & Clydes- dale, 1975). Results give the average from six readings.
2.7. Statistical Analysis
Analyses were performed using Statgraphics Plus, ver- sion 5.1, 2001 (Statistical Graphics Corp, Rockville, MD, USA). At least, two independent analyses were carried out per sample.
3. Results and discussion
Deep frying at 190 C for 3–4 min is usually applied by
local producers based on their practical experience since the process has not been automatised and still remains arti- sanal. Fig. 1 shows the changes in the moisture content of
churros deep-fried at different combinations of tempera- tures (180, 190, and 200 C) and time of frying (2, 3, 5 and 7 min). The loss of moisture is progressive relative to the frying time. When fried for the same length of time, the frying temperature was seen to have no significant impact on moisture content. However, lengthening the fry- ing time proved critical regardless of the temperature. Moisture content ranged from 32% to 10–5% for 2 min and 7 min, respectively. During deep frying, the quantity of steaming water released from within the sample was determined by the frying conditions. Commercial churros are fried at high temperatures for a short period of time to avoid excessive oil penetration in the product and served a few minutes after frying to avoid subsequent hydration. Moisture content in freshly prepared industrial samples was 25.3 ± 4.8 (n = 10).
One of the most important physical changes during fry- ing of churros is the darkening of the crust which is mainly a consequence of the MR. CIE-Lab* colour parameters were measured in defatted and ground portions of a sample to prevent a false reading produced by oil incorporated into the sample. In a cross-section, a brown surface ring of crust can be observed but the core still remains pale yellow and moist. The surface of the sample was neither uniform nor large enough to perform precise and represen- tative readings. Furthermore, as it was not possible to remove the surface efficiently, the whole sample was ground and colour readings are related to the whole sample.
Fig. 2 depicts the evolution of the colour index for chur- ros deep-fried at lab-scale. Contrary to what happened with moisture content, temperature has a more critical effect on the final colour than the processing time. Decrease in light- ness is attributed to the formation of coloured pigments during the advanced and final stages of the MR in the crust and this process is enhanced at 200 C. An average DE- value of 67.0 ± 2.8 (n = 10) was obtained in commercial samples. It is noteworthy that the coefficient of variation
35 80
30
25
70
20
15
10
180ºC
5 190ºC
200ºC
0 0 2 4 6 8
Time (min)
60
180ºC
190ºC
200ºC
50 0 2 4 6 8
Time (min)
Fig. 1. Changes in the moisture content of churros during deep frying at different times and temperatures.
Fig. 2. Total colour changes (DE) in churros during deep frying at different times and temperature.
F.J. Morales, G. Arribas-Lorenzo / Food Chemistry 109 (2008) 421–425 424
180º C
190º C
200º C
HM
F (
mg
/kg
)
Acry
lam
ide
(µ
g/k
g)
Acry
lam
ide
(µ
g/k
g)
obtained was 4.1%, thus indicating that the final colour of the product is one of the most important parameters for defining the end of the frying process by local producers.
Accumulation of HMF was quantitatively more impor- tant when compared with furfural whose traces (<1 mg/kg) were barely detectable under severe frying conditions. Fig. 3 shows the evolution of HMF formation in churros during deep frying under controlled conditions. Before HMF formation, a lag-phase of up to 3 min can be clearly observed and is more relevant at lower temperatures. HMF marks the advanced stage of the MR and precursors should have formed previously. The average HMF content in commercial samples was 74.3 ± 47.5 mg/kg (n = 10) indi- cating an important variability among samples. Furfural was not detected in commercial samples. Results agree with the range of HMF obtained at laboratory scale. HMF for- mation was closely related to moisture content increasing
100
80
60
40
20
0
180ºC
190ºC
200ºC
0 2 4 6 8
Time (min)
exponentially at moisture levels lower than 10% (data not shown).
To our knowledge, there are no published results deal- ing with the AA content of churros and the influence of fry- ing conditions. Fig. 4 plots the formation of AA in churros for different frying times and temperatures. AA only formed under the most severe frying conditions where an induction period of from 3 to 5 min, depending on the fry- ing temperature, was observed. Frying temperature has a critical effect on the formation of AA. In the range of fry- ing times commonly used by local producers, an increase of just 10 C implies a two-fold increase in the levels of AA. For potato chips, a reference temperature of 175 C has been calculated, but a higher temperature is necessary for churros in order to meet the product quality demanded by consumers. The average AA content in commercial
samples was 46 ± 24.5 lg/kg (n = 10). In this investigation, potential AA formed from frying oil and incorporated into the sample was not considered since it has recently been confirmed that frying oil used in deep frying would not
Fig. 4. Acrylamide formation in churros during deep frying at different times and temperatures.
contaminate foodstuffs with AA (Totani, Yawata, Takada, & Moriya, 2007).
HMF and AA content of deep-fried samples at lab-scale were correlated (Fig. 5). For both chemicals, an induction period was observed after which the formation of HMF and AA followed the same upward trend reaching values of about 90 mg/kg, and 60 lg/kg for HMF and AA, respec- tively. Optimal quality features for churros lie in this inter- mediate region of the graph. However, under more severe frying conditions, the two trends are modified and the reduced gradient of HMF formation is enhanced in com- parison with that of acrylamide (Fig. 5, dotted line). This region consisted of over-processed churros where loss of col- our quality by excessive darkening was noticeable. It is also plausible that evaporation loss or destruction of acrylamide at 200 C becomes more relevant and subsequently the net formation of AA is reduced. Frying times of over 3 min at
250
180ºC
190ºC
100
200 200ºC
75
150
50
100
25
50
0 0 2 4 6 8
Time (min)
0 0 50 100 150 200 250
HMF (mg/kg)
Fig. 3. HMF formation in churros during deep frying at different times and temperatures.
Fig. 5. The relationship between acrylamide and HMF in lab-scale samples deep-fried under controlled conditions.
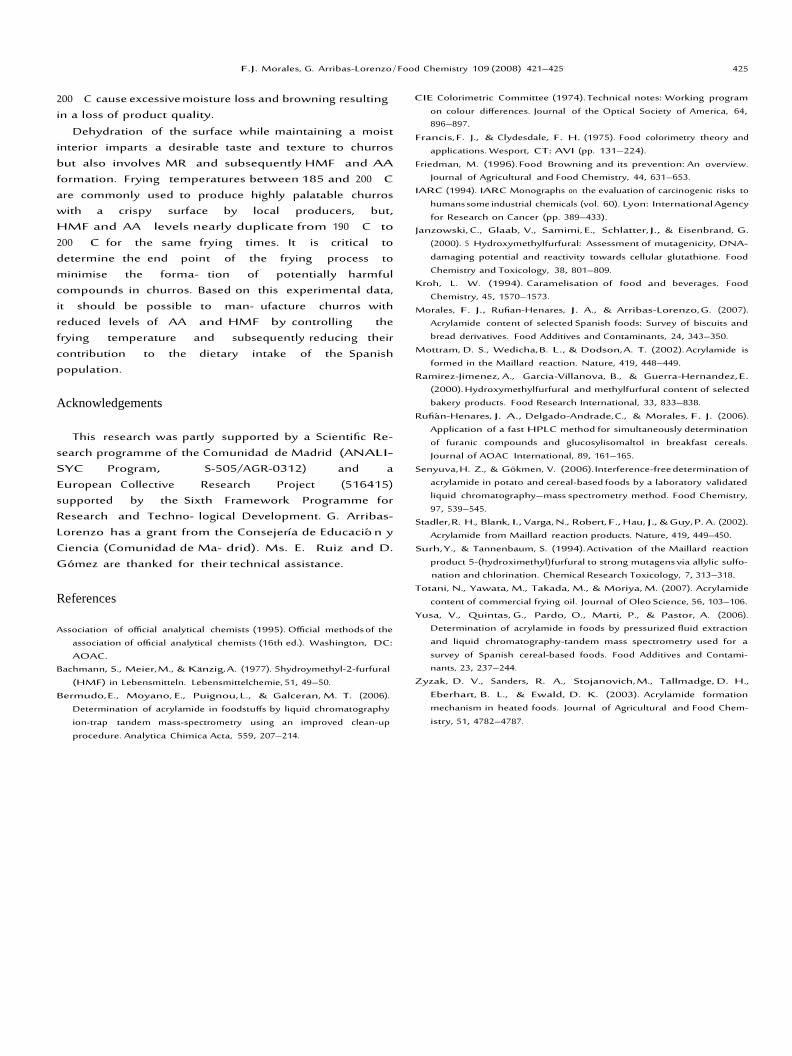
F.J. Morales, G. Arribas-Lorenzo / Food Chemistry 109 (2008) 421–425 425
200 C cause excessive moisture loss and browning resulting in a loss of product quality.
Dehydration of the surface while maintaining a moist interior imparts a desirable taste and texture to churros but also involves MR and subsequently HMF and AA formation. Frying temperatures between 185 and 200 C are commonly used to produce highly palatable churros with a crispy surface by local producers, but, HMF and AA levels nearly duplicate from 190 C to 200 C for the same frying times. It is critical to determine the end point of the frying process to minimise the forma- tion of potentially harmful compounds in churros. Based on this experimental data, it should be possible to man- ufacture churros with reduced levels of AA and HMF by controlling the frying temperature and subsequently reducing their contribution to the dietary intake of the Spanish population.
Acknowledgements
This research was partly supported by a Scientific Re-
search programme of the Comunidad de Madrid (ANALI- SYC Program, S-505/AGR-0312) and a European Collective Research Project (516415) supported by the Sixth Framework Programme for Research and Techno- logical Development. G. Arribas-Lorenzo has a grant from the Consejerıa de Educacio n y Ciencia (Comunidad de Ma- drid). Ms. E. Ruiz and D. Go mez are thanked for their technical assistance.
References
Association of official analytical chemists (1995). Official methods of the
association of official analytical chemists (16th ed.). Washington, DC: AOAC.
Bachmann, S., Meier, M., & Ka nzig, A. (1977). 5hydroymethyl-2-furfural (HMF) in Lebensmitteln. Lebensmittelchemie, 51, 49–50.
Bermudo, E., Moyano, E., Puignou, L., & Galceran, M. T. (2006). Determination of acrylamide in foodstuffs by liquid chromatography ion-trap tandem mass-spectrometry using an improved clean-up procedure. Analytica Chimica Acta, 559, 207–214.
CIE Colorimetric Committee (1974). Technical notes: Working program
on colour differences. Journal of the Optical Society of America, 64, 896–897.
Francis, F. J., & Clydesdale, F. H. (1975). Food colorimetry theory and applications. Wesport, CT: AVI (pp. 131–224).
Friedman, M. (1996). Food Browning and its prevention: An overview. Journal of Agricultural and Food Chemistry, 44, 631–653.
IARC (1994). IARC Monographs on the evaluation of carcinogenic risks to humans some industrial chemicals (vol. 60). Lyon: International Agency for Research on Cancer (pp. 389–433).
Janzowski, C., Glaab, V., Samimi, E., Schlatter, J., & Eisenbrand, G. (2000). 5 Hydroxymethylfurfural: Assessment of mutagenicity, DNA- damaging potential and reactivity towards cellular glutathione. Food Chemistry and Toxicology, 38, 801–809.
Kroh, L. W. (1994). Caramelisation of food and beverages. Food Chemistry, 45, 1570–1573.
Morales, F. J., Rufian-Henares, J. A., & Arribas-Lorenzo, G. (2007). Acrylamide content of selected Spanish foods: Survey of biscuits and bread derivatives. Food Additives and Contaminants, 24, 343–350.
Mottram, D. S., Wedicha, B. L., & Dodson, A. T. (2002). Acrylamide is formed in the Maillard reaction. Nature, 419, 448–449.
Ramirez-Jimenez, A., Garcia-Villanova, B., & Guerra-Hernandez, E. (2000). Hydroxymethylfurfural and methylfurfural content of selected bakery products. Food Research International, 33, 833–838.
Rufia n-Henares, J. A., Delgado-Andrade, C., & Morales, F. J. (2006). Application of a fast HPLC method for simultaneously determination of furanic compounds and glucosylisomaltol in breakfast cereals. Journal of AOAC International, 89, 161–165.
S enyuva, H. Z., & Go kmen, V. (2006). Interference-free determination of acrylamide in potato and cereal-based foods by a laboratory validated liquid chromatography–mass spectrometry method. Food Chemistry, 97, 539–545.
Stadler, R. H., Blank, I., Varga, N., Robert, F., Hau, J., & Guy, P. A. (2002). Acrylamide from Maillard reaction products. Nature, 419, 449–450.
Surh, Y., & Tannenbaum, S. (1994). Activation of the Maillard reaction product 5-(hydroximethyl)furfural to strong mutagens via allylic sulfo- nation and chlorination. Chemical Research Toxicology, 7, 313–318.
Totani, N., Yawata, M., Takada, M., & Moriya, M. (2007). Acrylamide content of commercial frying oil. Journal of Oleo Science, 56, 103–106.
Yusa, V., Quintas, G., Pardo, O., Marti, P., & Pastor, A. (2006). Determination of acrylamide in foods by pressurized fluid extraction and liquid chromatography-tandem mass spectrometry used for a survey of Spanish cereal-based foods. Food Additives and Contami- nants, 23, 237–244.
Zyzak, D. V., Sanders, R. A., Stojanovich, M., Tallmadge, D. H., Eberhart, B. L., & Ewald, D. K. (2003). Acrylamide formation mechanism in heated foods. Journal of Agricultural and Food Chem- istry, 51, 4782–4787.


INFLUENCIA DE DIFERENTES PARÁMETROS
……..……………………………………………........
64 Eur Food Res Technol (2009) 229:63–72
123
DOI 10.1007/s00217-009-1026-z
OR IGIN A L PA PER
Acrylamide formation in a cookie system as influenced by the oil phenol profile and degree of oxidation
Gema Arribas-Lorenzo Æ Vincenzo Fogliano Æ
Francisco J. Morales
Received: 27 November 2008 / Revised: 21 January 2009 / Accepted: 26 January 2009 / Published online: 17 February 2009
Springer-Verlag 2009
Abstract The purpose of this study was to investigate the
effect of the olive oil phenolic compounds as well as of
thermoxidised oil on the formation of acrylamide in a
cookies system. Three virgin olive oils having different
phenolic profile and a thermoxidised sunflower oil were
selected. Cookies were baked at 190 C for different times
(8–16 min) following a basic recipe where type of oil was
the variable. Additionally to acrylamide (AA), other
parameters such as colour, moisture, antioxidant activity
(AOA), and hydroxymethylfurfural (HMF) were measured.
Results showed that concentration and composition of
phenolic moiety of virgin olive oil significantly affect the
acrylamide formation, particularly at prolonged baking
time. Virgin olive oil with a higher dihydroxy/monohy-
droxy ratio was more efficient in the AA mitigation and
AA was reduced up to 20%. Colour and AOA were not
significantly different among the three types of oils.
However, AA is dramatically increased when thermoxi-
dised oil is used with a parallel increase of browning and
HMF. It was concluded that lipid oxidation products should
G. Arribas-Lorenzo F. J. Morales
Consejo Superior de Investigaciones Cientıficas,
Instituto de Ciencia y Tecnologıa de los
Alimentos y Nutricio n (formerly Instituto del Frıo),
28040 Madrid, Spain
V. Fogliano
Dipartimento di Scienza degli Alimenti,
University of Napoli ‘‘Federico II’’, via Universita 100,
80055 Portici, Italy
F. J. Morales (&)
Instituto del Frıo, CSIC, Jose Antonio Novais 10,
28040 Madrid, Spain
e-mail: [email protected]
be considered as an important factor in acrylamide for-
mation during baking of fat-rich products.
Keywords Acrylamide cookie Olive oil
Sunflower oil Phenolic compounds Thermoxidation
Carbonyl compounds
Introduction
Acrylamide (AA) monomer which is responsible of ner-
vous system damage [1], may act as a carcinogenic [2] and
mutagenic compound [3]. AA has been classified by the
International Agency for Research on Cancer (IARC) as
probably carcinogenic to humans [4]. AA is naturally
formed mainly in carbohydrate rich foods during thermal
treatment [5]. According to the most recent data, average
human intake is estimated to be 0.4 lg/kg bw/day from
2 years of age onwards [6]. However, the intake may vary
widely from 0.3 to 2 lg/kg bw/day or may reach even
5 lg/kg bw/day at the 99th percentile [6]. The main food
commodities contributing to the AA exposure were French
fries, potato crisps, coffee, biscuits and bread, while others
food items contributed less than 10% of the total exposure
[7]. All in all, the discovery of AA as new heat-induced
toxicant in foodstuffs led to a public health concern and
different National and International bodies aimed activities
for risk evaluation.
Reducing sugars and asparagine are the most important
precursors in the formation of acrylamide in foods linked to
the Maillard reaction (MR) through the decarboxylation of
the Schiff base in a Strecker-type reaction [8, 9]. Another
possible, although secondary pathway reported for acryl-
amide formation is from lipid oxidation, triacylglycerols
can hydrolyse to glycerol, forming acrolein from the
64 Eur Food Res Technol (2009) 229:63–72
123
thermal degradation which is a precursor of acrylamide [8,
10]. Acrylic acid may also rise from the oxidation of
acrolein which can be found in the thermal degradation of
lipids [11].
Due to the current interest of AA formation in cooked
foods, several studies have been carried out in order to
minimise its concentration in different food categories.
Most effective approaches to be implemented at industrial
scale have been compiled by the CIAA who developed a
guide called Acrylamide Toolbox [12]. Recent investiga-
tions indicated that antioxidant compounds could be an
effective tool to inhibit acrylamide production [13–15], but
opposite evidence about the effect of antioxidant on
acrylamide formation have also been reported. For
instance, Tareke [16] found that the addition of antioxi-
dants (butylated hydroxytoluene, sesamol, vitamin E) to
meat before heating enhances the formation of acrylamide.
This author hypothesised that antioxidants might protect
acrylamide from further radical-initiated reactions. Vattem
and Shetty [17] reported that formation of acrylamide in
fried potato slices previously treated with phenolic anti-
oxidants from cranberry and oregano increased when
exogenous phenolic is present. Rydberg et al. [18] mixing
in homogenised potato ascorbyl palmitate and sodium
ascorbate, as well as oxidants such as benzoyl peroxide and
hydrogen peroxide, found that the effect on acrylamide
content is small or nonexistent.
It is well known that MR and lipid oxidation are inter-
related and the products of each reaction influence the
development of the other. Recent findings from model
system suggested that some lipid oxidation products can
affect acrylamide formation [19]. But, studies on the
influence of oxidised oil on acrylamide formation in food
are scarce and mainly refer to French fries or potato crisps
during the frying process [20]. Also, emulsions with
acrylamide have been used to study the effect of the oxi-
dised oil [21], but no studies have been carried out about
the influence of thermoxidised oil as food constituent,
particularly during baking of cookies. Indeed, recent papers
dealing with acrylamide formation in baked products
did not consider the variable of fat oxidation or fat
oxidizability [22, 23].
In a previous study, we showed the relationship between
the concentration of ortho-diphenolic compounds of the
frying olive oil and acrylamide formation in potato crisps
[24]. These phenolic compounds with antioxidant proper-
ties in virgin olive oil [25], demonstrated to be also
effective in reducing the heterocyclic amines formation in
meat [26]. Based on this knowledge, the main objective of
this work was to investigate the effect of the oil compo-
sition on the acrylamide formation in a cookie system
where oil is a part of the formulation. For this purpose,
three virgin olive oils containing different profile of
phenolic compounds and a thermoxidised sunflower oil
were used.
Materials and methods
Materials
All chemicals used were of analytical grade and were
obtained from Sigma-Aldrich (St. Louis, MO, USA),
unless mentioned otherwise. 13
C3-Acrylamide (isotopic
purity 99%) was from Cambridge Isotope Labs (Andover,
MA, USA). Methanol and acetonitrile (HPLC grade) were
from Scharlau (Barcelona, Spain). Potassium hexacyano-
ferrate, zinc sulphate, formic acid (98%) were of analytical
grade and obtained from Panreac (Barcelona, Spain). Ultra
pure water was used throughout the experiments (Milli-Q
system, Milliporem Bedford, MA, USA). Oasis-HLB car-
tridges (30 mg, 1 mL) were supplied by Waters (Milford,
MA, USA). Glass vials with septum screw caps were
supplied by Agilent Technologies (Wilmington, DE, USA).
Wheat flour, salt and sugar were sourced from local pro-
ducers in Italy.
Methods
Dough preparation and baking conditions
The recipe of the model cookies was prepared according to
Go kmen et al. [22] with some modifications. Recipes were
formulated with 80 g wheat flour, 1 g salt, 17 g deionised
water, 24 g oil, 1.2 g sodium bicarbonate and 35 g sugar.
Recipes were identified according to the composition of the
oils. The ingredients were thoroughly mixed, and dough
was rolled out to discs with 5 cm of diameter and 2 mm of
thickness using a manual laminator (Imperia, Lusso, sp 150
model, Bologna, Italy). In each trial, four cookies were
prepared and baked at 190 C for 8, 10, 12, 14 and 16 min
in an oven without air convection (Rex, Electrolux,
Pordenone, Italy). After baking, the samples were photo-
graphed, grinded and stored (Laboratory Blender, Waring
Commercial, Torrington, USA). Two complete indepen-
dent trials of baking were carried out to investigate the
effect of phenolic compounds content and three indepen-
dent trials were carried out for the experiment with
thermoxidised oil.
Oil samples
Three different olive oils (VO) were used in the baking
experiments: a refined olive oil purchased at local market
with low phenolic compounds (LO, control), a virgin olive
oil (from Olea europaea cv. Coratina) with intermediate
123
65 Eur Food Res Technol (2009) 229:63–72
content in phenolic compounds (IO) and virgin olive oil
(from Olea europaea cv. Ravece) rich in phenolic com-
pounds (HO). The two virgin olive samples showed values
of free acidity (0.1 and 0.2 g/100 g, respectively) peroxide
number (10 and 13 mEqO2/kg, respectively), and spectro-
photometric indices (K232, K270 and DK) within the limits
for extra VOs as defined by EC Regulation (CE) 1989/2003
relative to the characteristics of olive oils, olive pomace
oils, and related analytical methods.
Thermoxidised oil (TXSO) was prepared from sun-
flower oil (CSO, control). Sunflower oil (100 g) was
weighed out in two open beakers and heated at 180 C for
17 h in an oven (Memmert, Hannover, Germany). Both,
control oil no-heating and oxidised oil, were used to pre-
pare the dough. The degree of oxidation was measured as
the peroxide value, determined by the standard iodometric
method, according to the AOCS Official method Cd 8-53
[27]. The sunflower oil lipid peroxidation was determined
by thiobarbituric acid reaction (TBA test). TBARS value
was measured according to Fee and Teitelbaum [28].
Briefly, 1 g oil was mixed with 5 mL of distilled H2O and
5 mL of hexane, vortexed, and the precipitate was removed
by centrifugation at 1,800g for 10 min. After the addition
of 1.5 mL of 0.6% (w/v) TBA, the supernatant was mea-
sured at 532 nm using a malondialdehyde (MDA) standard
curve.
Extraction of phenolic compounds from virgin olive oil
Extraction of phenolic compounds was performed accord-
ing to the method of Cortesi et al. [29]. Briefly, olive oil
(50 g) was dissolved in hexane (50 mL), and polar com-
pounds were extracted with methanol/water (3:2, v/v,
3 9 30 mL). The final extract was washed with hexane
(50 mL), and then the solvent was evaporated under
reduced pressure at 40 C. The residue obtained was
weighed, dissolved in methanol, filtered through 0.2 lm
filters (Amicon, Boca Raton, Florida), and used for deter-
mination of total phenolic compounds, HPLC separation,
for LC–MS analysis.
Determination of tocopherol and total phenolic compounds
content
The amount of phenolic compounds was given as gallic
acid equivalents and determined according to the Folin-
Ciocalteu method [30]. Briefly, 2.5 mL of Folin-Ciocalteu
reagent, diluted tenfold in water, was added to the different
virgin olive oils. The mixture was incubated for 2 min at
room temperature, and 2 mL of sodium carbonate was
added. The mixture was incubated for 15 min at 50 C and
finally cooled in a water-ice bath. The specific absorbance
at 760 nm was immediately measured. Tocopherol content
was determined according to Psomiadou et al. [31].
LC–MS analysis of virgin olive oils phenolic extracts
Virgin olive oils phenolic compounds were tentatively
identified by LC–MS, as previously described [32]. HPLC
runs were performed on a Shimadzu instrument configured
with two LC-10AD pumps and a SLC10 A control system.
Phenolic compound separation was performed on a Biosil
C18 HL 90-5S column (5 lm, 4.6 9 150 mm) (Bio-Rad,
Hercules, CA, USA). MS analysis was carried out on an
API-100 single quadrupole mass spectrometer (Applied
Biosystems, Foster City, CA, USA) equipped with an
atmospheric pressure chemical ionisation (APCI) ion
source.
The instrument used nitrogen as curtain gas and air to
dry the ion spray. Preliminary experiments were also per-
formed using an electrospray ion source (ESI). The HPLC
equipment was connected to the described above using
a flow rate of 0.8 mL/min. Ionisation was achieved at a
temperature of 70 C using a probe voltage of 4.8 kV and a
declustering potential of 70 V. The mass-to-charge ratio
scale was calibrated with the ions of ammonium adduct of
polypropylene glycol. Full-scan spectra were acquired
from 100 to 800 atomic mass units (amu) using a step size
of 0.5 amu and a dwell time of 2 ms. Single ion monitoring
(SIM) was performed simultaneously for four ions: 305,
321, 363 and 379 amu corresponding to the molecular ions
(MH?
) of the main phenolic compounds and to 357 for
pinoresinol. In these experiments, a 500 ms dwell time was
selected. Quantitative determination of secoiridoid com-
pounds was obtained using a calibration curve constructed
with oleuropein as standard; pinoresinol was quantified
using a calibration curve obtained with pure standard.
LC–ESI–MS determination of acrylamide
Powdered sample (0.450 g) was weighed and mixed with
5 mL water in polypropylene centrifugal tubes. Mixture
was spiked with 100 lL of a 10 lg/mL [13
C3]-acrylamide
methanolic solution as internal standard and later homog-
enised (Ultra Turrax, IKA, Mod-T10 basic, Germany) for
1 min. Afterwards, sample was treated with 750 lL of each
Carrez I and Carrez II solutions and centrifuged (9,000g for
10 min) at 4 C. For sample clean up, Oasis-HLB car-
tridges were used. Cartridges were preconditioned with
1 mL methanol and 1 mL water. An aliquot of the clear
supernatant (1 mL) was loaded onto the cartridge at a flow
rate of 2 mL/min and first drops were discharged and the
rest collected. Solution was filtered through a 0.45-lm
filter into an amberlite LC–MS vial.
123
66 Eur Food Res Technol (2009) 229:63–72
LC–ESI–MS analysis were performed as described by
Rufian-Henares et al. [33] with minor modifications [34]
using an Agilent 1100 liquid chromatograph coupled to an
Agilent Quadrupole MS detector (Agilent Technologies,
Palo Alto, CA, USA). Analytical separation was achieved
with an Inertsil ODS-3 column (25 9 0.46 cm, 5 lm)
(GLC-Sciences, Tokyo, Japan) at 32 C. Isocratic elution
was achieved with a mobile phase of 0.2% formic acid in
water at a flow rate of 0.6 mL/min. Electrospray ionisa-
tion in the positive ionisation mode was used. The MS
detector operated in selected ion monitoring (SIM) mode
at m/z ratios of 72.1 and 75.1 for acrylamide and [13
C3]-
acrylamide, respectively. A delay time of 8 min was
selected to avoid the introduction of co-extracted matrix
components into the MS instrument prior acrylamide
elution. The needle and cone voltages were set at 3.0 kV
and 100 V, respectively. Nitrogen was used as nebulizer
gas (12.0 L/h) and the source temperature was set at
300 C. Acrylamide was quantified using a linear cali-
bration function that was established with standard
solutions of acrylamide and [13
C3]-acrylamide in Milli-Q
water (5–100 lg/L). Acrylamide contents in sample
extracts were calculated from the calibration slope and
intercept value, taking into account the recovery calcu-
lated by means of [13
C3]-acrylamide slope. The limit of
the quantitation was set at 20 lg/kg. Precision (repro-
ducibility) was lower than 12% and recovery between 84
and 109%. Recently, CSIC laboratory has participated in
an EU validation study of IRMM (2008) for the deter-
mination of acrylamide in potato crisps with satisfactory
results (z-score, -0.5). Additionally, a reference material
(crispbread) from Proficiency test 3018 from FAPAS
(Central Science Laboratory, UK) was used, assigned
value was 101 lg/kg and reported value was 103 lg/kg
being satisfactory. The analysis is integrated within
the scope of a certified laboratory controlled by
AENOR (Spanish Association for Standardisation and
Certification).
1 mL/min under isocratic conditions and a Synergy 4 lm
Hydro-RP 80A, 25 9 4.6 cm (Phenomenex) column. The
UV detector was set at 280 nm and HMF was quantified
using the external standard method within the range 0.025–
75 mg/L. The limit of detection of the method was
0.010 mg/L while the reproducibility in cookies was 1.50%
(CV). All the analyses were performed in triplicate and the
results expressed as mg/kg sample.
Antioxidant activity assay
ABTS, 2,20 -azinobis(3-ethylbenzothiazoline-6-sulphonic
acid), assay for insoluble samples was carried out accord-
ing to Serpen et al. [36]. The antioxidant capacity was
expressed as Trolox equivalent antioxidant capacity
(TEAC) which is defined as the amount of Trolox (mmol)
necessary to obtain the same antioxidant capacity.
Moisture content
The moisture content was determined by a gravimetric
method as described in AOAC-925.10 [37]. Samples
(*1 g) were weighed accurately into a test tube and they
were dried until constant weight in oven at 105 C. The
experiment was carried out in duplicate.
Colour determination
Colour of baking cookies has been measured in units
L*a*b* using a Konica Minolta CM-3500d reflectance
spectrophotometer (Konika Minolta Sensing INC, Japan).
L*a*b* is an international standard for colour measure-
ments, adopted by the Commission Internationale
d’Eclairage (CIE) [38] in 1974. L* is the luminance or
lightness component, which ranges from 0 to 100, and
parameters a* (from green to red) and b* (from blue to
yellow) are the two chromatic components. The colour (E)
was determined according to the following equation:
2 2 2 1=2
HPLC determination of HMF E ¼ L þ a þ b
HMF determination was based on the method of Garcia-
Villanova et al. [35] with slight modifications. Ground
sample (500 mg) was suspended in 5 mL of deionised
water clarified with 0.25 mL each of potassium ferrocya-
nide (15% w/v) and zinc acetate (30% w/v) solutions. The
resulting mixture was centrifuged at 4,000 rpm for 10 min
at 4 C. The supernatant was collected and two further
extractions were performed using 2 mL of deionised water.
The extracts were filtered (0.45 lm) and analysed by
HPLC (Shimadzu, Kyoto, Japan). The mobile phase was a
mixture of acetonitrile in water (5% v/v) at a flow rate of
L* being the brightness, a* the redness and b* the
yellowness [39]. The instrument was calibrated each time
with a white and a black ceramic plate. Each sample was
scanned twice in three different places.
Statistical analysis
Data were analysed using Microcal Origin, version 7.5
(Origin Lab Corp, Massachusetts, USA). Values were
presented as means ± SD. Differences with P \ 0.05 were
considered statistically significant using Tukey test.
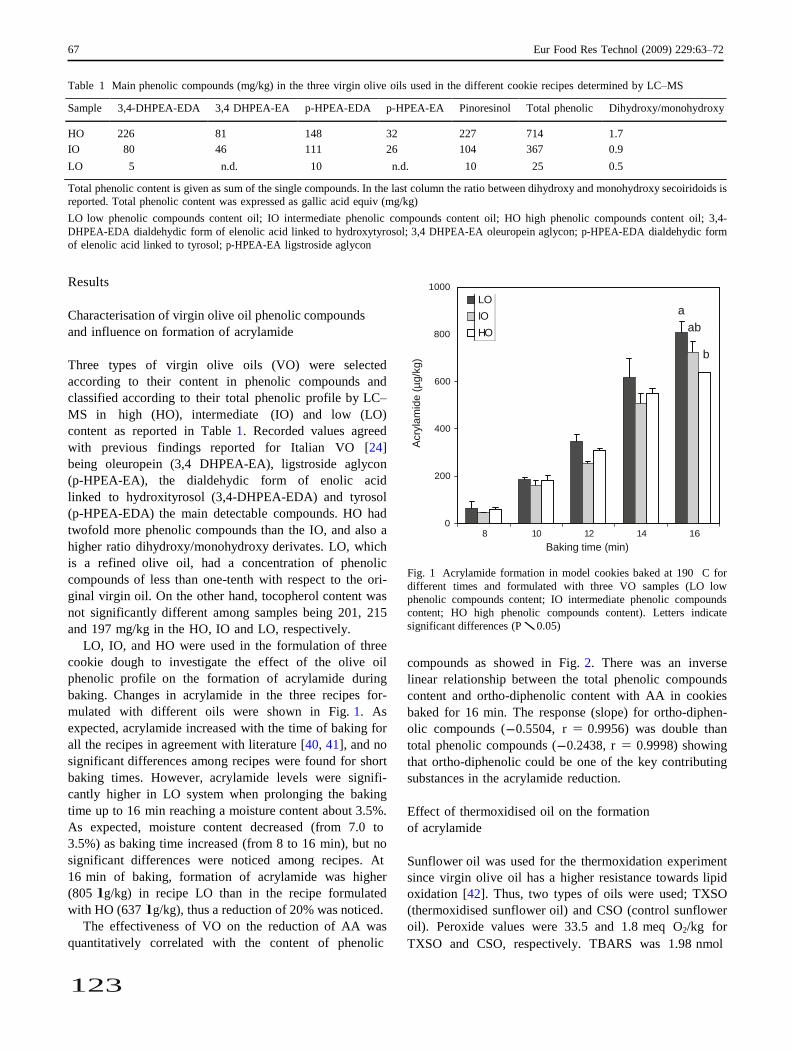
123
67 Eur Food Res Technol (2009) 229:63–72
LO
IO
HO
Results 1000
LO Characterisation of virgin olive oil phenolic compounds
and influence on formation of acrylamide
800
IO
HO
Acry
lam
ide (
µg/k
g)
Table 1 Main phenolic compounds (mg/kg) in the three virgin olive oils used in the different cookie recipes determined by LC–MS
Sample 3,4-DHPEA-EDA 3,4 DHPEA-EA p-HPEA-EDA p-HPEA-EA Pinoresinol Total phenolic Dihydroxy/monohydroxy
HO 226 81 148 32 227 714 1.7 IO 80 46 111 26 104 367 0.9 LO 5 n.d. 10 n.d. 10 25 0.5
Total phenolic content is given as sum of the single compounds. In the last column the ratio between dihydroxy and monohydroxy secoiridoids is
reported. Total phenolic content was expressed as gallic acid equiv (mg/kg)
LO low phenolic compounds content oil; IO intermediate phenolic compounds content oil; HO high phenolic compounds content oil; 3,4-
DHPEA-EDA dialdehydic form of elenolic acid linked to hydroxytyrosol; 3,4 DHPEA-EA oleuropein aglycon; p-HPEA-EDA dialdehydic form
of elenolic acid linked to tyrosol; p-HPEA-EA ligstroside aglycon
Three types of virgin olive oils (VO) were selected
according to their content in phenolic compounds and
classified according to their total phenolic profile by LC–
MS in high (HO), intermediate (IO) and low (LO)
content as reported in Table 1. Recorded values agreed
with previous findings reported for Italian VO [24]
being oleuropein (3,4 DHPEA-EA), ligstroside aglycon
(p-HPEA-EA), the dialdehydic form of enolic acid
linked to hydroxityrosol (3,4-DHPEA-EDA) and tyrosol
(p-HPEA-EDA) the main detectable compounds. HO had
twofold more phenolic compounds than the IO, and also a
higher ratio dihydroxy/monohydroxy derivates. LO, which
is a refined olive oil, had a concentration of phenolic
compounds of less than one-tenth with respect to the ori-
ginal virgin oil. On the other hand, tocopherol content was
not significantly different among samples being 201, 215
and 197 mg/kg in the HO, IO and LO, respectively.
LO, IO, and HO were used in the formulation of three
cookie dough to investigate the effect of the olive oil
phenolic profile on the formation of acrylamide during
baking. Changes in acrylamide in the three recipes for-
mulated with different oils were shown in Fig. 1. As
expected, acrylamide increased with the time of baking for
all the recipes in agreement with literature [40, 41], and no
significant differences among recipes were found for short
baking times. However, acrylamide levels were signifi-
cantly higher in LO system when prolonging the baking
time up to 16 min reaching a moisture content about 3.5%.
As expected, moisture content decreased (from 7.0 to
3.5%) as baking time increased (from 8 to 16 min), but no
significant differences were noticed among recipes. At
16 min of baking, formation of acrylamide was higher
(805 lg/kg) in recipe LO than in the recipe formulated
with HO (637 lg/kg), thus a reduction of 20% was noticed.
The effectiveness of VO on the reduction of AA was
quantitatively correlated with the content of phenolic
a
ab
b
600
400
200
0 8 10 12 14 16
Baking time (min)
Fig. 1 Acrylamide formation in model cookies baked at 190 C for
different times and formulated with three VO samples (LO low
phenolic compounds content; IO intermediate phenolic compounds
content; HO high phenolic compounds content). Letters indicate
significant differences (P \ 0.05)
compounds as showed in Fig. 2. There was an inverse
linear relationship between the total phenolic compounds
content and ortho-diphenolic content with AA in cookies
baked for 16 min. The response (slope) for ortho-diphen-
olic compounds (-0.5504, r = 0.9956) was double than
total phenolic compounds (-0.2438, r = 0.9998) showing
that ortho-diphenolic could be one of the key contributing
substances in the acrylamide reduction.
Effect of thermoxidised oil on the formation
of acrylamide
Sunflower oil was used for the thermoxidation experiment
since virgin olive oil has a higher resistance towards lipid
oxidation [42]. Thus, two types of oils were used; TXSO
(thermoxidised sunflower oil) and CSO (control sunflower
oil). Peroxide values were 33.5 and 1.8 meq O2/kg for
TXSO and CSO, respectively. TBARS was 1.98 nmol
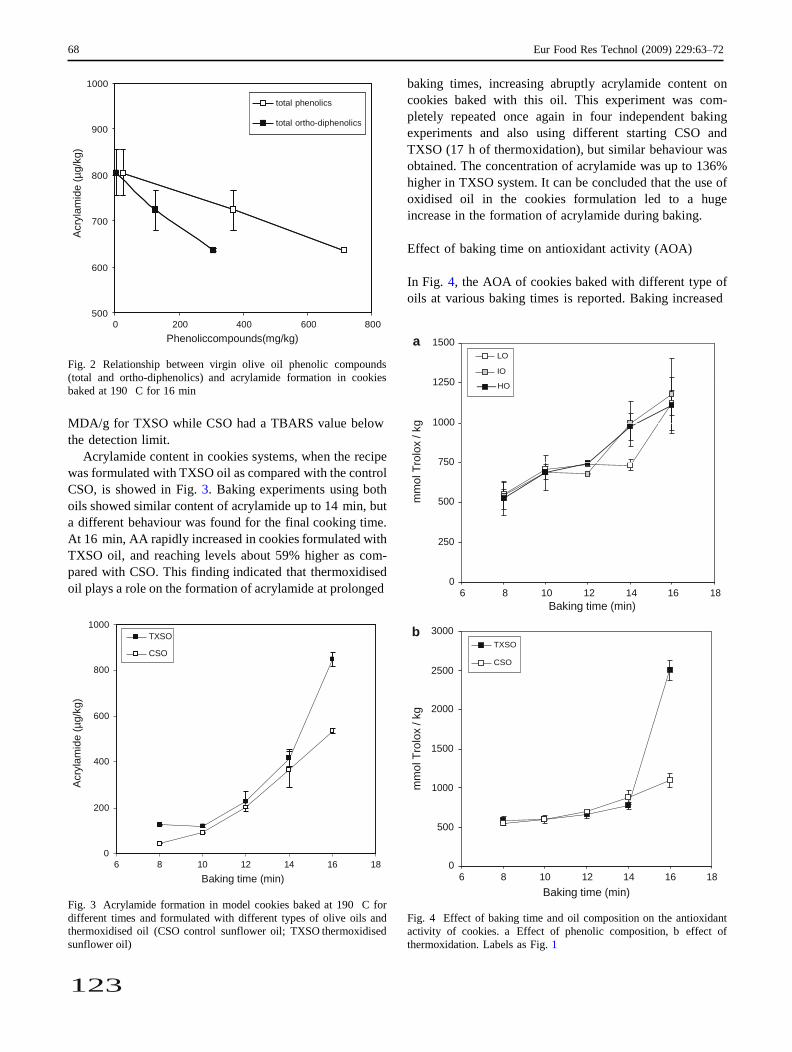
123
68 Eur Food Res Technol (2009) 229:63–72
total phenolics
total ortho-diphenolics
LO a IO
HO
TXSO b
CSO
Acry
lam
ide (
µg/k
g)
Acry
lam
ide (
µg/k
g)
mm
ol T
rolo
x / k
g
mm
ol T
rolo
x / k
g
1000
900
800
700
600
500
total phenolics
total ortho-diphenolics
0 200 400 600 800
baking times, increasing abruptly acrylamide content on
cookies baked with this oil. This experiment was com-
pletely repeated once again in four independent baking
experiments and also using different starting CSO and
TXSO (17 h of thermoxidation), but similar behaviour was
obtained. The concentration of acrylamide was up to 136%
higher in TXSO system. It can be concluded that the use of
oxidised oil in the cookies formulation led to a huge
increase in the formation of acrylamide during baking.
Effect of baking time on antioxidant activity (AOA)
In Fig. 4, the AOA of cookies baked with different type of
oils at various baking times is reported. Baking increased
Phenoliccompounds(mg/kg)
Fig. 2 Relationship between virgin olive oil phenolic compounds
(total and ortho-diphenolics) and acrylamide formation in cookies
baked at 190 C for 16 min
a 1500
LO
IO
1250 HO
MDA/g for TXSO while CSO had a TBARS value below
the detection limit.
Acrylamide content in cookies systems, when the recipe
was formulated with TXSO oil as compared with the control
CSO, is showed in Fig. 3. Baking experiments using both
oils showed similar content of acrylamide up to 14 min, but
a different behaviour was found for the final cooking time.
At 16 min, AA rapidly increased in cookies formulated with
TXSO oil, and reaching levels about 59% higher as com-
pared with CSO. This finding indicated that thermoxidised
oil plays a role on the formation of acrylamide at prolonged
1000
1000
750
500
250
0
6 8 10 12 14 16 18
Baking time (min)
800
TXSO
CSO
b 3000
2500
TXSO
CSO
600 2000
400
1500
1000
200 500
0
6 8 10 12 14 16 18
Baking time (min)
0
6 8 10 12 14 16 18
Baking time (min) Fig. 3 Acrylamide formation in model cookies baked at 190 C for
different times and formulated with different types of olive oils and
thermoxidised oil (CSO control sunflower oil; TXSO thermoxidised
sunflower oil)
Fig. 4 Effect of baking time and oil composition on the antioxidant
activity of cookies. a Effect of phenolic composition, b effect of
thermoxidation. Labels as Fig. 1
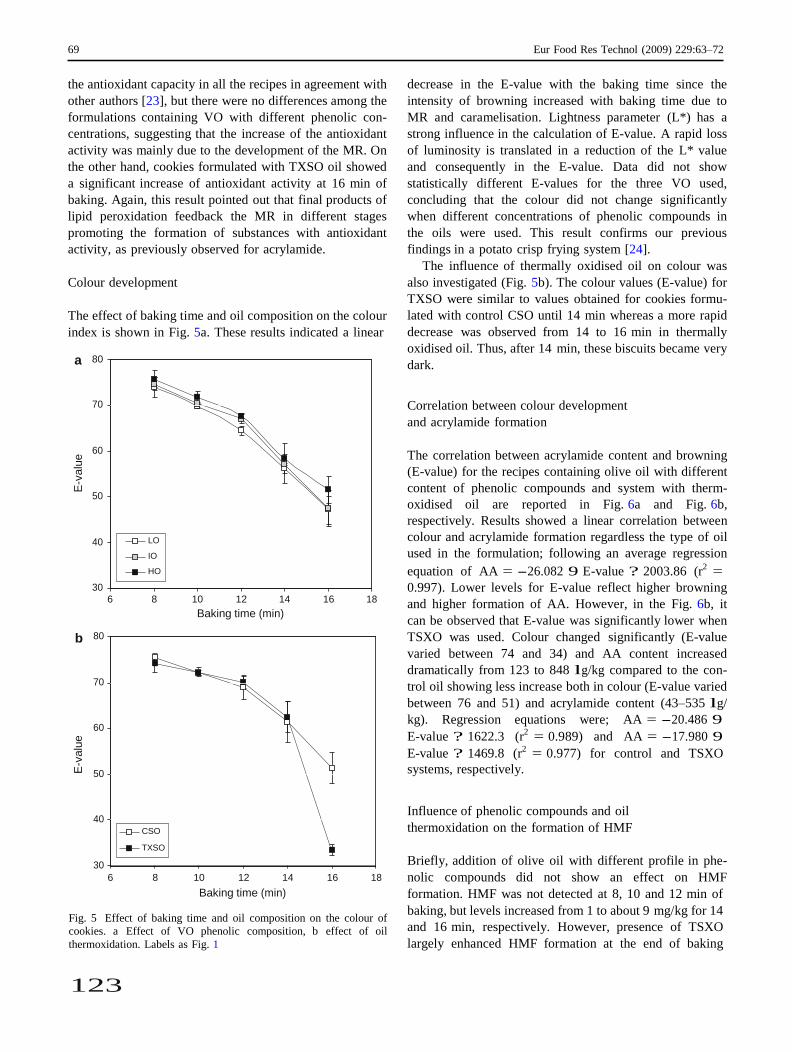
123
69 Eur Food Res Technol (2009) 229:63–72
a
LO
IO
HO
b
CSO
TXSO
E-v
alu
e
E-v
alu
e
the antioxidant capacity in all the recipes in agreement with
other authors [23], but there were no differences among the
formulations containing VO with different phenolic con-
centrations, suggesting that the increase of the antioxidant
activity was mainly due to the development of the MR. On
the other hand, cookies formulated with TXSO oil showed
a significant increase of antioxidant activity at 16 min of
baking. Again, this result pointed out that final products of
lipid peroxidation feedback the MR in different stages
promoting the formation of substances with antioxidant
activity, as previously observed for acrylamide.
Colour development
The effect of baking time and oil composition on the colour
index is shown in Fig. 5a. These results indicated a linear
a 80
decrease in the E-value with the baking time since the
intensity of browning increased with baking time due to
MR and caramelisation. Lightness parameter (L*) has a
strong influence in the calculation of E-value. A rapid loss
of luminosity is translated in a reduction of the L* value
and consequently in the E-value. Data did not show
statistically different E-values for the three VO used,
concluding that the colour did not change significantly
when different concentrations of phenolic compounds in
the oils were used. This result confirms our previous
findings in a potato crisp frying system [24].
The influence of thermally oxidised oil on colour was
also investigated (Fig. 5b). The colour values (E-value) for
TXSO were similar to values obtained for cookies formu-
lated with control CSO until 14 min whereas a more rapid
decrease was observed from 14 to 16 min in thermally
oxidised oil. Thus, after 14 min, these biscuits became very
dark.
70
60
50
40
30
b 80
70
60
50
40
30
LO
IO
HO
6 8 10 12 14 16 18
Baking time (min)
CSO
TXSO
6 8 10 12 14 16 18
Baking time (min)
Correlation between colour development
and acrylamide formation
The correlation between acrylamide content and browning
(E-value) for the recipes containing olive oil with different
content of phenolic compounds and system with therm-
oxidised oil are reported in Fig. 6a and Fig. 6b,
respectively. Results showed a linear correlation between
colour and acrylamide formation regardless the type of oil
used in the formulation; following an average regression
equation of AA = -26.082 9 E-value ? 2003.86 (r2
=
0.997). Lower levels for E-value reflect higher browning
and higher formation of AA. However, in the Fig. 6b, it
can be observed that E-value was significantly lower when
TSXO was used. Colour changed significantly (E-value
varied between 74 and 34) and AA content increased
dramatically from 123 to 848 lg/kg compared to the con-
trol oil showing less increase both in colour (E-value varied
between 76 and 51) and acrylamide content (43–535 lg/
kg). Regression equations were; AA = -20.486 9
E-value ? 1622.3 (r2
= 0.989) and AA = -17.980 9
E-value ? 1469.8 (r2 = 0.977) for control and TSXO
systems, respectively. Influence of phenolic compounds and oil
thermoxidation on the formation of HMF
Briefly, addition of olive oil with different profile in phe-
nolic compounds did not show an effect on HMF
formation. HMF was not detected at 8, 10 and 12 min of
Fig. 5 Effect of baking time and oil composition on the colour of
cookies. a Effect of VO phenolic composition, b effect of oil
thermoxidation. Labels as Fig. 1
baking, but levels increased from 1 to about 9 mg/kg for 14
and 16 min, respectively. However, presence of TSXO
largely enhanced HMF formation at the end of baking
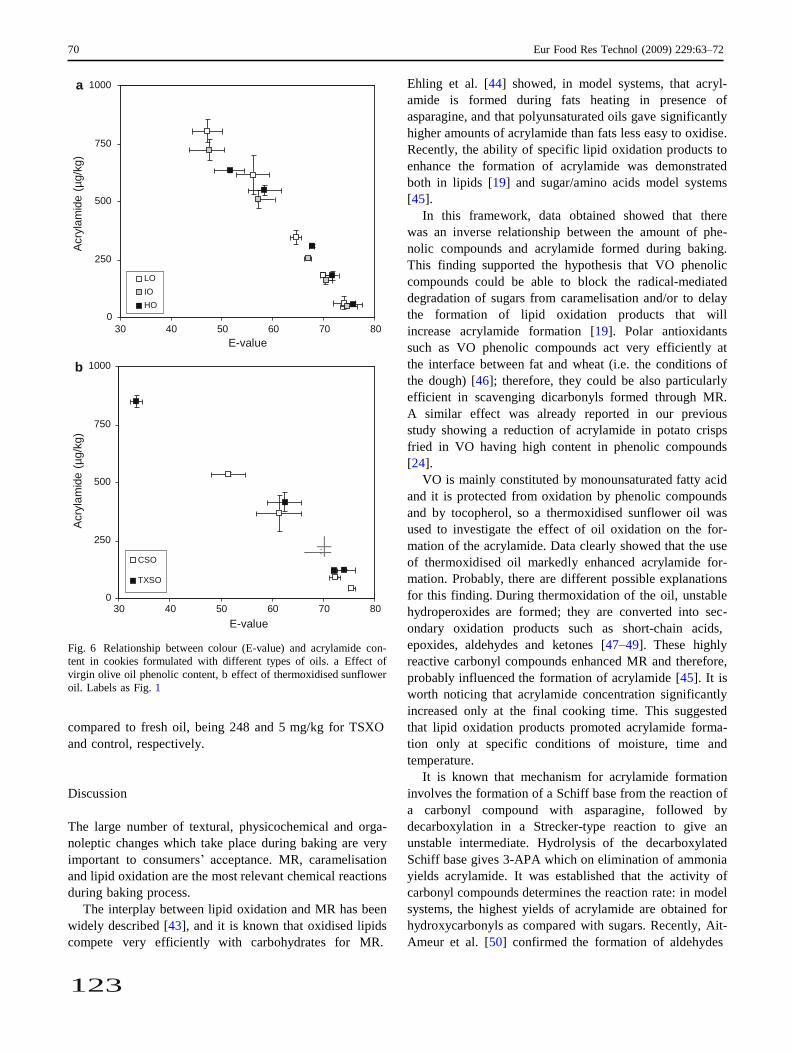
123
70 Eur Food Res Technol (2009) 229:63–72
LO
IO
HO
CSO
TXSO
Acry
lam
ide
(µ
g/k
g)
Acry
lam
ide
(µ
g/k
g)
a 1000
750
500
250
0
b 1000
750
500
250
0
LO
IO
HO
30 40 50 60 70 80
E-value
CSO
TXSO
30 40 50 60 70 80
E-value
Ehling et al. [44] showed, in model systems, that acryl-
amide is formed during fats heating in presence of
asparagine, and that polyunsaturated oils gave significantly
higher amounts of acrylamide than fats less easy to oxidise.
Recently, the ability of specific lipid oxidation products to
enhance the formation of acrylamide was demonstrated
both in lipids [19] and sugar/amino acids model systems
[45].
In this framework, data obtained showed that there
was an inverse relationship between the amount of phe-
nolic compounds and acrylamide formed during baking.
This finding supported the hypothesis that VO phenolic
compounds could be able to block the radical-mediated
degradation of sugars from caramelisation and/or to delay
the formation of lipid oxidation products that will
increase acrylamide formation [19]. Polar antioxidants
such as VO phenolic compounds act very efficiently at
the interface between fat and wheat (i.e. the conditions of
the dough) [46]; therefore, they could be also particularly
efficient in scavenging dicarbonyls formed through MR.
A similar effect was already reported in our previous
study showing a reduction of acrylamide in potato crisps
fried in VO having high content in phenolic compounds
[24].
VO is mainly constituted by monounsaturated fatty acid
and it is protected from oxidation by phenolic compounds
and by tocopherol, so a thermoxidised sunflower oil was
used to investigate the effect of oil oxidation on the for-
mation of the acrylamide. Data clearly showed that the use
of thermoxidised oil markedly enhanced acrylamide for-
mation. Probably, there are different possible explanations
for this finding. During thermoxidation of the oil, unstable
hydroperoxides are formed; they are converted into sec-
ondary oxidation products such as short-chain acids,
Fig. 6 Relationship between colour (E-value) and acrylamide con-
tent in cookies formulated with different types of oils. a Effect of
virgin olive oil phenolic content, b effect of thermoxidised sunflower
oil. Labels as Fig. 1
compared to fresh oil, being 248 and 5 mg/kg for TSXO
and control, respectively.
Discussion
The large number of textural, physicochemical and orga-
noleptic changes which take place during baking are very
important to consumers’ acceptance. MR, caramelisation
and lipid oxidation are the most relevant chemical reactions
during baking process.
The interplay between lipid oxidation and MR has been
widely described [43], and it is known that oxidised lipids
compete very efficiently with carbohydrates for MR.
epoxides, aldehydes and ketones [47–49]. These highly
reactive carbonyl compounds enhanced MR and therefore,
probably influenced the formation of acrylamide [45]. It is
worth noticing that acrylamide concentration significantly
increased only at the final cooking time. This suggested
that lipid oxidation products promoted acrylamide forma-
tion only at specific conditions of moisture, time and
temperature.
It is known that mechanism for acrylamide formation
involves the formation of a Schiff base from the reaction of
a carbonyl compound with asparagine, followed by
decarboxylation in a Strecker-type reaction to give an
unstable intermediate. Hydrolysis of the decarboxylated
Schiff base gives 3-APA which on elimination of ammonia
yields acrylamide. It was established that the activity of
carbonyl compounds determines the reaction rate: in model
systems, the highest yields of acrylamide are obtained for
hydroxycarbonyls as compared with sugars. Recently, Ait-
Ameur et al. [50] confirmed the formation of aldehydes
123
71 Eur Food Res Technol (2009) 229:63–72
(mostly, E,E,2,4-decadienal and nonanal) in a cookie
model system heated at 300 C up to 10 min and they
found that their concentrations decreased after 6–8 min of
baking due to reaction with dough proteins. In addition to
reducing sugars, other carbonyl compounds, including lipid
peroxidation products are also able to react with amino
groups. Lipid oxidation produces a number of carbonyl
derivatives which feedback the Maillard reaction. Hidalgo
and Zamora [51] showed that 4,5-epoxy-alkenals, a lipid
oxidation product, also produce the Strecker degradation of
amino acids. Furthermore, final lipid oxidation products are
able to react with amino acids to form their corresponding
Strecker aldehydes [43]. It was recently described that
some lipid oxidation products, particularly 2,4-decadienal,
promoted acrylamide formation [19]. Hence, it is plausible
that the higher yields of carbonyls in the thermoxidised oil
could be responsible for significant increase of the acryl-
amide formation in cookies.
These results are also in agreement with other authors
that stated the possible effect of deep-frying on the acryl-
amide formation [48, 52], but these results were not
consistent with earlier findings in model systems [20, 21,
53] where oil oxidation did not significantly influence
acrylamide formation.
Data showed a linear increase of the antioxidant activity
during cooking which confirm our previous finding [54]
and are probably due to the formation of enediol structures
reductones which break the radical chain by donation of
hydrogen. The direct procedure adopted by Serpen et al.
[36], which avoided sample extraction, proved to be par-
ticularly suitable for dry system rich with poorly soluble
MRPs such as cookies. In fact, the increase of the antiox-
idant activity is mainly due to the formation of insoluble
component which cannot be detected using the conven-
tional extraction-dependent protocols. On the other hand, it
was surprising that the three oils with different content in
phenolic compounds did not confer different value of
antioxidant activity in the final product.
The correlation between colour development and
acrylamide formation has been largely reported [22, 55,
56]. The correlation between colour and acrylamide for-
mation in our system, particularly in the case of
thermoxidised oil, suggested that the action of phenolic
compounds in this system is not specifically on acrylamide
pathway, but on the overall formation of carbonyl com-
pounds both from MR or lipid oxidation. In fact, the strong
browning development and the huge formation of HMF
using thermoxidised oil may be attributed to the formation
of coloured products during the advanced stages of the
lipid oxidation such as low molecular weight monomers
like 4,5-epoxy-2-alkenals or 4-hydroxyalkenals [57]. These
carbonyl compounds promote acrylamide formation and
consequently, change the surface browning.
Conclusion
The presence of virgin oil phenolic compounds in the
formulation of the dough significantly affects the acryl-
amide formation in a cookie model system. Reduction up
to 20% could be achieved at moderate baking conditions
(190 C). Mechanism of action is not fully understood,
however, antioxidants might minimise the extent of the
reactions mediated by carbonyl compounds derived by
lipids, as recently observed also in a fats-rich cocoa model
system [58]. Our investigation also supports the hypothesis
that secondary lipid oxidation products actively partici-
pated in the formation of acrylamide in fat-rich foods. Our
working hypothesis and a future research requirements in
this field is that phenolic compounds, thanks to their
intermediate polarity, are positioned at the interface
between lipid and hydrophilic environment. They could act
on one by side blocking the radical-mediated degradation
of sugars and on the other by delaying the formation of
lipid oxidation products. In both cases, the outcome is the
reduction of the reactants available for acrylamide forma-
tion. Lipids have been traditionally omitted from the
schemes of acrylamide formation in foods, but this research
suggested that in a cookie model, the oil characteristics can
significantly affect the final concentration of acrylamide.
Acknowledgments Assunta Siani and Edoardo Capuano are
thanked for the VOO sampling and technical assistance. This work
was carried out in the framework of COST 927-Thermally processed
foods: possible health implication. Research has been partly fund by
Consejeria Educacio n y Ciencia (CAM) under project (ANALISYC
Program, S-505/AGR-0312) and Comunidad de Madrid (PhD grant
Gema Arribas-Lorenzo).
References
1. LoPachin RM, Lehning EJ (1994) Neurotox 15:247–260
2. Friedman MA, Dulak LH, Stedham AM (1995) Fund Appl
Toxicol 27:95–105
3. Segerback D, Callemann J, Schroeder JL, Costa LG, Faustman
EM (1995) Carcinogenesis 16:1161–1165
4. RC IA (1994) Acrylamide. International Agency for Research on
Cancer, Lyon, France
5. Tareke E, Rydberg P, Karlsson P, Eriksson S, Tornqvist M (2002)
J Agric Food Chem 50:4998–5006
6. WHO/JECFA (2005) 64th meeting, Rome, 7–17 Feb 2005.
http://www.who.int/ipcs/food/jecfa/summaries/en/summary_
report_64_final.pdf
7. Boon PE, Mul A, van der Voet H, van Donkersgoed G, Brette M,
van Klaveren JD (2005) Mutat Res Genet Toxicol Environ
Mutagenesis 580:143–155
8. Becalski A, Lau BPY, Lewis D, Seaman SW (2003) J Agric Food
Chem 51:802–808
9. Yaylayan VA, Wnorowski A, Perez-Locas C (2003) J Agric Food
Chem 51:1753–1757
10. Gertz C, Klostermann S (2002) Eur J Lipid Sci Technol 104:762–
771
11. Umano K, Shibamoto T (1987) J Agric Food Chem 35:909–912
123
72 Eur Food Res Technol (2009) 229:63–72
12. CIAA (2007) Confederation of the Food and Drink Industries in
the UE. The CIAA acrylamide ‘‘Toolbox’’. Rev. 11, December,
2007. http://www.ciaa.be/documents/brochures/toolbox%20rev11
%nov%202007final.pdf
13. Morales F, Capuano E, Fogliano V (2008) Ann N Y Acad Sci
1126:89–100
14. Claus A, Carle R, Schieber A (2008) J Cereal Sci 47:118–133
15. Friedman M, Levin CE (2008) J Agric Food Chem 56:6113–6140
16. Tareke E. (2003) PhD thesis, Department of Environmental
Chemistry, Stockholm University, Sweden
17. Vattem DA, Shetty K (2003) Innov Food Sci Emerg Technol
4:331–338
18. Rydberg P, Eriksson S, Tareke E, Karlsson P, Ehrenberg L,
Tornqvist M (2003) J Agric Food Chem 51:7012–7018
19. Zamora R, Hidalgo F (2008) J Agric Food Chem 56:6075–6080
20. Mestdagh F, De Meulenaer B, Van Peteghem C (2007) Food
Chem 100:1153–1159
21. Hedegaard RV, Granby K, Franden H, Thygesen J, Leif HS
(2008) Eur Food Res Technol 227:519–525
22. Go kmen V, Acar OC, Koksel H, Acar J (2007) Food Chem
104:1136–1142
23. Summa C, Wenzl T, Brohee M, De la Calle B, Anklam E (2006) J
Agric Food Chem 54:853–859
24. Napolitano A, Morales F, Sacchi R, Fogliano V (2008) J Agric
Food Chem 56:2034–2040
25. Visioli F, Galli C (1998) J Agric Food Chem 46:4292–4296
26. Persson E, Graziani G, Ferracane R, Fogliano V, Skog K (2003)
Food Chem Toxicol 41:1587–1597
27. AOAC Official Methods of Analysis (1980) 13th edn, Associa-
tion of Official Analytical Chemists, Washington, DC, pp 440–
441
28. Fee JA, Teitelbaum HD (1972) Biochem Biophys Res Commun
49:150–153
29. Cortesi N, Ponziani A, Fedeli E (1981) Rivista-Italiana-delle-
Sostanze-Grasse 58:108–114
30. Singleton VL, Rossi A (1965) Am J Enol Vitic 16:144–158
31. Psomiadou E, Tsimidou M, Boskou D (2000) J Agric Food Chem
48:1770–1775
32. Monti SM, Ritieni A, Sacchi R, Skog K, Borgen E, Fogliano V
(2001) J Agric Food Chem 49:3969–3975
33. Rufian-Henares JA, Arribas-Lorenzo G, Morales FJ (2007) Food
Addit Contam 24:343–350
34. Morales FJ, Arribas-Lorenzo G (2008) Food Chem 109:421–425
35. Garcıa-Villanova B, Guerra-Hernandez E, Martinez-Go mez E,
Montilla J (1993) J Agric Food Chem 41:1254–1255
36. Serpen A, Go kmen V, Pellegrini N, Fogliano V (2008) J Cer Sci
48:816–820
37. Association of Official Analytical Chemists AOAC (1995) Offi-
cial methods of the association of official analytical chemists,
16th edn. Washington, DC
38. CIE Colorimetric Committee (1974) Technical notes: working
program on colour differences. J Op Soc Am 64:896–897
39. Francis FJ, Clydesdale FH (1975) Food colorimetry theory and
applications. AVI Publishing, Wesport, CT, pp 131–224
40. Go kmen V, Acar OC, Arribas-Lorenzo G, Morales FJ (2008) J
Food Eng 87:380–385
41. Taeymans J, Wood P, Ashby I, Blank A, Studer RH, Stadler P,
Gonde P, Van Eijck S, Lalljie H, Lingnert M, Lindblom R,
Matissek D, Mu ller D, Tallmadge J, O’Brien S, Thompson D,
Whitmore T (2004) Crit Rev Food Sci Nutr 44:323–347
42. AOCS (1998) In: Firestone D (ed) Method Cd 8–53. Official
methods and recommended practices of the American Oil
Chemists’ Society, 5th edn. American Oil Chemists’ Society,
Champaign, IL
43. Zamora R, Hidalgo FJ (2005) Crit Rev Food Sci Nutr 45:49–59
44. Ehling S, Hengel M, Shibamoto T (2005) In: Friedman M,
Mottram DS (eds) Chemistry and safety of acrylamide in food.
Springer, New York, pp 223–233
45. Yuan Y, Zhao G-H, Hu X-S, Wu J-H, Liu J, Chen F (2008) Eur
Food Res Technol 226:1301–1307
46. Frankel EN, Huang S-H, Aeschbach R, Prior E (1996) J Agric
Food Chem 44:131–135
47. Frenkel EN (2005) Lipid oxidation, 2nd edn, Chap 4. The Oily
Press, Bridgwater
48. Gertz C (2004) Eur J Lipid Sci Technol 106:736–745
49. Nawar WW (1998) Grasas y Aceites 49:271–274
50. Ait-Ameur L, Rega B, Giampaoli P, Trystram G, Birlouez-Ara-
gon I (2008) Food Chem 111:758–763
51. Hidalgo FJ, Zamora R (2004) J Agric Food Chem 52:7126–7131
52. Gertz C, Klostermann S, Kochhar SP (2003) Oleagineux Corps
Gras Lipides 10:297–303
53. Mestdagh M, Castelein P, Van Peteghem C, De Meulenaer B
(2008) J Agric Food Chem 65:6141–6144
54. Nicoli MC, Anese M, Parpinel M (1999) Trends Food Sci
Technol 10:94–100
55. Mustafa A, Andersson R, Rosen H, Kamal-Eldin A, Aman P
(2005) J Agric Food Chem 53:5985–5989
56. Surdyk N, Rosen J, Andersson R, Aman P (2004) J Agric Food
Chem 52:2047–2051
57. Hidalgo FJ, Zamora R (2000) Grasas y Aceites 51:35–49
58. Oliviero T, Capuano E, Cammerer B, Fogliano V (2009) J Agric
Food Chem 57:147–152
2966 J. Agric. Food Chem. 2010, 58, 2966–2972
DOI:10.1021/jf902815p
Analysis, Distribution, and Dietary Exposure of Glyoxal and
Methylglyoxal in Cookies and Their Relationship with Other Heat-Induced Contaminants
GEMA ARRIBAS-LORENZO AND FRANCISCO J. MORALES*
Consejo Superior de Investigaciones Cientıficas, Instituto del Frıo-ICTAN, Jose Antonio Novais 10,
28040 Madrid, Spain
Thermal processing of food leads to the formation of dicarbonyls such as glyoxal (GO) and
methylglyoxal (MGO), which are potentially harmful because they are precursors of advanced
glycation end products (AGEs). GO and MGO formation was examined during the baking process of
cookies as cookies are a widely distributed food commodity in Western diets. GO and MGO were
chromatographically analyzed after employment of an improved method of derivatization with
orthophenylenediamine to produce stable quinoxaline derivatives. Sample extraction, cleanup,
and chromatographic conditions were evaluated to provide an in-house validated procedure for
GO and MGO analysis in cookies. Quantification limits were set at 1.5 and 2 mg/kg for GO and
MGO, respectively, with an average recovery of 103% and a calculated precision lower than 7%.
Studies were carried out both on laboratory-scale cookies under controlled conditions and on
commercial samples as well. GO and MGO values in commercial cookies ranged from 4.8 to
26.0 mg/kg and from 3.7 to 81.4 mg/kg, respectively. Commercial cookies made from ammonium
bicarbonate and fructose showed the highest levels of MGO. Dicarbonyls were rapidly formed on the
upper side of the cookie regardless of the shape or thickness of the samples, confirming there was a
surface effect. Under controlled baking conditions, the formations of GO and MGO were linearly
correlated with baking time. MGO formation was related with acrylamide, a heat-processing
contaminant, in commercial cookies, but this relationship was not observed for 5-hydroxymethyl-
furfural. Dietary exposure of the Spanish population to GO and MGO from cookies was estimated to
be 213 and 216 μg/person/day, respectively.
KEYWORDS: Glyoxal; methylglyoxal; cookies; acrylamide; hydroxymethylfurfural
INTRODUCTION
Since the last century, R-dicarbonyl research has become an
interesting field in both food chemistry and medical science,
mainly due to the implications of R-dicarbonyls in public
health (1 -3 ). Glyoxal (GO) and methylglyoxal (MGO) have
been given special attention because they are reactive intermedi-
ates formed by heat processing such as roasting, frying, and
baking, as well as by food storage. R-Dicarbonyls are not only
known to be important precursors of color and aroma substances
but also lead to protein modifications with nutritional conse-
quences. In vivo, dicarbonyls react irreversibly with proteins,
forming advanced products analogous to those found in none-
nzymatically glycosylated proteins, which are characteristic in
aging, atherosclerosis, and diabetic and uremic subjects (4 ). Their
presence suggests potential health risk issues related to mutageni-
city and carcinogenity (5 , 6 ), with GO causing DNA lesions (7 )
both in vitro and in vivo studies. MGO inhibits protein, DNA,
and RNA synthesis in villus and crypt cells as well as in colono-
cytes, which are associated with genotoxicity in experimental
*Corresponding author (telephone þ34 91 549 2300; fax þ34 91 549 36 27; e-mail [email protected]).
animals (6 ). However, information about the effects on humans is
limited and basically related to allergic reactions (8 , 9 ). The
potential pathophysiological role of GO and MGO is therefore
under investigation in the biomedical area due to the toxicity of
these compounds (10).
In food, R-dicarbonyls are formed by the reaction of amino
groups in proteins with reducing sugars (Maillard reaction), by
the degradation of sugars during caramelization, and by lipid
peroxidation, apart from there being an enzymatic origin in
fermented foods (11-13 ). These toxic carbonyl species have been
found in several foods such as honey, with levels in the ranges of
0.2-2.7 and 0.4-5.4 mg/kg for GO and MGO, respectively (14),
and in fermented products such as wine (up to 1556 μg/L) (15 ) and
beer (230-1000 μg/L) (16), where they are enzymatically formed.
In addition, they have been detected in a variety of fermented
products, edible oils (up to 6.5 mg/kg for sardine oil) (17), and
bakery products such as bread or toast containing amounts of 0.3
and 0.79 mg/kg for GO and MGO, respectively (18).
Various chromatographic methods have been extensively des-
cribed in the scientific literature for measuring GO and MGO, espe-
cially high-performance liquid chromatography (HPLC)-based
procedures, capillary electrophoresis, and gas chromatography.
pubs.acs.org/JAFC Published on Web 02/04/2010 © 2010 American Chemical Society
2967 J. Agric. Food Chem., Vol. 58, No. 5, 2010 Arribas-Lorenzo and Morales
Derivatization of R-oxoaldehydes with diamino derivates of
benzene such as o-phenylenediamine (OPD) and conversion into
corresponding quinoxaline derivates with UV detection has been
reported as allowing a more specific estimation of these com-
pounds, especially if used in conjunction with HPLC (19, 20 ).
A number of studies have reported the formation of R-
dicarbonyls resulting from carbohydrate and amino acid reaction
during thermal treatment of foods, conditions that also favor
acrylamide (AA) and 5-hydroxymethylfurfural (HMF) forma-
tion. AA and HMF have been defined as heat-induced processing
contaminants potentially harmful to humans (21, 22). Further
studies on GO and MGO formation pathways are necessary
because they may provide new information about the dynamics of
these toxicants in food and, subsequently, potential mitigation
strategies. Until now, knowledge of these reactive dicarbonyls in
cookies, as well as their connection with acrylamide formation,
has been limited, despite evidence indicating the important role
they play in acrylamide genesis (23). Furthermore, GO and MGO
levels in cookies have been poorly described so far.
These observations have stimulated our interest in investigat-
ing reactive dicarbonyl formation with respect to the formation of
new processing contaminants. With this in mind, an in-house
validated HPLC-UV method for the determination of GO and
MGO in cookies has been developed. Additionally, their relation-
ship with AA and HMF was also studied to get further insight
into their formation dynamics and finally an estimation of
exposure from cookies to these dicarbonyls.
MATERIALS AND METHODS
Chemicals. HPLC grade methanol was purchased from LabScan
(Dublin, Ireland). Acrylamide (99%), 5-hydroxymethylfurfural, GO and
MGO solutions (40% in water w/v), OPD, quinoxaline (Q), 2-methylqui-
noxaline (2-MQ), and 5-methylquinoxaline (5-MQ) were supplied by
Sigma (St. Louis, MO). Sodium dihydrogen phosphate monohydrate
and glacial acetic acid as well as formic acid were acquired from Merck
(Darmstadt, Germany). The following materials were also used: ultrapure
water (Milli-Q system, Millipore Bedford, MA), Oasis-HLB cartridges (30
mg, 1 mL) and Oasis-MCX (30 mg, 1 mL) supplied by Waters (Milford,
MA), Strata-X-C (30 mg, 1 mL) obtained from Phenomenex (Torrance,
CA), and (13C3)-acrylamide (isotopic purity = 99%) from Cambridge
Isotope Laboratories (Andover, MA). All other chemicals and reagents
were of analytical grade.
Cookie Samples. Twenty-six commercial cookies were purchased
from Spanish markets. To study the effect of the baking process on the
dicarbonyls, laboratory-scale experiments were carried out with model
cookies. The recipe was prepared according to that of Arribas-Lorenzo et
al. (24 ) with some minor modifications: 85 g of wheat flour, 1 g of salt, 25 g
of deionized water, 24 g of sunflower oil, 1.2 g of sodium bicarbonate, and
35 g of sugar. The dough was rolled to form disks with a diameter of 5 cm
and a thickness of 2 mm and baked at 190 C from 9 to 17 min. Samples
were prepared in two parallel series and baked in an oven without forced
air circulation (UNE 400, Memmert GmbH, Schwabach, Germany).
Temperature was digitally controlled and monitored by software
(Celsius 2007 v8.0, Memmert GmbH). All samples were finely ground
and kept at 4 C until analyses.
Determination of GO and MGO in Cookies. Samples of 0.5 ( 0.01
g were weighed into centrifuge tubes, and 5 mL of a mixture containing
20 mM sodium phosphate buffer (pH 7.4) and methanol (50:50, v/v) was
added. The cookies were spiked with certain amounts of 5-MQ (internal
standard). Samples were vigorously shaken for 1 min and centrifuged
(5000g for 10 min) at 4 C. A 200 μL aliquot of supernatant was mixed with
375 μL of sodium phosphate buffer and 200 μL of OPD (10 mM) and
incubated for 3 h at 65-70 C in an oven (model 235, J. P. Selecta,
Barcelona, Spain). After cooling, 200 μL of acetic acid was added to the
derivatized mixture. The sample was then loaded onto the solid phase
extraction (SPE) column (Oasis-HLB) (the SPE step had previously been
optimized, see Results and Discussion), and eluent was discharged. Next,
1 mL of a mixture of methanol/0.5% acetic acid (40:60, v/v) and eluent was
discharged. Finally, 1 mL of methanol was passed through the cartridge
and the eluent collected in an Amberlite vial. The analysis was carried out
at least in duplicate.
Analytical HPLC-UV Procedure for Quantification of GO and
MGO. GO and MGO were measured as the corresponding quinoxalines
Q and 2-MQ, respectively, after derivatization with OPD using a reverse-
phase high-performance liquid chromatography (RP-HPLC) procedure
coupled to UV detection at 315 nm. A Shimadzu LC system (Kyoto,
Japan) equipped with an LC-20AD pump, an LC-20AD/AT low-pressure
gradient former, an SIL-10ADvp autosampler, a CTO-10AS VP oven,
and a DAD detector (SPD-M20A) was used. Separations were carried out
on an ACE C18 column (5 μm, 250 4.6 mm, Advanced Chromatography
Technologies, Aberdeen, U.K.). Elution was performed isocratically with
a mixture of 0.5% (v/v) acetic acid in water and methanol (40:60, v/v) with
a detection of 315 nm, although UV spectra were recorded in the 190-340
nm range. Quantification was based on the peak area of each compound
divided by the peak area of the internal standard in samples versus those
found in the calibration standard. Standard stock solutions of Q and 2-
MQ were prepared in deionized water to a concentration of 4 mg/mL. The
solution was stored in the dark at 4 C and used within 2 weeks. The
standard working solution was obtained by subsequent dilution of the
above-mentioned standard stock solutions with 0.5% (v/v) acetic acid in
water and methanol (40:60, v/v) to yield concentrations of 0.01, 0.04, 0.08,
0.12, 0.16, 0.2, 0.4, 0.6, and 0.8 μg/mL.
Acrylamide Analysis. AA analysis was carried out by HPLC-MS
according to the method of Arribas-Lorenzo et al. (24).
HMF Analysis. HMF determination was performed by reversed-
phase HPLC according to the method of Rufian-Henares et al. (25).
Food Consumption Data. An exposure study was carried out by the
Spanish Ministry of Agriculture, Fishing and Food based on a yearly food
consumption database (26 ). The statistical universe of the study compiles a
balanced, representative, and stratified probability sample of the Spanish
population taking into account, gender, age, region, and socioeconomic
status, among other factors. An average body weight of 70 kg was used to
estimate the total daily intake of GO and MGO to total population
expressed as micrograms per kilogram of body weight per day.
Statistical Analysis. Data are expressed as the mean of two or more
independent determinations. Differences with P < 0.05 were considered to
be statistically significant using the Tukey test. A Microcal Origin program
version 7.5 (Origin Lab Corp., Northampton, MA) was used.
RESULTS AND DISCUSSION
Derivatization. The derivatization procedure was based on a
previous work (20 ) but with some modifications to accommodate
the cookie samples. In a first step, standard solutions of target
dicarbonyl compounds (GO and MGO) were used to verify the
derivatization process. These standards were prepared at the
same concentrations as the standard solutions of their respective
quinoxalines (Q and 2-MQ), spiked with 5-MQ, and derivatized
and quantified by HPLC-UV. OPD was used to derivatize GO
and MGO into stable quinoxaline and 2-methylquinoxaline,
respectively, and its concentration was similar to that reported
on previous occasions (27). The reaction yield was determined by
comparing the calibration curve data of GO versus Q and MGO
versus 2-MQ with no significant differences being found (P <
0.05). Results showed that both curves were similar in the
concentration range studied from 0.01 to 0.8 μg/mL.
Liquid Chromatography Separation. The separation of Q, 2-
MQ, and 5-MQ (internal standard) was optimized by testing two
analytical columns (Kromasil ODS-2, 5 μm, 250 mm 4.0 mm,
and ACE C18, 5 μm, 250 4.6 mm). The ACE column produced
better resolution and appearance of peak shapes despite having a
longer retention time for GO and MGO (data not shown). The
influence of the solvent was also investigated by comparing
methanol and acetonitrile in combination with a water solution
of acetic acid (0.5%) under isocratic conditions at different
percentages. The best separation was obtained with 60% metha-
nol and 40% water acidified with 0.5% acetic acid and a flow of
Article J. Agric. Food Chem., Vol. 58, No. 5, 2010 2968
Figure 1. Chromatograms of quinoxaline derivatives of glyoxal (GO) and methylglyoxal (MGO) and internal standard of 5-methylquinoxaline (5-MQ) detected
at 315 nm: standard solutions (a); cookie sample before cleanup step (b); cookie sample after cleanup step (c).
0.8 mL/min. Figure 1a shows a chromatogram of Q and 2-MQ
standard solutions at a concentration of 0.8 μg/mL each, along
with 2.78 μg/mL of the internal standard 5-MQ under the
described optimum conditions. Retention times were 5.1, 6.1,
and 8.4 min for Q, 2-MQ, and 5-MQ, respectively.
Optimization of the Extraction Conditions. The effect of the
sample amount in the extraction step was evaluated at two
sample/extraction solvent ratios of 1:5 and 1:10 (g/mL). Metha-
nol was chosen as an efficient solvent to extract these carbonyl
compounds as indicated in previous studies (13). The study was
assayed in spiked cookie samples with a known amount of GO
and MGO to evaluate the yield. At the same time, the effect of
different percentages of mixture solvents (30 and 50%, v/v;
methanol in sodium phosphate buffer (pH 7.4)) was also studied.
Extraction efficiency improved with a sample/extraction ratio of
1:10 (g/mL) and 50% (v/v) methanol (data not shown). There-
fore, dicarbonyl extraction from cookie samples was carried out
under these conditions.
Analytes were poorly resolved when the former procedure was
directly applied to cookies as shown in Figure 1b. To eliminate
interferences and to obtain a cleaner chromatogram and conse-
quently increased sensitivity, the SPE procedure was carried out
as a cleanup step. This purification step had previously been
employed for both biological and food samples (28 , 29). Three
different SPE cartridges were tested (Oasis-HLB, Oasis-MCX,
Strata-X-C). These cartridges were evaluated under conditions
recommended by each respective supplier using as an internal
reference both an unspiked cookie sample and one spiked with Q
and 2-MQ. In addition, standard solutions of Q, 2-MQ, and 5-
MQ with increasing percentages of methanol (0, 20, 40, 60, 80,
and 100%) in acetic acid (0.5%) were also evaluated. Recovery,
retention time, separation at baseline, and cleanness of the
chromatogram profile were likewise assessed. Q, 2-MQ, and 5-
MQ standards were effectively retained by the three cartridges,
each reporting similar recoveries. However, differences in the
chromatographic profile were observed when a cookie sample
was used. The Oasis-HLB cartridge provided the best chromato-
graphic separation and resolution for cookies with no interfer-
ences when the extract was finally eluted with 100% methanol.
Panels b and c of Figure 1 show the chromatograms obtained for a
cookie sample before and after the cleanup step. Recovery in the
cleanup step was also studied using GO and MGO standard
Table 1. Calibration Data (Correlation Coefficient, r, and Regression Equa-
tion), Limits of Detection (LOD), and Limits of Quantification (LOQ) for
Analysis of Dicarbonyl Compounds in Cookiesa
calibration data
compound r equation LOD (μg/mL) LOQ (μg/mL) glyoxal 0.999 330.67x þ 3.76 0.01 0.03
methylglyoxal 0.997 367.72x þ 0.76 0.02
0.04
a Concentration range applied from 0.01 to 0.8 μg/mL.
solutions to which the internal standard had been added before
derivatization with OPD, followed by RP-HPLC analysis before
being finally passed through the cartridges. Recovery by the SPE
was checked by comparing the ratio area peaks of Q or 2-MQ/ 5-
MQ obtained by analyzing directly the derivatized compounds
prior to SPE with the same standard solutions derivatized after
SPE. The recovery average obtained ranged from 90 to 106%.
Although the dicarbonyls studied can be separated with good
resolution within 9 min, it was necessary to increase the elution time
to allow for the elution of other peaks that could interfere in the next
injection. Chromatographic separation of dicarbonyls in cookies is
complex due to the likely presence of other compounds, apart from
GO and MGO, such as deoxyosones (i.e., 3-deoxyglucosone), but
they are not the subject of the present investigation.
Method Validation. Linearity. The linearity of the chromato-
graphic method was calculated using Q and 2-MQ standard
solutions ranging from 0.01 to 0.8 μg/mL and with the internal
standard at 2.78 μg/mL. The response of both compounds was
satisfactory with correlation coefficients >0.997. Appropriate
dilution was applied to sample extracts >0.8 μg/mL. Table 1
summarizes the calibration data for GO and MGO.
Repeatability and Reproducibility. The repeatability and
reproducibility were determined by replicate analyses of a cookie
sample. The precision values are presented in Table 2 as well as the
concentrations of GO and MGO in the sample. The assay was
performed using relative standard deviation (RSD, %) and
calculated by analyzing five replicates over a period of 3 days.
The results obtained for both dicarbonyls showed RSD of <7%,
indicating that the precision of the method was satisfactory.
Recovery. Table 3 gives the recovery results obtained for GO
and MGO. Accuracy was determined by measuring the percen-
tage of recovery after spiking a cookie sample with three different
2969 J. Agric. Food Chem., Vol. 58, No. 5, 2010 Arribas-Lorenzo and Morales
Table 2. Repeatability and Reproducibility Values of the HPLC-UV Procedure
for Analysis of Glyoxal and Methylglyoxal in Cookiesa
mean (mg/kg) ( SD
Table 4. Ingredients of Commercial Cookiesa
cookie sugars cereal NH4HCO3
1 sucrose, syrup W RSD (%) RSD (%) 2 sucrose, glucose syrup O yes
compound day 1 day 2 day 3 repeatability reproducibility
glyoxal 15.4 ( 0.9 16.5 ( 0.8 16.7 ( 1.1 5.8 4.3
methylglyoxal 51.8 ( 3.1 55.7 ( 2.8 58.3 ( 4.8 6.4 5.9
a The assay was carried out on three different days with five replicates each. SD, standard deviation; RSD, relative standard deviation.
Table 3. Recovery (Mean ( RSD) of the Dicarbonyls from a Cookie Sample
at Different Spiking Levels (n = 5)
recovery (%) at spiking level of
compound 0.08 μg/mL 0.4 μg/mL 0.8 μg/mL
glyoxal 102 ( 7 107 ( 3 114 ( 2
methylglyoxal 99 ( 2 97 ( 4 103
( 4
levels of GO and MGO standard solutions and 25 μL of the
internal standard prior to the derivatization process. The recovery
obtained for both compounds ranged from 97 to 114% with
RSDs of <8% at different spiking levels.
Limits of Detection (LOD) and Quantification (LOQ). The
LOD and LOQ were determined by calculating the standard
deviation of the area divided by the slope and multiplying by 3.33
and 10, respectively. Table 1 summarizes the LOD and LOQ
obtained, although lower detection limits could easily be achieved
if needed by applying a preconcentration step after cleanup.
Application to Commercial Cookies. The in-house validated
method was applied in the analysis of 26 commercial cookies
taken randomly from different local markets in Madrid (Spain) to
obtain information on the distribution of these dicarbonyls and
then to estimate population exposure to them. As cookies
comprise a heterogeneous food commodity group because they
are composed of a great variety of ingredients (Table 4), tradi-
tional sweets, breakfast, and dietetic cookies were also included in
this study. Table 5 summarizes the results obtained from the
samples. GO content ranged from 4.8 to 26.0 mg/kg with a mean
value of 15.0 mg/kg and a median of 16.4 mg/kg. MGO content
ranged from 3.7 to 81.4 mg/kg with a mean value of 29.9 mg/kg
and a median of 16.6 mg/kg.
So far, numerous studies have found these dicarbonyls in
foodstuffs such as beer, honey, butter, wine, and fermented foods,
products in which these compounds were most frequently de-
tected. However, published data on bakery products is scarce, so
a systematic study is necessary before any risk assessment can be
carried out. GO and MGO were detected at concentrations of 0.3
and 0.79 mg/kg, respectively, in bread, and in the case of toast the
amounts reported were 0.5 and 2.5 mg/kg for GO and MGO (18).
Roiter and Borovikova (30) also showed that bread crust and
bread crumbs contained GO at concentrations of up to 1.6 mg/kg.
However, no studies have been found on the detection of these
dicarbonyls in cookies. The GO and MGO levels in cookies found
in our work were about 10-fold higher than those obtained for
bakery products and could result from differences in the for-
mulation and processing of the cookies and bread. In general,
cookie formulation is more complex and contains ingredients
such as reducing sugars and probably unsaturated oils, which are
precursors of these dicarbonyls through the Maillard reaction,
caramelization, or lipid oxidation. It is known that MGO is
formed by retroaldolization of the intermediate 3-deoxyglucosu-
lose (31) and that GO is mainly a product of autoxidation of
glucose (32). In comparison, bread derivates are mainly made up
3 sucrose, glucose syrup W
4 sucrose, glucose syrup W
5 fructose W, R, Z, Y yes
6 sugar, honey W
7 sucrose W
8 sucrose, glucose W, R
9 sucrose, glucose syrup, caramel W
10 sucrose, glucose, fructose syrup W
11 sucrose, glucose syrup W
12 sucrose, glucose, fructose syrup W
13 fructose W yes
14 sucrose, glucose syrup W
15 fructose W yes
16 maltitol, lactitol, caramel W
17 sucrose, glucose syrup W, R, M
18 sucrose, glucose, fructose syrup W, O
19 sucrose, glucose, fructose syrup, honey W, O, Y
20 sucrose, glucose, fructose syrup, honey W, O
21 fructose W yes
22 fructose W, O yes
23 fructose W
24 fructose W, R, Z, Y yes
25 sucrose, glucose syrup W
26 sucrose, glucose syrup, honey W
a Wheat (W), oat (O), maize (Z), rice (R), malt (M), and rye (Y).
Table 5. Occurrence of Glyoxal and Methylglyoxal in Commercial Cookies
glyoxal ( mg/kg) methylglyoxal
(mg/kg) mean 15.0 29.9
standard deviation 5.2 25.9
minimum 4.8 3.7
25th percentile 11.4 12.1
median 16.4 16.6
75th percentile 18.7 46.6
95th percentile 26.0 81.4
maximum 20.5 78.0
of wheat flour, baking powder, salt, and water, so dicarbonyl
levels would be expected to be lower.
By a closer scrutinization of the data it can be seen that seven
cookie samples showed higher values in comparison with the rest,
all of them with MGO values above 52.2 mg/kg and up to 81.4
mg/kg. It was observed that cookies containing ammonium
bicarbonate and fructose as ingredients (Table 4) formed more
MGO, thus confirming that ammonium bicarbonate and fructose
facilitate the generation of these dicarbonyl compounds (23 ).
To estimate the dietary exposure of Spanish consumers to
dicarbonyls from cookies, the national tables of food consump-
tion for 2008 were used (26). Although the point estimate (deter-
ministic approach) does not assess the probability or uncertainty
or even identify high-risk consumers, because it is based on
population and not on subjects, it is nevertheless a first approxi-
mation and a useful screening tool for designing a more specific
study should there be a potential risk. Overall population ex-
posures to dicarbonyls from cookies were estimated to be 213 and
216 μg/person/day for GO and MGO, respectively.
Mapping of Dicarbonyl Distribution in Commercial Cookies.
Six independent samples with different shapes, thicknesses, and
apparently different baking technologies according to their
brownness (visual appreciation) were chosen to get a broad view
of the distribution of GO and MGO in different zones of the
Article J. Agric. Food Chem., Vol. 58, No. 5, 2010 2970
Figure 2. Influence of baking time (min) on formation of glyoxal (GO) and
methylglyoxal (MGO) in cookies prepared at laboratory scale at 190 C.
cookie. Representative portions of the upper side (US), lower side
(LS), center side (CS), and border side (BS) of the sample
cookie were obtained to map the contribution of each frac-
tion to that of the whole cookie. On average, GO and MGO
formations were significantly higher in US and BS portions as
expected, regardless of the shape or thickness of the cookie,
because water evaporation and temperature are higher in these
parts of the cookie, subsequently enhancing both caramelization
and the Maillard reaction. Furthermore, considerable variability
was observed due to sample heterogeneity because there could be
up to a 3-fold difference in GO content between the upper and
lower sides in some samples. These results clearly showed that GO
and MGO contents in cookies were not uniformly distributed.
Effect of Processing Conditions. The influence of baking con-
ditions on GO and MGO in cookies baked at 190 C for 9, 11, 13,
15, and 17 min was investigated. As shown in Figure 2, amounts of
both GO and MGO increased linearly with time, reaching up to
16.1 and 15.3 mg/kg for GO and MGO, respectively. Values were
higher for GO than for MGO, probably due to its formation by
sugar oxidation during the heating process, unlike MGO which is
enhanced by the Maillard reaction (32 ). In general, levels were
found to be lower than those detected in commercial samples,
possibly due not only to the different baking processes but also
again to the type of sugar used in the formulation be it syrup,
inverted sugar, or honey. Cookies were prepared in the laboratory
with sucrose as the only sugar ingredient because earlier experi-
ments had demonstrated that the use of a nonreducing sugar such
as sucrose formed less dicarbonyls than it would if used in
conjunction with glucose or fructose (23 ). Apart from the fore-
going, these reactive compounds can undergo multiple reactions
and form other compounds such as melanoidins at more ad-
vanced stages of the reaction (see, e.g., ref 33 ). Nevertheless,
despite the small amounts detected, it was clear that the baking
process markedly accelerated the formation of these compounds,
confirming previous data such as that of Daglia et al. (29), who
demonstrated that the content of R-dicarbonyl compounds was
influenced by the roasting process of coffee. Moreover, it was
observed that dicarbonyls had already been detected in dough
before fermentation, indicating that the dough fermentation
process may have started when the baking agent was added
because it has been reported that both dicarbonyls are formed in
fermented food (13 ).
Figure 3. Relationship between dicarbonyls and acrylamide (a) and HMF
(b) levels in cookies baked at 190 C for different times. AA, acrylamide;
GO, glyoxal; MGO, methylglyoxal.
Relationship with Acrylamide and HMF. Acrylamide has been
identified by many as a heat-induced toxicant in foodstuffs,
formed by the reaction between a reducing sugar and asparagine
in the Maillard reaction (34, 35 ). Its formation is greatly facilitated
by high temperatures (above 120 C) in processes such as frying,
baking, or roasting (36 ). To date, several studies have demon-
strated the role of R-dicarbonyl compounds in the formation of
acrylamide following the Strecker degradation pathway (23 , 34 ).
Recently, Yuan et al. (37 ) showed clearly that MGO is the reaction
precursor of acrylamide and accounts for nearly 80% of its
formation in aqueous Maillard reaction models (Glc/Asn).
In our study, former correlation with model systems was also
demonstrated in cookies prepared at laboratory scale and in
commercial samples as well. Figure 3a shows acrylamide content
and dicarbonyl levels of cookies at laboratory scale at different
baking times. The yield of acrylamide and dicarbonyls was
positively correlated during baking under controlled conditions.
These results for cookies are also in line with the literature, in
which it has been reported that these reactive intermediates of the
Maillard reaction interact with asparagine, forming acrylamide in
model systems (34). As described in model systems (37 ), forma-
tion of dicarbonyls, as precursors of AA, accumulates during the
first stages of baking until AA formation is observed.
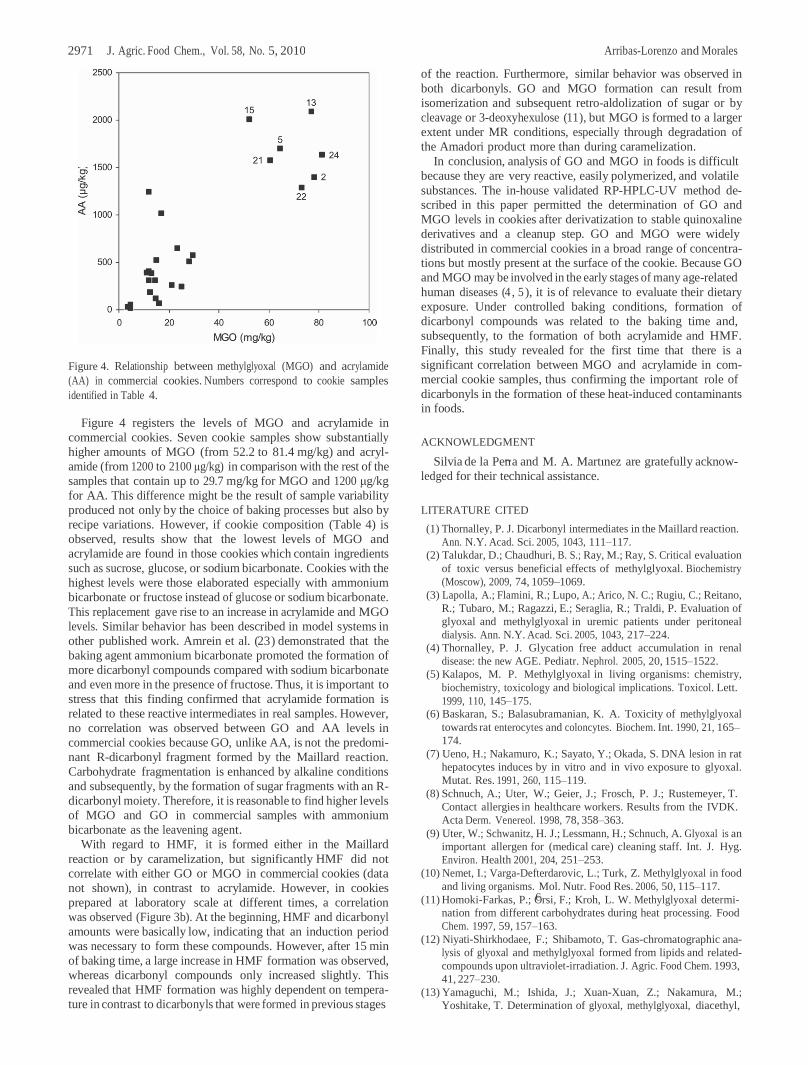
2971 J. Agric. Food Chem., Vol. 58, No. 5, 2010 Arribas-Lorenzo and Morales
Figure 4. Relationship between methylglyoxal (MGO) and acrylamide
(AA) in commercial cookies. Numbers correspond to cookie samples
identified in Table 4.
Figure 4 registers the levels of MGO and acrylamide in
commercial cookies. Seven cookie samples show substantially
higher amounts of MGO (from 52.2 to 81.4 mg/kg) and acryl-
amide (from 1200 to 2100 μg/kg) in comparison with the rest of the
samples that contain up to 29.7 mg/kg for MGO and 1200 μg/kg
for AA. This difference might be the result of sample variability
produced not only by the choice of baking processes but also by
recipe variations. However, if cookie composition (Table 4) is
observed, results show that the lowest levels of MGO and
acrylamide are found in those cookies which contain ingredients
such as sucrose, glucose, or sodium bicarbonate. Cookies with the
highest levels were those elaborated especially with ammonium
bicarbonate or fructose instead of glucose or sodium bicarbonate.
This replacement gave rise to an increase in acrylamide and MGO
levels. Similar behavior has been described in model systems in
other published work. Amrein et al. (23) demonstrated that the
baking agent ammonium bicarbonate promoted the formation of
more dicarbonyl compounds compared with sodium bicarbonate
and even more in the presence of fructose. Thus, it is important to
stress that this finding confirmed that acrylamide formation is
related to these reactive intermediates in real samples. However,
no correlation was observed between GO and AA levels in
commercial cookies because GO, unlike AA, is not the predomi-
nant R-dicarbonyl fragment formed by the Maillard reaction.
Carbohydrate fragmentation is enhanced by alkaline conditions
and subsequently, by the formation of sugar fragments with an R-
dicarbonyl moiety. Therefore, it is reasonable to find higher levels
of MGO and GO in commercial samples with ammonium
bicarbonate as the leavening agent.
With regard to HMF, it is formed either in the Maillard
reaction or by caramelization, but significantly HMF did not
correlate with either GO or MGO in commercial cookies (data
not shown), in contrast to acrylamide. However, in cookies
prepared at laboratory scale at different times, a correlation
was observed (Figure 3b). At the beginning, HMF and dicarbonyl
amounts were basically low, indicating that an induction period
was necessary to form these compounds. However, after 15 min
of baking time, a large increase in HMF formation was observed,
whereas dicarbonyl compounds only increased slightly. This
revealed that HMF formation was highly dependent on tempera-
ture in contrast to dicarbonyls that were formed in previous stages
of the reaction. Furthermore, similar behavior was observed in
both dicarbonyls. GO and MGO formation can result from
isomerization and subsequent retro-aldolization of sugar or by
cleavage or 3-deoxyhexulose (11), but MGO is formed to a larger
extent under MR conditions, especially through degradation of
the Amadori product more than during caramelization.
In conclusion, analysis of GO and MGO in foods is difficult
because they are very reactive, easily polymerized, and volatile
substances. The in-house validated RP-HPLC-UV method de-
scribed in this paper permitted the determination of GO and
MGO levels in cookies after derivatization to stable quinoxaline
derivatives and a cleanup step. GO and MGO were widely
distributed in commercial cookies in a broad range of concentra-
tions but mostly present at the surface of the cookie. Because GO
and MGO may be involved in the early stages of many age-related
human diseases (4 , 5 ), it is of relevance to evaluate their dietary
exposure. Under controlled baking conditions, formation of
dicarbonyl compounds was related to the baking time and,
subsequently, to the formation of both acrylamide and HMF.
Finally, this study revealed for the first time that there is a
significant correlation between MGO and acrylamide in com-
mercial cookie samples, thus confirming the important role of
dicarbonyls in the formation of these heat-induced contaminants
in foods.
ACKNOWLEDGMENT
Silvia de la Pen~a and M. A. Martınez are gratefully acknow-
ledged for their technical assistance.
LITERATURE CITED
(1) Thornalley, P. J. Dicarbonyl intermediates in the Maillard reaction.
Ann. N.Y. Acad. Sci. 2005, 1043, 111–117.
(2) Talukdar, D.; Chaudhuri, B. S.; Ray, M.; Ray, S. Critical evaluation
of toxic versus beneficial effects of methylglyoxal. Biochemistry
(Moscow), 2009, 74, 1059–1069.
(3) Lapolla, A.; Flamini, R.; Lupo, A.; Arico, N. C.; Rugiu, C.; Reitano,
R.; Tubaro, M.; Ragazzi, E.; Seraglia, R.; Traldi, P. Evaluation of
glyoxal and methylglyoxal in uremic patients under peritoneal
dialysis. Ann. N.Y. Acad. Sci. 2005, 1043, 217–224.
(4) Thornalley, P. J. Glycation free adduct accumulation in renal
disease: the new AGE. Pediatr. Nephrol. 2005, 20, 1515–1522.
(5) Kalapos, M. P. Methylglyoxal in living organisms: chemistry,
biochemistry, toxicology and biological implications. Toxicol. Lett.
1999, 110, 145–175.
(6) Baskaran, S.; Balasubramanian, K. A. Toxicity of methylglyoxal
towards rat enterocytes and coloncytes. Biochem. Int. 1990, 21, 165–
174.
(7) Ueno, H.; Nakamuro, K.; Sayato, Y.; Okada, S. DNA lesion in rat
hepatocytes induces by in vitro and in vivo exposure to glyoxal.
Mutat. Res. 1991, 260, 115–119.
(8) Schnuch, A.; Uter, W.; Geier, J.; Frosch, P. J.; Rustemeyer, T.
Contact allergies in healthcare workers. Results from the IVDK.
Acta Derm. Venereol. 1998, 78, 358–363.
(9) Uter, W.; Schwanitz, H. J.; Lessmann, H.; Schnuch, A. Glyoxal is an
important allergen for (medical care) cleaning staff. Int. J. Hyg.
Environ. Health 2001, 204, 251–253.
(10) Nemet, I.; Varga-Defterdarovic, L.; Turk, Z. Methylglyoxal in food
and living organisms. Mol. Nutr. Food Res. 2006, 50, 115–117.
(11) Homoki-Farkas, P.; O€ rsi, F.; Kroh, L. W. Methylglyoxal determi-
nation from different carbohydrates during heat processing. Food
Chem. 1997, 59, 157–163.
(12) Niyati-Shirkhodaee, F.; Shibamoto, T. Gas-chromatographic ana-
lysis of glyoxal and methylglyoxal formed from lipids and related-
compounds upon ultraviolet-irradiation. J. Agric. Food Chem. 1993,
41, 227–230.
(13) Yamaguchi, M.; Ishida, J.; Xuan-Xuan, Z.; Nakamura, M.;
Yoshitake, T. Determination of glyoxal, methylglyoxal, diacethyl,

2972 J. Agric. Food Chem., Vol. 58, No. 5, 2010 Arribas-Lorenzo and Morales
and 2,3-pentanedione in fermented foods by high-performance
liquid chromatography with fluorescence detection. J. Liq. Chroma-
togr. 1994, 17, 203–211.
(14) Weigel, K. U.; Opitz, T.; Henle, T. Studies on the occurrence and
formation of 1,2-dicarbonyls in honey. Eur. Food Res. Technol. 2004,
218, 147–157.
(15) De Revel, G.; Bertrand, A. A method for the detection of carbonyl
compounds in wine: glyoxal and methylglyoxal. J. Sci. Food Agric
1993, 61, 267–272.
(16) Barros, A.; Rodrigues, J. A.; Almeida, P. J.; Oliva-Teles, M. T.
Determination of glyoxal, methylglyoxal and diacetyl in selected
beer and wine by HPLC with UV spectrophotometric detection after
derivatization with o-phenylendiamine. J. Liq. Chromatogr. Relat.
Technol. 1999, 22, 2061–2069.
(17) Hirayama, T.; Yamada, N.; Nohara, M.; Fukui, S. The existence of
the 1,2-diacrbonyl compounds glyoxal, methylglyoxal and diacetyl
in autoxidised oils. J. Sci. Food Agric. 1984, 35, 1357–1362.
(18) Nagao, M.; Fujita, Y.; Sugimura, T.; Kosuge, T. Methylglyoxal in
beverages and foods: its mutagenicity and carcinogenicity. IARC Sci.
Publ. 1986, 70, 283–291.
(19) Thornalley, P. J.; Langborg, A.; Minhas, H. S. Formation of glyoxal,
methylglyoxal and 3-deoxyglucosone in the glycation of proteins by
glucose. Biochem. J. 1999, 344, 109–116.
(20) De Revel, G.; Pripis-Nicolau, L.; Berbe, J. C.; Bertrand, A. The
detection of R-dicarbonyl compounds in wine by formation of
quinoxaline derivates. J. Sci. Food Agric. 2000, 80, 102–108.
(21) Acrylamide; International Agency for Research on Cancer: Lyon, France,
1994.
(22) Surh, Y.; Tannenbaun, S. Activation of the Maillard reaction
product 5-(hydroxymethyl)furfural to strong mutagens via allylic
sulfonation and chlorination. Chem. Res. Toxicol. 1994, 7, 313–318.
(23) Amrein, T. M.; Andres, L.; Manzardo, G. G. G.; Amado, R.
Investigations on the promoting effect of ammonium hydrogencar-
bonate on the formation of acrylamide in model system. J. Agric.
Food Chem. 2006, 54, 10253–10261.
(24) Arribas-Lorenzo, G.; Fogliano, V.; Morales, F. J. Acrylamide
formation in a cookie system as influenced by the oil phenol profile
and degree of oxidation. Eur. Food Res. Technol. 2009, 229, 63–72.
(25) Rufian-Henares, J. A.; Delgado-Andrade, C.; Morales, F. J. Appli-
cation of a fast HPLC method for simultaneously determination
of furanic compounds and glucosylisomaltol in breakfast cereals.
J. AOAC Int. 2006, 89, 161–165.
(26) MARM. La Alimentacio n en Espan~a; Ministerio de Agricultura, Pesca
y Alimentacion: Madrid, Spain, 2009.
(27) Dhar, A.; Desai, K.; Liu, J.; Wu, L. Methylglyoxal, protein binding
and biological samples: are we getting the true measure? J. Chroma-
togr., B 2009, 877, 1093–1100.
(28) Gildersleeve, D. L.; Tobes, M. C.; Natale, R. B. Rapid analysis
for methylglyoxal bis(guanylhydrazone) by reversed-phase ion-pair
liquid chromatography. Clin. Chem. 1985, 31, 1979–1984.
(29) Daglia, M.; Papetti, A.; Aceti, C.; Sordelli, B.; Spini, V.; Gazzani, G.
Isolation and determination of R-dicarbonyl compounds by RP-
HPLC-DAD in green and roasted coffee. J. Agric. Food Chem. 2007,
55, 8877–8882.
(30) Roiter, I. M.; Borovikova, L. A. Level of volatile carbonyl com-
pounds in bread during the addition of enzyme preparations.
Khlebopek. Konditer. Promst. 1972, 14, 14–15.
(31) Weenen, H. Reactive intermediates and carbohydrate fragmentation
in Maillard chemistry. Food Chem. 1998, 62, 393–401.
(32) Wells-Knecht, K. J.; Zyzak, D. V.; Litchfield, J. E.; Thorpe, S. R.;
Baynes, J. W. Mechanism of autoxidative glycosylation: identifica-
tion of glyoxal and arabinose as intermediates in the autoxidative
modification of proteins by glucose. Biochemistry 1995, 34, 3702–
3709.
(33) Hayashi, T.; Namiki, M. Role of sugar fragmentation in an early
stage browning of amino-carbonyl reaction of sugar with amino
acid. Agric. Biol. Chem. 1986, 50, 1965–1970.
(34) Mottram, D. S.; Wedzicha, B. L.; Dodson, A. T. Acrylamide is
formed in the Maillard reaction. Nature 2002, 419, 449–450.
(35) Stadler, R. H.; Blank, I.; Varga, N.; Robert, F.; Hau, J.; Guy, P. A.;
Robert, M. C.; Riediker, S. Acrylamide from Maillard reaction
products. Nature 2002, 419, 449–450.
(36) Tareke, E.; Rydberg, P.; Karlsson, P.; Eriksson, S.; Tornqvist, M.
Analysis of acrylamide, a carcinogen formed in heated foodstuffs.
J. Agric. Food Chem. 2002, 50, 4998–5006.
(37) Yuan, Y.; Zhao, G-h.; Hu, X-s.; Wu, J-h.; Liu, J.; Chen, F. High
correlation of methylglyoxal with acrylamide formation in glucose/
asparagine Maillard reaction model. Eur. Food Res. Technol. 2008,
226, 1301–1307.
Received for review August 12, 2009. Revised manuscript received
January 12, 2010. Accepted January 22, 2010. This research has been
partly funded under Project ANALYSIC (S-505/AGR-0312) by the
Autonomous Community of Madrid and the Spanish Ministry of Science
and Technology (AGL 2005-01735). G.A.-L. is grateful to the
Conserjerıa de Educacion de la Comunidad de Madrid and Fondo
Social Europeo for her Ph.D. grant.
902
J. Agric. Food Chem., Vol. 57, No. 3, 2009
Arribas-Lorenzo and Morales
Effect of Pyridoxamine on Acrylamide Formation in a
Glucose/Asparagine Model System
GEMA ARRIBAS-LORENZO AND FRANCISCO J. MORALES*
Consejo Superior de Investigaciones Cientıficas, Instituto de Ciencia y Tecnologıa de los Alimentos y
Nutricio n (formerly Instituto del Frıo), Jose Antonio Novais 10, 28040 Madrid, Spain
The effect of pyridoxamine (PM) on the reduction of acrylamide (AA) formation in a low-moisture
equimolar glucose/asparagine model system was investigated. Formation/elimination kinetics of
acrylamide was carried out at temperatures between 120 and 180 C. Time courses of glucose,
asparagine, pyridoxamine, 3-aminopropionamide (3-APA), acrylamide, and browning were measured
to get more insight on the mechanism of action of PM. PM exhibited an inhibitory effect on AA formation
at all temperatures studied, but became more relevant at 160 and 180 C (up to 51% reduction).
Degradation rates of glucose and asparagine were not significantly affected by PM, but PM was
rapidly consumed in the glucose/asparagine system. Browning was significantly suppressed by addition
of PM in the system, and formation of 3-APA was increased as compared to control. In comparison
with pyridoxal, pyridoxine, and ascorbic acid, PM exerted the highest inhibition activity against AA
formation, and a clear dose-response was observed. The nucleophilic aminomethyl group of PM
was crucial for the exertion of an inhibition effect more than double those other B6 vitamers. The
action mechanism of PM was attributable to its structural features that have the capacity to scavenge
intermediary dicarbonyls formed during sugar degradation and advanced stages of the Maillard
reaction. These findings open new possibilities for strategies in acrylamide mitigation where formation
of reactive dicarbonyls should be carefully considered.
KEYWORDS: Acrylamide; pyridoxamine; Maillard reaction; glucose; asparagine; color; 3-aminopropi-
onamide
INTRODUCTION
Acrylamide (AA) is naturally formed mainly in carbohydrate-
rich foods during thermal treatment such as frying, baking, or
roasting, and it is largely present in the diet of western countries.
Levels of AA in foods suggest potential safety issues relative
to its potent mutagenicity and carcinogenity as well as its
damages to the central nervous system functions. Thus, the
presence of this heat-induced toxicant in foodstuffs has led to
public health concern, and intense research is being focused on
ways of preventing or minimizing its formation (1, 2).
Since 2002, significant efforts have been conducted to
elucidate the chemistry pathways of AA for which the main
actors have been identified. Thermal degradation of free
asparagine in the presence of reducing sugars or carbonyls
following Maillard-type reactions has been proposed as the
major route in acrylamide formation (3, 4). It is known that
Schiff bases, decarboxylated Amadori compounds, Strecker
aldehydes, and glycoconjugates such as N-glycosides contribute
to the formation of AA (3-5), via Maillard reaction (MR).
Therefore, yields of AA can be reduced by competitive reactions
with these key intermediates, suppressing the early steps of the
* Corresponding author (telephone +34 91 549 23 00; fax +34 91
549 36 27; e-mail [email protected]).
MR. In this way, for instance, it was shown that metal ions
inhibited acrylamide formation by impeding the intermediate
Schiff base of asparagine, or ferulic acid, from reacting with
AA precursors or intermediates; alternative approaches involve
adding amino acids that compete with asparagine in the MR
such as glycine, reduction by olive oil phenolic compounds,
and the addition of bamboo leaves or green tea extracts.
Recently, Friedman and Levin (2) published a comprehensive
review of the different strategies of mitigation applied.
Vitamin B6 is a water-soluble vitamin that exists in three
major chemical forms: pyridoxine (PN), pyridoxal (PL), and
pyridoxamine (PM). The phosphate ester derivative pyridoxal
5-phosphate (PLP) is the principal coenzyme form and has the
most importance in human amino acid and protein metabolism
and red blood cell metabolism; it is mainly present in fruits,
vegetables, cereal grains, meat, poultry, and fish (6).
In recent years, PM has attracted increasing attention because
it is a pharmacological agent used for the treatment of
multifactorial chronic diseases, such as diabetes or atheroscle-
rosis complications, by inhibiting the MR and reducing the
pathogenicity of carbonyl compounds (7). PM also prevents
renal and vascular pathology and hyperlipidemia in the Zucker
obese nondiabetic rat model (8). In addition, as recently
reviewed by Friedman and Levin (2), it has been pointed out
10.1021/jf802870t CCC: $40.75 2009 American Chemical

902
J. Agric. Food Chem., Vol. 57, No. 3, 2009
Arribas-Lorenzo and Morales
Society Published on Web 01/14/2009

Effect of Pyridoxamine on Acrylamide Formation
J. Agric. Food Chem., Vol. 57, No. 3, 2009 902
that PM might be a possible inhibitor of AA in food, so
investigations should be conducted to clarify this point.
Furthermore, PM has been described as a post-Amadori
inhibitor capable of inhibiting the formation of advanced
glycation end-products (AGEs) in vivo and in vitro (9, 10) as
well as advanced lipoxidation end-product (ALEs) (10, 11), but
its reaction mechanisms are yet subject to debate. Its inhibition
properties involved in the MR are a consequence of its reactivity
due to the phenol and aminomethyl group at pyridinium ring,
respectively. In addition, there has been a previous study
demonstrating that vitamin B6 supplementation can delay and
reduce the severity of the neurotoxicity caused by acrylamide
(12).
Previous knowledge supports the idea that PM could act as
an inhibitor of AA formation in foods. Its demonstrated
inhibitory effects in vivo have not been studied in foods so far.
The main purpose of this investigation was, therefore, to evaluate
whether this natural intermediate of vitamin B6 capable of
inhibiting AGE formation could mitigate AA formation in foods
systems as well. Another objective was to gain information about
the action mechanism of PM on reactions that involve acryla-
mide formation. The inhibition rates of PM were compared with
those of PN and PL as well as vitamin C as reference. In the
present paper the main changes in glucose, asparagine, and
3-aminopropionamide (3-APA) and the extent of browning as
well as the changes in the PM, subjected to rate of disappearance
or destruction due to a heating process, were considered.
MATERIALS AND METHODS
Chemicals. Acrylamide (99%), D-(+)-glucose, dansyl chloride (5-
[dimethylamino]naphthalene-1-sulfonyl chloride), pyridoxine hydro-
chloride, pyridoxal hydrochloride, and o-phthaldehyde (OPA) were
purchased from Sigma (St. Louis, MO). Heptafluorobutyric acid and
pyridoxamine dihydrochloride were from Fluka Chemicals (Madrid,
Spain). L-Asparagine monohydrate, glycine, -mercaptoethanol, metha-
nol, and acetonitrile (HPLC grade) were bought from Merck (Darmstadt,
Germany). Boric acid, sulfuric acid (96%), formic acid (98%), sodium
phosphate monobasic, and sodium bicarbonate were from Panreac
(Madrid, Spain). -Alaninamide hydrochloride (97%) was from ABCR
GmbH & Co. KG (Karlsruhe, Germany). Ultrapure water was used
(Milli-Q system, Millipore Bedford, MA). Oasis-HLB cartridges (30
mg, 1 mL) were supplied by Waters (Milford, MA). [13C3]Acrylamide
(isotopic purity 99%) was from Cambidge Isotope Laboratories
(Andover, MA). Glass vials with septum screw caps were supplied by
Agilent Technologies (Wilmington, DE).
Preparation of Model Systems. Kinetic Model. (a) Glucose and
Asparagine (Glc/Asn). Reaction mixtures were prepared with equimolar
quantities (1:1) of Glc and Asn (0.3 mmol each). To obtain a
homogeneous mixture, both reactants were carefully dry-mixed in a
mortar until a powder was obtained. Aliquots of the mixtures (99.1
mg) were transferred to Pyrex hydrolysis tubes (10 cm × 0.9 mm i.d.)
with 100 µL of 0.1 M NaH2PO4 buffer (pH 6.8), tightly capped, and
heated in an oil bath at temperatures of 120, 140, 160, and 180 C for
various times. Temperature (reference temperature ( 1 C) was
previously calibrated, with external thermocouples (type K, 0.1 mm) coupled to a datalogger. The heated samples were cooled immediately
in iced water to stop any further reaction. Samples were kept at 4 C for analysis within the same working day or frozen for further analysis.
Experiments were prepared at least in duplicate.
(b) Glucose, Asparagine, and Pyridoxamine (Glc/Asn/PM). The Glc/
Asn reaction mixture was modified by adding pyridoxamine (0.03
mmol) dissolved in 100 µL of 0.1 M NaH2PO4 buffer (pH 6.8). The
heating experiment was worked up as previously described. Experiments
were prepared at least in duplicate.
(c) Dose Effect. Glc (0.3 mmol) and Asn (0.3 mmol) were mixed
and transferred to Pyrex tubes, and variable concentrations of pyri-
doxamine, pyridoxine, pyridoxal, and vitamin C were added (0, 5, 10,
20, and 30 µmol) dissolved in 100 µL of 0.1 M NaH2PO4 buffer (pH
6.8). The experiment was heated at 140 C for 30 min and cooled in
ice-water. Samples were kept at 4 C for analysis within the same
working day or frozen for further analysis. The experiments were run
at least in triplicate.
Acrylamide Analysis. One milliliter of distilled water was added
to the heated mixtures, and the reaction solution was gently vortexed
and centrifuged for 5 min at 4000 rpm for removing insoluble particles,
if any. Appropriate dilution (100-fold) was made using distilled water
and then purified on an Oasis-HLB solid phase extraction cartridge.
The cartridges were washed with 1.0 mL of methanol and 1.0 mL of
water prior to use. The sample dilution (1.0 mL) was loaded on the
cartridge, and the first drops were discharged. The eluate was filtered
through a 0.45 µm filter and subjected to a liquid chromatography-diode
array detector (LC-DAD). The results were confirmed by using liquid
chromatography-mass spectrometry (LC-MS).
The quantification of acrylamide was conducted with a Shimadzu HPLC
system (Kyoto, Japan) equipped with a LC-20AD pump, a SIL-10ADvp
autosampler, a CTO-10ASVP oven, and a DAD (SPD-M20A). The
chromatographic separations were performed on an Inertsil ODS-3 column
(250 × 4.6 mm, 5 µm). The mobile phase condition was isocratic at 100%
ultrapure water at a flow rate of 0.6 mL/min at 32 C. Acrylamide was
detected at 210 nm. The quantification of AA was performed using a
calibration curve in the range of 5-1000 µg/L. The limit of quantitation
(5 µg/L) was similar to that found by other authors (13).
Confirmatory LC-ESI-MS analysis were performed as described by
Rufian-Henares et al. (14) using an Agilent 1100 HPLC system
(Waldbronn, Germany) consisting of a quaternary pump, an autosam-
pler, and a temperature-controlled column oven, coupled to an Agilent
1100 MS detector equipped with an electrospray ionization interface.
The analytical separation was performed on an Inertsil ODS-3 column
(250 × 4.6 mm, 5 µm; GLC-Sciences Inc., Kyoto, Japan) using an isocratic mixture of 0.2% aqueous solution of formic acid at a flow
rate of 0.6 mL/min at 25 C. Data acquisition was performed, with a
delay time of 8 min, in a selected ion monitoring (SIM) mode using
the following interface parameters: drying gas (N2, 100 psig) flow of
12 L/min, nebulizer pressure of 45 psig, drying gas temperature of 350
C, capillary voltage of 3 kV, and fragmenter voltage of 70 eV.
Monitored ions were m/z 72.1 for acrylamide and m/z 75.1 for 13C3-
labeled acrylamide. An acrylamide calibration curve was built in the
range of 2-100 µg/L. The accuracy of the procedure was recently demonstrated for potato crisps in an interlaboratory comparison study
organized by the Institute of Reference Materials and Measurements,
yielding a z score of -0.5. The analyses are integrated within the scope
of a certified laboratory controlled by AENOR (Spanish Association
for Standardization and Certification).
Analysis of 3-Aminopropionamide (3-APA). 3-APA was analyzed
according to the procedure reported by Bagdonaite et al. (15) with some
minor modifications. Samples (200 µL) were dissolved in 200 µL of
0.5 M NaHCO3 (pH ∼8) and then derivatized with dansyl chloride.
To 100 µL of the mixture was added 100 µL of dansyl chloride solution
(5 mg/mL in acetone) in a test tube. The mixture was vigorously mixed
for 3 min and left in the dark overnight. Twenty microliters of a glycine
solution (100 mg/mL) was added, vortexed for 1 min, and left for 15
min. The extraction of the sample was done with 1 mL of diethyl ether,
twice. The combined extracts were dried with nitrogen, and the residue
was dissolved in 1 mL of acetonitrile and filtered at 0.45 µm. A
Shimadzu HPLC system (Kyoto, Japan) equipped with an LC-20AD
pump, an LC-20AD/AT low-pressure gradient former, a SIL-10ADvp
autosampler, a CTO-10ASVP oven, and an RF-10AxL fluorescence
detector controlled by a CBM-10A communication bus module was
used. The chromatographic separations were performed on a Mediter-
ranea-Sea-C18 analytical column (25 × 0.40 cm, 5 µm, Tecknokroma, Barcelona, Spain) using a gradient elution of ultrapure water (phase
A) and acetonitrile (phase B) at a flow rate of 0.8 mL/min at 32 C.
Data acquisition was performed by acquiring chromatograms at an
excitation wavelength of 320 nm and an emission of 500 nm. The
column was equilibrated in 90% phase A and 10% phase B; the gradient
was as follows: time 0-2 min, 30% B; time 12 min, 70% B; time 20
min, 70% B; time 21 min, 10%, held until the end of the run (30 min).
The quantification of 3-APA was performed using a calibration curve.
Stock solution of 3-APA was prepared at a concentration of 10000
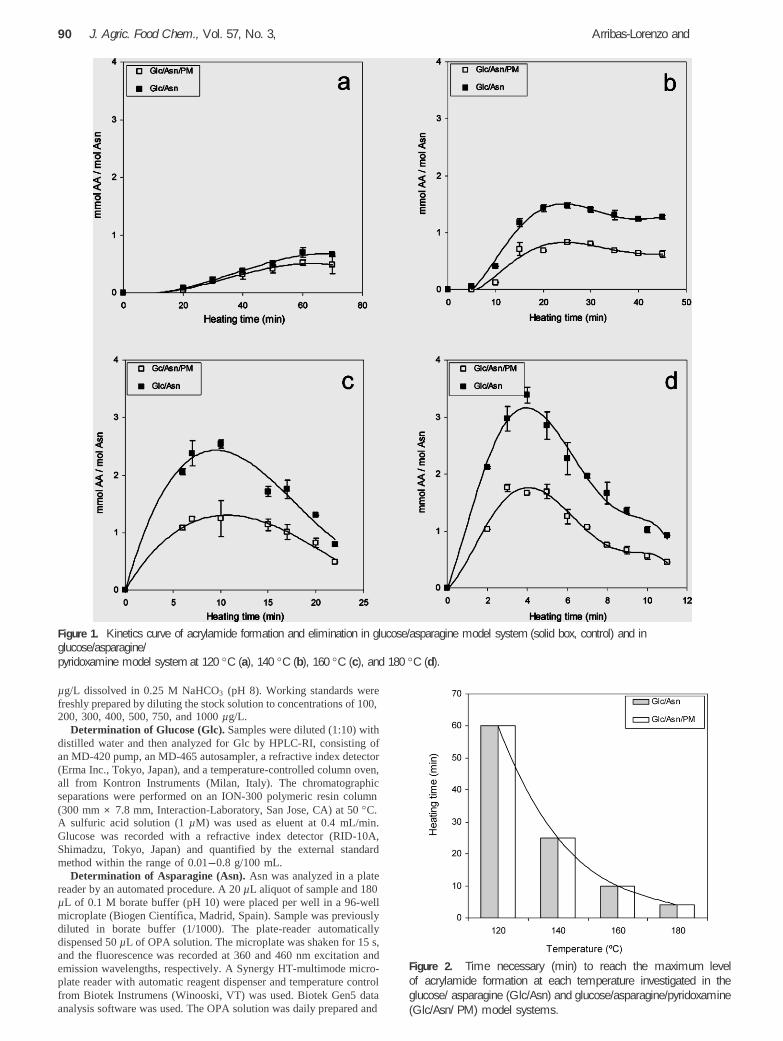
903
J. Agric. Food Chem., Vol. 57, No. 3, 2009
Arribas-Lorenzo and Morales
Figure 1. Kinetics curve of acrylamide formation and elimination in glucose/asparagine model system (solid box, control) and in glucose/asparagine/
pyridoxamine model system at 120 C (a), 140 C (b), 160 C (c), and 180 C (d).
µg/L dissolved in 0.25 M NaHCO3 (pH 8). Working standards were
freshly prepared by diluting the stock solution to concentrations of 100, 200, 300, 400, 500, 750, and 1000 µg/L.
Determination of Glucose (Glc). Samples were diluted (1:10) with
distilled water and then analyzed for Glc by HPLC-RI, consisting of
an MD-420 pump, an MD-465 autosampler, a refractive index detector
(Erma Inc., Tokyo, Japan), and a temperature-controlled column oven,
all from Kontron Instruments (Milan, Italy). The chromatographic
separations were performed on an ION-300 polymeric resin column
(300 mm × 7.8 mm, Interaction-Laboratory, San Jose, CA) at 50 C. A sulfuric acid solution (1 µM) was used as eluent at 0.4 mL/min.
Glucose was recorded with a refractive index detector (RID-10A,
Shimadzu, Tokyo, Japan) and quantified by the external standard
method within the range of 0.01-0.8 g/100 mL.
Determination of Asparagine (Asn). Asn was analyzed in a plate
reader by an automated procedure. A 20 µL aliquot of sample and 180
µL of 0.1 M borate buffer (pH 10) were placed per well in a 96-well
microplate (Biogen Cientıfica, Madrid, Spain). Sample was previously
diluted in borate buffer (1/1000). The plate-reader automatically
dispensed 50 µL of OPA solution. The microplate was shaken for 15 s,
and the fluorescence was recorded at 360 and 460 nm excitation and
emission wavelengths, respectively. A Synergy HT-multimode micro-
plate reader with automatic reagent dispenser and temperature control
from Biotek Instrumens (Winooski, VT) was used. Biotek Gen5 data
analysis software was used. The OPA solution was daily prepared and
Figure 2. Time necessary (min) to reach the maximum level
of acrylamide formation at each temperature investigated in the
glucose/ asparagine (Glc/Asn) and glucose/asparagine/pyridoxamine
(Glc/Asn/ PM) model systems.
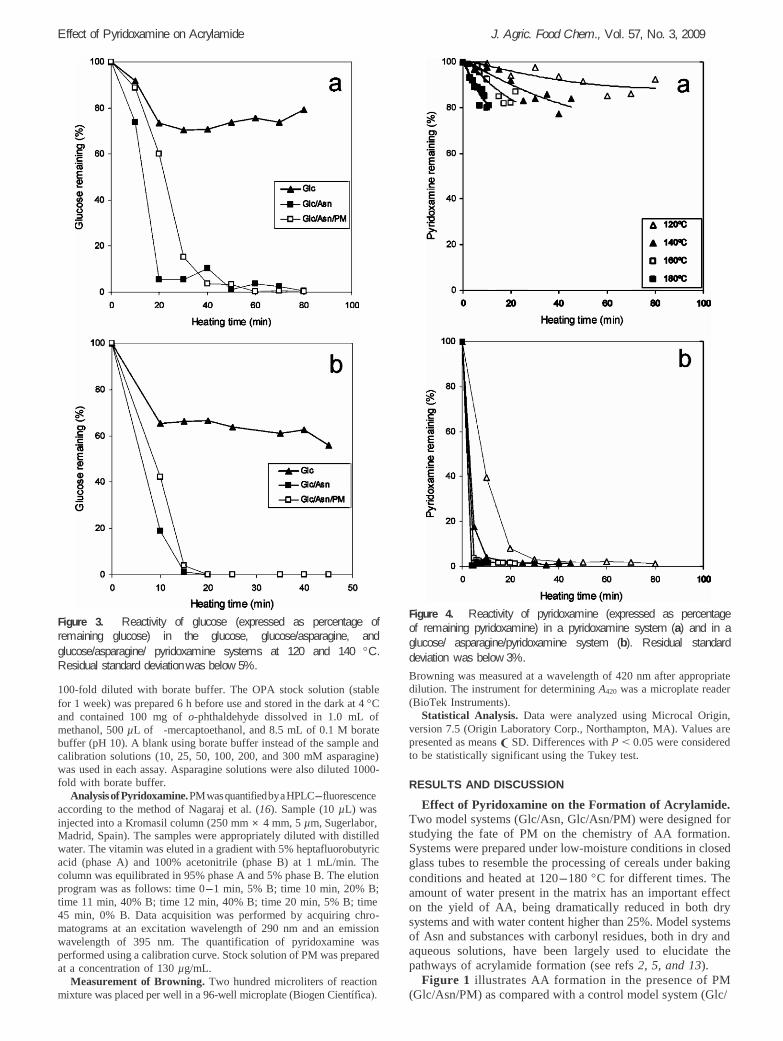
Effect of Pyridoxamine on Acrylamide Formation
J. Agric. Food Chem., Vol. 57, No. 3, 2009 904
Figure 3. Reactivity of glucose (expressed as percentage of
remaining glucose) in the glucose, glucose/asparagine, and
glucose/asparagine/ pyridoxamine systems at 120 and 140 C.
Residual standard deviation was below 5%.
100-fold diluted with borate buffer. The OPA stock solution (stable
for 1 week) was prepared 6 h before use and stored in the dark at 4 C
and contained 100 mg of o-phthaldehyde dissolved in 1.0 mL of
methanol, 500 µL of -mercaptoethanol, and 8.5 mL of 0.1 M borate
buffer (pH 10). A blank using borate buffer instead of the sample and
calibration solutions (10, 25, 50, 100, 200, and 300 mM asparagine)
was used in each assay. Asparagine solutions were also diluted 1000-
fold with borate buffer.
Analysis of Pyridoxamine. PM was quantified by a HPLC-fluorescence
according to the method of Nagaraj et al. (16). Sample (10 µL) was
injected into a Kromasil column (250 mm × 4 mm, 5 µm, Sugerlabor, Madrid, Spain). The samples were appropriately diluted with distilled
water. The vitamin was eluted in a gradient with 5% heptafluorobutyric
acid (phase A) and 100% acetonitrile (phase B) at 1 mL/min. The
column was equilibrated in 95% phase A and 5% phase B. The elution
program was as follows: time 0-1 min, 5% B; time 10 min, 20% B;
time 11 min, 40% B; time 12 min, 40% B; time 20 min, 5% B; time
45 min, 0% B. Data acquisition was performed by acquiring chro-
matograms at an excitation wavelength of 290 nm and an emission
wavelength of 395 nm. The quantification of pyridoxamine was
performed using a calibration curve. Stock solution of PM was prepared
at a concentration of 130 µg/mL.
Measurement of Browning. Two hundred microliters of reaction
mixture was placed per well in a 96-well microplate (Biogen Cientıfica).
Figure 4. Reactivity of pyridoxamine (expressed as percentage
of remaining pyridoxamine) in a pyridoxamine system (a) and in a
glucose/ asparagine/pyridoxamine system (b). Residual standard
deviation was below 3%.
Browning was measured at a wavelength of 420 nm after appropriate
dilution. The instrument for determining A420 was a microplate reader
(BioTek Instruments).
Statistical Analysis. Data were analyzed using Microcal Origin,
version 7.5 (Origin Laboratory Corp., Northampton, MA). Values are
presented as means ( SD. Differences with P < 0.05 were considered
to be statistically significant using the Tukey test.
RESULTS AND DISCUSSION
Effect of Pyridoxamine on the Formation of Acrylamide.
Two model systems (Glc/Asn, Glc/Asn/PM) were designed for
studying the fate of PM on the chemistry of AA formation.
Systems were prepared under low-moisture conditions in closed
glass tubes to resemble the processing of cereals under baking
conditions and heated at 120-180 C for different times. The
amount of water present in the matrix has an important effect
on the yield of AA, being dramatically reduced in both dry
systems and with water content higher than 25%. Model systems
of Asn and substances with carbonyl residues, both in dry and
aqueous solutions, have been largely used to elucidate the
pathways of acrylamide formation (see refs 2, 5, and 13).
Figure 1 illustrates AA formation in the presence of PM
(Glc/Asn/PM) as compared with a control model system (Glc/
905
J. Agric. Food Chem., Vol. 57, No. 3, 2009
Arribas-Lorenzo and Morales
Figure 5. Formation of 3-aminopropanamide in glucose/asparagine model system (solid box; control) and glucose/asparagines/pyridoxamine
model system at 120 C (a), 140 C (b), 160 C (c), and 180 C (d).
Asn) without the addition of PM at different temperatures
and times. Classical kinetics of AA in the MR describe both
the formation and elimination processes for whcih several
different mathematical models have been drawn to elucidate
the process and follow two consecutive first-order reactions
(see refs 13 and 17). Kinetic modeling of AA formation/
elimination is not the aim of this paper. Results obtained for
the Glc/Asn model system are in line with results in model
systems (see ref 18) and foods (19) reported in the literature,
where prolonged heating times and high temperatures decreased
the net formation of AA. AA has two reactive sites, the
conjugated double bond and the amide group, and it has been
proposed that losses of acrylamide are due to polymerization,
evaporation, and Michael addition reactions with other food
constituents (5). At 120 C a plateau was observed after 60 min
of heating where the formation and elimination of AA are in
balance. Inhibition of AA by PM was observed at all temper-
atures but become relevant at temperatures >120 C. As
expected, the time to reach the maximum level of acrylamide
was reduced by increasing temperature, being 60, 30, 10, and
4 min for 120, 140, 160, and 180 C, respectively, but the time
to reach the maximum level of AA for each temperature
remained equal in both systems and was not affected by the
addition of PM as depicted in Figure 2.
Becalski et al. (17) reported in dry systems that the amount
of AA was reduced when the temperature was increased from
155 to 185 C, at least when heating was longer than 10 min.
It is clear that AA is an intermediary of the MR rather than an
end-product, which implies that it is also subject to further
degradation reactions as has been clearly shown by kinetic
modeling (13). If percentages of AA reduction are compared at
the time at which the highest AA was formed, inhibition rates
of 25, 44, 51, and 51% were obtained at 120, 140, 160, and
180 C, respectively. Inhibition of AA by PM was more
effective at higher temperatures, at which up to 51% of reduction
was obtained, which is promising for its further application
during baking of cereal products.
In line with the literature, with increasing temperature, the
reaction rate of both AA formation and elimination increased (13, 20),
but it is worth noting that the curves of both Glc/Asn and Glc/
Asn/PM systems showed the same rate of acrylamide formation/
elimination. A correlation was observed between the time
necessary to reach the maximum AA yields at each temperature,
providing supportive evidence that was described before (Figure
2), and it was not affected by the presence of PM. In line with
previous studies, time and temperature drive AA formation (19, 21),
but PM did not induce new chemical pathways for AA and just
a net reduction in the reaction rate was suggested.
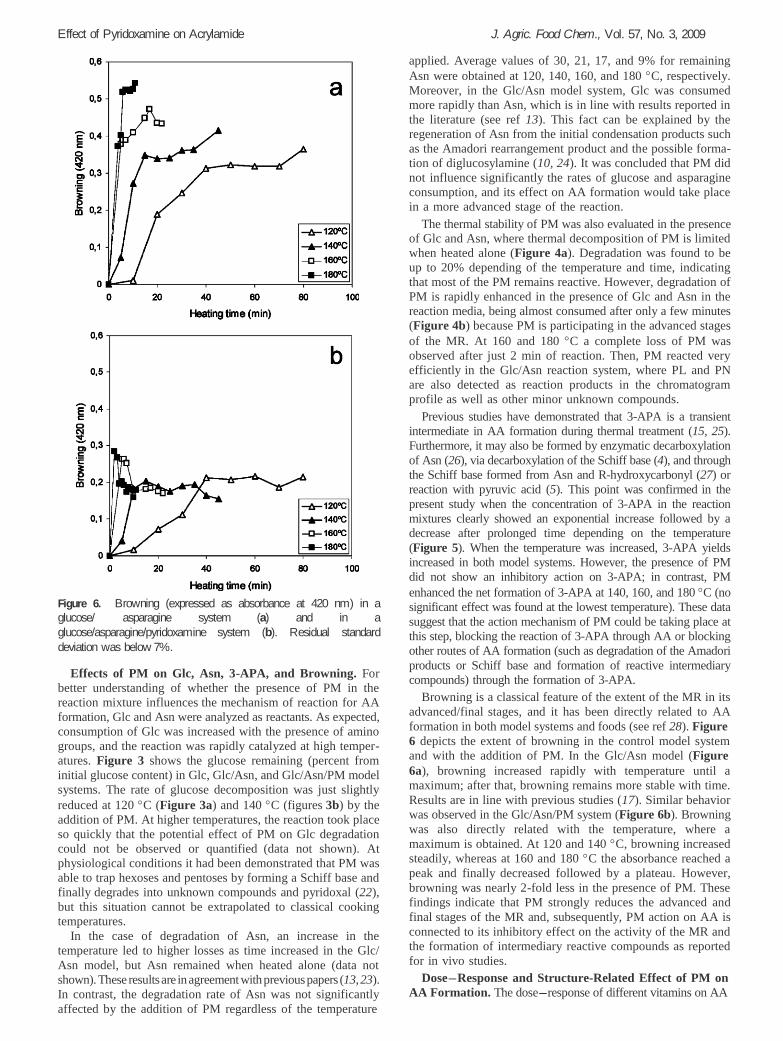
Effect of Pyridoxamine on Acrylamide Formation
J. Agric. Food Chem., Vol. 57, No. 3, 2009 906
Figure 6. Browning (expressed as absorbance at 420 nm) in a
glucose/ asparagine system (a) and in a
glucose/asparagine/pyridoxamine system (b). Residual standard
deviation was below 7%.
Effects of PM on Glc, Asn, 3-APA, and Browning. For
better understanding of whether the presence of PM in the
reaction mixture influences the mechanism of reaction for AA
formation, Glc and Asn were analyzed as reactants. As expected,
consumption of Glc was increased with the presence of amino
groups, and the reaction was rapidly catalyzed at high temper-
atures. Figure 3 shows the glucose remaining (percent from
initial glucose content) in Glc, Glc/Asn, and Glc/Asn/PM model
systems. The rate of glucose decomposition was just slightly
reduced at 120 C (Figure 3a) and 140 C (figures 3b) by the
addition of PM. At higher temperatures, the reaction took place
so quickly that the potential effect of PM on Glc degradation
could not be observed or quantified (data not shown). At
physiological conditions it had been demonstrated that PM was
able to trap hexoses and pentoses by forming a Schiff base and
finally degrades into unknown compounds and pyridoxal (22),
but this situation cannot be extrapolated to classical cooking
temperatures.
In the case of degradation of Asn, an increase in the
temperature led to higher losses as time increased in the Glc/
Asn model, but Asn remained when heated alone (data not
shown). These results are in agreement with previous papers (13, 23).
In contrast, the degradation rate of Asn was not significantly
affected by the addition of PM regardless of the temperature
applied. Average values of 30, 21, 17, and 9% for remaining
Asn were obtained at 120, 140, 160, and 180 C, respectively.
Moreover, in the Glc/Asn model system, Glc was consumed
more rapidly than Asn, which is in line with results reported in
the literature (see ref 13). This fact can be explained by the
regeneration of Asn from the initial condensation products such
as the Amadori rearrangement product and the possible forma-
tion of diglucosylamine (10, 24). It was concluded that PM did
not influence significantly the rates of glucose and asparagine
consumption, and its effect on AA formation would take place
in a more advanced stage of the reaction.
The thermal stability of PM was also evaluated in the presence
of Glc and Asn, where thermal decomposition of PM is limited
when heated alone (Figure 4a). Degradation was found to be
up to 20% depending of the temperature and time, indicating
that most of the PM remains reactive. However, degradation of
PM is rapidly enhanced in the presence of Glc and Asn in the
reaction media, being almost consumed after only a few minutes
(Figure 4b) because PM is participating in the advanced stages
of the MR. At 160 and 180 C a complete loss of PM was
observed after just 2 min of reaction. Then, PM reacted very
efficiently in the Glc/Asn reaction system, where PL and PN
are also detected as reaction products in the chromatogram
profile as well as other minor unknown compounds.
Previous studies have demonstrated that 3-APA is a transient
intermediate in AA formation during thermal treatment (15, 25).
Furthermore, it may also be formed by enzymatic decarboxylation
of Asn (26), via decarboxylation of the Schiff base (4), and through
the Schiff base formed from Asn and R-hydroxycarbonyl (27) or
reaction with pyruvic acid (5). This point was confirmed in the
present study when the concentration of 3-APA in the reaction
mixtures clearly showed an exponential increase followed by a
decrease after prolonged time depending on the temperature
(Figure 5). When the temperature was increased, 3-APA yields
increased in both model systems. However, the presence of PM
did not show an inhibitory action on 3-APA; in contrast, PM
enhanced the net formation of 3-APA at 140, 160, and 180 C (no
significant effect was found at the lowest temperature). These data
suggest that the action mechanism of PM could be taking place at
this step, blocking the reaction of 3-APA through AA or blocking
other routes of AA formation (such as degradation of the Amadori
products or Schiff base and formation of reactive intermediary
compounds) through the formation of 3-APA.
Browning is a classical feature of the extent of the MR in its
advanced/final stages, and it has been directly related to AA
formation in both model systems and foods (see ref 28). Figure
6 depicts the extent of browning in the control model system
and with the addition of PM. In the Glc/Asn model (Figure
6a), browning increased rapidly with temperature until a
maximum; after that, browning remains more stable with time.
Results are in line with previous studies (17). Similar behavior
was observed in the Glc/Asn/PM system (Figure 6b). Browning
was also directly related with the temperature, where a
maximum is obtained. At 120 and 140 C, browning increased
steadily, whereas at 160 and 180 C the absorbance reached a
peak and finally decreased followed by a plateau. However,
browning was nearly 2-fold less in the presence of PM. These
findings indicate that PM strongly reduces the advanced and
final stages of the MR and, subsequently, PM action on AA is
connected to its inhibitory effect on the activity of the MR and
the formation of intermediary reactive compounds as reported
for in vivo studies.
Dose-Response and Structure-Related Effect of PM on
AA Formation. The dose-response of different vitamins on AA
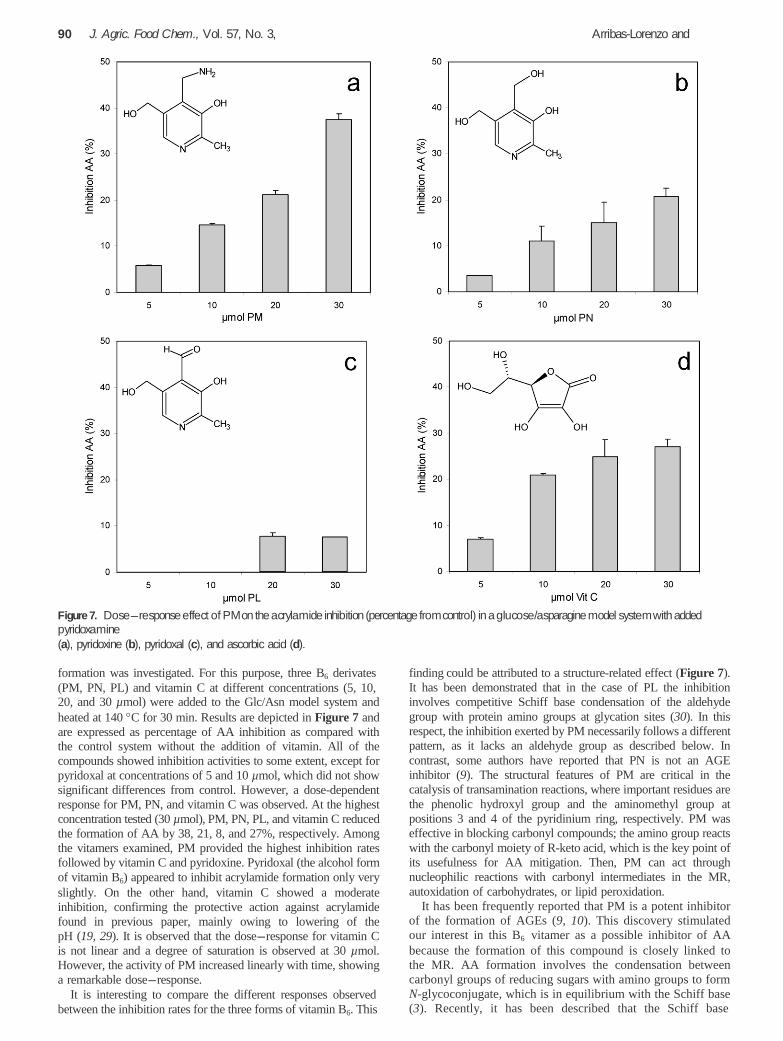
907
J. Agric. Food Chem., Vol. 57, No. 3, 2009
Arribas-Lorenzo and Morales
Figure 7. Dose-response effect of PM on the acrylamide inhibition (percentage from control) in a glucose/asparagine model system with added
pyridoxamine
(a), pyridoxine (b), pyridoxal (c), and ascorbic acid (d).
formation was investigated. For this purpose, three B6 derivates
(PM, PN, PL) and vitamin C at different concentrations (5, 10, 20, and 30 µmol) were added to the Glc/Asn model system and
heated at 140 C for 30 min. Results are depicted in Figure 7 and
are expressed as percentage of AA inhibition as compared with
the control system without the addition of vitamin. All of the
compounds showed inhibition activities to some extent, except for
pyridoxal at concentrations of 5 and 10 µmol, which did not show
significant differences from control. However, a dose-dependent
response for PM, PN, and vitamin C was observed. At the highest
concentration tested (30 µmol), PM, PN, PL, and vitamin C reduced
the formation of AA by 38, 21, 8, and 27%, respectively. Among
the vitamers examined, PM provided the highest inhibition rates
followed by vitamin C and pyridoxine. Pyridoxal (the alcohol form
of vitamin B6) appeared to inhibit acrylamide formation only very
slightly. On the other hand, vitamin C showed a moderate
inhibition, confirming the protective action against acrylamide
found in previous paper, mainly owing to lowering of the
pH (19, 29). It is observed that the dose-response for vitamin C
is not linear and a degree of saturation is observed at 30 µmol.
However, the activity of PM increased linearly with time, showing
a remarkable dose-response.
It is interesting to compare the different responses observed
between the inhibition rates for the three forms of vitamin B6. This
finding could be attributed to a structure-related effect (Figure 7).
It has been demonstrated that in the case of PL the inhibition
involves competitive Schiff base condensation of the aldehyde
group with protein amino groups at glycation sites (30). In this
respect, the inhibition exerted by PM necessarily follows a different
pattern, as it lacks an aldehyde group as described below. In
contrast, some authors have reported that PN is not an AGE
inhibitor (9). The structural features of PM are critical in the
catalysis of transamination reactions, where important residues are
the phenolic hydroxyl group and the aminomethyl group at
positions 3 and 4 of the pyridinium ring, respectively. PM was
effective in blocking carbonyl compounds; the amino group reacts
with the carbonyl moiety of R-keto acid, which is the key point of
its usefulness for AA mitigation. Then, PM can act through
nucleophilic reactions with carbonyl intermediates in the MR,
autoxidation of carbohydrates, or lipid peroxidation.
It has been frequently reported that PM is a potent inhibitor
of the formation of AGEs (9, 10). This discovery stimulated
our interest in this B6 vitamer as a possible inhibitor of AA
because the formation of this compound is closely linked to
the MR. AA formation involves the condensation between
carbonyl groups of reducing sugars with amino groups to form
N-glycoconjugate, which is in equilibrium with the Schiff base
(3). Recently, it has been described that the Schiff base
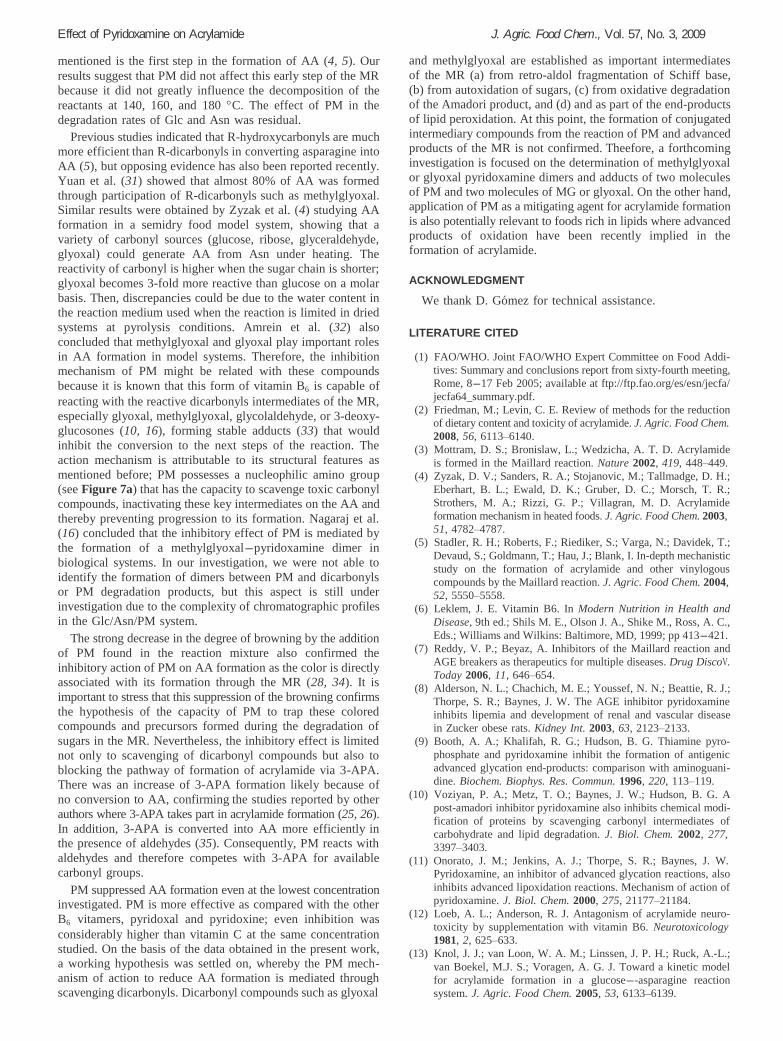
Effect of Pyridoxamine on Acrylamide Formation
J. Agric. Food Chem., Vol. 57, No. 3, 2009 908
mentioned is the first step in the formation of AA (4, 5). Our
results suggest that PM did not affect this early step of the MR
because it did not greatly influence the decomposition of the
reactants at 140, 160, and 180 C. The effect of PM in the
degradation rates of Glc and Asn was residual.
Previous studies indicated that R-hydroxycarbonyls are much
more efficient than R-dicarbonyls in converting asparagine into
AA (5), but opposing evidence has also been reported recently.
Yuan et al. (31) showed that almost 80% of AA was formed
through participation of R-dicarbonyls such as methylglyoxal.
Similar results were obtained by Zyzak et al. (4) studying AA
formation in a semidry food model system, showing that a
variety of carbonyl sources (glucose, ribose, glyceraldehyde,
glyoxal) could generate AA from Asn under heating. The
reactivity of carbonyl is higher when the sugar chain is shorter;
glyoxal becomes 3-fold more reactive than glucose on a molar
basis. Then, discrepancies could be due to the water content in
the reaction medium used when the reaction is limited in dried
systems at pyrolysis conditions. Amrein et al. (32) also
concluded that methylglyoxal and glyoxal play important roles
in AA formation in model systems. Therefore, the inhibition
mechanism of PM might be related with these compounds
because it is known that this form of vitamin B6 is capable of
reacting with the reactive dicarbonyls intermediates of the MR,
especially glyoxal, methylglyoxal, glycolaldehyde, or 3-deoxy-
glucosones (10, 16), forming stable adducts (33) that would
inhibit the conversion to the next steps of the reaction. The
action mechanism is attributable to its structural features as
mentioned before; PM possesses a nucleophilic amino group
(see Figure 7a) that has the capacity to scavenge toxic carbonyl
compounds, inactivating these key intermediates on the AA and
thereby preventing progression to its formation. Nagaraj et al.
(16) concluded that the inhibitory effect of PM is mediated by
the formation of a methylglyoxal-pyridoxamine dimer in
biological systems. In our investigation, we were not able to
identify the formation of dimers between PM and dicarbonyls
or PM degradation products, but this aspect is still under
investigation due to the complexity of chromatographic profiles
in the Glc/Asn/PM system.
The strong decrease in the degree of browning by the addition
of PM found in the reaction mixture also confirmed the
inhibitory action of PM on AA formation as the color is directly
associated with its formation through the MR (28, 34). It is
important to stress that this suppression of the browning confirms
the hypothesis of the capacity of PM to trap these colored
compounds and precursors formed during the degradation of
sugars in the MR. Nevertheless, the inhibitory effect is limited
not only to scavenging of dicarbonyl compounds but also to
blocking the pathway of formation of acrylamide via 3-APA.
There was an increase of 3-APA formation likely because of
no conversion to AA, confirming the studies reported by other
authors where 3-APA takes part in acrylamide formation (25, 26).
In addition, 3-APA is converted into AA more efficiently in
the presence of aldehydes (35). Consequently, PM reacts with
aldehydes and therefore competes with 3-APA for available
carbonyl groups.
PM suppressed AA formation even at the lowest concentration
investigated. PM is more effective as compared with the other
B6 vitamers, pyridoxal and pyridoxine; even inhibition was
considerably higher than vitamin C at the same concentration
studied. On the basis of the data obtained in the present work,
a working hypothesis was settled on, whereby the PM mech-
anism of action to reduce AA formation is mediated through
scavenging dicarbonyls. Dicarbonyl compounds such as glyoxal
and methylglyoxal are established as important intermediates
of the MR (a) from retro-aldol fragmentation of Schiff base,
(b) from autoxidation of sugars, (c) from oxidative degradation
of the Amadori product, and (d) and as part of the end-products
of lipid peroxidation. At this point, the formation of conjugated
intermediary compounds from the reaction of PM and advanced
products of the MR is not confirmed. Theefore, a forthcoming
investigation is focused on the determination of methylglyoxal
or glyoxal pyridoxamine dimers and adducts of two molecules
of PM and two molecules of MG or glyoxal. On the other hand,
application of PM as a mitigating agent for acrylamide formation
is also potentially relevant to foods rich in lipids where advanced
products of oxidation have been recently implied in the
formation of acrylamide.
ACKNOWLEDGMENT
We thank D. Go mez for technical assistance.
LITERATURE CITED (1) FAO/WHO. Joint FAO/WHO Expert Committee on Food Addi-
tives: Summary and conclusions report from sixty-fourth meeting,
Rome, 8-17 Feb 2005; available at ftp://ftp.fao.org/es/esn/jecfa/
jecfa64_summary.pdf.
(2) Friedman, M.; Levin, C. E. Review of methods for the reduction
of dietary content and toxicity of acrylamide. J. Agric. Food Chem.
2008, 56, 6113–6140.
(3) Mottram, D. S.; Bronislaw, L.; Wedzicha, A. T. D. Acrylamide
is formed in the Maillard reaction. Nature 2002, 419, 448–449.
(4) Zyzak, D. V.; Sanders, R. A.; Stojanovic, M.; Tallmadge, D. H.;
Eberhart, B. L.; Ewald, D. K.; Gruber, D. C.; Morsch, T. R.;
Strothers, M. A.; Rizzi, G. P.; Villagran, M. D. Acrylamide
formation mechanism in heated foods. J. Agric. Food Chem. 2003,
51, 4782–4787.
(5) Stadler, R. H.; Roberts, F.; Riediker, S.; Varga, N.; Davidek, T.;
Devaud, S.; Goldmann, T.; Hau, J.; Blank, I. In-depth mechanistic
study on the formation of acrylamide and other vinylogous
compounds by the Maillard reaction. J. Agric. Food Chem. 2004,
52, 5550–5558.
(6) Leklem, J. E. Vitamin B6. In Modern Nutrition in Health and
Disease, 9th ed.; Shils M. E., Olson J. A., Shike M., Ross, A. C.,
Eds.; Williams and Wilkins: Baltimore, MD, 1999; pp 413-421.
(7) Reddy, V. P.; Beyaz, A. Inhibitors of the Maillard reaction and
AGE breakers as therapeutics for multiple diseases. Drug DiscoV.
Today 2006, 11, 646–654.
(8) Alderson, N. L.; Chachich, M. E.; Youssef, N. N.; Beattie, R. J.;
Thorpe, S. R.; Baynes, J. W. The AGE inhibitor pyridoxamine
inhibits lipemia and development of renal and vascular disease
in Zucker obese rats. Kidney Int. 2003, 63, 2123–2133.
(9) Booth, A. A.; Khalifah, R. G.; Hudson, B. G. Thiamine pyro-
phosphate and pyridoxamine inhibit the formation of antigenic
advanced glycation end-products: comparison with aminoguani-
dine. Biochem. Biophys. Res. Commun. 1996, 220, 113–119.
(10) Voziyan, P. A.; Metz, T. O.; Baynes, J. W.; Hudson, B. G. A
post-amadori inhibitor pyridoxamine also inhibits chemical modi-
fication of proteins by scavenging carbonyl intermediates of
carbohydrate and lipid degradation. J. Biol. Chem. 2002, 277,
3397–3403.
(11) Onorato, J. M.; Jenkins, A. J.; Thorpe, S. R.; Baynes, J. W.
Pyridoxamine, an inhibitor of advanced glycation reactions, also
inhibits advanced lipoxidation reactions. Mechanism of action of
pyridoxamine. J. Biol. Chem. 2000, 275, 21177–21184.
(12) Loeb, A. L.; Anderson, R. J. Antagonism of acrylamide neuro-
toxicity by supplementation with vitamin B6. Neurotoxicology
1981, 2, 625–633.
(13) Knol, J. J.; van Loon, W. A. M.; Linssen, J. P. H.; Ruck, A.-L.;
van Boekel, M.J. S.; Voragen, A. G. J. Toward a kinetic model
for acrylamide formation in a glucose--asparagine reaction
system. J. Agric. Food Chem. 2005, 53, 6133–6139.
Effect of Pyridoxamine on Acrylamide Formation
J. Agric. Food Chem., Vol. 57, No. 3, 2009 909
(14) Rufian-Henares, J. A.; Arribas-Lorenzo, G.; Morales, F. J.
Acrylamide content of selected Spanish foods: survey of biscuits
and bread derivatives. Food Addit. Contam. 2007, 24, 343–350.
(15) Bagdonaite, K.; Viklund, G.; Skog, K.; Murkovic, M. Analysis
of 3-aminopropionamide: a potential precursor of acrylamide.
J. Biochem. Biophys. Methods 2006, 69, 215–221.
(16) Nagaraj, R. H.; Sarkar, P.; Mally, A.; Biemel, K. M.; Lederer,
M. O.; Padayatti, P. S. Effect of pyridoxamine on chemical
modification of proteins by carbonyls in diabetic rats: character-
ization of a major product from the reaction of pyridoxamine and
methylglyoxal. Arch. Biochem. Biophys. 2002, 402, 110–119.
(17) Becalski, A.; Lau, B. P.-Y.; Lewis, D.; Seaman, S. W. Acrylamide
in foods: occurrence, sources, and modeling. J. Agric. Food Chem.
2003, 51, 802–808.
(18) Ehling, S.; Shibamoto, T. Correlation of acrylamide generation
in thermally processed model system of asparagine and glucose
with color formation, amounts of pyrazines formed, and antioxi-
dative properties of extracts. J. Agric. Food Chem. 2005, 53, 4813–
4819.
(19) Rydberg, P.; Eriksson, S.; Tareke, E.; Karlsson, P.; Ehrenberg,
L.; To rnqvist, M. Investigations of factors that influence the
acrylamide content of heated foodstuffs. J. Agric. Food Chem.
2003, 51, 7012–7018.
(20) Vleeschouwer, K.; Van der Plancken, I.; Van Loey, A.; Hendrickx,
M. Impact of pH on the kinetics of acrylamide formation/
elimination reactions in model systems. J. Agric. Food Chem.
2006, 54, 7847–7855.
(21) Bråthen, E.; Knutsen, S. H. Effect of temperature and time on
the formation of acrylamide in starch-based and cereal model
systems, flat breads and bread. Food Chem. 2005, 92, 693–700.
(22) Adrover, M.; Volanova, B.; Mun oz, F.; Donoso, J. Inhibition of
glycosylation processes: the reaction between pyridoxamine and
glucose. Chem. BiodiVers. 2005, 2, 964–975.
(23) Vleeschouwera, K.; Planckena, I. V.; Loey, A. V.; Hendrickx,
M. E. The kinetics of acrylamide formation/elimination in
precursor in acrylamide formation. J. Agric. Food Chem. 2004,
52, 4751–4757.
(27) Schieberle, P.; Ko hler, P.; Granvogl, M. News aspects on the
formation and analysis of acrylamide. Chemistry and Safety of
Acrylamide in Food. AdV. Exp. Med. Biol. 2005, 561, 205–227.
(28) Go kmen, V.; Acar, O .C .; Arribas-Lorenzo, G.; Morales, F. J.
Investigating the correlation between acrylamide content and
browning ratio of model cookies. J. Food Eng. 2008, 87, 380–
385.
(29) Levine, R. A.; Smith, R. E. Sources of variability of acrylamide
levels in a cracker model. J. Agric. Food Chem. 2005, 53, 4410–
4416.
(30) Khatami, M.; Suldan, Z.; David, I.; Li, W.; Rockey, J. H.
Inhibitory effects of pyridoxal phosphate, ascorbate and ami-
noguanidine on nonenzymatic glycosylation. Life Sci. 1988, 43,
1725–1731.
(31) Yuan, Y.; Zhao, G.-H.; Hu, X.-S.; Wu, J.-H.; Liu, J.; Chen, F.
High correlation of methylglyoxal with acrylamide formation in
glucose/asparagine Maillard reaction model. Eur. Food Res.
Technol. 2008, 226, 1301–1307.
(32) Amrein, T. B.; Andres, L.; Giuseppe, G.; Manzardo, G.; Amado,
R. Investigations on the promoting effect of ammonium hydro-
carbonate on the formation of acrylamide in model system. J.
Agric. Food Chem. 2006, 54, 10253–10261.
(33) Voziyan, P. A.; Khalifah, R. G.; Thibaudeau, C.; Yildiz, A.; Jacob,
J.; Serianni, A. S.; Hudson, B. G. Modification of proteins in vitro
by physiological levels of glucose. J. Biol. Chem. 2003, 278,
46616–46624.
(34) Mustafa, A.; Andersson, R.; Rosen, H.; Kamal-Eldin, A.; Aman,
P. Factors influencing acrylamide content and color in rye crisp
bread. J. Agric. Food Chem. 2005, 53, 5985–5989.
(35) Perez-Locas, C.; Yaylayan, V. A. Further insight into thermally
and pH-induced generation of acrylamide from glucose/asparagine
model systems. J. Agric. Food Chem. 2008, 56, 6069–6074.
asparaginesglucose systems at different initial reactant concentra-
tions and ratios. Food Chem. 2008, 111, 719–729.
(24) Martins, S. I. F. S.; Van Boekel, M. A. J. S. A kinetic model for
the glucose/glycine Maillard reaction pathways. Food Chem. 2005,
90, 257–269.
(25) Granvogl, M.; Schieberle, P. Thermally generated 3-aminopro-
pionamide as a transient intermediate in the formation of acry-
lamide. J. Agric. Food Chem. 2006, 54, 5933–5938.
(26) Granvogl, M.; Jezussek, M.; Koehler, P.; Schieberle, P. Quanti-
tation of 3-aminopropionamide in potatoessa minor but potent
Received for review September 15, 2008. Revised manuscript received
December 2, 2008. Accepted December 6, 2008. This work was carried
out within the framework of COST 927 thermally processed foods:
possible health implication. Research has been partly fund by Conse-
jeria Educacio n y Ciencia (CAM) under project ANALISYC Program,
S-505/AGR-0312. G.A.-L. was the recipient of a grant from Conserjerıa
de Educacio n de la Comunidad de Madrid.
JF802870T
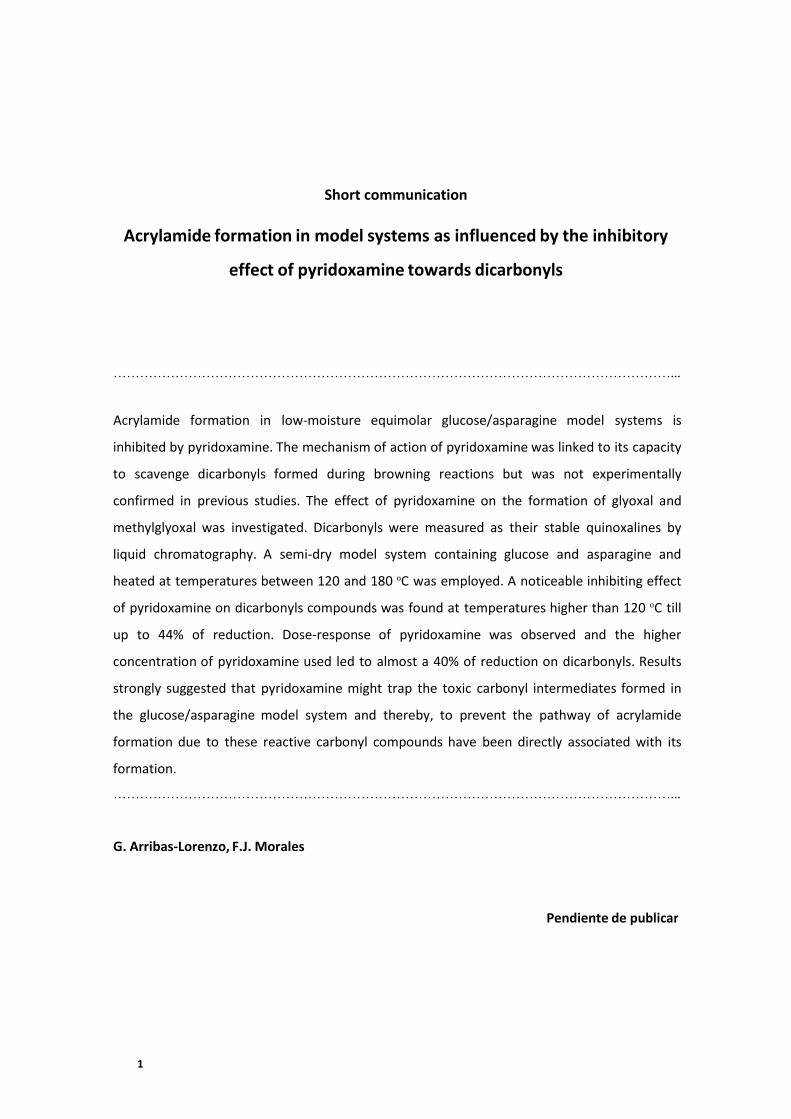
1
Short communication
Acrylamide formation in model systems as influenced by the inhibitory
effect of pyridoxamine towards dicarbonyls
………………………………………………………………………………………………………………...
Acrylamide formation in low‐moisture equimolar glucose/asparagine model systems is
inhibited by pyridoxamine. The mechanism of action of pyridoxamine was linked to its capacity
to scavenge dicarbonyls formed during browning reactions but was not experimentally
confirmed in previous studies. The effect of pyridoxamine on the formation of glyoxal and
methylglyoxal was investigated. Dicarbonyls were measured as their stable quinoxalines by
liquid chromatography. A semi‐dry model system containing glucose and asparagine and
heated at temperatures between 120 and 180 ºC was employed. A noticeable inhibiting effect
of pyridoxamine on dicarbonyls compounds was found at temperatures higher than 120 ºC till
up to 44% of reduction. Dose‐response of pyridoxamine was observed and the higher
concentration of pyridoxamine used led to almost a 40% of reduction on dicarbonyls. Results
strongly suggested that pyridoxamine might trap the toxic carbonyl intermediates formed in
the glucose/asparagine model system and thereby, to prevent the pathway of acrylamide
formation due to these reactive carbonyl compounds have been directly associated with its
formation.
………………………………………………………………………………………………………………...
G. Arribas‐Lorenzo, F.J. Morales
Pendiente de publicar
2
INTRODUCTION
Acrylamide (AA) is formed during both
industrial thermal processing and domestic
cooking of foods through the Maillard
reaction as the main mechanism (1, 2).
There is enough evidence about the
neurotoxic, genotoxic and carcinogenic
effect of AA (3). AA formation in foods is
dependent of several factors such as head
load, type and concentration of reactants,
moisture, pH, and certain additives among
others (4). Then small changes in the recipe
or processing conditions will cause large
changes in the final AA content in the
product. AA is ubiquitous in the food
supply although dietary exposure varies
with food commodities and consumption
habits of population for certain foods (5‐7).
In this sense, AA represents a potential
food safety issue for consumers which are
currently under close and deep evaluation
by the different Food Safety Authorities.
The main mechanism of acrylamide
formation in heated foods is the Maillard
reaction between sugars and amino acids
and several pathways have been proposed
(1, 8‐11). However, the role of the reactive
carbonyl intermediates from the Maillard
reaction, lipid oxidation and sugar
fragmentation on the AA formation is still
under investigation. Koutsidis et al. (12)
showed that the tautomerisation of the
carboxylated asparagine‐carbonyl Schiff
base is the key step in AA formation and
the type of carbonyls formed greatly
influenced the yield. Furthermore, 3‐
aminopropionamide, a transient
intermediate of the thermal degradation of
asparagine, can be deamined to form AA
(8). Some studies have reported the role of
α‐dicarbonyls such as glyoxal or
methylglyoxal in its formation since can
react with amino groups (11, 13, 14). In
addition, AA rapidly increased in cookies
formulated with thermooxidised oil reaching
levels about 59% higher as compared to the
reference sunflower oil (15). This conforms
that lipid oxidation produces a number of
carbonyl derivatives which feedback the
Maillard reaction and Strecker like reactions
to form AA (16). Recently, Koutsidis et al.
(17) showed a strong correlation between
the unsubstituted pyrazine and AA which
suggested the promotion of the formation of
the Maillard reaction intermediates, and in
particular glyoxal as the determining mode
of action in a low‐moisture asparagine‐
glucose model system.
In a previous study, we investigated the
ability of pyridoxamine (PM) to inhibit AA
formation in glucose/asparagine model
systems (18). PM clearly reduced the yield of
AA formation, but the mechanism of action
was under investigation. We hypothesized
dicarbonyls, derived from Maillard reaction,
caramelization or lipid peroxidation, might
be involved in AA formation due to PM is
3
capable of scavenging these reactive toxic
intermediates (19, 20). Furthermore, PM is
considered as a post‐Amadori inhibitor
capable of inhibiting the formation of
advanced glycation end‐products (AGEs) as
well as advanced lipoxidation end‐products
(ALEs) formation (19, 21‐24).
As a continuation of our research, herein it
is investigated if the reduction of AA is
closely associated to the inhibition rates of
glyoxal (GO) and methylglyoxal (MGO) by
PM. For this purpose, GO and MGO were
measured as their stables quinoxalines by
HPLC‐DAD method in the reaction media in
order to follow their response.
MATERIALS AND METHODS
Materials. Glyoxal, methylglyoxal,
orthophenylenediamine (OPD) and and 5‐
methylquinoxaline (5‐MQ) were supplied
by Sigma (St. Louis, MO, USA). Methanol of
HPLC grade was obtained from LabScan
(Dublin, Ireland). Sodium dihydrogen
phosphate monohydrate and glacial acetic
acid were acquired from Merck
(Darmstadt, Germany). Ultra pure water
was used (Milli‐Q system, Millipore
Bedford, MA, USA). Oasis‐HLB cartridges
(30 mg, 1 mL) were supplied by Waters
(Milford, MA, USA). All other chemicals and
reagents used were described in Arribas‐
Lorenzo and Morales (2009).
Model Systems. Low‐moisture model
systems used were described in Arribas‐
Lorenzo and Morales (2009).
Determination and quantification of GO
and MGO. Two‐hundred µL were taken
from heated model system and mixed with
375 µL of sodium phosphate buffer, 200 µL
of OPD (10 mM) and certain amounts of 5‐
MQ (internal standard). The mixture was
incubated for 3 h at 65‐70 ºC in an oven
(model 235, J. P. Selecta, Barcelona, Spain).
After cooling, 200 µL of acetic acid was
added to the derivatized mixture. The
sample was then loaded onto the solid
phase extraction (SPE) column (Oasis‐HLB)
(the SPE step had previously been
optimized, see Results and Discussion), and
eluent was discharged. Next, 1mL of a
mixture of methanol:0.5% acetic acid
(40:60, v/v) and eluent was discharged.
Finally, 1 mL of methanol was passed
through the cartridge and the eluent
collected in an amberlite vial. The analysis
was carried out at least in duplicate.
The quantification of GO and MGO was
carried out by HPLC‐UV according to the
method of Arribas‐Lorenzo and Morales
(2009).
Statistical Analysis. Data are expressed as
mean of two or more independent
determinations. Differences with P<0.05
were considered to be statistically
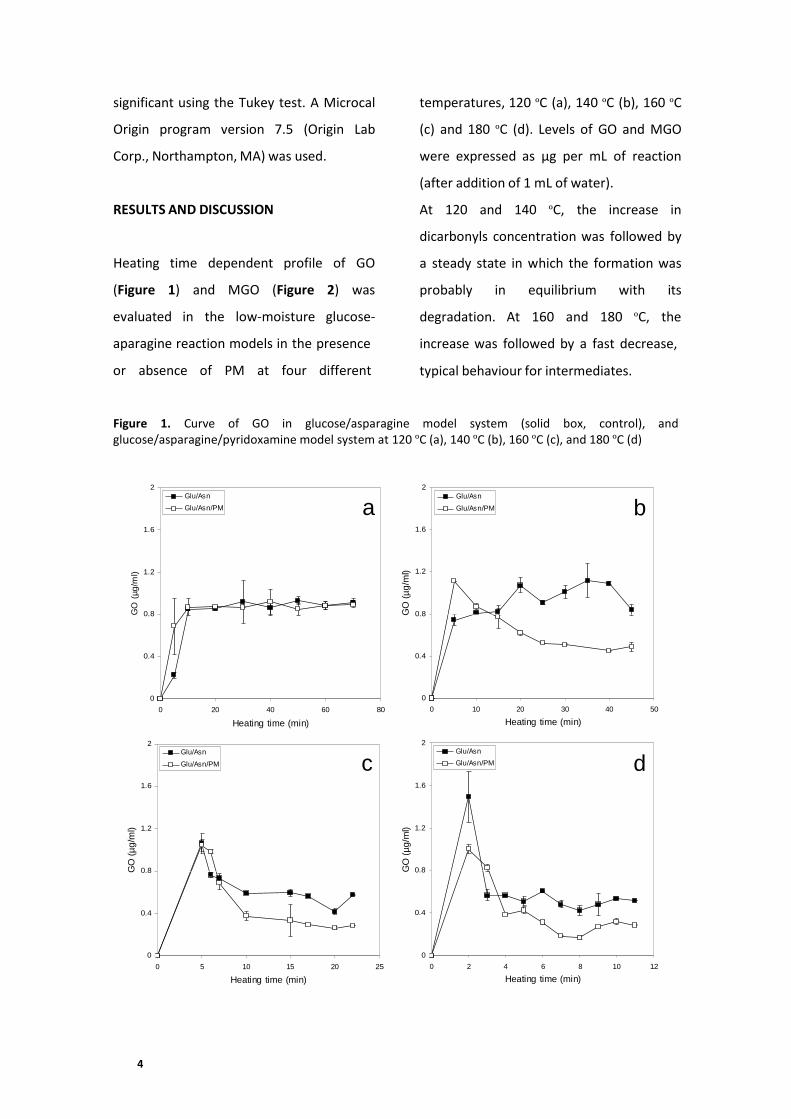
4
2 Glu/As n
Glu/As n/PM a 1.6
l 1.2 ) m / g µ (
GO 0.8
0.4
0
0 20 40 60 80
Heating time (min)
2 Glu/As n
Glu/As n/PM a 1.6
l 1.2 ) m / g µ (
GO 0.8
0.4
0
0 20 40 60 80
Heating time (min)
2 Glu/As n
Glu/As n/PM a 1.6
l 1.2 ) m / g µ (
GO 0.8
0.4
0
0 20 40 60 80
Heating time (min)
2 Glu/As n
Glu/As n/PM a 1.6
l 1.2 ) m / g µ (
GO 0.8
0.4
0
0 20 40 60 80
Heating time (min)
2 Glu/As n
Glu/As n/PM a 1.6
l 1.2 ) m / g µ (
GO 0.8
0.4
0
0 20 40 60 80
Heating time (min)
2 Glu/As n
Glu/As n/PM a 1.6
l 1.2 ) m / g µ (
GO 0.8
0.4
0
0 20 40 60 80
Heating time (min)
2 Glu/As n
Glu/As n/PM a 1.6
l 1.2 ) m / g µ (
GO 0.8
0.4
0
0 20 40 60 80
Heating time (min)
2
Glu/As n
Glu/As n/PM d 1.6
ml) 1.2
/ g µ (
GO 0.8
0.4
0
0 2 4 6 8 10 12
Heating time (min)
2 Glu/As n
Glu/As n/PM c 1.6
l 1.2 ) m / g µ (
GO 0.8
0.4
0
0 5 10 15 20 25
Heating time (min)
2
Glu/As n
Glu/As n/PM b 1.6
l 1.2 ) m / g µ (
GO 0.8
0.4
0
0 10 20 30 40 50
Heating time (min)
2 Glu/As n
Glu/As n/PM a 1.6
l 1.2 ) m / g µ (
GO 0.8
0.4
0
0 20 40 60 80
Heating time (min)
2 Glu/As n
Glu/As n/PM a 1.6
l 1.2 ) m / g µ (
GO 0.8
0.4
0
0 20 40 60 80
Heating time (min)
2 Glu/As n
Glu/As n/PM a 1.6
l 1.2 ) m / g µ (
GO 0.8
0.4
0
0 20 40 60 80
Heating time (min)
2 Glu/As n
Glu/As n/PM a 1.6
l 1.2 ) m / g µ (
GO 0.8
0.4
0
0 20 40 60 80
Heating time (min)
2 Glu/As n
Glu/As n/PM a 1.6
l 1.2 ) m / g µ (
GO 0.8
0.4
0
0 20 40 60 80
Heating time (min)
2 Glu/As n
Glu/As n/PM a 1.6
l 1.2 ) m / g µ (
GO 0.8
0.4
0
0 20 40 60 80
Heating time (min)
GO
(µ
g/m
l)
GO
(µg/m
l)
GO
(µ
g/m
l)
GO
(µ
g/m
l)
significant using the Tukey test. A Microcal
Origin program version 7.5 (Origin Lab
Corp., Northampton, MA) was used.
RESULTS AND DISCUSSION
Heating time dependent profile of GO
(Figure 1) and MGO (Figure 2) was
evaluated in the low‐moisture glucose‐
aparagine reaction models in the presence
or absence of PM at four different
temperatures, 120 ºC (a), 140 ºC (b), 160 ºC
(c) and 180 ºC (d). Levels of GO and MGO
were expressed as µg per mL of reaction
(after addition of 1 mL of water).
At 120 and 140 ºC, the increase in
dicarbonyls concentration was followed by
a steady state in which the formation was
probably in equilibrium with its
degradation. At 160 and 180 ºC, the
increase was followed by a fast decrease,
typical behaviour for intermediates.
Figure 1. Curve of GO in glucose/asparagine model system (solid box, control), and glucose/asparagine/pyridoxamine model system at 120 ºC (a), 140 ºC (b), 160 ºC (c), and 180 ºC (d)
2
1.6
Glu/As n
Glu/As n/PM a 2
1.6
Glu/As n
Glu/As n/PM b
1.2 1.2
0.8 0.8
0.4 0.4
0
0 20 40 60 80
Heating time (min)
0
0 10 20 30 40 50
Heating time (min)
2
1.6
Glu/As n
Glu/As n/PM
2
c 1.6
Glu/As n
Glu/As n/PM d
1.2 1.2
0.8 0.8
0.4 0.4
0
0 5 10 15 20 25
Heating time (min)
0
0 2 4 6 8 10 12
Heating time (min)

5
2
Glu/As n
Glu/As n/PM c 1.6
)
ml 1.2
/ g µ ( O
MG 0.8
0.4
0
0 5 10 15 20 25
Heating time (min)
2 Glu/As n
Glu/As n/PM a 1.6
)
m 1.2
l / g µ (
MGO 0.8
0.4
0
0 20 40 60 80
Heating time (min)
2
Glu/As n
Glu/As n/PM b 1.6
)
ml 1.2
/ g µ (
MGO 0.8
0.4
0
0 10 20 30 40 50
Heating time (min)
2 Glu/As n
Glu/As n/PM d 1.6
)
m 1.2
l / g (µ O
MG 0.8
0.4
0
0 2 4 6 8 10 12
Heating time (min)
MG
O (
µg
/ml)
MG
O (
µg/m
l)
MG
O (
µg
/ml)
MG
O (
µg
/ml)
Figure 2. Curve of MGO in glucose/asparagine model system (solid box, control), and glucose/asparagine/pyridoxamine model system at 120 ºC (a), 140 ºC (b), 160 ºC (c), and 180 ºC (d).
2
1.6
Glu/As n
Glu/As n/PM
2
a 1.6
Glu/As n
Glu/As n/PM b
1.2 1.2
0.8 0.8
0.4 0.4
0
0 20 40 60 80
Heating time (min)
0
0 10 20 30 40 50
Heating time (min)
2
1.6
Glu/As n
Glu/As n/PM
2
c 1.6
Glu/As n
Glu/As n/PM d
1.2 1.2
0.8 0.8
0.4 0.4
0
0 5 10 15 20 25
Heating time (min)
0
0 2 4 6 8 10 12
Heating time (min)
During heating, the presence of PM in the
reaction media became relevant in the
reduction of levels of dicarbonyls at 140,
160 and 180 ºC but not at 120 ºC. At a first
stage it was not any reduction, and after of
an initial period a decrease in GO and MGO
concentration was observed with time. Then
similar behaviour was found for both
dicarbonyl compounds. In addition, our
results agreed with previous studies
demonstrating that time and temperatures
are parameters that affect MGO and GO
formation (14, 25). It is worth noting that
in our previous study the curves of
acrylamide showed similar profile.
In order to describe the inhibitory effect of
PM towards dicarbonyls, the percentage of
inhibition for GO and MGO compared to
control for all heating times at each
temperature was depicted (Figure 3).
Inhibition ranged from 17% up to 63% at
180 ºC for GO, and in the case of MGO,
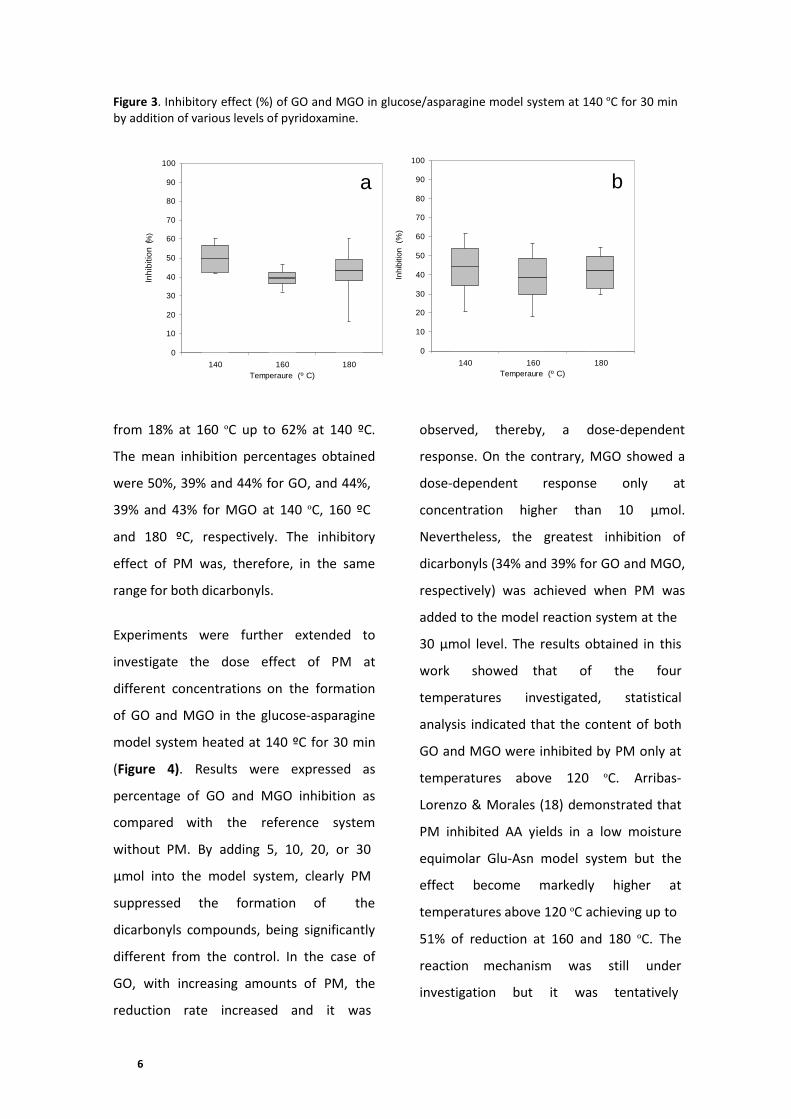
6
100
90 b 80
70
) % 60 ( n o ti 50 i b i h In 40
30
20
10
0
140 160 180
Temperaure (º C)
100
90 a 80
70
(%) 60
on
bit 50
i
nhi 40 I
30
20
10
0
140 160 180
Temperaure (º C)
Inh
ibitio
n (
%)
Inh
ibitio
n (%
)
Figure 3. Inhibitory effect (%) of GO and MGO in glucose/asparagine model system at 140 ºC for 30 min by addition of various levels of pyridoxamine.
100
90
80
70
60
50
40
30
20
10
0
a
140 160 180
Temperaure (º C)
100
90
80
70
60
50
40
30
20
10
0
b
140 160 180
Temperaure (º C)
from 18% at 160 ºC up to 62% at 140 ºC.
The mean inhibition percentages obtained
were 50%, 39% and 44% for GO, and 44%,
39% and 43% for MGO at 140 ºC, 160 ºC
and 180 ºC, respectively. The inhibitory
effect of PM was, therefore, in the same
range for both dicarbonyls.
Experiments were further extended to
investigate the dose effect of PM at
different concentrations on the formation
of GO and MGO in the glucose‐asparagine
model system heated at 140 ºC for 30 min
(Figure 4). Results were expressed as
percentage of GO and MGO inhibition as
compared with the reference system
without PM. By adding 5, 10, 20, or 30
µmol into the model system, clearly PM
suppressed the formation of the
dicarbonyls compounds, being significantly
different from the control. In the case of
GO, with increasing amounts of PM, the
reduction rate increased and it was
observed, thereby, a dose‐dependent
response. On the contrary, MGO showed a
dose‐dependent response only at
concentration higher than 10 µmol.
Nevertheless, the greatest inhibition of
dicarbonyls (34% and 39% for GO and MGO,
respectively) was achieved when PM was
added to the model reaction system at the
30 µmol level. The results obtained in this
work showed that of the four
temperatures investigated, statistical
analysis indicated that the content of both
GO and MGO were inhibited by PM only at
temperatures above 120 ºC. Arribas‐
Lorenzo & Morales (18) demonstrated that
PM inhibited AA yields in a low moisture
equimolar Glu‐Asn model system but the
effect become markedly higher at
temperatures above 120 ºC achieving up to
51% of reduction at 160 and 180 ºC. The
reaction mechanism was still under
investigation but it was tentatively
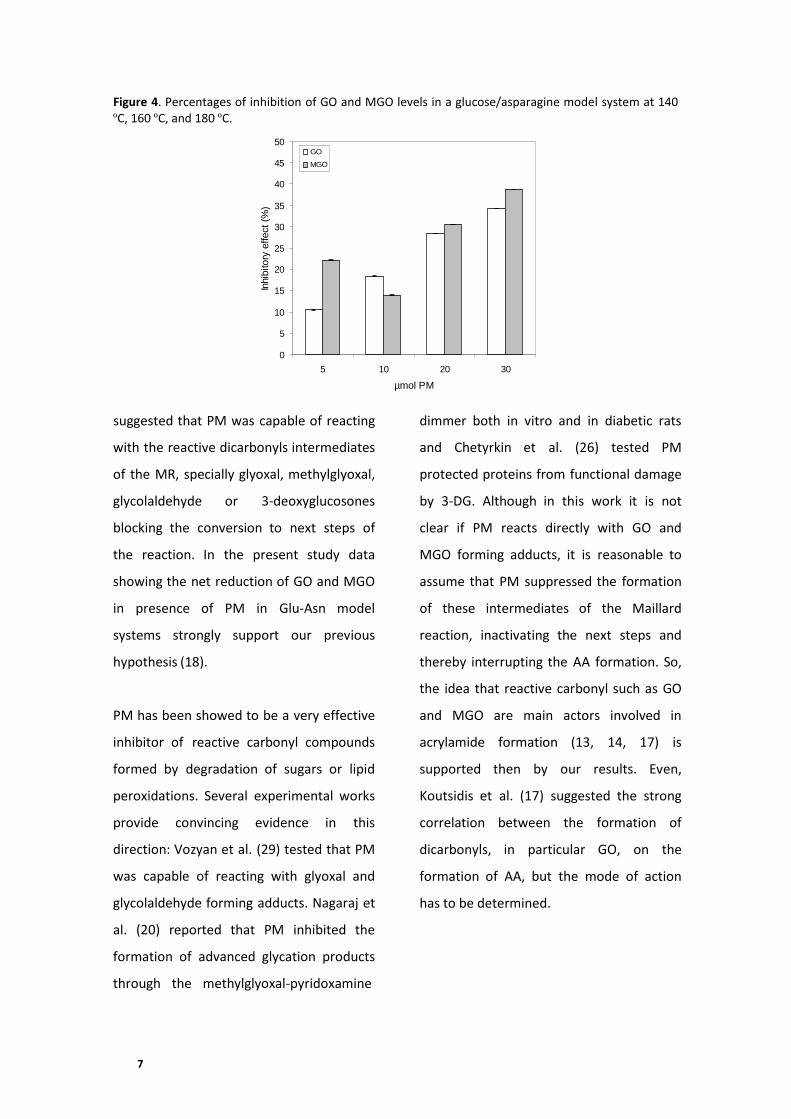
7
Inhib
itory
effect
(%)
Figure 4. Percentages of inhibition of GO and MGO levels in a glucose/asparagine model system at 140 ºC, 160 ºC, and 180 ºC.
50
GO
45 MGO
40
35
30
25
20
15
10
5
0
5 10 20 30
µmol PM
suggested that PM was capable of reacting
with the reactive dicarbonyls intermediates
of the MR, specially glyoxal, methylglyoxal,
glycolaldehyde or 3‐deoxyglucosones
blocking the conversion to next steps of
the reaction. In the present study data
showing the net reduction of GO and MGO
in presence of PM in Glu‐Asn model
systems strongly support our previous
hypothesis (18).
PM has been showed to be a very effective
inhibitor of reactive carbonyl compounds
formed by degradation of sugars or lipid
peroxidations. Several experimental works
provide convincing evidence in this
direction: Vozyan et al. (29) tested that PM
was capable of reacting with glyoxal and
glycolaldehyde forming adducts. Nagaraj et
al. (20) reported that PM inhibited the
formation of advanced glycation products
through the methylglyoxal‐pyridoxamine
dimmer both in vitro and in diabetic rats
and Chetyrkin et al. (26) tested PM
protected proteins from functional damage
by 3‐DG. Although in this work it is not
clear if PM reacts directly with GO and
MGO forming adducts, it is reasonable to
assume that PM suppressed the formation
of these intermediates of the Maillard
reaction, inactivating the next steps and
thereby interrupting the AA formation. So,
the idea that reactive carbonyl such as GO
and MGO are main actors involved in
acrylamide formation (13, 14, 17) is
supported then by our results. Even,
Koutsidis et al. (17) suggested the strong
correlation between the formation of
dicarbonyls, in particular GO, on the
formation of AA, but the mode of action
has to be determined.
8
In addition, in the earlier article it was
observed a reduction on AA by PM at all
times studied, on the contrary hereby,
there was no inhibitory effect until a more
prolonged time. For example, at 140 ºC it
was observed for 25 min, at 160 ºC for 10
min and 180 ºC for 4 min both GO and
MGO. It is noteworthy that those times
coincide with the times at which the
concentration of acrylamide was maximum
and from that point it started the
elimination pathway. Thus, it is likely that
PM only inhibits AA by dicarbonyls at final
stages and many others factors like 3‐APA
might contribute to the inhibitory effect of
AA as we demonstrated (18). To sum up
our research based on model system
confirms GO and MGO as the main
intermediates on formation of AA and the
capability of PM to inhibit them. There is a
margin of action in order to act in certain
key steps limiting the formation of
dicarbonyls to decrease the amount of
acrylamide formed through the Maillard
reaction. But approaches in acrylamide
reduction have to maintain the desirable
colour and flavour appreciated by
consumers before to transfer from model
systems to real foods.
ACKNOWLEDGEMENTS
Research has been partly fund under
project ANALYSIC (S‐505/AGR‐0312) and
Spanish Ministery of Science and
Techonology (AGL 2005‐01735). Gema
Arribas‐Lorenzo is gratefully to Conserjería
de Educación de la Comunidad de Madrid
and Fondo Social Europeo for PhD grant.
LITERATURE CITED (1) Mottram, D. S.; Bronislaw, L.; Wedzicha, A. T. D. Acrylamide is formed in the Maillard reaction. Nature. 2002, 419, 448‐449.
(2) Stadler, R. H.; Blank, I.; Varga, N.; Robert, F.; Hau, J.; Guy, P. A.; Robert, M. C.; Riediker, S. Acrylamide from Maillard reaction products. Nature. 2002, 419, 449‐450. (3) Shipp, A.; Lawrence, G.; Gentry, R.; McDonald, T.; Bartow, H.; Bounds, J.; Macdonald, N.; Clewell, H.; Allen, B.; Van Landingham C. Acrylamide: Review of toxicity data and dose–response analysis for cancer and noncancer effects. Crit. Rev. Tox. 2006, 36,
481–608. (4) Friedman, M.; Levin, C. E. Review of methods for the reduction of dietary content and toxicity of acrylamide. J. Agric. Food Chem. 2008, 56, 6113–6140. (5) Mestdagh, F.; Lachat, C.; Baert, K.; Moons, E.; Kolsteren, P.; Van Peteghem, C.; De Meulenaer, B. Importance of a canteen lunch on the dietary intake of acrylamide. Mol. Nutr. Food Res. 2007, 51, 509–516.
(6) Boon, P. E.; de Mul, A.; van der Voet, H.; van Donkersgoed, G.; Brette, M.; van Klaveren, J. D. Calculations of dietary exposure to acrylamide. Mut. Res. 2005, 580, 143–155.
(7) Arribas‐Lorenzo, G.; Morales, F. J. Dietary Exposure to acrylamide from potato crisps to Spanish population. Food Addit Cont.
2009, 26, 289‐297. (8) Granvogl, M.; Schieberle, P. Thermally generated 3‐aminopropionamide as a transient intermediate in the formation of acrylamide. J. Agric. Food Chem. 2006, 54, 5933–5938.
(9) Stadler, R. H.; Blank, I.; Varga, N.; Robert, F.; Hau, J.; Guy, P. A.; Robert, M. C.;
9
Riediker, S. Acrylamide from Maillard reaction products. Nature. 2002, 419, 449‐450.
(10) Weisshaar, R.; Gutsche, B. Formation of acrylamide in heated potato products ‐ Model experiments pointing to asparagine as precursor. Deutsche Lebensmittel‐Rundschau. 2002, 98, 397‐400.
(11) Zyzak, D. V.; Sanders, R. A.; Stojanovic, M.; Tallmadge, D. H.; Eberhart, B. L.; Ewald, D. K.; Gruber, D. C.; Morsch, T. R.; Strothers, M. A.; Rizzi, G. P.; Villagran, M. D. Acrylamide formation mechanism in heated foods. J. Agric. Food Chem. 2003, 51, 4782‐4787.
(12) Koutsidis, G.; de la Fuente, A.; Dimitriou, C.; Kakoulli, A.; Wedzicha, B. L.; Mottram, D. S. Acrylamide and pyrazine formation in model systems containing asparagine. J. Agric. Food Chem. 2008, 56,
6105‐6112.
(13) Yuan, Y.; Zhao, G‐H.; Hu, X‐S.; Wu, J‐H.; Liu, J.; Chen, F. High correlation of methylglyoxal with acrylamide formation in glucose/asparagine Maillard reaction model. Eur. Food Res.Tech. 2008, 226, 1301‐1307.
(14) Amrein, T. B.; Andres, L.; Giuseppe, G.; Manzardo, G.; Amado, R. Investigations on the promoting effect of ammonium hydrocarbonate on the formation of acrylamide in model system. J. Agric. Food Chem. 2006, 54, 10253‐10261.
(15) Arribas‐Lorenzo, G.; Fogliano, V.; Morales, F. J. Acrylamide formation in a cookie system as influenced by the oil phenol profile and degree of oxidation Eur. Food Res. Tech. 2009, 229, 63‐72.
(16) Zamora, R., Hidalgo, F. J. Contribution of lipid oxidation products to acrylamie formation in model systems. J. Agric. Food Chem. 2008, 56, 6075‐6080.
(17) Koutsidis, G.; Simons, S. P. J.; Thong, Y. H.; Haldoupis, Y.; Mojica‐Lazaro, J.; Wedzicha, B. L.; Mottram, D. S. Investigations on the Effect of Amino Acids on Acrylamide, Pyrazines, and Michael Addition Products in Model Systems. J. Agric. Food Chem. 2009, 57, 9011‐9015.
(18) Arribas‐Lorenzo G.; Morales F. J. Effect of pyridoxamine on acrylamide formation in a
glucose/asparagine model system. J. Agric. Food Chem. 2009, 57, 901‐909. (19) Voziyan, P. A.; Metz, T. O.; Baynes, J.W.; Hudson, B.G. A post‐amadori inhibitor pyridoxamine also inhibits chemical modification of proteins by scavenging carbonyl intermediates of carbohydrate and lipid degradation. J. Biol. Chem. 2002, 277, 3397‐ 3403.
(20) Nagaraj, R. H.; Sarkar, P.; Mally, A.; Biemel, K. M.; Lederer, M. O.; Padayatti, P. S. Effect of pyridoxamine on chemical modification of proteins by carbonyls in diabetic rats: characterization of a major product from the reaction of pyridoxamine and methylglyoxal. Arch. Biochem. Biophys. 2002, 402, 110‐119.
(21) Booth, A. A.; Khalifah, R. G.; Hudson, B. G. Thiamine pyrophosphate and pyridoxamine inhibit the formation of antigenic advanced glycation end‐products: comparison with aminoguanidine. Biochem. Biophys. Res. Commun. 1996, 220, 113‐119.
(22) Booth, A. A.; Khalifah, R. G.; Todd, P.; Hudson B. G. In vitro kinetic studies of formation of antigenic advanced glycation end products (AGEs). Novel inhibition of post‐ amadori glycation pathways. J.Biol.Chem. 1997,
272, 5430‐5437. (23) Khalifah, R. G.; Baynes, J. W.; Hudson, B. G. Amadorins: Novel post‐Amadori inhibitors of advanced glycation reactions. Biochem. Biophys. Res. Commun. 1999, 257, 251‐258. (24) Onorato, J. M.; Jenkins, A. J.; Thorpe, S. R.; Baynes, J. W. Pyridoxamine, an inhibitos of advanced glycation reactions, also inhibits advanced lipoxidation reactions. Mechanism of action of pyridoxamine. J.Biol. Chem. 2000, 275, 21177‐21184.
(25) Martins, S. I. F. S; Van Boeckel, M. A. J. S. Kinetics of the glucose/glycine Maillard reaction pathways: influences of pH and reactant initial concentrations. Food Chem. 2005, 92, 437‐448. (26) Chetyrkin, S. V.; Zhang, W.; Hudson, B. G.; Serianni, A. S. Voziyan, P. A. Pyridoxamine protects proteins from functional damage by 3‐ deoxyglucosine: mechanism of action of pyridoxamine. Biochem. 2008, 47, 997‐1006
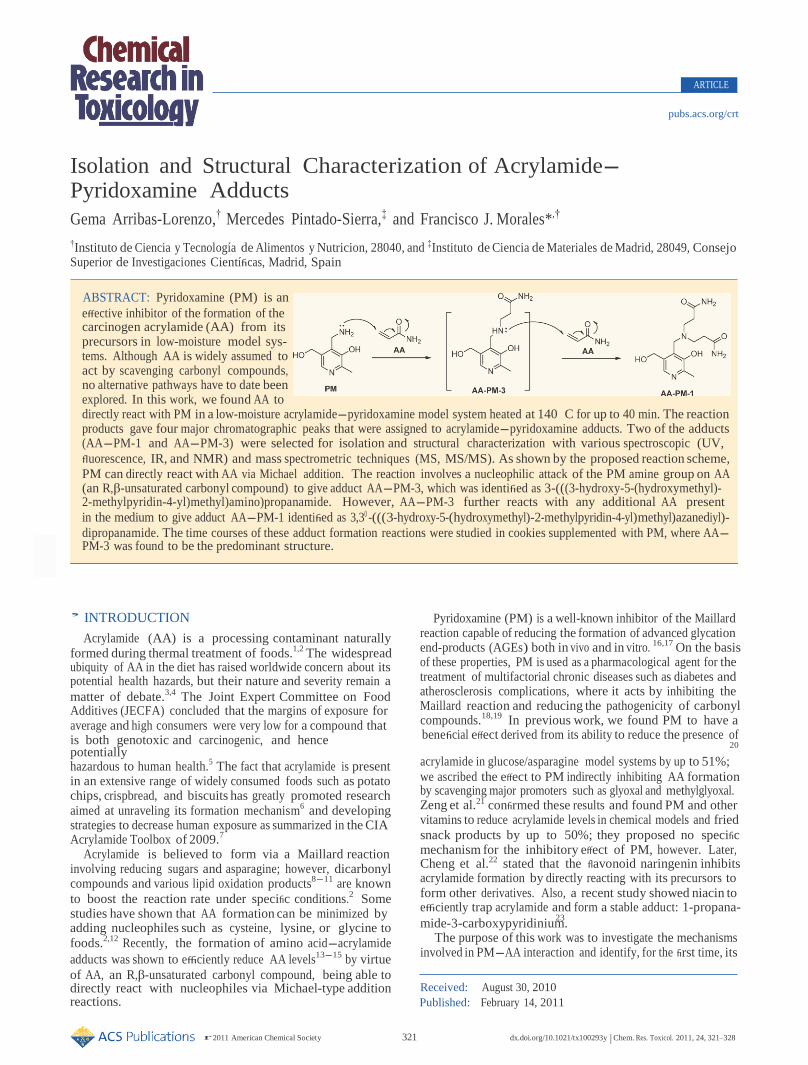
ARTICLE
pubs.acs.org/crt
Isolation and Structural Characterization of Acrylamide- Pyridoxamine Adducts
Gema Arribas-Lorenzo,† Mercedes Pintado-Sierra,‡ and Francisco J. Morales*,†
†Instituto de Ciencia y Tecnología de Alimentos y Nutrici on, 28040, and ‡Instituto de Ciencia de Materiales de Madrid, 28049, Consejo
Superior de Investigaciones Científicas, Madrid, Spain
ABSTRACT: Pyridoxamine (PM) is an
effective inhibitor of the formation of the carcinogen acrylamide (AA) from its precursors in low-moisture model sys- tems. Although AA is widely assumed to act by scavenging carbonyl compounds, no alternative pathways have to date been explored. In this work, we found AA to directly react with PM in a low-moisture acrylamide-pyridoxamine model system heated at 140 C for up to 40 min. The reaction products gave four major chromatographic peaks that were assigned to acrylamide-pyridoxamine adducts. Two of the adducts (AA-PM-1 and AA-PM-3) were selected for isolation and structural characterization with various spectroscopic (UV,
fluorescence, IR, and NMR) and mass spectrometric techniques (MS, MS/MS). As shown by the proposed reaction scheme,
PM can directly react with AA via Michael addition. The reaction involves a nucleophilic attack of the PM amine group on AA (an R,β-unsaturated carbonyl compound) to give adduct AA-PM-3, which was identified as 3-(((3-hydroxy-5-(hydroxymethyl)- 2-methylpyridin-4-yl)methyl)amino)propanamide. However, AA-PM-3 further reacts with any additional AA present
in the medium to give adduct AA-PM-1 identified as 3,30 -(((3-hydroxy-5-(hydroxymethyl)-2-methylpyridin-4-yl)methyl)azanediyl)-
dipropanamide. The time courses of these adduct formation reactions were studied in cookies supplemented with PM, where AA- PM-3 was found to be the predominant structure.
’ INTRODUCTION
Acrylamide (AA) is a processing contaminant naturally
Pyridoxamine (PM) is a well-known inhibitor of the Maillard reaction capable of reducing the formation of advanced glycation
16,17
formed during thermal treatment of foods.1,2
The widespread end-products (AGEs) both in vivo and in vitro. On the basis
ubiquity of AA in the diet has raised worldwide concern about its potential health hazards, but their nature and severity remain a
matter of debate.3,4
The Joint Expert Committee on Food Additives (JECFA) concluded that the margins of exposure for
of these properties, PM is used as a pharmacological agent for the treatment of multifactorial chronic diseases such as diabetes and atherosclerosis complications, where it acts by inhibiting the Maillard reaction and reducing the pathogenicity of carbonyl
18,19
average and high consumers were very low for a compound that compounds. In previous work, we found PM to have a
is both genotoxic and carcinogenic, and hence potentially
beneficial effect derived from its ability to reduce the presence of 20
hazardous to human health.5
The fact that acrylamide is present in an extensive range of widely consumed foods such as potato chips, crispbread, and biscuits has greatly promoted research
acrylamide in glucose/asparagine model systems by up to 51%;
we ascribed the effect to PM indirectly inhibiting AA formation by scavenging major promoters such as glyoxal and methylglyoxal.
aimed at unraveling its formation mechanism6
and developing Zeng et al.21 confirmed these results and found PM and other
strategies to decrease human exposure as summarized in the CIA Acrylamide Toolbox of 2009.
7
Acrylamide is believed to form via a Maillard reaction
vitamins to reduce acrylamide levels in chemical models and fried
snack products by up to 50%; they proposed no specific mechanism for the inhibitory effect of PM, however. Later,
involving reducing sugars and asparagine; however, dicarbonyl Cheng et al.22 stated that the flavonoid naringenin inhibits
compounds and various lipid oxidation products8-11
are known
to boost the reaction rate under specific conditions.2
Some studies have shown that AA formation can be minimized by
acrylamide formation by directly reacting with its precursors to form other derivatives. Also, a recent study showed niacin to efficiently trap acrylamide and form a stable adduct: 1-propana-
23
adding nucleophiles such as cysteine, lysine, or glycine to
foods.2,12
Recently, the formation of amino acid-acrylamide
adducts was shown to efficiently reduce AA levels13-15
by virtue
of AA, an R,β-unsaturated carbonyl compound, being able to directly react with nucleophiles via Michael-type addition reactions.
mide-3-carboxypyridinium. The purpose of this work was to investigate the mechanisms
involved in PM-AA interaction and identify, for the first time, its
Received: August 30, 2010
Published: February 14, 2011
r 2011 American Chemical Society 321 dx.doi.org/10.1021/tx100293y | Chem. Res. Toxicol. 2011, 24, 321–328
Chemical Research in Toxicology ARTICLE
322 dx.doi.org/10.1021/tx100293y |Chem. Res. Toxicol. 2011, 24, 321–328
major products. The results provide useful new insight into acrylamide reduction strategies.
’ EXPERIMENTAL PROCEDURES
Materials. Acrylamide (99%) was supplied by Sigma (St. Louis,
MO, USA). PM 3 (HCl) was purchased from Fluka Chemicals (Madrid,
Spain) and ultrapure water obtained from a Milli-Q apparatus from
Millipore (Bedford, MA, USA). Oasis-HLB cartridges (30 mg, 1 mL)
were supplied by Waters (Milford, MA, USA). [13C3]-Acrylamide in 99% isotopic purity was obtained from Cambridge Isotope Laboratories
(Andover, MA, USA), and HPLC-grade solvents and other reagents
were supplied by Merck (Darmstadt, Germany). Wheat flour, salt,
sunflower oil, and sugar were obtained from local producers. Flash
column chromatography was carried out on silica gel 60, 230-400 mesh
ASTM from Merck (Darmstadt, Germany), and TLC was performed on
silica gel precoated aluminum foils, 60F 254, 0.25 mm, also from Merck.
PM-AA Reaction in Model Systems. Acrylamide (141 μmol)
and pyridoxamine (28 μmol) were dissolved in 100 μL of 0.1 M sodium
phosphate buffer at pH 6.8 and heated in tightly closed Pyrex vacuum
hydrolysis tubes (10 cm 0.9 mm) at 140 C for 0, 5, 10, 20, 30, or
40 min in an oil bath. Solutions containing AA or PM alone were processed
simultaneously and used as controls. After heating for the preset times,
the samples were immediately cooled in iced water to stop the reaction.
Then, they were supplied with 1 mL of distilled water and stored at -
20 C. All runs were done in duplicate.
The effect of the reactant concentration was examined by heating an
amount of AA of 141 μmol in the presence of variable amounts of PM
(141, 28, 14, 3, 1, and 0 μmol) in 100 μL of 0.1 M sodium phosphate
buffer at pH 6.8. After heating at 140 C for 20 min, the samples were
cooled in ice-water and treated like the previous ones.
Cookie Preparation. The dough used as control was prepared
from salt (0.6%, w/w), sodium bicarbonate (0.7%, w/w), sugar (20.4%,
w/w), sunflower oil (14.0%, w/w), deionized water (14.6%, w/w), and
wheat flour (49.7%, w/w), and supplemented with PM at two different
concentrations (0.5% and 1% w/w) which were dissolved in the water
used to make the dough. Once ready, the dough was rolled to form disks
with 2 mm thick and 5 cm in diameter that were baked in duplicate in a
UNE 400 oven from Memmert GmbH (Heilbronn, Germany) without
forced air circulation at 190 C for 9-17 min. The baking temperature
was digitally controlled and monitored via the software Celsius 2007 v.
8.0, also from Memmert GmbH.
Acrylamide Analysis. Acrylamide in the reaction mixtures was
determined by LC with diode array detection (DAD). To this end,
samples were centrifuged at 9000g for 5 min, filtered to obtain a clear
supernatant, and diluted with distilled water as required. Acrylamide was
quantified on an LC system from Shimadzu (Kyoto, Japan) equipped
with an LC-20AD pump, an SIL-10ADvp autosampler, a CTO-10ASVP
oven, and an SPD-M20A diode array detector. Chromatographic
separations were performed on an Inertsil ODS-3 column (250
4.6 mm, 5 μm). The mobile phase was 100% ultrapure water and
circulated in the isocratic mode at a flow rate of 0.6 mL/min at 32 C.
Acrylamide was detected at 210 nm and eluted at 10.7 min. Calibration
was done over the range 5-1000 μg/L and the limit of quantitation set
at 5 μg/L. Within- and between-day precision, expressed as relative
standard deviation (RSD) were 2-10% and 2%, respectively, and
recoveries ranged from 84 to 109%, with RSD e 6%. Acrylamide in
column (250 mm 4 mm, 5 μm) from Sugerlabor (Madrid, Spain). The
samples were appropriately diluted with distilled water and eluted in a
gradient consisting of 10 mM heptafluorobutyric acid (HFBA) in water
(phase A) and 100% acetonitrile (phase B) at 1 mL/min. The column
was equilibrated in 95% phase A and 5% phase B. The elution program
was as follows: time 0-1 min, 5% B; time 10 min, 20% B; time 11 min,
40% B; time 12 min 40% B; time 20 min, 5% B; and time 45 min, 0% B.
Chromatograms were acquired at an excitation wavelength of 290 nm
and an emission wavelength of 395 nm. Calibration was done over the
range 10-1000 ng/mL and the limit of quantitation set at 50 ng/mL.
Precision was better than 3% and recoveries ranged from 95% to 105%.
In addition to fluorescence measurements, a DAD detector with a
reference wavelength of 290 nm was used to identify AA-PM reaction
products. A Shimadzu LC system (Kyoto, Japan) equipped with an LC-
20AD pump, an SIL-10ADvp autosampler, a CTO-10ASVP oven, an
SPD-M20A diode array detector, and an RF-10AxL fluorescence
detector controlled by a CBM-20A communication bus module was
used for this purpose.
Isolation and Purification of AA-PM Adducts. Obtaining
adequate amounts of some AA-PM adducts for their structural
characterization required scaling up the reaction model to 1 g of
acrylamide and 0.72 g of pyridoxamine. The mixture was dissolved in
100 mL of 0.1 M sodium phosphate buffer at pH 6.8, heated at 140 C
for 20 min and then rapidly cooled down and filtered for LC analysis.
Two semipreparative chromatographic methods were used. In the flash
chromatography method, the reaction mixture was neutralized with
NaHCO3 and washed with ethyl acetate (3 10 mL) to remove residual
acrylamide. The solvent (water) was removed from the aqueous layer
under reduced pressure and the reaction crude dissolved in methanol.
Any inorganic salts formed in the neutralization reaction were removed
by filtration, as was methanol under reduced pressure. The resulting
crude was purified, first by flash column chromatography (ethyl acetate/
ethanol gradient from 8/2 to 5/5) and then by preparative TLC
with methanol as eluent, which allowed two purified fractions to be
obtained. Reaction mixtures were also chromatographed over a semi-
preparative column (Spherisorb ODS-2, 25 1 cm, 5 μm, Tecknokro-
ma, Barcelona, Spain) at a flow rate of 2.2 mL/min, using two different
mobile phase compositions. One consisted of (A) 10 mM HFBA in
water (95:5) and (B) acetonitrile. The elution program was as follows:
time 0-1 min, 5% B; time 10 min, 20% B; time 11 min, 40% B; time
12 min 40% B; time 20 min, 5% B; and time 45 min, 0% B. The other
eluant consisted of 0.1% aqueous trifluoroacetic acid (TFA) and was
used in the isocratic mode. In both procedures, data were acquired by
using the DAD detector (190-500 nm) at an excitation wavelength of
290 nm and an emission wavelength of 395 nm. The chromatographic
peaks corresponding to the target compounds were collected from
repeated injections.
Mass Spectrometry. The isolated AA-PM adducts were dis-
solved in water before injection into the mass spectrometer. Samples
were then directly infused at a rate of 0.2 μL/min and data acquired for
3 min. Analyses were done on a Varian 1200 L triple quadrupole mass
spectrometer equipped with an atmospheric pressure ionization (API)
source using electrospray ionization (ESI) (Walnut Creek, CA, USA).
The operating conditions were as follows: drying gas pressure, 30 psi;
nebulizing pressure, 60 psi; drying gas temperature, 400 C; and API
housing temperature, 60 C. The capillary voltage was set at 40 V.
Nitrogen was used as both desolvation cone gas and nebulization gas, -9
the cookies was extracted and analyzed by LC-ESI-MS, using the and argon at a collision cell pressure of 2.1 10 Torr was employed as
method of Arribas-Lorenzo et al.20
Determination of PM and Target AA-PM Reaction Pro- ducts. Pyridoxamine was quantified by LC-fluorescence spectroscopy
according to Arribas-Lorenzo and Morales.20 Samples from the reaction mixtures and isolated fractions were passed through a nylon filter of
0.45 μm pore size and a 10 μL aliquot of each injected into a Kromasil
collision gas. The mass spectrometer was programmed to acquire a full
mass spectrum and an MS/MS spectrum of the most intense ion, using
variable collision energies for each transition. Spectra were recorded in
the positive ion mode over the m/z range 10-600.
High-resolution mass spectrometry was performed on an Agilent
1200 series LC system comprising a quaternary pump with integrated
Chemical Research in Toxicology ARTICLE
323 dx.doi.org/10.1021/tx100293y |Chem. Res. Toxicol. 2011, 24, 321–328
max
degasser, thermostatted autosampler, thermostatted column compart-
ment, and diode array detector, and coupled to an Agilent 6530
Accurate-Mass Quadrupole Time-of-Flight (Q-ToF) LC/MS with
ESI-Jet Stream Technology (Agilent Technologies, Waldbroon,
Germany). A Zorbax Extend C18 RRHT column (2.1 50 mm,
1.8 μm, Agilent Technologies, Waldbroon, Germany) was used. Each
sample (10 μL) was injected and separated isocratically by using a
mobile phase consisting of 90% water and 10% acetonitrile, both
containing 0.1% formic acid, at a flow rate of 0.4 mL/min. Identification and characterization were done by MS and MS/MS. The Q-ToF acquisition conditions were as follows: 4 GHz, mass range <1700 m/
z, positive polarity, drying gas volume and temperature 8 L/300 C,
sheath gas volume and temperature 11 L/350 C, nebulizer pressure
45 psi, cap voltage 3500 V, nozzle voltage 1000 V, and fragmentor
voltage 100 V. MS/MS runs for the target adducts were done with
collision energies from 5 to 75 V. ToF-MS resolution was >10,000
(m/z 118) with a mass error of 2 ppm. Data acquisition and qualitative
analysis were performed with the aid of MassHunter Workstation
Software (versions B.02.01 and B.03.01, respectively) from Agilent
Technologies (Waldbroon, Germany).
Nuclear Magnetic Resonance Spectroscopy (NMR). 1H
NMR and 13C NMR spectra were recorded on a Bruker 200 spectro- meter (Ettlingen, Germany), using D2O solutions at room temperature.
Chemical shifts are given in parts per million (ppm) and referred to the peak for a drop of added methanol (δ 3.34 for H NMR and δ 49.5
for C NMR) as internal reference. Singlets are denoted by s and triplets
by t.
IR Spectra. IR spectra were recorded over the wavenumber range
4000-200 cm-1 on a Bruker IFS 66v/S spectrophotometer (Ettlingen,
Germany), using potassium bromide disks.
Absorption Spectra. UV-vis spectra for the reaction mixtures were recorded by using a plate reader (BioTek Instruments, VT)
furnished with a quartz 96-well microplate (Biogen Científica, Madrid,
Spain). All samples were diluted prior to measurement.
Fluorescence Spectra. Fluorescence emission and excitation
spectra were recorded on an SMF-25 fluorescence spectrofluorimeter
(Kontron Instruments, Milan, Italy), using quartzglass cuvettes (QS-
1000 Suprasil, Hellma GmbH & Co, Germany) of 1 cm light path.
3,30 -(((3-Hydroxy-5-(hydroxymethyl)-2-methylpyridin-4-
yl)methyl)azanediyl) dipropanamide (AA-PM-1). 1H NMR (200 MHz, D2O): δ 2.38 (s, 3 H, CH3), 2.55 (t, 4 H, J = 6.9 Hz, 2
CH2CO), 2.91 (t, 4 H, J = 6.9 Hz, 2 CH2-N), 3.98 (s, 2 H, Ar-CH2-
N), 4.61 (s, 2 H, CH2-OH), 7.74 (s, 1 H, Ar-H), (OH, NH not
observed) ppm. 13C NMR (50 MHz, D2O): δ 18.0 (CH3), 32.6
(CH2CO), 49.8 (CH2-N), 51.7 (Ar-CH2-N), 60.2 (CH2OH),
131.6, 133.9, 135.6, 147.6, 149.0 (C-Ar), 177.6 (CO) ppm. MS
(ESI): m/z 311 [nominal mass, [M þ H]þ]. Q-ToF: m/z 310.1627
(calcd for C14H22N4O4, 310.1641). IR (KBr): 3500-3100 (s, νOH, NH),
2930 (w, νCH), 1675 (s, νCdO), 1572, 1414 (s, νCdC,C-C,CdN), 1106 -1
Figure 1. Acrylamide disappearance from the reaction systems on heating at 140 C in the presence (9 ) and absence ( 0) of pyridoxamine. (at λem = 395 nm); max emission 370 nm (at λex = 290 nm). TLC
solvent system: methanol, Rf = 0.2. Statistical Analysis. The results given are the means of two or
more independent determinations. Differences with P < 0.05 were
considered to be statistically significant as per Tukey’s test. Microcal
Origin, version 7.5, from Origin Lab Corp. (North Hampton, MA, USA)
was used for statistical computations.
’ RESULTS AND DISCUSSION
In a previous study, our group concluded that PM is a potent scavenger of dicarbonyls, which are precursors in the formation
of AA.20
Therefore, PM is an effective inhibitor of AA formation
via an indirect mechanism. No alternative, direct mechanism for the interaction between PM and AA was considered in the previous study, however.
Acrylamide Disappearance from AA-PM Model Systems.
As can be seen from Figure 1, the rate of disappearance of AA in the presence of PM in phosphate buffer increased as heating progressed, simultaneously with the appearance of new peaks in the chromatographic profile for acrylamide. These results suggest that PM may react with AA in a direct manner to form specific reaction products. However, heating acrylamide in the phosphate buffer used as control caused its concentration to decrease by nearly 15% after a long enough time even though evaporation was negligible. This is consistent with reported evidence of
(m, νC-OH, C-N), 652 (w), 469 (w) cm . UV λmax = 285 nm.
Fluorescence: max excitation 329 nm (at λem = 395 nm); max emission residual acrylamide polymerization in the presence of phosphate 15,24
370 (at λex = 290 nm). TLC solvent system: methanol, Rf = 0.5.
3-(((3-Hydroxy-5-(hydroxymethyl)-2-methylpyridin-4-yl)- methyl)amino) propanamide (AA-PM-3). 1H NMR (200
MHz, D2O): δ 2.32 (s, 3 H, CH3), 2.54 (t, 2 H, J = 6.4 Hz, CH2CO),
3.00 (t, 2 H, J = 6.4 Hz, CH2-N), 4.00 (s, 2 H, Ar-CH2-N), 4.57 (s, 2 H,
Ar-CH2-OH), 7.53 (s, 1 H, Ar-H), (OH, NH not observed) ppm. 13C NMR (50 MHz, D2O): δ 18.6 (CH3), 33.9 (CH2CO), 43.8 (CH2-N),
44.9 (Ar-CH2-N), 60.4 (CH2OH), 132.2, 133.4, 133.7, 147.0, 150.0
(C-Ar), 177.1 (CO) ppm. MS (LC-MS): 240 [nominal mass, [M þ
H]þ]. Q-ToF: m/z 239.1265 (calcd for C11H17N3O3, 239.1269). IR
(KBr): 3500-3100 (s, νOH, NH), 2956, 2927 (w, νCH), 1670 (s, νCdO),
1569, 1444, 1418 (s, νCdC,C-C,CdN), 1130 (s, νC-OH, C-N), 618 (w),
buffer.
The effect of the mole ratio of acrylamide to pyridoxamine was
also studied and AA found to disappear in proportion to the amount of PM present in the reaction medium. Acrylamide disappearance peaked at 92 ( 3% at a mole ratio of 1:1 (141 μmol, AA/PM). The next step was thus to identify and char- acterize the main products of the reaction between AA and PM.
AA-PM Adduct Formation. Mixtures of AA and PM in 0.1 M sodium phosphate buffer at pH 6.8 at 140 C were allowed to react for 0, 5, 10, 20, 30, or 40 min and then analyzed by LC with fluorescence (λex 290 nm, λem = 395 nm) and diode array detection (290 nm, scan range 190-500 nm). Since AA-PM
472 (w) cm-1. UV λ = 307 nm. Fluorescence: max excitation 317 nm adducts were expected to share the fluorescence properties of
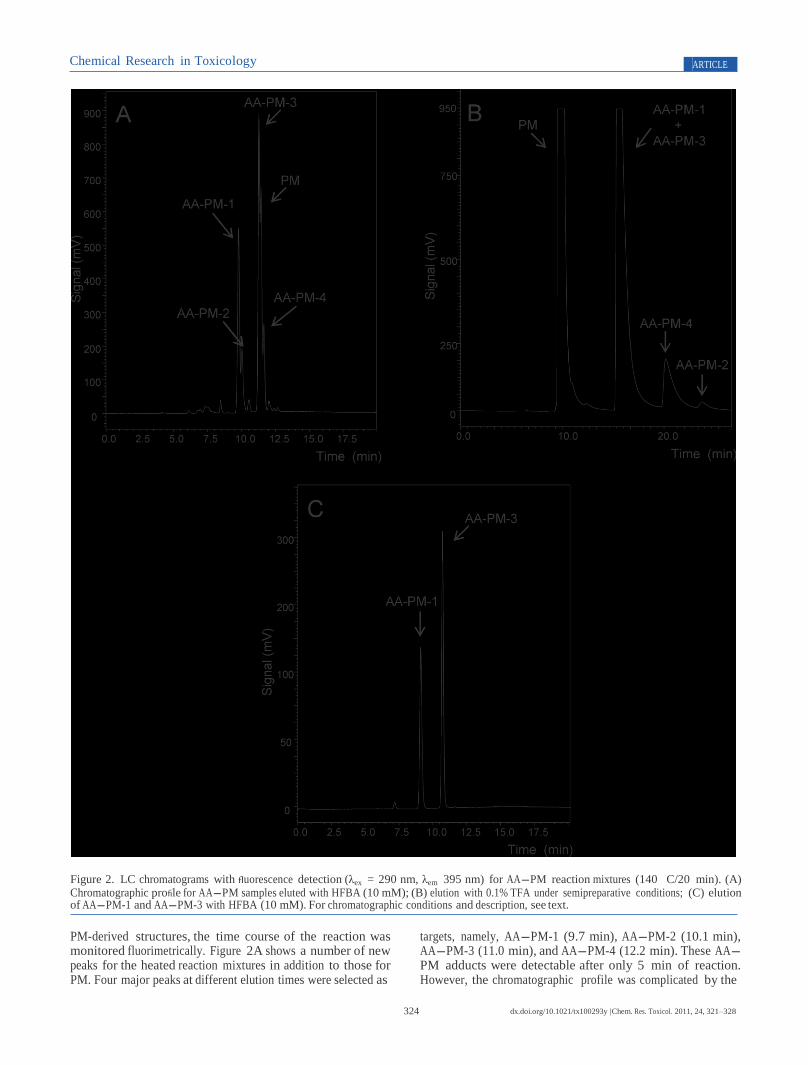
Chemical Research in Toxicology ARTICLE
324 dx.doi.org/10.1021/tx100293y |Chem. Res. Toxicol. 2011, 24, 321–328
Figure 2. LC chromatograms with fluorescence detection (λex = 290 nm, λem 395 nm) for AA-PM reaction mixtures (140 C/20 min). (A) Chromatographic profile for AA-PM samples eluted with HFBA (10 mM); (B) elution with 0.1% TFA under semipreparative conditions; (C) elution of AA-PM-1 and AA-PM-3 with HFBA (10 mM). For chromatographic conditions and description, see text.
PM-derived structures, the time course of the reaction was monitored fluorimetrically. Figure 2A shows a number of new peaks for the heated reaction mixtures in addition to those for PM. Four major peaks at different elution times were selected as
targets, namely, AA-PM-1 (9.7 min), AA-PM-2 (10.1 min), AA-PM-3 (11.0 min), and AA-PM-4 (12.2 min). These AA- PM adducts were detectable after only 5 min of reaction. However, the chromatographic profile was complicated by the
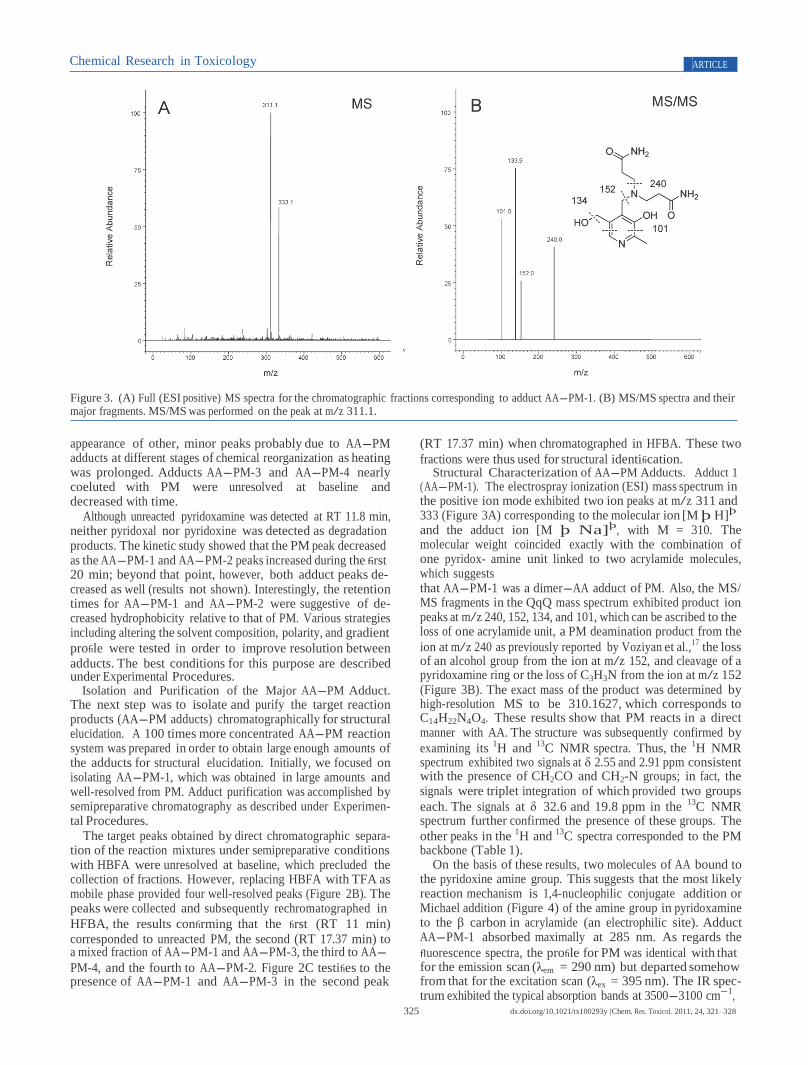
Chemical Research in Toxicology ARTICLE
325 dx.doi.org/10.1021/tx100293y |Chem. Res. Toxicol. 2011, 24, 321–328
Figure 3. (A) Full (ESI positive) MS spectra for the chromatographic fractions corresponding to adduct AA-PM-1. (B) MS/MS spectra and their major fragments. MS/MS was performed on the peak at m/z 311.1.
appearance of other, minor peaks probably due to AA-PM adducts at different stages of chemical reorganization as heating was prolonged. Adducts AA-PM-3 and AA-PM-4 nearly coeluted with PM were unresolved at baseline and decreased with time.
Although unreacted pyridoxamine was detected at RT 11.8 min, neither pyridoxal nor pyridoxine was detected as degradation products. The kinetic study showed that the PM peak decreased
as the AA-PM-1 and AA-PM-2 peaks increased during the first 20 min; beyond that point, however, both adduct peaks de- creased as well (results not shown). Interestingly, the retention times for AA-PM-1 and AA-PM-2 were suggestive of de- creased hydrophobicity relative to that of PM. Various strategies including altering the solvent composition, polarity, and gradient
profile were tested in order to improve resolution between
adducts. The best conditions for this purpose are described under Experimental Procedures.
Isolation and Purification of the Major AA-PM Adduct. The next step was to isolate and purify the target reaction products (AA-PM adducts) chromatographically for structural elucidation. A 100 times more concentrated AA-PM reaction system was prepared in order to obtain large enough amounts of the adducts for structural elucidation. Initially, we focused on isolating AA-PM-1, which was obtained in large amounts and well-resolved from PM. Adduct purification was accomplished by semipreparative chromatography as described under Experimen- tal Procedures.
The target peaks obtained by direct chromatographic separa- tion of the reaction mixtures under semipreparative conditions with HBFA were unresolved at baseline, which precluded the collection of fractions. However, replacing HBFA with TFA as mobile phase provided four well-resolved peaks (Figure 2B). The peaks were collected and subsequently rechromatographed in
HFBA, the results confirming that the first (RT 11 min)
corresponded to unreacted PM, the second (RT 17.37 min) to a mixed fraction of AA-PM-1 and AA-PM-3, the third to AA-
PM-4, and the fourth to AA-PM-2. Figure 2C testifies to the presence of AA-PM-1 and AA-PM-3 in the second peak
(RT 17.37 min) when chromatographed in HFBA. These two
fractions were thus used for structural identification. Structural Characterization of AA-PM Adducts. Adduct 1
(AA-PM-1). The electrospray ionization (ESI) mass spectrum in the positive ion mode exhibited two ion peaks at m/z 311 and 333 (Figure 3A) corresponding to the molecular ion [M þ H]
þ
and the adduct ion [M þ Na]þ
, with M = 310. The molecular weight coincided exactly with the combination of one pyridox- amine unit linked to two acrylamide molecules, which suggests that AA-PM-1 was a dimer-AA adduct of PM. Also, the MS/ MS fragments in the QqQ mass spectrum exhibited product ion peaks at m/z 240, 152, 134, and 101, which can be ascribed to the loss of one acrylamide unit, a PM deamination product from the
ion at m/z 240 as previously reported by Voziyan et al.,17
the loss of an alcohol group from the ion at m/z 152, and cleavage of a pyridoxamine ring or the loss of C3H3N from the ion at m/z 152 (Figure 3B). The exact mass of the product was determined by high-resolution MS to be 310.1627, which corresponds to C14H22N4O4. These results show that PM reacts in a direct manner with AA. The structure was subsequently confirmed by
examining its 1H and
13C NMR spectra. Thus, the
1H NMR
spectrum exhibited two signals at δ 2.55 and 2.91 ppm consistent with the presence of CH2CO and CH2-N groups; in fact, the signals were triplet integration of which provided two groups
each. The signals at δ 32.6 and 19.8 ppm in the 13
C NMR spectrum further confirmed the presence of these groups. The
other peaks in the 1H and
13C spectra corresponded to the PM
backbone (Table 1). On the basis of these results, two molecules of AA bound to
the pyridoxine amine group. This suggests that the most likely reaction mechanism is 1,4-nucleophilic conjugate addition or Michael addition (Figure 4) of the amine group in pyridoxamine to the β carbon in acrylamide (an electrophilic site). Adduct AA-PM-1 absorbed maximally at 285 nm. As regards the
fluorescence spectra, the profile for PM was identical with that for the emission scan (λem = 290 nm) but departed somehow from that for the excitation scan (λex = 395 nm). The IR spec- trum exhibited the typical absorption bands at 3500-3100 cm
-1,
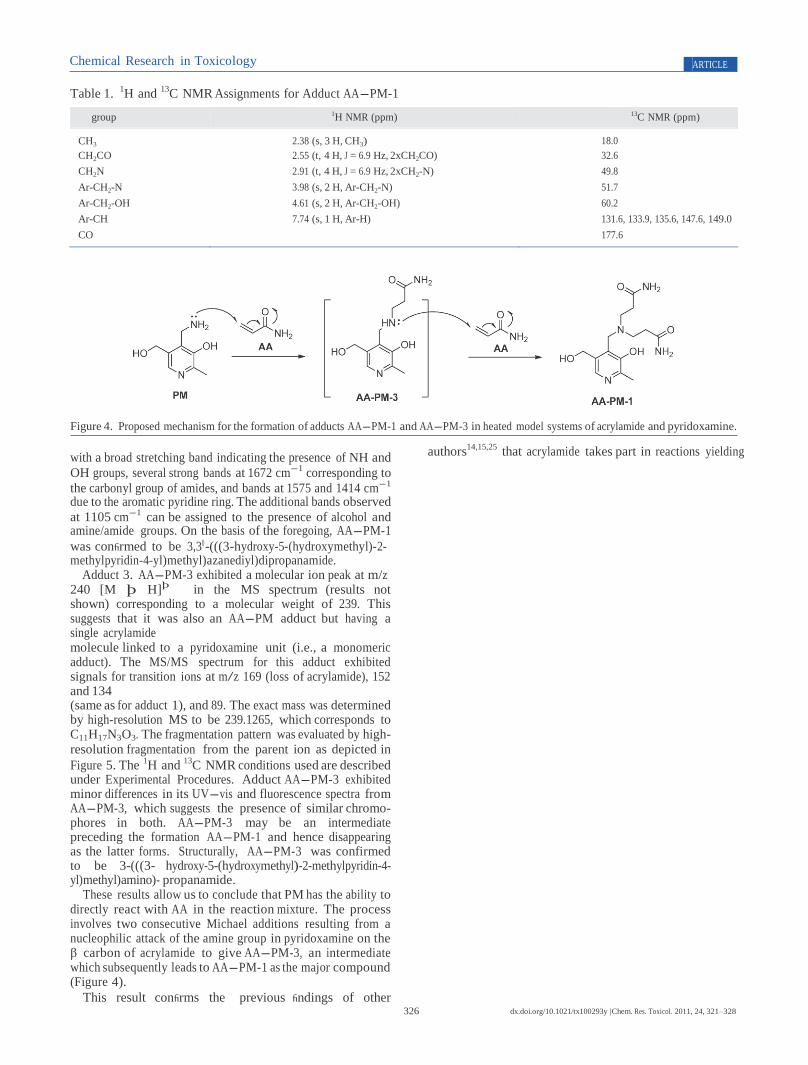
Chemical Research in Toxicology ARTICLE
326 dx.doi.org/10.1021/tx100293y |Chem. Res. Toxicol. 2011, 24, 321–328
Table 1. 1H and
13C NMR Assignments for Adduct AA-PM-1
group 1H NMR (ppm) 13C NMR (ppm)
CH3 2.38 (s, 3 H, CH3) 18.0 CH2CO 2.55 (t, 4 H, J = 6.9 Hz, 2xCH2CO) 32.6 CH2N 2.91 (t, 4 H, J = 6.9 Hz, 2xCH2-N) 49.8 Ar-CH2-N 3.98 (s, 2 H, Ar-CH2-N) 51.7 Ar-CH2-OH 4.61 (s, 2 H, Ar-CH2-OH) 60.2 Ar-CH 7.74 (s, 1 H, Ar-H) 131.6, 133.9, 135.6, 147.6, 149.0 CO 177.6
Figure 4. Proposed mechanism for the formation of adducts AA-PM-1 and AA-PM-3 in heated model systems of acrylamide and pyridoxamine.
with a broad stretching band indicating the presence of NH and
OH groups, several strong bands at 1672 cm-1
corresponding to
the carbonyl group of amides, and bands at 1575 and 1414 cm-1
due to the aromatic pyridine ring. The additional bands observed
at 1105 cm-1
can be assigned to the presence of alcohol and amine/amide groups. On the basis of the foregoing, AA-PM-1
was confirmed to be 3,30 -(((3-hydroxy-5-(hydroxymethyl)-2- methylpyridin-4-yl)methyl)azanediyl)dipropanamide.
Adduct 3. AA-PM-3 exhibited a molecular ion peak at m/z 240 [M þ H]
þ in the MS spectrum (results not
shown) corresponding to a molecular weight of 239. This suggests that it was also an AA-PM adduct but having a single acrylamide molecule linked to a pyridoxamine unit (i.e., a monomeric adduct). The MS/MS spectrum for this adduct exhibited signals for transition ions at m/z 169 (loss of acrylamide), 152 and 134 (same as for adduct 1), and 89. The exact mass was determined by high-resolution MS to be 239.1265, which corresponds to C11H17N3O3. The fragmentation pattern was evaluated by high- resolution fragmentation from the parent ion as depicted in
Figure 5. The 1H and
13C NMR conditions used are described
under Experimental Procedures. Adduct AA-PM-3 exhibited minor differences in its UV-vis and fluorescence spectra from AA-PM-3, which suggests the presence of similar chromo- phores in both. AA-PM-3 may be an intermediate preceding the formation AA-PM-1 and hence disappearing as the latter forms. Structurally, AA-PM-3 was confirmed to be 3-(((3- hydroxy-5-(hydroxymethyl)-2-methylpyridin-4-yl)methyl)amino)- propanamide.
These results allow us to conclude that PM has the ability to directly react with AA in the reaction mixture. The process involves two consecutive Michael additions resulting from a nucleophilic attack of the amine group in pyridoxamine on the β carbon of acrylamide to give AA-PM-3, an intermediate which subsequently leads to AA-PM-1 as the major compound (Figure 4).
This result confirms the previous findings of other
authors14,15,25
that acrylamide takes part in reactions yielding
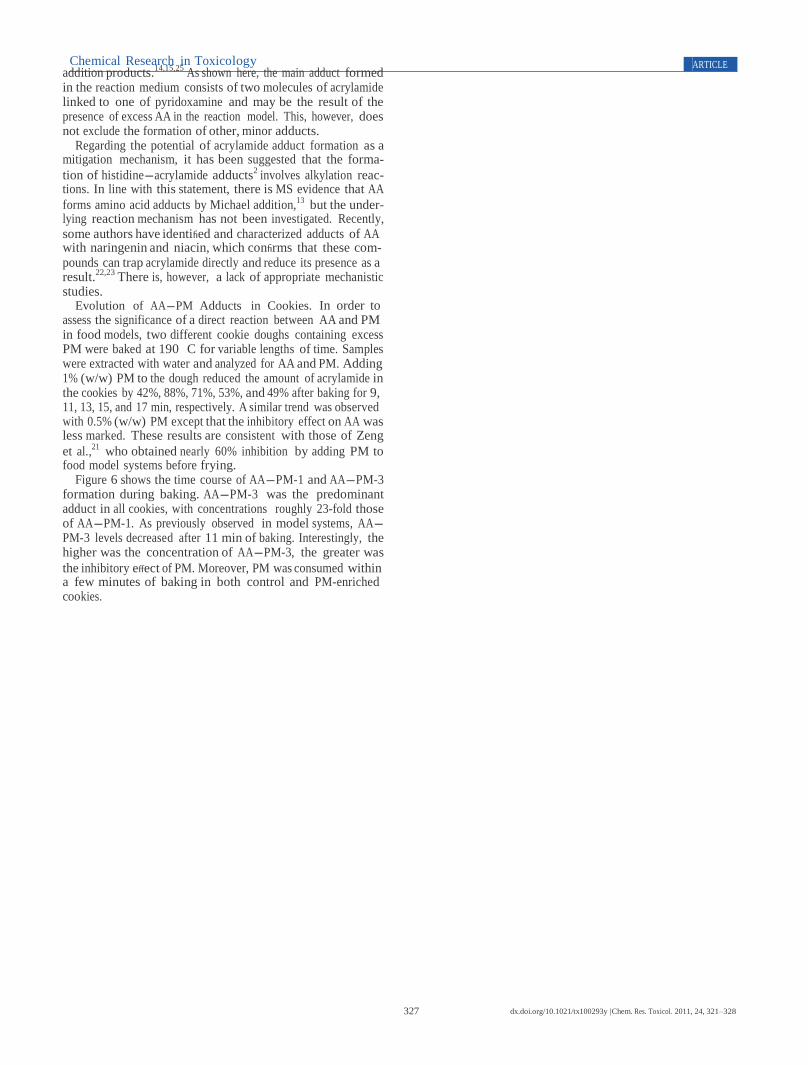
Chemical Research in Toxicology ARTICLE
327 dx.doi.org/10.1021/tx100293y |Chem. Res. Toxicol. 2011, 24, 321–328
addition products.14,15,25
As shown here, the main adduct formed in the reaction medium consists of two molecules of acrylamide linked to one of pyridoxamine and may be the result of the presence of excess AA in the reaction model. This, however, does not exclude the formation of other, minor adducts.
Regarding the potential of acrylamide adduct formation as a mitigation mechanism, it has been suggested that the forma-
tion of histidine-acrylamide adducts2
involves alkylation reac- tions. In line with this statement, there is MS evidence that AA
forms amino acid adducts by Michael addition,13
but the under- lying reaction mechanism has not been investigated. Recently,
some authors have identified and characterized adducts of AA with naringenin and niacin, which confirms that these com- pounds can trap acrylamide directly and reduce its presence as a result.
22,23 There is, however, a lack of appropriate mechanistic
studies. Evolution of AA-PM Adducts in Cookies. In order to
assess the significance of a direct reaction between AA and PM in food models, two different cookie doughs containing excess PM were baked at 190 C for variable lengths of time. Samples were extracted with water and analyzed for AA and PM. Adding 1% (w/w) PM to the dough reduced the amount of acrylamide in the cookies by 42%, 88%, 71%, 53%, and 49% after baking for 9, 11, 13, 15, and 17 min, respectively. A similar trend was observed with 0.5% (w/w) PM except that the inhibitory effect on AA was less marked. These results are consistent with those of Zeng
et al.,21
who obtained nearly 60% inhibition by adding PM to food model systems before frying.
Figure 6 shows the time course of AA-PM-1 and AA-PM-3 formation during baking. AA-PM-3 was the predominant adduct in all cookies, with concentrations roughly 23-fold those of AA-PM-1. As previously observed in model systems, AA- PM-3 levels decreased after 11 min of baking. Interestingly, the higher was the concentration of AA-PM-3, the greater was
the inhibitory effect of PM. Moreover, PM was consumed within a few minutes of baking in both control and PM-enriched cookies.
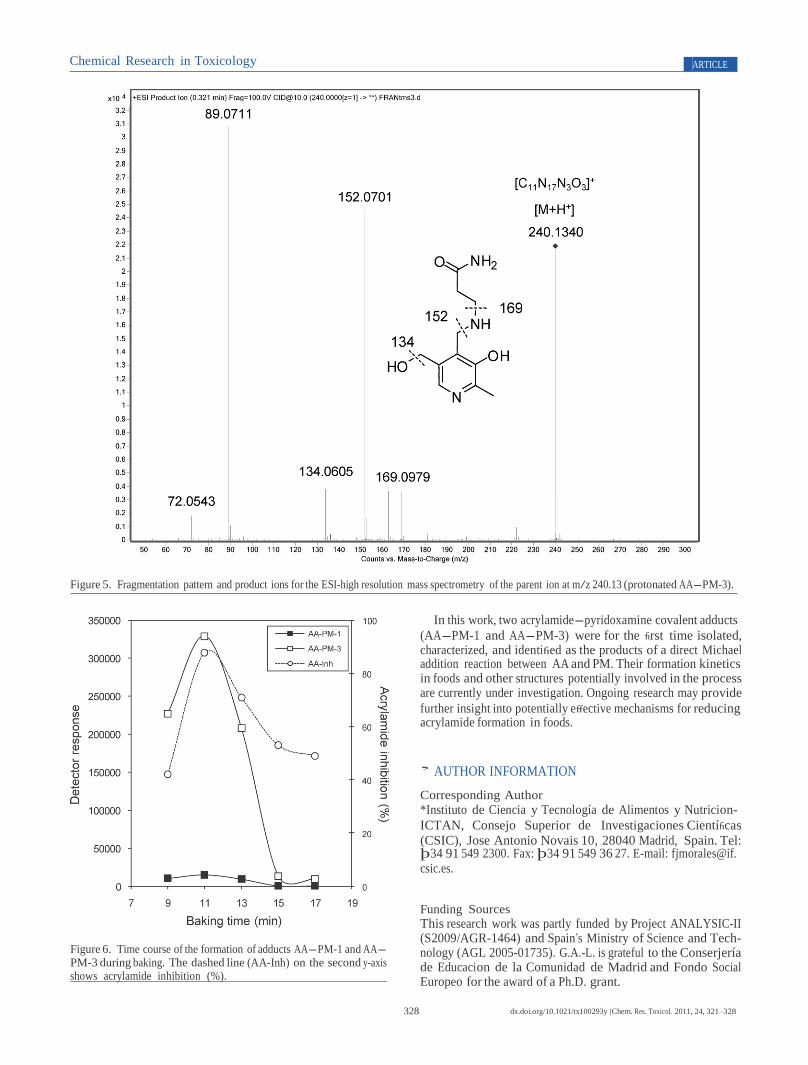
Chemical Research in Toxicology ARTICLE
328 dx.doi.org/10.1021/tx100293y |Chem. Res. Toxicol. 2011, 24, 321–328
Figure 5. Fragmentation pattern and product ions for the ESI-high resolution mass spectrometry of the parent ion at m/z 240.13 (protonated AA-PM-3).
Figure 6. Time course of the formation of adducts AA-PM-1 and AA- PM-3 during baking. The dashed line (AA-Inh) on the second y-axis shows acrylamide inhibition (%).
In this work, two acrylamide-pyridoxamine covalent adducts
(AA-PM-1 and AA-PM-3) were for the first time isolated, characterized, and identified as the products of a direct Michael addition reaction between AA and PM. Their formation kinetics in foods and other structures potentially involved in the process are currently under investigation. Ongoing research may provide
further insight into potentially effective mechanisms for reducing acrylamide formation in foods.
’ AUTHOR INFORMATION
Corresponding Author
*Instituto de Ciencia y Tecnología de Alimentos y Nutrici on-
ICTAN, Consejo Superior de Investigaciones Científicas
(CSIC), Jose Antonio Novais 10, 28040 Madrid, Spain. Tel: þ34 91 549 2300. Fax: þ34 91 549 36 27. E-mail: fjmorales@if. csic.es. Funding Sources
This research work was partly funded by Project ANALYSIC-II (S2009/AGR-1464) and Spain’s Ministry of Science and Tech- nology (AGL 2005-01735). G.A.-L. is grateful to the Conserjería de Educaci on de la Comunidad de Madrid and Fondo Social Europeo for the award of a Ph.D. grant.
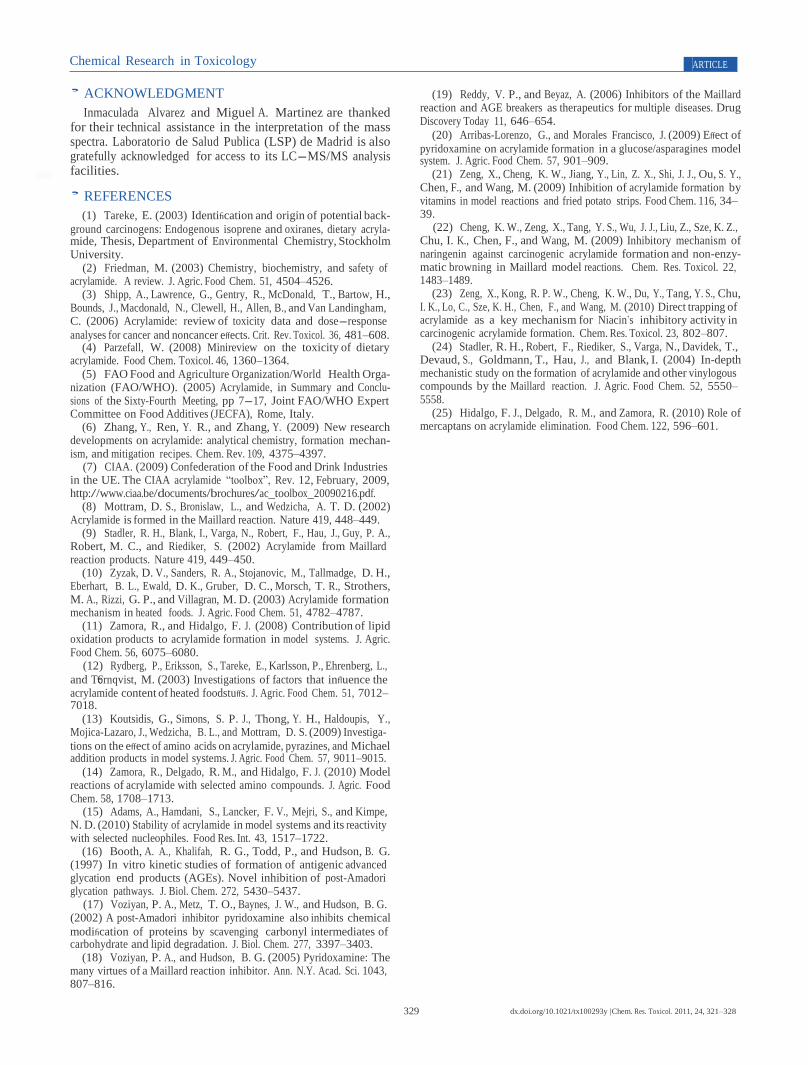
Chemical Research in Toxicology ARTICLE
329 dx.doi.org/10.1021/tx100293y |Chem. Res. Toxicol. 2011, 24, 321–328
’ ACKNOWLEDGMENT
Inmaculada Alvarez and Miguel A. Martinez are thanked for their technical assistance in the interpretation of the mass spectra. Laboratorio de Salud P ublica (LSP) de Madrid is also gratefully acknowledged for access to its LC-MS/MS analysis facilities.
’ REFERENCES
(1) Tareke, E. (2003) Identification and origin of potential back-
ground carcinogens: Endogenous isoprene and oxiranes, dietary acryla- mide, Thesis, Department of Environmental Chemistry, Stockholm University.
(2) Friedman, M. (2003) Chemistry, biochemistry, and safety of acrylamide. A review. J. Agric. Food Chem. 51, 4504–4526.
(3) Shipp, A., Lawrence, G., Gentry, R., McDonald, T., Bartow, H., Bounds, J., Macdonald, N., Clewell, H., Allen, B., and Van Landingham, C. (2006) Acrylamide: review of toxicity data and dose-response
analyses for cancer and noncancer effects. Crit. Rev. Toxicol. 36, 481–608. (4) Parzefall, W. (2008) Minireview on the toxicity of dietary
acrylamide. Food Chem. Toxicol. 46, 1360–1364. (5) FAO Food and Agriculture Organization/World Health Orga-
nization (FAO/WHO). (2005) Acrylamide, in Summary and Conclu- sions of the Sixty-Fourth Meeting, pp 7-17, Joint FAO/WHO Expert Committee on Food Additives (JECFA), Rome, Italy.
(6) Zhang, Y., Ren, Y. R., and Zhang, Y. (2009) New research developments on acrylamide: analytical chemistry, formation mechan- ism, and mitigation recipes. Chem. Rev. 109, 4375–4397.
(7) CIAA. (2009) Confederation of the Food and Drink Industries in the UE. The CIAA acrylamide “toolbox”, Rev. 12, February, 2009, http://www.ciaa.be/documents/brochures/ac_toolbox_20090216.pdf.
(8) Mottram, D. S., Bronislaw, L., and Wedzicha, A. T. D. (2002) Acrylamide is formed in the Maillard reaction. Nature 419, 448–449.
(9) Stadler, R. H., Blank, I., Varga, N., Robert, F., Hau, J., Guy, P. A., Robert, M. C., and Riediker, S. (2002) Acrylamide from Maillard reaction products. Nature 419, 449–450.
(10) Zyzak, D. V., Sanders, R. A., Stojanovic, M., Tallmadge, D. H., Eberhart, B. L., Ewald, D. K., Gruber, D. C., Morsch, T. R., Strothers, M. A., Rizzi, G. P., and Villagran, M. D. (2003) Acrylamide formation mechanism in heated foods. J. Agric. Food Chem. 51, 4782–4787.
(11) Zamora, R., and Hidalgo, F. J. (2008) Contribution of lipid oxidation products to acrylamide formation in model systems. J. Agric. Food Chem. 56, 6075–6080.
(12) Rydberg, P., Eriksson, S., Tareke, E., Karlsson, P., Ehrenberg, L.,
and T€ornqvist, M. (2003) Investigations of factors that influence the acrylamide content of heated foodstuffs. J. Agric. Food Chem. 51, 7012– 7018.
(13) Koutsidis, G., Simons, S. P. J., Thong, Y. H., Haldoupis, Y., Mojica-Lazaro, J., Wedzicha, B. L., and Mottram, D. S. (2009) Investiga-
tions on the effect of amino acids on acrylamide, pyrazines, and Michael addition products in model systems. J. Agric. Food Chem. 57, 9011–9015.
(14) Zamora, R., Delgado, R. M., and Hidalgo, F. J. (2010) Model reactions of acrylamide with selected amino compounds. J. Agric. Food Chem. 58, 1708–1713.
(15) Adams, A., Hamdani, S., Lancker, F. V., M ejri, S., and Kimpe, N. D. (2010) Stability of acrylamide in model systems and its reactivity with selected nucleophiles. Food Res. Int. 43, 1517–1722.
(16) Booth, A. A., Khalifah, R. G., Todd, P., and Hudson, B. G. (1997) In vitro kinetic studies of formation of antigenic advanced glycation end products (AGEs). Novel inhibition of post-Amadori glycation pathways. J. Biol. Chem. 272, 5430–5437.
(17) Voziyan, P. A., Metz, T. O., Baynes, J. W., and Hudson, B. G. (2002) A post-Amadori inhibitor pyridoxamine also inhibits chemical
modification of proteins by scavenging carbonyl intermediates of carbohydrate and lipid degradation. J. Biol. Chem. 277, 3397–3403.
(18) Voziyan, P. A., and Hudson, B. G. (2005) Pyridoxamine: The many virtues of a Maillard reaction inhibitor. Ann. N.Y. Acad. Sci. 1043, 807–816.
(19) Reddy, V. P., and Beyaz, A. (2006) Inhibitors of the Maillard reaction and AGE breakers as therapeutics for multiple diseases. Drug Discovery Today 11, 646–654.
(20) Arribas-Lorenzo, G., and Morales Francisco, J. (2009) Effect of
pyridoxamine on acrylamide formation in a glucose/asparagines model system. J. Agric. Food Chem. 57, 901–909.
(21) Zeng, X., Cheng, K. W., Jiang, Y., Lin, Z. X., Shi, J. J., Ou, S. Y., Chen, F., and Wang, M. (2009) Inhibition of acrylamide formation by vitamins in model reactions and fried potato strips. Food Chem. 116, 34– 39.
(22) Cheng, K. W., Zeng, X., Tang, Y. S., Wu, J. J., Liu, Z., Sze, K. Z., Chu, I. K., Chen, F., and Wang, M. (2009) Inhibitory mechanism of naringenin against carcinogenic acrylamide formation and non-enzy- matic browning in Maillard model reactions. Chem. Res. Toxicol. 22, 1483–1489.
(23) Zeng, X., Kong, R. P. W., Cheng, K. W., Du, Y., Tang, Y. S., Chu, I. K., Lo, C., Sze, K. H., Chen, F., and Wang, M. (2010) Direct trapping of acrylamide as a key mechanism for Niacin’s inhibitory activity in carcinogenic acrylamide formation. Chem. Res. Toxicol. 23, 802–807.
(24) Stadler, R. H., Robert, F., Riediker, S., Varga, N., Davidek, T., Devaud, S., Goldmann, T., Hau, J., and Blank, I. (2004) In-depth mechanistic study on the formation of acrylamide and other vinylogous compounds by the Maillard reaction. J. Agric. Food Chem. 52, 5550– 5558.
(25) Hidalgo, F. J., Delgado, R. M., and Zamora, R. (2010) Role of mercaptans on acrylamide elimination. Food Chem. 122, 596–601.

VIII. Bibliografía
193
Acrylamide Infonet operated by the Joint Institute for Food Safety and Applied Nutrition (JIFSAN); http://www.acrylamide‐food.org.
Adams, A.; Hamdani, S.; Van Lancker, F.; Mejri, S.; de Kimpe, N. Stability of acrylamide in model systems and its reactivity with selected nucleophiles. Food Res. Intern. 2010, 43, 1517‐1522.
Ahmed, H. H.; Elmegeed, G. A.; El‐Sayed, E. S. M.; Abd‐Elhalim, M. M.; Shousha, W. G.; Shafic, R. W. Potent neuroprotective role of novel melatonin derivatives for management of central neuropathy induced by acrylamide in rats. Eur. J. Med. Chem. 2010, 45, 5452‐5459.
Ait‐Ameur, L. A.; Trystam, G.; Birlouez‐Aragon, I. Accumulation of 5‐HMF in cookies during the baking process: validation of an extraction method. Food Chem. 2006, 98, 790‐796.
Ames, J. M. The Maillard reaction. In Biochemistry of Food Proteins; Hudson, B. J. F., Eds.; Elsevier Applied Science: London and New York, 1992; pp 150‐154.
Ameur, L. A.; Trystram, G.; Birlouez‐Aragon, I. Accumulation of 5‐hydroxymethyl‐2‐furfural in cookies during the backing process: validation of an extraction method. Food Chem. 2006, 98, 790‐ 796.
Amrein, T. M.; Schonbachler, B.; Rohner, F.; Lukac, H.; Schneider, H.; Keiser, A.; Escher, F.; Amado, R. Potential for acrylamide formation in potatoes: data from the 2003 harvest. Eur. Food Res. Technol. 2004a, 219, 572‐578.
Amrein, M.; Schonbachler, B.; Escher, F.; Amado, R. Acrylamide in gingerbread: Critical factors for formation and possible ways for reduction. J. Agric. Food Chem. 2004b, 52, 4282‐4288.
Amrein, T. M.; Andres, L.; Manzardo, G. G. G.; Amadò, R. Investigations on the promoting effect of ammonium hydrogencarbonate on the formation of acrylamide in model systems. J. Agric. Food Chem. 2006a, 54, 10253‐10261.
Amrein, T. M.; Escher, F.; Amadò, R. Controlling acrylamide formation during baking. In Acrylamide and other hazardous compounds in heat‐treated foods; Skog, K., Alexander, J., Eds.; Woodhead Publishing: Cambridge, U.K., 2006b; pp 459‐477.
Andrzejewski, D.; Roach, J. A. G.; Gay, M. L.; Musser, S. M. Analysis of coffee for the presence of acrylamide by LC‐MS/MS. J. Agric. Food Chem. 2004, 52, 1996‐2002.
Anese, M.; Quarta, B.; Frias, J. Modelling the effect of asparaginase in reducing acrylamide formation in biscuits. Food Chem. 2011, 126, 435‐440.
Anese, M.; Suman, M.; Nicoli, M. C. Acrylamide removal from heated foods. Food Chem. 2010, 119, 791‐794.
Arribas‐Lorenzo, G.; Fogliano, V.; Morales, F. J. Acrylamide formation in a cookie system as influenced by the oil phenol profile and degree of oxidation. Eur. Food Res. Technol. 2009, 229, 63‐ 72.
Arribas‐Lorenzo, G.; Morales, F. J. Effect of pyridoxamine on acrylamide formation in a glucose/asparagine model system. J. Agric. Food Chem. 2009, 57, 901‐909.
Arribas‐Lorenzo, G.; Pintado‐Sierra, M.; Morales, F. J. Isolation and structural characterization of acrylamide‐pyridoxamine adducts. Chem. Res. Toxicol. 2011, 24, 321‐328.
194
Bakhiya, N.; Monien, B.; Frank, H.; Seidel, A.; Glatt, G. Renal organic anion transporters OAT1 and OAT3 mediate the cellular accumulation of 5‐sulfooxymethylfurfural, a reactive, nephrotoxic metabolite of the Maillard product 5‐hydroxymethylfurfural. Biochem. Pharmacol. 2009, 78, 414‐ 419.
Barros, A.; Rodrigues, J. A.; Almeida, P. J.; Oliva‐Teles, M. T. Determination of glyoxal, methylglyoxal, and diacetyl in selected beer and wine, by HPLC with UV spectrophotometric detection, after derivatization with o‐phenylendiamine. J. Liq. Chrom. Rel. Technol. 1999, 22, 2061‐2069.
Baum, M.; Böhm, N.; Görlitz, J.; Lantz, I.; Merz, K. H.; Ternité, R.; Eisenbrand, G. Fate of 14C‐ acrylamide in roasted and ground coffee during storage. Mol. Nutr. Food Res. 2008, 52, 600‐608.
Becalski, A.; Lau, B. P. Y.; Lewis, D.; Seaman, S. W. Acrylamide in foods: occurrence, sources and modelling. J. Agric. Food Chem. 2003, 51, 802‐808.
Becalski, A.; Lau, B. P. Y.; Lewis, D.; Seaman, S. W. Acrylamide in French fries: influence of free amino acids and sugars. J. Agric. Food Chem. 2004, 52, 3801‐3806.
Becalski, A.; Seaman, S. Furan precursors in food: A model study and development of a simple headspace method for determination of furan. J. AOAC Int. 2005, 88, 102‐106.
Bermudo, E.; Moyano, E.; Puignou, L.; Galceran, M. T. Determination of acrylamide in foodstuffs by liquid chromatography ion‐trap tandem mass‐spectrometry using an improved clean‐up procedure. Anal. Chim. Acta 2006, 559, 207‐214.
Bermudo, E.; Moyano, E.; Puignou, L.; Galceran, M. T. Liquid chromatography coupled to tandem mass spectrometry for the analysis of acrylamide in typical Spanish products. Talanta 2008, 76, 389‐394.
Bermudo, E.; Ruiz‐Calero, V.; Puignou, L.; Galceran, M. T. Microemulsion electrokinetic chromatography for the analysis of acrylamide in food. Electrophoresis 2004, 25, 3257‐3262.
Biedermann, M.; Biedermann‐Brem, S.; Noti, A.; Grob, K.; Egli, P.; Mändli, H. Two GC‐MS methods for the analysis of acrylamide in foods. Mitt. Lebensm. Hyg. 2002a, 93, 638‐652.
Biedermann, M.; Biedermann‐Brem, S.; Noti, A.; Grob, K. Methods for determining the potential of acrylamide formation and its elimination in raw materials for food preparation, such as potatoes. Mitt. Lebensm. Hyg. 2002b, 93, 653‐667.
Biedermann, M.; Noti, A.; Biedermann‐Bremm, S.; Noti, A.; Grob, K.; Egli, P.; Mandli, H. Experiments on acrylamide formation and possibilities to decrease the potential of acrylamide formation in potatoes. Mitt. Lebensm. Hyg. 2002c, 93, 668‐687.
Blanco‐Gomis, D.; Gutiérrez‐Alvarez, M. D.; Sopeña‐Naredo, L.; Mangas‐Alonso, J. J. High‐ performance liquid chromatographic determination of furfural and hydroxymethylfurfural in apple juices and concentrates. Chromatogr. 1991, 32, 45‐48.
Boroushaki, M. T.; Nikkhah, E.; Kazemi, A.; Oskooei, M.; Raters, M. Determination of acrylamide level in popular Iranian brands of potato and corn products. Food Chem. Toxicol. 2010, 48, 2581‐ 2584.
BVL, 2002. German Federal Office of Consumer Protection and Food Safety. http://www.bvl.bund.de/EN/01_Food/04_Acrylamid_en/00_Minimierungskonzept_en/lm_acrylam id_minimierungskonzept_en_node.html
195
Calbiani, F.; Careri, N.; Elviri, L.; Mangia, A.; Zagnoni, I. Development and single‐laboratory validation of a reversed‐phase liquid chromatography‐electrospraytandem mass spectrometry method for identification and determination of acrylamide in foods. J. AOAC Int. 2004, 87, 107‐115.
Capuano, E.; Oliviero, T.; Açar, Ö. Ç.; Gökmen, V.; Fogliano, V. Lipid oxidation promotes acrylamide formation in fat‐rich model systems. Food Res. Int. 2010, 43, 1021‐1026.
Capuano, E.; Fogliano, V. Acrylamide and 5‐hydroxymethylfurfural (HMF): A review on metabolism, toxicity, occurrence in food and mitigation strategies. Food Sci. Technol. 2011, 44, 793‐810.
Casado, F. J.; Sánchez, A. H.; Montaño, A. Reduction of acrylamide content of ripe olives by selected additives. Food Chem. 2010, 119, 161‐166.
Casella, I. G.; Pierri, M.; Contursi, M. Determination of acrylamide and acrylic acid by isocratic liquid chromatography with pulsed electrochemical detection. J. Chromatogr. A 2006, 1107, 198‐203.
Castle, L. Determination of acrylamide monomer in mushrooms grown on polyacrylamide gel. J. Agric. Food Chem. 1993, 41, 1261‐1263.
Castle, L.; Eriksson, S. Analytical methods used to measure acrylamide concentrations in foods. J. AOAC Int. 2005, 88, 274‐284.
Cerny, C. The aroma side of the Maillard reaction. Ann. N.Y. Acad. Sci. 2008, 1126, 66‐71.
Cheng, K. W.; Zeng, X.; Tang, Y. S.; Wu, J. J.; Liu, Z.; Sze, K. H.; Chu, I. K.; Chen, F.; Wang, M. Inhibitory mechanism of naringenin against carcinogenic acrylamide formation and nonenzymatic browning in Maillard model reactions. Chem. Res. Toxicol. 2009, 22, 1483‐1489.
CIAA, 2006. The CIAA acrylamide ‘‘toolbox,’’ rev. 9.
CIAA, 2011. Food Drink Europe Acrylamide Toolbox; http://www.fooddrinkeurope.eu/uploads/publications_documents/Toolboxfinal260911.pdf
Ciesarova, Z.; Suhaj, M.; Horvathova, J. Correlation between acrylamide contents and antioxidant capacities of spice extracts in a model potato matrix. J. Food Nut. Res. 2008, 47, 1‐5.
Claus, A.; Mongili, M.; Weisz, G.; Schieber, A.; Carle, R. Impact of formulation and technological factors on the acrylamide content of wheat bread and bread rolls. J. Cereal Sci. 2008, 7, 546‐554.
Claus, A.; Weisz, G. M.; Schieber, A.; Carle, R. Pyrolytic acrylamide formation from purified wheat gluten and gluten‐supplemented wheat bread rolls. Mol. Nutr. Food Res. 2006a, 50, 87‐93.
Claus, A.; Schreiter, P.; Weber, A.; Graeff, S.; Hermann, W.; Claupein, W.; Schieber, A.; Carle, R. Influence of agronomic factors and extraction rate on the acrylamide contents in yeast‐leavened breads. J. Agric. Food Chem. 2006b, 54, 8968‐8976.
Claus, A.; Weisz, G. M.; Kammerer, D. R.; Carle, R.; Schieber, A. A method for the determination of acrylamide in bakery products using ion trap LC‐ESI‐MS/MS. Mol. Nutr. Food Res. 2005, 49, 918‐925.
CAC/RCP 67‐2009. Codigo de prácticas para reducir el contenido de acrilamida en los alimentos; http://www.codexalimentarius.net/download/standards/11258/CXP_067s.pdf
196
Comisión Europea. Decisión de la Comisión de 12 de agosto de 2002 por la que se aplica la Directiva 96/23/CE del Consejo en cuanto al funcionamiento de los métodos analíticos y la interpretación de los resultados. 2002/657/CE. Diario Oficial de las Comunidades Europeas, 2002, L221/8.
Comisión Europea. Directiva 98/83/EC del Consejo de 3 de noviembre de 1998 relativa a la calidad de las aguas destinadas al consumo humano. Diario Oficial de las Comunidades Europeas, 1998, L330/32.
Comisión Europea. Directiva 2002/72/CE de la Comisión de 6 de agosto de 2002, relativa a los materiales y objetos plásticos destinados a entrar en contacto con productos alimenticios. Diario Oficial de las Comunidades Europeas, 2002, L220/18.
Comisión Europea. Recomendación de la Comisión 2 de junio de 2010 relativa al control de los niveles de acrilamida en los alimentos, 2010/307/UE. Diario Oficial de la Unión Europea, 2010, L137/4.
Comisión Europea. Recomendación de la Comisión de 3 de mayo de 2007 relativa al control de los niveles de acrilamida en los alimentos, 2007/331/CE. Diario Oficial de la Unión Europea, 2007, L123/33.
Consonni, R.; Gatti, A. 1H NMR studies on Italian balsamic and traditional balsamic vinegars. J. Agric. Food Chem. 2004, 52, 3446‐3450.
Curtis, T. Y.; Muttucumaru, N.; Shewry, P. R.; Parry, M. A. J.; Powers, S. J.; Elmore, J. S.; Mottram, D. S.; Hook, S.; Halford, N. G. Effects of genotype and environment on free amino acid levels in wheat grain: implications for acrylamide formation during processing. J. Agric. Food Chem. 2009, 57, 1013‐ 1021.
Daglia, M.; Cuzzoni, M. T.; Dacarro, C. Antibacterial activity of coffee. J. Agric. Food Chem. 1994, 42, 2270‐2272.
Daglia, M.; Papetti, A.; Aceti, C.; Sordelli, B.; Spini, V.; Gazzani, G. Isolation and determination of α‐ dicarbonyl compounds by RP‐HPLC‐DAD in green and roasted coffee. J. Agric. Food Chem. 2007, 55, 8877‐8882.
Dattatreya, A.; Rankin, S. A. Moderately acidic pH potentiates browning of sweet whey powder. Int. Dairy J. 2006, 16, 822‐828.
Davies, R.; Hedebrant, U.; Athanassiadis, I.; Rydberg, P.; Törnqvist, M. Improved method to measure aldehyde adducts to N‐terminal valine in hemoglobin using 5‐hydroxymethylfurfural and 2,5‐furandialdehyde as model compounds. Food Chem. Toxicol. 2009, 47, 1950‐1957.
De la Iglesia, F.; Lazaro, F.; Puchades, R.; Maquieira, A. Automatic determination of 5‐ hydroxymethylfurfural (5‐HMF) by a flow injection method. Food Chem. 1997, 60, 245‐250.
De Revel, G.; Pripis‐Nicolau, L.; Berbe, J. C.; Bertrand, A. The detection of α‐dicarbonyl compounds in wine by formation of quinoxaline derivates. J. Sci. Food Agric. 2000, 80, 102‐108.
De Vleeschouwer, K.; Van der Plancken, I.; Loey, A. V.; Hendrickx, M. E. Modelling acrylamide changes in foods: from single response empirical to multiresponse mechanistic approaches. Trends Food Sci. Technol. 2009a, 20, 155‐167.
197
De Vleeschouwer, K.; Van der Plancken, I.; Loey, A. V.; Hendrickx, M. E. Role of precursors on the kinetics of acrylamide formation and elimination under low moisture conditions using a multiresponse approach‐Part I: Effect of the type of sugar. Food Chem. 2009b, 114, 116‐126.
De Vleeschouwer, K.; Van der Plancken, I.; Loey A. V.; Hendrickx, M. E. Impact of pH on the kinetics of acrylamide formation/elimination reactions in model systems. J. Agric. Food Chem. 2006, 54, 7847‐7855.
De Vleeschouwer, K.; Van der Plancken, I.; Van Loey, A.; Hendrickx, M. E. Kinetics of acrylamide formation/elimination reactions as affected by water activity. Biotechnol. Progr. 2007, 23, 722‐728.
De Wilde, T.; De Meulenaer, B.; Mestdagh, F.; Govaert, Y.; Vandeburie, S.; Ooghe, W.; Fraselle, S.; Demeulemeester, K.; Van Peteghem, C.; Calus, A.; Degroodt, J.; Verhe, R. Influence of fertilization on acrylamide formation during frying of potatoes harvested in 2003. J. Agric. Food Chem. 2006, 54, 404‐408.
Delatour, T.; Perisset, A.; Goldmann, T.; Riediker, S.; Stadler, R. H. Improved sample preparation to determine acrylamide in difficult matrixes such as chocolate powder, cocoa, and coffee by liquid chromatography tandem mass spectroscopy. J. Agric. Food Chem. 2004, 52, 4625‐4631.
Delgado‐Andrade, C.; Mesías, M.; Morales, F. J.; Seiquer, I.; Navarro, M. P. Assessment of acrylamide intake of Spain boys aged 11‐14 years consuming a traditional and balanced diet. LWT – Food Sci. Technol. 2012, 46, 16‐22.
Delgado‐Andrade, C.; Morales, F. J.; Seiquer, I.; Navarro, M. P. Maillard reaction products profile and intake from Spanish typical dishes. Food Res. Int. 2010, 43, 1304‐1311.
Delgado‐Andrade, C.; Seiquer, I.; Navarro, M. P. Effects of consumption of Maillard reaction. Products on magnesium digestibility and tissue distribution in rats. Food Sci. Technol. Int. 2007a, 13, 109‐116.
Delgado‐Andrade, C.; Seiquer, I.; Navarro, M. P.; Morales, F. J. Maillard reaction indicators in diets usually consumed by adolescent population. Mol. Nutr. Food Res. 2007b, 51, 341‐351.
Delgado‐Andrade, C.; Seiquer, I., Navarro, M. P.; Morales, F. J. Estimation of hydroxymethylfurfural availability in breakfast cereals. Studies in Caco‐2 cells. Food Chem. Toxicol. 2008, 46, 1600‐1607.
Dinsmore, H. I.; Nagy, S. Colorimetric furfural measurement as an index of deterioration in stored citrus juices. J. Food Sci. 1972, 37, 768‐770.
Doerge, D. R.; da Costa, G. G.; McDaniel, L. P.; Churchwell, M. I.; Twaddle, N. C.; Beland, F. A. DNA adducts derived from administration of acrylamide and glycidamide to mice and rats. Mutat. Res. 2005, 580, 131‐141.
Doroshyenko, O.; Fuhr, U.; Kunz, D.; Frank, D.; Kinzig, M.; Jetter, A.; Reith, Y.; Lazar, A.; Taubert, D.; Kirchheiner, J.; Baum, M.; Eisenbrand, G.; Berger, F. I.; Bertow, D.; Berkessel, A.; Sörgel, F.; Schömig, E.; Tomalik‐Scharte, D. In vivo role of cytochrome P450 2E1 and glutathione‐ S‐transferase activity for acrylamide toxicokinetics in humans. Cancer Epidemiol. Biomarkers Prev. 2009, 18, 433‐443.
Dunovska, L.; Cajka, T.; Hajslova, J.; Holadova, K. Direct determination of acrylamide in food by gas chromatography–high‐resolution time‐of‐flight mass spectrometry. Anal. Chim. Acta 2006, 578, 234‐240.
198
Dybing, E.; Farmer, P. B.; Andersen, M.; Fennell, T. R.; Lalljle, S. P. D.; Muller, D. J. G.; Olin, S.; Peterson, B. J.; Schlatter, J.; Scholz, G.; Scimeca, J. A.; Slimani, N.; Törnqvist, M.; Tuijtelaars, S.; Verger, P. Human exposure and internal dose assessments of acrylamide in food. Food Chem. Toxicol. 2005, 43, 365‐410.
Dybing, E.; Sanner, T. Risk assessment of acrylamide in foods. Toxicol. Sci. 2003, 75, 7‐15.
EFSA, 2005. Opinion of the scientific panel on food additives, flavourings, processing aids and materials in contact with food (AFC) on a request from the commission related to flavouring group evaluation 13: furfuryl and furan derivatives with and without additional side‐chain substituents and heteroatoms from chemical group 14. EFSA Journal, 2005a, 215, 1‐73.
EFSA, 2005. Opinion of EFSA scientific committee on a request of the EFSA related to a harmonised approach for risk assessment of substances which are both genotoxic and carcinogenic. EFSA Journal 2005b, 282, 1‐30.
EFSA, 2009. Results on the monitoring of acrylamide levels in food. EFSA Scientific Report 2009, 285, 1‐26
EFSA, 2010. Guidance on human health risk‐benefit assessment of foods. Scientific opinion. EFSA Journal 2010, 8, 1673.
EFSA, 2011. Results on acrylamide levels in food from monitoring years 2007‐2009 and exposure assessment. Scientific report. EFSA Journal 2011, 9, 2133.
Erdogdu, S. B.; Palazoglu, T. K.; Gökmen, V.; Senyuva, H. Z.; Ekiz, H. I. Reduction of acrylamide formation in French fries by microwave pre‐cooking of potato strips. J. Sci. Food Agric. 2007, 87, 133‐137.
Espinosa‐Mansilla, A.; Muñoz de la Peña, A.; Salinas F. Semiautomatic determination of furanic aldehydes in food and pharmaceutical samples by a stopped‐flow injection analysis method. J. AOAC Int. 1993, 76, 1255‐1261.
EU‐OSHA, 2008. The European Agency for Safety and Health at Work. Exploratory survey of occupational exposure limits for carcinogens, mutagens and reprotoxic substances at EU Member states level.
EURACHEM Guide, 1998. The fitness for purpose of analytical methods. A laboratory guide to method validation and related topics.
European Commission, 2002. Twenty‐sixth Commission Directive 2002/34/EC of 15 April 2002 adapting to technical progress Annexes II, III and VI to Council Directive 76/768/EEC on the approximation of the laws of the member states relating to cosmetic products. Off. J. Eur. Comm. 2002, L102/19.
European Commission Recommendation No. 2005/108/EC. Off. J. Eur. Comm. 2005, L34, 43.
European Commission, 2010. Mandate for standardisation addressed to CEN for methods of analysis for food contaminants; http://www.cen.eu/cen/Sectors/Sectors/Food/Documents/M_463.pdf
European Commission, 2011. Commission Recommendation of 10.1.2011 on investigations into the levels of acrylamide in food.
199
FAO/WHO (Food and Agricultural Organisation/World Health Organisation), 2005. Summary and conclusions of the sixty‐forth meeting of the Joint FAO/WHO Expert Committee on Food Additives (JECFA), pp. 1‐17.
FAO/WHO (Food and Agricultural Organisation/World Health Organization), 2010. Summary and conclusions report from seventy‐second meeting of the Joint FAO/WHO Expert Committee on Food Additives (JECFA), pp. 1‐16.
Felton, J. S.; Jagerstad, M.; Knize, M. G.; Skog, K.; Wakabayashi, K. Contents in foods, beverages and tobacco. In Food Borne Carcinogens Heterocyclic Amines; Nagao, M., Sugimura, T., Eds.; John Wiley & Sons Ltd: West Sussex, U.K., 2000; pp 31‐71.
Fennell, T. R.; Sumner, S. C. J.; Snyder, R. W.; Burgess, J.; Friedman, M. A. Kinetics of elimination of urinary metabolites of acrylamide in humans. Toxicol. Sci. 2006, 93, 256‐267.
Ferreira, A. C.; Reis, S.; Rodrigues, C.; Oliveira, C.; Guedes de Pinho, P. Simultaneous determination of ketoacids and dicarbonyl compounds, key Maillard intermediates on the generation of ages wine aroma. J. Food Sci. 2007, 72, S314‐S318.
Fredriksson, H.; Tallving, J.; Rosen, J.; Aman, P. Fermentation reduces free asparagine in dough and acrylamide content in bread. Cereal Chem. 2004, 81, 650‐653.
Friedman, M. Chemical basis for biological effects of acrylamide. A review. J. Agric. Food Chem. 2003, 51, 4504‐4526.
Friedman, M.; Levin, C. E. Review ofmethods for the reduction of dietary content and toxicity of acrylamide. J. Agric. Food Chem. 2008, 56, 6113‐6140.
Garoglio, P. G. Il Corriere Vinicolo, 1961, 27, 42.
Gertz, C.; Klostermann, S. Analysis of acrylamide and mechanisms of its formation in deep‐fried products. Eur. J. Lipid Sci. Technol. 2002, 104, 762‐771.
Glatt, H. R.; Sommer, Y.; Health risks by 5‐hydroxymethylfurfural (HMF) and related compounds. In Acrylamide and Other Health Hazardous Compounds in Heat‐treated Foods; Skog, K., Alexander, J., Eds.; Woodhead Publishing: Cambridge, 2006; pp 328‐357.
Gliguem, H.; Birlouez‐Aragon, I. Effects of sterilization, packaging, and storage on vitamin C degradation, protein denaturation, and glycation in fortified milks. J. Dairy Sci. 2005, 88, 891‐899.
Gökmen, V.; Açar, Ö. C.; Arribas‐Lorenzo, G.; Morales, F. J. Investigating the correlation between acrylamide content and browning ratio of model cookies. J. Food Eng. 2008, 87, 380‐385.
Gökmen, V.; Acar, O.; Köksel, H.; Acar, J. Effects of dough formula and baking conditions on acrylamide and hydroxymethylfurfural formation in cookies. Food Chem. 2007, 104, 1136‐1142.
Gökmen, V.; Kocadagli, T.; Göncüoglu, N.; Mogol, B. A. Model studies on the role of 5‐ hydroxymethyl‐2‐furfural in acrylamide formation from asparagine. Food Chem. 2012, 132, 168‐174.
Gökmen, V.; Mogol, B. A. Computer vision‐based image analysis for rapid detection of acrylamide in heated foods. Qual. Assur. Saf. Crops Foods 2010, 2, 203‐207.
Gökmen, V.; Morales, F. J. Hydroxymethylfurfural. In Encyclopedia of Food Safety (FOSA); Elsevier, The Netherlands, 2012.
200
Gökmen, V.; Morales, F. J.; Atac, B.; Serpen, A.; Arribas‐Lorenzo, G. Multiple‐stage extraction strategy for the dtermination of acrylamide in foods. J. Food Compos. Anal. 2009, 22, 142‐147.
Gökmen, V.; Palazoglu, T. K.; Senyuva, H. Z. Relation between the acrylamide formation and time‐ temperature history of surface and core regions of French fries. J. Food Eng. 2006b, 77, 972‐976.
Gökmen, V.; Şenyuva, H. Z. Acrylamide formation is prevented by divalent cations during the Maillard reaction. Food Chem. 2007, 103, 196‐203.
Gökmen, V.; Şenyuva, H. Z. Improved method for the determination of hydroxymethylfurfural in baby foods using liquid chromatography‐mass spectrometry. J. Agric. Food Chem. 2006a, 54, 2845‐ 2849.
Gökmen, V.; Şenyuva, H. Z.; Acar, J.; Sarıoğlu, K. Determination of acrylamide in potato chips and crisps by high‐performance liquid chromatography. J. Chromatogr. A 2005, 1088, 193‐199.
Graf, M.; Amrein, T. M.; Graf, S.; Szalay, R.; Escher, F.; Amadò, R. Reducing the acrylamide content of a semi‐finished biscuit on industrial scale. Lebensm.‐Wiss. Technol. 2006, 39, 724‐728.
Granda, C.; Moreira, R. G.; Tichy, S. E. Reduction of acrylamide formation in potato chips by low‐ temperature vacuum frying. J. Food Sci. 2004, 69, 405‐411.
Granvogl, M.; Schieberle, P. Thermally generated 3‐aminopropionamide as a transient intermediate in the formation of acrylamide. J. Agric. Food Chem. 2006, 54, 5933‐5938.
Granvogl, M.; Schieberle, P. Quantification of 3‐aminopropionamide in cocoa, coffee and cereal products. Correlation with acrylamide concentrations determined by an improved clean‐up method for complex matrices. Eur. Food Res. Technol. 2007, 225, 857‐863.
Greaves, E. O.; Morgan, A. F.; Loveen, M. K. The effect of amino acid supplements and variations in temperature and duration of heating upon the biological value of heated casein. J. Nutr. 1938, 6, 115‐128.
Guía ISO 34:2000. Requisitos generales para la competencia de los productores de materiales de referencia.
Guía ISO 35:2006. Materiales de referencia ‐ Principios generales y estadísticos para la certifcación.
Hadorn, H.; Kovacs, A. S. On the examination and evaluation of foreign bee honey with regards to its hydroxymethylfurfural and diastase content. Mitt. Geb. Lebensmittelunters Hyg. 1960, 51, 373‐ 375.
Hagmar, L.; Tornqvist, M.; Nordander, C.; Rosen, I.; Bruze, M.; Kautiainen, A.; Magnusson, A. L.; Malmberg, B.; Aprea, P.; Granath, F.; Axmon, A. Health effects of occupational exposure to acrylamide using hemoglobin adducts as biomarkers of internal dose. Scand. J. Work Environ. Health 2001, 27, 219‐226.
Hamlet, C. G.; Sadd, P. A. Effects of yeast stress and pH on 3‐monochloropropanediol (3‐MCPD)‐ producing reactions in model dough systems. Food Addit. Contam. 2005, 22, 616‐623.
Hamlet, C. G.; Sadd, P. A. Chloropropanols and their esters in cereal products. Czech J. Food Sci. 2004, 22, 259‐262.
201
Hao, R.; Leng, X.; Jing, H. Acrylamide‐taurine adducts formation as a key mechanism for taurine’s inhibitory effect on acrylamide formation. Int. J. Food Sci. Technol. 2011, 46, 1282‐1288.
Hartmann, E. C.; Boettcher, M. I.; Schettgen, T.; Fromme, H.; Drexler, H.; Angerer, J. Hemoglobin adducts and mercapturic acid excretion of acrylamide and glycidamide in one study population. J. Agric. Food Chem. 2008, 56, 6061‐6068.
Health Canada; http://www.hc‐sc.gc.ca/fn‐an/securit/chem‐chim/food‐aliment/acrylamide/index‐ eng.php
HEATOX, 2007. Heat‐generated food toxicants: Identification, characterisation and risk minimisation. Lund, Sweden: Lund University; http://heatox.org/
Hedegaard, R. V.; Granby, K.; Franden, H.; Thygesen, J.; Leif, H. S. Acrylamide in bread. Effect of prooxidants and antioxidants. Eur. Food Res.Technol. 2008, 227, 519‐525.
Hidalgo, F. J.; Delgado, R. M.; Navarro, J. L.; Zamora, R. Asparagine decarboxylation by lipid oxidation products in model systems. J. Agric. Food Chem. 2010a, 58, 10512‐10517.
Hidalgo, F. J.; Delgado, R. M.; Zamora, R. Role of mercaptans on acrylamide elimination. Food Chem. 2010b, 122, 596‐601.
Hidalgo, F. J.; Gallardo, E.; Zamora, R. Strecker type degradation of phenylalanine by 4‐hydroxy‐2‐ nonenal in model systems. J. Agric. Food Chem. 2005, 53, 10254‐10259.
Hodge, J. E. Dehydrated foods‐chemistry of browning reactions in model systems. J. Agric. Food Chem. 1953, 1, 928‐943.
Hodge, J. E. Origin of flavor in foods: Nonenzymatic browning reactions. In Chemistry and Physiology of Flavors; Schultz, H. W., Day, E. A., Libbey, L. M., Eds.; AVI Publishing Company, Inc.: Westport, C.T., 1967; pp 465‐491.
Hoenicke, K.; Gatermann, R.; Harder, W.; Hartig, L. Analysis of acrylamide in different foodstuffs using liquid chromatography‐tandem mass spectrometry and gas chromatography‐tandem mass spectrometry. Anal. Chim. Acta 2004, 520, 207‐215.
Hogervorst, J. G. F.; Baars, B. J.; Schouten, L. J.; Konings, E. J. M.; Goldbohm, R. A.; Van den Brandt, P. A. The carcinogenicity of dietary acrylamide intake: A comparative discussion of epidemiological and experimental animal research. Crit. Rev. Toxicol. 2010, 40, 485‐512.
Hogervorst, J. G.; Schouten, L. J.; Konings, E. J.; Goldbohm, R. A.; Van den Brandt, P. A. Dietary acrylamide intake and the risk of renal cell, bladder, and prostate cancer. Am. J. Clinical Nut. 2008, 87, 1428‐1438.
Hollnagel, A.; Kroh, L. W. Formation of a‐dicarbonyl fragments from mono‐ and disaccharides nder caramelization and Maillard reaction conditions. Z. Lebensm.‐Unters. Forsch. 1998, 207, 50‐54.
Hrdlicka, J. Study of changes occurring during thermic and hydrothermic reactions. Effect of heavy‐ metals on reaction course of nonenzymic browning. Sbornik Vysoke Skoly Chemicko‐Technologicke V Praze‐Potraviny 1976, 48, 65‐82.
Hurrel, R. F. Influence of the Maillard reaction on the nutritional value of food. In The Maillard reaction in food, processing, human nutrition and physiology; Finot, P. A., Aeshbacher, H. V., Hurrel, K. F., Liardon, K., Eds.; Basel, Switzerland: Birkhäuser Verlag, 1990.
202
Husøy, T.; Haugen, M.; Murkovic, M.; Jöbstl, D.; Stølen, L. H.; Bjellaas, T.; Rønningborg, C.; Glatt, H.; Alexander, J. Dietary exposure to 5‐hydroxymethylfurfural from Norwegian food and correlations with urine metabolites of short‐term exposure. Food Chem. Toxicol. 2008, 46, 3697‐3702.
IARC (International Agency for Research on Cancer), 2010. World Health Organization. Monographs on the evaluation of carcinogenic risks to humans. Volume 92. Some nonheterocyclic polycyclic aromatic hydrocarbons and some related exposures; http://monographs.iarc.fr/ENG/Monographs/vol92/index.php.
ISO Guide 34, 2000. General requirements for the competence of reference materials producers.
ISO Guide 35, 2006. Reference materials ‐ General and statistical principles for certification.
Jägerstad, M.; Skog, K. Genotoxicity of heat‐processed foods. Mut. Res. 2005, 574, 156‐172.
JECFA, 1996. Toxicological evaluation of certain food additives. The forty‐fourth meeting of the Joint FAO/WHO ExpertCommittee on Food Additives and contaminants. In WHO Food Additives Series, Vol. 35. Geneva: IFCS, WHO.
JECFA, 2009. Safety evaluation of certain food additives/prepared by the sixtyninth meeting of the Joint FAO/WHO Expert Committee on Food Additives (JECFA). WHO Food Additives Series, 60, 5.
Jeurings, J.; Kuppers, F. High performance liquid chromatography of furfural and hydroxymethylfurfural in spirits and honey. J. Ass. Off. Anal. Chem. 1980, 63, 1215‐1218.
Jiao, J.; Zhang, Y.; Ren, Y.; Wu, X.; Zhang, Y. Development of a quantitative method for determination of acrylamide in infant powdered milk and baby foods in jars using isotope dilution liquid chromatography/electrospray ionization tandem mass spectrometry. J. Chromatogr. A 2005, 1099, 198‐202.
JIFSAN /JECFA acrylamide analytical database; http://acrylamide‐food.org/index.htm
JRC‐IRMM, 2006, Joint Research Centre’s Institute for Reference Materials and Measurements. Acrylamide monitoring database; http://irmm.jrc.ec.europa.eu/activities/acrylamide/Documents/acrylamide_db_310506.pdf
Kanjahn, D.; Jarms, U.; Maier, H. G. Hydroxymethylfurfural and furfural in coffee and related beverages. Deutsche Lebensmittel‐Rundschau 1996, 92, 328‐331.
Kaplan, O.; Kaya, G.; Ozcan, C.; Ince, M.; Yaman, M. Acrylamide concentrations in grilled foodstuffs of Turkish kitchen by high performance liquid chromatography‐mass spectrometry. Microchem. J. 2009, 93, 173‐179.
Kawamura, S. Seventy years of the Maillard reaction. In The Maillard reaction in Food and Nutrition; Waller, G. R., Feather, M. S., Eds.; American Chemical Society: Washington D.C., 1983; pp 3‐18.
Keeney, M.; Bassette, R. Detection of intermediate compounds in the early stages of browning reaction in milk products. J. Dairy Sci. 1959, 42, 945‐960.
Keramat, J.; LeBail, A.; Prost, C.; Safari, M. Acrylamide in Baking Products: A Review Article. Food Bioproc. Technol. 2011, 4, 530‐543.
Khatami, M.; Suldan, Z.; David, I.; Li, W.; Rocky, J. H. Inhibitory effects of pyridoxal phosphate, ascorbate and aminoguanidine on nonenzymatic glycosylation. Life Sci. 1988, 43, 1725‐1731.
203
Kim, B.; Park, S.; Lee, I.; Lim, Y.; Hwang, E.; So, H. Y. Development of a certified reference material for the determination of acrylamide in potato chips. Anal. Bioanal. Chem. 2010, 398, 1035‐1042.
Kim, C. T.; Hwang, E. S.; Lee, H. J. An improved LC‐MS/MS method for the quantitation of acrylamide in processed foods. Food Chem. 2007, 101, 401‐409.
Kim, H. J.; Richardson, M. Determination of 5‐hydroxymethylfurfural by ion‐exclusion chromatography with UV detection. J. Chromatogr. A 1992, 593, 153‐156.
Kolek, E.; Simon, P.; Simko, P. Nonisothermal kinetics of acrylamide elimination and its acceleration by table salt‐a model study. J. Food Sci. 2007, 72, 341‐344.
Konings, E. J. M.; Hogervorst, J. G. F.; Schouten, L. J.; Brandt, van den Brandt, P. A. Assessing exposure levels of acrylamide. In Acrylamide and other hazardous compounds in heat‐treated foods; Skog, K., Alexander, J., Eds.; Woodhead Publishing: Cambridge, U.K., 2007; pp 214‐230.
Kotsiou, K.; Tasioula‐Margari, M.; Capuano, E.; Fogliano, V. Effect of standard phenolic compounds and olive oil phenolic extracts on acrylamide formation in an emulsion system. Food Chem. 2011, 124, 242‐247.
Kotsiou, K.; Tasioula‐Margari, M.; Kukurová, K.; Ciesarová, Z. Impact of oregano and virgin olive oil phenolic compounds on acrylamide content in a model system and fresh potatoes. Food Chem. 2010, 123, 1149‐1155.
Koutsidis, G.; Simons, S. P. J.; Thong, Y. H.; Haldou‐Pis, Y.; Mojica‐Lazaro, J.; Wedzicha, B. L.; Mottram, D. S. Investigations on the effect of amino acids on acrylamide, pyrazines, and Michael addition products in model systems. J. Agric. Food Chem. 2009, 57, 9011‐9015.
Koutsidis, G.; De la Fuente, A.; Dimitriou, C.; Kakoulli, A.; Wedzicha, B. L.; Mottram, D. S. Acrylamide and pyrazine formation in model systems containing asparagine. J. Agric. Food Chem. 2008, 56, 6105‐6112.
Koyama, N.; Yasui, M.; Oda, Y.; Suzuki, S.; Satoh, T.; Suzuki, T.; Matsuda, T.; Masuda, S.; Kinae, N.; Honma, M. Genotoxicity of acrylamide in vitro: acrylamide is not metabolically activated in standard in vitro systems. Environ. Mol. Mutag. 2011, 52, 12‐19.
Kukurova, K.; Morales, F. J.; Bednáriková, A.; Ciesarová, Z. Effect of L‐asparaginase on acrylamide mitigation in a fried‐dough pastry model. Mol. Nutr. Food Res. 2009, 53, 1532‐1539.
Lafferty, J. S.; Kamendulis, L. M.; Kaster, J. L.; Jiang, J. Z.; Klaunig, J. E. Subchronic acrylamide treatment induces a tissue‐specific increase in DNA synthesis in the rat. Toxicol. Lett. 2004, 154, 95‐ 103.
Larsson, S. C.; Akesson, A.; Wolk, A. Long‐term dietary acrylamide intake and risk of epithelial ovarian cancer in a prospective cohort of Swedish women. Cancer Epidemiol. Bio. Prev. 2009, 18, 994‐997.
Lee, H. S.; Rouseff, R. L.; Nagy, S. HPLC determination of furfural and 5‐hydroxymethylfurfural in citrus juices. J. Food Sci. 1986, 51, 1075‐1076.
Lee, M. R.; Chang, L. Y.; Dou, J. Determination of acrylamide in food by solid‐phase microextraction coupled to gas chromatography‐positive chemical ionization tandem mass spectrometry. Anal. Chim. Acta 2007, 582, 19‐23.
204
Levine, R. S.; Smith, R. E. Sources of variability of acrylamide levels in cracker model. J. Agric. Food Chem. 2005, 53, 4410‐4416.
Lindsay, R. C.; Jang, S. 2005. Methods for suppressing acrylamide formation and restoring browned color and flavor. Patent US20050214411.
Lin, Y.; Lagergren, J.; Lu, Y. Dietary acrylamide intake and risk of esophageal cancer in a population‐ based case‐control study in Sweden. Int. J. Cancer 2011, 128, 676‐681.
Lineback, D. R.; Stadler, R. H. Introduction to food process toxicants. In Process‐Induced Food Toxicants: Ocurrence, Formation, Mitigation, and Health Risks; Stadler, R. H., Lineback, D. R., Eds; John Wiley and Sons, Inc. Ltd: West Sussex, U.K., 2009; pp 3‐19.
Liu, J.; Zhao, G.; Yuan, Y.; Chen, F.; Hu, X. Quantitative analysis of acrylamide in tea by liquid chromatography coupled with electrospray ionization tandem mass spectrometry. Food Chem. 2008, 108, 760‐767.
Lo, C. Y.; Li, S.; Wang, Y.; Tan, D.; Pan, M. H.; Sang, S.; Ho, C. T. Reactive dicarbonyl compounds and 5‐(hydroxymethyl)‐2‐furfural in carbonated beverages containing high fructose corn syrup. Food Chem. 2008, 107, 1099‐1105.
Lo Coco, F.; Valentini, C.; Novelli, V.; Ceccon, L. High‐performance liquid chromatographic determination of 2‐furaldehyde and 5‐hydroxymethyl‐2‐furaldehyde in honey. J. Chromatogr. A 1996, 749, 95‐102.
Loeb, A. L.; Anderson, R. J. Antagonism of acrylamide neurotoxicity by supplementation with vitamin B6. Neurotoxicol. 1981, 2, 625‐633.
LoPachin, R. M. The changing view of acrylamide neurotoxicity. Neurotoxicol. 2004, 25, 617‐630.
LoPachin, R. M.; Gavin, T. Acrylamide‐induced nerve terminal damage: relevance to neurotoxic and neurodegenerative mechanisms. J. Agric. Food Chem. 2008, 56, 5994‐6003.
Maillard, L. C. Action des acides amines sur les secres: formation des melanodines par voie methodique. Comptes rendus de l´Académie des sciences 1912, 154, 66‐68.
Martins, S.; Jongen, W.; van Boekel, M. A review of Maillard reaction in food and implications to kinetic modelling. Trends Food Sci. Technol. 2001, 11, 364‐373.
Martins, S.; Van Boekel, M. A kinetic model for the glucose/glycine Maillard reaction pathways. Food Chem. 2005, 90, 257‐269.
Mavric, E.; Wittmann, S.; Barth, G.; Henle, T. Identification and quantification of methylglyoxal as the dominant antibacterial constituent of Manuka (Leptospermum scoparium honeys from New Zealand. Mol. Nutr. Food Res. 2008, 52, 483‐489.
McCollum, E. V.; Davis, M. The cause of the loss of nutritive efficiency of heated milk. J. Biol. Chem. 1915, 23, 247‐254.
Meade, S. J.; Reid, E. A.; Gerrard, J. A. The impact of processing on the nutritional quality of food proteins. J. AOAC Int. 2005, 88, 904‐922.
Mestdagh, F.; De Meulenaer, B.; Van Peteghem, C. Influence of oil degradation on the amounts of acrylamide generated in a model system and in French fries. Food Chem. 2007, 100, 1153‐1159.
205
Mestdagh, F.; Maertens, J.; Cucu, T.; Delporte K.; Van Peteghem, C.; De Meulenaer, B. Impact of additives to lower the formation of acrylamide in a potato model system through pH reduction and other mechanisms. Food Chem. 2008a, 107, 26‐31.
Mestdagh, F. J.; de Meulenaer, B.; van Poucke, C.; Detavernier, C.; Cromphout, C.; van Peteghem, C. Influence of oil type on the amounts of acrylamide generated in a model system and in French fries. J. Agric. Food Chem. 2005, 53, 6170‐6174.
Mestdagh, F.; Castelein P.; Van Peteghem, C.; De Meulenaer, B. Importance of oil degradation components in the formation of acrylamide in fried foodstuffs. J. Agric. Food Chem. 2008b, 56, 6141‐6144.
Monien, B. H.; Frank, H.; Seidel, A.; Glatt, H. Conversion of the common food constituent 5‐ hydroxymethylfurfural into a mutagenic and carcinogenic sulfuric acid ester in the mouse in vivo. Chem. Res. Toxicol. 2009, 22, 1123‐1128.
Monti, S. M.; Ritieni, A.; Sacchi, R.; Skog, K.; Borgen, E.; Fogliano, V. Characterization of phenolic compounds in virgin olive oil and their effect on the formation of carcinogenic/ mutagenic heterocyclic amines in a model system. J. Agric. Food Chem. 2001, 49, 3969‐3975.
Montilla‐Gómez, J.; Olea‐Serrano, F.; García‐Villanova, R. Determinación espectrofotométrica de furfural y 5‐hydroximetilfurfural al estado de tiosemicarbazonas en vinos tipo Málaga. Quím. Anal. 1988, 7, 77‐84.
Morales, F. J. Hydroxymethylfurfural (HMF) and related compounds. In Process‐Induced Food Toxicants: Occurrence, Formation, Mitigation, and Health Risks; Stadler, R. H., Lineback, D. R., Eds.; John Wiley and Sons, Inc. Hoboken, NJ, USA, 2009; pp 134‐175.
Morales, F. J.; Açar, Ö. Ç.; Serpen, A.; Arribas‐Lorenzo, G.; Gökmen, V. 2007. Degradation of free tryptophan in a cookie model system and its application in commerical samples. J. Agric. Food Chem. 2007, 55, 6793‐6797.
Morales, F. J.; Arribas‐Lorenzo, G. The formation of potentially harmful compounds in churros, a Spanish fried‐dough pastry, as influenced by deep frying conditions. Food Chem. 2008, 109, 421‐ 425.
Morales, F.; Capuano, E.; Fogliano, V. Mitigation strategies to reduce acrylamide formation in fried potato products. Ann. N.Y. Acad. Sci. 2008, 1126, 89‐100.
Morales, F. J.; Jiménez‐Pérez, S. Hydroxymethylfurfural determination in infant milk‐based formulas by micellar electrokinetic capillary chromatography. Food Chem. 2001, 72, 525‐531.
Morales, F. J.; Romero, C.; Jiménez‐Pérez, S. An enhanced liquid chromatographic method for 5‐ hydroxymethylfurfural determination in UHT milk. Chromatogr. 1992, 33, 45‐48.
Morales, F. J.; Somoza, V.; Fogliano, V. Physiological relevance of dietary melanoidins. Amino Acids 2012, 42, 1097‐1109.
Mottram D. S. Flavour compounds formed during the Maillard reaction. In Thermally Generated Flavors: Maillard, Microwave and Extrusion Processes; Parliament, T. H., Morello, M. J., McGorrin R.J., Eds.; American Chemical Society: Washington DC, 1994; pp 104‐126.
Mottram, D. S.; Wedzicha, B. L.; Dodson, A. T. Acrylamide is formed in the Maillard reaction. Nature 2002, 419, 448‐449.
206
Mucci, L. A.; Adami, H. O. The plight of the potato: is dietary acrylamide a risk factor for human cancer?. J. Nat. Cancer Instit. 2009, 101, 618‐621.
Mucci, L. A.; Adami, H. O.; Wolk, A. Prospective study of dietary acrylamide and risk of colorectal cancer among women. Int. J. Cancer 2006, 118, 169‐173.
Mulla, M. Z.; Bharadwaj, V. R.; Annapure, U. S.; Variyar, P. S.; Sharma, A.; Singhal, R. S. Acrylamide content in fried chips prepared from irradiated and non‐irradiated stored potatoes. Food Chem. 2011, 127, 1668‐1672.
Murkovic, M.; Bornik, M. A. Formation of 5‐hydroxymethyl‐2‐furfural (HMF) and 5‐hydroxymethyl‐ 2‐furoic acid during roasting of coffee. Mol. Nutr. Food Res. 2007, 51, 390‐394.
Murkovic, M.; Pichler, N. Analysis of 5‐hydroxymethylfurfural in coffee, dried fruits and urine. Mol. Nutr. Food Res. 2006, 50, 842‐846.
Mustafa, A.; Andersson, R.; Kamai‐Eldin, A.; Áman, P. Fortification with free amino acids affects acrylamide content in yeast leavened bread. In Flour and breads and their fortification in health and disease prevention; Preedy, V. R., Watson, R. R., Patel, V. B., Eds.; Academic Press, Elsevier, 2011; pp 325‐335.
Nagao, M.; Fujita, Y.; Sugimura, T.; Kosuge, T. Methylglyoxal in beverages and foods: its mutagenicity and carcinogenicity. IARC Sci. Publ. 1986, 70, 283‐291.
Nagaraj, R. H.; Sarkar, P.; Mally, A.; Biemel, K. M.; Lederer, M. O.; Padayatti, P. S. Effect of pyridoxamine on chemical modification of proteins by carbonyls in diabetic rats: characterization of a major product from the reaction of pyridoxamine and methylglyoxal. Arch. Biochem. Biophys. 2002, 402, 110‐119.
Napolitano, A.; Morales, F.; Sacchi, R.; Fogliano, V. Relationship between virgin olive oil phenolic compounds and acrylamide formation in fried crisps. J. Agric. Food Chem. 2008, 56, 2034‐2040.
National Toxicology Program, (NTP), 2008. Toxicology and carcinogenesis studies of 5‐ (hydroxymethyl)‐2‐furfural (CAS No. 67‐47‐0) in F344/N rats and B6C3F1 mice (gavage studies). National Toxicology Program Tech Report Series; http://ntp.niehs.nih.gov/.
Navarro, P.; Aspe, T.; Seiquer, I. Zinc transport in Caco‐2 cells and zinc in rats: Influence of the heat treatment of a casein glucose‐fructose mixture. J. Agric. Food Chem. 2000, 48, 3589‐3596.
Nemoto, S.; Takatsuki, S.; Sasaki, K.; Maitani, T. Determination of acrylamide in food by GC/MS using 13C‐labelled acrylamide as internal standard. J. Food Hyg. Soc. Jap. 2002, 43, 371‐376.
Nicoli, M. C.; Anese, M. A process for removing acrylamid from foods, 2006. Patent No. PD2006A000332.
Nomeir, A. A.; Silvena, D. M.; McComish, M. F.; Chadwick, M. Comparative metabolism and disposition of furfural and furfuryl alcohol in rats. Drug Metab. Disp. 1992, 20, 198‐204.
O'Brien, J.; Renwick, A. G.; Constable, A.; Dybing, E.; Muller, D. J. G.; Schlatter, J.; Slob, W.; Tueting, W.; van Benthem, J.; Williams, G. M.; Wolfreys, A. Approaches to the risk assessment of genotoxic carcinogens in food: A critical appraisal. Food Chem. Toxicol. 2006, 44, 1613‐1635.
OEHHA, Office of Environmental Health Hazard Assesment; http://www.oehha.ca.gov/prop65/acrylamide.html
207
Ono, H.; Chuda, Y.; Ohnishi‐Kameyama, M.; Yada, H.; Ishizaka, M.; Kobayashi, H.; Yoshida, M. Analysis of acrylamide by LC‐MS/MS and GC‐MS in processed Japanese foods. Food Addit. Contam. 2003, 20, 215‐220.
Onorato, J. M.; Jenkins, A. J.; Thorpe, S. R.; Baynes, J. W. Pyridoxamine, an inhibitor of advanced glycation reactions, also inhibits advanced lipoxidation reactions. Mechanism of action of pyridoxamine. J. Biol. Chem. 2000, 275, 21177‐21184.
Öste, R. E.; Dahlqvist, A.; Sjostrom, H.; Naren, O.; Miller, R. Effect of Maillard reaction products on protein digestion. In vivo studies. J. Agric. Food Chem. 1986, 34, 355‐358.
Öste, R. E.; Miller, R.; Sjostrom, H.; Noren, O. Effect of Maillard reaction products on protein digestion. Studies on pure compounds. J. Agric. Food Chem. 1987, 35, 938‐944.
Ou, S.; Shi, J.; Huang, C.; Zhang, G.; Teng, J.; Jiang, Y.; Yang, B. Effect of antioxidants on elimination and formation of acrylamide in model reaction systems. J. Hazard. Mater. 2010, 182, 863‐868.
Paleologos, E. K.; Kontominas, M. G. Determination of acrylamide and methacrylamide by normal phase high performance liquid chromatography and UV detection. J. Chromatogr. A 2005, 1077, 128‐135.
Pastoriza, S.; Rufián‐Henares, J. A.; Morales, F. J. Reactivity of acrylamide with coffee melanoidins in model systems. LWT ‐ Food Sci. Technol. 2012, 45, 198‐203.
Paulsson, B.; Warholm, M.; Rannug, A.; Törnqvist, M. In vitro studies of the influence of certain enzymes on the detoxification of acrylamide and glycidamide in blood. In Chemistry and Safety of Acrylamide in Food; Friedman, M., Mottram, D., Eds.; Springer: New York, 2005; pp 127‐133.
Pedreschi, F.; Granby, K.; Risum, J. Acrylamide mitigation in potato chips by using NaCl. Food Biopr. Technol. 2010, 3, 917‐921.
Pedreschi, F.; Kaack, K.; Granby, K.; Troncoso, E. Acrylamide reduction under different pre‐ treatments in French fries. J. Food Eng. 2007, 79, 1287‐1294.
Pedreschi, F.; Mariotti, S.; Granby, K.; Risum, J. Acrylamide reduction in potato chips by using commercial asparaginase in combination with conventional blanching. LWT‐Food Sci. Technol. 2011, 44, 1473‐1476.
Perez‐Locas, C.; Yaylayan, V. A. Isotope labeling studies on the formation of 5‐(hydroxymethyl)‐2‐ furaldehyde (HMF) from sucrose by pyrolysis‐GC/MS. J. Agric. Food Chem. 2008a, 56, 6717‐6723.
Perez‐Locas, C.; Yaylayan, V. A. Further insight into thermally and pH‐induced generation of acrylamide from glucose/asparagine model systems. J. Agric. Food Chem. 2008b, 56, 6069‐6074.
Petersen, B. J.; Tran, N. Exposure to acrylamide. Placing exposure in context. In Chemistry and safety of acrylamide in food; Friedman, M., Mottram, D., Eds.; New York (NY): Springer Science, 2005; pp 63‐76.
Porretta, S.; Sandei, L. Determination of 5‐(hydroxymethyl)‐2‐furfural (HMF) in tomato products: Proposal of a rapid HPLC method and its comparison with the colorimetric method. Food Chem. 1991, 39, 51‐57.
Quarta, B.; Anese, M. The effect of salts on acrylamide and 5‐hydroxymethylfurfural formation in glucose‐asparagine model solutions and biscuits. J. Food Nutr. Res. 2010, 49, 69‐77.
208
Rada‐Mendoza, M.; Olano, A.; Villamiel, M. Determination of hydroxymethylfurfural in commercial jams and in fruit‐based infant foods. Food Chem. 2002, 79, 513‐516.
Reddy, V. P.; Beyaz, A. Inhibitors of the Maillard reaction and AGE breakers as therapeutics for multiple diseases. Drug Discov. Today 2006, 11, 646‐654.
Reglamento (UE) Nº 366/2011 de la Comisión de 14 de abril de 2011 por el que se modifica el Reglamento (CE) nº 1907/2006 del Parlamento Europeo y del Consejo, relativo al registro, la evaluación, la autorización y la restricción de las sustancias y preparados químicos (REACH), en lo que respecta a su anexo XVII (acrilamida). Diario Oficial de la Unión Europea, 2011, L 101/12.
Reglamento (CE) Nº 1272/2008 del Parlamento Europeo y del Consejo de 16 de diciembre de 2008 sobre clasificación, etiquetado y envasado de sustancias y mezclas, y por el que se modifican y derogan las Directivas 67/548/CEE y 1999/45/CE y se modifica el Reglamento (CE) nº 1907/2006. Diario Oficial de la Unión Europea, 2008, L353/1.
Reglamento (CE) Nº 882/2004 del Parlamento Europeo y del Consejo, de 29 de abril de 2004, sobre los controles oficiales efectuados para garantizar la verificación del cumplimiento de la legislación en materia de piensos y alimentos y la normativa sobre salud animal y bienestar de los animales. Diario Oficial de la Unión Europea, 2004, L165.
Rerat, A.; Calmes, R.; Vaissade, P.; Finot, P. A. Nutritional and metabolic consequences of the early Maillard reaction of heat treated milk in the pig. Significance for man. Eur. J. Nutr. 2002, 41, 1‐11.
Reyes‐Salas, E. O.; Manzanilla‐Cano, J. A.; Barceló‐Quintal, M. H.; Juárez‐Mendoza, D.; Reyes‐Salas, M. Direct electrochemical determination of hydroxymethylfurfural (HMF) and its application to honey samples. Anal. Lett. 2006, 39, 161‐171.
Reynolds, T. Acrylamide and cancer: tunnel leak in Sweden prompted studies. J. Natl. Cancer Inst. 2002, 94, 876‐878.
Rice, J. M. The carcinogenicity of acrylamide. Mutat. Res. 2005, 580, 3‐20.
Rice, R. G.; Keller, G. J.; Kirchner, J. G. Separation and identification of 2,4‐dinitrophenylhydrazones of aldehydes and ketones, and 3,5‐dinitrobenzoates of alcohols by filter‐paper chromatography. Anal. Chem. 1951, 23, 194‐195.
Risner, C. H.; Kiser, M. J.; Dube, M. F. An aqueous high‐performance liquid chromatographic procedure for the determination of 5‐hydroxymethylfurfural in honey and other sugar‐containing materials. J. Food Sci. 2006, 71, 179‐184.
Roach, J. A. G.; Andrzejewski, D.; Gay, M. L.; Nortrup, D.; Musser, S. M. Rugged LC‐MS/MS survey analysis for acrylamide in foods. J. Agric. Food Chem. 2003, 51, 7547‐7554.
Rodríguez‐Ramiro, I.; Martín, M. A.; Ramos, S.; Bravo, L.; Goya, L. Olive oil hydroxytyrosol reduces toxicity evoked by acrylamide in human Caco‐2 cells by preventing oxidative stress. Toxicol. 2011, 288, 43‐48.
Roiter, I.; Borovikova, L. A. Level of volatile carbonyl compounds in bread during the addition of enzyme preparations. Khlebopek. Konditer. Promst 1972, 14, 14‐15.
Romani, S.; Bacchiocca, M.; Rocculi, P.; Rosa, M. D. Effect of frying time on acrylamide content and quality aspects of French fries. Eur. Food Res. Technol. 2008, 226, 555‐560.
209
Rosén, J.; Hellenäs, K. E. Analysis of acrylamide in cooked foods by liquid chromatography tandem mass spectrometry. Analyst 2002, 127, 880‐882.
Rufián‐Henares, J. A.; de la Cueva, S. P. Assessment of hydroxymethylfurfural intake in the Spanish diet. Food Addit. Contam. 2008, 25, 1306‐1312.
Rufián‐Henares, J. A.; de la Cueva, S. P. Antimicrobial activity of coffee melanoidins: a study of their metal‐chelating properties. J. Agric. Food Chem. 2009, 57, 432‐438.
Rufián‐Henares, J. A.; Delgado‐Andrade, C.; Jimenez‐Perez S.; Morales F. J. Assessing nutritional quality of milk‐based sport supplements as determined by furosine. Food Chem. 2007, 101, 573‐ 578.
Rufián‐Henares, J. A., Delgado‐Andrade, C.; Morales, F. J. Application of a reverse phase high‐ performance liquid chromatography method for simultaneous determination of furanic compounds and glucosylisomaltol in breakfast cereals. J. AOAC Int. 2006a, 89, 1‐5.
Rufián‐Henares, J. A.; Delgado‐Andrade, C.; Morales, F. J. Relationship between acrylamide and thermal‐processing indexes in commercial breakfast cereals: a survey of Spanish breakfast cereals. Mol. Nutr. Food Res. 2006b, 50, 756‐762.
Rufián‐Henares, J. A.; Morales, F. J. Determination of acrylamide in potato chips by a reversed‐ phase LC–MS method based on a stable isotope dilution assay. Food Chem. 2006, 97, 555‐562.
Rufián‐Henares, J. A.; Morales F. J. Functional properties of melanoidins: In vitro antioxidant, antimicrobial and antihypertensive activities. Food Res. Int. 2007, 40, 995‐1002.
Rydberg, P.; Eriksson, S.; Tareke, E.; Karlsson, P.; Ehrenberg, L.; Törnqvist, M. Investigations of factors that influence the acrylamide content of heated foodstuffs. J. Agric. Food Chem. 2003, 51, 7012‐7018.
Sadd, P.; Hamlet, C. The formation of acrylamide in UK cereal products. In Chemistry and safety of acrylamide in food; Friedman M., Mottram, D. S. Eds.; Springer: New York, 2005; pp 415‐430.
Sadd, P.; Hamlet, C. G.; Liang, L. Effectiveness of methods for reducing acrylamide in bakery products. J. Agric. Food Chem. 2008, 56, 6154‐6161.
Saison, D.; De Schutter, D. P.; Delvaux, F.; Delvaux, F. R. Determination of carbonyl compounds in beer by derivatisation and headspace solid‐phase microextraction in combination with gas chromatography and mass spectrometry. J. Chromatogr. A 2009, 1216, 5061‐5068.
Sang, S.; Shao, X.; Bai, N.; Lo, C. Y.; Yang, C. S.; Ho, C. T. Tea polyphenol (‐)‐epigallocatechin‐3 gallate: A new trapping agent of reactive dicarbonyl species. Chem. Res. Toxicol. 2007, 20, 1862‐1870.
Sanny, M.; Luning, P. A.; Marcelis, W. J.; Jinap, S.; Van Boekel, M. A. J. S. Impact of control behaviour on unacceptable variation in acrylamide in French fries. Trends Food Sci. Technol. 2010, 21, 256‐267.
Schettgen, T.; Kütting, B.; Hornig, M.; Beckmann, M. W.; Weiss, T.; Drexler, H.; Angerer J. Trans‐ placental exposure of neonates to acrylamide‐a pilot study. Int. Arch. Occupat. Environ. Health 2004, 77, 213‐216.
210
Schieberle, P.; Köhler, P.; Granvogl, M. New aspects on the formation and analysis of acrylamide. In Chemistry and Safety of Acrylamide in Food; Friedman, M., Mottram, D., Eds.; Springer: New York, 2005; pp 205‐222.
Shipp, A.; Lawrence, G.; Gentry, R.; McDonald, T.; Bartow, H.; Bounds, J.; Macdonald, N.; Clewell, H.; Allen, B.; Van Landingham, C. Acrylamide: Review of toxicity data and dose‐response analyses for cancer and noncancer effects. Crit. Rev. Toxicol. 2006, 36, 481‐608.
Schuck, D. F.; Pavlina, T. M. Rapid detection of 5 ‐ (hydroxymethyl) ‐ 2 ‐ furfural in parenteral solutions with high, performance thin, layer chromatography. J. Planar Chromatogr. 1994, 7, 242‐ 246.
Seal, C. J.; de Mul, A.; Eisenbrand, G.; Haverkort, A. J.; Franke, K.; Lalljie, S. P.; Mykkänen, H.; Reimerdes, E.; Scholz, G.; Somoza, V.; Tuijtelaars, S.; van Boekel, M.; van Klaveren, J.; Wilcockson, S. J.; Wilms, L. Risk‐benefit considerations of mitigation measures on acrylamide content of foods‐a case study on potatoes, cereals and coffee. British J. Nutr. 2008, 99, 1‐46.
Senyuva, H. Z.; Gökmen, V. Survey of acrylamide in Turkish foods by an in‐house validated LC‐MS method. Food Addit. Contam. 2005, 22, 204‐209.
Skog, K. I.; Johansson, M. A. E.; Jagerstad, M. I. Carcinogenic heterocyclic amines in model systems and cooked foods: A review on formation, occurrence and intake. Food Chem. Toxicol. 1998, 36, 879‐896.
Skog, K.; Solyakov, A. Heterocyclic amines in poultry products: a literature review. Food Chem. Toxicol. 2002, 40, 1213‐1221.
SNFA, Swedish National Food Administration, 2002. Analysis of acrylamide in food.
Soares, C. M. D.; Alves, R. C.; Casal, S.; Oliveira, M. B. P. P.; Fernandes, J. O. Development and validation of a matrix solid‐phase dispersion method to determine acrylamide in coffee and coffee substitutes. J. Food Sci. 2010, 75, 57‐63.
Soares, C. M. D.; Fernandes, J. O. MSPD method to determine acrylamide in food. Food Anal. Meth. 2009, 2, 197‐203.
Springer, M.; Fischer, T.; Lehrack, A.; Freund, W. Acrylamidbildung in Backwaren. Getreide, Mehl und Brot 2003, 57, 274‐278.
Stadler, R. H. The formation of acrylamide in cereal products and coffee. In Acrylamide and Other Hazardous Compounds in Heat‐Treated Foods; Skog, K., Alexander, J., Eds.; Woodhead Publishing: Cambridge, U.K., 2006; pp 23‐40.
Stadler, R. H.; Blank, I.; Varga, N.; Robert, F.; Hau, J.; Guy, P. A.; Robert, M.‐C.; Riediker, S. Acrylamide from Maillard reaction products. Nature 2002, 419, 449‐450.
Stadler, R. H.; Robert, F.; Riediker, S.; Varga, N.; Davídek, T.; Devaud, S.; Goldmann, T.; Hau, J.; Blank, I. In‐depth mechanistic study on the formation of acrylamide and other vinylogous compounds by the Maillard reaction. J. Agric. Food Chem. 2004, 52, 5550‐5558.
Stadler, R. H.; Verzegnassi, L.; Varga, N.; Grigorov, M.; Studer, A.; Riediker, S.; Schilter, B. Formation of vinylogous compounds in model Maillard reaction systems. Chem. Res. Toxicol. 2003, 16, 1242‐ 1250.
211
Stephens, J. M.; Schlothauer, R. C.; Morris, B. D.; Yang, D.; Fearnley, L.; Greenwood, D. R.; Loomes, K. M. Phenolic compounds and methylglyoxal in some New Zealand manuka and kanuka honeys. Food Chem. 2010, 120, 78‐86.
Sugimura, T.; Nagao, M.; Kawachi, T.; Honda, M.; Yahagi, T.; Seino, Y.; Sato, S.; Matsukura, N.; Matsushima, T.; Shirai, A.; Sawamura, M.; Matsumoto, H. Mutagen‐carcinogens in foods with special reference to highly mutagenic pyrolytic products in broiled foods. In Origins of human cancer; Hiatt, H. H., Watson, J. D., Winsten, J. A., Eds.; Cold Spring Harbor: New York, 1977; pp 1561‐1577.
Sumner, S. C. J.; Williams, C. C.; Snyder, R. W.; Krol, W. L.; Asgharian, B.; Fennell, T. R. Acrylamide: A comparison of metabolism and hemoglobin adducts in rodents following dermal, intraperitoneal, oral, or inhalation exposure. Toxicol. Sci. 2003, 75, 260‐270.
Surh, Y. J.; Tannenbaum, S. R. Activation of the Maillard reaction product 5‐(hydroxymethyl)furfural to strong mutagens via allylic sulfonation and chlorination. Chem. Res. Toxicol. 1994, 7, 313‐318.
Svendsen, C.; Husøy, T.; Glatt, H.; Paulsen, J. E.; Alexander, J. 5‐Hydroxymethylfurfural and 5‐ sulfooxymethylfurfural increase adenoma and flat ACF number in the intestine of Min/+ mice. Anticancer Res. 2009, 29, 1921‐1926.
Tareke, E. Identification and origin of potential background carcinogens: Endogenous isoprene and oxiranes, dietary acrylamide. Doctoral thesis, Department of Environmental Chemistry, 2003, Stockholm University, Sweden.
Tareke, E.; Rydberg, P.; Karlsson, P.; Eriksson, S.; Törnqvist, M. Analysis of acrylamide, a carcinogen formed in heated foodstuffs. J. Agric. Food Chem. 2002, 50, 4998‐5006.
Tareke, E.; Rydberg, P.; Karlsson, P.; Eriksson, S.; Törnqvist, M. Acrylamide: a cooking carcinogen?. Chem. Res. Toxicol. 2000, 13, 517‐522.
Tareke, E.; Twaddle, N. C.; McDaniel, L. P.; Churchwell, M. I.; Young, J. F.; Doerge, D. R. Relationships between biomarkers of exposure and toxicokinetics in Fischer 344 rats and B6C3F1 mice administered single doses of acrylamide and glycidamide and multiple doses of acrylamide. Toxicol. Appl. Pharmacol. 2006, 217, 63‐75.
Tateo, F.; Bononi, M.; Gallone, F. Acrylamide content in potato chips on the Italian market determined by liquid chromatography tandem mass spectrometry. Int. J. Food Sci. Technol. 2010, 45, 629‐634.
Teixidó, E.; Núñez, O.; Santos, F. J.; Galcerán, M. T. 5‐Hydroxymethylfurfural content in foodstuffs determined by micellar electrokinetic chromatography. Food Chem. 2011, 126, 1902‐1908.
Teixidó, E.; Santos, F. J.; Puignou, L.; Galceran, M. T. Analysis of 5‐hydroxymethylfurfural in foods by gas chromatography‐mass spectrometry. J. Chromatogr. A 2006, 1135, 85‐90.
Theobald, A.; Müller, A.; Anklam, E. Determination of 5‐hydroxymethylfurfural in vinegar samples by HPLC. J. Agric. Food Chem. 1998, 46, 1850‐1854.
Thornalley, P. J. Dicarbonyl intermediates in the Maillard reaction. Ann. N.Y. Acad. Sci. 2005, 1043, 1‐7.
Thornalley, P. J.; Wolff, S.; Crabbe, J.; Stern, A. The autoxidation of glyceraldehyde and other simple
212
monosaccharides under physiological conditions catalysed by buffer ions. Biochim. Biophys. Acta 1984, 797, 276‐287.
Törnqvist, M.; Paulsson, B.; Vikström, A. C.; Granath, F. Approach for cancer risk estimation of acrylamide in food on the basis of animal cancer tests and in vivo dosimetry. J. Agric. Food Chem. 2008, 56, 6004‐6012.
UNE‐EN ISO/IEC 17025:2005. Requisitos generales para la competencia de los laboratorios de ensayos y calibración.
Ulbricht, R. J.; Northup, S. J.; Thomas, J. A. A review of 5‐hydroxymethylfurfural (HMF) in parenteral solutions. Fundam. Appl. Toxicol. 1984, 4, 843‐853.
U.S. FDA, 2002. Survey data on acrylamide in food: individual food products; http://www.fda.gov/Food/FoodSafety/FoodContaminantsAdulteration/ChemicalContaminants/Acr ylamide/default.htm
U.S. FDA, 2006. Survey Data on Acrylamide in Food: Individual Food Products; http://www.fda.gov/Food/FoodSafety/FoodContaminantsAdulteration/ChemicalContaminants/Acr ylamide/default.htm
U.S. EPA, 1992. Initial submission: Acute oral LD50 study with 5‐hydroxymethylfurfural in rats. Cover letter dated 073192, EPA/OTS. Doc. #88‐920005429, Chicago, Illinois, USA.
U.S. EPA, 2002. United States Environmental Protection Agency. Polycyclic Organic Matter. Environmental Protection Agency, Washington, DC.; http://www.epa.gov/ttn/atw/hlthef/polycycl.html
Van Boekel, M. A. J. S. Formation of flavour compounds in the Maillard reaction. Biotechnol. Adv. 2006, 24, 230‐233.
Van Boekel, M.; Fogliano, V.; Pellegrini, N.; Stanton, C.; Scholz, G.; Lalljie, S.; Somoza, S.; Knorr, D.; Rao Jasti, P.; Eisenbrand, G. A review on the beneficial aspects of food processing. Mol. Nutr. Food Res. 2010, 54, 1‐33.
Van Duin, H. Chromatography by liquid‐liquid partition and liquid‐liquid interface adsorption. Nature 1957, 180, 1473.
Vattem, D. A.; Shetty, K. Acrylamide in foods: a model for mechanism of formation and its reduction. Innov. Food Sci. Emerg. Technol. 2003, 4, 331‐338.
Velíšek, J.; Davídek, J.; Hajšlová, J.; Kubelka, V.; Janícek, G.; Mánková, B. Chlorohydrins in protein hydrolysates. Zeitsch. Lebensmittel.‐Untersuch.‐Forsch. 1978, 167, 241‐244.
Vinci, R. M.; Mestdagh, F.; Van Poucke, C.; Kerkaert, B.; de Muer, N.; Denon, Q.; Van Peteghem, C.; De Meulenaer, B. Implementation of acrylamide mitigation strategies on industrial production of french fries: challenges and pitfalls. J. Agric. Food Chem. 2011, 59, 898‐906.
Voziyan, P. A.; Hudson, B. G. Pyridoxamine as a multifunctional pharmaceutical: targeting pathogenic glycation and oxidative damage. Cell. Mol. Life Sci. 2005, 62, 1671‐1681.
Voziyan, P. A.; Metz, T. O.; Baynes, J. W.; Hudson, B. G. A post‐amadori inhibitor pyridoxamine also inhibits chemical modification of proteins by scavenging carbonyl intermediates of carbohydrate and lipid degradation. J. Biol. Chem. 2002, 277, 3397‐3403.
213
Wang, H.; Lee, A. W. M.; Shuang, S.; Choi, M. M. F. SPE/HPLC/UV studies on acrylamide in deep‐ fried flour‐based indigenous Chinese foods. Microchem. J. 2008, 89, 90‐97.
Wang, R.; Yang, C.; Song, H. L. Key meat flavour compounds formation mechanism in a glutathione‐ xylose Maillard reaction. Food Chem. 2012, 131, 280‐285.
Wilson, K. M.; Mucci, L. A.; Rosner, B. A.; Willett, W. C. Prospective study on dietary acrylamide intake and the risk for breast, endometrial, and ovarian cancers. Cancer Epidemiol. Bio. Prev. 2010, 19, 2503‐2515.
Winkler, O. Detection and determination of hydroxy‐methylfurfural in honey. Zeitsch. Lebensmitt. 1955, 102, 161‐167.
Wu, J. Y.; Shi, Z. G.; Feng, Y. Q. Determination of 5‐Hydroxymethylfurfural using derivatization combined with polymer monolith microextraction by high‐Performance liquid chromatography. J. Agric. Food Chem. 2009, 57, 3981‐3988.
Xu, X. M.; Ren, Y. P.; Wu, P. G.; Han, J. L.; Shen, X. H. The simultaneous separation and determination of chloropropanols in soy sauce and other flavourings with gas chromatography‐ mass spectrometry in negative chemical and electron impact ionisation modes. Food Addit. Contam. 2006, 23, 110‐119.
Yasuhara, A.; Tanaka, Y.; Hengel, M.; Shibamoto, T. Gas chromatographic investigation of acrylamide formation in browning model systems. J. Agric. Food Chem. 2003, 51, 3999‐4003.
Yaylayan, V. A.; Perez Locas, C.; Wnorowski, A.; O’Brien, J. Mechanistic pathways of formation of acrylamide from different amino acids. In Chemistry and Safety of Acrylamide in Food; Friedman, M., Mottram, D. S., Eds.; Springer: New York, 2005; pp 191‐203.
Yaylayan, V. A.; Stadler, R. H. Acrylamide formation in food: a mechanistic perspective. J. AOAC Int. 2005, 88, 262‐267.
Yaylayan, V. A.; Wnorowski, A.; Perez Locas, C. Why asparagine needs carbohydrate to generate acrylamide. J. Agric. Food Chem. 2003, 51, 1753‐1757.
Ye, H.; Miao, Y.; Zhao, C.; Yuan, Y. Acrylamide and methylglyoxal formation in potato chips by microwaving and frying heating. Int. J. Food Sci. Technol. 2011, 46, 1921‐1926.
Yuan, J. P.; Chen, F. Separation and identification of furanic compounds in fruit juices and drinks by high‐performance liquid chromatography photodiode array detection. J. Agric. Food Chem. 1998, 46, 1289‐1291.
Yuan, Y.; Zhao, G. H.; Chen, F.; Liu, J.; Wu, J. H.; Hu, X. S. Correlation of methylglyoxal with acrylamide formation in fructose/asparagine Maillard reaction model system. Food Chem. 2008a, 108, 885‐890.
Yuan, Y.; Zhao, G. H.; Hu, X. S.; Wu, J. H.; Liu, J.; Chen, F. High correlation of methylglyoxal with acrylamide formation in glucose/asparagine Maillard reaction model. Eur. Food Res. Technol. 2008b, 226, 1301‐1307.
Yusa, V.; Quintas, G.; Pardo, O.; Marti, P.; Pastor, A. Determination of acrylamide in foods by pressurized fluid extraction and liquid chromatography‐tandem mass spectrometry used for a survey of Spanish cereal‐based foods. Food Addit. Contam. 2006, 23, 237‐244.
214
Zamora, R.; Delgado, R. M.; Hidalgo, F. J. Conversion of 3‐aminopropionamide and alkylaminopropionamides into acrylamide in model systems. Mol. Nutr. Food Res. 2009, 53, 1512‐ 1520.
Zamora, R.; Delgado, R. M.; Hidalgo, F. J. Strecker aldehydes and a‐keto acids, produced by carbonyl‐amine reactions, contribute to the formation of acrylamide. J. Agric. Food Chem. 2011, 128, 465‐470.
Zamora, R.; Gallardo, E.; Hidalgo, F. J. Strecker degradation initiated by 2,4‐decadienal or methyl 13‐oxooctadeca‐9,11‐dienoate in model systems. J. Agric. Food Chem. 2007, 55, 1308‐1314.
Zamora, R.; Hidalgo, F. J. Coordinate contribution of lipid oxidation and Maillard reaction to the nonenzymatic food browning. Crit. Rev. Food Sci. Nutr. 2005, 45, 49‐59.
Zamora, R.; Hidalgo, F. J. Contribution of lipid oxidation products to acrylamide formation in model systems. J. Agric. Food Chem. 2008, 56, 6075‐6080.
Zeng, X. H.; Cheng, K. W.; Jiang, Y.; Lin, Z. X.; Shi, J. J.; Ou, S. Y.; Chen, F.; Wang, M. F. Inhibition of acrylamide formation by vitamins in model reactions and fried potato strips. Food Chem. 2009, 116, 34‐39.
Zeng, X. H.; Kong, R. P. W.; Cheng, K. W.; Du, Y. G.; Tang, Y. S.; Chu, I. K.; Lo, C.; Sze, K. H.; Chen, F.; Wang, M. F. Direct trapping of acrylamide as a key mechanism for niacin's inhibitory activity in carcinogenic acrylamide formation. Chem. Res. Toxicol. 2010, 23, 802‐807.
Zhang, X.; Cao, J.; Jiang, L.; Geng, Ch.; Zhong, L. Protective effect of hydroxytyrosol against acrylamide‐induced cytotoxicity and DNA damage in HepG2 cells. Mutat. Res. 2009, 664, 64‐68.
Zhang, X. M.; Chan, C. C.; Stamp, D.; Minkin, S.; Archer, M. C.; Bruce, W. R. Initiation and promotion of colonic aberrant crypt foci in rats by 5‐hydroxymethyl‐2‐furaldehyde in thermolyzed sucrose. Carcinog. 1993, 14, 773‐775.
Zhang, Y.; Ren, Y.; Zhao, H.; Zhang, Y. Determination of acrylamide in Chinese traditional carbohydrate‐rich foods using gas chromatography with micro‐electron capture detector and isotope dilution liquid chromatography combined with electrospray ionization tandem mass spectrometry. Anal. Chem. Acta 2007, 584, 322‐332.
Zhang, Y.; Zhang, Y. Effect of natural antioxidants on kinetic behavior of acrylamide formation and elimination in low moisture asparagine‐glucose model system. J. Food Eng. 2008, 85, 105‐115.
Zhang, Y.; Zhang, Y. Formation and reduction of acrylamide in Maillard reaction: A review based on the current state of knowledge. Crit. Rev. Food Sci. Nutr. 2007, 47, 521‐542.
Zhaoyang, L. (2003). Process and apparatus for reducing residual level of acrylamide in heat processed food. US Patent 20030219518‐A1.
Zhu, Y.; Li, G.; Duan, Y.; Chen, S.; Zhang, C.; Li, Y. Application of the standard addition method for the determination of acrylamide in heat‐processed starchy foods by gas chromatography with electron capture detector. Food Chem. 2008, 109, 899‐908.
Zyzak, D. V.; Sanders, R. A.; Stojanovic, M.; Tallmadge, D. H.; Eberhart, B. L.; Ewald, D. K.; Gruber, D. C.; Morsch, T. R.; Strothers, M. A.; Rizzi, G. P.; Villagran, M. D. Acrylamide formation mechanism in heated foods. J. Agric. Food Chem. 2003, 51, 4782‐4787.


![DATAFLOW TESTING DONE BY A.PRIYA, 08CSEE17, II- M.s.c [C.S]](https://img.pdfslide.us/doc/110x75/551b48385503465c7e8b5559/dataflow-testing-done-by-apriya-08csee17-ii-msc-cs.jpg)


![DATAFLOW TESTING DONE BY A.PRIYA, 08CSEE17, II- M.s.c [C.S]](https://img.pdfslide.us/doc/110x75/5681566a550346895dc41bb4/dataflow-testing-done-by-apriya-08csee17-ii-msc-cs-56ef51455d61f.jpg)