Embed Size (px)
Citation preview

DI
SC
US
SI
ON
P
AP
ER
S
ER
IE
S
Forschungsinstitut zur Zukunft der ArbeitInstitute for the Study of Labor
Re-Orient? MNC Penetration and Contemporary Shifts in the Global Political Economy
IZA DP No. 4393
September 2009
Arno TauschAlmas Heshmati
Re-Orient?
MNC Penetration and Contemporary Shifts in the Global Political Economy
Arno Tausch Innsbruck University
Almas Heshmati Seoul National University
and IZA
Discussion Paper No. 4393 September 2009
IZA
P.O. Box 7240 53072 Bonn
Germany
Phone: +49-228-3894-0 Fax: +49-228-3894-180
E-mail: [email protected]
Any opinions expressed here are those of the author(s) and not those of IZA. Research published in this series may include views on policy, but the institute itself takes no institutional policy positions. The Institute for the Study of Labor (IZA) in Bonn is a local and virtual international research center and a place of communication between science, politics and business. IZA is an independent nonprofit organization supported by Deutsche Post Foundation. The center is associated with the University of Bonn and offers a stimulating research environment through its international network, workshops and conferences, data service, project support, research visits and doctoral program. IZA engages in (i) original and internationally competitive research in all fields of labor economics, (ii) development of policy concepts, and (iii) dissemination of research results and concepts to the interested public. IZA Discussion Papers often represent preliminary work and are circulated to encourage discussion. Citation of such a paper should account for its provisional character. A revised version may be available directly from the author.

IZA Discussion Paper No. 4393 September 2009
ABSTRACT
Re-Orient? MNC Penetration and Contemporary Shifts in the Global Political Economy*
This article analyses IMF estimates of economic growth in 180 countries (IMF, 2009), and inks the results to the “Re-orient” approach, put forward by Frank, 1998. With global economic gravitation shifting to the Indian Ocean/Pacific region, the article also analyses the role of MNC (foreign capital) penetration as the key variable of past quantitative dependency studies for contemporary economic growth and social performance. In a Schumpeterian fashion, MNC penetration reflects the power, which transnational oligopolies wield over local economies. Today, social polarization and stagnation increase as a consequence of the development model, based on high MNC penetration. JEL Classification: F50, O10 Keywords: international relations and international political economy,
economic development, technological change, growth Corresponding author: Almas Heshmati TEMEP #37-306-1, College of Engineering Seoul National University San 56-1, Shilim-dong, Kwanak-Gu Seoul, 151-742 South Korea E-mail: [email protected]
* Opinions expressed in this contribution are exclusively those of the authors in their academic capacities. The authors would like to thank to Professor Victor Krasilshchikov from the IMEMO Institute in Moscow, Russia, for his long and insightful comments on an earlier draft of this paper.
2
1. Introduction
“Re-Orient” (Frank, 1998) might be the catchword for the analysis of the world order, currently emerging from the profoundest economic crisis the world has seen since the Great Depression, which started in 1929. The current economic and social crisis is a temptation for social scientists to reconsider well-established assumptions of the discipline. The depth of the crisis, especially in the Northern-Euro-Atlantic region of our globe, and the apparent shift in the center of gravitation of the world economy away from the Atlantic towards the Indian and the Pacific Ocean will renew not only the interest in the later work of Frank, 1998, but also in the center-periphery models in the tradition of Prebisch, 1950, 1983, 1988, and dependency theories in the tradition of such authors as Cardoso, 1977, 1979, Cardoso/Faletto, 1971, Furtado, 1963, 1964, 1976, 1983, Sunkel, 1966, 1973, 1978, and in the quantitative research inspired by these theories, namely by Galtung, 1971, Sunkel, 1973 and later Chase-Dunn, 1975, Bornschier/Chase-Dunn/Rubinson, 1978 and Bornschier/Ballmer-Cao, 1979. All these theorists claimed that relations of dependency block long-run economic growth and bring about a socially unbalanced development, short spurts of economic growth notwithstanding. Is dependency theory now put on its head, and is the former periphery and semi-periphery rushing ahead, while the center is stagnating?
This study aims at investigating these fundamental issues. To start with, we look at the most recent IMF estimates and projections of economic growth. The world economy, to be sure, is confronting one of the biggest geographical shifts in its dynamics, resembling indeed the predictions of the “Asian age”, forwarded by Frank, 1998. Frank was, as it is well known, originally co-formulating the basic convictions of the dependency/globalization critical school (Frank, 1967). He later in his work decidedly believed that the centers of gravitation of the world economy will forever shift back again to the Asia/Pacific regions, which, according to him were always the world economic centers until around 1750.
The master variable in this study is MNC penetration. It is measuring the share of the value of cumulated foreign direct investments by transnational corporations in the gross domestic product of the host country, and is thus reflecting the power, which transnational oligopolies wield over local economies (UNCTAD, World Investment Report, 2009). The present study is the first in the literature, linking MNC penetration in the mid 1990s and its growth until 2005 with social and economic development in our contemporary period and the current world economic crisis.
Our approach is Schumpeterian in character. Schumpeter, 1908, 1912, 1939, 1950 strongly believed that capitalist development takes the form of “creative destruction”; and that innovation by entrepreneurs/companies is the force that sustains long-term economic growth, even as it destroys the value of established companies that enjoyed some degree of monopoly power. The monopolistic power, wielded by transnational corporations over their host countries, is also a measure of the temporary market power of the waning market leaders, facing new inventions, championed by the global emerging competitors of the old centers in the North Atlantic arena, especially in China and India.
The rest of this study is organized as follows. In Section 2 we shortly outline the main theories under scrutiny here, namely Schumpeterian economic development theory; the five monopolies of the international system according to Amin, 1997; world system

3
analysis in the tradition of Polanyi, 1957; Arrighi, 1995 and Wallerstein, 2000; the analysis by Frank, 1998; the dependency model, formulated by Cardoso, 1979; and the analysis of transnational capitalism and national disintegration according to Sunkel, 1973. MNC dependency, reflecting the economic, social and political power of transnational oligopolistic corporations over their host countries as the key to analyzing contemporary changes is discussed in Section 3. The data, the development of the research design and the regression analyses are presented in Section 4. We report the empirical results in Section 5. A final section concludes this study.
2. The main theories under scrutiny here
The writings of Joseph Alois Schumpeter (Schumpeter, 1908, 1912, 1939), and later world system and dependency analyses by Amin, 1976, 1994, 1997; Bornschier, 1982; Cardoso, 1979, Cardoso/Faletto, 1971; Prebisch, 1950, 1983, and Sunkel, 2003, were always aware of the emergence of crises, cyclical imbalances, regional shifts and their possible causes and consequences, as well as of the rise and decline of entire regions and even continents in the process of capitalist development. The world economy thus returns to the “old Galicia” of 1909, when and where the young Schumpeter started his job as a University Professor in Czernowitz (then a German-language university on the very eastern outer rim of the Austro-Hungarian Empire, now Chernivtsi University in Northern Bukovina, Ukraine), gaining valuable insights into the nature of world development in the Galician periphery of the Empire, with all the “creative destruction”, which surrounded him. Several of his major works, like “The Nature and Essence of Theoretical Economics” (1908, translated 2009) “The Theory of Economic Development: An inquiry into profits, capital, credit, interest and the business cycle” (1912, first translated 1934) were all heavily influenced by his early and short experience at the outer rim (1909-1911) of the Empire.
As it is well-known, according to Schumpeter, 1913, 1939 the entrepreneur is the prime mover of economic development, which is cyclic in character, connecting innovations, cycles, and development. Schumpeter strongly believed in the very long, 50-60 year economic cycles, the Kondratiev waves (for empirical studies on Kondratiev waves, see the posthumous editions of Kondratiev’s works in Kondratiev, 1980, 1984, 1998; for a general analysis Devezas, 2006; furthermore Bornschier, 1996; Goldstein, 1988; Tausch, 2007, 2008; for a skeptical view also Kuznets, 1940). Capitalist development takes the form of “creative destruction” (Schumpeter, 1950). Innovation by entrepreneurs/companies is the force that sustains long-term economic growth, even as it destroys the value of established companies that enjoyed some degree of monopoly power. Successful innovation is a source of temporary market power, eroding the profits and position of old firms, yet ultimately losing to the pressure of the new inventions, championed by the competitors (for a formal model of Schumpeterian growth economics, see Aghion/Howitt, 1992).
Like many other development theories of the first generation of development economists after the Second World War, whose stars began to rise long after Schumpeter already went to America, Mandelbaum, 1945; Rosenstein-Rodan, 1964; Rothschild, 1944, and Singer, 1975; Singer and Ansari, 1988; Singer and Roy, 1993 all shared with Schumpeter the observation that capitalism never was a smooth equilibrium process. Mandelbaum, Rosenstein-Rodan and Singer, and the early

4
dependency theorists in Latin America, whom they so heavily influenced, were deeply convinced that capitalism is NOT crisis-free growth, full employment, environmental sustainability and the end to social exclusion.
The international system, more and more, seems to resemble such a perpetual rise and fall of companies, regions, sectors, even nations. Several world systems approaches have taken up the basic idea of the Schumpeterian competition and stipulated that even the international system itself since the 1450s is characterized by hegemonies, international system de-concentration, the de-legitimation of the international order, and recurrent global wars over the hegemony in the system (see Devezas, 2006; furthermore Arrighi, 1995; Goldstein, 1988; Tausch, 2007; Wallerstein, 2000). That currently economic growth dramatically shifts away from the North Atlantic arena and the states very closely linked to them to other regions of the world economy seems to indicate that such a major fundamental shift is taking place with the force of a real tsunami. Everywhere, the monopolies of power, which the old dominant transnational oligopolies wield, are eroding.
Enlightening, as critical political economy might be in times of global crises, there are also some profound contradictions of the ongoing shifts in the global political economy with some of what seems today the all too narrowly and stable, geographically defined foundations of “dependency” and “world systems research”. Let us recall here that for dependency and later world systems theory, going back to the writings of its four “founding fathers” Amin, 1994; Arrighi, 1995; Frank, 1967; and Wallerstein, 2000, ascent and decline in world society is largely being determined by what Amin, 1977 called the following ‘five monopolies’ of the international system:
the monopoly of technology, supported by military expenditures of the dominant nations
the monopoly of control over global finances and a strong position in the hierarchy of current account balances
the monopoly of access to natural resources
the monopoly over international communication and the media, and
the monopoly of the military means of mass destruction.
Did these monopolies erode before the current global crash? Is their erosion instrumental in the current downfall of the North Atlantic Economy and its global allies? If we assume that the “five monopolies” were still in place in 2008, the hypothesis put forward by Amin of course does not explain us, when, how and why the global order is changing so rapidly nowadays, to the detriment of the centers (=holders of the five monopolies in 2008) and to the benefit of the periphery and semi-periphery during the global recession of 2009 and 2010. Let us also recall here that dependency authors generally explained backwardness and stagnation by the ever-growing dependent insertion of the global, ex-colonial South into the world economy. Starting with the writings Prebisch, 1950 their leading spokespersons all would stress the unequal and socially imbalanced nature of development in these regions. Short-term spurts of growth notwithstanding, long-term growth in the countries of Africa, Asia and Latin America will be imbalanced and unequal, and will tend towards high negative current account balances.

5
Later world system analyses – that started with the writings of the Austro-Hungarian socialist Karl Polanyi (Polanyi, 1957) after the First World War – also tended to confirm and expand this dependency argument (Wallerstein, 2000). Capitalism in the periphery, like in the centers, is characterized by strong cyclical fluctuations, and there are centers, semi-peripheries and peripheries. The rise of one group of semi-peripheries tends to be at the cost of another group, but the unequal structure of the world economy based on unequal transfer tends to remain stable.
Frank decidedly put this eternal division of the world into centers and peripheries into fundamental question by maintaining in his re-analysis of global economic history, 1998, that the centers’ fine hour of truth has come and that the centers will be dethroned by the new Asian/Pacific center of gravity of the world economy.
Cardoso once, at the height of the debate, summarized the quantifiable essence of dependency theories as follows:
there is a financial and technological penetration by the developed capitalist centers of the countries of the periphery and semi-periphery
this produces an unbalanced economic structure both within the peripheral societies and between them and the centers
this leads to limitations on self-sustained growth in the periphery
this favors the appearance of specific patterns of class relations, and
these require modifications in the role of the state to guarantee both the functioning of the economy and the political articulation of a society, which contains, within itself, foci of inarticulateness and structural imbalance (Cardoso, 1979).
The Chilean social scientist Osvaldo Sunkel, whose work is closely connected with the United Nations Economic Commission for Latin America (CEPAL/ECLA) was more cautious than most other dependency and world systems researchers by proposing in his ’Transnational capitalism and national disintegration (in Latin America)’ (1973) - the thought that transnational investment and integration might go hand in hand, under certain conditions, with an increasing global relative social polarization between rich and poor in the host countries of the evolving transnational system. In his 1973 essay he said:
‘The advancement of modernization introduces, so to speak, a wedge along the area dividing the integrated from the segregated segments (...) In this process, some national entrepreneurs are incorporated as executives into the new enterprises or those absorbed by the TRANCO (i.e. transnational corporations), and others are marginalized; some professionals, forming part of the technical staff and the segment of employees are incorporated, and the rest are marginalized; part of the qualified labor supply and those that are considered fit to be upgraded are incorporated, while the remainder are marginalized. (…)Finally, it is very probable that an international mobility will correspond to the internal mobility, particularly between the internationalized sectors (...) The process of social disintegration which has been outlined here probably also affects the social institutions which provide the bases of the different social groups and through which they express themselves. Similar tendencies to the ones described for the global society are, therefore, probably also to be found

6
within the state, church, armed forces, political parties with a relatively wide popular base, the universities etc.’ (Sunkel, 1973: 18-42).
The world map of the estimates of economic growth in 2009 and 2010, which seem to confirm the fundamental shifts in world economic centers of gravity, and which underline the necessity to reflect some of the basic assumptions of the development theory discipline are shown in Map 1.A and Map 1.B.
Insert Map 1.A on economic growth 2009 about here
Insert Map 1.B on economic growth 2010 about here
3. MNC dependency as the key to analyzing contemporary changes
MNC penetration measures the different shares of GDP, which foreign capital investments have in the host countries, i.e. the UNCTAD percentages of the stocks of multinational corporation investments per total host country GDP. This research tradition has been especially developed by the Swiss sociologist Volker Bornschier and his school (Bornschier, 1976, 1980, 1981, 1982, 1983, 2002, Bornschier/Ballmer-Cao, 1979, Bornschier/Chase-Dunn, 1985; Bornschier/Chase-Dunn/Rubinson, 1978). MNC penetration captures the power, which international oligopolies wield in the different countries of the world system, and it also measures dependency theory as expressed in Sunkel, 1973 and Cardoso, 1979.
There were dozens of attempts to quantitatively study this very simple and basic logic of dependency, which also can be linked to the formal economic models developed by the Polish political economist Michal Kalecki, many of them originally published already in the 1930s, 1940s and 1950s (Kalecki, 1972, 1979, furthermore Rothschild, 1954, 1957, 1958, 1959, 1964, 1965), stressing the linkage between monopoly power, the conditions of dependency (measured by Kalecki by raw material prices), and income distribution (measured by Kalecki by the wage share). A scientometric analysis of the vast empirical dependency-oriented research literature in the major international social science journals reveals that as of July 4th, 2009, 328 major international studies quoted the path-breaking empirical dependency analysis by Galtung, 1971, which links dependency measured by trade partner concentration and the concentration of export products to the inequality of income distribution. Further 74 major international studies were based on the Sunkel essay, 1973, which is more directly linked to the concept of MNC penetration than the Galtung essay, 1971. Galtung, 1971 and Sunkel, 1973, in turn must be regarded as the catalyst essays for the two follow-up pioneering quantitative dependency studies, authored by Chase Dunn, 1975 [which had in turn 213 follow-up studies], and Rubinson, 1976 [which yielded 170 follow-up studies in the major social science journals of the world to date]. Bornschier/Chase-Dunn/Rubinson, based on Chase-Dunn, 1975, and Rubinson, 1978, later became the most important study in the field, systematizing research based on the concept of MNC penetration. This essay initiated 185 follow-up studies, while Bornschier/Ballmer-Cao, devoted to the issue of economic inequality as a consequence of MNC penetration, originated 74 follow-up studies2. Later tests of the Bornschier hypotheses could nothing but support
2 ISI Web of Knowledge, Thomson Reuters, as of August 20, 2009

7
and refine the original argument, independently of the research design, for different indicators and different time periods and different samples and different methods (see inter alia Beer, 1999; Bornschier, 1982, 2002; Dutt, 1997; Heshmati, 2006b; Kentor, 1998; Klitgaard R. and Fedderke J., 1995; Tausch, 2003; Tausch and Prager, 1993; Tsai 1995, just to mention a few samples from this vast literature).
It is important to emphasize here that MNC penetration must not be confounded with the Kearney-Index oriented research results on globalization; for MNC penetration measures the oligopolistic control of transnational corporations over local markets, while the Kearney index has much to do with openness, connectivity, and also infrastructure (see Kearney A. T. 2002; 2003; furthermore Addison/Heshmati, 2004; Heshmati, 2006a, 2007). The Kearney Index combines the dimension of foreign direct investment with government transfers; Gross Domestic Product; international organization membership; international travel; internet hosts; internet users; peacekeeping missions; population; remittances and personal transfers; secure Internet servers; telephone traffic; trade; and treaties. Not surprisingly, in 2007 the ten most globalized countries according to the Kearney methodology were Singapore, Hong Kong, the Netherlands, Switzerland, and Ireland, followed by Denmark, the United States, Canada, Jordan and Estonia.3 The typical peripheries and semi-peripheries of the world system are generally ranked very low on the Kearney index. The rank of the countries differ somewhat when a parametric approach is used where, unlike in the Kearney index, different weights are attached to different globalization index components (for details see Heshmati, 2006a).
By and large, our present research results build on the original dependency theory arguments, reported in Bornschier/Chase-Dunn/Rubinson, 1978, and Bornschier/Ballmer-Cao, which both were based on analyses of the then “B-phase” in the waning Kondratiev cycle from 1960 to the mid 1970s, now being applied as well for the current period in the world economy. Our period (i.e. 2009 and 2010) is well comparable to the depression of the late 1970s and early 1980s. The fact that some later research results on MNC penetration, reported in the literature of the 1980s and 1990s, do not exactly correspond to other research results, must be qualified in the light of the following phenomena:
The time frame of the study in the 50-to 60 year long wave economic Kondratiev cycle and in the 18/22 year Kuznets cycles in the world economy since the oil crisis of 1973, with its very strong fluctuations
Differences of methods used and periods studied
The sample composition of the study by location and level of development of countries, and
The influence of other predictors, like development level, urbanization rate etc.
Arguments in the literature, which stress that cycle space and time play an important role in the logic of development, can be already found, among alia, in Bobróvnikov, 2004, and Bornschier, 1996. Cycle time requires certain conditions to be fulfilled to be
3 http://www.atkearney.com/index.php/News-media/hong-kong-jordan-and-estonia-debut-among-the-top-10-in-expanded-ranking-of-the-worlds-most-globalized-countries.htm

8
able to be responsive to a development wave and attraction of development forces. Our study is the first world-system-wide study in the literature, linking MNC penetration in the mid 1990s and its growth until 2005 with social and economic development in the contemporary world economic crisis.
Our geographical presentation of contemporary MNC penetration, based on UNCTAD World Investment Report data, will be kept to a minimum. In general terms, we observe today high levels of MNC penetration = high power concentration in the hands of the transnational corporations over the economies of their host countries in Western Europe, in some parts of Eastern Europe, in many parts of Latin America, Africa, and in Southeast Asia. MNC penetration is reported in Map 2.A and Map 2.B.
Insert Map 2.A on MNC penetration 2006 about here
Insert Map 2.B on MNC regional penetration about here
While different authors disagree on the direction of the influence of MNC penetration on the human condition, most would underline the strong influence of MNC penetration on control of the natural resources, assets distribution and ownership, as well as employment, economic growth, income inequality and income distribution, technology, management and skill transfer and the overall development of nations.
4. Data and research design
The design of our study is based on usual, statistical package SPSS-XV ordinary least square (OLS) standard regressions of the “kitchen sink type” (Durlauf et al., 2008) of economic growth and economic and social performance in the research tradition of Barro, 2003. The SPSS-OLS standard regressions specify a critical inclusion criterion of PIN = 5% error probability and POUT = 10% error probability.
In keeping with the research tradition, initiated by Seers/Öström, 1983; Seers, 1981; Seers/Schaffer/Kiljunen, 1979; and Seers/Vaitsos/Kiljunen, 1980 about “underdeveloped Europe” we however believe that it is impossible to separate the effects of MNC penetration on the “center” and on the “periphery”, because center/periphery problems nowadays characterize the entire world economy and because the (former) centers, more and more, exhibit characteristics of semi-peripheries.
4.1 The data
The source of data used in this study is secondary databases of the United Nations organizations databases and foremost those managed by the IMF, UNCTAD, UNDP, UN Statistics and the USA-CIA. It contains all major countries with available socio-economic data on growth and its determinants. The choice of a country to be included in the final analysis (originally 183 countries4) coincides with the availability of data from our standard sources for socio-economic comparative growth and development
4 For a list of the sample countries see Appendix Table 1.
9
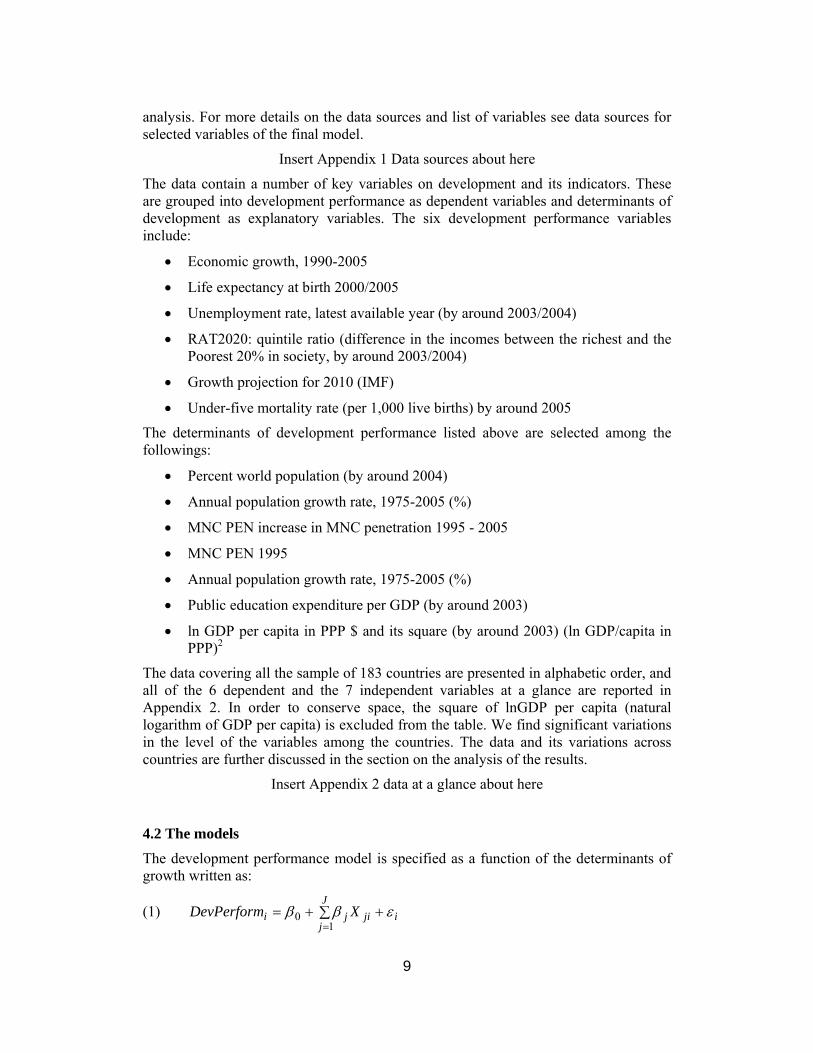
analysis. For more details on the data sources and list of variables see data sources for selected variables of the final model.
Insert Appendix 1 Data sources about here
The data contain a number of key variables on development and its indicators. These are grouped into development performance as dependent variables and determinants of development as explanatory variables. The six development performance variables include:
Economic growth, 1990-2005
Life expectancy at birth 2000/2005
Unemployment rate, latest available year (by around 2003/2004)
RAT2020: quintile ratio (difference in the incomes between the richest and the Poorest 20% in society, by around 2003/2004)
Growth projection for 2010 (IMF)
Under-five mortality rate (per 1,000 live births) by around 2005
The determinants of development performance listed above are selected among the followings:
Percent world population (by around 2004)
Annual population growth rate, 1975-2005 (%)
MNC PEN increase in MNC penetration 1995 - 2005
MNC PEN 1995
Annual population growth rate, 1975-2005 (%)
Public education expenditure per GDP (by around 2003)
ln GDP per capita in PPP $ and its square (by around 2003) (ln GDP/capita in PPP)2
The data covering all the sample of 183 countries are presented in alphabetic order, and all of the 6 dependent and the 7 independent variables at a glance are reported in Appendix 2. In order to conserve space, the square of lnGDP per capita (natural logarithm of GDP per capita) is excluded from the table. We find significant variations in the level of the variables among the countries. The data and its variations across countries are further discussed in the section on the analysis of the results.
Insert Appendix 2 data at a glance about here
4.2 The models
The development performance model is specified as a function of the determinants of growth written as:
(1)
J
jijiji XDevPerform
10

10
where DevPerform represents each of the six development performance variables listed above for country i and X is J vector of determinants of development performance listed above, some of which are logarithmic, while others expressed in level or percentages. The j and0 are unknown parameters to be estimated to infer about the
association and impact of the determinant of the development indicator. The is a random error term assumed to have a mean zero and constant variance. It captures the measurement error in the dependent variable and the effects of left out explanatory variables.
Due to the possible problems of multicollinearity between the explanatory variables and its effects in form of confounded effects of determinants and the difficulties in separation of the effects we used a univariate analysis instead of a multivariate regression analysis (equation 1) where the model is written as:
(2) ijiji XDevPerform 0
where each of the components is defined previously.
5. Analysis of the results
The final models are based on multivariate regression analysis estimating the effects of the determinants of growth simultaneously and conditional on other determinants. In multivariate regression analysis, multicollinearity can be a serious problem.
5.1 The estimation results
In order to isolate individual factors effects of economic growth (measured as GDP per capita) we also utilize the univariate approach as well. It helps to identify the significant predictors of the dependent variables. Here the set of dependent and independent variables are the same as those presented previously. The independent variables are classified both as dimensions and their corresponding variable labels. The unconditional beta weights and error probabilities are reported in Table 1.
Insert Table 1 on univariate analysis about here
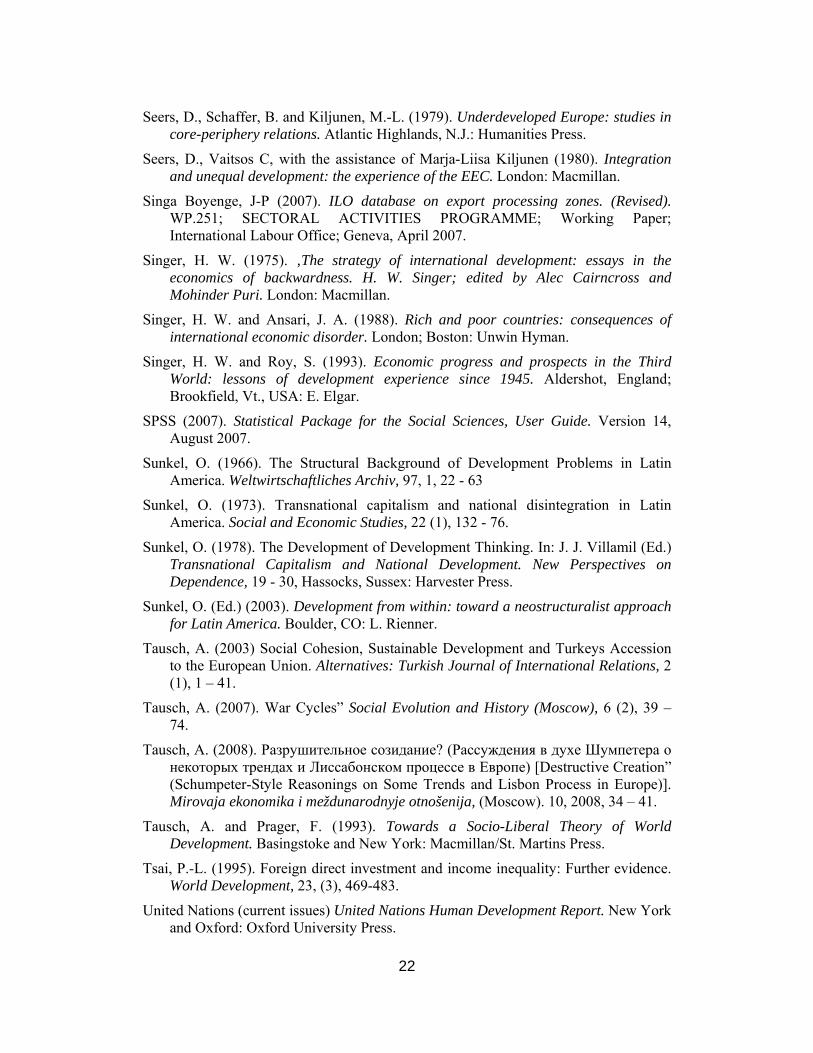
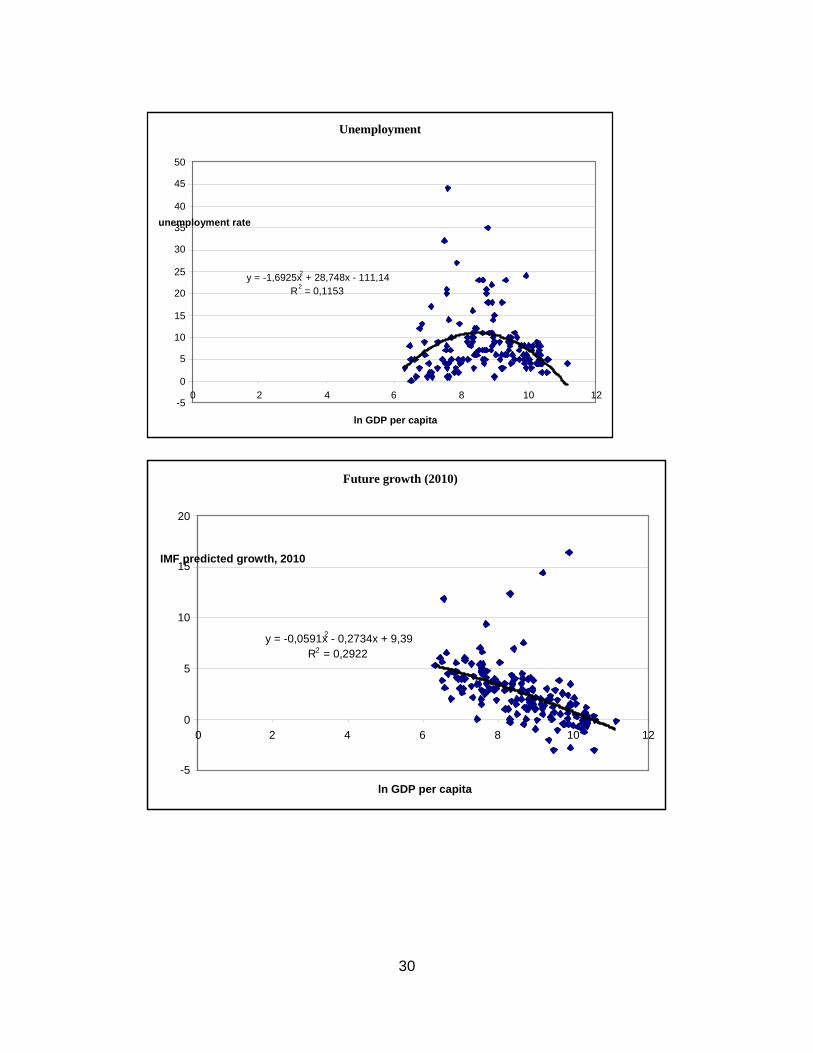
The results show, with the exception of few cases that the relationships between each pair of variables are statistically highly significant. In addition to the indication of significant relationships, the nature of a positive or negative relationship and its strength is also indicated. The relationship between our six development performance variables and the logarithm of GDP per capita and its square as explanatory variables are presented in Graphs 1.A-1.F. This is to capture the non-linearity in their relationships.
Insert Graph 1.A-F on non-linear relationships about here
GDP per capita and IMF predicted growth 2010 are negatively and linearly related, suggesting that the prediction is based on a simple linear relationship. A minor non-linear and positive relationship is observed between GDP per capita and economic growth 1990-2005 and life expectancy and a negative relationship between GDP per capita and inequality was found. GDP per capita is highly nonlinearly related to the under-five mortality rate and the unemployment rate. The former is U-shaped, while

11
the second has an inverted U-shaped relationship. The fit of the models measured as R2 is in the interval between 0.053 and 0.653, suggesting a good fit and a large share of the total variations in the development performance variable being explained by GDP per capita and its square.
The results from the 42 SPSS-XV standard OLS regression coefficients, their standardized errors, beta-weights, t-values and error probabilities to measure the effects of the 7 predictor variables on the 6 dependent variables are presented in Table 2. The table is divided into 6 different panels each, for each development performance variable. The models fits measured by adjusted R2 and degrees of freedom are reported at the end of each panel. The adjusted R2 is in the interval between 0.193 and 0.663, i.e. 19.3% and 66.3%, indicating the share of the total variation in the dependent variable explained by the set of explanatory variables. A joint F-test for the significance of the slope parameters is also reported, suggesting that the null hypothesis of zero effects is being rejected in favor of the alternative hypothesis, representing the appropriateness of the current specification of the model.
Insert Table 2 on the OLS estimation results about here
5.2 Interpretation of the quantitative results
Let us first look more precisely at the quantitative results. First we turn to economic growth 1990-2005. Without the effects of the predictor variables, the 138 countries with complete data under investigation here would be in a severe recession (almost -12%, but the effect is not significant); and significant effects on the growth rate, at a 5% significance level, are being wielded by the share of the country in world population (beta +0.200), MNC Penetration (beta +0.347) and public education expenditures (beta -0.275). Our equation explains 24.3% of economic growth 1990 to 2005. The effects, which are significant at the 10% level, include the negative effects of population growth and increases of MNC penetration over time.
Our next equation explains the income difference between the richest 20% and the poorest 20% of the population. Without the influence of the predictor variables, inequality would be -172; this effect is statistically highly significant. Our equation for the 114 countries with complete data explains 26.4% of total variance. Apart from the well-known effect of rising income inequality at middle levels of development and declining inequality thereafter, associated in the literature with Kuznets, 1955 and 1984, we observe significant effects of rising inequality, caused by population growth, MNC penetration, and public education expenditures, and the mitigating effects of rising MNC penetration over time, possibly due to the short-term employment effects of MNC capital inflows. It must be noted however that DYN MNC PEN does not have a significant effect on official unemployment rates (see below), which suggests the possibility that the inequality mitigating short term effects of fresh MNC inflows are mainly caused by changes in the pay structure of the industrially employed, official labor force.
The following equation – which explains 62.4% of total variance for the 141 countries with complete data – is featuring the determination of life expectancy. Apart from the well-known “plateau curve of basic human needs” (Goldstein, 1985), caused by ln GDP per capita and its square, we are confronted with the following negative effects,

12
which are all significant at the 10% level: population growth, MNC penetration, and public education expenditure. Without the influence of our predictors, life expectancy would be -43 years, but this effect is not significant.
Our analysis for unemployment rates with 127 countries with comparable and complete data suggests that 19.3% of the total variance of the unemployment rate in the different countries of our globe can be significantly explained by the unemployment increasing effects of public education expenditures, the modernization process (ln GDP per capita), and the unemployment mitigating effects of “modernity” (ln GDP per capita^2). Also, there is an unemployment increasing effect, which is significant at the 10% level, wielded by MNC penetration. Without the effects of our predictors, unemployment would be -109%; this effect is significant.
Our analysis of the determinants of predicted economic growth in the year 2010, which was calculated for 140 countries, and explains 40% of the total variance of the variable, reflects the enormous weight, which demographic dynamics will play in the future of the world economy. Both the big markets with very huge populations (beta +0.187), as well as countries with a high population growth rate (beta +0.460) will benefit from high rates of economic growth in 2010. These variables are significant at the 5% level; in addition, MNC penetration negatively determines future economic growth (beta -0.132, error probability 6.5%). Without the effects of our predictors, predicted growth in 2010 would be negative (recession of -3.3%).
Our last analysis deals with under-five mortality rates. It was calculated with the complete, comparable data from 141 countries. Without the effects of the predictor variables, under-five mortality would be 1242, and this effect is significant. Again, the “plateau curve of basic human needs”, discovered by Goldstein, 1985, plays an important role, with ln GDP per capita and its square determining a good part of the entire variance of under-five mortality rates. The entire variance explained by our equation is 66.3%. The other significant negative effects wielded on the variable are being caused by population growth and MNC penetration.
5.3 The results linked to the theories
So, the development logic of different economic cycles seems to shift indeed from cycle to cycle, and the pre-crisis world of the “golden days” of the post-1989/90 boom seemed to correspond to a logic, where high foreign capital penetration seemed to guarantee a long-run, but socially unbalanced economic growth. Foreign capital inflows did not result in immediate spurts of growth, but were rather first of all destroying, in a Schumpeterian fashion, existing economic structures. After the end of Communism in Eastern Europe in 1989, this global model, which seemed to dominate the global economy before the crash of 2008/2009, and which combined relatively rising rates of inequality, material poverty (measured with deficient life expectancy rates and relatively high under five mortality rates) with rapid economic growth, reflected in a way the boom years after the military coup in Brazil in 1964. This was the model, in which East Central Europe was the main area of expansion of global capitalism. Krasilshchikov (2008) analyzed this logic with his comparison of post-Communist Russia with Brazil during the heyday of dependent development.
But the new world structure of the post-crisis years, which now seems to emerge from the ruins of the post 1975/82 long economic cycle, will in many ways even more

13
resemble the world, predicted by Bornschier at the time, because also projected economic growth during the global crisis is now negatively determined – with at least a 6.5% error probability – by past MNC penetration. Thus the earliest formulations of quantitative dependency, written in the late 1970s, gain absolutely in relevance nowadays again at the precise long economic cycle time, which we face, and which is similar to the mid 1970s.
So, the often-hailed beneficial effects of foreign capital penetration nowadays even less materialize than ever before. As correctly predicted by the vast majority of the MNC penetration quantitative dependency literature, social polarization dramatically increases by a development model, based on a very high foreign capital penetration. The significant negative development policy effects on the development performance in our present study are on equality, life expectancy, employment and the reduction of under-five mortality. Fresh inflows of foreign capital somewhat alleviated inequalities.
The demographic dimension of our results also has to be taken into account. We show that large markets with numerous inhabitants, both in the period of 1990-2005, as well as in 2010, are significantly and positively connected with growth performance. Annual population growth, however, is significantly contributing to the deficits in basic human needs satisfaction, inequality, and to stagnation in the past period of economic growth, 1990-2005. But with the current world economic shifts to the global Southeast, high population growth rates significantly and positively contribute to the future growth performance of a country in 2010.
Ever since the writings of Colemann (1965), education should also be mentioned among the determining variables of the development performance of a country. Education and human capital formation figure prominently in the "Human Development Reports" of the United Nations Development Programme as variables, which determine positively the development outcome. For the UNDP it has been self-evident over the last decade that gender empowerment and the re-direction of public expenditures away from national defense will positively contribute to a positive development outcome. However, neo-liberal thought correctly would caution against such premature conclusions. Weede, 2002, 2004 has shown that standard indicators of human capital endowment - like literacy, school enrollment ratios, or years of schooling - suffer from a number of defects. They are crude. Mostly, they refer to input rather than output measures of human capital formation. Occasionally, Weede believes, they produce implausible effects. They are not robustly significant determinants of growth. Weede replaced them by average intelligence. This variable consistently outperforms the other human capital indicators in spite of suffering from severe defects of its own. Public education expenditures in our model negatively affect economic growth (1990-2005), equality, life expectancy and employment. University reform and University privatization would be important political steps to achieve a more viable development.
Now let us move towards the dimension of development history. This often puzzling question can here be answered in the following sense. Modernization – i.e. rising income levels (ln GDP per capita) have the strong expected following positive effects on the development performance: basic human needs satisfaction (life expectancy and reduction of under-five mortality). However, modernization contributes to a significant increase in inequality and unemployment.

14
Economic maturity, or if you wish and prefer, modernity, i.e. ln GDP/capita2, is good for the following performances: equality, and employment. The contradictions of modernity are largely to be found in what Goldstein already called in 1985 the “plateau curve of basic human needs”, basically constraining life expectancy and infant mortality reduction at very high levels of development, mainly due to the environmental and psychological strains of modern, urban life.
5.4 Major issues to be raised
At this point, four major issues should be raised in the discussion of our results, achieved so far, and which might be interesting subjects for future research. Krasilshchikov, 2008 highlighted the fact that dependency not always blocks development. Krasilshchikov starts from the assumption that rapid economic growth in China can be seen as a kind of “associated-dependent development” in the sense of Cardoso/Faletto, 1971, because “China has found niches in the economies of the western countries where mass production of many ordinary goods is already non-advantageous for the capital of the core”5. The same applies, according to Krasilshchikov, to the take-off of the Asian "tigers" in the 1960s-80s. Their export expansion would have been impossible without the structural changes in the western economies. For Krasilshchikov, dependency theory in all its versions was elaborated in the conditions when the peripheral/semi-peripheral countries and the developed ones belonged to the “same, industrial, capitalist mega-stage of development”. Today, we see the rise of a post-industrial social formation in the most advanced countries. At the same time, China, Brazil, and other countries continue to follow an industrial path of development.
Another point, closely connected to the first, is the unfettered rise in the model of “export processing zones”, especially in China and Southeast Asia. The first major international study by Froebel/Heinrichs/Kreye, 1980 was followed, among others, by Ross, 2004; and Singa-Boyenge, 2007. Export Processing Zones (EPZ) – or „Free Production Zones“ today already account for some 80 percent of the merchandise exports of countries like China, Kenya, the Philippines, Malaysia, Mauritius, Mexico, Senegal, Tunisia, Vietnam. 3500 EPZs in 130 countries of the world now employ 66 Million people, among these 40 million employees in China. The tendency, correctly foreseen by Froebel/Heinrichs/Kreye, 1980 towards a total global re-location of world industries continues unabated. Future research could determine the quantitative weights, which different forms of dependency have in the determination of future, projected economic growth rates (% of the population working in export processing zones versus MNC penetration versus the Kearney globalization index versus % of the GDP constituted by MNC outward foreign direct investment et cetera.).
In the face of the very huge statistical influence, to be ascribed to the demographic variables, the third point concerns the influence of family and household patterns, generational cohorts, and value change. Already the classic Arab philosopher Ibn Khaldun (1332-1406) (Ibn Khaldoun, 2005), who must be regarded as one of the founders of global sociology, foresaw the tendency towards economic cycles, which he
5 Communication from Prof. Krasilshchikov to the authors, August 25, 2009

15
linked, quite in a modern fashion, to what contemporary sociology would call “value change” (Inglehart/Norris, 2003; Norris/Inglehart, 2004) or – in the case of Ibn Khaldoun – value decay. The rise and fall of a societal order (or macro-cycle?) is intrinsically linked to the rise and fall of generations of human people. For Khaldoun, the life cycle of a societal model is linked to the ups and downs of exactly four human generations i.e. 80 to 100 years – from the building-up of an order by the “founding fathers/mothers” (1945?), to the phase of societal maturity during the tenure of societal power by the second generation (1965/70?), the onset of decline during the tenure of the third generation (1985/2005?), and the final destruction and end during the fourth generation (2005/2030?). Contemporary quantitative Kondratiev cycle researchers, like Rennstich, 2007, stumbled onto the issue again, without duly taking into account the theoretical forerunner Ibn Khaldoun, and linking the four generation cycle to the Nobel-laureate winning four generation family sage “Buddenbrooks. The Decline of a family” by the German novelist Thomas Mann (Mann, 1924), and calling the four-generation cycle the Buddenbrooks cycle. According to the Buddenbrooks cycle thought the novel contains a dire and general message for societal systems and is a model of analysis, also to be applied to the contemporary, post-World-War II world order. Independently of Rennstich, Devezas/Corrodine, already in 2001 developed on the basis of long-range demographic and sociological data a mathematical model, also based on the four-generation “model”. Schumpeter, in his rather conservative and pessimistic interpretation, also touched upon this issue in his 1950 “Capitalism, Socialism and Democracy”, when he stated that capitalism will not disappear from the face of the earth by a socialist revolution, but by the gradual erosion of capitalist individual family values and the rise of a socialist-oriented intellectual elite and bureaucracy. Indeed, the decline of the demographic base of Western societies castigates the West in the emerging new global order with a vengeance. And at any rate, the demographic variables play an important part in our empirical explanation of future expected economic growth. The effect of annual population growth on the expected economic growth rate in 2010 is 5.8 greater than the standard error of the coefficient.
The fourth and last point to be touched upon here is the necessary switch in the international Huntington debate and contemporary Islam-bashing – away from Huntington, the Islam critic, 1996 perhaps towards the Huntington of 1968, the modernization pessimist. Prudent Arab banking, remindful of the Holy Quran prescriptions about interest, nowadays overtakes New York as the global financial center; and most Muslim countries – with a few exceptions – have become growth superstars in the ongoing crisis. The re-orientation of the world along the map proposed by Frank, 1998, also implies that the Indian Ocean – and with it the vast area of the world, deeply influenced by Islam and Muslim culture, becomes again the center of the world economy, as it always was until 1450.
6. Conclusions
By focusing on MNC penetration as the measure, reflecting the power, which transnational oligopolies wield over the local economies, we have tried to free dependency and world systems research from some neo-Marxist connotations, which might have surrounded that concept in the past and which perhaps were mainly

16
responsible for the fact that the concept so well entered the core-research agenda of global political science and sociology, but failed to influence the course of the debate in the major mainstream economics journals. By giving the concept a Schumpeterian interpretation, we are also free to understand the dramatic changes, currently taking place in the world economy.
We have shown in this article these enormous geographical shifts, which currently take place, and which make the predictions of the “Asian age”, forwarded by Frank, 1998 come true almost over night. After the end of Communism in Eastern Europe in 1989, the model which emerged on the ruins of the Berlin Wall and took shape on a global scale combined relatively rising rates of inequality, material poverty (measured with deficient life expectancy rates and relatively high under-five mortality rates) with rapid economic growth. But in a Schumpeterian creative-destructive fashion, the countries formerly under strong control of the oligopolies (especially East Central Europe) are now being severely castigated in turn, while economic growth is being transplanted to the new growth regions of the Eastern part of the Indian Ocean, China, Southeast Asia and the Arab new global financial centers. As Arrighi correctly predicted in 1995, all major cyclical terminal crises also and above all mean a geographical transfer of the global financial centers, constituted in the history of global capitalism by Genoa, Amsterdam, London, then New York, and now the Arab financial centers.
Because of the negative influence of both high MNC penetration and low demographic dynamics, our investigation is especially pessimistic for the new member countries of the European Union in East Central Europe. They combine all the ills of our investigation at once – a high rate of control of their economies by transnational capital, a low population growth rate, a shrinking and already small share of world population, and an education system, which was, unlike the coal mines and the shipyards, largely left in state hands and is based on a dwindling resource base. Whether democracy can survive under such strenuous conditions, is another matter, beyond the theme of this essay. For Western Europe, faced by the partial collapse of the fruits of reconstruction policy and the European Union enlargement in Eastern Europe, prospects are also very dark, due to the dual effects of low demographic dynamics and a high MNC penetration.
17
Literature
Addison, T. and Heshmati, A. (2004). The new global determinants of FDI to developing countries. Research in Banking and Finance, 4, 151-186.
Aghion, Ph. and Howitt, P. (1992). A Model of Growth Through Creative Destruction. Econometrica, 60 (2), 323-351.
Amin, S. (1976). Unequal Development: An Essay on the Social Formations of Peripheral Capitalism. New York: Monthly Review Press.
Amin, S. (1994). Re-reading the postwar period: an intellectual itinerary. Translated by Michael Wolfers. New York: Monthly Review Press.
Amin, S. (1997). Die Zukunft des Weltsystems. Herausforderungen der Globalisierung. Herausgegeben und aus dem Franzoesischen uebersetzt von Joachim Wilke. Hamburg: VSA.
Arrighi, G. (1995). The Long 20th Century. Money, Power, and the Origins of Our Times. London, New York: Verso.
Barro, R. J. (2003). Economic Growth in a Cross Section of Countries. International Library of Critical Writings in Economics, 159 (1), 350-386.
Beer, L. (1999). Income Inequality and Transnational Corporate Penetration. Journal of World Systems Research, 5 (1), 1 – 25.
Bobróvnikov, A. V. (2004). Makrocikly v ekonomike stran Latinskoj Ameriki. [Macorcycles in the economies of Latin American countries]. Moskva: Inst. Latinskoj Ameriki.
Bornschier, V. (1976). ‚Wachstum, Konzentration und Multinationalisierung von Industrieunternehmen. Frauenfeld; Stuttgart: Huber.
Bornschier, V. (1980). Multinational Corporations, Economic Policy and National Development in the World System. International Social Science Journal, 32 (1), 158-172.
Bornschier, V. (1980). Multinationale Konzerne, Wirtschaftspolitik und nationale Entwicklung im Weltsystem. Mit Beiträgen von Thanh-Huyen Ballmer-Cao [et al.]. Frankfurt/Main; New York: Campus.
Bornschier, V. (1981). Dependent Industrialization in the World Economy: Some Comments and Results concerning a Recent Debate. The Journal of Conflict Resolution, 25 (3), 371-400.
Bornschier, V. (1982). The World Economy in the World System. Structure Dependence and Change. International Social Science Journal, 34 (1), 38-59.
Bornschier, V. (1983). World economy, level development and income distribution: An integration of different approaches to the explanation of income inequality. World Development, 11 (1), 11-20.
Bornschier, V. (1996). Western society in transition. New Brunswick, N.J.: Transaction Publishers.

18
Bornschier, V. (2002). Changing Income Inequality in the Second Half of the 20th Century: Preliminary Findings and Propositions For Explanations” Journal of World-Systems Research, available at: http://jwsr.ucr.edu/index.phpVIII, 1, Winter: 100 – 127.
Bornschier, V. and Ballmer-Cao, T. H. (1979). Income Inequality: A Cross-National Study of the Relationships Between MNC-Penetration, Dimensions of the Power Structure and Income Distribution. American Sociological Review, 44 (3), 438-506.
Bornschier, V. and Chase-Dunn, Ch. K (1985). Transnational Corporations and Underdevelopment N.Y., N.Y.: Praeger.
Bornschier, V., Chase-Dunn, Ch. K., Rubinson, R (1978). Cross-National Evidence of the Effects of Foreign Investment and Aid on Economic Growth and Inequality: A Survey of Findings and a Reanalysis. American Journal of Sociology, 84 (3), 651-683.
Cardoso, F. H. (1977). El Consumo de la Teoría de la Dependencia en los Estados Unidos El Trimestre Economico, 173, 44, 1, 33 - 52.
Cardoso, F. H. (1979). Development under Fire. Mexico D.F.: Instituto Latinoamericano de Estudios Transnacionales, DEE/D/24 i, Mayo (Mexico 20 D.F., Apartado 85 - 025).
Cardoso, F. H. and Faletto, E. (1971). Dependencia y desarrollo en América Latina. Mexico D.F.: Editorial Siglo XXI.
Chase-Dunn, Ch. K. (1975). The Effects of International Economic Dependence on Development and Inequality: a Cross- national Study. American Sociological Review, 40 (4), 720 - 738.
Coleman, J. S. (1965). Education and Political Development. Princeton: Princeton University Press.
Devezas, T. C. (Ed.) (2006). Kondratieff waves, warfare and world security: [proceedings of the NATO Advanced Research Workshop on The Influence of Chance Events and Socioeconomic Long Waves in the New Arena of Asymmetric Warfare, Covilhã, Portugal, 14 - 18 February 2005]. Amsterdam: IOS Press.
Devezas, T. C. and Corredine, J.T. (2001). The biological determinants of long-wave behavior in socioeconomic growth and development. Technological Forecasting and Social Change, 68, (1), 1-57.
Durlauf, St. N., Kourtellos, A., Tan, Ch. M. (2008). Are any Growth Theories Robust? The Economic Journal, 118 (1), 329–346.
Dutt, A. K. (1997). The pattern of direct foreign investment and economic growth. World Development, 25 (11), 1925-1936.
Frank, A. G. (1967). Capitalism and underdevelopment in Latin America: historical studies of Chile and Brazil. New York: Monthly Review Press.
Frank, A. G. (1998). ReOrient: Global Economy in the Asian Age. Ewing, USA: University of California Press.

19
Froebel, F. (1980). The new international division of labour: structural unemployment in industrialised countries and industrialisation in developing countries. Cambridge; New York: Cambridge University Press; Paris: Editions de la Maison des Sciences de l’Homme, 1980.
Furtado, C. (1963). The economic growth of Brazil: a survey from colonial to modern times. Translated by Ricardo W. de Aguiar and Eric Charles Drysdale. Berkeley: University of California Press.
Furtado, C. (1964). Development and underdevelopment. Trans. by R.W. de Aguiar and E. C. Drysdale. Berkeley: California University Press.
Furtado, C. (1976). Economic development of Latin America: historical background and contemporary problems. Translated by Suzette Macedo. Cambridge; New York: Cambridge University Press.
Furtado, C. (1983). Accumulation and development: the logic of industrial civilization. Translated by Suzette Macedo. Oxford: M. Robertson.
Galtung, J. (1971). A Structural Theory of Imperialism. Journal of Peace Research, 8 (2), 81 - 117.
Goldstein, J. S. (1985). Basic Human Needs: The Plateau Curve. World Development, 13 (5), 595 - 609.
Goldstein, J. S. (1988). Long Cycles: Prosperity and War in the Modern Age New Haven: Yale University Press.
Heshmati, A. (2006a). Measurement of a Multidimensional Index of Globalization. Global Economy Journal, 6 (2), Paper 1.
Heshmati, A. (2006b). The World Distribution of Income and Income Inequality: A Review of the Economic Literature”, Journal of World Systems Research, 12 (1), 61-107.
Heshmati, A. (2007). Global Trends in Income Inequality. Hauppauge, New York: Nova Science Publishers.
Huntington, S. P. (1968). Political order in changing societies. New Haven: Yale University Press.
Huntington, S. P. (1996). The clash of civilizations and the remaking of world order. New York: Simon & Schuster.
Ibn Khaldun (1332-1406) (2005). The Muqaddimah: an introduction to history. Ibn Khaldun; translated and introduced by Franz Rosenthal; abridged and edited by N.J. Dawood, with with a new introduction by Bruce B. Lawrence. Princeton, N.J.: Princeton University Press.
IMF (2009). World Economic Outlook database available at: http://www.imf.org/external/pubs/ft/weo/2009/01/weodata/download.aspx.
Inglehart, R. and Norris, P. (2003). Rising tide: gender equality and cultural change around the world. New York; Cambridge, U.K.: Cambridge University Press.
Kalecki, M. (1972). The Last Phase in the Transformation of Capitalism. New York: Monthly Review Press.
20
Kalecki, M. (1979). Essays on Developing Economies. With an Introduction by Professor Joan Robinson. Hassocks, Sussex: The Harvester Press.
Kearney, A. T., Inc., and the Carnegie Endowment for International Peace (2002). Globalizations Last Hurrah?” Foreign Policy, January/February: 38-51.
Kearney, A. T., Inc., and the Carnegie Endowment for International Peace (2003). Measuring Globalization: Whos up, whos down?” Foreign Policy, January/February: 60-72.
Kentor, J. (1998). The Long-Term Effects of Foreign Investment Dependence on Economic Growth, 1940-1990. The American Journal of Sociology, 103 (4), 1024-1046.
Klitgaard, R. and Fedderke, J. (1995). Social integration and disintegration: An exploratory analysis of cross-country data. World Development, 23 (3), 357-369.
Krasilshchikov, V. (2008). The Rise and Decline of Catching Up Development. An Experience of Russia and Latin America with Implications for Asian Tigers. Entelequia, Revista Interdisciplinar, e-books, Málaga, available from Internet: http://www.eumed.net/entelequia/en.lib.php?a=b008.
Kuznets, S. (1940). Schumpeters Business Cycles. The American Economic Review, 30, 2, 157 - 69.
Kuznets, S. (1955). Economic Growth and Income Inequality The American Economic Review, 45, 1: 1 - 28.
Kuznets, S. (1976). Modern Economic Growth: Rate, Structure and Spread. New Haven, CT: Yale University Press.
Mandelbaum, K. (1945). The industrialisation of backward areas by K. Mandelbaum, assisted by J. R. L. Schneider. Oxford: B. Blackwell.
Mann, Th. (1924). Buddenbrooks, translated from the German of Thomas Mann, by H.T. Lowe-Porter. New York: A.A. Knopf.
Norris, P. and Inglehart, R. (2004). Sacred and secular: religion and politics worldwide. Cambridge; Melbourne: Cambridge University Press.
Polanyi, K. (1957). The Great Transformation. Boston: Beacon.
Prebisch, R. (1950). The economic development of Latin America and its principal problems. Economic Commission for Latin America, New York: United Nations Department of Economic Affairs.
Prebisch, R. (1983). The crisis of capitalism and international trade ECLAC Review/Revista de la CEPAL (Santiago), 20, August: 51 - 74.
Prebisch, R. (1988). Dependence, development, and interdependence. In: G. Ranis and T. P. Schultz (Eds.). The State of Development Economics, 31 - 41. Oxford, United Kingdom: Basil Blackwell, 1988.
Rennstich, J. (2007). Is Globalization self-organizing? In: G. Modelski, T. C. Devezas, W. R. Thompson (Eds.)). Globalization as Evolutionary Process. Modeling Global Change, 74 – 107. London and New York: Routledge.

21
Rosenstein-Rodan, P. N. (1964). Capital formation and economic development. London: Allen & Unwin.
Ross, R. J. S. (2004). Slaves to Fashion. Poverty and Abuse in the New Sweatshops. Ann Arbor: University of Michigan Press.
Rothschild, K. W. (1944). The Small Nation and World Trade. The Economic Journal, April: 26 - 40.
Rothschild, K. W. (1954). The theory of wages. Oxford: Blackwell.
Rothschild, K. W. (1957). Der Lohnanteil am Gesamteinkommen: einige Bemerkungen zu einem umstrittenen Problem. Weltwirtschaftliches Archiv, 78 (2), 157 – 202.
Rothschild, K. W. (1958). Einkommensbildung und Einkommensverteilung. Weltwirtschaftliches Archiv, 80 (2), 53 – 58.
Rothschild, K. W. (1959). The limitations of economic growth models. Kyklos, 12 (4), 567-588.
Rothschild, K. W. (1964). Surveys of foreign postwar developments in economic thought. The American economic review, 54, 2, (2), 1 – 55.
Rothschild, K. W. (1965). Theme and variations, remarks on the Kaldorian distribution formula. Kyklos, 18 (4), 652 – 669.
Rubinson, R. (1976). The World Economy and the Distribution of Income within States – a Cross-national Study. American Sociological Review, 41 (4), 638 – 659.
Schumpeter, J. A. (1908). Wesen und Hauptinhalt der theoretischen Nationalökonomie. Leipzig: Duncker & Humblot. [The Nature and Essence of Economic Theory. Rutgers, New Jersey: Transaction Publishers, 2009].
Schumpeter, J. A. (1912). Theorie der wirtschaftlichen Entwicklung. Leipzig: Duncker & Humblot [The Theory of economic development: an inquiry into profits, capital, credit, interest and the business cycle / by Joseph A. Schumpeter; translated from the German by Redvers Opie. Cambridge (Mass.): Harvard University Press, 1934].
Schumpeter, J. A. (1939). Business cycles. A theoretical, historical, and statistical analysis of the capitalist process. New York, London: McGraw-Hill Book Company.
Schumpeter, J. A. (1942). The Process of Creative Destruction. London: Unwin.
Schumpeter, J. A. (1950). Capitalism, Socialism and Democracy. New York & London: Harper & Row
Schumpeter, J. A. (1954). History of economic analysis. New York: Oxford University Press.
Seers, D. and Öström, K. (Eds.) (1983). The Crises of the European regions. London: Macmillan in association with the European Association of Development Institutes.
Seers, D. (Ed.) (1981). Dependency theory: a critical reassessment. London: Pinter.
22
Seers, D., Schaffer, B. and Kiljunen, M.-L. (1979). Underdeveloped Europe: studies in core-periphery relations. Atlantic Highlands, N.J.: Humanities Press.
Seers, D., Vaitsos C, with the assistance of Marja-Liisa Kiljunen (1980). Integration and unequal development: the experience of the EEC. London: Macmillan.
Singa Boyenge, J-P (2007). ILO database on export processing zones. (Revised). WP.251; SECTORAL ACTIVITIES PROGRAMME; Working Paper; International Labour Office; Geneva, April 2007.
Singer, H. W. (1975). ‚The strategy of international development: essays in the economics of backwardness. H. W. Singer; edited by Alec Cairncross and Mohinder Puri. London: Macmillan.
Singer, H. W. and Ansari, J. A. (1988). Rich and poor countries: consequences of international economic disorder. London; Boston: Unwin Hyman.
Singer, H. W. and Roy, S. (1993). Economic progress and prospects in the Third World: lessons of development experience since 1945. Aldershot, England; Brookfield, Vt., USA: E. Elgar.
SPSS (2007). Statistical Package for the Social Sciences, User Guide. Version 14, August 2007.
Sunkel, O. (1966). The Structural Background of Development Problems in Latin America. Weltwirtschaftliches Archiv, 97, 1, 22 - 63
Sunkel, O. (1973). Transnational capitalism and national disintegration in Latin America. Social and Economic Studies, 22 (1), 132 - 76.
Sunkel, O. (1978). The Development of Development Thinking. In: J. J. Villamil (Ed.) Transnational Capitalism and National Development. New Perspectives on Dependence, 19 - 30, Hassocks, Sussex: Harvester Press.
Sunkel, O. (Ed.) (2003). Development from within: toward a neostructuralist approach for Latin America. Boulder, CO: L. Rienner.
Tausch, A. (2003) Social Cohesion, Sustainable Development and Turkeys Accession to the European Union. Alternatives: Turkish Journal of International Relations, 2 (1), 1 – 41.
Tausch, A. (2007). War Cycles” Social Evolution and History (Moscow), 6 (2), 39 – 74.
Tausch, A. (2008). Разрушительное созидание? (Рассуждения в духе Шумпетера о некоторых трендах и Лиссабонском процессе в Европе) [Destructive Creation” (Schumpeter-Style Reasonings on Some Trends and Lisbon Process in Europe)]. Mirovaja ekonomika i meždunarodnyje otnošenija, (Moscow). 10, 2008, 34 – 41.
Tausch, A. and Prager, F. (1993). Towards a Socio-Liberal Theory of World Development. Basingstoke and New York: Macmillan/St. Martins Press.
Tsai, P.-L. (1995). Foreign direct investment and income inequality: Further evidence. World Development, 23, (3), 469-483.
United Nations (current issues) United Nations Human Development Report. New York and Oxford: Oxford University Press.

23
United Nations Conference on Trade and Development (2009). World Investment Report. New York and Geneva: United Nations.
United Nations Economic Commission for Latin America, ECLAC/CEPAL, (2002). Globalización y desarrollo. available at: http://www.eclac.cl/cgi-bin/getProd.asp?xml=/publicaciones/xml/6/10026/P10026.xml&xsl=/tpl/p9f.xsl&base=/MDG/tpl/top-bottom.xsl.
Wallerstein, I. (2000). The Essential Wallerstein. New York: The New Press.
Weede, E. (2002). Impact of Intelligence and Institutional Improvements on Economic Growth. Kyklos, 55 (3), 361 - 380.
Weede, E. (2004). Does Human Capital Strongly Affect Economic Growth Rates? Yes, But Only If Assessed Properly. Comparative Sociology, 3 (2), 115 - 134.

24
Map 1.A: Economic growth in the world system, 2009
IMF forecastsApril 2009
3,5 to 16,4 (56)1,2 to 3,5 (62)
-3 to 1,2 (61)
Source: our own map from http://www.imf.org/external/pubs/ft/weo/2009/01/weodata/weoselgr.aspx

25
Map 1.B: Economic growth in the world system, 2010
IMF forecastsApril 2009
3,5 to 16,4 (56)1,2 to 3,5 (62)
-3 to 1,2 (61)
Source: our own map from http://www.imf.org/external/pubs/ft/weo/2009/01/weodata/weoselgr.aspx

26
Map 2.A: MNC penetration in the world system, 2006
MNC PEN as %of GDP
50 to 5.510 (54)30 to 50 (49)0 to 30 (89)

27
Map 2.B: MNC penetration in the world system, Europe 2006
MNC PEN as % of GDP
50 to 5.510 (54)30 to 50 (49)0 to 30 (89)

28
Graph 1.A – 1.F: Development level and development performance
Economic Growth
y = -0,1906x2 + 3,9432x - 17,947
R2 = 0,1183
-10
-5
0
5
10
15
20
0 2 4 6 8 10 12
ln GDP per capita
economic growth, 1990-2005, p.a. and pc.
Inequality
y = -0,7387x 2 + 11,033x - 28,673
R 2 = 0,053
0
10
20
30
40
50
60
70
0 2 4 6 8 10 12 ln GDP per capita
quintile share

29
Life expectancy
y = -1,0135x 2 + 25,021x - 72,506
R2 = 0,6534
0
10
20
30
40
50
60
70
80
90
0 2 4 6 8 10 12 ln GDP per capita
life expectancy
under-five mortality
y = 13,299x 2 - 271,32x + 1392,5
R2 = 0,6505
0
50
100
150
200
250
300
0 2 4 6 8 10 12
ln GDP per capita
under-five mortality rates
30
Future growth (2010)
y = -0,0591x2 - 0,2734x + 9,39R2 = 0,2922
-5
0
5
10
15
20
0 2 4 6 8 10 12
ln GDP per capita
IMF predicted growth, 2010
Unemployment
y = -1,6925x 2 + 28,748x - 111,14R 2 = 0,1153
-5
0
5
10
15
20
25
30
35
40
45
50
0 2 4 6 8 10 12
ln GDP per capita
unemployment rate

31
Table 1: Significant predictors of development.
Dimension variable lable beta-weight error probability
dependent variable
dependency from MNCs MNC PEN INWARD 0.347 0.000 growth 1990 – 2005
dependency from MNCs MNC PEN INWARD 0.193 0.045 Inequality
dependency from MNCs MNC PEN INWARD 0.102 0.047 under five mortality
dependency from MNCs MNC PEN INWARD -0.132 0.065 growth 2010 (IMF)
dependency from MNCs MNC PEN INWARD 0.162 0.066 Unemployment
dependency from MNCs MNC PEN INWARD -0.097 0.083 life expectancy
increases in MNC PEN DYN MNC PEN 95-2005 -0.185 0.047 Inequality
increases in MNC PEN DYN MNC PEN 95-2005 -0.159 0.059 growth 1990 – 2005
market size % world population 0.187 0.007 growth 2010 (IMF)
market size % world population 0.200 0.011 growth 1990 – 2005
Demography Annual population growth rate, 1975-2005 (%)
0.460 0.000 growth 2010 (IMF)
Demography Annual population growth rate, 1975-2005 (%)
0.415 0.001 Inequality
Demography Annual population growth rate, 1975-2005 (%)
0.143 0.017 under five mortality
Demography Annual population growth rate, 1975-2005 (%)
-0.179 0.054 growth 1990 – 2005
Demography Annual population growth rate, 1975-2005 (%)
-0.107 0.092 life expectancy
public education expenditure
public education expenditure per GNP
-0.275 0.001 growth 1990 – 2005
public education expenditure
public education expenditure per GNP
0.251 0.005 Unemployment
public education expenditure
public education expenditure per GNP
0.183 0.042 Inequality
public education expenditure
public education expenditure per GNP
-0.097 0.087 life expectancy
Modernization ln GDP 5.356 0.000 Inequality
Modernization ln GDP -4.688 0.000 under five mortality
Modernization ln GDP 5.169 0.000 Unemployment
Modernization ln GDP 2.189 0.007 life expectancy
Modernity ln GDP^2 -5.269 0.000 Inequality
Modernity ln GDP^2 4.035 0.000 under five mortality
Modernity ln GDP^2 -5.367 0.000 Unemployment
Modernity ln GDP^2 -1.445 0.074 life expectancy

32
Table 2: The OLS estimation results
1. Economic Growth 1990-2005 Beta std error beta-weight
t-value error prob
Constant -11.895 9.620 xx -1.236 0.219% world population 0.186 0.072 0.200 2.596 0.011Annual population growth rate, 1975-2005 (%)
-0.338 0.174 -0.179 -1.942 0.054
MNC PEN INWARD 0.033 0.008 0.347 4.263 0.000DYN MNC PEN 95-2005 -0.014 0.008 -0.159 -1.904 0.059public education expenditure per GNP -0.315 0.093 -0.275 -3.406 0.001ln GDP 3.138 2.218 1.629 1.415 0.160ln GDP^2 -0.154 0.127 -1.397 -1.218 0.226F-test=7.277, R2 adj 0.243, n=138
2. Inequality Beta std error beta-weight
t-value error prob
Constant -172.157 41.478 xx -4.151 0.000% world population -0.216 0.278 -0.065 -0.777 0.439Annual population growth rate, 1975-2005 (%)
3.287 0.978 0.415 3.362 0.001
MNC PEN INWARD 0.080 0.039 0.193 2.031 0.045DYN MNC PEN 95-2005 -0.068 0.034 -0.185 -2.012 0.047public education expenditure per GNP 0.836 0.405 0.183 2.062 0.042ln GDP 39.910 9.528 5.356 4.189 0.000ln GDP^2 -2.261 0.546 -5.269 -4.141 0.000F-test=6.776, R2 adj 0.264, n=114
3. Life Expectancy Beta std error beta-weight
t-value error prob
Constant -43.401 31.747 xx -1.367 0.174% world population 0.027 0.238 0.006 0.113 0.910Annual population growth rate, 1975-2005 (%)
-0.927 0.546 -0.107 -1.698 0.092
MNC PEN INWARD -0.043 0.025 -0.097 -1.745 0.083DYN MNC PEN 95-2005 0.031 0.025 0.072 1.244 0.216public education expenditure per GNP -0.531 0.309 -0.097 -1.722 0.087ln GDP 19.911 7.323 2.189 2.719 0.007ln GDP^2 -0.754 0.419 -1.445 -1.801 0.074F-test=34.233, R2 adj 0.624, n=141
4. Unemployment Beta std error beta-weight
t-value error prob
Constant -109.356 27.734 xx -3.943 0.000% world population -0.239 0.202 -0.099 -1.186 0.238Annual population growth rate, 1975-2005 (%)
-0.111 0.484 -0.022 -0.230 0.818
MNC PEN INWARD 0.041 0.022 0.162 1.857 0.066DYN MNC PEN 95-2005 -0.008 0.021 -0.033 -0.367 0.714public education expenditure per GNP 0.782 0.274 0.251 2.859 0.005ln GDP 27.537 6.379 5.169 4.317 0.000

33
ln GDP^2 -1.635 0.363 -5.367 -4.500 0.000F-test=5.305, R2 adj 0.193, n=127
5. Growth 2010 (IMF) Beta std error beta-weight
t-value error prob
Constant -3.343 10.673 xx -0.313 0.755% world population 0.220 0.080 0.187 2.752 0.007Annual population growth rate, 1975-2005 (%)
1.060 0.184 0.460 5.772 0.000
MNC PEN INWARD -0.015 0.008 -0.132 -1.860 0.065DYN MNC PEN 95-2005 0.012 0.008 0.104 1.397 0.165public education expenditure per GNP 0.155 0.104 0.107 1.488 0.139ln GDP 1.521 2.463 0.631 0.617 0.538ln GDP^2 -0.132 0.141 -0.952 -0.934 0.352F-test=14.239, R2 adj 0.400, n=140
6. Under Five Mortality Beta std error beta-weight
t-value error prob
Constant 1241.548 171.617 xx 7.234 0.000% world population -0.491 1.288 -0.019 -0.381 0.704Annual population growth rate, 1975-2005 (%)
7.101 2.947 0.143 2.410 0.017
MNC PEN INWARD 0.293 0.146 0.102 2.007 0.047DYN MNC PEN 95-2005 -0.122 0.140 -0.046 -0.874 0.384public education expenditure per GNP -1.880 1.670 -0.061 -1.126 0.262ln GDP -243.800 39.620 -4.688 -6.153 0.000ln GDP^2 12.051 2.266 4.035 5.318 0.000F-test=40.275, R2 adj 0.663, n=141

34
Appendix 1: Data Sources for the selected variables of the final model
IMF http://www.imf.org/external/datamapper/index.php
Economic growth rate, 2010
UNCTAD http://www.unctad.org/sections/dite_dir/docs/wir2007_instock_gdp_en.xls
http://www.unctad.org/sections/dite_dir/docs/wir2007_instock_gdp_en.xls http://www.unctad.org/sections/dite_dir/docs/wir2007_instock_gdp_en.xls http://www.unctad.org/Templates/Page.asp?intItemID=3198&lang=1 http://www.unctad.org/en/docs/wir2008_en.pdf http://www.unctad.org/Templates/Page.asp?intItemID=3277&lang=1
MNC PEN increase in MNC penetration 1995 - 2005
MNC PEN 1995
UNDP Human Development Report Office http://hdr.undp.org/en/statistics/data/
% world population
Annual population growth rate, 1975-2005 (%)
DYN 1990-2005 real economic growth rate
Life expectancy at birth 2000/2005
ln GDP per capita in PPP $
ln GDP per capita in PPP $^2
public education expenditure per GDP
RAT2020: quintile ratio (difference in the incomes between the richest and the poorest 20% in society
total population, 2005
Under-five mortality rate (per 1,000 live births) 2005
United Nations Statistics
http://unstats.un.org/unsd/Demographic/Products/socind/unemployment.htm
Unemployment rate, latest available year
United States Central Intelligence Agency
http://www.photius.com/rankings/spreadsheets_2008/population_2008.xls (based on US CIA)
% world population
Annual population growth rate, 1975-2005 (%)

35
Appendix 2: The data at a glance
Country
% world populatio
n
Annual pop
growth rate,
1975-2005 (%)
MNC PEN
INWARD
DYN MNC
PEN 95-2005
public education expenditu
re per GNP
ln GDP Economic growth (DYN) 1990-2005
quintile ratio
Life expectancy 2000-
2005
unemployment rate
IMF predicted growth 2010
under five mortality
2005
Albania 0.0500 0.9 8.51 3.29 3.1 8.51278 5.2 4.1 75.7 23.0 2.00 18Algeria 0.5142 2.4 3.88 4.29 5.1 8.79528 1.1 6.1 71.0 18.0 3.92 39Angola 0.2516 2.9 58.50 -21.52 .. 7.68708 1.5 .. 41.0 9.31 260Antigua and Barbuda 0.0016 0.3 88.27 51.94 .. 9.44034 1.5 .. .. 8.0 0.00 12Argentina 0.6049 1.3 9.87 20.23 3.5 9.49537 1.1 17.6 74.3 9.0 0.70 18Armenia 0.0469 0.2 5.13 22.64 2.0 8.31899 4.4 5.0 71.4 10.0 0.00 29Australia 0.3173 1.3 28.00 1.14 5.5 10.31993 2.5 7.0 80.4 4.0 0.65 6Austria 0.1297 0.3 8.23 14.53 5.4 10.38208 1.9 4.4 78.9 4.0 0.18 5Azerbaijan 0.1313 1.3 10.72 79.35 3.0 8.33159 2.6 66.8 16.0 12.33 89Bahamas 0.0047 1.8 21.65 80.22 .. 9.78937 0.4 .. 71.1 8.0 -0.50 15Bahrain 0.0109 3.3 41.10 20.75 4.4 9.94069 2.3 .. 74.8 6.0 3.47 11Bangladesh 2.3961 2.2 3.91 1.81 2.2 7.53369 2.9 4.6 62.0 4.0 5.38 73Barbados 0.0047 0.6 12.14 2.61 7.2 9.66269 1.5 .. 76.0 10.0 0.50 12Belarus 0.1532 0.1 0.36 7.53 5.9 8.84937 2.2 4.5 68.4 1.65 12Belgium 0.1626 0.2 37.04 90.30 3.1 10.34483 1.7 4.9 78.2 8.0 0.29 5Belize 0.0047 2.4 28.28 27.08 5.0 8.81685 2.3 .. 75.6 11.0 2.00 17Benin 0.1329 3.2 2.25 4.27 3.2 6.99485 1.4 6.0 54.4 1.0 3.04 150Bhutan 0.0094 1.9 0.91 1.66 4.1 7.58528 5.6 .. 63.5 3.0 6.62 75Bolivia 0.1438 2.2 23.30 28.07 4.9 7.90839 1.3 42.3 63.9 5.0 2.90 65Bosnia and Herzegovina 31.0 0.50Botswana 0.0281 2.7 25.46 -17.17 8.6 9.20483 4.8 31.5 46.6 18.0 14.35 120Brazil 2.9197 1.8 6.80 15.37 5.1 9.01128 1.1 23.7 71.0 9.0 2.17 33Brunei Darussalam 0.0063 2.8 12.86 86.06 .. 9.86319 -0.8 .. 76.3 5.0 0.60 9Bulgaria 0.1204 -0.4 3.40 47.55 3.2 8.99690 1.5 4.4 72.4 9.0 -1.00 15Burkina Faso 0.2173 2.8 2.77 -1.37 3.6 7.06390 1.3 6.9 50.7 2.0 4.09 191Burundi 0.1235 2.5 3.37 2.58 4.0 6.51767 -2.8 9.5 47.4 0.0 3.83 190Cambodia 0.2188 2.3 10.76 28.51 2.9 7.79276 5.5 6.9 56.8 2.0 2.99 143

36
Cameroon 0.2782 2.7 11.70 7.15 .. 7.68432 0.6 9.1 49.9 7.0 2.64 149Canada 0.5048 1.1 20.86 13.59 6.9 10.35019 2.2 5.5 79.8 6.0 1.16 6Cape Verde 0.0078 2.0 7.74 28.98 .. 8.65295 3.4 .. 70.2 23.0 2.96 35Central African Republic 0.0656 2.4 7.53 4.51 .. 6.99760 -0.6 32.7 43.3 3.10 193Chad 0.1579 3.0 22.89 41.38 1.7 7.64492 1.7 .. 50.5 1.0 2.51 208Chile 0.2548 1.5 33.91 28.84 3.6 9.29413 3.8 18.7 77.9 6.0 3.03 10China 20.5220 1.2 13.36 -1.54 2.3 8.68203 8.8 10.7 72.0 4.0 7.51 27Colombia 0.7018 1.9 6.93 23.08 4.4 8.88958 0.6 25.3 71.7 11.0 1.25 21Comoros 0.0125 3.1 8.35 -2.00 .. 7.57199 -0.4 .. 63.0 20.0 1.49 71Congo 0.0563 2.8 48.28 5.63 6.1 6.88551 -1.0 .. 53.0 5.54 108Congo (Dem Rep of the) 0.9175 3.0 9.59 3.20 .. 6.55820 -5.2 .. 45.0 11.87 205Costa Rica 0.0672 2.5 3.49 23.72 5.4 9.15705 2.3 14.2 78.1 5.0 1.50 12Côte d'Ivoire 0.2907 3.5 14.12 8.89 5.0 7.34666 -0.5 9.7 46.8 4.23 195Croatia 0.0719 0.2 2.64 34.89 5.3 9.40845 2.6 4.8 74.9 10.0 0.25 7Cuba 0.1766 0.6 0.12 0.08 6.7 3.5 .. 77.2 2.0 7Cyprus 0.0125 1.1 -0.85 52.02 4.5 10.03474 2.3 .. 79.0 5.0 2.10 5Czech Republic 0.1594 0.1 13.30 35.34 5.1 9.87344 1.9 3.5 75.4 5.0 0.08 4Denmark 0.0844 0.2 13.08 31.84 8.1 10.37080 1.9 4.3 77.3 4.0 0.40 5Djibouti 0.0125 4.3 4.59 17.91 .. 7.59740 -2.7 .. 53.4 44.0 5.39 133Dominica 0.0016 (.) 87.37 41.37 .. 8.63817 1.3 .. .. 11.0 2.00 15Dominican Republic 0.1485 2.0 -15.37 31.10 2.3 8.91584 3.9 14.4 70.8 18.0 2.00 31East Timor 22.73 24.37 7.88Ecuador 0.2048 2.1 17.92 8.60 3.5 8.28476 0.8 17.3 74.2 8.0 1.00 25Egypt 1.1379 2.1 21.32 9.67 4.8 8.34546 2.4 5.1 69.8 11.0 3.00 33El Salvador 0.1047 1.6 3.08 21.32 2.5 8.52536 1.6 20.9 70.7 7.0 0.50 27Equatorial Guinea 0.0078 2.6 105.39 -4.47 1.7 9.92867 16.6 .. 49.3 24.0 -2.83 205Eritrea 0.0703 2.5 .. 1.8 6.88449 0.3 .. 55.2 4.72 78Estonia 0.0203 -0.2 17.90 63.10 7.2 9.58569 4.2 6.4 70.9 5.0 -1.05 7Ethiopia 1.2348 2.8 2.25 22.60 4.0 6.62804 1.5 4.3 50.7 5.0 6.54 164Fiji 0.0125 1.2 29.32 -3.56 5.4 8.71045 1.4 .. 67.8 5.0 1.20 18Finland 0.0813 0.4 6.48 21.41 7.5 10.30732 2.5 3.8 78.4 7.0 -1.24 4France 0.9534 0.5 12.19 17.21 6.0 10.28534 1.6 5.6 79.6 8.0 0.41 5Gabon 0.0203 2.6 15.14 -13.08 2.9 8.79830 -0.4 .. 56.8 18.0 2.75 91Gambia 0.0250 3.5 48.75 32.00 4.9 7.59639 0.1 11.2 58.0 4.42 137Georgia 0.0703 -0.3 1.18 38.03 5.2 7.95297 0.2 8.3 70.5 13.0 3.00 45Germany 1.2926 0.2 6.58 10.48 4.8 10.25072 1.4 4.3 78.7 9.0 -1.00 5

37
Ghana 0.3517 2.6 12.79 7.24 4.2 7.71423 2.0 8.4 58.5 10.0 4.72 112Gibraltar Greece 0.1735 0.7 8.51 3.31 3.1 10.00807 2.5 6.2 78.3 8.0 -0.60 5Grenada 0.0016 0.4 72.00 97.37 4.7 8.98982 2.5 .. 67.7 15.0 1.00 21Guatemala 0.1985 2.4 16.85 2.18 1.7 8.36939 1.3 20.3 69.0 3.0 1.80 43Guinea 0.1407 2.7 3.34 16.50 1.9 7.68708 1.2 7.3 53.7 4.14 150Guinea-Bissau 0.0250 3.0 7.75 10.97 .. 6.58203 -2.6 10.3 45.5 3.10 200Guyana 0.0109 (.) 73.10 46.68 5.0 8.39818 3.2 .. 63.6 12.0 3.45 63Haiti 0.1454 2.0 6.57 -2.80 .. 7.54539 -2.0 26.6 58.1 7.0 2.00 120Honduras 0.1063 2.6 14.03 19.87 3.6 7.96416 0.5 17.2 68.6 4.0 1.90 40Hong Kong, China (SAR) 0.1110 1.6 157.76 136.55 2.9 10.33598 2.4 9.7 81.5 4.0 0.52 ..Hungary 0.1579 -0.1 24.63 31.45 4.6 9.72997 3.1 3.8 72.4 7.0 -0.45 8Iceland 0.0047 1.0 1.84 27.06 5.4 10.40581 2.2 .. 81.0 2.0 -0.20 3India 17.7305 2.0 1.52 3.95 3.2 8.05166 4.2 4.9 62.9 5.0 5.61 74Indonesia 3.5339 1.7 9.29 5.20 1.4 8.19119 2.1 5.2 68.6 9.0 3.50 36Iran (Islamic Republic of) 1.0847 2.4 2.09 0.11 4.0 8.92599 2.3 9.7 69.5 11.0 3.04 36Iraq -0.64 2.93 11.0 6.69Ireland 0.0641 0.9 65.85 15.58 6.0 10.56687 6.2 5.6 77.8 5.0 -3.00 6Israel 0.1047 2.3 6.23 21.76 7.6 10.10160 1.5 7.9 79.7 7.0 0.27 6Italy 0.9159 0.2 5.80 6.91 4.9 10.24637 1.3 6.5 79.9 6.0 -0.39 4Jamaica 0.0422 1.0 35.75 35.46 7.5 8.33399 0.7 6.9 72.0 9.0 -0.30 20Japan 1.9991 0.5 0.64 1.58 3.6 10.28367 0.8 3.4 81.9 4.0 0.52 4Jordan 0.0860 3.5 21.95 82.95 7.9 8.45276 1.6 6.9 71.3 12.0 4.00 26Kazakhstan 0.2376 0.2 14.09 30.34 4.4 8.91463 2.0 5.6 64.9 8.0 1.50 73Kenya 0.5564 3.2 6.26 -0.31 6.5 7.03878 -0.1 8.2 51.0 4.01 120Korea (Republic of) 0.7487 1 1.84 11.42 3.7 9.92813 4.5 4.7 77.0 3.0 1.53 5Kuwait 0.0422 3.3 0.35 0.45 5.0 9.87220 0.6 .. 76.9 2.39 11Kyrgyzstan 0.0813 1.5 9.67 13.21 5.3 7.56786 -1.3 4.4 65.3 8.0 2.93 67Lao People's Dem Republic 0.0891 2.2 11.85 11.45 2.1 7.57763 3.8 5.4 61.9 1.0 4.72 79Latvia 0.0359 -0.2 12.42 18.31 6.3 9.36332 3.6 6.8 71.3 6.0 -2.04 11Lebanon 0.0625 1.3 1.26 70.01 2.5 8.67197 2.8 .. 71.0 4.00 30Lesotho 0.0313 1.8 19.17 17.71 8.4 7.87055 2.3 44.2 44.6 27.0 2.98 132Liberia 2001.11 -1548.31 6.0 7.53Libyan Arab Jamahiriya 0.0922 2.9 3.00 2.22 .. 8.93195 .. 72.7 2.80 19Lichtenstein Lithuania 0.0531 0.1 5.42 26.49 5.5 9.48090 1.9 6.3 72.1 4.0 -3.00 9
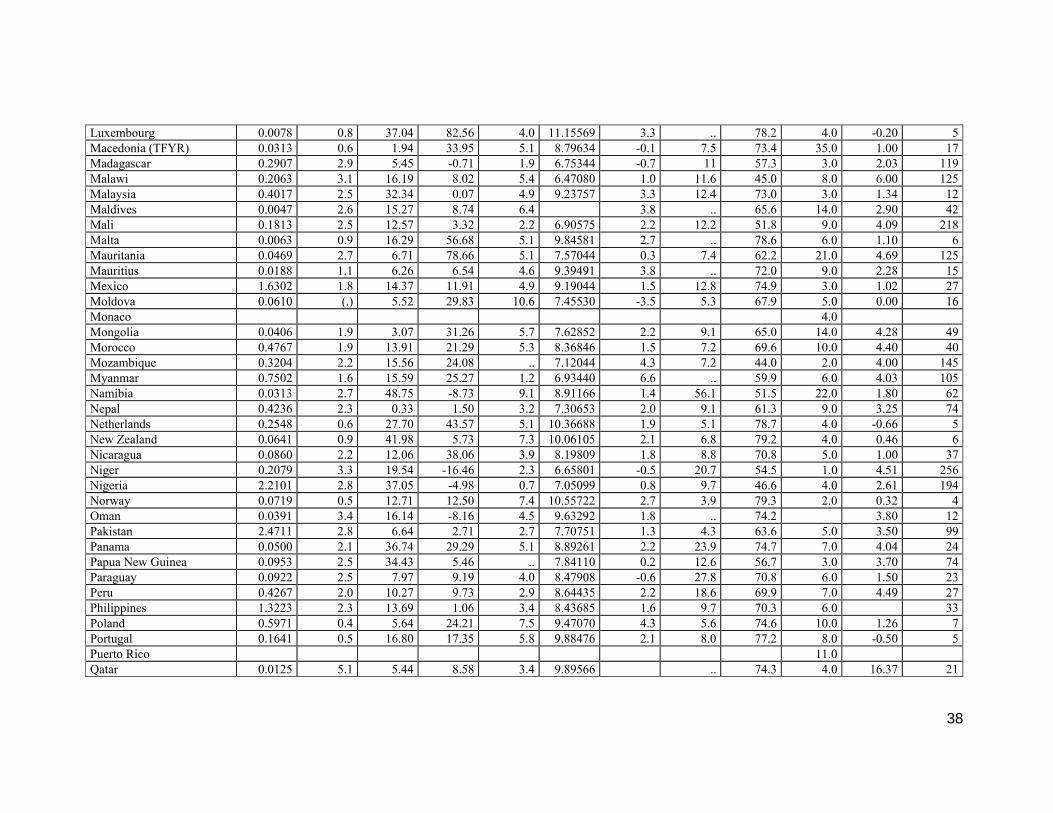
38
Luxembourg 0.0078 0.8 37.04 82.56 4.0 11.15569 3.3 .. 78.2 4.0 -0.20 5Macedonia (TFYR) 0.0313 0.6 1.94 33.95 5.1 8.79634 -0.1 7.5 73.4 35.0 1.00 17Madagascar 0.2907 2.9 5.45 -0.71 1.9 6.75344 -0.7 11 57.3 3.0 2.03 119Malawi 0.2063 3.1 16.19 8.02 5.4 6.47080 1.0 11.6 45.0 8.0 6.00 125Malaysia 0.4017 2.5 32.34 0.07 4.9 9.23757 3.3 12.4 73.0 3.0 1.34 12Maldives 0.0047 2.6 15.27 8.74 6.4 3.8 .. 65.6 14.0 2.90 42Mali 0.1813 2.5 12.57 3.32 2.2 6.90575 2.2 12.2 51.8 9.0 4.09 218Malta 0.0063 0.9 16.29 56.68 5.1 9.84581 2.7 .. 78.6 6.0 1.10 6Mauritania 0.0469 2.7 6.71 78.66 5.1 7.57044 0.3 7.4 62.2 21.0 4.69 125Mauritius 0.0188 1.1 6.26 6.54 4.6 9.39491 3.8 .. 72.0 9.0 2.28 15Mexico 1.6302 1.8 14.37 11.91 4.9 9.19044 1.5 12.8 74.9 3.0 1.02 27Moldova 0.0610 (.) 5.52 29.83 10.6 7.45530 -3.5 5.3 67.9 5.0 0.00 16Monaco 4.0Mongolia 0.0406 1.9 3.07 31.26 5.7 7.62852 2.2 9.1 65.0 14.0 4.28 49Morocco 0.4767 1.9 13.91 21.29 5.3 8.36846 1.5 7.2 69.6 10.0 4.40 40Mozambique 0.3204 2.2 15.56 24.08 .. 7.12044 4.3 7.2 44.0 2.0 4.00 145Myanmar 0.7502 1.6 15.59 25.27 1.2 6.93440 6.6 .. 59.9 6.0 4.03 105Namibia 0.0313 2.7 48.75 -8.73 9.1 8.91166 1.4 56.1 51.5 22.0 1.80 62Nepal 0.4236 2.3 0.33 1.50 3.2 7.30653 2.0 9.1 61.3 9.0 3.25 74Netherlands 0.2548 0.6 27.70 43.57 5.1 10.36688 1.9 5.1 78.7 4.0 -0.66 5New Zealand 0.0641 0.9 41.98 5.73 7.3 10.06105 2.1 6.8 79.2 4.0 0.46 6Nicaragua 0.0860 2.2 12.06 38.06 3.9 8.19809 1.8 8.8 70.8 5.0 1.00 37Niger 0.2079 3.3 19.54 -16.46 2.3 6.65801 -0.5 20.7 54.5 1.0 4.51 256Nigeria 2.2101 2.8 37.05 -4.98 0.7 7.05099 0.8 9.7 46.6 4.0 2.61 194Norway 0.0719 0.5 12.71 12.50 7.4 10.55722 2.7 3.9 79.3 2.0 0.32 4Oman 0.0391 3.4 16.14 -8.16 4.5 9.63292 1.8 .. 74.2 3.80 12Pakistan 2.4711 2.8 6.64 2.71 2.7 7.70751 1.3 4.3 63.6 5.0 3.50 99Panama 0.0500 2.1 36.74 29.29 5.1 8.89261 2.2 23.9 74.7 7.0 4.04 24Papua New Guinea 0.0953 2.5 34.43 5.46 .. 7.84110 0.2 12.6 56.7 3.0 3.70 74Paraguay 0.0922 2.5 7.97 9.19 4.0 8.47908 -0.6 27.8 70.8 6.0 1.50 23Peru 0.4267 2.0 10.27 9.73 2.9 8.64435 2.2 18.6 69.9 7.0 4.49 27Philippines 1.3223 2.3 13.69 1.06 3.4 8.43685 1.6 9.7 70.3 6.0 33Poland 0.5971 0.4 5.64 24.21 7.5 9.47070 4.3 5.6 74.6 10.0 1.26 7Portugal 0.1641 0.5 16.80 17.35 5.8 9.88476 2.1 8.0 77.2 8.0 -0.50 5Puerto Rico 11.0Qatar 0.0125 5.1 5.44 8.58 3.4 9.89566 .. 74.3 4.0 16.37 21

39
Reunion 29.0Romania 0.3376 0.1 2.30 23.89 3.6 9.04547 1.6 4.9 71.3 6.0 -0.04 19Russian Federation 2.2507 0.2 1.40 22.19 3.5 9.20049 -0.1 7.6 64.8 6.0 0.50 18Rwanda 0.1438 2.5 3.94 -0.25 .. 7.14125 0.1 4.0 43.4 1.0 5.79 203Saint Kitts and Nevis (.) 0.3 105.98 96.32 3.8 9.44951 2.9 .. .. 0.00 20Saint Lucia 0.0031 1.3 93.28 39.76 9.8 8.75211 0.9 .. 72.5 21.0 0.00 14Saint Vincent & Grenadines 0.0016 0.7 68.28 97.27 .. 8.76374 1.6 .. 70.6 20.0 1.20 20Samoa 0.0031 0.7 14.35 -1.49 .. 8.63284 2.5 .. 70.0 5.0 3.50 29Sao Tome and Principe 0.0031 2.1 -0.13 57.35 .. 7.11558 0.5 .. 64.3 17.0 6.00 118Saudi Arabia 0.3689 3.9 11.99 -1.36 7.5 9.53423 0.1 .. 71.6 6.0 2.90 26Senegal 0.1844 2.8 7.82 -3.65 3.7 7.44600 1.2 7.5 61.6 3.43 136Seychelles 0.0016 1.1 68.13 43.77 7.9 9.72029 1.5 .. .. 5.0 2.56 13Sierra Leone 0.0875 2.1 19.40 0.58 .. 6.32972 -1.4 57.6 41.0 3.0 5.30 282Singapore 0.0672 2.2 78.21 85.84 3.0 10.24271 3.6 9.7 78.8 4.0 -0.11 3Slovakia 0.0844 0.4 6.63 42.77 5.0 9.59035 2.8 4.0 73.8 11.0 1.92 8Slovenia 0.0313 0.5 12.90 7.77 5.7 9.94937 3.2 3.9 76.8 5.0 1.38 4Solomon Islands 0.0078 3.0 34.53 8.08 .. 7.50329 -2.4 .. 62.3 32.0 3.43 29South Africa 0.7487 2.1 9.93 22.70 8.0 9.32295 0.6 17.9 53.4 23.0 1.90 68Spain 0.6783 0.7 17.52 15.43 5.0 10.12851 2.5 6.0 80.0 8.0 -0.71 5Sri Lanka 0.2985 1.1 9.94 0.09 3.4 8.38708 3.7 5.1 70.8 6.0 3.59 14Sudan 0.5767 2.6 1.47 30.03 1.4 7.57507 3.5 .. 56.4 5.04 90Suriname 0.0078 0.7 3.5 1.1 .. 69.1 13.0 2.50 39Swaziland 0.0172 2.5 39.24 -9.47 5.7 8.63728 0.2 23.8 43.9 23.0 2.64 160Sweden 0.1407 0.3 12.24 34.69 8.3 10.29353 2.1 4.0 80.1 6.0 0.17 4Switzerland 0.1157 0.5 18.06 27.82 5.4 10.40547 0.6 5.5 80.7 4.0 -0.33 5Syrian Arab Republic 0.2954 3.1 47.82 -17.57 3.1 8.19146 1.4 .. 73.1 10.0 2.84 15Taiwan 5.75 6.38 0.01Tajikistan 0.1032 2.1 3.25 9.98 2.2 7.09174 -4 5.2 65.9 3.00 71Tanzania(United Rep of) 0.6018 2.9 11.47 22.46 .. 6.51323 1.7 5.8 49.7 5.0 5.66 122Thailand 0.9847 1.3 10.53 23.68 4.8 8.99838 2.7 7.7 68.6 1.0 1.04 21Togo 0.0969 3.1 19.52 14.39 4.5 7.33694 .. 57.6 2.15 139Trinidad and Tobago 0.0203 0.9 72.61 4.61 4.4 9.40771 4.3 8.3 69.0 7.0 2.00 19Tunisia 0.1579 1.9 60.83 -2.82 7.7 8.95777 3.3 7.9 73.0 14.0 3.80 24Turkey 1.1410 1.9 6.69 8.07 2.2 8.95584 1.7 9.3 70.8 10.0 1.50 29Turkmenistan 0.0750 2.2 18.96 22.34 .. 8.43033 -6.8 7.7 62.4 6.96 104Uganda 0.4517 3.3 4.58 17.44 2.6 7.29845 3.2 8.4 47.8 3.0 5.50 136

40
Ukraine 0.7330 -0.1 1.85 18.13 7.3 8.76312 -2.4 4.1 67.6 7.0 1.02 17United Arab Emirates 0.0641 6.8 4.14 17.37 1.8 10.08814 -0.9 .. 77.8 3.0 1.55 9United Kingdom 0.9409 0.2 17.59 20.34 5.3 10.33595 2.5 7.2 78.5 5.0 -0.40 6United States 4.6858 1.0 7.25 5.89 5.4 10.58850 2.1 8.4 77.4 5.0 -0.05 7Uruguay 0.0516 0.5 5.84 11.27 3.3 9.15070 0.8 10.2 75.3 9.0 2.00 15Uzbekistan 0.4158 2.1 0.79 7.88 7.7 7.53316 0.3 4.0 66.5 7.00 68Vanuatu 0.0031 2.5 102.23 25.40 4.8 8.02322 .. 68.4 3.50 38Venezuela (Bolivarian Rep) 0.4173 2.5 11.01 19.58 5.2 8.70666 -1 10.6 72.8 7.0 -0.50 21Viet Nam 1.3285 1.9 34.48 24.36 3.0 7.91754 5.9 6.0 73.0 2.0 3.97 19Yemen 0.3298 3.6 32.50 -27.45 7.0 6.77878 1.5 5.6 60.3 12.0 4.72 102Zambia 0.1797 2.7 44.74 6.88 2.2 6.84907 -0.3 8.0 39.2 13.0 4.55 182Zimbabwe 0.2048 2.5 6.93 55.17 7.1 7.63289 -2.1 12 40.0 4.0 132