Embed Size (px)
Citation preview

Re-Electrospraying Splash-Landed Proteins and NanoparticlesW. Henry Benner,*,† Gregory S. Lewis,‡ Susanne V. Hering,‡ Brent Selgelke,† Michelle Corzett,†
James E. Evans,§ and Felice C. Lightstone†
†Physics and Life Sciences, Biology and Biotechnology Division, Lawrence Livermore National Laboratory, P.O. Box 808, Livermore,California 94551, United States‡Aerosol Dynamics, Inc., 935 Grayson Street, Berkeley, California 94710, United States§Department of Molecular and Cellular Biology, University of California, Davis, Davis, California 95616, United States
*S Supporting Information
ABSTRACT: FITC-albumin, Lsr-F, or fluorescent polystyrene latex particleswere electrosprayed from aqueous buffer and subjected to dispersion bydifferential electrical mobility at atmospheric pressure. A resulting narrow sizecut of singly charged molecular ions or particles was passed through acondensation growth tube collector to create a flow stream of small waterdroplets, each carrying a single ion or particle. The droplets were splashlanded (impacted) onto a solid or liquid temperature controlled surface.Small pools of droplets containing size-selected particles, FITC-albumin, orLsr-F were recovered, re-electrosprayed, and, when analyzed a second timeby differential electrical mobility, showed increased homogeneity. Trans-mission electron microscopy (TEM) analysis of the size-selected Lsr-Fsample corroborated the mobility observation.
Publications in the field of mass spectrometry and aerosolscience describe various approaches for collecting ions and
particles after they have passed through a size selecting filter. Ina mass spectrometer the size selecting filter is the analyzermodule, and for electrical mobility separations a nano-differential mobility analyzer (nDMA) provides size selection.The aim of the investigations based on the use of a massspectrometer has been to develop methods for collecting intact(unfragmented) ions or particles for a variety of purposes1−6
including purification of a sample,7 production of surfacecoatings,8 studies of surface chemistry,9,10 production ofnanomaterials,11 and preparation of a virus for TEM analysis.12
The aim of the investigations based on deposition followingelectrical mobility separation has been similarly directed andincludes preparation of a virus for TEM analysis13 and thepreparation of targets for X-ray diffraction studies.14
All of the soft landing approaches described to date usingmass spectrometers provided soft landing conditions byretarding ion velocity electrostatically, thereby reducing ionenergy, so that upon impact with a collection surface, ionkinetic energy is not transformed into ion internal energy andavailable for bond rupture. Graham Cooks’ laboratory15
introduced the concept of soft landing for ions in 1977.Their initial description focused on ions with 1−3 atoms. Sincethe time of the initial publication, the concept of soft landinghas been refined by a number of research groups, includingCooks’, with 120 articles showing up in an ISI Web ofKnowledge title search of ‘soft landing + ion’ at the time of thiswriting. One of the softest approaches for landing ions was todeposit ions into thin layers of liquid.16,17 To date, relatively
small amounts of material have been deposited onto surfaces bymeans of soft landing due primarily to the relatively low ioncurrents associated with ions extracted from the analyzersection of a mass spectrometer. Working to beat thisbottleneck, Mazzei et al.9 deposited enough microperoxidaseonto a surface so that voltammetry could be performed on thecollected material. More notably, several investigators18,19
deposited enough material onto a surface such that the surfacecould be rinsed and the recovered material analyzed bynanoESI-MS.Soft landing has also been investigated using instruments that
are not mass spectrometers, such as the work of Davila et al..20
who collected ions after they passed through a drift tube. Thephysical principles defining mobility separations,21 performedwith a drift tube or DMA, are considered to be soft because themotion of an ion or charged particle in a gas is stronglyinfluenced by aerodynamic drag, which limits ion or particlevelocity to relatively low values.In this paper we demonstrate the collection of electrosprayed
protein ions or electrosprayed nanoparticles by means of a softlanding technique we call splash landing and show that it ispossible to recover splash landed ions or particles and analyzethem a second time using electrospray differential electricalmobility analysis. The soft landing technique we report hereintroduces mobility-selected ions or particles into a con-densation growth tube where they accrete a coating of
Received: December 12, 2011Accepted: January 26, 2012Published: January 26, 2012
Article
pubs.acs.org/ac
© 2012 American Chemical Society 2498 dx.doi.org/10.1021/ac203298w | Anal. Chem. 2012, 84, 2498−2504

condensed water vapor, grow to become small droplets, andsplash land onto a surface. We focus our attention on therecovery and analysis of the splash-landed material. An ion orparticle residing inside of a condensation droplet is protectedby the encapsulating liquid during the splash landing of thedroplet, thus precluding ion fragmentation. The techniqueprovides conditions for selecting, enriching, and collectingindividual protein molecules from an initial sample consistingof multimeric forms of the protein such as small clusters ofproteins or homo-oligomers. It is also demonstrated that arelatively wide size distribution of nanoparticles can be reducedto a narrow nearly monodisperse population of nanoparticleswith the same technique.
■ EXPERIMENTAL SECTIONA summary of our approach for selecting a narrow size cut ofions or particles, collecting this material by the very soft splashlanding process, recovering it, and reanalyzing it usingelectrospray differential electrical mobility is presented inFigure 1.
The differential electrical mobility instrumentation isoperated in scanning mode at two points (measurement 1,measurement 2) in this scheme to acquire size distributions ofthe material and in fixed-mobility mode to capture size-selectedmaterial.The experimental setup is shown in Figure 2, parts of which
have been described in detail by others.22,23 Gas-borne ions orpolystyrene latex particles (PSL) were generated using anElectrospray Generator (EG, TSI, Inc., Model 3480). Liquidsamples of these materials were pumped with air pressure (ΔP= 0.8 psig) through a 33 cm length of 50 μm i.d. × 220 μm o.d.of a fused silica capillary (Scientific Instrument Services, Inc.,Ringoes, NJ) resulting in a sample flow of approximately 200nL/min. The electrospray end of the capillary was mechanicallyabraded to form a flat-ended cone. The capillary tip was bathedin a flow of 1.5 Lpm dry air mixed with 0.25 Lpm CO2provided by the EG. Alpha particles from a Polonium-210source reduced the charge on the electrospray droplets to asteady-state charge distribution characterized by the theory ofFuchs,24 resulting a population of predominantly neutralmolecules or particles, along with a small fraction that were
singly charged and useful for differential electrical mobilitydispersion. Charge-reduced electrospray25 leads to ions andparticles having a residue shell. The thickness of the residue isdetermined by the concentration of nonvolatile salts in thesample, thus diluting the sample also dilutes the saltconcentration and reduces the thickness of the residue.26 Theions or particles are nearly anhydrous27,28 for a brief momentwhile they pass through a nano differential mobility analyzer(nDMA).The differential electrical mobility instrumentation consisted
of a nanodifferential mobility analyzer (nDMA, TSI, Inc.operated with a TSI, Inc. model 3080 classifier) and acondensation particle counter (CPC; TSI, Inc., model 3025).The flow of gas through each of these components wasdecoupled (excess gas allowed to escape) from the overallsystem so that each could be operated independently. Thedifferential electrical mobility instrumentation was operated inscanning mode to measure particle size distributions rangingfrom 2 to 72 nm or in fixed-mobility mode to collect size-selected ions. Further details of the analysis system arepresented in the Supporting Information.The CGTC in Figure 2 (Aerosol Dynamics, Inc., Berkeley,
CA) is basically a device that operates on the principle of aCPC with the provision that the condensation droplets do notpass through a droplet-counting detector and instead aredirected through nozzles that accelerate the condensationdroplets toward a surface, causing them to be collected viasplash impaction. Air carrying ions or particles enter three finemesh tubes (two are shown in the drawing), each having anentrance section that is cooled and a second section that iswarmed. The mesh tubes are wetted with water and serve tointroduce water vapor into the transiting air stream. Thegrowth tube operates on principles identified by Hering etal.29,30 In our experiments, 1 Lpm of air is divided among three1/4″ id mesh tubes in the CGTC, each of which connects to a0.03″ diameter tubular nozzle. The temperature at the entranceto the mesh tubes was set to 8 °C, while the second sections ofthe mesh tubes were operated at 30 °C. The nozzles act as atransition zone between the mesh tubes and an impactorchamber operated at 30 °C or slightly higher.Splash landing is a type of impaction technique used by the
aerosol science community to collect liquid and solid aerosolson a surface. As the jet of gas-borne droplets spreads and flowsover the collection surface, the droplets fail to follow the gasstreamlines31 and impact (splash land) onto the surface bycentrifugal force where they accumulate. Selection ofappropriately sized nozzles (0.03″ id) based on gas flow (1Lpm), along with the spacing between the nozzle and theimpactor surface (0.1″), provides an efficient way to collect thedroplets (1−3 μm diameter) generated in the condensationgrowth tube. Two types of impactors were used to splash landdroplets. The first, shown in the left panel of Figure 3 aimed ajet of droplet-laden air at a flat glass surface (circularmicroscope coverslip derivatized with Aqua-sil, Pierce Bio-technology) secured in place with heat transfer paste onto thetop of a short pedestal in a temperature controlled stainlesssteel chamber. The chamber and impactor surface were heatedto 30 °C, a temperature derived experimentally that was not toowarm to evaporate the splash landed droplets nor too cool tocondense water vapor onto the surface.A second type of impactor used in this study (right panel,
Figure 3) was designed to provide longer unattended operationso that larger quantities of a protein could be collected. Here a
Figure 1. Overview of our experimental approach.
Analytical Chemistry Article
dx.doi.org/10.1021/ac203298w | Anal. Chem. 2012, 84, 2498−25042499

100 μL cup-shaped device fabricated from PEEK was pressedinto a stainless steel housing and when filled with liquidprovided a liquid surface for collecting splash landed droplets.Ports provided a means for adding and withdrawing liquid. A 1mL syringe (manually operated) and a 25 mL syringe (operatedwith a syringe pump) were used to adjust the amount of liquidin the cup (refer to Figure 2, right). A small diameter tube,attached to a collection tube and a source of suction, extendedup through the bottom of the cup to a height that maintained apredetermined volume (typically 100 μL) in the bottom of thecup. The air stream passing from the impactor to the CPC wasnearly saturated with water vapor. If this water vapor wasallowed to enter the CPC, it would have been absorbed by thebutanol in the condenser tube inside the CPC and reduced theCPC’s detection efficiency. To prevent this problem, a smallthermoelectric cooler was used to chill a 10″ length of metaltubing on the inlet to the CPC, which removed a majority ofthe water vapor via water vapor condensation.
■ MATERIALS
FITC-albumin (PN: A 9771) was purchased from SigmaChemical and diluted with 25 mM aq. ammonium acetate. 0.02μm diameter particles (PN: F8787, Fluorospheres) werepurchased from Invitrogen and diluted with 25 mM aq.
ammonium acetate. The Lsr-f was prepared via a cloningprocedure described in the Supporting Information. Thetransmission electron microscope (TEM) samples wereprepared with TEM grids coated with amorphous carbon andthen stained with uranyl formate using procedures described inthe Supporting Information.
■ RESULTS
A critical parameter for forcing water to condense onto ionsand nanoparticles is the difference in temperature between thecooled and heated zones along the growth tube in the CGTC.It can be understood that when the temperature difference(ΔT) between the cooled and heated zones is larger, largerdroplets form and vice versa when the temperature difference issmaller. Larger droplets are collected by impaction moreefficiently than smaller droplets. Droplet size measurementswere obtained by drawing the droplets into an aerodynamicparticle sizer (TSI, INC., model 3321) and recording dropletsize distributions as a function of ΔT. The droplet sizedistribution extended from 1.8 to 3.2 μm and peaked at 2.64μm. The efficiency with which nanoparticles and protein ionsare transformed into condensation droplets is also important tounderstand because it governs the overall collection efficiency.
Figure 2. Experimental setup. nDMA = nanodifferential mobility analyzer, CGTC = condensation growth tube collector, CPC = condensationparticle counter. The chiller reduced the amount of water vapor entering the butanol-based CPC. The right panel shows an enlarged view of theCGTC.
Figure 3. Impactors showing glass coverslip (derivatized with Aqua-sil (left) onto which droplets are impacted or into a small pool of liquid (right),where it can be seen that the jets of gas depress the liquid.
Analytical Chemistry Article
dx.doi.org/10.1021/ac203298w | Anal. Chem. 2012, 84, 2498−25042500

The collection efficiency was 98.5% at 7.7 nm, 99.5% at 10 nm,99.8% at 12 nm, and 100% for particles larger than 15 nm.The temperatures of each zone cycled from a set point
temperature to about 2 degrees above the set point, which ledto small variations in the conditions causing droplet formationas detected by variations in the number concentration ofparticles detected downstream of the droplet impactor. Thesevariations were insubstantial (± approximately 0.1%) in termsof altering ion or particle collection efficiency.The droplets exiting the CGTC had an average diameter of
2.64 μm and equivalent to a volume of 9.2 × 10⁻¹² cm3. When1 × 105 ions/cm3, a typical input concentration to the CGTC,pass through the CGTC at 1 Lpm, approximately 1 μL/min ofdroplets are collected. This volumetric collection rate fordroplets is negligible in comparison to the 100 μL of startingbuffer in the collection cup and did not substantially dilute thebuffer during droplet collection.Conditions for operating the CGTC were optimized by
electrospraying nominally 0.02 μm diameter fluorospheres,which range in size from about 15 to 50 nm, from which anarrow size cut was selected using differential electrical mobilityand recovered via splash landing. In order to understand thefiltering efficiency of our size-selecting process, it was importantto characterize the starting material and then compare it to thesize-selected material. The blue line in Figure 4 shows the size
distribution of the nominally 0.02 μm particles, obtained usingmeasurement 1 in Figure 1. The modal diameter is 29.4 nmwhen the particles were diluted 1/4 and 28.8 nm (not shown)when they were diluted 1/4000. Further dilutions of theparticles did not substantially shift the modal diameter of theparticles to smaller sizes. The difference between the two modaldiameters is caused by the presence of surfactant in the stocksolution of the particles. A broad peak at 7 nm for the 1/4dilution of particles corresponds to residue particles of thesurfactant. When the 1/4 dilution of particles is electrosprayed,the dry particles carry a coating of the dry surfactant, whichshifts the measured size from 28.8 to 29.4 nm.The vertical red dashed line in Figure 4 at 29 nm represents
the diameter of particles that were targeted for size selection.The nDMA nominally operates with a resolving power between10 and 20 (depends on sheath flow rate), which means thatparticles slightly smaller and slightly larger than 29 nm will be
size-selected simultaneously. The nDMA was set to 29 nm andoperated in fixed-mobility mode for 1000 min and ∼70 μL,slightly less than predicted, of droplets were collected. Thecollected liquid was removed with a pipet, transferred to a 1.5mL microcentrifuge tube, and evaporated to about 20 μL undera jet of filtered air. Following addition of 2 μL of 250 mMammonium acetate, the recovered solution was re-electro-sprayed and analyzed by nDMA operated in scanning mode.The size distribution of the splash landed size-selected
particles, obtained using measurement 2 in Figure 1, isrepresented by the red plot in Figure 4. It is characterized bya dominant peak centered at 28.8 nm with fwhm equal to 2.7nm. The modal diameter of the recovered material is slightlysmaller than the diameter dialed into the nDMA’s controller,and the observed shift in diameter from 29 to 28.8 nm can beattributed to the presence of surfactant in the initial particlesolution. As the size-selected particles are collected theybecome diluted by the condensed water they accreted whilepassing through the CGTC. When re-electrosprayed, they carrya thinner residue of surfactant and emerge in the spectrum as apeak centered at 28.8 nm. Upon further dilution of thecollected material by 1/3, the measured particle size is shiftedfurther toward smaller diameter (28.7 nm), displayed as theblack plot in Figure 4, again as a result of a lower surfactantconcentration. The spectrum of the splash landed size-selectedparticles also has small peaks at 20 nm, 37 nm, and 42 nm. Anexplanation for the peak at 20 nm is not concrete - it may bepartially due to the production of doubly charged 29 nmparticles that result from the charge reduction process when 29nm particles are electrosprayed, since 29 nm particles at +2have the same electrical mobility as 20 nm particles at +1.32
The peaks at 37 and 42 nm appear to comprise doublets andtriplets of 29 nm particles, which could have formed aftercollection because there is no longer any surfactant in thesolution to prevent the size-selected particles from clumping.The heights of these peaks, relative to the height of the 29 nmpeak, approximates the distribution of dimers and trimerspredicted by Poisson statistics.nDMA spectra of several concentrations of FITC-albumin
(0.01, 0.1, and 1 mg/mL), presented in Figure 5, arecharacterized by a peak at 7.1 nm that corresponds to themonomeric form of FITC-albumin, and additional peakscorresponding to multimeric forms of FITC-albumin. WhenFITC-albumin is electrosprayed at 0.01 mg/mL (green plot),the monomeric form at 7.1 nm dominates a small peak at 8.8nm representing the dimeric form.Further dilution of the FITC-albumin did not shift the
location of the peaks in the spectrum and therefore it can beconcluded that the peak at 7.1 nm represents the size of singlemolecules of FITC-albumin. At the highest concentration ofFITC-albumin (1 mg/mL) a wide peak (blue plot in Figure 5)centered at about 13 nm represents a distribution of particlescarrying 2−20 FITC albumin molecules. The primary electro-spray droplets were approximately 250 nm in diameter, asdetermined by sucrose residue particle measurements26 andresults in the production of approximately 1.2 × 10¹⁴ dropletsafter 1 cm3 of sample is electrosprayed. If every one of thesedroplets contained a single FITC-albumin molecule thealbumin concentration would have been 2 × 10⁻⁷ M or0.013 mg/mL. One of the concentrations of FITC-albuminused to generate the plot in Figure 5 was 0.01 mg/mL,approximately the concentration that would produce dropletscontaining a single molecule of FITC-albumin on average.
Figure 4. Size distributions of fluorospheres. Blue = 1/4 dil of 0.02 nmfluorospheres from which size-selected (29 nm, red dashed line)particles were collected, red = recovered 29 nm size-selectedfluorospheres, black = 1/3 dil of 29 nm size-selected fluorospheresshowing a small shift toward smaller diameter. The width of thedashed line does not represent the resolving power of the nDMA.
Analytical Chemistry Article
dx.doi.org/10.1021/ac203298w | Anal. Chem. 2012, 84, 2498−25042501
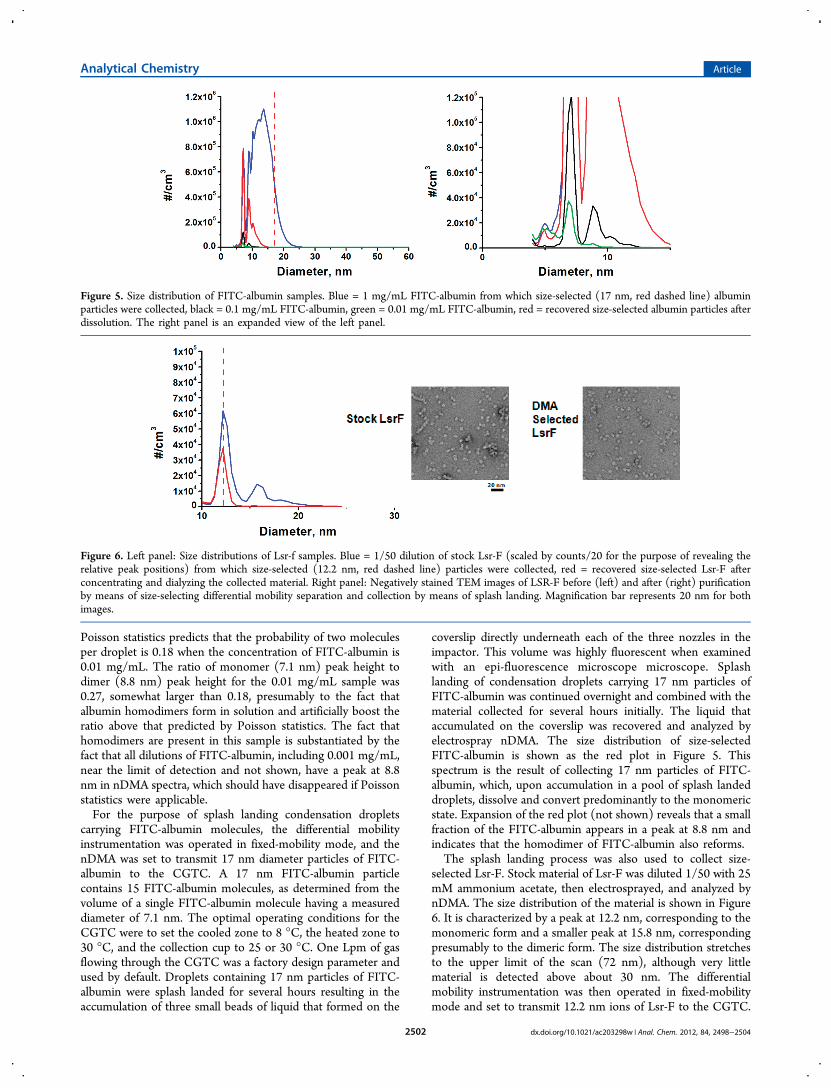
Poisson statistics predicts that the probability of two moleculesper droplet is 0.18 when the concentration of FITC-albumin is0.01 mg/mL. The ratio of monomer (7.1 nm) peak height todimer (8.8 nm) peak height for the 0.01 mg/mL sample was0.27, somewhat larger than 0.18, presumably to the fact thatalbumin homodimers form in solution and artificially boost theratio above that predicted by Poisson statistics. The fact thathomodimers are present in this sample is substantiated by thefact that all dilutions of FITC-albumin, including 0.001 mg/mL,near the limit of detection and not shown, have a peak at 8.8nm in nDMA spectra, which should have disappeared if Poissonstatistics were applicable.For the purpose of splash landing condensation droplets
carrying FITC-albumin molecules, the differential mobilityinstrumentation was operated in fixed-mobility mode, and thenDMA was set to transmit 17 nm diameter particles of FITC-albumin to the CGTC. A 17 nm FITC-albumin particlecontains 15 FITC-albumin molecules, as determined from thevolume of a single FITC-albumin molecule having a measureddiameter of 7.1 nm. The optimal operating conditions for theCGTC were to set the cooled zone to 8 °C, the heated zone to30 °C, and the collection cup to 25 or 30 °C. One Lpm of gasflowing through the CGTC was a factory design parameter andused by default. Droplets containing 17 nm particles of FITC-albumin were splash landed for several hours resulting in theaccumulation of three small beads of liquid that formed on the
coverslip directly underneath each of the three nozzles in theimpactor. This volume was highly fluorescent when examinedwith an epi-fluorescence microscope microscope. Splashlanding of condensation droplets carrying 17 nm particles ofFITC-albumin was continued overnight and combined with thematerial collected for several hours initially. The liquid thataccumulated on the coverslip was recovered and analyzed byelectrospray nDMA. The size distribution of size-selectedFITC-albumin is shown as the red plot in Figure 5. Thisspectrum is the result of collecting 17 nm particles of FITC-albumin, which, upon accumulation in a pool of splash landeddroplets, dissolve and convert predominantly to the monomericstate. Expansion of the red plot (not shown) reveals that a smallfraction of the FITC-albumin appears in a peak at 8.8 nm andindicates that the homodimer of FITC-albumin also reforms.The splash landing process was also used to collect size-
selected Lsr-F. Stock material of Lsr-F was diluted 1/50 with 25mM ammonium acetate, then electrosprayed, and analyzed bynDMA. The size distribution of the material is shown in Figure6. It is characterized by a peak at 12.2 nm, corresponding to themonomeric form and a smaller peak at 15.8 nm, correspondingpresumably to the dimeric form. The size distribution stretchesto the upper limit of the scan (72 nm), although very littlematerial is detected above about 30 nm. The differentialmobility instrumentation was then operated in fixed-mobilitymode and set to transmit 12.2 nm ions of Lsr-F to the CGTC.
Figure 5. Size distribution of FITC-albumin samples. Blue = 1 mg/mL FITC-albumin from which size-selected (17 nm, red dashed line) albuminparticles were collected, black = 0.1 mg/mL FITC-albumin, green = 0.01 mg/mL FITC-albumin, red = recovered size-selected albumin particles afterdissolution. The right panel is an expanded view of the left panel.
Figure 6. Left panel: Size distributions of Lsr-f samples. Blue = 1/50 dilution of stock Lsr-F (scaled by counts/20 for the purpose of revealing therelative peak positions) from which size-selected (12.2 nm, red dashed line) particles were collected, red = recovered size-selected Lsr-F afterconcentrating and dialyzing the collected material. Right panel: Negatively stained TEM images of LSR-F before (left) and after (right) purificationby means of size-selecting differential mobility separation and collection by means of splash landing. Magnification bar represents 20 nm for bothimages.
Analytical Chemistry Article
dx.doi.org/10.1021/ac203298w | Anal. Chem. 2012, 84, 2498−25042502

By setting the nDMA to transmit 12.2 nm ions, ionscorresponding to debris (Dp > 15 nm) and dimers and trimerswere excluded.Droplets containing monomeric Lsr-F were splash landed
overnight using the second type of impactor, into which 100 μLof 250 mM ammonium acetate was placed at the start ofcollection. During the overnight collection, 590 μL of liquidwas accumulated in the collection vial, therefore along with the100 μL remaining in the impactor, the 250 mM buffer wasdiluted by a factor of 100/690, to 36 mM. This size-selectedmaterial was concentrated by evaporation under a jet of filteredair to 20 μL and then drop dialyzed against 25 mM ammoniumacetate for 1 h. The size distribution of the recovered size-selected Lsr-F is represented by the red plot in Figure 6.The droplet collection times used in this study were long
because analysis by electrospray differential electrical mobilityhas a detection limit of about 1 μg/mL for proteins due to thenature of charge-reduced electrospray. For example, only about15% of 29 nm particles carry one charge and are useful foranalysis. The fraction of +1 charged ions is even smaller for theproteins we studied.Eight μL aliquots of Lsr-F of a 1/100 dilution of Lsr-F
starting material or monomeric size-selected Lsr-F wereadsorbed to separate TEM grids. The grids were processedby negative staining (see the Supporting Information) andexamined using TEM. Images of the two samples are shown inFigure 6, right panel. LSr-F macromolecules are arranged as adecamer with two rings of pentamers and have a diameter of10.5 nm and a height of 6.6 nm. The diluted starting materialshows aggregated chains of Lsr-F macromolecules along withmonomers, dimers, trimers, and larger clumps of Lsr-Fmacromolecules. Approximately 15% of the Lsr-F moleculesare monomers, and the remainder is aggregated. The size-selected sample of monomeric Lsr-F shows a few smallclumped particles, but chains and large clumps are no longerobserved. In the size-selected sample, approximately 70% of theLsr-F molecules are in the monomeric form. Since theadsorption and staining procedures were identical for bothsamples, any potential artifacts from incubation with a heavymetal salt solution (uranyl formate) or interaction with thepartially charged carbon film should be identical. Thus, theTEM results indicate the size-selection process creates a morehomogeneous population of molecules.
■ CONCLUSIONS AND FUTURE DIRECTIONSWe have demonstrated that the use of differential electricalmobility instrumentation, in conjunction with a condensationgrowth tube collector, and the splash landing process can beused to process and purify nanoparticles and biological samples.The approach provides a way to size-select small quantities ofthese materials out of a more complicated mixture forsubsequent testing or analysis. We have demonstrated that adistribution of nanoparticles, initially having fwhm of 17 nm(extending from 18 to 35 nm), can be processed to produce apopulation of particles that is nearly monodisperse with a fwhmof 2.7 nm. Any size of fluorospheres between 15 and 45 nmcould have been selected from the nominally 0.02 μm diameterstarting material. The same capability was also demonstratedwith FITC-albumin and Lsr-F proteins.One application of the technique reported here is to use it to
prepare more homogeneous populations of macromolecules forTEM or cryo-electron microscopy (cryo-EM) analysis. Liquidsamples are typically prepared for TEM or cryo-EM by placing
a small drop (5−10 μL) of sample onto a high surface tensionsurface onto which a TEM grid is carefully dropped. The splashlanding technique described here should make it possible tostart with a droplet of buffer atop a TEM grid and thenbombard the grid with droplets of size-selected material until anadequate quantity of sample is accumulated on the wet gridsimilar to the way samples are collected for time-resolved cryo-EM.33 The grid can then be further processed for TEM or cryo-EM inspection using standard procedures.It is understandable that there may be concern for the
stability of a protein ion during the process of drying anelectrospray droplet. It is possible to consider an experimentaldesign that begins with electrospraying a protein using a dilutenonvolatile buffer in addition to our use of 25 mM AA so thatthe dry protein ion carries with it a thin residue of buffer. Thepresence of nonvolatile buffers in electrospray samples cancause an electrospray to be unstable or not work at all, butcareful tuning of the buffer concentration leads to success34−36
and has been used to stabilize proteins. Adding a nonvolatilebuffer will necessitate understanding how much the diameter isshifted by the residue shell so that it can be size-selected.Another approach would be to coat the impactor surface with aresidue of buffer so that the impacted droplets will pick upbuffering capacity when the buffer dissolves in the collection ofdroplets.Many nanoparticles are characterized by broad size
distributions such as the distribution shown in Figure 4 for0.02 μm fluorospheres. Sources of nearly monodispersenanoparticles are needed for calibrating particle sizing instru-ments and high molecular weight samples that have beenseparated by means of gradient gel electrophoresis. Theproduction of small quantities of nearly monodisperse particlestandards37 appears to be attainable with the methods describedin this paper.
■ ASSOCIATED CONTENT*S Supporting InformationAdditional details about the preparation of sample material,performance of the condensation growth tube collector(CGTC), sample analysis, and improvements. This material isavailable free of charge via the Internet at http://pubs.acs.org.
■ AUTHOR INFORMATIONCorresponding Author*E-mail: [email protected].
NotesThe authors declare no competing financial interest.
■ REFERENCES(1) Peng, W.-P.; Goodwin, M. P.; Nie, Z.; Volny, M.; Ouyang, Z.;Cooks, R. G. Anal. Chem. 2008, 80, 6640−6649.(2) Gologan, B.; Green, J. R; Alvarez, J.; Laskin, J.; Cooks, R. G. Phys.Chem. Chem. Phys. 2005, 7, 1490−1500.(3) Volny, M.; Elam, W. T.; Branca, A.; Ratner, B. D.; Turecek, F.Anal. Chem. 2005, 77, 4890−4896.(4) Hadjar, O.; Futrell, J. H.; Laskin, J. J. Phys. Chem. 2007, 111,18220−18225.(5) Rauschenbach, S.; Vogelgesang, R.; Malinowski, N.; Gerlach, J.W.; Benyoucef, M.; Costantini, G.; Deng, Z.; Thontasen, N.; Kern, K.ACS Nano 2009, No. 3, 2901−2910.(6) Benesch, J. L. P.; Ruotolo, B. T.; Simmons, D. A.; Barrera, N. P.;Morgner, N.; Wamg, L.; Saibil, H. R.; Robinson, C. V. J. Struct. Biol.2010, 172, 161−168.
Analytical Chemistry Article
dx.doi.org/10.1021/ac203298w | Anal. Chem. 2012, 84, 2498−25042503

(7) Mayer, P.; Turecek, F.; Lee, H.; Scheidmann, A.; Lney, T.;Schumacher, F.; Strop, P.; Smrcina, M.; Patek, M.; Schirlin, D. Anal.Chem. 2005, 77, 4378−4384.(8) Hanley, L.; Sinnott, S. B. Surf. Sci. 2002, 500, 500−522.(9) Mazzei, F.; Favero, G.; Frasconi, M.; Tata, A.; Tuccitto, N.;Licciardello, A.; Pepe, F. Anal. Chem. 2008, 80, 5937−5944.(10) Hadjar, O.; Wang, P.; Futrell, J. H.; Dessiaterik, Y.; Zhu, Z.;Cowin, J. P.; Iedema, M. J.; Laskin, J. Anal. Chem. 2007, 79, 6566−6574.(11) Nagaoka, S.; Matsumoto, T.; Ikemoto, K.; Mitsui, M.; Nakajima,A. J. Am. Chem. Soc. 2007, 129, 1528−1529.(12) Siuzdak, G.; Bothner, B.; Yeager, M.; Brugidou, C.; Fauquet, C.M.; Hoey, K.; Chang, C. M. Chem. Biol. 1996, 3, 45−48.(13) Allmaier, G.; Laschober, C.; Szymanski, W. W. J. Am. Soc. MassSpectrom. 2008, 19 (8), 1062−1068.(14) Bogan, M. J.; Benner, W. H.; Hau-Riege, S. P.; Chapman, H. N.;Frank, M. J. Aerosol Sci. 2008, 29, 917−928.(15) Franchetti, V.; Solka, B. H.; Baitinger, W. E.; Amy, J. W.; Cooks,R. G. Int. J. Mass Spectrom. Ion Phys. 1977, 23 (1), 29−35.(16) Gologan, B.; Green, J. R.; Alvarez, J.; Laskin, J.; Cooks, R. G.Phys. Chem. Chem. Phys. 2005, 7, 1490−1500.(17) Gologan, B.; Takats, Z.; Alvarez, J.; Wiseman, J. M.; Talaty, N.;Ouyang, Z.; Cooks, R. G. Anal. Chem. 2004, 15, 1874−1884.(18) Badu-Tawiah, A. K.; Wu, C.; Cooks, R. G. Anal. Chem. 2011, 83,2648−2654.(19) Yang, X.; Mayer, P. S.; Turecek, F. J. Mass Spectrom. 2006, 41,256−262.(20) Davila, S. J.; Birdwell, D. O.; Verbeck, G. F. Rev. Sci. Instrum.2010, 81, 3 DOI: 10.1063/1.3361041.(21) Revercomb, H. E.; Mason, E. A. Anal. Chem. 1975, 47, 970−983.(22) Kaufman, S. L.; Skogen, J. W.; Dorman, F. D.; Zarrin, F. Anal.Chem. 1996, 68, 1895−1904.(23) Kaddis, C. S.; Lomeli, S. H.; Yin, S.; Berhane, B.; Apostol, M. I.;Kickhoefer, V. A.; Rome, L. H.; Loo, J. A. J. Am. Soc. Mass Spectrom.2007, 18, 1206−1216.(24) Fuchs, N. A. Geofis. Pura Appl. 1963, 56, 185−193.(25) Bacher, G.; Szymanski, W. W.; Kaufman, S. L.; Zollner, P.; Blass,D.; Allmaier, G. J. Mass Spectrom. 2001, 36, 1038−1052.(26) Kaufman, S. L. J. Aerosol Sci. 1998, 29, 537−552.(27) Hoaglund-Hyzer, C. S.; Counterman, A. E.; Clemmer, D. E.Chem. Rev. 1999, 99, 3037−3079.(28) Jarrold, M. F. Annu. Rev. Phys. Chem. 2000, 51, 179−207.(29) Hering, S. V.; Stolzenburg, M. R. Aerosol Sci. Technol. 2005, 39,428−436.(30) Hering, S. V.; Stolzenburg, M. R.; Quant, F. R.; Oberreit, D. R.;Keady, P. B. Aerosol Sci. Technol. 2005, 39 (7), 659−672.(31) Aerosol Technology, W. C. Hinds, Wiley-Interscience: 1982; p114.(32) TSI, Inc., Model 3986 SMPS Operator’s manual.(33) Lu, Z.; Shaikh, T. R.; Barnard, D.; Meng, X.; Mohamed, H.;Yasin, A.; Mannella, C. A.; Agrawal, R. K.; Lu, T.-M.; Wagenknecht, T.J. Struct. Biol. 2009, 168, 388−395.(34) Chen, C. H.; Emond, M. H. J.; Kelder, E. M.; Meester, B.;Schoonman, J. J. Aerosol Sci. 1999, 30 (7), 959−967.(35) Widiyandari, H.; Hogan, C. J.; Yun, K. M.; Iskandar, F.; Biswas,P.; Okuyama, K. Macromol. Mater. Eng. 2007, 292 (4), 495−502.(36) Freeke, J.; Robinson, C. V.; Ruotolo, B. T. Int. J. Mass Spectrom.2010, 298, 91−98.(37) Ude, S.; de la Mora, J. F.; Alexander, J. N. IV; Saucy, D. A. J.Colloid Interface Sci. 2006, 293, 384−393.
Analytical Chemistry Article
dx.doi.org/10.1021/ac203298w | Anal. Chem. 2012, 84, 2498−25042504