Embed Size (px)
Citation preview
Submitted to Software: Practice and Experience 2002-10-08
Re-architecting a data analysis system to enable pluggable tools and data
J. Scott Hawker1, Keith E. Massey2, and S. Michael Davis3 1Department of Computer Science, University of Alabama, Box 870290, Tuscaloosa, AL, 35487-0290, U.S.A. email: [email protected] phone: +1 205 348 1667 fax: +1 205 348 0219 2Lockheed-Martin Mission Systems, Santa Maria, CA U.S.A 3Department of Computer Science, University of Alabama, Box 870290, Tuscaloosa, AL, 35487-0290, U.S.A. ____________________________________________________________________________________ SUMMARY Formal architectural analysis and re-engineering have allowed us to identify deficiencies in the architecture of an existing system and to remove those deficiencies in a re-architected system. The system is used for data analysis and visualization of very large data sets. The initial architecture made it very difficult to incorporate new analysis and visualization techniques and apply the techniques to new problem domains. A formal architectural analysis helped us identify the deficiencies in the old architecture. Incorporating techniques of component-based architectures built on frameworks of abstract interfaces and component registries, we engineered a new architecture that removed the deficiencies in the old. We are now implementing the new architecture, and our initial results confirm our analysis results: the new architecture is more modifiable and distributable than the old, and it promises improved performance by parallel execution of computation components. KEY WORDS: component, re-engineering, framework, data analysis, data visualization
BACKGROUND
Component-based integration frameworks provide a powerful architecture style for flexible, evolvable, distributable software systems [1-4]. This paper describes the re-engineering of an architecture for a data analysis system and the implementation of that new architecture. The initial system architecture is a monolithic, single-process system with a fixed suite of data analysis tools and fixed data types. We re-architected the system to use plug-in components for new analysis tools, new data types, and new data visualizations. The new architecture also enables distributed, web-based deployment and execution. The data analysis system is CARE (Critical Analysis Reporting Environment) [5].
CARE system
CARE is a software tool suite that helps traffic safety analysts to analyze large amounts of data quickly and in a way that is easy for non-technical people to understand. Analysts select and filter the data they wish to analyze and then apply calculations to the data and investigate the results through various graphical and textual views. CARE is designed for quick response, allowing interactive analysis, such as, data exploration and drill-down, comparison of datasets, and comparison of alternate analysis results.
The CARE system has changed over the past 25 years to include new analysis and graphical representation techniques and to leverage new computing technologies. It has evolved from a mainframe-based system in the 1970s to a CP/M microcomputer-based system in the 1980s, a Microsoft Windows-based system in the 1990s, and most recently a web-based system. The data analysis techniques have evolved from typical statistical analysis to now include advanced information mining techniques [6-8]. We are now applying CARE to new analysis domains beyond traffic safety, such as analysis of aircraft incidents, telephone survey results, retail sales patterns, and census data. However, CARE’s current architecture limits its evolution.
− It is difficult to add new data selection, analysis, and visualization techniques. − CARE only analyzes discrete “count” data corresponding to the number of occurrences of an event (a two-car
accident on Highway 54, a “yes” response to a survey question, etc.), limiting analysis techniques to those dealing with the relative frequency of occurrence of events.
− Incorporating new domain data requires programmer interaction to map the source data into CARE internal structures.
J.S. Hawker, K.E. Massey, and S.M. Davis Re-architecting a data analysis system to enable pluggable tools and data 2 ________________________________________________________________________________________________________
Submitted to Software: Practice and Experience 2002-10-08
− The monolithic program structure makes it difficult to modify, extend, and distribute CARE functionality. − The code is not modular, it is not well organized, it is not well commented, and it is very difficult to read and
understand.
Current CARE architecture
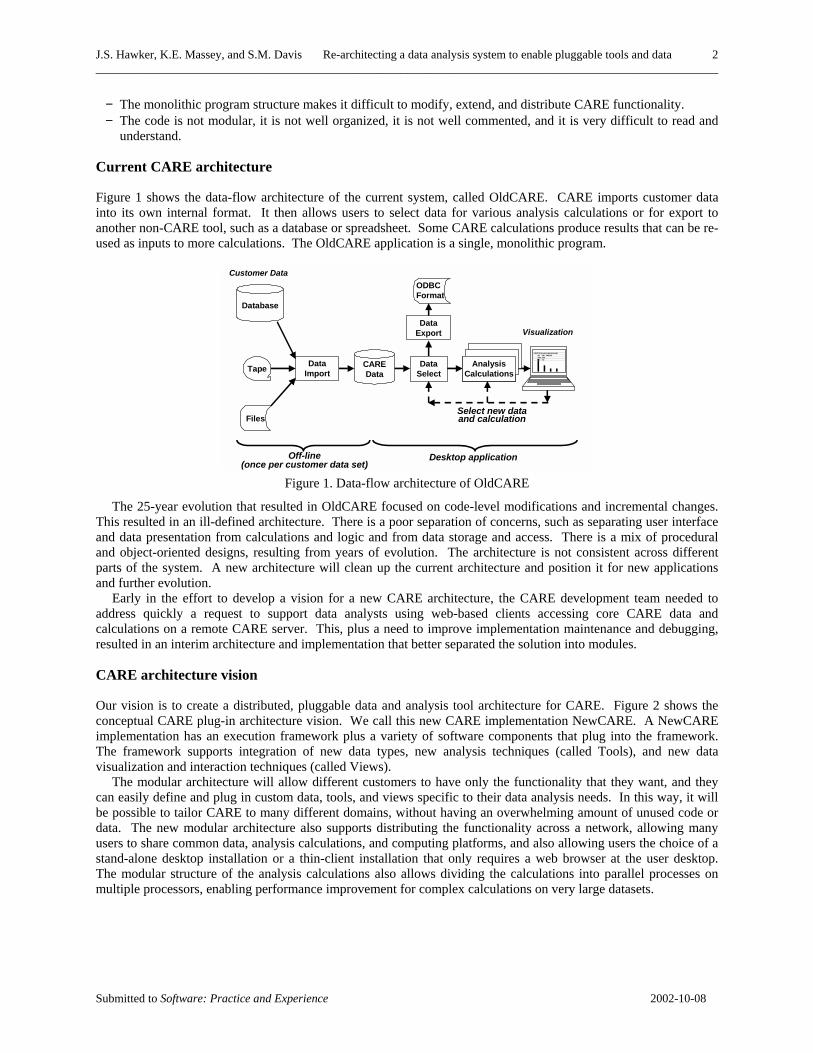
Figure 1 shows the data-flow architecture of the current system, called OldCARE. CARE imports customer data into its own internal format. It then allows users to select data for various analysis calculations or for export to another non-CARE tool, such as a database or spreadsheet. Some CARE calculations produce results that can be re-used as inputs to more calculations. The OldCARE application is a single, monolithic program.
Database
CAREDataTape
Files
Customer Data
DataSelect
Info-MiningCalculations
Data Import
CATEGORY KEY (one row for each category within the variable)Input Output Category LabelVariable VariableValue Value
Data Export
ODBC Format
AnalysisCalculations
Off-line(once per customer data set)
Select new data and calculation
Visualization
Desktop application
Figure 1. Data-flow architecture of OldCARE
The 25-year evolution that resulted in OldCARE focused on code-level modifications and incremental changes. This resulted in an ill-defined architecture. There is a poor separation of concerns, such as separating user interface and data presentation from calculations and logic and from data storage and access. There is a mix of procedural and object-oriented designs, resulting from years of evolution. The architecture is not consistent across different parts of the system. A new architecture will clean up the current architecture and position it for new applications and further evolution.
Early in the effort to develop a vision for a new CARE architecture, the CARE development team needed to address quickly a request to support data analysts using web-based clients accessing core CARE data and calculations on a remote CARE server. This, plus a need to improve implementation maintenance and debugging, resulted in an interim architecture and implementation that better separated the solution into modules.
CARE architecture vision
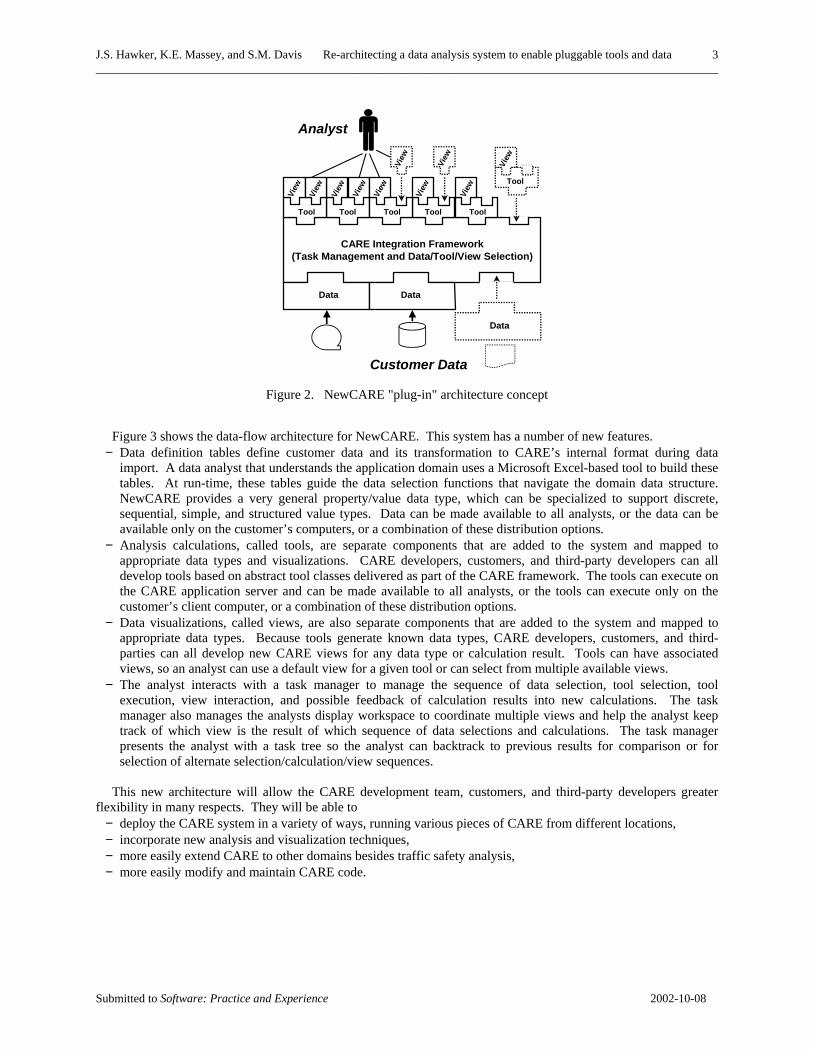
Our vision is to create a distributed, pluggable data and analysis tool architecture for CARE. Figure 2 shows the conceptual CARE plug-in architecture vision. We call this new CARE implementation NewCARE. A NewCARE implementation has an execution framework plus a variety of software components that plug into the framework. The framework supports integration of new data types, new analysis techniques (called Tools), and new data visualization and interaction techniques (called Views).
The modular architecture will allow different customers to have only the functionality that they want, and they can easily define and plug in custom data, tools, and views specific to their data analysis needs. In this way, it will be possible to tailor CARE to many different domains, without having an overwhelming amount of unused code or data. The new modular architecture also supports distributing the functionality across a network, allowing many users to share common data, analysis calculations, and computing platforms, and also allowing users the choice of a stand-alone desktop installation or a thin-client installation that only requires a web browser at the user desktop. The modular structure of the analysis calculations also allows dividing the calculations into parallel processes on multiple processors, enabling performance improvement for complex calculations on very large datasets.
J.S. Hawker, K.E. Massey, and S.M. Davis Re-architecting a data analysis system to enable pluggable tools and data 3 ________________________________________________________________________________________________________
Submitted to Software: Practice and Experience 2002-10-08
CARE Integration Framework(Task Management and Data/Tool/View Selection)
Data
View
View
View
View
View
View
View
View
Customer Data
Tool Tool Tool Tool Tool
Tool
View
View
Data
Data
Analyst
Figure 2. NewCARE "plug-in" architecture concept
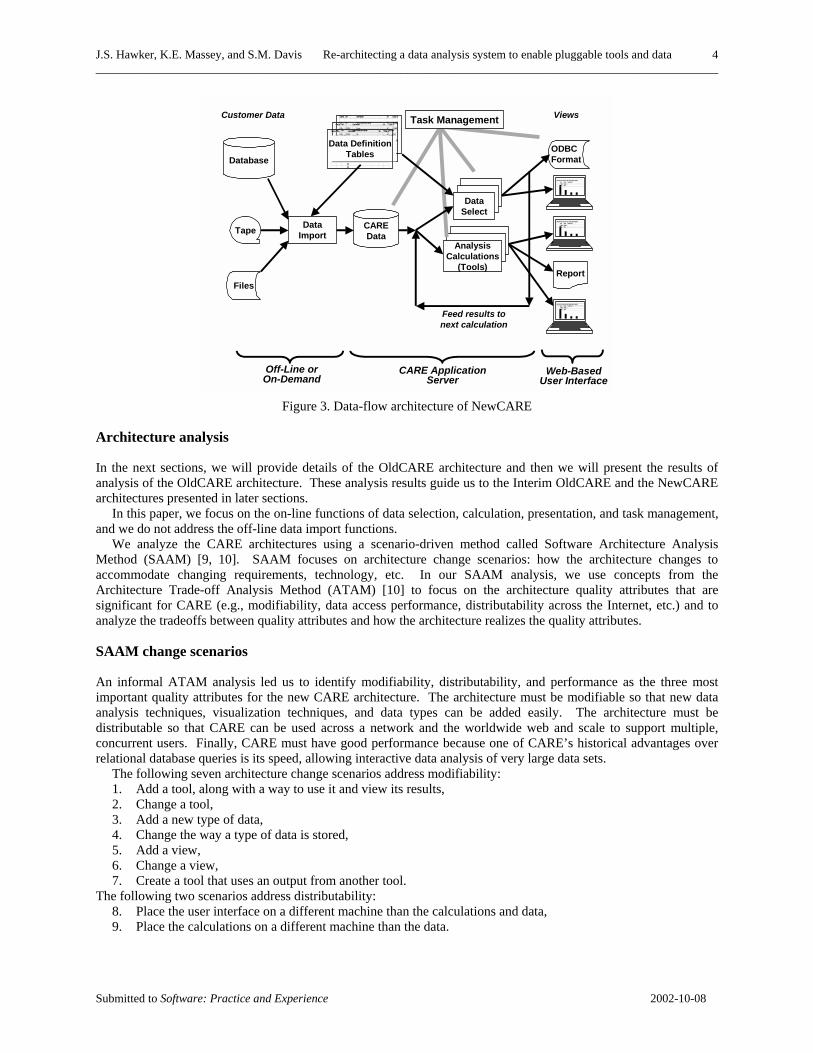
Figure 3 shows the data-flow architecture for NewCARE. This system has a number of new features.
− Data definition tables define customer data and its transformation to CARE’s internal format during data import. A data analyst that understands the application domain uses a Microsoft Excel-based tool to build these tables. At run-time, these tables guide the data selection functions that navigate the domain data structure. NewCARE provides a very general property/value data type, which can be specialized to support discrete, sequential, simple, and structured value types. Data can be made available to all analysts, or the data can be available only on the customer’s computers, or a combination of these distribution options.
− Analysis calculations, called tools, are separate components that are added to the system and mapped to appropriate data types and visualizations. CARE developers, customers, and third-party developers can all develop tools based on abstract tool classes delivered as part of the CARE framework. The tools can execute on the CARE application server and can be made available to all analysts, or the tools can execute only on the customer’s client computer, or a combination of these distribution options.
− Data visualizations, called views, are also separate components that are added to the system and mapped to appropriate data types. Because tools generate known data types, CARE developers, customers, and third-parties can all develop new CARE views for any data type or calculation result. Tools can have associated views, so an analyst can use a default view for a given tool or can select from multiple available views.
− The analyst interacts with a task manager to manage the sequence of data selection, tool selection, tool execution, view interaction, and possible feedback of calculation results into new calculations. The task manager also manages the analysts display workspace to coordinate multiple views and help the analyst keep track of which view is the result of which sequence of data selections and calculations. The task manager presents the analyst with a task tree so the analyst can backtrack to previous results for comparison or for selection of alternate selection/calculation/view sequences.
This new architecture will allow the CARE development team, customers, and third-party developers greater
flexibility in many respects. They will be able to − deploy the CARE system in a variety of ways, running various pieces of CARE from different locations, − incorporate new analysis and visualization techniques, − more easily extend CARE to other domains besides traffic safety analysis, − more easily modify and maintain CARE code.
J.S. Hawker, K.E. Massey, and S.M. Davis Re-architecting a data analysis system to enable pluggable tools and data 4 ________________________________________________________________________________________________________
Submitted to Software: Practice and Experience 2002-10-08
CaseNo DM Case Number VE CASE_YEA
VIN DM Vehicle Identification Number VE VIN_NUMB
U001 CC-C001 County AC COUNTY_
U002 CC-C002 City AC CITY_I
U003 DMT Unit Number VE VEH_UNIT_11223344
CaseNo DM Case Number VE CASE_YEA
VIN DM Vehicle Identification Number VE VIN_NUMB
U001 CC-C001 County AC COUNTY_I
U002 CC-C002 City AC CITY_I
U003 DMT Unit Number VE VEH_UNIT_11223344Database
CAREDataTape
Files
Customer DataCaseNo DM Case Number VE CASE_YEA
VIN DM Vehicle Identification Number VE VIN_NUMB
U001 CC-C001 County AC COUNTY_I
U002 CC-C002 City AC CITY_I
U003 DMT Unit Number VE VEH_UNIT_11223344
Data Definition Tables
Data Import
CATEGORY KEY (one row for each category within the variable)Input Output Category LabelVariable VariableValue Value
ODBC Format
DataSelect
AnalysisCalculations
(Tools)
CATEGORY KEY (one row for each category within the variable)Input Output Category LabelVariable VariableValue Value
Report
CATEGORY KEY (one row for each category within the variable)Input Output Category LabelVariable VariableValue Value
Task Management
Off-Line or On-Demand
CARE Application Server
Web-Based User Interface
Feed results to next calculation
Views
Figure 3. Data-flow architecture of NewCARE
Architecture analysis
In the next sections, we will provide details of the OldCARE architecture and then we will present the results of analysis of the OldCARE architecture. These analysis results guide us to the Interim OldCARE and the NewCARE architectures presented in later sections.
In this paper, we focus on the on-line functions of data selection, calculation, presentation, and task management, and we do not address the off-line data import functions.
We analyze the CARE architectures using a scenario-driven method called Software Architecture Analysis Method (SAAM) [9, 10]. SAAM focuses on architecture change scenarios: how the architecture changes to accommodate changing requirements, technology, etc. In our SAAM analysis, we use concepts from the Architecture Trade-off Analysis Method (ATAM) [10] to focus on the architecture quality attributes that are significant for CARE (e.g., modifiability, data access performance, distributability across the Internet, etc.) and to analyze the tradeoffs between quality attributes and how the architecture realizes the quality attributes.
SAAM change scenarios
An informal ATAM analysis led us to identify modifiability, distributability, and performance as the three most important quality attributes for the new CARE architecture. The architecture must be modifiable so that new data analysis techniques, visualization techniques, and data types can be added easily. The architecture must be distributable so that CARE can be used across a network and the worldwide web and scale to support multiple, concurrent users. Finally, CARE must have good performance because one of CARE’s historical advantages over relational database queries is its speed, allowing interactive data analysis of very large data sets.
The following seven architecture change scenarios address modifiability: 1. Add a tool, along with a way to use it and view its results, 2. Change a tool, 3. Add a new type of data, 4. Change the way a type of data is stored, 5. Add a view, 6. Change a view, 7. Create a tool that uses an output from another tool.
The following two scenarios address distributability: 8. Place the user interface on a different machine than the calculations and data, 9. Place the calculations on a different machine than the data.
J.S. Hawker, K.E. Massey, and S.M. Davis Re-architecting a data analysis system to enable pluggable tools and data 5 ________________________________________________________________________________________________________
Submitted to Software: Practice and Experience 2002-10-08
It is difficult to measure performance using SAAM scenarios. CARE’s speed is due mostly to its efficient data storage and access. The new architecture preserves these performance approaches and enables parallel execution of calculations to enhance performance. NewCARE’s distribution architecture will allow tools and data to be placed on the same computer, removing network delays in data access.
The SAAM analysis will identify the scope of architecture change needed to accommodate system modification and distribution. A good architecture will require small, localized changes instead of large, pervasive changes. In our analysis, we count the number of components affected by a change, and we count the number of change scenarios that affect a given component. Ideally, we want an architecture that directly supports a change, that is, the architecture was designed to accommodate that change. Lacking direct support for change, we want the number of components affected by a change to be a small portion of all the system components, and we want each component to be affected by few change scenarios. These metrics provide an assessment of the cohesion and coupling of system components and the separation of concerns between components. These SAAM analyses will point out problems in an existing or candidate architecture and point towards ways in which the architecture might be improved.
OldCARE ARCHITECTURE
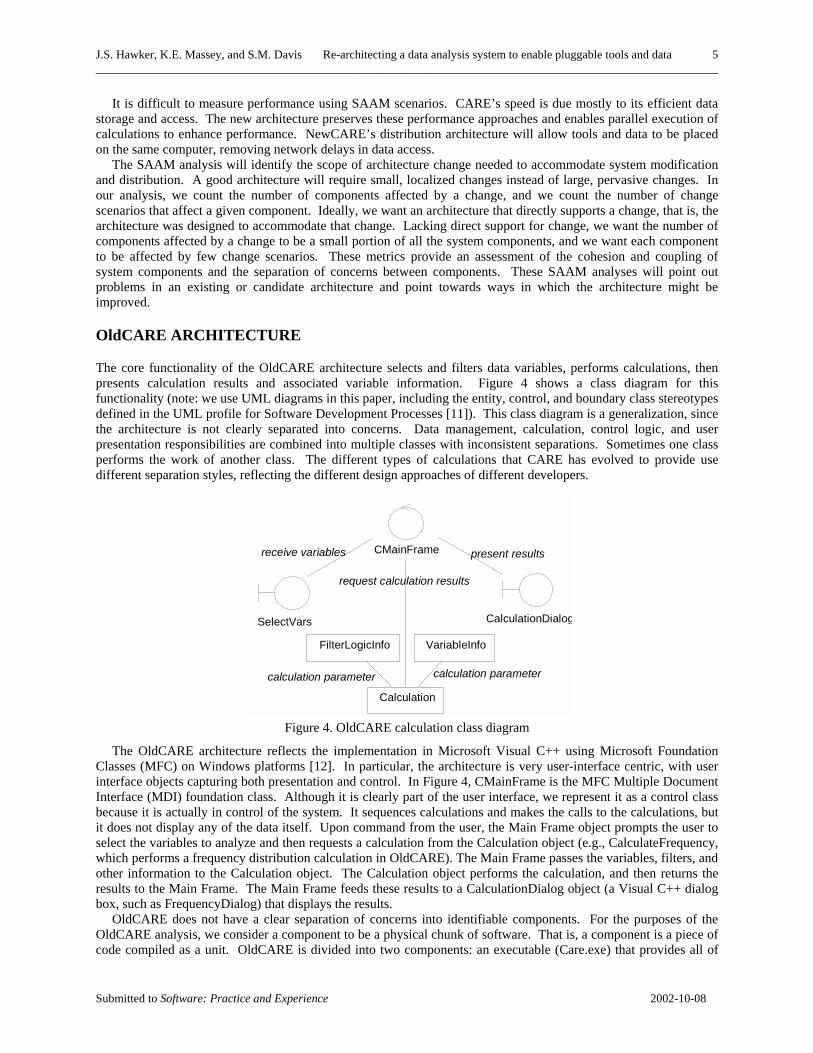
The core functionality of the OldCARE architecture selects and filters data variables, performs calculations, then presents calculation results and associated variable information. Figure 4 shows a class diagram for this functionality (note: we use UML diagrams in this paper, including the entity, control, and boundary class stereotypes defined in the UML profile for Software Development Processes [11]). This class diagram is a generalization, since the architecture is not clearly separated into concerns. Data management, calculation, control logic, and user presentation responsibilities are combined into multiple classes with inconsistent separations. Sometimes one class performs the work of another class. The different types of calculations that CARE has evolved to provide use different separation styles, reflecting the different design approaches of different developers.
SelectVars CalculationDialog
CMainFrame
FilterLogicInfo
Calculation
VariableInfo
receive variables present results
request calculation results
calculation parametercalculation parameter
Figure 4. OldCARE calculation class diagram
The OldCARE architecture reflects the implementation in Microsoft Visual C++ using Microsoft Foundation Classes (MFC) on Windows platforms [12]. In particular, the architecture is very user-interface centric, with user interface objects capturing both presentation and control. In Figure 4, CMainFrame is the MFC Multiple Document Interface (MDI) foundation class. Although it is clearly part of the user interface, we represent it as a control class because it is actually in control of the system. It sequences calculations and makes the calls to the calculations, but it does not display any of the data itself. Upon command from the user, the Main Frame object prompts the user to select the variables to analyze and then requests a calculation from the Calculation object (e.g., CalculateFrequency, which performs a frequency distribution calculation in OldCARE). The Main Frame passes the variables, filters, and other information to the Calculation object. The Calculation object performs the calculation, and then returns the results to the Main Frame. The Main Frame feeds these results to a CalculationDialog object (a Visual C++ dialog box, such as FrequencyDialog) that displays the results.
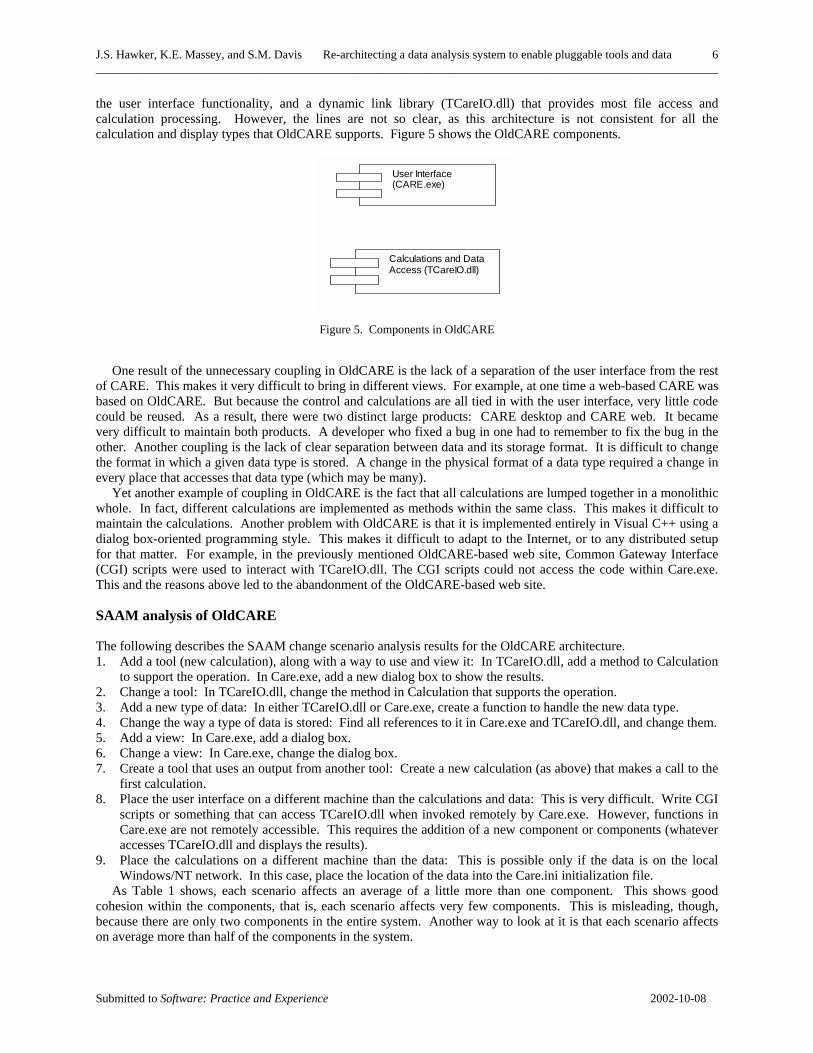
OldCARE does not have a clear separation of concerns into identifiable components. For the purposes of the OldCARE analysis, we consider a component to be a physical chunk of software. That is, a component is a piece of code compiled as a unit. OldCARE is divided into two components: an executable (Care.exe) that provides all of
J.S. Hawker, K.E. Massey, and S.M. Davis Re-architecting a data analysis system to enable pluggable tools and data 6 ________________________________________________________________________________________________________
Submitted to Software: Practice and Experience 2002-10-08
the user interface functionality, and a dynamic link library (TCareIO.dll) that provides most file access and calculation processing. However, the lines are not so clear, as this architecture is not consistent for all the calculation and display types that OldCARE supports. Figure 5 shows the OldCARE components.
User Interface (CARE.exe)
Calculations and Data Access (TCareIO.dll)
Figure 5. Components in OldCARE
One result of the unnecessary coupling in OldCARE is the lack of a separation of the user interface from the rest
of CARE. This makes it very difficult to bring in different views. For example, at one time a web-based CARE was based on OldCARE. But because the control and calculations are all tied in with the user interface, very little code could be reused. As a result, there were two distinct large products: CARE desktop and CARE web. It became very difficult to maintain both products. A developer who fixed a bug in one had to remember to fix the bug in the other. Another coupling is the lack of clear separation between data and its storage format. It is difficult to change the format in which a given data type is stored. A change in the physical format of a data type required a change in every place that accesses that data type (which may be many).
Yet another example of coupling in OldCARE is the fact that all calculations are lumped together in a monolithic whole. In fact, different calculations are implemented as methods within the same class. This makes it difficult to maintain the calculations. Another problem with OldCARE is that it is implemented entirely in Visual C++ using a dialog box-oriented programming style. This makes it difficult to adapt to the Internet, or to any distributed setup for that matter. For example, in the previously mentioned OldCARE-based web site, Common Gateway Interface (CGI) scripts were used to interact with TCareIO.dll. The CGI scripts could not access the code within Care.exe. This and the reasons above led to the abandonment of the OldCARE-based web site.
SAAM analysis of OldCARE
The following describes the SAAM change scenario analysis results for the OldCARE architecture. 1. Add a tool (new calculation), along with a way to use and view it: In TCareIO.dll, add a method to Calculation
to support the operation. In Care.exe, add a new dialog box to show the results. 2. Change a tool: In TCareIO.dll, change the method in Calculation that supports the operation. 3. Add a new type of data: In either TCareIO.dll or Care.exe, create a function to handle the new data type. 4. Change the way a type of data is stored: Find all references to it in Care.exe and TCareIO.dll, and change them. 5. Add a view: In Care.exe, add a dialog box. 6. Change a view: In Care.exe, change the dialog box. 7. Create a tool that uses an output from another tool: Create a new calculation (as above) that makes a call to the
first calculation. 8. Place the user interface on a different machine than the calculations and data: This is very difficult. Write CGI
scripts or something that can access TCareIO.dll when invoked remotely by Care.exe. However, functions in Care.exe are not remotely accessible. This requires the addition of a new component or components (whatever accesses TCareIO.dll and displays the results).
9. Place the calculations on a different machine than the data: This is possible only if the data is on the local Windows/NT network. In this case, place the location of the data into the Care.ini initialization file.
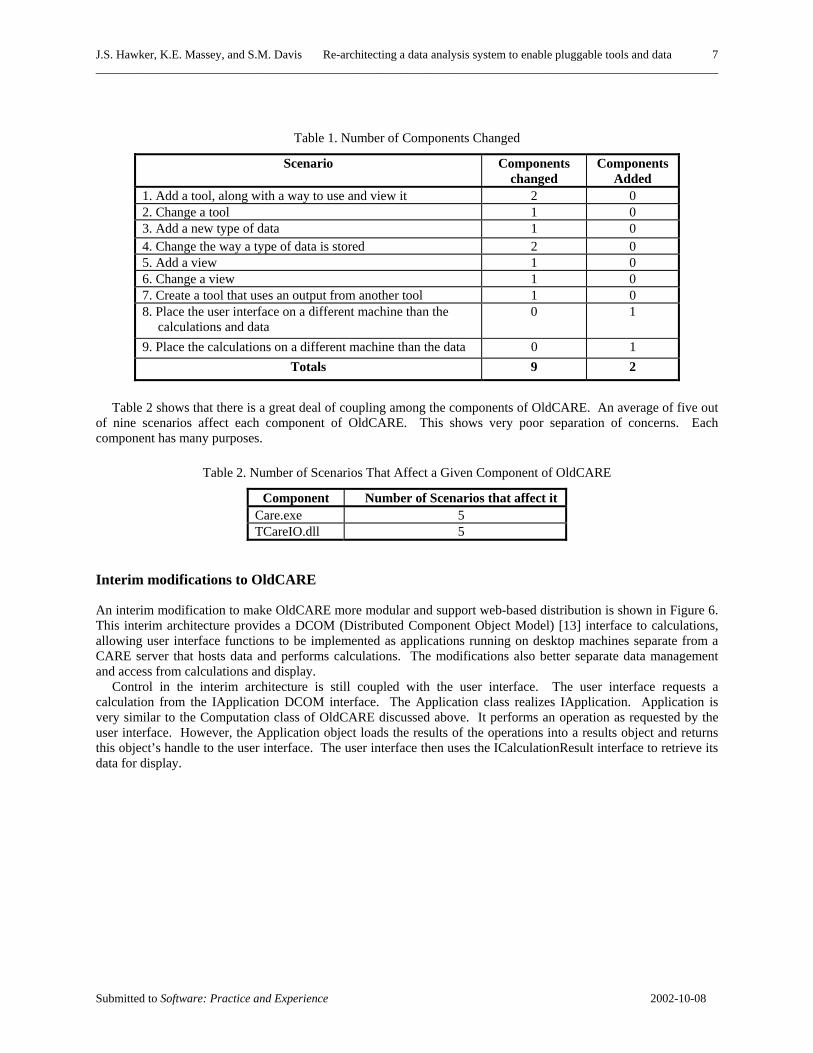
As Table 1 shows, each scenario affects an average of a little more than one component. This shows good cohesion within the components, that is, each scenario affects very few components. This is misleading, though, because there are only two components in the entire system. Another way to look at it is that each scenario affects on average more than half of the components in the system.
J.S. Hawker, K.E. Massey, and S.M. Davis Re-architecting a data analysis system to enable pluggable tools and data 7 ________________________________________________________________________________________________________
Submitted to Software: Practice and Experience 2002-10-08
Table 1. Number of Components Changed
Scenario Components changed
Components Added
1. Add a tool, along with a way to use and view it 2 0 2. Change a tool 1 0 3. Add a new type of data 1 0 4. Change the way a type of data is stored 2 0 5. Add a view 1 0 6. Change a view 1 0 7. Create a tool that uses an output from another tool 1 0 8. Place the user interface on a different machine than the
calculations and data 0 1
9. Place the calculations on a different machine than the data 0 1 Totals 9 2
Table 2 shows that there is a great deal of coupling among the components of OldCARE. An average of five out
of nine scenarios affect each component of OldCARE. This shows very poor separation of concerns. Each component has many purposes.
Table 2. Number of Scenarios That Affect a Given Component of OldCARE
Component Number of Scenarios that affect it Care.exe 5 TCareIO.dll 5
Interim modifications to OldCARE
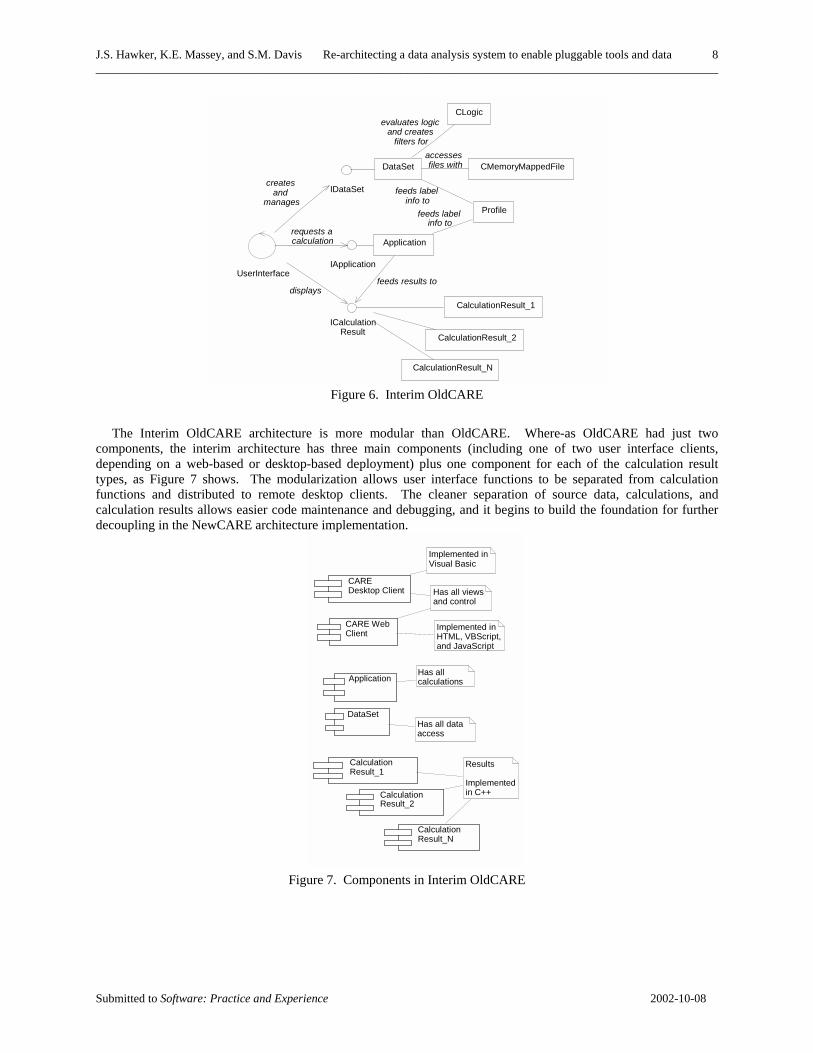
An interim modification to make OldCARE more modular and support web-based distribution is shown in Figure 6. This interim architecture provides a DCOM (Distributed Component Object Model) [13] interface to calculations, allowing user interface functions to be implemented as applications running on desktop machines separate from a CARE server that hosts data and performs calculations. The modifications also better separate data management and access from calculations and display.
Control in the interim architecture is still coupled with the user interface. The user interface requests a calculation from the IApplication DCOM interface. The Application class realizes IApplication. Application is very similar to the Computation class of OldCARE discussed above. It performs an operation as requested by the user interface. However, the Application object loads the results of the operations into a results object and returns this object’s handle to the user interface. The user interface then uses the ICalculationResult interface to retrieve its data for display.
J.S. Hawker, K.E. Massey, and S.M. Davis Re-architecting a data analysis system to enable pluggable tools and data 8 ________________________________________________________________________________________________________
Submitted to Software: Practice and Experience 2002-10-08
CLogic
CMemoryMappedFile
Profile
CalculationResult_1
Application
feeds label info to
DataSet
evaluates logic and creates
filters foraccesses files with
feeds label info to
IApplication
ICalculationResult
feeds results to
IDataSet
UserInterface
requests a calculation
displays
creates and
manages
CalculationResult_2
CalculationResult_N
Figure 6. Interim OldCARE
The Interim OldCARE architecture is more modular than OldCARE. Where-as OldCARE had just two
components, the interim architecture has three main components (including one of two user interface clients, depending on a web-based or desktop-based deployment) plus one component for each of the calculation result types, as Figure 7 shows. The modularization allows user interface functions to be separated from calculation functions and distributed to remote desktop clients. The cleaner separation of source data, calculations, and calculation results allows easier code maintenance and debugging, and it begins to build the foundation for further decoupling in the NewCARE architecture implementation.
CARE Desktop Client Has all views
and control
Implemented in Visual Basic
CARE Web Client
Implemented in HTML, VBScript, and JavaScript
Has all calculations
Calculation Result_1
DataSet
Application
Has all data access
Results
Implemented in C++Calculation
Result_2
Calculation Result_N
Figure 7. Components in Interim OldCARE
J.S. Hawker, K.E. Massey, and S.M. Davis Re-architecting a data analysis system to enable pluggable tools and data 9 ________________________________________________________________________________________________________
Submitted to Software: Practice and Experience 2002-10-08
SAAM analysis of Interim OldCARE
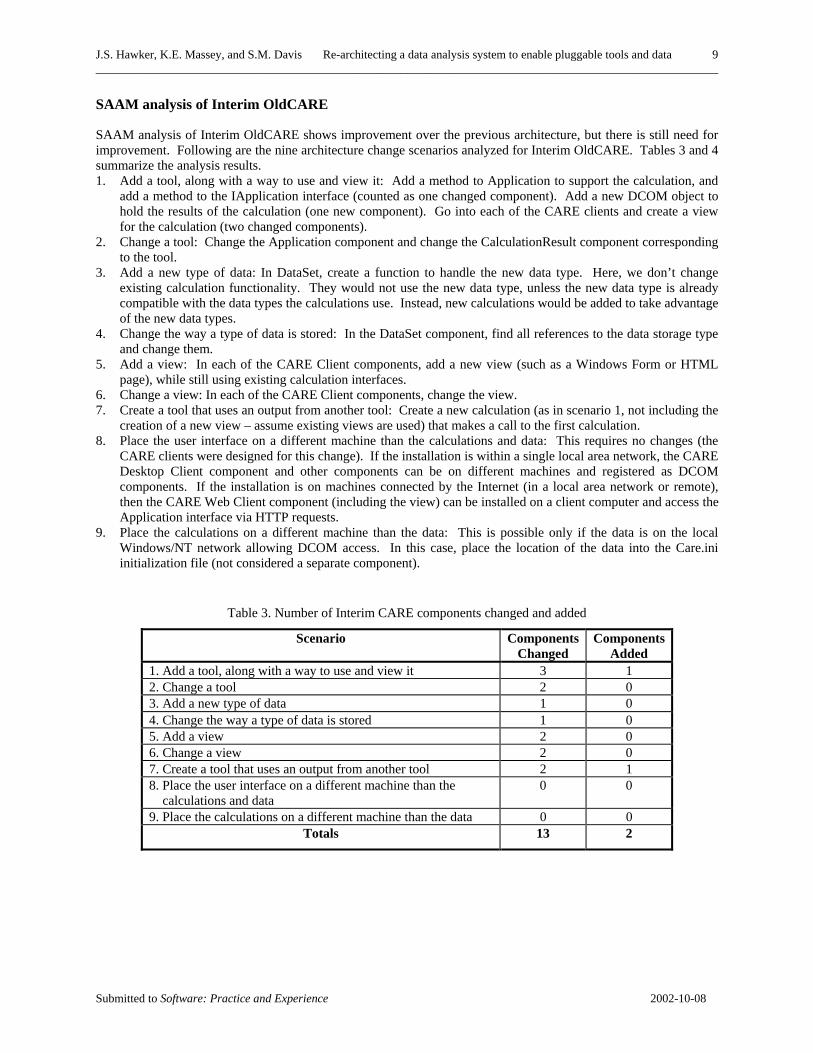
SAAM analysis of Interim OldCARE shows improvement over the previous architecture, but there is still need for improvement. Following are the nine architecture change scenarios analyzed for Interim OldCARE. Tables 3 and 4 summarize the analysis results. 1. Add a tool, along with a way to use and view it: Add a method to Application to support the calculation, and
add a method to the IApplication interface (counted as one changed component). Add a new DCOM object to hold the results of the calculation (one new component). Go into each of the CARE clients and create a view for the calculation (two changed components).
2. Change a tool: Change the Application component and change the CalculationResult component corresponding to the tool.
3. Add a new type of data: In DataSet, create a function to handle the new data type. Here, we don’t change existing calculation functionality. They would not use the new data type, unless the new data type is already compatible with the data types the calculations use. Instead, new calculations would be added to take advantage of the new data types.
4. Change the way a type of data is stored: In the DataSet component, find all references to the data storage type and change them.
5. Add a view: In each of the CARE Client components, add a new view (such as a Windows Form or HTML page), while still using existing calculation interfaces.
6. Change a view: In each of the CARE Client components, change the view. 7. Create a tool that uses an output from another tool: Create a new calculation (as in scenario 1, not including the
creation of a new view – assume existing views are used) that makes a call to the first calculation. 8. Place the user interface on a different machine than the calculations and data: This requires no changes (the
CARE clients were designed for this change). If the installation is within a single local area network, the CARE Desktop Client component and other components can be on different machines and registered as DCOM components. If the installation is on machines connected by the Internet (in a local area network or remote), then the CARE Web Client component (including the view) can be installed on a client computer and access the Application interface via HTTP requests.
9. Place the calculations on a different machine than the data: This is possible only if the data is on the local Windows/NT network allowing DCOM access. In this case, place the location of the data into the Care.ini initialization file (not considered a separate component).
Table 3. Number of Interim CARE components changed and added
Scenario Components Changed
Components Added
1. Add a tool, along with a way to use and view it 3 1 2. Change a tool 2 0 3. Add a new type of data 1 0 4. Change the way a type of data is stored 1 0 5. Add a view 2 0 6. Change a view 2 0 7. Create a tool that uses an output from another tool 2 1 8. Place the user interface on a different machine than the calculations and data
0 0
9. Place the calculations on a different machine than the data 0 0 Totals 13 2
J.S. Hawker, K.E. Massey, and S.M. Davis Re-architecting a data analysis system to enable pluggable tools and data 10 ________________________________________________________________________________________________________
Submitted to Software: Practice and Experience 2002-10-08
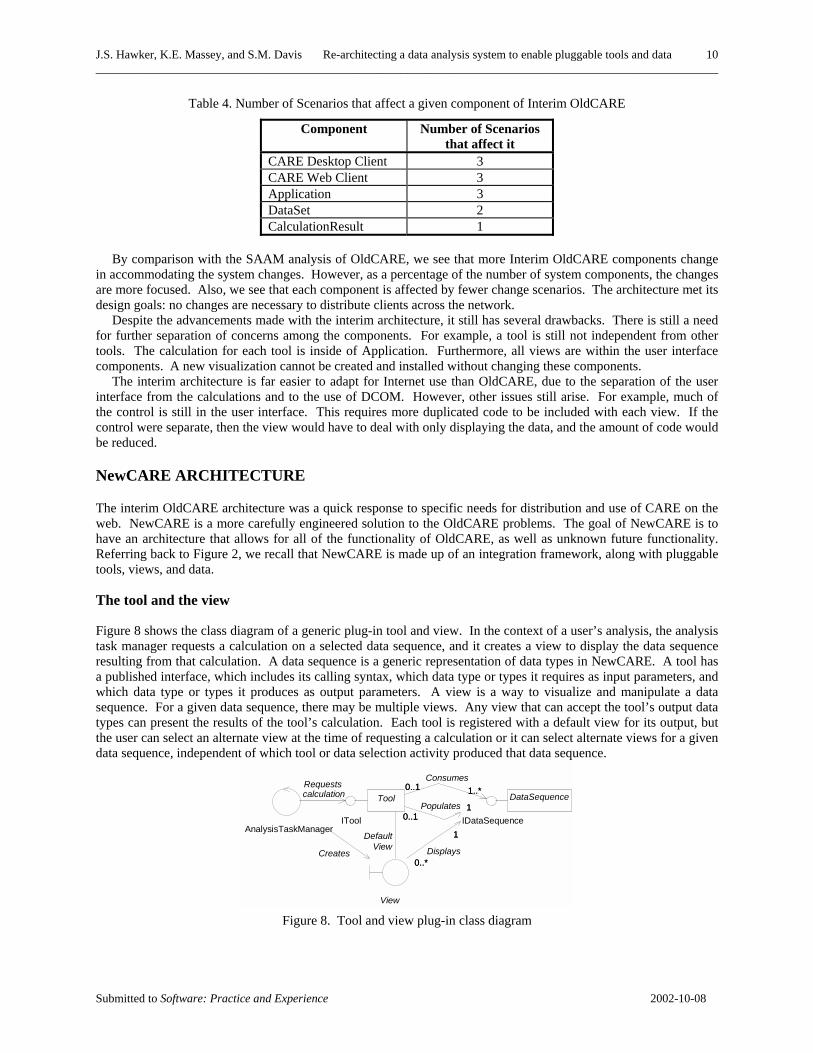
Table 4. Number of Scenarios that affect a given component of Interim OldCARE
Component Number of Scenarios that affect it
CARE Desktop Client 3 CARE Web Client 3 Application 3 DataSet 2 CalculationResult 1
By comparison with the SAAM analysis of OldCARE, we see that more Interim OldCARE components change
in accommodating the system changes. However, as a percentage of the number of system components, the changes are more focused. Also, we see that each component is affected by fewer change scenarios. The architecture met its design goals: no changes are necessary to distribute clients across the network.
Despite the advancements made with the interim architecture, it still has several drawbacks. There is still a need for further separation of concerns among the components. For example, a tool is still not independent from other tools. The calculation for each tool is inside of Application. Furthermore, all views are within the user interface components. A new visualization cannot be created and installed without changing these components.
The interim architecture is far easier to adapt for Internet use than OldCARE, due to the separation of the user interface from the calculations and to the use of DCOM. However, other issues still arise. For example, much of the control is still in the user interface. This requires more duplicated code to be included with each view. If the control were separate, then the view would have to deal with only displaying the data, and the amount of code would be reduced.
NewCARE ARCHITECTURE
The interim OldCARE architecture was a quick response to specific needs for distribution and use of CARE on the web. NewCARE is a more carefully engineered solution to the OldCARE problems. The goal of NewCARE is to have an architecture that allows for all of the functionality of OldCARE, as well as unknown future functionality. Referring back to Figure 2, we recall that NewCARE is made up of an integration framework, along with pluggable tools, views, and data.
The tool and the view
Figure 8 shows the class diagram of a generic plug-in tool and view. In the context of a user’s analysis, the analysis task manager requests a calculation on a selected data sequence, and it creates a view to display the data sequence resulting from that calculation. A data sequence is a generic representation of data types in NewCARE. A tool has a published interface, which includes its calling syntax, which data type or types it requires as input parameters, and which data type or types it produces as output parameters. A view is a way to visualize and manipulate a data sequence. For a given data sequence, there may be multiple views. Any view that can accept the tool’s output data types can present the results of the tool’s calculation. Each tool is registered with a default view for its output, but the user can select an alternate view at the time of requesting a calculation or it can select alternate views for a given data sequence, independent of which tool or data selection activity produced that data sequence.
AnalysisTaskManager
DataSequence
View
Creates
ITool
Requests calculation
IDataSequence1
0..*Displays
Tool1..*0..1 1..*0..1
Consumes
10..1
10..1
Populates
1
0..*
DefaultView
Figure 8. Tool and view plug-in class diagram
J.S. Hawker, K.E. Massey, and S.M. Davis Re-architecting a data analysis system to enable pluggable tools and data 11 ________________________________________________________________________________________________________
Submitted to Software: Practice and Experience 2002-10-08
The output of a tool is a data type in its own right. That is, the output results have a published interface separate from the tool interface, and the output may be an input to any other tool. This is significant for two reasons. First, it allows calculations to use the outputs of previous calculations. Second, it allows for data selection and filtering to behave as any other tool (i.e., it produces a DataSequence), which greatly simplifies the design of NewCARE. The management of the data is discussed below.
Data sequences, data sources, and data selection
The basic data type in NewCARE is the DataSequence. A DataSequence is a property list. A property list is a way of representing data so that data can be read from and added to the list without knowing anything about the internal representation of the data. This allows for defining new types of data without changing anything except the new data itself. It allows for defining a great variety of structures as DataSequences. This also allows for easier changes in the way data are stored.
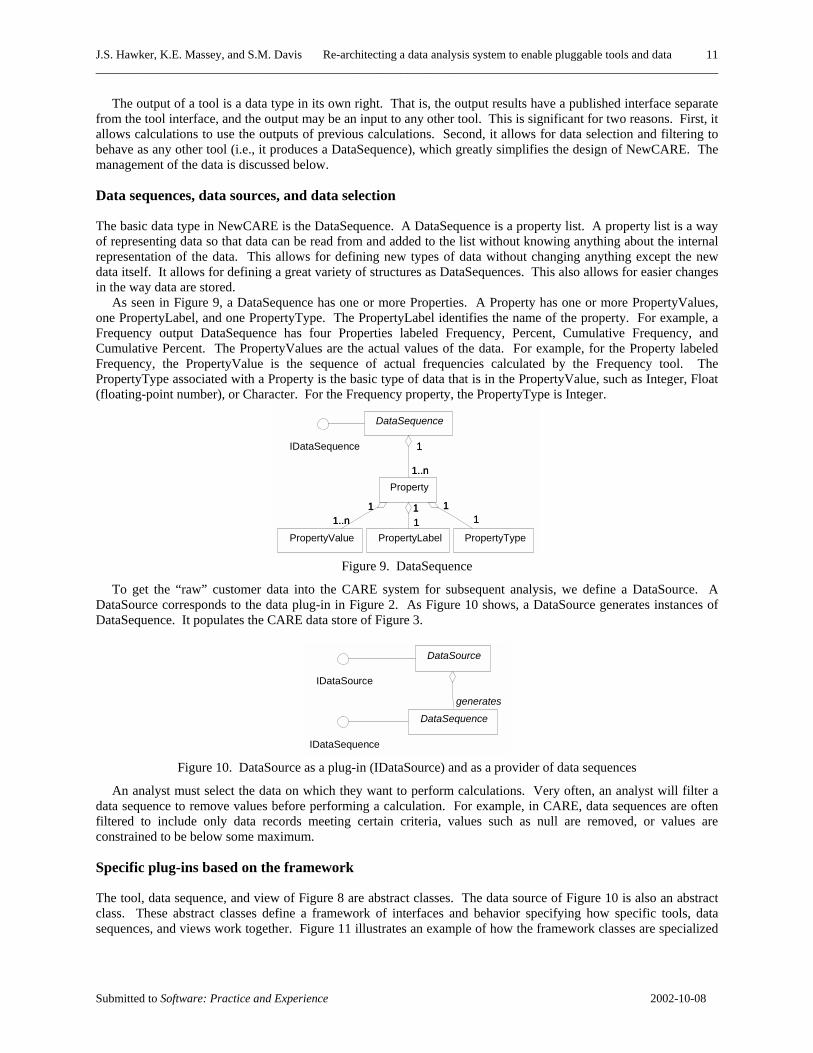
As seen in Figure 9, a DataSequence has one or more Properties. A Property has one or more PropertyValues, one PropertyLabel, and one PropertyType. The PropertyLabel identifies the name of the property. For example, a Frequency output DataSequence has four Properties labeled Frequency, Percent, Cumulative Frequency, and Cumulative Percent. The PropertyValues are the actual values of the data. For example, for the Property labeled Frequency, the PropertyValue is the sequence of actual frequencies calculated by the Frequency tool. The PropertyType associated with a Property is the basic type of data that is in the PropertyValue, such as Integer, Float (floating-point number), or Character. For the Frequency property, the PropertyType is Integer.
PropertyValue PropertyLabel PropertyType
IDataSequence
Property
11..n
11..n 1
111
11
11
DataSequence
1..n
1
1..n
1
Figure 9. DataSequence
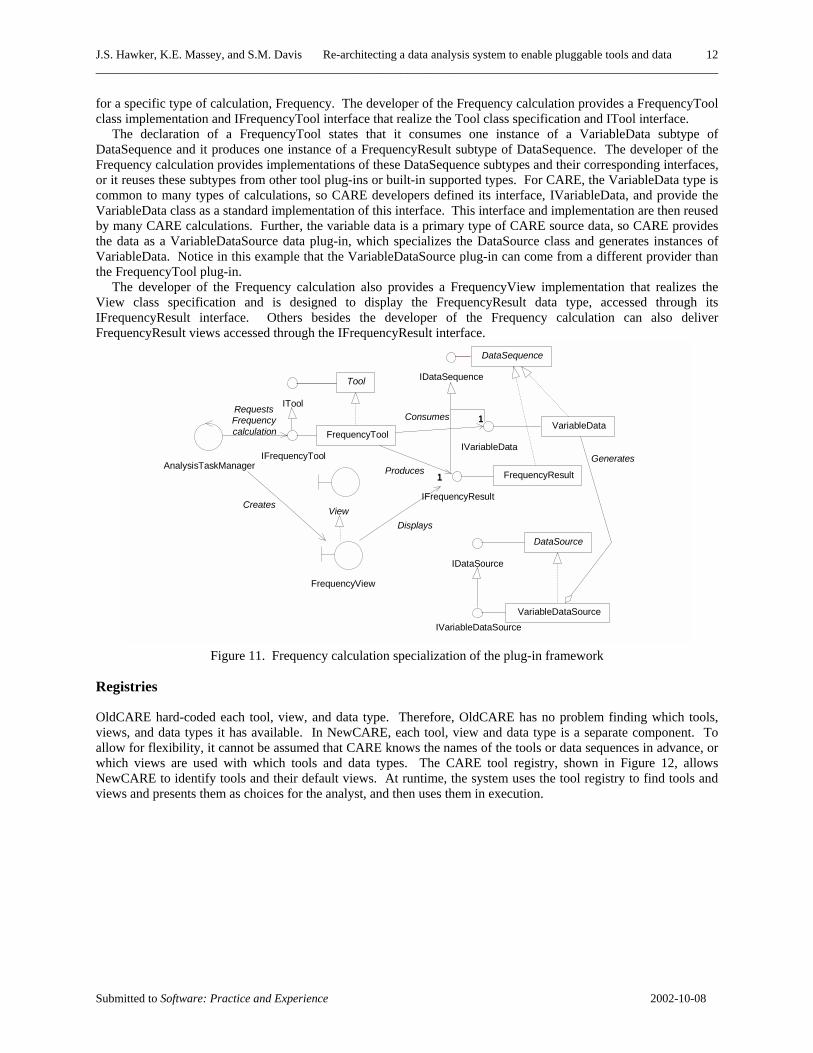
To get the “raw” customer data into the CARE system for subsequent analysis, we define a DataSource. A DataSource corresponds to the data plug-in in Figure 2. As Figure 10 shows, a DataSource generates instances of DataSequence. It populates the CARE data store of Figure 3.
IDataSequence
DataSequence
IDataSource
DataSource
generates
Figure 10. DataSource as a plug-in (IDataSource) and as a provider of data sequences
An analyst must select the data on which they want to perform calculations. Very often, an analyst will filter a data sequence to remove values before performing a calculation. For example, in CARE, data sequences are often filtered to include only data records meeting certain criteria, values such as null are removed, or values are constrained to be below some maximum.
Specific plug-ins based on the framework
The tool, data sequence, and view of Figure 8 are abstract classes. The data source of Figure 10 is also an abstract class. These abstract classes define a framework of interfaces and behavior specifying how specific tools, data sequences, and views work together. Figure 11 illustrates an example of how the framework classes are specialized
J.S. Hawker, K.E. Massey, and S.M. Davis Re-architecting a data analysis system to enable pluggable tools and data 12 ________________________________________________________________________________________________________
Submitted to Software: Practice and Experience 2002-10-08
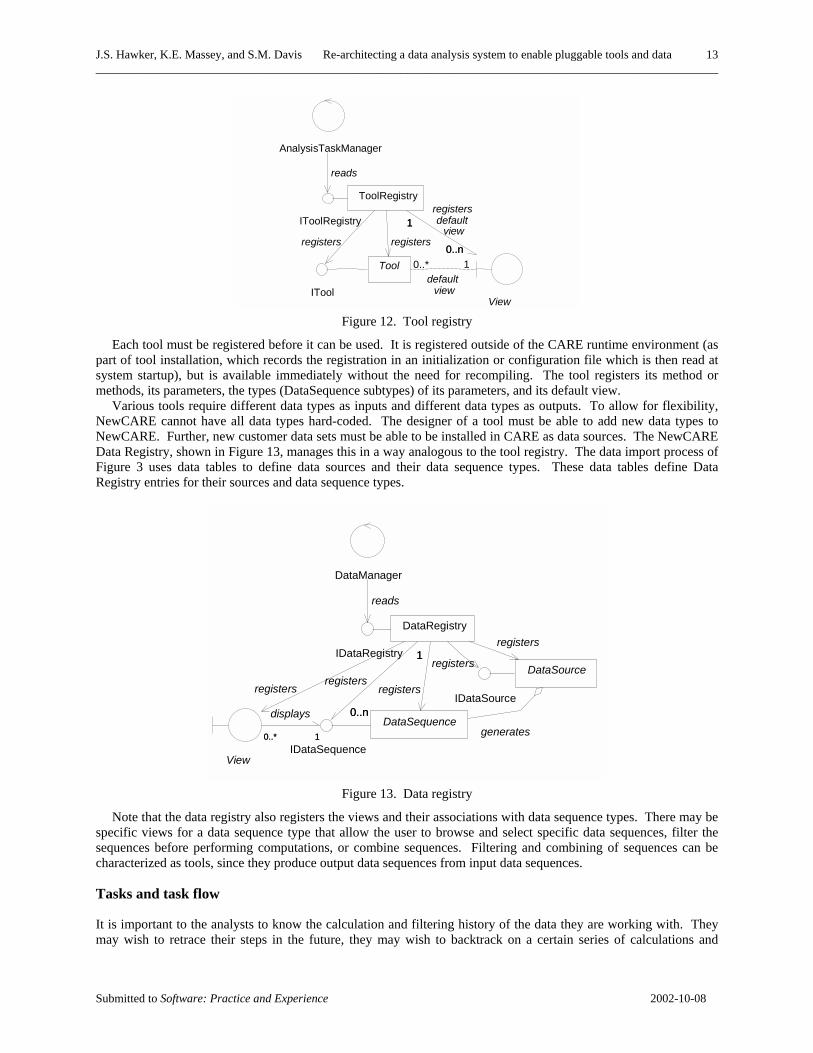
for a specific type of calculation, Frequency. The developer of the Frequency calculation provides a FrequencyTool class implementation and IFrequencyTool interface that realize the Tool class specification and ITool interface.
The declaration of a FrequencyTool states that it consumes one instance of a VariableData subtype of DataSequence and it produces one instance of a FrequencyResult subtype of DataSequence. The developer of the Frequency calculation provides implementations of these DataSequence subtypes and their corresponding interfaces, or it reuses these subtypes from other tool plug-ins or built-in supported types. For CARE, the VariableData type is common to many types of calculations, so CARE developers defined its interface, IVariableData, and provide the VariableData class as a standard implementation of this interface. This interface and implementation are then reused by many CARE calculations. Further, the variable data is a primary type of CARE source data, so CARE provides the data as a VariableDataSource data plug-in, which specializes the DataSource class and generates instances of VariableData. Notice in this example that the VariableDataSource plug-in can come from a different provider than the FrequencyTool plug-in.
The developer of the Frequency calculation also provides a FrequencyView implementation that realizes the View class specification and is designed to display the FrequencyResult data type, accessed through its IFrequencyResult interface. Others besides the developer of the Frequency calculation can also deliver FrequencyResult views accessed through the IFrequencyResult interface.
AnalysisTaskManagerFrequencyResult
FrequencyView
IFrequencyTool
Requests Frequency calculation
IFrequencyResult
Displays
IVariableDataFrequencyTool
11Produces
11Consumes
View
IDataSequence
DataSequence
ITool
Tool
DataSource
IDataSource
IVariableDataSource
Creates
VariableDataSource
VariableData
Generates
Figure 11. Frequency calculation specialization of the plug-in framework
Registries
OldCARE hard-coded each tool, view, and data type. Therefore, OldCARE has no problem finding which tools, views, and data types it has available. In NewCARE, each tool, view and data type is a separate component. To allow for flexibility, it cannot be assumed that CARE knows the names of the tools or data sequences in advance, or which views are used with which tools and data types. The CARE tool registry, shown in Figure 12, allows NewCARE to identify tools and their default views. At runtime, the system uses the tool registry to find tools and views and presents them as choices for the analyst, and then uses them in execution.
J.S. Hawker, K.E. Massey, and S.M. Davis Re-architecting a data analysis system to enable pluggable tools and data 13 ________________________________________________________________________________________________________
Submitted to Software: Practice and Experience 2002-10-08
ITool
ToolRegistry
registers
Tool
registers
IToolRegistry
AnalysisTaskManager
reads
View
1
0..n
1
0..n
registers default
view
10..*default
view
Figure 12. Tool registry
Each tool must be registered before it can be used. It is registered outside of the CARE runtime environment (as part of tool installation, which records the registration in an initialization or configuration file which is then read at system startup), but is available immediately without the need for recompiling. The tool registers its method or methods, its parameters, the types (DataSequence subtypes) of its parameters, and its default view.
Various tools require different data types as inputs and different data types as outputs. To allow for flexibility, NewCARE cannot have all data types hard-coded. The designer of a tool must be able to add new data types to NewCARE. Further, new customer data sets must be able to be installed in CARE as data sources. The NewCARE Data Registry, shown in Figure 13, manages this in a way analogous to the tool registry. The data import process of Figure 3 uses data tables to define data sources and their data sequence types. These data tables define Data Registry entries for their sources and data sequence types.
IDataRegistry
IDataSequence
IDataSource
DataSequence
DataSource
generates
DataManager
reads
DataRegistry
1
0..n
1
0..n
registersregisters
registers
registers
View
0..* 10..* 1
displays
registers
Figure 13. Data registry
Note that the data registry also registers the views and their associations with data sequence types. There may be specific views for a data sequence type that allow the user to browse and select specific data sequences, filter the sequences before performing computations, or combine sequences. Filtering and combining of sequences can be characterized as tools, since they produce output data sequences from input data sequences.
Tasks and task flow
It is important to the analysts to know the calculation and filtering history of the data they are working with. They may wish to retrace their steps in the future, they may wish to backtrack on a certain series of calculations and
J.S. Hawker, K.E. Massey, and S.M. Davis Re-architecting a data analysis system to enable pluggable tools and data 14 ________________________________________________________________________________________________________
Submitted to Software: Practice and Experience 2002-10-08
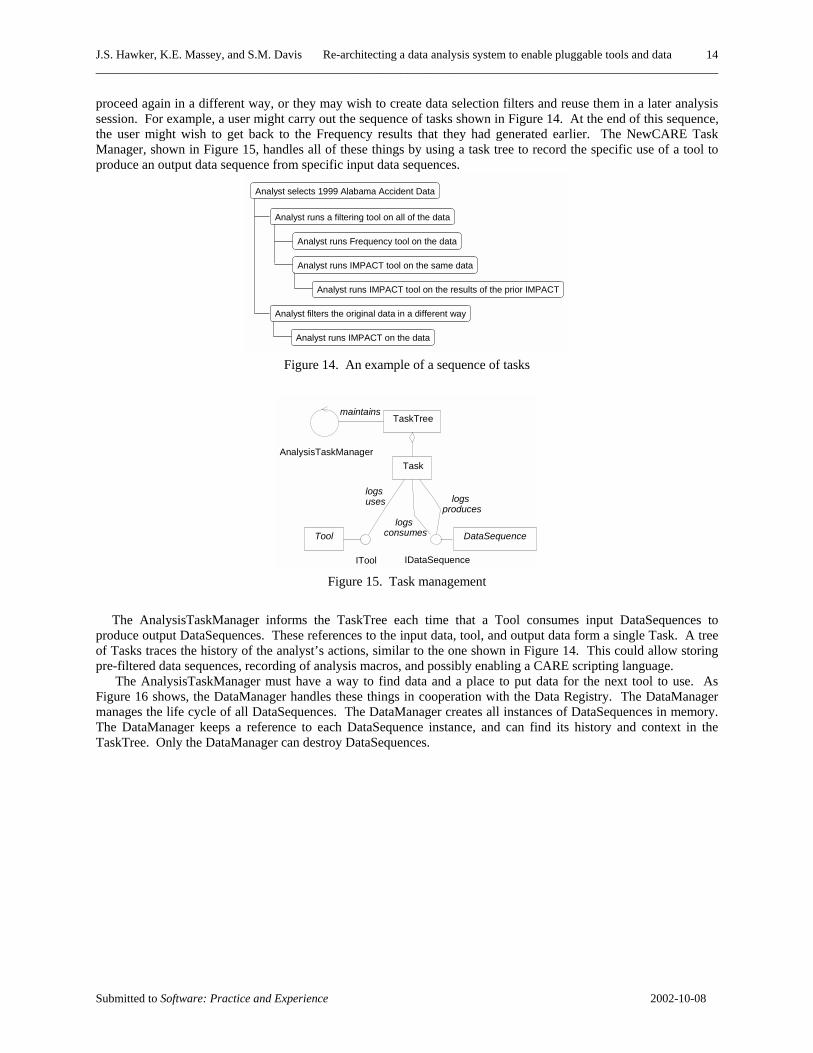
proceed again in a different way, or they may wish to create data selection filters and reuse them in a later analysis session. For example, a user might carry out the sequence of tasks shown in Figure 14. At the end of this sequence, the user might wish to get back to the Frequency results that they had generated earlier. The NewCARE Task Manager, shown in Figure 15, handles all of these things by using a task tree to record the specific use of a tool to produce an output data sequence from specific input data sequences.
Analyst selects 1999 Alabama Accident Data
Analyst runs a filtering tool on all of the data
Analyst runs Frequency tool on the data
Analyst runs IMPACT tool on the same data
Analyst runs IMPACT tool on the results of the prior IMPACT
Analyst filters the original data in a different way
Analyst runs IMPACT on the data
Figure 14. An example of a sequence of tasks
Tool DataSequence
ITool IDataSequence
AnalysisTaskManagerTask
logs uses
logs consumes
logs produces
TaskTreemaintains
Figure 15. Task management
The AnalysisTaskManager informs the TaskTree each time that a Tool consumes input DataSequences to
produce output DataSequences. These references to the input data, tool, and output data form a single Task. A tree of Tasks traces the history of the analyst’s actions, similar to the one shown in Figure 14. This could allow storing pre-filtered data sequences, recording of analysis macros, and possibly enabling a CARE scripting language.
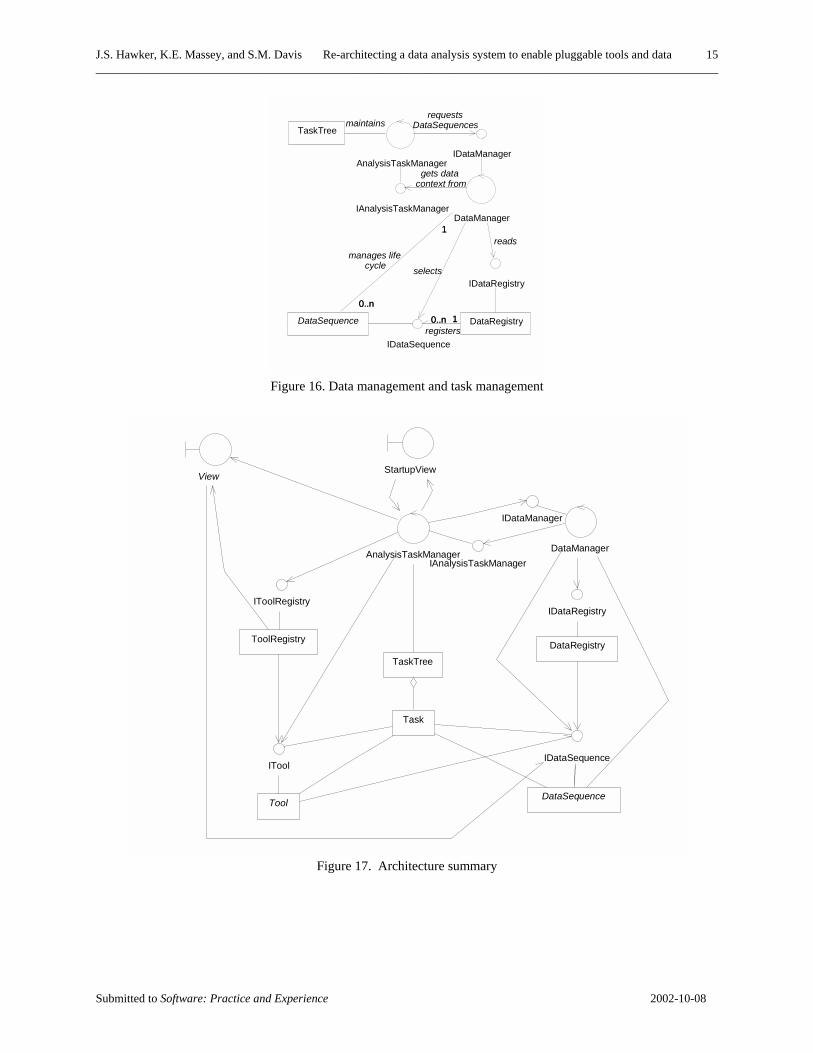
The AnalysisTaskManager must have a way to find data and a place to put data for the next tool to use. As Figure 16 shows, the DataManager handles these things in cooperation with the Data Registry. The DataManager manages the life cycle of all DataSequences. The DataManager creates all instances of DataSequences in memory. The DataManager keeps a reference to each DataSequence instance, and can find its history and context in the TaskTree. Only the DataManager can destroy DataSequences.
J.S. Hawker, K.E. Massey, and S.M. Davis Re-architecting a data analysis system to enable pluggable tools and data 15 ________________________________________________________________________________________________________
Submitted to Software: Practice and Experience 2002-10-08
DataRegistry
IDataRegistry
DataSequence
IDataSequence
10..n 10..nregisters
DataManager
reads
0..n
1
0..n
1
manages life cycle selects
IDataManager
IAnalysisTaskManager
gets data context from
AnalysisTaskManager
requests DataSequencesTaskTree
maintains
Figure 16. Data management and task management
StartupView
IToolRegistry
IDataManager
IAnalysisTaskManager
IDataRegistry
TaskTree
Tool
DataManager
DataRegistry
View
IDataSequence
Task
DataSequence
AnalysisTaskManager
ITool
ToolRegistry
Figure 17. Architecture summary
J.S. Hawker, K.E. Massey, and S.M. Davis Re-architecting a data analysis system to enable pluggable tools and data 16 ________________________________________________________________________________________________________
Submitted to Software: Practice and Experience 2002-10-08
Architecture operation
The major pieces of NewCARE are the tools, data sequences and views, plus the framework of registries, data manager, and task manager. The class diagram of Figure 17 summarizes how they all fit together.
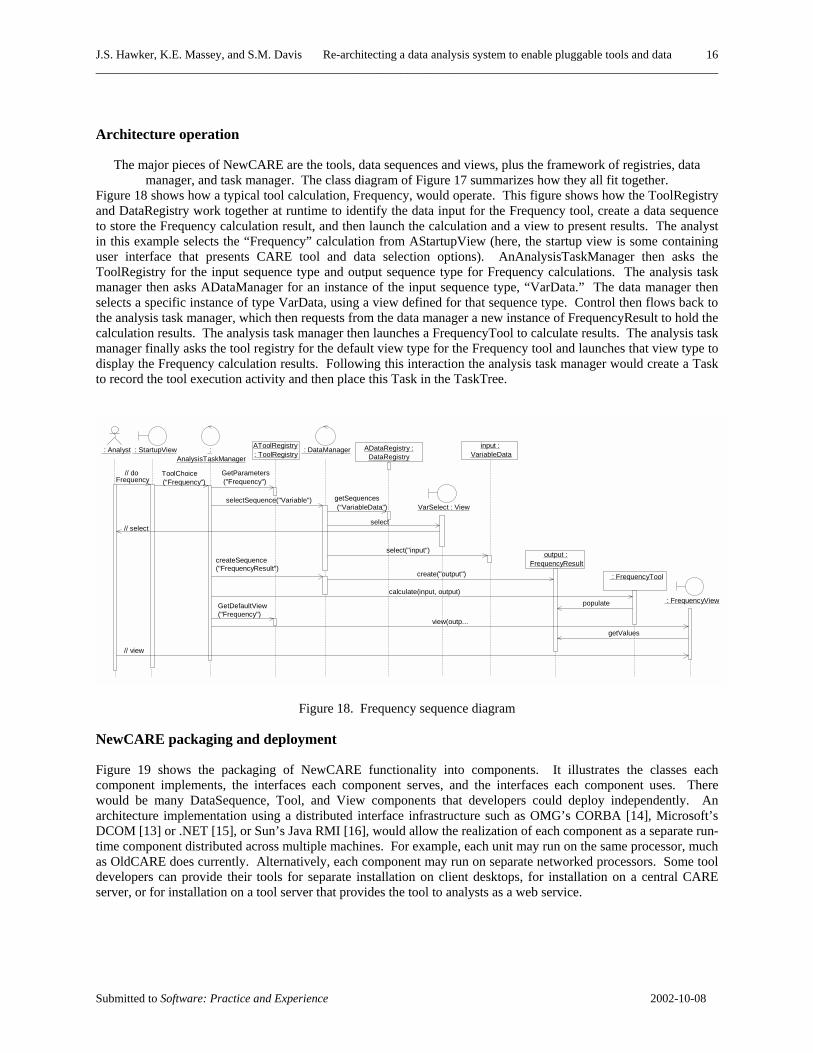
Figure 18 shows how a typical tool calculation, Frequency, would operate. This figure shows how the ToolRegistry and DataRegistry work together at runtime to identify the data input for the Frequency tool, create a data sequence to store the Frequency calculation result, and then launch the calculation and a view to present results. The analyst in this example selects the “Frequency” calculation from AStartupView (here, the startup view is some containing user interface that presents CARE tool and data selection options). AnAnalysisTaskManager then asks the ToolRegistry for the input sequence type and output sequence type for Frequency calculations. The analysis task manager then asks ADataManager for an instance of the input sequence type, “VarData.” The data manager then selects a specific instance of type VarData, using a view defined for that sequence type. Control then flows back to the analysis task manager, which then requests from the data manager a new instance of FrequencyResult to hold the calculation results. The analysis task manager then launches a FrequencyTool to calculate results. The analysis task manager finally asks the tool registry for the default view type for the Frequency tool and launches that view type to display the Frequency calculation results. Following this interaction the analysis task manager would create a Task to record the tool execution activity and then place this Task in the TaskTree.
: StartupView : AnalysisTaskManager
AToolRegistry: ToolRegistry : DataManager ADataRegistry :
DataRegistry
VarSelect : View
input : VariableData
output : FrequencyResult
: FrequencyTool
: FrequencyView
: Analyst
// do Frequency
ToolChoice(“Frequency")
GetParameters("Frequency")
selectSequence("Variable") getSequences(“VariableData")
select// select
select("input")createSequence("FrequencyResult")
create("output")
calculate(input, output)populateGetDefaultView
("Frequency")view(outp...
getValues
// view
Figure 18. Frequency sequence diagram
NewCARE packaging and deployment
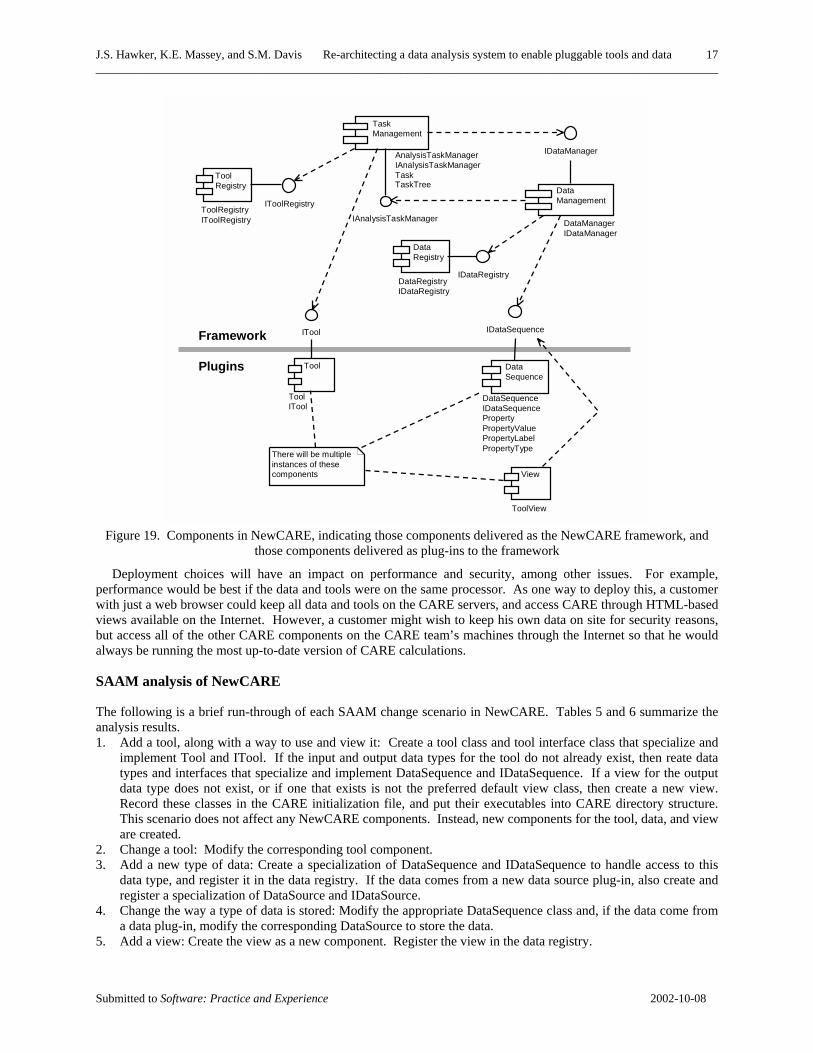
Figure 19 shows the packaging of NewCARE functionality into components. It illustrates the classes each component implements, the interfaces each component serves, and the interfaces each component uses. There would be many DataSequence, Tool, and View components that developers could deploy independently. An architecture implementation using a distributed interface infrastructure such as OMG’s CORBA [14], Microsoft’s DCOM [13] or .NET [15], or Sun’s Java RMI [16], would allow the realization of each component as a separate run-time component distributed across multiple machines. For example, each unit may run on the same processor, much as OldCARE does currently. Alternatively, each component may run on separate networked processors. Some tool developers can provide their tools for separate installation on client desktops, for installation on a central CARE server, or for installation on a tool server that provides the tool to analysts as a web service.
J.S. Hawker, K.E. Massey, and S.M. Davis Re-architecting a data analysis system to enable pluggable tools and data 17 ________________________________________________________________________________________________________
Submitted to Software: Practice and Experience 2002-10-08
Data Sequence
Task Management
Data Management
Data Registry
Tool Registry
Tool
View
There will be multiple instances of these components
IDataSequence
IAnalysisTaskManager
IToolRegistry
ITool
IDataManager
IDataRegistry
AnalysisTaskManagerIAnalysisTaskManagerTaskTaskTree
DataManagerIDataManager
DataRegistryIDataRegistry
ToolRegistryIToolRegistry
DataSequenceIDataSequencePropertyPropertyValuePropertyLabelPropertyType
ToolITool
ToolView
Framework
Plugins
Figure 19. Components in NewCARE, indicating those components delivered as the NewCARE framework, and
those components delivered as plug-ins to the framework
Deployment choices will have an impact on performance and security, among other issues. For example, performance would be best if the data and tools were on the same processor. As one way to deploy this, a customer with just a web browser could keep all data and tools on the CARE servers, and access CARE through HTML-based views available on the Internet. However, a customer might wish to keep his own data on site for security reasons, but access all of the other CARE components on the CARE team’s machines through the Internet so that he would always be running the most up-to-date version of CARE calculations.
SAAM analysis of NewCARE
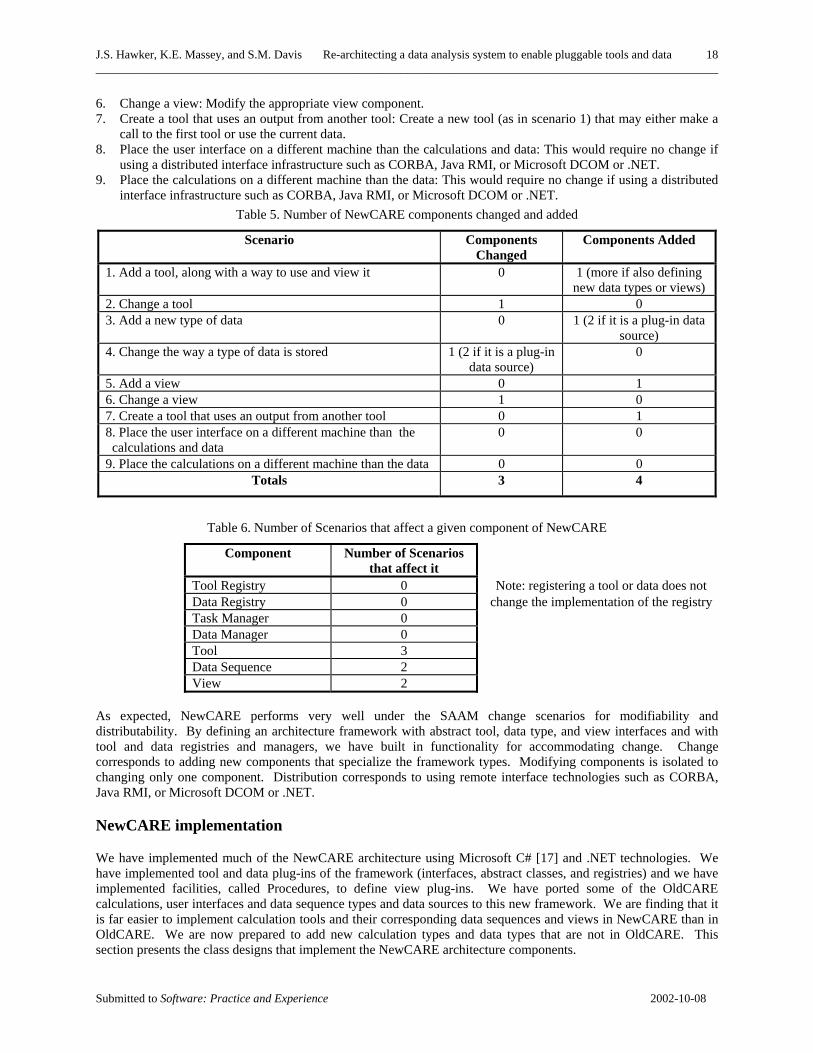
The following is a brief run-through of each SAAM change scenario in NewCARE. Tables 5 and 6 summarize the analysis results. 1. Add a tool, along with a way to use and view it: Create a tool class and tool interface class that specialize and
implement Tool and ITool. If the input and output data types for the tool do not already exist, then reate data types and interfaces that specialize and implement DataSequence and IDataSequence. If a view for the output data type does not exist, or if one that exists is not the preferred default view class, then create a new view. Record these classes in the CARE initialization file, and put their executables into CARE directory structure. This scenario does not affect any NewCARE components. Instead, new components for the tool, data, and view are created.
2. Change a tool: Modify the corresponding tool component. 3. Add a new type of data: Create a specialization of DataSequence and IDataSequence to handle access to this
data type, and register it in the data registry. If the data comes from a new data source plug-in, also create and register a specialization of DataSource and IDataSource.
4. Change the way a type of data is stored: Modify the appropriate DataSequence class and, if the data come from a data plug-in, modify the corresponding DataSource to store the data.
5. Add a view: Create the view as a new component. Register the view in the data registry.
J.S. Hawker, K.E. Massey, and S.M. Davis Re-architecting a data analysis system to enable pluggable tools and data 18 ________________________________________________________________________________________________________
Submitted to Software: Practice and Experience 2002-10-08
6. Change a view: Modify the appropriate view component. 7. Create a tool that uses an output from another tool: Create a new tool (as in scenario 1) that may either make a
call to the first tool or use the current data. 8. Place the user interface on a different machine than the calculations and data: This would require no change if
using a distributed interface infrastructure such as CORBA, Java RMI, or Microsoft DCOM or .NET. 9. Place the calculations on a different machine than the data: This would require no change if using a distributed
interface infrastructure such as CORBA, Java RMI, or Microsoft DCOM or .NET. Table 5. Number of NewCARE components changed and added
Scenario Components Changed
Components Added
1. Add a tool, along with a way to use and view it 0 1 (more if also defining new data types or views)
2. Change a tool 1 0 3. Add a new type of data 0 1 (2 if it is a plug-in data
source) 4. Change the way a type of data is stored 1 (2 if it is a plug-in
data source) 0
5. Add a view 0 1 6. Change a view 1 0 7. Create a tool that uses an output from another tool 0 1 8. Place the user interface on a different machine than the calculations and data
0 0
9. Place the calculations on a different machine than the data 0 0 Totals 3 4
Table 6. Number of Scenarios that affect a given component of NewCARE
Component Number of Scenarios that affect it
Tool Registry 0 Note: registering a tool or data does not Data Registry 0 change the implementation of the registry Task Manager 0 Data Manager 0 Tool 3 Data Sequence 2 View 2
As expected, NewCARE performs very well under the SAAM change scenarios for modifiability and distributability. By defining an architecture framework with abstract tool, data type, and view interfaces and with tool and data registries and managers, we have built in functionality for accommodating change. Change corresponds to adding new components that specialize the framework types. Modifying components is isolated to changing only one component. Distribution corresponds to using remote interface technologies such as CORBA, Java RMI, or Microsoft DCOM or .NET.
NewCARE implementation
We have implemented much of the NewCARE architecture using Microsoft C# [17] and .NET technologies. We have implemented tool and data plug-ins of the framework (interfaces, abstract classes, and registries) and we have implemented facilities, called Procedures, to define view plug-ins. We have ported some of the OldCARE calculations, user interfaces and data sequence types and data sources to this new framework. We are finding that it is far easier to implement calculation tools and their corresponding data sequences and views in NewCARE than in OldCARE. We are now prepared to add new calculation types and data types that are not in OldCARE. This section presents the class designs that implement the NewCARE architecture components.
J.S. Hawker, K.E. Massey, and S.M. Davis Re-architecting a data analysis system to enable pluggable tools and data 19 ________________________________________________________________________________________________________
Submitted to Software: Practice and Experience 2002-10-08
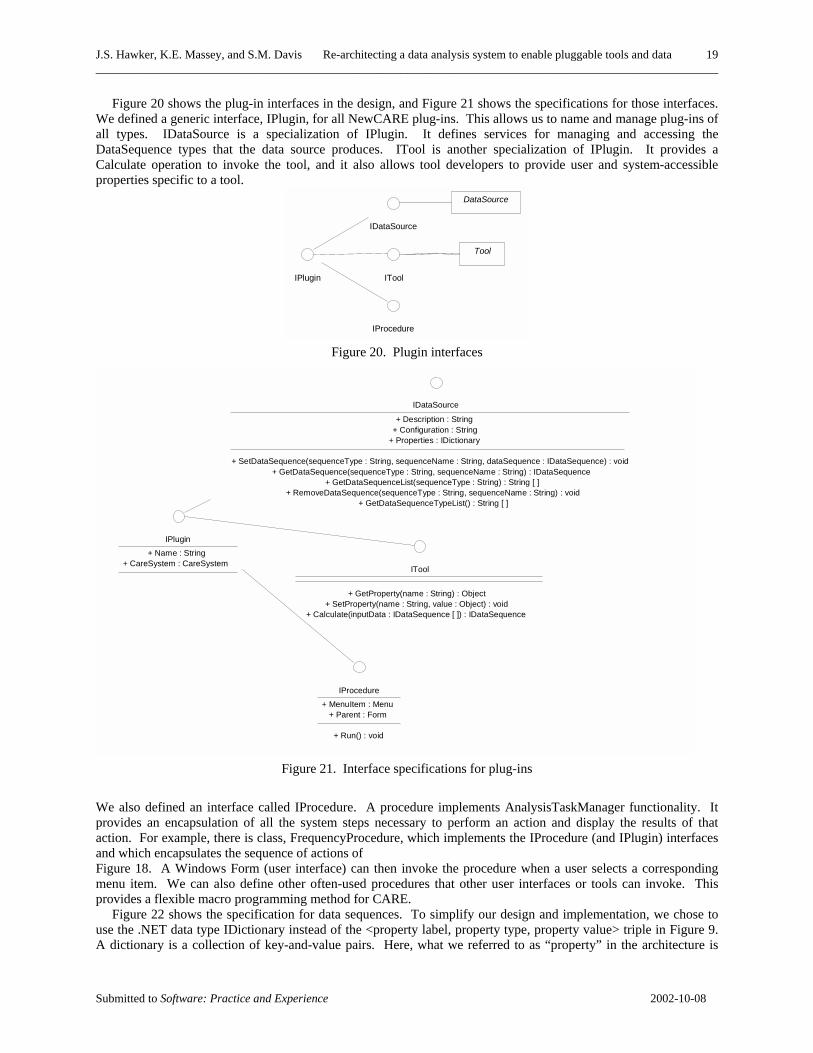
Figure 20 shows the plug-in interfaces in the design, and Figure 21 shows the specifications for those interfaces. We defined a generic interface, IPlugin, for all NewCARE plug-ins. This allows us to name and manage plug-ins of all types. IDataSource is a specialization of IPlugin. It defines services for managing and accessing the DataSequence types that the data source produces. ITool is another specialization of IPlugin. It provides a Calculate operation to invoke the tool, and it also allows tool developers to provide user and system-accessible properties specific to a tool.
ITool
Tool
IDataSource
IProcedure
DataSource
IPlugin
Figure 20. Plugin interfaces
ITool
+ GetProperty(name : String) : Object+ SetProperty(name : String, value : Object) : void
+ Calculate(inputData : IDataSequence [ ]) : IDataSequence
IDataSource
+ Description : String+ Configuration : String
+ Properties : IDictionary
+ SetDataSequence(sequenceType : String, sequenceName : String, dataSequence : IDataSequence) : void+ GetDataSequence(sequenceType : String, sequenceName : String) : IDataSequence
+ GetDataSequenceList(sequenceType : String) : String [ ]+ RemoveDataSequence(sequenceType : String, sequenceName : String) : void
+ GetDataSequenceTypeList() : String [ ]
IProcedure+ MenuItem : Menu
+ Parent : Form
+ Run() : void
IPlugin+ Name : String
+ CareSystem : CareSystem
Figure 21. Interface specifications for plug-ins
We also defined an interface called IProcedure. A procedure implements AnalysisTaskManager functionality. It provides an encapsulation of all the system steps necessary to perform an action and display the results of that action. For example, there is class, FrequencyProcedure, which implements the IProcedure (and IPlugin) interfaces and which encapsulates the sequence of actions of Figure 18. A Windows Form (user interface) can then invoke the procedure when a user selects a corresponding menu item. We can also define other often-used procedures that other user interfaces or tools can invoke. This provides a flexible macro programming method for CARE.
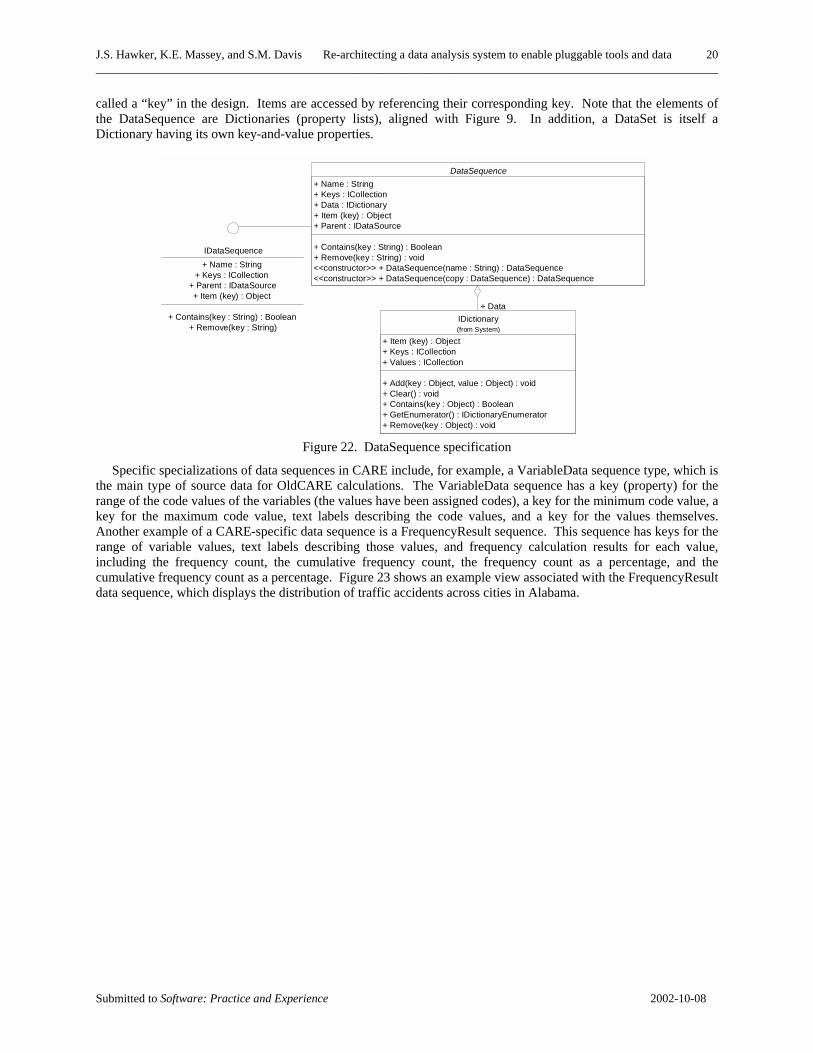
Figure 22 shows the specification for data sequences. To simplify our design and implementation, we chose to use the .NET data type IDictionary instead of the <property label, property type, property value> triple in Figure 9. A dictionary is a collection of key-and-value pairs. Here, what we referred to as “property” in the architecture is
J.S. Hawker, K.E. Massey, and S.M. Davis Re-architecting a data analysis system to enable pluggable tools and data 20 ________________________________________________________________________________________________________
Submitted to Software: Practice and Experience 2002-10-08
called a “key” in the design. Items are accessed by referencing their corresponding key. Note that the elements of the DataSequence are Dictionaries (property lists), aligned with Figure 9. In addition, a DataSet is itself a Dictionary having its own key-and-value properties.
IDataSequence+ Name : String
+ Keys : ICollection+ Parent : IDataSource+ Item (key) : Object
+ Contains(key : String) : Boolean+ Remove(key : String)
DataSequence+ Name : String+ Keys : ICollection+ Data : IDictionary+ Item (key) : Object+ Parent : IDataSource
+ Contains(key : String) : Boolean+ Remove(key : String) : void<<constructor>> + DataSequence(name : String) : DataSequence<<constructor>> + DataSequence(copy : DataSequence) : DataSequence
IDictionary
+ Item (key) : Object+ Keys : ICollection+ Values : ICollection
+ Add(key : Object, value : Object) : void+ Clear() : void+ Contains(key : Object) : Boolean+ GetEnumerator() : IDictionaryEnumerator+ Remove(key : Object) : void
(from System)
+ Data
Figure 22. DataSequence specification
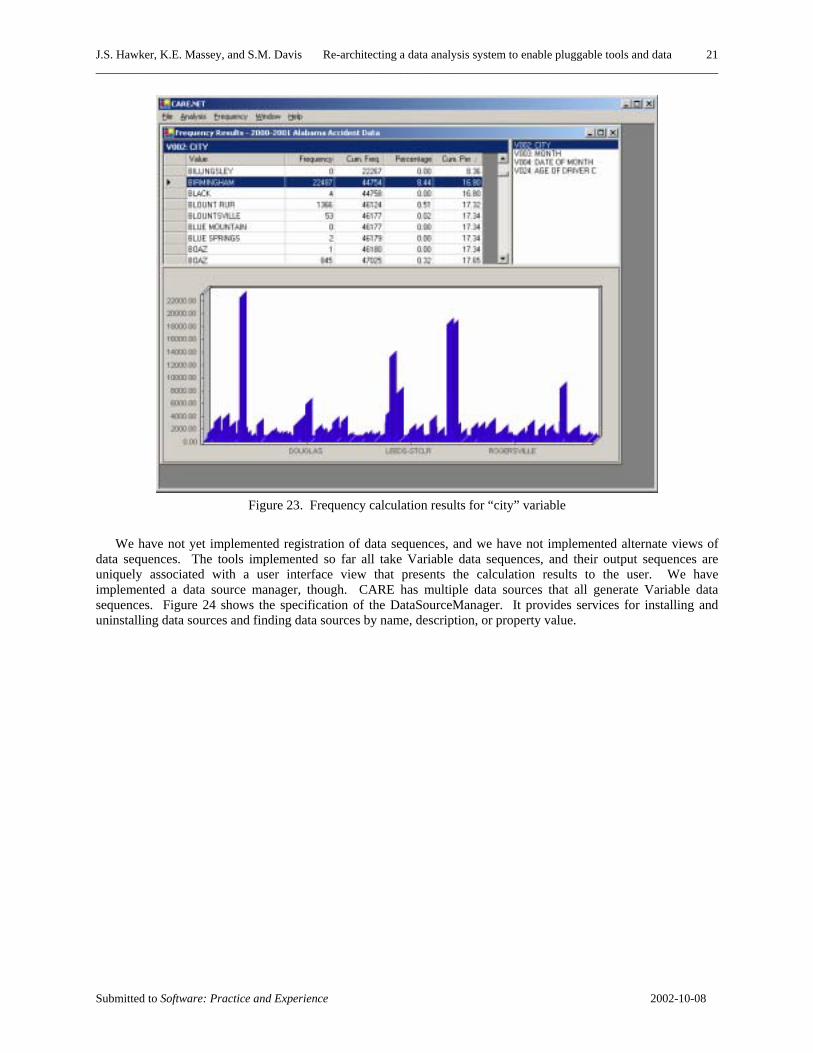
Specific specializations of data sequences in CARE include, for example, a VariableData sequence type, which is the main type of source data for OldCARE calculations. The VariableData sequence has a key (property) for the range of the code values of the variables (the values have been assigned codes), a key for the minimum code value, a key for the maximum code value, text labels describing the code values, and a key for the values themselves. Another example of a CARE-specific data sequence is a FrequencyResult sequence. This sequence has keys for the range of variable values, text labels describing those values, and frequency calculation results for each value, including the frequency count, the cumulative frequency count, the frequency count as a percentage, and the cumulative frequency count as a percentage. Figure 23 shows an example view associated with the FrequencyResult data sequence, which displays the distribution of traffic accidents across cities in Alabama.
J.S. Hawker, K.E. Massey, and S.M. Davis Re-architecting a data analysis system to enable pluggable tools and data 21 ________________________________________________________________________________________________________
Submitted to Software: Practice and Experience 2002-10-08
Figure 23. Frequency calculation results for “city” variable
We have not yet implemented registration of data sequences, and we have not implemented alternate views of
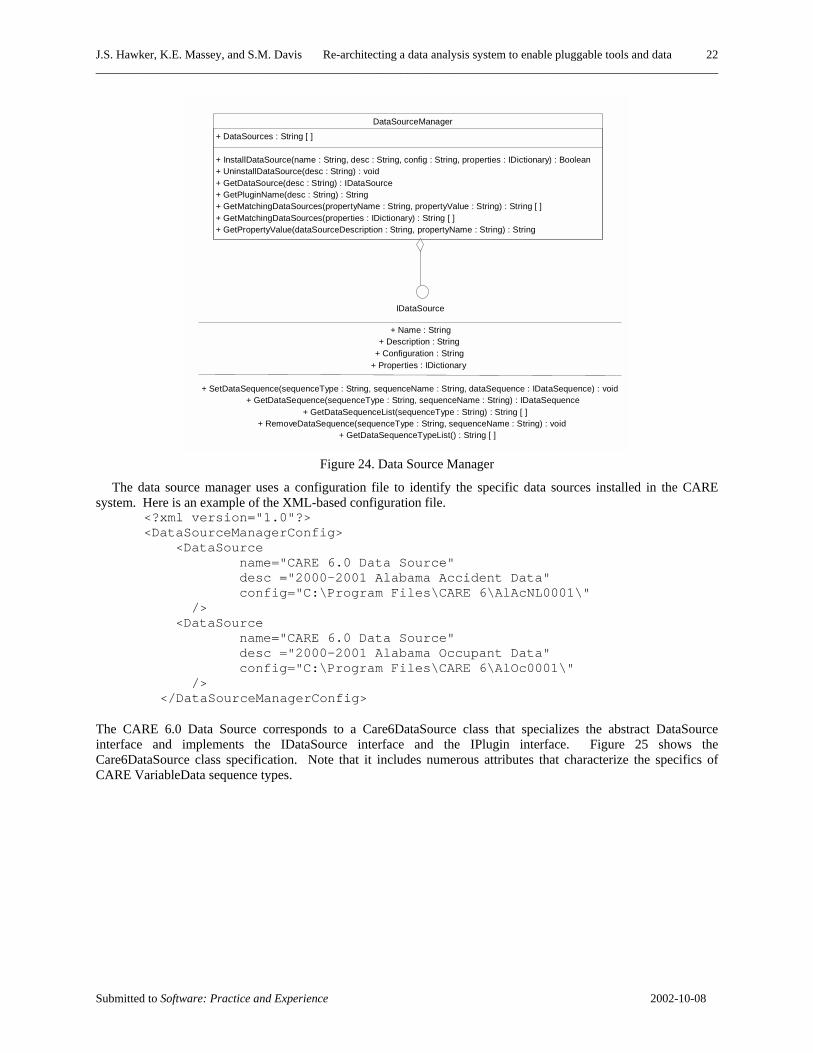
data sequences. The tools implemented so far all take Variable data sequences, and their output sequences are uniquely associated with a user interface view that presents the calculation results to the user. We have implemented a data source manager, though. CARE has multiple data sources that all generate Variable data sequences. Figure 24 shows the specification of the DataSourceManager. It provides services for installing and uninstalling data sources and finding data sources by name, description, or property value.
J.S. Hawker, K.E. Massey, and S.M. Davis Re-architecting a data analysis system to enable pluggable tools and data 22 ________________________________________________________________________________________________________
Submitted to Software: Practice and Experience 2002-10-08
IDataSource
+ Name : String+ Description : String
+ Configuration : String+ Properties : IDictionary
+ SetDataSequence(sequenceType : String, sequenceName : String, dataSequence : IDataSequence) : void+ GetDataSequence(sequenceType : String, sequenceName : String) : IDataSequence
+ GetDataSequenceList(sequenceType : String) : String [ ]+ RemoveDataSequence(sequenceType : String, sequenceName : String) : void
+ GetDataSequenceTypeList() : String [ ]
DataSourceManager
+ DataSources : String [ ]
+ InstallDataSource(name : String, desc : String, config : String, properties : IDictionary) : Boolean+ UninstallDataSource(desc : String) : void+ GetDataSource(desc : String) : IDataSource+ GetPluginName(desc : String) : String+ GetMatchingDataSources(propertyName : String, propertyValue : String) : String [ ]+ GetMatchingDataSources(properties : IDictionary) : String [ ]+ GetPropertyValue(dataSourceDescription : String, propertyName : String) : String
Figure 24. Data Source Manager
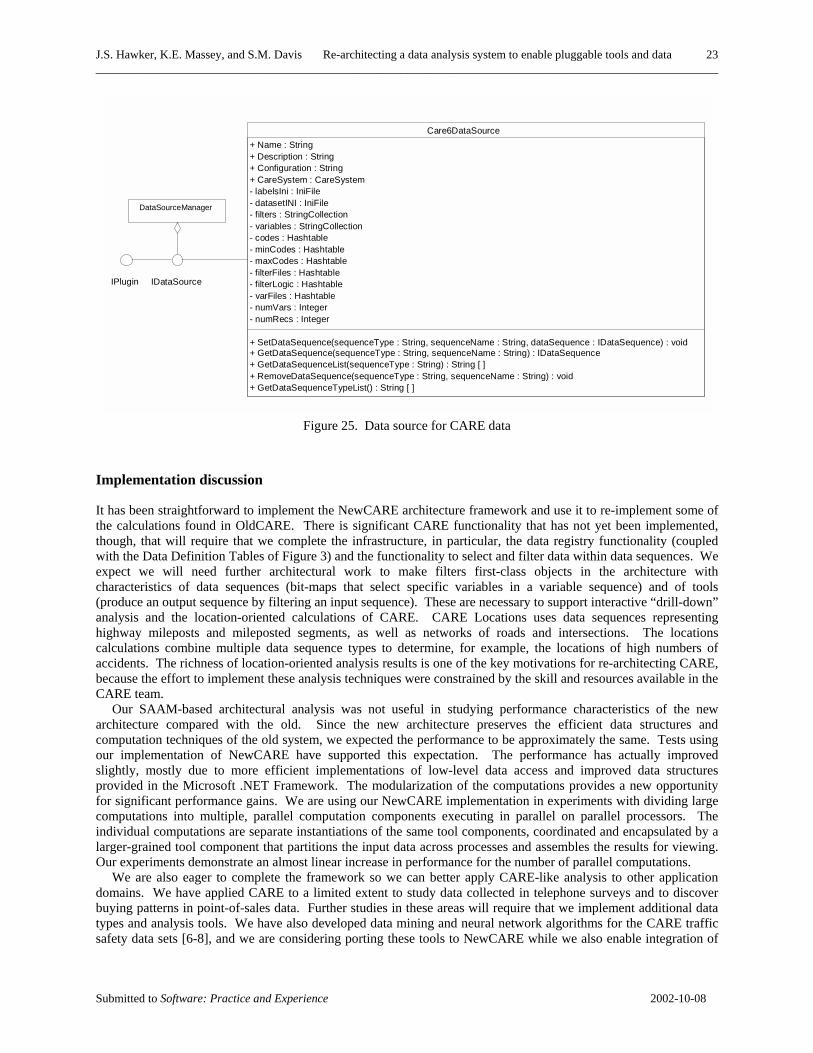
The data source manager uses a configuration file to identify the specific data sources installed in the CARE system. Here is an example of the XML-based configuration file.
<?xml version="1.0"?> <DataSourceManagerConfig> <DataSource name="CARE 6.0 Data Source" desc ="2000-2001 Alabama Accident Data" config="C:\Program Files\CARE 6\AlAcNL0001\" /> <DataSource name="CARE 6.0 Data Source" desc ="2000-2001 Alabama Occupant Data" config="C:\Program Files\CARE 6\AlOc0001\" />
</DataSourceManagerConfig> The CARE 6.0 Data Source corresponds to a Care6DataSource class that specializes the abstract DataSource interface and implements the IDataSource interface and the IPlugin interface. Figure 25 shows the Care6DataSource class specification. Note that it includes numerous attributes that characterize the specifics of CARE VariableData sequence types.
J.S. Hawker, K.E. Massey, and S.M. Davis Re-architecting a data analysis system to enable pluggable tools and data 23 ________________________________________________________________________________________________________
Submitted to Software: Practice and Experience 2002-10-08
Care6DataSource+ Name : String+ Description : String+ Configuration : String+ CareSystem : CareSystem- labelsIni : IniFile- datasetINI : IniFile- filters : StringCollection- variables : StringCollection- codes : Hashtable- minCodes : Hashtable- maxCodes : Hashtable- filterFiles : Hashtable- filterLogic : Hashtable- varFiles : Hashtable- numVars : Integer- numRecs : Integer
+ SetDataSequence(sequenceType : String, sequenceName : String, dataSequence : IDataSequence) : void+ GetDataSequence(sequenceType : String, sequenceName : String) : IDataSequence+ GetDataSequenceList(sequenceType : String) : String [ ]+ RemoveDataSequence(sequenceType : String, sequenceName : String) : void+ GetDataSequenceTypeList() : String [ ]
IPlugin IDataSource
DataSourceManager
Figure 25. Data source for CARE data
Implementation discussion
It has been straightforward to implement the NewCARE architecture framework and use it to re-implement some of the calculations found in OldCARE. There is significant CARE functionality that has not yet been implemented, though, that will require that we complete the infrastructure, in particular, the data registry functionality (coupled with the Data Definition Tables of Figure 3) and the functionality to select and filter data within data sequences. We expect we will need further architectural work to make filters first-class objects in the architecture with characteristics of data sequences (bit-maps that select specific variables in a variable sequence) and of tools (produce an output sequence by filtering an input sequence). These are necessary to support interactive “drill-down” analysis and the location-oriented calculations of CARE. CARE Locations uses data sequences representing highway mileposts and mileposted segments, as well as networks of roads and intersections. The locations calculations combine multiple data sequence types to determine, for example, the locations of high numbers of accidents. The richness of location-oriented analysis results is one of the key motivations for re-architecting CARE, because the effort to implement these analysis techniques were constrained by the skill and resources available in the CARE team.
Our SAAM-based architectural analysis was not useful in studying performance characteristics of the new architecture compared with the old. Since the new architecture preserves the efficient data structures and computation techniques of the old system, we expected the performance to be approximately the same. Tests using our implementation of NewCARE have supported this expectation. The performance has actually improved slightly, mostly due to more efficient implementations of low-level data access and improved data structures provided in the Microsoft .NET Framework. The modularization of the computations provides a new opportunity for significant performance gains. We are using our NewCARE implementation in experiments with dividing large computations into multiple, parallel computation components executing in parallel on parallel processors. The individual computations are separate instantiations of the same tool components, coordinated and encapsulated by a larger-grained tool component that partitions the input data across processes and assembles the results for viewing. Our experiments demonstrate an almost linear increase in performance for the number of parallel computations.
We are also eager to complete the framework so we can better apply CARE-like analysis to other application domains. We have applied CARE to a limited extent to study data collected in telephone surveys and to discover buying patterns in point-of-sales data. Further studies in these areas will require that we implement additional data types and analysis tools. We have also developed data mining and neural network algorithms for the CARE traffic safety data sets [6-8], and we are considering porting these tools to NewCARE while we also enable integration of
J.S. Hawker, K.E. Massey, and S.M. Davis Re-architecting a data analysis system to enable pluggable tools and data 24 ________________________________________________________________________________________________________
Submitted to Software: Practice and Experience 2002-10-08
advanced statistical and data mining techniques with CARE. We want to avoid our prior experience of having to couple these analysis tools to the specifics of the CARE data, and we want to significantly reduce the barriers to applying new analysis techniques to CARE data.
Architecture acceptance
One difficulty that the new CARE architecture brings is one of technical maturity of CARE developers. They are comfortable with code-level complexity, but are not familiar with architecture-level design techniques and their importance. The NewCARE architecture seems more complex, and the series of diagrams we use to describe the NewCARE architecture are certainly more involved than the two simple ones describing OldCARE. Before NewCARE, a tool developer simply dove into the code, found out how to access data, coded up their algorithm, created a display for the results, and placed the display and control into the main window menu options. Now, they need to think about specialization of interfaces, packaging their functionality into distinctly separated components, and placing data and tool declarations into initialization files. To developers familiar with the code, the perceived complexity of their big ball of mud architecture [18] is simple: there is no structure to see or worry about. The developers do not perceive the detailed inter-twining of code-level logic as difficult structure, and they do not perceive the pre-designed interfaces and separation of concerns as a benefit. Anything new to their perception adds complexity. More important, since the developers have already invested the effort to become familiar with the code and can accommodate it as it changes, they do not see the need to enable others to more quickly come in and add significant new functionality to the system.
There is an analogous difficulty for the “managers” of the CARE system development. They have trouble seeing the value in investing in architecture. They were used to asking a graduate student to “just do it” and then dealing with less than stable results. It was only after frustration in being able to respond to new opportunities for incorporating new analysis techniques or in applying CARE to new application domains that the need for a more flexible architecture became sufficiently strong. Even then, the perceived architectural complexity was a barrier in their embracing the new approach.
Our application experience is beginning to correct the perceptions that the new architecture adds complexity and is not worth the investment. The ease of implementing functionality in NewCARE is compelling.
CONCLUSION
We have proposed a new CARE architecture that addresses serious limitations of the existing OldCARE architecture. By discovering and documenting the OldCARE architecture, and analyzing it using the SAAM, we found deficiencies. Guided by these deficiencies and with specific architecture quality attributes in mind, we re-engineered the CARE architecture. Our new architecture leveraged architectural styles that define application components on a framework of abstract interfaces, along with services for the registration and management of components that implement those interfaces. SAAM analysis of the new architecture indicates it now has the quality attributes we sought – modifiability and distributability – without sacrificing system performance.
We are now implementing the NewCARE system in Microsoft C# and .NET. Our initial experience is validating our architecture analysis results: we are finding it easier to implement and maintain calculation functions in the new architecture than in the old. Our next steps are to complete the implementation of the framework portions of the architecture, in particular, the data registry functionality. Concurrent with this, we are porting additional OldCARE functionality to NewCARE, including locations-oriented analysis and data mining and other advanced analysis techniques. We are seeking new analysis and visualization tools to package as NewCARE tools and views. In addition, we are excited about parallel implementations of large complex analyses, which can be packaged and plugged into NewCARE just like any other calculation technique.
We are confident the new CARE architecture will enable us to accelerate the growth of the analysis capabilities of the CARE system and its application in new problem domains.
REFERENCES
1. C. Szyperski, Component Software: Beyond Object-Oriented Programming, Addison-Wesley, Harlow, England, 1998.
2. G.T. Heineman, and W.T. Councill, Component-Based Software Engineering: Putting the Pieces Together, Addison-Wesley, Boston, MA, 2001.
J.S. Hawker, K.E. Massey, and S.M. Davis Re-architecting a data analysis system to enable pluggable tools and data 25 ________________________________________________________________________________________________________
Submitted to Software: Practice and Experience 2002-10-08
3. M.E. Fayad, D.C. Schmidt, and R.E. Johnson, Implementing Application Frameworks, Object-Oriented Frameworks at Work, John Wiley & Sons, 1999.
4. M.E. Fayad, and R.E. Johnson, Domain-Specific Application Frameworks: Frameworks Experience by Industry, John Wiley & Sons, 1999.
5. University of Alabama, CARE Research and Development Lab, available at http://care.cs.ua.edu/. 6. D. Brown, A. Parrish, B. Dixon, S. Vrbsky, C. Gainer, ‘An Information Mining Approach Toward Improving
Aviation Safety,’ Proceedings of the 1999 Fifth ISSAT International Conference on Reliability and Quality in Design, (1999).
7. C. Nukoolkit, H.C. Chen, and D. Brown, ‘A Data Transformation Technique for Car Injury Prediction.,’ Proceedings of 39th Association of Computing and Machinery—South Eastern Conference, Athens, Georgia, (2001)
8. W. Yang, H.C. Chen, and D. Brown, ‘Detection of Safer Driving Patterns by a Neural Network Approach,’ ANNIE 1999 for the Proceedings of Smart Engineering System Design, (9) 839-844 (1999).
9. R. Kazman, G. Abowd, L. Bass, and P. Clements, ‘Scenario-Based Analysis of Software Architecture’, IEEE Software, 13 (6), 47-55 (1996).
10. P. Clements, R. Kazman, M. Klein, Evaluating Software Architectures: Methods and Case Studies, Addison-Wesley, Reading, MA, 2001.
11. OMG Unified Modeling Language Specification, v1.4, Object Management Group, Framingham, MA, 2002. 12. T. Archer and R.C. Leinecker, Visual C++ Bible, IDG Books Worldwide, Foster City, CA, 1998. 13. R. Rock-Evans, DCOM Explained, Digital Press, Boston, MA, 1998. 14. The Common Object Request Broker: Architecture and Specification, v3.0, Object Management Group,
Framingham, MA, 2002. 15. D.S. Platt, Introducing Microsoft .NET, Second Edition, Microsoft Press, Redmond, WA, 2002. 16. Java 2 Enterprise Edition Specification v1.3, Sun Microsystems, Palo Alto, CA, 2001. 17. M. Williams, Microsoft Visual C# .NET, Microsoft Press, Redmond, WA, 2002. 18. N. Harrison, B. Foote, and H. Rohnert (Eds), Pattern Languages of Program Design 4, Addison-Wesley, 2000,
Ch. 29.