Embed Size (px)
Citation preview
Re: 2014 Water Shortage Preparedness Survey Results
A water shortage occurs when supply is reduced to a level that cannot support existing
demands. Natural forces (e.g., drought), system component failure or interruption, or
regulatory actions may cause water shortages.
In order to help water utilities facing current and/or future water shortages, AWWA
conducted a survey in early 2014 to collect water shortage tracking and response
information. Complete responses to the stakeholder-developed survey were received from
485 utilities. This report includes aggregated summaries and analyses of the reported
utility practices and policies as collected through this survey.
Best Regards,
Kenneth L. Mercer
Senior Manager of Research and Utility Programs
American Water Works Association
303.347.6191
About AWWA:
The American Water Works Association (AWWA) is an international, nonprofit, scientific and educational society
dedicated to providing total water solutions assuring the effective management of water. Founded in 1881, the
Association is the largest organization of water supply professionals in the world. Our membership includes
over 3,900 utilities that supply roughly 80 percent of the nation's drinking water and treat almost half of the
nation's wastewater. Our nearly 50,000 total memberships represent the full spectrum of the water community:
public water and wastewater systems, environmental advocates, scientists, academicians, and others who hold
a genuine interest in water, our most important resource. AWWA unites the diverse water community to
advance public health, safety, the economy, and the environment.
6666 West Quincy Avenue
Denver, CO 80235-3098
T 303.794.7711
www.awwa.org

2014 Water Shortage Preparedness Survey Results Page 2
BACKGROUND Providing safe and reliable water for drinking and fire protection requires preparation for water
shortages of varying degree and duration. Water shortage response planning is an important
responsibility, and effective programs occur when water utilities have demand-reduction strategies in
place before a severe shortage. In many states, water suppliers must follow specific regulations when
declaring a water shortage emergency, regulations that provide utilities with the authority to enforce
emergency measures. In addition, complex relationships exist among water resources, customer
demands, stakeholder interests, and local, regional, national, and international policies affecting water
supply and demand during times of shortage. The impacts of water shortages can be especially
significant for small systems, which often are the first to face water shortages but may lack the
necessary resources to effectively prepare and respond.
In order to support decision makers facing current or future water shortages, AWWA collected data and
explanatory information from utility personnel through the 2014 Water Shortage Preparedness Survey
(WSPS) about practices and policies for effective water shortage planning and implementation. This
report summarizes those results and presents findings based on subsequent analyses. It should be
recognized upfront that there is no one-size-fits-all solution for water suppliers when it comes to their
individual water shortage responses, and ultimately it is important to develop a plan that fits with each
utility’s available resources, priorities, and relevant challenges.
METHODOLOGY Throughout the WSPS, AWWA made deliberate efforts to anticipate and minimize errors; however,
respondents ultimately self-selected to participate in this study. The sample for the survey consisted of a
general list of AWWA utility members and contacts who’ve expressed an interest in water shortage
response planning and water conservation. Because the bulk of AWWA contacts resides in North
America, the survey generally reflects the policies and practices of water professionals in the United
States, Canada, and Mexico.
On January 21, 2014, email invitations were delivered to 27,947 addresses. A second survey invitation
message was delivered to 46,843 addresses on February 21, 2014. The open period for the survey closed
on March 11, 2014.
After removing wholly incomplete and overlapping responses from employees of the same utility, 485
utilities completed the 2014 WSPS. A summary of the number of WSPS responses by utility location is
provided in Appendix 1. The results presented in the following sections have not been weighted to
reflect the demographic composition of any target population. Because the amount of self-selection bias
is unknown, no estimates of error have been determined. The full survey questionnaire is presented in
Appendix 2.
2014 Water Shortage Preparedness Survey Results Page 3
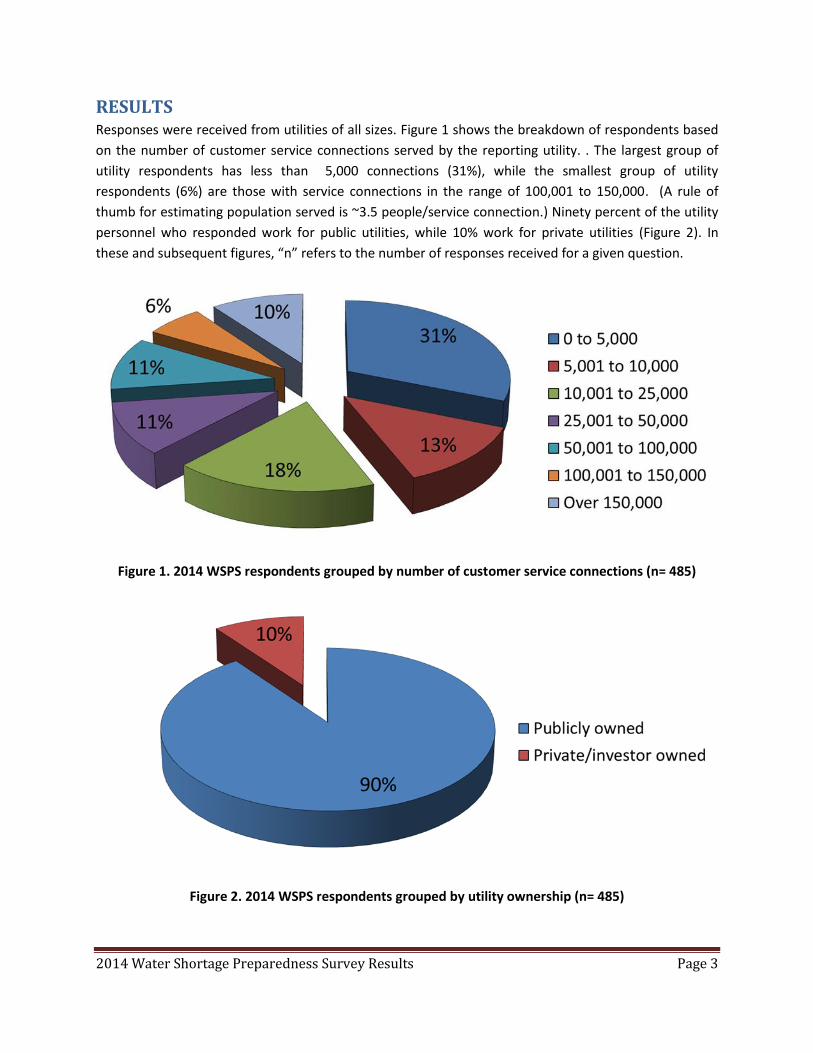
RESULTS Responses were received from utilities of all sizes. Figure 1 shows the breakdown of respondents based
on the number of customer service connections served by the reporting utility. . The largest group of
utility respondents has less than 5,000 connections (31%), while the smallest group of utility
respondents (6%) are those with service connections in the range of 100,001 to 150,000. (A rule of
thumb for estimating population served is ~3.5 people/service connection.) Ninety percent of the utility
personnel who responded work for public utilities, while 10% work for private utilities (Figure 2). In
these and subsequent figures, “n” refers to the number of responses received for a given question.
Figure 1. 2014 WSPS respondents grouped by number of customer service connections (n= 485)
Figure 2. 2014 WSPS respondents grouped by utility ownership (n= 485)
2014 Water Shortage Preparedness Survey Results Page 4
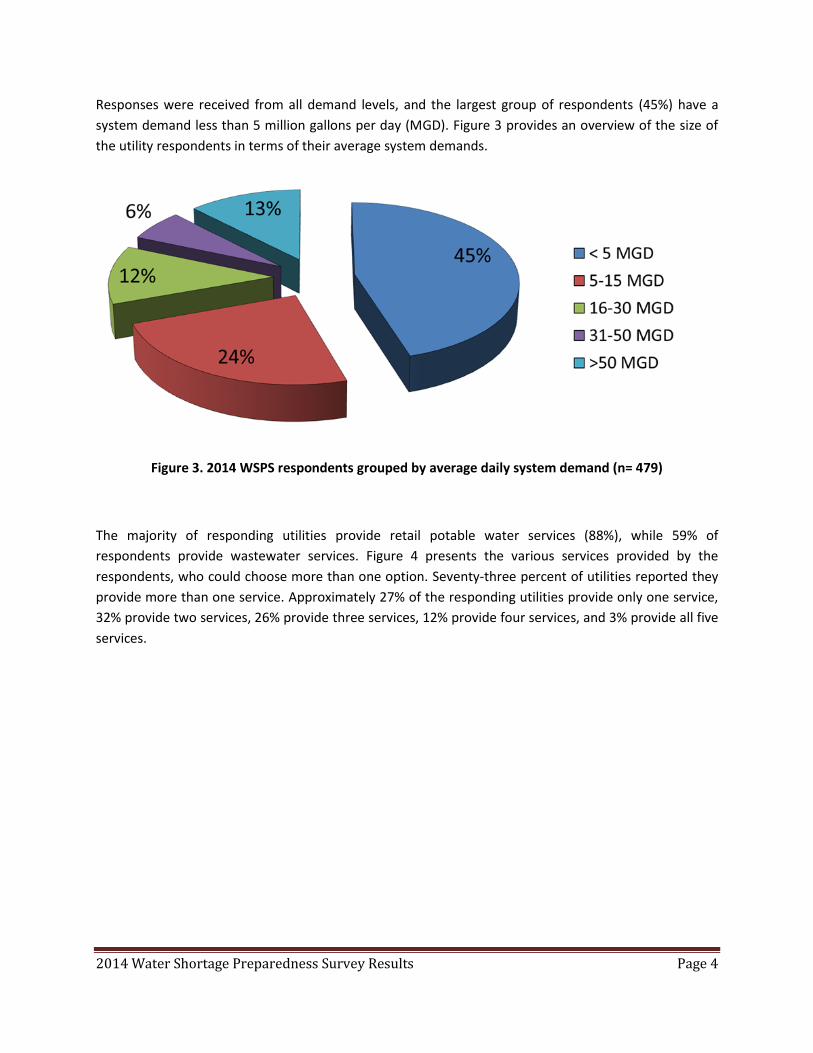
Responses were received from all demand levels, and the largest group of respondents (45%) have a
system demand less than 5 million gallons per day (MGD). Figure 3 provides an overview of the size of
the utility respondents in terms of their average system demands.
Figure 3. 2014 WSPS respondents grouped by average daily system demand (n= 479)
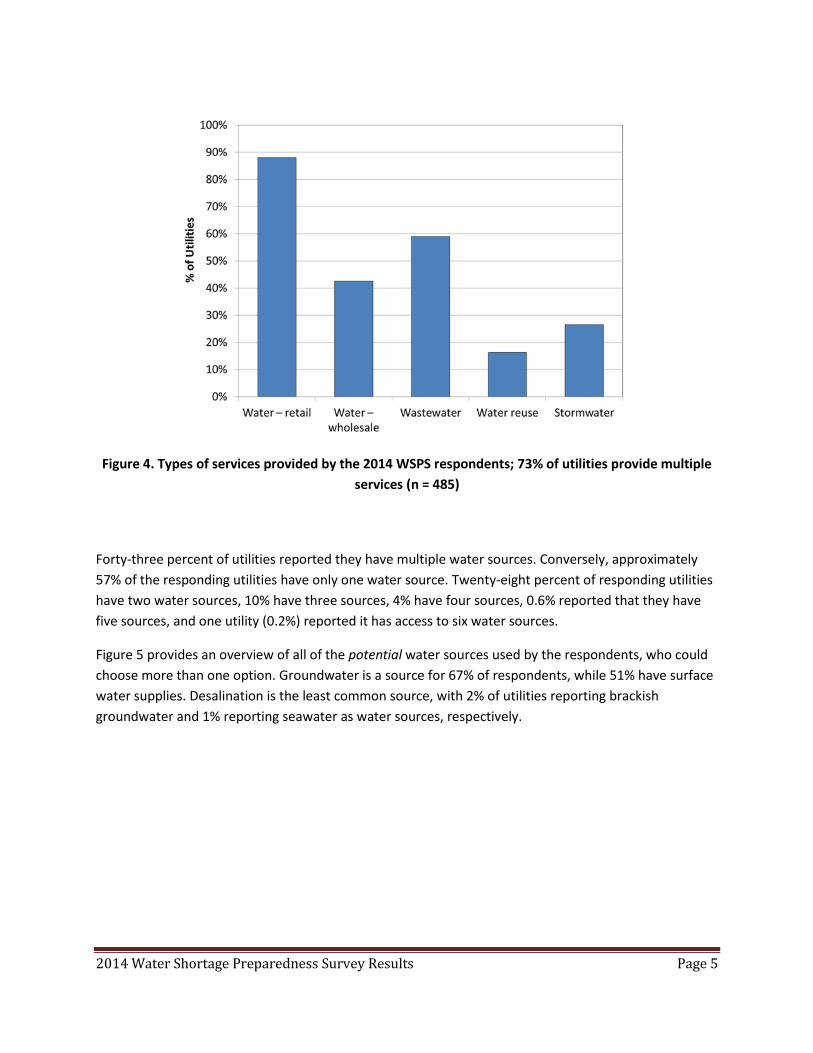
The majority of responding utilities provide retail potable water services (88%), while 59% of
respondents provide wastewater services. Figure 4 presents the various services provided by the
respondents, who could choose more than one option. Seventy-three percent of utilities reported they
provide more than one service. Approximately 27% of the responding utilities provide only one service,
32% provide two services, 26% provide three services, 12% provide four services, and 3% provide all five
services.
2014 Water Shortage Preparedness Survey Results Page 5
Figure 4. Types of services provided by the 2014 WSPS respondents; 73% of utilities provide multiple
services (n = 485)
Forty-three percent of utilities reported they have multiple water sources. Conversely, approximately
57% of the responding utilities have only one water source. Twenty-eight percent of responding utilities
have two water sources, 10% have three sources, 4% have four sources, 0.6% reported that they have
five sources, and one utility (0.2%) reported it has access to six water sources.
Figure 5 provides an overview of all of the potential water sources used by the respondents, who could
choose more than one option. Groundwater is a source for 67% of respondents, while 51% have surface
water supplies. Desalination is the least common source, with 2% of utilities reporting brackish
groundwater and 1% reporting seawater as water sources, respectively.

2014 Water Shortage Preparedness Survey Results Page 6
Figure 5. Potential water sources (n = 485)
As might be expected, groundwater and surface water are the dominant primary sources, with 86% of
respondents reporting one or the other, evenly split. Figure 6 shows the primary water sources as
reported by the responding utilities. Imported water is the least reported primary source of water with
only 3% of utilities reporting it as their primary source.
Figure 6. Primary water sources (n = 485)
2014 Water Shortage Preparedness Survey Results Page 7
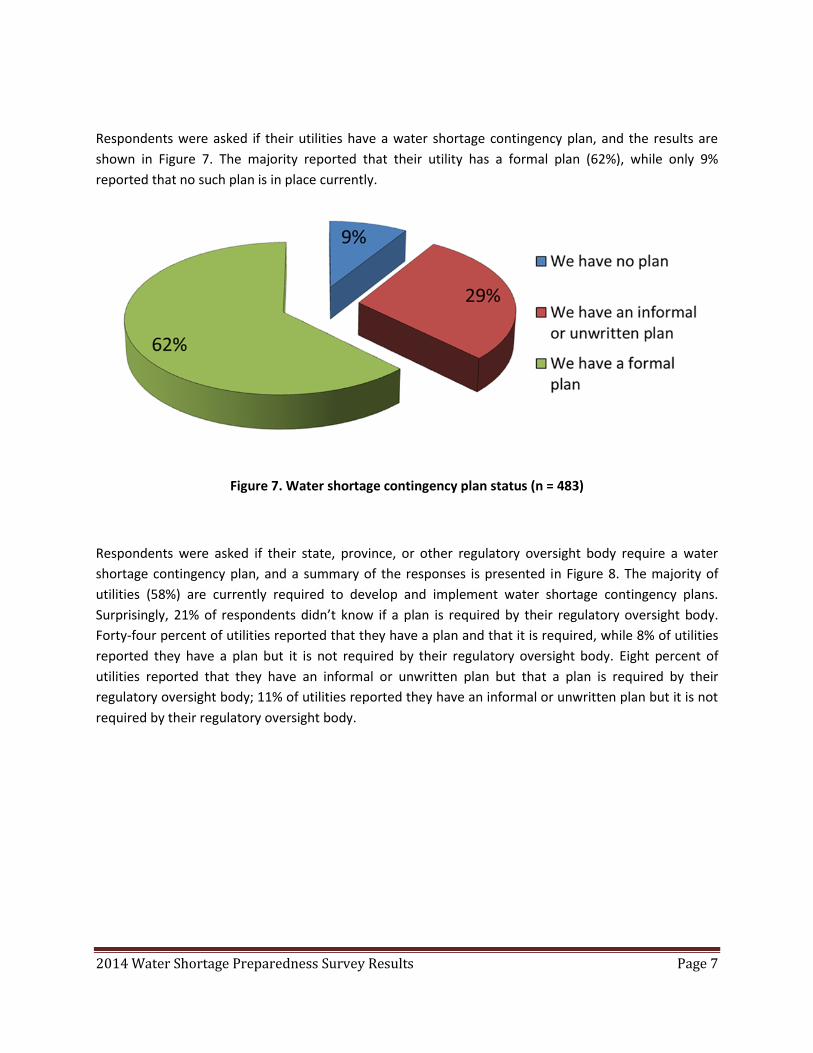
Respondents were asked if their utilities have a water shortage contingency plan, and the results are
shown in Figure 7. The majority reported that their utility has a formal plan (62%), while only 9%
reported that no such plan is in place currently.
Figure 7. Water shortage contingency plan status (n = 483)
Respondents were asked if their state, province, or other regulatory oversight body require a water
shortage contingency plan, and a summary of the responses is presented in Figure 8. The majority of
utilities (58%) are currently required to develop and implement water shortage contingency plans.
Surprisingly, 21% of respondents didn’t know if a plan is required by their regulatory oversight body.
Forty-four percent of utilities reported that they have a plan and that it is required, while 8% of utilities
reported they have a plan but it is not required by their regulatory oversight body. Eight percent of
utilities reported that they have an informal or unwritten plan but that a plan is required by their
regulatory oversight body; 11% of utilities reported they have an informal or unwritten plan but it is not
required by their regulatory oversight body.

2014 Water Shortage Preparedness Survey Results Page 8
Figure 8. Water shortage contingency plan required (n = 434)
Respondents were further asked if their water shortage contingency plans are specific to their utilities or
if they are part of a state or regional plan; results are shown in Figure 9. The majority of utilities (78%)
reported that their plans are specific to their utilities. More than twice as many utilities belong to a
regional plan (11%) compared to those that are part of a state plan (5%).
Figure 9. Water shortage contingency plans – utility-specific or part of a larger plan (n = 435)
Respondents were asked if there are regulatory steps in their regions or states that must be followed
before declaring a water shortage or activating their utilities’ water shortage contingency plans, and a
summary of the responses is presented in Figure 10. Approximately one-third of utilities responded that
they must follow regulatory steps before declaring a water shortage or activating their utilities’
contingency plans.

2014 Water Shortage Preparedness Survey Results Page 9
Figure 10. There are regulatory steps that must be followed before declaring a water shortage or
activating water shortage contingency plans (n = 433)
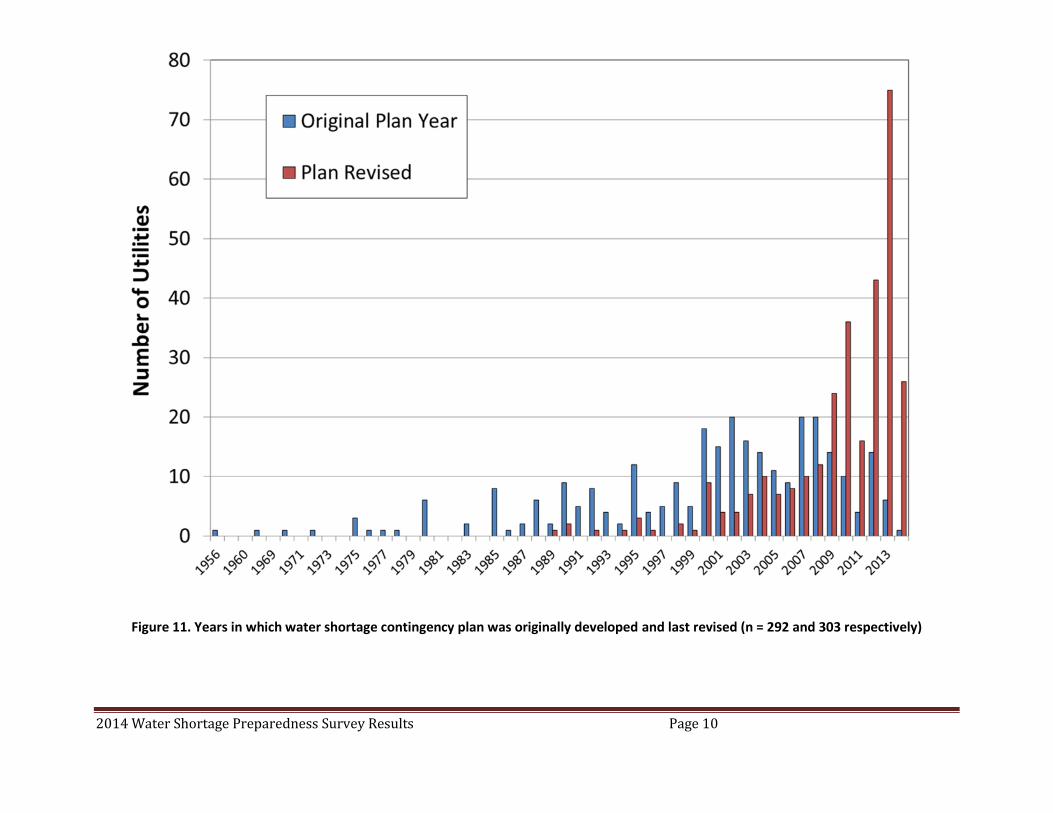
Utility personnel with water shortage contingency plans were asked the following two questions:
In what year was your utility's water shortage contingency plan developed?
In what year was your utility's water shortage contingency plan last updated?
Responses to these questions are shown in Figure 11. It would appear that drought plans began to
become more common in the mid-1980s with more coming into place around the turn of the century,
the same time that the frequency of plan revisions began to increase. Most of the activity from this
group of respondents in recent years has been in the area of revising exisiting plans.
2014 Water Shortage Preparedness Survey Results Page 10
Figure 11. Years in which water shortage contingency plan was originally developed and last revised (n = 292 and 303 respectively)
2014 Water Shortage Preparedness Survey Results Page 11
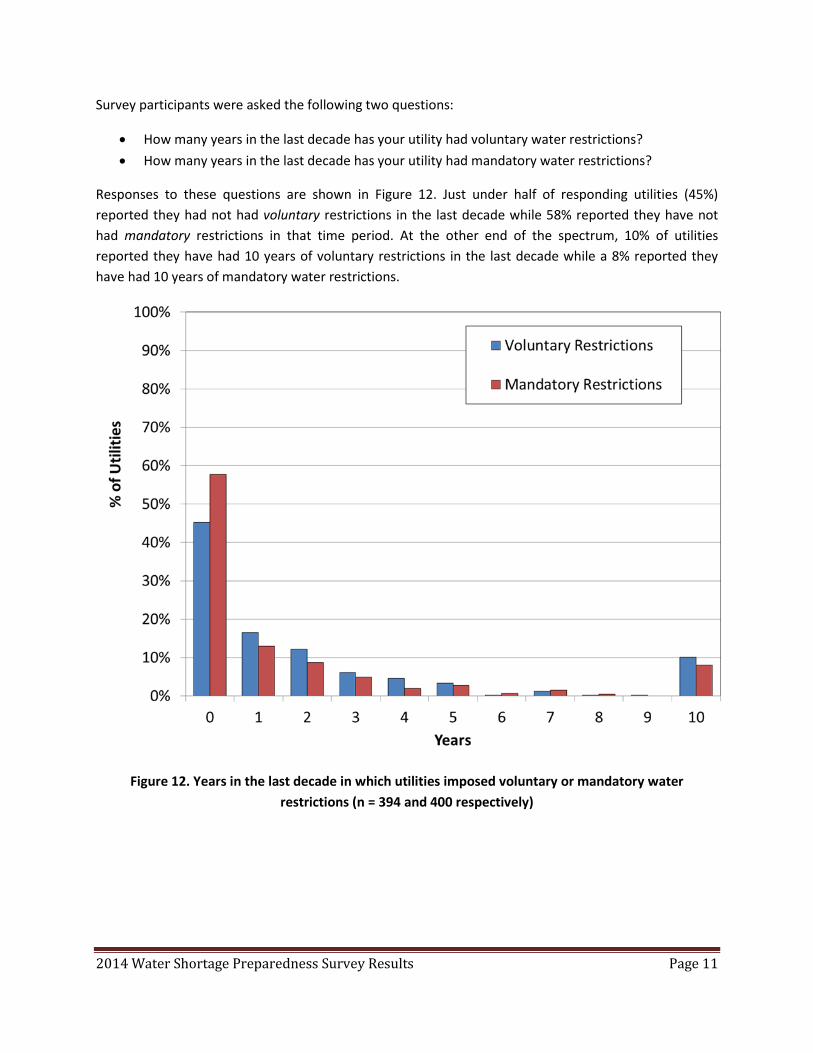
Survey participants were asked the following two questions:
How many years in the last decade has your utility had voluntary water restrictions?
How many years in the last decade has your utility had mandatory water restrictions?
Responses to these questions are shown in Figure 12. Just under half of responding utilities (45%)
reported they had not had voluntary restrictions in the last decade while 58% reported they have not
had mandatory restrictions in that time period. At the other end of the spectrum, 10% of utilities
reported they have had 10 years of voluntary restrictions in the last decade while a 8% reported they
have had 10 years of mandatory water restrictions.
Figure 12. Years in the last decade in which utilities imposed voluntary or mandatory water
restrictions (n = 394 and 400 respectively)
2014 Water Shortage Preparedness Survey Results Page 12
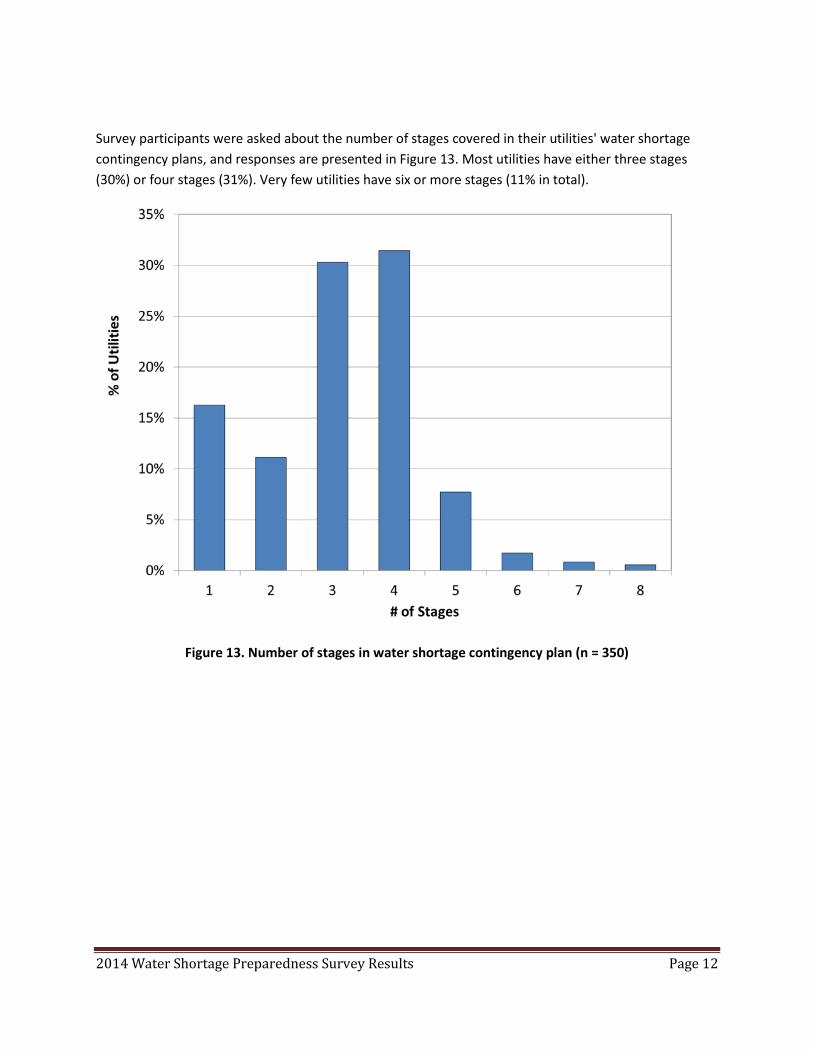
Survey participants were asked about the number of stages covered in their utilities' water shortage
contingency plans, and responses are presented in Figure 13. Most utilities have either three stages
(30%) or four stages (31%). Very few utilities have six or more stages (11% in total).
Figure 13. Number of stages in water shortage contingency plan (n = 350)
2014 Water Shortage Preparedness Survey Results Page 13
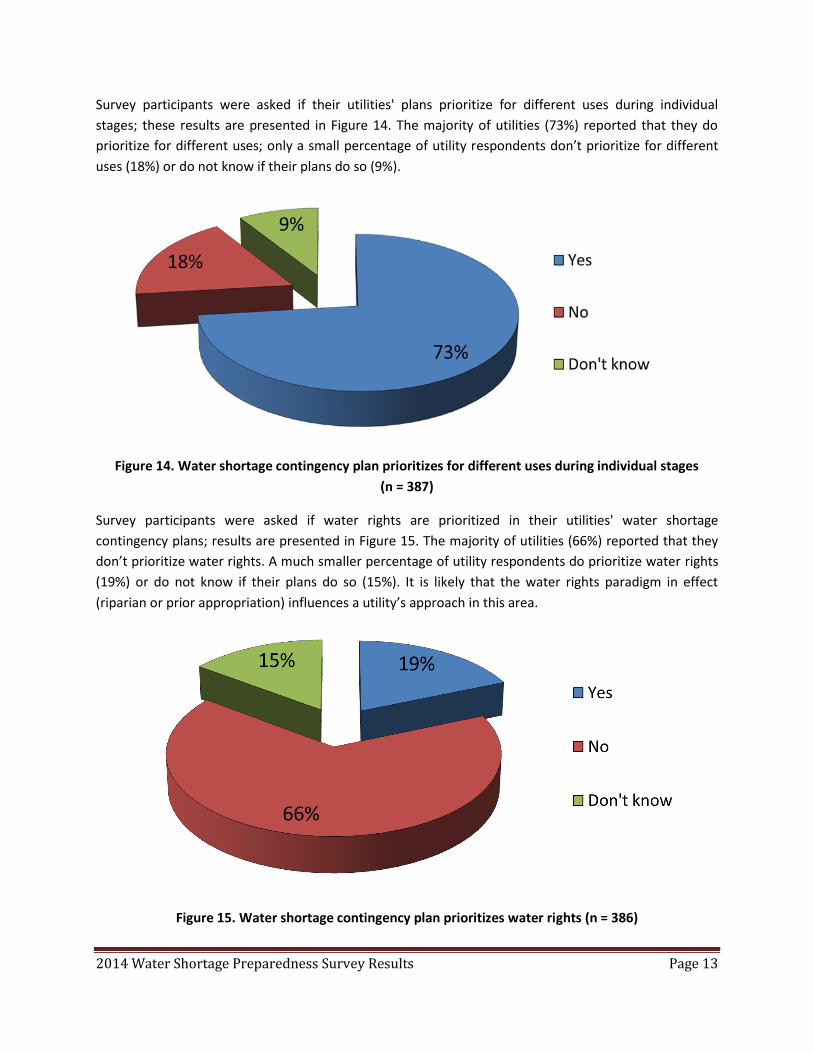
Survey participants were asked if their utilities' plans prioritize for different uses during individual
stages; these results are presented in Figure 14. The majority of utilities (73%) reported that they do
prioritize for different uses; only a small percentage of utility respondents don’t prioritize for different
uses (18%) or do not know if their plans do so (9%).
Figure 14. Water shortage contingency plan prioritizes for different uses during individual stages
(n = 387)
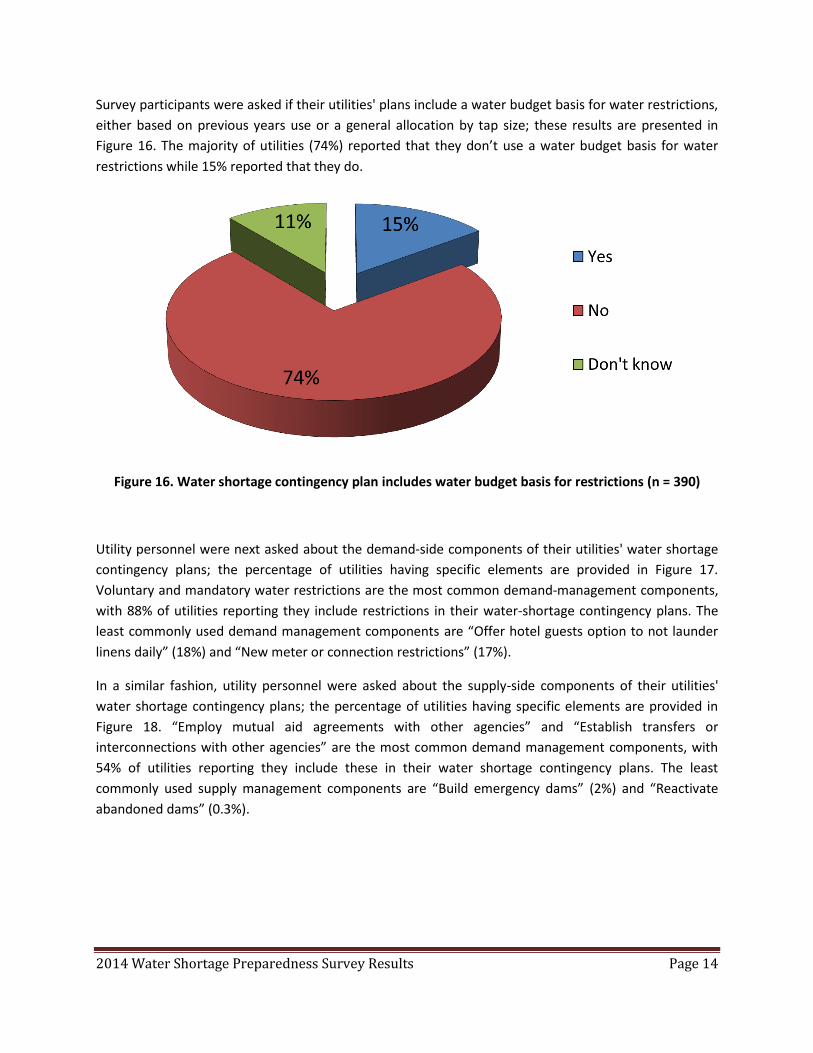
Survey participants were asked if water rights are prioritized in their utilities' water shortage
contingency plans; results are presented in Figure 15. The majority of utilities (66%) reported that they
don’t prioritize water rights. A much smaller percentage of utility respondents do prioritize water rights
(19%) or do not know if their plans do so (15%). It is likely that the water rights paradigm in effect
(riparian or prior appropriation) influences a utility’s approach in this area.
Figure 15. Water shortage contingency plan prioritizes water rights (n = 386)
2014 Water Shortage Preparedness Survey Results Page 14
Survey participants were asked if their utilities' plans include a water budget basis for water restrictions,
either based on previous years use or a general allocation by tap size; these results are presented in
Figure 16. The majority of utilities (74%) reported that they don’t use a water budget basis for water
restrictions while 15% reported that they do.
Figure 16. Water shortage contingency plan includes water budget basis for restrictions (n = 390)
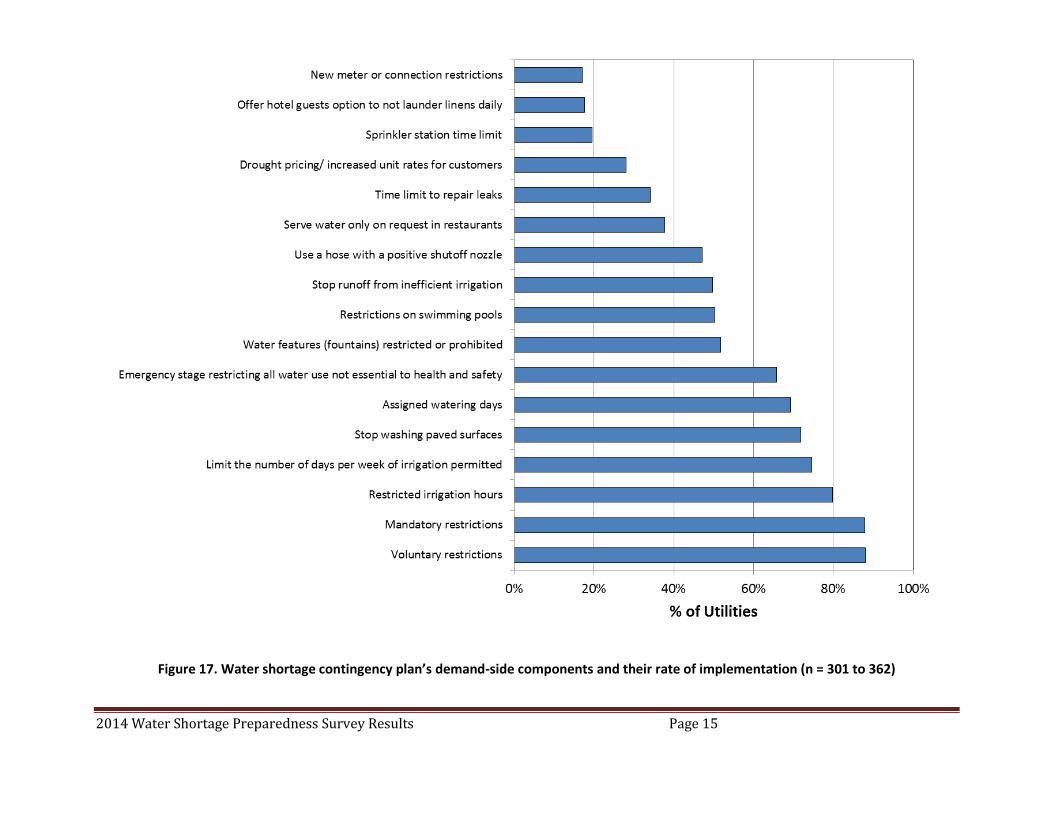
Utility personnel were next asked about the demand-side components of their utilities' water shortage
contingency plans; the percentage of utilities having specific elements are provided in Figure 17.
Voluntary and mandatory water restrictions are the most common demand-management components,
with 88% of utilities reporting they include restrictions in their water-shortage contingency plans. The
least commonly used demand management components are “Offer hotel guests option to not launder
linens daily” (18%) and “New meter or connection restrictions” (17%).
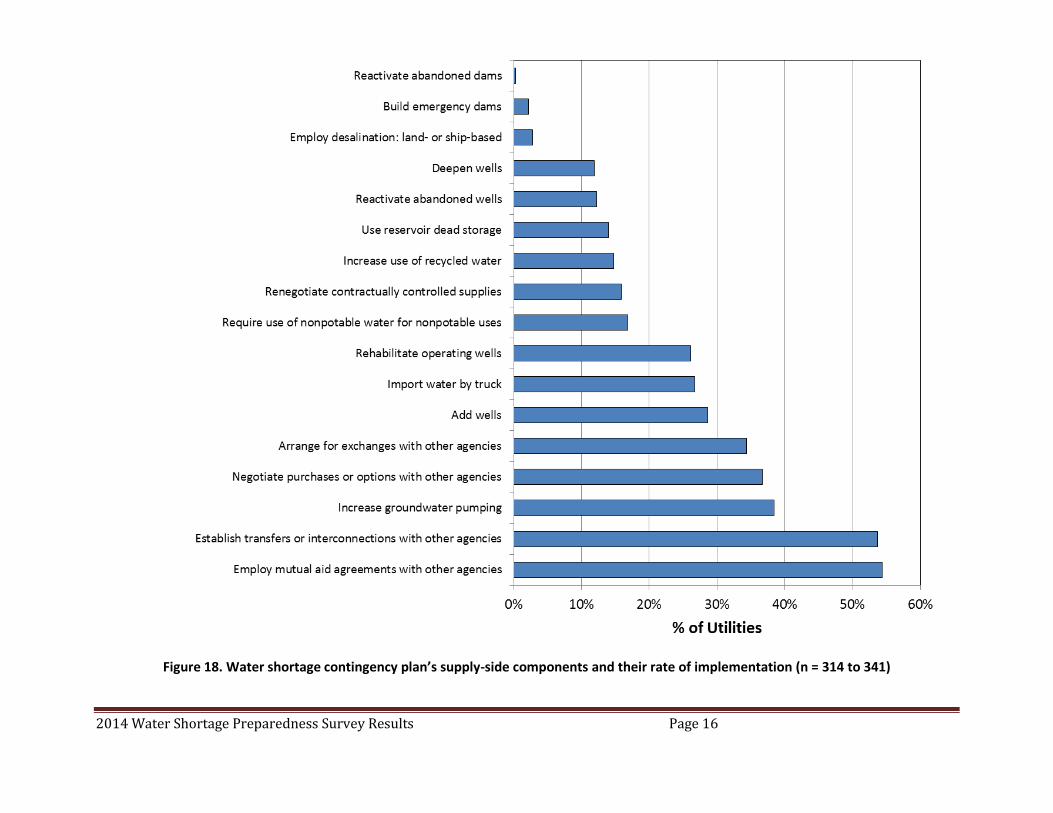
In a similar fashion, utility personnel were asked about the supply-side components of their utilities'
water shortage contingency plans; the percentage of utilities having specific elements are provided in
Figure 18. “Employ mutual aid agreements with other agencies” and “Establish transfers or
interconnections with other agencies” are the most common demand management components, with
54% of utilities reporting they include these in their water shortage contingency plans. The least
commonly used supply management components are “Build emergency dams” (2%) and “Reactivate
abandoned dams” (0.3%).
2014 Water Shortage Preparedness Survey Results Page 15
Figure 17. Water shortage contingency plan’s demand-side components and their rate of implementation (n = 301 to 362)
2014 Water Shortage Preparedness Survey Results Page 16
Figure 18. Water shortage contingency plan’s supply-side components and their rate of implementation (n = 314 to 341)

2014 Water Shortage Preparedness Survey Results Page 17
Utility personnel were asked about the groups specifically addressed in their utilities’ water shortage
contingency plans’ communication strategies; the percentage of utilities reaching out to various
stakeholders are provided in Figure 19. “Local decision makers (e.g., board or city council)” are the most-
reported stakeholder group that utilities specifically address (84%), followed by residential customers
(71%). Surprisingly, 9% of respondents reported they do not have a communication strategy as part of
their utilities’ water shortage contingency plans.
Figure 19. Stakeholder groups specifically identified in water shortage contingency plan’s
communication strategy and their notification priority (n = 356)

2014 Water Shortage Preparedness Survey Results Page 18
Survey participants were asked about enforcement of mandatory water restrictions; results are shown
in Figure 20. The most common group of restriction enforcers is utility operations field staff (75%) while
the least reported group is meter monitoring/advanced metering infrastructure (15%).
Figure 20. Who enforces mandatory water restrictions (n = 356)
2014 Water Shortage Preparedness Survey Results Page 19
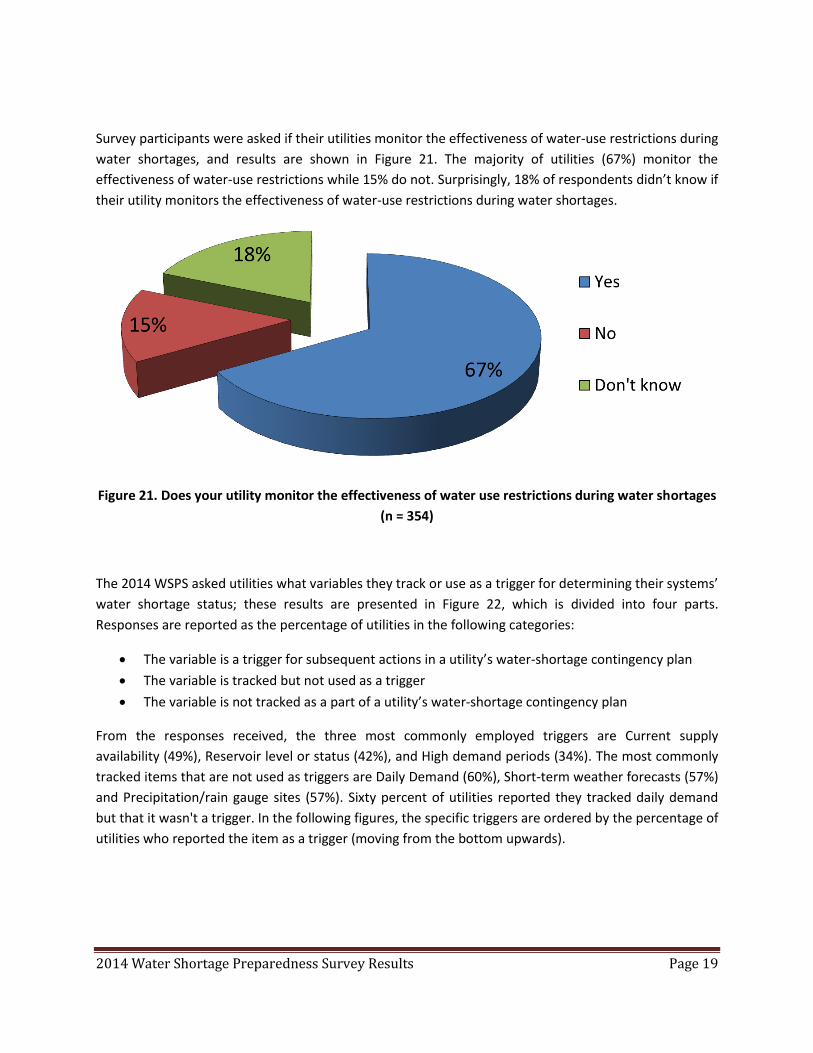
Survey participants were asked if their utilities monitor the effectiveness of water-use restrictions during
water shortages, and results are shown in Figure 21. The majority of utilities (67%) monitor the
effectiveness of water-use restrictions while 15% do not. Surprisingly, 18% of respondents didn’t know if
their utility monitors the effectiveness of water-use restrictions during water shortages.
Figure 21. Does your utility monitor the effectiveness of water use restrictions during water shortages
(n = 354)
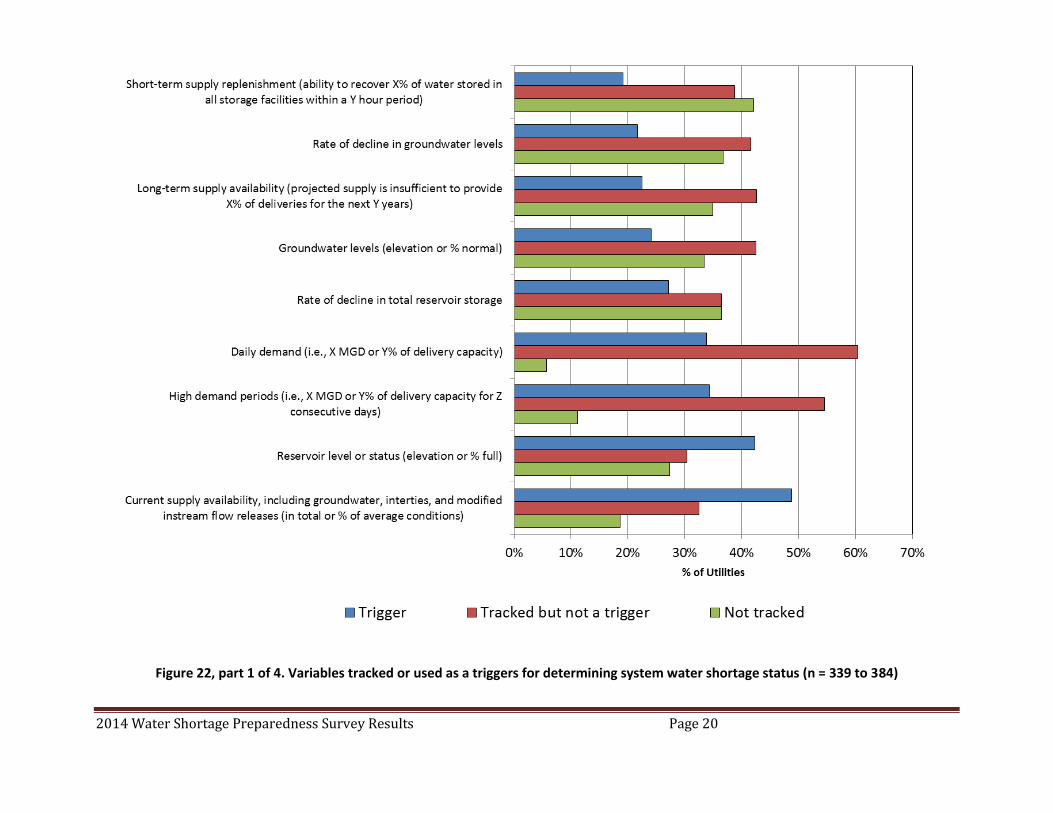
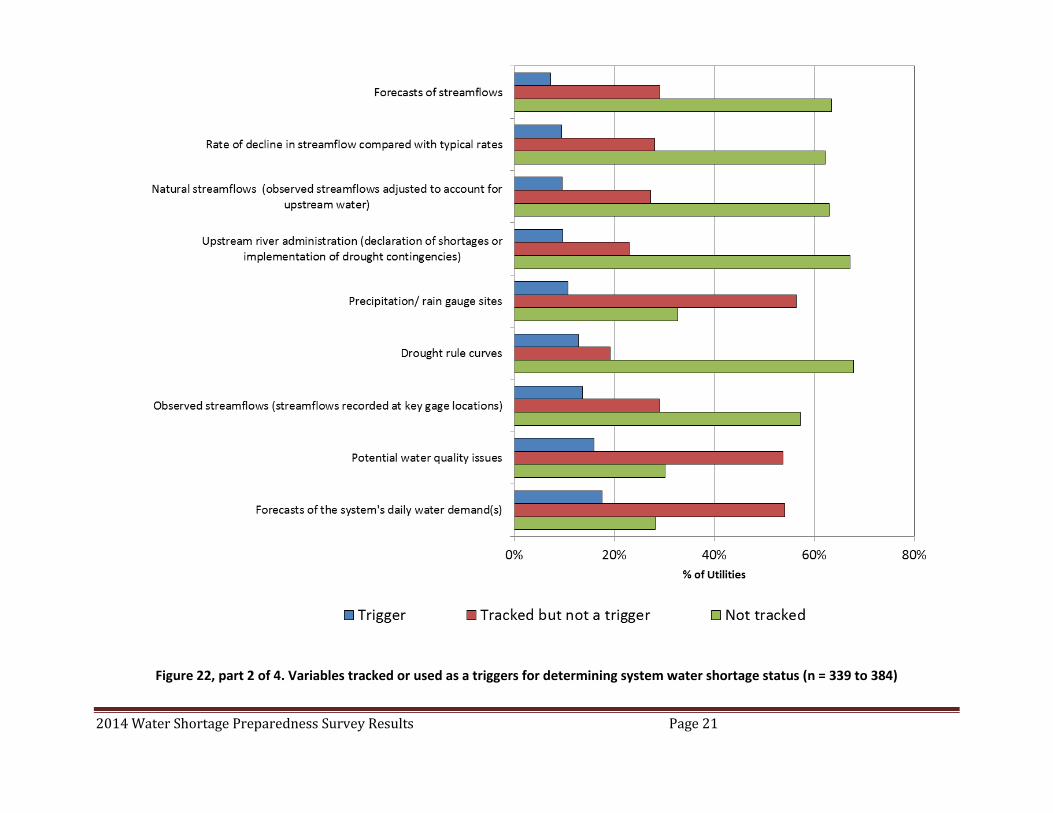
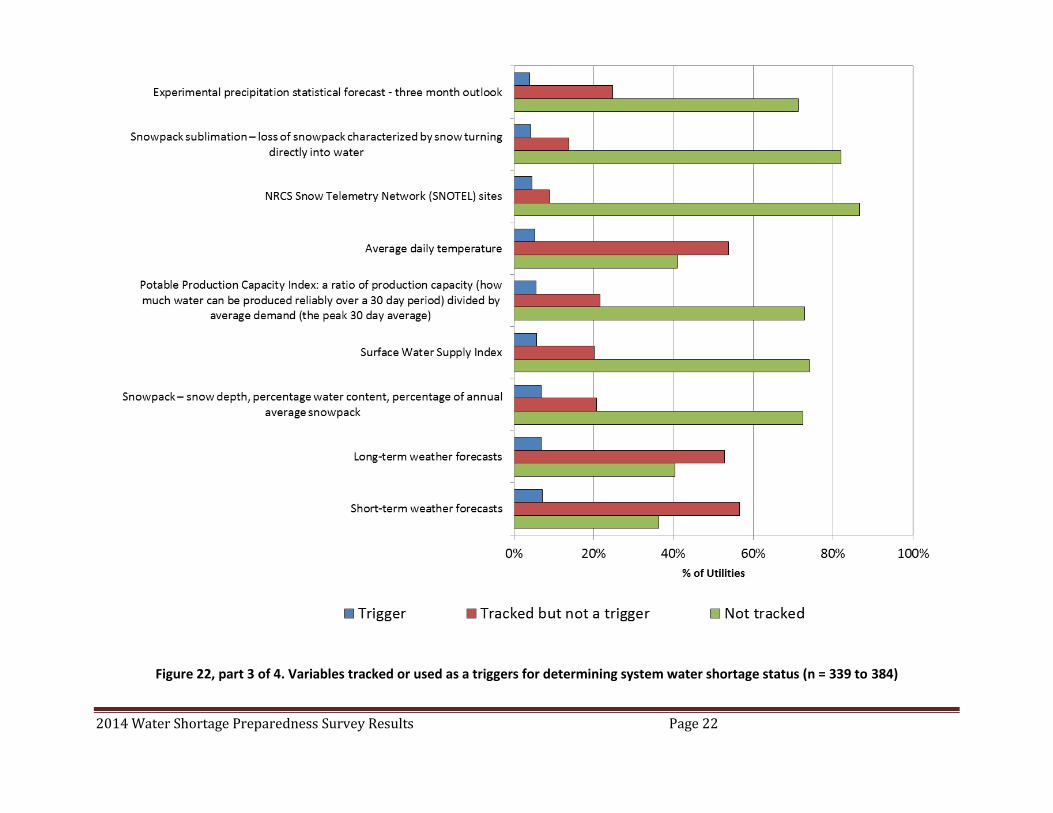
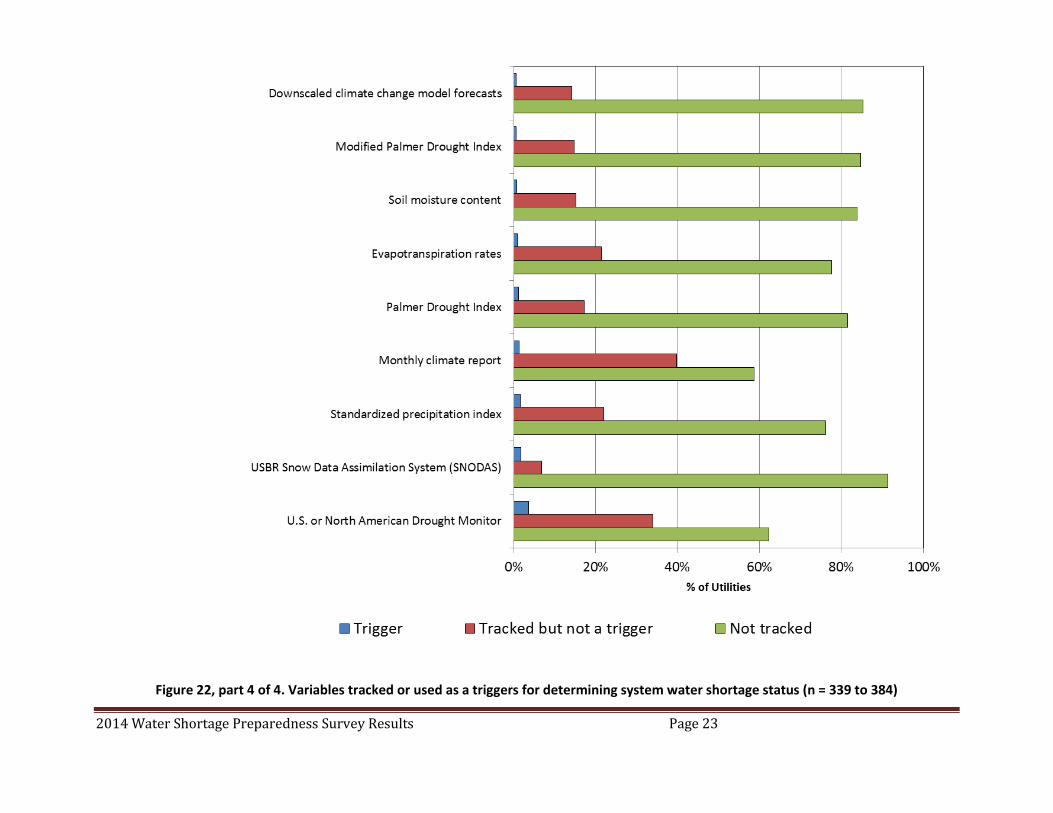
The 2014 WSPS asked utilities what variables they track or use as a trigger for determining their systems’
water shortage status; these results are presented in Figure 22, which is divided into four parts.
Responses are reported as the percentage of utilities in the following categories:
The variable is a trigger for subsequent actions in a utility’s water-shortage contingency plan
The variable is tracked but not used as a trigger
The variable is not tracked as a part of a utility’s water-shortage contingency plan
From the responses received, the three most commonly employed triggers are Current supply
availability (49%), Reservoir level or status (42%), and High demand periods (34%). The most commonly
tracked items that are not used as triggers are Daily Demand (60%), Short-term weather forecasts (57%)
and Precipitation/rain gauge sites (57%). Sixty percent of utilities reported they tracked daily demand
but that it wasn't a trigger. In the following figures, the specific triggers are ordered by the percentage of
utilities who reported the item as a trigger (moving from the bottom upwards).
2014 Water Shortage Preparedness Survey Results Page 20
Figure 22, part 1 of 4. Variables tracked or used as a triggers for determining system water shortage status (n = 339 to 384)
2014 Water Shortage Preparedness Survey Results Page 21
Figure 22, part 2 of 4. Variables tracked or used as a triggers for determining system water shortage status (n = 339 to 384)
2014 Water Shortage Preparedness Survey Results Page 22
Figure 22, part 3 of 4. Variables tracked or used as a triggers for determining system water shortage status (n = 339 to 384)
2014 Water Shortage Preparedness Survey Results Page 23
Figure 22, part 4 of 4. Variables tracked or used as a triggers for determining system water shortage status (n = 339 to 384)

2014 Water Shortage Preparedness Survey Results Page 24
Survey participants were asked if their utilities have water conservation plans. A water conservation
plan was defined to contain a utility's policies, procedures, and programs that result in the efficient use
of water, in its operations and by the public, through a balanced approach combining demand
management and supply-side practices. The results, as shown in Figure 23, show that the majority of
respondents (69%) have a water conservation plan while 28% reported their utility does not have a
water conservation plan.
Figure 23. Does your utility have a water conservation plan (n = 387)
Survey participants were then asked if their utilities' water conservation plans include residential
efficiency programs; results are provided in Figure 24. The majority of respondents (54%) have a water
conservation plan that includes residential efficiency programs, but 42% reported their utility does not.
Based on the results shown in Figure 23, approximately 15% of utilities with water conservation plans do
not include residential efficiency programs
Figure 24. Does your utility have a water conservation plan that includes residential efficiency
programs (n = 388)

2014 Water Shortage Preparedness Survey Results Page 25
Finally, survey participants were asked if their utilities' water conservation plans include commercial,
institutional, and industrial (CII) efficiency programs; results are provided in Figure 25. Forty-four
percent responded that their utilities have water conservation plans that include CII efficiency programs.
Based on the results shown in Figure 23, approximately 25% of utilities with water conservation plans do
not include CII efficiency programs.
Figure 25. Does your utility have a water conservation plan that includes commercial, institutional,
and industrial (CII) efficiency programs (n = 387)
CONCLUSIONS Water supply needs are dramatically impacted by drought, and following several dry years, many areas
in North America may again face drought conditions in 2014. In AWWA’s 2014 State of the Water
Industry report, "drought/periodic water shortages" was ranked as the #8 most important issue facing
water professionals. Future water shortages, short- and long-term, may be exacerbated by climate
change, which can magnify a water shortage's effects. For example, water quality changes brought
about by drought-impacted watersheds can impact supply and treatment, especially if the watershed
then experiences an extreme event such as flooding or wildfire.
The results of the 2014 Water Shortage Preparedness Survey are intended to serve as a foundation for
action and further discovery. Water professionals across North American continue to meet society’s
expectations for safe and clean water by developing and implementing solutions to solve difficult issues,
including water shortages. As we confront these challenges, AWWA will continue to serve as a bridge
organization, uniting the worlds of science and research, policy, and practice to address these critical
issues.

2014 Water Shortage Preparedness Survey Results Page 26
APPENDIX 1: Responses by Location
Lo ca tio n Re sp o nse s% o f T o ta l
Re sp o nseLo ca tio n Re sp o nse s
% o f T o ta l
Re sp o nse
Atlantic Canada 0 0.0% ND 2 0.4%
AK 14 2.9% NE 8 1.6%
AL 2 0.4% New Brunswick 2 0.4%
Alberta 2 0.4% Newfoundland 1 0.2%
AR 5 1.0% NH 2 0.4%
AZ 31 6.4% NJ 36 7.4%
British Columbia 5 1.0% NM 2 0.4%
CA 52 10.7% Northwest Territories 0 0.0%
CO 14 2.9% Nova Scotia 1 0.2%
CT 2 0.4% Nunavut 0 0.0%
DC 0 0.0% NV 6 1.2%
DE 1 0.2% NY 8 1.6%
FL 33 6.8% OH 11 2.3%
GA 12 2.5% OK 4 0.8%
Guam 1 0.2% Ontario 7 1.4%
HI 0 0.0% OR 13 2.7%
IA 15 3.1% PA 3 0.6%
ID 3 0.6% PR 1 0.2%
IL 25 5.2% Quebec 0 0.0%
IN 9 1.9% RI 3 0.6%
KS 4 0.8% Saskatchewan 1 0.2%
KY 5 1.0% SC 3 0.6%
LA 2 0.4% SD 3 0.6%
MA 7 1.4% TN 8 1.6%
Manitoba 0 0.0% TX 26 5.4%
MD 2 0.4% UT 6 1.2%
ME 2 0.4% VA 10 2.1%
Mexico 1 0.2% VI 0 0.0%
MH 0 0.0% VT 0 0.0%
MI 12 2.5% WA 12 2.5%
MN 11 2.3% WI 8 1.6%
MO 5 1.0% WV 2 0.4%
MS 2 0.4% WY 3 0.6%
MT 1 0.2% Yukon Territories 0 0.0%
NC 13 2.7%
T OT AL 485 100.0%

2014 Water Shortage Preparedness Survey Results Page 27
APPENDIX 2: 2014 Water Shortage Preparedness Survey Questions
In order to help water utilities facing current and/or future water shortages, AWWA has undertaken this
survey to collect water shortage tracking and response information. A water shortage occurs when
supply is reduced to a level that cannot support existing demands. Natural forces (e.g., drought), system
component failure or interruption, or regulatory actions may cause water shortages. Such conditions
could last two to three months or extend over many years.
The survey should take ~ 15 minutes to complete; thanks in advance for your contribution to this
collective effort.
Respondent Information
Name:
Position/Title:
Email:
Utility Information
Name:
Address:
City:
State/Province:
Zip Code:
Utility ownership
Publicly owned
Private/investor owned
Services provided (check all that apply)
Water – retail
Water – wholesale
Wastewater
Water reuse
Stormwater
Please select your utility’s number of customer service connections; if you need to estimate, use the
following: Customer Service Connections ~ (Retail and/or Wholesale Population Served)/3.5
0 to 5,000
5,001 to 10,000
2014 Water Shortage Preparedness Survey Results Page 28
10,001 to 25,000
25,001 to 50,000
50,001 to 100,000
100,001 to 150,000
Over 150,000
Average system demand
< 5 MGD
5-15 MGD
16-30 MGD
31-50 MGD
> 50 MGD
Water sources (check all that apply)
Surface water supplies
Groundwater
Wholesale water from another utility
Imported water from another region
Desalination – brackish groundwater
Desalination – seawater
Reuse
Which of the above is your utility's predominant water source?
How does your utility define a water shortage?
Does your utility have a water shortage contingency plan?
We have no plan
We have an informal or unwritten water shortage contingency plan that may include rationing
and/or other demand reduction measures
We have a formal water shortage contingency plan that includes rationing and/or other demand
reduction measures
Does your state, province, or other regulatory oversight body require a water shortage contingency
plan?
Yes
No
Don't know

2014 Water Shortage Preparedness Survey Results Page 29
Is your plan specific to your utility or is it part of a state or regional plan?
Utility specific
Part of a state plan
Part of a regional plan
Don't know
Are there regulatory steps in your region or state that must be followed before declaring a water
shortage or activating your utility's contingency plan?
Yes
No
Don't know
If yes, briefly explain these steps:
In what year was your utility's water shortage contingency plan developed?
In what year was your utility's water shortage contingency plan last updated?
If your utility's water shortage contingency plan is publicly available online, please provide the web
address in the space below:
How many years in the last decade has your utility had voluntary water restrictions?
How many years in the last decade has your utility had mandatory water restrictions?
How many stages are covered in your utility's water shortage contingency plan?
Does your utility's plan prioritize for different uses during individual stages?
Yes
No
Don't know
Are water rights prioritized in your utility's water shortage contingency plan?
Yes
No
Don't know
If yes, briefly explain how:
2014 Water Shortage Preparedness Survey Results Page 30
Does your utility’s water shortage contingency plan include a water budget basis for water restrictions
(based on previous years use or a general allocation by tap size)?
Yes
No
Don't know
Please indicate which of the following are demand-side components of your utility's water shortage
contingency plan:
Voluntary restrictions
Mandatory restrictions
Restricted irrigation hours
Limit no of days/week irrigation permitted
Assigned watering days
Sprinkler station time limit
Restrictions on swimming pools
Water features (fountains) restricted or prohibited
New meter or connection restrictions
Time limit to repair leaks
Stop washing paved surfaces
Stop runoff from inefficient irrigation
Use a hose with a positive shutoff nozzle
Serve water only on request in restaurants
Offer hotel guests option to not launder linens daily
Drought pricing/ increased unit rates for customers
Emergency stage restricting all water use not essential to health and safety
Other (please specify)
Please indicate which of the following are supply-side components of your utility's water shortage
contingency plan:
Increase groundwater pumping
Increase use of recycled water
Require use of nonpotable water for nonpotable uses
Build emergency dams
Reactivate abandoned dams
Employ desalination—land or ship-based
Import water by truck
Rehabilitate operating wells
Deepen wells
Add wells

2014 Water Shortage Preparedness Survey Results Page 31
Reactivate abandoned wells
Renegotiate contractually controlled supplies
Use reservoir dead storage
Negotiate purchases or options with other agencies
Arrange for exchanges with other agencies
Establish transfers or interconnections with other agencies
Employ mutual aid agreements with other agencies
Other (please specify)
Which of the following groups are specifically addressed in your utility's water shortage contingency
plan's communication strategy (choose all that apply)?
Local decision makers (e.g., board or city council)
Governmental bodies (e.g., park and fire departments)
Residential customers
Nonresidential customers
Wholesale customers
News media
Public
Don't have a communication strategy
Other (please specify)
Who enforces mandatory water restrictions (choose all that apply)?
Utility operations field staff
Utility drought enforcement field staff
Utility meter monitors (AMR)
Law enforcement
Other (please specify)
Does your utility monitor the effectiveness of water use restrictions during a water shortage?
Yes
No
Don't know
If yes, briefly explain how:
2014 Water Shortage Preparedness Survey Results Page 32
Which of the following variables does your utility track or use as a trigger for determining your system’s
water shortage status?
Daily demand (i.e., X MGD or Y% of delivery capacity)
High demand periods (i.e., X MGD or Y% of delivery capacity for Z consecutive days)
Forecasts of the system's daily water demand(s)
Current supply availability, including groundwater, interties, and modified in-stream flow
releases (in total or % of average conditions)
Short-term supply replenishment (ability to recover X% of water stored in all storage facilities
within a Y hour period)
Long-term supply availability (projected supply is insufficient to provide X% of deliveries for the
next Y years)
Reservoir level or status (elevation or % full)
Drought rule curves
Rate of decline in total reservoir storage
Observed streamflows (streamflows recorded at key gage locations)
Natural streamflows (observed streamflows adjusted to account for upstream water)
Rate of decline in stream flow compared with typical rates
Forecasts of streamflows
Precipitation/ rain gauge sites
Experimental precipitation statistical forecast three month outlook
Average daily temperature
Short-term weather forecasts
Long-term weather forecasts
Monthly climate report
Groundwater levels (elevation or % normal)
Rate of decline in groundwater levels
Soil moisture content
Evapotranspiration rates
Snowpack – snow depth, percentage water content, percentage of annual average snowpack
Snowpack sublimation – loss of snowpack characterized by snow turning directly into water
NRCS Snow Telemetry Network (SNOTEL) sites
USBR Snow Data Assimilation System (SNODAS
Downscaled climate change model forecasts
Standardized precipitation Index
Surface water supply Index
Palmer Drought Index
Modified Palmer Drought Index
Potable production capacity index: a ratio of production capacity (how much water can be
produced reliably over a 30 day period) divided by average demand (the peak 30 day average)

2014 Water Shortage Preparedness Survey Results Page 33
U.S. or North American Drought Monitor
Potential water quality issues
Upstream river administration (declaration of shortages or implementation of drought
contingencies)
Other please specify
Does your utility have a water conservation plan? A water conservation plan contains a utility's policies,
procedures, and programs that result in the efficient use of water, in its operations and by the public,
through a balanced approach combining demand management and supply-side practices.
Yes
No
Don't know
Does your utility have a water conservation plan that includes residential efficiency programs?
Yes
No
Don't know
Does your utility have a water conservation plan that includes commercial, institutional, and industrial
(CII) efficiency programs?
Yes
No
Don't know
Thank you for participating in the 2014 Water Shortage Preparedness Survey. Your results will be
submitted to AWWA by clicking the submit button below. Results and analysis will be made available at
AWWA's Annual Conference, June 8-12 in Boston, Mass. as well as through a 2014 article in the Journal
American Water Works Association, and ultimately on AWWA's Drought Resource Community.
If you have any unique or interesting drought management solutions that could serve as a case study for
future AWWA guidance, please send a message to [email protected] and we will add it to our
Drought Resource Community.


![Water shortage[1]](https://img.pdfslide.us/doc/110x75/556132e4d8b42a263b8b46da/water-shortage1.jpg)