Embed Size (px)
Citation preview

1
MVNO landscape: Global perspectives and New Zealand Applications Non-Confidential Report Date: May 14th 2019 Authors: Arun Dehiri Gareth Williams For further information, contact: Arun Dehiri Managing Director Red Dawn Consulting Ltd Mobile: +44 (0)7970 653134 Landline: +44 (0) 3333 013 450 Email: [email protected]
UK office
The Junction Station Road
Watford WD17 1ET
United Kingdom

2
Contents 1. Introduction ...................................................................................................................... 4
1.1. Report objective ....................................................................................................... 4 1.2. Analytical approach .................................................................................................. 4
2. Executive Summary ......................................................................................................... 5 3. The MVNO model ............................................................................................................ 8
3.1. Definitions ................................................................................................................ 8 3.2. MVNO ecosystem .................................................................................................. 10 3.3. MVNO and adjacent operating models .................................................................. 11 3.4. The rise of the MVNE ............................................................................................. 14
4. Global MVNO drivers ..................................................................................................... 17 5. Global MVNO landscape ............................................................................................... 19
5.1. Mobile growth globally ............................................................................................ 19 5.2. MVNO growth globally ........................................................................................... 20 5.3. MVNO adoption per region .................................................................................... 21 5.4. MVNO segments .................................................................................................... 22 5.5. Benefits to consumers ............................................................................................ 25 5.6. Regulation .............................................................................................................. 26
6. Country deep-drill ........................................................................................................... 27 6.1. Country overview ................................................................................................... 27 6.2. New Zealand .......................................................................................................... 28 6.3. United Kingdom ...................................................................................................... 36 6.4. The Netherlands ..................................................................................................... 40 6.5. Australia ................................................................................................................. 45
7. Implications and recommendations ............................................................................... 50

3
Glossary of terms ACMA Australian Communications and Media Authority APAC Asia-Pacific ARPU Average Revenue Per User BSS Business Support Systems BYOD Bring Your Own Device ERP Enterprise Resource Planning GCSB ICT
The Government Communications Security Bureau Information and Communications Technology
IPO Initial Public Offering KPI Key Performance Indicator MNO Mobile Network Operator MTR Mobile Termination Rate MVNA Mobile Virtual Network Aggregator MVNE Mobile Virtual Network Enabler MVNO Mobile Virtual Network Operator NRA National Regulatory Authority NZ New Zealand OECD Organisation for Economic Co-operation and Development OSS Operational Support System OTT Over-The-Top (applications) SaaS Software as a Service SLA Service Level Agreement SME Small-Medium Enterprise UK United Kingdom US/USA United States of America VHA Vodafone Hutchison Australia VoIP Voice over IP VR Virtual Reality YOY Year-on-year

4
1. Introduction
1.1. Report objective This report analyses the reasons for the apparent lack of lack of mobile virtual network operators (MVNOs) in the New Zealand (NZ) mobile market relative to other global markets. The analysis is being undertaken as part of a wider market study of the NZ mobile telecommunications market, to understand relevant global trends and assess whether there are any potential barriers to competition. This in turn will help establish if future market interventions are required amongst policy makers, industry participants, regulatory and legislative bodies, or if industry self-regulation is more appropriate. By comparing the NZ market to relevant markets across the globe, an assessment has been made as to whether the MVNO model is a feasible structure to stimulate competition and enable greater customer choice, whilst ensuring effective utilisation of network capacity. Alternative models adjacent to the MVNO model have also been considered (e.g. reseller model – see Section 3.3). This report addresses response submissions to The Commerce Commission’s Mobile Market Study Issues paper published on 31 August 2018.
1.2. Analytical approach An explanation of the MVNO model and adjacent models has been provided, together with the reasons why it has become prominent in many markets across the world. A global snapshot of the MVNO market today has been provided, with a view on where the market is heading over the next 5-10 years. For the MVNO model to succeed, a set of conditions in each market related to scale, economics and service development (as described in Section 4) need be met from the perspective of end customers, mobile network operators (MNOs) and MVNOs. These market conditions have been described and a framework has been used to assess whether the NZ market adheres to those conditions. In addition to the high-level global snapshot, several countries have been analysed to understand at a more granular level what factors have driven or restricted MVNO growth. These factors have then been compared to the NZ market, to identify any risks and opportunities and derive learnings and best practices which can be leveraged to stimulate MVNO growth in NZ. The countries selected for analysis are not too dissimilar to NZ, they share a similar set of characteristics, based on population size, competitiveness, regulatory etc. The focus of the analysis is the MVNO market as it relates to consumers and enterprises. IoT/ M2M services have also been considered in this paper. This is because many IoT MVNOs rely on mobile connectivity from MNOs, in addition to other connectivity methods such as Wi-Fi and alternative low power networks.

5
2. Executive Summary Since the first mainstream launch by Virgin in 1999, the MVNO model has gained considerable traction globally, leading to 1,482 MVNOs today (see Figure 1). There are also 296 MNO owned sub-brands, which is similar to the MVNO model in the objective it sets out to achieve, i.e. to stimulate competition and serve incremental customer segments with more choice. Globally, there are approximately 337m customers connected to an MVNO, representing 4% of overall connections (5% including sub-brands)1. Sub-brands have been slow to take off as MNOs have generally not been equipped to support a new brand with a separate flexible operating infrastructure. Sub-brands are a more recent concept than MVNOs and are gaining in popularity with MNOs as a way of targeting new segments which are not addressable by parent brands. MNOs are increasingly using platforms which have gained in maturity due to the MVNO model to facilitate new sub-brand launches. These platforms are commonly referred to as MVNEs (mobile virtual network enablers) which provide flexible support systems such as billing, provisioning and customer care interfaces. The number and success of MVNOs differs hugely country-by-country, which must be considered when deriving implications for the NZ market. To derive relevant comparisons to NZ, we have focused on countries which have been saturated in terms of mobile penetration for some time, given the MVNO model has greater relevance to markets looking to take growth beyond levels which can be achieved by the main operators only. We have also focused on countries where MVNOs are permitted, either regulated or not. Applying this lens, at one extreme are counties such as Netherlands, in which 33% of connections are on an MVNO or sub-brand2. At the other end is NZ, where only 1% of the country’s connections are hosted by MVNOs, and if we include sub-brands the share is 5%3. The key question we are addressing in this paper is: Why have MVNOs failed to grab a significant slice of NZ’s mobile market since they first launched in 2007? At first glance, the main restriction is the size of the available mobile market. A population of 4.8m, with 6.1m connections4, does not appear to provide sufficient critical mass - i.e. niche segments will be small in terms of number of subscribers and the business case to support such small MVNOs may not. The wholesale rate also becomes harder to negotiate for smaller scale MVNOs. By breaking down the MVNO model, we identify models that minimise the barriers to entry and the issue of critical mass. These models include joint venture, reseller, service provider and light MVNO, which need less capital expenditure and have lower running costs when compared to a Full MVNO. In addition, the operator owned sub-brand model, which is similar to the MVNO model, can also be used to stimulate competition and innovation. These lighter models are made possible by the maturity of MVNEs which lower on-board cost and time to market.
1 RDC analysis, based on World Bank, World Trade Organisation and regional (e.g. ACMA) data, 2019 2 RDC analysis, based on Telecompaper data, 2019 3 RDC analysis, based on operator announcements 4 RDC analysis, based on World Bank and World Tarde Organisation data, 2019

6
In general, MVNOs across the globe support nine key segments5 (e.g. youth/media), as shown in Section 5.4. NZ could sustain wholesale models for the larger of these segments in terms of customer numbers, being discount, retail, youth/ media, bundled and business. There have already been launches in most of these areas, but to date with limited growth. With the introduction of measures we propose, there is likely to be growth potential in the retail, youth/ media plus IoT/ data segments within NZ. Each MVNO serving these segments will have a feature or assets which an MNO will lack – for example, significant distribution with retail outlets such as supermarkets or content services attracting the youth market. MVNOs provide a brand affiliation and tailored customer service which ‘speaks the language’ of the customers in that segment – a specific example being the ethnic segment, where languages and cultural awareness plays a large part in attracting customers. Our analysis shows that even in countries with small mobile markets, the MVNO model can flourish. Providing service innovation, bundled digital customer experiences, more flexible tariffs and better value for money. The Netherlands has a relatively small population, and yet is home to around 65 MVNOs and sub brands6. Where there is an open wholesale market, the biggest commercial driver for uptake of the MVNO model is the willingness of MNOs to open capacity to third parties. This is a somewhat intangible aspect to measure, however in most markets, the environment is boosted by a fully developed main operator within a country leading the way and the others following suit. These ambassador networks recognise that their capacity will not be utilised by the segments they are unable to serve because their brands are too established and polarised, and it can be expensive to target these niche segments. A new brand may be able to reduce acquisition costs due to their existing relationship or closer touchpoints with customers. They also accept that MVNOs may be able to provide differentiated services (such as a media bundle) which a traditional network cannot. An example of an operator which stood out and led the way wholesale is KPN in the Netherlands, now hosting 6 out of the top 9 MVNO and sub-brands. In the UK, Telefonica’s O2 dominates at approximately 40% of the wholesale market7. We conclude that there is some room for MVNO growth in the NZ market, and anticipate this model could represent 10-15% of the market in the next 5-10 years8. Given the number of subscribers required by new entrants to achieve breakeven, and the population of NZ, we anticipate the market can sustain approximately 10-15 MVNO players. Incremental growth opportunities will come from the youth, enterprise and IoT/M2M markets including, to a smaller extent, consumers adopting multiple connected devices (e.g. wearables such as smart watches). For MVNOs to succeed in NZ, we propose a number of recommendations detailed in Section 7. Our recommendations start with validating the MVNO market to understand the market size and where specific opportunities lie. This involves analysing which segments are underserved (i.e. where MNOs do not provide communication, and branding and specific services which are tailored for these segments), gaining an understanding of IoT wholesale requirements, assessing interest from potential new entrants and MNOs appetite to host these players.
5 RDC analysis, 2019 6 RDC analysis, based on Telecompaper data, 2019 7 RDC analysis, 2019 8 ibid

7
Secondly, we propose developing a simple set of reference tools to guide new entrants and MNOs into striking a fair and fruitful agreement. This involves providing a model for parties to establish a fair wholesale price, providing a reference contract, or framework agreement, to protect both parties and to ensure future market developments are catered for. Best practices from global learnings can be provided to the new entrants and host MNOs covering aspects such as use of MVNEs, pricing strategies, distribution strategies etc. Thirdly, we propose some light touch regulatory measures to help stimulate the market. These include the use of asymmetric MTRs (i.e. higher inbound revenue to smaller new entrants), offering spectrum on a local level to support 5G applications, base cost wholesale price setting, and making MVNOs mandatory for 5G spectrum allocation.

8
3. The MVNO model
3.1. Definitions An MVNO provides the same services to end customers as a mobile operator, renting radio spectrum and network infrastructure from the network operator. An MVNO has business arrangements with traditional mobile operators to buy network time, which it then sells to its own customers. MVNOs work independently of MNOs and have a certain amount of freedom to set their own pricing structure, depending on the wholesale rates and pricing structures that they negotiate with MNOs. MVNOs generally operate their own business support services (BSS), including billing and customer care, but have the option to leverage the support systems of the host MNO, if an MNO provides this. An MVNO is classed as a reseller when it relies on the MNO to provide all parts of its support systems (this can be under the MNO’s brand or re-branded to the reseller’s brand). Whilst the reseller model is not strictly an MVNO, we have included it in our operating models (defined in MVNO ecosystem 3.3 below) as it is relevant to competition in NZ. The main rationale for MNOs to support MVNOs is as follows:
• Utilise spare capacity - MNOs are assigned radio spectrum and build infrastructure to provide mobile services to customers (voice, SMS, data). The network is built to provide enough capacity to support the busiest time of day, which means there is excess capacity at all other times. MNOs make this excess available to 3rd parties i.e. MVNOs
• Develop service innovation - By creating a wholesale layer, network operators can focus on providing network quality, whilst new brands are able to focus on developing innovative services (e.g. flexible billing and content services). Incumbent network operators are hampered by legacy infrastructure and unable to keep pace with customer requirements
• Attract new customer segments - Large scale network operators (such as Vodafone) have built “monolithic” brands which do not “speak the language” of emerging segments. The MNO’s master brand is attractive to a limited number of customer segments. To target a broader range of segments, they use alternative brands (e.g. Virgin). MVNOs also provide new distribution channels, which network operators may lack or do not excel at, such as retail (e.g. Tesco Mobile, global), social media (e.g. Line, Japan) and online (e.g. Telmore, Denmark).
There are potential reasons that MNOs may be reluctant to host MVNOs, the main ones being:
• Lack of capabilities – MNOs may not have the appropriate wholesale platforms and team in place to facilitate onboarding and management of third parties. To host MVNOs, an MNO will need to be able to segment traffic and operations from its core business plus have an account management team in place to cater for MVNO partners. Some MNOs may feel the investment required in a platform is not justified
9
• Risk of cannibalisation – MVNOs may pose a threat to MNOs if they target the same customer segments as the MNO. This risk can be avoided by including stipulations in the agreement between an MNO and MVNO, which disallows the MVNO from targeting specific segments or undertaking promotions to undercut the MNO in key channels
• Capacity constraints – An MVNO’s future traffic needs is unknown to the MNO. There is a risk that the MVNO’s customers could negatively affect the MNO’s network and service delivery particularly during busy hours. Regular forecasting by the MVNO and monitoring by the host MNO can avoid these risks.
• Potential brand damage – Although the MVNO has a separate brand, customers are often aware of the underlying host operator. This means that if an MVNO provides a poor customer experience, this could impact the perception of the network. There is no compelling evidence to suggest this a major issue but the MNO may consider this when thinking about bringing on board third parties.
Overall MVNO market growth will be fuelled by more capacity in mobile networks, with the expansion of 4G and the imminent introduction of 5G. The maturity of flexible third-party BSS solution providers makes it easier for MVNOs to set up without reliance on the MNOs infrastructure. Adjacent to the MVNO model are the joint venture and sub-brand models, discussed further in Section 3.3. Whilst there are clear reasons for why an MNO would embrace MVNOs, there are also reasons why they could be reluctant. Firstly, MNOs may feel they are able to target niche segments themselves through effective marketing to avoid cannibalisation of their customer base. Secondly, they may be concerned about impact on the busy hour traffic, particularly as they have limited visibility and control over a third party’s traffic profile. Thirdly, MNOs may not be motivated to set up a flexible operating and technical architecture to cater for 3rd parties. In some cases, MNOs may be reluctant to host MVNOs, but on board them with limited support to avoid them succeeding on other competing MNOs. Whilst the focus of this report is on MVNO serving consumers and enterprise customers, it is important to consider IoT connections. This is because IoT connections will experience significant growth. When considering whether the MVNO model requires attention in NZ, IoT data-only connections are relevant. This is treated as a separate segment and discussed in Section 5.4.

10
3.2. MVNO ecosystem Figure 1 below shows the overall structure of the mobile market at a high level, starting at the infrastructure level up to the operators, through to platform and end users. This highlights the importance of the enablement layer and brands in delivering services to end users. We see a growth in the number of platforms which contributed to the growth in brands separate from MNOs over the last 20 years. Figure 1 Mobile landscape: interaction between market participants9
9 RDC analysis, based on GSMA data, 2019

11
3.3. MVNO and adjacent operating models When considering service providers that are separate from an MNO and therefore stimulate competition, it is important to understand the different MVNO models. Each model has different barriers to entry, due to varying set up costs and contractual complexity. The key difference between the models is how much they rely on the host operator for supporting systems and processes and therefore how much independence and control they have over service creation. Figure 2 below shows the key network, operating and customer facing components which form an end to end mobile service. It demonstrates how there are different models used depending on the level of operations under the control of the operator, i.e. how independent the brand entity is from the MNO. Figure 2 MVNO operating models: degrees of maturity10
An outline for each model is as follows: Licensed reseller This is the simplest and most basic form of ‘wholesale’ model with a separate brand from the host MNO. In this model, tariffs are generally comparable in structure to the host MNO’s as the agreement for airtime will typically be on a ‘retail minus’ basis. This means the operator will sell a bundle of airtime to the reseller at a discount, when 10 ibid

12
compared to the tariffs it sells to its own customers. As the licensed reseller relies on the MNO for billing and service features, it will not differentiate significantly from the MNO, except at the brand and distribution levels. Often licensed resellers bundle a mobile service alongside their own core services to provide a more rounded offer to the customer. The reseller model is often used in the enterprise market. Companies that become licensed resellers in the enterprise market add mobile services to fixed line telephony, VoIP, broadband and other ICT services. Typically, low gross margins are achieved using this model, of around 10-20%, with low set up costs11. In some cases, MNOs provide a limited amount of marketing support to assist the reseller. Using a stricter MVNO definition, licensed resellers are generally not classified as MVNOs. They are included here as we are considering companies separate from MNOs that could stimulate competition in the NZ market and ‘provide the same services to end customers as a mobile operator’. An example of this is Fenercell in Turkey, a mobile service offered by the football club Fenerbahçe. Service provider Within this model the MVNO has more control over customer facing elements, which allows it for better integration with its own services and systems. It may also enable it to provide a more differentiated customer experience. Tariffs are generally controlled and designed by the MVNO, since most often a ‘cost-plus’ wholesale pricing model is used. MVNOs buy airtime for a set price per minute, SMS or megabyte and add a margin on top. The degree of control and flexibility an MVNO has will depend on which operating elements it controls. However, under this model, the host operator may impose some restrictions on what the MVNO is able to do in the retail environment. This is a popular model for new entrants. It allows MVNOs to start with a select set of operating elements and build their own operations over time. They then replace the host MNO’s operations with their own, once its proposition has been proven and achieved a critical mass of customers. Typical gross margins achievable under this model range between 20%-35%12. An example of this is Bamboo in the UK, an enterprise business. Light MVNO This is the most common form of MVNO, where there is a high degree of control to set tariffs independently from the MNO. Contractually, there are typically less restrictions on the MVNO in terms of the segments it can target and services it can offer. By controlling more of the operating elements, the MVNO can develop differentiated value-added services, such as content and payment services, and provide an integrated offering with its core business, if it is part of a wider group with more services in its portfolio. For example, a media MVNO such as Sky Mobile in the UK, can bundle the mobile services with pay TV, fixed broadband and telephony. The set-up costs and time to launch under a light MVNO can be high, approximately NZ$1m to NZ$2m and often take 6-12 months to become operational13, therefore it is essential that there will 11 RDC analysis, 2019 12 ibid 13 ibid

13
be critical mass of customers to support the operating costs. Broadly, this model is generally sustainable if there are at least 50,000 subscribers, based on average consumer profiles14. As mentioned, the strength and degree of ownership of the operating elements will dictate the level of service differentiation and innovation that can be developed. In the past 5-10 years, there has been a maturing of a type of support business that sits between a host MNO and MVNO. These are known as Mobile Virtual Network Enablers (MVNEs) – who provide a range of OSS and BSS services on a variable cost basis (i.e. after an initial set up fee, the costs will be paid via a monthly per subscriber fee). These MVNEs are depicted in Figure 1 in Section 3.2 and described in Section 3.4. They increasingly offer a high degree of flexibility to build bespoke value-added services, integrate with existing systems and third parties such as social media, payment gateways, ERP systems etc. An example of an MVNE architecture is shown in Figure 4 below. Typical margins achievable under this model range from 35%-55%15. An example of a light MVNO is Tesco Mobile, a mobile service of large-scale supermarket in several European countries. Full MVNO This is the most advanced and rarest form of MVNO and involves the MVNO owning core network elements, giving it complete freedom and independence to behave like an MNO. The only aspect it will utilise from the MNO is its radio spectrum. In this model, the MVNO will set up its own HLR and other core network elements. It also needs to negotiate its own interconnect agreements with all other operators that its customers need to interact with globally. This set up can take 12-18 months and cost between NZ$2-3m to set up16. Very few MVNOs have implemented the Full MVNO model globally, because the costs are not often outweighed by the benefits. The Full MVNO model gives full call control and complete service development flexibility and has the added benefit of enabling the MVNO to collect all inbound mobile terminating revenue (MTR), which is retained by the MNO when they support the MVNO models described above and shared on a negotiated basis. This benefit is diminishing over time as MTR rates are falling globally. Typical gross margin under the Full MVNO model range between 45%-70%17. An example of a large scale Full MVNO is Lycamobile, serving 24 countries with a proposition aimed at ethnic segments. Lycamobile requires call control as it terminates calls internationally via low costs methods, allowing its customers to call their home countries abroad at highly discounted rates. 14 RDC analysis, 2019 15 ibid 16 ibid 17 ibid

14
Sub-brands This concept has been around since KPN launch of Hi Mobile in 1996 in the Netherlands. However, it has recently been gaining traction. Under this model, MNO-owned subsidiaries are created to target specific customer segments, with a separate distinct brand and proposition from the main brand. A successful example of this is giffgaff, a social media focused sub-brand of Telefonica’s O2 in the UK. Joint ventures This in an alternative model where the new entrant generally has a strong brand or distribution channel and partners with an MNO to share risk and reward. A prominent example of this is Tesco Mobile in the UK, which has partnered with host operator O2 to provide a service distributed in Tesco’s numerous supermarkets. In NZ, we suggest that the Light MVNO model is the most appropriate. The licenced reseller and service provider models are unlikely to provide sufficient margins, nor the ability to facilitate service differentiation for potential new entrants. Referring to the 9 potential segments in Figure 9 below, we expect the new entrants to be derived from the discount, retail, youth/ media, bundled and business segments. There is limited justification for these entrants to launch under a Full MVNO model as the scale would not justify it and the service benefits would not outweigh the costs.
3.4. The rise of the MVNE Over the past 5 to 10 years, there has been a significant growth in platforms which sit between operators and virtual operators, i.e. the ‘middle layer’. This has been a major contributory factor in the growth of MVNOs. As voice and data prices have fallen, there has been increasing reliance on value added services to compensate for the loss in revenue from traditional mobile communication services. In competitive markets, operators have tried to compete by launching flexible tariff options, offering alternative customer care options, such as self-care, location-based services and loyalty programmes. As traditional mobile MNOs lacked the flexibility to keep pace with rapidly evolving customer demand for services, platforms known as MVNEs have arisen to provide the functionality required to facilitate these innovations. These also allow rapid on-boarding and integration of an MVNO with an MNO and provides the ability to connect with third parties via defined interfaces. An example of an MVNE service portfolio is shown in Figure 3 below.

15
Figure 3 A typical MVNE service portfolio18
A significant additional trend requiring flexibility in platforms and interfaces between MNOs and third parties is the rise in ‘over the top’ (OTT) players. These utilise the data capabilities of mobile networks and engage directly with customers via applications sitting on devices. Major OTT companies provide services including include messaging (WhatsApp, Snapchat), social media (e.g. Facebook, Instagram) and entertainment (e.g. Spotify, Netflix). These companies generate revenue from subscriptions, in-application purchases and advertising. Many OTT providers rely on information contained in networks, such as location and data browsing information, which require a flexible interface with MNOs. Figure 4 below provides a snapshot of the number and size of MVNEs globally and whether they serve MVNOs and sub-brands or MNOs. Several MVNEs offer OSS/BSS services (see Figure 3), plus airtime from the MNO they are connected to. These companies are called MVNAs (Mobile Virtual Network Aggregators), as they combine both airtime and support services facilitating an easier on-boarding and negotiating position with the host MNO. Increasingly, MVNEs are offering their services in multiple geographies, typically by developing cloud-based infrastructures.
18 RDC analysis, 2019

16
These MVNEs will charge a basic on-boarding fee and charge on an ongoing basis, per subscriber. This reduces the upfront capital expenditure requirement for a new entrant and enables them to ‘pay as they grow’. The implication for the NZ market is that there are several MVNEs adjacent to the region who could facilitate the launch of MVNOs in NZ at relatively low cost. Given the size of the NZ market, the mid-sized MVNEs are most suited, and we estimate 15-20 MVNEs will be applicable to the region. Figure 4 Global MVNE players19
19 RDC analysis, 2019
MNOs~600
~55 players
50k-2m subs each ~45 players
1m-10m average subs each ~10 players
5m-15m average
subs each
~10 players
1m-10m average subs
each
MVNOs and sub-brands
~1,650
~20m~150m
~60m
~40m
• Serve 1-2 countries• Average 2-5 MVNOs• Aggregate airtime
E.g: Ready Wireless, Digitalk, Isoton
• Serve 2-10 countries• Average 2-5 MVNOs• May or may not
aggregate airtime
E.g: I-New, Transatel, Tata
• Mainly suitable for MNOs
• Do not aggregate airtime
• Moving into mid-sized MVNE Space
E.g: Amdocs, Ericsson, Huawei, HPE
• Serve own MNO wholesale customers
• Building centralisedplatforms to serve multiple group OPCOs
E.g: Telefonica Global Solutions, Proximus Wholesale
Pot
entia
l glo
bal a
ddre
ssab
le m
arke
t
MVNEs~120
Small MVNEs Mid sized MVNEs Large Vendors MNOs’ own MVNEsPlatforms
Subscribers served, 2018

17
4. Global MVNO drivers For MVNOs to gain traction in any market, there are a set of market conditions that typically need to be met for each of the main participants. At a basic level, there needs to be critical scale of segments for the MVNO model to work successfully. Additionally, the economics need to work, specifically there must be enough gross margin in a wholesale agreement i.e. gap between retail and wholesale rates. There also needs to be sufficient demand for services which are incremental to the offering of the incumbent mobile operators. Scale is the most critical condition for success of the MVNO model, closely followed by economics. Typically, the drivers under services are prevalent in most markets, however the demand for service innovation within a country will vary depending on the level of disposable income and cultural factors. Under each of these conditions, there are a set of drivers for success of MVNOs in any given market, which are summarised in Figure 5 below. Figure 5 Drivers of MVNO success20
Market conditions
1. Scale 2. Economics 3. Services
Market assessment
How much scale can be achieved with existing demand?
How much can the market benefit economically?
How much scope is there for capturing service differentiation?
Market Participants Market conditions breakdown
End-customers The number and size of discrete segments
The degree to which MVNOs provide competitive retail prices
The level of demand for incremental innovation
MVNOs
The economies of scale that can be achieved by launching an MVNO service
The lower the distribution and operating cost vs the host MNOs
The degree of brand loyalty to MVNOs
MNOs The amount of excess capacity in network
The degree of the gap between retail and wholesale prices
The level of risk of cannibalising host MNOs customers
20 RDC analysis, 2019

18
The greater the strength of these drivers the greater the likelihood of MVNO adoption within a given market. Several countries have been analysed to understand the strength of these drivers and corresponding impact on the MVNO environment. In addition to these drivers, several structural aspects support a prominent MVNO environment. These are:
1. Technical – a flexible platform must exist between the wholesale and retail environment to enable flexible billing and innovative service creation. This platform can be owned and operated by the MNO, or an independent third party sitting between the MNO and the MVNO. These are generally referred to as MVNEs and are described in Section 3.4 above.
2. Legal – a contract structure should be in place with defined provisions such as margin protection and responsibilities of both parties. When starting from scratch, developing an MVNO agreement can be a lengthy process, where several points are negotiated such as SLAs, minimum commitments, exit conditions etc. If a reference document does not exist from the MNO, it is recommended that the contracting parties seek guidance from specialist consultancies or legal firms who have developed and negotiated such agreements.
3. Regulatory – an open regulatory environment is required to avoid dominance by large players. Guidelines should be in place to ensure wholesale prices are set at levels which are not onerous and ensure MVNOs can achieve sufficient margins. In some markets, regulation has worked against MVNOs, for example in Turkey there is a double taxation burden on MVNOs i.e. tax is imposed both on revenue and profit. Once the regulatory setting is open, with outline guidelines, it will then be left to commercial negotiations between the MNO and MVNO to agree precise details. The UK market is highly competitive with approximately 76 MVNOs (including sub-brands), and the market does not have any real MVNO regulation. Whilst the market is open, it does not ensure MVNOs are protected against MVNOs getting locked into contracts where wholesale prices become out of date in a short timeframe as retail prices fall. In addition, MVNOs are often restricted in what they can derive from an MNO in terms of support services which they need to provide certain customer services for example, location information or real time rating of calls (i.e. call records are sometimes passed to the MVNO with a delay). A consideration for regulatory intervention to assist MVNOs is the introduction of asymmetric MTRs where smaller players are provided with a greater revenue from the networks where calls originated than larger players.

19
5. Global MVNO landscape The MVNO market is naturally a subset of the wider mobile connections market, so its growth comes either from:
• An expansion of the overall market (detailed in Section 5.1), or
• An increasing share of the market (detailed in Section 5.2). We will start by analysing the global mobile connections market and will then deep-dive into the share of MVNOs globally, per region and divided by customer segments.
5.1. Mobile growth globally Figure 6 Mobile connections by geographic region, 2018 vs. 202321
In Figure 6, we take a high-level view of mobile connections globally, per region, and estimate growth for the next five years. Mobile connections will see a growth of up to 10% globally22, with the highest number of connections being added in Asia-Pacific and with the fastest growth rate being experienced in Sub-Saharan Africa (see Figure 6). We will now look at these 2 markets in more detail. Firstly, Asia-Pacific hosts more than half of the world’s population, and with an estimated 106% mobile penetration rate23; it leads global mobile connections with 21 RDC analysis, based on World Bank, World Trade Organisation and regional (e.g. ACMA) data, 2019 22 RDC analysis, 2019 23 RDC analysis, based on World Bank and World Trade Organisation data, 2019

20
around 4.4 billion connections, representing 57% of global connections24. Secondly, its 9% 5-year growth in mobile connections, leading up to almost 5 billion subscriptions in 2023, is driven by the high socio-economic growth of countries including China, India and Indonesia, where low-to-middle income distribution is shifting sharply, education levels are rising and medium-to-high income earners are spending increasingly more time and income on content streaming, OTT communication apps and mobile commerce. Secondly, Sub-Saharan Africa will see the highest growth rate of all regions in the next 5 years (29% from 2018 to 2023)25. Its main drivers are a growing young population and an increasing perception of mobile as an essential service. 60% of the population is under the age of 2526 and we estimate by 2023 it will have more mobile connections than the Middle East, North Africa and North America combined (see Figure 6). We believe there is scope for significant innovation and uptake of new services which are highly targeted and scalable. Vodafone’s m-Pesa mobile money solution (launched in 2007) is a successful example, with over 30 million users27. By contrast with APAC and Sub-Saharan Africa, Europe is experiencing saturation in mobile connections. We believe that Europe will be the only region to see a decline in total mobile connections (-2.8% from 2018 to 2023)28. The main factors influencing this trend are:
• Declining need to own multiple subscriptions per person, owing to market shifts such as Bring Your Own Device (BYOD), the roam-like-home legislation and consolidation across mobile operators
• Users retaining their mobile devices for longer.
5.2. MVNO growth globally Figure 7 MVNO connections as % of total mobile connections, global, 2018 vs. 202329
Figure 7 shows that out of total mobile connections, around 4% were via independent MVNOs in 2018. This represents about 337 million subscribers worldwide. We believe that by 2023, 7% of subscriptions, or 581 million, will be connected via MVNOs. 24 RDC analysis, 2019 25 ibid 26 UN data, 2019 27 Vodafone official website, 2018 28 RDC analysis, 2019 29 RDC analysis, based on World Bank, World Trade Organisation and regional (e.g. ACMA) data, 2019

21
The main factors behind this increase will be:
• The high mobile growth in emerging economies such as India, where only recently, in 2017, regulators opened up the market to wholesale mobile players
• The surge in data-driven customer demand, from services such as content streaming, mobile commerce, virtual assistant, VR developments and other emerging services
• More network capacity becoming available, for example with the launch of 5G • The growing nimbleness of MVNOs relative to MNOs, which allows them to
adapt more quickly to customer needs, implement changes in strategy and repackage communication bundles
• The development of flexible, cloud-based platforms which intermediate the relationship between MVNOs and MNOs with services such as provisioning, billing or analytics. These are MVNEs, BSS/OSS players and service delivery platforms which increasingly operate ‘software as a service’ (SaaS) models facilitating 3rd parties with operating support services on an easy to connect basis.
5.3. MVNO adoption per region Figure 8 MVNO numbers, connections and % shares by geographic region, 201830
Europe was home to the first MVNO launches, the most significant one being Virgin Mobile, and it is currently leading the absolute number of MVNO players, with an estimated 787 MVNOs in operation in 2018 (see Figure 8). It is followed by North America with 324 MVNOs and Asia Pacific with 278 MVNOs.
30 RDC analysis, based on World Bank, World Trade Organisation and regional (e.g. ACMA) data, 2019
22
In terms of number of MVNO connections, Asia Pacific hosts the most, with 155 million connections in 2018, representing 3.5% of the region’s mobile connections. Europe comes in second, with just over 100 million connections, and North America third, with 52 million connections. One of the most useful measures of MVNO performance is the MVNO share of the overall mobile market, as it indicates how well MVNOs coexist with their MNO hosts, as well as how receptive the end-customers are to the ensuing competition. On this KPI, North America scores highest, with 13.2% of connections being made via MVNO in 2018, with players such as America Movil in the market. Europe ranks second with 10.4% MVNO market share, hosting MVNO incumbent Virgin Mobile, as well as international giants Lycamobile and Lebara. Asia Pacific comes in third with a considerably lower 3.5% MVNO market share, motivated by a mix of regulatory challenges and relatively lower MNO adoption rate. Middle East and North Africa, Sub-Saharan Africa and Latin America all experienced MVNO market shares hovering just over 1% in 2018. Although country-level conditions vary, this relatively lower MVNO market share is driven by:
• A relatively lower mobile penetration rate and a less mature market, which may mean MNOs prioritise their own customer acquisition as first-time users buy mobile services
• MVNO start-up costs that are too high to be covered by expected returns in a relatively less mature market
• Lack of support from telecommunications regulators
• Lack of MVNO launch expertise.
5.4. MVNO segments
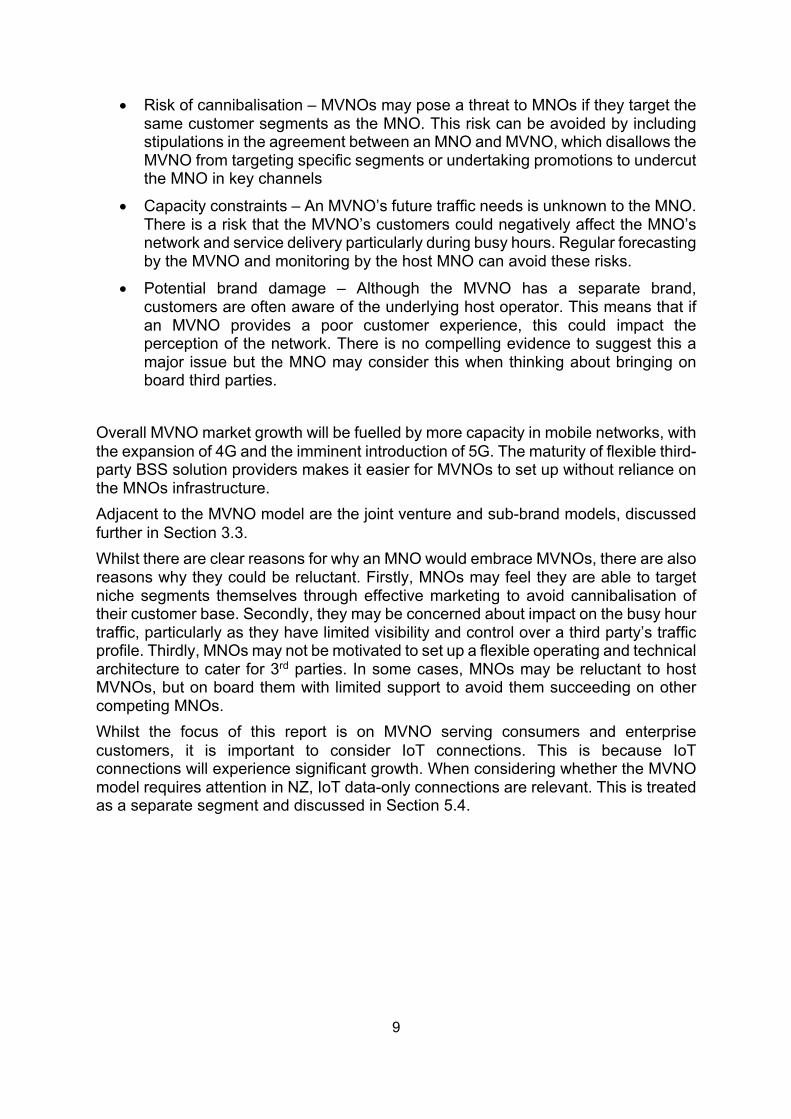
Figure 9 MVNO players by segment type, global, 2018 vs. 202331
Eight key customer segments have driven the growth in MVNO players across the world. In Figure 9, we quantify each segment’s share of the total number of MVNOs, in 2018 and 2023.
31 RDC analysis, 2019
23
1. Discount The biggest category today – and arguably one of the biggest benefits to end-customers – is discount. In 2018 this segment represented 22% of MVNOs (327 players), an example being Aldi Mobile. The key factor for the success of discount MVNOs is having a sufficiently low distribution cost and the opportunity to scale, as they need to offer relatively lower prices than competitors in order to survive and grow.
2. Specialist data Specialist data is the second largest segment worldwide, representing 11% of MVNOs. An example of this is Google Fi – the Google-owned MVNO in the US. Switching between the 3 MNOs (Verizon, AT&T and Sprint) and Wi-fi hotspots, it launched in 2015 exclusively for Google’s Nexus 6 users, after which it was additionally offered to Pixel users. Google’s mobile service can serve its data-hungry services, e.g. Google Maps, YouTube, Google Chrome, etc. For Google, potential benefits include a higher degree of visibility and control of network performance, a closer billing relationship to its customers and more user data to improve its services and marketing strategies. We expect this segment to experience the highest growth, taking about 19% of the pie by 2023. In the future, we see more companies like Google launching MVNOs to satisfy and manage the demand for specialist data, with use cases including financial services, digital entertainment services, virtual assistants and health equipment providers.
3. Retail Another significant market worldwide is retail, representing 17% of MVNOs in 2018. This is commonly launched as a supermarket chain sponsored mobile brand, aiming to offer large retail customer customers the opportunity to bundle mobile services (sometimes, with handset offers) with their shopping. Sometimes employed as a strategy to increase loyalty, retail MVNO subscriptions may offer users grocery discounts and loyalty card perks or may help the retailer better target its customer base. An example of a retail MVNO is Asda Supermarket’s Asda Mobile.
4. Ethnic The ethnic-focused MVNOs, representing 12% of MVNOs in 2018, are particularly successful in markets with relatively more relaxed immigration regulation, such as the European Union, or with diverse ethnic backgrounds, such as the US or Australia. These players generally identify key countries where immigrant segments may have friend or family and they offer competitive rates for those countries, on PAYG rates or in-bundle. In host countries, they generally utilise highly targeted, low-cost distribution channels such as local shops or airport outlets. The most successful brands in this area are Lycamobile and Lebara in multiple countries.

24
5. Business The business segment represents 11% of MVNOs in 2018. These players generally target SMEs, as large corporates are served more robustly by MNOs who have control over their own network and more reputability. However, having a smaller scale than MNOs can enable business MVNOs to create more bespoke services (e.g. security, roaming, tracking requirements) in a shorter timeframe, which is a highly valuable offer for an SME. Examples of business MVNOs are Coriolis in France and Gamma in UK.
6. International/ roaming The international/ roaming segment, representing 8% of MVNOs in 2018, competes with the historically high rates that operators have charged users outside their domestic market. These companies generally innovate at an operational/ technical level in order to create an efficient, high-quality set of international agreements, which then get forwarded to customers through cheaper rates or simpler travel logistics. For example, Truphone offers customers the opportunity to store several international numbers on one SIM and use it at local rates in the destination countries.
7. Youth/ media The youth/ media segment represented 5% of MVNOs in 2018, addressing the growing need for digital content, flexible bundling and targeted branding, highly desirable to millennials and generation Z’s. As the younger generations increase their purchasing power, their highly digitalised needs need new business models, including in-house produced content, partnerships with streaming services and zero-rated social media and digital content. Virgin Mobile is a successful example of an MVNO aimed at this segment.
8. Bundled The bundled segment represented 4% of MVNOs in 2018. In this segment, MVNOs tend to be established fixed line or media players who add mobile to their landline, broadband, and/or TV offering. In the last few years, we have also seen MVNO services bundled with energy and utilities and we believe this will continue to grow. This segment generally targets households that wish to make savings in cost and effort by having a billing relationship with one provider only. Notable examples include Virgin Mobile, New Zealand’s Vocus and the upcoming MVNO from Sky Italia.
9. Other Smaller segments are represented in the Other category, amounting to 10% of MVNOs. Segments in this category include: data only, charity, device, freemium/ ad-funded, the elderly, high-value subscribers, telecoms, multi-segment and emerging segments. For example, Age UK, a UK-based charity serving the elderly population, offers mobile services via an MVNO agreement.

25
There have been both expectations and rumours that major technology giants such as Apple Facebook and Google would launch MVNO services, given their strong relationships with customers, significant relevance of their services to mobile, and ability to provide a differentiated service. As mentioned above under the ‘specialist data’ segment, Google Fi launched an MVNO in USA but this has yet to take off in a significant way partly due to the fact that it is only available on Android and more specifically its own devices, which has had limited success. Apple has airtime MVNO agreements which, in 2014, enabled it to install e-sims into iPads in the United Kingdom and the United States; this has not taken off as a proposition. In our opinion, the reluctance of these major giants to push for a MVNO service is driven by their desire to focus on building their core service brands and in the case of Facebook and Google, utilise alternative technologies to create global internet services (such as Google’s Loon project which intended to create connectivity using balloons). We feel there is a justification and business case for these companies to launch MVNO services and predict they will do so in the near future.
5.5. Benefits to consumers MVNOs attract customers when they have a brand loyalty to the new mobile entrant. The more tangible benefits to customers come from the MVNOs focus on offering differentiated services from traditional operators. The areas of differentiation include:
• Tariff flexibility – in addition to competitive pricing and simpler tariffs, MVNOs may offer alternative pricing models (e.g. freemium model from Wifog, Sweden) and rolling over of data (e.g. With Sky Mobile, UK, data can be rolled over for up to three years. Unused data can also be ‘cashed in’ for iPhone cases and other accessories).
• High quality customer service – an MVNO can attract consumers by scoring highly in customer care comparisons versus competition. For example, delivering fast, consistent quality service can be supported by a community-based approach (e.g. iD Mobile’s iD Community in the UK, which also include live chat agents)32. The customer care can also be offered in a highly segmented way such as with different language support for ethnic segments (e.g. Lebara).
• Unique distribution models – MVNOs can either use existing channels to market or can create alternatives. Retailers, telecoms service providers and other brands may leverage their online and physical stores to sell MVNO services (e.g. Tesco, UK). Some MVNOs have re-purposed and extended existing channels to market to sell mobile services (e.g. Lycamobile using its calling card network of shop-based resellers to sell SIMs and top-ups).
• Bundling with fixed services – fixed operators and other telecom service providers can bundle mobile with fixed telephony, broadband and TV services
32 similar to giffgaff’s community-based customer service model

26
as part of multi-play services, issuing a single bill and providing discounts (e.g. cable operator Xfinity’s mobile service, USA).
• Access to unique content and services – MVNOs may include exclusive content (music, gaming, video etc.) in their tariffs, or provide consumers the ability to purchase add-ons (e.g. Lycamobile sells a LycaTV service and a personalised private healthcare).
5.6. Regulation In terms of MVNO regulation, countries can be grouped in to three groups at a high level, as follows, where:
• MVNOs are not allowed – Until recently countries such as Iran and India did not support the MVNO model. This is becoming a less popular scenario across the globe
• MVNOs are mandated, with regulation – Here regulators allow MVNOs to be established, but require licenses which require adherence to certain conditions, such as in South Africa. In rare extreme cases, regulars impose restrictions which make it onerous to survive – as in Turkey, where there is a double taxation regime, resulting in tax on revenue and also on profit
• There is no regulation – here, MVNOs are allowed but there is no requirement to have a license and the arrangement between the MNO and MVNO are left to commercial negotiations. This is the case in the UK where the regulator does not get involved unless in rare circumstances where there is anti-competitive scenarios or market dominance.

27
6. Country deep-drill 6.1. Country overview We have analysed the following sample of countries to identify best practices that can be applicable to the NZ MVNO market: Australia, the UK and the Netherlands. Below in Figure 10 is a high-level overview of the four markets, with their key indicators. Figure 10 Global selection of MVNO markets and their key indicators 33
Country Popu-lation (m)
Mobile penet-ration
MVNO connecti-ons (%)
MVNO + sub-brand connecti-ons (%)
MVNO launch
year
Pop. density (#/sq. km)
Urban-isation
(%)
MVNOs + sub-
brands (approx #)
New Zealand 4.8 127% 1% 5.1% 2007 18 86 5
Australia 24.6 126% 14% 23% 2000 3 86 40
UK 66 121% 17.3% 21.3% 1999 273 83 76
Netherlands 17.1 123% 16.5% 33% 2001 509 91 65
Below we have quantified each market’s scale, economics and services potential for MVNO growth, as per the framework introduced in Section 4: Global MVNO drivers. We break down the categories with examples in each country in the following sections (6.2, 6.3, 6.4 and 6.5). Note that the assessment per MVNO market represents a current view of MVNO market performance. It is not directly indicative of market competitiveness or ease of entry. Figure 11 MVNO market assessment per country34
Conditions
1. Scale 2. Economics 3. Services
Assessment criteria
How much scale can be achieved with existing demand?
How much can the market benefit economically?
How much scope is there for capturing service differentiation?
MVNO market potential NZ 2 2 3 UK 5 4 4 Netherlands 3 4 5 Australia 4 3 4
33 RDC analysis, based on World Bank, World Trade Organisation and regional (e.g. ACMA) data, 2019 34 RDC analysis, 2019; Key to scores: 1 to 5 scale measures potential for market participant to gain from the respective market condition, relative to other markets globally; 1 = low, 3 = average, 5 = high; We consider 3 to 5 to be the interval where a market is most likely to sustain the growth of MVNO players

28
6.2. New Zealand Our analysis shows that the NZ MVNO market has some scope for growth, but this scope is limited. This market is unlikely to sustain a large number of MVNOs or a high proportion of MVNO subscribers. The market’s low capacity to scale, combined with MNOs’ high bargaining power on wholesale prices, predicts low profitability for any individual MVNO. However, this inherent disadvantage could be offset by a high degree of service differentiation, with likely success rates in the bundled or retail MVNO segments, as demonstrated by existing players. We provide a set of recommendations to stimulate MVNO growth, to improve competition and provide customers with greater service choice.
Figure 12 NZ MVNO market assessment35
Conditions
1. Scale 2. Economics 3. Services
Assessment criteria
How much scale can be achieved with existing demand?
How much can the market benefit economically?
How much scope is there for capturing service differentiation?
NZ MVNO market potential
2 2 3
1. Scale
Figure 13 NZ market indicators36
Country Popu-lation (m)
Mobile penet-ration
MVNO connecti-ons (%)
MVNO + sub-brand connecti-ons (%)
MVNO launch
year
Population density
(#/sq. km)
Urban-isation
(%)
MVNOs + sub-brands
(#)
New Zealand 4.8 127% 1% 5.1% 2007 18 86 5
We believe MNOs are highly likely to possess sufficient extra network capacity to support growth in MVNO services, indicated by key factors including:
35 RDC analysis, 2019 36 RDC analysis, based on World Bank, World Trade Organisation and NZ Commerce Commission data, 2019

29
• The entry of 2degrees in 2009, which now has significant spectrum in the 1.8 and 2.1 GHz bands and an estimated 24% market share37
• Regular network improvements in all 3 MNOs
• NZ 3G/4G speed and availability is ranked 12th among 95 countries38 and this is to expand in the medium-term with the development of 5G
• Simon Mouter, Spark Managing Director, said “We are now at a point where it is likely cheaper to acquire a customer base from another provider through an M&A deal than it is to try to attract those customers through market efforts”39
However, for MVNOs, scale is unlikely to be reached due to:
• A total domestic population of approximately 4.8 million people40
• A mobile subscriber addressable market of approximately 6 million subscriptions41
• MVNOs’ challenge to reach critical mass to achieve breakeven point. RDC estimates that a benchmark subscriber base of 50,000 is required to sustain an MVNO business42, based on average consumer usage profiles. In NZ, 3 companies make up 50,000 subscribers (Vocus, Warehouse Mobile and Compass)
• A predicted MVNO market share (excluding sub-brands) of 10% in 5 years in New Zealand 43. This represents 600,000 MVNO subscriptions, yielding a theoretical maximum of 12 MVNOs at the average breakeven threshold. There would be two MVNO market leaders and 3-5 MVNO challengers.
Furthermore, from an end-customer segment perspective, there is likely to be low potential to serve an individual segment, based on a high-level look at the number of customers in the 9 segments in Section 5.4. Looking at the youth segment, there is a feasible market size, but only just:
• A total addressable market of around 640,000 people (13.35% of the population is aged between 15 and 24 years44)
• If we take an upper threshold of 15% MVNO share in the youth market, this would result in 96,000 youth subscribers.
37 Trilogy international (2degrees owner), 2017 38 Opensignal, 2016 39 IT Brief NZ, 2017 40 World Trade Organisation, 2017 41 RDC analysis, based on World Bank and World Trade Organisation data, 2019 42 RDC analysis, 2019 43 ibid 44 CIA World Factbook, 2017
30
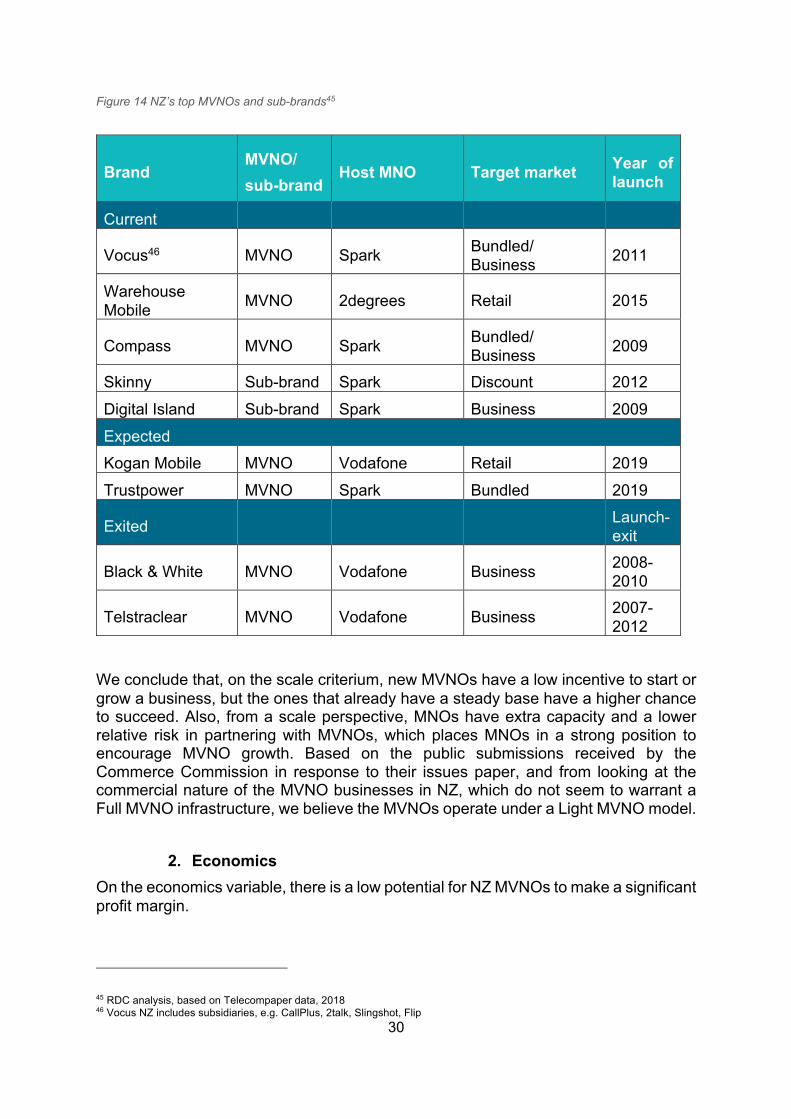
Figure 14 NZ’s top MVNOs and sub-brands45
Brand MVNO/ sub-brand
Host MNO Target market Year of launch
Current
Vocus46 MVNO Spark Bundled/ Business 2011
Warehouse Mobile MVNO 2degrees Retail 2015
Compass MVNO Spark Bundled/ Business 2009
Skinny Sub-brand Spark Discount 2012 Digital Island Sub-brand Spark Business 2009 Expected Kogan Mobile MVNO Vodafone Retail 2019 Trustpower MVNO Spark Bundled 2019
Exited Launch-exit
Black & White MVNO Vodafone Business 2008-2010
Telstraclear MVNO Vodafone Business 2007-2012
We conclude that, on the scale criterium, new MVNOs have a low incentive to start or grow a business, but the ones that already have a steady base have a higher chance to succeed. Also, from a scale perspective, MNOs have extra capacity and a lower relative risk in partnering with MVNOs, which places MNOs in a strong position to encourage MVNO growth. Based on the public submissions received by the Commerce Commission in response to their issues paper, and from looking at the commercial nature of the MVNO businesses in NZ, which do not seem to warrant a Full MVNO infrastructure, we believe the MVNOs operate under a Light MVNO model.
2. Economics On the economics variable, there is a low potential for NZ MVNOs to make a significant profit margin.
45 RDC analysis, based on Telecompaper data, 2018 46 Vocus NZ includes subsidiaries, e.g. CallPlus, 2talk, Slingshot, Flip

31
From an MNO’s perspective, if a wholesale price is considerably lower than their retail price, a deal is difficult to justify. This could particularly be the case with MNOs pursuing a discount strategy. Furthermore, MNOs are likely to consider the opportunity cost of making a margin from wholesale subscribers, such as gaining market share from MNO competitors, or investing long-term in IoT/ M2M services. From an MVNO’s perspective, there is low potential for an attractive profit margin, primarily due to a lower bargaining power in negotiations with operators. This is supported by:
• The status of entrants relative to incumbents with regards to market share and reputability, weakening bargaining power with MNOs
• The MVNO business case is not yet proven in NZ, as they currently hold around 1% market share47
• The low potential number of connections per segment which makes breakeven a challenge
• Asymmetric information between MVNO and MNO, due to undisclosed wholesale rates offered to other MVNOs
From an end-customer’s standpoint, we believe the average New Zealander can afford the price levels in the market, but there is scope for them to receive better value for money. On the one hand, on an OECD level, NZ scores higher than average in terms of plan affordability48. On the other hand, consumers need more value and variety among offers, due to points including:
• Data-only bundles have been shown to be more expensive than in other comparable markets49
• There is a relative lack of variety in price points for most MNOs, sub-brands and MVNOs (e.g. Spark and Skinny have 3 main plans for pay monthly and prepaid, respectively, while 2degrees has 450; Vodafone, however, allows users to design their own plans, but this comes at a premium51; operators in the Netherlands offer more distinct price points on average: KPN and T-Mobile offer 6 main price points for prepaid, while VodafoneZiggo offers 7 prepaid plans52)
• To increase value for money, there is more potential in content bundling and inclusion of OTT services. MNOs have an advantage in offering this due to their scale and partnership opportunities (e.g. Vodafone offers unlimited OTT usage with add-on passes; Spark resells Netflix and Spotify and runs an in-house VOD service, Lightbox). However, MVNOs have the agility and faster timescales to test new products and even create OTT services in-house.
47 Commerce Commission, 2018 48 Commerce Commission, based on OECD data, 2018 49 RDC analysis, incorporating Analysys Mason data, 2019 50 Spark, Skinny, 2degrees official websites, 2018 51 Vodafone NZ website, 2019; e.g. 2 Gb, 300 min, unlimited text plan costs NZ$29 on Vodafone Prepay Flexiplan. The same combination is NZ$29 at Spark (but with 2Gb extra data and OTT discounts), NZ$29 at 2degrees (but with 0.5Gb extra data and 2Gb extra weekend data) and NZ$29 at 2degrees (but with 0.5Gb extra) 52 KPN, T-Mobile Netherlands, VodafoneZiggo official websites, 2019
32
3. Services From a services standpoint, we believe the NZ MVNOs have sufficient scope to innovate relative to current competitors. Firstly, from an MNO perspective, there is an incentive to allow new MVNO services into the market because there is a low risk of revenue cannibalisation. Two main points support this claim:
• Current mobile services, both MNO and MVNO, are relatively undifferentiated. This means that new players can target niche markets, such as ethnic segments or enterprise, without directly or significantly impacting MNOs’ mass-market subscriber bases
• This potential is incrementally proven by Kogan Mobile’s upcoming entry as a retail MVNO or Skinny’ growing success in the price-sensitive segment (although Skinny has advantages relative to independent MVNOs such as financial and economies-of-scale advantages as a sub-brand of Spark).
From an MVNO’s perspective, competing for quality rather than quantity may offer room for growth in ARPU. This is where current and prospective MVNOs can apply global best practices including:
• Bundling mobile services with existing offer, such as fixed voice/ broadband, financial services, insurance, mobile payments, etc. under this model, the breakeven threshold for subscriber numbers is lower than for a mobile-only MVNO. This is already happening in NZ and can grow further, based on progress from Vocus (which bundles mobile with fixed/ broadband under 3 sub-brands), Warehouse Mobile and Kogan Mobile (both of which are established retailers in NZ and Australia).
• Targeting emerging segments with niche services and/ or branding. Building on Skinny’s success in attracting the price-conscious segment, NZ MVNOs can focus on growth segments such as millennial, entertainment-seekers, travellers etc.
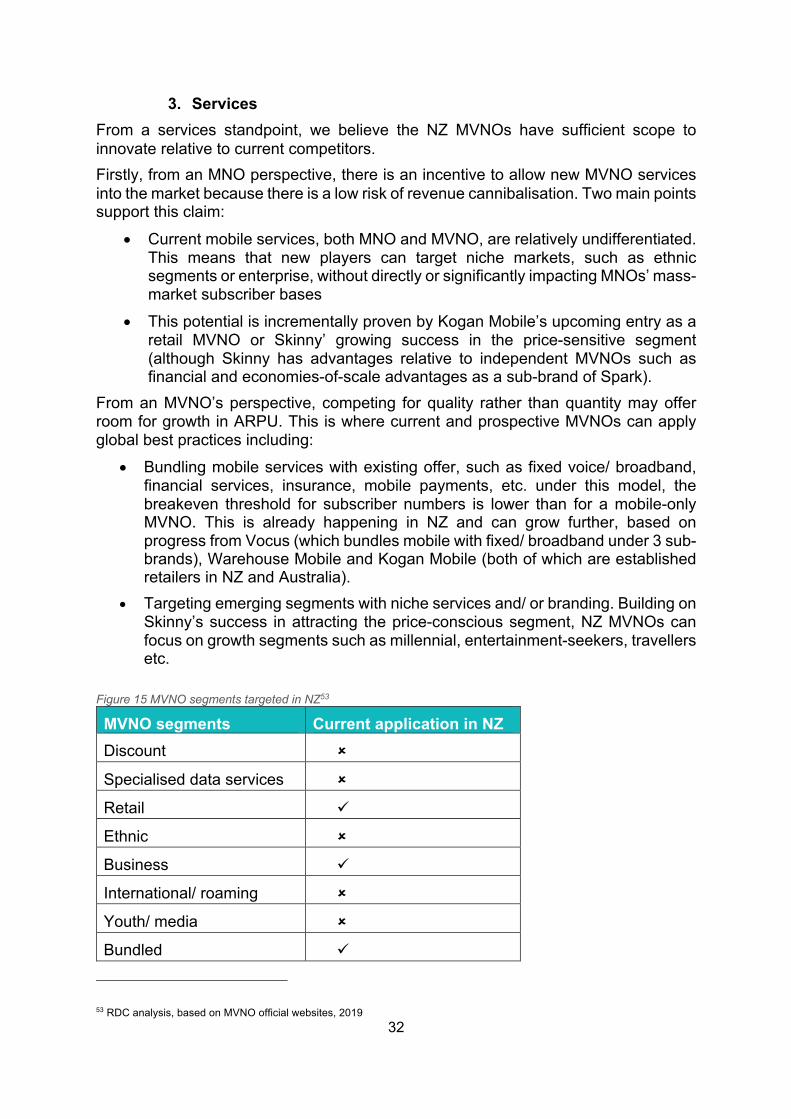
Figure 15 MVNO segments targeted in NZ53
MVNO segments Current application in NZ Discount û
Specialised data services û
Retail ü
Ethnic û
Business ü
International/ roaming û
Youth/ media û
Bundled ü
53 RDC analysis, based on MVNO official websites, 2019

33
In terms of end-customers, we believe there is scope for MVNOs to innovate the current standard of service. This is based on facts including:
• NZ consumers are overall more satisfied with MVNOs and sub-brands than with MNOs54
• Consumer digital media consumption is skyrocketing55, opening up the potential for data-specialised providers
• The business, bundled and discount segments have been successfully tested by brands such as Vocus and Skinny, respectively
• Based on NZ’s high mobile penetration (approximately 130%56), MVNOs can consider niche markets where 2 subscriptions per capita may be applicable, which would innovate in the services condition with a small risk of cannibalising MNO revenues.
IoT and M2M should be analysed as a separate segment and opportunity for MVNO connectivity in New Zealand. Although out of scope for this report, we believe that it is a viable way to overcome the population scale disadvantage, as well as the MNOs’ cannibalisation risk, where IoT goals are less likely to overlap. Globally, IoT/ M2M connections are predicted to rise threefold between 2017 and 2025, primarily driven by smart homes and cities. Of those, cellular IoT connections are predicted to represent 12%, or 3.1 billion57. In NZ, operators’ investment appetite in IoT is rising, with commercial deployments happening in Vodafone and Spark with partnerships including Nokia and Huawei, and explorations such as the partnership between 2degrees and NEC Corporation. Increasing IoT usage is largely dependent on timely 5G deployment – from this point of view, the GCSB’s decision to ban Spark from using Huawei equipment in its November 2018 iteration of 5G deployment plans is an obstacle. We believe there is scope for companies such as car manufacturers, utility providers and transportation/ logistics services to benefit from a flexible MVNO agreement in IoT, either directly or via an aggregator. An example of a company in NZ offering mobile connectivity with its IoT proposition is M2M One.
4. Further considerations on the NZ market A potential regulatory solution to increase MVNO market share in NZ is releasing spectrum with the condition to offer a network slice to MVNOs. This can be applied in the short-to-medium term with the upcoming NZ auction of 3.5GHz spectrum (part of 5G bands). We believe this condition can be a feasible solution to increase MVNO market share and competition in the mobile market, based on the following high-level analysis:
54 Consumer NZ, 2018 55 Euromonitor’s Consumer Lifestyle study, 2018 56 RDC analysis, based on World Bank and World trade organization data, 2019 57 GSMA, The Mobile Economy 2018

34
• Pros o Potential for MVNOs to increase market share up to 15%58 o Potential for price per connection to decrease in the long-term (for both
consumer and IoT connections) o Stimulus for both MVNOs and MNOs to innovate and differentiate as
competition increases o Potential use cases in: IoT for smart cities, smart homes and enterprise
IoT; wireless broadband in rural areas o Potential to leverage existing and future 5G co-operation between MNOs
in infrastructure sharing o More chance of the market offering more level of service options (e.g.
speed, quality) o Economic development in other areas of the supply chain, through entry
of new players and/ or increased investment, e.g. increased deployment of small cells, improved BSS/ OSS platforms, IoT devices
o Creates a precedent: this condition can signal the Commerce Commission’s commitment to co-operation, innovation and customer orientation (see Germany NRA example below)
• Cons o May decrease MNOs’ size of 5G deployment or delay deployment o The limited scale for consumer-focused MVNO business cases,
particularly for 5G, as detailed in Section 6.2 New Zealand o Low degree of maturity of IoT business cases, which can delay a
mutually-beneficial agreement between MNO and MVNO for an IoT-specific 5G band
o Creates inorganic competition, which may stifle co-operation in the long-term
o Creates a precedent: more regulation could create animosity from MNO leadership, bureaucratic costs/ inefficiencies, and/ or aversion to risk and investment
It is not common for NRAs to attach MVNO provision clauses when MNOs buy new lots of spectrum. However, there are a number of exceptions, including German and Romanian NRAs, detailed below:
• In Germany, the NRA is formally considering the obligation of MNOs to provide 5G network to MVNOs when they bid for 5G spectrum (the auction has not yet happened at the time of writing)59. Although met with opposition from Germany’s three MNOs (Vodafone, Telefonica and Deutsche Telekom), the proposal is supported by MVNO Europe, an entity that advocates for competition in European mobile markets. The German NRA has historically supported MVNO growth through its interventions. For example, it provided clearance for the E-Plus/ Telefonica merger in 2014, with the condition for the merged operator to provide MVNO access. Germany is a thriving market for MVNOs, with an MVNO market share of 20%60
• The Romanian NRA obligated three of the four MNOs in 2012 to host MVNOs, after the bid for 4G spectrum (Cosmote, RCS&RDS and 2K Telecom; the
58 RDC analysis, 2019 59 TechRadar, based on data from the German communications regulator (BNetzA), 2019 60 RDC analysis, based on Global Market Insights data, 2019

35
exception was Vodafone)61. At the time, Romania had no active MVNOs, but the NRA specified it was aware of 17 companies that were considering launching MVNO services62. Four years later, in 2016, Veridian Systems launched, the first Romanian MVNE, in partnership with Telekom Romania (part of Deutsche Telekom), which stimulated MVNO entry. Romania currently has 3 active MVNOs63, with former MVNO UPC Mobile successfully exiting via an M&A with Vodafone. The Romanian NRA regulation for MVNOs has contributed to MVNO entry and growth, but only after a significant amount of time and to a less-than-significant scale.
We recommend the Commerce Commission considers further analysis of the MVNO conditions in 5G spectrum allocation. This analysis could include actions such as: gathering significant interest and business cases from prospective IoT MVNOs, preparing NZ MNOs for the potential condition in spectrum allocation, identifying MVNEs that could support prospective MVNOs’ services. We also recommend the consideration for non-MNOs to buy 5G spectrum with the aim to wholesale, e.g. Dense Air’s recent purchase of 2.5GHz spectrum from Blue Reach and Cayman Wireless in NZ. Furthermore, to bring down the barrier to entry, the option to use flexible MVNEs residing on MNOs in NZ can be used. For example, Spark utilises the MVNE i-New to host its Skinny sub-brand.
61 Telegeography data 62 ANCOM 63 RDC analysis, based on Telegeography data, 2019

36
6.3. United Kingdom The UK is among the most mature MVNO markets globally. It possesses inherent advantages including scale, a thriving technology hub and a host of discrete segments to serve. While these may act as a springboard, the UK’s success in MVNO models is also attributable to shifts in MNOs’ wholesale appetite and the development of specialised MVNO services such as OSS/BSS platforms, pricing strategies and low-cost distribution channels. There is no specific regulation associated with MVNOs in the UK and there is no license requirement. The MVNO market has been developed solely from commercial negotiations between new entrants and MNOs. Figure 16 UK MVNO market assessment64
Conditions
1. Scale 2. Economics 3. Services
Assessment criteria
How much scale can be achieved with existing demand?
How much can the market benefit economically?
How much scope is there for capturing service differentiation?
UK MVNO market potential 5 4 4
1. Scale
Figure 17 UK market indicators65
Country Popu-lation (m)
Mobile penet-ration
MVNO connecti-ons (%)
MVNO + sub-brand connecti-ons (%)
MVNO launch
year
Population density
(#/sq. km)
Urban-isation
(%)
MVNOs + sub-brands
(#)
UK 66 121% 17.3% 21.3% 1999 273 83 76
One of the reasons the UK has a successful MVNO ecosystem is because of the scale of the domestic market, which includes sizeable customer segments, as well as sufficient extra capacity from MNOs. Measurable effects of this include:
64 RDC analysis, 2019 65 RDC analysis, based on World Bank and World Trade Organisation data, 2019

37
• The UK was one of the first markets to host MVNO players, with Virgin Mobile launching in November 1999
• Currently, there are around 76 MVNOs in the UK (including sub-brands, six of which have achieved significant subscriber numbers)
• MVNO represent just over 17% of the mobile market, serving around 13 million subscribers.66
Below is a selection of the most successful UK MVNOs in terms of market size and innovation. Note that apart from the big players, there are a number of smaller-sized players that serve subscribers in the range of 25,000 – 100,000 subscribers (e.g. Gamma, Utility Warehouse, Plan.com, ASDA Mobile). The top 6 MVNO represent approximately 64% of the total MVNO subscriber base.67 Figure 18 The UK’s top MVNOs and sub-brands68
Brand MVNO/ sub-brand
Host MNO Target market Year of launch
Tesco Mobile MVNO O2 Retail 2003 Virgin Mobile MVNO EE Bundled 1999 Lycamobile MVNO O2 Ethnic 2005 Lebara MVNO Vodafone Ethnic 2007 iD Mobile MVNO Three Discount 2015 Sky Mobile MVNO O2 Bundled 2017 giffgaff Sub-brand O2 Youth/ millennial 2009
2. Economics
The UK MVNO market, though highly competitive, still creates economic benefit, particularly for end-customers and MVNO players. For end-customers, the variety of price levels, coupled with an increase in VAS-inclusive bundles, ensures high value-for-money. For example, one of the least expensive prepaid plans from iD Mobile is 63% cheaper than the OECD average for the bundle size (See Figure 19 below). While the OECD 500 MB bundle is an average US$15.569 (source: Strategy Analytics analysis, 2018), iD Mobile’s 500 MB bundle is US$5.8 (PPP adjusted). 66 RDC analysis, 2019 67 ibid 68 RDC analysis, based on Telecompaper data, 2019 69 Strategy Analytics, based on OECD data, 2018
38
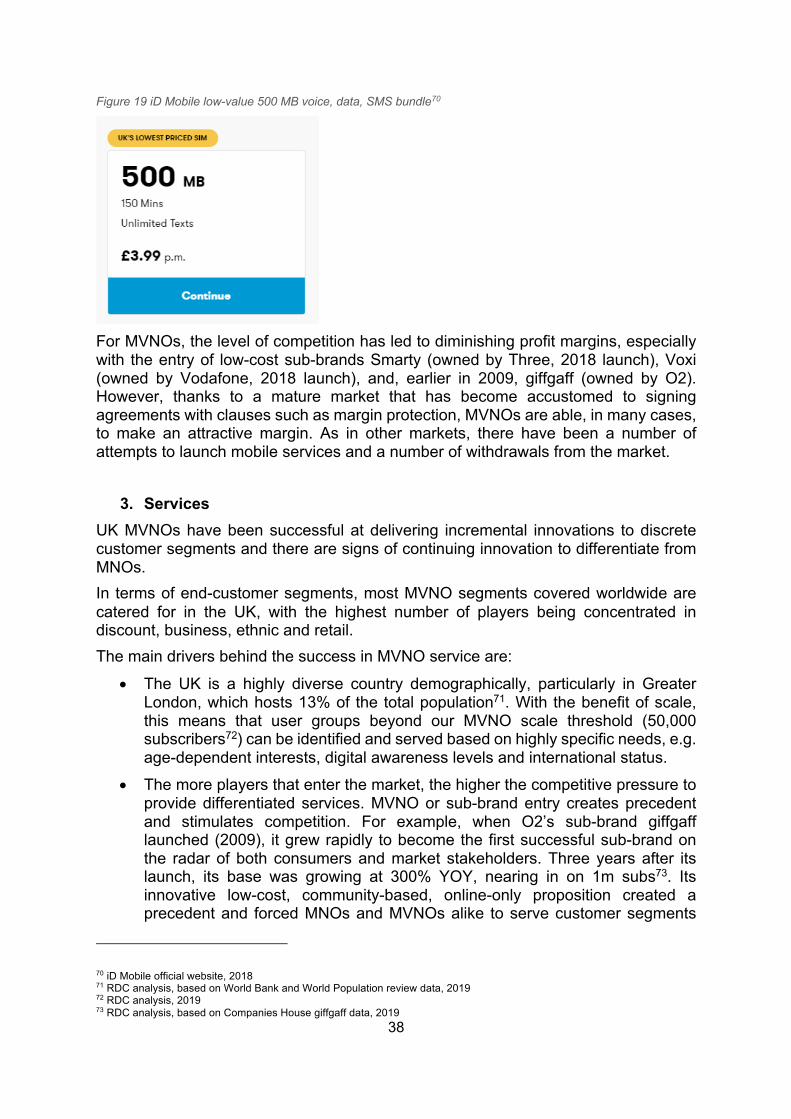
Figure 19 iD Mobile low-value 500 MB voice, data, SMS bundle70
For MVNOs, the level of competition has led to diminishing profit margins, especially with the entry of low-cost sub-brands Smarty (owned by Three, 2018 launch), Voxi (owned by Vodafone, 2018 launch), and, earlier in 2009, giffgaff (owned by O2). However, thanks to a mature market that has become accustomed to signing agreements with clauses such as margin protection, MVNOs are able, in many cases, to make an attractive margin. As in other markets, there have been a number of attempts to launch mobile services and a number of withdrawals from the market.
3. Services UK MVNOs have been successful at delivering incremental innovations to discrete customer segments and there are signs of continuing innovation to differentiate from MNOs. In terms of end-customer segments, most MVNO segments covered worldwide are catered for in the UK, with the highest number of players being concentrated in discount, business, ethnic and retail. The main drivers behind the success in MVNO service are:
• The UK is a highly diverse country demographically, particularly in Greater London, which hosts 13% of the total population71. With the benefit of scale, this means that user groups beyond our MVNO scale threshold (50,000 subscribers72) can be identified and served based on highly specific needs, e.g. age-dependent interests, digital awareness levels and international status.
• The more players that enter the market, the higher the competitive pressure to provide differentiated services. MVNO or sub-brand entry creates precedent and stimulates competition. For example, when O2’s sub-brand giffgaff launched (2009), it grew rapidly to become the first successful sub-brand on the radar of both consumers and market stakeholders. Three years after its launch, its base was growing at 300% YOY, nearing in on 1m subs73. Its innovative low-cost, community-based, online-only proposition created a precedent and forced MNOs and MVNOs alike to serve customer segments
70 iD Mobile official website, 2018 71 RDC analysis, based on World Bank and World Population review data, 2019 72 RDC analysis, 2019 73 RDC analysis, based on Companies House giffgaff data, 2019

39
more creatively. Fast forward 9 years: Sky added mobile to create a quad-play proposition (2016), Vodafone raced with Three to launch youth-targeting sub-brands (Voxi and Smarty launched in 2017) and Superdrug bundled mobile with health and beauty (2018).
Figure 20 MVNO segments targeted in the UK74
MVNO segments Current application in UK Discount ü
Specialised data services ü
Retail ü
Ethnic ü
Business ü
International/ roaming ü
Youth/ media ü
Bundled ü
4. Further considerations on the UK market
There are considerable differences in wholesale market share between the 4 MNOs in the UK, as well as in organisational attitudes towards wholesale. In terms of market share, O2 and EE are leading, while Vodafone and Three are serving a smaller share of the market. Operator details include:
• O2 is MVNOs’ MNO of choice in the UK. It hosts Tesco Mobile under a Joint Venture (4.9m subscribers), Lycamobile (1.2m subscribers) and Sky Mobile (335,000 subscribers) 75, as well as the giffgaff sub-brand
• EE hosts a major MVNO – Virgin (3.1m subscribers)76 and hosts two main sub-brands through merger with BT: BT Mobile, Plusnet. EE has a strong wholesale team and is looking for new airtime deals
• Over the past 3-5 years, Vodafone has had a policy to retrench from wholesale, but there are signs that they are revisiting this strategy and growing its wholesale operations.
• Three only hosts a small number of MVNOs, most notably iD Mobile, Gamma and Superdrug. It also hosts the Smarty sub-brand.
74 RDC analysis, based on MVNO official websites, 2019 75 RDC analysis, 2019 76 ibid

40
6.4. The Netherlands
The Netherlands is a market with a very high MVNO penetration rate, in spite of limited geographical reach, small-to-medium population size and a strong MNO presence. We have identified two main drivers of MVNO market growth: MNO proactivity in enabling wholesale through MVNO and sub-brand launches, and continuous targeting of discrete wholesale segments by MVNOs and sub-brands. This dynamic environment creates an appetite for consumers and enterprises to seek and request personalised deals, which perpetuates the market supply. Figure 21 The Netherlands MVNO market assessment77
Conditions
1. Scale 2. Economics 3. Services
Assessment criteria
How much scale can be achieved with existing demand?
How much can the market benefit economically?
How much scope is there for capturing service differentiation?
Netherlands MVNO market potential
3 4 5
1. Scale
Figure 22 The Netherlands market indicators78
Country Popu-lation (m)
Mobile penet-ration
MVNO connecti-ons (%)
MVNO + sub-brand connecti-ons (%)
MVNO launch
year
Population density
(#/sq. km)
Urban-isation
(%)
MVNOs + sub-brands
(#)
Netherlands 17.1 123% 16.5% 33% 2001 509 91 65
The Netherlands possesses sufficient scale to sustain a thriving MVNO market. This is based on arguments including:
• A total population size of 17m79. Although not a large number, it can sustain a number of key customer segments
77 RDC analysis, 2019 78 RDC analysis, based on World Bank, World Trade Organisation and Telecompaper data, 2019 79 World Trade Organisation, 2017

41
• A high 123% mobile penetration rate80
• High population density of 509 people per square km 81
• Dutch MNOs’ openness towards MVNO wholesale and sub-brand incremental growth, primarily driven by incumbent KPN.
Figure 23 The Netherlands’ top MVNOs and sub-brands82
Brand MVNO/ sub-brand
Host MNO Target market Year of launch
Current Lebara MVNO KPN Ethnic 2004 Lycamobile MVNO KPN Ethnic 2006 Simpel MVNO T-Mobile Discount 2007 AH Mobiel MVNO KPN Retail 2002 Telfort Sub-brand KPN Discount 1997 Hollandsnieuwe Sub-brand VodafoneZiggo Discount 2011 Simyo Sub-brand KPN Discount 2008 Ben Sub-brand T-Mobile Discount/ youth 1999 Telfort Zakelijk Sub-brand KPN Business 2005
Exited Launch - exit
Ziggo MVNO Vodafone Bundled 2013-2017
An analysis of the top 9 brands in the Netherlands MVNO wholesale market shows insights that are idiosyncratic to the Dutch market:
• MVNOs and MNO-owned sub-brands co-exist in a highly competitive environment
• KPN is the wholesale MNO hero for both MVNOs and sub-brands, alongside its KPN-branded services. On its website, KPN states “Every customer has their own preferences. Youngsters who are only interested in mobile internet, families seeking an affordable home package, companies who want to do worry-free business. For this reason, KPN has a number of different brands in order to serve diverse target groups as best as possible."83 However, in January
80 RDC analysis, based on World Bank and World Trade Organisation data, 2019 81 World Bank, 2018 82 RDC analysis, based on Telecompaper data, 2019 83 KPN official website, 2019

42
2019, KPN announced that it will begin to integrate four of its sub-brands into its KPN brand84. These are: Telfort, Telfort Zakelijk, XS4ALL and Yes Telecom, all of which offer mobile services from KPN’s network. This suggests that, even with wholesale MNO heroes, sub-brands (or, in other cases, MVNOs) achieve a critical growth stage where it becomes more valuable to transfer the customer base in-house.
• Discount offers are the most popular and relatively undifferentiated in terms of product and marketing
• Ethnic offers from international incumbents Lebara and Lycamobile are the second most successful in terms of segment-specific subscriptions
The element of scale behind these success stories lies within:
• Economies of scale and distribution power of MNOs for their sub-brands
• Brand awareness of international ethnic MVNOs Lebara and Lycamobile, as well as their local SME distribution channels
• A densely populated and urbanised market means lower distribution cost, as MVNOs may invest in fewer points-of-presence and marketing outlets.
2. Economics We believe that the Netherlands MVNO market delivers high economic benefit to its key participants. The key arguments for this include:
• MVNOs alone host 16.5% of total subscriptions85, which is about 6 percentage points higher than the European average and 12 percentage points higher than the world average
• Wholesale players, including MVNOs and sub-brands, have captured 33% of the market86
• KPN has been investing in MVNO and sub-brand ventures for about 13 years, leading 6 of the market’s top 9 MVNOs and sub-brands in terms of subscriber numbers (see Figure 23). They have mastered this strategy since buying Telfort in 2005 for US$1.19B87. This is a globally relevant example of MNOs that find pockets of economic growth through wholesale.
• Consumers receive great value for money in a highly competitive, discount-led wholesale market. This comprises both absolute prices and the variety of bundles. For example, Figure 24 shows four offers and price levels from Simpel. These are uncommon in other markets, as they offer relatively inexpensive services, including low-data options, in 2-year contracts. Simpel has been consistently in the top 10 wholesale providers and has experienced a management buyout, going from T-Mobile sub-brand to independent MVNO in 2014.
84 Telegeography, based on data from KPN official announcement, 2019 85 RDC analysis, based on Telecompaper data, 2019 86 RDC analysis, based on Telecompaper data, 2019 87 KPN has announced in January 2019 that it is bringing its sub-brand Telfort back into the KPN brand, expected 2019-2020

43
Figure 24 Simpel, low-value offers in 2-year contract88
3. Services In terms of services, the Netherlands hosts one of the most dynamic MVNO markets globally. While the top 5 MVNOs and sub-brands have maintained a relatively constant share of 50% of wholesale subscriptions over the past 3 years89, smaller niche players enter and exit at a fast pace. The Dutch MVNO players cover all the main global segments. However, some go a bit further in innovating in product and business model, including:
• Tibbaa Mobile, which has just launched in conjunction with the established Tibbaa ticketing business, creating a case for event-goers to have discounted access to mobile services. While success of this strategy will be apparent in the long-term, we believe that the high uptake in live entertainment, combined with digital services create a strong business case for the Dutch market
• Delta Mobile, which has relaunched its MVNO service in 2018 after turning it off in 2016, offering family-targeted deals bundled with utilities, broadband and TV. Its product packaging is highly targeted: for example, they “double the data for each DELTA Mobile subscription at your address. So the whole family participates every month.” and they offer free TV subscription if “You have Delta Internet”, “You have Delta Mobile” and “These subscriptions are at the same address” 90
88 Simpel official website, 2018 89 RDC analysis, based on Telecompaper data, 2019 90 Delta official website, 2018

44
Figure 25 Delta bundled offer91
Figure 26 MVNO segments targeted in the Netherlands92
MVNO segments Current application in the Netherlands Discount ü
Specialised data services ü
Retail ü
Ethnic ü
Business ü
International/ roaming ü
Youth/ media ü
Bundled ü
4. Further considerations on the Netherlands market
There is a trend in M&A at MNO/ fixed operator level, including the Vodafone/ Ziggo merger in 2018 and the upcoming T-Mobile/ Tele2 merger. These consolidations make a case for scale, as well as topping up investment in incremental innovations such as 5G and IoT/ M2M services. For current and future MVNOs, this trend could mean:
• Lower % market share of the mobile market as former MVNOs such as Tele2 gain MNO status
• Increasing pressure to acquire customers as multi-play operators convert fixed customers into mobile
• Potential competition from sub-brands as newly converged MNOs have cash to invest in new market opportunities.
Additionally, there have been active M&A at wholesale platform level, such as Teleena’s acquisition by TATA in 2018 and Elephant Talk’s acquisition by Pareteum in 2016. This is a sign of the growing need to develop robust technical platforms across different geographies, to serve MVNOs as they scale. 91 Delta official website, 2018 92 RDC analysis, based on MVNO official websites, 2019

45
6.5. Australia
Australia is an MVNO market that has achieved higher than average competition levels in mobile services. Based in a relatively restricted geographic area, with one of the lowest population densities and a mid-level population size in the OECD93, Australia would hypothetically have an average chance at developing a 4-5% MVNO share of the mobile market in 2018. However, its performance has beaten the odds, achieving an estimated 14% MVNO market share94, which we attribute to a dynamic entry/ exit culture, highly differentiated propositions and win-win partnerships between MNOs and MVNOs, which in some cases result in take-overs. Figure 27 Australia MVNO market assessment95
1. Scale
Figure 28 Australia MVNO market indicators96
Country Popu-lation (m)
Mobile penet-ration
MVNO connecti-ons (%)
MVNO + sub-brand connecti-ons (%)
MVNO launch
year
Population density
(#/sq. km)
Urban-isation
(%)
MVNOs + sub-brands
(#)
Australia 24.6 126% 14% 23% 2000 3 86 40
Australia hosts around 40 MVNOs and sub-brands, having been one of the first markets globally to test the model through the launches of Virgin Mobile and Boost Mobile. Its largest independent MVNO is amaysim, which in 8 years since launch has achieved around 4% of the total mobile market97, coming in at number 4 after the three MNOs, Telstra, Optus and Vodafone Hutchison Australia (VHA).
93 World Bank, 2018 94 RDC analysis, based on Analysys Mason and Kantar data, 2019 95 RDC analysis, 2019 96 RDC analysis, based on World Bank, World Trade Organisation, Telecompaper and ACMA data, 2019 97 RDC analysis, based on Venture Insights data, 2019
Conditions
1. Scale 2. Economics 3. Services
Assessment criteria
How much scale can be achieved with existing demand?
How much can the market benefit economically?
How much scope is there for capturing service differentiation?
Australia MVNO market potential 4 3 4

46
A more debateable success story is that of Virgin Mobile, which tested and proved the model under Richard Branson’s leadership in 2000. Growing to about 500,000 subscribers, in 2006 it became wholly owned by its host network, Optus, in a deal worth $100 million, where the Virgin brand would be preserved for 15 years98. Thus, Australia’s first MVNO became the country’s number one sub-brand. In 2018, Virgin Mobile’s subscriber base is around twice as large (an estimated 3.5% of the total mobile market), but experiencing decline year-on-year (0.4 percentage points 2016-2017)99. In May 2018, Optus announced the Virgin brand will be discontinued, all shops closed and customers to stay on until end of contract in 2020 or be migrated onto Optus100. We believe this decision is partially based on scaling difficulties – in a competitive, maturing market, customer segments overlap and transient consumers shop around according to the latest deals. This, in conjuncture with an MNO owner’s own goals (in Optus’s case, responding for the VHA-TPG upcoming merger), could mean that a declining sub-brand base may bring higher returns via the parent brand. While amaysim and Virgin are extreme examples of entry and exit, many other MVNOs manage to scale in highly differentiated target markets, the biggest ones being ethnic (Lycamobile and Lebara), retail (Aldi Mobile, Woolworths Mobile, Kogan Mobile) and bundled (Dodo). Of these, successful players have some degree of access to an existing customer base. For example, Aldi Mobile, with an estimated 3% of the total mobile market101, is owned and distributed by discount supermarket brand Aldi. Dodo is owned by Vocus Group, a supplier of energy and broadband services in Australia. Figure 29 Australia top MVNOs and sub-brands102
Brand MVNO/ sub-brand
Host MNO Target market Year of
launch
ALDI Mobile MVNO Telstra Retail 2013 Boost Mobile MVNO Telstra Youth/ Millennial 2000 Lycamobile MVNO Telstra Ethnic 2010 Woolworths Mobile MVNO Telstra Retail 2009 amaysim MVNO Optus Bundled/ Discount 2010 Dodo MVNO Optus Bundled 2004 OVO MVNO Optus Media 2015 Kogan Mobile MVNO VHA Retail 2015 Virgin Mobile Sub-brand Optus Aspirational brand 2000 Lebara Sub-brand VHA Ethnic 2009 Belong Sub-brand Telstra Bundled/ Discount 2017
98 Sydney Morning Herald, 2006 99 Kantar, 2017 100 Optus official website, 2018 101 RDC analysis, based on Venture Insights data, 2019 102 RDC analysis, based on Telecompaper data, 2019

47
Exited Launch-exit
Virgin Mobile MVNO Optus Aspirational brand 2000-2006
Lebara MVNO VHA Ethnic 2009-2016
2. Economics
In terms of economic benefit to end-customers, MVNOs and MNOs, Australia is in the middle range. While consumers have a wide range of price points and bundled options, the cost to serve them seems more bearable by incumbent MNOs than by independent MVNOs. Along with the Virgin Mobile exit that has been discussed, another high-profile case of MVNO-turned-sub-brand is Lebara, which was acquired by VHA in 2016 after 7 years of operation. Our analysis indicates that, while Lebara may have found its Australian margin insufficient compared to opportunities in other countries, VHA would have seen an increase in its wholesale margin from a customer segment that is separated from its own. Red Bull Mobile also exited after 2 years in the market. With a proposition including paying one year in advance, unmetered access to Red Bull video content and tickets to Red Bull-sponsored 'experiences', it addressed a highly niche market. This, along with the fact that it was one of the last MVNOs on the VHA network at the time, prompts us to believe that the MNO wholesale costs were too high to sustain a profitable business. For end-customers, prices are relatively accessible for the middle-ranged data, offers are often bundled with broadband, utilities and media services, and MVNOs such as Dodo provide niche-market options, such as the one in Figure 30 for high data consumption. Figure 30 Dodo Mobile high-data bundles, 1-year contract103
103 Dodo Mobile official website, 2019

48
3. Services Australia is a highly diverse and innovative market in terms of services delivered by independent MVNOs: so much so, that the biggest ones are seen as valuable investments to have in-house, as Virgin Mobile and Lebara acquisitions have shown. We believe that one of the best examples is amaysim, the country’s largest MVNO in subscriber numbers (4% market share104), and its most fast-paced. From 2015 until time of writing, amaysim started trading publicly on the Australian Stock Exchange (2015) and made 3 main acquisitions: Australian Broadband Services to mark its entry into bundled telecoms (2016), Vaya, an MVNO that added almost 20% to its customer base105 (2016) and Click Energy to add utilities to its proposition (2017). Its growth strategy is inverse to most MVNOs’ – it started with mobile and extended into bundled services, sub-branding and an IPOs. Although at the time of writing it has exited the broadband market by selling to Southern Phone, its start-up mentality and understanding of scale and differentiation are key drivers behind their high market share. Figure 31 amaysim bundled offer106
Further proof of innovation-driven services is Boost Mobile, founded in 2000, with a sister company in the USA owned by Sprint and currently just below 1% market share in Australia (an estimated 300,000 subscribers)107. Referring to the need to segment and differentiate, Boost Mobile’s founder Peter Adderton said of the company’s entry: “I could see that the carriers were incapable of talking to segments in the market. They’d just take anyone from the age of five to 65 and bundle them all in on the same plan.”108
104 RDC analysis, based on Venture Insights data, 2019 105 RDC analysis, based on Sydney Morning Herald data, 2019 106 amaysim official website, 2019 107 RDC analysis, based on Roy Morgan data, 2019 108 Boost Mobile CEO interview with Smart Company, 2019
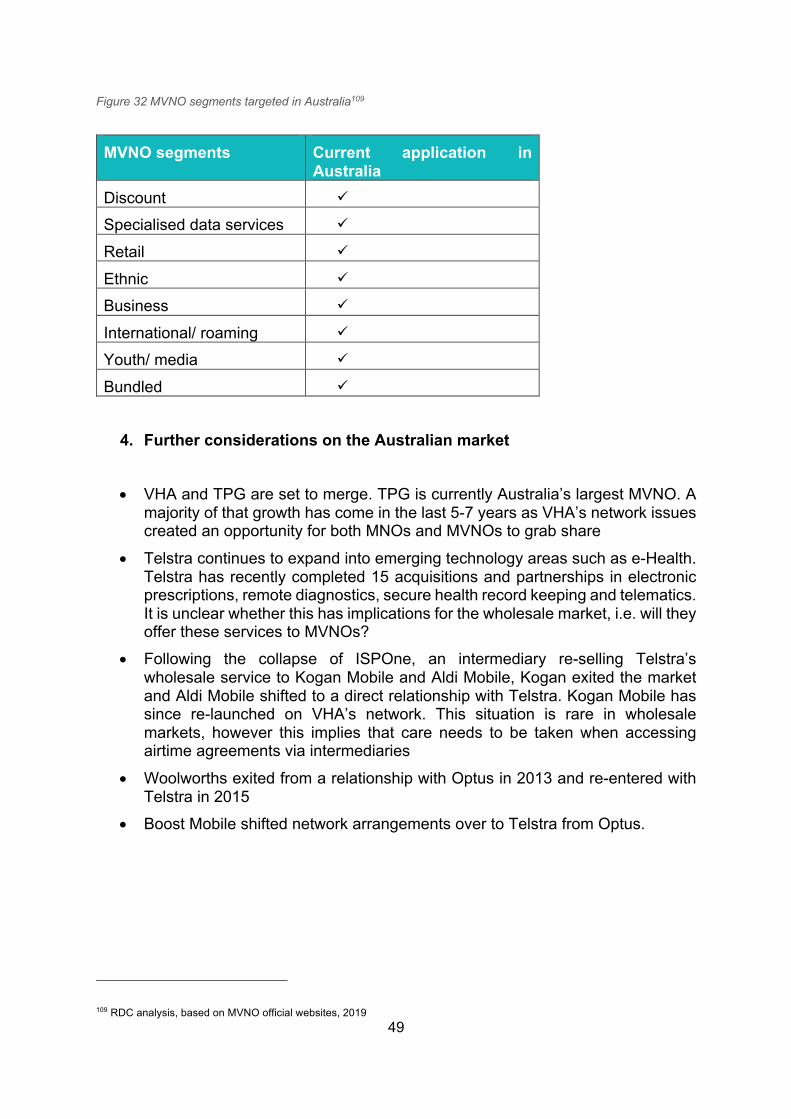
49
Figure 32 MVNO segments targeted in Australia109
MVNO segments Current application in
Australia Discount ü
Specialised data services ü
Retail ü
Ethnic ü
Business ü
International/ roaming ü
Youth/ media ü
Bundled ü
4. Further considerations on the Australian market
• VHA and TPG are set to merge. TPG is currently Australia’s largest MVNO. A majority of that growth has come in the last 5-7 years as VHA’s network issues created an opportunity for both MNOs and MVNOs to grab share
• Telstra continues to expand into emerging technology areas such as e-Health. Telstra has recently completed 15 acquisitions and partnerships in electronic prescriptions, remote diagnostics, secure health record keeping and telematics. It is unclear whether this has implications for the wholesale market, i.e. will they offer these services to MVNOs?
• Following the collapse of ISPOne, an intermediary re-selling Telstra’s wholesale service to Kogan Mobile and Aldi Mobile, Kogan exited the market and Aldi Mobile shifted to a direct relationship with Telstra. Kogan Mobile has since re-launched on VHA’s network. This situation is rare in wholesale markets, however this implies that care needs to be taken when accessing airtime agreements via intermediaries
• Woolworths exited from a relationship with Optus in 2013 and re-entered with Telstra in 2015
• Boost Mobile shifted network arrangements over to Telstra from Optus.
109 RDC analysis, based on MVNO official websites, 2019

50
7. Implications and recommendations From our global analysis and assessment of the NZ market, there is further scope for MVNO growth, however this growth potential is limited. It is almost 12 years since the first MVNO launch in NZ, but they only account for 1% of the mobile market110. We believe MVNOs could achieve a 10-15% share of the market in the next 5-10 years, amounting to 650,000 to 975,000111. We anticipate the market can sustain approximately 10-15 MVNO players. Incremental growth opportunities will come from the youth, enterprise and IoT/M2M markets including, to a smaller extent, consumers adopting multiple connections (e.g. for devices such as wearables) The benefit of stimulating MVNO growth will be to:
• Protect customer interests from a pricing perspective
• Ensure customers benefit from new service creation and innovation
• Provide converged media players, large retailers and enterprises with the ability to bundle mobile services to provide a more rounded service offering
• Help develop new data services which will be an efficient way of utilising the extra network capacity that will arise with the introduction of 5G.
To achieve this growth, models adjacent to the MVNO model should be considered. We do not believe there is sufficient scale achievable and justification for the investment required for the Full MVNO. Therefore, the following operating models could be considered:
• Joint ventures • Licensed resellers
• Sub brands
• Service providers
• Light MVNO. Looking at the drivers for MVNOs, we conclude that the following are likely to drive MVNO adoption in NZ:
• An increased willingness of MNOs to offer wholesale services
• Increased capacity with 5G spectrum • Growth in data usage fuelled by new content services offered by non-telco
brands
• Improved digital platforms to facilitate innovation by new entrants, utilising cloud infrastructure so platforms do not need to be physically in NZ
• Greater bundling with media and increasing demand for quad play offerings
110 NZ Commerce Commission, 2018 111 RDC analysis, 2019

51
• Enterprises requiring mobility services as part of a wider unified communications portfolio
• Differentiated services being offered to the discount, retail, youth and media segments.
In order to stimulate MVNO growth in NZ to achieve these benefits, we recommend three sets of action for the Commerce Commission. This starts with further analysis to validate and size the market, followed by developing a set of tools to be used to foster a healthy market, and introducing regulatory measures. If the Commerce Commission decides (in the future) to stimulate the MVNO market further, we have identified a set of actions under points 1 and 2 below which it could consider undertaking prior to regulatory interventions. If the Commission decides that regulatory interventions seem reasonable and/or necessary, these can be established as a follow on or in parallel to points 1 and 2 below.
1. Validate the MVNO Market In order to understand size of the MVNO market and where specific opportunities lie, we recommend a set of commercial analyses, to determine the level of effort to be undertaken and where this effort should be prioritised:
• Analyse segments: Perform a segmentation analysis of the NZ market to understand which sectors are underserved and which ones are likely to emerge. These segments should be matched to operating model options (i.e. joint venture to light MVNO), depending on scale and functionality requirements
• Calculate the approximate number of subscribers required to breakeven using the business models and segments identified
• Perform a deeper drill on IoT and enterprise segment needs to identify additional requirements which need to be supported by MNOs or MVNOs
• Assess interest: Discuss willingness to offer wholesale services with MNOs and appetite of large potential MVNOs, including companies that:
o Decided against launching o Failed to agree an MVNO contract o May not have considered launching, but own a unique asset, brand or
capability that would help them succeed as an MVNO.
2. Develop reference tools To stimulate MVNO business in NZ, we recommend developing a set of guidelines based on global best practice. These measures will not require significant investment.
• Establish a fair wholesale price: This can be done by understanding the margin requirements under each of the proposed business models, conducting retail benchmarks and considering costs by well understood methods such as LRIC (long run incremental costs). IoT will require a different set of principles based

52
on varying SLAs such as for throttling. Once a model for calculating costs has been established, this can be used as a regulatory tool or as guidance to make it easier for new entrants to come to an agreement with the network host
• Develop a reference contract: Create a framework agreement which acts as a checklist to ensure a healthy relationship is set between an MNO and an MVNO. This will include margin protection provisions, exit conditions, support management, SLAs, competition clauses, exclusivity etc.
• Develop best practice guidelines: Review global successes, and provide a set of recommendations to ensure MVNO success including pricing, on-boarding, platform set up, service roadmap, distribution options, and non-restriction of services offered by the host MNO
• Develop platform recommendations: Analyse MNO platforms to provide guidance on flexibility. Compare this to relevant vendors (MVNEs) which can serve the NZ market. Provide independent guidance on vendor’s capabilities to provide services for the segments identified and costs expectations
3. Develop regulatory measures Whilst we do not propose heavy handed regulation, we recommend some regulatory measures to help drive the MVNO market: • Analyse MTRs: Develop a cost and price elasticity model to assess whether
providing asymmetric MTRs (i.e. higher inbound revenue to smaller new entrants) is a feasible mechanism to assist MVNO growth
• Consider offering spectrum on a local level to support 5G applications e.g. for specialist IoT wholesale service providers. The feasibility of the Airspan Group model as a neutral host network can be assessed
• As mentioned above under reference tools, the Commerce Commission may consider creating a pricing model which can be used to regulate the underlying wholesale airtime network price. From this reference price, the ‘mark-up’ by the operator will be left to negotiation between the operator and MVNO depending on the business model being adopted
• Consider making supporting MVNOs mandatory for networks when they are allocated 5G spectrum. This option requires ascertaining interest and business cases from prospective MVNOs and IoT players. NZ MNOs will need to be prepared for the potential condition in spectrum allocation and MVNEs can be identified that could support prospective MVNO services.
---- END OF REPORT ---