Embed Size (px)
Citation preview
R&D Uncertainty in Future Benefits
Ozer Asdemir University of St. Thomas, Minnesota
Mohammed H. A. Mufti
King Abdulaziz University, Kingdom of Saudi Arabia
Fareed O. Sheikh King Abdulaziz University, Kingdom of Saudi Arabia
This paper contributes to the current debate on accounting treatment of R&D expenditures. We considered two different measures of future benefits to a firm, sales revenue and operating cash flows. We provide evidence that R&D expenditures do not generate more uncertain future sales revenue or operating cash flows compared to capital expenditures. In terms of sales revenue, R&D expenditures generate significantly less uncertain future benefits compared to capital expenditures. And in terms of operating cash flows, our results do not provide conclusive evidence that whether R&D expenditures generate more uncertain future benefits than capital expenditures or not. INTRODUCTION
Our objective in this study is to provide further evidence on the relative degree of uncertainty of future benefits attributable to current research and development (R&D) expenditures and to current capital expenditures. Kothari, Laguerre, and Leone (hereafter KLL) (2002) consider the uncertainty of future earnings in their analysis and find that future earnings from R&D expenditures are more uncertain than future earnings from capital expenditures. In addition to the uncertainty of future earnings, we examine the uncertainty of future sales revenue and operating cash flows. The motivation for looking into sales revenue stems from the fact that all stakeholders in a firm receive, or expect to receive, a stream of income from the firm (Sunder 2008). Total value a firm generates for all of its stakeholders is sales revenue. Sales revenue is an important performance measure because it is useful not only as a summary measure but also in providing new information to the market (Chandra and Ro, 2008). And investors’, lenders’, and other creditors’ expectations about returns depend on their assessment of the amount, timing, and uncertainty of future net cash inflows to the entity (FASB SFAC No. 8). Hence we also included the uncertainty operating cash flows in our analysis.
Our study compares the relative contributions of current R&D and capital expenditures to future earnings variability, sales revenue variability and operating cash flow variability. We use the standard deviation of realized future earnings, sales revenue and operating cash flows as measures for the uncertainty of future benefits. We analyze a sample of over 50,000 firm-year observations from 1987 to 2005 with data on R&D, capital expenditures and estimates of variability in future benefits. We find
148 Journal of Accounting and Finance vol. 12(3) 2012

mixed evidence on the relationship between R&D expenditures and uncertainty of future benefits. Specifically, similar to KLL (2002), in a regression of future earnings variability on R&D, capital expenditures, and other economic determinants of earnings variability such as leverage and firm size the coefficient on R&D is more than three times as large as that on capital expenditures. However, in a regression of future sales revenue variability on R&D, capital expenditures, and other economic determinants of earnings variability the coefficient on capital expenditures is larger than that on R&D. Further, analysis with future operating cash flows variability does not reveal convincing evidence that the coefficient on R&D is larger than that on capital expenditures.
R&D is an important productive input for a significant number of firms (Aboody and Lev, 2000) and it has increased significantly during the last few decades. We find that corporate spending on R&D increased from $20.4 billion in 1975 to $390.4 billion in 2009 peaking at $467 billion in 2007 for all firms in COMPUSTAT database. In 2009, R&D represents 2.7 percent of total assets and 3.9 percent of total sales revenue for firms which report R&D on their financial statements. The accounting treatment of R&D expenditures requires firms to expense such expenditures in the period incurred (FASB ASC 730-10-25-1). This treatment of R&D has been a topic of question. FASB employs the degree of uncertainty of future benefits as a criterion in determining whether a given cost should be capitalized or expensed. And FASB's perceived degree of uncertainty about future benefits from R&D probably commands the current accounting for R&D expenditures.
Studies that suggest the capitalization of R&D or improved R&D disclosures document evidence that R&D is associated with future performance (Lev and Sougiannis, 1996; Deng and Lev 2006). Additionally, the capitalization (and amortization) of software development costs improves the prediction of future earnings (Aboody and Lev, 1998) and extensive product-development and patent protection disclosure by biotech IPOs reduces risk evidenced by reduced stock volatility and bid-ask spreads (Guo, Lev, and Zhou, 2004). Further, previous studies show that adjusting accounting numbers for capitalization of R&D result in increased association between stock prices and accounting numbers (Lev and Sougiannis, 1996; Lev, Nissim, and Thomas, 2007). Although, the investors understand the capital properties of R&D expenditures they fail to incorporate these benefits fully into stock prices evidenced by positive excess stock market returns experienced by firms with high R&D to market value ratio (Chan, Lakonishok, and Sougiannis (hereafter CLS), 2001). This is probably due to the current accounting treatment of R&D.
On the other hand, consistent with FASB's concern regarding uncertainty, KLL (2002) provides evidence that future benefits from R&D expenditures are more uncertain than future benefits from capital expenditures. This relationship is more pronounced in R&D-intensive industries (Amir, Guan, and Livne, 2007). In addition, firms that have more productive R&D exhibit less volatile future operating performance (Pandit, Wasley, and Zach (hereafter PWZ), 2011) which is still higher than the volatility of future operating performance from capital expenditures. And for bondholders, when credit risk associated with R&D intensive firms is considered, the risks and uncertainties of R&D dominate the future benefits (Shi, 2003). Furthermore, excess returns to R&D intensive firms might be due to the risk associated with R&D expenditures (Chambers, Jennings, Thompson, 2002). Overall, these studies favor the expensing of R&D.
Our results contribute to the current debate on accounting treatment of R&D expenditures. We provide evidence that is contrary to the notion that R&D expenditures generate future benefits that are more uncertain than benefits from expenditures in PP&E. The outline for the remainder of the paper is as follow. Next section provides the background and motivation for our study. After that we present the research design of the paper followed by the results of empirical analysis and our conclusion. BACKGROUND AND MOTIVATION
Financial Accounting Standards Board (FASB) sets accounting standards in United States that set out Generally Accepted Accounting Principles (GAAP). Primary qualitative characteristics of accounting information FASB considers in setting standards are relevance and representational faithfulness. GAAP
Journal of Accounting and Finance vol. 12(3) 2012 149

requires R&D expenditures to be expensed in the period incurred (FASB ASC 730-10-25-1) because R&D expenditures do not meet the representational faithfulness and the relevance criteria:
“…there is often a high degree of uncertainty about whether research and development expenditures will provide any future benefits…” (FASB ASC 730-10-5-3) “At the time most research and development costs are incurred, the future benefits are at best uncertain. In other words, there is no indication that an economic resource has been created... There is normally little, if any, direct relationship between the amount of current research and development expenditures and the amount of resultant future benefits to the entity…” (FASB ASC 730-10-5-2)
Chartered Financial Analyst (CFA) institute, formerly known as the Association for Investment
Management and Research (AIMR), is an international, nonprofit organization of more than 70,000 investment practitioners and educators. As an important body of accounting information users they in general concur with FASB’s position on R&D expenditures. For example the following statement outlines their position:
“We are not enamored of recording self-developed intangible assets unless their values are readily apparent. We consider the cost of creating them to be so often unrelated to their actual value as to be irrelevant in the investment valuation process. Furthermore, it usually is next to impossible to determine in any sensible or codifiable manner exactly which costs provide future benefit and which do not.”(AIMR, 1993)
Prior research mostly focused on the relevance of R&D expenditures. Sougiannis (1994) examines
whether reported accounting earnings reflect benefits from past R&D expenditures. He shows that the total effect of past R&D on earnings ranges from 1.559 in 1978 to 2.829 in 1984 with a mean value of 2.083. He provides evidence that indicate R&D benefits last for seven years. Lev and Sougiannis (1996) provide a procedure to estimate depreciation rates for R&D expenditures in each R&D intensive industry. Using the procedure they capitalize and amortize R&D expenditures. Their estimates indicate that useful life of R&D ranges from five years in Scientific Instruments industry to nine years in Chemicals and Pharmaceuticals industry. Eberhart, Maxwell, and Siddique (2004) analyze the future operating performance of firms with unexpected R&D increases. They show that value-weighted and equal-weighted abnormal profit margin for firms that had unexpected R&D increases within the past five years is significantly positive. Their evidence indicates that R&D increases lead to better than expected future operating performance in terms of profit margin. Hence there is a direct link between a firm's reported total R&D, although not for individual R&D projects, and future operating performance.
While it has been documented that investors on average consider R&D expenditures to be asset (Hirschey, 1982; Lev and Sougiannis, 1996), investors fail to incorporate the effect of R&D expenditures on future operating performance fully into stock prices, that is R&D is underpriced (Lev and Sougiannis, 1996; CLS, 2001). Lev and Sougiannis (1996) present evidence that although capitalized R&D expenditures are associated with contemporaneous stock prices and returns, capitalized R&D expenditures are also associated with subsequent stock returns. Hence they conclude that the contemporaneous stock prices do not fully reflect the R&D benefits. CLS (2001) show that the market on average fully incorporates R&D benefits into stock prices. However their results indicate that firms with high R&D to market value ratio have positive risk-adjusted future excess returns. Eberhart, Maxwell, and Siddique (2004) show that long-term abnormal stock return persists after abnormal increases in R&D expenditures, which is consistent with investors’ under-reaction to the new information contained in increased R&D expenditures. Collectively this evidence suggests that the market is inefficient and the inefficiency is due to the investors being misled by conservative accounting for R&D expenditures.
On the other hand KLL (2002) show that future earnings from R&D expenditures are more uncertain than future earnings from capital expenditures. They measure the uncertainty of future earnings as the
150 Journal of Accounting and Finance vol. 12(3) 2012
future earnings variability. Future earnings variability is measured as standard deviation of five future annual earnings per share. They demonstrate that future earnings generated by R&D are three times more uncertain than future earnings generated by capital expenditures. Further analysis of the relationship between R&D expenditures and uncertainty of future benefits reveals that firms that have more productive R&D exhibit less volatile future operating performance (PWZ, 2011). Shi (2003) analyzes how creditors assess the risks and future benefits of R&D expenditures. The risks of R&D here refer to the credit risk and default risk. He shows that R&D is significantly associated with bond default ratings and bond premium risk. He also shows that R&D alone approximately explains 80 percent of cross-sectional variations in bond ratings and bond risk premium.
Overall, prior research shows that the benefits from past R&D expenditures are reflected in the reported accounting earnings but investors fail incorporate these benefits fully into stock prices. And these benefits are more uncertain than the benefits from past capital expenditures. In addition creditors consider R&D expenditures as risk proxies.
The main purpose of this paper is to further explore whether the variability of the realizations of future benefits is greater due to R&D expenditures than to capital expenditures. We use three different proxies for future benefits to a firm: Earnings, Sales revenue, and Operating cash flows. Sunder (2008) discusses the value of a firm under neoclassical economic theory and contract theory. Our first measure of future benefits to a firm is based on prior literature which follows the neoclassical economic theory of firm. In the neoclassical economic theory a firm is seen as an instrument of the entrepreneur or owner. All agents, other than the owner, are considered passive in the sense that their behavior can be well represented by their respective functions. The owner works with production, supply and demand functions to maximize the value of the firm he owns. Value to the owner is the value of the firm (Sunder 2008). Financial accounting reports are based on the value to the owner. The objective of financial reporting is to provide financial information about the reporting entity that is useful to external users in making decisions about providing resources to the entity. Hence the primary focus of financial reporting is information about an enterprise’s comprehensive income and its components. Investors, creditors, and others who are concerned with assessing the prospects for enterprise net cash inflows are especially interested in that information (FASB SFAC No. 8). Hence our first measure of benefits generated by a company for its investors, to replicate the findings of KLL (2002), is earnings.
The rationale for our next measure stems from the contract theory of firm. Under the contract-theoretic view (Barnard, 1936; Simon, 1947; Cyert and March, 1963), a firm is a set of contracts or alliances among agents. Each agent contributes factors of production to the firm, and receives compensation in the form of cash or other resources in exchange. Each agent chooses to participate in the firm if the value of compensation offered by the firm exceeds the opportunity cost of his resource contributions. Hence, all stakeholders in a firm receive, or expect to receive, a stream of income from the firm (Sunder 2008). These stakeholders would include, but is not limited to, investors, creditors, customers, vendors, employees, and government. And the total value a firm generates for all of its stakeholders is its sales revenue. We included sales revenue in our analysis as a measure of total benefits generated by a company for its stakeholders.
Sales revenue is an important performance measure for several reasons. Chandra and Ro (2008) provide evidence that sales revenue is useful not only as a summary measure but also in providing new information to the market. Sales revenue is more useful than earnings in summarizing the performance of technology firms and for profit incidents. Although the new information conveyed by earnings has declined, the new information conveyed by sales revenue has not. Further, earnings surprises that are accompanied by revenue surprises indicate more persistent earnings growth than similar levels of earnings surprises not accompanied by revenue surprises (Jagadeesh and Livnat 2006). Last, but not least, sales revenue models are less biased, better specified, and more powerful than accrual based models in detecting earnings management (Stubben. 2010).
Prior research provide evidence that demand uncertainty depresses firm investment (Bo, 2002; Fuss and Vermeulen, 2004) and this adverse effect of demand uncertainty on R&D investments is sharper than that of on non-R&D related investments (Goel and Ram, 2001). Hence we expect firms to invest in R&D
Journal of Accounting and Finance vol. 12(3) 2012 151
projects that would lead to less volatile sales revenue. Thus R&D would generate less uncertain future sales revenue than capital expenditures.
Our last measure of future benefits also follows the neoclassical economic theory of firm. Decisions by investors about buying, selling, or holding equity and debt instruments depend on the returns that they expect such as dividends, principal and interest payments, or market price increases. Similarly, decisions by creditors about providing or settling loans and other forms of credit depend on the principal and interest payments that they expect. Hence investors’ and creditors’ expectations about returns depend on their assessment of the amount, timing, and uncertainty of future net cash inflows to the entity (FASB SFAC No. 8). Although, information about earnings based on accrual accounting usually provides a better inference of a firm's ability to generate cash flows, the end goal is assessing the prospects for future net cash inflows to a firm. Hence, uncertainty of future net cash inflows would be more relevant to investors and creditors than uncertainty of future earnings. Consequently, our last proxy for benefits generated by a company for its investors and creditors is operating cash flows.
Minton and Schrand (1999) provides evidence that higher cash flow volatility leads to lower average levels of investment in capital expenditures, R&D, and advertising. And this relationship is strongest for R&D after controlling for cash flow levels. Thus firms which rely on R&D for innovation would invest in R&D projects that would lead to less volatile cash flows. Hence we expect R&D to generate less uncertain future cash flows than capital expenditures. RESEARCH DESIGN Empirical Model
To explore the notion that the variability of future benefits is more sensitive to R&D expenditures than capital expenditures, we estimate the following model (firm subscript i is suppressed) from KLL (2002):
FIGURE 1 FUTURE UNCERTAINTY EQUATION
STDEV(FVt+1,t+5) = α + β1t CapExt + β2t RNDt+ β3t ADVt + β4t MVt + β5t Leveraget + et+1,t+5
STDEV(FVt+1,t+5) is the standard deviation of future benefits; Proxies for FV are sales revenue (St),
earnings before extraordinary items and discontinued operations (Et), or operating cash flows (CFt); the standard deviation is calculated using five annual observations for years t+1 through t+5; each observation is deflated either by the book value of equity, BKV, or by stock price, PRC, at the beginning of the period t; CapExt is the capital expenditure per share, deflated by BKV or PRC; R&Dt is research and development per share, deflated by BKV or PRC; ADVt is advertising expense per share, deflated by BKV or PRC; MVt is the natural logarithm of the market capitalization of equity at the end of year t; and Leveraget is the ratio of long-term debt to the market value of equity plus long-term debt, both at the end of year t.
Our focus is on the coefficients of R&D and capital expenditures. However, we include advertising, leverage, and market value as control variables which are motivated for inclusion by KLL (2002). Based on the results of KLL (2002), we expect advertising and leverage to be positively associated with variability of future benefits, while market value of firm is expected to be negatively associated with variability of future benefits. Sample Selection
We obtain financial data from the Compustat Annual Industrial and Annual Research files for the period 1987-2005. For each year t from 1987 to 2005, we retain all observations with non-missing data for the following: CapExt is capital expenditures, Compustat data CAPX; RNDt is research and development expense, data XRD, a zero reported amount is not treated as a missing value; ADVt is
152 Journal of Accounting and Finance vol. 12(3) 2012
advertising expense, data XAD, a missing value is set to zero; MVt is the market value of equity, measured as the natural logarithm of the product of the fiscal-year closing price and common shares outstanding [log(PRCC_F*CSHPRI)]; Leveraget is the sum of long-term debt, data DLTT, and debt in current liabilities, data DLC, divided by the sum of long-term debt and the market value of equity; Et is the primary earnings per share before extraordinary items and discontinued operations, data EPSPX; St is sales revenue, data SALE, divided by the number of common shares; CFt is cash flows from operations, data OANCF, divided by the number of common shares; PRC is share price, data PRCC_F; and BKV is the stockholders’ equity, data SEQ, divided by the number of common shares outstanding. We exclude negative BKV firms when BKV is used as the deflator.
PRC and BKV are measured at the end of fiscal year t-1 because they are used as deflators. Per share values of PRC, BKV, and future benefits, FVt+1 to FVt+5, are adjusted for stock splits and stock dividends using the cumulative adjustment factor, Compustat data AJEX, so that they are comparable to the per share values of the remaining variables for year t. Our sample period is from 1987 to 2005 since the first date when operating cash flows data is available is 1987. And because variability of future benefits is calculated using data for five years following year t, the last year of the sample period is 2005.1
Research intensive firms are likely to go through mergers and acquisitions, and not survive the five year period required to calculate variability of future benefits (PWZ, 2011). This would lead to survivorship-bias. Even though future benefits variability is calculated using five years of future data, to avoid survivor bias, following KLL (2002)'s approach, we do not require future benefits data availability for years t+1 to t+5 for a firm-year to be included in the data. In cases where future benefits data are missing in any of the periods from t+1 through t+5, the standard deviation of future benefits, STDEV(FVt+1,t+5) is set equal to the mean of STDEV(FVt+1,t+5) for the firms in the same Altman Z-Score decile portfolio.2
The ending sample consists of a total of 51,866 firm-year observations when book-value of equity is used as the deflator and 51,837 observations when price is used as the deflator. Deflators are used to mitigate heteroscedasticity in the regressions. Descriptive Statistics
Panel A of Table 1 presents the descriptive statistics for the variables deflated by PRC. We winsorize Sales, RND, CapEX, ADV, MV, and leverage at the top and bottom one percent of their distribution each year. We winsorize deflated earnings variable at -1 and +1. And, Panel B of Table 1 presents the descriptive statistics for the variables deflated by BKV. Average spending for capital expenditures are 7.38% of their share price and 15.34% of their book value. Firms spend 6.73% of their share price and 18.49% of their book value on R&D expenditures. Our sample firms are, on average, loss firms. Average earnings per share are -0.0574, deflated by PRC, and -0.0668, deflated by BKV. The median earnings are positive. Average and median standard deviation of future earnings are similar to those of future cash flows. The average (median) standard deviation of future earnings are 0.1359 (0.0936), deflated by PRC, and 0.1734 (0.1440), deflated by BKV. And the average (median) standard deviation of future cash flows are 0.1310 (0.0955), deflated by PRC, and 0.1873 (0.1554), deflated by BKV. The average standard deviation of future sales revenue is much higher than those of earnings and cash flows.
Journal of Accounting and Finance vol. 12(3) 2012 153
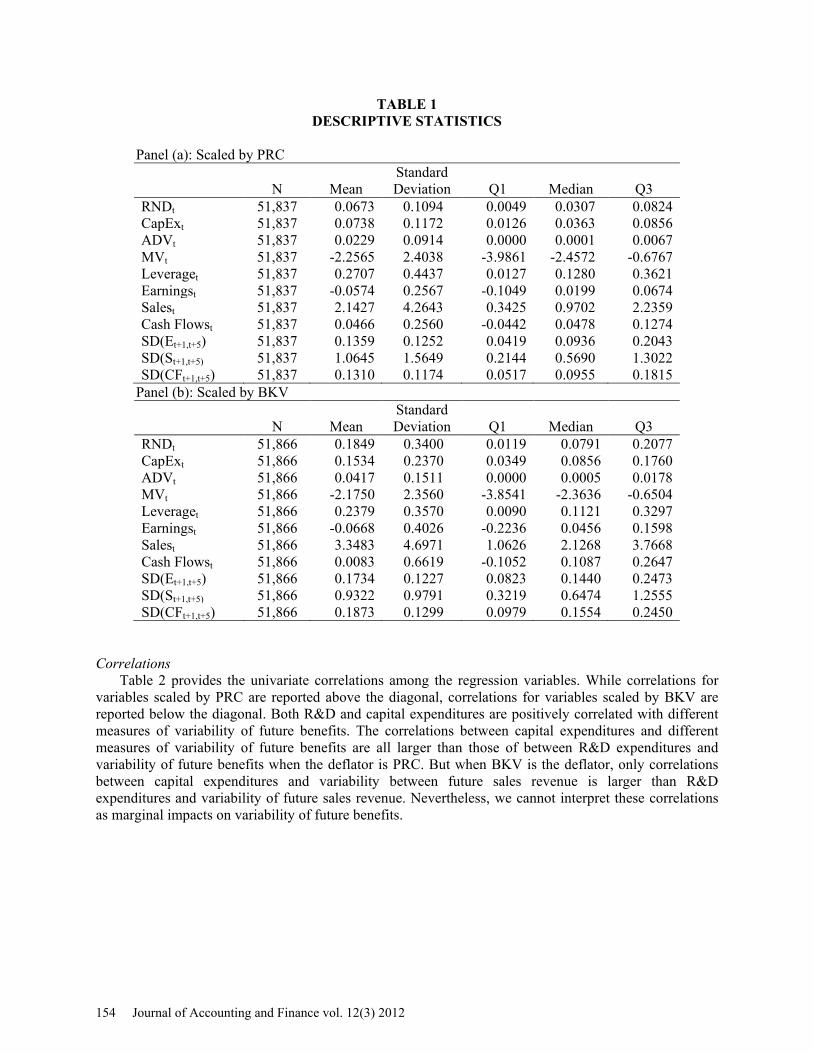
TABLE 1 DESCRIPTIVE STATISTICS
Panel (a): Scaled by PRC
N
Mean
Standard Deviation
Q1
Median
Q3
RNDt 51,837 0.0673 0.1094 0.0049 0.0307 0.0824 CapExt 51,837 0.0738 0.1172 0.0126 0.0363 0.0856 ADVt 51,837 0.0229 0.0914 0.0000 0.0001 0.0067 MVt 51,837 -2.2565 2.4038 -3.9861 -2.4572 -0.6767 Leveraget 51,837 0.2707 0.4437 0.0127 0.1280 0.3621 Earningst 51,837 -0.0574 0.2567 -0.1049 0.0199 0.0674 Salest 51,837 2.1427 4.2643 0.3425 0.9702 2.2359 Cash Flowst 51,837 0.0466 0.2560 -0.0442 0.0478 0.1274 SD(Et+1,t+5) 51,837 0.1359 0.1252 0.0419 0.0936 0.2043 SD(St+1,t+5) 51,837 1.0645 1.5649 0.2144 0.5690 1.3022 SD(CFt+1,t+5) 51,837 0.1310 0.1174 0.0517 0.0955 0.1815
Panel (b): Scaled by BKV
N
Mean Standard Deviation
Q1
Median
Q3
RNDt 51,866 0.1849 0.3400 0.0119 0.0791 0.2077 CapExt 51,866 0.1534 0.2370 0.0349 0.0856 0.1760 ADVt 51,866 0.0417 0.1511 0.0000 0.0005 0.0178 MVt 51,866 -2.1750 2.3560 -3.8541 -2.3636 -0.6504 Leveraget 51,866 0.2379 0.3570 0.0090 0.1121 0.3297 Earningst 51,866 -0.0668 0.4026 -0.2236 0.0456 0.1598 Salest 51,866 3.3483 4.6971 1.0626 2.1268 3.7668 Cash Flowst 51,866 0.0083 0.6619 -0.1052 0.1087 0.2647 SD(Et+1,t+5) 51,866 0.1734 0.1227 0.0823 0.1440 0.2473 SD(St+1,t+5) 51,866 0.9322 0.9791 0.3219 0.6474 1.2555 SD(CFt+1,t+5) 51,866 0.1873 0.1299 0.0979 0.1554 0.2450
Correlations
Table 2 provides the univariate correlations among the regression variables. While correlations for variables scaled by PRC are reported above the diagonal, correlations for variables scaled by BKV are reported below the diagonal. Both R&D and capital expenditures are positively correlated with different measures of variability of future benefits. The correlations between capital expenditures and different measures of variability of future benefits are all larger than those of between R&D expenditures and variability of future benefits when the deflator is PRC. But when BKV is the deflator, only correlations between capital expenditures and variability between future sales revenue is larger than R&D expenditures and variability of future sales revenue. Nevertheless, we cannot interpret these correlations as marginal impacts on variability of future benefits.
154 Journal of Accounting and Finance vol. 12(3) 2012
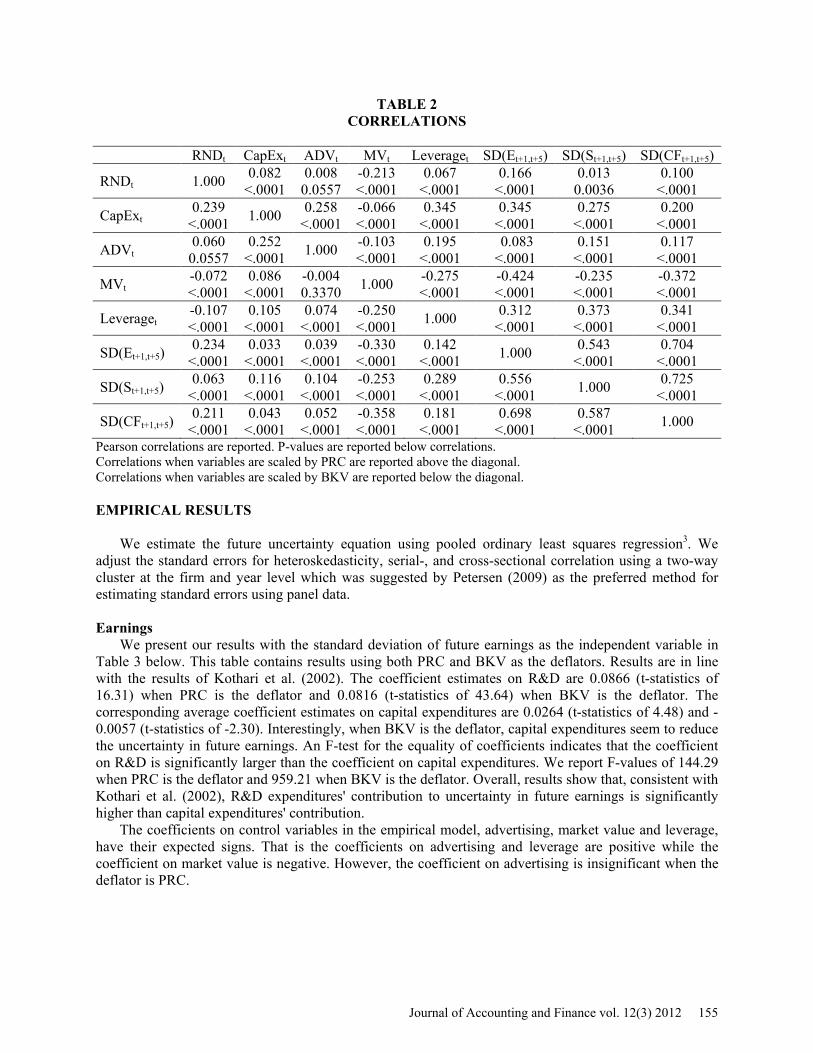
TABLE 2 CORRELATIONS
RNDt CapExt ADVt MVt Leveraget SD(Et+1,t+5) SD(St+1,t+5) SD(CFt+1,t+5)
RNDt 1.000 0.082 <.0001
0.008 0.0557
-0.213 <.0001
0.067 <.0001
0.166 <.0001
0.013 0.0036
0.100 <.0001
CapExt 0.239
<.0001 1.000 0.258 <.0001
-0.066 <.0001
0.345 <.0001
0.345 <.0001
0.275 <.0001
0.200 <.0001
ADVt 0.060
0.0557 0.252
<.0001 1.000 -0.103 <.0001
0.195 <.0001
0.083 <.0001
0.151 <.0001
0.117 <.0001
MVt -0.072 <.0001
0.086 <.0001
-0.004 0.3370 1.000 -0.275
<.0001 -0.424 <.0001
-0.235 <.0001
-0.372 <.0001
Leveraget -0.107 <.0001
0.105 <.0001
0.074 <.0001
-0.250 <.0001 1.000 0.312
<.0001 0.373
<.0001 0.341
<.0001
SD(Et+1,t+5) 0.234
<.0001 0.033
<.0001 0.039
<.0001 -0.330 <.0001
0.142 <.0001 1.000 0.543
<.0001 0.704
<.0001
SD(St+1,t+5) 0.063
<.0001 0.116
<.0001 0.104
<.0001 -0.253 <.0001
0.289 <.0001
0.556 <.0001 1.000 0.725
<.0001
SD(CFt+1,t+5) 0.211
<.0001 0.043
<.0001 0.052
<.0001 -0.358 <.0001
0.181 <.0001
0.698 <.0001
0.587 <.0001 1.000
Pearson correlations are reported. P-values are reported below correlations. Correlations when variables are scaled by PRC are reported above the diagonal. Correlations when variables are scaled by BKV are reported below the diagonal. EMPIRICAL RESULTS
We estimate the future uncertainty equation using pooled ordinary least squares regression3. We adjust the standard errors for heteroskedasticity, serial-, and cross-sectional correlation using a two-way cluster at the firm and year level which was suggested by Petersen (2009) as the preferred method for estimating standard errors using panel data. Earnings
We present our results with the standard deviation of future earnings as the independent variable in Table 3 below. This table contains results using both PRC and BKV as the deflators. Results are in line with the results of Kothari et al. (2002). The coefficient estimates on R&D are 0.0866 (t-statistics of 16.31) when PRC is the deflator and 0.0816 (t-statistics of 43.64) when BKV is the deflator. The corresponding average coefficient estimates on capital expenditures are 0.0264 (t-statistics of 4.48) and -0.0057 (t-statistics of -2.30). Interestingly, when BKV is the deflator, capital expenditures seem to reduce the uncertainty in future earnings. An F-test for the equality of coefficients indicates that the coefficient on R&D is significantly larger than the coefficient on capital expenditures. We report F-values of 144.29 when PRC is the deflator and 959.21 when BKV is the deflator. Overall, results show that, consistent with Kothari et al. (2002), R&D expenditures' contribution to uncertainty in future earnings is significantly higher than capital expenditures' contribution.
The coefficients on control variables in the empirical model, advertising, market value and leverage, have their expected signs. That is the coefficients on advertising and leverage are positive while the coefficient on market value is negative. However, the coefficient on advertising is insignificant when the deflator is PRC.
Journal of Accounting and Finance vol. 12(3) 2012 155

TABLE 3 R&D AND FUTURE EARNINGS VARIABILITY
Scaled by PRC Scaled by BKV
Variable Coefficient
Estimate t-stat p-value Coefficient
Estimate t-stat p-value Intercept 0.0714 104.50 <.0001 0.1181 157.29
<.0001 RNDt 0.0866 16.31 <.0001 0.0816 43.64
<.0001 CapExt 0.0264 4.48 <.0001 -0.0057 -2.30 0.0217 ADVt 0.0015 0.23 0.8142 0.0165 4.15
<.0001 MVt -0.0183 -90.98 <.0001 -0.0151 -
71.45
<.0001 Leveraget 0.0568 31.46 <.0001 0.0320 23.35
<.0001 R-Squred (%) 22.75 16.22
F-Value 144.29 <.0001 959.21 <.0001 SD(Et+1,t+5) is the dependent variable. t-statistics are calculated after adjusting the standard errors for heteroskedasticity, serial-, and cross-sectional correlation using a two-way cluster at the firm and year level. F-Value is to test the equality of coefficients on RND and CapEx.
Sales Revenue
We present our results with the standard deviation of future sales revenue as the independent variable in Table 4. Similar to Table 3, we present the estimation results using beginning both PRC and BKV as the deflators. The coefficient estimates, when PRC is the deflator, on R&D and capital expenditures are -0.7519 (t-statistics of -10.79) and 2.2195 (t-statistics of 21.61), respectively. When BKV is the deflator, the coefficient estimates on R&D and capital expenditures are 0.1457 (t-statistics of 9.68) and 0.3481 (t-statistics of 14.81), respectively. We report F-values of 274.49 when PRC is the deflator and 184.04 when BKV is the deflator to test the equality of coefficients. This indicates that the coefficient on R&D is significantly smaller than the coefficient on capital expenditures. In contrast to the results for earnings, our results for sales revenue provide evidence contrary to the notion that R&D expenditures generate more uncertain future benefits than investments in capital assets.
Prior research provide evidence that demand uncertainty depresses firm investment (Bo, 2002; Fuss and Vermeulen, 2004) and this adverse effect of demand uncertainty on R&D investments is more salient than that of on non-R&D related investments (Goel and Ram, 2001). The evidence that R&D budgets are often determined as a percentage of firm sales revenue (Scherer, 2001; Tubbs, 2007) indicates that firms determine the level of R&D spending based on availability of resources. Therefore, our result that R&D generates less uncertain future sales revenue is consistent with our firms investing in R&D projects that would lead to less volatile sales revenue.
The coefficients on control variables in the empirical model, advertising, market value and leverage, have their expected signs. That is the coefficient estimates on advertising and leverage are positive while the coefficient on market value is negative. And all of the coefficient estimates are statistically significant.
156 Journal of Accounting and Finance vol. 12(3) 2012
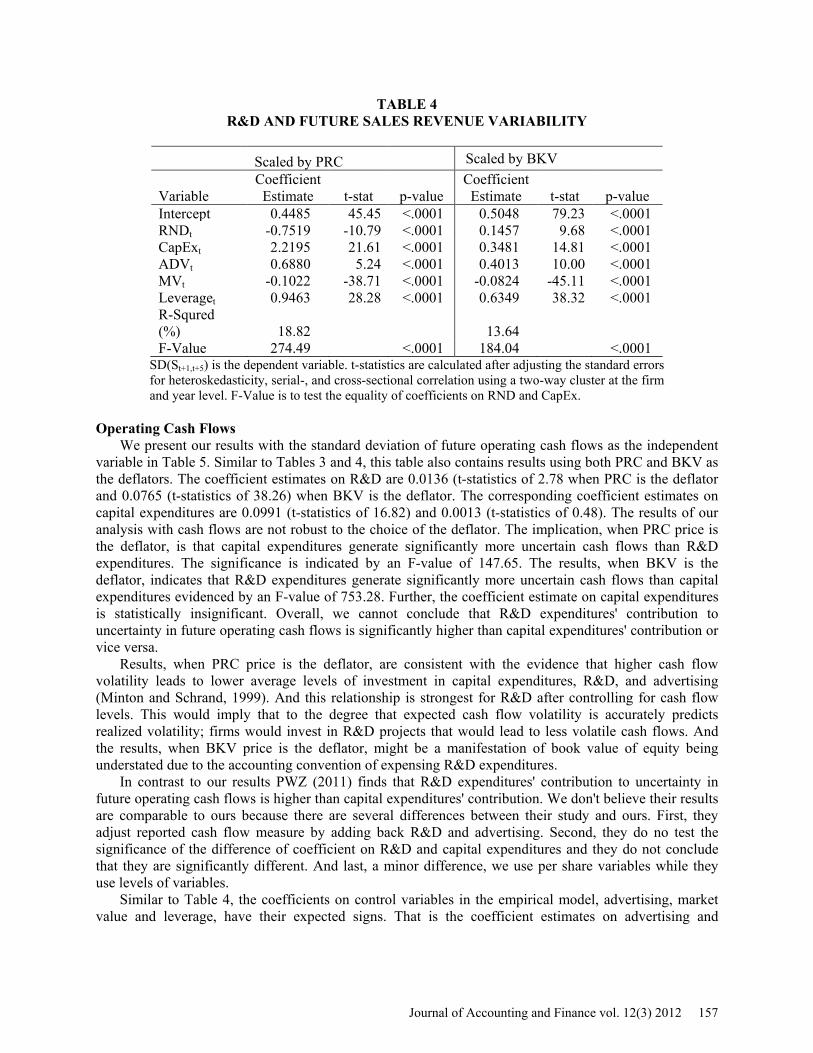
TABLE 4 R&D AND FUTURE SALES REVENUE VARIABILITY
Scaled by PRC Scaled by BKV
Variable Coefficient
Estimate t-stat p-value Coefficient
Estimate t-stat p-value Intercept 0.4485 45.45 <.0001 0.5048 79.23 <.0001 RNDt -0.7519 -10.79 <.0001 0.1457 9.68 <.0001 CapExt 2.2195 21.61 <.0001 0.3481 14.81 <.0001 ADVt 0.6880 5.24 <.0001 0.4013 10.00 <.0001 MVt -0.1022 -38.71 <.0001 -0.0824 -45.11 <.0001 Leveraget 0.9463 28.28 <.0001 0.6349 38.32 <.0001 R-Squred (%) 18.82 13.64 F-Value 274.49 <.0001 184.04 <.0001
SD(St+1,t+5) is the dependent variable. t-statistics are calculated after adjusting the standard errors for heteroskedasticity, serial-, and cross-sectional correlation using a two-way cluster at the firm and year level. F-Value is to test the equality of coefficients on RND and CapEx.
Operating Cash Flows
We present our results with the standard deviation of future operating cash flows as the independent variable in Table 5. Similar to Tables 3 and 4, this table also contains results using both PRC and BKV as the deflators. The coefficient estimates on R&D are 0.0136 (t-statistics of 2.78 when PRC is the deflator and 0.0765 (t-statistics of 38.26) when BKV is the deflator. The corresponding coefficient estimates on capital expenditures are 0.0991 (t-statistics of 16.82) and 0.0013 (t-statistics of 0.48). The results of our analysis with cash flows are not robust to the choice of the deflator. The implication, when PRC price is the deflator, is that capital expenditures generate significantly more uncertain cash flows than R&D expenditures. The significance is indicated by an F-value of 147.65. The results, when BKV is the deflator, indicates that R&D expenditures generate significantly more uncertain cash flows than capital expenditures evidenced by an F-value of 753.28. Further, the coefficient estimate on capital expenditures is statistically insignificant. Overall, we cannot conclude that R&D expenditures' contribution to uncertainty in future operating cash flows is significantly higher than capital expenditures' contribution or vice versa.
Results, when PRC price is the deflator, are consistent with the evidence that higher cash flow volatility leads to lower average levels of investment in capital expenditures, R&D, and advertising (Minton and Schrand, 1999). And this relationship is strongest for R&D after controlling for cash flow levels. This would imply that to the degree that expected cash flow volatility is accurately predicts realized volatility; firms would invest in R&D projects that would lead to less volatile cash flows. And the results, when BKV price is the deflator, might be a manifestation of book value of equity being understated due to the accounting convention of expensing R&D expenditures.
In contrast to our results PWZ (2011) finds that R&D expenditures' contribution to uncertainty in future operating cash flows is higher than capital expenditures' contribution. We don't believe their results are comparable to ours because there are several differences between their study and ours. First, they adjust reported cash flow measure by adding back R&D and advertising. Second, they do no test the significance of the difference of coefficient on R&D and capital expenditures and they do not conclude that they are significantly different. And last, a minor difference, we use per share variables while they use levels of variables.
Similar to Table 4, the coefficients on control variables in the empirical model, advertising, market value and leverage, have their expected signs. That is the coefficient estimates on advertising and
Journal of Accounting and Finance vol. 12(3) 2012 157
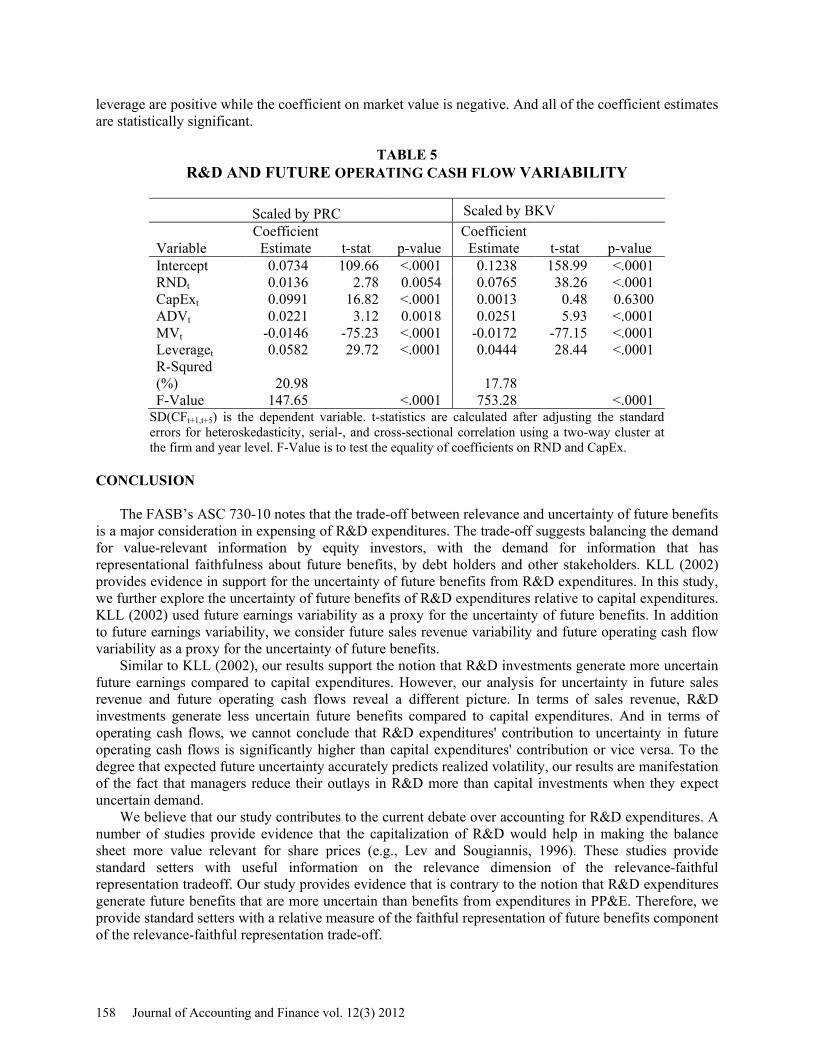
leverage are positive while the coefficient on market value is negative. And all of the coefficient estimates are statistically significant.
TABLE 5 R&D AND FUTURE OPERATING CASH FLOW VARIABILITY
Scaled by PRC Scaled by BKV
Variable Coefficient
Estimate t-stat p-value Coefficient
Estimate t-stat p-value Intercept 0.0734 109.66 <.0001 0.1238 158.99 <.0001 RNDt 0.0136 2.78 0.0054 0.0765 38.26 <.0001 CapExt 0.0991 16.82 <.0001 0.0013 0.48 0.6300 ADVt 0.0221 3.12 0.0018 0.0251 5.93 <.0001 MVt -0.0146 -75.23 <.0001 -0.0172 -77.15 <.0001 Leveraget 0.0582 29.72 <.0001 0.0444 28.44 <.0001 R-Squred (%) 20.98 17.78 F-Value 147.65 <.0001 753.28 <.0001
SD(CFt+1,t+5) is the dependent variable. t-statistics are calculated after adjusting the standard errors for heteroskedasticity, serial-, and cross-sectional correlation using a two-way cluster at the firm and year level. F-Value is to test the equality of coefficients on RND and CapEx.
CONCLUSION
The FASB’s ASC 730-10 notes that the trade-off between relevance and uncertainty of future benefits is a major consideration in expensing of R&D expenditures. The trade-off suggests balancing the demand for value-relevant information by equity investors, with the demand for information that has representational faithfulness about future benefits, by debt holders and other stakeholders. KLL (2002) provides evidence in support for the uncertainty of future benefits from R&D expenditures. In this study, we further explore the uncertainty of future benefits of R&D expenditures relative to capital expenditures. KLL (2002) used future earnings variability as a proxy for the uncertainty of future benefits. In addition to future earnings variability, we consider future sales revenue variability and future operating cash flow variability as a proxy for the uncertainty of future benefits.
Similar to KLL (2002), our results support the notion that R&D investments generate more uncertain future earnings compared to capital expenditures. However, our analysis for uncertainty in future sales revenue and future operating cash flows reveal a different picture. In terms of sales revenue, R&D investments generate less uncertain future benefits compared to capital expenditures. And in terms of operating cash flows, we cannot conclude that R&D expenditures' contribution to uncertainty in future operating cash flows is significantly higher than capital expenditures' contribution or vice versa. To the degree that expected future uncertainty accurately predicts realized volatility, our results are manifestation of the fact that managers reduce their outlays in R&D more than capital investments when they expect uncertain demand.
We believe that our study contributes to the current debate over accounting for R&D expenditures. A number of studies provide evidence that the capitalization of R&D would help in making the balance sheet more value relevant for share prices (e.g., Lev and Sougiannis, 1996). These studies provide standard setters with useful information on the relevance dimension of the relevance-faithful representation tradeoff. Our study provides evidence that is contrary to the notion that R&D expenditures generate future benefits that are more uncertain than benefits from expenditures in PP&E. Therefore, we provide standard setters with a relative measure of the faithful representation of future benefits component of the relevance-faithful representation trade-off.
158 Journal of Accounting and Finance vol. 12(3) 2012

ENDNOTES 1 We repeat our analysis with sales and earnings over the period included in Kothari et al. (2002). The results, not tabulated in the paper, are comparatively similar. 2 The decile portfolio average earnings variability is calculated using data for surviving firms only. 3 Similar to KLL (2002), we also estimate future uncertainty equation for each year from 1987 to 2005 and calculate the summary statistics from these thirty-four regressions. The results, not tabulated in the paper, are comparatively similar. REFERENCES Aboody, D., & Lev, B. (1998). The Value Relevance of Intangibles: The Case of Software Capitalization. Journal of Accounting Research, 36, 161–191. Aboody, D., & Lev, B. (2000). Information Asymmetry, R&D, and Insider Gains. The Journal of Finance, 55, 2747-2766. Altman, E.I. (1968). Financial ratios, discriminant analysis, and the prediction of corporate bankruptcy. Journal of Finance, 23, 589-609. Amir, E., Guan, Y., & Livne, G. (2007). The Association of R&D and Capital Expenditures with Subsequent Earnings Variability. Journal of Business Finance & Accounting, 34, 222-246. Association for Investment Management and Research. (1993). Financial Reporting in the 1990s and Beyond. Barnard, C. I. (1936). The Functions of the Executive. Cambridge, MA: Harvard University Press. Bo, H. (2002). Idiosyncratic Uncertainty and Firm Investment. Australian Economic Papers, 41, 1-14. Chambers, D., Jennings, R. & Thompson II, R.B. (2002). Excess Returns to R&D-Intensive Firms. Review of Accounting Studies, 7, 133-158. Chan, L.K.C., Lakonishok, J.& Sougiannis, T. (2001). The Stock Market Valuation of Research and Development Expenditures. The Journal of Finance, 56, 2431-2456. Chandra, U. & Ro, B. T. (2008). The Role of Revenue in FirmValuation. Accounting Horizons, 22, 199-222. Cyert, R. M. & March, J. (1963). A Behavioral Theory of the Firm. Englewood Cliffs, N.J.: Prentice-Hall. Deng, Z., & Lev, B. (2006). In-Process R&D: To Capitalize or Expense? Journal of Engineering and Technology Management, 23, 18–32. Eberhart, A.C., Maxwell, W.F. & Siddique, A.R. (2004). An Examination of Long-term Abnormal Stock Returns and Operating Performance Following R&D Increases. Journal of Finance, 54, 623-650. Fama, E., & French, K. (1992). The cross-section of expected returns. Journal of Finance 47: 427-465. Financial Accounting Standards Board. Accounting Standards Codification 730-10-25. Stamford, Conn.: FASB.
Journal of Accounting and Finance vol. 12(3) 2012 159
Financial Accounting Standards Board. Accounting Standards Codification 730-10-5. Stamford, Conn.: FASB. Financial Accounting Standards Board. 2010. Statement of Financial Accounting Standards 8. Stamford, Conn.: FASB. Fuss, C. & Vermeulen, P. (2004). Firms’ investment decisions in response to demand and price uncertainty. European Central Bank Working Paper, No. 347. Goel, R. K. & Ram, R. (2001). Irreversibility of R&D investment and the adverse effect of uncertainty: Evidence from the OECD countries. Economics Letters, 71, 287–291. Guo, R.-J., Lev, B. & Zhou, N. (2004). Competitive Costs of Disclosure by Biotech IPOs. Journal of Accounting Research, 42, 319–355. Hirschey, M. (1982). Intangible Capital Aspects of Advertising and R&D Expenditures. The Journal of Industrial Economics, 30, 375-390. Jegadeesh, N. & Livnat J. (2006). Revenue surprises and stock returns. Journal of Accounting and Economics, 41, 147–171. Kothari, S.P., Laguerre, T.E. & Leone, A.J. (2002). Capitalization versus Expensing: Evidence on the Uncertainty of Future Earnings from Capital Expenditures versus R&D Outlays. Review of Accounting Studies, 7, 355-382. Lev, B., Nissim, D. & Thomas, J. (2007). On the Informational Usefulness of R&D Capitalization and Amortization. In Zambon, S. & Marzo, G. (Eds.), Visualising Intangibles: Measuring and Reporting in the Knowledge Economy, 97-128. Surrey, England: Ashgate. Lev, B., & Sougiannis, T. (1996). The capitalization, amortization, and value-relevance of R&D. Journal of Accounting and Economics, 21, 107-138. Minton, B. A., & Schrand, C. (1999). The impact of cash flow volatility on discretionary investment and the costs of debt and equity financing. Journal of Financial Economics, 54, 423-460. Pandit, S., Wasley, C. E. & Zach, T. (2011). The Effect of R&D Inputs and Outputs on the Relation between the Uncertainty of Future Operating Performance and R&D Expenditures. Journal of Accounting, Auditing & Finance, 26, 121-144. Petersen M. (2009). Estimating Standard Errors in Finance Panel Data Sets: Comparing Approaches. Review of Financial Studies, 22, 435-80. Shi, C. (2003). On the trade-off between the future benefits and riskiness of R&D: a bondholders’ perspective. Journal of Accounting and Economics, 35, 227-254. Simon, H.A. (1947). Administrative Behavior. New York, NY: Macmillan. Sougiannis, T. (1994). The accounting based valuation of corporate R&D. The Accounting Review, 69, 44-68.
160 Journal of Accounting and Finance vol. 12(3) 2012
Stubben, S. R. (2010). Discretionary Revenues as a Measure of Earnings Management. The Accounting Review, 85, 695-717. Sunder, S. (2008). Extensive Income and Value of the Firm: Who Gets What? Yale ICF Working Paper No. 02-15. Tubbs, M. (2007). The relationship between R&D and company performance. Research Technology Management, 50, 23-30.
Journal of Accounting and Finance vol. 12(3) 2012 161