Embed Size (px)
Citation preview

23rd Annual Investment Conference amp Luncheon
William Larkin Jr Portfolio Manager
Cabot Money Management Inc
216 Essex Street Salem Massachusetts 01970
800-888-6468 eCabotcom
Trouble with the Bubble
Bond Bubble
Part I
Analyzing Our Current Situation
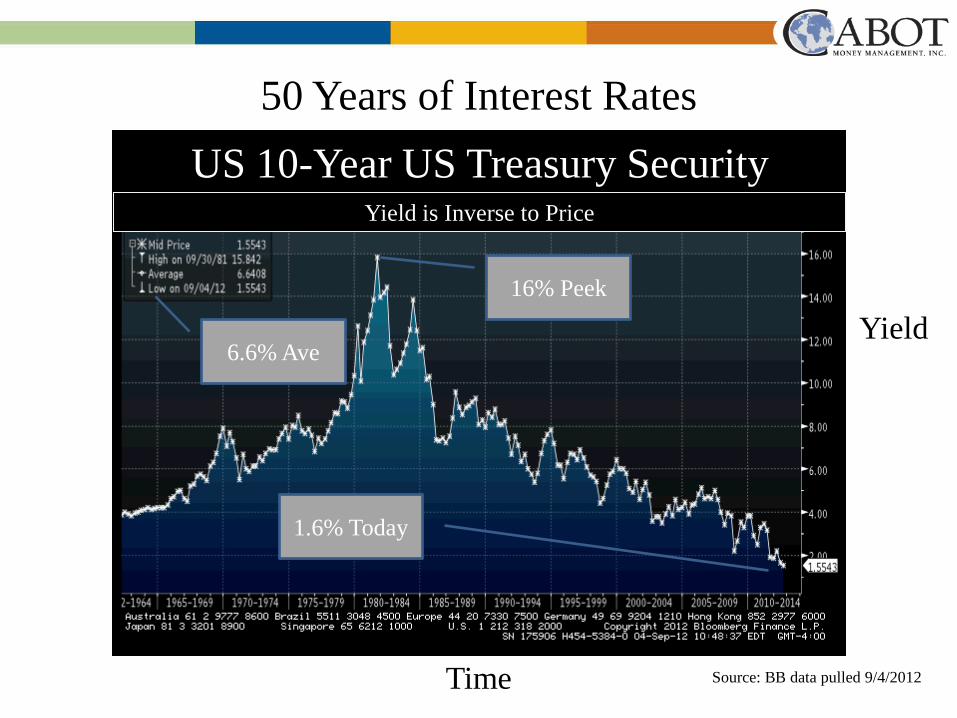
US 10-Year US Treasury Security
Yield
Time
Yield is Inverse to Price
16 Peek
16 Today
Source BB data pulled 942012
50 Years of Interest Rates
66 Ave
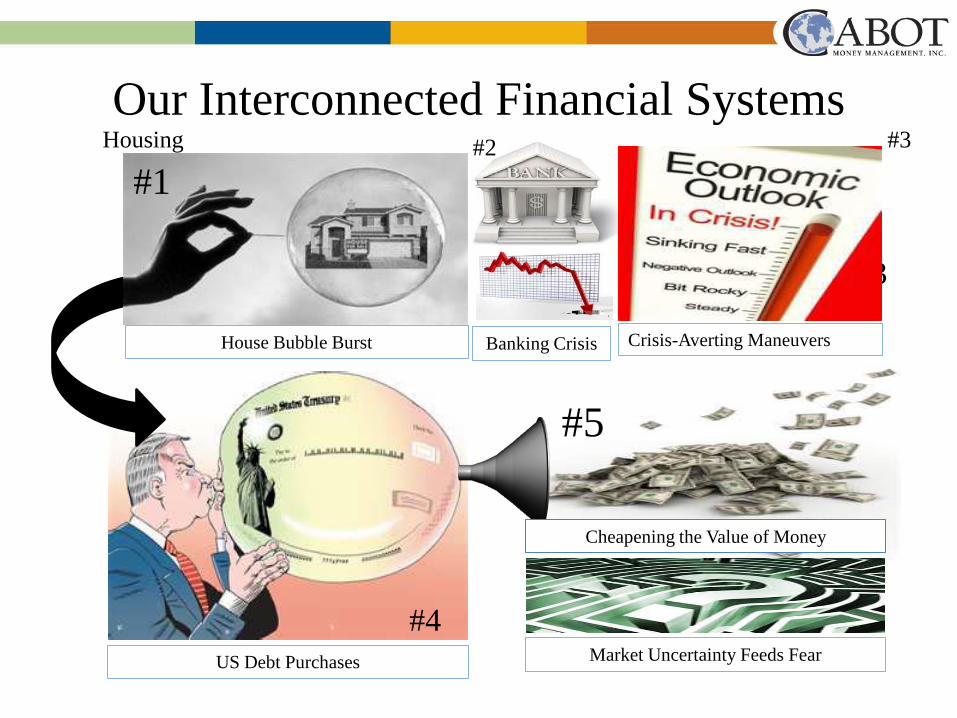
Our Interconnected Financial Systems
Debt Bubble
Housing
3
Market Uncertainty Feeds Fear
House Bubble Burst Crisis-Averting Maneuvers Banking Crisis
US Debt Purchases
1 2
4
5
Cheapening the Value of Money
3
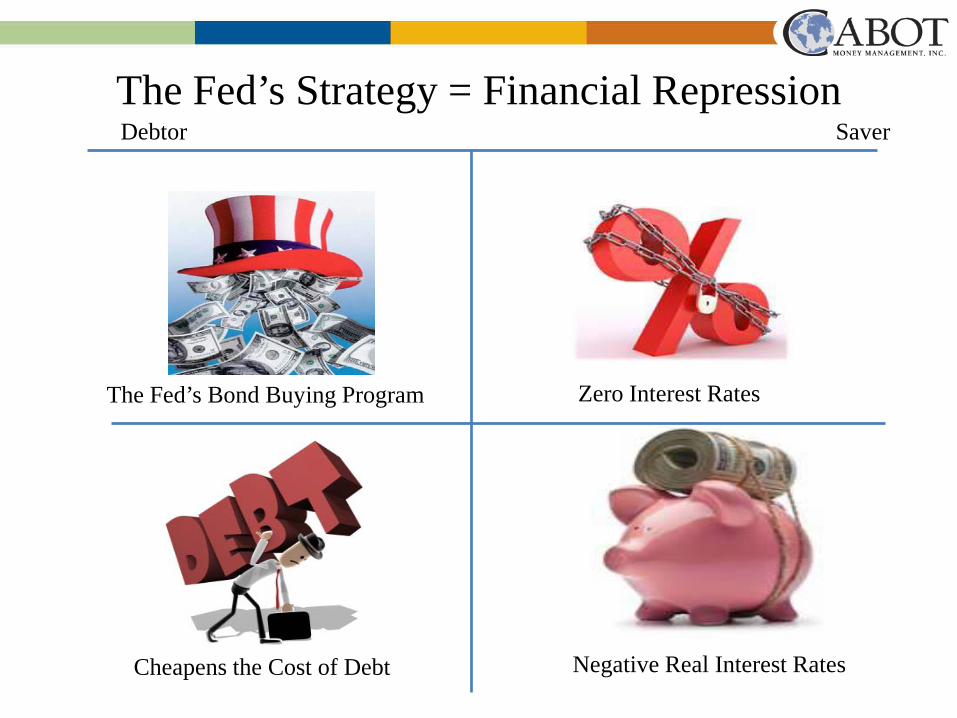
The Fedrsquos Strategy = Financial Repression
The Fedrsquos Bond Buying Program
Cheapens the Cost of Debt Negative Real Interest Rates
Zero Interest Rates
Debtor Saver
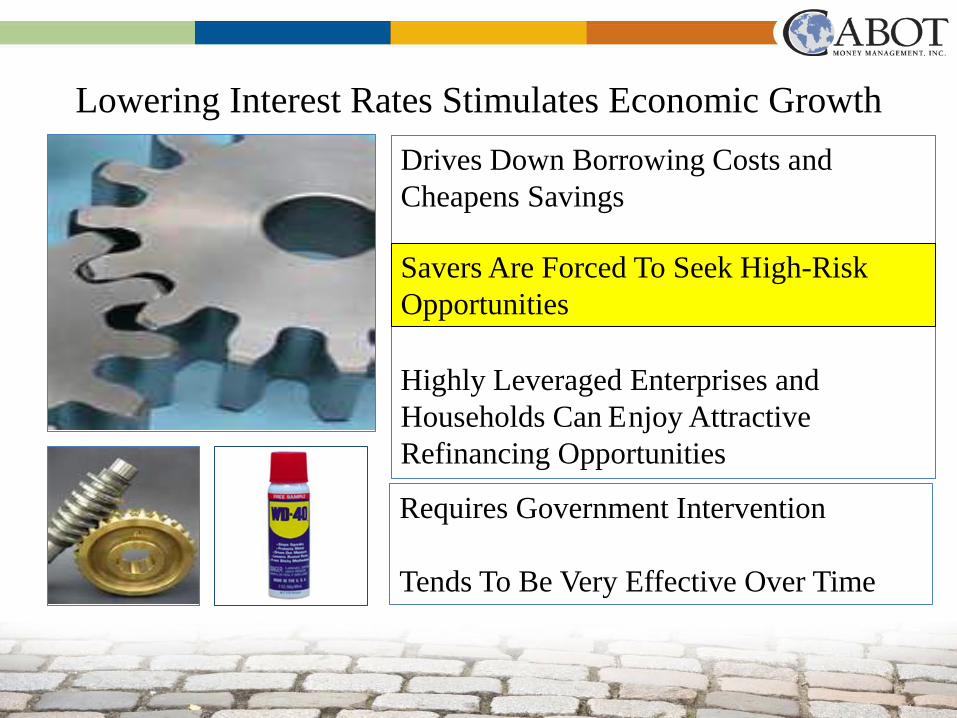
Lowering Interest Rates Stimulates Economic Growth Drives Down Borrowing Costs and Cheapens Savings Highly Leveraged Enterprises and Households Can Enjoy Attractive Refinancing Opportunities
Requires Government Intervention Tends To Be Very Effective Over Time
Savers Are Forced To Seek High-Risk Opportunities
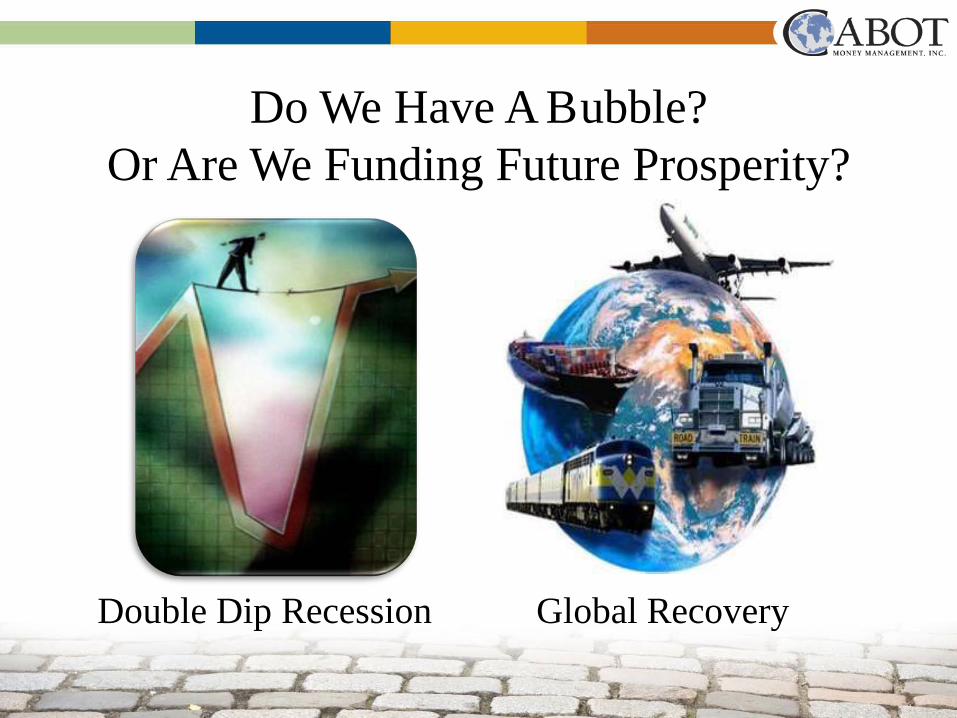
Do We Have A Bubble Or Are We Funding Future Prosperity
Double Dip Recession Global Recovery
Part II ndash Explaining the Low Rate Environment
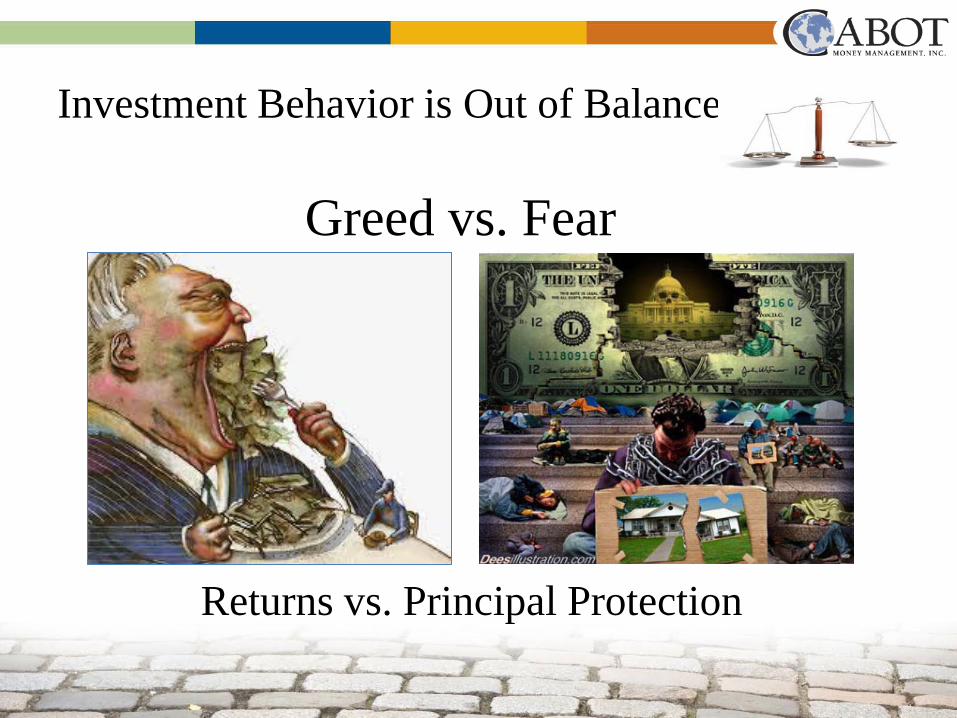
Investment Behavior is Out of Balance
Greed vs Fear
Returns vs Principal Protection
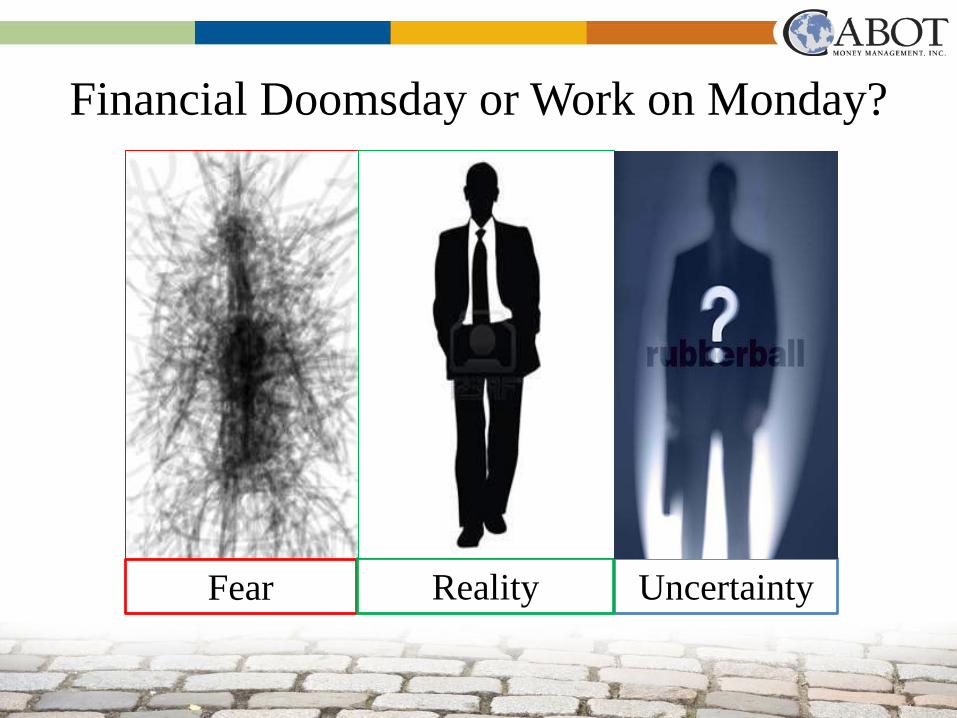
Financial Doomsday or Work on Monday
Fear Uncertainty Reality
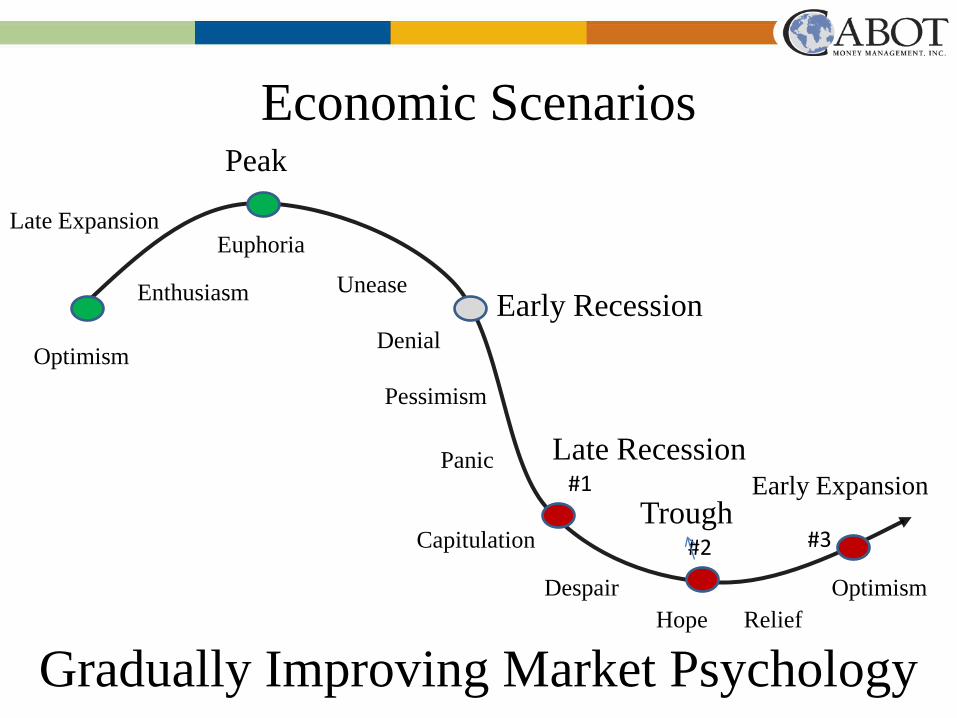
Peak
Trough
Early Recession
Late Recession Early Expansion 1
2 3
Gradually Improving Market Psychology
Late Expansion
Optimism
Enthusiasm
Euphoria
Unease
Denial
Pessimism
Panic
Capitulation
Despair Hope Relief
Optimism
Economic Scenarios
Part III - Analyze The Current Situation
Source httppoliticalcalculationsblogspotcom201111180-years-of-us-national-debt-burdenhtml
Unfortunately Wersquore Been Here Before
War on Terror Iraq War Afghan War
Bank Bailouts Extending US Unemployment Benefits
US Auto Rescue QE1
QE2
Payroll Tax Break
QE3
Tax Policies
Fiscal Cliff
Medicare Medicaid Social Security
Healthcare
US Debt Downgrade Structural Budget Deficit
Displaced Unemployed Interest Costs
Energy Policy
Bush Tax Cuts
American Recovery and Reinvestment Act
Foreign Policy
The US is Entering a Period Which Requires Rapid Changes
TARP
A Unique Macro Environment Banking Capital Markets
LaborWork Design Technology
Multi-National Companies
Supply Chain
Interest Rates
Transportation
Energy
Powerful Global Deflators
Energy
Resources Labor
Food Materials
Fertilizer
Capital Outsourcing Debt
Derivatives
Insurance
Made In China
No Environmental Rules Competitiveness
Innovation Product Development Efficiencies Quality Improvements
Global Integration Trade Supply Networks Legal and Regulatory Systems
Protectionism Requires Investments
Ignoring Extreme Valuations
Housing
US Treasury Securities
2-Yr UST Bond Highest 93081 = 167 Average = 61 Low 123011 = 024
Lipper Taxable US Bond Inflows
Source httpalphanowthomsonreuterscom201204the-contrarian-signal-money-flows-favor-stocks-over-bonds
Flows remain strong even with record low yields
The Mechanics of Bond Pricing Indicates Problems
Inflation Risks
Default Risk
Liquidity Risk
Reinvestment Risk
Duration Risk
Market Risk
Pricing that Ensures the Price of a Bond Adequately Compensates an Investor For the Level Of Risks Associated with a Particular Investment
Infl Expectations + Default Risks + Return = PriceYield 20 + 0 + 15 = 35
I Can Just Hold My Bonds Until Maturity Right Wrong
Current Price = $9971 Yielding = 0275
Current Price = $9884 Yielding = 175
Current Price = $9788 Yielding = 286
+1 Change in Interest Rates Price = $9781 Loss = -19 842009 +2 Change in Interest Rates Price = $9595 Loss = -38 952008 +3 Change in Interest Rates Price = $9413 Loss = -56 12262007
+1 Change in Interest Rates Price = $9024 Loss = -87 782011 +2 Change in Interest Rates Price = $8245 Loss = -166 242011 +3 Change in Interest Rates Price = $7539 Loss = -237 8152007
1 Change in Interest Rates Price = $8054 Loss = -177 822011 2 Change in Interest Rates Price = $6699 Loss = -316 452010 3 Change in Interest Rates Price = $5642 Loss = -424 3142002
2-Year UST
10-Year UST
30-Year UST
Source BB Valuation YAS basic Price change ao 8222012
ST
Int Term
LT
Is There A Bond Bubble
The debt burden grows out of control and fiscal solutions fail to develop
The market comes to the conclusion that the debt has become unsustainable and demands a much higher return to offset growing risks
Bond yields rise causing harm to current holders that do not properly understand their potential loses
Debt Burden
Debt Crisis
Bursting Bubble
Part IV Investment Solutions
Active Management Passive Indexing
Price Insensitive Opportunistic
Vast Diversification Is Required
66
48 575
38
23
18
1
1
0 40
25
Money Market
US Treasury Bonds
US Govrsquot Agencies
Municipal Bonds
Mortgage-Backed Securities
High-Grade Corporate Bonds
Low-Grade Corporate Bonds
Fixed-Rate Preferred Securities
Sovereign Debt
Emerging Markets Debt
Bank Loans
High-Yield Bonds Convertible Bonds
Foreign Infl Adj Securities
25
High-Yield Municipal Bonds
575
Zero Coupon Bonds
28
Floating Rate Notes
10 Certificates of Deposit
07
Australia Debt
36 Canadian Debt
27
LT Corporate Bonds
425 LT Govrsquot Securities
28
35 42
Intrsquol High Yield
68
Risk Management Requires Liquidity
Many Segments of the Bond Market Are Truly Untested for Major
Redemptions
A Bond Market Vulnerability
The Biggest Risk Is Taking No Risk
Credit Risk
Broaden Exposure
Duration Risk
3 Strategy Options
Default Risk
Global Opportunities Extend Maturities
Buy and Hold Doesnrsquot Work in This Environment
Index Funds have too much exposure to US Treasury Securities
Part V ndash Key Takeaways
Bond Strategies Require a Much More Diversified Approach
Uncertainty Requires Periodic Adjustments as Conditions Change
Liquidity Should be a Primary Risk-Management Practice
The Fed Has Removed Risk-Free Investment Options
Recoveries Can Occur Unexpectedly
Questions
23rd Annual Investment Conference amp Luncheon
William Larkin Jr Portfolio Manager
Cabot Money Management Inc
216 Essex Street Salem Massachusetts 01970
800-888-6468 eCabotcom
Trouble with the Bubble
Bond Bubble
Part I
Analyzing Our Current Situation
US 10-Year US Treasury Security
Yield
Time
Yield is Inverse to Price
16 Peek
16 Today
Source BB data pulled 942012
50 Years of Interest Rates
66 Ave
Our Interconnected Financial Systems
Debt Bubble
Housing
3
Market Uncertainty Feeds Fear
House Bubble Burst Crisis-Averting Maneuvers Banking Crisis
US Debt Purchases
1 2
4
5
Cheapening the Value of Money
3
The Fedrsquos Strategy = Financial Repression
The Fedrsquos Bond Buying Program
Cheapens the Cost of Debt Negative Real Interest Rates
Zero Interest Rates
Debtor Saver
Lowering Interest Rates Stimulates Economic Growth Drives Down Borrowing Costs and Cheapens Savings Highly Leveraged Enterprises and Households Can Enjoy Attractive Refinancing Opportunities
Requires Government Intervention Tends To Be Very Effective Over Time
Savers Are Forced To Seek High-Risk Opportunities
Do We Have A Bubble Or Are We Funding Future Prosperity
Double Dip Recession Global Recovery
Part II ndash Explaining the Low Rate Environment
Investment Behavior is Out of Balance
Greed vs Fear
Returns vs Principal Protection
Financial Doomsday or Work on Monday
Fear Uncertainty Reality
Peak
Trough
Early Recession
Late Recession Early Expansion 1
2 3
Gradually Improving Market Psychology
Late Expansion
Optimism
Enthusiasm
Euphoria
Unease
Denial
Pessimism
Panic
Capitulation
Despair Hope Relief
Optimism
Economic Scenarios
Part III - Analyze The Current Situation
Source httppoliticalcalculationsblogspotcom201111180-years-of-us-national-debt-burdenhtml
Unfortunately Wersquore Been Here Before
War on Terror Iraq War Afghan War
Bank Bailouts Extending US Unemployment Benefits
US Auto Rescue QE1
QE2
Payroll Tax Break
QE3
Tax Policies
Fiscal Cliff
Medicare Medicaid Social Security
Healthcare
US Debt Downgrade Structural Budget Deficit
Displaced Unemployed Interest Costs
Energy Policy
Bush Tax Cuts
American Recovery and Reinvestment Act
Foreign Policy
The US is Entering a Period Which Requires Rapid Changes
TARP
A Unique Macro Environment Banking Capital Markets
LaborWork Design Technology
Multi-National Companies
Supply Chain
Interest Rates
Transportation
Energy
Powerful Global Deflators
Energy
Resources Labor
Food Materials
Fertilizer
Capital Outsourcing Debt
Derivatives
Insurance
Made In China
No Environmental Rules Competitiveness
Innovation Product Development Efficiencies Quality Improvements
Global Integration Trade Supply Networks Legal and Regulatory Systems
Protectionism Requires Investments
Ignoring Extreme Valuations
Housing
US Treasury Securities
2-Yr UST Bond Highest 93081 = 167 Average = 61 Low 123011 = 024
Lipper Taxable US Bond Inflows
Source httpalphanowthomsonreuterscom201204the-contrarian-signal-money-flows-favor-stocks-over-bonds
Flows remain strong even with record low yields
The Mechanics of Bond Pricing Indicates Problems
Inflation Risks
Default Risk
Liquidity Risk
Reinvestment Risk
Duration Risk
Market Risk
Pricing that Ensures the Price of a Bond Adequately Compensates an Investor For the Level Of Risks Associated with a Particular Investment
Infl Expectations + Default Risks + Return = PriceYield 20 + 0 + 15 = 35
I Can Just Hold My Bonds Until Maturity Right Wrong
Current Price = $9971 Yielding = 0275
Current Price = $9884 Yielding = 175
Current Price = $9788 Yielding = 286
+1 Change in Interest Rates Price = $9781 Loss = -19 842009 +2 Change in Interest Rates Price = $9595 Loss = -38 952008 +3 Change in Interest Rates Price = $9413 Loss = -56 12262007
+1 Change in Interest Rates Price = $9024 Loss = -87 782011 +2 Change in Interest Rates Price = $8245 Loss = -166 242011 +3 Change in Interest Rates Price = $7539 Loss = -237 8152007
1 Change in Interest Rates Price = $8054 Loss = -177 822011 2 Change in Interest Rates Price = $6699 Loss = -316 452010 3 Change in Interest Rates Price = $5642 Loss = -424 3142002
2-Year UST
10-Year UST
30-Year UST
Source BB Valuation YAS basic Price change ao 8222012
ST
Int Term
LT
Is There A Bond Bubble
The debt burden grows out of control and fiscal solutions fail to develop
The market comes to the conclusion that the debt has become unsustainable and demands a much higher return to offset growing risks
Bond yields rise causing harm to current holders that do not properly understand their potential loses
Debt Burden
Debt Crisis
Bursting Bubble
Part IV Investment Solutions
Active Management Passive Indexing
Price Insensitive Opportunistic
Vast Diversification Is Required
66
48 575
38
23
18
1
1
0 40
25
Money Market
US Treasury Bonds
US Govrsquot Agencies
Municipal Bonds
Mortgage-Backed Securities
High-Grade Corporate Bonds
Low-Grade Corporate Bonds
Fixed-Rate Preferred Securities
Sovereign Debt
Emerging Markets Debt
Bank Loans
High-Yield Bonds Convertible Bonds
Foreign Infl Adj Securities
25
High-Yield Municipal Bonds
575
Zero Coupon Bonds
28
Floating Rate Notes
10 Certificates of Deposit
07
Australia Debt
36 Canadian Debt
27
LT Corporate Bonds
425 LT Govrsquot Securities
28
35 42
Intrsquol High Yield
68
Risk Management Requires Liquidity
Many Segments of the Bond Market Are Truly Untested for Major
Redemptions
A Bond Market Vulnerability
The Biggest Risk Is Taking No Risk
Credit Risk
Broaden Exposure
Duration Risk
3 Strategy Options
Default Risk
Global Opportunities Extend Maturities
Buy and Hold Doesnrsquot Work in This Environment
Index Funds have too much exposure to US Treasury Securities
Part V ndash Key Takeaways
Bond Strategies Require a Much More Diversified Approach
Uncertainty Requires Periodic Adjustments as Conditions Change
Liquidity Should be a Primary Risk-Management Practice
The Fed Has Removed Risk-Free Investment Options
Recoveries Can Occur Unexpectedly
Questions
23rd Annual Investment Conference amp Luncheon
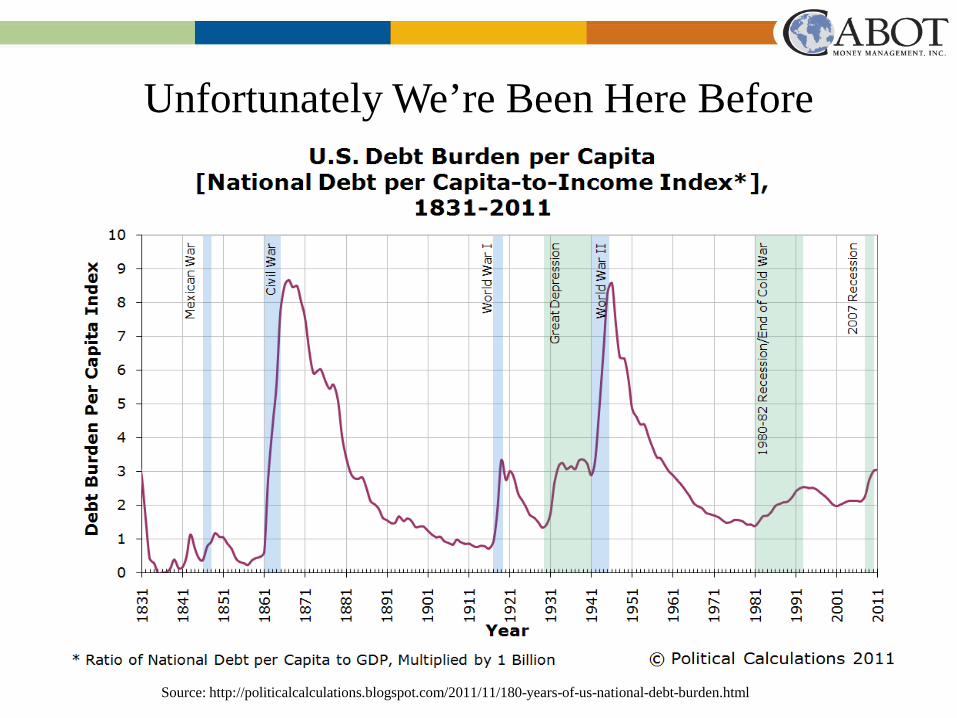
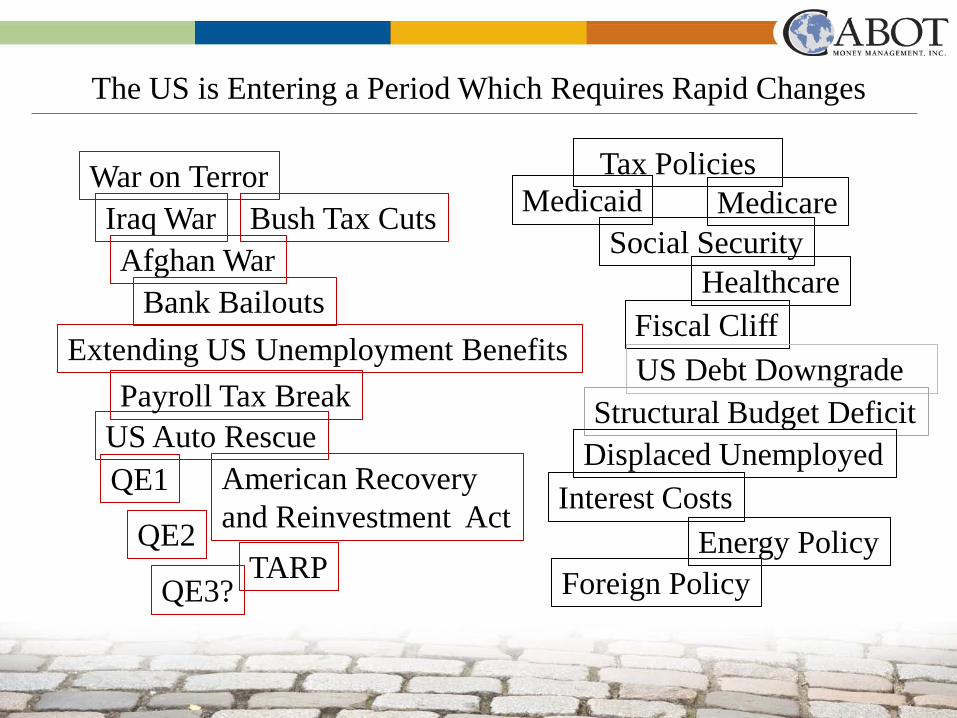
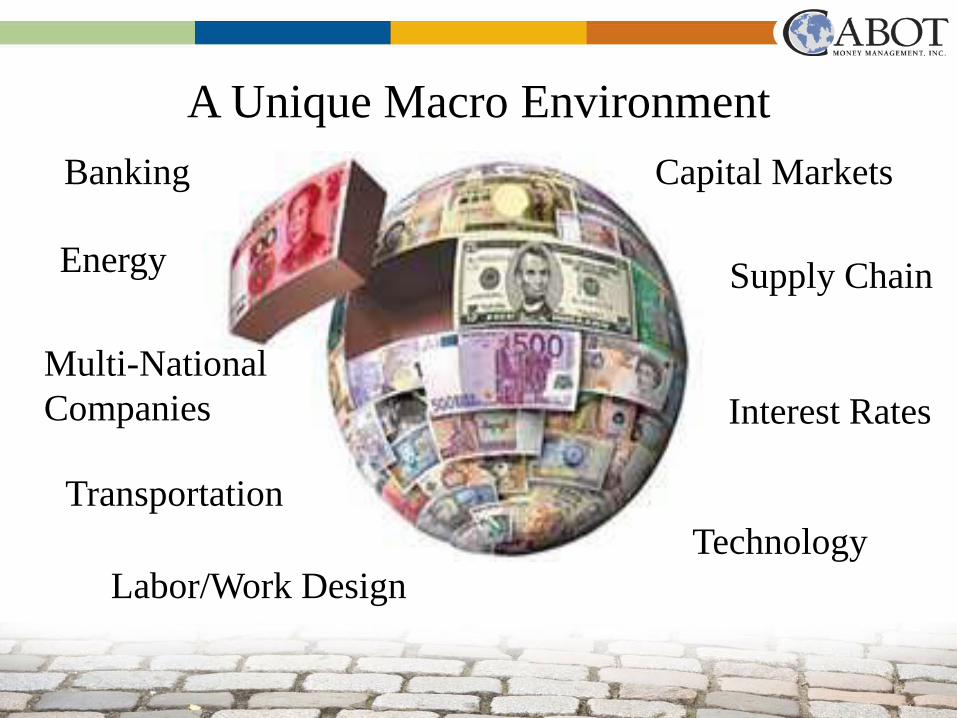
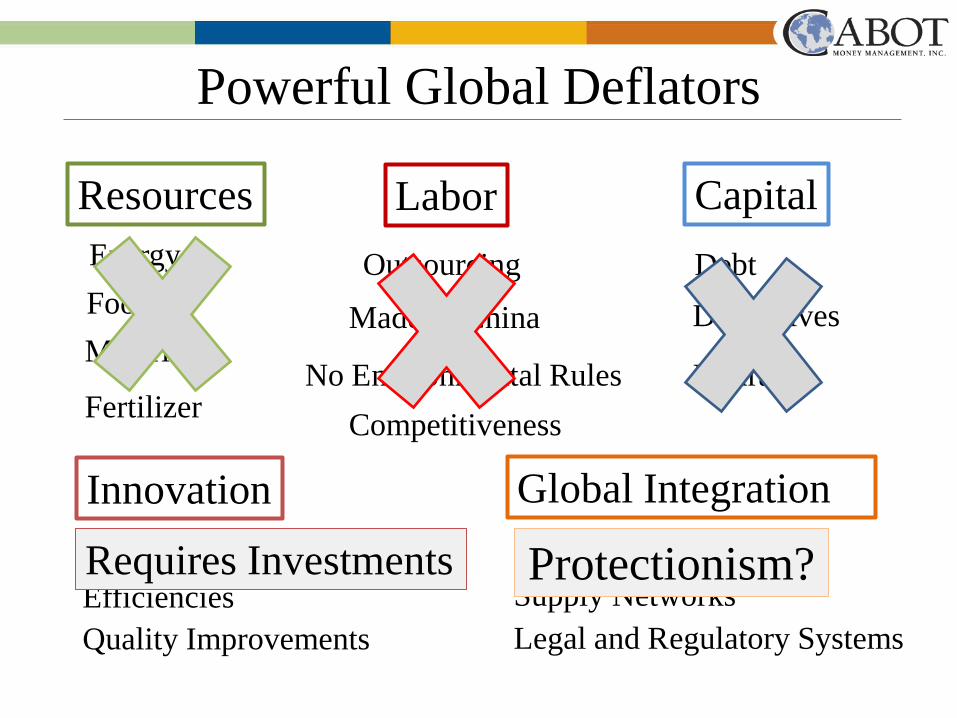
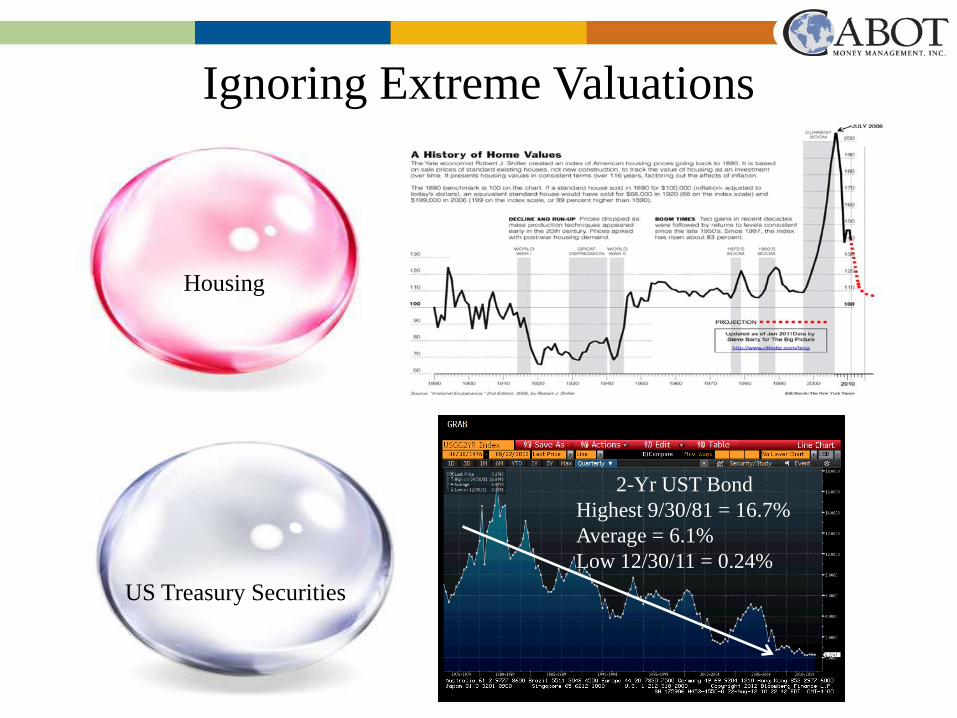
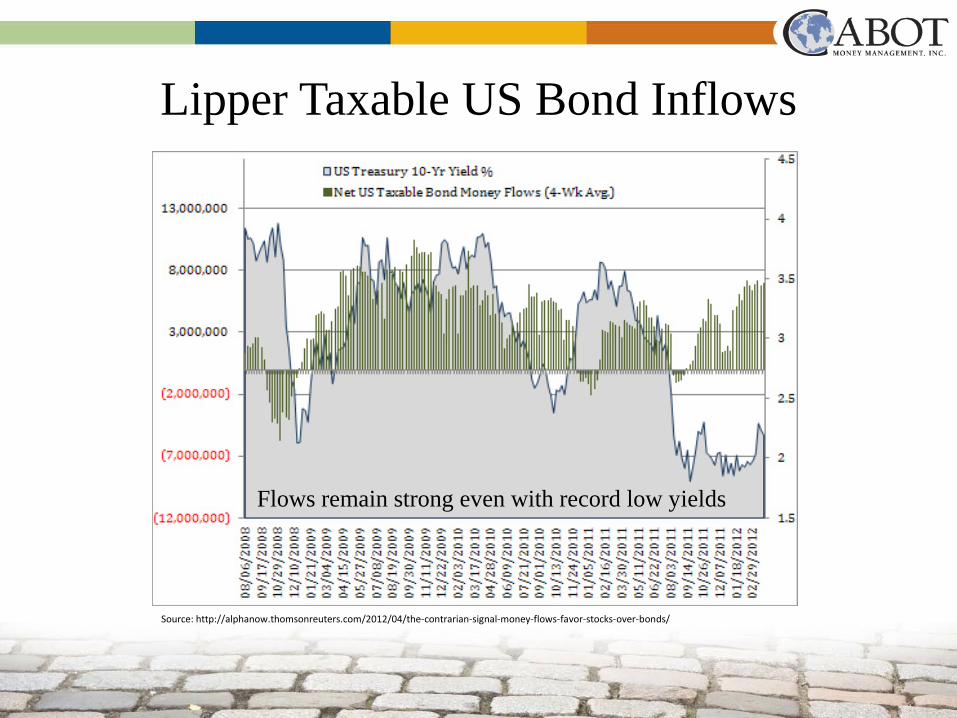
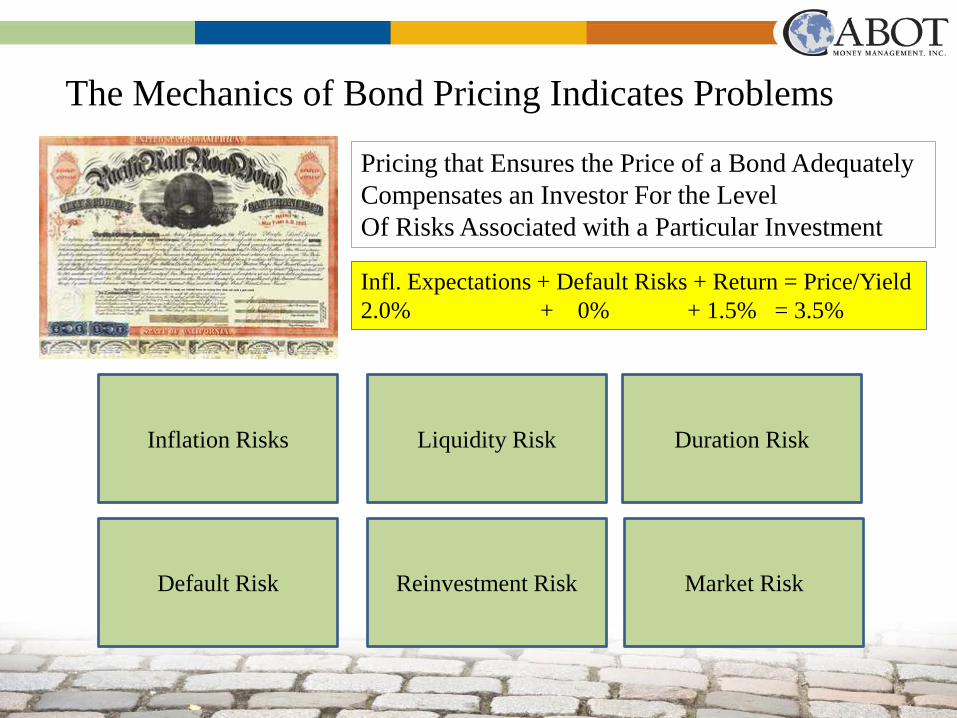
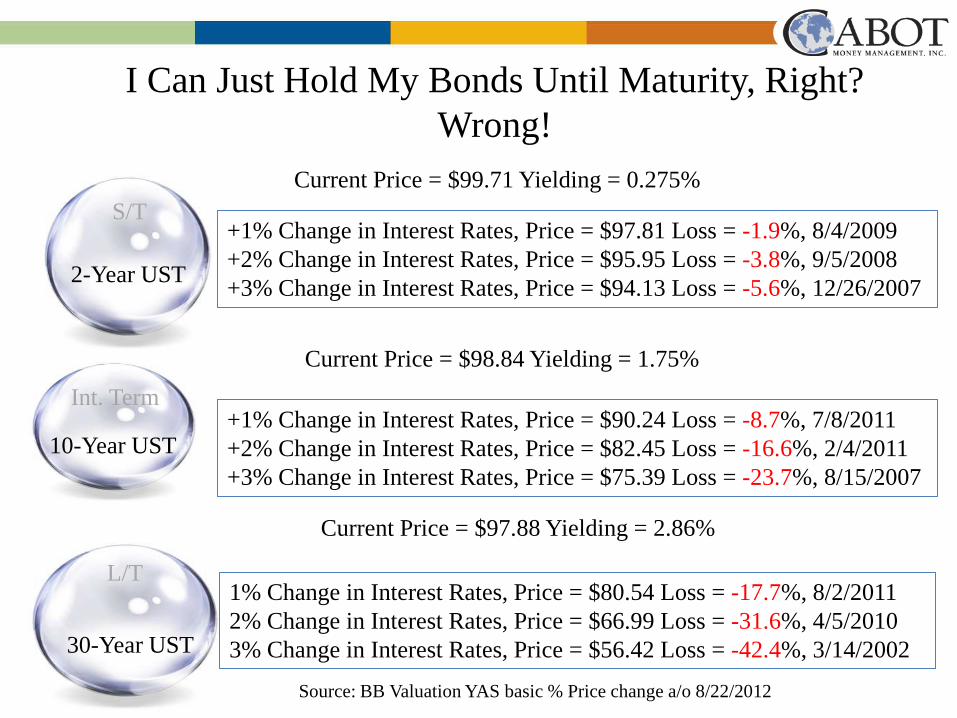
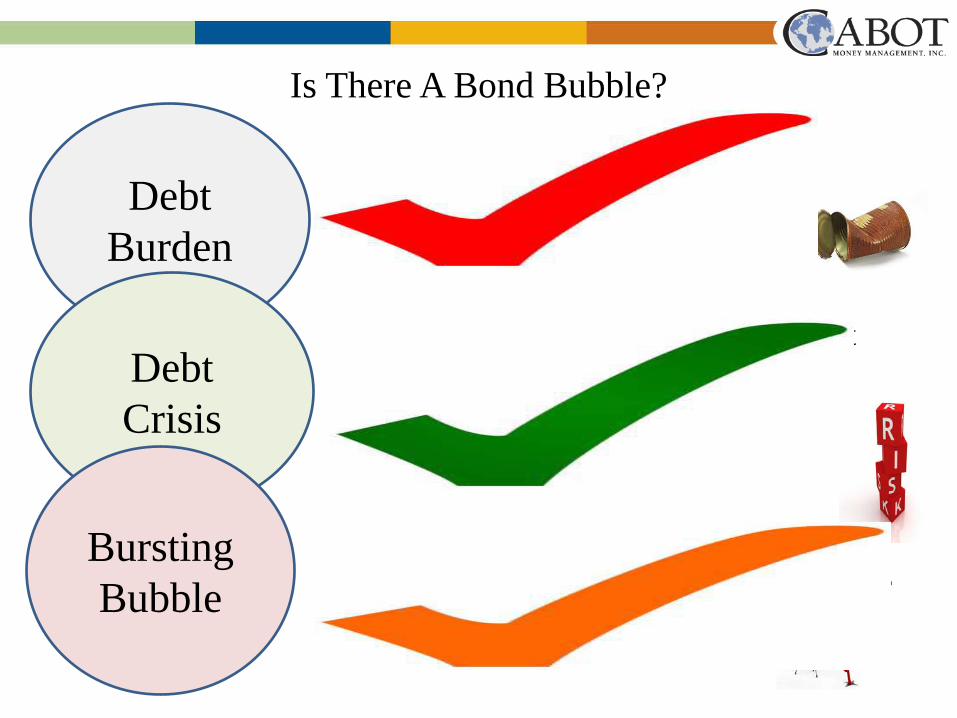
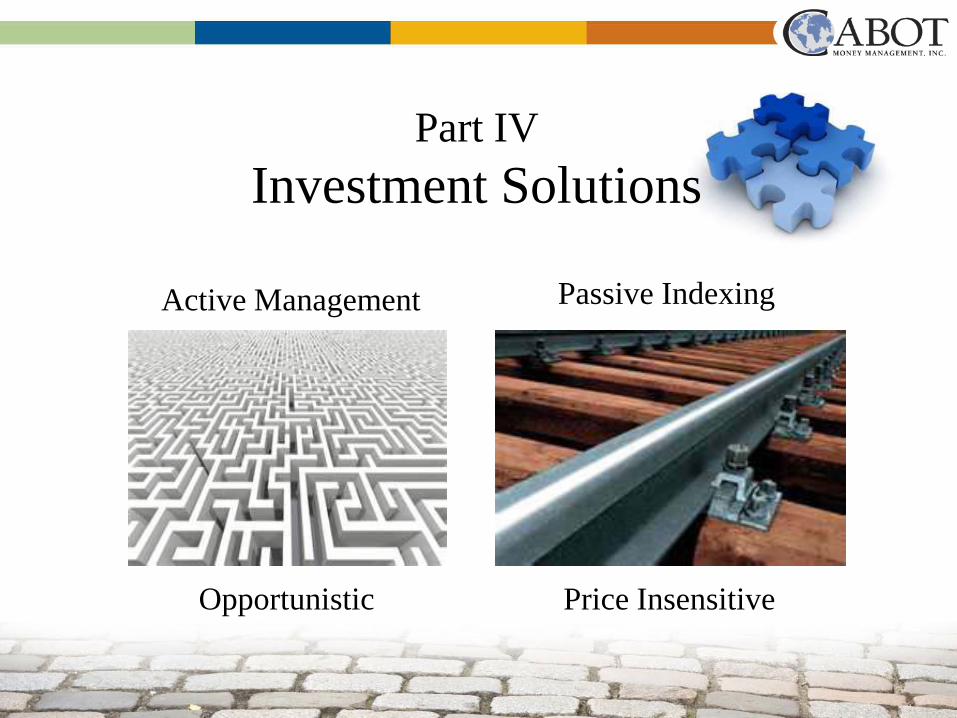
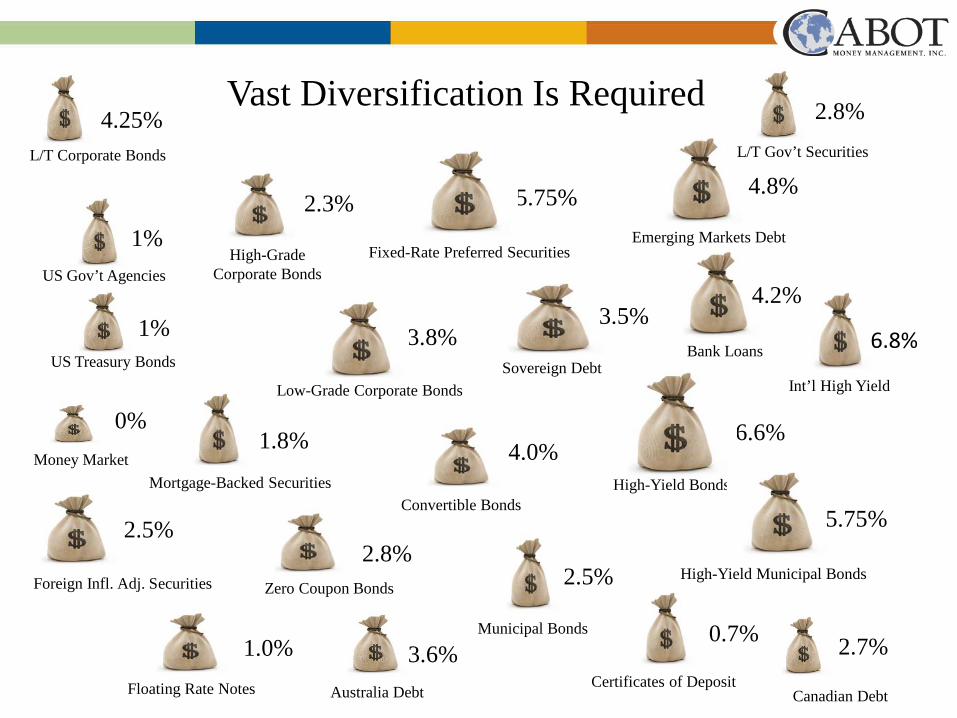
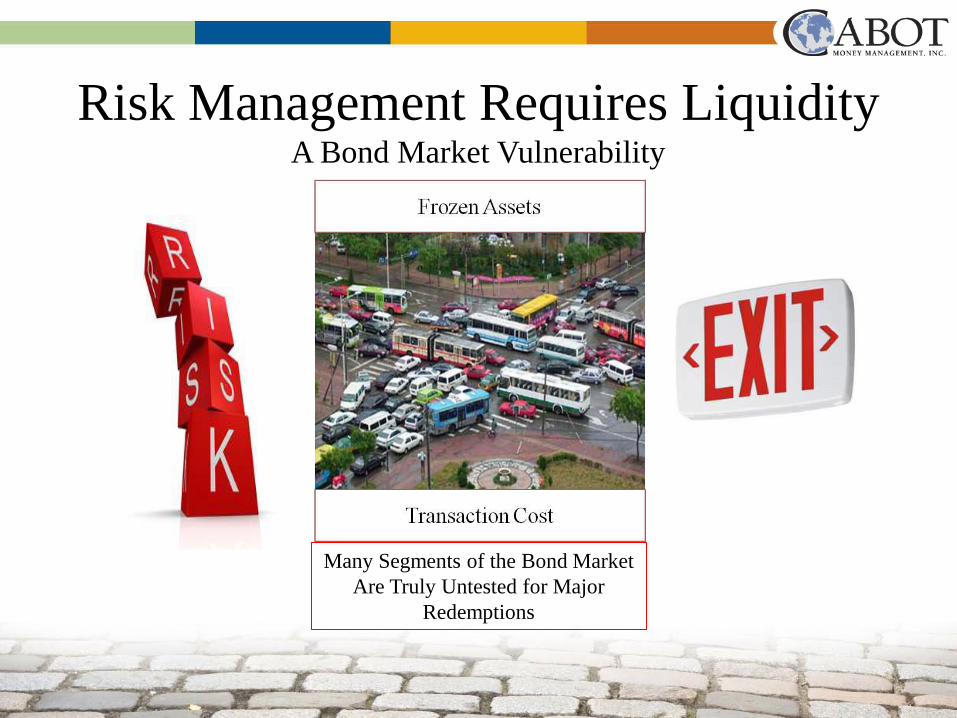
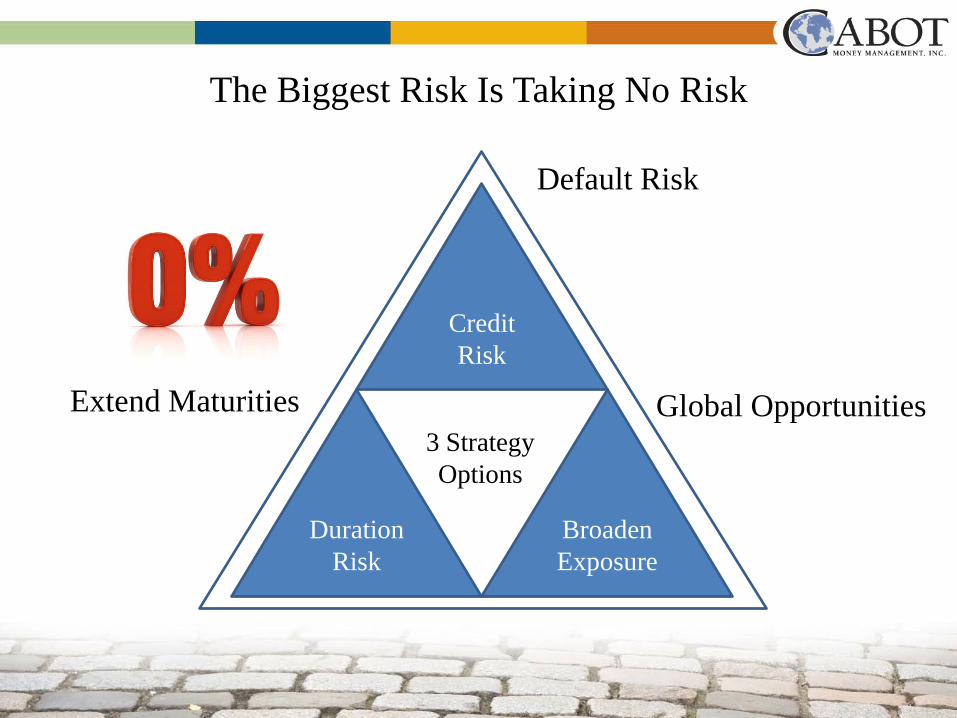

Questions
23rd Annual Investment Conference amp Luncheon

23rd Annual Investment Conference amp Luncheon