Embed Size (px)
Citation preview

United States General Accounting Office
GAO Report to the Chairman, Subcommitteeon Housing and Community Opportunity,Committee on Banking and FinancialServices, House of Representatives
January 1997 PUBLIC HOUSING
HUD Should Improvethe Usefulness andAccuracy of ItsManagementAssessment Program
GAO/RCED-97-27


GAO United States
General Accounting Office
Washington, D.C. 20548
Resources, Community, and
Economic Development Division
B-275648
January 29, 1997
The Honorable Rick LazioChairman, Subcommittee on Housing and Community OpportunityCommittee on Banking and Financial ServicesHouse of Representatives
Dear Mr. Chairman:
This report responds to your request that we review the Department of Housing and UrbanDevelopment’s (HUD) use of its Public Housing Management Assessment Program (PHMAP).Specifically, the report discusses (1) HUD’s use and implementation of the program at its fieldoffices, (2) public housing authorities’ (PHA) PHMAP scores over the first 4 years of the program,and (3) limits on any additional uses for the program.
We are sending copies of this report to the Secretary of Housing and Urban Development andwill make copies available to others upon request. Major contributors to this report are listed inappendix VI.
Please call me at (202) 512-7631 if you or your staff have any questions.
Sincerely yours,
Judy A. England-JosephDirector, Housing and Community Development Issues

Executive Summary
Purpose At a current annual cost of $5.4 billion, the Department of Housing andUrban Development (HUD) subsidizes the operation, maintenance, andmodernization of the nation’s public housing, a $90 billion investment thatprovides homes to 3 million people. Because HUD provides this subsidy tomore than 3,000 independent, state-chartered public housing authorities,the Congress holds HUD responsible for ensuring that these authoritiesefficiently provide safe and decent housing and protect the federalinvestment in their properties. However, the Public Housing ManagementAssessment Program (PHMAP)—HUD’s primary tool for measuring housingauthorities’ performance—has been criticized as unreliable, inaccurate,and at times conflicting with good property management practices.Nevertheless, because no other measurement tool exists, the Congress andHUD have proposed at different times using the program as a basis forderegulating or rewarding high-scoring housing authorities.
Stressing the need for HUD to hold housing authorities accountable whilemaking better use of the data PHMAP produces, the Chairman of theSubcommittee on Housing and Community Opportunity, HouseCommittee on Banking and Financial Services, asked GAO to review HUD’simplementation and use of PHMAP. Specifically, the Chairman asked GAO todetermine
• whether HUD’s field offices are using PHMAP and complying with theprogram’s statutory and regulatory requirements to monitor and providetechnical assistance to housing authorities;
• whether PHMAP scores have increased and how HUD uses the program toinform HUD’s Secretary and the Congress about the performance ofhousing authorities; and
• whether PHMAP scores are consistently accurate and can be considered agenerally accepted measure of good property management.
Background The National Affordable Housing Act of 1990 directed HUD to use certainindicators, including vacancy rates and the percentage of rentsuncollected, to assess the management performance of local housingauthorities. The act also directed HUD to determine the cause of anauthority’s management problems, commit both HUD and the housingauthority to a specific course of corrective action, and document agreedupon corrective actions in memorandums of agreement. To meet the act’srequirements, HUD developed PHMAP to annually obtain data from eachhousing authority on 12 basic indicators of management performance,such as vacancy rates and operating expenses. On the basis of aggregate
GAO/RCED-97-27 Public HousingPage 2

Executive Summary
performance against these indicators, HUD calculates a score from 0 to 100for each authority and assigns one of the following three designations:“troubled performer” for a score less than 60, “standard performer” for ascore between 60 and less than 90, and “high performer” for a score 90 orabove.
HUD’s field offices have nearly 800 staff devoted to oversight of housingauthorities and implementation of the full range of the Department’spublic housing programs, including PHMAP. Because HUD’s field offices areresponsible for implementing PHMAP, HUD expects them to ensure housingauthorities meet PHMAP’s requirements and provide technical assistancewhen an authority has problems doing so. Technical assistance can covera wide variety of activities, such as a focused review of an authority’scompliance with HUD’s rules and regulations, discussions over thetelephone, on-site reviews of HUD-funded modernization work, orsuggestions for improving an authority’s occupancy rate and rentcollection procedures.
Field offices depend on each authority to submit and certify to theaccuracy of about half the data that lead to the overall PHMAP score; thebalance of the information HUD uses comes from its existing informationsystem for tracking expenditures from major grants. With each troubledauthority, the act requires HUD to perform an independent managementassessment to determine the causes of an authority’s problems and thenenter into a binding memorandum of agreement stipulating the problemsthat authority needs to address and an approach and a timetable to resolvethem. Also, when a troubled authority’s new PHMAP score would cause HUD
to remove its troubled designation, HUD’s policy has been to require itsfield offices to verify the accuracy and completeness of the data thehousing authority submitted. Standard- and high-performing authoritiesthat fail any of the 12 indicators must submit a plan for improving theirperformance in that indicator.
While HUD’s primary use of PHMAP has been to identify troubled housingauthorities and target technical assistance to them, the Congress and HUD
have proposed to use PHMAP for other purposes. In 1994, the SenateCommittee on Banking, Housing, and Urban Affairs proposed additionalflexibility for housing authorities that had achieved PHMAP scores over 90.In its fiscal year 1997 budget request, HUD proposed to givehigh-performing housing authorities bonuses based in part on their PHMAP
scores.
GAO/RCED-97-27 Public HousingPage 3

Executive Summary
Results in Brief Most of HUD’s field offices are using PHMAP to identify troubled housingauthorities and target HUD’s limited technical assistance resources.However, the field offices have not been systematically using theassessment program, as required by statutes and regulations, to monitorhousing authorities’ progress in improving their performance and targettechnical assistance to them. For example, the field offices have generallynot been meeting the act’s requirement to enter into memorandums ofagreement with troubled authorities, nor have the field offices consistentlymet HUD’s requirement that housing authorities document plans to correctlow scores in individual performance indicators. Also, the impact of a 1995reorganization of the field offices’ functions and current departmentaldownsizing continue to influence some offices’ ability to provide technicalassistance.
Performance scores generally have increased during the first 4 full years ofthe program. With average scores increasing, the total number of troubledhousing authorities has decreased, and the greatest proportion of thosethat are troubled are the smallest authorities—those managing fewer than100 units. The proportion of high-performing authorities has increasedsteadily from about 33 percent in 1992 to over 50 percent in 1995.High-performing authorities manage nearly 50 percent of all publichousing units. Periodically, HUD officials provide the Secretary and theCongress information on the performance of all housing authorities aswell as the number of troubled authorities.
HUD’s confirmatory reviews of the information underlying assessmentscores have shown the scores to be inaccurate in half the instances whensuch reviews were performed. Regardless of the scores’ accuracy, HUD andpublic housing industry officials do not believe that the managementassessment program comprehensively assesses how well local housingauthorities manage their properties. This is because the assessmentprogram does not include indicators to specifically measure overallhousing quality or the quality of maintenance.
Principal Findings
Field Offices’ Use ofPHMAP and RelatedOversight Tools Has BeenLimited
GAO visited 5 of HUD’s 49 field offices and sent a survey to all 49 officesasking about their use of PHMAP. Officials in these offices generally foundPHMAP useful to identify troubled housing authorities and target limitedtechnical assistance and oversight resources. However, field offices
GAO/RCED-97-27 Public HousingPage 4

Executive Summary
reported that they have not been systematically complying with PHMAP’sstatutory and regulatory follow-up requirements for all housingauthorities.
The extent to which HUD’s field offices used PHMAP to provide technicalassistance to housing authorities varies widely. In part, this differencestems from how different field offices have interpreted their role inhelping authorities improve performance on PHMAP indicators as well astheir overall operations. Some field offices told GAO that they interprettheir role in providing oversight and technical assistance narrowly,generally limiting their assistance to advice, information on complyingwith federal rules and regulations, and suggestions for solvingmanagement problems. Other offices were more willing to get involved ina housing authority’s operations. For example, staff from one field officespent several days at a troubled authority to help it set up proper tenantrent records and waiting lists.
Regarding noncompliance with follow-up requirements, GAO found thefollowing:
• In 1992, HUD’s field offices entered into 29 percent of the requiredmemorandums of agreement; by 1995, just 18 percent of the housingauthorities that should have been operating under a memorandum ofagreement actually were. Primarily, field offices said the reason they didnot enter into these required agreements with troubled housing authoritiesis that the housing authorities had already corrected or were in theprocess of correcting their management deficiencies.
• Even though HUD requires an improvement plan to address eachperformance indicator an authority fails unless that authority can correctthe deficiency within 90 days, 31 percent of HUD’s field offices had notensured that housing authorities had developed such plans.
• Field offices generally did not meet HUD’s requirement to confirm theaccuracy of all PHMAP scores that were high enough to remove the troubleddesignation from a housing authority. In fiscal year 1995, HUD’s field officesconfirmed fewer than 30 percent of the scores that should have beenconfirmed. While 13 offices performed none of the required confirmatoryreviews, some of these same offices performed confirmatory reviews ofother standard- or high-performing authorities. Although no minimumlevel of activity is required, in 1995 HUD confirmed just over 6 percent of allscores, with some field offices performing no confirmatory reviews andothers performing 10 or more.
GAO/RCED-97-27 Public HousingPage 5

Executive Summary
• At the five field offices GAO visited, limited use was made of theindependent financial and compliance audits conducted annually at eachauthority. Over a year ago, HUD began to require that these audits certifythat the PHMAP data from each authority were accurate and complete; HUD
added this requirement because it does not have the resources to confirmeach score every year. Nonetheless, few HUD staff in the field offices GAO
visited were aware of this requirement or used the audits to better focustheir oversight and technical assistance.
The technical assistance HUD staff find most effective at improving theperformance of housing authorities is often the type of help leastfrequently provided. HUD’s field offices told GAO that technical assistanceand oversight are most effective when they provide it on-site at the localauthority. For example, while most staff in field offices said confirmatoryreviews, which must take place on-site, were one of the most effectiveways to provide technical assistance, discussions over the telephone werethe most common form of technical assistance. Some field offices citedresource constraints—a lack of staff, travel funds, or expertise—as themain reason for not meeting follow-up requirements or visiting housingauthorities more often; others opted not to enforce requirements whenthey believed the authorities were already addressing their problems.
Scores Are Increasing, butHUD Recognizes DatabaseFlaws Limit Program’s Use
Average PHMAP scores have increased over the life of the program, risingfrom an average of 83 in 1992 to 86 in 1995, the last year of complete data.In addition, HUD’s database of PHMAP scores indicates the following twotrends:
• The number of high-performing authorities grew each year, from almost athird in 1992 (33 percent) to over half in 1995 (57 percent).
• The number of troubled housing authorities has declined from 130 in 1992to 83 in 1995. However, by 1995, the smallest housing authorities—thosemanaging fewer than 100 units—accounted for a greater share of thosedesignated as troubled than when the program began. In 1995, half of allhousing authorities HUD designated as troubled were small.
GAO found missing, inaccurate, and inconsistent data in HUD’s primarydatabase for storing PHMAP scores. Nevertheless, HUD makes regular,periodic use of the database to provide information to the Secretary andthe Congress on all housing authorities’ scores and the number of troubledauthorities at any given time. However, before providing this informationto others, HUD first manually verifies much of the data it draws from this
GAO/RCED-97-27 Public HousingPage 6

Executive Summary
system. Senior HUD officials acknowledged these problems with thedatabase and added that they are currently working to address dataaccuracy and reliability problems as well as improve their ability tocorrect errors sooner.
The QuestionableAccuracy and Validity ofPHMAP Scores Limit theProgram’s Usefulness
PHMAP scores are often changed after HUD confirms the data used tosupport the scores. In commenting on this report, HUD said that mostconfirmatory reviews are conducted of high-risk housing authoritieswhose data are most susceptible to being found inaccurate. Overhalf—58 percent—of the changes HUD made to PHMAP scores resulted inHUD’s lowering the score by an average of 14 points; 42 percent of thechanges resulted in HUD’s raising the score by an average of 8 points.Typically, HUD changes a PHMAP score after such a review for severalreasons, including the housing authority’s failure to report correctly therequired data or its failure to maintain documentation to support its data.
PHMAP scores are not a generally accepted measure of good propertymanagement. HUD officials, as well as representatives of public housingindustry associations and professional property management consultants,told GAO that the PHMAP indicators do not assess all major aspects of ahousing authority’s performance. For example, PHMAP does not include anindependent on-site inspection of the condition of an authority’s housing,so it does not adequately assess the quality of modernization work orroutine maintenance. These same HUD officials and industryrepresentatives also told GAO that PHMAP does not always allow forextenuating circumstances that can lead to decisions inconsistent withgood property management. For example, a housing authority can improveits PHMAP score on the tenants accounts receivable indicator by writing offas uncollectible past due rents from vacated tenants, but PHMAP would notmeasure how diligent an effort the authority had undertaken to collect therent.
Recommendations GAO recommends that the Secretary of HUD
• provide guidance to its field offices that clearly (1) articulates theirminimally acceptable roles regarding oversight and assistance to housingauthorities and (2) emphasizes the importance of using the results of theindependent audits to better target the Department’s limited technicalassistance resources.
GAO/RCED-97-27 Public HousingPage 7

Executive Summary
Furthermore, because scores are not consistently accurate and PHMAP doesnot measure all aspects of property management, GAO recommends thatHUD
• not consider additional uses for PHMAP, including using scores as criteriafor funding bonuses, until it determines that PHMAP meets an acceptablelevel of accuracy and more comprehensively measures propertymanagement performance and
• require its field offices to confirm the PHMAP scores of housing authoritieswith scores low enough that the authorities are at risk of being designatedtroubled.
Agency Comments GAO provided a draft of this report to HUD for its review and comment. HUD
agreed with GAO’s recommendations and described the steps that theDepartment has begun taking to implement them. However, HUD expressedconcern that the draft report (1) used potentially inaccurate data fromHUD’s PHMAP database, (2) incorrectly assumed that PHMAP was intended tobe an all-encompassing system that measures both managementperformance and physical housing conditions, (3) neglected to place PHMAP
in a historical perspective by discussing HUD’s previous systems forassessing and identifying troubled housing authorities, and (4) reachedincorrect conclusions regarding the reliability of all PHMAP scores on thebasis of the results of confirmatory reviews of the high-risk authoritiesmost susceptible to discrepancies in their PHMAP data.
GAO used the best data available for this review. GAO recognizes anddiscusses in the report the inaccuracies in the PHMAP data. Where HUD wasable to provide more accurate data than its PHMAP database reports, GAO
used that data in this report. GAO did not assume that PHMAP should be acomplete measure of both performance and physical conditions. Thisreport describes the current uses of PHMAP data and addresses how theprogram’s limitations affect its suitability for additional purposes. GAO didnot provide a historical perspective on the program because discussingHUD’s previous systems for assessing and identifying troubled housingauthorities did not contribute to the review’s objectives of evaluating HUD’suse of PHMAP, trends in scores, or limits on additional uses for the program.Finally, GAO did not reach a conclusion about the reliability of all housingauthorities’ PHMAP scores. The report discusses only the reliability of PHMAP
scores for those housing authorities whose scores are so low that they
GAO/RCED-97-27 Public HousingPage 8

Executive Summary
may be at risk of being designated troubled. Statements have been addedto the report to clarify this point.
HUD’s written comments are presented in appendix V and GAO’s responsesare discussed at the end of each chapter as appropriate.
GAO/RCED-97-27 Public HousingPage 9

Contents
Executive Summary 2
Chapter 1 Introduction
12Indicator Grades Determine the PHMAP Score, Performance
Designation, Required Follow-Up, and Incentives14
HUD’s Field Offices Implement PHMAP 16Objectives, Scope, and Methodology 18
Chapter 2 Although Field OfficesUse PHMAP toIdentify TroubledPHAs, ComplianceWith Statutory andAgency Follow-UpRequirements HasBeen Limited
21HUD Uses PHMAP to Identify Troubled Housing Authorities, but
Technical Assistance Varies21
HUD’s Infrequent Use of Some Oversight Tools May NotAdequately Improve the Performance of PHAs or TargetTechnical Assistance
24
Conclusions 31Recommendation 31Agency Comments 31
Chapter 3 Although PHMAPScores Have Risen,HUD Recognizes ThatFlaws in theProgram’s DatabaseLimit Its Use
33Most PHMAP Scores Are Increasing and Fewer Housing
Authorities Are Troubled33
HUD Recognizes Database Flaws and Plans Corrections 37Agency Comments 39
Chapter 4 The QuestionableAccuracy of PHMAP’sScores and theProgram’s ValidityLimit Its Usefulness
40Accuracy of Scores and Validity as a Management Assessment
Tool Limit Uses for PHMAP40
The Congress and HUD Have Proposed to Use PHMAP as a Basisfor Deregulation and Funding Bonuses
43
Conclusions 45Recommendations 45Agency Comments 46
GAO/RCED-97-27 Public HousingPage 10

Contents
Appendixes Appendix I: Average PHMAP Score by Geographic Region, FiscalYears 1992-95
48
Appendix II: Number of Troubled PHAs by Geographic Region,Fiscal Years 1992-95
50
Appendix III: Number of Standard-Performing PHAs byGeographic Region, Fiscal Years 1992-95
52
Appendix IV: Number of High-Performing PHAs by GeographicRegion, Fiscal Years 1992-95
54
Appendix V: Comments From the Department of Housing andUrban Development
56
Appendix VI: Major Contributors to This Report 61
Tables Table 1.1: Twelve PHMAP Indicators 13Table 2.1: PHAs Receiving a Confirmatory Review From a HUD
Field Office, Fiscal Years 1992-9528
Table 3.1: Average PHMAP Score by PHA Size Category, FiscalYears 1992-95
34
Table 3.2: Number of PHAs by PHMAP Performance Category,Fiscal Years 1992-95
35
Table 3.3: Failed Indicators by Percentage of PHAs, Fiscal Years1992-95
36
Table 4.1: Changes in PHMAP Scores After HUD’s Field OfficesPerformed Confirmatory Reviews in Fiscal Year 1995
41
Figures Figure 2.1: Percentage of Troubled PHAs Operating Under aMOA, Fiscal Years 1992-95
26
Figure 2.2: Number of Confirmatory Reviews Performed by HUDField Offices, Fiscal Year 1995
29
Figure 3.1: Number of Troubled PHAs by Size, Fiscal Years1992-95
37
Abbreviations
GAO General Accounting OfficeHUD Department of Housing and Urban DevelopmentIG Office of Inspector GeneralMOA memorandum of agreementPHA public housing authorityPHMAP Public Housing Management Assessment ProgramSMIRPH System for Management Information Retrieval-Public
Housing
GAO/RCED-97-27 Public HousingPage 11

Chapter 1
Introduction
Because public housing represents a $90 billion investment on the part ofthe federal government since the program’s inception in 1937 and becausethe Department of Housing and Urban Development (HUD) currentlyspends $5.4 billion a year on operating subsidies and modernization grantsfor this housing, interest remains keen in knowing how well local publichousing authorities (PHA) are managing their properties. The PHAs, throughwhich HUD provides these subsidies and grants, house 3 millionlow-income people, many of whom are elderly or disabled. The Congressholds HUD responsible for ensuring that the authorities provide safe anddecent housing, operate their developments efficiently, and protect thefederal investment in their properties.
The National Affordable Housing Act of 1990 required HUD to developindicators to assess the management performance of PHAs.1 This lawbecame the framework through which HUD developed one of its primaryoversight tools for housing authorities, the Public Housing ManagementAssessment Program (PHMAP). Primarily, PHMAP establishes objectivestandards for HUD to evaluate and monitor the management operations ofall PHAs to identify those that are troubled. According to HUD, PHMAP alsoallows the Department to identify ways to reward high-performing PHAs aswell as improve the management practices of troubled PHAs. The programalso allows PHAs’ governing bodies, management officials, residents, andthe local community to better understand and identify specific programareas needing improvement.
To help improve public housing management, the National AffordableHousing Act of 1990, as amended (the act), required HUD to developindicators to assess the performance of PHAs in all the major aspects oftheir management operations. The act required HUD to use certainindicators as well as provided discretion for the Secretary of HUD todevelop up to five additional indicators that the Department deemedappropriate. HUD implemented PHMAP by using the 12 indicators listed intable 1.1, the first seven of which are those required by statute.
1P.L. 101-625, Section 502(a), as amended by the departments of Veterans Affairs and Housing andUrban Development, and Independent Agencies Appropriations Act of 1992.
GAO/RCED-97-27 Public HousingPage 12

Chapter 1
Introduction
Table 1.1: Twelve PHMAP IndicatorsPHMAP indicator Measurement
1.Vacancy number and percentage Number and percentage of vacancies,including progress made within theprevious 3 years to reduce vacancies
2.Modernization Amount and percentage of fundsunexpended after 3 years
3.Rents uncollected Balance uncollected as a percentage oftotal rents to be collected
4.Energy consumption Increase in annual consumption
5.Unit turnaround Average time required to repair andreoccupy vacant units
6.Outstanding workorders Proportion of maintenance workordersoutstanding
7.Annual inspection and condition of unitsand systems
Percentage of units and systems notinspected to determine preventivemaintenance or modernization needs
8.Tenants accounts receivable Percentage of monies owed to theauthority by current residents
9.Operating reserves Percentage of operating reservesmaintained by the authority
10.Routine operating expenses Level of operating expenses compared tooperating income and federal subsidy
11.Resident initiatives Existence of a partnership betweenresidents and the authority to promoteopportunities for self-sufficiency and otherprograms
12.Development Ability to develop additional public housingunits
Because some indicators are more important than others in measuringmanagement performance, HUD assigns them added weight in determiningthe overall score.2 HUD considers the indicators for vacancies, rentsuncollected, annual inspection and condition of units and systems, andresident initiatives most indicative of good property management anddelivery of services to residents, so each one has a greater weight thanother indicators.
After reviewing existing procedures and extensively consulting with agroup of PHAs, public housing industry groups, private management firms,resident groups, and HUD staff in field offices, HUD has significantly revisedthe PHMAP indicators. HUD’s revisions to PHMAP, published December 30,1996, eliminated three indicators; consolidated four other indicators into
2According to a HUD official, these weights reflect the Department’s determination that they are themost important indicators of good property management.
GAO/RCED-97-27 Public HousingPage 13

Chapter 1
Introduction
two; and added one new indicator, security.3 These revisions primarilyaddress the performance indicators on which housing authorities reportdata, not HUD’s use of PHMAP data.
Indicator GradesDetermine thePHMAP Score,PerformanceDesignation, RequiredFollow-Up, andIncentives
Annually, PHAs receive a grade of “A” through “F” for each of the twelveindicators that apply to their operations. HUD uses a formula that reflectsthe weights assigned to each indicator, converts indicator grades intopoints, totals each PHA’s points, and divides that total by the maximumtotal the PHA could have achieved to arrive at a percentage. Thatpercentage, a number between 0 and 100, is the PHMAP score.
HUD draws data on the performance of a housing authority from twosources to determine the authority’s PHMAP score. First, the housingauthority submits data to HUD for about half of the PHMAP indicators andcertifies that this information is accurate and complete.4 HUD assignsgrades to each of these indicators according to a comparison of theauthority’s data and HUD’s criteria for grades “A” through “F.” The balanceof the information HUD uses comes from its own information system fortracking expenditures from major grants. This system contains thefinancial and other types of data the field offices need to grade theremaining indicators for which the PHAs do not provide data. The fieldoffices use this data and the PHA-certified data to determine indicatorscores, the PHMAP score, and the PHA’s performance designation.
The PHMAP score is HUD’s starting point for both the performancedesignation it assigns to a PHA and, depending on that designation, theextent of follow-up required of the PHA to correct deficiencies identifiedduring the PHMAP assessment. Generally, HUD uses three designations todescribe the performance of PHAs:
• troubled performers are those scoring less than 60 percent;5
• standard performers are those scoring between 60 and less than90 percent; and
• high performers are those scoring 90 percent or more.
3HUD eliminated the tenants accounts receivable, routine operating expenses, and developmentindicators. HUD also consolidated unit turnaround into the vacancy indicator and energy consumptioninto the financial management (formerly operating reserves) indicator.
4PHAs certify the data for the following indicators: vacancy number and percentage, rents uncollected,unit turnaround, outstanding work orders, annual inspection and condition of units and systems, andresident initiatives.
5PHMAP includes an additional designation, modernization troubled (mod-troubled), which can applyto any PHA that scores less than 60 percent on the modernization indicator.
GAO/RCED-97-27 Public HousingPage 14

Chapter 1
Introduction
HUD has the discretion to withhold the troubled designation or award thehigh performer designation if a PHA’s score is within 10 points of thethreshold for either designation and HUD determines that its score resultsfrom the physical condition and/or neighborhood environment of thatauthority’s units rather than from the PHA’s poor management practices.
If a housing authority is designated as troubled, it faces several mandatoryfollow-up activities and/or corrective actions to improve performance andremove the troubled designation. Specifically, the act requires HUD toperform an independent management assessment of the troubled PHA’soverall operations to identify the causes of the deficiencies that led to itspoor PHMAP score. HUD uses private contractors to perform theseindependent assessments.
HUD expects the independent assessments to form the basis for the secondrequirement for troubled PHAs—the memorandum of agreement (MOA). Amemorandum of agreement is a binding contract between HUD and atroubled PHA to identify solutions to its management problems and pursuethose solutions in a way that is significant, expeditious, and lasting.Among other things, HUD requires that the MOA address the specificresponsibilities of HUD and the PHA, the resources each will commit toresolving the authority’s problems, the annual and quarterly performancetargets for improving its performance on PHMAP indicators, and theincentives for it to meet its performance targets as well as sanctions forfailing to do so. A PHA’s initial MOA generally lasts 18 months so that it cancomplete a second-year agreement with HUD, if necessary, before the firstexpires.6
HUD’s regulations for implementing PHMAP require standard- andhigh-performing PHAs to develop improvement plans for every PHMAP
indicator on which the PHA received an “F,” unless the PHA can correct thedeficiency within 90 days;7 HUD may also choose to require these plans forindicators receiving scores of “D” or “E” when failure to raise the grademight pose significant added risk. An improvement plan documents howand when the PHA plans to correct deficiencies. Although similar in contentand scope to a memorandum of agreement, improvement plans differ inthat (1) PHAs develop and submit them to HUD for approval rather than
6Second and subsequent year agreements are necessary only as long as the PHA remains troubled.
7Mandatory improvement plans would not apply to the modernization indicator because any PHAreceiving an F on this would be designated mod-troubled.
GAO/RCED-97-27 Public HousingPage 15

Chapter 1
Introduction
negotiate them with HUD officials and (2) they are not a bindingcontractual commitment between the PHA and HUD.
When HUD first implemented PHMAP, it offered high-performers a variety ofincentives, primarily regulatory relief from various reporting requirements.These incentives included less frequent reviews of changes to a PHA’soperating budget and, for those performing well on the modernizationindicator, no prior HUD review for architects’ or engineers’ contracts. Inaddition to regulatory relief, high-performing PHAs receive a HUD certificateof commendation and public recognition for their performance.
In its fiscal year 1997 budget request, HUD proposed an additionalPHMAP-based incentive for high-performing PHAs when it sought to create a$500 million capital bonus fund (as part of the $3.2 billion it sought for itspublic housing capital fund).8 To be eligible for a bonus, a PHA would haveto be a PHMAP high performer and have undertaken substantive efforts toobtain education and job training for its residents. However, the Congresschose not to fund the bonus proposal for public housing or any of HUD’sother major programs, in part because of concerns about HUD’s ability toaccurately and reliably track the performance of bonus recipients.
HUD’s Field OfficesImplement PHMAP
With nearly 800 staff devoted to oversight of housing authorities andimplementation of the full range of HUD’s public housing programs, its fieldoffices have the bulk of the Department’s responsibility for the day-to-dayimplementation of PHMAP. Field offices’ PHMAP responsibilities includedetermining the indicator grades and PHMAP scores, negotiatingmemorandums of agreement, approving PHAs’ improvement plans, andmonitoring their progress in meeting the goals the MOA or improvementplan set forth. To determine a housing authority’s PHMAP score, a fieldoffice relies on that PHA to provide about half the data that leads to theoverall PHMAP score and certify the data’s accuracy. As a result, the overallPHMAP score and everything it influences—from incentives for highperformers to sanctions for troubled PHAs—are very much a joint effortand a shared responsibility.
A PHA may also request to exclude or modify the data HUD should considerin computing its PHMAP score. An exclusion means that the indicator (orone or more of its components) is entirely excluded from calculations todetermine the PHMAP score. For example, PHAs with no ongoing
8The public housing capital fund would have consolidated public housing modernization, development,and several other capital repair and replacement programs.
GAO/RCED-97-27 Public HousingPage 16

Chapter 1
Introduction
modernization or development programs are automatically excluded frombeing assessed on those indicators. Modifying the data for an indicatorallows HUD to consider unique or unusual circumstances by exemptingsome of the data HUD usually requires the PHA to consider. The PHA stillreceives a score for the indicator, but the score would not reflect the dataassociated with the PHA’s unique or unusual circumstances. For example, aPHA operating under a court order not to collect tenants’ rent at specificdevelopments until it corrects deficiencies the court had identified canseek to exempt those units in its developments from being considered inits indicator score for rents uncollected. A PHA always has the right toappeal a field office’s decision about modifications, exclusions, indicatorscores, or the performance designation. However, after those appeals havebeen exhausted, the field office certifies the PHA’s PHMAP score, assigns afinal performance designation, and proceeds with any requiredimprovement plans, MOAs, or other necessary follow-up.
When a troubled authority’s new PHMAP score is high enough to cause HUD
to remove its troubled designation, HUD’s policy is to require the fieldoffice to verify the accuracy and completeness of the new data submittedby the housing authority. HUD also requires the field office to conduct aconfirmatory review to verify the data the PHA had certified as well as theaccuracy of the data HUD had obtained from its own information system.HUD’s guidance for implementing PHMAP stipulates that a confirmatoryreview must take place on-site at the PHA and cannot be accomplishedthrough remote monitoring.
HUD’s field offices may choose to conduct some confirmatory reviews ofstandard- and high-performing PHAs’ PHMAP certifications. HUD expects itsfield offices to choose these PHAs according to the risk they pose and focuson those with the highest potential for fraud, waste, mismanagement, orpoor performance. Some of the factors HUD field offices may consider inanalyzing the risk associated with a PHA’s PHMAP certification include size(number of units), borderline troubled designation (5 percent above orbelow the percentage for the designation), and negative trends in overallor individual indicator scores over several years.
In May 1995, HUD expanded the scope of the annual independent auditeach PHA receives in order to improve the Department’s ability todetermine whether PHA-certified data are accurate. The annual audit,conducted pursuant to the requirements of the Single Audit Act, examinesthe housing authority’s financial statements, internal controls, andcompliance with HUD’s rules and regulations. Housing authorities are
GAO/RCED-97-27 Public HousingPage 17

Chapter 1
Introduction
responsible for selecting their own auditors and submitting the results ofthe audits to their HUD field office. Field offices are responsible forreviewing the audits to ensure they meet all of HUD’s requirements and,when they have approved the audit, reimbursing housing authorities forthem. In fiscal year 1995, these independent audits cost HUD about$8 million for all housing authorities.
HUD now requires the independent auditors to determine whether ahousing authority has adequate documentation for the data it submits toHUD for its PHMAP certification. According to HUD officials, because theDepartment’s resources are too limited to conduct annual confirmatoryreviews of most housing authorities, they expected to use the results ofthese audits to better focus HUD’s attention, oversight, and technicalassistance. In addition to paying for the audits, HUD expects its field officesto use the results as part of a risk assessment to determine which housingauthorities should get the most sustained attention and technicalassistance.
Objectives, Scope,and Methodology
Stressing the need for HUD to hold housing authorities accountable whilemaking better use of the data that PHMAP produces, the Chairman of theSubcommittee on Housing and Community Opportunity, HouseCommittee on Banking and Financial Services, asked GAO to review HUD’suse and implementation of PHMAP. As agreed with the Chairman’s office,we reviewed
• whether HUD’s field offices are using PHMAP and complying with theprogram’s statutory and regulatory requirements to monitor and providetechnical assistance to housing authorities,
• whether PHMAP scores have increased and how HUD uses the program toinform HUD’s Secretary and the Congress about the performance ofhousing authorities, and
• whether PHMAP scores are consistently accurate and can be considered agenerally accepted measure of good property management.
We developed information from several different sources to addressquestions concerning the usefulness of PHMAP to HUD and other uses forwhich PHMAP may not be appropriate. To determine PHMAP’s usefulness toHUD, we interviewed officials and collected information on technicalassistance activities at both the Department’s headquarters and fieldoffices. At HUD’s headquarters, we analyzed a variety of documentspertaining to PHMAP and discussed the program’s use as a basis for
GAO/RCED-97-27 Public HousingPage 18

Chapter 1
Introduction
technical assistance with the Offices of the Deputy Assistant Secretariesunder HUD’s Assistant Secretary for Public and Indian Housing.
At HUD’s field offices, our approach was twofold. First, we surveyed themvia fax questionnaire to obtain data on the use of PHMAP, such as thenumber of confirmatory reviews each field office performs and how usefulsuch program tools as improvement plans have been.9 This data reflectresponses from all of HUD’s public housing field offices.10 Second, wevisited five HUD field offices to review their use of PHMAP in more depth andto supplement the information we had gathered in our survey.11 Wejudgmentally selected the five field offices because of their geographicdistribution, variations in the number of HUD staff in each office as well asthe number of PHAs each oversees, and variations in average PHMAP scoresfor the PHAs reporting to those offices.
To provide information on PHAs’ PHMAP scores, we relied on existing datafrom HUD sources, including HUD’s primary public housing database, theSystem for Management Information Retrieval-Public Housing (SMIRPH).From this database, we extracted the module containing housingauthorities’ PHMAP data, including the PHMAP scores and individual indicatorgrades. Our analysis covers federal fiscal years 1992 through 1995 becausethe first fiscal year in which the rules governing PHMAP took effect was1992 and the most recent year for which all PHMAP scores were complete atthe time of our review was 1995.
We did not systematically verify the accuracy of HUD’s data or conduct areliability assessment of HUD’s database. In performing our analysis wefound erroneous and incomplete information for a few PHAs, ranging from1 to 3 percent of the total. We confirmed this with HUD officials, whoattributed the errors to mistakes in data input or the field office’s havingentered incomplete scores. However, because we used these data incontext with additional evidence we obtained directly from HUD’s fieldoffices and we did not focus on the scores of specific PHAs or small groups
9HUD headquarters does not collect or centrally maintain the information for which we surveyed thefield offices.
10Although 51 of HUD’s 79 field offices have public housing oversight responsibilities, 2 of those 51have assumed the workload of another field office due to attrition or temporary vacancies in the publichousing division. In these cases, the field office handling the workload provided a combined responsereflecting data for both office’s jurisdictions. As a result, our data is drawn from 49 responses, but itdoes reflect the PHMAP-related activities of all of HUD’s public housing field offices.
11We visited HUD’s field offices in Birmingham, Alabama; Kansas City, Missouri; Minneapolis,Minnesota; San Antonio, Texas; and San Francisco, California.
GAO/RCED-97-27 Public HousingPage 19

Chapter 1
Introduction
of PHAs, we believe our conclusions about overall trends in scores arevalid.
Throughout the course of our work, because the number of PHAs reportingPHMAP scores is too great for us to visit a representative sample, weconsulted with several prominent groups representing the public housingindustry to discuss HUD’s uses for PHMAP as well as their perspectives onthe program’s ability to measure the performance of public housingauthorities. These groups include the Council of Large Public HousingAuthorities, the National Association of Housing and RedevelopmentOfficials, and the Public Housing Authorities Directors Association.
We provided a draft of this report to HUD for review and comment. HUD’scomments appear in appendix V and are addressed at the end of eachapplicable chapter.
We performed our work from January through December 1996 inaccordance with generally accepted government auditing standards.
GAO/RCED-97-27 Public HousingPage 20

Chapter 2
Although Field Offices Use PHMAP toIdentify Troubled PHAs, Compliance WithStatutory and Agency Follow-UpRequirements Has Been Limited
HUD’s field offices use PHMAP scores for their primary intended purposes: asa standard, objective means to identify troubled housing authorities; tocompare performance among PHAs; and to identify when, where, and howto target HUD’s limited resources for technical assistance. However,beyond identifying troubled authorities and what they need, the amountsand kinds of technical assistance HUD provides varies because its fieldoffices interpret their responsibilities differently—some choose to beactively involved while others adopt a hands-off approach. Furthermore,HUD’s 1995 reorganization of its field offices adversely affected someoffices’ ability to provide technical assistance while others adapted tochanged expectations and resumed providing as much assistance as theydid before the reorganization.
HUD Uses PHMAP toIdentify TroubledHousing Authorities,but TechnicalAssistance Varies
As part of HUD’s oversight of public housing, the PHMAP score is animportant tool for identifying troubled authorities so HUD can focustechnical assistance and monitoring on them. The most common types oftechnical assistance that HUD’s 49 public housing field offices provided allPHAs were telephone consultations, training, and participation inconferences. However, we found differences in how field offices definedtheir roles in providing PHAs technical assistance as well as someinnovations in how others provided that assistance. For example, somefield offices have encouraged high-performing PHAs to provide “peerassistance” to lower performers. Many of the differences in assistancewere due to variations in field offices’ interpretations of their roles and theimpact of HUD’s 1995 reorganization of its field offices. HUD headquartersofficials believe that more training for all field staff and leadership fromfield office managers would help achieve more quality and consistencyamong field offices in providing technical assistance.
HUD Uses PHMAP toTarget PHAs for TechnicalAssistance
Officials in 40 of HUD’s 49 field offices rated PHMAP as being of “utmost” or“major” importance in identifying which housing authorities need the mosttechnical assistance. According to field office staff, PHMAP providesstandard indicators to objectively measure an authority’s performance. Inaddition, some staff said that because PHAs have a strong aversion tofailing performance scores and try to avoid failure, they are confident thatwhen PHAs report information that results in low scores or failing grades,the data and the resulting scores are accurate. Because an accumulation oflow or failing scores results in a PHA’s being designated troubled, HUD staffare confident that those PHAs PHMAP identifies as the worst-performinghousing authorities are accurately designated as troubled performers.
GAO/RCED-97-27 Public HousingPage 21

Chapter 2
Although Field Offices Use PHMAP to
Identify Troubled PHAs, Compliance With
Statutory and Agency Follow-Up
Requirements Has Been Limited
Some field office staff also use declining PHMAP scores to provide an earlywarning of management problems and to identify which PHAs could needadditional technical assistance. In addition, the staff use PHMAP’s 12individual indicator grades to better focus their limited technicalassistance resources and thereby maximize the benefits PHAs receive fromHUD’s assistance. For example, one field office developed a package oftechnical assistance for the “resident initiatives” indicator because manyPHAs failed this indicator. The package of assistance included samplepolicies and procedures for operating resident programs. Another fieldoffice developed assistance specifically for small housing authoritiesbecause many of them were having trouble renting their units when theybecame vacant (thus failing PHMAP’s unit turnaround indicator). Amongother things, that field office provided its small PHAs an extensive list ofsuggestions on how and where to better market their units.
Most technical assistance from HUD’s field offices consisted of telephoneconsultations, training sessions, and industry conferences. HUD alsoprovided assistance—although limited because of time constraints—at thetime of a PHMAP confirmatory review. During telephone consultations,several offices we visited answered questions from housing authority staffand helped the executive directors of new housing authorities betterunderstand public housing regulations and operations. Training sessionscovered these and other topics and provided more details than telephonediscussions. In addition, to increase the amount of personal contact theyhave with housing authority staff and to provide technical assistance, fieldoffice staff said they regularly participate in conferences hosted by publichousing industry associations.
Field Offices’Interpretations of TheirRole and Their RecentReorganization Influencethe Level and Types ofTechnical Assistance
Field offices’ interpretations of their obligation to improve theperformance of housing authorities influences the type of technicalassistance they provide. For example, officials in one field office did notbelieve that it was HUD’s role to manage PHAs’ operations. Instead, theybelieved that the role of their field office should be limited to providinginformation on compliance with federal rules and regulations and tosuggesting solutions to management problems. This field office avoidsshowing PHAs how to manage their developments because the staff believethat they do not have sufficient expertise and that the housing authoritieswould view this advice as intrusive.
In contrast, staff at other field offices that we visited believed they areobligated to tell PHAs what must be done to correct management
GAO/RCED-97-27 Public HousingPage 22

Chapter 2
Although Field Offices Use PHMAP to
Identify Troubled PHAs, Compliance With
Statutory and Agency Follow-Up
Requirements Has Been Limited
deficiencies because HUD is responsible for ensuring that PHAs use federalfunds efficiently and effectively to provide safe, decent housing. Forexample, staff from one field office spent several days at a troubledauthority to help it set up proper tenant rent records and waiting lists.
In addition to differences in how they view their role to directly assistPHAs, we found differences in the extent to which field offices use outsideresources to help their housing authorities. Some field offices told us thatto compensate for a shortage of resources from HUD, they help PHAs intheir jurisdiction by encouraging technical assistance from other PHAsrather than providing it themselves. For example, some of the field officesarranged for high-performing PHAs to provide peer assistance to authoritieswith management problems. One field office persuaded staff from ahigh-performing PHA to temporarily manage a small authority thatunexpectedly lost its executive director. Another field office recruited ahigh-performing PHA to help another one develop a system for inspectingits housing units.
In 1995, HUD reorganized the field offices and changed the responsibilitiesof the staff who oversee and assist PHAs. Before the reorganization, mostfield office staff were generalists and broadly understood federal housingregulations and PHA operations. After the reorganization, however, theresponsibilities of individual field office staff became more specialized tofocus on the rules and regulations of specific public housing operations.1
This specialization confused some staff in field offices and housingauthorities as well as impaired the ability of some field offices to providetechnical assistance. For example, field office staff we visited said thatsome specialists do not have the skills needed to do their jobs becausemany of them did not have the work experience or requisite training forthe specialists’ positions; the staff also noted that HUD had not providedsufficient training for the staff to understand the reorganization and theirnew responsibilities. The staff also said that the reorganization was asource of confusion for PHAs. Before the reorganization, a housingauthority could call one employee at HUD’s field office to answer all itsquestions; afterward, a housing authority generally needed to call severaldifferent staff at HUD’s field office to answer questions.
Adjusting to the reorganization differed across field offices. At one fieldoffice, staff resisted the reorganization because they did not want tobecome specialists and they recognized that technical assistance to the
1The five areas in which field office staff now specialize are finance and budget; marketing, leasing,and management; facilities management; community relations and involvement; and organization,management, and personnel.
GAO/RCED-97-27 Public HousingPage 23

Chapter 2
Although Field Offices Use PHMAP to
Identify Troubled PHAs, Compliance With
Statutory and Agency Follow-Up
Requirements Has Been Limited
PHAs suffered as a result. For example, the staff now disagree over who isresponsible for overseeing certain PHA operations. They also have resistedworking together to provide technical assistance and have not beensharing PHMAP information to develop the best plan for correctingmanagement deficiencies. Other field offices we visited adapted to thereorganization. Staff in these field offices worked cooperatively to build onthe skills of the experienced staff. For example, one field office continuesto assign each housing authority to only one staff member who provides orcoordinates all technical assistance to that authority. The responsible staffmember, however, belongs to a team of staff from all operational areaswho work together to solve each PHA’s problems.
Officials at HUD headquarters, including the Deputy Assistant Secretary forPublic and Assisted Housing Operations, acknowledged that some fieldoffices had difficulty adjusting to the reorganization. They stated thatalthough adequate training was crucial to the reorganization’s success,some field offices either did not seek it or did not take the need for itseriously, despite the availability of training funds for field staff. HUD
officials continue to emphasize the importance and availability of trainingand expect field office management to assess the staff’s skills andexpertise and request the appropriate training. These officials believe thatbecause of limited staff resources, now and in the future, thereorganization is the best way for field offices to provide effectiveoversight and technical assistance to PHAs. Furthermore, they believe thatmanagers of the field offices must take a more active leadership role indirecting their staff to work together.
HUD’s Infrequent Useof Some OversightTools May NotAdequately Improvethe Performance ofPHAs or TargetTechnical Assistance
The act and HUD’s requirements for how field offices use PHMAP provide forseveral tools to guide improvements in a housing authority’s performanceand thereby raise its indicator grades and PHMAP score. These tools includethe memorandums of agreement (MOA), improvement plans, confirmatoryreviews, and the annual independent audits. While such tools as MOAs andimprovement plans generally apply to PHAs designated as troubled orfailing specific indicators, a confirmatory review is mandatory for any PHA
coming off HUD’s troubled list and an independent audit is mandatory forall PHAs. Nonetheless, we found that the compliance of field offices withstatutory requirements and HUD’s guidance for using these tools has beeninadequate and infrequent.
Furthermore, HUD has not determined whether these statutory or agencyrequirements are effective, adequately improve housing authority
GAO/RCED-97-27 Public HousingPage 24

Chapter 2
Although Field Offices Use PHMAP to
Identify Troubled PHAs, Compliance With
Statutory and Agency Follow-Up
Requirements Has Been Limited
performance, or help the field offices better target limited technicalassistance resources. As a result, HUD has little information to determinewhich of these tools best improve a PHA’s performance and which tools itsfield offices can use most effectively to offset their declining resources.
Field Offices Make LimitedUse of Oversight Tools
Over 90 percent of the field offices we surveyed reported that on-site visitsto the housing authorities were one of the most effective means to ensurecompliance with PHMAP requirements and provide technical assistance.Officials at one field office responded that PHAs under its jurisdictionbelieved that on-site visits from HUD staff to provide technical assistancewere essential to maintaining effective operations. Yet, most field officestaff we visited made fewer personal visits to housing authorities than theyfelt were necessary because of limited staff resources and travel funds.Field office staff told us, for example, that their workload has increasedbecause their offices have been unable to replace staff who have left theagency. With less time available for on-site visits, direct monitoring of thePHAs’ performance has occurred less frequently. In addition, some fieldoffice staff said that they could rarely justify to their management usinglimited staff and travel resources to visit a PHA that is more than a 1-daytrip from the office unless that authority’s PHMAP score was below 60.
Memorandums ofAgreement
Although HUD is required by law to enter into MOAs with troubled housingauthorities to improve management performance, few field offices havedone so. Figure 2.1 shows that the percentage of troubled PHAs operatingunder an MOA has been decreasing since 1992. Furthermore, in fiscal year1995, only 3 of HUD’s 32 field offices that had troubled PHAs were fully incompliance with the requirement to enter into an MOA with each troubledauthority.2
2For fiscal year 1995, the 49 field offices responded that a total of 71 housing authorities were troubled,but only 13 had MOAs. However, HUD’s PHMAP database reports 150 housing authorities as troubledin fiscal year 1995. HUD headquarters officials told us that our survey information was probably moreaccurate than its database.
GAO/RCED-97-27 Public HousingPage 25

Chapter 2
Although Field Offices Use PHMAP to
Identify Troubled PHAs, Compliance With
Statutory and Agency Follow-Up
Requirements Has Been Limited
Figure 2.1: Percentage of TroubledPHAs Operating Under a MOA, FiscalYears 1992-95
Percentage of troubled housing authorities
0
10
20
30
40
50
60
70
80
90
100
1992 1993 1994 1995
Fiscal year
29
2320
18
Source: HUD field offices’ responses to GAO’s questionnaire.
The primary reason HUD’s field offices told us that they did not enter intothese required agreements with troubled housing authorities is that thePHAs had already corrected or were in the process of correcting theirmanagement deficiencies. However, HUD headquarters officials told usthey did not accept this as a valid reason for not meeting the requirementand questioned how the field offices could be sure the housing authoritieswere no longer troubled.
Improvement Plans When a PHA fails any of PHMAP’s 12 performance indicators, HUD requiresthe responsible HUD field office to obtain a plan from that PHA forimproving its performance and to track its progress against the plan.However, we found that nearly a third—31 percent—of HUD’s field officeshad not ensured that local housing authorities had developed these plans.We also found examples of PHAs’ plans lacking specific strategies and timeframes for correcting management deficiencies. For example, one PHA’splan for a failing “rents uncollected” indicator simply stated that thehousing authority would start collecting rent. Although field office staffacknowledged that the PHA also needed to update its standard tenant lease
GAO/RCED-97-27 Public HousingPage 26
Chapter 2
Although Field Offices Use PHMAP to
Identify Troubled PHAs, Compliance With
Statutory and Agency Follow-Up
Requirements Has Been Limited
and develop a rent collection policy to improve this indicator grade, theysaid that they had not yet had the time to contact the PHA to revise its plan.
HUD requires its field offices to monitor the progress of housing authoritiesin implementing improvement plans to ensure PHAs meet the quarterly andannual performance targets in their plans. However, four of the five fieldoffices we visited told us they do not follow up with the PHAs to determinethe status of improvement plans or whether the plans had corrected themanagement deficiencies. Field office staff said that they did not have timeto track the effectiveness of the plans because their workloads have beenincreasing due to decreasing numbers of staff.
HUD headquarters officials confirmed that systematic tracking of the fieldoffices’ success in obtaining improvement plans or executing MOAs has notbeen done. They emphasized that responsibility for implementing PHMAP
rests with the field offices and said that limited efforts were underway toensure field offices do more to use these tools and measure theireffectiveness. However, they could not tell us whether troubled PHAswithout MOAs had improved their scores and left the troubled list withoutsuch oversight, nor could they tell us whether improvement plans areinstrumental in improving indicator scores.
Field Offices Confirm FewPHMAP Scores
When a troubled housing authority receives a new PHMAP score that is highenough to remove that designation, HUD requires that the field officeconfirm the score’s accuracy by verifying that the PHA’s improvementshave been effective before removing the troubled designation. However,we found most field offices are not meeting this requirement. In 1995, forexample, HUD’s field offices confirmed less than 30 percent of the scoresthat should have been confirmed. HUD officials acknowledged that theinfrequency of confirmatory reviews by its field offices hampers theprogram’s credibility and integrity. Because it has done so fewconfirmatory reviews, HUD cannot say that most scores are accurate, norcan it say that most troubled PHAs that raised their scores above 60 reallyare no longer troubled. The HUD Inspector General (IG) recently noted thatwithout more confirmatory reviews, the self-reporting nature of PHMAP
creates a temptation for PHAs to manipulate data to raise their scores.3 Infiscal year 1995, 24 of the 49 field offices had housing authorities withPHMAP scores high enough to remove them from HUD’s troubled list, butonly 11 of the 24 field offices performed all or some of the required
3Limited Review of the Public Housing Management Assessment Program (Audit RelatedMemorandum No. 96-PH-101-0801), July 1996, HUD Office of Inspector General.
GAO/RCED-97-27 Public HousingPage 27

Chapter 2
Although Field Offices Use PHMAP to
Identify Troubled PHAs, Compliance With
Statutory and Agency Follow-Up
Requirements Has Been Limited
confirmatory reviews.4 The remaining 13 offices performed none of therequired confirmatory reviews. Nonetheless, some of these same 13 fieldoffices performed discretionary confirmatory reviews of other housingauthorities that had not been classified as troubled. In one case, a fieldoffice had just one housing authority whose new PHMAP score was highenough to remove its troubled designation. Although the field office didnot perform a confirmatory review for that authority until the next fiscalyear, it did complete nine confirmatory reviews of standard- orhigh-performing housing authorities. HUD headquarters officials told usthat although they encourage the field offices to do as many additional,discretionary confirmatory reviews as possible, they expect field offices tocomplete the mandatory reviews first. They also told us that limitedresources kept them from monitoring the performance of field offices onthese reviews.
In addition to the field offices’ lack of compliance with HUD’s requirementfor performing confirmatory reviews, few offices are performingdiscretionary confirmatory reviews. Over the life of the program, HUD hasconfirmed 6.7 percent of all PHMAP scores. Table 2.1 shows that since theprogram began in 1992, HUD has confirmed no more than 8 percent of allPHMAP scores in any given year (see table 2.1).
Table 2.1: PHAs Receiving aConfirmatory Review From a HUDField Office, Fiscal Years 1992-95
1992 1993 1994 1995
Number of PHAssubmittingPHMAPcertifications
2,372 3,071 3,071 3,077
Number ofconfirmatoryreviewscompleted
137 225 241 200
Percentage ofPHAs receiving aconfirmatoryreview
5% 7% 8% 6%
4In fiscal year 1995, a total of 58 PHAs reported new PHMAP scores that would have taken them offHUD’s troubled list. HUD’s field offices confirmed 15 (26 percent) of these 58 PHMAP scores.
GAO/RCED-97-27 Public HousingPage 28

Chapter 2
Although Field Offices Use PHMAP to
Identify Troubled PHAs, Compliance With
Statutory and Agency Follow-Up
Requirements Has Been Limited
To expand on fiscal year 1995 data, nine field offices performed noconfirmatory reviews, over two thirds performed five or fewer, and 4offices performed 10 or more confirmatory reviews (see fig. 2.2).5
Figure 2.2: Number of ConfirmatoryReviews Performed by HUD FieldOffices, Fiscal Year 1995
53% • 1-5 Reviews (26 Field offices)
20%•
6-10 Reviews (10 Field offices)
•
8%>10 Reviews (4 Field offices)
18%•
0 Reviews (9 Field offices)
Source: HUD field offices’ responses to GAO’s questionnaire.
Recognizing that PHMAP scores may not be as accurate as they could orshould be to give the program integrity and credibility, HUD has added newrequirements and begun initiatives to improve the accuracy of the scoresand strengthen the program. HUD currently requires its field offices toconfirm the PHMAP scores of housing authorities whose scores have risento 60 or above, thereby removing them from the troubled list. Recently,HUD formed a team of “expert” field office staff to develop reviewguidelines and to perform confirmatory reviews at selected housing
5HUD’s Oklahoma City Field Office reported having one staff member and performing no confirmatoryreviews in fiscal year 1995. We did not include that office’s response in our analysis, however, becauseits responsibilities for overseeing public housing had been transferred to HUD’s Ft. Worth office afterthe bombing of the Oklahoma City Federal Building.
GAO/RCED-97-27 Public HousingPage 29

Chapter 2
Although Field Offices Use PHMAP to
Identify Troubled PHAs, Compliance With
Statutory and Agency Follow-Up
Requirements Has Been Limited
authorities whose new PHMAP scores meet HUD’s criteria for a mandatoryconfirmatory review. HUD officials expect this team to perform as many as12 confirmatory reviews in 1 year, during which they will focus primarilyon large, high-risk housing authorities.
Field Offices Are Not UsingIndependent Audits to VerifyData Provided by PHAs
In May 1995, HUD expanded the scope of the mandatory annual financialaudits of PHAs to require that auditors review the records underlying aPHA’s self-reported PHMAP data.6 HUD expects the financial audits to verifythat the PHAs’ data are accurate and complete and that the PHAs haveadequate documentation to support their submissions. HUD adopted thisrequirement because the field offices do not have sufficient resources toconfirm each PHA’s score every year. Moreover, HUD officials told us thatfurther departmental downsizing will limit its field offices’ ability toprovide meaningful technical assistance, including confirmatory reviews.As a result, HUD expects that the PHMAP review in the annual audit can helpensure the integrity of housing authorities’ PHMAP data and should be avaluable tool for aiding the field offices to identify those housingauthorities most needing technical assistance.
HUD does not consider the auditors’ analysis to be a confirmatory reviewbecause the auditors do not verify the information HUD maintains in itsinformation system. Furthermore, even though the auditors certify that ahousing authority has documentation to support the data it submitted toHUD, they do not verify that some of the activities reflected in that datawere actually performed by that authority. For example, while the auditorsverify that a PHA has data indicating it has met the requirements for theindicator on conducting annual inspections of all of its housing units andmajor systems (e.g., heating, plumbing, and electrical), the auditors do notverify that those inspections actually took place.
Although the independent audit requirement has been in place sinceMay 1995, few of the staff in the five field offices we visited were aware ofit. Before field offices authorize payment for an annual audit, HUD
headquarters officials said that they expect field offices to review theaudits for quality and completeness and verify that the audits addressed allappropriate areas of the PHAs’ operations, including the PHMAP. However,field office staff said that they had not seen an audit of a housing authority
6Annually, HUD requires and pays for a single financial and compliance audit of every public housingauthority.
GAO/RCED-97-27 Public HousingPage 30

Chapter 2
Although Field Offices Use PHMAP to
Identify Troubled PHAs, Compliance With
Statutory and Agency Follow-Up
Requirements Has Been Limited
that tested the reliability of its PHMAP submission.7 HUD also expects thefield offices to consider significant audit findings in deciding which PHAsneed additional oversight or assistance. HUD officials acknowledged,however, that the independent auditors may need training to betterunderstand HUD’s expectations of them, regulations, and PHMAP system aswell as the operations of PHAs. Similarly, these officials noted that staff inHUD’s field offices need training and guidance in how to better use theannual independent audit.
Conclusions One of the key challenges HUD faces in the coming years is effectivelydownsizing the Department while maintaining the needed level ofoversight at public housing authorities. However, HUD is currently notmaintaining a consistent, minimally acceptable level of oversight at allhousing authorities because of the variance in how field offices interprettheir roles to provide that oversight as well as their lack of systematiccompliance with follow-up requirements. Furthermore, because fieldoffices are not making enough use of the independent audits’ verificationof PHMAP data to target their technical assistance, HUD is not using theresources it has to effectively determine which housing authorities’ scoresare most likely to be inaccurate. As a result, HUD is not ensuring that thehousing authorities most in need of oversight and assistance are receivingit and thereby improving their performance. Continued departmentaldownsizing likely will cause HUD to leverage its existing resources toachieve a minimally acceptable level of oversight. This oversight is neededfor HUD to be reasonably confident that all housing authorities are usingfederal funds appropriately, managing and maintaining their developmentsproperly, and reporting accurately their performance information.
Recommendation To make better use of the limited resources it has to devote to theoversight of public housing, we recommend that HUD provide guidance toits field offices that clearly (1) articulates their minimally acceptable rolesregarding oversight and assistance to housing authorities and(2) emphasizes the importance of using the results of the independentaudits to better target HUD’s limited technical assistance resources.
Agency Comments HUD agreed with our findings regarding oversight of public housingauthorities and stated that it has begun taking steps to address this
7HUD’s IG evaluated some housing authorities’ annual independent audits that included a PHMAPreview. The IG found that the auditors had problems confirming the reliability of the PHMAPsubmissions because the PHAs lacked documentation to support the self-reported indicator grades.
GAO/RCED-97-27 Public HousingPage 31

Chapter 2
Although Field Offices Use PHMAP to
Identify Troubled PHAs, Compliance With
Statutory and Agency Follow-Up
Requirements Has Been Limited
recommendation. These steps include a wide variety of training and otheractivities to (1) explain the revisions HUD is making to PHMAP;(2) reemphasize the need for and importance of statutory and agencyfollow-up requirements, such as memorandums of agreement,improvement plans, and confirmatory reviews; and (3) update HUD’sguidance to its field offices regarding their PHMAP and other oversightresponsibilities.
GAO/RCED-97-27 Public HousingPage 32

Chapter 3
Although PHMAP Scores Have Risen, HUDRecognizes That Flaws in the Program’sDatabase Limit Its Use
According to a HUD database of PHMAP scores, average PHMAP scores haveincreased over the life of the program from an average of 83 in 1992 to 86in 1995 (the last year of complete data). The number of high-performinghousing authorities increased, with more than half of all authoritiesdesignated high performers in 1995, and the number of troubledauthorities decreased. However, the smallest housing authorities—thosewith fewer than 100 units—now make up a greater proportion of thosedesignated troubled than when the program began. During our analysis ofthis database, we found omissions of key data, such as the number of unitsunder a PHA’s management and its performance designation. We also foundinconsistencies between PHMAP scores and the assigned performancedesignations. Notwithstanding these weaknesses, the database representsthe most complete data available on PHA performance over time.
Most PHMAP ScoresAre Increasing andFewer HousingAuthorities AreTroubled
Nationwide, average PHMAP scores generally increased over the 4 years ofthe program for which we analyzed data. By 1995, over half of all publichousing authorities were high performers. Subsequent analysis showedlittle regional variation in how well they scored on PHMAP. While the overallincreases in PHMAP scores held true for all sizes of PHAs, the largest oneshad scores consistently lower than the national average. With averagescores increasing, the number of PHAs with scores low enough for HUD todesignate them as troubled also decreased. The number of troubledauthorities reached 83 in 1995, with half of that total consisting of thesmallest housing authorities (those managing fewer than 100 units).
Average PHMAP ScoresIncreased
The average PHMAP score for all housing authorities rose from about 83 in1992 to 86 in 1995. This increase held true for PHAs of all sizes, althoughlarge PHAs—those with more than 1,250 units—consistently scored lowerthan the national average (see table 3.1). In fiscal year 1995, 151 large PHAsaccounted for approximately 5 percent of all PHAs reporting PHMAP scores,but they operated nearly 60 percent of all public housing units.Consequently, while more PHAs had higher scores, more units were underthe control of PHAs with somewhat lower scores.
GAO/RCED-97-27 Public HousingPage 33

Chapter 3
Although PHMAP Scores Have Risen, HUD
Recognizes That Flaws in the Program’s
Database Limit Its Use
Table 3.1: Average PHMAP Score by PHA Size Category, Fiscal Years 1992-95
1992 1993 1994 1995PHA sizecategory(number ofunits) a
Number ofPHAs
PHMAPscore
Number ofPHAs
PHMAPscore
Number ofPHAs
PHMAPscore
Number ofPHAs
PHMAPscore
No size datab 4 54 4 43 3 41 7 31
1-99 1,453 83 1,471 84 1,481 87 1,488 87
100-499 1,241 83 1,262 85 1,266 88 1,269 87
500-1,249 243 83 242 84 243 86 242 86
1,250 or more 149 78 151 80 151 81 151 83
All sizes 3,090 83 3,130 84 3,144 87 3,157 86aAll size categories were calculated on the number of managed units for fiscal year 1995. HUDdoes not maintain information on the number of units managed in previous years. To the extentthat specific PHAs reduced or increased the number of units under their jurisdiction in previousyears, the current size categories may not represent previous years.
bThe database did not contain size information for these PHAs.
Source: GAO’s analysis of data from HUD’s System for Management Information Retrieval-PublicHousing (SMIRPH) database.
Appendix I provides average PHMAP scores for PHAs for all of HUD’s fieldoffices for fiscal years 1992 through 1995.
The Majority of PHAs WereHigh Performers
By fiscal year 1995, more than half—about 57 percent—of all publichousing authorities were designated as high performers. As shown in table3.2, the number of high performing authorities grew each year, rising from1,033 (33 percent) in 1992 to 1,791 (57 percent) in 1995. Also, by 1995,nearly 50 percent of all public housing units were under the managementof high-performing authorities.
GAO/RCED-97-27 Public HousingPage 34
Chapter 3
Although PHMAP Scores Have Risen, HUD
Recognizes That Flaws in the Program’s
Database Limit Its Use
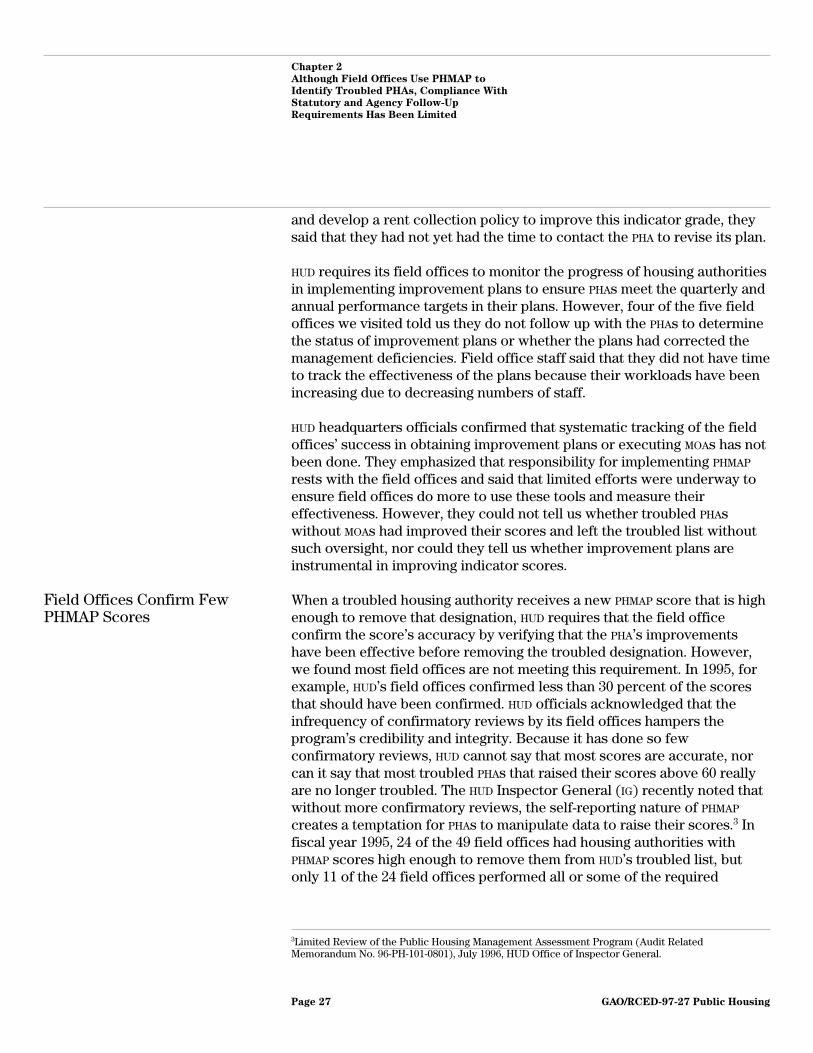
Table 3.2: Number of PHAs by PHMAPPerformance Category, Fiscal Years1992-95 Number of PHAs
Performancecategory(score)
Units (inthousands) a 1992 1993 1994 1995
Troubled (<60) 214 130 118 101 83
Standard(60-<90)
443 1,927 1,719 1,358 1,216
High (90-100) 656 1,033 1,293 1,685 1,791
Allperformancecategories
1,313 3,090 3,130 3,144 3,090
aHUD’s SMIRPH database contains the number of units for only fiscal year 1995.
Source: GAO’s analysis of data from HUD’s SMIRPH database.
Little Variation AmongRegions
Our analysis showed little regional variation in PHMAP scores. The regionaldifferences we found were slightly greater than those associated with thesize of housing authorities, but no region was significantly below thenational average. Likewise, there was little variation among the regions inthe percentage of troubled PHAs under their jurisdiction. For example, infiscal year 1995, 5 percent of all PHAs nationwide were troubled, but withinthe 10 regions we analyzed, the percentage of troubled housing authoritiesranged from 2 to 9 percent.
Appendixes I-IV provide detailed information on average PHMAP scores aswell as the number of troubled, standard- and high-performing PHAs,respectively, for each HUD field office.
PHAs Consistently FailedSome Indicators
Despite some improvement in overall scores, some indicators were moreproblematic for PHAs than others. As shown in table 3.3, with the exceptionof 1 year, PHAs consistently had the most difficulty with the energyconsumption indicator—which had the highest failure rate for 1992, 1994,and 1995.1 Similarly, the indicators for unit turnaround, tenants accountsreceivable, and operating expenses proved troublesome, with 10 percentor more of all PHAs failing them in 1995.
1This indicator measures the annual increase in the housing authority’s energy consumption. Housingauthorities with no increase from year to year receive an A for the indicator; those whose consumptionincreases receive lower grades. In commenting on this report, HUD officials noted that in some casesfailing this indicator was related less to PHA performance than to such conditions as regional weathervariations or an inappropriate baseline to measure this indicator.
GAO/RCED-97-27 Public HousingPage 35

Chapter 3
Although PHMAP Scores Have Risen, HUD
Recognizes That Flaws in the Program’s
Database Limit Its Use
Table 3.3: Failed Indicators byPercentage of PHAs, Fiscal Years1992-95
Percentage of PHAs that failed
PHMAP indicator 1992 1993 1994 1995
1. Vacancynumber andpercentage
5.5 4.2 3.6 2.9
2. Modernization 1.9 1.4 1.4 1.5
3. Rentsuncollected
4.1 3.1 3.0 2.2
4. Energyconsumption
18.0 12.4 14.3 15.3
5. Unit turnaround 16.4 13.6 12.9 11.2
6. Outstandingworkorders
3.6 2.1 2.4 1.7
7. Annualinspection andcondition of unitsand systems
2.2 2.3 2.1 1.9
8. Tenantsaccountsreceivable
16.9 15.2 14.2 12.8
9. Operatingreserves
6.3 5.8 4.8 7.4
10. Routineoperatingexpenses
11.2 10.8 10.1 10.0
11. Residentinitiatives
13.4 26.7 11.0 5.9
12. Development 8.5 6.2 6.2 3.0
Source: GAO’s analysis of data from HUD’s SMIRPH database.
A HUD official explained that the high failure rate in 1993 for the indicatormeasuring resident initiatives occurred because the PHAs were not payingattention to this indicator. In 1992, all PHAs received an automatic “C” forthis indicator because HUD had not provided enough information on therequirements for grades “A” through “F” until after the assessment periodstarted. This official said that many PHAs assumed they would receive anautomatic “C” the next year as well, even though HUD had stated in 1992that the automatic grade was a one-time occurrence. This official addedthat most field offices followed up by providing technical assistance to thePHAs with failing grades and were able to resolve the problems in thefollowing year. This appears to be supported by the decline of the failurerate over the following 2 years to less than 6 percent in 1995.
GAO/RCED-97-27 Public HousingPage 36

Chapter 3
Although PHMAP Scores Have Risen, HUD
Recognizes That Flaws in the Program’s
Database Limit Its Use
Smaller PHAs Were MoreLikely to Be Troubled
While the total number of troubled housing authorities declined—130 weretroubled in 1992 compared to 83 in 1995—more of those PHAs wereconcentrated among the smallest housing authorities than when theprogram began. The percentage of troubled PHAs that weresmall—managing fewer than 100 units each—grew from 32 percent of alltroubled authorities in 1992 to 49 percent in 1995 (see fig. 3.1).
Figure 3.1: Number of Troubled PHAsby Size, Fiscal Years 1992-95 Number of troubled PHAs
0
5
10
15
20
25
30
35
40
45
50
55
60
65
70
1992 1993 1994 1995
1-99 units
100-499 units
500-1,249 units
1,250 or more units
Note: For each fiscal year, the figures exclude six or fewer PHAs for which there was noinformation on size in HUD’s database.
Source: HUD’s SMIRPH database.
HUD RecognizesDatabase Flaws andPlans Corrections
We found missing, inaccurate, and inconsistent data in HUD’s SMIRPH
database, the primary database for storing PHMAP scores. A HUD officialattributed these problems to data input problems at the field offices.Although HUD headquarters makes regular, periodic use of this database, it
GAO/RCED-97-27 Public HousingPage 37

Chapter 3
Although PHMAP Scores Have Risen, HUD
Recognizes That Flaws in the Program’s
Database Limit Its Use
must also manually verify much of the information before providing it toHUD’s Secretary, Members of Congress, and others. HUD’s General DeputyAssistant Secretary for Public and Indian Housing acknowledged that theSMIRPH database, as currently implemented, does not produce a complete,accurate list of troubled PHAs and that HUD is in the process of making itmore reliable and useful.
We found that the number of troubled authorities (150) for fiscal year 1995that we derived from the database was inaccurate when we compared it tothe number reported (83) as of December 20, 1995, by HUD’s ManagementAssessment Coordinator. We also found performance designations thatwere inconsistent with PHMAP scores. In 1995, for the 150 PHAs we found tobe troubled, HUD had designated 42 as high performers, 7 as standard, and51 had no designation. Among high-performing PHAs in 1995, of the 1,791PHAs that we found that had PHMAP scores of 90 or higher, HUD haddesignated one as troubled, 43 as standard, and 325 had no performancedesignation. We also found some omissions in the database. Data, such asthe number of units and performance designations, had not been enteredfor all PHAs. For example, we found that the database did not have sizeinformation on 18 PHAs from fiscal years 1992 through 1995. We also foundthat no designations had been entered for 132 PHAs with scores less than60 and 1,037 PHAs with scores 90 or higher.
HUD’s Management Assessment Coordinator stated that these problemswith missing, inaccurate, and inconsistent data occurred because fieldoffices either (1) did not enter the information at all or (2) entered itincorrectly. These instances of inconsistent or missing data suggest thatbasic system safeguards do not exist to prevent field offices from makingthese data entry errors or omitting essential PHMAP data.
While HUD officials who oversee PHMAP and the Department’s field officesacknowledged problems with the database, they added that the program’sredesign includes changes that will address the problems with dataaccuracy and reliability. HUD officials told us they plan to changeprocedures for entering information on PHAs into the database to allowfield offices to update PHA data on a real-time basis and to make immediatecorrections when they find errors or omissions. These procedural changeswill also enable HUD headquarters staff to access field office data directlyand allow ongoing reviews of the information for accuracy andcompleteness. HUD officials also believe that the changes will increasecontrol over the information from the field offices and help ensure that theinformation in the SMIRPH database is accurate.
GAO/RCED-97-27 Public HousingPage 38

Chapter 3
Although PHMAP Scores Have Risen, HUD
Recognizes That Flaws in the Program’s
Database Limit Its Use
Agency Comments HUD expressed concern that our draft report used data from the SMIRPH
database that HUD had not verified for accuracy. HUD noted that it ismaking changes to the database that will improve headquarters’ ability tofind and correct data errors that have been entered by staff at its fieldoffices.
To address HUD’s concern that we used inaccurate, unverified data from itsdatabase to analyze PHMAP data on housing authorities’ scores by size andregion, we recalculated the number of troubled housing authorities by sizecategory for 1995 using data HUD verified with its field offices; we alsomodified this report to reflect a more accurate and lower number oftroubled housing authorities in 1995. Recalculating the number of troubledauthorities by size did not change our conclusion that a greater proportionof the authorities that HUD verified as being troubled are those with fewerthan 100 units. In fact, while HUD’s database indicates that 44 percent oftroubled authorities in 1995 were small, HUD’s verified list of troubledauthorities indicates 49 percent were small. Furthermore, although HUD
officials told us that a manually-verified list of troubled authorities for1992 was not available, they agreed with our conclusion that the smallesthousing authorities make up a greater proportion of troubled housingauthorities in 1995 than in 1992.
Because our draft report presented no analysis of data on a regional basis(only data as drawn from HUD’s database) and because we draw noconclusions in that regard in this report, we have retained appendixes I-IV,which show average PHMAP scores and the number of troubled, standard,and high-performers in HUD’s regions. Where HUD provided us withmanually verified data—particularly in appendix II showing troubledauthorities—we have modified the appendixes to reflect the moreaccurate data.
GAO/RCED-97-27 Public HousingPage 39

Chapter 4
The Questionable Accuracy of PHMAP’sScores and the Program’s Validity Limit ItsUsefulness
Our review and those of others indicate that PHMAP scores are ofteninaccurate, imprecise, and must be changed when HUD verifies the datathat public housing authorities have submitted to support their scores.Furthermore, professional property managers and others in the publichousing industry question whether PHMAP can capture all aspects ofmanagement operations. Although HUD has taken some steps to helpensure that future scores are more accurate than they have been over theprogram’s first 4 years, these steps will be resource-intensive and do notaddress all of the program’s limitations. In the past, both HUD and theCongress have proposed additional uses for PHMAP, such as deregulatingand awarding bonuses to PHAs with high PHMAP scores. However, untilgreater confidence exists that individual scores are accurate and HUD
brings greater validity to PHMAP as a comprehensive measure ofmanagement operations, such additional uses for the program may not beappropriate.
Accuracy of Scoresand Validity as aManagementAssessment ToolLimit Uses for PHMAP
After performing on-site reviews of selected PHAs to confirm the accuracyof their PHMAP scores, HUD’s field offices changed half of the scores. Incommenting on this report, HUD indicated that most confirmatory reviewsinvolved high-risk PHAs, whose PHMAP data have been most susceptible tobeing found inaccurate. In similar reviews, HUD’s independent assessmentcontractors as well as HUD’s IG found that many scores or grades forspecific indicators were inaccurate. To better identify PHAs that needoversight and technical assistance, HUD staff often supplement theirdecision-making with other measures of management problems to get amore complete picture of an authority’s performance. Professionalproperty managers and industry representatives agreed that moreinformation is needed than PHMAP provides to give a complete picture ofhow well a PHA’s management is performing.
After ConfirmatoryReviews, PHMAP ScoresChange Significantly
After performing confirmatory reviews of 200 PHAs in fiscal year 1995,HUD’s 49 field offices changed 98 PHMAP scores (see table 4.1).
GAO/RCED-97-27 Public HousingPage 40

Chapter 4
The Questionable Accuracy of PHMAP’s
Scores and the Program’s Validity Limit Its
Usefulness
Table 4.1: Changes in PHMAP ScoresAfter HUD’s Field Offices PerformedConfirmatory Reviews in Fiscal Year1995
Change inPHMAP score
Number of housingauthorities
(percentage of total)Average change
in points
No change 96 (49) 0
Scores lowered 57 (29) –14
Scores raised 41 (21) +8
Note: The field offices had not reported the final PHMAP scores for 6 out of the 200 confirmatoryreviews because the reviews’ results were being finalized at the time the offices responded to ourquestionnaire. As a result, this table reflects results from 194 of the 200 confirmatory reviewsperformed in fiscal year 1995.
In several cases, the changes HUD made to PHMAP scores also meant HUD
would have to change the performance designation of those PHAs. Forexample, HUD
• lowered the scores of 14 PHAs enough to designate them as troubled,• raised the scores of 4 troubled PHAs to 60 points or higher, and• raised the scores of 10 standard-performing PHAs to 90 or higher.
Both of HUD’s independent assessment contractors as well as HUD’s IG havereviewed PHMAP data to confirm the accuracy of PHAs’ scores. For example,in 1993, the IG confirmed the scores of 12 housing authorities. As a resultof this review, the IG concluded that the PHMAP scores for 9 of the 12 PHAsshould be lowered because 3 of them fell below 60, a score which shouldhave warranted the troubled designation. In a second report on PHMAP, theIG reported that six of HUD’s field offices reduced over half of the scoresthey reviewed. Similarly, one of HUD’s independent assessment contractorsreported that for the 30 assessments it has performed at troubled housingauthorities, it found 21 indicator grades and/or PHMAP scores that wereinaccurate. Over 50 percent of the contractor’s assessments resulted inlowering the indicator grades to an “F.” The contractor most often loweredthe indicators used to measure outstanding workorders and annualinspections of housing conditions and systems.
Several reasons explain why HUD and others changed so many PHMAP
scores after performing a confirmatory review. Some field office staff saidthese scores changed because the PHAs did not understand all therequirements of PHMAP and therefore misreported their data. They also toldus that PHMAP is particularly difficult for smaller housing authorities whoselimited staff can find HUD’s paperwork requirements overwhelming.
GAO/RCED-97-27 Public HousingPage 41

Chapter 4
The Questionable Accuracy of PHMAP’s
Scores and the Program’s Validity Limit Its
Usefulness
HUD staff do not believe many PHAs intentionally try to deceive theDepartment by reporting false PHMAP information. Instead, they, as well asthe contractor staff, said that the PHAs often have insufficientdocumentation to support the data they must submit to the field offices ordo not understand how HUD wants them to report the information. Forexample, while a PHA may report the average number of days their housingunits have been vacant, the PHA may not have the tenant files to documentwhen the previous tenants moved out and when the new tenants’ leasestook effect. Without supporting documentation or evidence of a system totrack unit turnaround, HUD assigns an “F” to this indicator. Similarly, a PHA
may be providing support programs for its residents, but fail to understandthat its board of commissioners must approve those programs to receive apassing grade on PHMAP’s indicator for resident initiatives. Typically, whenHUD’s field office staff find examples, such as these, during a confirmatoryreview, they use the correct data to recalculate the housing authority’sgrade for each of the affected indicators.
HUD and IndustryProfessionals SupplementPHMAP With AdditionalFactors to EvaluateManagement Performance
HUD’s field office staff did not use PHMAP alone to assess the managementperformance of its public housing authorities. Although they agreed thatPHMAP accurately identifies troubled authorities, several staff said that theyconsider other factors besides PHMAP indicators to supplement theirdecision-making for the other authorities they oversee. They said thatsome PHAs with scores over 90 have management problems that theprogram’s indicators do not measure. Other factors used by some HUD staffto identify the potential for management problems at standard- andhigh-performing authorities include
• the failure of a PHA to implement consistent and effective operatingpolicies and procedures,
• the frequency of changes in the executive leadership and the continuedinterference into a PHA’s daily operations by its board of commissioners,
• the number and the type of telephone calls received from a PHA’s residentsand staff, and
• any adverse news stories about a PHA.
Staff at the five field offices we visited said that they believed somehousing authorities with high PHMAP scores were not operating theirhousing programs efficiently or effectively. These field offices differed,however, in how they treated those PHAs. Staff at two field offices told usthat although they use the scores to determine which PHAs need on-site
GAO/RCED-97-27 Public HousingPage 42

Chapter 4
The Questionable Accuracy of PHMAP’s
Scores and the Program’s Validity Limit Its
Usefulness
reviews, they would not let a high score prevent them from visiting anauthority they believed had serious management problems.
The HUD IG also questioned whether or not PHMAP scores accuratelymeasure the management performance of public housing authorities. TheIG’s reviews of high- and standard-performing PHAs found instances offraud and program abuse. For example, the IG reported that the executivedirector of a high-performing PHA had charged over $62,000 in ineligibleexpenses, including excessive compensatory time, unsupported travelcosts, and health and insurance benefits for his divorced spouse. AnotherPHA executive director falsified PHMAP data to obtain a high-performingdesignation. After reviewing the operations of a standard-performing PHA,the IG also cited numerous program abuses and mismanagement. The IGconcluded that although PHMAP could be a useful tool to assess PHAs, theprogram was too unreliable for HUD to make oversight decisions.
Other public housing professionals—property managers and thoserepresenting industry associations—agreed that more information isneeded than PHMAP provides to give a complete picture of how well a PHA ismanaged. For example, they noted that PHMAP does not automaticallyinclude an on-site observation and inspection of a PHA’s housingdevelopments. One association noted that while a PHA could improve itsPHMAP score by simply writing off more past due rents from former tenantsas uncollectible to improve its grade on the indicator for rents uncollected,its PHMAP score would not measure how diligent an effort it hadundertaken to collect the rent. Another industry association official knewof several examples of PHAs that were making good property managementdecisions, such as choosing to perform deferred maintenance when a unitbecame vacant rather than rent it immediately, that ironically led to lowerPHMAP scores. Citing a similar situation, HUD has agreed that occasionallythe best decision for a PHA is to take an action that yields a lower PHMAP
score, and that the score should not be the sole driving force influencing aPHA’s decisions.
The Congress andHUD Have Proposedto Use PHMAP as aBasis for Deregulationand Funding Bonuses
While HUD’s primary use of PHMAP has been to identify troubled housingauthorities and target technical assistance to them, the Congress and HUD
have proposed to use this program for other purposes. In 1994, the SenateCommittee on Banking, Housing, and Urban Affairs proposed somederegulation and additional flexibility for those authorities that hadachieved PHMAP scores of 90 or above. In addition, in its fiscal year 1997budget request, HUD proposed to give high-performing PHAs bonuses based
GAO/RCED-97-27 Public HousingPage 43

Chapter 4
The Questionable Accuracy of PHMAP’s
Scores and the Program’s Validity Limit Its
Usefulness
in part on their PHMAP scores. Because PHMAP scores do not alwaysmeasure the true management performance of the PHAs, the benefits ofthese proposals need to be weighed against the possibility of grantingundeserved flexibility and awards.
To encourage individual PHAs to be more innovative, the BankingCommittee proposed limited deregulation and additional flexibility forhigh-performing PHAs in two ways. First, it proposed permitting a PHA thatgenerates income over a certain level to exclude that income fromcalculations of its need for a subsidy from HUD to operate and manage itsproperties.1 At that time, each dollar of extra income that a PHA generatedreduced its subsidy by a dollar, thereby creating a disincentive to generateadditional income from sources other than rent. Second, the Committeeproposed to waive all but a few key regulations—such asnondiscrimination, equal opportunity, and tenant income eligibility—sohigh-performing PHAs could have more flexibility to bring innovativesolutions to local problems and achieve more efficient operations.
In its fiscal year 1997 budget request, HUD proposed to award $500 millionto high-performing PHAs as bonuses based, in part, on their PHMAP scores.As we reported in our testimony in June 1996 and as we found in thecourse of our work on this report, HUD does not confirm the scores of highperformers and generally accepts them.2 In our June 1996 testimony, werecommended that the Congress consider not appropriating the bonusfunding until HUD develops adequate performance measures andsupporting information systems. The HUD appropriations bill which theCongress approved and the President signed did not contain funding forperformance bonuses.
The three associations representing the public housing industry and theprofessional property managers that we interviewed all opposed or hadstrong reservations about using PHMAP scores for purposes other thanidentifying troubled housing authorities and targeting technical assistanceto them. They also believed that other uses would be inappropriatebecause of the limited number of confirmatory reviews the field officesperform and the proportion of PHMAP scores that have been changed after areview. Two of the associations did not believe that PHMAP scores
1Housing authorities receive operating subsidies from HUD each year to make up the differencebetween the rent they are allowed to charge their tenants and the expected costs of operating theirdevelopments.
2Housing and Urban Development: Comments on HUD’s FY 1997 Budget Request(GAO/T-RCED-96-205, June 17, 1996).
GAO/RCED-97-27 Public HousingPage 44

Chapter 4
The Questionable Accuracy of PHMAP’s
Scores and the Program’s Validity Limit Its
Usefulness
adequately measured the management performance of housing authoritiesbecause they thought some PHAs that received high scores did not providetheir residents with decent, safe housing. The professional propertymanagement firm that independently verified some scores also agreed thatthe usefulness of these scores is limited. Because this firm hasrecommended lowering many scores after an independent assessment, thefirm lacks confidence in the scores’ accuracy and does not believe that theprogram provides enough information about the managementperformance of PHAs for HUD to make effective funding decisions.
Conclusions In recent years, both the Congress and HUD have proposed additional usesfor PHMAP, such as bonuses to reward those housing authorities with thehighest scores. While PHMAP has provided a quantifiable means to assessthe management performance of housing authorities, the scores are notsufficiently accurate for detailed comparisons of performance. AlthoughHUD is currently working to enhance the accuracy of these scores, they donot yet provide a comprehensive, generally accepted way to assess theperformance of PHAs. To be useful for other purposes, not only wouldthese scores have to be more accurate, but the program would have to beexpanded to provide a more comprehensive measure of public housingauthorities’ management operations.
Because HUD does not frequently confirm most scores—confirmatoryreviews have focused on troubled PHAs—HUD does not know how manyauthorities are not receiving the proper designation. When HUD doesconfirm scores, it changes half of them—and more than half of thesechanges result in HUD’s lowering the score. We found that when HUD lowersa PHMAP score, it does so by an average of 14 points. If this average changeheld true for housing authorities in general, then HUD may not be properlydesignating as troubled those authorities currently scoring between 60 andthe low 70s whose scores should be lower. As a result, those authoritiesare not receiving the oversight and technical assistance HUD should beproviding to improve their performance.
Recommendations We recommend that until it establishes a cost-effective means to ensureconsistently accurate scores, HUD should
• not consider additional uses for PHMAP, including using its scores ascriteria for funding bonuses, until it determines that PHMAP meets an
GAO/RCED-97-27 Public HousingPage 45

Chapter 4
The Questionable Accuracy of PHMAP’s
Scores and the Program’s Validity Limit Its
Usefulness
acceptable level of accuracy and more comprehensively measuresproperty management performance and
• require its field offices to confirm the PHMAP scores of housing authoritieswith scores low enough that they are at risk of being designated troubled.
Agency Comments HUD agreed with our findings and recommendations. When we met withHUD officials, including the General Deputy Assistant Secretary for Publicand Indian Housing, to discuss a draft of this report, they told us that theDepartment is no longer considering additional uses for PHMAP, such asusing scores as criteria for funding bonuses. Even in the absence of usingPHMAP for such purposes, we believe that it is important that HUD works toensure scores are more consistently accurate and have, therefore, retainedthis recommendation. HUD has begun taking steps to address ourrecommendation that it confirm PHMAP scores of those housing authoritiesthat are at risk of being designated troubled but expressed concern that itmay not have sufficient resources to fully implement thisrecommendation.
HUD expressed three concerns relating to the information and conclusionspresented in this chapter of our report. HUD believed that this chapter(1) assumes that PHMAP was intended to be an all-inclusive assessmentsystem for property management, (2) does not place PHMAP in a historicalperspective, and (3) reaches incorrect conclusions regarding the overallreliability of PHMAP scores.
We do not believe that we characterize PHMAP’s purpose as being anall-inclusive measure of property management. Our discussion of theprogram does not state that this is the purpose of PHMAP. Rather, the reportdiscusses how the program’s limitations—including its intentional designnot to be a complete performance measure—affect its suitability foradditional purposes, such as those proposed in recent years by HUD andthe Congress. HUD agreed that there is a perception that PHMAP is anall-encompassing system to assess the performance of PHAs and stated it istaking steps to address this misperception. Seeking to clarify theprogram’s purpose, HUD added language to its recently revised interimPHMAP rule (published in the December 30, 1996, Federal Register), that theprogram’s indicators reflect performance in only specific areas.
HUD correctly states that this report does not provide a historicalperspective of PHMAP by discussing previous HUD systems for assessing andidentifying troubled housing authorities. We believe that such information
GAO/RCED-97-27 Public HousingPage 46

Chapter 4
The Questionable Accuracy of PHMAP’s
Scores and the Program’s Validity Limit Its
Usefulness
would not contribute substantially to our report’s three objectives toevaluate HUD’s use of the current program, provide trends in PHMAP scoresfrom fiscal years 1992 through 1995, and discuss limitations in theprogram’s design and implementation that affect its usefulness forpurposes other than identifying troubled housing authorities and targetingassistance to them. Therefore, we have not added the historicalinformation HUD suggested to the report.
Finally, HUD is concerned that we have incorrectly reached conclusionsabout the reliability of all PHMAP scores based on the results ofconfirmatory reviews of high-risk authorities. HUD noted that the accuracyof the scores of these PHAs does not necessarily represent the accuracy ofall PHMAP scores because the data provided by these PHAs are mostsusceptible to being inaccurate. Our report did not reach a conclusionabout the reliability of all housing authorities’ scores because of thechanges that resulted from confirmatory reviews. This report discusses thereliability of PHMAP scores for housing authorities whose scores are lowenough that they may be at risk of being designated troubled. We haveadded language to the report to clarify this point.
GAO/RCED-97-27 Public HousingPage 47

Appendix I
Average PHMAP Score by GeographicRegion, Fiscal Years 1992-95
Average PHMAP score
Region 1992 1993 1994 1995
Great Plains 82.2 83.1 86.9 82.9
Des Moines 84.4 82.3 88.9 92.1
Kansas City 81.7 81.5 86.9 88.3
Omaha 84.0 88.4 88.3 90.4
St. Louis 78.9 78.7 83.6 53.1
Mid-Atlantic 80.1 81.3 83.1 85.7
Baltimore 81.8 84.3 82.8 84.8
Charleston 76.0 79.7 82.2 86.1
Philadelphia 80.9 81.4 85.9 87.4
Pittsburgh 80.1 80.5 81.3 83.2
Richmond 84.5 84.7 84.2 88.7
District of Columbia 72.5 71.7 73.9 76.3
Midwest 83.6 86.1 88.8 88.9
Chicago 75.4 77.2 82.9 83.9
Cincinnati 77.6 78.8 84.8 87.1
Cleveland 77.9 80.8 83.9 85.5
Columbus 80.7 85.1 86.3 90.7
Detroit 82.4 84.0 87.6 87.9
Grand Rapids 85.5 86.3 91.2 90.2
Indianapolis 82.6 87.3 89.6 89.5
Milwaukee 90.2 92.5 93.1 91.5
Minneapolis 86.5 90.1 90.6 90.7
Northwest/Alaska 89.9 92.9 92.9 92.6
Anchorage 77.8 86.1 94.9 99.2
Portland 90.6 93.9 94.1 95.4
Seattle 89.6 92.0 91.4 89.4
New York/New Jersey 81.8 84.9 88.2 89.7
Buffalo 84.6 86.9 90.0 91.2
New York 79.6 85.0 83.4 90.5
Newark 80.9 83.7 88.9 88.4
New England 83.4 85.3 89.3 89.2
Boston 83.6 82.9 88.0 90.4
Hartford 74.4 76.9 83.7 78.3
Manchester 91.9 94.1 95.1 94.0
Providence 79.9 87.3 89.9 92.4
(continued)
GAO/RCED-97-27 Public HousingPage 48

Appendix I
Average PHMAP Score by Geographic
Region, Fiscal Years 1992-95
Average PHMAP score
Region 1992 1993 1994 1995
Pacific/Hawaii 85.4 85.4 86.9 87.2
Honolulu 81.5 68.9 73.8 70.6
Los Angeles 89.1 90.0 90.4 91.0
Phoenix 85.4 83.3 88.2 83.8
Sacramento 86.1 81.9 75.5 85.5
San Francisco 82.9 84.9 87.4 87.7
Rocky Mountains 87.8 87.9 86.8 91.5
Denver 87.8 87.9 86.8 91.5
Southeast/Caribbean 82.9 85.4 87.9 84.6
Atlanta 81.7 83.7 85.5 87.9
Birmingham 85.8 87.3 89.7 90.8
Columbia 84.2 86.5 91.7 94.0
Greensboro 82.5 85.6 88.8 89.9
Jackson 82.6 86.6 86.4 87.4
Jacksonville 79.6 83.3 86.0 83.3
Louisville 86.9 88.4 91.0 60.6
Knoxville 85.4 87.7 91.9 90.1
Nashville 77.1 82.4 85.4 85.3
Caribbean 44.5 36.7 48.2 32.0
Southwest 80.3 80.8 84.0 85.7
Albuquerque 74.8 70.4 72.7 83.7
Beaumont 79.1 78.4 83.7 84.1
Ft. Worth 80.5 79.5 82.9 85.9
Houston 80.1 78.3 80.8 82.7
Little Rock 86.3 90.5 91.6 91.5
New Orleans 76.5 78.6 81.3 79.5
Oklahoma City 80.0 81.1 84.0 86.1
San Antonio 79.8 79.9 85.5 87.0
Source: GAO’s analysis of data from the Department of Housing and Urban Development’s (HUD)System for Management Information Retrieval-Public Housing (SMIRPH) database.
GAO/RCED-97-27 Public HousingPage 49

Appendix II
Number of Troubled PHAs by GeographicRegion, Fiscal Years 1992-95
Number of troubled PHAs
Region 1992 1993 1994 1995
Great Plains 10 13 12 7
Des Moines 1 3 1 1
Kansas City 1 3 5 2
Omaha 0 1 1 1
St. Louis 8 6 5 3
Mid-Atlantic 7 7 11 6
Baltimore 0 0 1 0
Charleston 1 0 0 0
Philadelphia 2 2 4 3
Pittsburgh 2 3 4 2
Richmond 1 1 1 0
District of Columbia 1 1 1 1
Midwest 24 16 12 12
Chicago 12 10 7 5
Cincinnati 1 0 0 0
Cleveland 2 0 1 1
Columbus 0 0 0 0
Detroit 4 5 3 2
Grand Rapids 1 0 0 0
Indianapolis 2 0 0 2
Milwaukee 0 0 0 1
Minneapolis 2 1 1 1
Northwest/Alaska 0 0 0 1
Anchorage 0 0 0 0
Portland 0 0 0 0
Seattle 0 0 0 1
New York/New Jersey 10 5 6 3
Buffalo 0 1 1 0
New York 4 2 3 1
Newark 6 2 2 2
New England 12 5 2 5
Boston 2 0 0 0
Hartford 7 5 2 4
Manchester 0 0 0 1
Providence 3 0 0 0
(continued)
GAO/RCED-97-27 Public HousingPage 50

Appendix II
Number of Troubled PHAs by Geographic
Region, Fiscal Years 1992-95
Number of troubled PHAs
Region 1992 1993 1994 1995
Pacific/Hawaii 2 2 2 4
Honolulu 0 0 0 0
Los Angeles 0 0 0 0
Phoenix 1 1 1 2
Sacramento 0 0 0 0
San Francisco 1 1 1 2
Rocky Mountains 2 4 8 0
Denver 2 4 8 0
Southeast/Caribbean 30 30 19 58
Atlanta 9 12 7 5
Birmingham 1 1 0 0
Columbia 2 2 0 0
Greensboro 3 3 0 1
Jackson 2 0 1 1
Jacksonville 2 4 3 3
Louisville 2 1 2 1
Knoxville 0 0 0 1
Nashville 7 4 4 2
Caribbean 2 1 1 1
Southwest 33 36 29 28
Albuquerque 4 9 8 3
Beaumont 3 4 0 1
Ft. Worth 7 7 8 6
Houston 1 1 0 1
Little Rock 3 1 0 1
New Orleans 12 7 9 12
Oklahoma City 1 1 0 0
San Antonio 2 6 4 4
All regions 130 118 101 150
Source: GAO’s analysis of data from HUD’s SMIRPH database.
GAO/RCED-97-27 Public HousingPage 51

Appendix III
Number of Standard-Performing PHAs byGeographic Region, Fiscal Years 1992-95
Number of standard-performing PHAs
Region 1992 1993 1994 1995
Great Plains 235 213 157 141
Des Moines 30 31 18 12
Kansas City 99 95 62 60
Omaha 67 47 40 34
St. Louis 39 40 37 35
Mid-Atlantic 121 115 89 78
Baltimore 15 13 12 13
Charleston 25 25 22 20
Philadelphia 36 33 17 11
Pittsburgh 26 27 20 18
Richmond 13 12 13 11
District of Columbia 6 5 5 5
Midwest 304 246 215 205
Chicago 73 67 61 61
Cincinnati 6 6 6 4
Cleveland 12 13 9 9
Columbus 22 12 13 9
Detroit 24 19 19 17
Grand Rapids 44 40 23 28
Indianapolis 27 20 17 13
Milwaukee 36 30 24 24
Minneapolis 60 39 43 40
Northwest/Alaska 24 13 10 10
Anchorage 1 1 0 0
Portland 11 5 4 3
Seattle 12 7 6 7
New York/New Jersey 107 93 67 54
Buffalo 31 28 19 15
New York 18 15 14 6
Newark 58 50 34 33
New England 88 84 61 51
Boston 40 49 31 22
Hartford 21 17 15 18
Manchester 10 5 4 4
Providence 17 13 11 7
(continued)
GAO/RCED-97-27 Public HousingPage 52

Appendix III
Number of Standard-Performing PHAs by
Geographic Region, Fiscal Years 1992-95
Number of standard-performing PHAs
Region 1992 1993 1994 1995
Pacific/Hawaii 42 46 31 27
Honolulu 2 2 2 2
Los Angeles 8 9 9 8
Phoenix 8 8 4 3
Sacramento 4 7 6 3
San Francisco 20 20 10 11
Rocky Mountains 49 44 31 35
Denver 49 44 31 35
Southeast/Caribbean 459 421 334 310
Atlanta 110 110 103 94
Birmingham 80 73 60 49
Columbia 19 19 9 7
Greensboro 63 58 43 31
Jackson 30 27 25 25
Jacksonville 49 37 36 47
Louisville 52 46 23 20
Knoxville 22 18 9 9
Nashville 34 32 25 27
Caribbean 0 1 1 1
Southwest 497 445 363 331
Albuquerque 26 18 17 18
Beaumont 56 55 48 42
Ft. Worth 130 128 97 86
Houston 16 16 16 11
Little Rock 56 39 28 31
New Orleans 69 62 54 53
Oklahoma City 78 74 65 51
San Antonio 66 53 38 39
All regions 1,927 1,719 1,358 1,242
Source: GAO’s analysis of data from HUD’s SMIRPH database.
GAO/RCED-97-27 Public HousingPage 53

Appendix IV
Number of High-Performing PHAs byGeographic Region, Fiscal Years 1992-95
Number of high-performing PHAs
Region 1992 1993 1994 1995
Great Plains 102 122 179 200
Des Moines 18 15 30 36
Kansas City 36 39 70 75
Omaha 31 50 57 63
St. Louis 17 18 22 26
Mid-Atlantic 42 48 74 90
Baltimore 3 5 6 6
Charleston 6 7 10 12
Philadelphia 12 15 30 37
Pittsburgh 8 6 13 17
Richmond 12 14 13 16
District of Columbia 1 1 2 2
Midwest 200 266 303 316
Chicago 13 21 30 34
Cincinnati 2 3 3 5
Cleveland 5 6 9 9
Columbus 2 12 11 15‘
Detroit 18 23 25 28
Grand Rapids 31‘ 36 53 48
Indianapolis 12 21 24 26
Milwaukee 59 65 71 71
Minneapolis 58 79 77 80
Northwest/Alaska 34 45 48 47
Anchorage 0 0 1 1
Portland 18 24 25 26
Seattle 16 21 22 20
New York/New Jersey 46 65 90 106
Buffalo 20 22 31 36
New York 10 15 15 25
Newark 16 28 44 45
New England 67 78 102 112
Boston 24 17 34 44
Hartford 5 11 15 12
Manchester 33 38 39 38
Providence 5 12 14 18
(continued)
GAO/RCED-97-27 Public HousingPage 54

Appendix IV
Number of High-Performing PHAs by
Geographic Region, Fiscal Years 1992-95
Number of high-performing PHAs
Region 1992 1993 1994 1995
Pacific/Hawaii 35 31 46 49
Honolulu 0 0 0 0
Los Angeles 14 13 13 14
Phoenix 6 6 10 11
Sacramento 3 0 1 4
San Francisco 12 12 22 20
Rocky Mountains 64 67 77 84
Denver 64 67 77 84
Southeast/Caribbean 281 355 459 487
Atlanta 51 79 91 101
Birmingham 63 70 85 96
Columbia 19 19 31 34
Greensboro 31 36 54 65
Jackson 19 24 27 27
Jacksonville 22 35 41 30
Louisville 52 59 81 85
Knoxville 10 14 23 23
Nashville 14 19 26 26
Caribbean 0 0 0 0
Southwest 162 216 307 342
Albuquerque 6 9 13 16
Beaumont 11 11 22 27
Ft. Worth 36 38 68 83
Houston 3 3 4 8
Little Rock 51 70 82 78
New Orleans 16 29 34 34
Oklahoma City 23 27 37 51
San Antonio 16 29 47 45
All regions 1,033 1,293 1,685 1,833
Source: GAO’s analysis of data from HUD’s SMIRPH database.
GAO/RCED-97-27 Public HousingPage 55

Appendix V
Comments From the Department of Housingand Urban Development
GAO/RCED-97-27 Public HousingPage 56

Appendix V
Comments From the Department of Housing
and Urban Development
GAO/RCED-97-27 Public HousingPage 57

Appendix V
Comments From the Department of Housing
and Urban Development
GAO/RCED-97-27 Public HousingPage 58

Appendix V
Comments From the Department of Housing
and Urban Development
GAO/RCED-97-27 Public HousingPage 59

Appendix V
Comments From the Department of Housing
and Urban Development
GAO/RCED-97-27 Public HousingPage 60

Appendix VI
Major Contributors to This Report
Resources,Community, andEconomicDevelopment Division
Lawrence J. Dyckman, Associate DirectorEric Marts, Assistant DirectorCarol Anderson-GuthrieCurtis GrovesBill MacBlaneLuann MoyTerri Russell
(385602) GAO/RCED-97-27 Public HousingPage 61

Ordering Information
The first copy of each GAO report and testimony is free.
Additional copies are $2 each. Orders should be sent to the
following address, accompanied by a check or money order
made out to the Superintendent of Documents, when
necessary. VISA and MasterCard credit cards are accepted, also.
Orders for 100 or more copies to be mailed to a single address
are discounted 25 percent.
Orders by mail:
U.S. General Accounting Office
P.O. Box 6015
Gaithersburg, MD 20884-6015
or visit:
Room 1100
700 4th St. NW (corner of 4th and G Sts. NW)
U.S. General Accounting Office
Washington, DC
Orders may also be placed by calling (202) 512-6000
or by using fax number (301) 258-4066, or TDD (301) 413-0006.
Each day, GAO issues a list of newly available reports and
testimony. To receive facsimile copies of the daily list or any
list from the past 30 days, please call (202) 512-6000 using a
touchtone phone. A recorded menu will provide information on
how to obtain these lists.
For information on how to access GAO reports on the INTERNET,
send an e-mail message with "info" in the body to:
or visit GAO’s World Wide Web Home Page at:
http://www.gao.gov
PRINTED ON RECYCLED PAPER

United StatesGeneral Accounting OfficeWashington, D.C. 20548-0001
Official BusinessPenalty for Private Use $300
Address Correction Requested
Bulk RatePostage & Fees Paid
GAOPermit No. G100