Embed Size (px)
Citation preview

Report of the Central Board of Directors on the working of the Reserve Bank of India
for the year ended June 30, 2011 submitted to the Central Government in terms of
Section 53(2) of the Reserve Bank of India Act, 1934
RESERVE BANK OF INDIA ANNUAL REPORT2010-2011


CENTRAL BOARD / LOCAL BOARDS
MEMBERS OF LOCAL BOARDS
WESTERN AREA
Y.H. Malegam
K. Venkatesan
Dattaraj V. Salgaocar
Jayantilal B. Patel
EASTERN AREA
Suresh D. Tendulkar5
A. K. Saikia
Sovan Kanungo
Md. Sohrab9
NORTHERN AREA
Mitha Lal Mehta10
U.R. Rao
Ram Nath
Pritam Singh
Kamal Kishore Gupta11
Mihir Kumar Moitra12
SOUTHERN AREA
Lakshmi Chand
C. P. Nair
M. Govinda Rao
Devaki Jain
GOVERNOR
D. Subbarao
DEPUTY GOVERNORS
Shyamala Gopinath1
Usha Thorat2
K.C. Chakrabarty
Subir Gokarn
Anand Sinha3
H. R. Khan4
DIRECTORS NOMINATED UNDER
SECTION 8 (1) (b) OF THE RBI ACT, 1934
Y.H. Malegam
Suresh D. Tendulkar5
U.R. Rao
Lakshmi Chand
DIRECTORS NOMINATED UNDER
SECTION 8 (1) (c) OF THE RBI ACT, 1934
H. P. Ranina
Azim Premji
Kumar Mangalam Birla
Shashi Rajagopalan6
Suresh Neotia
A. Vaidyanathan
M. M. Sharma
Sanjay Labroo
DIRECTOR NOMINATED UNDER
SECTION 8 (1) (d) OF THE RBI ACT, 1934
Ashok Chawla7
R Gopalan 8
1 Term expired on June 20, 2011 7 Retired on January 31, 20112 Term expired on November 9, 2010 8 Appointed on February 15, 20113 Assumed office on January 19, 2011 9 Ceased to be in Office w.e.f. May 13, 20114 Assumed office on July 4, 2011 10 Term ended on September 23, 20105 Expired on June 21, 2011 11 Appointed on August 26, 20106 Expired on August 5, 2011 12 Appointed on September 24, 2010
Position for the year 2010-11(updated till August 11, 2011)

PRINCIPAL OFFICERS(As on August 11, 2011)
EXECUTIVE DIRECTORS ............................................................... V.K. Sharma............................................................... V.S. Das............................................................... G. Gopalakrishna............................................................... Deepak Mohanty............................................................... S. Karuppasamy............................................................... R. Gandhi............................................................... P. Vijaya Bhaskar............................................................... B. Mahapatra............................................................... G. Padmanabhan
CENTRAL OFFICECustomer Service Department ............................................................ Rajesh Verma, Chief General ManagerDepartment of Banking Operations and Development ....................... Deepak Singhal, Chief General Manager-in-ChargeDepartment of Banking Supervision ................................................... G. Jaganmohan Rao, Chief General Manager-in-ChargeDepartment of Communication ........................................................... A.I. Killawala, Press Relations Officer (Gr. F)Department of Currency Management ................................................ N. Krishna Mohan, Chief General ManagerDepartment of Economic and Policy Research .................................. B.M. Misra, Officer-in-ChargeDepartment of Expenditure and Budgetary Control ............................ Deepa Srivastava, Chief General ManagerDepartment of External Investments and Operations ......................... M. S. Deb, Chief General ManagerDepartment of Government and Bank Accounts ................................ A.K. Bera, Chief General Manager-in-ChargeDepartment of Information Technology ............................................... A.S. Ramasastri, Chief General ManagerDepartment of Non-Banking Supervision ............................................ Uma Subramaniam, Chief General Manager-in-ChargeDepartment of Payment and Settlement Systems ............................. Vijay Chugh, Chief General ManagerDepartment of Statistics and Information Management ..................... A.B. Chakraborty, Officer-in-ChargeFinancial Markets Department ............................................................ G. Mahalingam, Chief General ManagerFinancial Stability Unit ......................................................................... Rabi N. Mishra, Chief General ManagerForeign Exchange Department ........................................................... Meena Hemchandra, Chief General Manager-in-ChargeHuman Resource Management Department ...................................... Sandip Ghose, Chief General Manager-in-ChargeInspection Department ........................................................................ Karuna Sagar, Chief General ManagerInternal Debt Management Department .............................................. K.K. Vohra , Chief General ManagerLegal Department ................................................................................ G.S. Hegde, Principal Legal AdviserMonetary Policy Department ............................................................... Janak Raj, Adviser-in-ChargePremises Department .......................................................................... K.R. Ananda, Chief General ManagerRajbhasha Department ....................................................................... Ramakant K. Gupta, Deputy General ManagerRural Planning and Credit Department ............................................... Deepali Pant Joshi, Chief General Manager-in-ChargeSecretary’s Department ....................................................................... Grace E. Koshie, Chief General Manager & SecretaryUrban Banks Department .................................................................... A. Udgata, Chief General Manager-in-Charge
CHIEF VIGILANCE OFFICER ............................................................ Kaza Sudhakar
COLLEGES PRINCIPALSCollege of Agricultural Banking, Pune ................................................. Kamala RajanReserve Bank Staff College, Chennai ................................................. J. Sadakkadulla
OFFICES REGIONAL DIRECTORSChennai ............................................................................................... N.S. VishwanathanKolkata ................................................................................................. Salim GangadharanMumbai ................................................................................................ J.B. BhoriaNew Delhi ............................................................................................ Chandan Sinha
BRANCHESAhmedabad ......................................................................................... Sudarshan SenBangalore ............................................................................................ Uma ShankarBhopal .................................................................................................. P.K. PandaBhubaneswar ....................................................................................... B.K. BhoiChandigarh .......................................................................................... Jasbir SinghGuwahati .............................................................................................. Surekha MarandiHyderabad ........................................................................................... A.S. RaoJaipur ................................................................................................... B.P. KanungoJammu ................................................................................................. K.K. SarafKanpur ................................................................................................. Bazil ShaikhLucknow ............................................................................................... Amarendra SahooNagpur ................................................................................................. Phulan KumarPatna ................................................................................................... M.K. SinghThiruvananthapuram ........................................................................... Suma Varma
............................................................................................................. OFFICERS-IN-CHARGEAgartala ............................................................................................... A.K. Pandey, General ManagerBelapur ................................................................................................ S. Bhatnagar, General ManagerDehradun ............................................................................................. V.S. Bajwa, General ManagerGangtok ............................................................................................... E.E. Karthak, General ManagerKochi .................................................................................................... C.V. George, General ManagerPanaji ................................................................................................... M.A.R. Prabhu, General ManagerRaipur .................................................................................................. Nirmal Chand, General ManagerRanchi .................................................................................................. H.N. Panda, General ManagerShimla .................................................................................................. R. Gurumurthy, General ManagerSrinagar ............................................................................................... D.P. Sharma, Deputy General Manager

i
CONTENTS
Page No.
PART ONE : THE ECONOMY – REVIEW AND PROSPECTS
I. ASSESSMENT AND PROSPECTS ................................................................................. 1
Assessment of 2010-11 .................................................................................................. 2
Prospects for 2011-12 .................................................................................................... 5
Reserve Bank’s Perspective on the Medium-term Challenges for the Indian Economy 9
II. ECONOMIC REVIEW ..................................................................................................... 15The Real Economy ......................................................................................................... 15
Price Situation ................................................................................................................. 26
Money and Credit ........................................................................................................... 35
Financial Markets ............................................................................................................ 42
Government Finance ...................................................................................................... 52
External Sector ................................................................................................................ 60
PART TWO: THE WORKING AND OPERATIONS OF THE RESERVE BANK OF INDIA
III. MONETARY POLICY OPERATIONS .............................................................................. 72
Monetary Policy Operations: Context and Rationale ..................................................... 74
IV. CREDIT DELIVERY AND FINANCIAL INCLUSION ........................................................ 81
Priority Sector Lending ................................................................................................... 81
Financial Inclusion .......................................................................................................... 84
Outreach Activities .......................................................................................................... 87
V. DEVELOPMENT AND REGULATION OF FINANCIAL MARKETS ................................ 89
Money Market ................................................................................................................. 89
Government Securities Market ....................................................................................... 90
Foreign Exchange Market .............................................................................................. 90
Derivatives Market .......................................................................................................... 92
VI. REGULATION, SUPERVISION AND FINANCIAL STABILITY ........................................ 96
Financial Stability Assessment ........................................................................................ 96
Monitoring of Financial Stability ...................................................................................... 98
Assessment of the Banking Sector................................................................................. 98
Major Decisions Taken by Board for Financial Supervision .......................................... 101
Commercial Banks .......................................................................................................... 102
Urban Co-operatives Banks ........................................................................................... 108
Rural Co-operatives........................................................................................................ 110
Deposit Insurance and Credit Guarantee Corporation .................................................. 110
Banking Codes and Standards Board of India ............................................................... 111
Non-Banking Financial Companies ................................................................................ 111
CONTENTS
ii
Page No.
VII. PUBLIC DEBT MANAGEMENT ..................................................................................... 114
Debt Management of Central Government .................................................................... 114
Debt Management of State Governments ...................................................................... 117
VIII. CURRENCY MANAGEMENT ......................................................................................... 122
Banknotes in Circulation ................................................................................................. 122
Coins in Circulation ......................................................................................................... 122
Currency Operations ...................................................................................................... 123
Clean Note Policy ............................................................................................................ 123
Counterfeit Banknotes .................................................................................................... 124
Customer Service ........................................................................................................... 126
Indigenisation of Paper, Ink and other Raw Materials for Production of Banknotes ..... 126
Expenditure on Security Printing and Distribution ......................................................... 126
IX. PAYMENT AND SETTLEMENT SYSTEMS AND INFORMATION TECHNOLOGY ....... 127
Oversight of Payment Systems in India .......................................................................... 127
Policy Initiatives ............................................................................................................... 129
CPSS Initiatives ............................................................................................................... 131
Information Technology ................................................................................................... 133
Information Technology Infrastructure ............................................................................ 133
Information Technology Applications .............................................................................. 134
Policy Initiatives ............................................................................................................... 136
X. GOVERNANCE, HUMAN RESOURCES DEVELOPMENT AND
ORGANISATIONAL MANAGEMENT .............................................................................. 137
Initiatives for Improved Governance ............................................................................... 137
Initiatives for Improved Communication .......................................................................... 140
Human Resource Development Initiatives ...................................................................... 142
Initiatives in Organisation Management ......................................................................... 143
XI. THE RESERVE BANK’S ACCOUNTS FOR 2010-11 ..................................................... 150
Income ............................................................................................................................. 150
Expenditure ..................................................................................................................... 151
Balance Sheet ................................................................................................................. 153
Significant Accounting Policies and Notes to the Accounts for the Year 2010-11 ......... 160

iii
CONTENTS
Page No.
Annex I : List of Speeches by Governor and Deputy Governors:April 2010 to August 2011 ..................................................................... 164
Annex II : Visits of Foreign Delegations to the Reserve Bank of Indiaduring July 01, 2010 to June 30, 2011 ................................................ 166
INDEX OF APPENDIX TABLES
1. Macroeconomic and Financial Indicators ................................................................... 168
2. Growth Rates and Sectoral Composition of Real Gross Domestic Product .............. 171
3. Gross Domestic Saving and Investment ..................................................................... 172
4. Financial Saving of the Household Sector (Gross) .................................................... 173
5. Agricultural Production ............................................................................................... 174
6. Procurement, Off-Take and Stocks of Foodgrains ..................................................... 175
7. Trends in Index of Industrial Production ..................................................................... 176
8. Variations in Index Numbers of Wholesale Prices ...................................................... 177
9. Variations in Reserve Money ...................................................................................... 178
10. Variations in Money Stock ........................................................................................... 179
11. Sectoral Deployment of Gross Bank Credit ............................................................... 180
12. Capital Market - Primary and Secondary ................................................................... 181
13. Turnover in Indian Derivatives Market ........................................................................ 182
14. Indices of Real Effective Exchange Rate (REER) and Nominal Effective ExchangeRate (NEER) of the Indian Rupee .............................................................................. 183
15. Key Fiscal Indicators ................................................................................................... 184
16. Budgetary Operations of the State Governments ...................................................... 185
17. India's Exports and Imports ......................................................................................... 186
18. India's Overall Balance of Payments .......................................................................... 187
19. Foreign Direct Investment Flows to India: Country-wise and Industry-wise............... 188
20. India's Foreign Exchange Reserves ........................................................................... 189
21. India's External Debt (As at end-March) ..................................................................... 190
BOXES
II.1 Would Firming Oil Prices Cringe Growth? .................................................................. 17
II.2 Food Management – What Needs to Improve? ......................................................... 21
II.3 Transmission of Global Commodity Price Shocks to Domestic Inflation .................... 30
II.4 Growth Inflation Trade-off and Threshold Inflation..................................................... 32
II.5 Towards Better Price Statistics .................................................................................... 34

CONTENTS
iv
Page No.
II.6 Determinants of Currency Demand – What Caused the Shift in Trend? .................. 38
II.7 Short-run Shocks to Money Velocity and the Behaviour of Money Growth ............... 39
II.8 Financial Derivatives in India - Current Status ........................................................... 48
II.9 Trends in Non-Bank Financing- Is the Financial System still Bank Dominant? ......... 50
II.10 Impact of Financial Market Developments on Financial Soundness Indicators ofthe Banking System .................................................................................................... 51
II.11 Infrastructure Financing .............................................................................................. 51
II.12 Revenue and Expenditure Reforms – Improving the Fiscal Environment forRobust and Inclusive Growth ...................................................................................... 55
II.13 Fiscal Indicators in a Rule-based Framework: Cross-country Survey....................... 57
II.14 Fiscal Multiplier: A Cross-Country Experience............................................................ 59
II.15 Recommendations of Committee on the Comprehensive Review of the NSSF ........ 60
II.16 Has Increasing Globalisation Limited the Effectiveness of National Policies in India? 63
II.17 India’s Threshold level of Sustainable Current Account Deficit ................................. 67
II.18 Interest Rate Sensitivity of Capital Flows to India ...................................................... 69
II.19 Equilibrium Exchange Rate ......................................................................................... 70
III.1 Monetary Policy Transmission after the Switchover to Base Rate ............................ 73
III.2 Changes in Operating Procedure of Monetary Policy ............................................... 77
IV.1 Financial Inclusion and Inclusive Growth: What the Empirical Evidence Suggests?. 84
IV.2 Committee on the MFI Sector (Malegam Committee) ................................................ 88
V.1 Guidelines on Credit Default Swaps (CDS) for Corporate Bonds ............................. 94
V.2 NDF Market and its Implication for the Domestic Financial Markets .......................... 95
VI.1 Financial Stability Board (FSB) ................................................................................... 97
VI.2 Developments related to FSDC and its Sub-Committee ............................................ 98
VI.3 Corporate and Household Leverage, Credit Cycle and Economic Growth ............... 99
VI.4 Initiatives taken by the Reserve Bank to migrate towards the Basel III norms .......... 104
VI.5 Expert Committee on Licensing of New Urban Cooperative Banks ........................... 109
VI.6 Regulatory Framework for Core Investment Companies (CICs) ................................ 112
VII.1 Developments in RBI’s role as Banker to Government .............................................. 118
VIII.1 Procedure for Dealing with Counterfeit Currency ...................................................... 125
IX.1 Interdependencies in Payment Systems .................................................................... 132
IX.2 IT Vision Document: 2011-2017 ................................................................................. 134
IX.3 Information Technology as a Vehicle for Data Dissemination .................................... 135
X.1 Governance Framework in the Reserve Bank ........................................................... 138
X.2 Knowledge Initiative .................................................................................................... 144

v
CONTENTS
Page No.
CHARTS
II.1 Real GDP Growth ....................................................................................................... 16
II.2 Saving and Investment (Per cent of GDP at current market prices) ......................... 16
II.3 Household Financial Savings ..................................................................................... 18
II.4 Comparative Yield: India and the World ..................................................................... 19
II.5 2010-11 Yield Differential – State-wise ....................................................................... 19
II.6 Monsoon and Agriculture ............................................................................................ 20
II.7 Growth in IIP (Y-o-Y) ................................................................................................... 22
II.8 Industrial Growth ......................................................................................................... 22
II.9 Components of Aggregate Demand and Related Industry Growth Trends ............... 23
II.10 Growth in Infrastructure Industries ............................................................................. 23
II.11 Growth in Services Sector GDP.................................................................................. 24
II.12 Growth Trend in Cargo Movements............................................................................ 24
II.13 Growth in services (excluding community, social and personal services) ................. 24
II.14 Expenditure Side of GDP ............................................................................................ 25
II.15 Changing Weighted Contributions to Increase in WPI ............................................... 26
II.16 Trends in Wholesale Price Inflation ............................................................................ 27
II.17 Contribution to Inflation: Major Groups ...................................................................... 27
II.18 Trends in Food Inflation .............................................................................................. 28
II.19 Global and Domestic Fuel Inflation (Y-o-Y) ................................................................ 28
II.20 Manufactured Products Inflation ................................................................................. 29
II.21 International Commodity Prices .................................................................................. 29
II.22 CPI and WPI Inflation (Y-o-Y) ...................................................................................... 31
II.23 Trends in GDP Growth and Inflation ........................................................................... 31
II.24 Growth in Reserve Money .......................................................................................... 35
II.25 Important Sources of Variation in Reserve Money ..................................................... 36
II.26 Liquidity Management Operations .............................................................................. 36
II.27 Money and Deposit Growth ........................................................................................ 37
II.28 Variations in M3 in ` crore and per cent share of Major Components of M3 in theVariation ...................................................................................................................... 37
II.29 Non-food Credit Growth (Y-o-Y, per cent) .................................................................. 37
II.30 Share of Various Sub-sectors in Incremental Industrial Credit Flow .......................... 40
II.31 Aggregate Deposits and Bank Credit of SCBs .......................................................... 41
II.32 Flow of Financial Resources to the Commercial Sector ............................................ 41
II.33 Indicators of Global Financial Market Developments ................................................. 42
II.34 Transmission of Policy Rates to Financial Markets .................................................... 43
II.35 Movement in Government Securities Yield Curve ...................................................... 44

CONTENTS
vi
Page No.
II.36 Activities in Domestic Financial Markets ..................................................................... 46
II.37 Volatility in the Indian Financial Markets ..................................................................... 47
II.38 Movement in Equity Markets ....................................................................................... 47
II.39 Activity in Financial Derivatives Market ...................................................................... 49
II.40 Movement in Housing Prices and Transactions ......................................................... 49
II.41 Exchange Rate and Forward Premia ......................................................................... 50
II.42 Key Deficit Indicators .................................................................................................. 53
II.43 Subsidies of Central Government .............................................................................. 54
II.44 Key Global Indicators .................................................................................................. 61
II.45 India’s External Trade ................................................................................................. 64
II.46 Year-on-Year Export Growth of India vis-a-vis AEs and EMEs ................................... 64
II.47 Exports and Imports of Major Commodities ................................................................ 65
II.48 Performance of India's Invisibles ................................................................................ 66
II.49 Trends in the Major Components of Balance of Payments ........................................ 66
II.50 Trends in Major Components of Capital Flows (Net) ................................................. 68
II.51 Country-wise FDI Inflows ............................................................................................. 68
II.52 Industry-wise FDI Flows .............................................................................................. 68
II.53 Exchange Rate flexibility in India ................................................................................ 68
II.54 Movements of Indian Rupee against US Dollar and Euro .......................................... 70
II.55 External Debt Indicators .............................................................................................. 71
III.1 Repo (+)/Reverse Repo (-) under LAF ...................................................................... 78
III.2 Outstandings under LAF and GoI Balance ................................................................ 78
VI.1 Soundness Indicators on SCBs .................................................................................. 100
VII.1 Cash Balance of the Central Government ................................................................. 117
VIII.1 Cost of Security Printing ............................................................................................. 126
IX.1 Share of Paper Based Vs Electronic Transaction ...................................................... 130
X.1 Total Staff Strength of the Reserve Bank ................................................................... 146
TEXT TABLES
III.1 Movements in Key Policy Rates and Reserve Requirements in India ....................... 75
III.2 Monetary Policy Reviews ............................................................................................ 75
III.3 Liquidity Management Measures taken by the Reserve Bank in 2010-11 ................ 79
IV.1 Priority Sector Advances ............................................................................................. 81
IV.2 Disbursements under SACP by Public Sector Banks ................................................ 82
IV.3 Recovery of Direct Agricultural Advances .................................................................. 82
IV.4 Compensation of lending institutions under Agricultural Debt Waiver and DebtRelief Scheme, 2008................................................................................................... 82
IV.5 Credit to MSE Sector by SCBs ................................................................................... 83

vii
CONTENTS
Page No.
VI.1 Select Financial Indicators .......................................................................................... 101
VII.1 Gross and Net Market Borrowings of the Central Government ................................. 114
VII.2 Central Government’s Market Loans - A Profile ......................................................... 115
VII.3 Issuance of GoI Dated Securities - Maturity Pattern .................................................. 115
VII.4 States’ Market Borrowings........................................................................................... 117
VII.5 Residual Maturity Profile of Outstanding State Development Loans and PowerBonds (as at end-March 2011) ................................................................................... 117
VII.6 Yield on State Government Securities ........................................................................ 119
VII.7 WMA/OD of State Governments (Average monthly outstanding) .............................. 119
VII.8 No. of Days States Availed of Special/Normal WMA and OD...................................... 120
VII.9 Investments of the State Governments/UT ................................................................. 120
VIII.1 Banknotes in Circulation ............................................................................................. 122
VIII.2 Coins in Circulation ..................................................................................................... 123
VIII.3 Currency Chests and Small Coin Depots ................................................................... 123
VIII.4 Indent and Supply of Banknotes (April –March) ........................................................ 123
VIII.5 Indent and Supply of Coins ........................................................................................ 124
VIII.6 Disposal of Soiled Notes and Supply of Fresh Banknotes ........................................ 124
VIII.7 Counterfeit Notes Detected ........................................................................................ 125
IX.1 Payment System Indicators - Annual Turnover .......................................................... 128
X.1 Reserve Bank Training Establishments - Programmes Conducted ........................... 142
X.2 Number of Officers Trained in External Training Institutions in India and Abroad ..... 143
X.3 Recruitment by the Reserve Bank – 2010 ................................................................. 146
X.4 Staff Strength of the Reserve Bank ............................................................................ 147
X.5 Category-wise Staff Strength ...................................................................................... 147
X.6 Reserve Bank’s Office-wise Strength of Staff ............................................................. 148
XI.1 Gross Income .............................................................................................................. 151
XI.2 Earnings from Foreign Sources.................................................................................. 151
XI.3 Earnings from Domestic Sources ............................................................................... 152
XI.4 Expenditure ................................................................................................................. 152
XI.5 Trends in Gross Income, Expenditure and Net Disposable Income ........................... 153
XI.6 Contingency and Asset Development Reserves and Surplus Transfer to theGovernment ................................................................................................................ 153
XI.7 Balances in Currency and Gold Revaluation Account (CGRA), ExchangeEqualisation Account (EEA) and Investment Revaluation Account (IRA) .................. 155
XI.8 Balances in Contingency Reserve and Asset Development Reserve ....................... 156
XI.9 Outstanding Foreign Currency and Domestic Assets ................................................ 156
XI.10 Foreign Exchange Reserves ...................................................................................... 157
XI.11 Investments in Shares of Subsidiaries/Associate Institutions .................................... 157

LIST OF ABBREVIATIONS
viii
AACS - Advanced Access Content System
AD - Authorised Dealer
ADB - Asian Development Bank
A.E. - Advance Estimates
AEs - Advanced Economies
ALM - Assets Liability Management
AMA - Advance Measurement Approach
AML - Anti Money Laundering
ASEAN - Association of Southeast Asian Nations
ASSOCHAM - Associated Chambers of Commerce andIndustry of India
ATBs - Auction Treasury Bills
ATM - Automated Teller Machine
BC - Business Correspondent
BCBS - Basel Committee on Banking Supervision
BCP - Business Continuity Planning
BCSBI - Banking Codes and Standards Board ofIndia
BE - Budget Estimates
BFS - Board for Financial Supervision
BI - Business Intelligence
BIFR - Board for Industrial and FinancialReconstruction
BIS - Bank for International Settlements
BO - Banking Ombudsman
BPL - Below Poverty Line
BPLR - Benchmark Prime Lending Rate
bps - Basis Points
BPSS - Board of Payment and Settlement System
BRBNMPL - Bharatiya Reserve Bank Note MudranPrivate Limited
BSE - Bombay Stock Exchange
BWA - Broadband Wireless Access
CAB - Current Account Balance
CACP - Commission for Agricultural Costs andPrices
CAD - Current Account Deficit
CAFL - Centre for Advanced Financial Learning
CAFRAL - Centre for Advanced Financial Researchand Learning
CAS - Central Account Section
CBLO - Collateralized Borrowing and LendingObligation
CBRC - China Banking Regulatory Commission
CBS - Core Banking Solutions
CCBs - Central Cooperative Banks
CCIL - Clearing Corporation of India Ltd.
CCP - Central Counter Parties
CCs - Currency Chests
CDBS - Currency Disintegration and BriquettingSystem
CDR - Corporate Debt Restructuring
CDs - Certificates of Deposit
CDS - Credit Default Swap
CGA - Controller General of Accounts
CIC - Core Investment Company
CII - Confederation of Indian Industry
CIP - Central Issue Price
CMBs - Cash Management Bills
CODs - Central Office Department
CoR - Certificate of Registration
CP - Commercial Paper
CPADS - Centralised Public Account DepartmentSystems
CPI - Consumer Price Index
CPI-IW - Consumer Price Index for IndustrialWorkers
CPIO - Chief Public Information Officer
CPIOs - Central Public Information Officers
CPSS - Committee on Payment and SettlementSystems
CPSUs - Central Public Sector Undertakings
CRA - Credit Rating Agencies
CRAR - Capital to Risk-weighted Assets Ratio
CRCS - Central Registrar of Co-operative Societies
CRM - Customer Relationship Management

ix
LIST OF ABBREVIATIONS
CRR - Cash Reserve Ratio
CSF - Consolidated Sinking Fund
CSO - Central Statistics Office
CTS - Cheque Truncation System
CVPS - Currency Verification and ProcessingSystem
DCCBs - District Central Co-operative Banks
DEPR - Department of Economic and PolicyResearch
DGA - Duration Gap Analysis
DGCI&S - Directorate General of CommercialIntelligence and Statistics
DICGC - Deposit Insurance and Credit GuaranteeCorporation
DIF - Deposit Insurance Fund
DIT - Department of Information Technology
DR - Disaster Recovery
DRM - Dispute Resolution Mechanism
DSIM - Department of Statistics and InformationManagement
DSS - Decision Support Systems
DTC - Direct Tax Code
DTL - Demand and Time Liabilities
DWM - Dynamic Working Model
EBT - Electronic Benefit Transfer
ECB - External Commercial Borrowings
ECCS - Express Cheque Clearing System
ECS - Electronic Clearing Services
EKP - Enterprise knowledge Portal
EMDEs - Emerging Market and DevelopingEconomies
EMEs - Emerging Market Economies
EMS - Estate Management System
ERER - Equilibrium Real Exchange Rate
ETL - Extract Transform and Load
FAO - Food and Agriculture Organization
FC - Finance Commission
FCI - Food Corporation of India
FCMD - Financial Conglomerates MonitoringDivision
FCNR(B) - Foreign Currency Non-Resident Accounts(Banks)
FDI - Foreign Direct Investment
FEMA - Foreign Exchange Management Act
FI - Financial Institutions
FICCI - Federation of Indian Chambers ofCommerce & Industry
FIF - Financial Inclusion Fund
FITF - Financial Inclusion Technology Fund
FII - Financial Inclusion Index
FIIs - Foreign Institutional Investors
FIMMDA - Fixed Income Money Market andDerivatives Association of India
FLCCs - Financial Literacy and Credit CounselingCentres
FMC - Forwards Markets Commission
FMD - Financial Market Department
FMI - Financial Market Infrastructures
FPS - Fair Price Shops
FRAs - Forward Rate Agreements
FRBM - Fiscal Responsibility and BudgetManagement
FRBs - Floating Rate Bonds
FRLs - Fiscal Responsibility Legislations
FSB - Financial Stability Board
FSDC - Fiscal Stability and Development Council
FSF - Financial Stability Forum
FST - Financial Sector Technology
GCC - General Purpose Credit Cards
GCF - Gross Capital Formation
GDP - Gross Domestic Product
GDS - Gross Domestic Savings
GFCE - Government Final ConsumptionExpenditure
GFCF - Gross Fixed Capital Formation
GFD - Gross Fiscal Deficit
GoI - Government of India

LIST OF ABBREVIATIONS
x
GPS - Global Positioning System
GRF - Guarantee Redemption Fund
G-sec - Government Securities
GST - Goods and Services Tax
HLCCFM - High Level Coordination Committee onFinancial Markets
HTM - Held to Maturity
IADI - International Association of DepositInsurance
IAS - Integrated Accounting System
IBA - Indian Banks Association
ICCL - Indian Clearing Corporation Limited
ICOR - Incremental Capital Output Ratio
ICT - Information and CommunicationTechnology
IDRBT - Institute for Development and Research inBanking Technology
IES - Integrated Establishment System
IFCs - Infrastructure Finance Companies
IFRS - International Financial ReportingStandards
IFTP - Inter-bank Funds Transfer Processor
IGIDR - Indira Gandhi Institute of DevelopmentResearch
IIBM - Indian Institute of Bank Management
IIFCL - India Infrastructure Finance Company Ltd.
IIM - Indian Institute of Management
IIP - Index of Industrial Production
IIT - Indian Institute of Technology
IMD - India Meteorological Department
IMF - International Monetary Fund
INFINET - Indian Financial Network
IOSCO - International Organisation of SecuritiesCommissions
IPCs - Irrevocable Payment Commitments
IRDA - Insurance Regulatory and DevelopmentAuthority
IRF - Interest Rate Futures
IRS - Interest Rate Swaps
ISMS - Information Security Management System
ISO - International Organisation forStandardisation
IT - Information Technology
ITBs - Intermediate Treasury Bills
ITeS - Information Technology enable Services
JLG - Joint Liability Group
JV/WOS - Joint Ventures/ Wholly Owned Subsidiaries
KCCs - Kisan Credit Cards
KVP - Kisan Vikas Patra
KYC - Know Your Customer
LABs - Local Area Banks
LAF - Liquidity Adjustment Facility
LAN - Local Area Network
LC - Letter of Credit
LCR - Liquidity Coverage Ratio
LTV - Loan to Value Ratio
M3 - Broad Money
MCX - Multi Commodity Exchange
MCX-SX - MCX Stock Exchange
MENA - Middle East and North Africa
MFIs - Micro-Finance Institutions
MFs - Mutual Funds
MIBOR - Mumbai Inter-bank Offered Rate
MICR - Magnetic Ink Character Recognition
MIS - Management Information System
MMS - Mail Messaging Solution
MoF - Ministry of Finance
MoU - Memorandum of Understanding
MPLS - Multi Protocol Label Switching
MQRs - Mid Quarter Reviews
MSE - Micro and Small Enterprises
MSF - Marginal Standing Facility
MSME - Micro, Small and Medium Enterprises
MSP - Minimum Support Prices
MSS - Market Stabilisation Scheme
MURI - Minimum Unemployment Rate of Inflation

xi
LIST OF ABBREVIATIONS
NAB - New Agreements to Borrow
NABARD - National Bank for Agriculture and RuralDevelopment
NAIRU - Non-Accelerating Inflation Rate ofUnemployment
NASSCOM - National Association of Software andServices Company
NBFCs - Non-Banking Financial Companies
NBS - Nutrient Based Subsidy
NCAF - Net Capital Adequacy Framework
NCD - Non-Convertible Debenture
NDF - Non-Deliverable Forwards
NDTL - Net Demand and Time Liabilities
NECS - National Electronic Clearing Services
NEFT - National Electronic Fund Transfer
NEL - Net External Liabilities
NFA - Net Foreign Currency Assets
NFSB - National Food Security Bill
NHB - National Housing Bank
NIBM - National Institute of Bank Management
NIM - Net Interest Margin
NOC - No Objection Certificate
NOF - Net Owned Fund
NPAs - Non-Performing Assets
NPS - New Pension Scheme
NR(E)RA - Non-Resident (External) Rupee Account
NREGA - National Rural Employment Guarantee Act
NRIs - Non Resident Indians
NSC - National Savings Certificate
NSCCL - National Security Clearing Co-operationLimited
NSE - National Stock Exchange
NSFR - Net Stable Funding Ratio
NSM - Note Sorting Machines
NSSF - National Small Savings Fund
NSSO - National Sample Survey Office
OBCs - Other Backward Classes
OD - Over Draft
OIS - Overnight Index Swap
OLS - Ordinary Least Square
OMO - Open Market Operation
ORFS - Online Return Filing System
OTC - Over-the-Counter
OTS - One Time Settlement
PACS - Primary Agricultural Credit Societies
PAD - Public Account Department
PAR - Performance Appraisal Reports
PCR - Provisional Coverage Ratio
PDO-NDS - Public Debt Office- Negotiated DealingSystem
PDS - Public Distribution System
PFCE - Private Final Consumption Expenditure
PGPBF - Post Graduate Programme in Banking andFinance
PI - Participant Interface
PIOs - Persons of Indian Origin
PNs - Participatory Notes
POS - Points of Sale
PPP - Public-Private Partnership
PSS - Payment and Settlement System
Q.E. - Quick Estimates
QIS - Quantitative Impact Study
RBI - Reserve Bank of India
RBSC - Reserve Bank Staff College
RCCP - Recommendations for CentralCounterparties
RCS - Registrar of Co-operative Societies
RD - Revenue Deficit
RE - Revised Estimates
RECS - Regional Electronic Clearing Service
REER - Real Effective Exchange Rate
RIA - Right to Information Act
RIDF - Rural Infrastructure Development Fund
RNBCs - Residuary Non-Banking Companies
ROs - Regional Offices

LIST OF ABBREVIATIONS
xii
RoA - Return on Assets
RoE - Return on Equity
RR - Revenue Rules
RRBs - Regional Rural Banks
RSSS - Recommendations for SecuritiesSettlement Systems
RTGS - Real Time Gross Settlement
RTI - Right to Information
SACP - Special Agricultural Credit Plan
SCBs - Scheduled Commercial Banks
SCEPR - Steering Committee on Economic andPolicy Research
SCs - Scheduled Castes
SCSS - Senior Citizens' Saving Scheme
SDL - State Development Loan
SEBI - Securities and Exchange Board of India
SEZ - Special Economic Zone
SGL - Subsidiary General Loan
SHG - Self-Help Group
SIDBI - Small Industries Development Bank of India
SIFI - Systemically Important FinancialInstitutions
SLAF - Second Liquidity Adjustment Facility
SLBC - State Level Bankers Committees
SLR - Statutory Liquidity Ratio
SMEs - Small and Medium Enterprises
SPMCIL - Security Printing and Minting Corporation ofIndia
SPVs - Special Purpose Vehicles
ST CCS - Short-term Rural Cooperative CreditSocieties
STC - Short-term Trade Credit
StCBs - State Co-operative Banks
STCRC - Short-term Co-operative Rural Credit
STOs - Sub Treasury Officers
STs - Scheduled Tribes
TAC - Technical Advisory Committee
TAFCUBs - Task Force for Cooperative Urban Banks
TAG - Technical Advisory Group
T-Bills - Treasury Bills
TGA - Traditional Gap Analysis
UCBs - Urban Cooperative Banks
USE - United Stock Exchange
UTs - Union Territories
VAR - Vector Auto Regression
VAT - Value Added Tax
VECM - Vector Error Correction Mechanism
VGF - Viability Gap Funding
VVVF - Variable Voltage Variable Frequency
WMA - Ways and Means Advances
WPI - Wholesale Price Index
XBRL - Extensible Business Reporting Language
XML - Extensive Mark Up
Y-o-Y - Year on Year
ZCBs - Zero Coupons Bonds
ZCYC - Zero Coupon Yield Curve
ZTCS - Zonal Training Centres
This Report can also be accessed on InternetURL : www.rbi.org.in

1
I.1 The Indian economy rebounded strongly in2010-11 from the moderation induced by globalfinancial crisis. However, several macroeconomicfactors posed new challenges in 2010-11. During thepreceding year and a half, the Reserve Bank had tocarefully calibrate its monetary policy as the globalfinancial crisis and the consequent slowdown in theglobal growth adversely impacted India’s real andfinancial economic conditions. Both, fiscal andmonetary policies worked in tandem to pull the Indianeconomy quickly and firmly out of the slowdown.
I.2 Even as growth reverted to its trend, newchallenges emerged. First, the headline inflationaccelerated from the negative levels in mid-2009 to
THE ANNUAL REPORT ON THE WORKING OF THE RESERVE BANK OF INDIA
For the Year July 1, 2010 to June 30, 2011*
PART ONE: THE ECONOMY - REVIEW AND PROSPECTS
I ASSESSMENT AND PROSPECTS
* While the Reserve Bank of India’s accounting year is July-June, data on a number of variables are available on a financial year basis, i.e.,April-March, and hence, the data are analysed on the basis of the financial year. Where available, the data have been updated beyond March2011 based on information available till mid-August. For the purpose of analysis and for providing proper perspective on policies, reference topast years as also prospective periods, wherever necessary, has been made in this Report.
The Indian economy returned to a high growth path in 2010-11. However, challenges emerged as the year progressed.
First, investment activity slowed in the second half of the year as business confidence was impacted by high commodity
prices, tight monetary policy, political factors and execution issues. Second, while headline fiscal numbers improved
during the year, the improvement was led by cyclical and one-off factors, leaving its sustainability in question.
Third, though monetary policy was tightened through the year, inflation remained sticky on the back of new pressures.
It also turned broad-based in the later part of the year with cost-push and demand-pull factors feeding into producer
prices. This prompted the Reserve Bank to take aggressive policy actions during May-July 2011. Going ahead,
global uncertainty, sticky inflation, hardening interest rates and high base, especially for agriculture, could moderate
growth in 2011-12. On the other hand, though global commodity prices appear to have plateaued, inflation is likely
to be elevated in near term and fall only towards the later part of the year as monetary transmission works through
further. For medium-term growth sustainability, it is important to rebalance demand from private and government
consumption to private and public investment, while inflation is lowered on an enduring basis through better supply
responses. Continued focus on development of infrastructure and agriculture technology through public policy would
facilitate improved supply response.
double digits during March-July of 2010. The wholeof 2010-11 was marked by inflation persistence, withheadline inflation averaging 9.6 per cent. The ReserveBank responded to the inflation challenge by raisingrepo rate seven times during the year by 25 basispoints (bps) each. Despite these actions, inflationremained elevated due to both newer supply-sideshocks and demand factors. As input costs rose andwere passed on substantially amidst strongconsumption demand, inflation became generalisedsince December 2010.
I.3 In response to the generalisation, the ReserveBank raised its policy rate – the repo rate – moreaggressively in 2011-12. It hiked the rate by 50 bps in
ANNUAL REPORT
2
May, 25 bps in June and again by 50 bps in July. Withthis, operational policy rate has been raised by 475bps in less than 17 months since March 2010, whenthe rate hikes began. Monetary transmissionimproved considerably in the latter half of 2010-11after sustained tight liquidity prompted banks to raisedeposit and lending rates. It continued into 2011-12,helping avert inflation gathering further momentumamidst high inflation expectations and persistence ofpricing power of the producers, reflecting strongdemand.
I.4 Second, even as overall GDP growthincreased supported by strong private consumptiondemand, investment slowed down during the secondhalf of 2010-11 and has shown no signs ofimprovement yet. Considering that investmentintentions in the new projects declined significantlyin the second half of 2010-11 on a sequential basis,maintaining corporate investment levels in 2011-12could turn out to be difficult. Corporate fixedinvestment, as captured by phasing details of theprojects sanctioned financial assistance, whichshowed a seven fold jump during 2003-04 to 2009-10, also turned flat in 2010-11, with a sharp dip in thesecond half. Public investment in relation to the sizeof the economy declined during 2008-09 and 2009-10. With revenue deficit, despite some improvementduring 2010-11 remaining above the levels thatprevailed during 2004-05 to 2007-08, fiscal space tosupport investment in the economy remains limited.This underscores the importance of focusing onquality of fiscal consolidation. Meanwhile, in anuncertain interest rate environment, it remains to beseen how far the momentum in investment can besustained ahead. As such, in the short run, investmentcycle can be elongated by focusing on betterexecution of pipeline investment and improvedgovernance at all levels, internal and external to a firm.
ASSESSMENT OF 2010-11
I.5 In assessing the macroeconomic performanceof 2010-11, some questions are central to the overallassessment as set out below.
Why did inflation persist and was this predictable?
I.6 The year 2010-11 was marked by stronginflation exhibiting persistence on the back of elevatedinflation expectations, spike in vegetable prices withunseasonal rains post-monsoon and rising globalcommodity prices that resulted in significant cost-pushand demand-pull pressures since December 2010.Drivers of inflation changed during 2010-11. Foodproducts were the main drivers of price rise duringApril-July 2010, accounting for about two-fifths ofincrease in WPI. Their share declined during August-November, when non-food primary products turnedout to be the main drivers. However, these pricepressures spilled over to manufactured non-foodproducts during December 2010-March 2011, whichaccounted for 61 per cent of the price rise in thisperiod.
I.7 Inflation became difficult to predict in face ofthis changing pattern, where new unforeseen pricepressures emerged. The declining trend in inflationduring first half of 2010-11 was disrupted bysharper-than-expected rise in global commodityprices and structural factors constraining the declinein food prices in spite of normal monsoon. Anunforeseen spike in vegetable prices due tounseasonal rains followed the good monsoon. Finally,as inflation spilled over to the manufactured non-foodproducts, producers were able to pass on a largeshare of the input cost pressures reflecting strongdemand.
Was monetary tightening adequate and did it helpfight inflation?
I.8 Cumulative monetary tightening by raisingoperational policy rates by 475 bps since mid-March2010 has been one of the sharpest around the world.Of this, hikes of 325 bps occurred during 2010-11.The hikes were in smaller but frequent doses as thefrequency of scheduled policy decisions wasincreased to eight from four, enabling a smootheradjustment of the financial markets to monetary policyactions. The magnitude of these rate hikes was small

ASSESSMENT AND PROSPECTS
3
as the nature of inflation was largely supply-drivenfor the larger part of the year. Also, liquidity conditionswere already unusually tight following theunexpectedly large 3G/BWA spectrum auctionrevenues that resulted in large government cashbalances with the Reserve Bank for a major part of2010-11.
I.9 Policy choices toughened during the secondhalf of the year. Inflation had become generalisedtowards the later part of the year, even as theheadline IIP growth numbers available then on thebasis of old index (base: 1993-94) suggested adistinct deceleration. The Reserve Bank assessedthat this deceleration was exacerbated by few volatilecomponents. The deceleration was much less ifthese volatile components were excluded from thegrowth. Furthermore, related indicators such ascredit expansion, corporate profitability, exportsand imports, trend in tax collections did notcorroborate the slowdown. Monetary policy wastightened further in face of persistence of highinflation. However, the hikes remained small inquantum as headline and core inflation wereexpected to trend down. Also, uncertain inferenceson growth due to data quality prompted a cautiousview. The new IIP numbers (base: 2004-05) releasedsubsequently reinforced the RBI view thatgrowth had not decelerated during the second halfof 2010-11.
I.10 In face of a series of supply-side shocks,monetary tightening helped to keep some check onthe spillover effects and high inflation expectations.However, monetary policy was constrained by theextraordinarily large stimulus given in the wake ofglobal financial crisis. Large surplus liquidity neededto be siphoned out first, before rate hikes could beginto gain traction. Both, the rate and quantum channelsof monetary transmission were weak in the first half.Banks started responding to monetary signals in thesecond half of the year by raising deposit and lendingrates, helping restrain inflationary pressures fromspiraling up further.
Did the growth rebound of 2010-11 lose steam inthe second half?
I.11 It is now clear that the growth did not losemomentum in the second half of 2010-11. IIP growthaccelerated to 8.2 per cent in 2010-11 from 5.3 percent in the previous year. It grew at about the samepace in the second half as in the first half.
I.12 Agricultural growth rebounded in the secondhalf due to record Kharif crop on back of normalmonsoon. The consequent rise in farm incomessupported demand conditions and with linkages withindustry and services, kept the overall growthmomentum. Services remained buoyant, except‘community, social and personal services’ wherepolicy-induced deceleration was visible as fiscalconsolidation resumed.
I.13 Overall growth in 2010-11 is currentlyestimated at 8.5 per cent and is likely to turn higherafter factoring in the new base IIP in the GDP datarevisions. The above trend growth in 2010-11 wassupported by strong aggregate demand conditionsprimarily emerging from high private consumption. Asa result, the supply-side price pressures spilled overto generalised inflation.
Was the fiscal consolidation in 2010-11 temporaryor permanent?
I.14 Fiscal deficit ratios in 2010-11 turned out tobe better than envisaged in the Union budget. Centre’sgross fiscal deficit (GFD) was 4.7 per cent of GDPagainst 5.5 per cent budgeted. Compared with a GFDof 6.4 per cent of GDP in 2009-10, this was a hugeswing.
I.15 A qualitative assessment of fiscal correctionduring 2010-11, however, raises concerns. Not onlydid the correction in revenue account reflect more-than-anticipated non-tax revenues from spectrumauctions, there has been a spillover of subsidyexpenditure from the last quarter of 2010-11 to thecurrent fiscal year. Although the share of capital

ANNUAL REPORT
4
expenditure in total expenditure increased in 2010-11 from 2009-10, it was marginally lower than thebudget estimates. In particular, capital outlay-GDPratio fell short of the budgeted ratio in 2010-11 and isstill significantly lower than that achieved during pre-crisis period. Consequently, in outstanding terms, theCentral government’s capital outlay (as ratio to GDP)as at end-March 2011 was lower at 12.9 per cent than13.8 per cent a year ago.
I.16 Improved fiscal position had a large temporarycomponent arising from a business cycle upswing andone-off revenue gains. This resulted in theimprovement in headline deficit numbers. Notcounting for the revenue proceeds of two mainone-off items – spectrum auction and thedisinvestment – the GFD/GDP ratio works out to be6.3 per cent of GDP during 2010-11. Also, revenuebuoyancy was supported by a cyclical upswing thatled to above trend growth. So the one-off gains andhigher growth in nominal GDP of 20 per cent againstthe budgeted 12.5 per cent contributed largely to lowerdeficits, while the permanent component of fiscalconsolidation was rather weak.
I.17 Clearly, a more enduring fiscal consolidationstrategy that focuses on expenditure compression byrestraining subsidies as well as revenue enhancementby implementing Direct Taxes Code (DTC) and Goodsand Services Tax (GST) needs to be put into placewithout any further delay.
Why did the CAD improve and is this improvementsustainable?
I.18 The improvement in the current account gapis more sustainable than the fiscal gap. Theimprovement came about by cyclical upswing in globaltrade and turnaround in invisibles. The CurrentAccount Deficit (CAD) improved markedly in thesecond half of 2010-11 on back of a strong pick-up inexports from November 2010. Diversification of tradein terms of composition as well as direction helped inachieving strong export performance. Trade policysupporting exports through schemes such as Focus
Market Scheme (FMS), Focus Product Scheme (FPS)and Duty Entitlement Passbook Scheme (DEPB) alsohelped.
I.19 The CAD improved to 2.6 per cent in 2010-11from 2.8 per cent in 2009-10. Going forward, therecould be some pressure on CAD if the global economyweakens significantly and affects exports. Withadequate foreign exchange reserves, India remainscapable of handling any pressures emanating fromthe external sector in the near term. However, from amedium to long term perspective, it is important toimprove resilience of external account by pursuingpolicies that shift the composition of capital flows soas to reduce dependence on its volatile components.Augmenting FDI further could bring about a betterbalance between different components of capital flowsand reduce the possibility of volatile currencymovements and any pressure on reserves in the faceof contagion risks.
Have financial markets mitigated risks post-crisis?
I.20 Financial markets across the world havewitnessed significant deleveraging in the post-crisisperiod. However, balance sheet risks still remain.Effective market discipline is not getting re-established. Assurances that multilateral backstopshave the capacity to facilitate an orderly deleveragingwithout triggering further fiscal or bank funding lackcredibility. Against this backdrop, it is important to lookat whether financial risks have been sufficientlymitigated in India, should another round of contagionoccur.
I.21 A strong payment and settlement systemarchitecture with central counterparties and Deliveryversus Payment (DvP) is in place in India. While inthe post-Lehman crisis, NBFCs and Mutual Fundscame under some stress, banks proved to be largelyresilient. Since then regulators have taken severalmeasures to strengthen regulation and supervision,increase transparency and reduce settlement risksfor derivatives and other financial instruments.

ASSESSMENT AND PROSPECTS
5
Despite these measures there still remain areas ofconcern.
I.22 The OTC interest rate derivative market inIndia display a significant degree of concentration,with domination by a few banks. The growth ofderivatives as off-balance sheet items of Indian banksis also a source of risk. The absence of a liquid 3-month or 6-month funds market has led to theabsence of a term benchmark curve. This is hinderingtrading in Forward Rate Agreements (FRAs) as alsoin swaps. However, recent emergence of a deep andliquid Certificates of Deposit (CDs) market withsignificant secondary market trading could alleviatethis issue.
I.23 India continues to promote orderlydevelopment of the financial markets. In particular,efforts have been made to develop a vibrant interestrate futures (IRF) market to support long-term debtfinancing in India. In March 2011, the Reserve Bankpermitted IRF trading in 91-day Treasury bills withcash settlement in rupees. Guidelines for 5-year and2-year IRFs are being finalised in consultation withthe Securities and Exchange Board of India (SEBI).Furthermore, the Reserve Bank has decided to extendthe period of short sale in central governmentsecurities from the existing five days to a maximumperiod of three months in order to provide a fillip tothe IRF market and the term repo market.
Can Indian banks withstand financial marketstress?
I.24 A corollary to the above question is whetherthe financial system can withstand another wave ofstress in the global markets. Since the Indian financialsystem remains bank dominated, banks’ ability towithstand stress is critical to overall financial stability.A series of stress tests conducted by the ReserveBank in respect of credit, liquidity and interest raterisks showed that banks remained reasonablyresilient. However, under extreme shocks, somebanks could face moderate liquidity problems andtheir profitability could be affected.
I.25 Recent trends in asset quality, withdeterioration observed in case of some major banks,is a matter of concern. Asset quality of banks needsto be closely watched in the changing interest rateenvironment as the sticky loan portfolio of small andmedium enterprises might rise. Risks of asset qualitydeterioration in infrastructure sector exists. Suchdeterioration needs to be averted by quickly resolvingthe pricing and input supply issues. However, overalltrends in non performing assets (NPAs) do notindicate any systemic vulnerability. At a system level,the Gross NPA (GNPA) ratio of scheduled commercialbanks increased marginally to 2.52 per cent by end-June 2011 from 2.35 per cent at end-March 2011 butstill remains low. Based on unaudited results of thesebanks, the Capital to Risk (Weighted) Asset Ratio(CRAR) based on Basel II was 13.86 per cent as atend-June 2011. Though this was lower than 14.19per cent as at end-March 2011, it was well above theminimum requirement.
PROSPECTS FOR 2011-12
I.26 The Indian economy needs to brace up for adifficult year from a macroeconomic perspective. Withweak supply response, inflation remains an importantmacroeconomic challenge. Consumption demandhas been strong so far, though private consumptionmay decelerate ahead responding to monetarytransmission from higher interest rates. However, itis important to shore up investment from the point ofview of sustaining high growth over the medium term.Both, fiscal and monetary space is limited for anycounter-cyclical stimulus if global conditionsdeteriorate. As such, demand rebalancing from privateand government consumption to private and publicinvestment holds the key to meeting themacroeconomic challenges in 2011-12.
I.27 There are risks that the twin deficits – fiscaland current account – could increase if the globaleconomic problems deepen. Global uncertaintieshave increased markedly since the Standard & Poor’s(S&P’s) downgraded long-term sovereign credit ratingof the US to AA+ from AAA on August 5, 2011. This
ANNUAL REPORT
6
followed a US deficit reduction plan of US$ 2.4 trillionover next 10 years as against earlier proposals for asharper reduction of about US$4 trillion. Credit DefaultSwap (CDS) spreads, including those for thesovereigns, have widened since the event resultingin amplification of the debt difficulties in the Euro zoneregion.
I.28 The S&P action came at a time when therewere increasing signs of growth slowing down in themajor advanced economies, especially the US. Thelikely impact of these developments on the Indianeconomy, going forward, will depend upon the effectit will have on trade, capital flows and globalcommodity prices.
Growth Outlook for 2011-12
I.29 After above trend growth during 2010-11,growth is expected to decelerate but remain close tothe trend of about 8.0 per cent in 2011-12. Growthprospects for the year 2011-12 seem to be relativelysubdued compared to the previous year due to anumber of unfavourable developments. Globaluncertainties have increased. If global financialproblems amplify and slows down global growthmarkedly, it would impart a downward bias to thegrowth projection indicated in the First Quarter Reviewof Monetary Policy 2011-12. Currently, global oil andcommodity prices even, after some correction, remainhigh and could adversely impact growth. Persistentinflationary pressures, rising input costs, rise in costof capital due to monetary tightening and slow projectexecution are some of the factors that are weighingon growth. While the prospect for the farm sector looksencouraging with the normal South-West monsoonso far, industrial sector growth is likely to deceleratedue to above mentioned factors. The growth of theservices sector will be driven by the unfolding of theglobal and domestic economic situation, but is largelyexpected to keep its momentum.
I.30 At the sectoral level, crop prospects remaingood, except in the case of some cereals, pulses andgroundnut. The monsoon up to August 17, 2011 was
just 1 per cent below the Long Period Average. Arainfall deficiency in Haryana, Orissa and parts ofNorth-East, Maharashtra and Andhra Pradesh mayhave small adverse impact. However, RBI’s overallfoodgrains production weighted rainfall index was 101till August 17, 2011, compared with 88 in thecorresponding period last year. Sowing up to August12, 2011 was marginally higher than in correspondingperiod of the previous year. On the whole, theprospects for agriculture at this juncture appearpromising, though the growth is likely to turn out tobe less than last year on a high base.
I.31 The outlook for the industrial sector in 2011-12 remains uncertain with the downside risksoutweighing the upside risks. The downside risks tothe industrial growth in 2011-12 may arise from (i)falling business confidence in face of globaluncertainties and political factors, (ii) firm commodityprices amidst inflationary pressures, (iii) tightening ofmonetary conditions and (iv) weak supply response.Fixed investment growth has slumped to 0.4 per centin the last quarter of 2010-11. Private consumptionmay moderate if inflationary pressures persist. Thecore sector performance is lagging behind the overalleconomic activity, resulting in infrastructurebottlenecks. The power sector growth in 2011-12, inparticular, may moderate if the coal sector continuesto underperform, with thermal power accounting forabout 70 per cent of total power generation in India.
I.32 On the positive side, the June IIP growth of8.8 per cent has bucked the trend of industrial growthentering a soft patch. Though the acceleration isdriven by capital goods that exhibit volatile output frommonth to month, it has helped register a 6.8 per centIIP growth in Q1 of 2011-12. Industrial growth aheadmay derive support from domestic demand due torising income of people from higher salaries andwages. Though demand for some interest rate-sensitive sectors has been impacted, overallconsumption demand has remained strong in spiteof rising prices and interest rates. In spite of highinflation, real demand has not suffered as wage

ASSESSMENT AND PROSPECTS
7
inflation, especially in rural areas has outstrippedcommodity price inflation.
I.33 There is a very strong structural dimension toservice sector growth in India, especially with factorssuch as low product penetration, favourabledemographics and strong demand from rural/semi-urban areas shielding services such as transport,communication, finance and insurance from a cyclicalslowdown in the industrial sector. The hotel andrestaurant segment is expected to register robustgrowth during 2011-12 driven by domestic demand.The outlook for external demand driven services,however, continues to remain uncertain, given thatglobal growth is weakening again.
I.34 On current reckoning, real GDP growth isexpected to moderate to around 8.0 per cent in 2011-12 from 8.5 per cent in 2010-11. At the same time, itis expected that the robustness of the services sector,which accounts for more than 65 per cent of GDP,would continue to support the growth process. Evenso, there are major downside risks to growth during2011-12 that may arise if (i) global financial conditionsworsen, (ii) global recovery weakens further, or(iii) food and non-food commodity price inflationremain high. From the demand side, moderation isexpected as investment may remain soft in the nearterm, while private consumption may decelerate. Inface of moderating demand, expenditure-switchingfrom government consumption expenditures to publicinvestments would help.
Inflation Outlook for 2011-12
I.35 Inflation is likely to remain high and moderateonly towards the latter part of the year to about7 per cent by March 2012. With global growthenvironment deteriorating, global commodityprices, including crude oil, have weakened since thefourth week of July. However, the decline has notbeen very significant. Should the global recoveryweaken ahead, commodity prices may declinefurther, which should have a salutary impact ondomestic inflation.
I.36 Given the fiscal limitations and growing signsof weakness in the US, the Fed has already indicatedthat it will pursue its near zero rate policy at least tillmid-2013. It has also hinted at another dose ofquantitative easing. This policy stance may keep thecommodity prices elevated. Global commodity pricescurrently remain far above their level in the previousyear. The pass-through of the rise in global commodityprices till April 2011 has been incomplete, especiallyin the minerals and oil space. As such, the benefit ofa moderate fall in global commodity prices ondomestic price level would be limited.
I.37 On a year-on-year basis, inflation may remainstubborn in the near term and start falling sometimesin the third quarter of 2011-12. Incomplete pass-through of high global commodity prices andpersistence of high inflation expectations amidstcontinuing food price pressures may keep inflationelevated in near term. If global oil prices stay at currentlevel, further increase in prices of administered oilproducts will become necessary to contain subsidies.Fertiliser and electricity prices will also require anupward revision in view of sharp rise in input costs.
I.38 The high and persistent inflation over the lasttwo years has brought to the fore the limitation inarresting inflation in absence of adequate supplyresponse. However, monetary policy still has animportant role to play in curbing the second roundeffects of supply-led inflation. In face of nominalrigidities and price stickiness, there are dangers ofaccepting elevated inflation level as the new normal.Doing so can un-anchor long term inflationexpectations, which can then lift inflation further fromthe present level. This can eventually lead to a hardlanding, which may impose large costs of disinflation.
Outlook on the twin deficits for 2011-12
I.39 In the context of weakening global economyand the likelihood of some spillovers to the domesticeconomy during 2011-12, the twin deficits requireclose monitoring. If the global crisis deepens anddomestic economy slows down beyond what is

ANNUAL REPORT
8
currently anticipated, the fiscal slippage could turnout to be an issue of concern. It could potentially erodethe fiscal consolidation achieved in the previous year.On current assessment, the fiscal deficit in 2011-12is likely to overshoot the budgeted projections. If theeconomy slows down beyond what is currentlyanticipated, the resultant revenue erosion couldmagnify the slippage. At the same time, the fiscalspace to support any counter-cyclical policies is morelimited than what existed at the time of the global crisisof 2008.
I.40 On the other hand, in the baseline scenario,the CAD would remain at a sustainable level in 2011-12. Estimates of sustainable CAD suggest a thresholdof 2.7-3.0 per cent of GDP. Prospects for externalsector for 2011-12 remain somewhat uncertain dueto global uncertainties arising from the financial turmoilfollowing the sovereign rating downgrade of the US,slowing pace of global recovery and the sovereigndebt problems in the Euro area. These could impingeon commodity prices and exchange rate movements.
I.41 The continuance of robust performance ofexports recorded in 2010-11 and 2011-12 so far facesdownside risks. If these problems continue to simmerand do not turn into a full-blown crisis, the impact ofgrowth slowdown in the advanced economies on Indiacould partly be mitigated by continued diversificationof exports. India’s exports have diversified notably incomposition and destination in recent years. Theimpact could, nevertheless, turn material in case theslowdown in global growth is sharp and widespread.
I.42 Services exports are also likely to expand dueto India’s comparative advantage in software services.As the Indian IT industry is inter-twined with the globaleconomy, with the US and Europe constituting thebulk of Indian software exports, some impact from aslowdown in advanced economies can be expected.National Association of Software and ServicesCompanies (NASSCOM), which serve as thechambers of commerce for the Indian IT and BPOcompanies, had projected software exports in dollarterms to grow by 16-18 per cent in 2011-12. Several
pointers suggest that a growth of broadly similar ordercould still be attained. These include (i) better-than-expected dollar revenues by software firms in Q1 of2011-12, (ii) reasonably good guidance for Q2, (iii)locked-in contracts this year and (iv) good corporateearnings and cash on balance sheet of the US firmsin spite of sluggish growth. As such, any downsideimpact would be marginal in the near term. However,it can become perceptible with a lag if crisis assumessevere proportions impacting global growth prospectsbeyond current year. For the current year, theprospects are that services exports as well as privatetransfers are likely to remain stable despite problemsin the US, Europe and MENA countries.
I.43 As regards capital flows, the impact is moredifficult to gauge. Capital flows could surge ordiminish, depending upon the degree of risk aversionamong several other factors. Going forward, if globalcrisis turns deep, capital flows are more likely tomoderate as (i) foreign portfolio investors may sellequities in the EMEs, including India to cover uplosses elsewhere, (ii) risk aversion may raise the costof borrowings for the Indian corporate and also impactdirect investments, and (iii) domestic bonds could stillremain less attractive if a slowdown impacts fiscalposition adversely.
I.44 On the other hand, capital flows to India couldincrease in spells as relative returns in EMEs couldnow be still higher. Several investors view thevaluation in the Indian stock market as attractive onan expected future earnings basis. Interestdifferentials are likely to remain large and alluring todebt flows. With India’s growth prospects still broadlyintact, its attractiveness as an investment destinationmay increase. In the short run, if commodity pricessoften and global crisis remains contained, theresultant benefit it may have in lowering inflation, fiscaland current account deficits could attract freshinvestments. Therefore, the possibility of lumpy capitalinflows cannot be ruled out. Over the course, capitalflows could remain volatile and may depend on howtrade and capital flows, as also other macro-economicparameters, respond endogenously to exchange ratemovements.

ASSESSMENT AND PROSPECTS
9
I.45 Overall, the year 2011-12 appears to havebegun well from the balance of payments front.Exports in dollar terms have risen 54 per cent year-on-year during April-July 2011, while imports haveexpanded 40 per cent. As a result the size of the tradedeficit in absolute terms during the first four monthshas remained largely unchanged from that in thecorresponding period of the previous year. On thecapital flows side, FDI to India in Q1 of 2011-12 hasrisen more than twice that in the corresponding periodof the previous year. The prospects for FDI alsoappear bright as further policy initiatives are on theanvil. The debt component of the capital inflows couldrise with rising interest rate differential. However, thebalance of payments during 2011-12, although likelyto be manageable, requires constant monitoring dueto global uncertainties.
RESERVE BANK’s PERSPECTIVE ONTHE MEDIUM-TERM CHALLENGES FOR
THE INDIAN ECONOMY
I.46 While the immediate challenge to sustaininghigh growth lies in bringing down inflation, growthsustainability over medium-term depends onaddressing the structural bottlenecks facing theeconomy. There are several challenges faced by theIndian economy that are constraining growth. Theseinclude those relating to education, health, energy,infrastructure and agriculture sectors, where publicpolicy interventions are needed as markets bythemselves may not be able to do enough to removethe constraints. The Reserve Bank does not have adirect role in addressing most of these. However,addressing them is central to raising the potential levelof growth in the Indian economy. Some of these arediscussed below.
Lowering inflation and inflation expectations toacceptable levels
I.47 What policy interventions can help to lowerinflation and inflation expectations to acceptablelevels? Monetary policy has an important role to play,but may find it difficult to deliver the objective unless
complementary policies are put in place. Theseinclude, improved supply response for food, higherstorage capacity for grains, cold storage chains tomanage supply-side shocks in perishable produceand market-based incentives to augment supply ofnon-cereal food items. Finally, supply response wouldalso depend on better management of water as alsotechnical and institutional improvements in the farmsector and allied activities. Land consolidation,improving land quality, better seeds, irrigation,harvesting, technologies and supply chain to retailpoints all can contribute to lowering inflation and theinflation expectations that are formed adaptively.
I.48 Tackling food inflation also needs a strategyto break the inertial element arising from rising realwages leading to increases in the Minimum SupportPrice (MSP), which in turn lead to higher food inflationthat feeds back to higher wages with an element ofindexation. Some public policy interventions may bedesirable in this regard. Rural wage programmesneed to be linked with productivity. If productivityimproves, real wages can rise without putting pressureon prices. The inclusion agenda can then be pursuedon a sustainable basis without drag on inflation andthe fiscal position.
I.49 Transmission of inflation from abroad has alsobeen an important element in keeping inflation highin the recent years. International commodity pricesremain a potential threat as global liquidity is still fartoo large due to monetary policy accommodation byadvanced countries. Fuel and food security wouldneed to be given particular attention. There is a needfor environmentally sustainable solutions to manageenergy security. Free pricing of petroleum productscan help, as a large population cannot be subsidisedin an import dependent item. Finally, pricing power inthe manufacturing sector has macro as well as microangles. A competition policy has been put in placeand industrial organisation structures could be studiedalong with price information to stamp out anti-competitive practices and collusive behavior. Suchbehavior also adds to inflationary pressures andneeds to be curbed.

ANNUAL REPORT
10
Harnessing technology for agricultureproductivity enhancements
I.50 India is a knowledge economy with a strongtechnology base. Yet, it has not fully reaped thedividends from technology. For instance, substantialproductivity enhancements are possible on the farmsector through better adoption of technology aidedby incentives and institutional improvement. Largescale introduction of Precision Farming Techniquesinvolving GIS and Remote Sensing, combined withlocal-specific fertigation practices, better cultivarsand optimal water management can go a long wayto improve farm productivity on a sustainable basis.The decline in availability of land for foodgrainproduction due to increasing urbanisation anddiversion of bio-fuels makes it important thattechnology is harnessed for improving yields. Betteradoption of modern technologies in the area ofbiotechnology, genomic tools, cost-effective and eco-friendly integrated pest management technologies,seed-supply chains and systems, regionally adaptedvarieties and hybrids, especially drought-resistantvarieties can also help in improving farm output.Focus on better water harvesting, especially indryland regions, and institutional reforms such ascreation of infrastructure and laws for digitising landrecords in the country through appropriate legalframework would help.
I.51 Importantly, the approach to technologyadvancement has to be eco-friendly. It should focuson providing favourable soil conditions by managingsoil organic matter and enhancing soil biologicalactivity; improving soil and water conservationmeasures; reducing excessive reliance onhydrocarbon inputs; minimum or zero tillage; rotationgroups to manage soil fertility and pests; integratedpest management (IPM); and exploitingcomplementarities in the use of genetic resources bycombining these in farming systems with a highdegree of genetic diversity. Resource conservationtechnologies that improve input use efficiency, andconserve and protect natural resources need to beaggressively promoted.
I.52 Rainfed agriculture continues to play animportant role in India, contributing around 55 per centof the cropped area and 45 per cent of the totalagricultural output. Since irrigation potential in Indiais not fully used, there is scope for significantlyincreasing agricultural production. Rainfed areascontribute more than 70 per cent of the pulses andoilseeds production as well as a substantial part ofhorticulture and animal husbandry produce. There is,therefore, a need for a comprehensive irrigation/watermanagement strategy as water is probably going tobe the most scarce resource in the twenty-first century.
I.53 Water management is particularly important.Worldwide, ground water is preferred to surface dueto easier accessibility in terms of place, time andquantity. This has been the case in India also as seenin the shift from canal irrigation in the 1970s to groundwater in the 1990s. Currently, as per the Third MinorIrrigation Census, 2005, 75-80 per cent of the irrigationpotential is under groundwater, bulk of which are wells- dugwells, shallow and deep tube-wells - and mainlyin private hands. Notwithstanding scarcity, competinguses of water, and the consumptive nature of wateruse in agriculture, policy for agricultural reforms hasto take into account the need to evolve programmesfor recharge and management of the groundwaterreserves of the country, so that extraction is limitedonly to what we can annually recharge. Natural andincidental recharge based on factors like rainfall, soilcharacteristics and geomorphology cannot sustaingroundwater given the rate at which it is beingconsumed. Emphasis on steps like water harvesting,cultivation of high value and low water requiring crops,such as pulses and oilseeds in water scarce areas,using water-saving methods of cultivation like Systemof Rice Intensification (SRI) methodology for paddyand sugarcane, seawater farming for crops that thrivein salt water in coastal areas and investment inresearch to promote water-efficient crops couldfacilitate in achieving long-term sustainability inagricultural production.
I.54 In order to step up agriculture growth from atrend of around 3 per cent per annum to 4 per cent
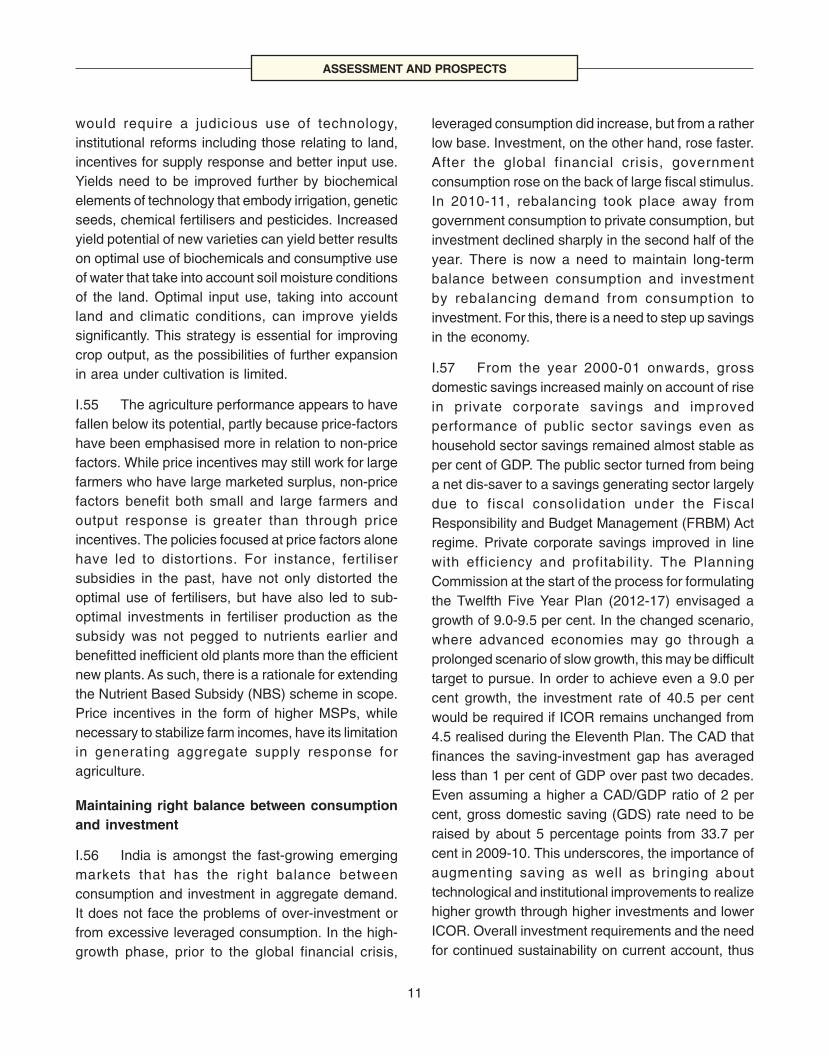
ASSESSMENT AND PROSPECTS
11
would require a judicious use of technology,institutional reforms including those relating to land,incentives for supply response and better input use.Yields need to be improved further by biochemicalelements of technology that embody irrigation, geneticseeds, chemical fertilisers and pesticides. Increasedyield potential of new varieties can yield better resultson optimal use of biochemicals and consumptive useof water that take into account soil moisture conditionsof the land. Optimal input use, taking into accountland and climatic conditions, can improve yieldssignificantly. This strategy is essential for improvingcrop output, as the possibilities of further expansionin area under cultivation is limited.
I.55 The agriculture performance appears to havefallen below its potential, partly because price-factorshave been emphasised more in relation to non-pricefactors. While price incentives may still work for largefarmers who have large marketed surplus, non-pricefactors benefit both small and large farmers andoutput response is greater than through priceincentives. The policies focused at price factors alonehave led to distortions. For instance, fertilisersubsidies in the past, have not only distorted theoptimal use of fertilisers, but have also led to sub-optimal investments in fertiliser production as thesubsidy was not pegged to nutrients earlier andbenefitted inefficient old plants more than the efficientnew plants. As such, there is a rationale for extendingthe Nutrient Based Subsidy (NBS) scheme in scope.Price incentives in the form of higher MSPs, whilenecessary to stabilize farm incomes, have its limitationin generating aggregate supply response foragriculture.
Maintaining right balance between consumptionand investment
I.56 India is amongst the fast-growing emergingmarkets that has the right balance betweenconsumption and investment in aggregate demand.It does not face the problems of over-investment orfrom excessive leveraged consumption. In the high-growth phase, prior to the global financial crisis,
leveraged consumption did increase, but from a ratherlow base. Investment, on the other hand, rose faster.After the global financial crisis, governmentconsumption rose on the back of large fiscal stimulus.In 2010-11, rebalancing took place away fromgovernment consumption to private consumption, butinvestment declined sharply in the second half of theyear. There is now a need to maintain long-termbalance between consumption and investmentby rebalancing demand from consumption toinvestment. For this, there is a need to step up savingsin the economy.
I.57 From the year 2000-01 onwards, grossdomestic savings increased mainly on account of risein private corporate savings and improvedperformance of public sector savings even ashousehold sector savings remained almost stable asper cent of GDP. The public sector turned from beinga net dis-saver to a savings generating sector largelydue to fiscal consolidation under the FiscalResponsibility and Budget Management (FRBM) Actregime. Private corporate savings improved in linewith efficiency and profitability. The PlanningCommission at the start of the process for formulatingthe Twelfth Five Year Plan (2012-17) envisaged agrowth of 9.0-9.5 per cent. In the changed scenario,where advanced economies may go through aprolonged scenario of slow growth, this may be difficulttarget to pursue. In order to achieve even a 9.0 percent growth, the investment rate of 40.5 per centwould be required if ICOR remains unchanged from4.5 realised during the Eleventh Plan. The CAD thatfinances the saving-investment gap has averagedless than 1 per cent of GDP over past two decades.Even assuming a higher a CAD/GDP ratio of 2 percent, gross domestic saving (GDS) rate need to beraised by about 5 percentage points from 33.7 percent in 2009-10. This underscores, the importance ofaugmenting saving as well as bringing abouttechnological and institutional improvements to realizehigher growth through higher investments and lowerICOR. Overall investment requirements and the needfor continued sustainability on current account, thus

ANNUAL REPORT
12
underscore the need for attaining the highs of privatecorporate and public sector savings reached in therecent past and exploring the possibility of invokingan upward shift in household savings which haveremained stable for many years.
Facilitating energy security
I.58 Amidst high growth, India faces a large energydeficit that can eventually constrain the growth.Factoring the current and expected trends in supplyand demand of energy in India, India’s energy deficitcould double by the end of the Twelfth Plan from about170 million tonnes of oil equivalent during 2010-11.By the end of the Twelfth Plan, India may need toimport 40 per cent of its energy requirements.Demand-supply gaps could be particularly large incoal and crude oil. This will put pressure on energyprices and balance of payments.
I.59 India will need to augment its domestic energyproduction. At the same time, moderation of demand,efficient energy usage and alternative sources ofenergy will have to form the three pillars for achievingenergy security. Price increases would be necessaryto incentivise energy conservation, curb demand andsupport supply response through capacity addition.Also, public policy support for augmentation ofdomestic hydrocarbons, coal and power outputthrough public and private investments is necessary.The demand-supply gap for crude oil, petroleumproducts as well as natural gas in India is likely torise. As the Ninth Round of auctioning explorationblocks under the New Exploration Licensing Policy(NELP IX) has not received adequate response, thestrategy will need to be re-worked to create enablingfinancial and regulatory environment where publicand private sectors effectively participate in theexploration.
I.60 India has large coal reserves; coal blockauctions could be front-loaded. Pipeline investmentin power projects is large, but once the projects goon-stream, their optimal utilisation requires that coalsupply issues be resolved. This is a priority that
would entail better planning and coordinationamongst concerned agencies and stakeholders. Itis important to ensure that not only do existing powerplants get adequate coal supply, but newer plantsare also able to secure input supplies so that theystart off in time with a reasonable load factor. As alarge amount of bank finance is locked in theinfrastructure sector, the viability of newinfrastructure projects need to be ensured in orderto avoid any restructuring needs.
Facilitating infrastructure finance
I.61 As per the assessment of the PlanningCommission, during the Twelfth Plan (2012-17) Indiamay need infrastructure investments of over US$ 1trillion. This poses a mammoth financing task. Theinfrastructure gap of India, both in relation to othermajor countries and its own growing demand hasbeen a key factor affecting the overall productivity ofinvestments. The requirement of high initial capitaloutlay, that too over longer terms, necessitatesmeasures to address the financing constraint tocapacity expansion in infrastructure. The financingissue relates not only to possible resource gap, butalso to ensure commercially viable funding thatremains so over business cycles.
I.62 Infrastructure investment during the TwelfthPlan will need to be funded by both, public and privatesectors. Despite increasing participation of the privatesector in bridging the infrastructure gap, publicinvestment still has to play a significant role. Fiscalconsolidation and reorientation of expendituretowards capital expenditure is required to meet thetarget. The banking system, despite the risk of asset-liability mismatch while lending long-term forinfrastructure projects, has seen high growth in creditto this sector in recent years.
I.63 In the recent past, several measures havebeen taken to support development of corporate bondmarket to facilitate long-term finance so thatinfrastructure investment can pick up. The FII limit oninvestments in corporate bonds has been raised to

ASSESSMENT AND PROSPECTS
13
US$40 billion. FIIs can now invest in corporate bondsof residual maturity of over five years issued bycompanies in infrastructure sector up to US$25 billionwithin the overall limit. Disclosure norms have beensimplified and withholding tax on investment in IndiaInfrastructure Development Fund (IDF) bonds hasbeen reduced. Banks, Primary Dealers andinvestment banks have all been allowed as marketmakers. In the secondary market, repos in corporatebonds have been allowed and new 91-day IRFproduct has been launched. CDS are also expectedto be take off in near term. Reporting platform onOTC interest rate derivatives is now in place and DvPhas been facilitated through transitory pooling ofaccounts.
I.64 Further measures are, however, needed toimprove the flow of resources to infrastructure sectoron a commercial basis. These include, rationalisationof stamp duties across States and re-look at taxtreatment of Pass Through Certificates (PTC). Partialcredit enhancement by banks is an option, but hasits own problems. Alternative means of risk mitigationthrough CDS or bond insurance are being explored.More players are also needed to help corporate bondmarket acquire depth and vibrancy.
Promoting financial inclusion and inclusivegrowth
I.65 Long-term growth sustainability criticallydepends on achieving inclusive growth. In turn,financial inclusion is a necessary condition forachieving this. Inclusion strategy aims at not just thepace of growth, but its pattern with a view to cover allin the growth process. It allows people to contributeto as well as benefit from economic growth. Financialinclusion refers to delivery of financial services ataffordable costs to the low income or disadvantagedgroups in a fair and transparent manner bymainstream institutional players. To support inclusivegrowth through financial inclusion, the Reserve Bankof India has been encouraging banks to open no-frillaccounts with inbuilt overdraft facility, developingsuitable recurring deposits, remittance facilities suited
for pattern of cash flows for poor and rural households,small loans for entrepreneurial activity and offeringmicro insurance facility.
I.66 Availability of finance is the most importantfactor in promoting a sustainable model for inclusivegrowth. However, there are several barriers toinclusive growth. Investments in agriculture,infrastructure, human capital formation througheducation, health and skill formation are critical toinclusive growth. For instance, about one crore peoplewill seek to enter the workforce each year over thenext decade, posing challenges for employment andskilling. The demographic dividend will turn out to bea threat if skill formation does not gather pace.Recognising this, a National Policy on SkillDevelopment is now being implemented. Finance isimportant for supply of all these activities. Inclusivefinance is necessary for supporting the demand forthese activities, so that these can be paid for.
I.67 Financial inclusion is an important priority ofthe Reserve Bank as only 30 per cent of thecommercial bank branches are in rural areas and only61 per cent of the country’s population has bankaccounts. It is both a national commitment and a policypriority especially when a large section of populationlacks access to even the most basic formal financialservices. The Reserve Bank has taken the task offinancial inclusion in mission mode and has fosteredan enabling regulatory and policy environment byliberalising branch licensing, mandating banks toopen 25 per cent of new branches in unbanked ruralcentres, permitting large number of entities includingcorporates to function as Business Correspondents(BCs) and Business Facilitators (BFs), introducinginnovative products and encouraging use oftechnology for reaching the unbanked.
I.68 The list of medium-term challenges discussedabove is not exhaustive. They, however, illustrate thatwhile demand management through counter-cyclicalmonetary and fiscal policies has a role to play incontaining inflation and in stabilising growth aroundits trend, an increase in the trend growth would require

ANNUAL REPORT
14
policies that remove structural constraints over themedium term. India remains a country with substantialgrowth potential, given the natural resources, humancapital endowment, demographic dividends, itsknowledge base and increasing openness. However,the potential can only be reaped through technologyimprovements, productivity enhancements, reducingenergy deficits, development of infrastructure,
stepping up saving and investment, pursuit ofinclusive growth and lowering inflation on an enduringbasis. It should be possible to target a higher growthunder the Twelfth Plan than the current trend.However, to maintain macro-economic stability withfaster, more inclusive and sustainable growth, thePlan would need to address the medium-term issuesupfront.

15
II.1.1 2010-11 marked the completion of the processof recovery from the adverse impact of the globalfinancial crisis and the consequent slowdown of theglobal economy. Slack in the advanced economies,with their output gap estimated at 3.4 per cent in 2010,as also the uncertainty about their future growth,employment and debt still impinge upon the activitylevels in India. However, growth in India was back tothe earlier high growth path.
II.1.2 Starting in double digits, headline inflationremained elevated throughout 2010-11. Withvegetable prices spiking following unseasonal rainsafter a good monsoon and global commodity pricesfirming up in the second half of 2010-11, inflationexpectations started to feed on themselves and cost-push factors from the manufacturing side exertedpressures on inflation. Inflation turned persistent andgeneralised as a result. The stance of monetary policycontinued to be anti-inflationary during the course of2010-11 and in the year so far to contain inflation andanchor inflation expectations.
I. THE REAL ECONOMY
Growth rebounds strongly in 2010-11
II.1.3 Real GDP growth at factor cost increased to8.5 per cent in 2010-11 from 8.0 per cent in 2009-10(Appendix Tables 1 and 2). At this pace, the real GDPgrowth rate increased for the second successive year
Growth rebounded strongly in 2010-11, after the dip in 2008-09 in the wake of the global financial crisis and the
recovery in 2009-10. However, inflation rose and remained stubbornly high throughout 2010-11 as supply-side
shocks got generalised amidst strong aggregate demand. With added risks to growth from inflation above the
threshold level where growth-inflation trade-off can work, the Reserve Bank responded with eleven rate hikes between
March 2010 and July 2011. This lifted effective policy rates by 475 basis points in the current interest rate cycle. As
a result of monetary tightening and deteriorating global economic conditions, some moderation in growth and
significant moderation in inflation from the later part of the year is anticipated going forward. However, risk to
demand compression remains from likely slippage on envisaged fiscal consolidation.
after the global crisis-induced sharp slowdown in2008-09.
II.1.4 The main impetus to growth during 2010-11emanated from agriculture which rebounded toabove-trend growth rate on the back of a normalmonsoon. Reflecting this, the contribution ofthe agriculture sector to overall GDP growthincreased sharply in 2010-11 (Chart II.1). Servicessector continued to be the predominant driver ofgrowth, though its growth was slightly lower thanthe average in the pre-crisis high growth phase of2003-08.
Sustainability of high growth – enabling conditions
II.1.5 Growth is expected to moderate to the trendlevel of about 8 per cent in 2011-12. If globalconditions worsen, downside bias to this projectionmay arise. This raises concern about sustainabilityof the high growth over the medium to long-term.The Planning Commission in its paper on Issues forthe Approach to the Twelfth Plan (2012-17) proposeda growth target of 9.0-9.5 per cent. A pre-requisitefor high growth is upfront removal of structuralconstraints with close attention on legal andinstitutional framework, as also execution andgovernance. In the short run, growth will have tocontend with risks from low agricultural productivity,poor infrastructure, high global commodity prices,quality of corporate governance and low productivity
II ECONOMIC REVIEW

ANNUAL REPORT
16
enhancement in the manufacturing sector.Furthermore, the substantial increase in oil prices in2010-11 and 2011-12 so far, has raised concernsabout the near-term growth (Box II.1).
II.1.6 Calculations suggest that aggregate savingand investment rates need to be stepped up from 33.7per cent and 36.5 per cent of GDP in 2009-10, inorder to achieve GDP growth of 9.5 per cent,envisaged for the Twelfth Five Year Plan. Aninvestment rate of around 38-39 per cent with an ICORof around 4.1(as was envisaged for the Eleventh FiveYear Plan) would be required. Thus, the investmentrate needs to be stepped up by 2.5-3.0 percentagepoints. The gross domestic saving rate needs to beaugmented to 37 per cent or more. This underscoresthe importance of at least attaining the high levels ofprivate corporate and public sector savings reachedin the past. Furthermore, there is a need for stepping
up of household savings, which have stagnated inrecent years, largely reflecting the reallocation ofsavings between financial and physical assets as wellas the near synchronous movement of changes infinancial assets and financial liabilities (Chart II.2 andAppendix Table 3).
II.1.7 Preliminary estimates based on latestavailable information show that net financial savingsof the household sector moderated to 9.7 per cent ofGDP at current market prices in 2010-11 from 12.1per cent in the previous year (Chart II.3 and AppendixTable 4). The decline in the net financial savings rateof the household sector reflected the slower growthin households’ savings in bank deposits and lifeinsurance fund as well as an absolute decline ininvestment in shares and debentures, mainly drivenby redemption of mutual fund units. Even so, therewas a shift in favour of small savings and currency
Chart II.1: Real GDP Growth
a: Contribution to GDP Growth
0.0
20.0
40.0
60.0
80.0
100.0
120.0
2006-07 2007-08 2008-09 2009-10 2010-11
Per
cen
t
6.0
6.5
7.0
7.5
8.0
8.5
9.0
9.5
10.0
Per
cen
t
Agriculture & allied activities Industry Services
GDP growth (RHS)
b: Growth Rate
-2.0
0.0
2.0
4.0
6.0
8.0
10.0
12.0
14.0
2006-07 2007-08 2008-09 2009-10 2010-11
Per
cen
t
Agriculture & allied activities Industry Services
Chart II.2: Saving and Investment (Per cent of GDP at current market prices)
a. Gross Domestic Saving
2.4 3.6 50.5 2.1
23.5 23.2 22.5
23.823.5
7.5 7.99.4
7.98.1
0
5
10
15
20
25
30
35
40
2005-06 2006-07 2007-08 2008-09 2009-10
Public Sector Household Sector
Private Corporate Sector Gross Domestic Saving
b. Gross Capital Formation
0
5
10
15
20
25
30
35
40
2005-06 2006-07 2007-08 2008-09 2009-10
Public Sector Household Sector Private Corporate SectorValuables Gross Capital Formation
7.9 8.3 8.9 9.5 9.2
11.7 11.9 10.813.1 11.7
13.6 14.5 17.3 11.5 13.2
1.11.2
1.11.3 1.7

ECONOMIC REVIEW
17
Box II.1Would Firming Oil Prices Cringe Growth?
The oil price shocks of 1970s were associated with sharpoutput losses and large inflationary pressures. In the 2000s,even larger increases in the price of oil were associated withmuch softer impact on these macroeconomic variables. The1973 oil embargo in the wake of the Arab-Israeli War andthe 1979 oil price surge following the Iranian Revolution sawthe supply of oil falling. In contrast, the 125 per cent rise inoil prices during 2002-06 was driven primarily by excessglobal liquidity and rising demand for oil.
That raises the question whether we need to worry aboutthe rising oil prices in 2011. Blanchard and Gali (2007) foundthat the oil prices are no longer correlated with businesscycle as structural changes have weakened and modifiedthe transmission mechanism of oil shocks. Further worksuggests that this change is attributable to wage rigiditiesand anchored inflation expectations in recent period. Also,economic agents have viewed the recent episodes of firmingoil prices as temporary and volatile movements.
The impact of oil prices on growth is, however, corroboratedby the IMF’s World Economic Outlook, April 2011. It estimatedthat if global oil prices average US$ 150/barrel in 2011, itwould lower real GDP growth in advanced economies by0.75 per cent, while output loss in emerging and developingeconomies could vary from 0.75 per cent in Asia and sub-Saharan Africa to 0.5 per cent in Latin America. There is,thus, good reason for not being complacent about themacroeconomic adjustment that may become necessary ifglobal oil prices firm up significantly. Bodenstein, et al. (2007)demonstrated that the impact differs from country to countryand ultimately depends on the oil dependence, the structureof financial market and risk-sharing, critically hinging onstructural parameters.
Trading environment in the oil markets in 2011 remainsuncertain with hedge funds liquidating and re-building positionscausing volatility in prices. Event risks such as the politicalturmoil in the Middle East and North Africa (MENA) region,the Japanese quake shutting oil refineries and the sovereigndefault risks in the Euro zone have time and again reversedthe otherwise firming oil prices on the back of global recoverybroadly staying on track. The price of the Indian basket ofcrude rose from an average of US$ 69.8/barrel in 2009-10 toUS$ 85.1/barrel in 2010-11 and further to US$ 118.5/barrel inApril 2011, before declining to US$ 110.6/barrel in May 2011on expectations of weaker global growth (Chart 1). Oil pricesmoderated temporarily in June 2011 on account of the decisionof the International Energy Agency (IEA) members to release60 million barrels of crude from their strategic reserves to offsetsupply disruptions, but edged up again, averaging US$ 112.4/barrel during July 2011. Following the US sovereign ratingdowngrade by S&P, oil prices fell again averaging US$ 106.6/barrel in the first fortnight of August 2011. Even with this, theAugust price of the Indian basket of crude is 25 per cent higherthan its average during 2010-11.
In the case of India, imports accounted for 87.3 per cent oftotal domestic oil requirement in 2010-11. Net oil imports (oilimport less oil export) accounted for 65.3 per cent of totalmerchandise trade deficit in 2010-11. Though it is difficult toprecisely quantify the impact of oil price on growth, a smallmacro model developed to evaluate the impact of oil priceshock on India’s economic growth suggests that the impactcould be somewhat significant. The model comprises sevenstructural equations pertaining to consumption, investment,government consumption expenditure, net exports and pricesof non-oil commodities and two major identities relating tonational income and aggregate wholesale price index (WPI)comprising prices of oil and non-oil commodities. Resultsshowed that a 10 percentage point increase in oil priceinflation, if passed through fully, would lead to a reduction inreal GDP growth by about 0.3 percentage point. It wouldalso raise WPI inflation by 1.0 percentage point through directimpact, with total impact after subsequent rounds of feedthrough estimated at about 2.0 percentage points. Thesereflect broad approximations and actual impact may dependon several factors. With existence of non-linearities, theadverse impact is greater if oil prices change above the 10per cent threshold.
References:
Bodenstein, Martin, Christopher J. Erceg, and Luca Guerrieri(2007), “Oil Shocks and External Adjustments”, InternationalFinance Discussion Paper No.897, Board of Governors ofthe Federal Reserve Board.
Blanchard, Olivier J. and Jordi Gali (2007), “TheMacroeconomic Effects of Oil Shocks: Why Are the 2000sso Different from the 1970s?”, NBER Working Paper No.13368, September.
Petroleum Planning and Analysis Cell, GoI.
Chart 1: Crude Oil Price Trends
Jan
-08
Apr-
08
Ju
l-08
Oct-
08
Jan
-09
Apr-
09
Ju
l-09
Oct-
09
Jan
-10
Apr-
10
Ju
l-10
Oct-
10
Jan
-11
Apr-
11
US
$per
barr
el
Index
0
20
40
60
80
100
120
140
Global Crude Oil Price (Indian Basket)
Domestic Mineral Oil Index [WPI] (RHS)
120
133
146
159
172
185
Ju
l-11
during the year. Households’ financial liabilities,however, increased reflecting higher borrowings fromcommercial banks. Notwithstanding the pick-up in the
real GDP growth rate during 2010-11, persistently highinflation, relatively slower adjustment of bank depositrates and the volatility in the Indian equity market

ANNUAL REPORT
18
impacted by global macroeconomic uncertainties,affected the level and composition of net financialsavings of the household sector.
Strong rebound in agriculture growth in 2010-11
II.1.8 After two consecutive years of subduedperformance, agriculture turned into a significantdriver of growth in 2010-11. The simultaneousoccurrence of a normal and well-distributed south-west monsoon and excess north-east monsoon, thefirst occasion in the last one decade, enabled bothKharif and Rabi sowings to be above normal.Consequently, there was record foodgrain productionin 2010-11 (Appendix Table 5).
II.1.9 The progress of monsoon so far during 2011has been on the whole satisfactory. The monsoonarrived on time and by July 9, 2011 had covered theentire country; a week earlier than scheduled. As onAugust 17, 2011, cumulative rainfall since the start ofthe monsoon season was normal at 1 per cent belowthe Long Period Average (LPA). The IndiaMeteorological Department (IMD) had revised its initialforecast of normal monsoon in 2011-12 to slightlybelow normal monsoon at 95 per cent of the LPA,with a model error of ±4 per cent. Spatially, themonsoon has been reasonably well-distributed,
though it has been so far deficient in Haryana, Orissaand some parts of North East, Maharashtra andAndhra Pradesh.
II.1.10 Though it is still early to predict the impact ofmonsoon on agricultural output, Kharif sowing isprogressing well and till August 12, 2011 wasmarginally higher than last year. However, sowingdeficiency is observed in case of coarse cereals,pulses, groundnut and sunflower. If this stays, supplymanagement would be needed to keep pricepressures at bay. Overall, the agricultural prospectsremain encouraging, even though growth is likely todecelerate on a high base.
Technology breakthroughs key to maintainingdemand-supply balances
II.1.11 There are several factors constrainingagriculture supply response thereby impactinginflation. The foremost relates to low productivity andmonsoon dependence. Presently, productivity levelsremain low and productivity differentials across Statesand crops continue to persist. The target growth rateof 4 per cent for the agriculture sector (Twelfth FiveYear Plan), in relation to the trend growth rate ofaround 3 per cent, will require considerabletechnological and institutional improvements.
II.1.12 Productivity in Indian agriculture is lowcompared with productivity at the world level andmajor producers such as China and the US(Chart II.4). Even the most productive States in thecountry fall short of the world standards in terms ofyields of major crops, namely, foodgrains, pulses andoilseeds. Further, there exists a wide variation inproductivity of these crops across States/regions(Chart II.5). This is significant given the importdependence for edible oils and pulses. Increase infoodgrain productivity can be realised by ensuring soilconservation, which has been neglected and use ofoptimal and locale-specific agricultural practices andintroduction of precision agriculture.
II.1.13 India’s self-sufficiency in food and other agro-products can be endangered if technology
Chart II.3: Household Financial Savings
0
2
4
6
8
10
12
14
16
2008-09(revised)
2009-10(revised)
2010-11(provisional)
Per
cen
tto
GD
Pat
cu
rren
tm
ark
et
pri
ces
Change in Financial Assets (gross)
Change in Financial Liabilities (gross)
Net Fianancial Savings

ECONOMIC REVIEW
19
advancements do not keep pace with growingdemand stemming from rising population and incomelevels. Policy interventions are required to supportsustainable growth in crop production andenvironmental protection through development ofimproved and diversified cultivars, eco-friendly andcost-effective pest management practices, efficientseed supply systems, and commercialisation of thediversified and alternative uses of crop produce. This,in turn, would improve farm incomes and food security,while helping to keep food inflation low.
II.1.14 Notwithstanding the sharp decline in the shareof agriculture in GDP from an average of 53 per centin the fifties to 19 per cent in the 2000s, 52 per centof the work force continues to be engaged inagriculture. With just around 44.6 per cent of the grosscropped area irrigated (as per the latest data availablefor 2007-08), the dependence of Indian agriculture
on rainfall remains preponderant (Chart II.6). It is inthis backdrop that public policy interventions to stepup investment and productivity enhancements foraugmenting food supplies, assumes importance.
Higher demand for protein-based items calls for urgentactions
II.1.15 In recent years, the demand for otheragricultural products, particularly, protein-basedproducts such as meat, eggs, milk and fish, and fruitand vegetables, have increased substantially. Thiscan be attributed to rising income levels of a fastgrowing economy leading to a change in the dietaryhabits of the people. The demand-supply mismatchesin the case of these items resulting from inadequatesupply response to structural changes in demandpattern have led to rising prices. Steps have beeninitiated to address the growing imbalance. TheNational Mission for Protein Supplements through
Chart II.4: Comparative Yield: India and the World(Tonnes per hectare)
April 2011
2.83.2
1.5
1.0
3.1
7.5
9.0
2.7
4.7
6.7
9.0
2.1
2.9
4.3
3.5
0.0
0.0
2.0
4.0
6.0
8.0
10.0
Wheat Rice CoarseGrains
Oilseeds
Ton
nes
per
hecta
re
India US China World
April 2006
0.0
1.0
2.0
3.0
4.0
5.0
Wheat Rice CoarseGrains
OilseedsTon
nes
per
hecta
re
India US China World
2.722.82
4.25
2.843.04
4.03 4.03 4.03
1.20
3.20
4.90
3.20
0.84
2.64
2.06
0.0
April 2001
Wheat Rice CoarseGrains
Oilseeds
Ton
nes
per
hecta
re
India US China World
0
1
2
3
4
5
6
7
8
2.82.8
3.8
2.72.9
7.0
6.3
3.9
1.1
7.7
4.1
2.9
0.7
2.3
1.8
0.0
Chart II.5: 2010-11 Yield Differential – State-wise(Kg per hectare)
Foodgrains
Yield of Foodgrains All India average yield
0
500
1000
1500
2000
2500
3000
3500
4000
4500
Pu
nja
b
Hary
an
a
Kera
laW
est
BA
ndh
raP
Utt
ar
PTam
iln
adu
Him
ach
alP
Assam
Oth
ers
Utt
ara
kh
an
dG
uja
rat
Karn
ata
ka
J&
KB
ihar
Ori
ssa
Ch
hatt
isgarh
Mah
ara
sh
tra
Raja
sth
an
Jh
ark
han
dM
adh
ya
P
Pulses
Yield of Pulses All India average yield
0
200
400
600
800
1000
1200
1400
1600
Yield of Oilseeds All India average yield
Oilseeds
Tam
ilN
adu
Hary
an
a
Mah
ara
sh
tra
Gu
jara
t
Pu
nja
b
Raja
sth
an
Madh
ya
P
West
BU
ttara
kh
an
dK
era
laB
ihar
Oth
ers
An
dh
raP
Utt
ar
PJ
&K
Karn
ata
ka
Ch
hatt
isgarh
Ori
ssa
Him
ach
alP
Assam
Jh
ark
han
d
0
200
400
600
800
1000
1200
1400
1600
1800
2000
2200
2400
Kera
laB
ihar
Pu
nja
b
Oth
ers
Utt
ar
PW
est
Ben
gal
Gu
jara
t
Utt
ara
kh
an
dM
ah
ara
sh
tra
Hary
an
a
An
dh
raP
Jh
ark
han
dM
adh
ya
P
Assam
Raja
sth
an
J&
KC
hh
att
isgarh
Ori
ssa
Karn
ata
ka
Him
ach
alP
Tam
ilN
adu
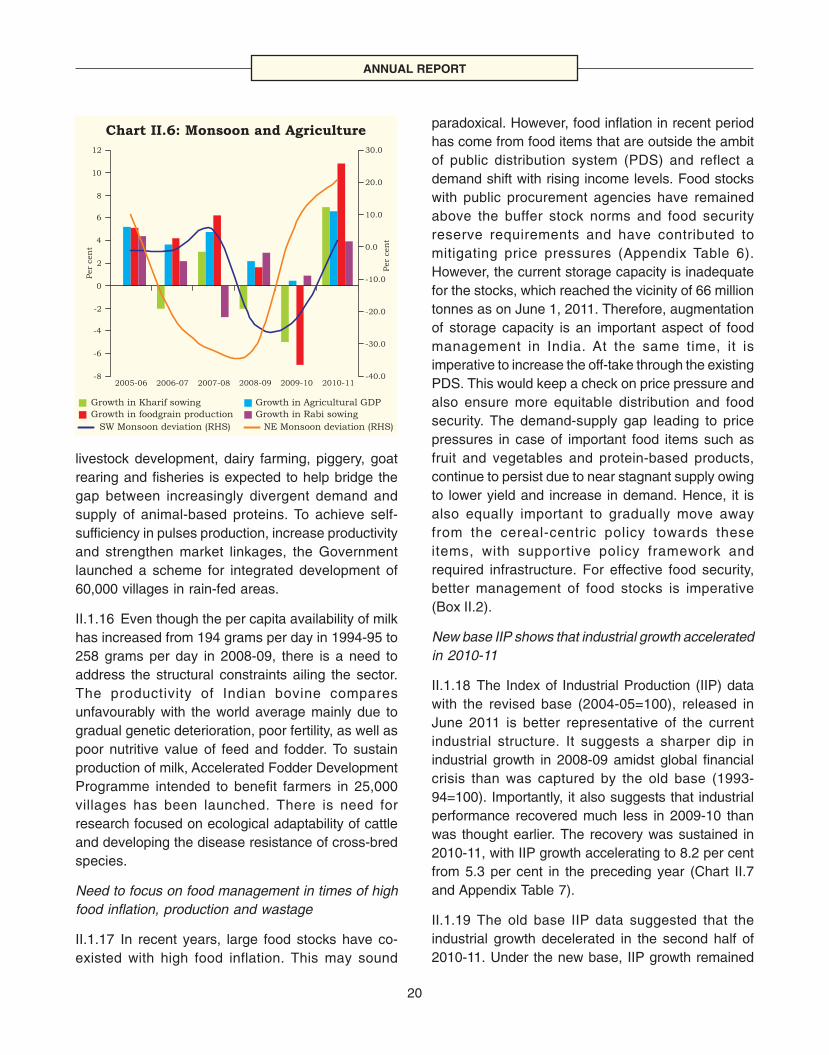
ANNUAL REPORT
20
livestock development, dairy farming, piggery, goatrearing and fisheries is expected to help bridge thegap between increasingly divergent demand andsupply of animal-based proteins. To achieve self-sufficiency in pulses production, increase productivityand strengthen market linkages, the Governmentlaunched a scheme for integrated development of60,000 villages in rain-fed areas.
II.1.16 Even though the per capita availability of milkhas increased from 194 grams per day in 1994-95 to258 grams per day in 2008-09, there is a need toaddress the structural constraints ailing the sector.The productivity of Indian bovine comparesunfavourably with the world average mainly due togradual genetic deterioration, poor fertility, as well aspoor nutritive value of feed and fodder. To sustainproduction of milk, Accelerated Fodder DevelopmentProgramme intended to benefit farmers in 25,000villages has been launched. There is need forresearch focused on ecological adaptability of cattleand developing the disease resistance of cross-bredspecies.
Need to focus on food management in times of highfood inflation, production and wastage
II.1.17 In recent years, large food stocks have co-existed with high food inflation. This may sound
paradoxical. However, food inflation in recent periodhas come from food items that are outside the ambitof public distribution system (PDS) and reflect ademand shift with rising income levels. Food stockswith public procurement agencies have remainedabove the buffer stock norms and food securityreserve requirements and have contributed tomitigating price pressures (Appendix Table 6).However, the current storage capacity is inadequatefor the stocks, which reached the vicinity of 66 milliontonnes as on June 1, 2011. Therefore, augmentationof storage capacity is an important aspect of foodmanagement in India. At the same time, it isimperative to increase the off-take through the existingPDS. This would keep a check on price pressure andalso ensure more equitable distribution and foodsecurity. The demand-supply gap leading to pricepressures in case of important food items such asfruit and vegetables and protein-based products,continue to persist due to near stagnant supply owingto lower yield and increase in demand. Hence, it isalso equally important to gradually move awayfrom the cereal-centric policy towards theseitems, with supportive policy framework andrequired infrastructure. For effective food security,better management of food stocks is imperative(Box II.2).
New base IIP shows that industrial growth acceleratedin 2010-11
II.1.18 The Index of Industrial Production (IIP) datawith the revised base (2004-05=100), released inJune 2011 is better representative of the currentindustrial structure. It suggests a sharper dip inindustrial growth in 2008-09 amidst global financialcrisis than was captured by the old base (1993-94=100). Importantly, it also suggests that industrialperformance recovered much less in 2009-10 thanwas thought earlier. The recovery was sustained in2010-11, with IIP growth accelerating to 8.2 per centfrom 5.3 per cent in the preceding year (Chart II.7and Appendix Table 7).
II.1.19 The old base IIP data suggested that theindustrial growth decelerated in the second half of2010-11. Under the new base, IIP growth remained
Chart II.6: Monsoon and Agriculture
2006-07 2007-08 2008-09 2009-10 2010-11
Per
cen
t
-40.0
-30.0
-20.0
-10.0
0.0
10.0
20.0
30.0
Per
cen
t
Growth in Kharif sowing Growth in Agricultural GDPGrowth in foodgrain production Growth in Rabi sowing
SW Monsoon deviation (RHS) NE Monsoon deviation (RHS)
-8
-6
-4
-2
0
2
4
6
8
10
12
2005-06

ECONOMIC REVIEW
21
Box II.2Food Management – What Needs to Improve?
The draft National Food Security Bill (NFSB) seeks to givelegal right to every below poverty line (BPL) family in India toget 35 kgs. of wheat or rice per month at the rate of `3 per kgfor rice and `2 per kg for wheat by way of central allocationto the States to be distributed through the targeted PDS. Inthis backdrop a holistic review of food management wouldbe helpful.Food management in India, as it stands now, entailsprocurement of foodgrains from farmers at minimum supportprices (MSP), distribution of foodgrains to consumers,particularly the vulnerable sections of society at affordableprices and maintenance of buffers for food security and pricestability. It has been reasonably successful in warding offthe threat of famine, though has had limited successregarding certain other objectives such as price stability,equitable access and food security.Procurement and PricingProcurement of foodgrains, in particular, wheat and rice, isan open-ended operation. The Food Corporation of India(FCI) procures foodgrains at the MSP, which are based onthe recommendations of the Commission for AgriculturalCosts and Prices (CACP). In addition, in recent years, anumber of states have opted for Decentralised ProcurementScheme introduced in 1997, under which foodgrains areprocured and distributed by the State governmentsthemselves. Between 2006-07 and 2010-11, MSP of rice andwheat were hiked at an average annual rate of 14.1 per centand 14.6 per cent, respectively. On average, agricultural pricepolicy has provided a margin of around 20 per cent overtotal costs to both rice and wheat farmers (Dev and Rao,2007). This has ensured sufficient and steady procurementof foodgrains which can cater to the demand for the PDSand various welfare schemes of the Government. Priceinterventions alone are, however, inadequate for ensuringbetter food management and greater focus on non-priceinterventions is necessary. Skewed incentives have affectedland use and cropping pattern. Spatially, bulk of the publicprocurement remains confined to a few States for want ofaccess to take-in windows.The off-take of foodgrains has not kept pace with procurementdespite the Central Issue Price (CIP), the price at whichfoodgrains are lifted by States for distribution under variouswelfare schemes, being constant since 2002. This hasresulted in stocks of foodgrains building up to a level muchhigher than the quarterly buffer norms and food securityreserve requirements. Basu (2010) is of the view that lack ofadequate storage is not the central problem for foodmanagement. He underscored the need to look at the entiresystem of food production and procurement, and its releaseand distribution.Production and Food SecurityFoodgrain production in India grew at an average rate of 1.6per cent annually between 1990 and 2010, lower than thedecadal rate of population growth of 1.8 per cent. Resultantly,per capita net availability of foodgrains per day declined from510 grams in 1991 to 444 grams in 2009. This is despite thefact that food stocks have been at their peak in the 2000s.This may have implications for food security in future.
The NFSB has been approved by the Empowered Group ofMinisters (EGoM) on food security. If the Bill is implemented,the total requirement of foodgrains will increase. Given thelimitation to expanding the area under crops, increasedsupply of foodgrains would thus have to come from increasein productivity. This has implication for capital expenditure inagriculture, including that on storage facilities. Further, it couldpose a fiscal challenge through significant increase in foodsubsidy bill, estimated at about `92,000 crore by the ExpertCommittee (GOI, 2010).
Distribution and Delivery MechanismDistribution and delivery have been the most intricate andchallenging aspects of food management in the country. Theexisting PDS in India with roughly 0.5 million Fair Price Shops(FPS) is plagued with deficiencies such as low margins thatcreate perverse incentives for diversion of foodgrains.Surveys conducted in the past revealed significant inclusionand exclusion errors in PDS coverage. The PlanningCommission, in early 2000s, found that the total leakage ofgrains meant for BPL population was 58 per cent. Pendingunanimity in approach for identification of beneficiaries,Aadhaar smart cards could help reduce identification errorsand leakages significantly. Smart cards have the ability tostore and record a large amount of programmed andauthorised biometric information that can be matched to theactual fingerprint or signature of an individual involved in atransaction, including eligibility for rations, quantity, price andtime intervals at which he/she could be supplied rations.These features of the proposed smart card are expected toimmensely help the existing food coupon or food-stampsystem, introduced on a pilot basis in select districts in AndhraPradesh, Arunachal Pradesh and Bihar. Greater use ofInformation and Communication Technology (ICT) in PDS,such as GPS tracking of movement of vehicles transportingPDS commodities, CCTV monitoring of FPS andcomputerisation of various operations of PDS could alsoimprove its efficiency. Other reform measures for foodmanagement which could be considered include allowingfood coupons to be redeemed at approved private foodretailers, thus providing freedom to choose quality of grainsand thereby reducing incentive for adulteration of foodgrains.An even bolder measure would be direct cash transfer thatoffers households the choice of purchase of any mix of grains,pulses or other household basics up to the value of thecoupon.
References:
Basu, Kaushik (2010), “The Economics of FoodgrainManagement in India”, Department of Economic AffairsWorking Paper, No. 2/2010-DEA.
Dev, S. Mahendra and Chandrasekhara Rao, “AgriculturalPrice Policy, Farm Profitability and Food Security.”Economic and Political Weekly, June, 45:(26 & 27):,174-182.
GOI (2010), Report of the Expert Committee to Examinethe Implications of National Food Security Bill (Chairman:Dr. C. Rangarajan), Prime Minister’s Economic AdvisoryCouncil.

ANNUAL REPORT
22
broadly unchanged across the two halves of 2010-11, recording 8.2 per cent growth in the first half and8.3 per cent in the second half. The new base hasbetter coverage and is reflective of the more recentproduction structure based on 399 item groups asagainst 303 in the old base. The Reserve Bank inits report on ‘Macroeconomic and MonetaryDevelopments’ accompanying the Monetary PolicyStatement of May 2011 had indicated that the recentIIP slowdown was exacerbated by a few volatile items.The analysis adopting the trimmed mean approachto compute IIP growth excluding volatile items showedthat the industrial growth had not dropped as much
as appeared from the headline numbers. The newbase data confirms the view and shows that the IIPgrowth was in fact higher.
II.1.20 Further analysis of the IIP growth suggestssome deceleration in mining and electricity in 2010-11 emanating from poor performance of coal andconsequent lower thermal power generation. The use-based classification exhibits strong performance ofcapital goods and acceleration in growth across allsectors except consumer durables (Chart II.8 andChart II.9). The IIP growth during April-June 2011shows some deceleration, but this was substantiallyon a high base.
II.1.21 Despite the emphasis on manufacturing sectorin India’s planning process, its share in real GDP, asof 2010-11, was only 15.8 per cent. There is a needto boost this sector, not only to increase output butalso to gainfully employ a larger number of people.A number of recent studies have highlighted thegrowth of total factor productivity in the organisedmanufacturing sector in the past three decades.There, however, exists wide differentials in productivitybetween different States and different industry groups.Also, there is a large difference in productivity betweenthe organised and unorganised sub-sectors ofmanufacturing. Considering that the latter accountsfor almost four-fifths of total employment in themanufacturing sector, there is an urgent need tobridge the gap.
Chart II.7: Growth in IIP (Y-o-Y)
-5.0
0.0
5.0
10.0
15.0
20.0
Apr
May
Ju
n
Ju
l
Au
g
Sep
Oct
Nov
Dec
Jan
Feb
Mar
Per
cen
t
2009-10 2010-11 2011-12
Chart II.8: Industrial Growth
a: IIP - Sectoral Classification
Mining Manufacturing Electricity
2007-08 2008-09 2009-10 2010-11 Apr-Jun2011
0.0
2.0
4.0
6.0
8.0
10.0
12.0
14.0
16.0
18.0
20.0
Per
cen
t
2007-08 2008-09 2009-10 2010-11 Apr-Jun2011
Per
cen
t
b: IIP - Use-based Classification
Basic Goods Capital Goods Intermediate Goods
Consumer Durables Consumer Non-durables
-10.0
0.0
10.0
20.0
30.0
40.0
50.0
60.0
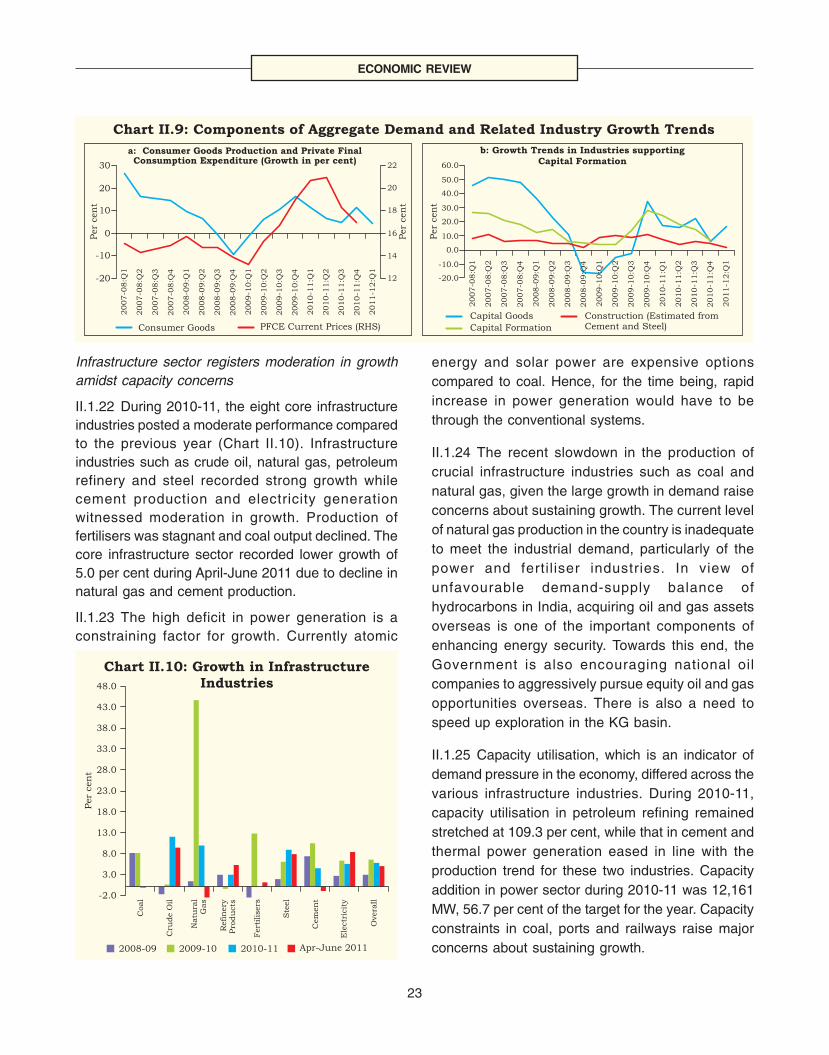
ECONOMIC REVIEW
23
Infrastructure sector registers moderation in growthamidst capacity concerns
II.1.22 During 2010-11, the eight core infrastructureindustries posted a moderate performance comparedto the previous year (Chart II.10). Infrastructureindustries such as crude oil, natural gas, petroleumrefinery and steel recorded strong growth whilecement production and electricity generationwitnessed moderation in growth. Production offertilisers was stagnant and coal output declined. Thecore infrastructure sector recorded lower growth of5.0 per cent during April-June 2011 due to decline innatural gas and cement production.
II.1.23 The high deficit in power generation is aconstraining factor for growth. Currently atomic
Chart II.9: Components of Aggregate Demand and Related Industry Growth Trends
a: Consumer Goods Production and Private FinalConsumption Expenditure (Growth in per cent)
Consumer Goods PFCE Current Prices (RHS)Capital Goods Construction (Estimated from
Cement and Steel)Capital Formation
b: Growth Trends in Industries supportingCapital Formation
-20.0
-10.0
0.0
10.0
20.0
30.0
40.0
50.0
60.0
2007-0
8:Q
1
2007-0
8:Q
2
2007-0
8:Q
3
2007-0
8:Q
4
2008-0
9:Q
1
2008-0
9:Q
2
2008-0
9:Q
3
2008-0
9:Q
4
2009-1
0:Q
1
2009-1
0:Q
2
2009-1
0:Q
3
2009-1
0:Q
4
2010-1
1:Q
1
2010-1
1:Q
2
2010-1
1:Q
3
2010-1
1:Q
4
2011-1
2:Q
1
Per
cen
t
-20
-10
0
10
20
30
2007-0
8:Q
1
2007-0
8:Q
2
2007-0
8:Q
3
2007-0
8:Q
4
2008-0
9:Q
1
2008-0
9:Q
2
2008-0
9:Q
3
2008-0
9:Q
4
2009-1
0:Q
1
2009-1
0:Q
2
2009-1
0:Q
3
2009-1
0:Q
4
2010-1
1:Q
1
2010-1
1:Q
2
2010-1
1:Q
3
2010-1
1:Q
4
12
14
16
18
20
22
2011-1
2:Q
1
Per
cen
t
Per
cen
t
energy and solar power are expensive optionscompared to coal. Hence, for the time being, rapidincrease in power generation would have to bethrough the conventional systems.
II.1.24 The recent slowdown in the production ofcrucial infrastructure industries such as coal andnatural gas, given the large growth in demand raiseconcerns about sustaining growth. The current levelof natural gas production in the country is inadequateto meet the industrial demand, particularly of thepower and ferti l iser industries. In view ofunfavourable demand-supply balance ofhydrocarbons in India, acquiring oil and gas assetsoverseas is one of the important components ofenhancing energy security. Towards this end, theGovernment is also encouraging national oilcompanies to aggressively pursue equity oil and gasopportunities overseas. There is also a need tospeed up exploration in the KG basin.
II.1.25 Capacity utilisation, which is an indicator ofdemand pressure in the economy, differed across thevarious infrastructure industries. During 2010-11,capacity utilisation in petroleum refining remainedstretched at 109.3 per cent, while that in cement andthermal power generation eased in line with theproduction trend for these two industries. Capacityaddition in power sector during 2010-11 was 12,161MW, 56.7 per cent of the target for the year. Capacityconstraints in coal, ports and railways raise majorconcerns about sustaining growth.
Chart II.10: Growth in InfrastructureIndustries
-2.0
3.0
8.0
13.0
18.0
23.0
28.0
33.0
38.0
43.0
48.0
Coal
Cru
de
Oil
Natu
ral
Gas
Refin
ery
Pro
du
cts
Fert
ilis
ers
Ste
el
Cem
en
t
Ele
ctr
icit
y
Overa
ll
Per
cen
t
2008-09 2009-10 2010-11 Apr-June 2011

ANNUAL REPORT
24
Services sector sustains momentum, albeit withmarginal deceleration
II.1.26 Services sector growth of 9.2 per cent in2010-11 was marginally lower than that in theprevious year largely due to deceleration in‘community, social and personal services’ reflectingfiscal consolidation (Chart II.11). Services dependenton external demand such as tourist arrivals,passengers handled at international terminals, exportand import cargo showed acceleration in growthduring 2010-11, indicating improvement in globaleconomic conditions. Cell phone connections alsoregistered double digit growth, though lower than theprevious year. Cargo movements in sea ports andrailway freight traffic showed signs of moderationduring 2010-11 on account of capacity constraints(Chart II.12).
Vulnerabilities that could impede sustained highgrowth of services sector remain
II.1.27 Being the largest sector of the Indianeconomy, the services sector has significantimplications for growth. It is export-intensive,employment-oriented and attractive for foreign directinvestors. In view of the above, the sustainability ofthe services sector growth is important. One major
challenge for its sustainable growth arises from itsdependence on external demand. This increases itsvulnerability to global economic developments, as waswitnessed during the global financial crisis(Chart II.13). India is facing increased competitivenessin IT/ITeS and telecommunications of late. The sectorhas responded well so far, but in future the wage pricepressures may pose a threat to growth and profitability.Another area where other countries have gained
Chart II.11: Growth in Services Sector GDP
Services Construction
Trade, hotels, transport, storage and communicationFinancing, insurance, real estate & business
Community, social & personal services
2006-07 2007-08 2008-09 2009-10 2010-110.0
2.0
4.0
6.0
8.0
10.0
12.0
14.0
16.0
Per
cen
t
Chart II.12: Growth Trend in CargoMovements
-10
-5
0
5
10
15
20
25
30
35
40
Per
cen
t
Ju
n-0
9
Dec-0
9
Feb-1
0
Ju
n-1
0
Apr-
09
Au
g-0
9
Oct-
09
Apr-
10
Au
g-1
0
Oct-
10
Dec-1
0
Feb-1
1
Apr-
11
Aviation Cargo Port Cargo
Chart II.13: Growth in services (excludingcommunity, social and personal services)
Services excluding community, social and personal services
5.0
7.0
9.0
11.0
13.0
Per
cen
t
2007-0
8:Q
1
2007-0
8:Q
2
2007-0
8:Q
3
2007-0
8:Q
4
2008-0
9:Q
1
2008-0
9:Q
2
2008-0
9:Q
3
2008-0
9:Q
4
2009-1
0:Q
1
2009-1
0:Q
2
2009-1
0:Q
3
2009-1
0:Q
4
2010-1
1:Q
1
2010-1
1:Q
2
2010-1
1:Q
3
2010-1
1:Q
4

ECONOMIC REVIEW
25
tremendously is tourism. India has potential butinfrastructure such as road connectivity to touristareas is a major challenge. Globally traded services,viz., financial services, health care, education,accountancy and other business services, also havevast potential for growth which is yet to be tapped.
II.1.28 The Indian Health Care Federation hasprepared a roadmap for making India a world-classdestination for medical tourism. For this, accreditationof Indian hospitals is paramount as it will help inensuring quality standards across a spectrum ofspeciality and super-speciality hospitals. In addition,to encourage medical tourism, there is a need toprovide supportive infrastructure such as improvedair connectivity, streamlining of immigration processalong with developing health support infrastructure.
Private consumption and investment continue to drivegrowth
II.1.29 The drivers of growth from the demand side1
revealed the continued predominance of private finalconsumption expenditure (PFCE) in driving growth,followed by gross fixed capital formation (GFCF). Onthe other hand, the growth of government finalconsumption expenditure (GFCE) moderated sharplyin 2010-11 reflecting the re-emphasis on fiscalconsolidation following the gradual withdrawal of fiscalstimulus measures that had to be undertaken in theprevious two years to support the economic recovery.The rebalancing in government expenditure could bemaintained in 2011-12 by staying on the path of fiscal
consolidation. External demand improved in line withthe global recovery process, and as a result, thecontribution of net exports turned positive in 2010-11(Chart II.14).
II.1.30 Even though aggregate expenditure, in realterms, accelerated in 2010-11 with privateconsumption as well as investment expendituregrowing at a brisk pace, some moderation inexpenditure is expected going forward in responseto high inflation and demand-side policy measures.There was a perceptible slowdown in investment inthe second half of 2010-11. Recovery from the softpatch, would depend on pick-up in execution of largeinfrastructure projects.
Employment situation improved in the recent years
II.1.31 High growth rate along with subdued ormarginal increase in employment generation hasbeen a pressing concern in the post-reform period.Available data provides evidence of creation ofadditional employment opportunities, though at aslower pace when compared with the high economicgrowth experienced in recent years. According to theresults of latest quinquennial survey by the NationalSample Survey Office (NSSO, 66th round),employment situation improved in both rural andurban areas in 2009-10 compared to the previousround (2004-05). The overall unemployment rate,measured by current daily status, declined from 8.2per cent in 2004-05 to 6.6 per cent in 2009-10 andthe decline in unemployment rate was more
Chart II.14: Expenditure Side of GDP
a: Contribution to GDP Growth from Expenditure Side
2008-09 2009-10 2010-11
-60
-40
-20
0
20
40
60
80
100
Per
cen
t
Pri
vate
Con
su
mpti
on
Govt.
Con
su
mpti
on
GFC
F
Net
Export
s
b: Growth in Consumption and Investment
2008-09 2009-10 2010-11
Per
cen
t
PFCE GFCE GFCF0
5
10
15
20
1 Despite well known limitations, expenditure side GDP data are being used as proxies for components of aggregate demand.

ANNUAL REPORT
26
pronounced for men than for women. The overall workparticipation rate (usual status), however, declined to39.2 per cent in 2009-10 from 42.0 per cent in 2004-05, largely driven by decline in women workparticipation rate.
II.1.32 High industrial growth, with a rate of growth inreal value added in organised manufacturing of about10 per cent per annum during 2003-09, also wasassociated with increase in employment in this sector.The latest Annual Survey of Industries (ASI) datareveal that between 2003-04 and 2008-09,employment in the organised manufacturing sectorincreased by 7.5 per cent per annum, as againstdecline of 1.5 per cent per annum between 1995-96and 2003-04. This marks a clear difference from theprevious phases of high growth in manufacturingoutput when there was no major contribution toemployment generation.
II.1.33 Labour Bureau has been conducting a seriesof quarterly quick employment surveys sinceJanuary 2009 to study the impact of the globaleconomic slowdown on employment in eight majorindustries of the Indian economy. As per the latestdata available, employment increased by 9.8 lakhduring 2010-11 with the major share accounted bythe IT/BPO sector.
II. PRICE SITUATION
High inflation persisted through the year
II.2.1 With growth consolidating around the trend,inflation emerged as the dominant policy challenge
for the Reserve Bank during 2010-11. Inflationremained high throughout, while the underlying driverschanged during three distinct phases during the year(Chart II.15). Price pressures were both external anddomestic, with changing relative roles of supply anddemand side factors. The monetary policy responseof the Reserve Bank was accordingly calibratedbased on assessment of the changing drivers ofinflation and assessment about the role monetarypolicy could play in dealing with different sources ofinflation. Monetary policy was, however, continuouslytightened during the course of the year, reflectingnormalisation of crisis time stimulus, to begin with,but subsequently conditioned by the rising inflationarypressures. In the absence of anti-inflationarymonetary policy response, the inflation conditionand inflation expectations would have deterioratedfurther.
Drivers of inflation shifted over three different phases
II.2.2 The changing inflation dynamics during2010-11 could be evident from changes inweighted contributions to increase in WPI over threedistinct phases. During the first period April-July 2010,the increase in WPI was quite significant (3.4 per cent)and was largely driven by high food prices. In spite ofgood Rabi arrivals, food inflation remained high asprices of protein-rich items firmed up, perhapsreflecting continuing demand shifts with rising incomelevels. During the second phase between August andNovember 2010, the magnitude of price rise wasmoderate (2.0 per cent) but primary non-food articles
Chart II.15: Changing Weighted Contributions to Increase in WPI
Note: Pie Chart Represents the Contribution of Different Sub-groups to Increase in WPI (adjusted for rounding up).
Phase I: April-July 2010
Increase in WPI 3.4 per cent Increase in WPI 2.0 per cent Increase in WPI 7.1 per cent
Phase II: August-November 2010 Phase III: December 2010-July 2011
38.832.0
24.4
6.4
28.0 27.8
37.6
4.3
Total Food Fuel and Power Primary Non-food Articles & Minerals Manufactured Non-food Products
43.2
23.2
8.7
24.9
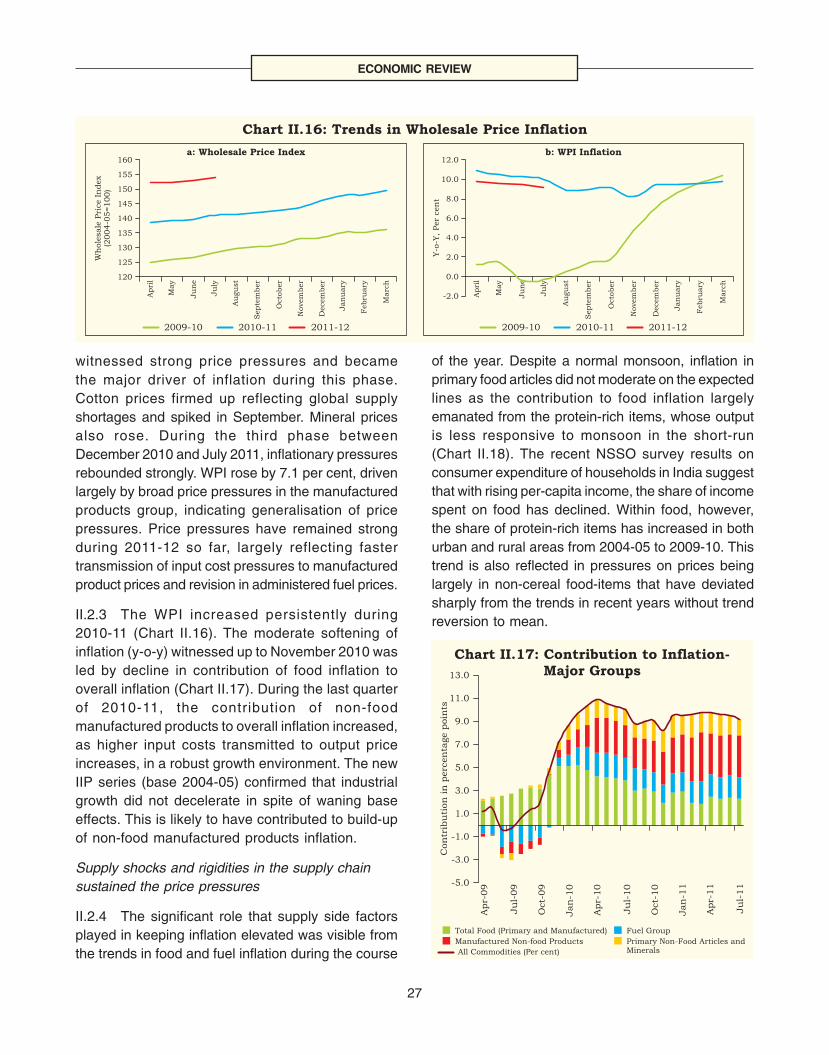
ECONOMIC REVIEW
27
witnessed strong price pressures and becamethe major driver of inflation during this phase.Cotton prices firmed up reflecting global supplyshortages and spiked in September. Mineral pricesalso rose. During the third phase betweenDecember 2010 and July 2011, inflationary pressuresrebounded strongly. WPI rose by 7.1 per cent, drivenlargely by broad price pressures in the manufacturedproducts group, indicating generalisation of pricepressures. Price pressures have remained strongduring 2011-12 so far, largely reflecting fastertransmission of input cost pressures to manufacturedproduct prices and revision in administered fuel prices.
II.2.3 The WPI increased persistently during2010-11 (Chart II.16). The moderate softening ofinflation (y-o-y) witnessed up to November 2010 wasled by decline in contribution of food inflation tooverall inflation (Chart II.17). During the last quarterof 2010-11, the contribution of non-foodmanufactured products to overall inflation increased,as higher input costs transmitted to output priceincreases, in a robust growth environment. The newIIP series (base 2004-05) confirmed that industrialgrowth did not decelerate in spite of waning baseeffects. This is likely to have contributed to build-upof non-food manufactured products inflation.
Supply shocks and rigidities in the supply chainsustained the price pressures
II.2.4 The significant role that supply side factorsplayed in keeping inflation elevated was visible fromthe trends in food and fuel inflation during the course
of the year. Despite a normal monsoon, inflation inprimary food articles did not moderate on the expectedlines as the contribution to food inflation largelyemanated from the protein-rich items, whose outputis less responsive to monsoon in the short-run(Chart II.18). The recent NSSO survey results onconsumer expenditure of households in India suggestthat with rising per-capita income, the share of incomespent on food has declined. Within food, however,the share of protein-rich items has increased in bothurban and rural areas from 2004-05 to 2009-10. Thistrend is also reflected in pressures on prices beinglargely in non-cereal food-items that have deviatedsharply from the trends in recent years without trendreversion to mean.
2009-10 2010-11 2011-12
b: WPI Inflation
Chart II.16: Trends in Wholesale Price Inflation
Apri
l
May
Ju
ne
Ju
ly
Au
gu
st
Septe
mber
Octo
ber
Novem
ber
Decem
ber
Jan
uary
Febru
ary
Marc
h
-2.0
0.0
2.0
4.0
6.0
8.0
10.0
12.0
Y-o
-Y,Per
cen
t
a: Wholesale Price Index
2009-10 2010-11 2011-12
Apri
l
May
Ju
ne
Ju
ly
Au
gu
st
Septe
mber
Octo
ber
Novem
ber
Decem
ber
Jan
uary
Febru
ary
Marc
h
Wh
ole
sale
Pri
ce
Index
(2004-0
5=100)
120
125
130
135
140
145
150
155
160
Chart II.17: Contribution to Inflation-Major Groups
Total Food (Primary and Manufactured) Fuel Group
Manufactured Non-food Products
All Commodities (Per cent)
Primary Non-Food Articles andMinerals
-5.0
-3.0
-1.0
1.0
3.0
5.0
7.0
9.0
11.0
13.0
Con
trib
uti
on
inperc
en
tage
poin
ts
Apr-
09
Ju
l-09
Oct-
09
Jan
-10
Apr-
10
Ju
l-10
Oct-
10
Jan
-11
Apr-
11
Ju
l-11
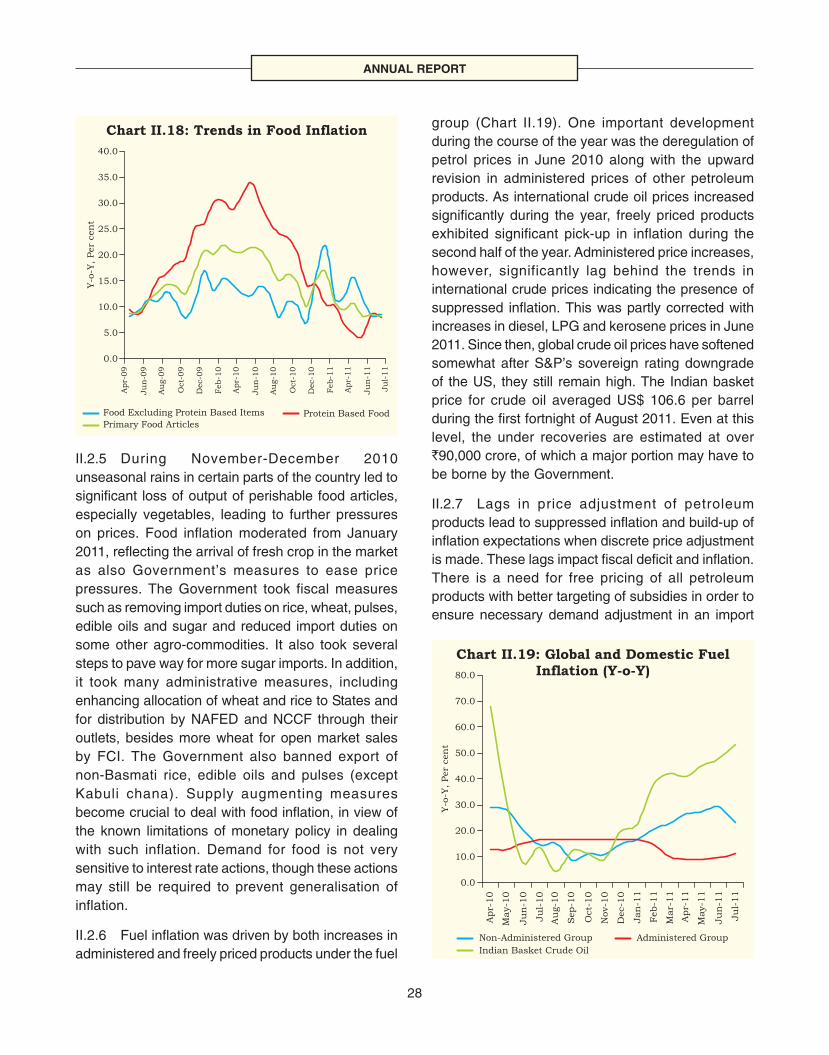
ANNUAL REPORT
28
II.2.5 During November-December 2010unseasonal rains in certain parts of the country led tosignificant loss of output of perishable food articles,especially vegetables, leading to further pressureson prices. Food inflation moderated from January2011, reflecting the arrival of fresh crop in the marketas also Government’s measures to ease pricepressures. The Government took fiscal measuressuch as removing import duties on rice, wheat, pulses,edible oils and sugar and reduced import duties onsome other agro-commodities. It also took severalsteps to pave way for more sugar imports. In addition,it took many administrative measures, includingenhancing allocation of wheat and rice to States andfor distribution by NAFED and NCCF through theiroutlets, besides more wheat for open market salesby FCI. The Government also banned export ofnon-Basmati rice, edible oils and pulses (exceptKabuli chana). Supply augmenting measuresbecome crucial to deal with food inflation, in view ofthe known limitations of monetary policy in dealingwith such inflation. Demand for food is not verysensitive to interest rate actions, though these actionsmay still be required to prevent generalisation ofinflation.
II.2.6 Fuel inflation was driven by both increases inadministered and freely priced products under the fuel
group (Chart II.19). One important developmentduring the course of the year was the deregulation ofpetrol prices in June 2010 along with the upwardrevision in administered prices of other petroleumproducts. As international crude oil prices increasedsignificantly during the year, freely priced productsexhibited significant pick-up in inflation during thesecond half of the year. Administered price increases,however, significantly lag behind the trends ininternational crude prices indicating the presence ofsuppressed inflation. This was partly corrected withincreases in diesel, LPG and kerosene prices in June2011. Since then, global crude oil prices have softenedsomewhat after S&P’s sovereign rating downgradeof the US, they still remain high. The Indian basketprice for crude oil averaged US$ 106.6 per barrelduring the first fortnight of August 2011. Even at thislevel, the under recoveries are estimated at over`90,000 crore, of which a major portion may have tobe borne by the Government.
II.2.7 Lags in price adjustment of petroleumproducts lead to suppressed inflation and build-up ofinflation expectations when discrete price adjustmentis made. These lags impact fiscal deficit and inflation.There is a need for free pricing of all petroleumproducts with better targeting of subsidies in order toensure necessary demand adjustment in an import
Chart II.18: Trends in Food Inflation
Food Excluding Protein Based Items Protein Based FoodPrimary Food Articles
0.0
5.0
10.0
15.0
20.0
25.0
30.0
35.0
40.0
Y-o
-Y,Per
cen
t
Apr-
09
Ju
n-0
9
Au
g-0
9
Oct-
09
Dec-0
9
Feb-1
0
Apr-
10
Ju
n-1
0
Au
g-1
0
Oct-
10
Dec-1
0
Feb-1
1
Apr-
11
Ju
n-1
1
Ju
l-11
Non-Administered Group Administered Group
Indian Basket Crude Oil
Chart II.19: Global and Domestic FuelInflation (Y-o-Y)
0.0
10.0
20.0
30.0
40.0
50.0
60.0
70.0
80.0
Apr-
10
May-1
0
Ju
n-1
0
Ju
l-10
Au
g-1
0
Sep-1
0
Oct-
10
Nov-1
0
Dec-1
0
Jan
-11
Feb-1
1
Mar-
11
Apr-
11
May-1
1
Ju
n-1
1
Ju
l-11
Y-o
-Y,Per
cen
t

ECONOMIC REVIEW
29
dependant item and also encourage investment inalternative sources of energy. Any short-term pricestabilisation objective could be attained through aseparate fund created for that purpose with a provisionfor annual fiscal transfers from the budget within thelimits of fiscal prudence.
Generalisation of price pressures accelerated,necessitating sustained anti-inflationary monetarypolicy actions
II.2.8 Inflation in non-food manufactured productsremained range-bound between 5.3 to 5.9 per centin the first eight months of 2010-11, which was stillhigher than the average over the last decade at about4 per cent. In the last quarter of the year, however,inflation in this category increased significantlyreaching 8.5 per cent in March 2011, indicatingstronger pass-through of input costs than expected,as also pricing power of producers amidst strongprivate consumption demand that supportedmomentum in industrial growth (Chart II.20).Manufactured food products inflation declined sharplyduring the initial period of the year reflecting largelydecline in sugar prices and strong base effects, butreverted course subsequently.
Global commodity prices hardened during 2010-11,partly reflecting geo-political developments andweather related disturbances
II.2.9 International commodity prices moderatedsomewhat during the first quarter of 2010-11as greater uncertainty relating to recovery inadvanced economies impacted commodity markets(Chart II.21). However, prices rebounded significantly
thereafter, both on account of weather related supplydisruptions in a number of primary commodityproducing countries and geo-political tensions in theMiddle East and North Africa (MENA) region. Theincrease in global food prices was also significant,with severe welfare implications for low incomecountries. Some softening of global commodity prices,however, was witnessed during the initial months of2011-12. The impact of increase in internationalcommodity prices on domestic inflation has beendifferent for different commodity groups (Box II.3).
WPI and CPIs exhibited convergence
II.2.10 The year 2010-11 started with significantdivergence between inflation as measured by WPI
Manufactured Products Manufactured Food products
Manufactured Non-food Products
Chart II.20: Manufactured Products Inflation
-5.0
0.0
5.0
10.0
15.0
20.0
25.0
Apr-
09
May-0
9
Ju
n-0
9Ju
l-09
Au
g-0
9S
ep-0
9
Oct-
09
Nov-0
9D
ec-0
9Jan
-10
Feb-1
0M
ar-
10
Apr-
10
May-1
0
Ju
n-1
0Ju
l-10
Au
g-1
0S
ep-1
0
Oct-
10
Nov-1
0D
ec-1
0Jan
-11
Feb-1
1M
ar-
11
Apr-
11
May-1
1
Ju
n-1
1Ju
l-11
Y-o
-Y,Per
cen
t
International Commodity PricesInternational Food Prices (FAO)
80
130
180
230
280
330
380
430
480
Apr-
08
Ju
n-0
8
Au
g-0
8
Oct-
08
Dec-0
8
Feb-0
9
Apr-
09
Ju
n-0
9
Au
g-0
9
Oct-
09
Dec-0
9
Feb-1
0
Apr-
10
Ju
n-1
0
Au
g-1
0
Oct-
10
Dec-1
0
Feb-1
1
Apr-
11
Ju
n-1
1
Index:2002-0
4=100
Food Price Index Meat Dairy
Cereals Edible Oils Sugar
Chart II.21: International Commodity Prices
Ju
l-08
Jan
-09
Ju
l-09
Jan
-10
Ju
l-10
Jan
-11
60
110
160
210
260
310
Index:2005=100
Apr-
08
Oct-
08
Apr-
09
Oct-
09
Apr-
10
Oct-
10
Apr-
11
Ju
l-11
IMF Primary Commodity Price Index FoodMetals Crude Oil

ANNUAL REPORT
30
Box II.3Transmission of Global Commodity Price Shocks to Domestic Inflation
With a surfeit of liquidity as a result of very low levels ofinterest rates and successive measures of quantitative easingby global central banks, global commodity prices recoveredfaster than the global economy supported by leveragedtrades. This has become a major source of pressure onheadline inflation in India during 2010-11. The significantreversal in the commodity price cycle was also broad based,covering food, oil, metals and other commodities. The FAOfood price index increased through 2009 and 2010 to regainthe pre-crisis peak by February 2011. Oil prices crossed US$100 per barrel mark in the last quarter of 2010-11 and haveremained high thereafter.
The global food price pressures reflect the combined impactof growing demand and weak supply response. Robustgrowth in EMEs and growing population have boosted thedemand for food items. Rising per capita income is changingfood habits resulting in higher demand for protein-rich fooditems, such as meat and dairy products. On the supply side,the availability of arable land is shrinking, due to increasingurbanization as well as diversion of land for bio-fuelsproduction. Recent spikes in oil prices have also raised theinput costs for farms, including transportation and fertilizercosts. Climatic changes and weather related disturbancesare also impacting global food prices. Import barriers andlarge farm subsidies in advanced economies are influencingthe supply response through price distortions.
Low energy efficiency and policies on oil subsidies have alsocontributed to the demand growth. The pace of urbanisationin EMEs with emphasis on physical infrastructure hasincreased demand-supply imbalances. The demand formetals and minerals, particularly steel, copper, aluminium,oil and coal have increased. In the case of oil, the peak oilhypothesis seems to suggest that global production may be
peaking. Progress on alternative sources of energy also lagsbehind the demand trends. The recent concerns on nuclearpower post-Japanese earthquake can only worsen theenergy supplies. Financialisation of commodities has addeda new dimension to the commodity price cycle. Geo-politicalfactors continue to be an important factor behind suddenand sharp increases in oil prices, as has been the case sincethe beginning of 2011.
The actual impact of global commodity shocks on consumerprice inflation in developing countries depends ongovernment policy measures (Jongwaninch and Park, 2011).The spillover effects to domestic prices depend on the degreeof import dependence in a commodity, domestic supply-demand trends, administered price interventions and pricingpower at the wholesale level. The impact ultimately dependson the weight of respective commodities in the WPI and thelinkages with other commodities that determine the secondround effects (Table-1). The second round effect reflectsresponse of wages and prices aimed at protecting real wagesand profit margins as input costs rise. The estimatespresented for different commodities in Table-1 reflect thecombined impact, with the direction of causation presumedfrom global prices to domestic prices. Given the uncertainoutlook for commodity prices, despite the softening of pricepressures so far in the year, upside risks to India’s inflationpath could persist.
References:
Food and Agricultural Organisation (FAO) (2010), World FoodOutlook, November 2010
Jongwaninch, Juthathip and Donghyun Park (2011), “Inflationin Developing Asia: Pass-through from Global Food and OilPrice Shocks’, Asian-Pacific Economic Literature, 25(1):79-92, May
Table 1: Impact of Global Commodity Price Movements on Domestic Prices
Item 2010-11 July 2011 over March 2011 Estimated Elasticity(Y-o-Y Increase in Per cent, March) (Increase in Per cent)
Weight International Domestic International Domestic Short- Long-in Prices Prices Prices@ Prices run# run$
WPI (WPI) (WPI)
1 2 3 4 5 6 7 8
Rice 1.8 -1.9 2.3 8.8 1.8 0.01 --Wheat 1.1 65.7 0.2 -4.0 -1.2 0.02 --Maize 0.2 82.7 25.3 3.5 7.5 0.02 --Soyabean Oil 0.4 42.8 19.2 2.3 3.2 0.06** 0.47Sugar 1.7 40.6 -7.1 7.5 -0.2 0.05** 0.66Cotton 0.7 167.6 103.0 -46.9 -31.5 0.17** 0.98Rubber 0.2 63.8 44.8 -12.8 -1.8 0.34** 1.08Coal 2.1 33.6 13.3 -4.9 0.0 0.03** 0.48Petroleum 9.4 37.0 6.3 -0.7 33.4 0.07** 0.55Fertilizers 2.7 28.5 9.9 29.0 5.1 0.00 --Aluminium 0.5 15.9 2.1 -1.2 0.9 0.03** 0.42Copper 0.1 27.3 3.2 1.5 -2.5 0.03** 0.53Gold 0.4 27.9 36.2 10.4 5.4 0.28** 1.00Silver 0.0 109.6 90.3 6.0 2.4 0.41** 1.00Source: World Bank and Ministry of Commerce and Industry, GOI.# : Estimated using Partial Adjustment Model$ : Long-run elasticities are not reported for products where short-run elasticity is not significant.** : Significant at 1 per cent level of significance.
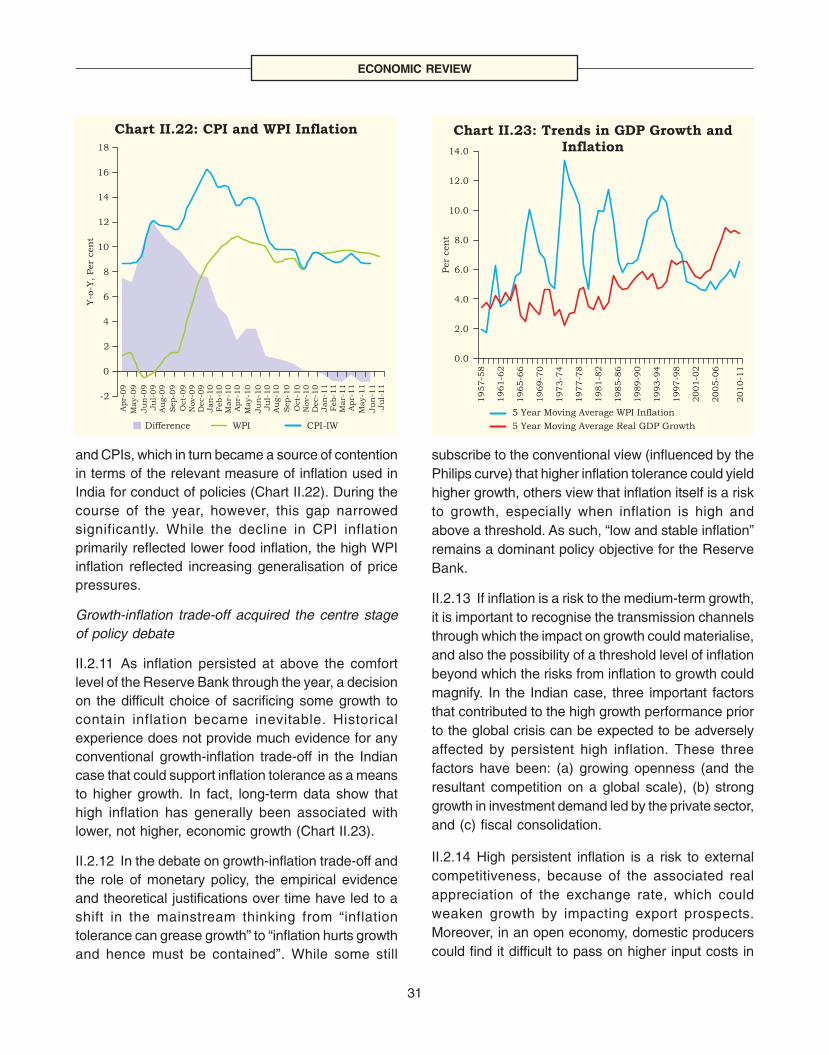
ECONOMIC REVIEW
31
and CPIs, which in turn became a source of contentionin terms of the relevant measure of inflation used inIndia for conduct of policies (Chart II.22). During thecourse of the year, however, this gap narrowedsignificantly. While the decline in CPI inflationprimarily reflected lower food inflation, the high WPIinflation reflected increasing generalisation of pricepressures.
Growth-inflation trade-off acquired the centre stageof policy debate
II.2.11 As inflation persisted at above the comfortlevel of the Reserve Bank through the year, a decisionon the difficult choice of sacrificing some growth tocontain inflation became inevitable. Historicalexperience does not provide much evidence for anyconventional growth-inflation trade-off in the Indiancase that could support inflation tolerance as a meansto higher growth. In fact, long-term data show thathigh inflation has generally been associated withlower, not higher, economic growth (Chart II.23).
II.2.12 In the debate on growth-inflation trade-off andthe role of monetary policy, the empirical evidenceand theoretical justifications over time have led to ashift in the mainstream thinking from “inflationtolerance can grease growth” to “inflation hurts growthand hence must be contained”. While some still
subscribe to the conventional view (influenced by thePhilips curve) that higher inflation tolerance could yieldhigher growth, others view that inflation itself is a riskto growth, especially when inflation is high andabove a threshold. As such, “low and stable inflation”remains a dominant policy objective for the ReserveBank.
II.2.13 If inflation is a risk to the medium-term growth,it is important to recognise the transmission channelsthrough which the impact on growth could materialise,and also the possibility of a threshold level of inflationbeyond which the risks from inflation to growth couldmagnify. In the Indian case, three important factorsthat contributed to the high growth performance priorto the global crisis can be expected to be adverselyaffected by persistent high inflation. These threefactors have been: (a) growing openness (and theresultant competition on a global scale), (b) stronggrowth in investment demand led by the private sector,and (c) fiscal consolidation.
II.2.14 High persistent inflation is a risk to externalcompetitiveness, because of the associated realappreciation of the exchange rate, which couldweaken growth by impacting export prospects.Moreover, in an open economy, domestic producerscould find it difficult to pass on higher input costs in
Chart II.22: CPI and WPI Inflation
Difference WPI CPI-IW
-2
0
2
4
6
8
10
12
14
16
18
Apr-
09
May-0
9
Ju
n-0
9Ju
l-09
Au
g-0
9
Sep-0
9
Oct-
09
Nov-0
9D
ec-0
9Jan
-10
Feb-1
0M
ar-
10
Apr-
10
May-1
0
Ju
n-1
0Ju
l-10
Au
g-1
0
Sep-1
0
Oct-
10
Nov-1
0D
ec-1
0Jan
-11
Feb-1
1M
ar-
11
Apr-
11
May-1
1
Ju
n-1
1Ju
l-11
Y-o
-Y,Per
cen
t
Chart II.23: Trends in GDP Growth andInflation
5 Year Moving Average WPI Inflation
5 Year Moving Average Real GDP Growth
1957-5
8
1961-6
2
1965-6
6
1969-7
0
1973-7
4
1977-7
8
1981-8
2
1985-8
6
1989-9
0
1993-9
4
1997-9
8
2001-0
2
2005-0
6
2010-1
1
0.0
2.0
4.0
6.0
8.0
10.0
12.0
14.0
Per
cen
t

ANNUAL REPORT
32
the form of higher output prices, because of thecompetition from imports resulting in pressures onearnings and dampening of investment plans. Privateinvestment is particularly impacted by distortionsthrough both high inflation and inflation volatility.Private investors have to spend time and money tounderstand and manage the effects of inflation ontheir business. Moreover, foreign investors may alsosee inflation as a risk factor, which could affect capitalflows.
II.2.15 The fiscal situation may not improve in anenvironment of high inflation, despite plannedintention for consolidation. In an environment of risinginflation government expenditure may continue togrow at a pace exceeding the rate of inflation butrevenue collections may not keep up with inflation.This would especially occur when global commodityprices drive inflation, necessitating much largersubsidies than may be planned. While delayed fiscal
consolidation could dampen growth impulses and alsoincrease the risk of inflation, a high inflationenvironment may in itself become a constraint to fasterfiscal consolidation.
II.2.16 Inflation could also work against growththrough other channels, the most important one beingmonetary policy response to inflation and theassociated increase in the interest cost of capital. Fallin asset prices in response to high inflation whichinvolve wealth and income effects also may not becongenial to growth. In pursuing the anti-inflationarypolicy, however, it is important for a central bank toidentify the threshold level of inflation, which may beconsistent with the highest sustainable growth path.Inflation higher than the threshold level would haveto be contained to avoid the welfare loss arising fromboth high inflation and lower growth. Estimates onthreshold inflation for India are found to be in a rangeof 4-6 per cent (Box II.4). Desirable level of inflation
Box II.4Growth Inflation Trade-off and Threshold Inflation
The growth-inflation trade-off debate in economics is a longstanding one. The Phillips curve relationship – the empiricallyobserved negative relation between change in nominalmoney wages and rate of unemployment – gained popularityin the late 1950s and 1960s, but has been long discreditedby economists. The stagflation of the 1970s destroyed faithin it. Phelps and Friedman helped explain the existence ofstagflation by distinguishing the ‘short-run Phillips curve’, alsocalled the ‘expectations-augmented Phillips curve’. Eventhough short-run Phillips curve shifts up when inflationaryexpectations rise, in the long run monetary policy cannotaffect unemployment, which adjusts back to its ‘natural rate’.So Phillips curve becomes vertical in the long run, asexpected inflation equals actual inflation. The long-run Phillipscurve is known as the Non-Accelerating Inflation Rate ofUnemployment (NAIRU).
In the policy debate on the trade-off, a common distinction isoften made between the short-run Phillips curve and the long-run NAIRU. At NAIRU, inflation is fully anticipated. If a centralbank uses the trade-off in the short-run and gives an inflationsurprise (which was not anticipated) in its attempt to allowgrowth to remain above potential, then the actual inflationwill exceed the expected inflation, and the trade-offrelationship may work in the short-run. But the adaptiveexpectation process could soon lead to revision in inflationexpectations, causing an upward shift in the short-run Phillipscurve, at which higher inflation will co-exist with NAIRU. Ifexpectations are rational, then the trade-off relationship maynot exist even in the short-run.
Following the work of Palley (2003), it is now being realisedthat the Phillips curve relationship may be lot more complex,with the likelihood of the relationship changing from lowinflation to high inflation. In these models, inflationexpectations are a positive function of actual inflation. Phillipscurve is negatively sloped at low levels of inflation, becomespositively sloped at high levels of inflation and turns verticalif inflation expectations converge to actual inflation (Chart-1). Thus, there is a threshold inflation at P*, which could becountry specific and is an important guidepost for monetarypolicy in terms of when it could use the short-run trade-off,and when it has to just focus on containing inflation even atthe cost of sacrificing growth. At inflation lower than P*, relyingon short-run trade-off could make sense. But at inflation ratesabove P*, there would not be any exploitable trade-off
Chart 1: The Backward Bending Phillips Curve
Inflation (%)
P*
MUR U* Unemployment Rate (%)
MUR = Minimum Unemployment Rate
(Contd...)

ECONOMIC REVIEW
33
may be even lower than any estimated threshold levelin view of the distributional consequences of inflationand other macro-economic considerations. In the age-old policy debate on growth inflation trade-off, theemphasis has always been on the short-runstabilisation role for monetary policy. This is becausethe natural trend growth of the economy is conditionedby structural factors.
Price statistics improved, with a revised WPI baseand new indices of CPI
II.2.17 Two significant improvements in database onprices during the year were the revision of WPI basefrom 1993-94 to 2004-05 and the introduction of anew Consumer Price Index for ‘rural’, ‘urban’ and ‘AllIndia’ from January 2011 (Box II.5). The new seriesof WPI marks a major improvement in terms of scopeand coverage of commodities and is also morerepresentative of the changing underlying economicstructure. It captures the present underlying economicstructure, which is consistent with changes in theproduction and consumption patterns. The
introduction of new CPIs provides a nationwide priceindex which is more comprehensive both in coverageacross regions and commodity groups. The weightingpattern also reflects more recent consumption patternas compared to the existing CPIs. As year-on-yearinflation data based on the new CPI become availablefrom January 2012, it will be closer to the measure ofinflation that is being commonly used in othercountries for the conduct of monetary policy.
Anti-inflationary thrust of policy sustained in 2010-11amidst changing dynamics of inflation
II.2.18 The changing dynamics of inflation had amajor element of uncertainty throughout the year,which added significant complexity to the ReserveBank’s forward looking assessment of the inflationoutlook. Significant revisions of provisional data oversuccessive months also widened the information lags,particularly the information on the extent ofgeneralisation of price pressures. High inflation andrepeated supply shocks impacted the inflationexpectations adversely, and the Reserve Bank
relationship for policy, and by containing inflation a centralbank could best contribute to sustainable employment andgrowth levels in the medium-run (Gokarn, 2011).
Different techniques have been used in the literature toestimate threshold inflation. Three broad approaches havebeen: (1) running a series of spline regression to findthreshold value of inflation which maximises adjusted R2 andminimises Root Mean Square Error (RMSE), following Sarel(1996), (2) to estimate the unknown threshold inflation alongwith other regression parameters using non-linear leastsquares (NLLS) (Khan and Senhadji, 2001) and (3)estimating threshold using Logistic Smooth TransitionRegression (LSTR) model (Espinoza et.al, 2010). Empiricalestimates for threshold inflation for India using thesealternative techniques are found to be in 4-6 per cent range.
Estimated threshold level, however, need not completelycondition the inflation objective of monetary policy, since evenat the threshold level, the welfare costs of inflation particularlyfor the poorer section of the society, have to be contained.Keeping in view the distributional consequences and themacro-economic requirements of an open economy to keepinflation low relative to the rest of the world, the ReserveBank’s medium-term inflation objective has been 3 per cent.The average of the non-food manufactured products inflationin the last one decade has been about 4 per cent. Anchoringinflation expectations to check inflation has been an importantelement behind monetary policy actions. This has motivated
Reserve Bank’s emphasis on containing perceptions ofinflation in the range of 4.0-4.5 per cent. Clear communicationhas been made in the policy statements to this effect. Theimportance of containing inflation even at the cost of somemarginal sacrifice of growth in the short-run appears to beconsistent with the estimates of growth-inflation trade-off forIndia, as also the distributional and other objectives behindcontaining inflation.
References
Espinoza, R., Leon, H. and Prasad, A., (2010), “Estimatingthe Inflation-Growth Nexus, A Smooth Transition Model”, IMFWorking Paper 10/76.
Gokarn, Subir (2011), “Sustainability of Economic Growthand Controlling Inflation – The Way Forward”, Address atFICCI’s National Executive Committee Meeting, Mumbai,April 5.
Khan, Mohsin S. and Abdelhak S. Senhadji,(2001),"Threshold Effects in the Relationship BetweenInflation and Growth," IMF Staff Papers, vol. 48(1).
Palley, T.I. (2003), “The Backward Bending Phillips Curveand the Minimum Unemployment Rate of Inflation (MURI):Wage Adjustment with Opportunistic Firms”, The ManchesterSchool of Economic and Social Studies, 71(1): 35-50.
Sarel, M (1996), “Non-linear Effects of Inflation on EconomicGrowth”, IMF Staff Papers, Vol.43, No.1.
(...Concld.)

ANNUAL REPORT
34
sustained its anti-inflationary thrust of monetary policyto anchor inflation expectations and contain demandinduced pressures on inflation. The focus of medium-
Box.II.5Towards Better Price Statistics
Revision of WPI Base Year
One significant development during 2010-11 relating toprices data was the revision of base year of WPI from 1993-94 to 2004-05. The weight of primary articles declined inthe revised WPI, while the weight increased for fuel groupand manufactured products (Table 1). Although the changesin the weights for manufactured products are not substantialfor the group as a whole, there has been a shift in weightstowards non-food manufactured products. A substantialincrease in the number of new items added/revised reflectsthe changes in production pattern during the decade. Thenew series has 417 new commodities, of which 406 arenew manufactured products. These include items fromunorganised manufacturing activity. Also the new series haswider coverage as the price quotations have increased from1,918 in the old series to 5,482 in the new series.
The average overall inflation rate, according to the newseries and the old series, is about 5.5 per cent for theoverlapping period for which data are available (i.e., 2005-06 to 2009-10) indicating that there is not much difference
in the rate of inflation between the two series. This, howeveris marked by differential inflation rates for food andnon-food products in the old and new series. Higher foodinflation (both primary and manufactured) in the new seriesis largely offset by the lower inflation in the non-foodmanufactured products leading to smaller difference in theoverall inflation.
Introduction of new Consumer Price Index
The Central Statistics Office (CSO), Ministry of Statisticsand Programme Implementation introduced a new seriesof Consumer Price Indices (CPI) for all-India and States/UTs separately for rural, urban and combined. Indices arebeing released from the month of January 2011 with 2010as the base year. The weighting pattern is derived from theNSSO’s Consumer Expenditure Survey of 2004-05. Acomparison of the new CPI series against the existing seriessuggests that while the weight of food group has declinedsignificantly for both rural and urban groups, themiscellaneous group, largely including services, has shownincrease in its share (Chart 1).
Chart 1: CPI Weights (Old and New)
CPI Rural Labourers (1986-87=100) New CPI-Rural (2010=100)
a: CPI-RL CPI- Weightsvs. Rural
0
10
20
30
40
50
60
70
80
FoodGroup
Pan, Supari,Tobacco
& Intoxicants
Fuel &Light
Clothing,Bedding
& Footwear
MiscellaneousGroup
11.87
24.91
9.765.36
7.9010.42
3.70 2.73
66.77
56.58
Per
cen
t
b: CPI-IW CPI- Weightsvs. Urban
CPI-Industrial Workers (2001=100) New CPI- (2010=100)Urban
FoodGroup
Pan, Supari,Tobacco
& Intoxicants
Fuel &Light
Clothing,Bedding
& Footwear
MiscellaneousGroup
Housing0
5
10
15
20
25
30
35
40
45
50
Per
cen
t
46.20
35.80
2.271.35
6.438.40
15.27
22.53
6.573.91
23.26
28.00
Table 1: Major Changes in the Weights and Commodities in the Revised WPI SeriesWeights Number of Commodities
Items New Series Old Series New Series Old Series New Items(Base:2004-05) (Base:1993-94) (Base:2004-05) (Base:1993-94) added/ revised
1 2 3 4 5 6
All Commodities 100.00 100.00 676 435 417I. Primary Articles 20.12 22.03 102 98 11
Food 14.34 15.40 55 54 1Non-Food and Minerals 5.78 6.63 47 44 10
II. Fuel and Power 14.91 14.23 19 19 0III. Manufactured Products 64.97 63.75 555 318 406
Food 9.97 11.54 57 41 25Non-Food 55.00 52.21 498 277 381
term inflation management, however, must be to easesupply constraints in key sectors where demand couldbe expected to continue to grow.

ECONOMIC REVIEW
35
III. MONEY AND CREDIT
II.3.1 During 2010-11, the Reserve Bank’smonetary policy stance became strongly anti-inflationary. Money growth was moderate during theyear but picked up during the last quarter of 2010-11.Liquidity remained in deficit mode for a major part ofthe year on account of both structural and frictionalfactors. The tight liquidity helped in strengthening themonetary policy transmission, reflected in rise indeposit and lending rates of the banks during the latterpart of the year. Credit to the commercial sectorincreased rapidly during the first quarter of 2010-11,reflecting mainly the borrowings by telecom companiesto pay for spectrum auctions. Notwithstanding somedeceleration in the second quarter of 2010-11, creditgrowth remained strong throughout the year, in linewith the strong growth of the economy.
II.3.2 In 2011-12 till July, as liquidity eased and wasbroadly within the desirable level of deficit (one percent of NDTL of banks), the pace of injection ofprimary liquidity declined leading to a deceleration inbase money growth. Money supply, on the other hand,remained strong on the back of strong growth indeposits.
Strong growth in reserve money in 2010-11 reflectedincrease in currency demand and large injection ofprimary liquidity
II.3.3 Trends in reserve money largely reflect theimpact of the monetary policy changes and liquiditymanagement operations. There was strong growthin reserve money during 2010-11 due to large injectionof primary liquidity in response to the tight liquidityconditions that prevailed since end-May 2010. Evenadjusting for the policy-induced change in the cashreserve ratio (CRR), reserve money growth in 2010-11 was higher than that in 2009-10 (Chart II.24 andAppendix Table 9).
II.3.4 Currency in circulation is the largestcomponent of reserve money and is primarily
determined by demand. There was acceleration incurrency in circulation in 2010-11, due to increaseddemand on account of economic growth, high inflationand low yield on deposits for most part of the year(Box II.6).
II.3.5 On the sources side, net Reserve Bank creditto the Centre2 has been the dominant source ofincrease in reserve money since 2008-09 (ChartII.25). This is because government borrowing shotup significantly in the wake of the global financial crisisand necessitated active management of liquidity inthe form of unwinding/de-sequestering of marketstabilisation scheme (MSS) balances (in 2008-09 and2009-10). Besides, there were large scale injectionsunder liquidity adjustment facility (LAF) and openmarket operations (OMO) purchase auctions duringtimes of liquidity duress in these three years.
Primary liquidity injected mainly in the form of largescale repo and OMO in 2010-11
II.3.6 The most notable source of increase in netReserve Bank credit to the Centre during 2010-11
2 Changes in net Reserve Bank credit to the Centre primarily reflect the combined impact of the Reserve Bank’s liquidity managementoperations conducted through OMO, operations under the MSS, LAF and Marginal Standing Facility (MSF - introduced in 2011-12) as also thegovernment’s cash management operations. Increase in repo under LAF/OMO purchases/availment of MSF and decline in reverse repounder LAF/MSS balances/government’s surplus balances with Reserve Bank lead to increase in net Reserve Bank credit to the Centre, andvice versa.
Chart II.24: Growth in Reserve Money
Reserve Money Adjusted Reserve Money
Per
cen
t
5
10
15
20
2008-09 2009-10 2010-11

ANNUAL REPORT
36
was LAF operations. This reflected the change in themode of the LAF from reverse repo (absorption ofliquidity) to repo (injection of liquidity). The other majorsource of injection of liquidity was open marketpurchases worth about `67,000 crore conductedmainly through the auction route. The OMO wasconfined to the second half of the year. The ReserveBank also unwound the remaining MSS balancesamounting to `2,737 crore by July 2010.
II.3.7 Even though LAF operations and open marketpurchases explain almost the entire fiscal variationin net Reserve Bank credit to the Centre, the mostsignificant liquidity impacting variable intra-year wasthe Centre’s surplus balances with the Reserve Bank,which is an autonomous determinant of liquidity. FromJune 2010, there was a significant increase ingovernment’s balances with the Reserve Bankreflecting the higher-than-expected proceeds fromauctions of telecom spectrums. The balance wasfurther boosted by the quarterly advance taxcollections. The government balances continued tobuild up till the end of the third quarter of 2010-11.The sharp drawdown of government balances duringthe fourth quarter improved the liquidity situation.
II.3.8 Overall monetary conditions reflectedsignificant changes in the autonomous drivers ofliquidity as well as the offsetting discretionary liquidity
management operations of the Reserve Bank. Duringthe third quarter of 2010-11, large liquidity deficitoccurred amidst tight monetary policy stance. TheReserve Bank undertook liquidity injections throughLAF repos that peaked at nearly two times more thanthe level conforming to the comfort zone of theReserve Bank. The aggregate outcome of variationsin autonomous and discretionary components ofliquidity match with the changes in banks’ reserves(Chart II.26). Detailed discussions on liquiditymanagement operations of the Reserve Bank arepresented in Chapter III.
Slower pace of deposit mobilisation and dip inmultiplier led to low rate of money growth in 2010-11
II.3.9 Broad money (M3) growth decelerated for the
third successive year in 2010-11, though the pace ofdeceleration was lower than that of the previous year,reflecting the resurgence in economic activity(Appendix Table 10). On the components side, thedeceleration was mainly on account of contraction indemand deposits. There was a slowdown in thegrowth of time deposits initially, which though reversedtrend during the latter part of the year as banks raisedinterest rates markedly (Chart II.27). The strongertransmission of monetary policy led to a substitutionfrom demand deposits to time deposits during the lastquarter of 2010-11 and in 2011-12 so far. Currency
Chart II.26: Liquidity ManagementOperations
-150
-100
-50
0
50
100
150
Q1 Q2 Q3 Q4 Q1 Q2 Q3 Q4 Q1
2009-10 2010-11 2011-12
Vari
ati
on
sin
`Th
ou
san
dcro
re
Autonomous Drivers of Liquidity
RBI's Management of Liquidity
Change in Bank Reserves
Chart II.25: Important Sources ofVariation in Reserve Money
2008-09 2009-10 2010-11-200
-100
0
100
200
300
(Th
ou
san
dcro
re)
`
MSS Open Market Purchases LAF Centre's SurplusNet Foreign Currency Assets Adjusted for Valuation
Note: Net Reserve Bank Credit to the Centre represents the combinedimpact of changes in MSS, Open Market Purchases, LAF and Centre'sSurplus Balance.
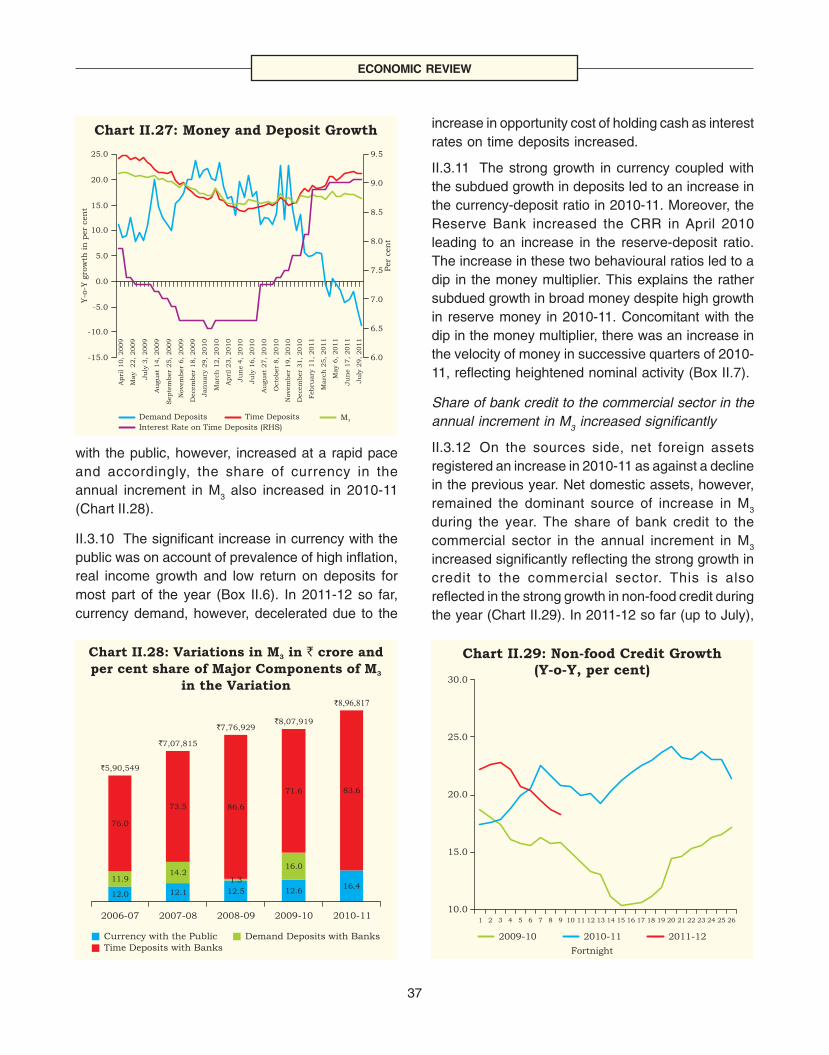
ECONOMIC REVIEW
37
with the public, however, increased at a rapid paceand accordingly, the share of currency in theannual increment in M3 also increased in 2010-11(Chart II.28).
II.3.10 The significant increase in currency with thepublic was on account of prevalence of high inflation,real income growth and low return on deposits formost part of the year (Box II.6). In 2011-12 so far,currency demand, however, decelerated due to the
increase in opportunity cost of holding cash as interestrates on time deposits increased.
II.3.11 The strong growth in currency coupled withthe subdued growth in deposits led to an increase inthe currency-deposit ratio in 2010-11. Moreover, theReserve Bank increased the CRR in April 2010leading to an increase in the reserve-deposit ratio.The increase in these two behavioural ratios led to adip in the money multiplier. This explains the rathersubdued growth in broad money despite high growthin reserve money in 2010-11. Concomitant with thedip in the money multiplier, there was an increase inthe velocity of money in successive quarters of 2010-11, reflecting heightened nominal activity (Box II.7).
Share of bank credit to the commercial sector in theannual increment in M
3 increased significantly
II.3.12 On the sources side, net foreign assetsregistered an increase in 2010-11 as against a declinein the previous year. Net domestic assets, however,remained the dominant source of increase in M3
during the year. The share of bank credit to thecommercial sector in the annual increment in M3
increased significantly reflecting the strong growth incredit to the commercial sector. This is alsoreflected in the strong growth in non-food credit duringthe year (Chart II.29). In 2011-12 so far (up to July),
Chart II.28: Variations in M in3 ` crore and
per cent share of Major Components of M
in the Variation3
Currency with the Public Demand Deposits with BanksTime Deposits with Banks
2006-07 2007-08 2008-09 2009-10 2010-11
12.0
11.9
76.0
12.1
14.2
73.5
12.5
1.3
86.6
12.6
16.0
71.6
16.4
83.6
`5,90,549
`7,07,815
`7,76,929`8,07,919
`8,96,817
Chart II.27: Money and Deposit Growth
-15.0
-5.0
0.0
5.0
10.0
15.0
20.0
25.0
Y-o
-Ygro
wth
inper
cen
t
6.0
6.5
7.0
7.5
8.0
8.5
9.0
9.5
Per
cen
t
Demand Deposits Time Deposits M3
Interest Rate on Time Deposits (RHS)
Apri
l10,2009
May
22,2009
Ju
ly3,2009
Au
gu
st
14,2009
Septe
mber
25,2009
Novem
ber
6,2009
Decem
ber
18,2009
Jan
uary
29,2010
Marc
h12,2010
Apri
l23,2010
Ju
ne
4,2010
Ju
ly16,2010
Au
gu
st
27,2010
Octo
ber
8,2010
Novem
ber
19,2010
Decem
ber
31,2010
Febru
ary
11,2011
Marc
h25,2011
May
6,2011
Ju
ne
17,2011
Ju
ly29,2011
-10.0
Chart II.29: Non-food Credit Growth(Y-o-Y, per cent)
10.0
15.0
20.0
25.0
30.0
Fortnight
2009-10 2010-11 2011-12
1 2 3 4 5 6 7 8 9 10 11 12 13 14 15 16 17 18 19 20 21 22 23 24 25 26

ANNUAL REPORT
38
Box II.6Determinants of Currency Demand – What Caused the Shift in Trend?
The demand for currency is determined by a number offactors such as income, price level, the opportunity cost ofholding currency, i.e., the interest rate on interest bearingassets and the availability of alternative instruments oftransactions, eg. credit/debit cards, ATMs, cheque payments,etc.. Currency is also used as a store of value, particularly incountries with low inflation or large shadow economies.Currencies such as the US dollar, euro, yen and pound havelarge off-shore demand as medium of internationaltransactions.
Several factors could explain the growth in currency demandin India in 2010-11. Inflation remained high, often in doubledigits, in respect of commodities such as foodgrain, pulses,fruits and vegetables, and milk during 2009-10 and 2010-11– where transactions are expected to be cash-intensive.Consequently, after a long period of secular decline, the shareof agriculture and allied activities in nominal GDP increasedfrom 17.6 per cent in 2008-09 to 19.0 per cent in 2010-11.Second, there was a step-up in real economic activity from6.8 per cent in 2008-09 to 8.5 per cent in 2010-11. Third, theinterest rate on bank deposits was generally lower thaninflation during 2010-11, implying a negative real rate of returnon deposits.
A study of the decadal trend reveals that even as incomeelasticity of currency demand has stayed relatively stable,price elasticity increased significantly in the decade of 2000s,which experienced a low and stable inflation for a majorpart. In the remaining years, when inflation was relativelyhigh, currency demand shot up significantly. In theory,increase in ATM network (increase in number of ATMs aswell as access usage rules such as freer access to ATMs ofother banks) decreases show leather costs. However, cross-country evidence suggests that the attractiveness of currencyas a medium of exchange can increase as against cardpayments. This is observed in India also (Chart 1). This couldhave facilitated the substitutability between currency anddemand deposits in recent years.
During the 2000s, the acceleration in per capita real GDPgrowth, commercialisation of agriculture and allied activities
and urbanisation, and availability of higher denominationnotes appear to have maintained the increasing growth trendof the cash economy operating from both the demand andthe supply sides. The social sector expenditure by theGovernment, particularly in rural areas (MGNREGS, etc.)also seems to have boosted demand for cash, particularlyin 2008-09 when the currency to GDP ratio peaked. Also,currency use, being anonymous, facilitates tax evasion. Withincreasing importance of KYC and CBS and reporting of largevalue bank transactions for tax purposes in the recent years,currency demand can potentially rise, reflected in uptrend inthe currency to GDP ratio (Chart 2).
Over the long term, an estimated relationship using VECM,relating to demand for currency in India for the period 1972-73 to 2010-11 reveals that a 1 per cent increase in the realincome (GDP) leads to a 1.24 per cent increase in thedemand for currency. The price effect on the demand forcurrency is also found to be close to unity. A 1 per centincrease in the prices (WPI) leads to a 1.05 per cent increasein the demand for currency. Further, it was found that interestrate per se is not a significant determinant of currency.However, in the years when the real return on term depositsis negative (the average inflation being higher than theaverage rate on deposits of one-three year maturity), theinterest rate seems to be a significant determinant of currencydemand.
References:
Amromin, Gene and Sujit Chakravorti (2009), “Whither LooseChange? The Diminishing Demand for Small DenominationCurrency”, Journal of Money, Credit and Banking, 41(2-3):315-335, March-April.
Embaye, Abel and Wei-Choun Yu, (2010). “ Tax Evasion andCurrency Ratio: Panel Evidence from Developing Countries”,Empirical Economics.
Nyberg, Lars (2011), “Will Cash Replace Cards?”. Speechat Cards & Cash Payments Forum in Stockholm, May,Sveriges Riksbank.
Chart 1: Currency to Demand Deposits
108
113
118
123
128
133
138
143
1991-9
2
1992-9
3
1993-9
4
1994-9
5
1995-9
6
1996-9
7
1997-9
8
1998-9
9
1999-0
0
2000-0
1
2001-0
2
2002-0
3
2003-0
4
2004-0
5
2005-0
6
2006-0
7
2007-0
8
2008-0
9
2009-1
0
2010-1
1
Per
cent
Chart 2: Growth in Currency and the Cash Economy
1991-9
2
1992-9
3
1993-9
4
1994-9
5
1995-9
6
1996-9
7
1997-9
8
1998-9
9
1999-0
0
2000-0
1
2001-0
2
2002-0
3
2003-0
4
2004-0
5
2005-0
6
2006-0
7
2007-0
8
2008-0
9
2009-1
0
2010-1
1
8.0
10.0
12.0
14.0
16.0
18.0
20.0
22.0
Y-o
-ygro
wth
inper
cen
t
8.0
8.5
9.0
9.5
10.0
10.5
11.0
Per
cen
t
Currency Growth Cash to GDP (RHS)

ECONOMIC REVIEW
39
Box II.7Short-run Shocks to Money Velocity and the Behaviour of Money Growth
M3 growth, for most part of 2010-11, remained below theReserve Bank’s indicative trajectory. This deceleration inmoney growth alongside both a robust pick-up in growth aswell as a high inflation environment, would suggest acorresponding increase in the velocity of money (followingthe conventional quantity theory of money equation MV=PY).In a theoretical framework, the velocity of money is generallypresumed to be stable, if not constant, especially in the shortrun. Any breakdown in its stability, particularly due tosignificant short run shocks, and the volatility therein couldeither amplify or dampen the expected relationship betweenmoney, output and prices (as set out in the conventionalmonetary arithmetic above). Also anticipated andunanticipated shocks to money demand and the resultantshift in the velocity pattern could add further noise to thetrend in money growth.
In almost every country, velocity of money has exhibitedsignificant deviations from its respective medium-termtrend post the global crisis, thereby complicating theanalysis of monetary trends vis-à-vis those of output andprices. The sharp fall in velocity for the US (because of thefinancial crisis) despite the massive quantitative easing inthe aftermath of the Great Recession and the ensuing“velocity crowding out of quantitative easing” highlights thatexternal developments, especially contagion risk arising fromcrises, could add significant instability to domestic moneydemand.
In India, the velocity of money, computed as a ratio of thenominal income to broad money, has declined since the late1960s. Bordo and Jonung (1987) in their pioneering studyidentified a “U” shaped velocity pattern across countries withdistinct phases corresponding to the level of development.In the initial developing phase of a country, due to theincreasing monetization of the economy, money demand
rises (reflected in money supply growth) and velocity falls.Once the financial system deepens accompanied by financialand technological innovations, as the country develops,increasing confidence in the stability of the financial systemlowers the income elasticity of money demand which can beseen as the rising phase of velocity.
In the Indian context, both annual and quarterly datacorrespond to the initial falling phase of velocity which couldbe ascribed to the increasing monetization of the economy(Chart 1). Despite the financial sector reforms and theenhanced financial deepening, the economic growth of thelast decade has plausibly accelerated the monetisationprocess so much that it more than offset the gains from thefinancial sophistication. Hence the continued decline invelocity.
In recent years, however, the rate of decline in velocity hadaccelerated. Accentuated liquidity preference and slack creditdemand in the aftermath of the crisis were reflected in sharpfall in velocity (Chart 2). Subsequently, with the return ofconfidence in the financial system and the economy, velocity
Chart 1: Falling Velocity of Money overthe Last Six Decades
1952-5
3
1955-5
6
1958-5
9
1961-6
2
1964-6
5
1967-6
8
1970-7
1
1973-7
4
1976-7
7
1979-8
0
1982-8
3
1985-8
6
1988-8
9
1991-9
2
1994-9
5
1997-9
8
2000-0
1
2003-0
4
2006-0
7
2009-1
0
`cro
re
0
2000000
4000000
6000000
8000000
10000000
1.21.62.02.42.83.23.64.04.44.85.25.6
Nominal GDP Broad Money Velocity (RHS)
Quarterly
Chart 2: Money Velocity Trends Since the Global Crisis
Annual
1.22
1.24
1.26
1.28
1.30
1.32
1.34
1.36
1.38
1.40
2007-08 2008-09 2009-10 2010-11
-8.0
-6.0
-4.0
-2.0
0.0
2.0
4.0
Velocity Change in Velocity (Y-o-Y %, RHS)
1.15
1.20
1.25
1.30
1.35
1.40
2008-0
9:
Q3
2008-0
9:
Q4
2009-1
0:
Q1
2009-1
0:
Q2
2009-1
0:
Q3
2009-1
0:
Q4
2010-1
1:
Q1
2010-1
1:
Q2
2010-1
1:
Q3
2010-1
1:
Q4
-12
-8
-4
0
4
8
12
Velocity Change in Velocity (Y-o-Y %, RHS)
(Contd....)

ANNUAL REPORT
40
increased to its normal trend. This increase in velocityfollowing the fast paced fall witnessed in the past two years,explains the subdued growth in M3 in 2010-11.
A Vector Error Correcting Model (VECM) estimation of somedeterminants of velocity as suggested by theoretical andempirical literature – output [Y - GDP at factor cost (constantprice)], interest rate (R1 - Annual SBI lending rate; R2 -Quarterly 91-day T-Bill rate), inflation expectations (WPI),financial deepening indicator proxied by bank credit to GDPratio (CY), and a dummy variable (D1 - Annual; D2 - Quarterly)capturing the impact of short run disturbances on velocity –yielded the following results.
Annual Data:
V = 54.38 – 4.03 Y + 0.04 R1 + 1.28 D1
(9.81) (1.39) (6.29)
Quarterly Data:
V = 39.52 – 3.19Y + 0.05 R2 + 1.90 WPI + 2.30 CY- 0.18D2
(5.06) (6.34) (6.96) (2.65) (6.98)
Money growth trajectory projection involves the conditionalpredictability of velocity. Hence, money growth in the absence
of reference to velocity trends could at times be misleading,even in the short run. Empirical estimates suggest that theconventional determinants of velocity (GDP, interest rateand financial deepening) as well as the short termshocks are statistically significant for Indian data. But in timesof major uncertainty velocity could significantly deviate fromits medium trend and weaken any forward-lookingassessment.
Short-run trends in money growth should be seen along withexpected changes in velocity. In the medium run, however,velocity could be expected to remain anchored to the longrun trend, and hence, money growth in the medium-term ismore likely to be consistent with the inflation and output trendsthan in the short-run.
Reference:
Pattanaik, Sitikantha and Subhadhra S (2011), “The VelocityCrowding-out Impact: Why high money growth is not alwaysinflationary”, RBI Working Paper, May 2011.
Bordo, Michael D., and Lars Jonung, The Long-Run Behaviorof the Velocity of Circulation: The International Evidence,Cambridge: Cambridge University Press, 1987.
(...Concld.)
even as credit growth is decelerating, it remainsabove the Reserve Bank’s indicative trajectory for theyear.
II.3.13 Disaggregated data suggest that the flow ofcredit to industry during 2010-11 remained strongwhile that to services and personal loans increasedsignificantly (Appendix Table 11). Within industry,even though infrastructure continued to account forthe largest share of industrial credit, the share of
other industry groups such as food processing, basicmetal and metal products and engineering inincremental credit to industry increased (Chart II.30).During the first quarter of 2011-12, while thedominant share of incremental industrial credit wentto infrastructure sector, basic metal and metalproducts, petroleum and mining and quarrying alsotogether accounted for one third of the incrementalindustrial credit during the quarter.
2010-112009-10
Food Processing Textiles Chemicals & Chemical Products Basic Metal & Metal Product
All Engineering Construction Other Industries Infrastructure
Chart II.30: Share of Various Sub-sectors in Incremental Industrial Credit Flow
22.8
42.8
4.67.3
4.0
13.3
3.12.2
47.4
6.2
7.6
2.8
15.2
6.3
1.9
12.6
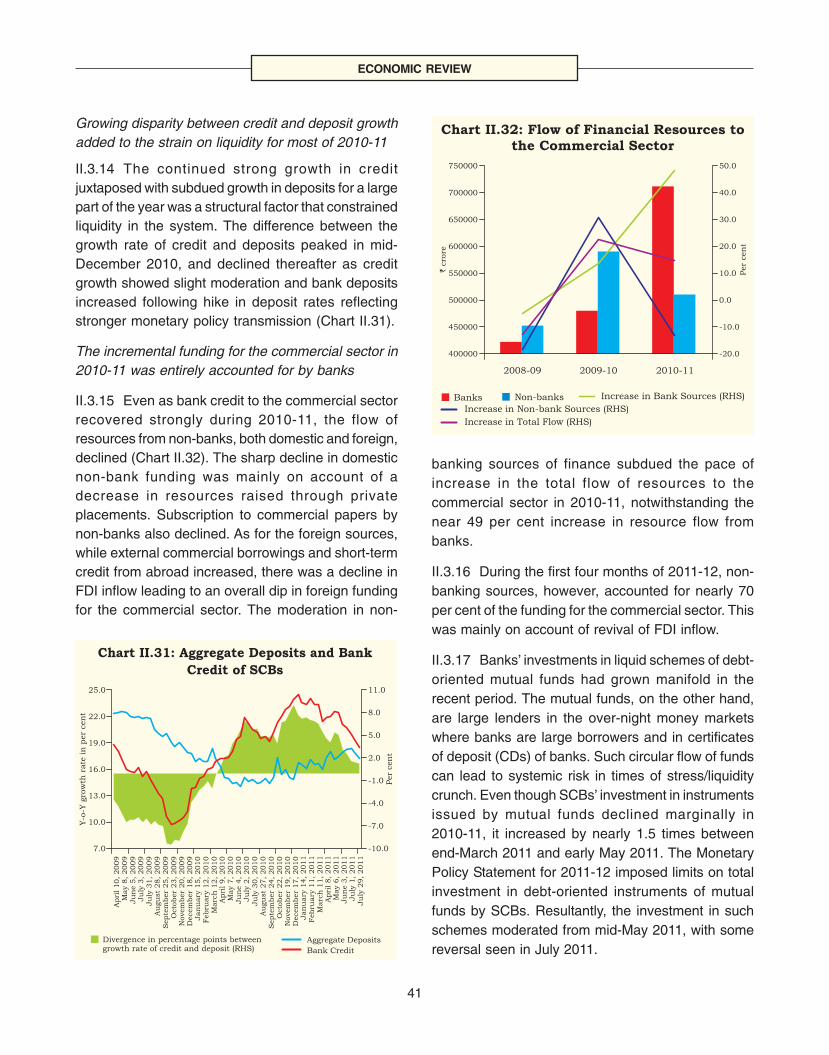
ECONOMIC REVIEW
41
Chart II.31: Aggregate Deposits and Bank
Credit of SCBs
Divergence in percentage points betweengrowth rate of credit and deposit (RHS)
Aggregate Deposits
Bank Credit
7.0
10.0
13.0
16.0
19.0
22.0
25.0
-10.0
-7.0
-4.0
-1.0
2.0
5.0
8.0
11.0
Y-o
-Ygro
wth
rate
inper
cen
t
Per
cen
t
Apri
l10,2009
May
8,2009
Ju
ne
5,2009
Ju
ly3,2009
Ju
ly31,2009
Au
gu
st
28,2009
Septe
mber
25,2009
Octo
ber
23,2009
Novem
ber
20,2009
Decem
ber
18,2009
Jan
uary
15,2010
Febru
ary
12,2010
Marc
h12,2010
Apri
l9,2010
May
7,2010
Ju
ne
4,2010
Ju
ly2,2010
Ju
ly30,2010
Au
gu
st
27,2010
Septe
mber
24,2010
Octo
ber
22,2010
Novem
ber
19,2010
Decem
ber
17,2010
Jan
uary
14,2011
Febru
ary
11,2011
Marc
h11,2011
Apri
l8,2011
May
6,2011
Ju
ne
3,2011
Ju
ly1,2011
Ju
ly29,2011
Chart II.32: Flow of Financial Resources tothe Commercial Sector
-20.0
-10.0
0.0
10.0
20.0
30.0
40.0
50.0
Per
cen
t
400000
450000
500000
550000
600000
650000
700000
750000
`cro
re
2008-09 2009-10 2010-11
Banks Non-banks Increase in Bank Sources (RHS)
Increase in Non-bank Sources (RHS)
Increase in Total Flow (RHS)
Growing disparity between credit and deposit growthadded to the strain on liquidity for most of 2010-11
II.3.14 The continued strong growth in creditjuxtaposed with subdued growth in deposits for a largepart of the year was a structural factor that constrainedliquidity in the system. The difference between thegrowth rate of credit and deposits peaked in mid-December 2010, and declined thereafter as creditgrowth showed slight moderation and bank depositsincreased following hike in deposit rates reflectingstronger monetary policy transmission (Chart II.31).
The incremental funding for the commercial sector in2010-11 was entirely accounted for by banks
II.3.15 Even as bank credit to the commercial sectorrecovered strongly during 2010-11, the flow ofresources from non-banks, both domestic and foreign,declined (Chart II.32). The sharp decline in domesticnon-bank funding was mainly on account of adecrease in resources raised through privateplacements. Subscription to commercial papers bynon-banks also declined. As for the foreign sources,while external commercial borrowings and short-termcredit from abroad increased, there was a decline inFDI inflow leading to an overall dip in foreign fundingfor the commercial sector. The moderation in non-
banking sources of finance subdued the pace ofincrease in the total flow of resources to thecommercial sector in 2010-11, notwithstanding thenear 49 per cent increase in resource flow frombanks.
II.3.16 During the first four months of 2011-12, non-banking sources, however, accounted for nearly 70per cent of the funding for the commercial sector. Thiswas mainly on account of revival of FDI inflow.
II.3.17 Banks’ investments in liquid schemes of debt-oriented mutual funds had grown manifold in therecent period. The mutual funds, on the other hand,are large lenders in the over-night money marketswhere banks are large borrowers and in certificatesof deposit (CDs) of banks. Such circular flow of fundscan lead to systemic risk in times of stress/liquiditycrunch. Even though SCBs’ investment in instrumentsissued by mutual funds declined marginally in2010-11, it increased by nearly 1.5 times betweenend-March 2011 and early May 2011. The MonetaryPolicy Statement for 2011-12 imposed limits on totalinvestment in debt-oriented instruments of mutualfunds by SCBs. Resultantly, the investment in suchschemes moderated from mid-May 2011, with somereversal seen in July 2011.

ANNUAL REPORT
42
IV. FINANCIAL MARKETS
Sovereign risks come to fore in the internationalfinancial markets
II.4.1 International financial markets witnessedfrequent re-pricing of risks during 2010-11, reflectingpersisting uncertainties. Sovereign risk concerns,particularly in the Euro Area affected the financialmarkets for a greater part of the year, with thecontagion of Greece’s sovereign debt problemspreading to other economies in the Euro Area,notably Ireland, Portugal and Spain, despite transientstability resulting from the significant European rescuepackage. As a result, sovereign CDS spreadswidened in the region (Chart II.33a to d). The multi-paced global recovery led to divergent policyresponses. While advanced economies (AEs) eithermaintained or further eased their monetary policy tostimulate economic growth, a number of EMEsresorted to monetary tightening in response toinflationary pressures. During 2010, EMEs attracted
greater portfolio flows given the easy availability ofliquidity in AEs, especially after the announcement ofthe second round of quantitative easing (QE2) by theUS Fed. These flows, in turn, exerted upwardpressures on EME currencies and asset prices,prompting some of these economies to take recourseto macro prudential measures and soft capitalcontrols.
II.4.2 Towards the end of 2010 and early 2011,however, there was a rebalancing of global portfolioson the back of strengthening economic recovery inAEs, particularly the US, and equity prices in theseeconomies increased. While credit spread narroweddown considerably in many AEs, bond yields firmedup reflecting the post-crisis rise in debt to GDP ratioas well as incipient signs of inflationary concerns. Byend-February 2011, geopolitical risks in Middle Eastand North Africa (MENA) region and therepercussions on oil prices affected investorsentiments and sovereign CDS spreads increased ina few vulnerable economies in the Euro Area. AEs
Chart II.33: Indicators of Global Financial Market Developments
c: Stock Prices: Global and EME
DOW JONES SENSEX MSCI WORLD (RHS) MSCI EM (RHS)
6000
8000
10000
12000
14000
16000
18000
20000
22000
Index
0
200
400
600
800
1000
1200
1400
1600
Index
1-A
pr-
09
16-M
ay-0
9
30-J
un
-09
14-A
ug-0
9
28-S
ep-0
9
12-N
ov-0
9
27-D
ec-0
9
10-F
eb-1
0
27-M
ar-
10
11-M
ay-1
0
25-J
un
-10
9-A
ug-1
0
23-S
ep-1
0
7-N
ov-1
0
22-D
ec-1
0
5-F
eb-1
1
22-M
ar-
11
6-M
ay-1
1
20-J
un
-11
4-A
ug-1
1
d: Exchange Rate Movements
0.4
0.51
0.62
0.73
0.84
0.95
1-A
pr-
09
16-M
ay-0
9
30-J
un
-09
14-A
ug-0
9
28-S
ep-0
9
12-N
ov-0
9
27-D
ec-0
9
10-F
eb-1
0
27-M
ar-
10
11-M
ay-1
0
25-J
un
-10
9-A
ug-1
0
23-S
ep-1
0
7-N
ov-1
0
22-D
ec-1
0
5-F
eb-1
1
22-M
ar-
11
6-M
ay-1
1
20-J
un
-11
4-A
ug-1
1
50
60
70
80
90
100
110
GBP/USD EUR/USD JPY/USD (RHS)
a: Sovereign CDS Spreads: Euro Area
0
500
1000
1500
2000
2500
3000
1-A
pr-
09
16-M
ay-0
9
30-J
un
-09
14-A
ug-0
9
28-S
ep-0
9
12-N
ov-0
9
27-D
ec-0
9
10-F
eb-1
0
27-M
ar-
10
11-M
ay-1
0
25-J
un
-10
9-A
ug-1
0
23-S
ep-1
0
7-N
ov-1
0
22-D
ec-1
0
5-F
eb-1
1
22-M
ar-
11
6-M
ay-1
1
20-J
un
-11
4-A
ug-1
1
Basis
Poin
ts
Greece Ireland Portugal SpainItaly Belgium Germany
b: 10-year Government Bond Yields in EMEs
India China
2
3
4
5
6
7
8
9
Per
cen
t
1-A
pr-
09
16-M
ay-0
9
30-J
un
-09
14-A
ug-0
9
28-S
ep-0
9
12-N
ov-0
9
27-D
ec-0
9
10-F
eb-1
0
27-M
ar-
10
11-M
ay-1
0
25-J
un
-10
9-A
ug-1
0
23-S
ep-1
0
7-N
ov-1
0
22-D
ec-1
0
5-F
eb-1
1
22-M
ar-
11
6-M
ay-1
1
20-J
un
-11
4-A
ug-1
1
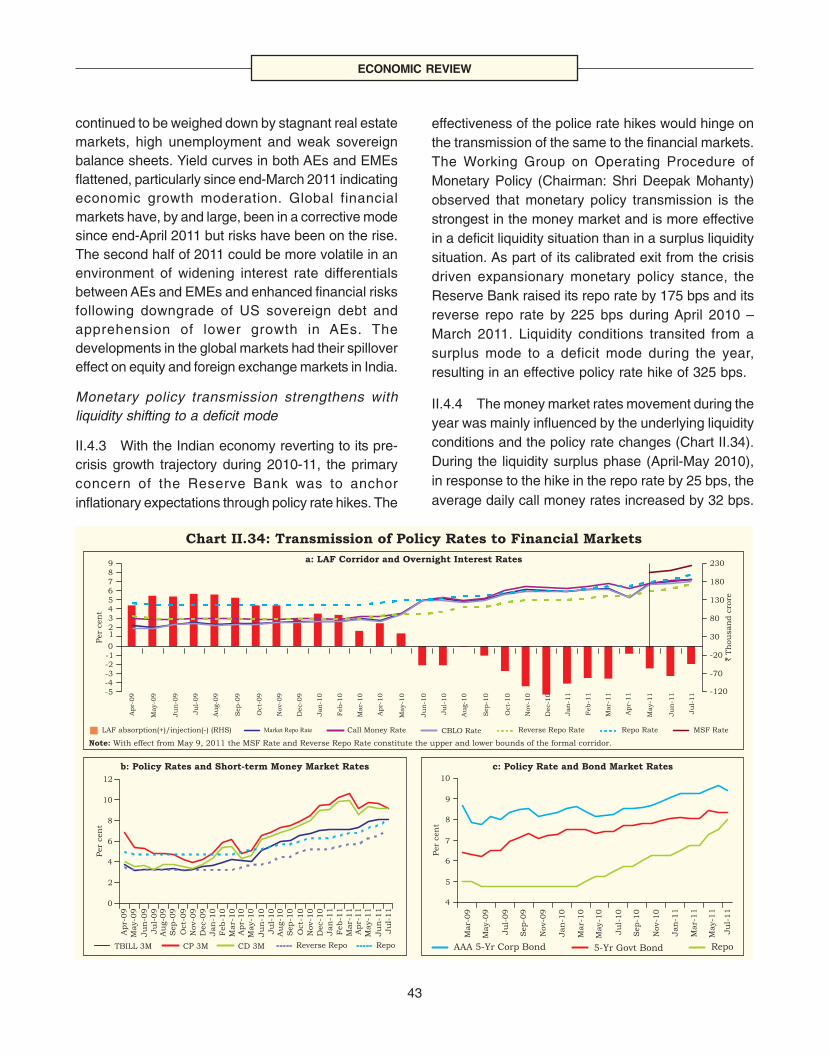
ECONOMIC REVIEW
43
continued to be weighed down by stagnant real estatemarkets, high unemployment and weak sovereignbalance sheets. Yield curves in both AEs and EMEsflattened, particularly since end-March 2011 indicatingeconomic growth moderation. Global financialmarkets have, by and large, been in a corrective modesince end-April 2011 but risks have been on the rise.The second half of 2011 could be more volatile in anenvironment of widening interest rate differentialsbetween AEs and EMEs and enhanced financial risksfollowing downgrade of US sovereign debt andapprehension of lower growth in AEs. Thedevelopments in the global markets had their spillovereffect on equity and foreign exchange markets in India.
Monetary policy transmission strengthens withliquidity shifting to a deficit mode
II.4.3 With the Indian economy reverting to its pre-crisis growth trajectory during 2010-11, the primaryconcern of the Reserve Bank was to anchorinflationary expectations through policy rate hikes. The
effectiveness of the police rate hikes would hinge onthe transmission of the same to the financial markets.The Working Group on Operating Procedure ofMonetary Policy (Chairman: Shri Deepak Mohanty)observed that monetary policy transmission is thestrongest in the money market and is more effectivein a deficit liquidity situation than in a surplus liquiditysituation. As part of its calibrated exit from the crisisdriven expansionary monetary policy stance, theReserve Bank raised its repo rate by 175 bps and itsreverse repo rate by 225 bps during April 2010 –March 2011. Liquidity conditions transited from asurplus mode to a deficit mode during the year,resulting in an effective policy rate hike of 325 bps.
II.4.4 The money market rates movement during theyear was mainly influenced by the underlying liquidityconditions and the policy rate changes (Chart II.34).During the liquidity surplus phase (April-May 2010),in response to the hike in the repo rate by 25 bps, theaverage daily call money rates increased by 32 bps.
Chart II.34: Transmission of Policy Rates to Financial Markets
a: LAF Corridor and Overnight Interest Rates
LAF absorption(+)/injection(-) (RHS) Market Repo Rate Call Money Rate CBLO Rate Reverse Repo Rate Repo Rate MSF Rate
Note: With effect from May 9, 2011 the MSF Rate and Reverse Repo Rate constitute the upper and lower bounds of the formal corridor.
-5-4-3-2-10
123456789
Apr-
09
May-0
9
Ju
n-0
9
Ju
l-09
Au
g-0
9
Sep-0
9
Oct-
09
Nov-0
9
Dec-0
9
Jan
-10
Feb-1
0
Mar-
10
Apr-
10
May-1
0
Ju
n-1
0
Ju
l-10
Au
g-1
0
Sep-1
0
Oct-
10
Nov-1
0
Dec-1
0
Jan
-11
Feb-1
1
Mar-
11
Apr-
11
May-1
1
Ju
n-1
1
Ju
l-11
Per
cen
t
80
130
180
230
`Th
ou
san
dcro
re
b: Policy Rates and Short-term Money Market Rates
0
2
4
6
8
10
12
Apr-
09
May-0
9
Ju
n-0
9Ju
l-09
Au
g-0
9S
ep-0
9
Oct-
09
Nov-0
9D
ec-0
9Jan
-10
Feb-1
0M
ar-
10
Apr-
10
May-1
0
Ju
n-1
0Ju
l-10
Au
g-1
0S
ep-1
0
Oct-
10
Nov-1
0D
ec-1
0Jan
-11
Feb-1
1M
ar-
11
Apr-
11
May-1
1
Ju
n-1
1Ju
l-11
Per
cen
t
TBILL 3M CP 3M CD 3M Reverse Repo Repo
c: Policy Rate and Bond Market Rates
4
5
6
7
8
9
10
Per
cen
t
AAA 5-Yr Corp Bond 5-Yr Govt Bond Repo
-120
-70
-20
30
Mar-
09
May-0
9
Ju
l-09
Sep-0
9
Nov-0
9
Jan
-10
Mar-
10
May-1
0
Ju
l-10
Sep-1
0
Nov-1
0
Jan
-11
Mar-
11
May-1
1
Ju
l-11

ANNUAL REPORT
44
The certificates of deposit (CD) rates declined. At themedium to longer end, the yields on 5-year and10-year G-secs too declined by 21 bps and 38 bps,respectively.
II.4.5 During the liquidity deficit phase, monetarytransmission strengthened. With a repo rate hike of150 bps during the period June 2010-March 2011,the average daily call rate increased by 332 bps andhovered around the upper bound of the corridor. Thehigher call money rates also reflected the skewed SLRholding across the banks. The rates in thecollateralised segment generally moved in tandemwith the call rate, but mostly remained below it. Theother money market rates also increased. In tune withthe monetary policy stance, the yield curve shifted upreflecting the hardening of the short to medium-termrates. The lower than budgeted market borrowingprogramme for the second half of 2010-11, increasein the investment limits of FIIs in governmentsecurities, OMO purchases by the Reserve Bankduring the third quarter of 2010-11, as also the lowerthan expected market borrowings announced for thefirst half of 2011-12 improved the market sentiment.These factors, along with a well-anchored mediumto long-term inflation expectations and a moderationin growth outlook contributed to the flattening of theyield curve. Accordingly, the rise in the medium term(5-year) and long-term (10-year) yields was lower thanthat of money market rates (Chart II.35). In view ofthe flattening of the yield curve at the longer end, theshare of the primary issuances of the longer datedsecurities was raised during the year.
II.4.6 The transmission of policy rate hikes to thecredit markets, which remained weak during the firstquarter of 2010-11, strengthened significantlythereafter following the introduction of the Base Ratein July 2010 and the prevailing deficit liquidityconditions turning tight from end-May 2010. Banksincreased deposit rates by 25-500 bps across variousmaturities between end-June 2010 and end-March2011 to accommodate the accelerated growth incredit. Several banks increased their Base Rates by25-250 bps between end-July 2010 and end-March
2011. Base Rates ruled in a narrow range reflectinga greater convergence of rates across banks. TheBase Rate system has improved the transmissionfrom the policy rate to banks’ lending rates (Pleaserefer to Box III.1 of Chapter III on monetary policytransmission after the switch over to the Base Rate).
Monetary transmission strengthens further during2011-12 so far.
II.4.7 The transmission mechanism strengthenedfurther during 2011-12 so far. Following a cumulativeincrease of 125 bps in the repo rate during April-July2011, money market rates moved in step with thepolicy rate hikes. The issuances of cash managementbills to the tune of ̀ 58,000 crore during April-July 2011to meet temporary mismatches between Governmentreceipts and expenditure also exerted pressure onmoney market rates. The yields on dated Governmentsecurities increased across maturities during 2011-12 (April-August 12) rising more at the shorter endthan at the longer end, reflecting the impact of policyrate hikes and larger issuances at the short-end.Interestingly, the yield on 10-year securities was lowerthan the yields at the shorter end, reflecting thepreferred market habitat and the liquidity of the10-year segment resulting in a kinked yield curve.
Chart II.35: Movement in GovernmentSecurities Yield Curve
Term in years
5
5.5
6
6.5
7
7.5
8
8.5
9
1 2 3 4 5 6 7 8 9 10 11121314151617181920 21222324252627282930
Yie
ldin
per
cen
t
31-Mar-10 31-Mar-11 30-Jun-1129-Jul-11 12-Aug-11

ECONOMIC REVIEW
45
II.4.8 In the credit market, banks increased theirdeposit and lending rates in response to the increasein the policy rate by the Reserve Bank. During 2011-12 (April-August 11), 52 major banks with a creditshare of around 99 per cent raised their Base Ratesby 50-175 bps and 23 major banks accounting foraround 75 per cent of bank deposits raised theirdeposit rates in the range of 25-250 bps. The rise indeposit rates was relatively sharper for maturities upto 1 year for all categories of banks.
II.4.9 The Indian capital market witnessed somerevival in April 2011, aided by steady FII inflows andstrong global cues. However, relatively betterperformance of equity markets in AEs weighed onmarket sentiments. The persistence of sovereign debtproblems in the Euro Area and the delay in finalisinga higher public debt ceiling in the US on the globalfront, and lower than expected earnings by some ofthe major corporates on the domestic front, adverselyaffected the markets and the stock markets remainedsubdued since May 2011.
II.4.10 Since an excessive liquidity deficit candestabilise the financial markets and impede creditflow to the commercial sector, the Reserve Bank drewa distinction between its monetary stance and itsliquidity management and undertook liquidityenhancing measures to promote orderliness in thefinancial markets (Please see Table III.3.1 of ChapterIII for details of the measures taken by the ReserveBank.)
Divergent volume growth across market segments
II.4.11 As the financial market conditions normalisedpost global financial crisis, the various segments offinancial markets witnessed further recovery in tradingvolumes during 2010-11 (Chart II.36). Thecollateralised segment of the overnight money marketaccounted for around 85 per cent of the total volumeduring 2010-11. The CP market witnessed largeissuances in the immediate post-Base Rateenvironment and reached a peak in October 2010mainly on account of sharp increase in issuances by
leasing and finance as well as manufacturingcompanies. The issuances of CDs increased sharplyduring the second half of the year reflecting banks’efforts to mobilise more funds to meet the increasedcredit demand. The volumes in G-secs marketdeclined in a rising interest rate environment.
Reduced volatility in financial markets
II.4.12 The volatility1 in the Indian financial marketswas generally lower in 2010-11 than in the previousyear, barring a brief spell of heightened volatility duringMay 2010 (Chart II.37). The increased volatility duringMay 2010 could be attributed to the transition of theliquidity situation from surplus to deficit mode for themoney and G-sec markets and to the resurfacing ofsovereign debt concerns in the Euro Area for theequity and forex markets.
Equity markets remain range bound in absence ofimproved earnings visibility
II.4.13 Equity markets remained range-bound during2010-11 (Chart II.38). Much of the gains during Q2and Q3 of 2010-11 were offset by a correction duringQ4 of 2010-11. Equity markets, which werenegatively impacted by the sovereign debt crisis inthe Euro Area in May 2010, rallied during July-December 2010 on the back of large FII investments,better corporate performances and relatively strongeconomic growth. During Q4 of 2010-11, equitymarkets were weighed down by concerns overdomestic corporate profitability, weakeninginvestment climate and global uncertainty. In theprimary market, resource mobilisation through publicissues was higher than a year ago, reflecting mainlyfollow-on public offers (FPOs) and rights issues(Appendix Table 12). Although the number of IPOswas higher in 2010-11 than a year ago, the individualissue size was lower. Resources raised by mutualfunds in the equity market, however, turned negative,reflecting muted participation by retail participantsand corporates. However, the resources raised bymutual funds in the debt segment increased during2010-11 over the previous year, reflecting
1 Volatility has been measured by using Generalised Autoregressive Conditional Heteroskedasticity (GARCH) model.

ANNUAL REPORT
46
institutional investor preference in a rising interestrate environment.
Volumes rising in equity and currency derivatives
II.4.14 The presence and role of derivative segments- OTC and exchange traded - has been increasingsteadily over the years (Box II.8 and Chart II.39). Thevolumes of the derivatives segment of the equitymarket increased substantially during 2010-11 andtheir volumes were considerably higher than those of
the cash segment. The increased turnover in theequity derivatives during 2010-11 was associated withreduced volatility in the stock price indices.
II.4.15 In the currency futures segment, the volumesincreased sharply in September 2010, with thecommencement of operations by the United StockExchange (USE), which introduced currency futuresin four currency pairs (Appendix Table 13). The dailytrading volumes in currency futures exhibited agradual secular uptrend thereafter. The increased
Chart II.36 : Activities in Domestic Financial Markets
b: Fortnightly Issuance in CP Market
0
5
10
15
20
25
30
35
40
15-A
pr-
09
15-M
ay-0
9
14-J
un
-09
14-J
ul-
09
13-A
ug-0
912-S
ep-0
912-O
ct-
09
11-N
ov-0
911-D
ec-0
910-J
an
-10
9-F
eb-1
011-M
ar-
10
10-A
pr-
10
10-M
ay-1
09-J
un
-10
9-J
ul-
10
8-A
ug-1
07-S
ep-1
0
7-O
ct-
10
6-N
ov-1
06-D
ec-1
05-J
an
-11
4-F
eb-1
16-M
ar-
11
5-A
pr-
11
5-M
ay-1
14-J
un
-11
4-J
ul-
11
`Th
ou
san
dcro
re
c: Fortnightly Issuance in CD Market
0
10
20
30
40
50
60
70
80
90
`Th
ou
san
dcro
re
10-A
pr-
09
22-M
ay-0
9
3-J
ul-
09
14-A
ug-0
9
25-S
ep-0
9
6-N
ov-0
9
18-D
ec-0
9
29-J
an
-10
12-M
ar-
10
23-A
pr-
10
4-J
un
-10
16-J
ul-
10
27-A
ug-1
0
8-O
ct-
10
19-N
ov-1
0
31-D
ec-1
0
11-F
eb-1
1
25-M
ar-
11
6-M
ay-1
1
17-J
un
-11
e: Equity Market Turnover
(Monthly turnover in the Cash Segment at BSE and NSE)
0
100000
200000
300000
400000
500000
600000
700000
`cro
re
Apr-
09
Ju
l-09
Oct-
09
Jan
-10
Apr-
10
Ju
l-10
Oct-
10
Jan
-11
Apr-
11
Ju
l-11
f: Foreign Exchange Market Average Daily Turnover
0
10
20
30
40
50
60
70
80
Apr-
09
Ju
l-09
Oct-
09
Jan
-10
Apr-
10
Ju
l-10
Oct-
10
Jan
-11
Apr-
11
Ju
l-11
US
$billion
0.0
0.5
1.0
1.5
2.0
2.5
3.0
3.5
4.0
Merchant Inter-bank Inter-bank to merchant (RHS)
d: Average Daily Volume in Government Securities Market
0
2000
4000
6000
8000
10000
12000
14000
16000
18000
20000
Apr-
09
Ju
l-09
Oct-
09
Jan
-10
Apr-
10
Ju
l-10
Oct-
10
Jan
-11
Apr-
11
Ju
l-11
`cro
re
a:Average Daily Volume in Money Market
Call Money Market Repo CBLO
Apr-
09
Ju
l-09
Oct-
09
Jan
-10
Apr-
10
Ju
l-10
Oct-
10
Jan
-11
Apr-
11
Ju
l-11
0
20
40
60
80
100
120
`Th
ou
san
dcro
re

ECONOMIC REVIEW
47
volumes in the currency futures market are mainlyattributable to the cash settlement (which obviatesthe need for payment of the principal amount),the speculative interest in the backdrop ofnon-requirement of underlying exposure and theabsence of restrictions on cancellation andre-booking.
Housing prices remain firm and volumes decline
II.4.16 Housing prices continued to remain firmduring 2010-11, barring a brief phase of moderation
in the metros during Q3, despite the hardening ofmortgage rates in response to policy rate hikes asevidenced by the Reserve Bank’s Quarterly House
a: Movement in Stock Price Indices
REALTY IT Auto BANKEX SENSEX
Chart II. 38: Movement in Equity Markets
b: Stock Prices Index and Institutional Investment
FII Investment Mutual Fund Investment Average BSE Sensex (RHS)
-15000
-10000
-5000
0
5000
10000
15000
20000
25000
30000
35000
`C
rore
0
5000
10000
15000
20000
25000
Index
Index
1000
3000
5000
7000
9000
11000
13000
15000
17000
19000
21000
Apr-
09
Ju
l-09
Oct-
09
Jan
-10
Apr-
10
Ju
l-10
Oct-
10
Jan
-11
Apr-
11
Ju
l-11
Apr-
09
Ju
l-09
Oct-
09
Jan
-10
Apr-
10
Ju
l-10
Oct-
10
Jan
-11
Apr-
11
Ju
l-11
Chart II.37: Volatility in the Indian Financial Markets
a: Money Market
0
5
10
15
20
25
Call Rate CBLO Rate
2-A
pr-
09
17-M
ay-0
9
1-J
ul-
09
15-A
ug-0
9
29-S
ep-0
9
13-N
ov-0
9
28-D
ec-0
9
11-F
eb-1
0
28-M
ar-
10
12-M
ay-1
0
26-J
un
-10
10-A
ug-1
0
24-S
ep-1
0
8-N
ov-1
0
23-D
ec-1
0
6-F
eb-1
1
23-M
ar-
11
7-M
ay-1
1
21-J
un
-11
5-A
ug-1
1
2-A
pr-
09
17-M
ay-0
9
1-J
ul-
09
15-A
ug-0
9
29-S
ep-0
9
13-N
ov-0
9
28-D
ec-0
9
11-F
eb-1
0
28-M
ar-
10
12-M
ay-1
0
26-J
un
-10
10-A
ug-1
0
24-S
ep-1
0
8-N
ov-1
0
23-D
ec-1
0
6-F
eb-1
1
23-M
ar-
11
7-M
ay-1
1
21-J
un
-11
5-A
ug-1
1
b: G-sec Market
-0.20.00.20.40.60.81.01.21.41.61.82.02.22.4
10 year G-sec Rate
c: Stock Market
0
5
10
15
20
25
30
35
40
45
Nifty
1-A
pr-
09
16-M
ay-0
9
30-J
un
-09
14-A
ug-0
9
28-S
ep-0
9
12-N
ov-0
9
27-D
ec-0
9
10-F
eb-1
0
27-M
ar-
10
11-M
ay-1
0
25-J
un
-10
9-A
ug-1
0
23-S
ep-1
0
7-N
ov-1
0
22-D
ec-1
0
5-F
eb-1
1
22-M
ar-
11
6-M
ay-1
1
20-J
un
-11
4-A
ug-1
1
d: Forex Market
0.00
0.50
1.00
1.50
2.00
2.50
USD-INR Exchange Rate
2-A
pr-
09
17-M
ay-0
9
1-J
ul-
09
15-A
ug-0
9
29-S
ep-0
9
13-N
ov-0
9
28-D
ec-0
9
11-F
eb-1
0
28-M
ar-
10
12-M
ay-1
0
26-J
un
-10
10-A
ug-1
0
24-S
ep-1
0
8-N
ov-1
0
23-D
ec-1
0
6-F
eb-1
1
23-M
ar-
11
7-M
ay-1
1
21-J
un
-11
5-A
ug-1
1
ANNUAL REPORT
48
Box II.8Financial Derivatives in India - Current Status
Derivatives instruments in India are regulated by theReserve Bank of India, Securities and Exchange Board ofIndia (SEBI) and Forward Markets Commission (FMC). TheReserve Bank of India Act, 1934 (as amended in 2006)empowers the Reserve Bank to regulate OTC derivativeproducts as long as at least one of the parties in thetransaction is regulated by it; exchange-traded derivativesare governed by the rules of the respective exchanges andoverseen by the SEBI. Financial institutions in India canuse OTC derivatives for their own balance sheetmanagement while non-financial firms are only permittedto hedge their exposures.
OTC derivatives
Over the years, the Reserve Bank introduced various plainvanilla interest rate and foreign currency derivatives. Certainproducts like swaps having explicit/implicit option featuressuch as caps/ floors/ collars are not permitted. The ReserveBank has, however, permitted the use of cross currencyswaps, caps and collars and FRAs for specific purposes.The Reserve Bank has issued guidelines on credit defaultswaps and securitisation to develop the credit derivativemarket.
The Reserve Bank issued the guidelines on forward rateagreements (FRAs) and Interest Rate Swaps (IRS) in 1999to enable banks, primary dealers and all-India financialinstitutions to use these products for their own balance sheetmanagement and corporates to hedge interest rate risks.Overnight index swaps (OIS) based on overnight MumbaiInterbank Offered Rate (MIBOR) benchmark registeredsignificant growth over the years, although otherbenchmarks beyond the overnight have not become popularpossibly due to the absence of a vibrant inter-bank termmoney market. Foreign banks dominate the IRS market. Itis mandatory for entities regulated by the Reserve Bank toreport their IRS/FRA trades on the reporting platformdeveloped by the Clearing Corporation of India (CCIL). CCILhas been providing non-guaranteed settlement of FRA/IRStrades since November 2008. Guaranteed settlement in IRS/FRA segment is expected to be started soon by CCIL. CCILhas also started providing portfolio compression exercisein the OTC interest rate swaps aimed at reducing the overallnotional outstandings and the number of outstandingcontracts.
Within the OTC foreign currency derivatives market, theswap segment is the most active. Rupee-foreign exchangeoptions allowed in July 2003 is gradually picking up.
Exchange Traded Derivatives
The experience of exchange traded derivatives in India hasbeen mixed. Equity derivatives like Index futures wereintroduced in June 2000, followed by index options in June2001, and options and futures on individual securities inJuly 2001 and November 2001, respectively. Equityderivatives have grown rapidly since their inception. Thesederivative contracts are settled by cash payment and donot involve physical delivery of the underlying product. FIIshave an increasing presence in the equity derivativesmarkets and currently contribute around 21 per cent of themarket turnover.
Currency futures witnessed substantial increase in volumessince it was launched in NSE in August 2008 on Rupee-USD pair. Following the guidelines issued by the ReserveBank and the SEBI in January 2010, the NSE and MCXsubsequently launched futures trading in three new currencypairs, namely, EUR-INR, GBP-INR and JPY-INR in February2010. Currency options - introduced in the Indian stockexchanges in October 2010 - saw a significant increase involume and open interest.
Trading in Interest Rate Futures (IRF) was re-activated inAugust 2009 on a 7 per cent notional coupon bearing 10-year Government of India security settled through physicaldelivery. IRF Trading on 91-day Treasury bills issued bythe Government of India has been permitted by the ReserveBank in March 2011 with cash settlement. The May 2011Annual Policy Statement has proposed the introduction ofIRFs for 2- and 5-year tenors also.
As compared to the exchange traded equity and currencyderivatives segments, the IRF segment remainsdormant in India despite the fact that globally it occupies70 per cent of the overall derivatives turnover in the stockexchanges.
Exchange-traded commodity derivatives have been tradingin the commodities exchanges since 2000. Currently, the22 commodities exchanges operating in the country mostlytrade in futures.
Price Index (HPI)2 (Chart II.40 a and b). The volumeof transactions, however, exhibited a declining trendduring the second and third quarters of 2010-11 butrevived during the Q4 in most cities. On a y-o-y basis,out of the seven cities, while housing prices
increased in six cities, transactions volumes fell infive cities. Housing prices and transaction volumesin Mumbai and Delhi continued to increase on ay-o-y basis. Quarterly credit deployment in thehousing sector continued to increase during 2010-
2 The Reserve Bank’s housing price and volume indices are based on data in respect of seven cities collected from the Department of Registrationand Stamps (DRS) of the respective State Governments.

ECONOMIC REVIEW
49
11, notwithstanding increase in interest rates andmacro prudential policy measures such as increasein provisioning requirement for housing loans withteaser interest rates, increase in risk weights for highvalue housing credit and the stipulation of a highermargin.
Real exchange rate appreciates reflecting inflationdifferential
II.4.17 During 2010-11, while several Asian countriesresorted to capital control, India hardly intervenedthrough purchase/sale of foreign currency or activecapital account management. The rupee dollarexchange rate showed two-way movement in therange of ̀ 44.03-47.58 per US dollar (Chart II.41). Therupee appreciated by 4.0 per cent on an average basisagainst the U.S. dollar during the year. Most ofthis appreciation occurred during Q2, on theback of strong equity inflows. On an average basis,
the 6-currency real effective exchange rate(REER) appreciated by 13.1 per cent in 2010-11, the30-currency REER by 4.5 per cent and the 36-currency REER by 7.7 per cent. The 6-currencyindex showed the maximum appreciation comparedto other indices reflecting higher inflation differentialwith these countries (Appendix Table 14).
Financial system remains bank dominated
II.4.18 The Indian financial system is primarily a bank-dominated system. The dominance of banks hasincreased further during the post-crisis period, whichessentially reflected an increasing preference for saferavenues of savings (Box II.9).
Financial markets may imperfectly track bankingindicators
II.4.19 The banking system is usually closelyintegrated with the financial market developments
Chart II.40 : Movement in Housing Prices and Transactions
a: Trends in Housing Price Index (2008-09:Q4=100)
75
100
125
150
175
Q1:09-10
Q2:09-10
Q3:09-10
Q4:09-10
Q1:10-11
Q2:10-11
Q3:10-11
Q4:10-11
Index
25
75
125
175
275
Q1:09-10
Q2:09-10
Q3:09-10
Q4:09-10
Q1:10-11
Q2:10-11
Q3:10-11
Q4:10-11
Index
*:Chennai index includes both residential and commercial properties. *:Chennai index includes both residential and commercial properties.
Delhi Mumbai Kolkata Chennai*
Bengaluru Ahmedabad Lucknow All India
Delhi Mumbai Kolkata Chennai*
Bengaluru Ahmedabad Lucknow All India
b: Trends in Housing Transactions Volume Index(2008-09:Q4=100)
Chart II.39 : Activity in Financial Derivatives Market
b: Monthly Turnover in Equity Derivatives
0
500
1,000
1,500
2,000
2,500
3,000
3,500
Apr-
09
Ju
l-09
Oct-
09
Jan
-10
Apr-
10
Ju
l-10
Oct-
10
Jan
-11
Apr-
11
Ju
l-11
`Th
ou
san
dcro
re
Index Futures Index Options Stock Futures Stock Options
0
1,000
2,000
3,000
4,000
5,000
6,000
7,000
8,000
`Th
ou
san
dcro
re
0
10
20
30
40
50
60
70
80
90
100
`Th
ou
san
dcro
re
Open Interest Value (RHS)
a: Currency Futures (Total of NSE, USE and MCX-SXfor all Currencies)
2-A
pr-
09
17-M
ay-0
9
1-J
ul-
09
15-A
ug-0
9
29-S
ep-0
9
13-N
ov-0
9
28-D
ec-0
9
11-F
eb-1
0
28-M
ar-
10
12-M
ay-1
0
26-J
un
-10
10-A
ug-1
0
24-S
ep-1
0
8-N
ov-1
0
23-D
ec-1
0
6-F
eb-1
1
23-M
ar-
11
7-M
ay-1
1
21-J
un
-11
5-A
ug-1
1
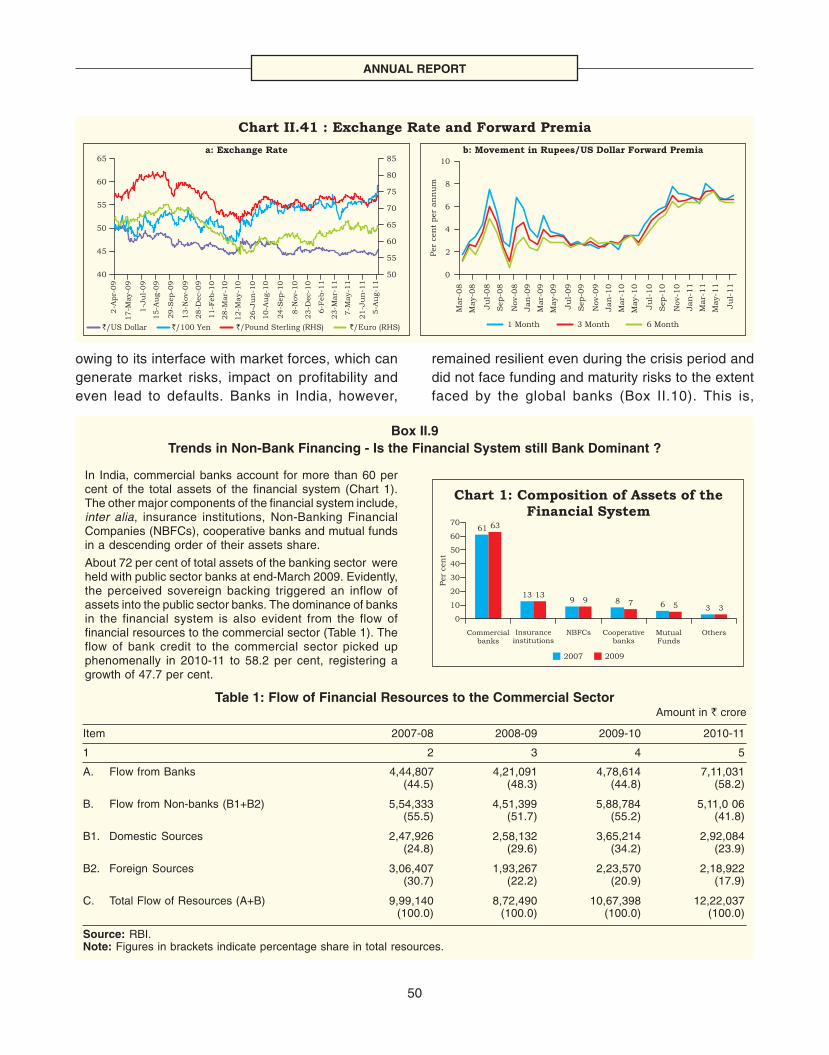
ANNUAL REPORT
50
Chart II.41 : Exchange Rate and Forward Premia
40
45
50
55
60
65
2-A
pr-
09
17-M
ay-0
9
1-J
ul-
09
15-A
ug-0
9
29-S
ep-0
9
13-N
ov-0
9
28-D
ec-0
9
11-F
eb-1
0
28-M
ar-
10
12-M
ay-1
0
26-J
un
-10
10-A
ug-1
0
24-S
ep-1
0
8-N
ov-1
0
23-D
ec-1
0
6-F
eb-1
1
23-M
ar-
11
7-M
ay-1
1
21-J
un
-11
5-A
ug-1
1
50
55
60
65
70
75
80
85b: Movement in Rupees/US Dollar Forward Premiaa: Exchange Rate
0
2
4
6
8
10
Mar-
08
May-0
8
Ju
l-08
Sep-0
8
Nov-0
8
Jan
-09
Mar-
09
May-0
9
Ju
l-09
Sep-0
9
Nov-0
9
Jan
-10
Mar-
10
May-1
0
Ju
l-10
Sep-1
0
Nov-1
0
Jan
-11
Mar-
11
May-1
1
Ju
l-11
Per
cen
tper
an
nu
m
1 Month 3 Month 6 Month`/US Dollar `/100 Yen `/Pound Sterling (RHS) `/Euro (RHS)
owing to its interface with market forces, which cangenerate market risks, impact on profitability andeven lead to defaults. Banks in India, however,
remained resilient even during the crisis period anddid not face funding and maturity risks to the extentfaced by the global banks (Box II.10). This is,
Box II.9Trends in Non-Bank Financing - Is the Financial System still Bank Dominant ?
In India, commercial banks account for more than 60 percent of the total assets of the financial system (Chart 1).The other major components of the financial system include,inter alia, insurance institutions, Non-Banking FinancialCompanies (NBFCs), cooperative banks and mutual fundsin a descending order of their assets share.
About 72 per cent of total assets of the banking sector wereheld with public sector banks at end-March 2009. Evidently,the perceived sovereign backing triggered an inflow ofassets into the public sector banks. The dominance of banksin the financial system is also evident from the flow offinancial resources to the commercial sector (Table 1). Theflow of bank credit to the commercial sector picked upphenomenally in 2010-11 to 58.2 per cent, registering agrowth of 47.7 per cent.
Chart 1: Composition of Assets of theFinancial System
2007 2009
Commercialbanks
Insuranceinstitutions
NBFCs Cooperativebanks
MutualFunds
Others
0
10
20
30
40
50
60
7061
139 8 6 3
63
139 7 5 3
Per
cen
t
Table 1: Flow of Financial Resources to the Commercial SectorAmount in ` crore
Item 2007-08 2008-09 2009-10 2010-11
1 2 3 4 5
A. Flow from Banks 4,44,807 4,21,091 4,78,614 7,11,031(44.5) (48.3) (44.8) (58.2)
B. Flow from Non-banks (B1+B2) 5,54,333 4,51,399 5,88,784 5,11,0 06(55.5) (51.7) (55.2) (41.8)
B1. Domestic Sources 2,47,926 2,58,132 3,65,214 2,92,084(24.8) (29.6) (34.2) (23.9)
B2. Foreign Sources 3,06,407 1,93,267 2,23,570 2,18,922(30.7) (22.2) (20.9) (17.9)
C. Total Flow of Resources (A+B) 9,99,140 8,72,490 10,67,398 12,22,037(100.0) (100.0) (100.0) (100.0)
Source: RBI.Note: Figures in brackets indicate percentage share in total resources.

ECONOMIC REVIEW
51
however, not borne out from the CDS spreadsand the stock prices of the banks in India whichlargely paralleled the global trends, reflectingincreasing integration with the global financialmarkets.
Box II.10Impact of Financial Market Developments on Financial Soundness Indicators of the Banking System
While the Indian banking sector has significantly grown insize in the recent years, its soundness has largely beenmaintained even during financial crises. The impact ofsub-prime crisis on banks was almost negligible due to limitedexposure to toxic assets owing to the counter-cyclicalprudential norms prescribed by the Reserve Bank.
The impact of financial market developments on banks isreflected by the trends in their various soundnessindicators, namely, Return on Asset (RoA), Capital to RiskWeighted Assets Ratio (CRAR) and Non-Performing Assets(NPAs). Some of these major soundness indicators of thebanking system showed significant resilience evenduring the times of the crisis (Table 1). The Returns on
Table 1: Size and Soundness of the Indian Banking Sector(in per cent)
Year Banking RoA Return on Return on Gross CRARassets to GDP Investments Advances NPAs
1 2 3 4 5 6 7
2004-05 72.4 1.01 7.9 8.1 5.2 12.82005-06 75.6 1.01 7.7 8.2 3.3 12.32006-07 80.6 1.05 7.2 8.9 2.5 12.32007-08 86.8 1.12 7.3 8.9 2.3 13.02008-09 93.8 1.13 7.0 9.9 2.3 13.22009-10 92.0 1.05 6.6 9.3 2.4 13.6Average 83.5 1.10 7.3 9.2 3.0 12.8Standard Deviation 8.7 0.05 0.46 0.95 1.14 0.51
Source: Reports on Trend and Progress of Banking in India, various issues.Statistical Tables Relating to Banks in India, various issues.
Advances and Investments moved in opposite directionsduring phases of rising and falling interest rates. As a result,banks could earn a stable RoA in a volatile marketenvironment by making appropriate adjustments to theirportfolios, while ensuring sound asset quality and high levelsof CRAR.
The stable performance and sound health of the Indianbanking system, however, does not preclude importantinitiatives that need to be taken in order to further increaseoperational efficiency of banks. There is also a need tostrengthen the countercyclical prudential regulatoryframework and step up capital adequacy to meet unforeseenrisks emanating from developments in the financial markets.
Financing of infrastructure poses challenge ahead
II.4.20 The development of the financial markets andhealthy balance sheets of the financial sector entitiesare prerequisites for financial intermediation with a viewto bridging enormous infrastructure deficit (Box II.11).
Box II.11Infrastructure Financing
Infrastructure deficit remains a major stumbling block in thegrowth process of the Indian economy. It is widely recognisedthat poor and inadequate infrastructure is adding toproduction costs, affecting productivity of capital and erodingcompetitiveness of productive sectors of the economy(Subbarao, 2009). The Planning Commission has projectedthe investment requirement for the infrastructure sector forthe Twelfth Five Year Plan (2012-2017) to be of the order of`40,99,240 crore (about US$ 1,025 billion), which cannotbe met by the public sector alone due to fiscal constraints.
Gross Capital Formation (GCF) in infrastructure has hoveredaround 5 per cent of GDP and is likely to fall short of the 11th
Five Year Plan’s (2007-2012) target of raising it to 9 per centof GDP by 2012, which is also the level attained in some ofthe Asian economies. In India, there has been a significantincrease in the share of bank credit to infrastructure from2.2 per cent of gross bank credit as at end-March 2001 toaround 13.4 per cent as at end-March 2011. Credit extendedby commercial banks is, however, constrained by the risk ofasset-liability mismatch.
Globally, the corporate bond market plays a significant rolein financing infrastructure development. In India, thecorporate bond market is underdeveloped and the stock oflisted non-public sector debt at 2 per cent of GDP is
(Contd...)

ANNUAL REPORT
52
significantly lower as compared with that of other EMEs, suchas, Malaysia, Korea, and China. In order to develop thecorporate bond market, some of the measures which needconsideration include exemption from withholding tax for FIIs,rationalisation of stamp duties across states, tax treatmentof pass through certificates, reconciliation of definitionaldifferences in respect of bonds and debentures,enhancement of scope of investment by insurancecompanies and provident /pension /gratuity funds, permissionto FIIs to invest in to-be-listed bonds, repo lending byinsurance companies and mutual funds, single unifieddatabase to ensure reporting by all entities and partial creditenhancement by banks.
Securitisation of infrastructure bonds/loans is an importantway of increasing the quantum of debt financing ofinfrastructure projects by banks/FIs/NBFCs. Theinfrastructure sector has a high potential for bundling ofsecurities of infrastructure bonds/loans and selling them toinstitutional and retail investors based on their perceivedrisks. Credit derivatives and credit insurance are alsoexpected to provide efficient risk transfer mechanisms and,thus, play a significant role in the corporate bond marketdevelopment. In this context, the Reserve Bank has comeout with credit default swap (CDS) guidelines, which will comeinto effect from October 24, 2011. CDS would allow corporateentities including insurers, FIIs and mutual funds (MFs) tohedge the risk of default in repayment of corporate bonds.Private equity and venture capital funds may have to beencouraged to accept higher levels of risk in return for higherexpected returns. Take out financing, which is anotherimportant and innovative way of enhancing the quantum ofbanks’/NBFCs’ financing of infrastructure projects and whichalso facilitates better asset-liability management, has nottaken off despite efforts by the Reserve Bank and thegovernment and needs to be pushed further.
Foreign sources are supplementing the domestic finance infinancing infrastructure in recent years. The share of FDI in
infrastructure sector as a percentage of total FDI hasincreased significantly from around 4 per cent in 2002-03 toaround 16.7 per cent in 2010-11.
Public-Private Partnership (PPP) has been an importantmode of financing infrastructure worldwide. PPPs havereceived a somewhat lukewarm response in India except inthe case of telecom, airport and roadways, despite theirpotential to attract private investments. A number of factors,which need to be addressed expeditiously in order to bringdown the time and cost overruns in a significant way, areresponsible for this, e.g., deficiencies in the project appraisalskills, problems in developing an optimal risk sharingmechanism, lack of transparency in bidding procedures,overlapping regulatory jurisdictions and governance relatedconcerns. PPP projects that are economically essential butcommercially unviable are provided financial assistance inthe form of Viability Gap Funding (VGF) and long tenor loansthrough IIFCL (UK), a subsidiary of the India InfrastructureFinance Company Ltd. (IIFCL). The Reserve Bank hassignificantly relaxed prudential norms for infrastructureprojects and has initiated a number of regulatory concessionsfor infrastructure finance. Additionally, SEBI has raised theFII limit for investment in corporate bonds, with residualmaturity of over five years issued by companies ininfrastructure sector, to US$ 25 billion.
References
Deepak Parekh Committee Report (2007), The Report ofthe Committee on Infrastructure Financing, PlanningCommission, New Delhi.
Economic Survey, 2010-11.
R H Patil Committee (2005), High Level Expert Committeeon Corporate Bonds and Securitisation, Ministry of Finance,Government of India, New Delhi.
Subbarao, Duvvuri (2009), ‘Should Banking Be Made Boring?- An Indian Perspective’, RBI Bulletin, December.
V. GOVERNMENT FINANCES
Lower combined fiscal deficit reflects improvement inCentral and State finances, but its sustainabilityrequires further reforms
II.5.1 The combined finances of the Central andState governments showed distinct improvement interms of the key deficit indicators during 2010-11 (RE)as compared with 2009-10. The combined gross fiscaldeficit (GFD) of Central and State governments as aratio of GDP declined markedly to 7.7 per cent in2010-11 from 9.3 per cent in 2009-10 (Appendix Table15). The combined revenue deficit (RD) also fellperceptibly. The lower fiscal deficit ratios are the
outcome of both Centre and States returning to thepath of fiscal consolidation. However, these ratios arestill well above 2007-08 levels.
II.5.2 The budgets of the Central and Stategovernments envisage further fiscal consolidationduring 2011-12 driven by expected moderation inexpenditure growth. The combined GFD and RD asratios to GDP are budgeted to decline further in 2011-12. However, in order to meet these targets, concertedefforts would be necessary to avoid fiscal slippagesin 2011-12, especially arising from higher expenditureon subsidies if global commodity and fuel pricescontinue at an elevated level.
(...Concld.)

ECONOMIC REVIEW
53
II.5.3 The sustainability of lower deficits during2011-12, however, requires substantial new measuresin the arena of fiscal reforms, as the 2010-11improvement was led by the benefit of cyclicalupswing and one-off gains in revenue. For asustainable improvement in fiscal position, furtherexpenditure compression as well as revenue raisingmeasures would be necessary.
Centre’s lower deficit ratios reflect one-offunanticipated revenue and higher nominal GDPgrowth
II.5.4 Central government finances haddeteriorated significantly during 2008-09 and 2009-10 on account of expansionary fiscal policy stanceadopted by the government to address growthconcerns as a fallout of global financial crisis.However, with economic recovery during 2010-11, thegovernment reverted to the path of fiscal consolidationwith a partial exit from stimulus measures. Benefitingfrom more than anticipated realisation of non-taxrevenue receipts and GDP, the Centre’s key deficit/GDP ratios turned out to be lower in revised estimatesthan were originally budgeted (Chart II.42 a and b).The revised estimates (RE) for 2010-11 show thatthe Central government receipts were better thanbudgeted, reflecting buoyancy in domestic economicactivity and the increase in indirect tax rates followingpartial fiscal exit. Total expenditure, however,exceeded the budgeted level. This was on accountof government’s decision to utilise higher thananticipated receipts from 3G/BWA auctions for
financing increased outlays in key priority areas (ruralinfrastructure, implementation of Right to EducationAct, plan assistance to States and recapitalisation ofpublic sector banks). Nonetheless, benefiting fromthe better than anticipated GDP outcome, aggregateexpenditure-GDP ratio lay within the budget estimatesfor 2010-11.
II.5.5 Provisional data from the Controller Generalof Accounts (CGA) confirm the expected improvementin fiscal position of the Central government in 2010-11. The estimates of key deficit indicators, turned outto be lower in the provisional accounts than the revisedestimates on account of higher than anticipatedrevenue receipts and reduction in plan expenditure.Lower fiscal imbalances enabled reduction ingovernment’s debt-GDP ratio during 2010-11, therebycontaining risks to macroeconomic stability.
II.5.6 However, the fiscal correction is far from over.Enduring correction through expenditure compressionand better returns on public investments has to bethe cornerstone of an effective fiscal strategy. Thereare clear limits to one–off revenue generationmeasures over the medium to long run.
II.5.7 Expenditure growth remained higher thanbudgeted for 2010-11, thereby maintaining pressureson aggregate demand. The revised estimates of totalexpenditure on subsidies (mainly on food, fertiliserand petroleum) remained higher than the budgetestimates reflecting the impact of higher internationalprices of these commodities. Capital expenditure,
Chart II.42 : Key Deficit Indicators
b: Impact of Excess Non-tax Receipts and Higher GDP onRevenue Deficit
Revenue DeficitRevenue Deficit (Without excess sprectrum receipts)Revenue Deficit (With old GDP)Revenue Deficit (With old GDP and without excess spectrum receipts)
0.0
1.0
2.0
3.0
4.0
5.0
6.0
Per
cen
tofG
DP
2004-05
2005-06
2006-07
2007-08
2008-09
2009-10
2010-11 (RE)
a: Central Government
-2.0
-1.0
0.0
1.0
2.0
3.0
4.0
5.0
6.0
7.0
Per
cen
tofG
DP
Revenue Deficit Gross Fiscal Deficit Primary Deficit
Rollingtargets
2004-0
5
2005-0
6
2006-0
7
2007-0
8
2008-0
9
2009-1
0
2010-1
1(R
E)
2011-1
2(B
E)
2012-1
3
2013-1
4

ANNUAL REPORT
54
both plan and non-plan, remained higher than thebudgeted levels in 2010-11. On the whole,expenditure growth not only turned out to be higherthan that was budgeted for 2010-11 but alsoaccelerated as compared with that of 2009-10.
State governments resume fiscal consolidation
II.5.8 State governments also resumed the processof fiscal consolidation in 2010-11, after suffering asetback in 2008-09 and 2009-10 (Appendix Table 16).The revised estimates for 2010-11, based on thebudgets of 28 States, indicate a reduction in key deficitratios. This shows State governments’ commitmenttowards fiscal consolidation. Going forward, the Statesare likely to carry forward the process of fiscalconsolidation in 2011-12 as the revenue account isexpected to turn into surplus after remaining in deficitduring 2009-10 and 2010-11, while the GFD-GDPratio is expected to decline further.
II.5.9 A disaggregated analysis shows that thebudgeted improvement in revenue account of Statesin 2011-12 is mainly on account of decline in revenueexpenditure while revenue receipts-GDP ratio isexpected to be marginally higher. However, themoderation in revenue expenditure growth isattributable to a sharp decline in developmentexpenditure growth (comprising social and economicservices). In line with the improvement in revenueaccount, States’ GFD-GDP ratio is budgeted to belower in 2011-12 (BE). Capital outlay as a ratio toGDP at 2.2 per cent in 2011-12 (BE), however, is yetto revert to the high levels achieved during 2006-07to 2008-09. Overall, the States seem to be committedto bringing their finances on a sustainable path in themedium-term and the present pace appears to be intandem with the path suggested by the ThirteenthFinance Commission.
Further fiscal consolidation necessary for macro-stability
II.5.10 The improvement in government finances till2007-08 under rule-based fiscal consolidation hadprovided cushion to the Centre and States forundertaking fiscal expansion during 2008-09 and
2009-10 to address the growth slowdown.Notwithstanding an improvement in fiscal position in2010-11, the fiscal deficit indicators are yet to reachthe pre-crisis levels. Lowering of these indicators arenecessary for lower inflation and macroeconomicstability. Going forward, it is imperative for thegovernment to strengthen the process of fiscalconsolidation. Accordingly, more drastic expenditurereforms alongwith the envisaged tax reforms – DirectTaxes Code (DTC) and Goods and Services Tax(GST) – have to be pursued. Expenditure reformshave to be directed towards restraining built-in growthin expenditure and also to bring about structuralchanges in its composition (Box II.12).
Expenditure driven fiscal consolidation strategy of theCentre may be challenging
II.5.11 The fiscal consolidation strategy of the Centralgovernment for 2011-12 is primarily expendituredriven, reflecting the impact of lower growth inexpenditure on salary, pensions and subsidies. Inparticular, all subsidies except interest subsidy arebudgeted to decline in 2011-12 (Chart II.43). There isan urgent need to implement reforms in the systemof subsidies. Concomitantly, a conservative stanceon revenue projections has been adopted. Althoughthe Union Budget 2011-12 has opted not to further
Chart II.43: Subsidies of Central Government
Food Fertiliser Petroleum Interest subsidy Others
0
0.5
1
1.5
2
2.5
2009-10 2010-11 RE 2011-12 BE
Per
cen
tofG
DP
0.90.8
0.7
0.9
0.7
0.6
0.2
0.5
0.3
0.1
0.1
0.10.1
0.1

ECONOMIC REVIEW
55
Box II.12Revenue and Expenditure Reforms – Improving the Fiscal Environment
for Robust and Inclusive Growth
Improving growth, making it inclusive and keeping fiscal deficitslow and sustainable are all desirable objectives of economicpolicies. Yet, they are often thought as irreconcilable. Thesemultiple objectives, however, can best be achieved by adoptingsustainable fiscal policies. Growth and equity objectives bothcan be served by keeping the balance between revenues andexpenditures of the government at sustainable levels, whichnecessitate both revenue and expenditure reforms.
Revenue reforms in India have been pursued for sometimenow. Multiplicity of rates have been brought down, tax rateslowered and tax base widened. The standard rates of servicesand excise taxes have now converged to a single rate of 10per cent. Peak customs duty has been reduced from over 300per cent in the late 1980s to 10 per cent as a part of committedstance of converging over the medium term to tariff prevailingin ASEAN countries. Major accomplishments include theintroduction of services tax in 1994 and Value Added Tax (VAT)by the States during 2004-08.
The present State level VAT structure still has some elementof cascading effect. However, with introduction of GST,cascading effects of CENVAT and services tax are likely to beremoved with a continuous chain of set-offs. While benefitingtaxpayers, GST is also expected to be a plus sum game forthe Governments. Thirteenth Finance Commission (2009)estimated that GST could provide gains to India’s GDPsomewhere within a range of 0.9 to 1.7 per cent. Revenuegains are also likely to be large coming from additional GDPas well as improved tax compliance. Upscaling of inclusivegrowth programmes would then be possible through budgetaryresources.
Direct Taxes Code (DTC) would contribute to enhance GDPgrowth, raise tax-GDP ratio and improve allocative efficiencyand equity (both horizontal and vertical) of the direct taxes,bringing about reduction in administrative and compliance costs(GOI, 2009). DTC would lead to repeal of the current Income-Tax and Wealth Tax Acts with the objectives of minimisingexemptions, widening tax base, moderating tax rates andeffective enforcement. The Code also proposes to do awaywith profit linked deductions and introduce investment linkeddeductions for priority areas.
Both these important pillars of tax reforms have been deferredfor want of political consensus and ironing out the operationaldetails. The federal structure of our fiscal system entails taxreforms to be more challenging which require a pragmaticapproach by all stakeholders. However, GST and DTC needto be rolled out without any further delay. Both, States andCentre gain from these tax reforms. In addition to tax reforms,other revenue enhancing measures would be needed.Improved returns on public investment can help. Bettergovernance of public utilities, especially at sub-national levelcan go a long way in correcting the fiscal imbalances.Appropriate user charges alongwith plugging of leakages areneeded. The financial positions of State Power Sector utilitiesrequire focused attention.
Revenue reforms alone may not suffice in keeping fiscalposition on a sustainable path. Expenditure cutting holds thekey to fiscal consolidation in India. While modes and speed of
fiscal consolidation have differed across countries, expenditurereforms have formed important component. Barrios, et al.(2010) find that public expenditure-cuts-based consolidationstend to be more effective. They send convincing signalsregarding the political will of the fiscal retrenchment as well asensure its medium-run viability. Expenditure reforms in manycountries have achieved large fiscal adjustments by reducingspending on transfers, subsidies and public consumption whileensuring that allocations for education and health remainadequate (Hauptmeier et al 2007).
Expenditure reforms in India have been directed towardsrestraining built-in growth in expenditure and also bring aboutstructural changes in its composition. In this regard, variousmeasures over the years were intended to rationalisemanpower requirements and assessing the feasibility of on-going schemes. In order to overcome perpetual committedexpenditure, the New Pension System has been introduced.The process also involved review of the existing subsidysystems. For instance, the government is gradually movingtowards nutrient based subsidy (NBS) regime in fertiliser sector.The government has proposed to move towards direct transferof cash subsidy to people living below poverty line in a phasedmanner in order to ensure greater efficiency, cost effectivenessand better delivery for kerosene and fertiliser. With the objectiveof rationalising petroleum subsidy, government hasdecontrolled the pricing of petrol in June 2010. However, thesemeasures are not sufficient as oil, fertiliser and food subsidiesare still large. Total subsidies constituted 2.1 per cent of GDPin 2010-11, which was much higher than 1.3 per cent of GDPin 2006-07. As such, expenditure reforms need to be pushedmore aggressively. Deregulation of diesel and other fuel pricesassumes importance in this context.
Revenue and expenditure reforms need to be speeded up toprovide fiscal space for achieving the objective of inclusivegrowth. The government’s strategy for inclusive growth is toempower people through legal entitlements in respect ofemployment, food security, education and information. Fulfillingthese commitments would require substantial outlays therebynecessitating a stable, efficient and broad-based tax systemwhich is conducive to overall business environment.
References:
Barrios, S., S Langedijk, and L R Pench (2010), “EU FiscalConsolidation after the Financial Crisis: Lessons from PastExperiences”, European Economy Economic Paper No.418,Directorate General for Economic and Financial Affairs,Brussels.
Empowered Committee of State Finance Ministers (2009): FirstDiscussion Paper on Goods and Services Tax in India, NewDelhi, November.
GOI (2009), Direct Taxes Code, Discussion Paper, Ministry ofFinance, August.
Hauptmeier, Sebastian, Martin Heipertz and LudgerSchuknecht (2007), “Expenditure Reform in IndustrialisedCountries: A Case Study Approach”, Working Paper SeriesNo 634, European Central Bank, May.

ANNUAL REPORT
56
raise the indirect taxes to the levels prevailing beforethe crisis and retained the standard rates of centralexcise duty and service tax at 10 per cent, the Centralgovernment announced tax rationalisation measureswhich would have differential impact on relative pricesacross sectors.
II.5.12 The moderation in non-plan revenueexpenditure growth is welcome as it creates fiscalspace for undertaking other expenditures. However,capital expenditure, which is budgeted to becompressed during 2011-12, raises concernsregarding the quality of fiscal consolidation.
II.5.13 The government recognises that fiscalcorrection for 2010-11 reflected the one-off windfallbenefits of higher than anticipated revenue proceedsfrom spectrum auctions, which is unlikely in 2011-12.The Union Budget for 2011-12 does not take intoaccount any such one-off sources of revenues andremains conservative on tax buoyancy.
II.5.14 Going forward, credible fiscal consolidationstrategy will contribute to keeping the debt-GDP ratioat a sustainable level. In this regard, the reduction inCentre’s debt-GDP ratio to below 50 per cent in 2010-11 is a positive development. In terms of the revisedmethodology for compilation of debt, which excludesliabilities not used for financing of GFD and calculatesexternal debt at current exchange rates, the Centre’sdebt-GDP ratio is budgeted to decline to 44.2 per centduring 2011-12.
Likely expenditure pressures on subsidies posechallenge for fiscal consolidation in 2011-12
II.5.15 In spite of the Central government’scommitment towards fiscal consolidation, theprogress towards this end hinges upon a few factors.First, the reduction in expenditure growth for 2011-12 is on account of lower subsidy expenditure, whichis based on the underlying assumption of no majorvariation in international fertiliser and petroleum pricesduring 2011-12. However, the subsequentdevelopments indicated an uptrend in internationalprices of crude oil which could have significantimplications for subsidy expenditure. Even though
domestic prices of diesel, PDS kerosene and LPGhave been partially revised on June 24, 2011, theprojected level of petroleum subsidy is likely to remainhigher than the budgeted level for 2011-12. Theelimination/ reduction of customs/ excise duty onpetrol products would also cause revenue loss andimpact the fiscal balance. Second, in view of severaldomestic and international downside risks toeconomic growth, moderation in tax revenuecollections cannot be ruled out. A slowdown, however,may also result in decline in oil prices, which mayhelp in containing subsidy expenditure.
Pace and nature of fiscal consolidation remains aconcern over the medium term
II.5.16 Over the medium-term, the Centralgovernment envisages gradual corrections in revenueand fiscal deficits under its rolling targets set out for2012-13 and 2013-14. Even though, rolling targetsset for fiscal deficit seem achievable, at the currentjuncture achieving the revenue targets appear to bea challenge. There could be a shortfall in achievingthe deficit targets prescribed by the Thirteenth FinanceCommission for the medium-term. An amendment tothe Fiscal Responsibility and Budget Management(FRBM) Act, 2003 is expected during the course of2011-12, which would lay down the fiscal roadmapfor the next five years. Fiscal rules defined during thepre-crisis period are also subject to review in manyadvanced and developing economies (Box II.13).
Quality of fiscal adjustment has long term growthimplications
II.5.17 While restraint on revenue expendituregrowth not only ensures that the fiscal consolidationprocess is sustainable, it also creates a fiscal spacefor undertaking additional capital outlay, which isessential for infrastructure financing and to providean enabling environment for sustained economicgrowth. Nonetheless, going forward, there are certainconcerns with regard to fiscal consolidation. First, theratio of revenue deficit to gross fiscal deficit, which isan important benchmark for assessment of the qualityof fiscal consolidation, is expected to remain

ECONOMIC REVIEW
57
Box II.13Fiscal Indicators in a Rule-based Framework: Cross-country Survey
In the aftermath of global financial crisis, fiscal rules havecome under strain across a number of countries as they donot distinguish between economic upturns and downturns.Fiscal rules constrain budget makers by delineating a‘numerical target’ on budgetary aggregates over a ‘longlasting time period’ with a view to guiding fiscal policy (Kopits,2001). Although countries have not repealed pre-crisis fiscalrules, many of them have either ignored or adjusted theirrules and even taken discretionary action to cut revenues,boost expenditures and raise the deficit to address theeconomic slowdown. High fiscal deficits and sovereign debtrisks, however, have necessitated countries to re-examinetheir fiscal rules so as to anchor their fiscal imbalances evenbefore their economies stabilised. Effective fiscal rules shouldnot only aim for numerical targets that have an unambiguousand stable link with an ultimate objective like public debtsustainability, but also provide sufficient flexibility to respondto shocks.
In practice, fiscal policy under the rule-based framework isanchored to a variety of budgetary aggregates.Conventionally, overall budget balance is targeted formoving towards debt-sustainability whereby debt-GDP ratioconverges to a finite level. However, as this indicatorprovides a low degree of cyclical flexibility for fiscal policyto respond to shocks, countries also target structural orcyclically adjusted balance (CAB), whereby the governmentpursues the objective of achieving a nominal budgetbalance on average over a full economic cycle. Whileprimary balance rules also exist, they are less linked todebt sustainability as they tend to ignore imbalances beingincurred on account of interest payments. Similarly, thegolden rules, which target the overall balance net of capitalexpenditures, are also less linked to debt. Countries mayalso adopt debt rules (DR) by directly setting an explicitlimit or target for public debt (in absolute or as ratio to GDP)either in gross terms or in net terms (after adjusting financialassets). Although DRs are most effective for ensuringconvergence to a debt target, they do not provide sufficientguidance for fiscal policy in terms of its constituents andcan become misleading at times, when debt level is belowthe ceiling but rising.
Alternatively, some countries may set permanent limits orceilings on total, primary, or current spending in absoluteterms, growth rates, or in per cent of GDP (expenditure rules:ER) or they may set floors/ceilings on revenues (to boost taxcollection/limit tax burden) (revenue rules: RR). While ERsprovide flexibility for conduct of fiscal policy through cyclicaland discretionary reductions in revenues during an economicdownturn, they do not normally permit discretionaryexpenditure stimulus. On the other hand, RRs do notconstrain government spending. Both these sets of rules arenot directly linked to the control of public debt. Furthermore,
RRs do not generally account for the operation of automaticstabilisers on the revenue side in a downturn (or in an upturnfor revenue ceilings). As automatic stabilisers are strongeron the revenue side, these rules per se may tend to result ina procyclical fiscal policy. ERs and RRs, therefore, need tobe accompanied by debt or budget balance rules for ensuringlong term fiscal sustainability.
Historically, the genesis of fiscal rules dates back to the mid-nineteenth century. However, recognising inadequacies instand-alone rule making, countries (New Zealand in 1994followed by countries in Latin America, Europe and Asia)started enacting fiscal responsibility legislations (FRLs) asa permanent institutional arrangement for promoting fiscaldiscipline in a credible, predictable and transparent manner(Corbacho and Schwartz, 2007). The number of countriesadopting national and/or supranational fiscal rules has goneup from seven in 1990 to 80 in 2009 (IMF, 2009). Increasinglymany (60 per cent) countries including EMEs (Argentina,Indonesia and Mexico) have adopted combination of budgetbalance and debt targets to improve the effectiveness of theirfiscal rules to ensure debt sustainability. Supranational rulesalso have combined budget balance rules with debt rules (in41 countries), which were accompanied, particularly in theadvanced economies by national rules, such as expenditureceilings and specific revenue rules in some countries (e.g.,tax revenue ceilings in Denmark, and a windfall revenue rulein France).
Rule-based fiscal frameworks have varied across advancedand developing economies depending upon their differentneeds, institutional capacity, and exposure to global shocks.Advanced economies have tended to favour flexibility in theirfiscal rules by either adopting cyclically adjusted balancesas target indicators or merely strengthening their fiscalframeworks without emphasising numerical targets. On theother hand, the EMEs have preferred combination of balancebudget rules and debt rules for working towards debtsustainability. While in EMEs fiscal rules were accompaniedby FRLs, advanced countries have generally not adoptedFRLs reflecting strength in the existing legal and institutionalframework (Lienert, 2010).
India embarked on FRL framework with the enactment ofFiscal Responsibility and Budget Management (FRBM) Actby the Central government in 2003, followed by the Statessubsequently. In order to improve the effectiveness of suchlegislations, the FRLs in India have a combination of targetsset for various fiscal indicators such as fiscal deficit, revenuedeficit and debt. Notably, India’s FRL system of targetingrevenue and fiscal balances separately is quite uniqueinternationally as other countries generally tend to targetoverall budgetary balance. By targeting a zero level ofrevenue deficit, India’s FRLs recognise the importance of
(Condt....)

ANNUAL REPORT
58
(...Concld.)
significantly higher at 74.4 percent in 2011-12 (BE)than 41.4 per cent in 2007-08. This indicates that alarge portion of borrowings are used to finance therevenue deficit, thereby reducing the availability ofresources to undertake capital outlays which couldhave implications for potential growth. With theGFD-GDP ratio budgeted to be lower in 2011-12,higher RD-GFD ratio reflects that fiscal adjustmentenvisaged during 2011-12 will be mainly throughcompression in capital outlay. Accordingly, thequality of fiscal adjustment may have long-termimplications for growth as fiscal multiplier is generallyfound to be higher in the case of capital expenditure(Box II.14).
States’ own initiatives important for their durable fiscalconsolidation
II.5.18 While laying out the revised fiscal roadmapin amended FRBM Acts, States need to takecognisance of changing contours of Centre-Statefinancial relations. With a sharp decline in loans fromthe Centre, particularly since 2004-05, resourcetransfers from Centre to States in recent years havebeen mainly through current transfers, viz., taxdevolution and grants. While current transfers fromthe Centre contributed to around one-third ofcorrection in revenue account of States during thepre-crisis period (2003-04 to 2007-08), lower taxdevolution due to cyclical downturn in tax collectionsat the Central level during the crisis was compensatedby higher grants.
II.5.19 Keeping in view the cyclicality in taxcollections at the Central level, States need to exploreown non-tax sources of revenues by undertakingreforms in major sectors, viz., power and irrigation.Effective mobilisation of own non-tax revenues, whichare expected to be more durable than tax revenues,would facilitate lower dependence of States on Centreespecially during the period of slowdown. While thetax base of States is likely to expand with the proposedimplementation of GST, States may have to assessits revenue implications based on the structure of theirState economies.
II.5.20 The recommended share of States in the formof tax devolution from the Centre has also been raisedby the Thirteenth Finance Commission (FC). States,on their part, may have to devolve higher resourcesto local governments, for facilitating greaterdecentralisation and undertake fiscal consolidationinitiatives so as to benefit from State-specific grantsas recommended by the Thirteenth FC. Goingforward, taking into cognisance these factors, Statesneed to amend their FRBM Acts to provide revisedfiscal roadmap for medium term.
II.5.21 The Central Government had constituted anExpert Committee in July 2010 (Chairperson: Smt.Shyamala Gopinath) for comprehensive review of theNational Small Savings Fund (NSSF). The terms ofreference of the Committee were, inter alia, torecommend mechanisms to make small savingschemes market linked and to recommend on the
phasing out the use of borrowed resources for currentconsumption of the government so as to ensure thatborrowings are used only for capital expenditures for long-term fiscal sustainability. This is consistent with the UK’s‘golden rule’ fiscal framework, whereby borrowing ismandated only for capital expenditure. From Union Budget2011-12, the Central government has started focusing onreducing ‘effective revenue deficit’, which excludes capitalgrants to States from the headline measure of revenue deficit.Recognising that fiscal consolidation is conducive tomacroeconomic management, the Central governmentintends to introduce an amendment to the FRBM Act, 2003during the course of 2011-12, which would lay down the fiscalroadmap for the next five years.
References:
Corbacho, Ana, and Gerd Schwartz, 2007, “FiscalResponsibility Laws,” in Promoting Fiscal Discipline, ed. byManmohan S. Kumar and Teresa Ter-Minassian(Washington: International Monetary Fund).
Kopits, G. (2001), “Fiscal Rules: Useful Policy Framework orUnnecessary Ornament?” IMF Working Paper 01/145.
Lienert, Ian (2010), “Should Advanced Countries Adopt aFiscal Responsibility Law?” Fiscal Affairs Department, IMFWorking Paper 10/254.
IMF (2009), “Fiscal Rules—Anchoring Expectations forSustainable Public Finances”, Fiscal Affairs Department,December 16.

ECONOMIC REVIEW
59
lending arrangement of the net collection of smallsavings to Centre and States, and to suggestalternative investment avenues. The Committeesubmitted its report to the Government of India in June2011 (Box II.15). The recommendations of theCommittee are aimed at aligning the administeredinterest rates on small savings instruments withmarket related rates on government securities. This
Box II.14Fiscal Multiplier: A Cross-Country Experience
The global financial crisis drew discretionary fiscal stimulusmeasures almost as reflex actions across countries mirroringan underlying belief about efficacy of government spendingor taxation measures for stimulating desired change inaggregate demand. With widespread adoption ofexpansionary fiscal policy during the crisis, a long standingdebate about the size of the fiscal multiplier has resurfacedboth in theory and across countries. ‘Multiplier effect’,originally propounded by Richard Kahn (1930) and laterpopularised by Keynes, measures the efficacy of governmentspending or tax measures to bring desired change inaggregate demand. Fiscal multiplier exceeds unity in simpleKeynesian framework but it is now known that it can varyconsiderably with impact varying from even negative valuesto large positive values. Interaction with a large number ofmacro-economic parameters ultimately determines the sizeof the multiplier. If with fiscal expansion, monetary conditionsremain accommodative, fiscal multiplier is generally larger.While lower level of leakages in spending increases the valueof multiplier, concerns with regard to long term fiscalsustainability may make it less effective and even negative.The composition of expenditure plays an important role inassessing the effect of fiscal stimulus in developing countries.Furthermore, fiscal multiplier calculated as an impactmultiplier differs from cumulative multiplier or the peakmultiplier. Even though there has been a vast literature onestimating fiscal multiplier, the empirical work on fiscalmultiplier, providing a broad range of results, has not settledthe theoretical debates.
Typically, in advanced economies, the multipliers arestatistically significant and moderately positive. In contrast,the effects on output in the medium-term in emergingeconomies were found to be consistently negative indicatingthat discretionary fiscal measures taken in emergingeconomies might have a positive impact in the immediateperiod but they appear to be anti-growth in the medium-termas they become more of a structural nature and thus moredifficult to phase out in later years.
In the wake of occurrence of global crisis, a number of studieswere undertaken to examine the impact of fiscal stimulusunder varying conditions. Ilzetzki et al (2011) have shown
that the cumulative impact of government consumption onoutput was lower in developing countries as compared withhigh-income countries. Fiscal expansions that were expectedto persist indefinitely have smaller multipliers due to strongerprivate-sector offsets. In general, during crisis when fiscalstimulus is designed to address recessionary conditions,fiscal multipliers are expected to be larger than in the normalperiod when monetary and fiscal policies may be working atcross purposes.
An exercise undertaken for estimating the size of fiscalmultipliers in respect of government final consumptionexpenditure (GFCE) and the Central government’s capitaloutlay using VAR framework adopting methodology similarto Espinoza and Senhadji (2011) suggests that fiscalmultipliers in India are low. Based on quarterly data for 1996-97 to 2009-10, it was found that government consumptionpositively impacts GDP growth (both in real and nominalterms) in the short-term. Government consumption multiplierpeaks within first three quarters (ranging between 0.11 and0.20 under alternative specifications), after which the impactis found to peter out. Focusing on impact of Centralgovernment’s investment as reflected in annual capitaloutlays (in real terms), the cumulative multiplier works out toaround 1.5 when the multiplier peaks. Thus, cross-countryfindings as well as the results for India show that governmentconsumption leads to crowding out with size of multiplierbeing significantly lower than one while investment multiplier,working over the long-run, has crowding-in impact with itssize more than unity. This calls for improving quality of publicexpenditure management by increasingly rationalisingoutlays towards investment as the Central and Stategovernments revert to the rule-based fiscal consolidationpath.
References:
Ilzetzki, Ethan; Enrique G. Mendoza and Carlos A. Végh(2011), “How Big (Small?) are Fiscal Multipliers?”, IMFWorking Paper No. WP/11/52.
Espinoza, Raphael and Abdelhak Senhadji (2011), “HowStrong are Fiscal Multipliers in the GCC? An EmpiricalInvestigation”, IMF Working Paper No. WP/11/61.
would reduce the volatility in small savings collections,which would facilitate a more efficient cash and debtmanagement of the Central and State Governmentsand a smoother transmission of monetary policysignals. The recommendations would also empowerthe State Governments with greater discretion onborrowings from NSSF keeping in view their cashposition and improve the viability of NSSF.

ANNUAL REPORT
60
Box II.15 Recommendations of Committee on the Comprehensive Review of the NSSF
The Committee recommended the following measures onthe rationalisation of savings instruments: (i) an increase inthe rate of interest to 4 per cent p.a. on savings deposits toalign with commercial bank savings deposit rate; (ii)measures to improve liquidity on recurring and time depositschemes; (iii) abolition of maturity bonus on Monthly IncomeScheme; (iv) an increase in the annual investment limit onPPF to `1 lakh to coincide with the ceiling on Section 80C ofthe I.T. Act; (v) withdrawal of Section 80C income tax benefitfor accrued interest on NSC; (vii) discontinuance of KisanVikas Patra (KVP) which is prone to misuse being a bearer-like instrument; and (viii) introduction of a longer maturityinstrument – 10 year NSC.
The Committee recommended that the secondary marketyields on Central government securities of comparablematurities should be the benchmarks for the small savingsinstruments (other than savings bank deposits). A one-yearreference period - taking the average of the month-endsecondary market yields in the preceding calendar year -may be adopted; however, the inter-year movement ofinterest rate fluctuations would be limited to maximum 100bps on either direction. A positive spread of 25 bps, vis-à-visgovernment securities of similar maturities (as against 50bps recommended by the earlier Committees) wouldcontribute to the viability of the NSSF. Exceptions were madeonly in case of 10-year NSC and Senior Citizens’ Savings
Scheme (SCSS) by recommending a spread of 50 bps and100 bps, respectively. The date of notification of the rate ofinterest on small savings by the Government would be April1, every year, effective 2012-13.
The Committee recommended a reduction in the mandatoryshare for States to 50 per cent from 80 per cent at present.After the States exercise their options, the balance amount,if any, could either be taken by the Centre or could be on-lent to other States if they so desire, or could be on-lent forfinancing infrastructure to companies which are whollyowned by Government. With the rule-based improvementin fiscal situation, lower maturity may not involve refinancingrisk. Accordingly, to broadly align with the maturity profileof the small savings instruments, the Committeerecommended a shorter tenor of 10 years for investmentsby NSSF that would largely address the asset-liabilitymaturity mismatch of NSSF. The rate of interest onsecurities issued to the Central / State Governments wouldbe equal to the sum of the weighted average interest coston the outstanding small savings and the averageadministrative cost and would be announced every yearon April 1. The reinvestments may be as per the same termsas for fresh investments. The negative gap between theoutstanding assets and liabilities of NSSF may be fundedby the Central Government. These measures wouldcontribute to the viability of NSSF.
VI. THE EXTERNAL SECTOR
Global recovery loses momentum; sovereign balancesheet risks add to uncertainty
II.6.1 The global economy rebounded in 2010 witha growth of 5.1 per cent after contracting by 0.5 percent in 2009. The growth in emerging market anddeveloping economies (EMDEs) at 7.4 per centoutstripped the 3.0 per cent growth in advancedeconomies (AEs) in 2010 (Chart II.44a). China, India,Brazil and the ASEAN-5 grew at a significantly fasterpace than the AEs. However, the United States,Germany and Japan had larger swings in growth ratestransiting from significant negative to moderatelypositive growth.
II.6.2 The recovery was marked by continueduncertainty about the durability of the growth process.After recovering strongly in the first half of 2010, theglobal economy encountered heightened downsiderisks emanating from concerns relating to the possible
sovereign debt defaults in Greece, Ireland andPortugal and the weakening sovereign balancesheets in Italy and Spain. The global recovery lostsome momentum in the second half of the year in theAEs, particularly in the US and Japan. Growth in worldindustrial production also exhibited signs ofdeceleration after attaining peaks in March 2010. TheAEs which faced the prospect of double-dip recession,nevertheless, performed better than expected.However, the recent downgrading of the US sovereigndebt by Standard and Poors’ (S&P) adversely affectedthe sentiments in the financial markets across theworld, renewing fears of slowdown amidst weakeningglobal economic recovery. Emerging marketeconomies (EMEs) led by China and India continuedto grow at a faster rate compared to the AEs.
EMEs face rising inflation led by commodity prices
II.6.3 Inflation accelerated in EMDEs during 2010.On an average consumer price basis, it rose to 6.1per cent in 2010 from 5.2 per cent in the preceding

ECONOMIC REVIEW
61
year. Both India and China faced considerableinflationary pressures. As a result, Developing Asia’sinflation rate nearly doubled to 6.0 per cent in 2010from 3.1 per cent in 2009. In contrast, consumer priceinflation in AEs rose to 1.6 per cent from 0.1 per centover the same period, but was still well below the long-run average in these countries. The core inflationarypressures remained subdued in these economies, buta stark divergence has occurred in recent months withproducer price inflation having risen faster with risingfuel and non-fuel commodity prices.
II.6.4 Global commodity prices firmed up during2010, owing to rapid growth in EMDEs, stronger-than-expected growth of AEs and weather-relatedsupply shocks. Low global interest rates and largesurplus liquidity in the global economy fuelled globalcommodity prices with players taking long positions.OPEC’s lower-than-expected output responseduring 2010 and unrest in the Middle East and NorthAfrica (MENA) since January 2011 drove up oilprices. Commodity prices are expected to remainfirm in 2011. If, however, monetary accommodation
Chart II.44 : Key Global Indicators
a: Output Growth
-4
-2
0
2
4
6
8
10
2007 2008 2009 2010 2011f 2012f
Per
cen
t
World Advanced EconomiesEmerging and Developing Economies
Source: IMF
c: Net Private Financial Flows to EMDEs
0
100
200
300
400
500
600
700
800
2003
2004
2005
2006
2007
2008
2009
2010
2011f
US
$billion
Source: IMF
Advanced G-20 Economies Emerging G-20 Economies
e. Overall Fiscal Balance
-10
-9
-8
-7
-6
-5
-4
-3
-2
-1
0
2008 2009 2010 Est. 2011P 2012P
Per
cen
tof
GD
P
P: ProjectionIMF Fiscal Monitor Update, June 2011Source:
P: Projection
Advanced G-20 Economies Emerging G-20 Economies
d.Public Debt
0
20
40
60
80
100
120
2008 2009 2010Est. 2011P 2012P
Per
cen
tof
GD
P
Source: IMF Fiscal Monitor Update, June 2011
b: Growth in World Merchandise Exports (Value)
-40
-30
-20
-10
0
10
20
30
40
2006Q
1
2006Q
2
2006Q
3
2006Q
4
2007Q
1
2007Q
2
2007Q
3
2007Q
4
2008Q
1
2008Q
2
2008Q
3
2008Q
4
2009Q
1
2009Q
2
2009Q
3
2009Q
4
2010Q
1
2010Q
2
2010Q
3
2010Q
4
2011Q
1
Per
cen
t
-25
-20
-15
-10
-5
0
5
10
15
20
25
Per
cen
t
Q-on-Q (RHS) Y-o-YSource: WTO
Source: Websites of respective national statistics organisations.US Japan Euro Area UK
f. Unemployment Rate
3
4
5
6
7
8
9
10
11
Per
cen
t
2005
2007
Ju
n-0
8
Au
g-0
8
Oct-
08
Dec-0
8
Feb-0
9
Apr-
09
Ju
n-0
9
Au
g-0
9
Oct-
09
Dec-0
9
Feb-1
0
Apr-
10
Ju
n-1
0
Au
g-1
0
Oct-
10
Dec-1
0
Feb-1
1
Apr-
11
Ju
n-1
1

ANNUAL REPORT
62
in AEs is progressively withdrawn, the consequentrise in interest rates could reduce leveragedposition in commodity markets and deflatecommodity prices. Commodity prices could alsoexperience a decline if the pace of global recoveryslackens further.
II.6.5 Strong capital inflows induced by the multi-paced global growth and the consequent differentialexit from accommodative monetary policy, coupledwith the near full capacity utilisation have generatedinflationary pressures in many EMEs, includingBrazil, China, India, Indonesia, and Russia. In anincreasingly interdependent globalised world,options for the pursuit of an independent monetarypolicy for EMEs like India can get constrained butthis could be managed through appropriate policies(Box II.16).
II.6.6 In 2010, the improving demand conditionshelped in the recovery of world trade to its pre-crisislevel. Exports of EMDEs witnessed higher growththan those of AEs. Exports surged during 2010 andglobal trade recovered to exceed the pre-crisis highof July 2008 for the first time in March 2011(Chart II.44b). However, the growth in global tradeis expected to moderate due to rising prices of foodand other primary products, and unrest in major oilexporting countries. Capital flows are likely to remainstrong during 2011, but in view of the recentdevelopments, they do run the risks of turningvolatile, with possible episodes of sudden reversals(Chart II.44c).
II.6.7 Fiscal policy continued to support economicactivity in the AEs in 2010 (Chart II.44d and e). Goingforward, there is an urgent need for adopting fiscalconsolidation plans. This need is particularly urgentin countries with debt sustainability issues in the Euroarea and also in Japan and the US to avoid contagionspreading from the government balance sheet to thebank balance sheets and the financial markets.Unemployment situation has remained stubbornlyhigh in the AEs throughout 2010 and is improvingslowly in 2011 (Chart II.44f).
Balance of Payments improve in 2010-11
II.6.8 The improvement in India’s balance ofpayments (BoP) during 2010-11 primarily reflectedpick-up in exports during the second half of the year.Coupled with a higher invisibles surplus, it led to amoderation in the current account deficit (CAD) in2010-11. While recovery in global growth augured wellfor pick-up in exports and invisibles, higherinternational commodity prices, particularly crude oil,impacted the import bill. The improved net capitalinflows helped bridge the higher CAD and foreignexchange reserves increased modestly. Key externalsector indicators such as CAD, level of external debtand import cover of foreign exchange reservescontinued to remain comfortable. On the capitalaccount, the composition of inflows poses someconcern as there was slow down in FDI while thevolatile components such as FII and short-term tradecredits showed some rise that have implications forexternal debt sustainability. The bilateral nominalrupee-dollar exchange rate showed a two-waymovement broadly reflecting demand and supplyconditions in the foreign exchange market.
Trade diversification helps narrow trade deficit
II.6.9 India’s merchandise exports grew robustlyduring 2010-11 aided by higher rate of growth in globalincome and diversification in direction andcomposition of trade. The Government’s export policyin terms of encouragement of Free Trade Zones, DutyExemption Entitlement Scheme, focus marketscheme (FMS) and focus product scheme (FPS)appeared to have contributed to the diversification ofexports in terms of products from labour intensivemanufactures to higher value-added products inengineering and petroleum sectors and destinationsacross EMDEs which led to moderation in trade deficitduring 2010-11 (Chart II.45). While the share ofengineering and petroleum products increased to27 per cent and 17 per cent in 2010-11 from 21 percent and 11 per cent, respectively, in 2005-06, theshare of labour intensive products declined from 29per cent to 21 per cent during the same period. The

ECONOMIC REVIEW
63
Box II.16Has Increasing Globalisation Limited the Effectiveness of National Policies in India?
In the wake of the global financial crisis, financial globalisationhas come under scrutiny once again. Critiques ofglobalisation have re-emphasised that globalisation does notbring any additional gains than what can already come fromfree trade. In the context of increasing capital flows, it hasbeen time and again pointed out by the critiques that gainsfrom trade in goods (widgets) are of first order, while gainsfrom trade in capital (dollars) are of second order, a’la JagdishBhagwati. Another observation has been that countries thathave benefited most from free-market globalisation are notthose that have embraced it wholeheartedly, but those thathave adopted parts of it selectively. Open markets succeedonly when embedded within social, legal and politicalinstitutions that provide them legitimacy by ensuring that thebenefits of capitalism are broadly shared (Rodrik, 2011).
Contrarian arguments have been equally strong. Kose, etal.(2009) review a large body of literature to highlight gainsfrom financial globalisation and the various economic policiesthat could help developing economies effectively managethe process of financial globalisation. They find that policiespromoting sound macroeconomy, financial sectordevelopment, institutional quality and trade openness appearto help developing countries derive the benefits of financialintegration. However, a more recent concern has been:if globalisation is leading to a loss of national policyeffectiveness?
The answer is not easy to find. Subbarao (2011) suggeststhat there is a need to find ways to maximise the benefits ofglobalisation while minimising its costs. While spilloversoccur, we need to deal with them. A typical case has beenQE2, which has both positive and negative externalities. Itsannouncement caused a double whammy on the EMEsthrough a surge in capital inflows and a rise in commodityprices, both requiring them to tackle inflationary pressures.They put EMEs in a policy bind as higher interest rates tofight inflation could potentially intensify capital inflows further.QE2, however, also helped shore up US recovery, bringingback confidence in financial markets and ultimately helpingEMEs through improved trade and capital account flows.Effectiveness of national economic policies goes down insuch cases, especially if they are uncoordinated.
The impact of globalisation on national economic policyeffectiveness is ultimately an empirical question. Ourtheoretical understanding of the channels through whichnational economies are linked is also inadequate. Yet, it wouldnot be correct to say that domestic monetary, fiscal orexchange rate policy becomes redundant with increasedopenness. Trilemma in policy choice is a well known problemand needs to be managed by adopting less than cornersolutions. In fact, under globalisation national policies canbe more carefully calibrated and fine-tuned to serve nationalinterests.
For instance, monetary policy takes on new importance underglobalisation due to need to contain spillovers and theirimpact on nominal asset returns. The case for price stabilityas an optimal monetary rule becomes stronger. Even withoutnominal price rigidities, price stability is important because it
enhances the risk sharing properties of nominal bonds(Devereux and Sutherlands, 2008). It is important torecognise that globalisation represents a shock to relative,not absolute prices. What happens to the general price leveldepends on what monetary policy makers then decide to do.
It has been argued that de facto openness has risen sharplyin India and has implied a loss of monetary policy autonomywhen exchange rate pegging was attempted (Shah andPatnaik, 2011). It is true that the exchange rate regime hasevolved towards greater flexibility as a conscious policychoice, but this has been calibrated to the changing structureand dynamics of the economy without loss of monetary policyindependence. Policies had supported this move over aperiod of time, inter alia, by capacity building to withstandvolatility and shocks. It has increasingly allowed exchangerate to serve as a buffer, depreciating to help the economywhen it was weak and appreciating to reduce excess demandwhen it was strong. In the past two years, there has been nosignificant foreign exchange market intervention. The smallincrease in the Reserve Bank’s foreign exchange reservesmainly reflects various accruals, interest earnings andvaluation changes. Increased exchange rate flexibility hasalso minimised the danger that foreign inflows would beattracted by “one-way bets” on appreciation, or that domesticfirms would borrow excessively from abroad without hedgingtheir exposure.
Globalisation is a phenomenon that has now acquired a forceof its own. Policy interventions can best aim at a right policymix to reap gains from it while minimising the risks. Thesegains dynamically can be significant. It may appear thatgrowing global interdependence has increased the Indianeconomy’s vulnerability to external demand and exchangerate shocks. However, misaligned exchange rates amidstbalance of payment shocks had a much larger adverseimpact on the Indian economy in the earlier crisis episodes.After the Indian economy has become integrated globally, alarge shock in the form of a swing of US$100 billion in totalnet capital inflows in a single year of peak of global crisishad been managed without too much impact on exchangerate, interest rates, external and internal balances.
References:Devereux, Michael B. and Alan Sutherland (2008), “FinancialGlobalisation and Monetary Policy”, Journal of MonetaryEconomics, 55(8): 1363-1375, November.
Kose, A. Ayhan, Eswar Prasad, Kenneth Rogoff and Shang-Jin Wei (2009), “Financial Globalisation and EconomicPolicies”, IZA Discussion Paper No. 4037.
Rodrik, Dani (2011), The Globalisation Paradox, WW Norton& Co.
Shah, Ajay and Ila Patnaik (2011), “India’s FinancialGlobalisation”, NIPFP Working Paper, No. 2011-79.
Subbarao, D. (2011), “Policy Discipline and Spillovers in anInter-connected Global Economy”, Comments at the SNB-IMF Conference on The International Monetary System,Zurich, May 10.

ANNUAL REPORT
64
share of developing economies in total exportsimproved to 42 per cent in 2010-11 from 38 per centin 2005-06, while the share of OECD countriesdeclined to 33 per cent from 45 per cent during thesame period.
II.6.10 Comparing across countries, exports from thegroup of EMDEs as a whole rose relative to worldexports. Countries like India, Brazil, China, Indonesiaand Russia witnessed higher growth during 2010(Chart II.46).
II.6.11 While exports of almost all major groups ofcommodities improved significantly during 2010-11,performance in case of valued added products such
as engineering and petroleum sector has beennoteworthy. Engineering products, petroleumproducts, gems and jewellery witnessed asignificantly higher growth (Chart II.47). Moreover,efforts to explore new markets particularly in Africaand Latin America along with added emphasis onexports to EMDEs also contributed to the exportperformance.
II.6.12 With a view to improving efficiency of exportprocesses, the Union Budget 2011-12 announced thefollowing measures: (i) introduction of a system ofself assessment in Customs to enable importers andexporters to assess their duty liabilities; (ii) simplificationof tax refunds on services used for exports of goodson the lines of duty drawback schemes; (iii) allowingtax-free receipt of services wholly consumed withinthe SEZs along with simplified refunds procedures;and (iv) setting up of seven mega leather clustersand a handicraft mega cluster.
II.6.13 Imports grew at a lower pace than exportsduring 2010-11. There was an increase in the shareof industrial inputs in total imports (non-oil importsnet of gold and silver, bulk consumption goods,manufactured fertilisers and professionalinstruments), which was indicative of some qualitativeshift in the pattern of imports. Imports of export relateditems recorded a steep rise of about 59 per cent duringthe year. The share of gold and silver in total importsremained almost same as that of the previous year’slevel despite the rise in the price of gold and silver inthe international market.
Chart II.45 : India’s External TradeA
pr-
08
Ju
l-08
Oct-
08
Jan
-09
Apr-
09
Ju
l-09
Oct-
09
Jan
-10
Apr-
10
Ju
l-10
Oct-
10
Jan
-11
Apr-
11
Ju
l-11
b: India's POL Imports and International Crude Oil Prices
5.0
8.0
11.0
14.0
17.0
20.0
23.0
26.0
29.0
32.0
35.0
US
$per
barr
el
10
30
50
70
90
110
130
150
US
$billion
POL Imports Non Oil ImportsAverage Crude Oil Price of Indian Basket (RHS)
Apr-
08
Ju
l-08
Oct
-08
Jan
-09
Apr-
09
Ju
l-09
Oct
-09
Jan
-10
Apr-
10
Ju
l-10
Oct
-10
Jan
-11
Apr-
11
Ju
l-11
a.Exports and Imports
Exports Imports Trade Balance (RHS)
US
$B
illion
Per
cen
tG
row
th
-50.0
-40.0
-30.0
-20.0
-10.0
0.0
10.0
20.0
30.0
40.0
50.0
60.0
70.0
80.0
-17.0-16.0-15.0-14.0-13.0-12.0-11.0-10.0-9.0-8.0-7.0-6.0-5.0-4.0-3.0-2.0-1.00.0
Chart II.46: Year-on-Year Export Growth ofIndia AEs and EMEsvis-a-vis
Per Cent Growth
2009 2010
-40.0 -20.0 0.0 20.0
Adv. Eco.
World
US
TurkeySwitzerland
Sweden
SingaporeRussia
Mexico
Malaysia
Korea, Rep. of
JapanIndonesia
India*
France
Emer.& Dev.
China
Chile
Brazil
Argentina
40.0
* Based on DGCI&S data. IMFSource:

ECONOMIC REVIEW
65
Chart II.47: Exports and Imports of Major Commodities
a:Growth in India's Major Commodities Exports
-40 -30 -20 -10 0 10 20 30 40 50 60 70 80
Agricultural & Allied Products
Ores & Minerals
Manufactured Goods
Leather & Manufactures
Chemicals & Related Products
Engineering Goods
Textiles and Textile Products
Gems & Jewellery
Handicrafts
Petroleum Products
Per cent2009-10 2010-11
-50
Per cent2009-10 2010-11
b:Growth in India's Major Commodities Imports
-30 -20 -10 0 10 20 30 40 50 60 70 80 90
Bulk Imports
POL
Bulk Consumption Goods
Iron & Steel
Non-Bulk Imports
Capital Goods
Mainly Export Related Items
Gold & Silver
c: Percentage Share in India's Merchandise Exports
2009-10 2010-11 2009-10 2010-11
d: Percentage Share in India's Merchandise Imports
Develo
pin
gC
ou
ntr
ies
OPE
C
EU
Ch
ina
UA
E
Sau
di
Ara
bia
US
A
Sw
itze
rlan
d
Au
str
alia
Iran
Germ
an
y
Develo
pin
gC
ou
ntr
ies
OPE
C
EU
UA
E
US
A
Ch
ina
Hon
gK
on
g
Sin
gapore
Neth
erl
an
ds
UK
Germ
an
y
0
5
10
15
20
25
30
35
40
45
0
5
10
15
20
25
30
35
II.6.14 During 2010-11, as per DGCI&S data, India’smerchandise exports and imports increased by 42.3per cent and 22.3 per cent, respectively, as against adecline of 2.2 per cent and 3.5 per cent during theprevious year. Consequently, trade deficit narrowedto US $ 98.2 billion (5.7 per cent of GDP) from theprevious year (Appendix Table 17). However, on BoPbasis, trade deficit as a percentage of GDP was higherat 7.5 per cent.
Invisibles growth robust
II.6.15 During 2010-11, invisibles receipts andpayments exhibited robust growth in contrast to adecline in receipts during 2009-10. This increase -driven by services exports and private transfers - waspartly offset by a decline in investment income. Thesharp growth in invisible payments was led by its majorcomponents viz., services and investment income.As a result, net invisibles recorded a modest increaseover the preceding period. Among the majorcomponents of invisibles, services exports witnessed
a turnaround and recorded a growth of 37.8 per centto US $ 132 billion. While software services receiptsaccounted for 44.7 per cent of total services exports,performance of business and financial services alsoimproved significantly during the year.
II.6.16 A noteworthy aspect in respect of servicesdata was the release of provisional aggregate dataon trade in services for the first time for the month ofApril 2011 as a follow up of the implementation of therecommendations of the Working Group on Balanceof Payments Manual for India (Chairman: Shri DeepakMohanty). The aggregate data on trade in serviceswill be released on a monthly basis after a gap ofabout 45 days.
II.6.17 Investment income receipts, which is a majorcomponent of invisibles, declined by about one-thirdon account of low interest rates abroad. Privatetransfer receipts, a significant and resilient componentof invisibles receipts during the global crisis, increasedmarginally during 2010-11. With the turnaround in other

ANNUAL REPORT
66
segments, the share of private transfer receipts incurrent receipts declined during 2010-11 (Chart II.48).
Current account deficit shrinks
II.6.18 On BoP basis, trade deficit widened inabsolute terms to US$ 130 billion (7.5 per cent ofGDP) during 2010-11 from US$ 118 billion (8.6 percent of GDP) in the previous year despite highergrowth in exports relative to imports (Appendix Table18). Net invisibles financed about 66.1 per cent oftrade deficit as compared with 67.6 per cent in theprevious year. As a result, the CAD narrowed to 2.6per cent of GDP during 2010-11 from 2.8 per centduring the previous year (Chart II.49). Thus, CAD is
within the threshold level of sustainable CAD of 2.7-3.0 per cent (Box II.17).
Capital account improves though composition of flowsposes concerns
II.6.19 The positive perception of India’s growthprospects attracted capital inflows during 2010-11which witnessed an increase of US$ 6.3 billion overthe preceding year. The composition and volatility ofsuch flows posed some concern. There was thedominance of volatile flows such as FII investmentand debt creating flows like ECBs and short termcredit, while FDI flows moderated. Net FII inflowsremained almost at the same level as that of thepreceding year; there were, however, occasionalbouts of net outflows when investor sentimentschanged. Net FDI inflows were lower by almostUS$ 11.6 billion, due to significant moderation in grossFDI inflows to India coupled with higher grossoutflows. The moderation in equity flows coupled withrising debt flows during 2010-11 poses risks tosustainability.
II.6.20 Non-resident deposits during 2010-11 stoodhigher than the previous year mainly on account ofhigher inflows under NRO deposits (Chart II.50).While debt creating flows exhibit significant sensitivityto the interest rate differentials, at the aggregate level,capital flows are only weakly sensitive to the interestrate differentials (Box II.18). Net external assistancereceived by India was higher by US$ 2 billionbenefitting from financial sector loan from the World
Chart II.48 : Performance of India’s Invisibles
Chart II.48a: Invisibles Receipts and Payments
-10
0
10
20
30
40
50
60
70
2000-0
1
2001-0
2
2002-0
3
2003-0
4
2004-0
5
2005-0
6
2006-0
7
2007-0
8
2008-0
9
2009-1
0
2010-1
1
Gro
wth
inper
cen
t
-20
0
20
40
60
80
100
US
$billion
Net Invisibles (RHS) Invisibles Receipts Services ReceiptsInvisibles Payments Services Payments
Chart II.48b: Growth of Major Components of Invisibles Receipts
-40
-20
0
20
40
60
2005-06 2006-07 2007-08 2008-09 2009-10 2010-11
Per
cen
t
Pvt Transfers Software Investment Income
Chart II.49: Trends in the Major Componentsof Balance of Payments
-120
-80
-40
0
40
80
120
2005-06 2006-07 2007-08 2008-09 2009-10 2010-11
US
$billion
CAB TB NIV RES NKA
CAB: Current Account Balance; TB: Trade Balance
NIV: Net Invisibles; RES: Change in Reserves
NKA: Net Capital Account

ECONOMIC REVIEW
67
Box II.17India’s Threshold level of Sustainable Current Account Deficit
Conceptually, sustainability refers to the ability of a nation tofinance its CAD on an ongoing basis. Therefore, the level ofcurrent account balance (CAB) that could be financed on acontinuous basis without resulting in any external paymentdifficulties is termed as the sustainable level. Generally, thesustainable level of CAD is measured in terms of net externalliabilities (NEL) relative to the size of the economy. The levelof CAB that stabilises the net external assets/liabilities inrelation to the size of the economy is considered assustainable. Apart from NEL/GDP ratio, sustainability couldalso be assessed in terms of a range of economic indicators,viz., debt-GDP ratio, import cover, and debt-servicing ratio.Sustainability of the CAB could also be seen in terms ofsolvency. A nation is considered solvent if the sum of itsdiscounted current account surpluses in future is more thanthe current level of net external liabilities. Solvency andsustainability are closely related as a continuedunsustainable path of external balance would undermine thesolvency of the nation. Theoretically, it can not a prioribe determined what would be the sustainable level of NELratio. It varies from country to country depending upon ahost of factors including credibility and ability of the nation tosustain interest of the investors.
The issue of current account sustainability has been raisedin several countries from time to time. As a practical solution,any historically sustainable level could be assumed to besustainable in future as well (IMF, 1999). Milessi-Ferretti andRazin (1996) point out that though generally a CAD at 5 percent of GDP is considered as a red mark, the questionwhether CAD is excessive or not can only be answered bymodeling the path of external imbalances. But 5 per centclearly is a danger level even for countries which haveunrestricted access to global capital markets. Obstfeld andRogoff (2005) showed that the then US CAD of 5.4 per centof GDP had a high probability of the collapse of the US dollar.More recently, concerns have resurfaced over CADsustainability of a few Euro zone countries. Gagnon (2011)warns that current account imbalances are coming back asa result of interplay of fiscal policy, external financial policy,
net foreign assets and oil prices. Sustainable CAD in EMEsis likely to be far less than AEs.
The sustainable CAD/GDP ratio in India has gone up over aperiod of time. One of the early studies by Callen and Cashin(1999) had estimated it at 1.5-2.5 per cent depending upongrowth rate and cost of external finance. However, with muchlarger cross-border capital flows and improved institutionalcapability to absorb the same, this has improved. Historically,in India NEL ratio of about 21 per cent was the highest in1996-97 and it did not cause any pressure on the economy.In order to empirically workout the level of CAB that isconsistent with historical sustainable peak level of NEL toGDP ratio, a model akin to ‘Domar Model of DebtSustainability’ could be used. Under this model, larger theabsolute size of the differential between the growth rate andthe interest rate, higher would be the size of CAB that isconsistent with a stable NEL ratio. By this method, CAD of2.7 to 3.0 per cent is found to be sustainable for India overthe medium term subject to a set of conditions, viz., (i) GDPgrowth varies between 7.0 to 9.0 per cent and inflation hoversaround 5.0 per cent; (ii) average interest cost on externalliabilities ranges 2.0 to 3.5 per cent; and (iii) capital flowsrange around 4-4.5 per cent of GDP and about 3/5th of theflows are non-debt creating inflows.
Reference
Callen, Tim and Paul Cashin P (1991), “Assessing ExternalSector Sustainability in India”, IMF Working Paper, No.181.
Gagnon, Joseph E. (2011), “Current Account ImbalancesComing Back”, Peterson Institute of International EconomicsWorking Paper, WP-11-1, January.
Milesi-Ferretti, Gian Maria and Assaf Razin (1996), “CurrentAccount Sustainability”, Princeton Studies in InternationalFinance, No.81, October.
Obstfeld, Maurice and Kenneth Rogoff (2004), “TheUnsustainable US Current Account Position Revisited”,NBER Working Paper No. 10869.
Bank. Buoyant domestic economic activities,improvement in international financial markets andlower cost of funds abroad prompted the Indiancorporates to take recourse to ECBs which more thanquadrupled to US$ 11.9 billion. Short-term tradecredits (STC) also increased. Net capital flows, thoughhigher, were absorbed by the higher current accountdeficit.
II.6.21 Country-wise, investments routed throughMauritius remained the largest component of gross
FDI inflows to India during 2010-11 followed bySingapore and the Netherlands (Appendix Table 19)(Chart II.51). During 2010-11, FDI was mainlychanneled into the manufacturing, services and‘construction, real estate and mining’ sectors(Chart II.52).
II.6.22 The increase of US$ 13.1 billion in foreigncurrency assets (FCA) on BoP basis during 2010-11could primarily be attributed to receipts under externalassistance (US$ 6.1 billion), interest and funding

ANNUAL REPORT
68
income (US$ 4.1 billion) and net purchases (RBI’smarket intervention) from Authorised Dealers (ADs)(US $ 1.7 billion). During 2011-12 so far (up to August12), the Indian rupee depreciated against the majorinternational currencies, partly reflecting higherdemand from importers (Chart II.53). The exchangerate of the rupee at the current level appears to befairly valued (Box II.19).
Foreign exchange reserves stable, reflecting
flexible rupee
II.6.23 During 2010-11, net capital account
surplus, after financing a larger CAD, resulted in a
net accretion to foreign exchange reserves of
US$ 13.1 billion (excluding valuation effect).
Inclusive of the valuation gains, the foreign exchange
Chart II.50: Trends in Major Componentsof Capital Flows (Net)
2005-06 2006-07 2007-08 2008-09 2009-10 2010-11
US
$billion
-20
-10
0
10
20
30
40
FDI Portfolio ECB NRI STC
FDI: Foreign Direct Investment; Portfolio: Portfolio Investments;ECB: External Commercial Borrowings; NRI: Non-Resident Indian Deposits;STC: Short Term Credit.
Chart II.51 Country-wise FDI Inflows
2009-10 2010-11
0
2
4
6
8
10
12
Mau
riti
us
Sin
gapore
Neth
erl
an
ds
Japan
US
A
Cypru
s
UK
Hon
gK
on
g
Oth
ers
US
$billion
2009-10 2010-11
Chart II.52: Industry-wise FDI Flows
US
$billion
0
1
2
3
4
5
6
7
Con
str
ucti
on
,R
eal
Esta
te&
Min
ing
Man
ufa
ctu
re
Fin
an
cia
lS
erv
ices
Ele
ctr
icit
y&
oth
er
Com
mu
nic
ati
on
Serv
ices
Bu
sin
ess
Serv
ices
Mis
cellan
eou
s
Com
pu
ter
Serv
ices
Resta
ura
nts
&H
ote
ls
Reta
il&
Wh
ole
sale
Tra
de
Tra
nsport
Tra
din
g
Edu
cati
on
,R
&D
Oth
ers
Chart II.53: Exchange Rate flexibility in India
Net capital inflows in excess of CAD
RBI's net forex purchase
Rupee app (+) / dep (-) against the US dollar (RHS)
2005-06 2006-07 2007-08 2008-09 2009-10 2010-11-60
-40
-20
0
20
40
60
80
100
US
$billion
-25
-20
-15
-10
-5
0
5
10
15
Per
cen
t

ECONOMIC REVIEW
69
Box II.18Interest Rate Sensitivity of Capital Flows to India
Interest rate differential has often been viewed as a majordeterminant of capital flows to EMEs, and, at times, monetarypolicy measures that may be conditioned by the inflation-growthobjectives could magnify or dampen the volume of capitalinflows into a country. In the aftermath of the recent globalfinancial crisis, multi-speed recovery and divergent inflationarytrends have led to asymmetric monetary exit between EMEsand the AEs. An outcome of this process has been return ofexcessive capital flows to EMEs, exerting pressure on theirasset prices to inflate and the exchange rates to appreciate.In India, during the normalisation of monetary policy in 2010-11 when policy interest rates were successively raised, similarconcerns surfaced, particularly in the first half, even though ahigher CAD and the associated higher financing needs easedthe pressure on the exchange rate. Among the push factors,near zero policy rates maintained in AEs, their weak growthprospects and ample global liquidity conditions reflectingquantitative easing, implied scope for larger inflows to EMEs,including India, in search of higher return. Stronger recoveryin a stable macroeconomic environment and the generalassessment of India continuing to be one of the fastest growingeconomies in the world for a long period of time provided thenecessary pull to capital inflows.
Recent empirical assessment for India using both causalityand cointegration analyses suggests that FDI and FII equityflows, which together on a net basis accounted for aroundthree fourth of the total net capital inflows during the 10-yearperiod from 2000-01 to 2009-10, are not sensitive to interestrate differentials (Verma and Prakash, 2011). FDI inflows areessentially long-term in nature and are primarily driven bygrowth prospects of the Indian economy and confidence ofinternational investors in India as an attractive long-term
investment destination. Stock market returns have been foundto be a major pull factor for FII flows into the domestic financialmarkets. In line with the expectations, debt creating flows, inparticular, ECBs, FCNR(B) and NR(E)RA deposits exhibitstatistically significant sensitivity to interest rate differentials,even though other determinants of these inflows dominatesignificantly the impact of interest rate differential. At theaggregate level, cumulative gross capital inflows appear toincrease by 0.05 percentage point in response to 1 percentagepoint increase in interest rate differential. The weak sensitivityof capital flows to interest rate changes suggests that theReserve Bank’s monetary policy needs to continue its focuson objectives relating to inflation and growth, instead of dilutingthe action based on perception of attracting higher capitalinflows and the resultant challenges for exchange rate anddomestic liquidity. The magnitude and composition of capitalflows could be managed using other instruments, as has beenthe case in the past.
References:
Calvo, Guillermo A., Eduardo Fernández-Arias, CarmenReinhart, and Ernesto Talvi (2001) “The Growth-Interest RateCycle in the United States and its Consequences for EmergingMarkets,” Inter-American Development Bank Working PaperNo. 458, Washington.
Singh, Bhupal (2009), “Changing Contours of Capital Flowsto India” Economic and Political Weekly, VOL XLIV No. 43October 24.
Verma, Radheyshyam and Anand Prakash (2011) “Sensitivityof Capital Flows to Interest Rate Differentials: An EmpiricalAssessment for India”, RBI Working Paper, WPS (DEPR): 7/2011, May.
reserves increased by US$ 25.8 billion. India’s
foreign exchange reserves stood at US$ 316.6 billion
as on August 12, 2011 (Appendix Table 20). The
two-way movement in Indian rupee vis-à-vis US
dollar and Euro was more pronounced since
February 2007 than the earlier period indicating its
flexibility (Chart II.54).
Management of foreign exchange reserves
II.6.24 The guiding objectives of foreign exchangereserves management in India are safety, liquidityand returns in line with the general internationalpractices in this regard. The level of foreignexchange reserves has traditionally been theoutcome of the Reserve Bank’s intervention in theforeign exchange market to contain excessiveexchange rate volatility and valuation changes due
to movement in prices of securities and of the USdollar against other currencies. Moreover, thereserves which are built up mostly out of thevolatile capital flows do not represent surplusearnings through trade like in the case of some othercountries and they are required to be held as bufferduring periods of sudden stops and reversal in capitalflows.
Investments under Note Purchase Agreementwith IMF
II.6.25 In order to strengthen the IMF’s lendableresources, the Reserve Bank had entered into a NotePurchase Agreement (NPA) with the IMF under whichthe Reserve Bank shall purchase IMF Notes for anamount up to the equivalent of US$10 billion. Theearlier commitment of US$ 10 billion under NPA has

ANNUAL REPORT
70
Chart II.54: Movements of Indian Rupeeagainst US Dollar and Euro
30
35
40
45
50
55
60
65
70
75
` per US dollar ` Per Euro
Apr-
05
Ju
n-0
5A
ug-0
5O
ct-
05
Dec-0
5F
eb-0
6A
pr-
06
Ju
n-0
6A
ug-0
6O
ct-
06
Dec-0
6F
eb-0
7A
pr-
07
Ju
n-0
7A
ug-0
7O
ct-
07
Dec-0
7F
eb-0
8A
pr-
08
Ju
n-0
8A
ug-0
8O
ct-
08
Dec-0
8F
eb-0
9A
pr-
09
Ju
n-0
9A
ug-0
9O
ct-
09
Dec-0
9F
eb-1
0A
pr-
10
Ju
n-1
0A
ug-1
0O
ct-
10
Dec-1
0F
eb-1
1A
pr-
11
Ju
n-1
1A
ug-1
1
Box II.19Equilibrium Exchange Rate
With the increasing integration of the world economy,the role of exchange rate has become important in theexternal adjustment process and calls for a credibleassessment of equilibrium exchange rate. The assessmentof equilibrium exchange rate is essentially an empiricalexercise.
From the policy makers perspective in the long-term horizon,there are three complementary methodologies for exchangerate arrangements. These are: macroeconomic balance (MB)approach, a reduced form equilibrium real exchange rate(ERER) approach and an external sustainability (ES)approach. Exchange rate assessments are based on thenotion of equilibrium, that is, consistency with external andinternal balance over the medium to long-run. The MBapproach - a pillar of current account and exchange rateassessments for a number of years - calculates the differencebetween the CAB projected over the medium term atprevailing exchange rates and an estimated equilibrium CAB.The exchange rate adjustment that would eliminate thisdifference over the medium term is obtained using country-specific estimated responses of the trade balances to thereal exchange rate. The ERER approach directly estimatesan equilibrium real exchange rate for each country as afunction of medium-term fundamentals such as the netforeign asset position of the country, the relative productivitydifferential between the tradable and non-tradable sectors,and the terms of trade. Under this approach, the exchangerate adjustment needed to restore equilibrium overthe medium term is calculated as the difference betweenthe estimated equilibrium real exchange rate and itscurrent value. The ES approach, involves calculating thedifference between the actual CAB and the balance that
would stabilise the NFA position of the country at somebenchmark level.
With respect to the exchange rate of the Indian Rupee, thepreliminary exercise using the external sustainabilityapproach, shows that the sustainable level of CAD is forIndia is around 3 per cent. As the current level of CAD forIndia is around 3 per cent, it could be inferred that theexchange rate is close to its equilibrium value. The broad-based 36 currency trade weighted real effective exchangerate, a measure of external competiveness, covering about85 per cent of India’s total trade is generally hovering aroundthe base level of 100, which also corroborates the aboveempirical exercise. IMF has estimated that the real effectiverupee, based on the MB approach, is slightly undervaluedbut on average the rupee is in equilibrium (IMF 2010).
The exchange rate policy in India is not guided by a fixed orpre-announced target or band; rather, it is determined bythe demand and supply in the foreign exchange market.However, the objective of exchange rate policy has been toretain the flexibility to intervene in the foreign exchangemarket if the capital inflows are lumpy and volatile or if theydisrupt the macroeconomic situation.
References
Jaewoo Lee, Gian Maria, Milesi-Ferretti, Jonathan Ostry,Alessandra Prati and Luca Antonio Ricci (2008), ‘ExchangeRate Assessments: CGER Methodologies’, InternationalMonetary Fund, Occasional Paper No. 261.
IMF (2010), ‘Current Account and External Sustainability’.IMF Staff Technical Note for Article IV consultations with India,November.
been folded into the amended and expanded NewArrangements to Borrow (NAB) which has beenactivated on April 1, 2011. As on June 30, 2011investments amounting to SDR 750 million (`5367.90crore) have been made in notes under NAB.
External debt rises moderately
II.6.26 India’s external debt stock increased by 17.2per cent to US$ 306 billion as at end-March 2011owing to increase in commercial borrowings, short-term trade credits, multilateral and bilateral borrowingsas well as the valuation effects due to depreciation ofthe US dollar against other major currencies. Whilelong-term debt increased by US$ 32.2 billion to US$241 billion, short-term debt (on the basis of originalmaturity) increased by US$ 13 billion to US$ 65 billion(Appendix Table 21). In terms of currency

ECONOMIC REVIEW
71
composition, the US dollar denominated debtaccounted for the major portion of total external debtat end-March 2011 with a share of 59.9 per cent,followed by Indian Rupee (13.2 per cent), Japaneseyen (11.4 per cent) and SDR (9.7 per cent) with thebalance 5.8 per cent accounted for by the Euro, PoundSterling and other currencies. Various debtsustainability indicators remained at a comfortablelevel (Chart II.55).
International investment position weakens
II.6.27 Net International investment position (IIP)computed as a gap between the economy’s externalfinancial assets and liabilities, is an indicator of thecountry’s strength in terms of sustainability of thefinancing of its external sector. The internationalassets increased from US$ 381 billion at end-March2010 to US$ 425 billion at end-March 2011, mainlyon account of increases in direct investment abroadand reserve assets. The increase in internationalliabilities from US$ 539 billion as at end-March 2010to US$ 643 billion as at end-March 2011 was mainlyon account of an increase in inward direct and portfolioinvestments and other investments. As a result, netliabilities increased by US$ 61 billion.
External sector resilient, but global uncertainties canimpact current and capital account movements
II.6.28 India’s external sector remains resilient evenafter weathering the global financial crisis. However,global uncertainties can have considerable impact onmovements in current and capital account of BoP.Exports which performed well in 2010-11 may notsustain high growth momentum if the downside risksto world growth materialise. However, continuedproduct diversification and targeting new marketstogether with proactive policies pursued by theGovernment bode well for harnessing export growthpotential. Services exports are also likely to remain
buoyant due to India’s comparative advantage insoftware services. As projected by NASSCOM,software exports could grow robustly by 16-18 percent in 2011-12. Rising commodity prices, particularlyoil, and geo-political turmoil, may have implicationsfor BoP. Private transfers continued to remainbuoyant.
II.6.29 Financing of CAD for 2011-12 may not posea problem as it is unlikely to be high. However, thepublic debt fragilities in the Euro Zone and the growthslow down in the US may impact capital flows. Theinward FDI flows are likely to be much larger during2011-12 taking into account the proposals cleared andthe initial trend available up to June 2011. With regardto portfolio flows they could be volatile, though Indiais likely to remain one of the preferred destinationsdue to the differential growth rates. The debt flowsmay be supported by interest rate differential.Therefore, the BoP situation remains manageable,though it necessitates continuous monitoring due tothe global uncertainties.
Chart II.55: External Debt Indicators
0
5
10
15
20
25
2005-06 2006-07 2007-08 2008-09 2009-10 PR
2010-11 P
Per
cen
t
0
50
100
150
200
250
300
350
US
$billion
Total External Debt (RHS) Total Debt to GDPDebt Service Ratio Short-Term to Reserves
Short-Term to Total Debt

72
III.1 The monetary policy stance in 2010-11changed course during the year, from calibratednormalisation to tightening driven by inflationconcerns. Liquidity conditions remained consistentwith the shift in monetary policy stance, though someof the key determinants of liquidity remained volatile.The cumulative effect of transient factors (such asadvance tax collections), frictional factors (largegovernment surplus balances) and structural factors(i.e., high increase in currency in circulation and highercredit growth relative to deposit growth) culminatedin large deficit liquidity conditions, which weremanaged by the Reserve Bank through anappropriate mix of SLR, OMO and LAF.
III.2 A number of steps were taken during 2010-11to enhance the communication of monetary policy.The Reserve Bank introduced mid-quarter reviewsduring the year. Another notable development during2010-11 was the introduction of the Base Rate systemwhich replaced the Benchmark Prime Lending Rate(BPLR) with effect from July 2010. This helped inimproving the assessment of the transmission ofmonetary policy (Box III.1).
Role of communication in monetary policy
III.3 Monetary policy acts on its ultimate objectivesof price stability and growth with long and variablelags. Given these lags in monetary transmission,effective communication of monetary policyobjectives, rationale for policy actions and expectedoutcomes is critical. Effective communication alongwith appropriate monetary actions can help anchorinflation expectations. Like other central banks, theReserve Bank has also placed a lot of emphasis oneffective communication of its policy objectives. Thestance of monetary policy and the rationale arecommunicated to the public in a variety of ways –periodic monetary policy statements, otherpublications, speeches by the top management andpress releases. In order to further enhance the efficacyof the communication process, a number of stepshave been taken in the recent period. FromSeptember 2010, the Reserve Bank introduced Mid-Quarter Reviews (MQRs) to combine the rigour andcomprehensiveness of the quarterly process with theneed for flexibility to respond in a fast evolving globaland domestic macroeconomic situation.
THE ANNUAL REPORT ON THE WORKING OF THE RESERVE BANK OF INDIA
PART TWO: THE WORKING AND OPERATIONS OFTHE RESERVE BANK OF INDIA
III MONETARY POLICY OPERATIONS
In balancing the twin objectives of price stability and growth, the conduct of monetary policy was conditioned by theshift in policy challenge from “management of recovery” to “management of inflation”. During the first half of2010-11, policy was geared towards non-disruptive normalisation of the monetary policy stance, which supportedconsolidation of growth. Inflation stayed elevated, but the sources of inflationary pressures warranted cautiouscalibration of the normalisation process. The anti-inflation accent of monetary policy became stronger during thesecond half of the year, as the inflation process became generalised and sticky in an environment of strong growth.Furthering transparency about the monetary policy process, minutes of the meetings of the Technical AdvisoryCommittee on Monetary Policy are now being released in the public domain. The operating framework for monetarypolicy was modified in May 2011, with the switchover to repo rate as the single policy rate for better signalling thestance of monetary policy.

MONETARY POLICY OPERATIONS
73
Box III.1Monetary Policy Transmission after the Switchover to Base Rate
The Benchmark Prime Lending Rate (BPLR), introduced in2003, was expected to serve as the benchmark rate forpricing of loan products by reflecting the actual cost of fundsfor banks. The BPLR system, however, fell short of its originalobjective of bringing transparency to lending rates. This wasmainly because banks could lend below the BPLR underthe system. The share of sub-BPLR lending (excluding exportcredit and small loans) of SCBs was as high as 77 per centin September 2008, before dropping to 70 per cent, whichwas still very high, during the quarter ended June 2010. Asa result, it was difficult to assess the transmission of policyrates of the Reserve Bank to lending rates of banks.
In order to address these concerns, the Reserve Bankannounced the constitution of a Working Group (Chairman:Shri Deepak Mohanty) in the Annual Policy Statement of2009-10 to review the BPLR system and suggest changesto make credit pricing more transparent. The Working Groupsubmitted its Report in October 2009 and based on therecommendations of the Group and the suggestions fromvarious stakeholders, the Reserve Bank issued guidelineson the Base Rate system in April 2010. The system of BaseRate, that came into effect on July 1, 2010, replaced theBPLR system.
Under the new system, the actual lending rate charged toborrowers is the Base Rate plus borrower-specific charges.The Base Rate is the minimum rate for all loans and banksare not permitted to resort to any lending below the BaseRate except some specified categories such as:(a) Differential Rate of Interest (DRI) advances, (b) loans tobanks’ own employees, (c) loans to banks’ depositors againsttheir own deposits, (d) interest rate subvention given bygovernment to agricultural loans and rupee export credit,and (e) some specific cases of restructured loans. Theinterest rates on small loans up to `2 lakh and rupee exportcredit have been deregulated to increase the flow of creditto small borrowers and exporters at reasonable rates. Withthese measures, the Reserve Bank achieved completederegulation of interest rates relating to rupee lending bycommercial banks. The Base Rate system was expected tofacilitate better pricing of loans, enhance transparency inlending rates and improve the assessment of thetransmission of monetary policy. Though the experience sofar is limited, it suggests that these objectives have beenlargely met.
The Reserve Bank has increased the repo rate by 325 basispoints (bps) since mid-March 2010. The effective tighteningof the policy rate has, however, been of the order of 475 bpsas the system migrated from surplus mode to deficit mode.In response, Base Rates have been raised by 75-375 bps
between July 2010 and August 11, 2011 (Table 1). The rangeof increase was, however, much narrower, i.e., 175-375 bpsfor 49 major banks.
Table 1: Variation in Policy Rate of the Reserve Bankand Deposit/Lending Rates of SCBs
(bps)
Period Increase in Increase in Increase inRepo Deposit Lending RateRate Rates Base Rate BPLR
Mid-March 2010 to Not NoMay 2010 50 25-160 Applicable Change
June 2010 toAugust 11, 2011 275 25-550 75-375 100-375
It has been observed that there is greater convergenceamongst banks in fixing the Base Rate over time vis-a-visunder the BPLR system. As a result, the Base Rate systemis found to be more transparent and more responsive to hikesin policy rates by the Reserve Bank compared to the BPLRsystem. This is reflected in the average increase in the BaseRate by public and private sector banks since July 2010. Itis seen that the pace of increase in Base Rate in responseto increase in policy rate was initially slower but picked upmomentum during December 2010-February 2011. Also, thenumber of days taken by these banks to raise their BaseRates went down during this period (Table 2). However,following gradual moderation in the growth of non-food credit,the pace of increase in Base Rate relative to that of the reporate slowed down from February 2011 onwards, while thenumber of days taken to raise the Base Rate also increased.
Table 2: Extent of Increase in Base Rate and TimeTaken by Public/Private Sector Banks
Period Increase Average Average(Month over in Repo increase in no. of daysMonth) Rate (bps) Base Rate taken to raise
(bps) Base Rate
Dec.10/July 10 75 58 140
Feb.11/Dec.10 25 65 74May 11/Feb.11 75 64 88August 11, 11/May 11 125 69 87
Thus, not only has there been a larger degree of convergenceof the Base Rates across banks, they have also becomemore responsive to increase in policy rates of the ReserveBank. As a result, the assessment of the transmission ofmonetary policy has strengthened under the new system,from that under the BPLR system.
III.4 Steps taken to strengthen the existing two-waycommunication process include webcasting of theGovernor’s press conference and interaction withresearchers/analysts on monetary policy after the
quarterly reviews. Audio recordings and transcriptsof the press conference and the teleconference withresearchers/analysts are also put on the ReserveBank’s website.
ANNUAL REPORT
74
III.5 As a part of its communication policy andgiven the objective of more transparency, theReserve Bank is endeavouring to put in publicdomain all data/inputs that go into the formulationof monetary policy. Accordingly, the main points ofdiscussion in the meetings of the Technical AdvisoryCommittee (TAC) on Monetary Policy are beingplaced on the website, roughly four weeks after themeeting of the Committee. The first such releasewas in February 2011 of the TAC meeting in January2011.
Introduction of mid-quarter reviews
III.6 Most major central banks make frequentmonetary policy announcements ranging from 8 to12 announcements a year. Monetary and credit policywas traditionally reviewed by the Reserve Bank twicea year. Over time, a need was felt to increase thefrequency of the policy communication and the AnnualPolicy Statement of 2005-06 announced theintroduction of more frequent reviews of monetarypolicy, at quarterly intervals. The proposed quarterlyreviews of monetary policy were intended to providethe opportunity for structured communication withmarkets on a more frequent basis, while retaining theflexibility to take specific measures warranted byevolving circumstances.
III.7 The gap of a quarter between policy reviewswas felt too long in a rapidly evolving macroeconomicsituation. There were several occasions (April, Juneand September-December 2008; January and March2009; March and July 2010) when the Reserve Bankhad to take policy actions in response tomacroeconomic developments. While theseinstances questioned the discipline of the quarterlyschedule, they also underscored the need forflexibility.
III.8 Accordingly, the First Quarter Review ofMonetary Policy for July 2010 announced theintroduction of MQRs. By instituting MQRs, theReserve Bank intended to take the surprise elementout of the off-cycle actions. The Reserve Bank,however, reserves the flexibility to take swift and pre-emptive policy actions, as and when warranted by
the evolving macroeconomic developments. It wasdecided to announce the MQRs in June, September,December and March by way of a press release,providing a rationale for either action or maintenanceof the status quo. The first MQR was announced inSeptember 2010.
III.9 Unlike the Quarterly Reviews, the MQRs wereintended to be a less intensive process. In the run upto the MQRs, there are no pre-policy consultationswith the stakeholders from the financial market andthe industry. However, there is a process of consultingthe members of the TAC. In order to take the adviceof the TAC members in the run up to the MQRs, theReserve Bank has instituted a mechanism to obtainthe views of the members through a structuredfeedback format.
MONETARY POLICY OPERATIONS:CONTEXT AND RATIONALE
III.10 The monetary policy stance in 2010-11evolved in line with changing domestic growth-inflationdynamics. In the first half of 2010-11, the thrust ofmonetary policy was on avoiding policy impedimentsto the recovery amidst global uncertainties, while alsocontaining inflationary pressures. Headline inflation,which touched double digits in the first quarter of 2010-11, showed moderation in the second quarter of theyear, but remained above the comfort zone of theReserve Bank. Food inflation remained high onaccount of structural demand-supply imbalancesdespite normal monsoons. Though non-foodmanufactured products inflation declined from theelevated levels seen at the start of the year, itremained sticky and above its medium term trend.Considering global uncertainties and associatedimplications for domestic growth and the fact thatinflation was largely driven by supply side factors, theReserve Bank followed calibrated normalisation ofpolicy (Table III.1).
III.11 In the second half of 2010-11, while growthcontinued to consolidate, the moderating path ofinflation reversed beginning December 2010 due toa series of supply side shocks, both domestic and

MONETARY POLICY OPERATIONS
75
global. Food prices registered sharp increases inDecember 2010 and January 2011 followingunseasonal increase in vegetable prices. The sharpincrease in global prices of raw cotton and rubber,
metals and minerals were transmitted quickly to thedomestic markets during the second half of the year.Even as mineral oil price inflation showed an uptick,it was less than the extent of the global crude priceinflation as the administered mineral oil pricesremained unchanged. Robust demand conditions sawinput price pressures being increasingly transmittedto final output prices and rising core inflation. It was,therefore, crucial to ensure that the elevatedinflationary expectations did not get entrenched.Hence, towards the end of 2010-11, monetary policystance underwent a shift as the Reserve Bankdeviated from the calibrated approach and tookstronger monetary policy measures. This waswarranted to ensure that the long-term growthprospects were not harmed, even if it meant sacrificingsome growth in the short-term (Table III.2).
III.12 Based on the Report of the Working Group toReview the Operating Procedures of Monetary Policyin India (Chairman: Shri Deepak Mohanty) and in thelight of the feedback received, changes relating tooperating procedures of monetary policy wereannounced in the Monetary Policy Statement for 2011-12 (Box III.2).
Table III.1: Movements in Key Policy Rates andReserve Requirements in India
(Per cent)
Effective since Reverse Repo Rate Cash MarginalRepo Rate Reserve Ratio Standing
Facility Rate
1 2 3 4 5
February 13, 2010 3.25 4.75 5.50 (+0.50) -February 27, 2010 3.25 4.75 5.75 (+0.25) -March 19, 2010 3.50 (+0.25) 5.00 (+0.25) 5.75 -April 20, 2010 3.75 (+0.25) 5.25 (+0.25) 5.75 -April 24, 2010 3.75 5.25 6.00 (+0.25) -July 2, 2010 4.00 (+0.25) 5.50 (+0.25) 6.00 -July 27, 2010 4.50 (+0.50) 5.75 (+0.25) 6.00 -September 16, 2010 5.00 (+0.50) 6.00 (+0.25) 6.00 -November 2, 2010 5.25 (+0.25) 6.25 (+0.25) 6.00 -January 25, 2011 5.50 (+0.25) 6.50 (+0.25) 6.00 -March 17, 2011 5.75 (+0.25) 6.75 (+0.25) 6.00 -May 3, 2011 6.25 (+0.50) 7.25 (+0.50) 6.00 8.25*June 16, 2011 6.50 (+0.25) 7.50 (+0.25) 6.00 8.50 (+0.25)July 26, 2011 7.00 (+0.50) 8.00 (+0.50) 6.00 9.00 (+0.50)
Note: 1. Reverse repo indicates absorption of liquidity and repo indicatesinjection of liquidity.
2. Figures in parentheses indicate change in policy rates in per cent.* : Marginal Standing Facility is with effect from May 9, 2011.
Table III.2: Monetary Policy Reviews
Monetary Policy Statement 2010-11Backdrop:• Broad-based recovery taking firm hold with rising domestic
and external demand.• Inflation pressures, initially driven by food prices, becoming
more generalized.• Corporates regaining pricing power in many sectors.• Inflation expectations of the households at elevated level.Baseline Projection/Indicative Trajectory:• 8.0 per cent real GDP growth (with an upside bias) during
2010-11.• 5.5 per cent WPI inflation for March 2011.• 17.0 per cent, 18.0 per cent and 20.0 per cent growth in M3,
aggregate deposits and non-food credit, respectively, during2010-11.
Measures:• Increase in repo rate, reverse repo rate and CRR by 25 basis
points each.Expected Outcome:• Contain inflation and anchor inflationary expectations.• Sustain the recovery process.• Meet government borrowing requirements and the private
credit demand.• Align policy instruments in a manner consistent with the
evolving state of the economy.
Mid-Cycle Policy Measure: July 2, 2010Backdrop:• Double-digit headline inflation levels.• Petrol prices were decontrolled and prices of remaining
administered fuel such as diesel, LPG and kerosene wereincreased in end-June 2010.
Measures:• Increase in repo rate and reverse repo rate by 25 basis points
each (with the LAF window having moved to deficit modefrom end-May 2010, effective tightening of 175 basis points).
First Quarter Review of Monetary Policy 2010-11Backdrop:• Growth process registered further momentum during Q1 of
2010-11.• Overall food inflation at elevated level.• Rise in administered prices of iron ore and electricity.• Non-food manufactured products inflation much higher than
the medium-term trend.Baseline Projection/Indicative Trajectory:• 8.5 per cent real GDP growth during 2010-11.• 6.0 per cent WPI inflation for March 2011.Measures:• Increase in repo rate and reverse repo rate by 25 basis points
and 50 basis points, respectively. (Contd...)

ANNUAL REPORT
76
Mid Quarter Review: September 2010• Inflation continued to be the dominant concern for policy.• Increase in repo rate and reverse repo rate by 25 basis points
and 50 basis points, respectively.
Second Quarter Review of Monetary Policy 2010-11Backdrop:• Normal monsoons raised the prospects of good Kharif
cultivation.• Quarterly industrial outlook survey showed improvement in
the overall business conditions.• Moderation in food inflation not commensurate with a normal
monsoon, due to continued elevated prices of protein-richfood items.
• Non-food primary articles, specifically fibres registeredsignificant inflation.
Baseline Projection/Indicative Trajectory:• 8.5 per cent real GDP growth during 2010-11.• 5.5 per cent WPI inflation (under the new base) for March
2011, equivalent to 6.0 per cent inflation under the old base.Measures:• Increase in repo rate and reverse repo rate by 25 basis points
each.Expected Outcome:• Sustain the anti-inflationary thrust of the recent monetary
actions and outcomes in the face of persistent inflation risk.• Rein in rising inflationary expectations that could be
aggravated by the structural nature of food price increases,while not disrupting growth.
Mid Quarter Review: December 2010• Management of liquidity came to the forefront of policy
concerns, following the excessive tightness in money markets.• The SLR of SCBs was reduced from 25 per cent of their NDTL
to 24 per cent with effect from December 18, 2010.• Staggered OMO auctions for purchase of government
securities for an aggregate amount of `48,000 croreannounced.
• These measures were expected to release sizeable primaryliquidity into the system, bringing down the liquidity deficit inthe system close to the comfort zone of the Reserve Bankwhile stabilising interest rates in the overnight inter-bankmarket closer to the operative policy rate of the Reserve Bank.
Third Quarter Review of Monetary Policy 2010-11Backdrop:• Real GDP increased by 8.9 per cent during the first half of
2010-11, reflecting strong domestic demand, especiallyprivate consumption and investment, and improving externaldemand.
• Series of commodity price shocks – vegetable prices, crudeoil prices.
Baseline Projection/Indicative Trajectory:• 8.5 per cent real GDP growth (with an upside bias) during
2010-11.• 7.0 per cent WPI inflation for March 2011.Measures:• Increase in repo rate and reverse repo rate by 25 basis
points each.
Mid Quarter Review: March 2011• Inflation pressures accentuated further after January 2011.• Inflation estimated at around 8 per cent for March 2011.• Increase in repo rate and reverse repo rate by 25 basis points
each.
Monetary Policy Statement 2011-12Backdrop:• Very sharp rise in inflation and elevated inflationary
expectations.• Rise in inputs costs quickly passed on to domestic
manufactured goods.• Signs of moderation in growth particularly investment
spending.• Rise in administered coal prices in end-February 2011.Baseline Projection/Indicative Trajectory:• 8.0 per cent real GDP growth during 2011-12.• 6.0 per cent WPI inflation (with an upward bias) for March
2012.• 16.0 per cent, 17.0 per cent and 19.0 per cent growth in M3,
aggregate deposits and non-food credit of SCBs, respectively.Measures:• Repo rate increased by 50 basis points to 7.25 per cent.• Reverse repo rate, determined with a spread of 100 basis
points below the repo rate, automatically adjusted to 6.25per cent.
• Marginal Standing Facility (MSF) rate, determined with aspread of 100 basis points above the repo rate, fixed at 8.25per cent.
• Interest rate on savings bank deposit rate increased from 3.5per cent to 4.0 per cent.
Expected Outcome:• Contain inflation by reining in demand-side pressures.• Anchor inflationary expectations and sustain the growth in
the medium-term by containing inflation.
Mid Quarter Review: June 2011• The monetary policy stance remains anti-inflationary.• Repo rate increased by 25 basis points.
First Quarter Review of Monetary Policy 2011-12Backdrop:• Some moderation underway in industrial production.• Prospects of agriculture not clear.• Continued high level of inflation.• Rise in administered fuel prices in June 2011.Baseline Projection/Indicative Trajectory:• 8.0 per cent real GDP growth during 2011-12.• 7.0 per cent WPI inflation for March 2012.• 15.5 per cent and 18.0 per cent growth in M3 and non-food
credit of SCBs, respectively.Measures:• Repo rate increased by 50 basis points to 8.0 per cent.• Reverse repo rate, determined with a spread of 100 basis
points below the repo rate, automatically adjusted to 7.0 percent.
• MSF rate, determined with a spread of 100 basis points abovethe repo rate, fixed at 9.0 per cent.
(...Concld.)

MONETARY POLICY OPERATIONS
77
Asset price implications for monetary policy
III.13 In general, wealth impact is not observed tobe very significant in India. Only a small portion ofsavings, i.e., about 12 per cent of total savings of thehousehold sector in financial assets, is invested inthe equity market. In many advanced economies, theshare of such investment in total financial savings ismuch bigger. Therefore, cooling down of the equitymarket should not have any significant impact on theaggregate demand. As regards, the real estatemarket, home owners in India, unlike advancedeconomies, do not borrow against the houses alreadypurchased when their valuations go up. As such,cooling of real estate prices should also not have anysignificant impact on consumption and henceaggregate demand. Thus, asset prices do not seemto influence the inflation path and conduct of monetarypolicy may refrain from responding directly to assetprice cycles. The Reserve Bank has used both microand macro prudential measures to limit the risks tofinancial stability from asset price cycles. Monetarypolicy, as a macroeconomic policy tool, enables anenvironment in which prudential regulation worksmore effectively.
Overall Assessment
III.14 During the major part of 2010-11, the stanceof the monetary policy was for calibratednormalisation. The moderation in inflation in Q2 andQ3 of 2010-11 justified such a calibrated approach.As the LAF window of the Reserve Bank transitedfrom a surplus to a deficit mode, consistent with theReserve Bank’s anti-inflationary stance and itscalibrated approach to absorb surplus liquidity,liquidity management also became a central focus in2010-11. It had to be ensured that the primary liquidityneeds of an expanding economy were met in amanner consistent with the anti-inflationary monetarypolicy stance. Inflation pressures, however, intensifiedin Q4 of 2010-11 even as the growth process showedsome signs of moderation. The proximate cause ofthe intensification of inflationary pressure was a seriesof supply side shocks, both domestic and global,which rapidly fed into a broad spectrum ofmanufactured products. The inflation pressures andelevated inflation expectations emerged as a sourceof risk to future growth. Accordingly, the stance ofmonetary policy for 2011-12 gave foremost priority tocontaining inflation and anchoring inflation
Box III.2Changes in Operating Procedure of Monetary Policy
Background
The operating procedure of monetary policy in India haswitnessed significant changes since the beginning of the1990s with developments in money market and changes inliquidity conditions brought about by financial sector reforms.In this process, the LAF, introduced in June 2000, emergedas the principal operating procedure of monetary policy, withthe repo and the reverse repo rates as the key instrumentsfor signalling the monetary policy stance. LAF, supported byinstruments such as the CRR, OMO and MSS, had servedthe Indian monetary and financial system well. Large volatilityin capital flows and sharp fluctuations in government cashbalances, however, posed several challenges to liquiditymanagement by the Reserve Bank.
Thus, the first Quarter Review of Monetary Policy for 2010-11 proposed the need for revisiting the operating proceduresof monetary policy in India. Accordingly, on October 1, 2010,a Working Group (Chairman: Shri Deepak Mohanty) wasconstituted with members drawn from the Reserve Bank,financial market participants and the academia.
Changes in the Extant Operating Procedures of MonetaryPolicy
Based on the Group’s recommendations and the feedbackreceived, the following changes in the extant operatingprocedures of monetary policy were effected as announcedin the Monetary Policy Statement for 2011-12:
• The weighted average overnight call money rate is nowthe operating target of monetary policy.
• The repo rate has acquired the status of being the onlyone independently varying policy rate.
• A new MSF has been instituted from which SCBs canborrow overnight up to 1.0 per cent of their respectiveNDTL at 100 basis points above the repo rate.
The revised corridor has a fixed width of 200 basis points.The repo rate has been placed in the middle of the corridor,with the reverse repo rate 100 basis points below it and theMSF rate 100 basis points above it. However, the ReserveBank will have the flexibility to change the width of the corridor,should monetary conditions so warrant.
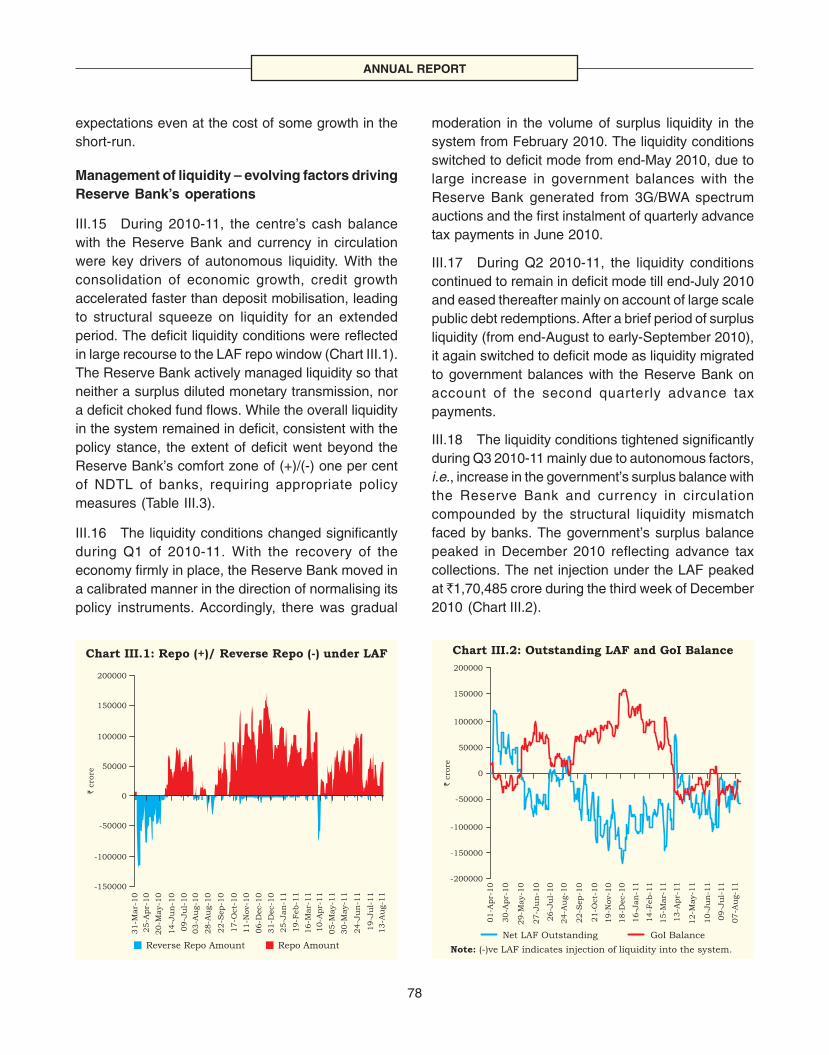
ANNUAL REPORT
78
expectations even at the cost of some growth in theshort-run.
Management of liquidity – evolving factors drivingReserve Bank’s operations
III.15 During 2010-11, the centre’s cash balancewith the Reserve Bank and currency in circulationwere key drivers of autonomous liquidity. With theconsolidation of economic growth, credit growthaccelerated faster than deposit mobilisation, leadingto structural squeeze on liquidity for an extendedperiod. The deficit liquidity conditions were reflectedin large recourse to the LAF repo window (Chart III.1).The Reserve Bank actively managed liquidity so thatneither a surplus diluted monetary transmission, nora deficit choked fund flows. While the overall liquidityin the system remained in deficit, consistent with thepolicy stance, the extent of deficit went beyond theReserve Bank’s comfort zone of (+)/(-) one per centof NDTL of banks, requiring appropriate policymeasures (Table III.3).
III.16 The liquidity conditions changed significantlyduring Q1 of 2010-11. With the recovery of theeconomy firmly in place, the Reserve Bank moved ina calibrated manner in the direction of normalising itspolicy instruments. Accordingly, there was gradual
moderation in the volume of surplus liquidity in thesystem from February 2010. The liquidity conditionsswitched to deficit mode from end-May 2010, due tolarge increase in government balances with theReserve Bank generated from 3G/BWA spectrumauctions and the first instalment of quarterly advancetax payments in June 2010.
III.17 During Q2 2010-11, the liquidity conditionscontinued to remain in deficit mode till end-July 2010and eased thereafter mainly on account of large scalepublic debt redemptions. After a brief period of surplusliquidity (from end-August to early-September 2010),it again switched to deficit mode as liquidity migratedto government balances with the Reserve Bank onaccount of the second quarterly advance taxpayments.
III.18 The liquidity conditions tightened significantlyduring Q3 2010-11 mainly due to autonomous factors,i.e., increase in the government’s surplus balance withthe Reserve Bank and currency in circulationcompounded by the structural liquidity mismatchfaced by banks. The government’s surplus balancepeaked in December 2010 reflecting advance taxcollections. The net injection under the LAF peakedat ̀ 1,70,485 crore during the third week of December2010 (Chart III.2).
Chart III.1: Repo (+)/ Reverse Repo (-) under LAF
-150000
-100000
-50000
0
50000
100000
150000
200000
cro
re`
Reverse Repo Amount Repo Amount
31-M
ar-
10
25-A
pr-
10
20-M
ay-1
0
14-J
un
-10
09-J
ul-
10
03-A
ug-1
0
28-A
ug-1
0
22-S
ep-1
0
17-O
ct-
10
11-N
ov-1
0
06-D
ec-1
0
31-D
ec-1
0
25-J
an
-11
19-F
eb-1
1
16-M
ar-
11
10-A
pr-
11
05-M
ay-1
1
30-M
ay-1
1
24-J
un
-11
19-J
ul-
11
13-A
ug-1
1
Chart III.2: Outstanding LAF and GoI Balance
-200000
-100000
-50000
0
50000
100000
150000
200000
cro
re`
Net LAF Outstanding GoI Balance
-150000
01-A
pr-
10
30-A
pr-
10
29-M
ay-1
0
27-J
un
-10
26-J
ul-
10
24-A
ug-1
0
22-S
ep-1
0
21-O
ct-
10
19-N
ov-1
0
18-D
ec-1
0
16-J
an
-11
14-F
eb-1
1
15-M
ar-
11
13-A
pr-
11
12-M
ay-1
1
10-J
un
-11
09-J
ul-
11
07-A
ug-1
1
Note: (-)ve LAF indicates injection of liquidity into the system.

MONETARY POLICY OPERATIONS
79
Table III.3:Liquidity Management Measures taken by the Reserve Bank in 2010-11
Time Period/Event
1
End-May 2010 : Larger thananticipated collection from 3G/BWAspectrum auctions in addition toadvance tax outflows resulted inmigration of liquidity to centralgovernment’s cash balance accountwith the Reserve Bank
End-October 2010 : Frictional liquiditypressure due to autonomous factors
Mid-December 2010 : Continued buildup in government balances onaccount of third quarterly advance taxcollections
End-January 2011: Frictional andstructural liquidity pressure
Measures
2
For the period May 28, 2010-July 2, 2010, SCBs were :
(i) Allowed to avail additional liquidity support under the LAF to the extent of up to0.5 per cent of their NDTL (for any shortfall in maintenance of SLR arising out ofavailment of this facility, banks were allowed to seek waiver of penal interest).
(ii) Given access to second LAF (SLAF) on a daily basis. With the persistence ofdeficit liquidity conditions, measure (i) was extended up to July 16, 2010 andmeasure (ii) up to July 30, 2010.
(i) The Reserve Bank conducted special SLAF on October 29 and November 1,2010, a special two-day repo auction under the LAF on October 30, 2010, andallowed waiver of penal interest on shortfall in maintenance of SLR (on October30-31, 2010) to the extent of 1.0 per cent of NDTL for availing additional liquiditysupport under the LAF.
(ii) The Reserve Bank extended these liquidity easing measures further andconducted SLAF on all days during November 1-4, 2010 and extended theperiod of waiver of penal interest on shortfall in maintenance of SLR (to theextent of 1.0 per cent of NDTL) for availing additional liquidity support under theLAF till November 7, 2010.
(iii) The Reserve Bank purchased government securities under OMO from November4, 2010.
(iv) On November 9, 2010, the Reserve Bank reintroduced daily SLAF and extendedthe period of waiver of penal interest on shortfall in maintenance of SLR to theextent of 1.0 per cent of NDTL for availing additional liquidity support under theLAF till December 16, 2010.
(v) On November 29, 2010, the Reserve Bank extended the daily SLAF and allowedadditional liquidity support to the SCBs under the LAF to the extent of up to 2.0per cent of their NDTL till January 28, 2011.
In the MQR, the Reserve Bank:
(i) Reduced the SLR of SCBs from 25 per cent of NDTL to 24 per cent with effectfrom December 18, 2010. Given the permanent reduction in the SLR, additionalliquidity support of 1.0 per cent of NDTL was made available from December18, 2010 to January 28, 2011.
(ii) Announced conduct of OMO auctions for purchase of government securitiesfor an aggregate amount of `48,000 crore over the next one month (staggeredas purchases of `12,000 crore per week).
In the Third Quarter Review of January 2011, the Reserve Bank extended the dailySLAF and additional liquidity support to SCBs of 1.0 per cent of NDTL under the LAFtill April 8, 2011.
Subsequently, both the measures were extended till May 6, 2011.
III.19 At the start of Q4 2010-11, injections underthe LAF declined marginally due to the cumulativeimpact of decline in surplus balances of the Centreand staggered OMO carried out by the Reserve Bankin December 2010-January 2011. During 2010-11, theReserve Bank purchased government securities foran aggregate amount of about `67,000 crore under
OMO auctions. The liquidity conditions improvedfurther in February 2011 with the decline in the surplusbalances of the Centre. Notwithstanding the quarterlyadvance tax outflows during mid-March 2011, theliquidity deficit remained controlled on account ofhigher government expenditure during the month.Thus, the quantum of liquidity deficit declined in Q4

ANNUAL REPORT
80
as compared with Q3, mainly on account ofthe Reserve Bank’s OMO purchases and thedecline in government cash balances with theReserve Bank.
III.20 The current financial year began with liquidityremaining in absorption mode in the first week ofApril 2011 on account of high governmentexpenditure and the absence of normal governmentsecurities auctions. The liquidity conditions againshifted to injection mode from the second week ofApril 2011. The average daily net liquidity injectiondeclined significantly to about `19,000 crore duringApril 2011 from about `81,000 crore in March 2011.While the negative government balance with theReserve Bank added liquidity into the system, theincreasing currency with the public acted in theopposite direction during the month. The liquidityconditions tightened further in May 2011 as the gapbetween pace of credit growth and depositmobilisation by banks, which had been narrowingfrom end-December 2010, reversed trend andincreased in May 2011. There was also a decline inWMA/OD availed by the government.
III.21 The liquidity conditions remained in deficitmode in June 2011 due to quarterly advance taxoutflows. The average daily net liquidity injectionincreased further to around `74,000 crore. Theliquidity conditions improved at the beginning of July2011 partly on account of redemption of a securitywith outstanding stock of `37,000 crore. The liquiditydeficit, however, increased subsequently and theaverage daily net liquidity injection was around`44,000 crore during July 2011. The average dailynet liquidity injection under the LAF was around`37,000 crore during August 1-16, 2011. Up tomid-August 2011, availment of funds under the MSF,which came into operation in May 2011, has happenedonly twice.
III.22 As the main drivers of liquidity conditionsvaried from quarter to quarter as discussed above,the Reserve Bank had to manage liquidity activelywhile avoiding any possible conflict with the monetarypolicy stance. Persistence of inflation at elevated levelwas a key challenge for monetary policy, despiteevidence of strengthening monetary policytransmission.

81
IV.1 Credit delivery in a country as diverse as Indiaposes many a challenge including bringing thosesections of society that are financially excluded intothe ambit of formal financial system, providingfinancial literacy, reforming credit deliverymechanisms, among others. The Reserve Bank ofIndia continued with its various initiatives in this areasuch as rolling out the Financial Inclusion Plans (FIP),encouraging multiple channels of lending andenhancing the scope of the Business Correspondent(BC) model, improving credit delivery procedures inmicro and small enterprises (MSE) sectors andencouraging adoption of Information andCommunication Technology (ICT) solutions.
PRIORITY SECTOR LENDING
IV.2 The focus of priority sector lending is toenhance credit facilities for those priority sectors thatimpact large sections of the population, the weakersections and the sectors which are employmentintensive such as agriculture and micro and smallenterprise (MSE). As on the last reporting Friday ofMarch 2011, 15 out of 81 banks had not achieved thepriority sector lending target (Table IV.1).
IV.3 Scheduled commercial banks (SCBs) havingshortfall in lending to priority sector/subsectors vis-a-vis the stipulated targets, will be required to contributeto the corpus of Rural Infrastructure DevelopmentFund (RIDF) and similar funds set up with NationalBank of Agriculture and Rural Development(NABARD) / Small Industries Development Bank of
India (SIDBI) / National Housing Bank (NHB). Thecorpus of such funds are announced every year bythe Government of India.
IV.4 The Union Budget 2011-12 announced to setup RIDF XVII (corpus of ̀ 18,000 crore of which ̀ 2,000crore will be dedicated to creation of warehousingfacilities), Short Term Co-operative Rural Credit(STCRC) (Refinance) Fund (corpus of ̀ 10,000 crore),Micro, Small and Medium Enterprise (MSME)(Refinance) Fund (corpus of `5,000 crore), and RuralHousing Fund (corpus of ̀ 3,000 crore) with NABARD,SIDBI, NHB, respectively during the year.
Flow of Credit to Agriculture Sector
IV.5 The Government had announced a target of`3,75,000 crore for flow of agricultural credit in 2010-
Financial inclusion is an important process to attain the goal of inclusive growth. Accordingly, the Reserve Bank ofIndia has made sustained efforts to increase the penetration of formal financial services in unbanked areas, whilecontinuing with its policy of ensuring adequate but viable flow of credit to priority sectors of the economy. Financialliteracy efforts of the Reserve Bank, particularly the outreach programme, generated significant interest and exuberantparticipation from public and banks/ financial institutions. Regulatory actions to further financial inclusion includedchanges in KYC norms, relaxing branch authorization policy, widening eligible entities to function as businesscorrespondents, and requiring minimum percentage of additional branches to be opened in unbanked rural centres.
IV CREDIT DELIVERY ANDFINANCIAL INCLUSION
Table IV.1: Priority Sector Advances(Amount in ` crore)
Public Sector Private Sector ForeignBanks Banks Banks
1 2 3 4
2010* 8,63,777 2,14,669 59,960
(41.6) (45.8) (36.0)
2011* 10,22,925 2,49,139 66,796
(41.0) (46.7) (39.1)
Notes: 1. * : As on the Last Reporting Friday of March.2. Figures in brackets are percentages to ANBC or credit
equivalent of OBE, whichever are higher as on March31 of the previous year, in the respective groups.
3. The target for aggregate advances to the priority sectoris 40 per cent of the ANBC or credit equivalent of OBE,whichever is higher for domestic banks and 32 per centfor the foreign banks.
4. Data for 2011 are provisional.Source: Provisional data reported by banks.

ANNUAL REPORT
82
11, of which 119 per cent had been achieved by end-March, 2011(provisional) by banks including co-operative banks and regional rural banks (RRBs). Thetarget for the year 2011-12 is `4,75,000 crore fordisbursement to agriculture by all agencies. Bankshave been advised to step up direct lending toagriculture and credit to small and marginal farmers.
IV.6 The disbursements by the public sector banksto agriculture under Special Agricultural Credit Plan(SACP) for the financial year 2009-10 was at`2,07,347 crore against that of `2,04,460 crore lastyear (101.4 per cent of the projected amount) whilstthat of the private sector banks was a disbursal of`78,452 crore against the projection of `62,352crore(126 per cent of the projected amount). Disbursementsby the public sector banks under SACP for the lastthree years are as set out in Table IV.2.
IV.7 Recovery rate for direct agricultural advancesfor the year ended 2010 showed moderate declineas compared to the rise seen in the previous year(Table IV.3).
IV.8 For the year 2010-11, the Governmentlowered the rate of interest subvention for short-term
production credit up to `3 lakh to 1.5 per cent whilethe additional interest subvention for prompt payingfarmers was raised to 2 per cent; accordingly theeffective interest rate charged to such farmers is likelyto come down to 5 per cent per annum.
IV.9 As per the reimbursement schedule forAgricultural Debt Waiver and Debt Relief Scheme,the Government of India released the 3rd instalmentof ̀ 11,340 crore in January 2011 of which ̀ 1,240 crorewas passed on to NABARD for reimbursement toRRBs and co-operatives and the remainderamount (`10,100 crore) was utilised for reimbursingSCBs, local area banks (LABs) and urban co-operative banks (UCBs) (Table IV.4).
Flow of Credit to Micro, Small and MediumEnterprises (MSMEs)
IV.10 In order to study various issues relating toMSMEs, a High Level Task Force was constituted bythe Government of India (Chairman: Shri T K A Nair,Principal Secretary to the Prime Minster). SCBs wereaccordingly advised in June, 2010 to increase theirshare of lending to micro enterprises in MSE to 60
Table IV.2: Disbursements under SACP byPublic Sector Banks
(Amount in ` crore)
Year Target Achievement Percentage Annual growthof in Disbursement
Achievement (%)
1 2 3 4 5
2007-08 1,52,133 1,33,226 87.6 8.82008-09 1,59,470 1,65,198 103.3 24.02009-10 2,04,460 2,07,347 101.4 26.02010-11* 2,29,709 2,05,367 89.4 -0.95
*: Data are provisional.
Table IV.3: Recovery of Direct AgriculturalAdvances
(Amount in ` crore)
Year ended Demand Recovery Overdues PercentageJune of recovery
to demand
1 2 3 4 5
2008 95,100 71,739 23,361 75.42009 1,19,084 90,660 28,425 76.12010* 92,905 68,665 24,240 73.9
*: Data are provisional.
Table IV.4: Compensation of lending institutions under Agricultural Debt Waiver andDebt Relief Scheme, 2008
(Amount in ` crore)
Lending Institutions Proposed Reimbursement*
1st instalment 2nd instalment 3rd instalment 4th instalmentSep-08 Jul-09 Jul-10 Jul-11
1 2 3 4 5
RRBs and Co-operatives 17,500 10,500 2,800 Balance amount, if any
SCBs, UCBs and LABs 7,500 4,500 9,200 Balance amount, if any
Total 25,000 15,000 12,000 Balance amount
*: Based on the current provisional estimates.

CREDIT DELIVERY AND FINANCIAL INCLUSION
83
per cent in three stages (viz., 50 per cent in the year2010-11, 55 per cent and 60 per cent in thesubsequent years) with 10 per cent annual growth inthe number of micro enterprise accounts and also 20per cent year-on-year growth in MSE lending. Asuitable format has been devised by the ReserveBank to capture and closely monitor the achievementof these targets by banks on a half yearly basis i.e.,in March and September.
IV.11 The Union Budget 2011-12 proposed toliberalise the existing scheme of interest subventionof 1 per cent on housing loans by extending it up to`15 lakh where the cost of the house does not exceed`25 lakh from the present limit of `10 lakh and `20lakh, respectively. Accordingly, necessary instructionswere issued to all SCBs (excluding RRBs) on April21, 2011.
IV.12 Reflecting the revival in demand conditionsin 2010-11, the total credit to MSE from the SCBsincreased by 33.7 per cent during the year (Table IV.5).
IV.13 Based on the recommendations of the TaskForce on Revival of Rural Co-operative CreditInstitutions (Chairman: Prof. A. Vaidyanathan) theGovernment of India ,in consultation with StateGovernments, had approved a package for revival ofthe short-term rural cooperative credit structure (STCCS), consisting of Primary Agricultural CreditSocieties (PACS) at the village/base level, central co-operative banks (CCBs) at the intermediate level andthe state co-operative banks (StCBs) at the apex level.Aside from aiming at reviving the ST CCS to make itan efficient medium to serve the credit needs of ruralIndia, especially the small and marginal farmers, the
package also seeks to (i) provide financial assistanceto bring the system to an acceptable level of health;(ii) introduce legal and institutional reforms necessaryfor its democratic, self reliant and efficient functioning;and (iii) take measures to improve the quality ofmanagement.
IV.14 The twenty-five states willing to participatewere required to enter into a Memorandum ofUnderstanding (MoU) with the Central Governmentand NABARD. This covers more than 96 per cent ofthe ST CCS units in the country. Also, twenty onestates have amended their respective StateCooperative Societies Act through legislative process.
IV.15 An aggregate amount of `8,993 crore hasbeen released by NABARD (up to end-June, 2011)towards Government of India’s share forrecapitalisation of PACS in 16 states while the StateGovernments have also released their share of `854crore. The implementation of the revival package onan all India basis is supervised by the NationalImplementing and Monitoring Committee, set up bythe Government of India.
IV.16 The Reserve Bank regulates StCBs anddistrict central co-operative banks (DCCBs) under theBanking Regulation Act, 1949 (AACS), while theNABARD supervises them. Subsequent to theissuance of revised guidelines (in consultation withNABARD) in October 2009 on licensing of StCBs/DCCBs, 10 StCBs and 160 DCCBs have beenlicensed taking the total number of licensed StCBsand DCCBs to 24 and 235 respectively, as at end-June, 2011.
IV.17 With a view to liberalizing the branch licensingfor RRBs, they were allowed to open branches in Tier3 to Tier 6 centres as identified in the Census 2001(with population up to 49,999), without having theneed to take permission from the Reserve Bank ineach case, subject to reporting, provided they fulfillcertain conditions. Accordingly, instructions wereissued to all RRBs and their sponsor banks inNovember 2010.
IV.18 The Working Group of TechnologyUpgradation in RRBs (Chairman: Shri G.Srinivasan)
Table IV.5: Credit to MSE Sector by SCBs
Outstanding credit to MSE MSE/SSI credit No. of Accounts Amount as per cent
(in Million) (in ` crore) of ANBC
1 2 3 4
2010 8.5 3,62,291 13.4 (41.4) 2011* 9.3 4,84,473 9.9 (33.7)
*: As on the Last Reporting Friday of March.Note: 1. Figures in parantheses indicate per cent growth in credit
over the previous year.2. Data for 2011 are provisional.

ANNUAL REPORT
84
had recommended that Core Banking Solution (CBS)should be fully implemented in all RRBs by September2011. As on date, CBS has been fully implementedin 45 out of the total 82 RRBs, while it is in progressin the remainder.
FINANCIAL INCLUSION
IV.19 Financial inclusion broadly refers to theprocess of ensuring access to appropriate financialproducts and services needed by vulnerable groupssuch as the weaker sections and low income groupsat an affordable cost, in a fair and transparent mannerby mainstream institutional players. Despite
widespread expansion of the banking sector, asignificant proportion of the households, especiallyin rural areas, remain outside the coverage of theformal banking system. The proportion of ruralresidents who lack access to bank accounts is about40 per cent, and this rises to over three-fifths in theeastern and north-eastern regions of India.
IV.20 Moving towards universal financial inclusionhas been a policy priority for the Reserve Bank overthe last few years since financial inclusion becomesa critical financial component for ensuring sustainableand equitable economic growth (Box IV.1).
Inclusive growth as a strategy of economic development hasreceived renewed attention in recent years owing to risingconcerns that the benefits of economic growth have not beenequitably shared. Growth is inclusive when there is equalityof economic opportunities. Financial inclusion makes growthbroad based and sustainable by progressively encompassingthe hitherto excluded population. Financial inclusion is nolonger a policy choice but a policy compulsion.
Banks and other financial services players are expected tomitigate the supply side bottlenecks that hinder the poor anddisadvantaged social groups from gaining access to thefinancial system. Empirical evidence suggests that accessto financial products is constrained by several factors whichinclude: lack of awareness about the financial products,unaffordable products, high transaction costs, and productswhich are inconvenient, inflexible, not customised and of lowquality. Microfinance and financial literacy play pivotal rolesin addressing these issues.
Empirical evidence shows that countries with large proportionof population excluded from the formal financial system alsoshow higher poverty ratios and higher inequality. Theinclusive growth country analytics has a distinct characterfocusing on the pace and pattern of growth. Rapid pace ofgrowth is unquestionably necessary for substantial povertyreduction, but for this growth to be sustainable in the longrun, it should be broad-based across sectors, and include alarge part of the country’s labour force. This analytics ofinclusive growth implies a direct link between the macro andmicro determinants of growth.
The main instrument for a sustainable and inclusive growthis productive employment. Against this backdrop, studiesbased on application of the Tobit model on national-levelcross-sectional household data for 2001 on the Indianeconomy show a highly significant positive relationshipbetween productive loan amount and households povertyafter controlling for socio-economic characteristics. Panel
Box IV.1Financial Inclusion and Inclusive Growth: What the Empirical Evidence Suggests?
data studies of Bangladesh observe that access tomicrofinance contributes to poverty reduction, especially forfemale participants. Cross country studies on factorsassociated with financial inclusion show that the level ofhuman development and that of financial inclusion arepositively correlated, barring a few exceptions.
Some of the important factors determining the level offinancial inclusion in a country are per capita GDP, incomeinequality, adult literacy and urbanisation. Further, physicaland electronic connectivity and information availability suchas telephone and internet usage also play positive role inenhancing financial inclusion.
The estimated values of a Financial Inclusion Index, byMehrotra et al (2009) at the state and district levels for India,indicate that there has been a relative improvement in thestatus of financial inclusion between 2002 and 2006 with thenumber of districts in the lowest grade declining from 378 to330.
The empirical findings strengthen the argument that financialexclusion is indeed a reflection of social exclusion, ascountries having low GDP per capita, relatively higher levelsof income inequality, low rates of literacy, low urbanisationand poor connectivity appear to be less financially inclusive.Financial inclusion, therefore, assumes importance as apolicy objective.
References:
Chakrabarty, K. C. (2010), ‘‘Inclusive Growth – Role ofFinancial Sector’’, Speech at the National Finance Conclave2010.
Ianchovichina, E. and S. Lundstrom (2009), ‘‘Inclusive GrowthAnalytics: Framework and Application’’, World Bank PolicyResearch Working Paper No. 4851.
Mehrotra,N, V.Puhazhendhi, G.G.Nair, and B.B.Sahoo (2009),“Financial Inclusion – An Overview”, NABARD OccasionalPaper No. 48.

CREDIT DELIVERY AND FINANCIAL INCLUSION
85
Instruments used for strengthening delivery ofservices and assessment of their effectiveness
IV.21 Financial inclusion can be seen as a viablebusiness proposition for banks, especially so if thedelivery models aim at generating revenue rather thanbeing cost centric such that customers get qualitybanking services at their door step while simultaneouslycreating business opportunities for the banks.
IV.22 It is feasible only if delivery of services, at theminimum, includes four products: (i) a savings cumoverdraft account, (ii) a remittance product forelectronic benefits transfer and other remittances, (iii)a pure savings product ideally a recurring depositscheme, and (iv) entrepreneurial credit in the form ofGeneral-purpose Credit Card (GCC) or Kisan CreditCard (KCC).
IV.23 Reserve Bank is furthering financial inclusionwith high priority through a combination of strategiesranging from relaxation of regulatory guidelines,provision of new products and other supportivemeasures to achieve sustainable and scalablefinancial inclusion as outlined below.
A. Provision of new products
i) As of March 2011, 74.4 million No Frillaccounts have been opened by domesticcommercial banks with outstanding balanceof `6,566 crore. Basic banking No Frillaccounts have nil or very low minimumbalances as well as charges that make suchaccounts accessible to vast sections of thepopulation.
ii) With a view to encourage transactions in NoFrill accounts banks have been advised toprovide small overdrafts (ODs) in suchaccounts. Up to end March 2011, banks haveprovided 4.2 million ODs amounting to `199crore.
iii) Banks had been asked to considerintroduction of a GCC facility up to `25,000 attheir rural and semi-urban braches. Theobjective of the scheme is to provide hassle-free credit to banks’ customers based on theassessment of cash flow without insistence
on security, purpose or end-use of the credit.This is in the nature of revolving credit entitlingthe holder to withdraw up to the limitsanctioned. As of March 2011, banks had 0.95million GCC accounts with outstanding creditof `1,308 crore.
iv) Banks have been advised to speed upopening of accounts, leveraging ICT to providebenefits to their customers at their door step.As on March 2011, banks had opened 37.2million accounts using ICT through BCs.
B. Regulatory measures
i) KYC requirements for opening bank accountshave been further relaxed during the year, toinclude job card issued by MGNREGA dulysigned by an officer of the State Governmentor the letters issued by the Unique IdentificationAuthority of India containing details of name,address and Aadhaar number.
ii) Simplified branch authorisation: To addressthe issue of uneven spread of bank branches,domestic SCBs are permitted, sinceDecember 2009, to freely open branches inTier 3 to Tier 6 centres with population of lessthan 50,000 under general permission, subjectto reporting. In the north eastern states andSikkim, domestic SCBs can now openbranches in rural, semi urban and urbancentres without taking prior permission fromthe Reserve Bank, subject to reporting.
iii) Engaging Business Correspondents: During2010-11, ‘for-profit’ companies were alsoallowed to be engaged as BC - intermediariesfor providing financial and banking services,as facilitators for banks. As at end-March,2011, domestic commercial banks havereported deploying 58,361 BCs/ customerservice providers (CSPs), providing bankingservices in 76,801 villages.
iv) Opening of branches in unbanked ruralcentres: So as to improve banking penetrationand financial inclusion rapidly in the ruralareas, the need for opening more brick andmortar branches, besides using BCs, was felt.

ANNUAL REPORT
86
Accordingly, banks were mandated in theAnnual Policy Statement of May 2011 toallocate at least 25 per cent of the total numberof branches to be opened during a year tounbanked rural centres.
C. Supportive measures
i) Two Funds, namely the Financial InclusionFund (FIF) for meeting the cost ofdevelopmental and promotional interventionsfor ensuring financial inclusion, and theFinancial Inclusion Technology Fund (FITF),to meet the cost of technology adoption hasbeen set up at NABARD with an overall corpusof `500 crore each. In the Union Budget for2011-12 the corpus of these funds wasenhanced by `100 crore each.
ii) To improve banking penetration in the North-East, the Reserve Bank has offered to fundthe capital and running costs for five years,provided the State Government concerned iswilling to make available the premises and putin place appropriate security arrangements.During the year, branches were opened at 2of the agreed centres in Meghalaya, 2 inTripura and 4 in Manipur.
iii) With an objective of ensuring uniform progressin provision of banking services in all parts ofthe country, banks were advised to draw up aroadmap to provide banking services througha banking outlet in every unbanked villagehaving a population of over 2,000 by March2012. The Reserve Bank advised banks thatsuch banking services need not necessarilybe extended through a brick and mortarbranch but could be provided also through anyof the various forms of ICT- based models,including BCs. About 72,800 such unbankedvillages have been identified and allotted tovarious banks through State Level BankersCommittees (SLBCs).
Progress of Financial Inclusion Plans duringthe year
IV.24 In January 2010, all public and private sectorbanks were advised to put in place a Board approved
three-year FIP and submit the same to the ReserveBank by March 2010. Accordingly, the banks havesubmitted their FIPs containing targets for March2011, 2012 and 2013.
IV.25 These plans broadly include self-set targetswith respect to opening of rural brick and mortarbranches; employment of BCs; coverage of unbankedvillages with population above 2,000 as also otherunbanked villages with population below 2,000through branches/BCs/other modes; opening of NoFrill accounts including those opened through BC-ICT; issuance of KCC, GCC and other specificproducts designed by them to cater to the financiallyexcluded segments. Banks were advised to integrateBoard approved FIPs with their business plans andto include the criteria on financial inclusion as aparameter in the performance evaluation of their staff.
IV.26 In order to review the progress of banks in theimplementation of FIPs and making way foraccelerated progress in future, the Reserve Bank hasbeen conducting Annual FIP Review Meetings withbanks. A few important action points from thediscussions held during May-June 2011 are as follows:
i) Banks would review their delivery models sothat financial inclusion results in a profitablebusiness for them.
ii) Banks will also focus on providing bankingservices in peripheral villages with populationof less than 2,000.
iii) In future, banks would focus more on openingof brick and mortar branches in unbankedvillages. It may be a low cost intermediarykiosk with a simple structure, requiringminimum infrastructure for operating smallcustomer transactions and supporting up to8-10 BCs at a reasonable distance of 2-3 Kms.
iv) Banks would expand financial inclusioninitiatives in urban and semi-urban areas bytargeting pockets of migrant workers and smallvendors, leveraging Aadhaar enrollment foropening banks accounts.
v) PSBs shall formulate FIPs for all RRBssponsored by them and develop an effective
CREDIT DELIVERY AND FINANCIAL INCLUSION
87
monitoring mechanism so that targetsassigned to the RRBs are achievedmeticulously.
Financial literacy efforts including outreachactivities
IV.27 Financial literacy facilitates financial inclusion,which in turn results in inclusive growth anddevelopment. In countries with diverse social andeconomic profiles as in India, financial education isparticularly relevant for people who are resource poor,operate at the margin and are vulnerable to persistentdownward financial pressures.
IV.28 Financial education can broadly be definedas the capacity to have a familiarity with and also anunderstanding of financial market products, especiallyrisks and rewards to make informed choices. TheReserve Bank has taken a number of measures forincreasing financial literacy.
i) RBI has undertaken a project titled ‘ProjectFinancial Literacy’ with the objective ofdisseminating information regarding thecentral bank and general banking conceptsto various target groups including school andcollege going children, women, rural andurban poor, defence personnel and seniorcitizens.
ii) A multilingual website in 13 Indian languageson all matters concerning banking and thecommon person was launched by the ReserveBank in June, 2007.
iii) With a view to introducing banking to schoolchildren, illustrated books have been madeavailable on the website. Similar books havebeen prepared for the different target groupsand are widely distributed in regionallanguages through various Regional Officesof the Reserve Bank.
iv) Financial literacy programmes are beinglaunched in each state with the activeinvolvement of the State Government and theSLBC. These programmes include skits, roadshows, exhibitions, workshops, seminars, anddissemination through radio and television.
IV.29 A model scheme on financial literacy andcredit counselling centres (FLCCs) was formulatedby the Reserve Bank and communicated to all SCBsand RRBs with the advice to set up the centres asdistinct entities, such that the FLCCs’ services areavailable even to other banks’ customers in thedistrict.
IV.30 Financial education stresses on thecapacity building measures to enable small andmarginal borrowers to avail of the entire suite offinancial products and services i.e., savings,remittance, insurance and pension from thebanking sector, in addition to credit. In view of theutility of these centres as expressed by stategovernments and other stakeholders, banks havebeen advised to set up FLCCs in all districts. As onMarch 2011, 252 FLCCs were set up in various statesof the country.
IV.31 During 2010-11, the Reserve Bank organisedthe second Frontline Managers’ Conferences onfinancial inclusion to review the progress made infurthering financial inclusion, understand the problemsimpeding financial inclusion at the ground level fromdemand and delivery perspective and get a feel ofthe ground realities on the current status of ourfinancial inclusion efforts. Grassroot levelfunctionaries of banks, MFIs, BCs, technologyproviders and representative customers of financialservices from across the country participated in theconference.
IV.32 In the wake of the Andhra Pradesh microfinance crisis in 2010, concerns were expressed byvarious stakeholders and the need was felt to reviewregulation of NBFCs which function as MFIs. Asindicated in the Second Quarter Review of November2010, a Sub-Committee of the Central Board of theReserve Bank (Chairman: Shri Y. H. Malegam) wasconstituted to study issues and concerns in the MFIsector (Box IV.2).
OUTREACH ACTIVITIES
IV.33 Cognizant of the beneficial impact of outreachactivities, these flagship events were carefullyorchestrated to ensure financial inclusion,

ANNUAL REPORT
88
emphasising focus on financial education and literacyinitiatives across the country during the year. A totalof 214 villages, including 167 villages identified in thepreceding Platinum Jubilee year of the Reserve Bank,were taken up for being transformed into ‘ModelVillages’.
IV.34 During the outreach programmes of grassrootlevel sensitisation, various events such as lectures,demonstrations, exhibitions and skits were organisedto educate people about the role played by theReserve Bank in their daily life. The outreach events
received all round acclaim from the public,Government officials and banks and attracted theinterest of electronic and print media in the country.The participation of the top executives of the Bank(in 34 outreach programmes in 2010-11) along withother dignitaries from banks, NABARD and StateGovernment agencies generated new hopes amongthe public in rural areas as evident from their whole-hearted involvement in these programmes. TheReserve Bank endeavours to ensure sustained post-event momentum so that long-term objectives offinancial inclusion are attained.
The Malegam Committee in its January 2011 report, interalia, recommended (i) creation of a separate category ofNBFC-MFIs; (ii) a margin cap and an interest rate cap onindividual loans; (iii) transparency in interest charges;(iv) lending by not more than two MFIs to any individualborrower; (v) creation of one or more credit informationbureaus; (vi) establishment of a proper system of grievanceredressal procedure by MFIs; (vii) creation of one or more“social capital funds”; and (viii) continuation of categorisationof bank loans to MFIs, complying with the regulation laiddown for NBFC-MFIs, under the priority sector.
Based on the feedback received, the broad regulationframework recommended by the Committee have beenaccepted. The SCBs have accordingly been advised in May,2011 that bank credit to MFIs extended on or after April 1,2011 for onward-lending to individuals and also to membersof self help groups (SHGs)/joint liability groups (JLGs) wouldbe eligible for categorisation as priority sector advance underrespective categories viz., agriculture, MSE, and micro credit(for other purposes), as indirect finance, provided not lessthan 85 per cent of total assets of MFI (other than cash,balances with banks and financial institutions, Governmentsecurities and money market instruments) are in the natureof “qualifying assets”.
In addition, aggregate amount of loan, extended for incomegenerating activity, is not less than 75 per cent of the totalloans given by MFIs.
• A “qualifying asset” shall mean a loan disbursed by MFI,which inter alia satisfies criteria such as (i) the borrower’shousehold annual income does not exceed `60,000 inrural areas and `1,20,000 in non-rural areas; (ii) loandoes not exceed `35,000 in the first cycle and `50,000in the subsequent cycles; (iii) total indebtedness of theborrower does not exceed `50,000; (iv) the loan iswithout collateral; (v) loan is repayable by weekly,fortnightly or monthly installments as per borrower’schoice
• Further, banks have to ensure that MFIs comply withthe stipulated caps on margin and interest rate as also
Box IV.2Committee on the MFI Sector (Malegam Committee)
other pricing guidelines, to be eligible to classify theseloans as priority sector loans:
i) Margin cap at 12 per cent for all MFIs. The interestcost is to be calculated on average fortnightlybalances of outstanding borrowings and interestincome is to be calculated on average fortnightlybalances of outstanding loan portfolio of qualifyingassets.
ii) Interest cap on individual loans at 26 per cent perannum for all MFIs to be calculated on a reducingbalance basis.
iii) Only three components are to be included in pricingof loans viz., (a) a processing fee not exceeding 1per cent of the gross loan amount, (b) the interestcharge and (c) the insurance premium.
iv) The processing fee is not to be included in themargin cap or the interest cap of 26 per cent.
v) Only the actual cost of insurance i.e., actual cost ofgroup insurance for life, health and livestock forborrower and spouse can be recovered;administrative charges to be recovered as per IRDAguidelines.
vi) No penalty for delayed payment.
vii) No security deposit/ margin to be taken.
• The banks should obtain from MFIs, at the end of eachquarter, a Chartered Accountant’s Certificate stating,inter alia, that (i) 85 per cent of total assets of the MFIare in the nature of “qualifying assets’’, (ii) the aggregateamount of loan, extended for income generation activity,is not less than 75 per cent of the total loans given bythe MFIs, and (iii) pricing guidelines are followed.
• Bank loans to MFIs, which do not comply with aboveconditions and bank loans to other NBFCs, will not bereckoned as priority sector loans w.e.f. April 1, 2011.The bank loans extended prior to April 1, 2011 classifiedunder priority sector will continue to be reckoned underpriority sector till maturity of such loans.

89
V.1 Financial stability has been recognised as akey objective of the Reserve Bank’s monetary policy.Financial stability entails stability of the financialmarkets and financial institutions. Financial marketstability minimises uncertainties and facilitatesinvestment decision making with due assignment ofmeasurable risks. Market development augmentsmarket efficiency that reduces transaction costs,promotes transparency, establishes benchmarks forthe purpose of pricing, and fosters long-term savingsand investment for growth. Market instability affectsrisk taking behaviour and impedes sustained growthand hence financial market regulation is necessaryfor growth. Development and regulation of financialmarkets can, however, entail trade-offs at least in theshort run, when the regulatory measures that aredesigned to promote financial stability impede marketefficiency. Accordingly, the recognition of the trade-offs to achieve the best possible outcome is a requisitefor a central bank that is vested with the responsibilityof the development and the regulation of the varioussegments of the financial markets.
MONEY MARKET
V.2 The money market is an important segmentof the financial market because it not only reflectsthe impact of liquidity mismatch in the system but alsooperates as the first leg in transmitting monetary policychanges to the other parts of the financial system.With liquidity transiting to a deficit mode in May 2010,policy measures during 2010-11 were aimed atensuring smooth functioning of the markets so as not
to destabilise economic activity. Against thismacroeconomic backdrop, policy measures weretaken with a view to addressing certain regulatorygaps, promote transparency and improve liquidity inthe money market.
Regulation of NCDs of maturity up to one year
V.3 In order to address the regulatory gap thatexisted in the case of issuance of NCDs of maturityup to one year through private placement, the ReserveBank issued Directions in terms of section 45W ofthe RBI (Amendment) Act, 2006 on June 23, 2010.The Directions provide for regulation of the issuanceof NCDs of maturity up to one year, which are moneymarket instruments. The Directions are applicable toboth secured as well as unsecured NCDs. As per theDirections, NCDs cannot be issued for maturity lessthan 90 days and cannot have call/put options thatare exercisable within 90 days from the date of issue.The eligibility criteria, rating requirements, etc., forthese NCDs have been prescribed broadly in line withthe extant guidelines on issuance of CPs. Taking intoaccount the feedback received from the marketparticipants, the Reserve Bank has issued anamendment Direction on December 6, 2010, inter alia,permitting financial institutions (FIs) to invest in NCDsof maturity up to one year; non-banking financialcompanies including Primary Dealers that do notmaintain a working capital limit to issue NCDs ofmaturity up to one year; and FIIs to invest in NCDs ofmaturity up to one year subject to extant provisionsof FEMA and SEBI guidelines issued in this regard.
The financial markets functioned smoothly during 2010-11. With a view to further strengthening the regulatory
architecture while promoting greater efficiency in the financial markets, the Reserve Bank initiated policy measures
to address certain regulatory gaps, promote transparency and improve liquidity in the money markets. The policy
initiatives in the area of foreign exchange management were directed towards procedural simplifications and
maintaining sustainability of the liberalisation process. In the derivatives market, the Reserve Bank persisted with
a calibrated and sequential approach towards launching of new market instruments keeping a balance between
financial stability issues and market efficiency.
V DEVELOPMENT AND REGULATIONOF FINANCIAL MARKETS

ANNUAL REPORT
90
Reporting platform for CDs and CPs
V.4 Towards transparency in the secondarymarket for CDs and CPs, the Reserve Bankintroduced a reporting platform for all secondarymarket transactions in CDs and CPs. The reportingplatform was operationalised by FIMMDA with effectfrom July 1, 2010. The Reserve Bank, SEBI and IRDAhave mandated all their regulated entities to reporttheir OTC trades in CDs and CPs on the FIMMDAreporting platform.
Repo in corporate bonds
V.5 As a measure aimed at provision of liquidityto the corporate bond market, the Reserve Bank hadissued guidelines in January 2010, permitting repo incorporate bonds. To further facilitate repo transactionsin corporate bonds, a review of the guidelinesgoverning repo in corporate bonds was undertakenby the Reserve Bank in consultation with the marketparticipants. Consequently, the minimum haircutapplicable on the underlying collateral has beenrevised from 25 per cent to 10 per cent (in case ofAAA-rated bonds), 12 per cent (AA+) and 15 per cent(AA). Further, settlement of repo trades in corporatebonds on a T+0 basis (in addition to T+1 and T+2)has also been permitted.
GOVERNMENT SECURITIES MARKET
V.6 The government securities market is a keysegment of the financial market as it finances the fiscin a cost effective manner, provides reference pointsfor the pricing of corporate debt, serves as a conduitfor monetary policy transmission across the maturityspectrum and also provides the wherewithal for thecentral bank’s liquidity management by way of openmarket operations. During 2010-11, the purchase ofgovernment securities from the market participantsunder the open market operations served to infuseliquidity and reduce the structural liquiditymismatches. During the recent years, the ReserveBank has been taking a series of measures that hascontributed to price discovery, widening of investorbase, increasing transparency of the market andsafeguarding the financial system. The initiatives
regarding the development of the governmentsecurities market during 2010-11 were aimed atensuring a balance between greater market liquidityand effective regulation.
Government Securities Act, 2006, Sections 27 &30 - Imposition of penalty for bouncing of SGLforms
V.7 The guidelines for SGL transfer were reviewedin the light of the provisions of sections 27 and 30(3)of the Government Securities Act, 2006 and theexisting regulatory penalty for SGL bouncing wasreplaced with a transparent and rule-based pecuniarypenalty in July 2010. Under the revised guidelines,graded monetary penalties (subject to a maximumpenalty of `5 lakh per instance) are charged for thefirst nine instances in a financial year while the tenthdefault would lead to debarment from undertakingshort sales for the remaining part of the financial year.The permission to undertake short sales shall berestored in the next financial year subject to certainrequirements in terms of improved internal controls,etc.
Extension of DvP III facility in the GovernmentSecurities market to Gilt Account Holders
V.8 The settlement of trades in Governmentsecurities through CCIL was shifted from DvP II toDvP III with effect from April 2, 2004. The DvP III facilitywas not, however, available to transactions by thegilt account holders. With the stabilisation of thetransaction and settlement infrastructure, DvP IIIfacility has been extended in July 2011 to transactionsby the gilt account holders (excluding transactionsbetween the gilt account holders of the samecustodian) so that the gilt account holders get thebenefit of efficient use of funds and securities.
FOREIGN EXCHANGE MARKET
V.9 During 2010-11, capital flows were largelyabsorbed by the current account deficit (CAD). FIIinvestment, ECBs, external assistance and NRIdeposits dominated capital flows during the year.However, the slowdown in inward FDI was a cause
DEVELOPMENT AND REGULATION OF FINANCIAL MARKETS
91
for concern, although inward FDI during 2011-12(April-June) has been encouraging. The policyinitiatives in the area of foreign exchangemanagement during the year under review weredirected towards procedural simplifications, stabilityof forex market and maintaining sustainability of theliberalisation process.
Current Account
V.10 The specific counter cyclical measuresinitiated during the crisis period were either scaleddown or rolled back as part of the exit policy. Thespecial rupee refinance facility to the EXIM Bank wasdiscontinued with effect from April 1, 2010, and theswap facility to it was scaled down from US $ 1 billionto US $ 525 million (the outstanding level as onJanuary 25, 2010) and the same was made availableup to September 30, 2010.
V.11 With the continued recession in the advancedeconomies impacting India’s exports in the immediatepost crisis period, the relaxation allowed to exportersin realisation and repatriation of export proceedswithin 12 months from the date of export of goodsand services was extended up to September 30, 2011.In case of write-off of unrealised export bills, ADCategory – I banks were advised not to insist onsurrender of the proportionate incentives, subject tocertain terms and conditions, other than those underthe Duty Drawback Scheme, if availed of by theexporters under any of the Export PromotionSchemes under the Foreign Trade Policy 2009-14.
V.12 Acknowledging the importance of the servicesprovided by the Online Payment Gateway ServiceProviders (OPGSPs) to the exporters in facilitatingexport transactions, particularly for small value goodsand services, suitable guidelines to ensure orderlyconduct of such transactions in line with the FEMARegulations, have been issued to AD banks.
V.13 To facilitate greater use of Indian Rupee intrade transactions, non-resident importers andexporters have now been permitted to hedge theircurrency risk in respect of exports from and importsto India invoiced in Indian Rupees with AD category Ibanks in India.
V.14 The currency component of foreign exchangefor visits abroad was reviewed and increased duringthe year to US $ 3,000 or its equivalent, as againstUS $ 2,000 earlier to a traveller proceeding tocountries other than Iraq, Libya, Islamic Republic ofIran, Russian Federation and other Republics ofCommonwealth of Independent States, without theprior permission from the Reserve Bank.
V.15 AD Category – I banks were required to obtainan unconditional, irrevocable standby Letter of Credit(LC) or a guarantee from an international bank ofrepute situated outside India or a guarantee of an ADCategory – I bank in India, if such a guarantee isissued against the counter guarantee of aninternational bank of repute situated outside India,for an advance remittance for imports of goodsexceeding US $ 100,000 or its equivalent. The limithas been enhanced to US $ 200,000 or its equivalent,for importers other than a Public Sector Company ora Department/Undertaking of Central/StateGovernments where the requirement of bankguarantee is to be specifically waived by theMinistry of Finance, Government of India foradvance remittances exceeding US $ 100,000 or itsequivalent.
Capital Account
V.16 ECB policies have been progressivelyliberalised to channelise more external funds to theinfrastructure sector. The recent liberalisationmeasures include expansion of the definition ofinfrastructure to include “cold storage or cold roomfacility, including for farm level pre-cooling, forpreservation or storage of agricultural and alliedproduce, marine products and meat”, allowingInfrastructure Finance Companies (IFCs) for availingECBs for on-lending to the infrastructure sector, facilityof credit enhancement for raising debt through capitalmarket instruments by entities in the infrastructuresector and the scheme of take-out finance throughECB under the approval route for refinancing of rupeeloans availed from domestic banks for developmentof new projects in the sea port and air port, roadsincluding bridges and power sector. Corporatesengaged in the development of integrated township
ANNUAL REPORT
92
were permitted to avail of ECB, under the approvalroute, up to end-December 2010. Corporates in selectservices sectors, such as software, hospital and hotelhave been allowed to avail ECB above US $ 100million under the approval route.
V.17 The facility of premature buyback of FCCBswhich was available up to end-June, 2011 has beenextended up to end-March, 2012 with reducedminimum discount rates. In order to meet theredemption obligations, Indian companies have beenallowed to raise fresh ECBs/FCCBs as per the extantECB guidelines under the automatic route to refinancetheir outstanding obligations, subject to certainconditions.
V.18 Keeping in view the requirement of huge fundsfor the infrastructure sector and to enable thedevelopment of government securities and corporatebond markets in the country in a calibrated manner,the FII investment limits were enhanced from US $ 5billion to US $ 10 billion in respect of governmentsecurities and from US $ 15 billion to US $ 40 billionin respect of corporate bonds issued by companiesin the infrastructure sector, subject to the conditionthat the incremental limit should be earmarked forinvestment in corporate bonds with a residual maturityof over five years. The incremental limit in corporatebonds will have to be earmarked for investment inthe corporate bonds issued by the companies in theinfrastructure sector, as defined under the ECB policy.This measure, besides augmenting the flow of financeto the infrastructure sector, would also enhance theliquidity of long-term papers.
V.19 Keeping in view the utility and usage of theinstrument of performance guarantees in projectexecutions abroad and also considering the risksassociated with such guarantees vis-a-vis financialguarantees, henceforth only 50 per cent of the amountof the performance guarantees would be reckonedfor the purpose of computing financial commitmentto its JV/WOS overseas, within the 400 per cent ofthe net worth of the Indian Party. Irrespective ofwhether the direct subsidiary is an operating companyor a SPV, the Indian promoter entity mayextend corporate guarantee on behalf of the first
generation step down operating company under theAutomatic Route, within the prevailing limit foroverseas direct investment. Further, the areas relatingto restructuring of the balance sheet of the overseasentity involving write-off of capital and receivables anddisinvestment by the Indian Parties of their stake inan overseas JV/WOS involving write-off wereliberalised.
V.20 Non-resident investors (other than SEBIregistered FIIs and SEBI registered FVCIs) who meetthe KYC requirements of SEBI, have been permittedto purchase on repatriation basis rupee denominatedunits of equity schemes of domestic MFs, within anoverall ceiling of US$ 10 billion. These investors havealso been allowed to invest up to an additional amountof US$ 3 billion in units of debt schemes of domesticMFs which invest in infrastructure (as defined underthe ECB norms) with a minimum residual maturity of5 years, within the existing ceiling of US$ 25 billionfor FII investment in corporate bonds issued byinfrastructure companies.
V.21 Recognising the important contribution of non-resident Indians (NRIs) and persons of Indian origin(PIOs) in India’s growth process and the need forfacilitating genuine foreign exchange transactions bynon-resident Indians (NRIs) as well as residentindividuals under the current regulatory frameworkof FEMA, a committee (Chairperson: Smt. K.J.Udeshi) has been constituted in April 2011 to identifyareas for streamlining and simplifying the procedureso as to remove the operational impediments, andassess the level of efficiency in the functioning ofauthorised persons, including the infrastructurecreated by them. The Committee submitted its reportin August 2011. The recommendations of theCommittee are under examination.
DERIVATIVES MARKET
V.22 Derivatives can serve as importantinstruments in the development of the financialmarkets when these instruments permit portfoliodiversification and risk hedging, thereby ensuringfinancial stability. Derivatives can, however, turn outto be a double-edged sword as the global financial

DEVELOPMENT AND REGULATION OF FINANCIAL MARKETS
93
crisis would testify. During the post-crisis period,instead of addressing the risks, derivatives emergedas the source of off balance sheet and hiddenexposures of banks and financial institutions. In India,the Reserve Bank has persisted with a calibrated andsequential approach towards launching of new marketinstruments in recognition of the trade-offs betweenfinancial stability issues and market efficiency.
Introduction Interest Rate Futures (IRF) on91-Day T-Bills
V.23 The Interest Rate Futures contract on 10-yearnotional coupon bearing Government of Indiasecurity was re-introduced on August 31, 2009.Based on the market feedback and therecommendations of the Technical AdvisoryCommittee (TAC) on the Money, Foreign Exchangeand Government Securities Markets, it was decidedto introduce short-tenor IRF contracts. Accordingly,in order to provide participants with additionalinstruments to manage volatility in the short-terminterest rates, IRFs on 91-day Treasury Bills werepermitted since March 2011.
Introduction of Credit Default Swaps (CDS)
V.24 Lack of instruments to manage credit risk wasa long-felt need and to address the same theintroduction of credit default swaps was taken up in2003 and further followed up in 2007. However, theinitiatives had to be put on hold in view of the unfoldingof the global financial crisis. Taking into account thelessons learnt from global financial crisis, it wasdecided to permit CDS on corporate bonds and thefinal guidelines in this regard were issued in May 2011(Box V.1).
Exchange Traded Currency Derivatives
V.25 The currency futures market remained activeduring 2010-11. The average daily turnover incurrency futures on the three active exchanges (NSE,MCX-SX and USE) stood at US $ 8.0 billion in March2011 as against US $ 7.1 billion in March 2010.Increased globalisation of the economy increases theforeign exchange exposure of Indian firms andindividuals with exchange rate risk arising from
domestic and global financial market developments.This has necessitated introduction of variousinstruments by the Reserve Bank to hedge theexchange exposure by the residents. Currently,residents in India are permitted to trade in futurescontracts in four currency pairs on recognised stockexchanges.
V.26 In order to expand the menu of tools forhedging currency risk, recognised stock exchangeswere permitted to introduce plain vanilla currencyoptions on spot US Dollar/Rupee exchange ratefor residents. The exchange traded currencyoptions market is functioning subject to theguidelines issued by the Reserve Bank and theSecurities and Exchange Board of India (SEBI) fromtime to time.
V.27 In view of the large positions held by the FIIsand considering the increased depth of the Indianforex market to absorb the impact on the exchangerate, FIIs have now been permitted to canceland rebook up to 10 per cent of the marketvalue of the portfolio as at the beginning of thefinancial year as against 2 per cent that was permittedearlier.
Non-deliverable Forwards Market
V.28 NDF market exists mostly in non-convertibleor in currencies with limited on-shore hedgingoptions. With increasing capital flows to the EMEs,the NDF market offers a convenient hedgingmechanism for foreign investors who may not havefull access to the onshore market of the concernedcurrency due to restrictions or may prefer to transactin an international financial centre they are familiarwith for the sake of convenience. Thoughcomprehensive information is not available on theglobal NDF market, Brazilian Real, ChineseRenminbi, Taiwanese dollar, South Korean Won andthe Indian Rupee reportedly account for the majorshare. The major centres for the Indian Rupee NDFmarket are reportedly Singapore, London, New Yorkand Hong Kong. In India, the linkage between theNDF market and the domestic financial marketsremains weak (Box V.2).

ANNUAL REPORT
94
OTC Foreign Exchange Derivatives
V.29 The comprehensive guidelines on OTCforeign exchange derivatives and overseas hedgingof commodity price and freight risks were issued inDecember 2010. The important elements of the
revised guidelines, which became effective inFebruary 2011 are: (i) AD Category I banks can onlyoffer plain vanilla European cross currency options;(ii) allowing embedded cross currency option in thecase of foreign currency-rupee swaps; (iii) permittinguse of cost reduction structures, both under the
1 Change in price of Rs.100 nominal bond for one basis point change in yield.
Introduction of credit derivatives in India was activelyexamined in the past to provide the market participants toolsto manage credit risk. Accordingly, draft guidelines onintroduction of CDS were issued in 2003 and 2007. However,taking into account the status of the risk managementpractices then prevailing in the banking system and also theexperiences relating to the financial crisis, the issuance offinal guidelines was deferred.
The matter was reviewed and the Second Quarter Reviewof Monetary Policy of 2009-10 had proposed introduction ofplain vanilla OTC single-name CDS for corporate bondssubject to appropriate safeguards. Accordingly, an internalWorking Group was constituted to finalise the operationalframework for the introduction of single-name CDS forcorporate bonds in India. The Group submitted its final reportin February, 2011. Based on the recommendations of thereport, the draft guidelines on CDS were prepared and placedon the Bank’s website on February 23, 2011 for publiccomments. Taking into account the feedback received fromthe market participants and other stake holders, the finalguidelines on CDS were issued on May 23, 2011 and wouldbecome effective from October 24, 2011.
The salient features of the guidelines are as under:
• The CDS shall be permitted on listed corporate bonds,unlisted but rated bonds of infrastructure companies andunlisted/unrated bonds issued by the Special PurposeVehicles (SPVs) set up by infrastructure companies asreference obligations.
• The reference entities shall be single legal residententities.
• The permitted participants have been categorised into:
a) Market Makers: Participants such as CommercialBanks, NBFCs and stand-alone Primary Dealers arepermitted to undertake both protection buying andprotection selling subject to satisfying the prescribedeligibility norms. Insurance Companies and MutualFunds would be allowed to act as market-makerssubject to the approval of their respective regulators.
b) Users: Participants permitted only to hedge theirunderlying exposures, such as, Commercial Banks,
Box V.1Guidelines on Credit Default Swaps (CDS) for Corporate Bonds
Primary Dealers, NBFCs, Mutual Funds, InsuranceCompanies, Housing Finance Companies, ProvidentFunds, Foreign Institutional Investors (FIIs) and listedcorporates.
• Users cannot purchase CDS without having theunderlying exposure and the protection can bebought only to the extent (both in terms of quantumand tenor) of such underlying risk.
• For users, physical settlement is mandatory. Market-makers can opt for any of the three settlement methods(physical, cash or auction settlement), provided the CDSdocumentation envisages such settlement.
• The CDS contracts shall be standardised in terms ofcoupon, coupon payment dates, etc.
• Bankruptcy, Failure to pay, Repudiation/moratorium,Obligation acceleration, Obligation default, Restructuringapproved under Board for Industrial and FinancialReconstruction (BIFR) and Corporate Debt Restructuring(CDR) mechanism and corporate bond restructuring arethe eligible credit events for CDS.
• As CDS markets are exposed to various risks, such as,sudden increases in credit spreads resulting in mark-to-market losses, jump-to-default risk, basis risk,counterparty risks, etc., market participants are requiredto take these risks into account and build robust andappropriate risk management system to manage suchrisks. The guidelines specifically prescribe for havingcounterparty credit exposure limits, PV011 limit and anindependent risk management framework for reporting,monitoring and controlling all aspects of risks, assessingperformance, valuing exposures, monitoring andenforcing position and other limits for CDS.
• Market-makers shall report their CDS trades with bothusers and other market-makers on the reporting platformof CDS trade repository within 30 minutes from the dealtime. The trade repository would disseminate keyinformation on market participants’ positions and helpregulators and market participants gain a clear andcomplete snapshot of the market’s overall risk exposureto CDS.
DEVELOPMENT AND REGULATION OF FINANCIAL MARKETS
95
A non deliverable forward (NDF) refers to an OTC forwardtransaction that is settled not by delivery but by exchangeof the difference between the contracted rate and somereference rate. Such transactions usually involve a non-convertible (with some degree of capital control) or incurrencies with limited on-shore hedging options and takeplace in an offshore location either in order to overcomeon-shore regulations or because it is convenient for thetransacting parties. The contract is for a fixed amount (ofthe non-convertible currency), on a specific due date, andat an agreed forward rate. At maturity, the prevailing spotrate (reference rate) is compared with the contracted NDFrate. The difference is usually paid in the convertiblecurrency on the maturity date. There is no delivery of thereference or domestic currency on the maturity date. Nopayment or account movement takes place in the non-convertible currency. When a NDF transaction is agreed,the parties must also agree on a way to determine thereference rate (at maturity). This might be the daily ratefixed by the central bank in question, or an average ratepublished by several banks. NDFs require a specialcontract that meets the provisions of the internationallyrecognised International Swaps and DerivativesAssociation (ISDA).
NDF market in Indian Rupee
The demand for Rupee NDF may arise from many sources,e.g.
Box V.2NDF Market and its Implications for the Domestic Financial Markets
1. Hedge funds/FIIs for hedging potential future exposureto Indian equity/bond market (since the presentdispensation allows hedging only of actual, but notpotential, exposures);
2. MNCs having manufacturing or business interests inIndia, who do their invoicing in Indian Rupee but are notallowed to hedge their rupee exposure; and
3. Directional bet by the speculators on the Indian Rupeewithout any underlying exposure.
The linkage between the NDF market and the domesticmarket may come from banks and corporates who haveglobal books and can, therefore, take offsetting positions intheir foreign and Indian books. This linkage would transmitthe price movement in the NDF market to the domesticmarket or vice versa. However, the linkage is weak becausecorporates’ domestic forex forward transaction is based onunderlying exposure and there is a limit on the aggregate(cash and derivative) positions that banks can take. Theempirical analysis also brings out a weak causality betweenthe NDF and domestic market rates.
Reference :
Padmanabhan, G. (2011), ‘Forex Market Development -Issues and Challenges: Thoughts of a Returning ForexMarket Regulator,’ Keynote address at the seminar of ForexAssociation of India, Singapore, August 13.
contracted exposures and past performance routes,subject to certain safeguards; and (iv) allowing swapsto move from rupee liability to forex liability, subjectto certain safeguards.
V.30 With the return to normalcy in the financialmarkets, the Reserve Bank persisted with its objectiveof maintaining an appropriate balance between itsmarket development objectives and effectiveregulation in order to promote financial stability which
is a precondition for long term sustainable growth.Policy measures were taken with a view to addressingcertain regulatory gaps, promoting transparency andimproving liquidity in the financial markets. TheReserve Bank’s calibrated and sequential approachtowards the introduction of new market instrumentsin recognition of the trade-offs between financialstability issues and market efficiency has contributedto the stability of financial markets.

96
VI.1 The mandate of central banks in manycountries is getting widened to include systemicregulation and macroprudential supervision in theaftermath of the global financial crisis. In India, theregulation and supervision have since long been themost crucial functions of the Reserve Bank. TheReserve Bank currently has the mandate to regulatebanks as well as non-banking financial companies(NBFCs) and has conducted its regulatory andsupervisory functions with the objective of maintainingsystemic financial stability as well as preventing failureof individual entities.
VI.2 The focus on regulation, supervision andfinancial stability helped the Indian banking systemto sustain the downturn witnessed during the globalfinancial crisis. Strong prudential regulations wereadopted by the Reserve Bank much ahead of theoutbreak of the crisis. The Indian financial system stillremains largely bank oriented and therefore a resilientbanking system is crucial in maintaining systemicstability. The stress test results suggest that Indianbanking system is largely resilient and can withstandplausible shocks.
FINANCIAL STABILITY ASSESSMENT
VI.3 Post-crisis, financial stability has come to berecognised as an integral element of macroeconomicpolicy framework globally. In the international fora, a
Financial Stability Board (FSB) is set up to detectsystemic vulnerabilities and strengthen thesupervisory and regulatory structure with a view topromoting financial stability. India is also a memberof FSB and has committed to adopt international bestpractices (Box VI.1).
VI.4 The multiple indicator approach to monetarypolicy as well as prudent financial sector managementhas enabled the Reserve Bank to maintain financialstability in the country even in the face of strongheadwinds from the global economy. The post crisisfocus on establishing an institutional mechanism forcoordination among regulators and the Governmenthas culminated in the establishment of the FinancialStability and Development Council (FSDC) inDecember 2010. The FSDC is chaired by the FinanceMinister and assisted by a Sub-Committee to bechaired by the Governor of the Reserve Bank. Thisstructure attempts to strike a balance between thesovereign’s objective of ensuring financial stability andthe operative arrangements involving the central bankand other regulators. While the Sub-Committee isexpected to evolve as a more active, hands-on bodyfor financial stability in normal times, the FSDC wouldhave a broad oversight and will assume a central roleduring crises (Box VI.2).
VI.5 Further, the Financial Sector LegislativeReforms Commission (FSLRC) has been constituted
After the outbreak of the global financial crisis, pursuit of financial stability as an explicit policy objective, especially
by central banks, is gaining prominence. In India, the Reserve Bank’s regulatory and supervisory policies have
always been oriented towards maintenance of systemic stability. The Indian banking system remained largely sound
and resilient to shocks as indicated by various stress tests. The high level of leverage in developed countries, which was
one of the causal factors behind the global financial crisis, continues to remain low in India. The regulatory and
supervisory structure of the Reserve Bank was further strengthened during the year. The important policy decisions
for SCBs included, inter alia, strengthening countercyclical provisioning norms, measures to avoid excessive leverage
in housing loan segment, credit support to Micro Finance Institutions(MFIs) etc. After the consolidation in the
UCB sector there is substantial improvement in their financial health.
VI REGULATION, SUPERVISION ANDFINANCIAL STABILITY

REGULATION, SUPERVISION AND FINANCIAL STABILITY
97
The FSB, which was established in 2009 as a successor tothe Financial Stability Forum (FSF), is an international bodyestablished to address financial system vulnerabilities andto drive the development and implementation of strongregulatory, supervisory and other policies in the interest offinancial stability. The FSB has identified a range of issueswith potential implications for systemic stability and variousinitiatives, as under, are now underway, internationally, totackle these issues:
1. Developing macroprudential frameworks and policymeasures as an essential tool for ensuring financialstability;
2. Implementing the Basel Committee proposals toenhance the capital and liquidity standards of financialinstitutions, now commonly known as Basel III. Theproposals envisage a minimum Common Equity Capitalratio of 4.5 per cent, a Capital Conservation Buffer of upto 2.5 per cent, calibration of a Liquidity Coverage Ratio(LCR) and a Net Stable Funding Ratio (NSFR), etc.;
3. Reforming policies relating to Systemically ImportantFinancial Institutions (SIFI), with a view to reducing theprobability and impact of failure, improving resolutioncapacity and strengthening core financial infrastructuresand markets;
4. Exploring possible regulatory measures to address thesystemic risk and regulatory arbitrage concerns posedby the shadow banking system;
5. Improving the OTC and Commodity Derivatives Marketthrough measures requiring all standardised OTCderivative contracts to be traded on exchanges orelectronic trading platforms and, where appropriate,cleared through central counterparties; reporting ofOTC derivative contracts to trade repositories; andhigher capital requirements for non-centrally clearedcontracts;
6. Other measures such as reforming compensationpractices of financial institutions, enhancing andstrengthening accounting standards and reducingreliance on Credit Rating Agencies (CRAs).
Reserve Bank’s views
India is a member of the FSB and the Reserve Bank isactively involved in the process of policy formulation in the
Box VI.1Financial Stability Board (FSB)
Board. It remains committed to adoption of internationalstandards and best practices, in a phased manner andcalibrated to local conditions, wherever necessary.
Banks in India are well capitalised and the Basel III normsare unlikely to put undue pressure on the banking system inthe aggregate, though a few individual banks may need toraise additional capital to comply to these standards, oncethey are phased in. Many regulatory prescriptions beingcontemplated internationally, especially with respect to corecapital, had been inducted into the Indian regulatoryframework well before the crisis.
A framework for monitoring the activities of the FinancialConglomerates (FCs) is in place in the country. Thoughnone of the Indian institutions are likely to qualify as aglobal SIFI, nonetheless, the progress made in SIFIidentification and resolution mechanism will have to beincorporated into the domestic regulatory regime.
The shadow banking sector, as it is understood globally, doesnot exist in India. The NBFC sector which is loosely identifiedwith shadow banking is also largely regulated. There remainsome regulatory gaps which leave scope for arbitrage. AWorking Group has been, inter alia, mandated to identifysuch gaps and suggest measures to plug them.
Unlike in most jurisdictions, where centralised trade reportinghas come into focus only post-crisis, India has hadarrangements for reporting of various OTC derivativetransactions ranging from summary information to transactionlevel data. The existing reporting arrangements require tradesin foreign exchange, interest rate, government securities,corporate bonds and money market instruments to bereported to the Clearing Corporation of India Ltd. (CCIL). AWorking Group constituted by the Reserve Bank has furthersuggested a range of measures towards expanding the menuof products which are reported and requiring such reportingthrough regulatory mandates.
Macroprudential policy tools to address issues of systemicconcerns have been employed in India for quite some timeand the results have been largely positive. The tools used inIndia included specifying/revising exposure norms,provisioning for standard assets, differentiated risk weightsfor sensitive sectors, specification of loan to value ratio, etc.To sustain the efficacy of such instruments, going forward, awide range of qualitative and quantitative indicators will needto be developed and the integrity of data will have to beenhanced.
under the Chairmanship of Justice B.N. Srikrishnaby the Central Government in March 2011, with a viewto rewriting and streamlining the financial sector laws,rules and regulations to bring them in harmony withthe requirements of India’s fast growing financialsector.
VI.6 By the Securities and Insurance Laws(Amendment and Validation) Act, 2010, a new chapter(chapter III-E) has been inserted in the Reserve Bankof India Act, 1934. This chapter provides for a jointmechanism, consisting of Union Finance Minister asChairperson, Governor, Reserve Bank of India as

ANNUAL REPORT
98
Vice-Chairperson, the Secretary, Department ofEconomic Affairs, the Secretary, Department ofFinancial Services and the Chairpersons of SEBI,IRDA and PFRDA as members to resolve anydifference of opinion amongst the regulators. The Actprovides for a reference being made to the JointCommittee only by the regulators and not by theCentral Government. The decision of the JointCommittee shall be binding on the Reserve Bank ofIndia, the Securities and Exchange Board of India(SEBI), the Insurance Regulatory and DevelopmentAuthority (IRDA) and the Pension Fund Regulatoryand Development Authority (PFRDA).
MONITORING OF FINANCIAL STABILITY
VI.7 Stress testing exercises are regularly carriedout by the Reserve Bank as part of its macroprudentialoversight. A series of stress testing in respect of credit,liquidity and interest rate risks showed that Indianbanking system remained reasonably resilient thoughtheir profitability could be affected significantly. Thestress tests show that credit risk would be wellcontained even if 30 per cent of restructured standardassets turned into NPAs. Though under the moststringent credit quality shock of 150 per cent on thebaseline, the system level CRAR was adverselyaffected, the banking system was able to withstand
an adverse NPA shock reasonably with their capitalfund. Liquidity stress tests revealed some areas ofconcern even though the scenario has improved ascompared to the last assessment. The credit riskstress tests on systemically important non-deposittaking NBFCs (NBFC-ND-SI) and scheduled UCBsrevealed that the impact on CRAR under differentscenarios would not be alarming.
Leverage of Corporate and Household Sector
VI.8 In the recent period, high leverage levels ofcorporate and household sector are causes ofconcern, especially in developed countries. Of these,leverage in household and to a large extent even thecorporate sector has been an area which is not directlyregulated, even though macroprudential guidelinesexist for bank and non-bank lending to corporatesector and retail sector. In India, however, the level ofleverage for corporate and household sector is muchlower as compared to the high levels prevailing indeveloped countries (Box VI.3).
ASSESSMENT OF THE BANKING SECTOR
VI.9 The robust economic growth during 2010-11was accompanied by a strong credit growth, eventhough deposit growth did not keep pace and the gapwas funded through an increasing share of market
Following the announcement in the Union Budget of 2010-11, the Financial Stability and Development Council (FSDC)was set up in December 2010 with a view to institutionaliseand strengthen the mechanism for maintaining financialstability. The FSDC will, inter alia, deal with issues relatingto financial stability, financial sector development, inter-regulatory coordination and macroprudential supervision ofthe economy including the functioning of large financialconglomerates.
The FSDC is chaired by the Union Finance Minister and itsmembers include the heads of the financial sector regulatorsand representatives from key departments of the Ministry ofFinance. The FSDC is assisted by its Sub-Committee, whichmeets frequently (at quarterly intervals) to assess the healthof the financial sector and monitor any incipient signs ofvulnerability. The Sub-Committee is chaired by the Governorof the Reserve Bank and its members also include the headsof the financial sector regulators and representatives fromthe Ministry of Finance. The Sub-Committee has replaced
Box VI.2Developments Related to FSDC and its Sub-Committee
the erstwhile High Level Co-ordination Committee onFinancial Markets (HLCCFM).
Since its inception, the FSDC has met thrice and has takenstock of issues related to the macroeconomy, implications ofthe developments in the advanced countries on India,sovereign rating of India and the impact of competitivedevaluation by different jurisdictions. The Sub-Committee hasalso met thrice since its constitution and has reviewed themajor macroeconomic and financial sector developments,focusing on issues related to systemic risk. It is engagingitself on an institutional mechanism for inter-regulatorycoordination for the supervision of financial conglomeratesand putting in place a robust reporting platform for over-the-counter (OTC) derivatives market. Bridging the existingregulatory gaps in the NBFC sector, regulation of governmentsponsored NBFCs, regulation of investment advisory services,conflict of interest in the distribution of financial products,development of repos in corporate bonds, introduction ofinfrastructure development funds (IDF), financial inclusion andfinancial literacy are also critical issues on its agenda.

REGULATION, SUPERVISION AND FINANCIAL STABILITY
99
The high level of debt and steady and sharp rise in leveragein the developed economies, especially after 2000, has beenidentified as one of the major causal factors that sparked offthe global financial crisis. The high level of leverage wasparticularly significant in case of household sector andcorporate sector. In the years preceding the financial crisis,household debt rose significantly, especially in countrieswhich experienced a boom in the housing sector, like USA,UK, Ireland and Spain. Corporate debt ratios also increasedsharply in some countries like Ireland, Spain, Portugal andUK but were stable in the US (Chart 1). In contrast, thegovernment debt ratios were stable in most of the countries.Surprisingly, even though household sector and corporatesector were highly leveraged, aggregate financial sectorleverage in most countries grew only modestly or declinedduring the years preceding the crisis. This was mainlybecause of rise in securitisation which allowed banks to shiftnon-performing loans off their balance sheets.
It is well documented in economic literature that financialcrises often take place after a credit boom as reflected in asharp rise in the ratio of credit to GDP. The leverage is highduring credit boom periods, suggesting risk taking behaviourof both lenders as well as borrowers, thereby leading to
Box VI.3Corporate and Household Leverage, Credit Cycle and Economic Growth
build-up of systemic risk. This subsequently results in abust when risk materialises. These types of credit cyclesare fairly regular and clearly identifiable across countriesand across time and may subsequently lead to bankingcrises. Thus, even though high leverage in the initial periodmay lead to a phase of high economic growth through creditboom, as the bubble bursts, the spillover effects may haveadverse implications for growth. This is usually followed bya long and often painful process of deleveraging, asfinancial sector, households and corporates reduce theirdebt exposures. Following the recent crisis as well, theprocess of deleveraging has begun in developedeconomies, though by no means yet complete. Thus, whilehousehold and corporate sector debt is beginning to decline,government borrowing is increasing sharply in manyeconomies to finance crisis related stimulus programmesand financial sector bailouts. In contrast, the process ofdeleveraging is faster in case of financial institutions asthese institutions reduced lending and resorted to shrinkingbalance sheets.
In sharp contrast to the developing countries, the debt levelsin India have remained low. In fact, the leverage of corporatesector has been falling in recent years implying that the
(Contd...)
Chart 1: Debt GDP Ratio: Cross Country Experience
USA
40
50
60
70
80
90
100
Per
cen
t
1999
2000
2001
2002
2003
2004
2005
2006
2007
2008
2009
Per
cen
t
1999
2000
2001
2002
2003
2004
2005
2006
2007
2008
2009
Ireland
0
50
100
150
200
250
Data sources: Eurostat, OECD Stat, National Economic Accounts data, USA.
UK
1999
2000
2001
2002
2003
2004
2005
2006
2007
2008
2009
30
40
50
60
70
80
90
100
110
120Spain
20
40
60
80
100
120
140
Per
cen
t
1999
2000
2001
2002
2003
2004
2005
2006
2007
2008
2009
Household Non-financial Corporate Government
Per
cen
t
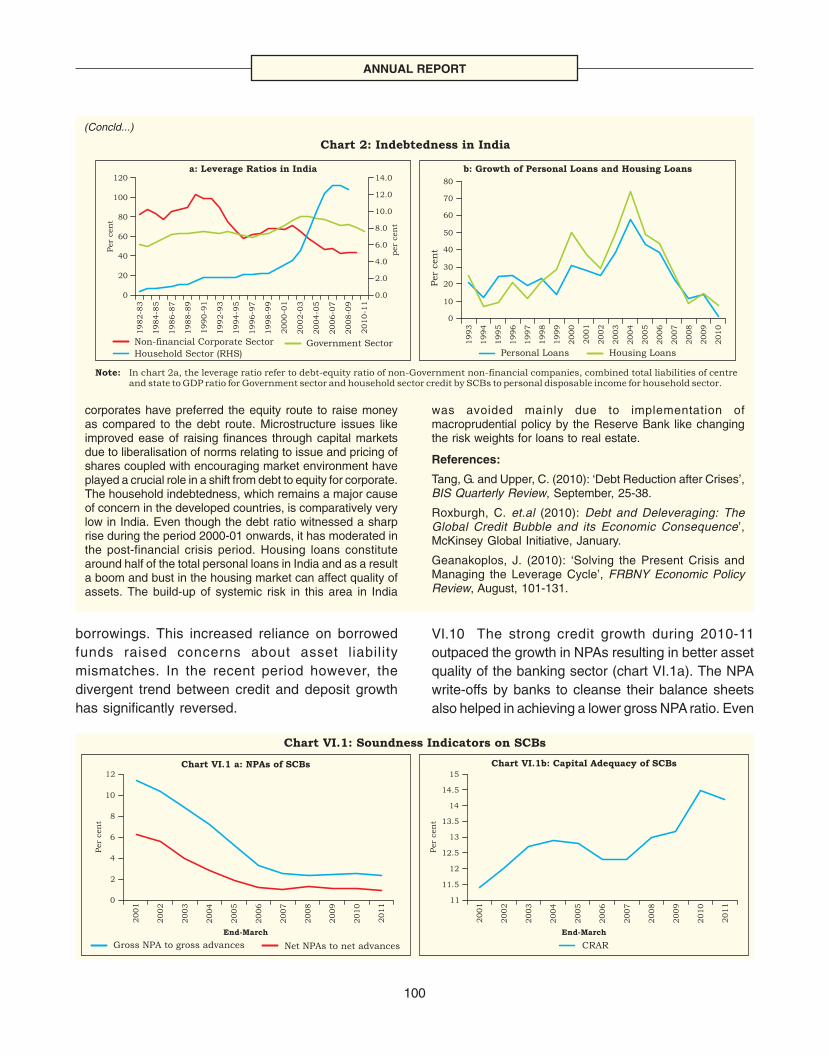
ANNUAL REPORT
100
borrowings. This increased reliance on borrowedfunds raised concerns about asset liabilitymismatches. In the recent period however, thedivergent trend between credit and deposit growthhas significantly reversed.
VI.10 The strong credit growth during 2010-11outpaced the growth in NPAs resulting in better assetquality of the banking sector (chart VI.1a). The NPAwrite-offs by banks to cleanse their balance sheetsalso helped in achieving a lower gross NPA ratio. Even
Household Sector (RHS)
Non-financial Corporate Sector Government Sector
Per
cen
t
Personal Loans Housing Loans
Chart 2: Indebtedness in India
a: Leverage Ratios in India
Note: In chart 2a, the leverage ratio refer to debt-equity ratio of non-Government non-financial companies, combined total liabilities of centreand state to GDP ratio for Government sector and household sector credit by SCBs to personal disposable income for household sector.
b: Growth of Personal Loans and Housing Loans
0
10
20
30
40
50
60
70
80
1993
1994
1995
1996
1997
1998
1999
2000
2001
2002
2003
2004
2005
2006
2007
2008
2009
2010
0
20
40
60
80
100
120
Per
cen
t
per
cen
t
1982-8
3
1984-8
5
1986-8
7
1988-8
9
1990-9
1
1992-9
3
1994-9
5
1996-9
7
1998-9
9
2000-0
1
2002-0
3
2004-0
5
2006-0
7
2008-0
9
2010-1
1
0.0
2.0
4.0
6.0
8.0
10.0
12.0
14.0
Chart VI.1: Soundness Indicators on SCBs
Chart VI.1 a: NPAs of SCBs
0
2
4
6
8
10
12
2001
2002
2003
2004
2005
2006
2007
2008
2009
2010
2011
End-March
Per
cen
t
End-March
Gross NPA to gross advances Net NPAs to net advances
Chart VI.1b: Capital Adequacy of SCBs
2001
2002
2003
2004
2005
2006
2007
2008
2009
2010
2011
Per
cen
t
11
11.5
12
12.5
13
13.5
14
14.5
15
CRAR
corporates have preferred the equity route to raise moneyas compared to the debt route. Microstructure issues likeimproved ease of raising finances through capital marketsdue to liberalisation of norms relating to issue and pricing ofshares coupled with encouraging market environment haveplayed a crucial role in a shift from debt to equity for corporate.The household indebtedness, which remains a major causeof concern in the developed countries, is comparatively verylow in India. Even though the debt ratio witnessed a sharprise during the period 2000-01 onwards, it has moderated inthe post-financial crisis period. Housing loans constitutearound half of the total personal loans in India and as a resulta boom and bust in the housing market can affect quality ofassets. The build-up of systemic risk in this area in India
was avoided mainly due to implementation ofmacroprudential policy by the Reserve Bank like changingthe risk weights for loans to real estate.
References:
Tang, G. and Upper, C. (2010): ‘Debt Reduction after Crises’,BIS Quarterly Review, September, 25-38.
Roxburgh, C. et.al (2010): Debt and Deleveraging: TheGlobal Credit Bubble and its Economic Consequence’,McKinsey Global Initiative, January.
Geanakoplos, J. (2010): ‘Solving the Present Crisis andManaging the Leverage Cycle’, FRBNY Economic PolicyReview, August, 101-131.
(Concld...)
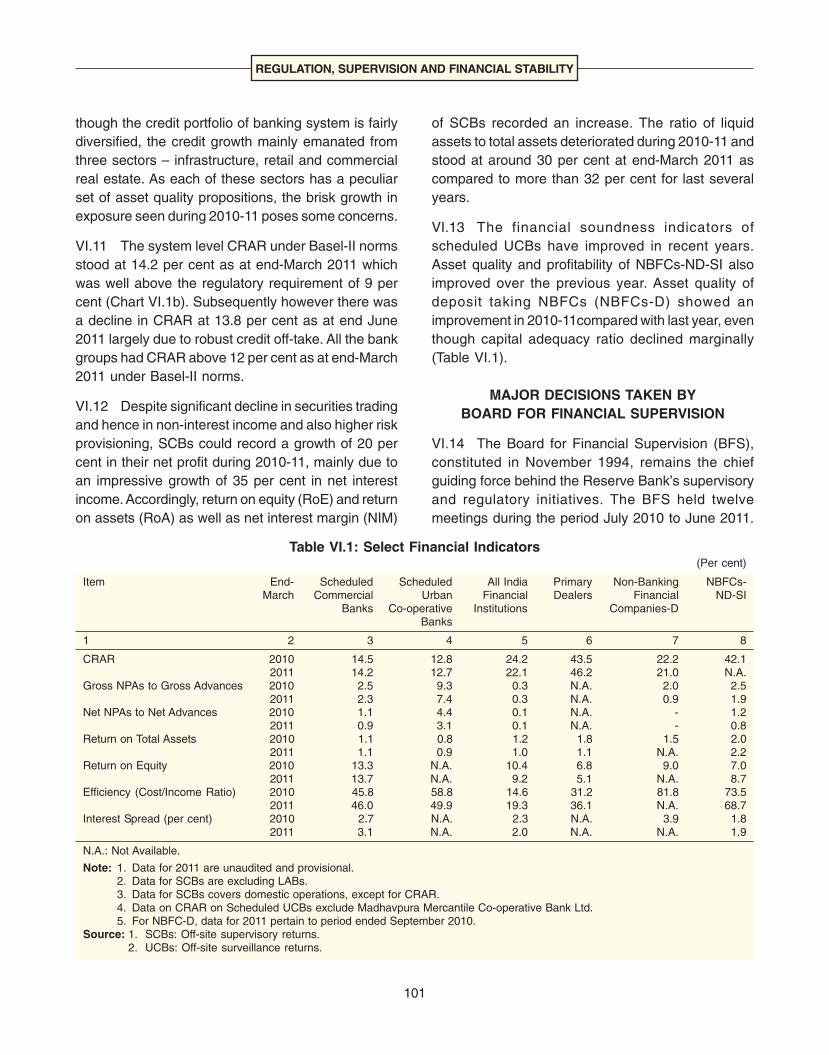
REGULATION, SUPERVISION AND FINANCIAL STABILITY
101
though the credit portfolio of banking system is fairlydiversified, the credit growth mainly emanated fromthree sectors – infrastructure, retail and commercialreal estate. As each of these sectors has a peculiarset of asset quality propositions, the brisk growth inexposure seen during 2010-11 poses some concerns.
VI.11 The system level CRAR under Basel-II normsstood at 14.2 per cent as at end-March 2011 whichwas well above the regulatory requirement of 9 percent (Chart VI.1b). Subsequently however there wasa decline in CRAR at 13.8 per cent as at end June2011 largely due to robust credit off-take. All the bankgroups had CRAR above 12 per cent as at end-March2011 under Basel-II norms.
VI.12 Despite significant decline in securities tradingand hence in non-interest income and also higher riskprovisioning, SCBs could record a growth of 20 percent in their net profit during 2010-11, mainly due toan impressive growth of 35 per cent in net interestincome. Accordingly, return on equity (RoE) and returnon assets (RoA) as well as net interest margin (NIM)
of SCBs recorded an increase. The ratio of liquidassets to total assets deteriorated during 2010-11 andstood at around 30 per cent at end-March 2011 ascompared to more than 32 per cent for last severalyears.
VI.13 The financial soundness indicators ofscheduled UCBs have improved in recent years.Asset quality and profitability of NBFCs-ND-SI alsoimproved over the previous year. Asset quality ofdeposit taking NBFCs (NBFCs-D) showed animprovement in 2010-11compared with last year, eventhough capital adequacy ratio declined marginally(Table VI.1).
MAJOR DECISIONS TAKEN BYBOARD FOR FINANCIAL SUPERVISION
VI.14 The Board for Financial Supervision (BFS),constituted in November 1994, remains the chiefguiding force behind the Reserve Bank’s supervisoryand regulatory initiatives. The BFS held twelvemeetings during the period July 2010 to June 2011.
Table VI.1: Select Financial Indicators(Per cent)
Item End- Scheduled Scheduled All India Primary Non-Banking NBFCs-March Commercial Urban Financial Dealers Financial ND-SI
Banks Co-operative Institutions Companies-DBanks
1 2 3 4 5 6 7 8
CRAR 2010 14.5 12.8 24.2 43.5 22.2 42.12011 14.2 12.7 22.1 46.2 21.0 N.A.
Gross NPAs to Gross Advances 2010 2.5 9.3 0.3 N.A. 2.0 2.52011 2.3 7.4 0.3 N.A. 0.9 1.9
Net NPAs to Net Advances 2010 1.1 4.4 0.1 N.A. - 1.22011 0.9 3.1 0.1 N.A. - 0.8
Return on Total Assets 2010 1.1 0.8 1.2 1.8 1.5 2.02011 1.1 0.9 1.0 1.1 N.A. 2.2
Return on Equity 2010 13.3 N.A. 10.4 6.8 9.0 7.02011 13.7 N.A. 9.2 5.1 N.A. 8.7
Efficiency (Cost/Income Ratio) 2010 45.8 58.8 14.6 31.2 81.8 73.52011 46.0 49.9 19.3 36.1 N.A. 68.7
Interest Spread (per cent) 2010 2.7 N.A. 2.3 N.A. 3.9 1.82011 3.1 N.A. 2.0 N.A. N.A. 1.9
N.A.: Not Available.
Note: 1. Data for 2011 are unaudited and provisional.2. Data for SCBs are excluding LABs.3. Data for SCBs covers domestic operations, except for CRAR.4. Data on CRAR on Scheduled UCBs exclude Madhavpura Mercantile Co-operative Bank Ltd.5. For NBFC-D, data for 2011 pertain to period ended September 2010.
Source: 1. SCBs: Off-site supervisory returns.2. UCBs: Off-site surveillance returns.

ANNUAL REPORT
102
In these meetings, it considered, inter alia, theperformance and the financial position of banks andfinancial institutions during 2009-10. It reviewed 94inspection reports (25 reports of public sector banks,28 of private sector banks, 31 of foreign banks, 4 oflocal area banks, and 6 of financial institutions).During the period, the BFS also reviewed 15summaries of inspection reports pertaining toscheduled urban co-operative banks and 43summaries of financial highlights pertaining toscheduled UCBs classified in Grade I/II. With a viewto fine tuning of supervisory rating, the BFS sought acomplete review of the rating methodology, which iscurrently under process.
VI.15 Based on the recommendations of BFS, aHigh Level Committee (Chairman: Dr. K. C.Chakrabarty) has been constituted to assess theadequacy of the RBI’s supervisory policies,procedures and processes, and suggestenhancements for benchmarking the supervisoryframework to global standards. Further, with a viewto address supervisory concerns arising out ofgrowing volumes as well as complexity of businessof banks, the supervisory processes and theorganisational structure of the Department of BankingSupervision has been reorganised. The supervisoryprocess (both on-site and off-site) in respect of themajor banking groups is being brought together withina division (Financial Conglomerates MonitoringDivision - FCMD) in the department so as to achievebetter synergy and optimum utilisation of availablesupervisory resources. Further a need-basedreorganisation of the other operational areas of theDepartment will also be undertaken.
VI.16 While deliberating on issues relating to theInternal Vigilance Framework in private sector/foreignbanks, the BFS decided, inter alia, that the banksmay be advised to frame their own policy foridentification of sensitive positions at all levels andfor evolving a framework for periodic rotation andmandated leave periods.
VI.17 While deliberating on the issues relating toconstitution and performance of co-operative courtsin different states, BFS had observed that recovery is
treated as dispute under co-operative law, and it wouldbe desirable for UCBs to incorporate in their bye-lawsand loan agreements a provision for settling recoveryof loans internally through an arbitration council setup by the general body. Based on the directions ofthe BFS, the views of the respective Task Forces forCo-operative Urban Banks (TAFCUBs) and those ofthe Legal Department in the matter were obtained.Subsequently, the Secretaries and Registrars of Co-operative Societies of all the State Governments havebeen advised on July 8, 2010 that the State Co-operative Societies Act may be amended for settingup an internal disputes resolution mechanism wherethe Act does not provide for arbitration.
COMMERCIAL BANKS
Regulatory Initiatives
Entry of new banks in the private sector
VI.18 Following the announcement made in theAnnual Policy Statement for 2010-11, a discussionpaper on new bank license was published in August2010 inviting suggestions and comments from allconcerned. Subsequently a gist of such commentsreceived on the discussion paper and the viewsemerged in the discussions with stakeholders wereplaced on the Reserve Bank’s website inDecember 2010. Based on the experience gainedfrom the licensing of new banks under the guidelinesissued in 1993 and 2001 and the comments/suggestions received from the stakeholders andgeneral public, draft guidelines on ‘entry of new banksin the private sector ’ are in the process ofbeing finalised in consultation with the Governmentof India.
Entry of foreign banks
VI.19 A revision to the Reserve Bank’s “Roadmapfor Presence of Foreign Banks in India”, released inFebruary 2005 was due in April 2009. At that juncture,however, the global financial markets were in turmoiland there were uncertainties surrounding the financialstrength of banks around the world. In this backdrop,it was decided to review the roadmap once there was

REGULATION, SUPERVISION AND FINANCIAL STABILITY
103
greater clarity regarding stability and recovery of theglobal financial system. Presently variousinternational fora are engaged in setting out policyframeworks incorporating the lessons learnt from thecrisis. Drawing lessons from the crisis, a discussionpaper on ‘Presence of Foreign Banks in India’ wasreleased in January 2011 seeking feedback /suggestions from stakeholders and general public.The guidelines delineating the road-map for presenceof foreign banks in India would be finalised after takinginto account the feedback/suggestions received fromthe stakeholders.
VI.20 Reserve Bank, however, continues to grantlicenses to foreign banks to open branches in Indiaon a case to case basis. During the year 2010-11,the Reserve Bank issued 4 approvals to foreign banksfor maiden presence in India, taking the total numbersof foreign banks operating in India to 37 as at end-June 2011. Besides, 47 foreign banks have alsorepresentative offices in India.
Basel II – Implementation of advanced approaches
VI.21 In line with the Basel II framework, ReserveBank issued detailed guidelines on AdvancedMeasurement Approach (AMA) for computing capitalcharge for operational risk in April 2011. Banksintending to migrate to AMA were advised to assesstheir preparedness with reference to these guidelines.As and when they are ready for implementation, theymay approach RBI with a notice of intention.
VI.22 All the commercial banks in India wereadvised to continue the parallel run under Basel Iframework till March 31, 2013 subject to review andensure that their Basel II minimum capital requirementis higher than 80 per cent of the minimum requirementunder Basel I.
Basel III
VI.23 Pursuant to the release of the document titled‘Basel III: A global regulatory framework for moreresilient banks and banking system’ by the BCBS inDecember 2010, which becomes operationalbeginning January 2013, banks have been advisednot to issue Tier I and Tier II capital instruments with
‘step up options’, so that such instruments can qualifyfor inclusion in the new definition of regulatory capital(Box VI.4).
Provisioning Coverage Ratio (PCR) for advances andother provisioning requirements
VI.24 As a macroprudential measure, banks wererequired to maintain PCR of 70 per cent of grossNPAs with reference to the position as on end-September 2010. The surplus of the provision overand above the prescribed prudential norms shouldbe segregated into a separate account styled as“countercyclical provisioning buffer” which will beallowed to be used during periods of system-widedownturn with the prior approval of Reserve Bank.This was intended to be an interim measure till suchtime the Reserve Bank introduces a morecomprehensive methodology of countercyclicalprovisioning taking into account the evolvinginternational standards.
VI.25 Reserve Bank increased the provisionrequirements in case of certain categories of non-performing and restructured accounts in May 2011.The provision requirement for ‘sub-standard’ assetswas increased from 10 per cent to 15 per cent. Theprovisioning requirement for unsecured exposure inthis category was increased from 20 per cent to 25per cent. The provisioning in respect of securedportion of advances which have remained in ‘doubtful’category up to one year was increased from 20 percent to 25 per cent, whereas that for advances whichremained ‘doubtful’ between one to three years wasincreased from 30 per cent to 40 per cent.
VI.26 Restructured accounts classified as standardadvances will now attract a provision of 2 per cent inthe first two years from the date of restructuring.In case of moratorium on payment of interest/principal after restructuring, such advances will nowattract a provision of 2 per cent for the periodcovering moratorium and two years thereafter.Restructured accounts classified as NPAs whenupgraded to standard category will now attract aprovision of 2 per cent in the first year from the dateof upgradation.

ANNUAL REPORT
104
In the wake of financial crisis, the Basel Committee onBanking Supervision (BCBS) has initiated several post-crisisreform measures mainly building on the Basel II capitaladequacy framework. The framework was bolsteredsignificantly in July 2009 through a series of enhancementsto each of the three pillars; notably, to address theundercapitalisation of trading book exposures of banks.Subsequently, in December 2010, the BCBS has releasedrevised sets of rules for capital and liquidity regulations viz.‘Basel III: A global regulatory framework for more resilientbanks and banking systems’ and ‘Basel III: Internationalframework for liquidity risk measurement, standards andmonitoring’ which inter alia aim at promoting a more resilientbanking sector and strengthening liquidity regulations.Collectively, the revised Basel II capital framework and thenew global standards have been commonly referred to as“Basel III”.
Though Basel III can be viewed as a modification to Basel IIframework, it differs significantly from Basel II in terms of itscomprehensiveness. More particularly, apart from revisingthe definition of regulatory capital, it is much wider in riskcoverage and encompasses measures to address thesystemic risks. Implementation of Basel III has thrown upsignificant challenges to both banks and the bankingsupervisors alike.
So far as implementation of Basel III in India is concerned,availability of adequate amount of capital, both in terms ofquality and quantity provides significant comfort to beginimplementation of the new framework as per the timeschedule fixed by the BCBS. Nevertheless, RBI has taken anumber of initiatives to ensure smooth transition of the
Box VI.4Initiatives Taken by the Reserve Bank to Migrate Towards the Basel III Norms
banking sector to Basel III framework. RBI’s representationat the Financial Stability Board (FSB), BCBS and their varioussub-groups provides the much needed opportunity tounderstand and contribute to the formulation of policiesrelating to regulation and supervision of the banking sectorat the international level, particularly, Basel III. In order toraise awareness among banks about Basel III, RBI has beenregularly briefing the Chief Executives of banks since RBIbecame member of BCBS in 2009. These meetings alsoprovide an opportunity to RBI to assess the level ofpreparedness of banks to implement Basel III andclarify any issues which they may have in this regard.Other initiatives taken by RBI include organising varioustraining programmes through its training establishments,seminars, meetings and participation in seminars organisedby the Indian Banks’ Association (IBA) and other selfregulatory bodies.
The BCBS is monitoring the impact of Basel III proposalsthrough the semi-annual Quantitative Impact Study (QIS) onbanks. Ten Indian banks are participating in this QIS exercise.The outcome of the QIS will not only give an idea about theimpact of the Basel III rules on Indian banks, but will alsohelp in enhancing the understanding of banks about thesubtle nuances of various aspects of Basel III proposals.
Meanwhile, RBI is examining the Basel III regulations andwill issue guidelines to the extent applicable for banksoperating in India in due course of time. RBI is also workingon operationalisation of Countercyclical Capital Buffer underBasel III. RBI would adhere to internationally agreed phase-in period starting in January 1, 2013 for implementation ofBasel III.
Housing loans by commercial banks – LTV ratio, riskweight and provisioning
VI.27 In order to prevent excessive leveraging inhousing loans portfolio, banks were advised inDecember 2010 that the Loan to Value (LTV) ratio inrespect of housing loans should not exceed 80 percent. However, for small value housing loans, i.e.housing loans up to `20 lakh, the LTV ratio shouldnot exceed 90 per cent. The risk weight for residentialhousing loans of `75 lakh and above, irrespective ofthe LTV ratio, will be 125 per cent. The standard assetprovisioning on the outstanding amount of housingloans at teaser rates was increased from 0.40 percent to 2 per cent. The provisioning on these assetswould revert to 0.40 per cent after one year from thedate on which the rates are reset at higher rates if theaccounts remain ‘standard’.
Credit support to Micro Finance Institutions (MFIs)
VI.28 Considering the fact that the problemsafflicting the Micro Finance Institutions (MFIs) sectorwere not necessarily on account of any creditweakness per-se but were mainly due to exogenousfactors, it was decided in January 2011 that the specialregulatory asset classification benefit could beextended to restructured MFI accounts, which werestandard at the time of restructuring, even if they arenot fully secured. This relaxation was granted purelyas a temporary measure and was applicable tostandard MFI accounts restructured up to March 31,2011. This time line was extended up to June 6, 2011in the case of MFI loans restructured under theconsortium approach adopted by banks and underthe CDR mechanism. The objective was to providesome liquidity support to MFIs and facilitate a ‘holding

REGULATION, SUPERVISION AND FINANCIAL STABILITY
105
on’ operation for some time till appropriate measureswere taken to bring about long term and structuralchanges in the functioning of MFIs.
Prudential norms on investment in Zero CouponBonds
VI.29 It was observed that banks were investing inlong term Zero Coupon Bonds (ZCBs) issued bycorporates including those issued by NBFCs. Sincethe issuers of ZCBs are not required to pay anyinterest or instalments till the maturity of bonds, thecredit risk in such investments would go unrecognisedtill the maturity of bonds and this risk could especiallybe significant in the case of long term ZCBs. Further,since such issuances and investments if done on alarge scale could pose systemic problems, bankswere advised in September 2010 that they should notinvest in ZCBs unless the issuer builds up sinkingfund for all accrued interest and keeps it invested inliquid investments/securities (Government bonds).Banks were also advised to put in place conservativelimits for their investments in ZCBs. Similar guidelineswere also issued for UCBs.
Permanent diminution in the value of investments inbanks’ subsidiaries /joint ventures
VI.30 In the absence of any specific instructions onthe method of assessment/measurement ofpermanent diminution in the value of banks’investments in subsidiaries/ joint ventures which areincluded under ‘Held to Maturity’ (HTM) category,banks were not making any attempt to determinewhether there is any permanent diminution in theirstrategic equity investments held under HTM or‘Available for Sale’ (AFS) categories. In January 2011banks were advised about the circumstances underwhich the need to determine impairment arises andin such an eventuality they would be required to obtainvaluation of such investments by a reputed/qualifiedvaluer and make provision for the impairmentrequired, if any.
Sale of Investments held under HTM category
VI.31 Securities under HTM category are intendedto be held till maturity by the banks and accordingly
are not required to be marked to market. However, itwas observed that many banks were resorting to saleof securities under HTM category, that too frequentlyto take advantage of favourable market conditionsand to book profit. Therefore, banks were advised inAugust 2010 that if the value of sales and transfersof securities to/from HTM category exceeds 5 per centof the book value of investments held in HTM categoryat the beginning of the year, they should disclose inthe notes to accounts to the balance sheet the marketvalue of the investments held in the HTM categoryand indicate the excess of book value over marketvalue for which provision is not made. However, theone-time transfer of securities to/from HTM categorywith the approval of Board of Directors permitted tobe undertaken by banks at the beginning ofaccounting year and sales to RBI under pre-announced OMO auctions, will be excluded from the5 per cent cap mentioned above.
Accounting Procedure for Investment
VI.32 It was observed that banks were not followinga uniform methodology in accounting their investmentin government securities. They were following either‘trade date’ accounting or ‘settlement date’accounting. Therefore, to bring about uniformity, thebanks were advised to follow only the ‘SettlementDate’ accounting. Similar guidelines were also issuedfor UCBs.
Investment in Non-SLR Securities
VI.33 Reserve Bank issued a circular in December2010 permitting banks to invest in non-convertibledebentures (NCDs) with original or initial maturity upto one year issued by corporates (including NBFCs),subject to extant prudential guidelines.
Guidelines on banks’ ALM-Interest Rate Risk
VI.34 Detailed guidelines on banks’ Asset LiabilityManagement (ALM) Framework on Interest Rate Riskwere issued by the Reserve Bank on November 4,2010. In the guidelines, the banks were advised toadopt the Duration Gap Analysis (DGA) for interestrate risk management in addition to the TraditionalGap Analysis (TGA) previously mandated.

ANNUAL REPORT
106
Issue of Irrevocable Payment Commitments (IPCs)
VI.35 Certain risk mitigating measures wereprescribed by the Reserve Bank in September 2010in the context of banks issuing IPCs to various stockexchanges on behalf of mutual funds and FIIs, as atransitory measure up to end-October 2011. Bankswere advised therein to incorporate a clause in theagreement with their clients which gives them aninalienable right over the securities to be received aspayout in any settlement, before November 1, 2010.In view of operational difficulties expressed by somebanks, this deadline was subsequently extended upto end-December 2010.
Revised Business Correspondents (BC) guidelines
VI.36 Guidelines were issued in September 2010,permitting banks to engage companies registeredunder the Companies Act, 1956 (excluding NBFCs)with large and widespread retail outlets as BCs inaddition to the individuals/entities permitted earlier.
Credit card operations of banks
VI.37 Inspite of instructions issued to banks fromtime to time on credit card operations, complaints arereceived from card holders both at Reserve Bank andat the offices of the Banking Ombudsmen. Banks weretherefore, once again advised that if they fail to adhereto the prescribed guidelines, Reserve Bank wouldinitiate suitable penal action, including levy ofmonetary penalties.
Branch authorisation policy
VI.38 In view of the need to step up opening ofbranches in rural areas so as to meet the objectivesof financial inclusion and increased bankingpenetration, banks have been mandated to open atleast 25 per cent of the total number of branchesproposed to be opened during a year in unbankedrural (tier 5 and tier 6) centres.
Fair practices code-disclosure
VI.39 With a view to bringing in fairness andtransparency, banks were advised to disclose to theborrowers all-in cost information inclusive of all
charges involved in processing/sanction of loans inthe loan application in a transparent manner. Bankswere also advised to ensure that the charges/feesare non-discriminatory.
Bank’s participation in trading of Currency Options
VI.40 Pursuant to the issue of guidelines on tradingof currency options on recognised stock/newexchanges, AD category-1 commercial banks fulfillingrequired criteria were permitted to become tradingand clearing members of the exchange tradedcurrency options market of the recognised stockexchanges, on their own account and on behalf oftheir clients. All other SCBs are permitted to participateonly as clients. NBFCs-ND-SI were also permitted toparticipate in the designated currency optionsexchanges recognised by SEBI as clients, only forthe purpose of hedging their underlying forexexposures. UCBs licensed as AD category I wereallowed to participate in the exchange traded currencyoption market of a designated exchange recongnisedby SEBI, only as clients, subject to RBI guidelines.Such participation is allowed only for hedgingunderlying forex exposure arising from customertransactions.
Reopening of pension option- prudential treatment
VI.41 To mitigate the difficulties faced by publicsector banks in absorbing the enhanced expenditurearising on account of enhancement of gratuity limitsand reopening of pension option to their employees,special regulatory dispensation of amortisation wasgranted to such banks and was subsequentlyextended to ten old private sector banks, which cameunder the 9th bipartite settlement under the aegis ofIndian Banks’ Association (IBA). These banks werepermitted to amortise the expenditure over a periodof 5 years beginning with the financial year 2010-11subject to a minimum of 1/5th of the total amount beingamortised every year. Upon the introduction ofInternational Financial Reporting Standards (IFRS)from April 2013 as scheduled, the opening balanceof reserves of banks will be reduced to the extent ofthe unamortised carry forward expenditure. Furtherthe unamortised expenditure shall not include any

REGULATION, SUPERVISION AND FINANCIAL STABILITY
107
amount relating to retired employees. Theunamortised expenditure would not be reduced fromTier I capital, as a special case in view of theexceptional nature of the event.
The Banking Laws (Amendment) Bill, 2011
VI.42 The Banking Laws (Amendment) Bill 2011 hasbeen introduced in Lok Sabha in March 2011. TheBill seeks to amend certain provisions of the BankingRegulation Act, 1949 and the Banking Companies(Acquisition and Transfer of Undertakings) Act of 1970and 1980. The proposed amendments to the BR Actenvisages, inter alia, removal of restriction on votingrights, enabling banking companies to raise capitalin accordance with the international best practices,formation of Depositors’ Education and AwarenessFund, conferring powers on Reserve Bank tosupersede the Board of Directors of a bankingcompany in certain cases, to call for information from/to inspect the associate enterprises of a bankingcompany and to exempt mergers of bankingcompanies from the applicability of the provisions ofthe Competition Act, 2002, thus making the regulatorypowers of RBI more effective.
VI.43 The proposed amendments to theBanking Companies (Acquisition and Transfer ofUndertakings) Act, 1970 and 1980 envisages raisingthe authorised capital of the nationalised banks,enable them to raise capital through right issue/issueof bonus shares and raising the restriction on votingrights.
Supervisory Initiatives
Cross Border Supervision and Co-operation
VI.44 The process of entering into bilateral MoUswith 16 identified jurisdictions/countries for crossborder supervision has been initiated. Out of the 16pre-identified overseas supervisors, MoUs with ChinaBanking Regulatory Commission (CBRC) and DubaiFinancial Services Authority (DFSA), the independentintegrated financial services and market regulatorsof the Dubai International Financial Centre (DIFC),
have been signed. Proposals in respect of 7 otheroverseas supervisors are at various stages offinalisation.
Regulatory and Audit Compliance
VI.45 In view of the concerns about the adequacyof regulatory compliance by foreign banks in India, itwas advised that for all foreign banks operating inIndia, the Chief Executive Officer would beresponsible for effective oversight of regulatory andstatutory compliance as also the audit process andthe compliance thereof in respect of all operations inIndia.
Developments in Fraud Monitoring
VI.46 RBI as a part of its supervisory process alertsthe banks about common fraud prone areas, modusoperandi of frauds and the measures to be taken bythem to prevent/reduce incidence of frauds in bankson an ongoing basis. During 2010-11, the ReserveBank took several measures for strengthening thefrauds monitoring mechanism in banks.
Enhancement of governance of IT security measures
VI.47 A Working Group on Information Security,Electronic Banking Technology, Risk Managementand Cyber Frauds (Chairman: Shri G. Gopalakrishna),was formed by the Reserve Bank following theannouncement in the Annual Monetary PolicyStatement of 2010. Based on the recommendationsof the group and the feedback received fromstakeholders, detailed guidelines were issued to thebanks on April 29, 2011. These guidelines are aimedat enhancing the governance of IT information securitymeasures, cyber frauds, independent assuranceabout the effectiveness of the IT controls and relatedareas.
Internal vigilance in banks
VI.48 In an endeavour to align the vigilance functionin private sector and foreign banks to that of the publicsector banks, detailed guidelines for the former havebeen issued so that all issues arising out of lapses in

ANNUAL REPORT
108
the functioning of the private sector and foreign banksespecially relating to corruption, malpractices, fraudsetc. can be addressed uniformly by the banks fortimely and appropriate action.
Guidelines for prevention of frauds
VI.49 A study was also made across banks toascertain the policy and operating framework in placefor detection, reporting and monitoring of frauds. Thestudy revealed that while the banks do have controlpolicies and processes, these are not well structuredand systematic to ensure proper focus on typical fraudevents. Besides, there was lack of consistency intreatment of transactions having characteristics offraud as also in their reporting to the competentauthority. The banks have been advised to suitablymodify their policies and streamline the operatingframework. In order to ensure close monitoring andtighter controls so as to thwart frauds especially inhousing loan, export finance, loans against fixeddeposit receipts etc., the banks have been asked tostructure their operating framework on three tracksviz. (i) Detection and reporting of frauds (ii) Correctiveaction and(iii) Preventive and punitive action.
URBAN CO-OPERATIVE BANKS
Consolidation through mergers
VI.50 The consolidation of the urban co-operativebanking sector through the process of merger of weakbanks with stronger ones while providing an avenuefor non-disruptive exit to the weak entities has beenset in motion since 2005-06. During last six years,the Reserve Bank has received 158 proposals formerger. The Reserve Bank issued no objectioncertificate (NOC) for 120 cases. Out of the 120 NOCsissued, 95 mergers had actually been effected uponthe issue of statutory orders by the Central Registrarof Co-operative Societies (CRCS)/Registrar of Co-operative Societies (RCS) of the State concerned. Outof the 95 mergers, 59 UCBs had negative net worth.Profit making UCBs were also permitted to mergewith other financially strong UCBs with the aim ofconsolidation and strengthening the sector.
Transfer of assets and liabilities of UCBs toCommercial Banks
VI.51 Certain financially weak UCBs with relativelybigger size balance-sheets (i.e. Tier II UCBs) couldnot opt for mergers as there were no willing UCBs totake over such UCBs with higher accumulated losses.To overcome this problem, specific guidelines abouttransfer of certain assets and liabilities with mutualconsent of both the UCB and the interested SCBswere issued for the first time in February 2010. So farthere have been two such cases of transfer of assetsand liabilities of UCBs to SCBs. Specific assets andliabilities of Shree Suvarna Sahakari Bank Ltd., Punewere taken over by the Indian Overseas Bank andsimilarly the assets and liabilities of the Memon Co-operative Bank Ltd., Mumbai were taken over by theBank of Baroda.
Unlicensed UCBs and licensing of new UCBs
VI.52 Based on the guidelines issued by the BFS inAugust 2009, a review of unlicensed UCBs was madeand 51 UCBs have been granted banking licenses.As on March 31, 2011, there are four unlicensedbanks and review in respect of these UCBs is inprogress. Further, the Reserve Bank has constitutedan expert committee for studying the advisability ofgranting new urban cooperative banking licenses(Box VI.5).
Maximum limits on unsecured loans and advances
VI.53 The maximum limits for grant of unsecuredloans by the UCBs (with or without surety or forcheque purchase) for individual and group borrowerswere enhanced suitably keeping in view the twincriteria of capital adequacy (CRAR) and size ofdemand and time liabilities (DTL) of the UCBs. Theenhanced limits ranged between `0.25 lakh (for UCBwith DTL up to `10 crore and CRAR below nine percent) and `5.00 lakh (for UCB with DTL above `100crore and CRAR above nine per cent). The totalunsecured loans and advances granted by an UCBare limited to 10 per cent of its total assets as peraudited balance sheet as on 31 March of thepreceding financial year.

REGULATION, SUPERVISION AND FINANCIAL STABILITY
109
Share linking to borrowing norm in UCBs
VI.54 UCBs which maintain a minimum capital torisk-weighted assets ratio (CRAR) of 12 per cent ona continuous basis were exempted from themandatory share linking norms.
Credit exposure to housing and commercial realestate sectors
VI.55 The permitted credit exposure of UCBs tohousing, real estate and commercial real estatesectors was revised from the earlier limit of 15 percent of deposits to 10 per cent of their total assets.This limit of 10 per cent could be exceeded by anadditional limit of five per cent of total assets inhousing loans to individual up to `15 lakh.
Extension of area of operation of UCBs
VI.56 All financially sound and well managed UCBshaving minimum assessed net worth of `50 crore,subject to meeting other norms, were permitted toextend their area of operation beyond the State oforiginal registration as also to any other States of their
choice. Further if such UCBs have acquired weakbanks in other States, they would be allowed to extendtheir area of operation to the entire State of registrationof the target bank.
Liberalised norms for opening of branches by UCBs
VI.57 All financially sound and well managed UCBshaving required headroom capital in terms of assessednet worth per branch including existing branches andsatisfying other criteria were allowed to openbranches/extension counters beyond the annualceiling of 10 per cent of existing branch network.
Use of business correspondents/ business facilitatorsby UCBs
VI.58 With the objective of ensuring greater financialinclusion and increasing the outreach of the UCBs inproviding basic and affordable banking services intheir area of operation, it was decided to considerrequests from well managed and financially soundUCBs to engage business facilitator/businesscorrespondent using ICT solutions.
In the light of the past experience regarding newly licensedUCBs becoming financially unsound in short span of timeand the prevailing precarious financial health of the UCBsector, the Reserve Bank issued a comprehensive policy in2005 on UCBs with a view to improving the financial healthof this sector. It was also decided not to issue any freshlicences thereafter for new UCBs. The Reserve Bank enteredinto memoranda of understanding (MoU) with all StateGovernments and the Central Government for coordinationof regulatory policies and encouraged voluntary consolidationin the sector by merger of non-viable UCBs with financiallysound and well managed UCBs. Pursuant to these policies,the share of financially sound banks has increased from 61.3per cent in 2005 to 80.3 per cent in 2010. As the financialposition of the sector improved considerably, UCBs werepermitted to enter into new areas of business.
Against this backdrop a Committee (Chairman: Shri Y. H.Malegam), has been set up for studying the advisability ofgranting new urban co-operative banking licences. Further,as announced in the Second Quarter Review of MonetaryPolicy 2010-11, the Committee was advised to look into thefeasibility of an umbrella organisation for the UCB sector.
Box VI.5Expert Committee on Licensing of New Urban Cooperative Banks
The terms of references of the Committee are as under:
i) To review the role and performance of UCBs over thelast decade and especially since the adoption of Visiondocument in 2005,
ii) To review the need for organisation of new UCBs in thecontext of the existing legal framework for UCBs, thethrust on financial inclusion in the economic policy andproposed entry of new commercial banks into thebanking space,
iii) To review the extant regulatory policy on setting up ofnew UCBs and lay down entry point norms for new UCBs,
iv) To examine whether licensing could be restricted onlyto financially sound and well managed cooperative creditsocieties through conversion route,
v) To make recommendations relating to the legal andregulatory structure to facilitate the growth of soundUCBs especially in the matter of raising capital consistentwith co-operative principles.
vi) To examine the feasibility of an umbrella organisationfor the UCB Sector.
vii) To examine other issues incidental to licensing of UCBsand make appropriate recommendations.

ANNUAL REPORT
110
Collection of account payee cheques
VI.59 With a view to mitigating the difficulties facedby the members of co-operative credit societies incollection of account payee cheques, UCBs werepermitted to collect account payee cheques drawnfor an amount not exceeding `50,000 to the accountof their customers who are co-operative creditsocieties, if the payees of such cheques are theconstituents of such co-operative credit societies.
RURAL CO-OPERATIVES
Package for revival of Rural Co-operatives
VI.60 Based on the recommendations of the TaskForce on Revival of Rural Co-operative CreditInstitutions (Chairman: Prof. A. Vaidyanathan) and inconsultation with state governments, the centralgovernment had approved a package for revival ofrural co-operatives at the apex level. An aggregateamount of `8,993 crore has been released byNABARD up to June 30, 2011 towards Governmentof India’s share for recapitalisation of PACS in sixteenStates while the State Governments have alsoreleased `854 crore as their share.
Licensing of Rural Co-operative Banks
VI.61 The Annual Policy Statement of April 2009 hadannounced a roadmap for licensing of unlicensedstate and central co-operative banks in a non-disruptive manner and revised guidelines were issuedfor the same in October 2009. Subsequent to theissuance of revised guidelines, 10 StCBs and 160DCCBs have been licensed taking the total numberof licensed StCBs and DCCBs to 24 and 235respectively as at end-June, 2011. Efforts are beingmade to ensure that the remaining unlicensedbanks meet the criteria for licensing by the stipulateddate.
Raising RRB branches to CBS platform
VI.62 The Working Group of TechnologyUpgradation in Regional Rural Banks (RRBs)
(Chairman: Shri G. Srinivasan) had recommendedthat CBS should be fully implemented in all RRBs bySeptember 2011. As on date, out of total 82 RRBs,CBS has been fully implemented in 45 RRBs while inremaining 37 it is in progress.
DEPOSIT INSURANCE AND CREDITGUARANTEE CORPORATION
VI.63 Deposit insurance constitutes an importantelement in preventing any runs on the banks due tounforeseen events. Deposit Insurance and CreditGuarantee Corporation (DICGC) is a wholly ownedsubsidiary of Reserve Bank of India. Depositinsurance extended by DICGC covers all commercialbanks, including Local Area Banks (LABs) andRegional Rural Banks (RRBs) in all the States andUnion Territories (UTs). All Co-operative Banks acrossthe country except three UTs of Lakshadweep,Chandigarh, and Dadra and Nagar Haveli are alsocovered by deposit insurance. The number ofregistered insured banks as on March 31, 2011 stoodat 2,217 comprising 82 Commercial Banks, 82 RRBs,4 LABs and 2,049 Co-operative Banks. With thepresent limit of deposit insurance in India at `1 lakh,the number of fully protected accounts (977 million)as on March 31, 2011 constituted 93 per cent of thetotal number of accounts (1,052 million) as againstthe international benchmark1 of 80 per cent. Amount-wise, insured deposits at ̀ 17,35,800 crore constituted35 per cent of assessable deposits at `49,52,427crore against the international benchmark1 of 20 to40 per cent. At the current level, the insurance coverworks out to 1.63 times per capita GDP as on March31, 2011 as against the international benchmark ofaround 1 to 2 times per capita GDP prior to thefinancial crisis.
VI.64 The Corporation builds up its DepositInsurance Fund (DIF) through transfer of its surplus,i.e., excess of income (mainly comprising premiareceived from insured banks, interest income frominvestments and cash recovery out of assets of failedbanks) over expenditure each year, net of taxes. This
1 : Accepted as a Rule of Thumb at the First Annual Conference of the International Association of Deposit Insurers (IADI) in Basel, Switzerlandin May 2002
REGULATION, SUPERVISION AND FINANCIAL STABILITY
111
fund is used for settlement of claims of depositors ofbanks taken into liquidation/reconstruction/amalgamation, etc. During the year 2010-11, theCorporation settled aggregate claims for `379 crorein respect of a commercial bank (supplementaryclaim) and 73 Co-operative Banks (28 original claimsand 45 supplementary claims) as compared withclaims for around ̀ 655 crore during the previous year.The size of the DIF stood at ̀ 24,704 crore as on March31, 2011, yielding a Reserve Ratio (DIF/insureddeposits) of 1.4 per cent.
VI.65 An assessment team comprisingrepresentatives of IADI and IMF visited DICGC in end-September 2010 to undertake a field test of the DraftAssessment Methodology for Core Principles forEffective Deposit Insurance Systems. According tothe assessment of the team, DICGC is compliant orlargely compliant with about half of the 18 coreprinciples for ‘effective deposit insurance systems’.In its “paybox” function, the DICGC is fully or largelycompliant on all core principles. However,weaknesses in the overall insolvency frameworkwhich are outside the control of the DICGC makesoverall compliance with many core principles limited.The report made several recommendations such asremoving insolvent co-operative banks from thesystem, obtaining deposit-specific information frombanks in a standard format, executing MoUs byDICGC with other deposit insurers whose banks havea presence in India, granting DICGC an access to a“fast-track” source of funding from either RBI orMinistry of Finance (MoF) to provide funds neededfor prompt depositor reimbursement, developing aformal public awareness programme and establishinga reasonable target reserve fund by DICGC. TheWorking Group on Reforms in Deposit Insurance,including Amendments to DICGC Act, would belooking into the recommendations of the field testteam.
BANKING CODES AND STANDARDSBOARD OF INDIA
VI.66 The membership of BCSBI has grown from67 banks in 2006 to 112 banks in 2011 and the
membership of 14 more banks is under process.During the year, BCSBI undertook a Survey of 1,000branches and 135 hubs of 49 member banks(excluding RRBs and Urban Co-operative Banks),spread over 22 cities in India, to independently verifycompliance with the provisions of the Code of Bank'sCommitment to Customers and Code of Bank'sCommitment to Micro and Small Enterprises. Morethan 2,000 customers were also interviewed at thebranches to obtain their responses. In general, theSurvey findings reveal perceptible improvement incustomer service.
NON-BANKING FINANCIAL COMPANIES
VI.67 As announced in the Annual Policy 2010-11,the regulatory framework for Core InvestmentCompanies (CICs) was announced (Box VI.6).
Provision of 0.25 per cent for standard assets ofNBFCs
VI.68 In the interest of counter cyclicality and alsoto ensure that NBFCs create a financial buffer as aprotection from the effect of economic downturns,provisioning for standard assets was introduced toNBFCs at 0.25 per cent of the outstanding standardassets.
Participation in currency futures
VI.69 NBFCs (excluding residuary non-bankingcompanies (RNBCs)) were allowed to participate inthe designated currency futures exchangesrecognised by SEBI as clients only for the purpose ofhedging their underlying forex exposures. NBFCswere advised to make appropriate disclosuresregarding transactions undertaken in the balancesheet.
Exemption for Long Term Infrastructure FinanceBonds
VI.70 Amount raised by issue of infrastructure bondsby Infrastructure Finance Companies, shall not betreated as ‘public deposit’ under the ‘Non-BankingFinancial Companies Acceptance of Public Deposits(Reserve Bank) Directions, 1998.

ANNUAL REPORT
112
Amendment to Definition of Infrastructure Loan
VI.71 NBFCs were advised to include telecomtowers also as an infrastructure facility for availingcredit facility. Further NBFCs were advised that onlyCredit Rating Agencies (CRAs) approved by theReserve Bank can give the rating to InfrastructureFinance Companies (IFCs).
NBFCs not to be Partners in Partnership firms
VI.72 In view of the risks involved in NBFCsassociating themselves with partnership firms, it was
decided to prohibit NBFCs from contributing capitalto any partnership firm or to be partners in partnershipfirms. In cases of existing partnerships, NBFCs wereadvised that they may seek early retirement from thepartnership firms.
Loan facilities to the physically / visually challenged
VI.73 NBFCs were advised that there should be nodiscrimination in extending financial products andfacilities including loan facilities to the physically/visually challenged applicants on grounds of disability
Core Investment Company (CIC) is a non-banking financialcompany carrying on the business of acquisition of sharesand securities and which (a) holds not less than 90 per centof its net assets in the form of investment in equity shares,preference shares, bonds, debentures, debt or loans in groupcompanies and (b) its investments in the equity shares ingroup companies constitutes not less than 60 per cent of itsnet assets as on the date of the last audited balance sheet.
CICs were not required to obtain Certificate of Registration(CoR) from Reserve Bank under Section 45 IA of the RBIAct 1934. In practice however, it proved very difficult todetermine whether a company has invested in the shares ofanother company for the purpose of holding stake or for thepurpose of trade. It was therefore decided that investing inshares of other companies, even for the purpose of holdingstake should also be regarded as carrying on the businessof acquisition of shares. Furthermore, in view of the peculiarbusiness model of CICs, viz., holding stake in groupcompanies and funding group concerns, CICs find it difficultto comply with the extant net owned fund (NOF) requirementsand exposure norms for NBFCs prescribed by the ReserveBank. Considering these issues, a revised regulatoryframework for CICs was announced in August 2010. Thesalient features of the framework are as follows:
i) Core Investment Companies (CIC) with an asset size ofless than `100 crore will be exempted from therequirements of registration with RBI. For this purposeall CICs belonging to a Group will be aggregated.
ii) CICs with asset size above Rs. 100 crore but notaccessing public funds are also exempted from therequirement of registration with RBI.
iii) Due to systemic implications on account of access topublic funds (such as funds raised through CommercialPaper, debentures, inter-corporate deposits andborrowings from banks/FIs), CICs having asset size of
Box VI.6Regulatory Framework for Core Investment Companies (CICs)
100 crore or above are categorised as SystemicallyImportant Core Investment Companies (CICs-ND-SI)and are required to obtain CoR from the Reserve Bank.
iv) Every CIC-ND-SI shall ensure that at all times itmaintains a ‘minimum capital ratio’ whereby its adjustednet worth shall not be less than 30 per cent of itsaggregate risk weighted assets and risk adjusted valueof off-balance sheet items.
v) Every CIC-ND-SI shall ensure that its outside liabilitiesat all times shall not exceed 2.5 times its adjusted networth.
vi) A CIC-ND-SI which adheres to the requirementsregarding capital and leverage ratio as specified at (iii)and (iv) above, may to the extent necessary, beexempted from compliance with maintenance of statutoryminimum NOF and requirements of “Non-BankingFinancial (Non-Deposit accepting or holding) CompaniesPrudential Norms (Reserve Bank) Directions, 2007”including requirements of capital adequacy and exposurenorms.
In view of the changed regulatory framework, all CICs-ND-SI, irrespective of whether they were specifically exemptedin the past from registration with the Reserve Bank or not,were directed to apply for obtaining the CoR. In order tooperationalise the changed policy environment in a non-disruptive manner, companies which apply for CoR withinthe stipulated time were directed to carry on the existingbusiness till the disposal of their application by the ReserveBank. However, companies which fail to apply for the CoRwithin the stipulated period will be regarded as contraveningthe provisions of Section 45IA of the Reserve Bank of IndiaAct, 1934. Companies which presently have an asset sizeof less than `100 crore would be required to apply to RBI forCoR within three months of the date of achieving a balancesheet size of `100 crore.
REGULATION, SUPERVISION AND FINANCIAL STABILITY
113
and all possible assistance may be provided to suchcustomers.
Applicability of exemption from concentration norms
VI.74 Under the extant instructions, any NBFC-ND-SI not accessing public funds, either directly orindirectly, may make an application to the ReserveBank for modifications in the prescribed ceilings withregard to concentration of credit/investment norms.NBFCs-ND-SI may also be issuing guaranteesand devolvement of these guarantees mightrequire access to public funds. Accordingly, anyNBFC-ND-SI not accessing public funds, eitherdirectly or indirectly, or not issuing guarantees mayapproach Reserve Bank of India for appropriatedispensation.
Enhancing CRAR to fifteen per cent
VI.75 It was decided to align the minimum capitalratio of all deposit taking NBFCs as well as NBFCs-ND-SI to 15 per cent. Accordingly, all deposit takingNBFCs were advised to raise the minimum capitalratio consisting of Tier I and Tier II capital, which shallnot be less than 15 per cent of its aggregate riskweighted assets on balance sheet and risk adjustedvalue of off-balance sheet item with effect from March31, 2012.
Review of guidelines on entry of NBFCs intoinsurance business
VI.76 As per extant instructions, NBFCs registeredwith the Reserve Bank and satisfying the eligibilitycriteria will be permitted to set up a joint venture (JV)company for undertaking insurance business with riskparticipation. The maximum equity contribution anNBFC can hold in a JV company is 50 per cent of itspaid-up capital. In case more than one company(irrespective of doing financial activity or not) in thesame group of NBFC wishes to take a stake in theinsurance company, the contribution by all companiesin the same group shall be counted for the limit of 50per cent prescribed for the NBFCs in an insurance JV.
Opening of branch/subsidiary/ joint venture/representative office or undertaking investmentabroad by NBFCs.
VI.77 Presently, an Indian party requires priorapproval of the concerned regulatory authorities bothin India and abroad, to make an investment in an entityoutside India engaged in financial services activities.No-objection certificate will be issued by ReserveBank to the NBFC before opening of subsidiary/jointventure/representative office or undertaking investmentabroad subject to the NBFC fulfilling the conditionsspecified by Reserve Bank on June 14, 2011.

114
VII.1 The financial year 2010-11 was characterisedby rising inflationary pressure and tight liquidityconditions coupled with successive hikes in policyrates. The Reserve Bank, as the Government’s debtmanager conducted the market borrowingprogramme smoothly, guided by the twin objectivesof minimisation of cost over time and pursuit ofmaturity profiles that are consistent with low rolloverrisk. The market borrowing programme of the CentralGovernment was completed successfully during2010-11, with the net amount raised through datedsecurities being lower by around 18 per cent thanthat in the previous year.
VII.2 During 2010-11, the one-off revenue items like3G and broadband wireless access (BWA) auctionsled to the accumulation of large Governmentbalances, and the market borrowing programme wasmodulated accordingly. During 2010-11, the increasein key policy rates and a rise in inflationaryexpectations impacted the cost of market borrowings.Further, the unanticipated build-up of surplus cashbalances with the Government following the front
loading of receipts and the back loading ofexpenditure resulted in frictional liquidity mismatchesin the financial system that had implications for theGovernment’s borrowing costs.
DEBT MANAGEMENT OF CENTRALGOVERNMENT
Market Borrowings
VII.3 The gross and net amounts raised throughdated securities in 2010-11 were lower by around 3per cent and 18 per cent, respectively, than thoseraised in the previous year (Table VII.1). A majorchallenge for the Reserve Bank, during 2010-11 wasthe management of the government market borrowingprogramme in a situation of tight liquidity conditionsand rise in inflationary expectations. Nonetheless,one-off revenue items like 3G and BWA auctions ledto an accumulation of large Government balances,which in turn, contributed to lower market borrowingsduring the year. The Reserve Bank’s purchases ofGovernment securities amounting to around ̀ 67,200crore through open market operations (OMOs), aimed
VII PUBLIC DEBT MANAGEMENT
A major challenge for the Reserve Bank of India during 2010-11 was the management of market borrowing
programme of both the Government of India and the State Governments in a situation of increasing inflationary
pressure and tight liquidity conditions. The inflationary pressures and successive hikes in policy rates alongwith large
issuances exerted pressure on the yield, particularly at the shorter end. The cost of borrowing, however, was largely
contained by a judicious mix of maturities and yield, among others.
Table VII.1: Gross and Net Market Borrowings of the Central Government#(` crore)
Item 2009-10 2010-11 2011-12
Budget Revised Actual Budget Revised Actual Budget Actual@Estimate Estimate Estimate Estimate Estimate
1 2 3 4 5 6 7 8 9
Gross borrowing 4,91,044 * 4,92,368 * 4,92,497 4,98,635 4,88,595 4,79,482 4,69,738 1,97,203
Net Borrowing 3,97,957 * 3,94,229 * 3,94,358 3,45,010 3,35,512 3,26,398 3,53,128 1,33,354
(i) Dated Securities 3,97,957 * 3,98,411 * 3,98,411 * 3,45,010 3,35,414 3,25,414 3,43,000 1,20,527
(ii) 364-day TBs – -4,182 -4,053 – 98 984 10,128 12,827
#: Dated securities and 364-day Treasury Bills. *: Includes MSS de-sequestering. @: Up to July 31, 2011.

PUBLIC DEBT MANAGEMENT
115
at addressing the structural liquidity mismatch, interalia, facilitated the completion of large Governmentmarket borrowing during 2010-11.
VII.4 During 2010-11, in order to contain inflationarypressures, the Reserve Bank increased the key policyrates, which had an impact on the cost ofGovernment’s market borrowings. The weightedaverage yield of dated securities rose to 7.92 per centin 2010-11 from 7.23 per cent in 2009-10. Theweighted average coupon on the outstanding stockof Government dated securities, however, declinedmoderately to 7.81 per cent as on March 31, 2011from 7.89 per cent as on March 31, 2010 (Table VII.2).
VII.5 The yield curve turned increasingly flat duringthe course of 2010-11 as reflected in the significantdecline in the yield spreads. A large volume of longdated securities was issued during the second half inconsonance with the yield curve movements. During2010-11, 37.53 percent of the market borrowings wereraised through issuance of dated securities withresidual maturity of 10-14.99 years as compared to
21.77 per cent in 2009-10 (Table VII.3). As a result,the weighted average maturity of debt issuancesduring 2010-11 increased to 11.62 years from 11.16years during the previous year.
VII.6 The weighted average maturity of theoutstanding stock (based on residual maturity)decreased fractionally to 9.78 years as on March 31,2011 from 9.82 years as on March 31, 2010.
VII.7 The Reserve Bank continued with the UniformPrice based auctions of Central Government datedsecurities during 2010-11 with a view to facilitatingaggressive bidding by the market participants in anenvironment of uncertain market conditions. Floatingrate bonds (FRBs) amounting to `3,000 crore wereissued during 2010-11 as against `5,000 crore in2009-10.
VII.8 The Central Government issued 8.01 per cent‘Postal Life Insurance Government of India SpecialSecurity 2021’ for `4,000 crore (nominal) and 8.08per cent ‘Postal Life Insurance Government of India
Table VII.2: Central Government’s Market Loans - A Profile#(Yield in per cent / Maturity in years)
Year Range of YTMs at Primary Issues Issues during the year Outstanding Stock
under 5 5-10 Over 10 Weighted Range of Weighted Weighted Weightedyears years years Average Maturities Average Average Average
Yield Maturity Maturity Coupon
1 2 3 4 5 6 7 8 9
2008-09 7.71-8.42 7.69-8.77 7.77-8.81 7.69 6-30 13.8 10.45 8.23
2009-10 6.09-7.25 6.07-7.77 6.85-8.43 7.23 5-30 11.16 9.82 7.89
2010-11 5.98-8.67 7.17-8.19 7.64-8.63 7.92 5-30 11.62 9.78 7.81
#: Excludes issuances under MSS; YTM: Yield to Maturity.
Table VII.3: Issuance of GoI Dated Securities - Maturity Pattern(` crore)
Residual Maturity 2008-09 2009-10 2010-11
Amount Percentage Amount Percentage Amount Percentageraised to total raised to total raised to total
1 2 3 4 5 6 7
Less than 5 years – – 52,000 12.44 11,000 2.52
5 - 9.99 years 77,000 29.5 1,80,000 43.06 1,52,000 34.78
10 -14.99 99,000 37.93 91,000 21.77 1,64,000 37.53
15 -19.99 years 14,000 5.36 39,000 9.33 54,000 12.36
20 years & above 71,000 27.2 56,000 13.4 56,000 12.81
Total 2,61,000 100 4,18,000 100 4,37,000 100
ANNUAL REPORT
116
Special Security 2023’ for `3,000 crore on March 31,2011. The Reserve Bank permitted with effect fromApril 1, 2011 transfer of/trading in the Power Bondsmaturing on October 1, 2015 and April 1, 2016, issuedby various States to the Central Public SectorUndertakings (CPSUs) in terms of the TripartiteAgreement among 27 State Governments, Ministryof Power, Central Government and the Reserve Bankunder One Time Settlement Scheme for dues of StateElectricity Boards. The Central Governmentrepurchased the Fertilizer Bonds issued to variousFertilizer Companies amounting `5,763 crore (facevalue), in the first tranche of such repurchase, heldon March 31, 2011 and `6,032 crore in the secondtranche, held on July 26, 2011.
VII.9 As per the Union Budget 2011-12, thegross market borrowings of the Centre throughdated securities for 2011-12 are estimated at`4,17,128 crore (net `3,43,000 crore). The issuancecalendar for dated securities for the first half of 2011-12 was issued in consultation with the CentralGovernment on March 25, 2011. An amount of`2,50,000 crore is scheduled to be raised duringthe first half of 2011-12 as against `2,84,000 croreraised during the corresponding period of the previousyear.
VII.10 Although the gross market borrowings of theCentral Government through dated securities for2011-12 are budgeted 4.6 per cent lower than theprevious year, the net market borrowings would behigher than the previous year by 5.4 per cent. TheCentral Government has raised a large part of thescheduled borrowing programme during 2011-12 (upto July 31, 2011) (Table VII.1). The weighted averageyield of dated securities issued during 2011-12 (up toJuly 31, 2011) was higher at 8.38 per cent ascompared with 7.67 per cent during the correspondingperiod of the previous year.
Cash Management
VII.11 The Government started the year 2010-11 witha modest cash balance of `16,514 crore, but soontook recourse to WMA on April 6, 2010 due to itsexpenditure commitments. Having breached the
WMA ceiling of `30,000 crore for the first half, theGovernment resorted to OD during April 23-25, 2010.The Government again entered into OD on May 14,2010 for a day and continued with WMA up to May30, 2010. To tide over temporary cash mismatches,Cash Management Bills (CMBs) to the tune of`12,000 crore were issued in two tranches of `6,000crore each for 35 days and 28 days, respectively,during May 2010. After recording a positive cashbalance on May 31, 2010, the Government revertedto WMA on September 4 and 5, 2010. Overall, theGovernment availed of OD for three days and WMAfor 57 days during 2010-11.
VII.12 The Government’s cash balances remainedpositive for most part of the year on account of the 3-G spectrum auction receipts and buoyant taxcollections. As part of cash management, theGovernment bought back dated securities to the tuneof `11,767 crore in 2010. The surplus transfer fromthe Reserve Bank to the Government amounting to`18,759 crore on August 12, 2010 boosted theGovernment’s cash balance to `37,916 crore on thatday. The Government’s cash balance graduallyreached the peak at ̀ 1,61,101 crore as on December27, 2010. The WMA ceilings for the CentralGovernment for 2010-11 were fixed at `30,000 crorefor the first half and ̀ 10,000 crore for the second half.During 2011-12, due to the elevated temporarymismatches in the Central Government cash balance,inter alia, reflecting tax refunds, the WMA limits wererevised to `30,000 crore for April 1, 2011 to April 20,2011, `45,000 crore for April 21, 2011 to June 30,2011, `30,000 crore for July 1, 2011 to September30, 2011 and `10,000 crore for the second half of theyear (October to March).
VII.13 In order to meet the emergent temporary cashflow mismatches, the Reserve Bank in consultationwith the Government issued CMBs amounting to`58,000 crore during April-July 2011-12 (`12,000crore in April-July 2010-11). Moreover, the notifiedamount for issuance of Treasury bills was increasedby `61,000 crore over and above the rollover amountduring April-July 2011-12 (Chart VII.1).

PUBLIC DEBT MANAGEMENT
117
crore. Taking into account the repayments of `15,641crore and additional allocation of `5,971 crore, thegross allocation amounted to `1,63,769 crore (whilegross sanctions under Article 293(3) amounted to`1,09,063 crore). The State Governments raised agross amount of ̀ 1,04,039 crore in 2010-11 as against`1,31,122 crore in the previous year (Table VII.4).Since 2005-06, the entire market borrowings of StateGovernments have been by way of issuances of 10-year securities. Hence, securities issued in 2010-11would mature in 2020-21 (Table VII.5). ArunachalPradesh, Chhattisgarh, Orissa and Sikkim did notparticipate in the market borrowing programme in2010-11 as against one State (viz., Orissa) in 2009-10. Four States did not raise their full sanctions in2010-11 as against five States in 2009-10.
VII.16 The weighted average yield of StateGovernment securities issued during 2010-11 stoodhigher at 8.39 per cent as compared to 8.11 per centduring the previous year (Table VII.6). The weightedaverage spread (i.e., the difference between theweighted average primary market yield of SDL on theday of auction and the secondary market yield ofcorresponding maturity of Central Government datedsecurity on the same day) declined to 45 bps duringthe year from 86 bps during the previous year. Thelower spread during 2010-11 reflected several factorsincluding lower market borrowings on account ofcomfortable cash position of the States, the lower
VII.14 In order to discharge its functions as a bankerto the Central and State Governments more effectivelyand efficiently, the Reserve Bank has initiated a seriesof measures at the operational and technologicallevels in the recent years (Box VII.1)
DEBT MANAGEMENT OF STATEGOVERNMENTS
Market Borrowings
VII.15 The market borrowing programme of the StateGovernments was conducted smoothly during 2010-11. The gross market borrowings were lower thanthose of the previous year. The net allocation underthe market borrowing programme for StateGovernments for 2010-11 was placed at `1,42,157
Table VII.4: States’ Market Borrowings(`crore)
Item 2009-10 2010-11
1 2 3
Net Allocation 1,02,458 1,42,157Additional Allocation 2,679 5,971Maturities during the year 16,238 15,641Gross Allocation 1,21,375 1,63,769Gross Sanctions under Article 293 (3) 1,36,948 1,09,063Gross Amount Raised during the Year@ 1,31,122 1,04,039Net Amount Raised during the Year 1,14,883 88,398Amount Raised during the year as a% of Total Sanctions 95.8 95.4
@ An amount of `500 crore was auctioned on March 31, 2010.
Table VII.5: Residual Maturity Profile ofOutstanding State Development Loans and
Power Bonds (as at end-March 2011)(`crore)
Year of State Power TotalMaturity Development Loans Bonds
1 2 3 4
2011-12 21,989 1,453 23,4422012-13 30,628 2,870 33,4982013-14 32,079 2,870 34,9492014-15 33,384 2,870 36,2542015-16 35,191 2,785 37,9762016-17 31,522 1,575 33,0972017-18 67,779 – 67,7792018-19 1,18,138 – 1,18,1382019-20 1,30,622 – 1,30,6222020-21 1,04,539 – 1,04,539Total 6,05,871 14,423 6,20,294
Chart VII.1: Cash Balance of the CentralGovernment
-60000
-40000
-20000
0
20000
40000
60000
80000
100000
120000
140000
160000
1-A
pr
22-A
pr
13-M
ay
3-J
un
24-J
un
15-J
ul
5-A
ug
26-A
ug
16-S
ep
7-O
ct
28-O
ct
18-N
ov
9-D
ec
30-D
ec
20-J
an
10-F
eb
3-M
ar
24-M
ar
`C
rore
2011-12 2009-10 2010-11
ANNUAL REPORT
118
The Reserve Bank acts as a banker to the Central and theState Governments in terms of provisions of sections 20, 21& 21 (A) of the Reserve Bank of India Act, 1934. The ReserveBank carries out the general banking business of theGovernments through its own offices and branches of publicsector banks and a few private sector banks (viz. HDFC BankLtd., ICICI Bank Ltd. and the Axis Bank Ltd.) which act asthe Agency Banks. The various measures initiated by theReserve Bank for further improvement in its functionalresponsibilities in this regard are summarised below.
• The Public Accounts Departments (PADs) at all theRegional Offices of the Reserve Bank which maintain andoperate the accounts of Government departments havenow switched over from the erstwhile stand-alonesystem to a more robust and secured CentralisedWeb-based application viz., the Centralised PublicAccounts Department System (CPADS) for its operations.The CPADS is a user friendly application with multiplefacilities.
• For more safe, secure and efficient banking transactions,as a proactive stance, the Reserve Bank has beenimpressing upon the Government departments to switchover to electronic modes for effecting their payments andreceipts through various e-products such as NEFT, NECS/RECS, RTGS, etc. which are provided by the AgencyBanks. The Regional Offices of the Reserve Bank play apivotal and pro-active role in offering NEFT facility forremittance of funds to the account holders. As a result, anumber of Central and State Government departmentshave switched over to internet mode of collection of taxes.In the State Finance Secretaries’ Conference held atMumbai in May 2011, the State Governments were alsourged upon to draw a roadmap for switching over to e-mode of receipts and payments in a phased and timebound manner.
• As a facilitator to e-payment initiatives of Government ofIndia, the Reserve Bank has also reviewed theperformance of the Agency Banks under OLTAS (On LineTax Accounting System) of the Central Board of DirectTaxes (CBDT) and EASIEST (Electronic AccountingSystem in Excise and Service Tax) of the Central Boardof Excise and Customs (CBEC) on various parameters.Accordingly, the Agency Banks, whose performanceswere not satisfactory in this regard, were advised toimprove their position.
• The Reserve Bank launched an e-payment system in May2011 for collection of commercial taxes of Government ofKarnataka on the lines of Electronic Accounting Solutionsfor e-Receipts (EASeR) Model of CBEC.
• To provide a platform to the top functionaries of the CentralGovernment, the Reserve Bank, Agency Banks, IBA,NSDL, etc. for discussions on various issues, the ReserveBank has conceptualized and formalized the “High LevelMeeting” as a forum, which takes stock of various issuesconcerning conduct of Government Business through RBI/Agency Banks and provides inputs for policy making.
• The Reserve Bank has been instrumental in playing apivotal role to ensure timely remittance of funds to theGovernment accounts. Accordingly, in consultation withthe Government, the Reserve Bank prescribes as well asreviews the time limit for remittance of funds collected forcredit to the Government accounts by Agency Banks andalso the rate of penal interest in case of non-compliancewith the prescribed norms. The period of remittance forelectronic receipts has been brought down to T+1 daysfor all Agency Banks with effect from November 2010.
• In terms of the recommendations of a Committeeconstituted by the Reserve Bank (Chairman: ShriPrabhakar Rao) to look into the customer service aspectsof the services rendered by Agency Banks, which includedestablishment of Centralised Pension Processing Centres(CPPCs) by the Agency Banks for pension disbursement,customer friendly measures in the collection of taxes etc.,Agency Banks have been advised to implement the same.Consequently, most of the Agency Banks have establishedCPPC while others are in the process of establishing them.As a customer friendly measure, the Reserve Bank hasalso hosted an FAQ on its website for the benefit ofpensioners.
• In order to compensate the pensioners for delayedpayment of pensions beyond due date, instructions wereissued to the Agency Banks to pay penal interest for thedelayed period at Bank Rate plus 2 per cent. Thecompensation shall be credited to the account of thepensioners automatically without waiting for any claimfrom them.
• As the adviser to the Government of India in theformulation of accounting policies and other relatedmatters of Government Business, the Reserve Bankassociates with various Committees constituted by theGovernment for effective administration of Governmentrevenue collection and accounting system.
• The Reserve Bank also looks after the appointment ofAgency Banks, under section 45 of the RBI Act, 1934, tocarry out Government Business as agents of the Bank.Recently, the Reserve Bank appointed Jammu & KashmirBank Ltd. to conduct the business of the State Governmentof Jammu & Kashmir as an agent, from April 01, 2011.
Box VII.1Developments in RBI’s role as Banker to Government
average issuance size and lower volatility in the yieldof the 10-year benchmark government securities inthe secondary market.
VII.17 During 2011-12 (up to July 31, 2011), tentranches of auctions were conducted under themarket borrowing programme of the State

PUBLIC DEBT MANAGEMENT
119
Governments and 14 States raised an aggregateamount of ̀ 37,023 crore on a gross basis (net ̀ 30,147crore) as compared to `31,640 crore (net `23,519crore) raised by 17 States during the correspondingperiod of the previous year.
Cash Management
VII.18 The aggregate Normal WMA limit for States,including Government of Union Territory ofPuducherry, was placed at `9,925 crore for 2010-11, which was the same as in the previous year.Consequent upon the supplementary agreement
entered with the Government of Jammu andKashmir, the aggregate WMA limit for 2011-12 wasincreased to `10,240 crore in April 2011. The ratesof interest on Normal and Special WMA and ODcontinued to be linked to the repo rate. The monthlyaverage utilisation of WMA and OD by the States in2010-11 was higher than that of 2009-10 (Table VII.7and 8).
VII.19 Most State Governments have accumulatedsizable cash balances in the recent years reflectingthe fiscal consolidation measures undertaken since2005-06. The liquidity pressures during 2010-11 wereconfined to a few State Governments (Table VII.9).The surplus cash balances of State Governments areautomatically invested in 14-day IntermediateTreasury Bills (ITBs), the discount rate of which ispresently fixed at 5 per cent. The average investmentin 14-day ITBs declined to ̀ 78,875 crore from ̀ 84,462crore during the previous year. The outstandinginvestments of States in ITBs stood at ̀ 1,01,301 croreas at end-March 2011 as against ` 93,776 crore asat end-March 2010. The average investment of theState Governments in Auction Treasury Bills (ATBs)more than tripled to `9,620 crore from `2,680 crorein the previous year. The outstanding investment ofState Governments in ATBs as at end-March 2011was higher at `10,187 crore than that of `250 croreat end-March 2010 (Table VII.9).
Table VII.7: WMA/ OD of State Governments(Average monthly outstanding)
(` crore)
Month Special WMA Normal WMA Overdraft Total
2009-10 2010-11 2011-12 2009-10 2010-11 2011-12 2009-10 2010-11 2011-12 2009-10 2010-11 2011-12
1 2 3 4 5 6 7 8 9 10 11 12 13
Apr 619 589 970 294 290 698 111 191 868 1024 1070 2536May 126 298 619 50 14 114 2 – 39 178 312 772June 5 36 227 67 – 175 – – 16 72 36 418July 76 2 144 7 – 97 – – – 83 2 241Aug 72 6 52 122 – – 124 128Sept 216 120 246 88 77 3 539 211Oct 54 821 161 537 2 117 217 1475Nov 389 898 74 480 – 242 463 1620Dec 22 19 31 60 – – 53 79Jan 120 454 47 112 25 – 192 566Feb 523 952 35 522 – 194 558 1668Mar 252 893 252 383 90 295 594 1571Avg. 206 424 110 217 26 87 341 730
Table VII.6: Yield on State Government Securities(Per cent)
Year Range Weighted Average
1 2 3
1997-98 12.30-13.05 12.821998-99 12.15-12.50 12.351999-00 11.00-12.25 11.892000-01 10.50-12.00 10.992001-02 7.80-10.53 9.202002-03 6.60-8.00 7.492003-04 5.78-6.40 6.132004-05 5.60-7.36 6.452005-06 7.32-7.85 7.632006-07 7.65-8.66 8.102007-08 7.84-8.90 8.252008-09 5.80-9.90 7.872009-10 7.04-8.58 8.112010-11 8.05-8.58 8.392011-12@ 8.36-8.68 8.55
@ Up to July 31, 2011.

ANNUAL REPORT
120
Table VII.9 : Investments of the State Governments / UT*(` crore)
Month Intermediate Treasury Bills Auction Treasury Bills Total
2009-10 2010-11 2011-12 2009-10 2010-11 2011-12 2009-10 2010-11 2011-12
1 2 3 4 5 6 7 8 9 10
April 72,837 77,068 86,409 9,329 250 10,862 82,166 77,318 97,271May 66,143 76,631 72,810 8,811 250 14,530 74,954 76,881 87,340June 69,983 78,015 67,789 6,312 635 24,979 76,295 78,650 92,768July 75,122 84,787 61,389 1,931 3,001 32,644 77,053 87,788 94,033August 77,321 78,121 1,125 7,995 78,446 86,116September 73,617 71,814 1,125 11,263 74,742 83,077October 84,369 66,444 798 12,503 85,167 78,947November 88,089 68,203 750 13,468 88,839 81,671December 98,003 82,494 637 15,462 98,640 97,956January 99,668 76,754 500 18,323 100,168 95,077February 103,214 80,347 500 17,830 103,714 98,177March 105,182 105,818 339 14,461 105,521 120,279Average 84,462 78,875 72,099 2,680 9,620 20,754 87,142 88,495 92,853
* Average of daily data.
VII.20 The Reserve Bank, on behalf of the StateGovernments, maintains the consolidated sinkingfund (CSF) that provides a cushion for amortisationof market borrowing/liabilities and the guaranteeredemption fund (GRF), which provides for theservicing of contingent liability arising from invocationof guarantees issued in respect of borrowings byState level undertakings or other bodies. As on March31, 2011, 20 State Governments includingPuducherry had notified CSF and 10 State
Governments had set up GRF. The outstandinginvestments under CSF and GRF amounted to`36,504 crore and `3,704 crore, respectively, as atend-March 2011.
VII.21 The 24th Conference of the State FinanceSecretaries was held in the Reserve Bank of India atMumbai on May 24, 2011. The issues discussed inthe Conference included: States’ role in addressingsupply side constraints and strengthening Public
Table VII.8: No. of Days States Availed of Special / Normal WMA and OD
Special WMA Normal WMA Overdraft
2009-10 2010-11 2011-12 2009-10 2010-11 2011-12 2009-10 2010-11 2011-12
1 2 3 4 5 6 7 8 9 10
Andhra Pradesh 1 3 – – – – – – –Haryana 7 10 13 5 10 13 – 8 6Kerala 18 – – 2 – – – – –Madhya Pradesh 11 – – 11 – – – – –Maharashtra – – – – – – – – –Karnataka – – – – – – – – –Nagaland 69 – 11 45 – 6 13 – –Punjab 130 133 40 128 132 40 29 13 14Rajasthan – – – – – – – – –Uttar Pradesh 8 4 – 8 4 – – – –West Bengal 95 195 79 15 113 40 8 62 24Himachal Pradesh – – – – – – – – –Manipur – – – – – – – – –Mizoram 29 25 6 15 15 – – – –Goa – – – 1 – – – – –Uttarakhand 69 35 25 26 12 8 9 10 –Meghalaya – 1 – – – – – – –Jharkhand – – 4 – – 4 – – –

PUBLIC DEBT MANAGEMENT
121
Distribution System for better inflation management;challenges in the management of CentralGovernment borrowing programme during 2011-12;management of cash balances and marketborrowings of the State Governments for 2011-12;repayment / exchange rate risk in States’ borrowingand building of sinking funds to meet theseobligations; risks to State finances on account ofpower sector utilities; switch over to electronic modeof payment and receipt for Governments’ bankingbusiness and proposed classification structure ofUnion and State Governments’ accounts.
VII.22 Notwithstanding the relatively lower budgetedmarket borrowings of the Central Government in 2011-12, managing the borrowing programme would be achallenge in view of tight liquidity conditions and highlevel of excess SLR holdings of the banks and non-availability of MSS securities for unwinding.Accordingly, the conduct of the market borrowingprogramme will be influenced by the ability of theGovernment to rein in the fiscal deficit and its financingby way of market borrowings at the budgeted levelcoupled with the monetary policy actions that anchorinflationary expectations.

122
VIII.1 The management of currency being one ofthe core functions of a central bank, commands ahigh degree of public visibility. Section 22 of theReserve Bank of India Act, 1934, empowers theReserve Bank as the sole authority to issue banknotesin India. Although one rupee notes / rupee coins and50 paise coins are issued by the Government, theyare put into circulation only through the Reserve Bankof India. Also, the Act casts upon the Reserve Bank,not only the responsibility of providing banknotes inadequate quantity throughout the country, but alsomaintaining the quality of banknotes in circulation.
VIII.2 The Reserve Bank has, accordingly, carriedout the functions of note issue and currencymanagement during 2010-11. Prevention anddetection of counterfeit notes continued to beaccorded high priority. The ongoing process ofenhancing security features of the banknotes waspursued with renewed vigour. Further, so as toencourage reporting of counterfeit notes, consciousefforts were made for simplifying the administrativeand legal procedures. Technology driven improvementsin customer service were also undertaken.
BANKNOTES IN CIRCULATION
VIII.3 Value, as well as volume, of the banknotescontinued to increase during 2010-11 (Table VIII.1).Growth in the value of banknotes outpaced that ofvolume, reflecting the continuing compositional shifttowards higher denomination banknotes, particularly`1,000 and `500.
COINS IN CIRCULATION
VIII.4 The total value of coins, including small coinsin circulation, increased by 14.1 per cent during 2010-11 as compared with 12.2 per cent in the previousyear. In volume terms, the increase was 6.5 per centduring 2010-11 as compared with 5.8 per cent a yearago (Table VIII.2).
VIII.5 In the exercise of powers conferred by Section15A of the Coinage Act, 1906 (3 of 1906), theGovernment of India decided to call in fromcirculation coins of denomination of 25 paise andbelow with effect from end-June, 2011. Thereafter,these coins will cease to be legal tender for paymentas well as on account. Exchange facilities for these
VIII CURRENCY MANAGEMENT
Notwithstanding the increasing use of technology driven non-cash modes of payment, the demand for currency
continues to rise. The Reserve Bank in pursuing its clean note policy has made provision for a steady supply of fresh
banknotes in response to the speedier disposal of soiled banknotes. While the current financial year marks the end of
circulation for coins of denomination of 25 paise and below, the economy continues to witness a compositional shift
towards higher denomination banknotes. The Reserve Bank continued with its efforts to strengthen the security
features of banknotes and increase public awareness so as to address the challenge of counterfeit notes.
Table VIII.1: Banknotes in CirculationDenomination Volume Value
(Million pieces) (` crore)End - March End - March
2009 2010 2011 2009 2010 2011
1 2 3 4 5 6 7
`2 & `5 7,865 7,953 11,116 2,936 2,930 4,281(16.0) (14.1) (17.2) (0.4) (0.4) (0.5)
`10 12,222 18,536 21,288 12,222 18,536 21,288(25.0) (32.8) (33.0) (1.8) (2.4) (2.3)
`20 2,200 2,341 3,020 4,399 4,681 6,040(4.5) (4.1) (4.7) (0.6) (0.6) (0.7)
`50 4,888 4,211 3,196 24,440 21,057 15,980(10.0) (7.4) (5.0) (3.6) (2.7) (1.7)
`100 13,702 13,836 14,024 1,37,028 1,38,364 1,40,243(28.0) (24.5) (21.7) (20.1) (17.6) (15.0)
`500 6,166 7,290 8,906 3,08,304 3,64,479 4,45,311(12.6) (12.9) (13.8) (45.3) (46.2) (47.6)
`1,000 1,918 2,383 3,027 1,91,784 2,38,252 3,02,713(3.9) (4.2) (4.7) (28.2) (30.2) (32.4)
Total 48,963 56,549 64,577 6,81,133 7,88,299 9,35,856
Note: Figures in parentheses represent percentage share in total.

CURRENCY MANAGEMENT
123
coins were made available at the branches of banksmaintaining small coin depots and also at offices ofthe Reserve Bank.
CURRENCY OPERATIONS
VIII.6 In a continued endeavour to provide goodquality banknotes, the Reserve Bank of India pursuedits multi-pronged approach involving regular supplyof fresh banknotes, speedier disposal of soiledbanknotes and mechanisation of cash processingactivity. Various options to enhance the life ofbanknotes so as to ensure the clean note policy, andmeasures to address the menace of counterfeit noteswere continuously examined.
Infrastructure for Currency Management
VIII.7 Through its 18 Issue Offices, one sub-officeat Lucknow, a currency chest at Kochi and a widenetwork of 4,247 currency chests and 4,017 smallcoin depots, the Reserve Bank carries out the issueof notes and management of currency. The ReserveBank of India has agency agreement with SCBs,under which the currency chest facility is granted tothem. Currency chests with Sub Treasury Offices(STOs) are being gradually phased out and theirnumber has reduced to 11 during 2010-11.The StateBank of India and its associates continue to have thelargest share (71 per cent) of currency chests followedby nationalised banks (26 per cent) (Table VIII.3).
CLEAN NOTE POLICY
Indent and Supply of Fresh Banknotes and Coins
VIII.8 About 93 per cent of the indent for banknotesfor 2010-11 was met by the printing presses.The total supply increased from 16.4 billion pieces in2009-10 to 16.5 billion pieces in 2010-11.The supply in volume and value affirms the effectivemonitoring of supplies as also efficient allocationand management of the capacities at the presses(Table VIII.4 and 5).
Disposal of Soiled Banknotes
VIII.9 During 2010-11, as many as 13.9 billionpieces of soiled banknotes (21.4 per cent ofbanknotes in circulation) were processed andremoved from circulation (Table VIII.6). The numberof banknotes withdrawn from circulation andeventually disposed at the Reserve Bank offices
Table VIII.2: Coins in Circulation
Denomination Volume Value(Million pieces) (` crore)
End - March End - March
2009 2010 2011 2009 2010 2011
1 2 3 4 5 6 7
Small coin 54,736 54,738 54,797 1,455 1,455 1,458(57.7) (52.0) (48.9) (14.6) (13.1) (11.5)
`1 26,975 29,461 32,675 2,696 2,964 3,267(27.0) (28.0) (29.1) (27.1) (26.8) (25.9)
`2 11,179 13,198 15,342 2,236 2,640 3,068(11.2) (12.5) (13.7) (22.4) (23.8) (24.3)
`5 7,141 7,760 9,070 3,570 3,880 4,535(7.1) (7.4) (8.1) (35.9) (35.0) (35.9)
`10 - 149 300 - 149 300 (0.0) (0.3) (1.3) (2.4)
Total 100,013 105,306 112,184 9,957 11,070 12,628
Note: Figures in parentheses represent percentage share in total.
Table VIII.3: Currency Chests andSmall Coin Depots
(as on December 31, 2010)
Category No. of Currency No. of Small CoinChests Depots
1 2 3
Treasuries 11 -State Bank of India 2,120 2,050SBI Associate Banks 886 868Nationalised Banks 1,112 982Private Sector Banks 110 109Co-operative Banks 1 1Regional Rural Banks 3 3Foreign Banks 4 4Total 4,247 4,017
Table VIII.4: Indent and Supply of Banknotes(April – March)
Volume (Million pieces)
Denomination 2009-10 2010-11 2011-12 Indent Supply Indent Supply Indent
1 2 3 4 5 6
`5 1,000 548 - 674 -
`10 5,000 5,060 5000 5,143 5,700
`20 800 820 1,500 1,104 600
`50 1,000 1,004 2,000 1,602 1,200
`100 4,000 3,969 4,300 3,420 6,100
`500 4,000 4,008 4,000 4,130 2,000
`1,000 1,000 1,007 1,000 467 2,000
Total 16,800 16,416 17,800 16,540 17,600
ANNUAL REPORT
124
increased during the year. This is in line with the on-going efforts for speedier removal of soiled banknotesfrom currency chests and augmenting the disposal atReserve Bank offices.
VIII.10 Out of the 13.9 billion pieces of banknotesdisposed during 2010-11, 8.05 billion pieces wereprocessed through 54 Currency Verification andProcessing Systems (CVPS). The remainingbanknotes were disposed under the Dynamic WorkingModel (DWM).
VIII.11 To further augment the processing anddisposal capacity of soiled notes, 5 new CVPSmachines have been installed during the year in 5select offices of the Reserve Bank.
Measures to Improve the Quality of Banknotes inCirculation
VIII.12 All currency chest branches are equipped withNote Sorting Machines (NSMs). Banks have been
advised to ensure that all notes received by themare processed before re-issuing them to public. Incompliance to one of the recommendations of theHigh Level Group on Systems & Procedures forCurrency Distribution, banks have been furtherdirected that notes in the denomination of `100 andabove are to be processed through machinesconforming to “Note Authentication and FitnessSorting Parameters” prescribed by Reserve Bankfrom time to time, before issuing them over thecounters or through ATMs. Bank branches havingaverage daily cash receipts of `50 lakh and aboveshall put to use such machines by end-March 2011.
VIII.13 As on April 2011, the banks have installed4,091 NSMs in their branches in above categories.Further, the banks have also made arrangements forissue of machine processed notes for another 1,823branches.
VIII.14 The above measure, besides promotingefficient Banknote sorting, is seen to provide animpetus to both the Clean Note Policy and thedetection of counterfeit notes.
VIII.15 The Reserve Bank continued with its effortsto introduce polymer / plastic banknotes in thedenomination of `10, on a “field trial” basis, in selectlocations of the country. While the process relatingto the “field trial” is under progress, the Reserve Bankcommissioned a study on the “environmental impact(Carbon Footprint) of cotton based banknotes vis-a-vis polymer based alternative”.
COUNTERFEIT BANKNOTES
VIII.16 Counterfeit banknotes detected during theyear were higher in magnitude on account of
Table VIII.5: Indent and Supply of Coins
Denomination Volume (Million pieces) Value (` crore)
2009-10 2010-11 2011-12 2009-10 2010-11
Indent Supply Indent Supply Indent Indent Supply Indent Supply
1 2 3 4 5 6 7 8 9 10
50 paise 200 100 70 59 70 10 5 4 3`1 3,000 2,918 2,600 2,746 1,600 300 292 260 275`2 2,000 2,284 1,700 1,811 2,900 400 457 340 362`5 800 778 1,300 1,292 800 400 389 650 646`10 100 205 1,000 232 1,000 100 205 1,000 232Total 6,100 6,285 6,670 6,140 6,370 1,210 1,348 2,254 1,518
Table VIII.6: Disposal of Soiled Notes andSupply of Fresh Banknotes
Volume (Million pieces)
Denomination 2008-09 2009-10 2010-11
Disposal Supply Disposal Supply Disposal Supply
1 2 3 4 5 6 7
`1,000 39 664 78 865 179 706`500 735 2,611 1,247 3,513 1,864 4,347`100 3,690 4,277 4,307 3,935 5,227 4,085`50 2,403 1,042 2,400 791 2,095 1,114`20 1,003 605 790 467 664 1,296`10 3,700 4,607 3,832 4,975 3,657 5,580Up to `5 392 3 418 441 166 549Total 11,962 13,809 13,072 14,987 13,852 17,677
Note: Supply indicates fresh notes supplied to currency chests andmembers of public .

CURRENCY MANAGEMENT
125
heightened awareness amongst banks and increaseduse of Note Sorting Machines. Almost 90 per cent ofthe 0.4 million counterfeit notes identified weredetected at bank branches, reflecting increased useof NSMs (Table VIII.7).
VIII.17 In conjunction with other steps to check themenace of counterfeit banknotes such asstrengthening of security features, training to banksand other organisations, rationalisation of procedurefor dealing with counterfeit currency (Box VIII.1),improvements in the area of mechanised processingof notes, etc., the Reserve Bank has also launchedan awareness campaign on Indian banknotes.
VIII.18 Under this campaign, initially an ad film titled“Paisa Bolta Hai” in Hindi was launched on
Table VIII.7: Counterfeit Notes Detected(No. of pieces)
Year Detection at Detection at TotalReserve Bank other banks
1 2 3 4
2008-09 55,830 342,281 398,111(14.0) (86.0)
2009-10 52,620 348,856 401,476(13.1) (86.9)
2010-11 45,235 390,372 435,607(10.4) (89.6)
Note: Figures in parentheses represent percentage share in total.
Doordarshan in August, 2010. Subsequently, the filmhas been translated in 11 major Indian languages andis being shown over the regional channels ofDoordarshan. The film’s primary message to thecommon man is to form a habit of examiningbanknotes and it also aims at educating the generalpublic (Aam Aadmi) about the security features ofIndian banknotes. Future plans include campaignsthrough various media viz., other TV channels, radio,newspapers, etc.
VIII.19 The Reserve Bank has also prepared amicrosite for the web page which has incorporatedall information on genuine Indian banknotes for thebenefit of the public. The Microsite, named “PaisaBolta Hai”, is displayed on the home page of the RBIwebsite and can also be accessed from the URLhttp://www.paisaboltahai.rbi.org.in/
VIII.20 The government introduced the Coinage Bill,2011 which has been passed by the Lok Sabha inMarch, 2011. The Bill, apart from seeking toconsolidate the laws relating to coinage and the Mints,also endeavours to prohibit as also impose penaltyon the melting or destruction of coins, unlawfulmaking, or issue or possession of metal pieces to beused as money.
Box VIII.1Procedure for Dealing with Counterfeit Currency
Printing and/or circulation of forged Indian Currency Notesis an offence under Sections 489A to 489E of the IndianPenal Code. As per Section 39 of the Criminal ProcedureCode, every person, aware of the commission of or of theintention of any other person to commit certain offences,including those relating to counterfeiting of currency, isrequired to immediately give information about suchcommission or intention to the nearest magistrate or policeofficer. Accordingly, the procedure prescribed by the ReserveBank of India for the commercial banks requires impoundingall counterfeit notes detected by the banks and sending themto the police for lodging an FIR in accordance with the law.
With the increase in incidence of counterfeit notes, individualsmay come in possession of a counterfeit note without theirknowledge of it being a counterfeit and unintentionallybecome a conduit for its circulation by presenting it to a bankor business establishment.
The High Level Group constituted by the Reserve Bank onSystems and Procedures for Currency Distribution, in itsreport in August 2009, had recommended rationalizing the
procedure with regard to the filling of FIR on detection offorged notes.
The matter was taken up with the Ministry of Home Affairs,Central Government and an in-principle decision has beentaken to :
i) Consider designating one nodal police station at eachdistrict for registration of cases of forged note offences.Correspondingly, banks would designate one nodalofficer in a district with responsibility of registering suchcases with police.
ii) The nodal officer of the bank will register a single reportto designate police station with detailed informationwhere recovery of forged notes in 1 piece to 4 pieces ina single transaction.
iii) In case of recovery of 5 or more pieces in a singletransaction separate FIR would be filed.
While several states have designated nodal police stations,simplification of reporting system is under consideration ofthe Central Government.
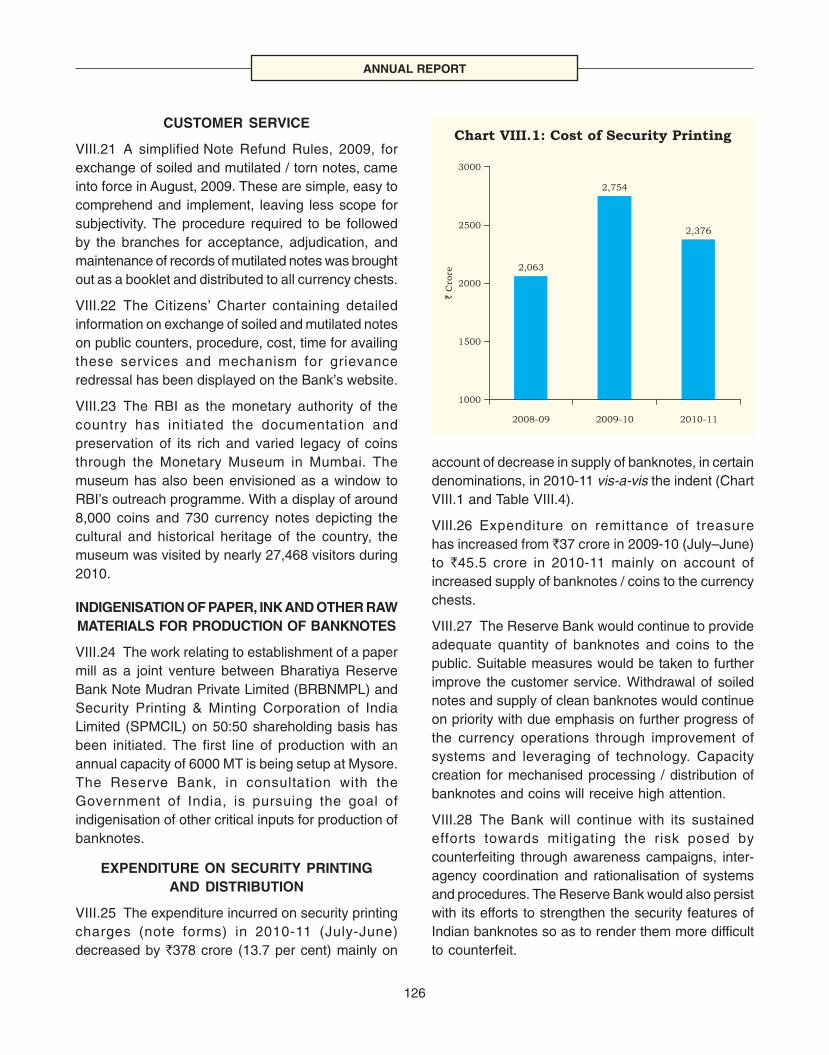
ANNUAL REPORT
126
CUSTOMER SERVICE
VIII.21 A simplified Note Refund Rules, 2009, forexchange of soiled and mutilated / torn notes, cameinto force in August, 2009. These are simple, easy tocomprehend and implement, leaving less scope forsubjectivity. The procedure required to be followedby the branches for acceptance, adjudication, andmaintenance of records of mutilated notes was broughtout as a booklet and distributed to all currency chests.
VIII.22 The Citizens’ Charter containing detailedinformation on exchange of soiled and mutilated noteson public counters, procedure, cost, time for availingthese services and mechanism for grievanceredressal has been displayed on the Bank’s website.
VIII.23 The RBI as the monetary authority of thecountry has initiated the documentation andpreservation of its rich and varied legacy of coinsthrough the Monetary Museum in Mumbai. Themuseum has also been envisioned as a window toRBI’s outreach programme. With a display of around8,000 coins and 730 currency notes depicting thecultural and historical heritage of the country, themuseum was visited by nearly 27,468 visitors during2010.
INDIGENISATION OF PAPER, INK AND OTHER RAWMATERIALS FOR PRODUCTION OF BANKNOTES
VIII.24 The work relating to establishment of a papermill as a joint venture between Bharatiya ReserveBank Note Mudran Private Limited (BRBNMPL) andSecurity Printing & Minting Corporation of IndiaLimited (SPMCIL) on 50:50 shareholding basis hasbeen initiated. The first line of production with anannual capacity of 6000 MT is being setup at Mysore.The Reserve Bank, in consultation with theGovernment of India, is pursuing the goal ofindigenisation of other critical inputs for production ofbanknotes.
EXPENDITURE ON SECURITY PRINTINGAND DISTRIBUTION
VIII.25 The expenditure incurred on security printingcharges (note forms) in 2010-11 (July-June)decreased by `378 crore (13.7 per cent) mainly on
account of decrease in supply of banknotes, in certaindenominations, in 2010-11 vis-a-vis the indent (ChartVIII.1 and Table VIII.4).
VIII.26 Expenditure on remittance of treasurehas increased from `37 crore in 2009-10 (July–June)to `45.5 crore in 2010-11 mainly on account ofincreased supply of banknotes / coins to the currencychests.
VIII.27 The Reserve Bank would continue to provideadequate quantity of banknotes and coins to thepublic. Suitable measures would be taken to furtherimprove the customer service. Withdrawal of soilednotes and supply of clean banknotes would continueon priority with due emphasis on further progress ofthe currency operations through improvement ofsystems and leveraging of technology. Capacitycreation for mechanised processing / distribution ofbanknotes and coins will receive high attention.
VIII.28 The Bank will continue with its sustainedefforts towards mitigating the risk posed bycounterfeiting through awareness campaigns, inter-agency coordination and rationalisation of systemsand procedures. The Reserve Bank would also persistwith its efforts to strengthen the security features ofIndian banknotes so as to render them more difficultto counterfeit.
2,063
2,754
2,376
1000
1500
2000
2500
3000
2008-09 2009-10 2010-11
`C
rore
Chart VIII.1: Cost of Security Printing

127
IX PAYMENT AND SETTLEMENT SYSTEMSAND INFORMATION TECHNOLOGY
Reflecting the need for technologically advanced, secure, efficient, accessible payment and settlement systems, the
Reserve Bank persisted in its endeavour to incentivise electronic modes of payment. Enhanced use of prepaid payment
instruments and mobile phone based payment services have been promoted with adequate security measures in place.
Driven by the objective of reinforcing RBI as a knowledge hub, the Bank has striven towards strategic use of IT and
its applications.
IX.1 In a system of inter-woven financial andinternational economic linkages, an efficient paymentand settlement system is paramount. In the Indianset up with an enormous spread of banking and non-bank financial institutions and other financialorganisations, ensuring adequate payment andsettlement structures with strong security measuresto harness efficacy assumes critical significance andhence is yet another unique responsibility of theReserve Bank.
IX.2 During the year, various payment andsettlement systems in the country continuedto function efficiently, thereby facilitatingsmooth functioning of the financial markets inparticular and the economy in general. The totalturnover under the various payment and settlementsystems both in value as well as volume terms,exhibited a steady growth of 10 per cent in 2010-11(Table IX.1).
OVERSIGHT OF PAYMENT SYSTEMS IN INDIA
IX.3 The Payment and Settlement Systems Act,2007 (PSS Act) empowers the Reserve Bank of Indiato regulate and supervise payment systems withinthe country.1 The scope of the oversight function ofthe Bank is guided by the policy objectives spelt outin the Mission Statement “Payment Systems in IndiaVision 2009-12 (July-June)”, in terms of which theBank would strive “to ensure that all payment and
settlement systems operating in the country are safe,secure, sound, efficient, accessible and authorised”.Oversight necessitates that “the objectives of safetyand efficiency are promoted by monitoring existingand planned systems, assessing them against theseobjectives and, where necessary, inducing change”2.
IX.4 In terms of the PSS Act, the Reserve Bankmonitors all planned payment systems and ensuresthat only those payment systems with strong systemdesign, adequate risk management solutions andsound financial parameters are authorized to operatein the country.
IX.5 All authorised entities are assessed againsttheir individual authorisation conditionalities andrelevant policy guidelines issued by the Bank. Theassessment process comprises of off-site surveillanceas well as on-site inspections.
IX.6 Off-site surveillance involves data collectionand analysis, self-assessment by the authorisedentities, periodical system audits by qualifiedprofessionals and market intelligence. Periodicalanalysis of the data is carried out to discern patternsand/or trends for further policy actions, if any. Systemaudit has been prescribed to ensure that theauthorised payment systems perform to the beststandards of data security and integrity and that theprocesses and procedures are in sync with theauthorisation conditions.
1 The powers to regulate and supervise comprise: Power to determine standards (Section 10); Notice of change in the payment system(Section 11); Power to call for returns, documents or other information (Section 12); Access to information (Section 13); Power to enter andinspect (Section 14); Power to carry out audit and inspection (Section 16); Power to issue direction (Section 17); Power of Reserve Bank to givedirections generally (Section 18); Directions of RBI to be generally complied with (Section 19).
2 Central Bank Oversight of Payment and Settlement Systems, May 2005, CPSS, BIS.

ANNUAL REPORT
128
IX.7 Additionally, each authorised entity is requiredto carry out a self-assessment of its operations, riskmanagement and business continuity arrangementsamongst other parameters based on internationalstandards prescribed by the Committee on Paymentand Settlement Systems (CPSS), the globalstandards setting body for payment and settlementsystems. The results of the self-assessment sharedwith the Reserve Bank, are used to create a risk profileof the entity. The inputs gathered through marketintelligence are also used as a pointer. A need basedon-site inspection complements the assessmentprocess.
IX.8 Based on the assessment carried out andmarket intelligence including consultation withstakeholders, the Reserve Bank induces changes inthe payment system/s for improving their safety andefficiency as well as customer convenience andservice. Rules, regulations, procedural guidelines,access criteria and minimum standards for operationalefficiency for various products including the large-value and retail payments are used for this purpose.Statutory powers conferred by the PSS Act are alsoused for giving necessary directions.
IX.9 To aid the process of oversight, RegionalOffices have been set up at four metros.
Table IX.1: Payment System Indicators - Annual Turnover
Item Volume (in million) Value (` crore)
2008-09 2009-10 2010-11 2008-09 2009-10 2010-11
1 2 3 4 5 6 7
Systemically Important PaymentSystems (SIPS)1. High Value Clearing 21.8 5.5 0.0 45,50,667 18,61,560 02. RTGS 13.4 33.2 49.3 3,22,79,881 3,94,53,359 4,84,87,234Total SIPS (1+2) 35.2 38.8 49.3 3,68,30,548 4,13,14,919 4,84,87,234
(6.6) (6.3) (6.2)
Financial Markets Clearing3. CBLO 0.1 0.1 0.1 88,24,784 1,55,41,378 1,22,59,7444. Government Securities Clearing 0.3 0.3 0.4 62,54,519 89,86,718 69,70,2365. Forex Clearing 0.8 0.9 1.2 1,69,37,489 1,42,11,486 1,91,60,153Total Financial Markets Clearing (3-5) 1.2 1.4 1.7 3,20,16,792 3,87,39,582 3,83,90,133
(5.7) (5.9) (4.9)
Others 6. MICR Clearing 1,142.0 1,144.2 1,155.1 58,57,575 66,69,957 83,01,2187. Non-MICR Clearing 233.6 230.6 232.3 20,60,893 18,78,425 18,32,909
Retail Electronic Clearing8. ECS DR 160.1 149.3 156.7 66,976 69,524 73,6469. ECS CR 88.4 98.1 117.3 97,487 1,17,613 1,81,68610. EFT/NEFT 32.2 66.3 132.3 2,51,956 4,09,507 9,39,149Total Retail Electronic Clearing 280.6 313.8 406.4 4,16,419 5,96,644 11,94,481
Cards11. Credit Cards 259.6 234.2 265.1 65,356 61,824 75,51612. Debit Cards 127.7 170.2 237.1 18,547 26,418 35,705
Total Cards 387.2 404.4 502.2 83,903 88,242 1,14,207
Total Others (6 to 12) 2,043.4 2,092.9 2,296.0 84,18,790 92,33,268 1,14,35,745(1.5) (1.4) (1.5)
Grand Total (1 to12) 2,079.8 2,133.0 2,346.9 7,72,66,130 8,92,87,769 9,83,13,112(13.9) (13.6) (12.5)
Note:1. High value clearing has been discontinued w.e.f. April 1, 2010.2. Settlement of Government securities clearing and forex transactions is through Clearing Corporation of India Ltd.3. At the end of April 2011, the MICR clearing was available at 66 centres (65 centres during previous year).4. The figures of cards are for transactions at POS terminals only.5. Figures in parentheses are ratios to GDP at current market prices.
PAYMENT AND SETTLEMENT SYSTEMSAND INFORMATION TECHNOLOGY
129
POLICY INITIATIVES
IX.10 Under the guidance of the Board forRegulation and Supervision of Payment andSettlement Systems (BPSS) several important policyinitiatives were taken.
Paper-based Payment Systems
IX.11 The magnitude of the paper transactionsdespite recording a fall of 5 per cent over the previousyear, continued to dominate the payment systemaccounting for 59 per cent of the total volume oftransactions. The Reserve Bank took several stepsto both reduce the settlement time of paper clearingand also encourage the shift towards electronic modeof payments.
i) To further refine the acceptance of multi-userinputs in a networked environment, core-banking integration and graphic interfacecompatibility, a new automation softwarepackage called ‘Express Cheque ClearingSystem’ (ECCS) has been developed. Itincorporates all the latest features and isexpected to be rolled out across all the non-Magnetic Ink Character Recognition (MICR)locations in the country by September 2011along with the speed clearing facility at all thecentres.
ii) Speed clearing has since been extended to216 centres including all 66 MICR centres.
iii) The service charge for cheque processingthrough MICR CPC and collection charge foroutstation/speed clearing have beenrationalized.
iv) The second phase of the grid-based ChequeTruncation System (CTS) is nearingimplementation at Chennai incorporating theCTS Standards-2010.
Electronic Payment Systems
IX.12 The electronic payment products providespeedier, cost effective and secure paymentmechanism to customers in comparison to traditional
paper based payment instruments. The evolution ofelectronic payment products in the country hasprogressed through two phases: (i) introductory phaseand (ii) rationalisation phase.
IX.13 During the introductory phase, electronicproducts like Electronic Clearing Service (ECS) andElectronic Funds Transfer (EFT) were introduced bythe Reserve Bank. These systems weredecentralised, serving the population of specificareas. The focus during the rationalisation phase hasbeen to introduce centralised pan-India paymentsolutions like the Real Time Gross Settlement(RTGS), National Electronic Funds Transfer (NEFT)and National Electronic Clearing Service (NECS) thatenable servicing customers spread throughout thecountry with settlement at a central location. Thisphase also coincided with the implementation of CoreBanking Solutions (CBS)/centralised liquiditymanagement solutions in banks.
IX.14 The RTGS system, in operation since March2004, has witnessed a steady growth in both valueand volume terms (Table IX.1).
IX.15 Various initiatives taken to further refine thecentralised systems during the year are as follows:
i) To streamline the process flow in credit-pushsystems like NEFT, RTGS, ECS (Credit) andNECS systems, banks can creditbeneficiaries’ accounts based solely onaccount number details subject to safeguards.
ii) RBI has been waiving processing charges forretail electronic payment systems since theyear 2006. It has now been decided to allowthe clearing houses/processing centres to levyprocessing charges on the originating banks.Further, the destination banks will also levysome nominal charges on the originatingbanks as a compensation for usage of theirinfrastructure.
iii) Regional Electronic Clearing Service (RECS)introduced in 2009 for facilitating state-widepayment and receipts, has been successfully

ANNUAL REPORT
130
operating at Bengaluru, Chennai,Thiruvananthapuram, Ahmedabad,Hyderabad, Guwahati, Kolkata, Bhubaneswarand Jaipur. While all these centres operatethe credit scheme, Bengaluru and Chennaialso operate the debit scheme.
iv) A new value band in the `1-2 lakh segmentunder NEFT was created, with customershaving to pay lower charges. The thresholdvalue for RTGS transactions has since beenraised to `2 lakh.
IX.16 The efforts of RBI aimed at promotingelectronic payment systems vis-à-vis paper basedpayments are evident, with both the value andvolumes of these systems registering impressivegrowth rates (Chart IX.1).
IX.17 To ensure timely resolution of disputesbetween system providers and system participants,a Dispute Resolution Mechanism (DRM) under thePSS Act, 2007 has been framed. A time frame of amaximum 15 working days has been laid down forresolution of disputes.
IX.18 The PSS Act, 2007 and regulations framedthereafter have provided a firm legal basis for theprocess of netting and settlement finality. To amplifythese aspects, a directive on Settlement and DefaultHandling Procedures has been issued which coversall multilateral and deferred net settlement systemsauthorised by the Reserve Bank of India.
New Payment Channels
IX.19 The card based payment systems cover credit/debit and prepaid cards. With more than 250 millioncards (debit, credit) issued in the country, a spurt inthe usage of these cards across various deliverychannels like Automated Teller Machines (ATMs),Points of Sale (POS), e-commerce, m-commerce,Interactive Voice Response (IVR), etc. has beenobserved. On an average, 400 million transactionsvaluing over a `1,000 billion are being processedduring a month using these cards.
IX.20 To ensure the security in the usage of theseproducts, the Reserve Bank has mandated
i) An additional factor of authentication for allcard-not-present transactions except the MailOrder Telephone Order (MOTO) transactions.The Bank is in the process of addressing thesecurity of card present transactions(transactions effected with cards at ATM andPOS channels). A working group constitutedby the Reserve Bank for securing cardpresent transactions has submitted itsrecommendations which are being evaluatedfor implementation.
ii) Online alerts effective from July 01, 2011 forall types of card transactions irrespective ofthe amount and channel used.
IX.21 Subsequent to issuance of the guidelines onprepaid payment instruments, this segment has also
b: Valuea: Volume
Chart IX.1: Share of Paper Based Electronic TransactionVs
Paper Electronic
16.1 11.7 10.3
83.9 88.3 89.7
67.2 64.7 59.1
32.8 35.3 40.9
0
20
40
60
80
100
2008-09 2009-10 2010-11
Per
cen
t
Paper Electronic
0
20
40
60
80
100
2008-09 2009-10 2010-11
Per
cen
t

PAYMENT AND SETTLEMENT SYSTEMSAND INFORMATION TECHNOLOGY
131
seen a spurt in activity. Banks as well as non-bankscurrently operate in the prepaid payments systemsegment. This product is being leveraged by non-banksystem providers for entry into payments arena.Fifteen non-bank entities have been authorised toissue these products, and this has ushered ininnovative payment products leveraging paymentchannels like e-commerce and m-commerce. Thesemi closed m-wallets can be issued for value up to`50,000 bringing them on par with other semi closedprepaid instruments.
IX.22 The guidelines on prepaid instruments havebeen amended to (i) extend the use of semi closedprepaid instruments intended for payment of utilitybills/essential services, for purchase of air/train traveltickets (ii) permit banks to issue semi closed prepaidinstruments through the agents in addition to thebusiness correspondents and (iii) permit the issue ofco-branded and gift prepaid payment instruments(iv) permit banks to issue prepaid instruments togovernment organisations and other financialinstitutions for onward issuance to the beneficiaries/customers and to beneficiaries under Money TransferService Scheme (MTSS) for loading cross borderinward remittances received by them.
IX.23 Mobile phone based banking, one of theimportant evolutions in payment systems, is currentlybeing provided by 38 banks. Banks have also beenpermitted to facilitate mobile banking transactionswithout end-to-end encryption up to `5000.
IX.24 As a further step to ensure timely and speedyreconciliation of failed ATM transaction, effective fromJuly 2011, the time limit for resolution of complaintshas been reduced from 12 to 7 working days fromthe date of complaint, failing which `100 per day ispayable as penalty by the bank (provided thecomplaint is lodged by the customer within 30 daysof the transaction).
IX.25 To ensure a level playing field among thestakeholders, banks have been advised that the fivefree transactions in a month permitted to savingsbank account holders at other bank ATMs wouldinclude all types of transactions - financial and non-financial.
Interdependencies in Payment Systems
IX.26 The payment and settlement infrastructure ofthe country is becoming increasingly interdependentdue to the direct/indirect relationships betweensystems and the use of common third party serviceproviders. As a consequence, the settlement flows,operational processes and risk managementprocedures of many systems have becomeincreasingly interdependent. Thus, the smoothfunctioning of an individual system often depends onthe smooth functioning of other related systems(Box IX.1).
CPSS INITIATIVES
IX.27 A joint Working Group (WG) of the CPSS andthe Technical Committee of the InternationalOrganisation of Securities Commissions(IOSCO) was formed in June 2009 to provideguidance on the application of the recommendationsfor central counterparties (CCPs) to OTC derivativesand for trade repositories in OTC derivativesmarkets3. The CPSS formed two otherWorking Groups in June 2009 to study the repoclearing and settlement arrangements and post tradeservices.
IX.28 The first Working Group in its September 2010report4 studied the extent to which the clearing andsettlement infrastructure for repos contributed to theinstability evident in some repo markets during thecrisis, and suggested that a review of the existingclearing and settlement arrangements for repos could
3 The two reports of this working group, Guidance on the application of 2004 CPSS-IOSCO recommendations for central counterparties to OTCderivatives CCPs and Considerations for trade repositories in OTC derivatives markets, were issued as consultative reports in May 2010. Thefeedback received during the consultative process for both the reports has been incorporated in the FMI report.
4 ‘Strengthening repo clearing and settlement arrangements’.

ANNUAL REPORT
132
be undertaken with a view to making necessaryimprovements.
IX.29 The other Working Group on post-tradeservices in its November 2010 report5 detailed the
developments in the clearing industry and marketstructures between the years 2000 and 2010 in theCPSS countries and the impact of thesedevelopments on new risks which could have abearing on the robustness of CCPs.
Box IX.1Interdependencies in Payment Systems
Highlighting the increasing interdependencies in paymentsystem infrastructure and knock-on effects which couldaffect multiple systems due to their inter-linkages andinterdependencies, the Committee on Paymentand Settlement Systems (CPSS), BIS, published a reporton ‘The interdependencies of payment and settlementsystems’ in June 2008 which identifies variousinterdependencies that exist among the systems of CPSScountries; analyses the risk implications of theseinterdependencies; and assesses any associated riskmanagement challenges.
The report states that the development of tightinterdependencies has on the one hand helped instrengthening the global payment and settlement systemsinfrastructure by reducing various costs and risks, but onthe other hand also increased the potential for disruptions tospread quickly and widely across multiple systems andmarkets. It has highlighted the need for system operators,participants and service providers to recognise, understandand manage these risks effectively arising out of theinterdependencies for the safe and efficient functioning ofthe payments and settlement infrastructure.
A study on the interdependencies in the Indian payment andsettlement system infrastructure was carried out, keeping inview the international efforts in this regard and thedevelopment of different market segments within the countryand the inter-linkages between them.
Some of the key takeaways from the study are as follows:
• The Indian payments system infrastructure ischaracterised by a large number of payment systemssuch as the large value payment system (RTGS), CCILoperated systems (Government securities, Forex,CBLO), centralised retail payment systems with a pan-Indian presence such as NEFT, NECS, NFS-ATM, andother retail systems such as MICR cheque clearing inMumbai, settling in central bank money. In addition,clearing corporations such as India Clearing CorporationLimited (ICCL) and National Securities ClearingCorporation Limited (NSCCL) settle the funds leg of thecorporate bond transactions in central bank money inthe RTGS system on a Delivery versus Payment (DvP)basis. Thus, the use of central bank money as a
settlement asset for these key payment systems in thecountry has contributed to the reduction of both creditand liquidity risk.
• The settlement in central bank money is a keycharacteristic which has led to the Indian paymentssystem becoming a highly integrated and interdependentweb of interrelationships with the central bank (RBI) atits centre. This in turn has had an impact on thesettlement flows between various systems anddetermines the smooth settlement of all paymentobligations in central bank money. Owing to theinterconnectedness of systems the credit and liquidityrisks can spread very fast throughout the system. Thepotential for disruption has, however, been minimisedthrough the use of the Central Counterparty (CCP)infrastructure for various markets such as USD-INRForex segment, CBLO and G-Sec markets.
• The study has also highlighted the presence of cross-system liquidity and operational risks in the Indianpayments and settlement system infrastructure. This isespecially evident in the case of CCIL which whileminimising liquidity needs and providing a guaranteedsettlement in various market segments, is by itself thebiggest source of concentration of counterparty risk andoperational risk to the Indian payments and settlementsystem infrastructure.
• Using the evidence presented in the Financial StabilityReport (FSR), the study also recognises thatconcentration risk is evident with few participantsaccounting for the bulk of transactions pointing to thepotential disruption of operations in various paymentsystems on account of failure or disruption in theoperations of one or more than one amongst the largestfive participants.
• On account of the high level of integration and inter-linkages of the Indian payments and settlement system,it is essential that the individual risk management rulesand regulations of each payment system are understoodfor overall containment of systemic risk. The study in itsconclusion accordingly advocates for the adoption ofinternational best practises in the conduct of oversightby the Reserve Bank.
5 ‘Market structure developments in the clearing industry: implications for financial stability’.
PAYMENT AND SETTLEMENT SYSTEMSAND INFORMATION TECHNOLOGY
133
Principles for Financial Market Infrastructure
IX.30 In response to the Asian crisis in the late 90s,the CPSS and the Technical Committee of the IOSCOcame out with three sets of standards forstrengthening payments and settlement systeminfrastructure (including both payment and securitiessettlement systems). These are: (i) the CPSSproduced “Core principles for systemically importantpayment systems (CP) (2001); (ii) the joint CPSS-IOSCO “Recommendations for Securities settlementsystems (RSSS) (2001); and (iii) the joint CPSS-IOSCO “Recommendations for central counterparties”(RCCP) (2004).
IX.31 The recent global financial crisis necessitateda relook at these standards. Accordingly, a joint CPSS-IOSCO Steering Group was formed to chalk out acomprehensive list of standards incorporating not onlythe lessons from the crisis but also the experience ofusing these standards over the past decade inassessing and strengthening the payment andsettlement system infrastructure in many countries.
IX.32 This initiative also supports the FinancialStability Board’s (FSB) efforts in strengtheningfinancial systems through identification of gaps, if any,in international standards and addressing them.Towards this end, the consultative report “Principlesfor Financial Market Infrastructures” (FMI) has beenreleased for public comments in March 2011.
IX.33 An FMI is defined as ‘a multilateral systemamong participating financial institutions, including theoperator of the system, used for the purposes ofrecording, clearing or settling payments, securities,derivatives or other financial transactions’. FMIstypically possess a set of common rules andprocedures for all participants, a technicalinfrastructure, and a risk management framework.
IX.34 The principles in the consultative report whenfinalised would replace the above three sets ofstandards, with a single set of standards. ThePrinciples (24 in total) cover the entire gamut of thepayment and settlement system landscape andencompass payment systems, central securities
depositories, securities settlement systems,CCPs and a new category of FMI viz., traderepositories.
INFORMATION TECHNOLOGY
IX.35 During 2010-11 the Reserve Bank continuedin its endeavour to facilitate the alignment of bankingsector with innovations in technology by improvingits own IT infrastructure, implementing newapplications and initiating steps for further adoptionof technology in the banking sector.
IX.36 The IT Vision document 2011-17 prepared bya High Level Committee (Chairman Dr. K.C.Chakrabarty) with members from Indian Institute ofTechnology (IIT), Indian Institute of Management (IIM),Institute for Development and Research in BankingTechnology (IDRBT), banks and the Reserve Bank,was released. Inter alia, the vision documentdiscusses the road map for enabling IT as a strategicresource for positioning RBI as a knowledgeorganisation, and the steps to be taken for harnessingits human resource potential. For commercial banks,it envisages leveraging technology for enhancedefficiency, reduction in small transactions cost,improved customer service and better information flowto regulators (Box IX.2).
IX.37 In order to improve the quality of data/information received from commercial banks, aproject for automating the flow of data from the corebanking solution or other IT systems of banks to theReserve Bank by a straight through process has beentaken up . A core group consisting of experts frombanks, the Reserve Bank, IDRBT and the IndianBanks Association (IBA) was constituted for preparingan approach paper on the same. The project will beimplemented in a phased manner taking into accountthe technology and process maturity of individualbanks.
INFORMATION TECHNOLOGYINFRASTRUCTURE
IX.38 The vision to reinforce RBI as a knowledgeorganisation has invigorated an internal technological

ANNUAL REPORT
134
revamp augmented by the significant updation to theexisting infrastructure support.
IX.39 Enterprise Knowledge Portal (EKP): Aninterdepartmental Technical Advisory Group with anexternal expert has been constituted to work towardsthe enhancement of the EKP, the intranet site of theBank for effective internal communication.
IX.40 The Data Centres continued to providenecessary infrastructure support for running thecritical payment and non-payment systems of theBank. Adequate redundancy has been built to ensureuninterrupted availability of applications and data. Totest the preparedness for business continuity, threedisaster recovery (DR) drills were conducted duringthe year for payment system applications. For non-payment applications, DR drills have been conductedon a quarterly basis.
IX.41 Network: The INdian FInancial NETwork(INFINET), the communication backbone for theIndian Banking and financial sector managed byIDRBT provides a secured platform for access to all
Box IX.2IT Vision Document: 2011-17
The IT Vision of the Reserve Bank of India 2011-17 wasprepared by a High Level Committee, chaired by Dr. K.C.Chakarbarty, Deputy Governor with experts from variedbackgrounds within and outside Reserve Bank as members.
The objective of the IT Vision for 2011-17 is to enable IT asa strategic resource for (i) enhancing enterprise knowledge,(ii) improving customer service, (iii) strengtheninggovernance, (iv) increasing overall efficiency, and (v) ensuringenvironment friendly systems.
The steps to attain the envisioned state have been identifiedas:
• Adopting appropriate business process re-engineeringand allocating resources before taking up thedevelopment of any new project;
• Conforming to internationally accepted data standards;
• Using business intelligence tools for analysinginformation;
• Ensuring automated flow of data from the sourcesystems of banks to their Management InformationSystems (MIS) and then to the Reserve Bank withoutany manual intervention;
• Improving IT governance;
• Effective project management;
• Evolving well defined information policies as well asinformation security framework; and
• Better vendor management and outsourcing practices.
For commercial banks, enhanced use of IT in areas like MIS,regulatory reporting, adoption of technology based strategiesfor financial inclusion, need for risk mitigation, use of analyticsfor improved customer relationship management (CRM) havebeen set as priorities.
The vision document discusses the need to movetowards an integrated IT environment. Desirability ofevolving a Centre of Excellence (CoE) for serving thetechnical and technological needs of the banking sector,which may also serve as a laboratory for research anddevelopment activity has also been mentioned in thedocument.
Department of Information Technology (DIT) in RBI wouldbe the nodal department for coordinating and monitoring theprogress of implementation of the recommendations of visiondocument.
payment and settlement applications. During the year,all offices of the Reserve Bank have migrated to themore reliable and cost effective Multi Protocol LabelSwitching (MPLS) technology. The network availabilityhas considerably improved. The banks are graduallymigrating to MPLS.
IX.42 LAN revamping at all RBI locations: The LocalArea Network (LAN) was installed in phased mannerduring 1999 to 2002, at various offices of the Bank toprovide connectivity to the users. During the year,the LAN has been upgraded in each RBI office totake care of present and near future requirements.Simultaneously, the process of providing asingle domain across all the RBI offices has beeninitiated.
INFORMATION TECHNOLOGY APPLICATIONS
IX.43 The RBI manages multiple IT applicationswhich are utilised by external and internal users forthe purposes of payment and settlement, currencymanagement, debt management, bank andgovernment account management, regulatory

PAYMENT AND SETTLEMENT SYSTEMSAND INFORMATION TECHNOLOGY
135
surveillance, internal accounts management,database management and communication.
IX.44 Real Time Gross Settlement System (RTGS):Patches for removal of positive Inter-Bank FundsTransfer Processor (IFTP) acknowledgement andmultithreading for handling increased volume ofincoming messages in Participant Interface (PI)software were successfully deployed. During the year,participant banks have migrated their PI to Windows2008 environment. Steps have been initiated toreplace the existing RTGS system with the NextGeneration Real Time Gross Settlement (NG-RTGS)system for adopting the latest technology andemerging business processes. Some of the newfeatures proposed to be implemented in the NG-RTGS system are advanced liquidity managementfacility; extensible mark-up language (XML) basedmessaging system conforming to ISO 20022standards; and real time information and transactionmonitoring and control system.
IX.45 Public Debt Office: Negotiated DealingSystem (PDO-NDS): The application was suitablymodified to support the system with respect tointroduction of call and put options for Governmentsecurities, extinguishing bought back securities,buyback auctions for Market Stabilisation Scheme(MSS) and normal securities and development ofMarginal Standing Facility (MSF) for SCBs (other thanRRBs).
IX.46 Centralised Public Accounts DepartmentSystems (CPADS): A centralised web based
application with Public Key Infrastructure (PKI) basedsecurity for handling government transactions isworking successfully from the data centres. Duringthe year, a significant development in this applicationwas related to the software developed for collectionof e-payment of commercial taxes for the state ofKarnataka by Public Accounts Department (PAD),Bangalore. This module is functioning from thesecured web site and all the participating banks alongwith PAD Bangalore have been provided access tocarry out e-payment of commercial taxes. This hasfacilitated the State Government of Karnataka tocollect the commercial taxes through banks on T+0basis.
IX.47 Integrated Accounting System (IAS): BASIShas been replaced by IAS and has been rolled out inall centres.
IX.48 Core Banking Solution (CBS): A project fordeveloping and implementing an RBI specific CBShas been taken up and is expected to integrateactivities of the banking departments i.e., Public DebtOffice (PDO), Public Accounts Department (PAD) andDeposit Accounts Department (DAD).
IX.49 Database Management: A significant amountof statistical data is collected, compiled anddisseminated by the Reserve Bank. This datagenerating system augments the policy makingprocesses, which is the core function of the Bank.Advanced IT applications have been used by the Bankto enhance the efficacy of the data management anddissemination process (Box IX.3).
Box IX.3Information Technology as a Vehicle for Data Dissemination
The Reserve Bank of India compiles monetary, banking, andfinancial statistics for India while Central Statistics Officeproduces most of the economic statistics. Recognizing thepotential use of information technology solutions in the datamanagement processes, the Bank has been using ITsolutions consistently to enhance both coverage and qualityof data to contribute to the policy making processes.
Presently, multiple domain specific Statistical InformationSystems, ranging from stand-alone spreadsheet basedsystems to sophisticated systems based on Business
Intelligence (BI) tools are being used in the Bank. In order tofurther improve efficiency, a centralised approach is beingenvisaged for better manageability and control.
The approach may include centralisation of computinginfrastructure, generalisation of data handling processesand integration of data elements. The technologiesadopted will span across the entire spectrum of theGeneric Statistical Business Processes (GSBPM 4.0, 2009)like data design, collection, processing, analysis,dissemination, etc.
(Contd...)

ANNUAL REPORT
136
(...Concld.)
Improvement in the data collection and data exchangeprocesses, particularly from the banks, has been facilitatedby use of Online Return Filing System (ORFS) for submissionof returns as against the earlier paper format or unstructuredexcel format. Under ORFS, a single window returnssubmission system, commercial banks enter data or uploadreturns online through the web based front-end. Returnssubmitted by banks first reaches a central data pool, whichis then pushed to the user departments in the Reserve Bank.
While ORFS takes care of data capturing and transmissionof returns from banks to the Reserve Bank, it doesn’tincorporate any standard for exchange of data. Aligning withinternational standards on financial reporting, Reserve Bankhas adopted eXtensible Business Reporting Language(XBRL) format for reporting data by banks and financialinstitutions. Technically, XBRL is an extension of XML infinance and accounting, and XBRL is leveraging XML to themaximum extent.
Recently, the Bank prepared an Approach Paper onAutomated Data Flow (a straight through process) from theCBS or other IT systems of commercial banks to the ReserveBank, according to which banks would be required, in thefirst phase, to ensure seamless flow of data from theirtransaction server to their MIS server and automaticallygenerate all returns from the MIS server, without any manualintervention. In the second phase, the Reserve Bank wouldintroduce a system for the flow of data from the MIS serverof banks in a straight through process.
With time, the scope of data released by the Reserve Bankhas enlarged and the manner in which the data were released
has changed from print to electronic version. The Bank isusing various IT solutions to improve the dissemination ofstatistical data and chief among them is the Bank’s datawarehouse platform.
Data are now made available in downloadable and reusableformats through the Bank’s data warehouse, which theRBI had set up for its internal use in December 2002.For the benefit of researchers, analysts and others usersof such data outside the RBI, internet access to thepublishable part of the data warehouse has beenprovided by the Bank to the public through a link called‘Database on Indian Economy: RBI’s Data Warehouse’ onits website (www.rbi.org.in). This effort has been generallywelcomed by the academicians, researchers and generalpublic.
The data capturing process itself has been automated usingETL (Extract, Transform and Load) tools, which update thedata warehouse on incremental basis as per the pre-defineddata load strategy which includes push/pull technology basedon data changes in the source system. ETL tool carries outdata cleansing and data transformation to integrate relateddata from various sources, as a result data in data warehousestands up-to-date.
For the first time “Hand Book of Statistics on the IndianEconomy” was generated and printed directly from RBI datawarehouse and has been made available online also makingit nearly real time. Apart from this “Statistical Tables relatedto Banks in India” is also being brought out directly fromdata warehouse and more publications are envisaged to beadded on this platform.
POLICY INITIATIVES
IX.50 The review process of the InformationSecurity Policy, which was issued in 2005, has beeninitiated in the backdrop of a changed environmentfor centralisation of all IT systems and also changesin the IT industry. To take this forward aninterdepartmental committee has been formed withan external expert as the Chairman.
IX.51 The continuity of critical services in case of adisaster has always been a priority. But with the
adoption of technology based systems andapplications to provide such services, businesscontinuity preparedness has assumed greatersignificance. To address this issue, a comprehensiveBusiness Continuity Planning (BCP) documentcovering business continuity as well as disasterrecovery aspects for all the functions of the Bank isbeing prepared. DIT has been entrusted with thisresponsibility, with suitable inputs from businessowner departments.

137
XGOVERNANCE, HUMAN RESOURCES
DEVELOPMENT ANDORGANISATIONAL MANAGEMENT
The Reserve Bank has been entrusted with the responsibility of handling diverse functions ranging from monetary
policy, ensuring orderly conditions in the financial markets, regulation and supervision of banks and non-banking
financial companies to maintaining financial stability. Governance, human resource development and organisation
management is crucial to deliver on these multi-dimensional tasks efficiently. The Reserve Bank has taken several
initiatives in recent years covering improved transparency and governance and knowledge initiatives apart from
recruitment, training of staff, schemes for higher studies and incentive schemes for attaining professional qualifications
by the staff. Some departments of the Reserve Bank were reorganised with a view to harnessing greater synergies. As
part of corporate social responsibility, several green initiatives were undertaken by the Bank.
INITIATIVES FOR IMPROVED GOVERNANCE
X.1 The Reserve Bank has been steadilyimproving its governance in the recent years withinits legal structure (Box X.1). The focus on governancehas become necessary in view of the increasingcomplexities of the economy amidst a mandate thatis wider than most other central banks. The RBI Act,1934 indicates that issuance of currency and actingas a monetary authority are core to the RBIfunctioning. However, the Act also entrusts otherfunctions to the Reserve Bank such as regulation ofnon-bank financial intermediaries, financialinstitutions, management of foreign exchangereserves, management of sovereign debt - by statutein respect of central government and by agreementin respect of state governments, regulation of forex,money and government securities markets and theirderivatives. Various other statutes also entrust RBIwith the responsibility of oversight of payment andsettlement systems and strengthens its regulatory andsupervisory activities.
X.2 Amidst diverse functions, RBI has created amulti-layered governance structure that allowsdecision-making to proceed smoothly in accordancewith the statutory provisions. It has also takensteps for providing more frequent and morereliable information to the members of its decision-making and advisory bodies. In addition, it has takensteps for improved communication of its decisions orthe recommendations made by its advisory bodies(Paragraphs X.19 to X.25).
Meetings of the Central Board and its Committee
X.3 The Central Board held seven regularmeetings during the year 2010-11 (July-June). Ofthese, four were held at traditional metro centresincluding the post-Budget meeting which was gracedby the Hon’ble Finance Minister Shri PranabMukherjee, two were held at non-traditional centresand one at Agartala, Tripura where a new office wasopened in May 2011.
X.4 Forty six weekly meetings of the Committeeof the Central Board (CCB) were held during the yearin Mumbai. The CCB attended to the current businessof the Bank, including approval of the weekly accountsof Issue and Banking Departments.
Directors/Members of the Central Board/Local Boards– Changes since July 1, 2010
X.5 Smt Usha Thorat, Deputy Governor, retiredas at the close of business on November 9, 2010.She was appointed as Director of Centre for AdvancedFinancial Research and Learning (CAFRAL),Mumbai.
X.6 Smt Shyamala Gopinath, Deputy Governorretired from Bank’s service with effect from theforenoon of June 20, 2011. She was appointed DeputyGovernor of the Bank on September 21, 2004.
X.7 Shri Anand Sinha took over the office ofDeputy Governor of the Bank on January 19, 2011.

ANNUAL REPORT
138
Box X.1Governance Framework in the Reserve Bank
While Board practices differ widely amongst different centralbanks (Laybek and Morris, 2004), there has been anincreasing focus on governance issues amongst centralbanks (BIS, 2009; BIS, 2010). The central bank governancedeals with the ways in which the governments mandate thecentral banks certain objectives or sets goals or targets andcentral banks through their institutional arrangements goabout delivering them. It is about how boards, managementsand other decision making bodies function in order to deliverthe central bank objectives that are mandated. Just as incase of corporate governance, it covers the contractual andlegal arrangements and managerial practices.
There are fundamental differences between corporate andcentral bank governance. Governance in the case ofcorporate firms is best described as the ways in which thesuppliers of finance to the corporations assure themselvesof getting return on their investment. However, central bankgovernance is not about profit maximisation as central bankperforms services in nature of pubic goods. It is about legalfoundations, practices, governance and accountability inrelation to the mandate it has.
While several central banks, post-crisis have broadened theirmandate to perform activities other than monetary policy,the Reserve Bank of India since long been functioning as afull-service central bank in terms of its wide mandate. TheReserve Bank functions as regulator and supervisor of thebanks and non-bank financial companies, the payment andsettlement systems and regulator of money, forex,government securities and credit markets, banker to theGovernments and banks and also as lender of the last resort.The Reserve Bank derives its mandate from the ReserveBank of India Act, 1934 and from other specific statutes.Keeping in view its mandate, the Reserve Bank continues tostrive for improvement in its functioning and raising itsgovernance standards relating to the systems, processesand implementation mechanism in response to the evolvingglobal and domestic situations. What sets apart the ReserveBank from other central banks is the developmental role itplays in the economy, in particular, in the rural economy asalso in responding and reaching out to the needs of the under-privileged people of the society.
Governance Structure
The Central Board of Directors
The Central Board of Directors appointed by the Governmentof India is entrusted with the governance functions of theReserve Bank in accordance with the RBI Act. The CentralBoard reviews key economic, monetary and financialdevelopments and provides overall direction to the Bank’saffairs. The Central Board is assisted by various Committeesand Sub-committees for smooth functioning of the affairs ofthe Reserve Bank.
Committees
The Committee of the Central Board (CCB) with a balancedrepresentation of management representatives andDirectors meets every week to attend to the current businessof the Bank including approval of the Reserve Bank’s weeklyaccounts pertaining to the Issue and Banking Departmentsand assist the Central Board in the monitoring ofimplementation of various policy decisions.
A Board for Financial Supervision (BFS), as a Committee ofthe Central Board undertakes consolidated supervision ofthe financial sector comprising commercial banks, financialinstitutions and non-banking finance companies.
A Board for Payment and Settlement Systems (BPSS) alsoa Committee of the Central Board, regulates, supervises andensures smooth operation of the payment and settlementsystems. The BPSS is also empowered to set standards forexisting and future systems, authorise the payment andsettlement systems, determine criteria for membership tothese systems, including continuation, termination andrejection of membership.
Sub-committees
The Inspection and Audit Sub-committee examines thecritical areas emanating from the Management Audit andSystems Inspection (MASI) of the Central Office Departmentsand Regional Offices through compliance check andfeedback to executive management. The Human ResourcesManagement Sub-committee reviews manpower planningin the Bank and gives necessary approval for addition/upgradation of posts. The Building Sub-committee advisesReserve Bank on various matters, including construction ofstaff quarters, renovation of office and residential buildings.The Building sub-committee also reviews the utilisation ofcapital budgets during the year.
Local Boards
Four Local Boards representing as far as possible, theterritorial and economic interests of the local co-operativesand indigenous banks of the four regions of the countryadvise the Central Board on various matters relating to theregional issues of economic interest.
Technical Advisory Committee on Monetary Policy
A Technical Advisory Committee (TAC) on Monetary Policyfirst constituted in July 2005, advises the Reserve Bank onthe stance of monetary policy and monetary measures thatmay be undertaken in the ensuing policy reviews. Itcomprises the Governor as chairman, the Deputy Governorin charge of monetary policy as the vice chairman and otherthree Deputy Governors as members. Besides, thecommittee has five external members who are appointed bythe Governor. The role of the TAC is advisory in nature and
(Contd...)

GOVERNANCE, HUMAN RESOURCES DEVELOPMENTAND ORGANISATIONAL MANAGEMENT
139
(...Concld.)
the responsibility, accountability and time path of the decisionmaking remains entirely with the Reserve Bank. The minutesof the meetings of the TAC are now being posted on the RBIwebsite with a time lag.
Other Senior Management Group/Committee
A Top Management Group (TMG) under the Chairmanshipof Governor and attended by DGs, EDs and select HODs ofthe Reserve Bank, meets once in a month and discusseskey issues and prepares strategy for the future course ofaction in the short and medium term. A Committee of DeputyGovernors meets at regular intervals to discuss and decideon various policy matters referred to it. Governor chairsseveral sideline meetings generally held during Central Boardmeetings and also during his visits to the Regional Offices.The Governor meets the departmental heads and directrecruits of the Regional Offices, bankers of the region asalso senior State Government officials and discusses variousspecific developmental and implementational issues. Thedecisions taken in these meetings are followed-up with theentities concerned for implementation.
Improving Governance
The Reserve Bank is not an inflation targeting central bankand there is no formal memorandum of understanding (MoU)or a ‘Results Agreement’ between the Government and theReserve Bank. Nevertheless, the Reserve Bank hasfunctioned independently within a broad two-way consultativeprocess with the Government. It has taken several steps forimproved governance by wide consultations for policyformulation and for intensive policy interactionscommunicating its stance, action, expected outcomes, policy
successes and failures through several channels (Subbarao,2011). This has enhanced autonomy and accountability evenin the absence of formal mechanism. The Reserve Bankhas made extensive use of communication policy with theobjective of transparency, timeliness and credibility. TheReserve Bank communicates by way of website, publications,press releases, press meets, periodicals, monetary policystatements, speeches of Governor / Deputy Governors, daily/ weekly statistical dissemination and interaction with themedia. The Reserve Bank reiterates its resolve towardstransparency and responsibility to the members of the publicand other stakeholders through these public responses, thusenhancing accountability.
References:
Bank of International Settlements (2009), Issues in theGovernance of Central Banks, A Report from the CentralBank Governance Group, BIS Consultative Document, Basel,March.
Bank of International Settlements (2010), “The Future ofCentral Banking Under Post-Crisis Mandates”, BIS PaperNo.55, Ninth Annual BIS Conference, Monetary andEconomic Department, BIS, Basel, June.
Lybek, Tonny and JoAnne Morris (2004), “Central BankGovernance: A Survey of Boards and Management”, IMFWorking Paper, WP/4/226.
Subbarao, D. (2011), “Central Bank Governance Issues:Some RBI Perspectives”, Address to the Meetingof the Central Bank Governance Group in Basel on May 9,2011.
X.8 Shri R Gopalan, Secretary, Department ofEconomic Affairs, Ministry of Finance, Governmentof India was nominated on the Central Board of theBank with effect from February 15, 2011 in place ofShri Ashok Chawla, who retired at the close ofbusiness on January 31, 2011.
X.9 Shri Harun Rashid Khan took over theoffice of Deputy Governor of the Bank on July 4,2011
X.10 Shri Kamal Kishore Gupta, CharteredAccountant and Shri Mihir Kumar Moitra wereappointed as members of the Local Board (NorthernArea) with effect from August 26, 2010 and September24, 2010, respectively.
X.11 Md Sohrab was appointed to the Local Board(Eastern Area) on December 28, 2010. His resignation
was accepted with effect from May 13, 2011consequent upon his becoming a Member of theLegislative Assembly of West Bengal.
Appointment/Retirement of Executives
X.12 Shri C. Krishnan, Executive Director, retiredfrom the Bank’s service as at the close of businesson February 28, 2011.
X.13 Shri S. Karuppasamy and Shri R. Gandhi wereappointed as Executive Directors with effect fromFebruary 02, 2011 and March 01, 2011, respectively.Shri P. Vijaya Bhaskar and Shri B. Mahapatra wereappointed as Executive Directors with effectfrom June 13, 2011. Shri G Padmanabhan wasappointed as the Executive Director with effect fromJuly 4, 2011.

ANNUAL REPORT
140
Awards
X.14 Shri Azim Premji, Director of the Central Boardas also Shri Montek Singh Ahluwalia and Dr. VijayKelkar, former Government Directors of the CentralBoard of the Bank were conferred Padma BhushanAward on Republic Day, 2011 for Trade and Industryand Public Affairs, respectively.
Obituary
X.15 Prof. Suresh D. Tendulkar (72), Director of theCentral Board of the Bank passed away on June 21,2011 at Pune. Prof. Tendulkar was an outstandingscholar and was widely respected across theacademic and civil society for his ability to applyeconomic theory and insights to real world problemsof poverty and inequality. He was most known for hisextensive work on poverty and had also writtenextensively on Indian development issues andpolicies, including liberalization and globalization. Hewas a former Chairman of the Prime Minister’sEconomic Advisory Council. He was nominated onthe Bank’s Central Board on June 27, 2006. Prof.Tendulkar was also a member of the Eastern AreaLocal Board and a member of Human Resource Sub-Committee of the Bank.
X.16 Smt Shashi Rajagopalan (60), Director on theCentral Board of the Reserve Bank passed away onAugust 5, 2011 at Hyderabad. She was nominatedon the Central Board on June 27, 2006 and was amember of the Board for Financial Supervision. Shewas also a RBI nominee on the Board of NationalBank for Agriculture and Rural Development(NABARD) and Chairperson of the Audit Committeeconstituted by its Board. Smt Rajagopalan promotedcredit co-operatives among rural women. She was amember of expert committee to review co-operativelaws set up by International Labour Organisation(ILO). She had a long and illustrious career withseveral civil society organisations. She was activelyinvolved in the watershed development in the country.She was a member of the Sub-Committee of theCentral Board to study ‘Issues and Concerns in MFISector’.
Visit of Foreign Dignitaries
X.17 During the year, 38 delegations fromseventeen countries visited the Bank. The delegationsheld interactive meetings with the Governor and othersenior executives. A wide spectrum of issues cameup for discussion, including the functions and policiesof the Reserve Bank, facets of monetary policy,banking supervision, economic policy, trade andbilateral relations.
X.18 Several high profile dignitaries visited the Bankduring 2010-11 including, inter alia, the Rt. Hon.George Osborne, UK Chancellor of the Exchequer,U. S. Secretary of Commerce Gary Locke, SenatorChristopher J. Dodd, Chairman of the Banking,Housing and Urban Affairs Committee, USA, The LordMayor of the City of London Alderman Nick Anstee,Lord Stephen Green, Minister of State for Trade andInvestment, UK, H.E. Dr. Yuval Steinitz, Minister ofFinance, Israel, Prof. Stanley Fischer, Governor, Bankof Israel, Mr. Rundeersing Bheenick, Governor ofBank of Mauritius, and Dr. Ngozi Okonjo-Iweale,Managing Director of World Bank (Annex II). Thesehigh level visits helped in exchange of ideas andsignified the keen interest taken by the worldcommunity to understand India’s economic andfinancial sector policies, which had enabled thecountry to successfully cope with the global crisis.
INITIATIVES FOR IMPROVED COMMUNICATION
X.19 The Reserve Bank has been striving towardsa transparent communication policy and has takenseveral initiatives in this direction. Its publications havebecome concise with precise messages. Thepublications include the two statutory publications -the Annual Report and the Report on Trend andProgress of Banking in India - and other publicationssuch as the Report on Currency and Finance, as alsothe Monetary Policy and the Macroeconomic andMonetary Developments. Accompanied by crisp pressreleases, these publications are well-read andcommented upon by researchers and analysts as wellas by media.

GOVERNANCE, HUMAN RESOURCES DEVELOPMENTAND ORGANISATIONAL MANAGEMENT
141
Monetary policy communication
X.20 With a view to further improving monetarypolicy communication three new initiatives were takenby the Reserve Bank during 2010-11. First, it startedteleconferencing with researchers and analysts afterannouncing the annual and mid-term policies, as alsoafter the two quarterly policies. This enabled a firsthand understanding of the rationale of the policydirectly from policy makers. Second, from April 2011,it started live telecast of the Governor’s statement tothe bankers, which enabled the Reserve Bank to bringin public domain the stance of the policy directly fromthe Governor before the market begins to analysethe policy. Third, it has started disseminating minutesof the Technical Advisory Committee on MonetaryPolicy with a lag, as per the best internationalpractices.
Promoting interaction with stakeholders for betterunderstanding
X.21 In an effort to promote research, the ReserveBank has been holding seminars on its researchpublications relating to monetary policy, surveys doneby the Reserve Bank as a precursor to monetarypolicy, regulatory issues and on developmentalmeasures such as financial inclusion. These seminarshave helped in increasing interaction with variousstakeholders and promoted a better understanding.Workshops on central banking functions for journalistswho follow central banking were also organized whichcontributed towards creating a better understandingbetween the media and the central bank. Sessionson financial literacy aimed at educating the audienceabout functions and working of the Reserve Bankwere also organised.
X.22 As part of its financial literacy initiatives,regular educational visits to the Central Office of theReserve Bank are organised for students as well assenior citizens and young entrepreneurs. Theparticipants get an opportunity to visit the MonetaryMuseum to get a glimpse of the Reserve Bank’shistory and the National Clearing Cell to see thecheque clearing process. An interactive session withReserve Bank executives is also part of these visits.
Starting from 2008 till date, more than 150 educationalvisits have been conducted.
Outreach Programmes
X.23 During its Platinum Jubilee last year, theReserve Bank had launched an ‘outreach’ programmein which the senior management of the Reserve Bankvisited remote villages across the country to createawareness about banking and central banking. Thishas proved to be an immensely rewarding learningexperience for the Reserve Bank and it was decidedto continue the outreach programme as a regularactivity through 2010-11.
X.24 In an effort to bring the central bank closer tothe common man, the Reserve Bank has decided toconduct one town hall event every year. The eventfor 2010 was conducted in Chandigarh, with studentcommunity as the main audience. A newsibition wascreated out of Mint Road Milestones - the ReserveBank’s Platinum Jubilee publication brought out in2010 that recorded milestones in the Reserve Bank’shistory largely drawing from reports and photographsappearing in newspapers. After its inaugural run inKolkata in December 2010, the newsibition is nowscheduled to travel to ten centres, mainly second tierand remote cities.
X.25 The Reserve Bank also continued to makeextensive use of its web-site to communicate withexternal audiences. The site today has nearly 53,000registered users. The size of the regional languagewebsites has also increased significantly.
Right to Information Act (RTI), 2005
X.26 As part of its transparency goal and as part ofthe statutory obligations, RBI has been providing thenecessary information under the RTI Act. The headsof various Central Office Departments and the 15Banking Ombudsmen have been designated asCentral Public Information Officers (CPIOs), withExecutive Director (Shri V. S. Das) as the AppellateAuthority. In compliance with the directions of theCentral Information Commission (CIC), the ChiefGeneral Manager-in-Charge of Department ofAdministration and Personnel Management has beendesignated as the Transparency Officer.

ANNUAL REPORT
142
Table X.1: Reserve Bank Training Establishments - Programmes Conducted
Training Establishment 2008-09(July-June) 2009-10(July-June) 2010-11 (July-June)
No. of No. of No. of No. of No. of No. ofProgrammes Participants Programmes Participants Programmes Participants
1 2 3 4 5 6 7
RBSC, Chennai 149 3,015 143 2,960 147 2,904*CAB, Pune 161 4,867 160 4,885 162 4,951@ZTCs (Class I) 17 370 47 1,066 57 1,140ZTCs (Class III) 150 2,602 112 1,826 87 1,310ZTCs (Class IV) 64 1,329 63 1,214 70 1,422
* : Includes 19 concurrent auditors, 4 chartered accountants and 31 foreign participants.@: Includes 29 foreign participants.RBSC: Reserve Bank Staff College. CAB: College of Agricultural Banking. ZTC : Zonal Training Centre.
X.27 The number of requests for information underRIA has increased from 3,333 in 2008-09 (July-June)to 4,350 in 2009-10 and further to 5,087 in 2010-11.During 2010-11 (July-June) about 97 per cent ofrequests had been responded.
X.28 The Bank has initiated steps to digitise all therecords which are frequently required for furnishingthe information sought under the RTI Act. Incompliance with the directions of the CIC, the ReserveBank of India has formulated indicative negative list/classes of information which the Reserve Bankconsiders as exempt from disclosure under theprovisions of the RIA. This list was approved by theCommittee of the Central Board and has been hostedon the Bank’s website.
HUMAN RESOURCE DEVELOPMENTINITIATIVES
Training / deputation / higher studies / distancelearning
X.29 The Reserve Bank continued to provideavenues for skill upgradation to its staff, with a viewto enhance the quality of human capital in the Bank.The two training establishments of the Reserve Bank,viz., the Reserve Bank Staff College (RBSC), Chennaiand the College of Agricultural Banking (CAB), Punecater to the training needs of the officers of theReserve Bank and the banking industry and servethe objectives for human resource development. Theyhave been consistently striving for skill upgradation,while modernising the techniques for imparting
training as well as revamping the course content inresponse to the evolving challenges for central banksand the changing needs for training in the bankingsector. The four Zonal Training Centres (ZTCs) mainlyfocus on training of Class III and IV staff of the ReserveBank (Table X.1).
Repositioning of Zonal Training Centres (ZTCs)
X.30 The Zonal Training Centres (ZTCs),established in 1963, at the four metros were mandatedto cater to the training needs of workmen employeesof the Bank. The capacity and infrastructure of theseinstitutes were underutilised while the colleges werefinding it difficult to cope up with the increase intraining requirements. The ZTCs have therefore beenrepositioned as training centres for officers in basicskill building, both functional and soft. They will,however, continue to conduct training programmesfor workmen employees also.
Training at external institutions
X.31 During 2010-11, 1,090 officers were deputedby the Bank to participate in training programmes,seminars and conferences organised by externalmanagement/banking institutions in India. A numberof Class III and Class IV employees were also deputedfor training in external institutions in India during theyear. In addition, 166 Class III employees and 295Class IV employees were deputed for in-houseprogrammes within the Bank. The Reserve Bankdeputed 578 officers to attend training courses,seminars, conferences and workshops conducted by

GOVERNANCE, HUMAN RESOURCES DEVELOPMENTAND ORGANISATIONAL MANAGEMENT
143
banking and financial institutions and multilateralinstitutions in more than 34 countries (Table X.2).
X.32 Four officers were selected during the yearunder the Golden Jubilee Scholarship Scheme forhigher studies abroad during 2011-12. Under thisscheme, officers of the Bank get an opportunity topursue courses in leading international universities.In all, 103 officers have been selected under thisscheme since its inception in 1986. One officer wasselected during the year under the scheme ofsponsoring officers for two-years Post GraduateProgramme in Banking and Finance (PGPBF) atNIBM, Pune. Six officers of the Bank availed studyleave under different schemes for pursuing higherstudies during the year. Furthermore, 450 employeesavailed the benefits under the incentive scheme forpursuing select categories of part-time and distanceeducation courses during 2010-11.
Joint India-IMF Training Programme (ITP)-Pune
X.33 The Reserve Bank of India and theInternational Monetary Fund jointly established theJoint India–IMF Training Program (ITP) at NIBM, Punein May 2006 to impart policy oriented training ineconomics and related operational areas to Indianofficials (from Central Government, StateGovernments, Reserve Bank and other regulatorybodies) and the officials of countries from South Asiaand East Africa. The ITP serves as a platform todisseminate policy lessons learned in other parts ofthe world and as a forum to discuss regional issues.During the year, six programmes were conductedunder this joint training initiative covering topics, inter-alia, on macroeconomic management and financialsector issues, government finance statistics,microeconomic diagnostics, monetary and financial
statistics and anti-money laundering and combatingthe financing of terrorism. In all 36 participants fromthe Reserve Bank took advantage of this trainingfacility in 2010-11.
Operationalisation of CAFRAL
X.34 Launched by the Prime Minister, Dr.Manmohan Singh, CAFL has been set up as a Societyon April 19, 2007 and subsequently as a Trust underthe Bombay Trust Act 1950. The Centre is a non-profitorganization. A Concept Committee for CAFL underthe chairmanship of Dr. Ashok S. Ganguly was setup in 2009 which laid down the focus areas for CAFL.The Committee also recommended, inter alia, changeof name of Centre from Centre for Advanced FinancialLearning (CAFL) to Centre for Advanced FinancialResearch and Learning (CAFRAL). The CAFRAL hasin place a Governing Council, chaired by the Governorof Reserve Bank of India.
Creation of Human Resource ManagementDepartment (HRMD)
X.35 Consequent upon the amalgamation of thefunctions of the erstwhile Department ofAdministration and Personnel Management (DAPM)and Human Resources Development Department(HRDD), a new department called Human ResourceManagement Department (HRMD) has been createdin the Bank. Governor inaugurated the Departmenton August 3, 2011. With this merger, it is expectedthat there would be greater synergy between framingof human resource policies in Reserve Bank and theirexecution.
INITIATIVES IN ORGANISATION MANAGEMENT
X.36 The Reserve Bank during the year moved toreposition it as a knowledge institution, driving greaterfocus on the Bank’s strategic imperatives and relatedcapacity building measures, undertaking a diagnosticstudy of engagement levels amongst the Bank’spersonnel, developing improved ways of employeecollaboration and designing clearer and cascadedcommunication strategies.
Table X.2: Number of Officers Trained in ExternalTraining Institutions in India and Abroad
Year No. of officers No. of officerstrained in India trained abroad
1 2 3
2008-09 718 426
2009-10 1,104 553
2010-11 1,090 578

ANNUAL REPORT
144
Knowledge Initiative
X.37 Knowledge is a multi-dimensionalphenomenon, reflected in an organisation throughboth people and processes. Consequently, to beeffective, a Knowledge Policy must articulateobjectives and strategies related to both people andprocesses. With this in mind, the Reserve Bank’sKnowledge Policy has been designed with two setsof objectives, short term and medium term (Box X.2).
Reorganisation of Departments
X.38 The Reserve Bank has been increasinglyrelying on research to provide a more scientific basisfor its policy-making. The economic research and
analysis requirement of the Bank has increasedsignificantly over last several years, as the economicand operational environment in which the Bankoperates has turned increasingly more complex anddynamic. In this context, it was felt necessary tostreamline the organisational structure of Departmentof Economic Analysis and Policy (DEAP), by betteraligning the Department’s work to the research andanalytical needs of the Bank. Based on the report ofan Internal Committee, the department wasreorganised with thematic units reflecting the coreareas of research. The name of the department wasalso changed to “Department of Economic and PolicyResearch (DEPR)” from September 2010.
Box X.2Knowledge Initiative
There is now a fundamental rethinking of the principles oforganising, resulting in a quest for designs that are inherentlyflexible, highly oriented towards problem solving and has abias for continuous learning through experimentation. Theshift is now distinctly to organisations and industries referredto as 'knowledge-based' as opposed to the asset-basedmodel of value creation in traditional organisations andindustries.
As work gets increasingly knowledge intensive, there is anemergent need to convert institutions into KnowledgeInstitutions. Reserve Bank of India has also been seized ofthis and has, therefore, recently initiated a reorientationinitiative which puts a premium on enhancing the knowledgecontent of all its work practices.
Knowledge is a multi-dimensional phenomenon, reflectedin an organisation through both people and processes.Consequently, to be effective, a Knowledge Policy mustarticulate objectives and strategies related to both peopleand processes. To the extent that significant change is calledfor on both fronts, abruptness can be disruptive. The Policyshould phase in change so as to minimise disruption incurrent work practices even while enhancing the knowledgecontent of these practices.
With this in mind, RBI's Knowledge Policy has been designedwith two sets of objectives, differentiated by time horizon.Short-term objectives articulated by the Policy provide thebasis for immediate actions, which are intended to exploitavailable opportunities for knowledge enhancement withinexisting process and people arrangements. Medium-termobjectives are more ambitious, seeking to significantlyenhance the role of knowledge in decision-making andimplementation by the Bank. These will require changes inboth processes and people policies.
The Reserve Bank's Senior Management Retreat for the year2010 provided a number of inputs for follow-up actions forknowledge management by the Bank. Some of these wereconsistent with a short-term horizon, while others called fordiscontinuous change in organisational policies and,therefore, were consistent with a medium-term timeframe.
The Knowledge Policy of the Reserve Bank aims at facilitatingthe flow of knowledge through the organisation so as toenhance the quality of decision-making and implementationand to initiate a culture of information and knowledge sharingby departments and individuals. It also has medium-termobjectives of integrating knowledge into placement andtransfer decisions and to design career paths for juniorofficers.
Apart from deputation on trainings, Reserve Bank hasundertaken a number of initiatives to enhance the knowledgebase and skills of its human resources. These include(a) Leveraging technology for revamping the Bank's"Enterprise Knowledge Portal' - which helps the employeesin keeping abreast of the latest happenings both inside andoutside the organization - with a focus shift from informationto knowledge customization; (b) Setting up in-house groupsacross the Bank's offices which, inter alia hold seminars onimportant and emerging issues as also organize broad-basedStudy Circles in the Bank for discussing and debating ideasand issues of mutual interest and concern; (c) Building upwell-stocked libraries at all the offices of Reserve Bank;(d) The 'Knowledge Sharing Series' where external expertsare invited to deliver lectures on diverse areas ranging fromsubjects of general interest, issues of public concern, health,personal investments to women's empowerment; and (e) The'thematic video conference' every month which is an initiativetowards information dissemination within the Bank onimportant developments in various work areas.

GOVERNANCE, HUMAN RESOURCES DEVELOPMENTAND ORGANISATIONAL MANAGEMENT
145
X.39 The vision of DEPR is to be a knowledgecentre in policy-oriented research in monetary,financial, banking, international and macroeconomicissues. The management information system (MIS)of DEPR has been strengthened with a view toproviding a quick snapshot of data and informationcoupled with analytical inputs in an integrated formatto the top management. A near and medium termresearch agenda has been formulated to generateresearch output, which could form inputs for takingpolicy decisions on wide range of macroeconomicissues.
X.40 In the wake of financial crisis, increasedglobalisation and changes in monetary and bankingregulatory policies, the need for quality and timelystatistics as inputs to policy making has been greaterthan ever before. With the monetary policyannouncements becoming more frequent, need forhigh frequency forward looking information, mostlycollected through surveys, has become essential.Against this background, in 2010, the Department ofStatistics and Information Management (DSIM) hasreorganised and reoriented its statistical activitiesaround data generation, data management, datadissemination, surveys, analysis and research. Witha view of disseminating key macroeconomic datamore frequently, the ‘Handbook of Statistics on IndianEconomy’ has been made available on near real timebasis on the Reserve Bank’s web-site.
X.41 A new publication viz. ‘RBI Working PaperSeries’ was introduced as an exclusive webpublication to provide platform to the Reserve Bank’sStaff for presenting their research papers as well asto receive feedback from informed researchers, withthe first issue in the series commencing from March2011. The RBI Working Paper Series would focus onquick analytical research on issues and challengesof contemporary relevance to the Bank. In addition,‘RBI Occasional Papers’ continued to disseminate theresearch work of RBI Staff on broad range of issues,which have been at the forefront of policy discussions,with specific periodicity. Researchers of the Bank havealso published several research articles in referredeconomic domestic as well as international journals.
Promotion of external research activities
X.42 The broad categories of financial assistanceprovided by the Reserve Bank for promoting externalresearch include: (a) establishment of RBI Chairs inUniversities/ Research Institutions, (b) initiatingDevelopment Research Group (DRG) Studies,(c) financing of projects, (d) funding seminars/conferences/workshops, (e) financial support forpublication of research journals and (f) scholarshipscheme for faculty members from academicinstitutions.
X.43 In pursuance of the recommendations of theExpert Committee (Chairman: Dr. Bimal Jalan) andtaking into account case-by-case analysis offunctioning of the existing RBI Chairs, suggestionsexpressed during interaction with the Chair Professorsand norms of pay structure announced in the 6th PayCommission for UGC Professors, it was decided toenhance the corpus fund for RBI Chairs to Rs. 4 croreand also to strengthen the guidelines for operatingvarious external research schemes. At present, thereare 17 RBI Chairs (of which, corpus fund in one RBIChair is being recalled due to non-compliance ofterms and conditions) and two new RBI Chairs havebeen established to support research activities inemerging areas. Following the recommendations ofDr. Jalan Committee, a Steering Committee onEconomic and Policy Research (SCEPR) wasconstituted with Deputy Governor-in-Charge ofResearch Departments as Chairman and ExecutiveDirector-in-Charge of Research Departments as Vice-Chairman and few distinguished academicians andsenior officers of the Reserve Bank as members. Theobjectives of the Committee include preparing theresearch agenda and identifying research areas forexternal research, reviewing and ensuringaccountability, transparency and usefulness ofresearch activities funded by the Bank. Three sub-Committees have also been formed to assist SCEPRin achieving its objectives.
Performance Appraisal
X.44 With a view to bringing about transparency inthe appraisal process, it has been decided to allow

ANNUAL REPORT
146
all officers to view their Performance AppraisalReports (PAR) after finalisation of the same by theReview Committee. Further, a redressal mechanismto hear appeals, if any, from officers oncommunication of the entries made in their PAR hasalso been put in place by designating appellateauthorities for officers in all grades.
Engagement Survey
X.45 As part of its organisational developmentinitiatives, the Bank took up, during 2010-11, anEmployee Engagement Survey for gauging theengagement levels of its employees across its offices.One of the Bank’s empanelled consultants, i.e. AonHewitt Consultancy got the survey done for the Bank.While the engagement level of the staff has beenfound to be high, the survey brought out specific areaswhere engagement appears to be low. Focus on theseareas is on the anvil.
Grants and Endowments
X.46 The Reserve Bank has catalysed the creationof four research and training institutions in India, viz.,(i) Indira Gandhi Institute of Development Research(IGIDR), Mumbai; (ii) National Institute of BankManagement (NIBM), Pune; (iii) Indian Institute ofBank Management (IIBM), Guwahati; and (iv) Institutefor Development and Research in BankingTechnology (IDRBT), Hyderabad apart from its owntraining colleges. During the year 2010-11, ReserveBank extended financial support of `1,800 lakh, `263lakh and `75 lakh to IGIDR, NIBM and IIBM,respectively.
Industrial Relations
X.47 Industrial relations in the Bank remainedpeaceful during the year 2010-11. Recognising thesignificance of designing reasonable compensationpackages for appropriate harnessing of humancapital, the pay and allowances of all categories ofemployees in the Reserve Bank were revised duringthe year, effective November 01, 2007. Thesechanges have reflected the Reserve Bank’s positiveapproach for organisational development throughenhanced productivity strategies and better work-lifebalances for its employees.
Recruitment
X.48 During 2010 (January-December), theReserve Bank recruited 165 employees. Of this, 18belonged to Scheduled Castes (SCs) and 12 toScheduled Tribes (STs) categories, constituting 18.2per cent of total recruitment (Table X.3).
Staff Strength
X.49 The total staff strength of the Reserve Bankas on December 31, 2010 was 19,207 as comparedto 20,295 a year ago (Table X.4 and Chart X.1). Ofthe total staff, 21 per cent belonged to ScheduledCastes and 8.9 per cent belonged to ScheduledTribes.
Table X.3: Recruitment by theReserve Bank – 2010*
Category of Total of which PercentageRecruitment SC ST SC ST
1 2 3 4 5 6
Class I 109 13 08 11.9 7.3
Class III 3 0 0 0.0 0.0
Class IV
(a) Maintenance 8 5 1 62.5 12.5Attendant
(b) Others 45 0 3 0.0 6.7
Total 165 18 12 10.9 7.3
* : January-December.
Chart X.1: Total Staff Strength of the Reserve Bank
10,000
15,000
20,000
25,000
30,000
35,000
1999
2000
2001
2002
2003
2004
2005
2006
2007
2008
2009
2010
end-December

GOVERNANCE, HUMAN RESOURCES DEVELOPMENTAND ORGANISATIONAL MANAGEMENT
147
Table X.5: Category-wise Staff Strength (As on December 31, 2010)
Class Actual Strength
1 2
A. Class I 8,7541. Senior Officers in Grade F 932. Senior Officers in Grade E 2283. Senior Officers in Grade D 3914. Officers in Grade C 9395. Officers in Grade B 1,3396. Officers in Grade A 5,6527. Treasurer 118. Deputy Treasurer 349. Assistant Treasurer 67
B. Class III 3,6041. Sr. Assistant 1,1542. Assistant 8763. Secretarial assistant 1164. Word Processor Assistant 3655. Special Assistant (Teller) 6086. Class III (Others) 485
C. Class IV 6,8491. Maintenance Staff 1,4702. Service Staff 4,4113. Technical Staff 2024. Other Staff 766
Total Strength in the RBI (A+ B+C) 19,207
X.50 During the year 2010 (January-December),
meetings between the management and the
representatives of the All India Reserve Bank
Scheduled Castes/Scheduled Tribes and the
Buddhist Federation were held on four occasions to
discuss issues relating to the implementation of
reservation policy in the Reserve Bank. In accordance
with the Central Government’s policy, the Reserve
Bank provided reservation to Other Backward Classes
(OBCs) effective September 8, 1993. The
representation of OBCs (recruited after September
1993) in the Reserve Bank as on December 31, 2010
stood at 942. Of these, 335 were in Class I, 82 in
Class III and 525 in Class IV.
X.51 One meeting was held between the
management and the representative of the All India
Reserve Bank OBC Employees’ Welfare Association
to discuss issues relating to implementation of
reservation policy in Reserve Bank.
X.52 The total strength of ex-servicemen in the
Reserve Bank as on December 31, 2010 stood at
216 in Class I, 113 in Class III and 728 in Class IV.
The total number of physically handicapped
employees in Class I, Class III and Class IV cadres
in the Reserve Bank stood at 245, 81 and 136,
respectively, as on December 31, 2010.
X.53 Of the total staff, 45.6 per cent belonged to
Class I, 18.8 per cent to Class III and the remaining
to Class IV (Table X.5).
X.54 Mumbai centre (including the Central OfficeDepartments) continued to have the maximumnumber of staff (of about 30 per cent) (Table X.6).
Opening of Sub-Office of RBI at Agartala (Tripura)
X.55 The Agartala Sub-Office of the Reserve Bankwas opened on May 19, 2011, thus making Tripurathe second state in the North-East after Assam to havean office of the Bank. The new office will further co-ordination with banks, State Government, localauthorities, etc. so as to ensure that targets under
Table X.4: Staff Strength of the Reserve Bank
Category Per cent toTotal Strength
Total Strength SC ST SC ST
December December December December December December December 31, 201031, 2009 31, 2010 31, 2009 31, 2010 31, 2009 31, 2010
1 2 3 4 5 6 7 8 9
Class I 9,430 8,754 1,365 1,277 658 598 14.6 6.8
Class III 3,789 3,604 596 554 439 422 15.4 11.7
Class IV 7,076 6,849 2,300 2,200 710 688 32.1 10.0
Total 20,295 19,207 4,261 4,031 1,807 1,708 21.0 8.9

ANNUAL REPORT
148
special dispensation scheme and roadmap forproviding banking services in villages with populationof more than 2,000 under financial inclusion plansare met, as also to ensure that banks take initiative toinculcate the habit of banking amongst the ‘no- frills’account holders. It would also explore new avenuesfor credit so as to improve the CD ratio for the stateand monitor availability of good quality currency notes.
Rajbhasha
X.56 The Reserve Bank continued with its effortsto promote the use of Hindi in its working during 2010-11 in pursuance of the statutory requirements of
Rajbhasha policy. During the year, several Hinditraining programmes were conducted. A quarterlyHindi magazine on banking viz. “Banking Chintan-Anuchintan”, containing original Hindi articles, withits special issue on ‘Co-operative Banking’, waspublished. A reporting package on Rajbhasha wasmade live ensuring online submission of quarterlyreports regarding the use of Hindi by the RegionalOffices (ROs)/ Central Office Departments (CODs)of the Bank. Rajbhasha Officers’ conference as wellas region-wise review meetings with the concernedRajbhasha Officers were held to monitor the progressmade in the use of Hindi. All the handouts were madeavailable in bilingual form in its training colleges andthe Bank continued to bring out various publicationsin bilingual form i.e. both in Hindi and English.
Management of the Bank’s Premises
X.57 Premises Department continued its effortstowards providing residential accommodation to theofficers in a planned way during the year. In all, sixprojects including four projects for officers’ flats andtwo projects for student hostels in IGIDR and RBSChave been taken up under ‘design and build (DB)’mode, which are expected to be completed by mid-2013. All these buildings will be developed as onesingle project, which is first of its kind in the Bank.The contractor viz. M/s Shapoorji Pallonji & Co. Ltd.would be responsible for the planning, designing,obtaining permission from the controlling civicauthorities and executing them, while PremisesDepartment will monitor the mile stone events of theproject with a view to complete the projects as perthe specified quality and time.
The Green Initiatives
X.58 As a part of the Bank’s corporate socialresponsibility, many initiatives aiming at environmentpreservation and protection have been undertaken.Premises Department undertakes energy as well aswater audit to identify areas of wastages and devisemore efficient ways of resource utilisation. Newequipments for performance measurements on useof water and electricity have been installed at variouspoints in Central Office Building. Further, most of the
Table X.6 : Reserve Bank’s Office-wiseStrength of Staff
(As on December 31, 2010)
Office Class I Class III Class IV Total(including sub-offices)
1 2 3 4 5 6
1. Ahmedabad 379 179 298 8562. Bengalaru 468 145 260 8733. Belapur 155 68 233 4564. Bhopal 184 26 96 3065. Bhubaneswar 209 73 227 5096. Chandigarh 199 34 114 3477. Chennai 541 316 517 1,3748. Dehradun 11 2 3 169. Gangtok 4 0 0 4
10. Guwahati 244 99 219 56211. Hyderabad 353 127 294 77412. Jaipur 290 125 226 64113. Jammu@ 102 8 61 17114. Kanpur 285 182 393 86015. Kochi 52 44 44 14016. Kolkata 701 417 671 1,78917. Lucknow 200 58 135 39318. Mumbai 972 534 1,152 2,65819. Nagpur 300 250 275 82520. New Delhi 594 275 409 1,27821. Panaji, Goa 7 4 2 1322. Patna 258 69 286 61323. Pune-CAB-CRDC-ITP 69 19 84 17224. Raipur 12 0 0 1225. Ranchi 11 0 0 1126. Shimla 7 0 0 727. Thiruvananthapuram 218 71 167 456A. Total 6,825 3,125 6,166 16,116B. CODs # 1,929 479 683 3,091
Grand Total 8,754 3,604 6,849 19,207
CAB : College of Agricultural Banking.CRDC : Central Records and Documentation Centre.ITP : IMF Training Programme, Pune@ : Includes Srinagar Sub-Office.# : Central Office DepartmentsNote: Agartala Sub-Office was opened on May 19, 2011.
GOVERNANCE, HUMAN RESOURCES DEVELOPMENTAND ORGANISATIONAL MANAGEMENT
149
old central air-conditioning equipments have beenreplaced with new energy efficient air-conditioningequipments using environment friendly refrigerantsand the remaining equipments will also be replacedin the next two years.
X.59 The old lift equipments are being replaced withnew energy efficient equipments based on ‘variablevoltage variable frequency (VVVF)’ technology withmicroprocessor based smart traffic managementsystems. As a pilot project, recently an exercise hasalso been taken up for Carbon Footprint mapping forthe Central Office Building. As a result of all theseefforts, 24 of the Reserve Bank’s office buildings havereceived star ratings from the Bureau of EnergyEfficiency, Ministry of Power. The new buildingconstruction projects being undertaken are as per thelatest green building requirements.
Internal Audit/Inspection in the Reserve Bank
X.60 Inspection Department examines andevaluates systems, processes and controls to provideobjective feedback to the top management regardinghealth of various offices / departments of the Bank. Acompendium of Information Systems (IS) auditguidelines covering both generic as well as applicationspecific areas was prepared and circulated during2010-11 to all stakeholders. The five regional officeswere covered under Risk Based Internal Audit (RBIA)during the year 2010-11 in an endeavor to qualitativelyenhance audit process. Management audit of four
offices of Banking Ombudsman (BO) were also carriedout during the year. Technology audit of EnterpriseKnowledge Portal (EKP), Mail Message Service(MMS) and Integrated Computerised CurrencyOperations Management System (ICCOMS) werealso carried out by external experts during the year.
X.61 Quality assurance of Inspection Departmentwas carried out by a team from Institute of InternalAuditors (IIA) in December 2010, which conferred thehighest rating viz. ‘generally conforms’ on theDepartment. Based on suggestions of the audit, aninternal group was constituted with some CentralOffice Departments of the Bank to prepare criticalitymatrices to facilitate and support Enterprise RiskManagement (ERM) and RBIA implementation for theBank. Action is also initiated with all CODs inidentification of functional risks and updation of riskregisters and with all CODs and ROs in building up‘Incident Database’. A system of IS audit oncontinuous assurance basis (akin to concurrent audit)was introduced initially at four metro offices withexternal assistance.
X.62 Department of Economic and Policy Research(DEPR) received ISO 9001-2008 certification duringthe year. ISO certification process initiated at eightROs is at final stage. Information SecurityManagement System (ISMS) certification of CentralAccounts Section (CAS), Nagpur and FMD, Mumbaiwas completed during the year.

150
The balance sheet of the Reserve Bank expanded significantly during the year, mainly reflecting the impact of
liquidity management operations undertaken by the Bank. The income from foreign assets declined for the second
successive year, reflecting the low interest rates in international markets. The decline in income from foreign assets
in 2010-11 was, however, more than offset by earnings from domestic assets which have expanded. While the Bank’s
gross income increased by 12.73 per cent to ` 37,070.12 crore in 2010-11, there was a 3 per cent increase in total
expenditure to ` 8,655.22 crore. After meeting the needs of necessary transfer to the Contingency Reserve and the
Asset Development Reserve, ` 15,009 crore was allocated for transferring to the Government.
XI THE RESERVE BANK’SACCOUNTS FOR 2010-11
XI.1 The size of the Reserve Bank’s balance sheetincreased significantly in 2010-11 (July-June) mainlyon account of its liquidity management operations.On the liability side, the expansion was on account ofa large increase in notes in circulation as also anincrease in banks’ deposits with the Reserve Bank inline with the deposit growth in the banking system(see Box II.6). On the asset side, there was asignificant increase in Bank’s portfolio of domesticassets in the form of government securities onaccount of open market purchases, repo purchasesand disinvestment of Government of India’s surplusbalance parked with the Reserve Bank. The increasein foreign currency assets mainly reflected thevaluation effect on the portfolio.
XI.2 The financial statements of the Reserve Bankare prepared in accordance with the Reserve Bankof India Act, 1934 and the notifications issuedthereunder and in the form prescribed by the ReserveBank of India General Regulations, 1949. TheReserve Bank presents two balance sheets. The firstone relating to the sole function of currencymanagement is presented as the Balance Sheet ofthe Issue Department. The second one reflecting theimpact of all other functions of the Bank is known asthe Balance Sheet of the Banking Department. Thekey financial results of the Reserve Bank’s operationsduring the year 2010-11(July-June) are presented inthis Chapter.
INCOME
XI.3 The Reserve Bank’s assets and liabilitiesreflect the outcome of its operations guided by the
overall policy objectives relating to the economy andthe financial system and not by commercialconsiderations.
XI.4 The two major components of the Bank’sincome are earnings from foreign sources andearnings from domestic sources. The major sourceof the net interest receipts is augmented by relativelysmall amounts of income from other sources, viz.,discount, exchange, commission, etc.
XI.5 The gross income of the Reserve Bank forthe year 2010-11 was `37,070.12 crore, an increaseof 12.73 per cent over the previous year (Table XI.1).The increase in income from domestic sources morethan offset the decline in income from foreign sources.
Earnings from Foreign Sources
XI.6 The Reserve Bank’s earnings from thedeployment of foreign currency assets and golddecreased by `3,952.86 crore (15.75 per cent) from`25,102.55 crore in 2009-10 to `21,149.69 crorein 2010-11. The rate of earnings on foreigncurrency assets and gold was lower at 1.74 per centin 2010-11 as compared with 2.09 per cent in2009-10 (Table XI.2).
Earnings from Domestic Sources
XI.7 The earnings from domestic sourcesincreased by `8,138.84 crore from `7,781.59 crore in2009-10 to `15,920.43 crore in 2010-11, registeringan increase of 104.59 per cent (Table XI.3). Theincrease was mainly due to the effect of earnings on

THE RESERVE BANK’S ACCOUNTS FOR 2010-11
151
LAF operations, governments’ cash managementoperations involving higher availment of ways andmeans advances (WMA) from the Reserve Bankand higher coupon receipt on an increasedportfolio of government securities. The rate ofearnings on average domestic assets increased from3.45 per cent in the previous year to 3.77 per cent in2010-11.
EXPENDITURE
XI.8 The Reserve Bank’s expenditure comprisesits establishment expenses besides expenditure thatarises in the process of performing statutory functionsof the Bank, such as, agency charges and securityprinting charges. The total expenditure of the ReserveBank increased by `252.10 crore (3.00 per cent)from `8,403.12 crore in 2009-10 to `8,655.22 crorein 2010-11 largely due to an increase in establishmentexpenditure and agency charges, moderated by adecline in security printing charges (Table XI.4).
Establishment Expenditure
XI.9 The establishment expenses for 2010-11were `2,300.71 crore as against `1,986.82 crore for2009-10 registering an increase of `313.89 crore(15.80 per cent). The increase is mainly due to therevision of wages of all categories of staff withretrospective effect.
Non-Establishment Expenditure
XI.10 The amount of agency charges paid during2010-11 was `3,012.49 crore compared with`2,855.02 crore in 2009-10. The increase of `157.47crore (5.52 per cent) is mainly attributable to theincrease in the volume of government businessconducted by agency banks. Agency charges alsoincludes a small component of fees paid by theReserve Bank to the Primary Dealers as underwritingcommission. This component decreased from`64.14 crore in 2009-10 to `36.76 crore in 2010-11and constituted 1.22 per cent of the agency chargesin 2010-11.
Table XI.1: Gross Income (` crore)
Item 2006-07 2007-08 2008-09 2009-10 2010-11
1 2 3 4 5 6
A. Foreign SourcesInterest, Discount, Exchange 35,152.99 51,883.27 50,796.21 25,102.55 21,149.69
B. Domestic Sources (i) Interest 5,144.52 4,958.35 9,056.27 6,646.35 15,031.84 (ii) Profit on sale of shares of SBI 34,308.60 - - - - (iii) Other Earnings 742.22 909.17 879.50 1,135.24 888.59 Total : [(i)+(ii)+(iii)] 40,195.34 5,867.52 9,935.77 7,781.59 15,920.43
(5,886.74)
C. Total Income (Gross) (A+B) 75,348.33 57,750.79 60,731.98 32,884.14 37,070.12(41,039.73)
Note: Figures in parentheses indicate the amount excluding profit of `34,308.60 crore on sale of shares in SBI.
Table XI.2: Earnings from Foreign Sources (` crore)
Item As on Variation
June 30, 2010 June 30, 2011 Absolute Per cent
1 2 3 4 5
Average Foreign Currency Assets (FCA) 12,03,828.90 12,17,751.21 13,922.31 1.16
Earnings (Interest, Discount, Exchange gain/loss,Capital gain/loss on securities) 25,102.55 21,149.69 (-) 3,952.86 (-) 15.75
Earnings as percentage of Average FCA 2.09 1.74
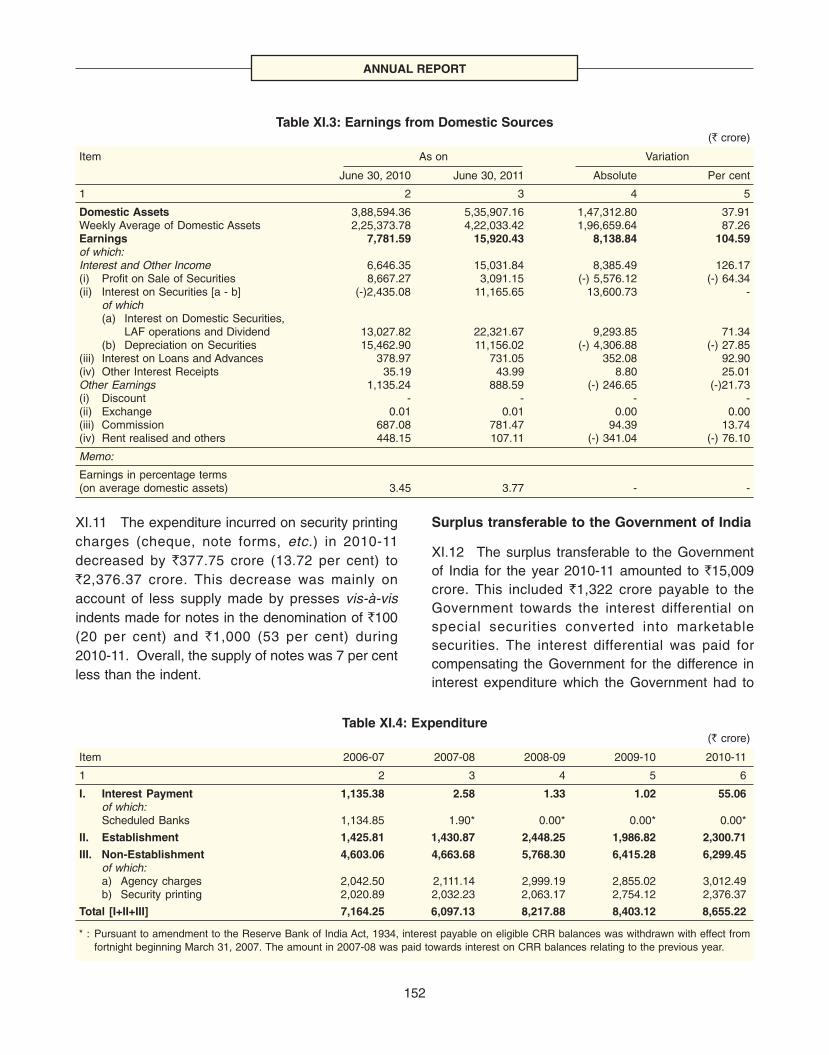
ANNUAL REPORT
152
XI.11 The expenditure incurred on security printingcharges (cheque, note forms, etc.) in 2010-11decreased by `377.75 crore (13.72 per cent) to`2,376.37 crore. This decrease was mainly onaccount of less supply made by presses vis-à-visindents made for notes in the denomination of `100(20 per cent) and `1,000 (53 per cent) during2010-11. Overall, the supply of notes was 7 per centless than the indent.
Surplus transferable to the Government of India
XI.12 The surplus transferable to the Governmentof India for the year 2010-11 amounted to `15,009crore. This included `1,322 crore payable to theGovernment towards the interest differential onspecial securities converted into marketablesecurities. The interest differential was paid forcompensating the Government for the difference ininterest expenditure which the Government had to
Table XI.3: Earnings from Domestic Sources (` crore)
Item As on Variation
June 30, 2010 June 30, 2011 Absolute Per cent
1 2 3 4 5
Domestic Assets 3,88,594.36 5,35,907.16 1,47,312.80 37.91Weekly Average of Domestic Assets 2,25,373.78 4,22,033.42 1,96,659.64 87.26Earnings 7,781.59 15,920.43 8,138.84 104.59of which:Interest and Other Income 6,646.35 15,031.84 8,385.49 126.17(i) Profit on Sale of Securities 8,667.27 3,091.15 (-) 5,576.12 (-) 64.34(ii) Interest on Securities [a - b] (-)2,435.08 11,165.65 13,600.73 -
of which(a) Interest on Domestic Securities,
LAF operations and Dividend 13,027.82 22,321.67 9,293.85 71.34(b) Depreciation on Securities 15,462.90 11,156.02 (-) 4,306.88 (-) 27.85
(iii) Interest on Loans and Advances 378.97 731.05 352.08 92.90(iv) Other Interest Receipts 35.19 43.99 8.80 25.01Other Earnings 1,135.24 888.59 (-) 246.65 (-)21.73(i) Discount - - - -(ii) Exchange 0.01 0.01 0.00 0.00(iii) Commission 687.08 781.47 94.39 13.74(iv) Rent realised and others 448.15 107.11 (-) 341.04 (-) 76.10
Memo:
Earnings in percentage terms(on average domestic assets) 3.45 3.77 - -
Table XI.4: Expenditure(` crore)
Item 2006-07 2007-08 2008-09 2009-10 2010-11
1 2 3 4 5 6
I. Interest Payment 1,135.38 2.58 1.33 1.02 55.06of which:Scheduled Banks 1,134.85 1.90* 0.00* 0.00* 0.00*
II. Establishment 1,425.81 1,430.87 2,448.25 1,986.82 2,300.71
III. Non-Establishment 4,603.06 4,663.68 5,768.30 6,415.28 6,299.45of which:a) Agency charges 2,042.50 2,111.14 2,999.19 2,855.02 3,012.49b) Security printing 2,020.89 2,032.23 2,063.17 2,754.12 2,376.37
Total [I+II+III] 7,164.25 6,097.13 8,217.88 8,403.12 8,655.22
* : Pursuant to amendment to the Reserve Bank of India Act, 1934, interest payable on eligible CRR balances was withdrawn with effect fromfortnight beginning March 31, 2007. The amount in 2007-08 was paid towards interest on CRR balances relating to the previous year.

THE RESERVE BANK’S ACCOUNTS FOR 2010-11
153
bear consequent to conversion of such specialsecurities. The position of income, expenditure andsurplus transferred to the Government in the last fiveyears is given in Table XI.5.
Internal Reserves
XI.13 Contingency Reserve represents the amountset aside on a year-to-year basis for meetingunexpected and unforeseen contingencies, includingdepreciation in the value of securities, exchangeguarantees and risks arising out of monetary/exchange rate policy compulsions. In order to meetthe needs of internal capital expenditure and make
investments in subsidiaries and associateinstitutions, a further sum is provided andcredited to the Asset Development Reserve. Theamounts of transfer to the Contingency Reserveand the Asset Development Reserve and thesurplus transferred to the Government as apercentage to the total income are set out inTable XI.6.
BALANCE SHEET
XI.14 The size of the overall balance sheet of theReserve Bank increased noticeably during 2010-11
Table XI.5 : Trends in Gross Income, Expenditure and Net Disposable Income (` crore)
Item 2006-07 2007-08 2008-09 2009-10 2010-11
1 2 3 4 5 6
Total Income (Gross) 41,039.73 57,750.79 60,731.98 32,884.14 37,070.12(75,348.33) #
Less transfer to:
(i) Contingency Reserve 20,488.97 33,430.74 26,191.40 5,168.39 12,167.27
(ii) Asset Development Reserve 1,971.51 3,207.92 1,309.70 549.63 1,234.63
Total (i + ii) 22,460.48 36,638.66 27,501.10 5,718.02 13,401.90
Total Income (Net) 18,579.25 21,112.13 33,230.88 27,166.12 23,668.22(52,887.85) #
Total Expenditure 7,164.25 6,097.13 8,217.88 8,403.12 8,655.22Net Disposable Income 11,415.00 15,015.00 25,013.00 18,763.00 15,013.00
(45,723.60) #
Less : Transfer to Funds * 4.00 4.00 4.00 4.00 4.00
Transfer of surplus to the Government 11,411.00 15,011.00 25,009.00 18,759.00 15,009.00(45,719.60) #
# : Figures in parentheses indicate amounts including profit on sale of shares of the State Bank of India (SBI) divested on June 29, 2007.* : An amount of ` one crore each has been transferred to the National Industrial Credit (Long Term Operations) Fund, National Rural
Credit (Long Term Operations) Fund, National Rural Credit (Stabilisation) Fund and National Housing Credit (Long Term Operations)Fund during each of the five years.
Table XI.6: Contingency and Asset Development Reserves and Surplus Transfer to the Government(` crore)
Item 2006-07 2007-08 2008-09 2009-10 2010-11
1 2 3 4 5 6
Total Income (Gross) 41,039.73 * 57,750.79 60,731.98 32,884.14 37,070.12Transfer to Contingency Reserve 20,488.97 33,430.74 26,191.40 5,168.39 12,167.27
(49.92) (57.89) (43.13) (15.72) (32.82)
Transfer to Asset Development Reserve 1,971.51 3,207.92 1,309.70 549.63 1,234.63(4.80) (5.55) (2.16) (1.67) (3.33)
Transfer of Surplus to the Government 11,411.00 * 15,011.00 25,009.00 18,759.00 15,009.00(27.80) (25.99) (41.18) (57.05) (40.49)
Transfer of Surplus to the Government aspercentage of Total Income (Gross) less Expenditure 33.69 29.06 47.62 76.63 52.82
* : Excluding profit on account of sale of shares of SBI.Note: Figures in parentheses indicate proportion to the total income (gross).
ANNUAL REPORT
154
due to increase in notes in circulation (liabilities ofthe Issue Department) and increase in the depositsof banks with the Reserve Bank (liabilities of theBanking Department). While the first component isdemand driven, the second component changes inrelation to growth in deposits as well as monetarypolicy changes, if any, effected through the instrumentof CRR.
Issue Department – Liabilities
XI.15 The liabilities of the Issue Department equalthe currency notes issued by the Government of Indiabefore the commencement of operations of ReserveBank on April 1, 1935 plus the bank notes issued bythe Reserve Bank since then in terms of Section 34(1)of the RBI Act. The notes in circulation increased by15.11 per cent during 2010-11, as compared with 20per cent during 2009-10.
Issue Department - Assets
XI.16 In terms of the RBI Act, the eligible assets forthe Issue Department consist of gold coin and bullion,foreign securities, rupee coin, Government securitiesand internal bills of exchange. The total holding ofgold by the Reserve Bank stands at 557.75 metrictonnes. A part of gold stock is marked as assets ofthe Issue Department and reflected accordingly in thebalance sheet of the Issue Department. Theremaining stock of gold is reckoned as assets of theBanking Department and is shown under “OtherAssets” in the balance sheet of the BankingDepartment.
Banking Department – Liabilities
XI.17 The liabilities of the Banking Departmentinclude the following:
a) Capital paid-up: The Reserve Bank wasconstituted as a private shareholders’ Bank in1935 with an initial paid-up capital of `5 crore.The Bank was nationalised with effect fromJanuary 1, 1949 and the entire ownership is nowvested in the Government of India. The paid-upcapital continues to be `5 crore as per section 4of the RBI Act.
b) Reserve Fund: The original Reserve Fund of`5 crore was created in terms of section 46 ofthe RBI Act as contribution from the CentralGovernment for the currency liability of the thensovereign government taken over by the ReserveBank. Thereafter, `6,495 crore was credited tothis Fund by way of gain on periodic revaluationof gold up to October 1990, thus taking it to`6,500 crore. Since then such valuation gain/loss is booked in the “Currency and GoldRevaluation Account” under the head “OtherLiabilities” in the balance sheet.
c) National Industrial Credit (Long TermOperations) Fund: This Fund was created in July1964, under section 46C of the RBI Act with aninitial corpus of `10 crore plus annualcontributions by the Bank for financial assistanceto eligible financial institutions. Since 1992-93,only a token amount of `1 crore is beingcontributed each year.
d) National Housing Credit (Long Term Operations)Fund: This Fund was created in January 1989under section 46D of the RBI Act with an initialcorpus of `50 crore plus annual contributions bythe Bank thereafter for extending financialaccommodation to the National Housing Bank.Since 1992-93, only a token amount of `1 croreis being contributed each year.
There are two other Funds, viz., National RuralCredit (Long Term Operations) Fund andNational Rural Credit (Stabilisation) Fundconstituted under section 46A of the RBI Actwhich are now placed with NABARD. A tokencontribution of `1 crore is made each year toeach of these two Funds.
e) Deposits: These represent the cash balancesmaintained with the Reserve Bank by the Centraland the State Governments, banks, all Indiafinancial institutions such as EXIM Bank,NABARD, etc., foreign central banks, internationalfinancial institutions, the balance in differentaccounts relating to the Employees’ ProvidentFund, Gratuity and Superannuation Funds.

THE RESERVE BANK’S ACCOUNTS FOR 2010-11
155
f) Bills payable: This represents Demand Drafts(DDs) and Payment Orders outstanding forpayment and balances under the RemittanceClearance Account pending encashment of theDDs issued.
g) Other Liabilities: Internal reserves and provisionsof the Reserve Bank are the major componentsof other liabilities. In terms of specific sub-heads,other liabilities include balances in ContingencyReserve (CR), Asset Development Reserve(ADR), Currency and Gold Revaluation Account(CGRA), Exchange Equalisation Account (EEA),Investment Revaluation Account (IRA) and alsothe surplus pending transfer to the Governmentand provision for outstanding expenses. Otherliabilities increased from `3,28,809.36 croreas on June 30, 2010 to `4,14,197.15 crore as onJune 30, 2011, mainly due to accretion to CGRA.
h) The CR and the ADR reflected in “OtherLiabilities” are in addition to the ‘Reserve Fund’of `6,500 crore held by the Reserve Bank as adistinct balance sheet head.
Currency and Gold Revaluation Account (CGRA),Exchange Equalisation Account (EEA) andInvestment Revaluation Account (IRA)
XI.18 Gains/losses on valuation of foreign currencyassets and gold due to movements in the exchangerates and/or price of gold are not taken to the Profitand Loss Account but instead booked under a balancesheet head named as the Currency and GoldRevaluation Account (CGRA). The balance in thisaccount represents accumulated net gain on valuationof foreign currency assets and gold. During 2010-11,there was an increase of `63,152.06 crore in theCGRA, thus increasing its balance from ̀ 1,19,133.98crore as on June 30, 2010 to `1,82,286.04 crore ason June 30, 2011. This reflected the increase in thevalue of gold as also appreciation of other currenciesagainst the US dollar.
XI.19 The balance in the Exchange EqualisationAccount (EEA) represents provision made for theexchange losses arising out of forward commitments.
The balance in the EEA as on June 30, 2011 was`1.12 crore.
XI.20 The Reserve Bank values foreign datedsecurities at market prices prevailing on the lastbusiness day of each month and the appreciation/depreciation arising therefrom is transferred tothe Investment Revaluation Account (IRA). Thebalance in IRA as on June 30, 2011 was `4,269.09crore. The balances in CGRA, EEA and IRA aregrouped under “Other Liabilities” in the balance sheet(Table XI.7).
Contingency Reserve
XI.21 The Reserve Bank maintains a ContingencyReserve (CR) to enable it to absorb unexpected andunforeseen contingencies. With transfer of`12,167.27 crore from the Reserve Bank’s income toCR during 2010-11, the balance in CR increased to`1,70,727.87 crore as on June 30, 2011 from`1,58,560.60 crore as on June 30, 2010. The balanceavailable in the CR is considered sufficient to meetcontingent liabilities.
Asset Development Reserve
XI.22 To meet the internal capital expenditure andmake investments in its subsidiaries and associateinstitutions, the Reserve Bank had created a separateAsset Development Reserve (ADR) in 1997-98 withthe aim of reaching one per cent of the ReserveBank’s total assets within the overall indicative targetof 12 per cent set for CR and ADR taken together. In2010-11, an amount of `1,234.63 crore wastransferred from income to ADR raising its level from
Table XI.7: Balances in Currency and GoldRevaluation Account (CGRA), Exchange
Equalisation Account (EEA) and InvestmentRevaluation Account (IRA)
(` crore)
As on June 30 CGRA EEA IRA
1 2 3 4
2007 21,723.52 9.68 –2008 1,63,211.83 0.00 –2009 1,98,842.03 26.98 –2010 1,19,133.98 18.87 9,370.962011 1,82,286.04 1.12 4,269.09

ANNUAL REPORT
156
`14,631.58 crore as on June 30, 2010 to `15,866.21crore as on June 30, 2011. CR and ADR togetherconstituted 10.34 per cent of the total assets of theReserve Bank as on June 30, 2011 (Table XI.8). ADRnow accounts for 0.88 per cent of the total assets ofthe Bank as against the target of one per cent.
Banking Department - Assets
XI.23 The assets of the Banking Departmentcomprise Notes, Rupee Coin, Small Coin, BillsPurchased and Discounted, Balances Held Abroad,Investments, Loans and Advances and Other Assets.They are presented in the balance sheet in thedescending order of liquidity.
Notes, Rupee Coin and Small Coin
XI.24 This is the stock of bank notes, one rupeenotes, rupee coins of `1, 2, 5 and 10 and small coinskept in the vaults of the Banking Department to meetthe day to day requirements arising out of usualreceipt and payment transactions as a banker.
Balances Held Abroad
XI.25 This represents foreign currency balancesheld abroad. This is part of Bank’s foreign currencyassets shown under assets of the BankingDepartment.
Foreign Currency Assets
XI.26 The foreign currency assets (FCA) compriseforeign securities and balances held abroad. TheRBI Act provides the legal framework for deploymentof the FCA as well as gold. FCA comprise deposits
with other central banks, the Bank for InternationalSettlements (BIS), foreign commercial banks,securities representing debt of sovereigns andsupra-national institutions with residual maturity notexceeding 10 years and any other instrument orinstitution as approved by the Central Board of theReserve Bank in accordance with the provisions ofthe Act. The increase in the level of FCA in Rupeeterms was mainly on account of appreciation of non-US dollar currency assets. The position ofoutstanding FCA and domestic assets over the lastfive years is given in Table XI.9.
XI.27 FCA form a major part of the foreign exchangereserves of the country. The comparative position ofthe foreign exchange reserves in the last two years isgiven in Table XI.10. It may be noted that althoughSDRs and the Reserve Tranche Position (RTP) formpart of India’s official reserves, these are held by theGovernment of India and therefore not reflected inthe Reserve Bank’s balance sheet.
XI.28 The Reserve Bank has agreed to makeresources available under the IMF’s NewArrangements to Borrow (NAB) up to an amount ofSDR 8,740.82 million (`62,559.91 crore). As on June30, 2011, investments amounting to SDR 750 million(`5,367.90 crore) have been made in notes issuedunder NAB.
XI.29 The Reserve Bank has agreed to invest up toan amount, the aggregate of which shall not exceedUS$ 5 billion (`22,360 crore), in the bonds issued bythe India Infrastructure Finance Company (UK)Limited. As on June 30, 2011, the Reserve Bank hadinvested US$ 250 million (`1,118 crore) in such bonds.
Table XI.8 : Balances in Contingency Reserveand Asset Development Reserve
(` crore)
As on Balance Balance Total PercentageJune 30 in CR in ADR to total
assets
1 2 3 4 (2+3) 5
2007 93,770.07 9,564.33 1,03,334.40 10.312008 1,27,200.81 12,772.25 1,39,973.06 9.572009 1,53,392.21 14,081.95 1,67,474.16 11.892010 1,58,560.60 14,631.58 1,73,192.18 11.152011 1,70,727.87 15,866.21 1,86,594.08 10.34
Table XI.9: Outstanding Foreign Currency andDomestic Assets
(` crore)
As on June 30 Foreign Domestic AssetsCurrency Assets
1 2 3
2007 8,39,878.79 1,62,058.592008 12,98,552.05 1,64,431.132009 12,17,541.80 1,90,652.642010 11,64,431.33 3,88,594.362011 12,68,743.82 5,35,907.16

THE RESERVE BANK’S ACCOUNTS FOR 2010-11
157
Investment in Government of India RupeeSecurities
XI.30 The investment in Government of Indiasecurities increased by `1,03,181.38 crore from`1,92,901.62 crore as on June 30, 2010 to`2,96,083.00 crore as on June 30, 2011, excludingthe securities purchased (Repo) under the LiquidityAdjustment Facility (LAF). The increase was primarilyon account of open market purchases by the ReserveBank and disinvestment of surplus cash balance bythe Government.
Investments in shares of subsidiaries andassociate institutions
XI.31 The Reserve Bank divested its stake inNABARD as per the decision of the Government ofIndia. Thus, out of 72.5 per cent of NABARD’s total
share capital of `2,000 crore earlier held by theReserve Bank, 71.5 per cent was transferred toGovernment of India at par on October 13, 2010. TheReserve Bank now holds one per cent of shareholdingin NABARD (Table XI.11). Investments in shares arevalued at cost.
Other Assets
XI.32 ‘Other Assets’ comprise income accrued butnot received, fixed assets (net of depreciation), goldholdings in the Banking Department, amounts spenton projects pending completion and staff advances,etc. The value of ‘Other Assets’ increased by`11,172.21 crore from `58,676.68 crore as on June30, 2010 to `69,848.89 crore as on June 30, 2011mainly on account of increase in the value of goldholdings by 19 per cent from `44,126.92 crore as onJune 30, 2010 to `52,510.70 crore as on June 30,2011.
Auditors
XI.33 The accounts of the Reserve Bank for the year2010-11 were audited by M/s. V. Sankar Aiyar & Co.,Mumbai and M/s. Jain Chowdhary & Co., Mumbai asthe Statutory Central Auditors. Branch offices wereaudited by the Statutory Branch Auditors, namely,M/s. S. Ramanand Aiyar & Co., New Delhi, M/s. K.K.Mankeshwar & Co., Nagpur, M/s. M.K. Dandeker &Co., Chennai and M/s. S. N. Guha & Co., Kolkata.The auditors were appointed by the CentralGovernment in terms of section 50 of the RBI Act.
Table XI.10 : Foreign Exchange Reserves(` crore)
Item As on Variation
June 30, 2010 June 30, 2011 Absolute Per cent
1 2 3 4 5
Foreign Currency Assets (FCA) 11,64,431.33 12,68,743.82 1,04,312.49 8.96
Gold 92,704.13 1,10,317.23 17,613.10 19.00
Special Drawing Rights (SDR) 22,718.63 20,631.97 (-) 2,086.66 (-) 9.18
Reserve Position in the IMF* 6,117.62 13,302.68 7,185.06 117.45
Total Foreign Exchange Reserves (FER) 12,85,971.71 14,12,995.70 1,27,023.99 9.88
*: Reserve Position in the International Monetary Fund (IMF), which was shown as a memo item from May 23, 2003 to March 26, 2004has been included in the reserves from the week ended April 2, 2004.
Table XI.11 : Investments in Shares ofSubsidiaries/Associate Institutions
(` crore)
Institution Book value of sharesheld as on
June 30, 2010 June 30, 2011
1 2 3
1. Deposit Insurance andCredit Guarantee Corporation 50.00 50.00
2. National Bank for Agricultureand Rural Development 1,450.00 20.00
3. National Housing Bank 450.00 450.00
4. Bharatiya Reserve BankNote Mudran (Pvt.) Ltd. 800.00 800.00
Total 2,750.00 1,320.00

ANNUAL REPORT
158
RESERVE BANK OF INDIABALANCE SHEET AS AT 30th JUNE 2011
ISSUE DEPARTMENT(` Thousands)
2009-10 LIABILITIES 2010-11 2009-10 ASSETS 2010-11
Notes held in the Gold Coin and Bullion:32,61,51 Banking Department 15,14,26 48577,21,52 (a) Held in India 57806,52,57
842008,36,40 Notes in Circulation 969261,23,85 – (b) Held outside India -792300,92,96 Foreign Securities 910165,61,91
842040,97,91 Total Notes Issued 969276,38,11 840878,14,48 Total 967972,14,48116,40,43 Rupee Coin 257,80,63
1046,43,00 Government of India Rupee Securities 1046,43,00Internal Bills of Exchange and other
– Commercial Paper –
842040,97,91 Total Liabilities 969276,38,11 842040,97,91 Total Assets 969276,38,11
BANKING DEPARTMENT
2009-10 LIABILITIES 2010-11 2009-10 ASSETS 2010-11
5,00,00 Capital paid-up 5,00,00 32,61,51 Notes 15,14,266500,00,00 Reserve Fund 6500,00,00 6,34 Rupee Coin 5,34
National Industrial Credit 3,08 Small Coin 2,2519,00,00 (Long Term Operations) Fund 20,00,00
National Housing Credit193,00,00 (Long Term Operations) Fund 194,00,00 Bills Purchased and Discounted :
– (a) Internal –– (b) External –– (c) Government Treasury Bills –
Deposits(a) Government 339226,34,23 Balances Held Abroad 303530,92,97
36457,41,08 (i) Central Government 100,51,3041,33,15 (ii) State Governments 42,44,43
(b) Banks 310068,81,35 Investments 458606,21,75307759,41,00 (i) Scheduled Commercial Banks 381206,41,38
4065,43,76 (ii) Scheduled State Co-operative Banks 3679,82,184986,76,82 (iii) Other Scheduled Co-operative Banks 5755,36,42
68,63,80 (iv) Non-Scheduled State Co-operative Banks 67,31,809224,79,62 (v) Other Banks 10357,81,03
12807,72,53 (c) Others 12430,75,91 Loans and Advances to :– (i) Central Government 770,00,00
73,38,00 (ii) State Governments 76,51,0079,45,62 Bills Payable 833,14,36 Loans and Advances to:
2623,17,00 (i) Scheduled Commercial Banks 1746,69,00– (ii) Scheduled State Co-operative Banks –
41,00,00 (iii) Other Scheduled Co-operative Banks –– (iv) Non-Scheduled State Co-operative Banks –– (v) NABARD –
275,22,98 (vi) Others 795,28,48328809,35,60 Other Liabilities 414197,15,13 Loans, Advances and Investments from
National Industrial Credit (Long TermOperations) Fund:(a) Loans and Advances to:
– (i) Industrial Development Bank of India –– (ii) Export Import Bank of India –– (iii) Industrial Investment Bank of India Ltd. –– (iv) Others –
(b) Investments in bonds/ debenturesissued by:
– (i) Industrial Development Bank of India –– (ii) Export Import Bank of India –– (iii) Industrial Investment Bank of India Ltd. –– (iv) Others –
Loans, Advances and Investments from NationalHousing Credit (Long Term Operations) Fund:
– (a) Loans and Advances to National Housing Bank –– (b) Investments in bonds/debentures issued by –
National Housing Bank58676,68,49 Other Assets 69848,88,89
711017,32,98 Total Liabilities 835389,73,94 711017,32,98 Total Assets 835389,73,94
Significant Accounting Policies and Notes to the Accounts as per the Annex.

THE RESERVE BANK’S ACCOUNTS FOR 2010-11
159
PROFIT AND LOSS ACCOUNT FOR THE YEAR ENDED 30th JUNE 2011(` thousands)
2009-10 INCOME 2010-11
27166,12, 24 Interest, Discount, Exchange, Commission, etc.1 23668,21,72
27166,12,24 Total 23668,21,72
EXPENDITURE
1,01,60 Interest 55,06,44
1986,82,29 Establishment 2300,70,71
2,08,15 Directors’ and Local Board Members’ Fees and Expenses 2,29,61
37,12,10 Remittance of Treasure 45,52,77
2855,02,06 Agency Charges 3012,48,83
2754,12,35 Security Printing (Cheque, Note forms, etc.) 2376,37,20
26,58,89 Printing and Stationery 23,32,59
42,48,93 Postage and Telecommunication Charges 71,84,43
85,15,56 Rent, Taxes, Insurance, Lighting, etc. 85,50,27
2,51,17 Auditors’ Fees and Expenses 3,13,86
2,75,54 Law Charges 3,26,84
274,21,93 Depreciation and Repairs to Bank’s Property 243,91,95
333,21,67 Miscellaneous Expenses 431,76,22
8403,12,24 Total 8655,21,72
18763,00,00 Available Balance 15013,00,00
Less: Contribution To:
National Industrial Credit (Long Term Operations) Fund 1,00,00
National Rural Credit (Long Term Operations) Fund 2 1,00,00
National Rural Credit (Stabilisation) Fund 2 1,00,00
National Housing Credit (Long Term Operations) Fund 1,00,00
4,00,00 4,00,00
18759,00,00 Surplus payable to the Central Government 15009,00,00
1. After making the usual or necessary provisions in terms of section 47 of the Reserve Bank of India Act, 1934 amounting to `13401,90,26 thousands (2009-10 - `5718,01,83 thousands).2. These funds are maintained by the National Bank for Agriculture and Rural Development (NABARD).
A.K. Bera H.R. Khan Anand Sinha Subir Gokarn K.C. Chakrabarty D. SubbaraoChief General Manager Deputy Governor Deputy Governor Deputy Governor Deputy Governor Governor
REPORT OF THE AUDITORS
TO THE PRESIDENT OF INDIA
We, the undersigned auditors of the Reserve Bank of India (hereinafter referred to as the Bank), do hereby report to the Central Government upon the Balance Sheet of the Bankas at June 30, 2011 and the Profit and Loss Account for the year ended on that date.
We have examined the Balance Sheet of the Bank as at June 30, 2011 and the Profit and Loss Account of the Bank for the year ended on that date and report that where we havecalled for information and explanations from the Bank, such information and explanations have been given to our satisfaction.
These financial statements include the accounts of nineteen Accounting Units of the Bank which have been audited by the Statutory Branch Auditors. The branch audit reportshave been furnished to us which we have considered in preparing our report.
These financial statements are the responsibility of the Bank's management. Our responsibility is to express an opinion on these financial statements based on our audit.
We conducted our audit in accordance with auditing standards generally accepted in India. Those standards require that we plan and perform the audit to obtain reasonableassurance about whether the financial statements are free of material misstatement. An audit includes examining, on a test basis, evidence supporting the amounts anddisclosures in the financial statements. An audit also includes assessing the accounting principles used and significant estimates made by management as well as evaluating theoverall financial statement presentation. We believe that our audit provides a reasonable basis for our opinion.
In our opinion and according to the best of our information and explanations given to us and as shown by the books of account of the Bank, the Balance Sheet read with SignificantAccounting Policies and Notes to the Accounts is a full and fair Balance Sheet containing all necessary particulars and is properly drawn up in accordance with the Reserve Bankof India Act, 1934 and Regulations framed thereunder so as to exhibit a true and correct view of the state of the Bank's affairs in conformity with the accounting principles generallyaccepted in India.
For V. Sankar Aiyar & Co. For Jain Chowdhary & Co.Chartered Accountants Chartered Accountants
Firm Registration No.109208W Firm Registration No.113267WS.Venkatraman S.C. Jain
Partner Partner(M. No. 34319) (M. No. 14871 )
Dated: August 11, 2011Place: Mumbai

ANNUAL REPORT
160
SIGNIFICANT ACCOUNTING POLICIES AND NOTESTO THE ACCOUNTS FOR THE YEAR 2010-11
SIGNIFICANT ACCOUNTING POLICIES
1. CONVENTION
The financial statements are prepared in accordancewith the Reserve Bank of India Act, 1934 and thenotifications issued thereunder and in the formprescribed by the Reserve Bank of India GeneralRegulations, 1949 and are based on historical costexcept where it is modified to reflect revaluation.
The accounting practices and policies followed in thefinancial statements are consistent with those followedin the previous year unless otherwise stated.
2. REVENUE RECOGNITION
Income and expenditure are recognised on accrualbasis except penal interest and dividend, which areaccounted for on receipt basis. Only realised gainsare recognised.
Balances unclaimed and outstanding for more thanthree consecutive years in certain transit accountsincluding Drafts Payable Account, Payment OrdersAccount, Sundry Deposits Account, RemittanceClearance Account and Earnest Money DepositAccount are reviewed and written back to income.Claims in this respect are considered and chargedagainst income in the year of payment.
Income and expenditure in foreign currency arerecorded at the exchange rates prevailing on the lastbusiness day of the preceding week/preceding month/year-end as applicable.
3. GOLD AND FOREIGN CURRENCY ASSETSAND LIABILITIES
(a) Gold
Gold is revalued at the end of the month at 90 percent of the daily average price quoted at London forthe month. The rupee equivalent is determined on
ANNEXRESERVE BANK OF INDIA
the basis of the exchange rate prevailing on the lastbusiness day of the month. Unrealised gains/lossesare adjusted to the Currency and Gold RevaluationAccount (CGRA).
(b) Foreign Currency Assets and Liabilities
All foreign currency assets and liabilities are translatedat the exchange rates prevailing on the last businessday of the week as well as on the last business dayof the month. At the year-end, assets and liabilities inforeign currencies are translated at the exchangerates prevailing on the last business day except incases where rates are contractually fixed. Exchangegains and losses arising from such translation offoreign currency assets and liabilities are accountedfor in CGRA and remain adjusted therein. Forwardexchange contracts are evaluated half-yearly and netloss, if any, is provided for.
Foreign securities other than Treasury Bills are valuedat market price prevailing on the last business day ofeach month. The appreciation or depreciation, if any,is transferred to the Investment Revaluation Account(IRA). Credit balance in IRA is carried forward to thesubsequent year. Debit balance, if any, at the end ofthe year in IRA is charged to the Profit and LossAccount and the same is reversed to the credit of theProfit and Loss Account on the opening day of thesucceeding financial year.
Foreign Treasury Bills and Commercial Papers arecarried at cost as adjusted by amortization of discount.Premium or discount on foreign securities is amortiseddaily.
Profit/loss on sale of foreign currency assets isrecognised with respect to the book value, except inthe case of foreign dated securities, where it isrecognised with reference to the amortised cost.Further, on sale/ redemption of foreign datedsecurities, gain/loss in relation to the securities sold,lying in IRA, is transferred to the Profit and LossAccount.

THE RESERVE BANK’S ACCOUNTS FOR 2010-11
161
8. CONTINGENCY RESERVE AND ASSETDEVELOPMENT RESERVE
Contingency Reserve (CR) represents the amountset aside on a year-to-year basis for meetingunexpected and unforeseen contingencies includingdepreciation in value of securities, exchangeguarantees and risks arising out of monetary /exchange rate policy compulsions.
In order to meet the internal capital expenditure andmake investments in subsidiaries and associateinstitutions, a further sum is provided and credited tothe Asset Development Reserve (ADR).
NOTES TO THE ACCOUNTS
1. SURPLUS TRANSFER TO GOVERNMENT OFINDIA
Surplus transferable to the Government includes`1,322.00 crore (previous year – `1,407.00 crore)representing interest differential pertaining to theperiod April 1, 2010-March 31, 2011 on account ofconversion of special securities issued by theGovernment of India into marketable securities.
2. EARMARKED SECURITIES
The Reserve Bank has earmarked certainGovernment securities having a book value of`10,066.55 crore (previous year ̀ 9,466.68 crore) fromits Investment Account in order to cover the liabilitiesin the Provident Fund, Gratuity and SuperannuationFund and Leave Encashment (Retiring Employees)Fund.
3. RESERVE FUND
Reserve Fund comprises initial contribution of `5.00crore made by the Government of India andappreciation of `6,495.00 crore on account ofrevaluation of Gold up to October 1990. Subsequentgains / losses on monthly revaluation of Gold aretaken to the Currency and Gold Revaluation Account(CGRA).
4. RUPEE SECURITIES
Rupee securities, other than Treasury Bills, held inthe Issue and Banking Departments, are valued atlower of book value or market price (LOBOM). Wherethe market price for such securities is not available,the rates are derived based on the yield curveprevailing on the last business day of the month. Thedepreciation in the value, if any, is adjusted againstcurrent interest income.
Treasury Bills are valued at cost.
5. SHARES
Investments in shares are valued at cost.
6. FIXED ASSETS
Fixed Assets are stated at cost less depreciation.
Depreciation on computers, microprocessors,software (costing `1 lakh and above), motor vehicles,furniture, etc. is provided on straight-line basis at thefollowing rates.
Asset Category Rate of depreciation
Motor vehicles, furniture, etc. 20 per cent
Computers, Microprocessors, Software, etc. 33.33 per cent
Depreciation on leasehold land and building is providedon written-down value basis at the following rates.
Asset Category Rate of depreciation
Leasehold Land and Building(s) Proportionate to leaseconstructed thereon period but not less
than 5 per cent
Building(s) constructed on Freehold Land 10 per cent
Fixed Assets costing less than `1 lakh (excepteasily portable electronic assets such as laptops,mobile phones, etc. costing more than `10,000) arecharged to the Profit and Loss Account in the year ofacquisition.
Depreciation is provided on year-end balances of theFixed Assets.
7. EMPLOYEE BENEFITS
The liability on account of long term employee benefitsis provided based on an actuarial valuation.

ANNUAL REPORT
162
4. DEPOSITS
(a) Government
There is no outstanding balance maintained by theCentral Government under the Market StabilisationScheme (MSS).
Deposits of State Governments include balance ofGovernment of the Union Territory of Puducherry.
(b) Others(` crore)
Particulars As on June 30
2010 2011
1 2 3
I. Rupee Deposits from the ForeignCentral Banks and the ForeignFinancial Institutions 3,246.36 725.23
II. Deposits from the IndianFinancial Institutions 516.33 198.94
III. Accumulated Retirement Benefits 8,817.13 9,401.14IV. Miscellaneous 227.91 2,105.45
Total 12,807.73 12,430.76
5. DETAILS OF OTHER LIABILITIES(` crore)
Particulars As on June 30
2010 2011
1 2 3
I. Contingency ReserveBalance at the beginning of the year 1,53,392.21 1,58,560.60Add: Accretion during the year 5,168.39 12,167.27Balance at the end of the year 1,58,560.60 1,70,727.87
II. Asset Development ReserveBalance at the beginning of the year 14,081.95 14,631.58Add: Accretion during the year 549.63 1,234.63Balance at the end of the year 14,631.58 15,866.21
III. Currency And Gold Revaluation AccountBalance at the beginning of the year 1,98,842.03 1,19,133.98Add: Net Accretion (+)/Net Depletion (-)
during the year (-) 79,708.05 63,152.06Balance at the end of the year 1,19,133.98 1,82,286.04
IV. Investment Revaluation AccountBalance at the beginning of the year – 9,370.96Add: Net Accretion (+)/Net Utilization (-)
during the year 9,370.96 (-)5,101.87Balance at the end of the year 9,370.96 4,269.09
V. Exchange Equalisation AccountBalance at the beginning of the year 26.98 18.87Transfer from Exchange account 18.87 1.12Add: Net Accretion (+)/Net Utilization (-)
during the year (-) 26.98 (-) 18.87Balance at the end of the year 18.87 1.12
VI. Settlement Liabilities - 16,688.64
VII. Provision for Outstanding Expenses 1,548.02 1,517.53
VIII. Surplus Transferable to theGovernment of India 18,759.00 15,009.00
IX. Miscellaneous 6,786.35 7,831.65Total (I to IX) 3,28,809.36 4,14,197.15
6. EMPLOYEE BENEFITS
In accordance with the Accounting Standard (AS) 15– Employee Benefits (Revised), the liability for longterm employee benefits has been ascertained underthe ‘Projected Unit Credit’ method and provided forin the accounts.
7. RBI GENERAL ACCOUNT
‘Other Assets’ include `17.19 crore (correspondingfigure in previous year was `18.37 crore) in respectof inter–office transactions and balances which areat various stages of reconciliation and necessaryadjustments are being effected as and whenreconciled.
8. RUPEE INVESTMENTS
Securities purchased (Repo) and sold (ReverseRepo) under the Liquidity Adjustment Facility (LAF)are added to and reduced from ‘Investments’respectively. As at the year-end, the outstandingRepos and Reverse Repos amounted to ̀ 1,04,690.00crore (previous year ̀ 78,630.00 crore) and ̀ 2,600.00crore (previous year `20.00 crore) respectively.
9. DETAILS OF FOREIGN CURRENCY ASSETS(` crore)
Particulars As on June 30
2010 2011
1 2 3
I. Held in Issue Department 7,92,300.93 9,10,165.62II. Held in Banking Department
(a) Included in Investments 32,904.06 55,047.27(b) Balances Held Abroad 3,39,226.34 3,03,530.93
Total 11,64,431.33 12,68,743.82
Note :1. Uncalled amount on partly paid shares of the Bank for International
Settlements (BIS) as on June 30, 2011 was ` 86.18 crore (SDR1,20,41,250). The amount was `82.98 crore (SDR 1,20,41,250) inthe previous year.
2. RBI has agreed to make resources available under the IMF’s NewArrangements to Borrow (NAB) {which subsumes the earliercommitment of US$ 10 billion (`46,600 crore) under the NotePurchase Agreement} up to a maximum amount of SDR 8,740.82million (`62,559.91 crore). As on June 30, 2011, investmentsamounting to SDR 750 million (`5,367.90 crore) have been madeunder the NAB.
3. RBI has agreed to invest up to an amount, the aggregate of whichshall not exceed US dollar 5 billion (`22,360 crore), in the bondsissued by India Infrastructure Finance Company (UK) Limited.Presently, RBI has invested US dollar 250 million (`1,118 crore) insuch bonds.

THE RESERVE BANK’S ACCOUNTS FOR 2010-11
163
10. DETAILS OF OTHER ASSETS(` crore)
Particulars As on June 30
2010 2011
1 2 3
I. Fixed Assets (net of accumulated depreciation) 516.08 488.28
II. Gold 44,126.92 52,510.70
III. Income accrued but not received 12,969.29 15,901.04
IV. Miscellaneous 1,064.39 948.87
Total 58,676.68 69,848.89
11. INTEREST, DISCOUNT, EXCHANGE, COMMISSION, etc.
Interest, Discount, Exchange, Commission, etc. include the following:(` crore)
Particulars Year ended
June 30, 2010 June 30, 2011
1 2 3
I. Profit on sale of Foreign and Rupee Securities 14,764.45 5,537.29
II. Net profit on sale of Bank’s Property 1.87 2.93
12. AUDITORS’ FEES
Out of total Auditors’ Fees and Expenses of `3.14 crore, a sum of `24.00 lakh was paid to the Bank’sStatutory Auditors as audit fees for audit of the Bank’s accounts.
13. Previous year’s figures have been regrouped / reclassified, wherever necessary, to conform to currentyear’s presentation.

164
ANNEX I LIST OF SPEECHES BY GOVERNOR AND DEPUTYGOVERNORS: APRIL 2010 TO AUGUST 2011
Sr.Title of Speech Speech by Date
No.
1 2 3 4
1. Looking Back and Looking Ahead Dr. Duvvuri Subbarao, Governor April 1, 2010
2. Silver Jubilee Function of Institute of Banking Personnel Selection Dr. K. C. Chakrabarty, Deputy Governor April 2, 2010
3. The Economics of Ecosystems and Biodiversity Workshop Smt. Usha Thorat, Deputy Governor April 13, 2010
4. Statement at the IMFC Dr. Duvvuri Subbarao, Governor April 24, 2010
5. India and the Global Financial Crisis: Dr. Duvvuri Subbarao, Governor April 26, 2010Transcending from Recovery to Growth
6. New Paradigms in IT Security in Indian Banks Dr. K. C. Chakrabarty, Deputy Governor April 26, 2010
7. Keynote Address at Review Meet on Implementation of Dr. K. C. Chakrabarty, Deputy Governor April 29, 2010Revival Package for Short-term Rural Co-operative Credit Structure
8. Volatility in Capital Flows: Some Perspectives Dr. Duvvuri Subbarao, Governor May 11, 2010
9. Bank Credit to MSMEs: Present Status and Way Forward Dr. K. C. Chakrabarty, Deputy Governor May 21, 2010
10. RBI Archives – Way Forward Dr. Duvvuri Subbarao, Governor June 1, 2010
11. Financial Regulation and Financial Inclusion – Smt. Usha Thorat, Deputy Governor June 2, 2010Working Together at Cross-purposes
12. Financial Deepening by Putting Financial Inclusion Campaign into Dr. K. C. Chakrabarty, Deputy Governor June 17, 2010Mission Mode
13. Harnessing Technology to Bank the Unbanked Dr. Duvvuri Subbarao, Governor June 18, 2010
14. Banking Technology Beyond CBS: Issues and Way Forward Dr. K. C. Chakrabarty, Deputy Governor July 2, 2010
15. Over-the-counter Derivative Markets in India – Smt. Shyamala Gopinath, Deputy Governor July 28, 2010Issues and Perspectives
16. Macroprudential Approach to Regulation – Scope and Issues Smt. Shyamala Gopinath, Deputy Governor August 4, 2010
17. Financial Crisis – Some Old Questions and Maybe Some New Answers Dr. Duvvuri Subbarao, Governor August 5, 2010
18. Securitisation Markets in India – A Post-Crisis Perspective Smt. Shyamala Gopinath, Deputy Governor August 10, 2010
19. Economic Crisis and Crisis in Economics – Some Reflections Dr. Duvvuri Subbarao, Governor August 27, 2010
20. Technology in Banking: An Instrument for Economic Growth Dr. K. C. Chakrabarty, Deputy Governor September 3, 2010
21. Post-crisis Reforms to Banking Regulation and Supervision – Dr. Duvvuri Subbarao, Governor September 7, 2010Think Global, Act Local
22. Setting New Paradigm in Regulation Smt. Usha Thorat, Deputy Governor September 8, 2010
23. Banking Transactions in the Next Decade: Faster, Cheaper and Easier Dr. K. C. Chakrabarty, Deputy Governor September 8, 2010
24. Preparing Indian Banks for Global Competitiveness: Dr. Subir Gokarn, Deputy Governor September 9, 2010Strategic and Policy Perspectives
25. Perspectives on Financial Sector Strategy Dr. Subir Gokarn, Deputy Governor September 20, 2010
26. Managing the Growth-Inflation Balance in India: Dr. Subir Gokarn, Deputy Governor October 5, 2010Current Considerations and Long-term Perspectives
27. Emerging Market Economies Leading Global Growth Dr. Duvvuri Subbarao, Governor October 9, 2010
28. The Price of Protein Dr. Subir Gokarn, Deputy Governor October 26, 2010
29. Frontier Issues on the Global Agenda: Need for Global Co-operation Dr. Duvvuri Subbarao, Governor October 27, 2010
30. G-20 After the Crisis: An Indian Perspective Dr. Subir Gokarn, Deputy Governor October 27, 2010
31. Developing the Humanware to Improve Customer Service Dr. K. C. Chakrabarty, Deputy Governor November 12, 2010
32. Readers’ Interview Dr. Duvvuri Subbarao, Governor November 18, 2010
33. Inaugural Remarks at the Opening of Inter-bank Smt. Shyamala Gopinath, Deputy Governor November 22, 2010Mobile Payment Service
34. Inclusive Growth: Role of Financial Sector Dr. K. C. Chakrabarty, Deputy Governor November 27, 2010
35. Monetary Policy Considerations after the Crisis: Dr. Subir Gokarn, Deputy Governor December 1, 2010Practitioners’ Perspectives

165
36. Five Frontier Issues in Indian Banking Dr. Duvvuri Subbarao, Governor December 3, 2010
37. Mint Road Milestones Dr. Duvvuri Subbarao, Governor December 8, 2010
38. Prospects for Economic Growth and the Policy Imperatives for India Dr. K. C. Chakrabarty, Deputy Governor December 10, 2010
39. Dilemmas in Central Bank Communication: Some Reflections Based Dr. Duvvuri Subbarao, Governor January 7, 2011on Recent Experience
40. Centrality of Banks in the Financial System Smt. Shyamala Gopinath, Deputy Governor January 8, 2011
41. Emerging Trends in Payment Systems and Challenges Dr. K. C. Chakrabarty, Deputy Governor January 19, 2011
42. Implications of the Expansion of Central Bank Balance Sheets Dr. Duvvuri Subbarao, Governor January 31, 2011
43. Welcome Remarks: Third P. R. Brahmananda Memorial Lecture Dr. Duvvuri Subbarao, Governor February 11, 2011
44. Introduction of IFRS – Issues and Challenges Dr. K. C. Chakrabarty, Deputy Governor February 11, 2011
45. Beyond CBS: Fast Forward to Banking 2.0! Dr. K. C. Chakrabarty, Deputy Governor February 18, 2011
46. Approach to Capital Account Management – Shifting Contours Smt. Shyamala Gopinath, Deputy Governor February 18, 2011
47. The Reserve Bank of India Making a Difference in Your Daily Life Dr. Duvvuri Subbarao, Governor February 24, 2011
48. Banking and Beyond: New Challenges before Indian Financial System Dr. K. C. Chakrabarty, Deputy Governor March 15, 2011
49. Financial Inclusion: A Consumer-centric View Dr. Subir Gokarn, Deputy Governor March 21, 2011
50. Frontier Issues on the Global Agenda: Emerging Economy Perspective Dr. Duvvuri Subbarao, Governor March 29, 2011
51. Linking Entrepreneurship with Credit - The Role of Financial System Dr. K. C. Chakrabarty, Deputy Governor April 4, 2011
52. Sustainability of Economic Growth and Controlling Inflation: Dr. Subir Gokarn, Deputy Governor April 5, 2011The Way Forward
53. The Global Economy and Framework Dr. Duvvuri Subbarao, Governor April 15, 2011
54. Statement at IMFC Dr. Duvvuri Subbarao, Governor April 16, 2011
55. Global Challenges, Global Solutions: Some Remarks Dr. Duvvuri Subbarao, Governor April 16, 2011
56. Regulatory Perspectives on Derivatives Markets in India Dr. Subir Gokarn, Deputy Governor May 4, 2011
57. Central Bank Governance Issues! Some RBI Perspectives Dr. Duvvuri Subbarao, Governor May 9, 2011
58. Policy Discipline and Spillovers in an Inter-connected Global Economy Dr. Duvvuri Subbarao, Governor May 10, 2011
59. Banking on Technology Shri Anand Sinha, Deputy Governor May 13, 2011
60. Talent Acquisition and Management Dr. K. C. Chakrabarty, Deputy Governor May 31, 2011
61. Macroprudential Policies: Indian Experience Shri Anand Sinha, Deputy Governor June 2, 2011
62. Non-financial Reporting - What, Why and How - Indian Perspective Dr. K. C. Chakrabarty, Deputy Governor June 6, 2011
63. Financial Stability Mandate of Central Banks: Issues in Dr. Duvvuri Subbarao, Governor June 10, 2011the International and Indian Context
64. Challenges and Opportunities in a Trillion Dollar Economy Dr. K. C. Chakrabarty, Deputy Governor June 17, 2011
65. Mutual Funds and Market Development in India Dr. Subir Gokarn, Deputy Governor June 22, 2011
66. India and the Global Financial Crisis: What Have We Learnt? Dr. Duvvuri Subbarao, Governor June 23, 2011
67. Economic Reforms for Sustainable Growth Dr. Subir Gokarn, Deputy Governor June 23, 2011
68. Challenges for Next Generation Banking Dr. K. C. Chakrabarty, Deputy Governor June 25, 2011
69. Striking the Balance between Growth and Inflation in India Dr. Subir Gokarn, Deputy Governor June 27, 2011
70. Connecting the Dots Dr. K. C. Chakrabarty, Deputy Governor June 28, 2011
71. Statistics in the World of RBI Dr. Duvvuri Subbarao, Governor July 5, 2011
72. Technology in Banking – In pursuit of Excellence Shri Anand Sinha, Deputy Governor August 4, 2011
73. Indian Education System – Issues and Challenges Dr. K. C. Chakrabarty, Deputy Governor August 5, 2011
LIST OF SPEECHES BY GOVERNOR AND DEPUTYGOVERNORS: APRIL 2010 TO AUGUST 2011
Sr.Title of Speech Speech by Date
No.
1 2 3 4

ANNEX IIVISITS OF FOREIGN DELEGATIONS TO THE
RESERVE BANK OF INDIA DURINGJULY 01, 2010 TO JUNE 30, 2011
166
1. July 09, 2010 Senator Christopher J. Dodd, U.S. Dr. D. Subbarao, Governor, Smt. Shyamala Gopinath,Senator, Chairman of the Banking, Deputy Governor, Anand Sinha, Executive Director.Housing and Urban Affairs Committee.
2. July 18, 2010 The Rt. Hon. George Osborne, UK Dr. D. Subbarao, Governor, Smt. Shyamala Gopinath,Chancellor of the Exchequer. Smt. Usha Thorat, Dr. K. C. Chakrabarty and
Dr. Subir Gokarn, Deputy Governors,S/Shri V. K. Sharma, C. Krishnan, Anand Sinha,V. S. Das, G. Gopalakrishna, H. R. Khan andDeepak Mohanty, Executive Directors, andSmt. Grace Koshie, Chief General Manager & Secretary.
3. August 10, 2010 Lord Megnad Desai and Mr. David Wayne Marsh, Dr. D. Subbarao, Governor, Dr. Subir Gokarn, DeputySCCO International, London, UK. Governor, S/Shri H. R. Khan and Deepak Mohanty,
Executive Directors
4. August 25, 2010 Ms. Subrino Chow, Director, Hong Kong Economic & Smt. Grace Koshie, Chief General Manager & Secretary.Trade Office in Singapore, Government of theHong Kong Special Administrative Region.
5. September 06, 2010 Mr. Song Xuejun, Commercial Consul, Chinese Smt. Usha Thorat, Deputy Governor.Consulate and Head of the Economic andCommercial Section and Mr. Sun Xiang, Head of theIndustrial and Commercial Bank of China preparatoryworking team.
6. September 07, 2010 Lord James Sassoon, Commercial Secretary to the Smt. Usha Thorat, Deputy Governor.Treasury, UK.
7. September 09, 2010 Mr. Robert D. Hormats, Under Secretary, Economic, Dr. Subir Gokarn, Deputy Governor, Shri DeepakEnergy and Agricultural Affairs, USA. Mohanty, Executive Director.
8. October 20, 2010 Delegation from the State of Guernsey led by Shri Deepak Mohanty, Executive Director.Ms Carla McNutty Bauer, Minister, Commerce &Employment, Guernsey Government.
9. October 27, 2010 Mr. Rundeersing Bheenick, Governor of Dr. D. Subbarao, Governor.Bank of Mauritius.
10. October 28, 2010 Canadian delegation led by Mr. Michael R. P. Rayfield, Dr. Subir Gokarn, Deputy Governor, S/Shri Anand Sinha,Vice Chair, Investment and Corporate Banking, H. R. Khan and Deepak Mohanty, Executive Directors.BMO Capital Markets.
11. October 28, 2010 High level delegation of the European Parliament led by Dr. Subir Gokarn, Deputy Governor, Shri Anand Sinha,Mr. Jose Manuel Garcia-Margallo Y Marfil, Member of Executive Director.the European Parliament (EPP), Vice President of theCommittee on Economic and Monetary AffairsCommittee.
12. October 29, 2010 The Lord Mayor of the City of London, Alderman Nick Smt. Shyamala Gopinath and Smt. Usha Thorat, DeputyAnstee and his delegation, UK. Governors, S/Shri Anand Sinha, H. R. Khan and Deepak
Mohanty, Executive Directors.
13. November 03, 2010 Mr. C. Lawrence Greenwood, Vice President, Dr. Subir Gokarn, Smt. Shyamala Gopinath, DeputyAsian Development Bank. Governors, S/Shri V. K. Sharma, H. R. Khan,
Deepak Mohanty, Executive Directors.
14. November 11, 2010 Consortium of Cooperative Banks from the Trentino Shri V. K. Sharma, Executive Director.region in Italy called ASDIR.
15. November 22, 2010 Mr. Edgardo Torija-Zane, Economist responsible for the Shri Deepak Mohanty, Executive Director.emerging Asia macroeconomic scenario at theEconomic Research Department of Natixis.
Sr. Date of Meeting Foreign Delegates/Delegation RBI ExecutivesNo.1 2 3 4

167
16. November 29, 2010 Young Parliamentary Delegation from Australia. Smt. Shyamala Gopinath, Deputy Governor, S/ShriAnand Sinha and Deepak Mohanty, Executive Directors.
17. November 30, 2010 Mr. John Clark, Sr. Vice President, Federal Reserve Shri Deepak Mohanty, Executive Director.Bank of New York’s Emerging Group.
18. December 14, 2010 Mr. Anil Kakani, Sr. Adviser for India, US Treasury Dr. Subir Gokarn, Deputy Governor.Department.
19. January 18, 2011 BBVA delegation headed by Mr. Francisco Gonzalez, Smt. Shyamala Gopinath, Deputy Governor, S/ ShriChairman and CEO of BBVA, Spain. Anand Sinha and Deepak Mohanty, Executive Directors.
20. February 11, 2011 U.S. Secretary of Commerce Gary Locke and his Dr. D. Subbarao, Governor, Dr. K. C. Chakrabarty,delegation. Dr. Subir Gokarn and Shri Anand Sinha, Deputy
Governors, S/Shri H. R. Khan and Deepak Mohanty,Executive Directors.
21. February 11, 2011 Prof. Stanley Fischer, Governor, Bank of Israel. Dr. D. Subbarao, Governor, Dr. K. C. Chakrabarty,Dr. Subir Gokarn and Shri Anand Sinha,Deputy Governors.
22. February 22, 2011 Mr. Seiji Nakamura, Member of Policy Board, Dr. D. Subbarao, Governor, Shri Anand Sinha, DeputyBank of Japan. Governor and Shri Deepak Mohanty, Executive Director.
23. February 25, 2011 11 Congressional Staffers from U.S. Smt. Shyamala Gopinath, Deputy Governor, S/Shri H. R.Khan and Deepak Mohanty, Executive Directors.
24. February 28, 2011 Mr. Jiang Jianquing, Chairman of Board of ICBC, Dr. D. Subbarao, Governor and Shri Anand Sinha,China and his delegation. Deputy Governor.
25. March 03, 2011 Ms. Lael Brainard, Under Secretary for International Dr. D. Subbarao, Governor, Dr. Subir Gokarn, DeputyAffairs, USA. Governor, Shri Deepak Mohanty, Executive Director and
Shri Chandan Sinha, Regional Director, RBI, New Delhi.
26. March 16, 2011 Lord Stephen Green, Minister of State for Trade and Dr. D. Subbarao, Governor and Shri Anand Sinha,Investment, UK. Deputy Governor.
27. March 18, 2011 Macroeconomic analysis team of Agence Francaise Shri K. U. B. Rao, Officer-in-Charge and other seniorDevelopment (AFD), France. officers from Department of Economic and
Policy Research.
28. March 29, 2011 Mr. Russel Green, Treasury Attaché, U. S. Treasury Mr. H. R. Khan, Executive Director.and Consulate.
29. March 31, 2011 H.E. Dr. Yuval Steinitz, Minister of Finance, Israel. Dr. D. Subbarao, Governor.
30. April 26, 2011 Mr. Akitaka Saiki, Ambassador of Japan to India. Dr. D. Subbarao, Governor.
31. April 26, 2011 Mr. Florent Dauba, Economic Attaché, Consulate Shri H. R. Khan, Executive Director.General of France and Economic Service of Bombay.
32. May 09, 2011 Canadian delegation of eight Assistant Deputy Shri Anand Sinha, Deputy Governor,S/Shri G.Ministers under Canada’s Advanced Leadership Gopalakrishna, H. R. Khan and Deepak Mohanty,Program (ALP). Executive Directors.
33. May 16, 2011 Dr. Ngozi Okonjo-Iweale, Managing Director of Dr. D. Subbarao, Governor, Dr. K. C. Chakrabarty,World Bank. Dr. Subir Gokarn, Shri Anand Sinha, Deputy Governors
and Shri V. K. Sharma, Executive Director.
34. June 14, 2011 H.E. Mr. Pierre Vaesen, Ambassador of Belgium to India.Dr. D. Subbarao, Governor.
35. June 14, 2011 Mr. Spencer Dale, Chief Economist at Bank of England. Dr. Subir Gokarn, Deputy Governor.
36. June 16, 2011 Sir Richard Stagg, High Commissioner, UK. Dr. D. Subbarao, Governor.
37. June 17, 2011 Mr. Freddy Svane, Danish Ambassador Dr. D. Subbarao, Governor.
38. June 27, 2011 Mr. Michael C. Camunez, U. S. Assistant Secretary of Shri B. Mahapatra, Executive Director.Commerce for Market Access and Compliance (MAC).
S r. Date Foreign Delegates/Delegation RBI ExecutivesNo.1 2 3 4
VISITS OF FOREIGN DELEGATIONS TO THE RESERVEBANK OF INDIA DURING JULY 01, 2010 TO JUNE 30, 2011

168
ANNUAL REPORT
Item Average Average Average1990-91 2000-01 2003-04
to to to 2008-09 2009-10 2010-111999-2000 2009-10 2007-08( 10 years) ( 10 years) ( 5 years)
1 2 3 4 5 6 7
I. Real EconomyI.1 Overall Real GDP (% change) 5.7 7.3 8.9 6.8 8.0 QE 8.5 RE
a) Agriculture (% change) 3.2 2.4 5.0 -0.1 0.4 6.6b) Industry (% change) 5.7 7.3 9.0 4.0 8.3 7.8
of which :Manufacturing (% change) 5.6 8.0 10.0 4.2 8.8 8.3
c) Services (% change) 7.1 9.0 10.1 9.5 9.7 9.2Demand Side Aggregatesd) Final Consumption Expenditure (% change) 5.0 6.3 7.2 8.2 8.7 8.0
of which :PFCE (% change) 4.8 6.4 7.4 7.7 7.3 8.6GFCE (% change) 6.3 5.8 5.6 10.7 16.4 4.8
e) Gross Fixed Capital Formation (% change) 7.2 10.2 15.7 1.5 7.3 8.6I.2 Share in GDP
a) Agriculture (%) 28.4 19.4 18.9 15.7 14.6 14.4b) Industry (%) 20.1 20.0 20.1 20.1 20.2 20.0c) Services (%) 51.5 60.6 61.1 64.2 65.2 65.6
I.3 Foodgrains Production (Million tonnes) 188.6 210.5 213.6 234.5 218.1 241.6of which :Rice 80.1 89.2 90.7 99.2 89.1 95.3Wheat 63.9 73.4 72.9 80.7 80.8 85.9Pulses 13.5 13.5 14.1 14.6 14.7 18.1
I.4 Commercial Crops (Million tonnes) $ 308.0 341.9 347.9 345.4 353.3 414.3of which :Oilseeds 21.3 23.8 26.3 27.7 24.9 31.1Sugarcane 265.5 289.9 291.2 285.0 292.3 339.2
I.5 Food Stocks (Million tonnes)a) Procurement 23.3 42.0 38.4 55.3 58.0 56.8b) Off-take 20.6 39.5 41.5 39.5 48.9 52.9c) Stocks at end-March 19.3 30.1 18.6 35.6 43.4 44.4
I.6 Index of Industrial Production (% change) 6.3 7.4 12.4 2.5 5.3 8.2Sectorala) Mining 3.4 4.3 4.0 2.6 7.9 5.2b) Manufacturing 6.5 8.0 14.5 2.5 4.8 9.0c) Electricity 7.0 4.8 6.3 2.7 6.1 5.5Use-Basedd) Basic Goods 6.3 5.6 8.0 1.7 4.7 6.0e) Capital Goods 5.5 13.3 30.0 11.3 1.0 14.8f) Intermediate Goods 7.5 6.2 8.5 0.0 6.0 7.4g) Consumer Goods 5.9 8.2 14.8 0.9 7.7 8.6
I.7 Core Infrastructure Industries (% change) 6.3 5.5 5.8 2.8 6.6 5.8I.8 Gross Domestic Saving Rate (% of GDP) 23.0 30.7 33.3 32.2 33.7 QE _
of which :Household 17.7 23.1 23.5 23.8 23.5 –Private Corporate 3.8 6.3 7.4 7.9 8.1 –Public 1.5 1.3 2.4 0.5 2.1 –
I.9 Gross Domestic Investment Rate (% of GDP) 24.4 31.2 34.3 34.5 36.5 QE –
II. PricesII.1 Wholesale Price Index Annual Average (% change)
All Commodities 8.1 5.4 5.5 8.1 3.8 9.6All Commodities-Point to Point – – – 1.6 10.4 9.7Primary Articles 9.4 6.4 6.0 11.0 12.7 17.7
of which :Food Articles 10.2 5.8 5.2 9.1 15.3 15.6Non-food Articles 8.3 6.1 5.5 12.9 5.5 22.3
Fuel and Power 10.6 8.9 7.3 11.6 -2.1 12.3Manufactured Products 7.1 4.1 5.0 6.2 2.2 5.7
of which :Food Products 8.6 4.7 4.8 8.7 13.5 3.7Non-Food Products 6.8 4.0 5.0 5.7 0.2 6.1
APPENDIX TABLE 1: MACROECONOMIC AND FINANCIAL INDICATORS

169
APPENDIX TABLES
II.2 Consumer Price Index (CPI)(Average % Change)a) CPI- Industrial Workers 9.5 5.9 5.0 9.1 12.4 10.4
of which :CPI- Industrial Workers Food 9.8 6.2 5.5 12.3 15.2 9.9
b) CPI- Agricultural Labourers 9.3 5.4 5.1 10.2 13.9 10.0
III. Money and CreditIII.1 Reserve Money (M0) (% change) 13.9 15.4 20.4 6.4 17.0 19.1
Adjusted Reserve Money (% change) – – – 19.0 12.9 18.2a) Currency in Circulation (% change) 15.2 15.1 15.9 17.0 15.7 18.8b) Bankers’ Deposits with RBI (% change) 11.5 17.9 33.1 -11.3 21.0 20.2
III.2 Narrow Money (M1) ( % change) 15.6 16.0 19.6 9.0 18.2 9.8
III.3 Broad Money (M3) ( % change) 17.2 17.5 18.6 19.3 16.8 16.0a) Currency with Public (% change) 15.2 15.1 15.9 17.1 15.3 19.1b) Bank Credit to Commercial Sector (% of GDP) 28.7 42.9 44.5 54.0 53.3 53.8c) Bank Credit to Government (% of GDP) 22.7 23.1 21.5 22.9 25.5 25.2d) Currency-Deposit Ratio (%) 23.1 18.3 18.3 16.1 15.9 16.4e) Money Multiplier 3.4 4.5 4.7 4.9 4.8 4.7
III.4 Scheduled Commercial Banksa) Aggregate Deposits (% change) 17.2 18.1 19.0 19.9 17.2 15.9b) Time Deposits (% change) 17.4 18.5 18.5 23.9 16.2 18.7c) Demand Deposits (% change) 16.5 16.4 21.9 -0.2 23.4 -0.6d) Bank Credit (% change) 15.9 21.8 25.5 17.5 16.9 21.5e) Non-food Credit (% change) 15.4 22.4 26.7 17.8 17.1 21.3f) Investment in Government Securities (% change) 20.9 17.7 13.3 20.6 19.3 8.6g) Credit-Deposit Ratio (%) 55.1 64.8 68.0 72.4 72.2 75.7h) Credit-GDP Ratio (%) 20.6 37.7 39.5 49.7 49.5 50.0
IV. Financial MarketsIV.1 Interest rates (%)
a) Call / Notice Money rate 11.7 6.1 5.6 7.1 3.2 5.8b) 10 year G-Sec yield 12.3 7.5 7.0 7.5 7.2 7.9c) 91-Days T-bill yield 9.4 6.1 5.8 7.1 3.6 –d) Weighted Average interest rate on
Central Government Borrowings 12.3 7.8 7.2 7.7 7.2 –e) Commercial Paper 12.5 8.2 7.7 10.8 6.3 8.7
IV.2 Liquidity ( `crore)a) LAF Outstanding – – – 1,485 990 -1,06,005b) MSS Outstanding – – – 88,077 2,737 –c) Average Daily Call Money Market Turnover – – 18,492 22,436 15,924 17,727d) Average Daily G-Sec Market Turnover – – 7,709 10,879 14,426 14,256
V. Government FinancesV.1 Central Government Finances (% of GDP) #
a) Total Revenue Receipts 9.2 9.5 9.9 9.7 8.7 10.0i) Tax Revenue 6.8 7.2 7.6 7.9 7.0 7.2ii) Non Tax Revenue 2.5 2.3 2.3 1.7 1.8 2.8
b) Total Expenditure 16.0 15.4 14.8 15.8 15.6 15.4i) Revenue Expenditure 12.3 12.9 12.2 14.2 13.9 13.4
of which :Interest Payment 4.2 4.0 3.8 3.4 3.3 3.1
ii) Capital Expenditure 3.7 2.5 2.6 1.6 1.7 2.1c) Revenue Deficit 3.0 3.4 2.3 4.5 5.2 3.4d) Fiscal Deficit 5.9 4.8 3.6 6.0 6.4 5.1e) Primary Deficit 1.6 0.8 -0.2 2.6 3.1 2.0f) Domestic Debt 48.0 56.7 58.2 54.4 51.7 47.9
V.2 State Finances #a) Revenue Deficit (% of GDP)* 1.2 1.0 0.5 -0.2 0.5 0.3b) Gross Fiscal Deficit (% of GDP)* 3.1 3.1 2.7 2.4 2.9 2.6c) Primary Deficit (% of GDP)* 1.2 0.8 0.3 0.6 1.2 1.0d) Outstanding Liabilities (% of GDP)* 22.3 29.3 30.1 26.3 25.0 23.0
APPENDIX TABLE 1: MACROECONOMIC AND FINANCIAL INDICATORS (Contd.)
Item Average Average Average1990-91 2000-01 2003-04
to to to 2008-09 2009-10 2010-111999-2000 2009-10 2007-08( 10 years) ( 10 years) ( 5 years)
1 2 3 4 5 6 7

170
ANNUAL REPORT
APPENDIX TABLE 1: MACROECONOMIC AND FINANCIAL INDICATORS (Concld.)
Item Average Average Average1990-91 2000-01 2003-04
to to to 2008-09 2009-10 2010-111999-2000 2009-10 2007-08( 10 years) ( 10 years) ( 5 years)
1 2 3 4 5 6 7
VI. External SectorVI.1 Balance of Payments
a) Merchandise Exports (% change) ∆ 8.6 17.7 25.3 13.7 -3.6 37.4Oil Exports (% change) ∆ -13.5 505.3 × 62.6 -2.9 2.3 48.7Non Oil Exports (% change) ∆ 8.9 18.5 × 31.0 17.2 -4.6 35.4
b) Merchandise Imports (% change) ∆ 9.6 19.5 32.3 19.8 -2.6 26.7Oil Imports (% change) ∆ 17.7 22.9 35.7 17.6 -7.0 21.7Non Oil Imports (% change) ∆ 8.8 18.5 31.0 20.7 -0.6 28.8
c) Trade Balance/GDP (%) -2.8 -5.3 -5.4 -9.8 -8.6 -7.5d) Invisible Balance/GDP (%) 1.6 4.8 5.1 7.5 5.8 5.0e) Current Account Balance/GDP (%) -1.3 -0.5 -0.3 -2.3 -2.8 -2.6f) Net Capital Flows /GDP(%) 2.2 3.4 4.6 0.6 3.9 3.5g) Current Account Balance (US$ billion) -4.4 -8.3 -4.7 -27.9 -38.4 -44.3
Net Invisibles 6.0 44.2 45.8 91.6 80.0 86.2of which : Services 1.3 21.5 23.4 53.9 35.7 47.7Private Transfers 7.8 27.9 27.6 44.6 52.1 53.4Investment Income -3.5 -5.0 -4.9 -6.6 -7.2 -13.9
h) Net Capital Flows (US$ billion) 7.7 31.0 44.4 6.8 53.4 59.7of which : FDI to India 1.6 16.3 15.3 37.7 33.1 23.4FIIs 1.3 7.1 10.6 -15.0 29.0 29.4NRI Deposits 1.3 2.5 2.0 4.3 2.9 3.2
i) Reserve Changes (BoP basis) (US $ billion)[(Increase (-)/Decrease (+)] -3.3 -22.9 -40.3 20.1 -13.4 -13.1
VI.2 External Debt Indicatorsa) External Debt Stock (US$ billion)** 93.0 157.0 156.0 224.5 261.0 305.9b) Debt-GDP Ratio (%) 29.0 19.0 17.7 20.5 18.0 17.3c) Import cover of Reserves (in Months) ** 6.5 12.5 14.0 9.8 11.1 9.6d) Short-term Debt to Total Debt (%) 6.0 11.8 13.6 19.3 20.0 21.2e) Debt Service Ratio (%) 24.9 8.8 8.3 4.4 5.5 4.2f) Reserves to Debt (%) ** 23.0 96.0 114.2 112.2 106.9 99.6
VI.3 Openness Indicators (%)a) Export plus Imports of Goods/GDP 18.8 29.5 30.4 41.0 35.0 36.5b) Export plus Imports of Goods & Services/GDP 22.9 39.2 40.8 54.0 46.3 49.0c) Current Receipts plus Current 26.8 45.1 46.6 61.1 52.8 54.4
Payments/GDPd) Gross Capital Inflows plus Outflows/GDP 15.1 33.6 36.8 51.1 46.2 53.9e) Current Receipts & Payments plus Capital
Receipts & Payments /GDP 41.9 78.7 83.5 112.2 99.1 108.3VI.4 Exchange Rate Indicators
a) Exchange Rate (Rupee/US Dollar)End of Period 34.1 45.4 43.1 50.9 45.1 44.6Average 32.7 45.6 44.1 45.9 47.4 45.6
b) 36 - Currency REER (Percentage Change) -0.04 @@ 0.4 1.0 -9.9 -3.1 7.7c) 36 - Currency NEER (Percentage Change) -1.3 @@ -0.3 0.5 -10.9 -2.6 2.9d) 6 - Currency REER (Percentage Change) 0.4 @@ 1.5 2.5 -9.3 -0.3 13.1e) 6 - Currency NEER (Percentage Change) -4.0 @@ -1.4 0.4 -13.6 -3.7 5.7
QE : Quick Estimates.RE : Revised Estimates.$ : Includes oilseeds, sugarcane, cotton (lint) and raw jute and mesta.- : Not Available/Not applicable.# : Data for 2010-11 relates to Revised estimates.* : Data for 2009-10 and 2010-11 pertains to 28 States of which five are Vote on Account.∆ : Based on DGCI&S data.× : Figure pertains to average during 2000-01 to 2008-09.** : At end-March.@@ : Average of 1994-95 to 1999-2000.
Notes: 1. PFCE: Private Final Consumption Expenditure; GFCE: Government Final Consumption Expenditure; REER: Real Effective Exchange Rate.2. Agricultural production figures for 2010-11 are based on Fourth Advance Estimates as on 19-07-2011.3. Average growth rate in the 4th column for item I.6 and I.7 are calculated with the new base year (2004-05). Average growth rate of 3 years, i.e., 2005-
06, 2006-07 and 2007-08 are given in column.

171
APPENDIX TABLES
Memo : (` crore)
(at current prices)
Sector 2006-07 2007-08 2008-09 2009-10* 2010-11#
1. Agriculture and Allied Activities 7,22,984 8,36,518 9,28,943 10,89,297 13,86,8822. Industry 8,17,768 9,41,362 10,39,030 11,52,164 13,28,8873. Services 24,11,489 28,03,542 33,14,113 38,91,769 45,91,2214. Gross Domestic Product at factor cost 39,52,241 45,81,422 52,82,086 61,33,230 73,06,990
(at constant prices)
Sector 2006-07 2007-08 2008-09 2009-10* 2010-11#
1. Agriculture and Allied Activities 6,19,190 6,55,080 6,54,118 6,56,975 7,00,3902. Industry 7,36,372 8,04,474 8,36,363 9,06,081 9,76,6343. Services 22,10,449 24,39,404 26,72,028 29,30,687 32,00,8194. Gross Domestic Product at factor cost 35,66,011 38,98,958 41,62,509 44,93,743 48,77,842
* : Quick Estimates. # : Revised Estimates. .. : Not available.Source : Central Statistics Office.
APPENDIX TABLE 2 : GROWTH RATES AND SECTORAL COMPOSITION OF REALGROSS DOMESTIC PRODUCT
(At 2004-05 Prices)(Per cent)
Growth Rate Share in real GDP
Sector Average2005-06 to 2006-07 2007-08 2008-09 2009-10* 2010-11# 2006-07 2007-08 2008-09 2009-10* 2010-11#
2010-11
1 2 3 4 5 6 7 8 9 10 11 12
1. Agriculture and Allied Activities 3.7 4.2 5.8 -0.1 0.4 6.6 17.4 16.8 15.7 14.6 14.4of which :
Agriculture 3.1 4.1 6.3 -0.6 -0.1 .. 14.7 14.3 13.3 12.3 ..
2. Industry 8.5 12.9 9.2 4.0 8.3 7.8 20.6 20.6 20.1 20.2 20.0of which :
a) Mining and quarrying 4.4 7.5 3.7 1.3 6.9 5.8 2.6 2.5 2.3 2.3 2.3
b) Manufacturing 9.3 14.3 10.3 4.2 8.8 8.3 16.0 16.1 15.8 15.9 15.8
c) Electricity, gas and water supply 6.9 9.3 8.3 4.9 6.4 5.7 2.1 2.0 2.0 2.0 1.9
3. Services 10.0 10.1 10.4 9.5 9.7 9.2 62.0 62.6 64.2 65.2 65.6of which :
a) Construction 9.1 10.3 10.7 5.4 7.0 8.1 8.0 8.1 8.0 7.9 7.9
b) Trade, hotels and restaurants 9.1 11.0 10.0 5.5 6.7 9.0 16.7 16.8 16.6 16.4 16.5
c) Transport, storage andcommunications 12.7 12.7 12.9 11.1 15.0 12.3 8.9 9.2 9.5 10.2 10.5
d) Financing, insurance, real estateand business services 11.7 14.0 11.9 12.5 9.2 9.9 15.7 16.1 17.0 17.2 17.4
e) Community, social and personalservices 8.0 2.9 6.9 12.7 11.8 7.0 12.7 12.4 13.1 13.6 13.4
4. Gross Domestic Product atfactor cost 8.6 9.6 9.3 6.8 8.0 8.5 100 100 100 100 100

172
ANNUAL REPORT
APPENDIX TABLE 3: GROSS DOMESTIC SAVING AND INVESTMENT
Item Per cent of GDP at current market prices Amount in ` crore
Average2004-05 to 2007-08 2008-09 P 2009-10* 2007-08 2008-09 P 2009-10*
2009-10
1 2 3 4 5 6 7 8
1. Household Saving 23.3 22.5 23.8 23.5 11,19,829 13,31,033 15,36,071of which :a) Financial Assets 11.2 11.7 10.8 11.8 5,81,935 6,00,141 7,71,527b) Physical Assets 12.1 10.8 13.1 11.7 5,37,894 7,30,892 7,64,544
2. Private corporate sector 7.9 9.4 7.9 8.1 4,68,707 4,38,376 5,31,403
3. Public sector 2.7 5.0 0.5 2.1 2,48,962 28,938 1,39,949
4. Gross Domestic Saving 33.9 36.9 32.2 33.7 18,37,498 17,98,347 22,07,423
5. Net capital inflow 1.5 1.3 2.3 2.8 64,430 1,28,760 1,81,790
6. Gross Domestic Capital Formation 35.4 38.1 34.5 36.5 19,01,928 19,27,107 23,89,213
7. Errors and Omissions 0.1 0.1 -0.8 0.7 5,365 -46,428 45,034
8. Gross Capital Formation 35.3 38.0 35.4 35.8 18,96,563 19,73,535 23,44,179of which :a) Public sector 8.5 8.9 9.5 9.2 4,41,923 5,29,231 6,01,618b) Private corporate sector 13.4 17.3 11.5 13.2 8,63,154 6,41,199 8,64,643c) Household sector 12.1 10.8 13.1 11.7 5,37,894 7,30,892 7,64,544d) Valuables # 1.3 1.1 1.3 1.7 53,592 72,213 1,13,374
Memo:
Total Consumption Expenditure (a+b) 67.3 69.4 69.7a) Private Final Consumption Expenditure 57.0 58.4 57.7b) Government Final Consumption Expenditure 10.3 11.0 12.0
Saving-Investment Balance (4-6) -1.2 -2.3 -2.8Public Sector Balance # -3.9 -9.0 -7.0Private Sector Balance # 3.8 7.1 6.7a) Private Corporate Sector -7.9 -3.6 -5.1b) Household Sector 11.7 10.8 11.8
GDP at Market Prices (at current prices) 49,86,426 55,82,623 65,50,271
P : Provisional Estimates. * : Quick Estimates.# : Valuables cover the expenditures made on acquisition of valuables, excluding works of art and antiques.Source : Central Statistics Office.

173
APPENDIX TABLES
APPENDIX TABLE 4: FINANCIAL SAVING OF THE HOUSEHOLD SECTOR (GROSS)
Item Per cent to Total Financial Saving `crore
2008-09 R 2009-10 R 2010-11 P 2008-09 R 2009-10 R 2010-11 P
1 2 3 4 5 6 7
Financial Saving (Gross) 100.0 100.0 100.0 7,26,889 9,91,582 10,43,977
a) Currency 12.7 9.8 13.3 92,188 96,940 1,39,344
b) Deposits 60.7 47.2 47.3 441,063 4,67,575 4,93,237
i) With Commercial Banks 52.8 41.7 42.0 3,83,679 4,13,313 4,38,048ii) With Non-banking Companies 2.0 1.9 2.9 14,742 19,220 30,343iii) With Coperative Banks and Societies 4.7 3.6 2.5 34,154 36,140 25,943iv) Trade Debt (Net) 1.2 -0.1 -0.1 8,488 -1,097 -1,097
c) Share and Debentures -0.7 4.6 -0.4 -5,070 45,338 -4,636of which :
i) Private Corporate Business 1.0 1.3 1.2 7,441 12,758 12,483ii) Banking 0.0 0.1 0.1 231 954 766iii) Bonds of public Sector undertakings 0.1 0.1 0.1 446 606 828iv) Mutual Funds (including UTI) -1.4 3.3 -1.8 -10,450 33,041 -18,713
d) Claims on Government -3.8 4.3 6.5 -27,551 42,872 67,954
i) Investment in Government securities 0.0 0.0 0.0 271 389 321ii) Investment in Small Savings, etc. -3.8 4.3 6.5 -27,822 42,484 67,633
e) Life Insurance Funds 21.0 22.6 24.2 1,52,861 2,24,487 2,52,919of which :
i) Life Funds of LIC andprivate insurance companies 20.3 22.0 23.8 1,47,795 2,17,973 2,47,993
f) Provident and Pension Funds 10.1 11.5 9.1 73,397 1,14,369 95,159
R : Revised.P : Preliminary Estimates.Note : Components may not add up to the totals due to rounding off.

174
ANNUAL REPORT
APPENDIX TABLE 5: AGRICULTURAL PRODUCTION(Million Tonnes)
Crop 2001-02 2002-03 2003-04 2004-05 2005-06 2006-07 2007-08 2008-09 2009-10 2010-11#
1 2 3 4 5 6 7 8 9 10 11
I. All Crops: Annual Growth Rate (per cent) $ 6.0 -12.8 7.4 -1.6 12.2 14.3 3.2 -6.3 -1.4 11.8
A) Foodgrains 9.4 -18.5 22.6 -7.1 5.7 4.1 6.2 1.6 -7.0 8.2B) Non-foodgrains 2.0 -5.7 -8.9 1.6 16.1 19.5 1.8 -9.9 1.5 13.5
A Foodgrains (1+2+3+4, a+b) 212.9 174.8 213.2 198.4 208.6 217.3 230.8 234.5 218.1 241.6
1. Rice 93.3 71.8 88.5 83.1 91.8 93.4 96.7 99.2 89.1 95.3
2. Wheat 72.8 65.8 72.2 68.6 69.4 75.8 78.6 80.7 80.8 85.9
3. Coarse Cereals 33.4 26.1 37.6 33.5 34.1 33.9 40.8 40.0 33.6 42.2of which :i) Jowar 7.6 7.0 6.7 7.2 7.6 7.2 7.9 7.2 6.7 6.7ii) Bajra 8.3 4.7 12.1 7.9 7.7 8.4 10.0 8.9 6.5 10.1iii) Maize 13.2 11.2 15.0 14.2 14.7 15.1 19.0 19.7 16.7 21.3
4. Pulses 13.4 11.1 14.9 13.1 13.4 14.2 14.8 14.6 14.7 18.1of which :i) Tur 2.3 2.2 2.4 2.4 2.7 2.3 3.1 2.3 2.5 2.9ii) Gram 5.5 4.2 5.7 5.5 5.6 6.3 5.8 7.1 7.5 8.3
a) Kharif 112.1 87.2 117.0 103.3 109.9 110.6 121.0 118.1 104.0 120.21. Rice 80.5 63.1 78.6 72.2 78.3 80.2 82.7 84.9 75.9 80.72. Coarse Cereals 26.7 20.0 32.2 26.4 26.7 25.6 31.9 28.5 23.8 32.4
of which :i) Jowar 4.2 4.2 4.8 4.0 4.1 3.7 4.1 3.1 2.8 3.5ii) Bajra 8.3 4.7 12.1 7.9 7.7 8.4 10.0 8.9 6.5 10.1iii) Maize 11.3 9.3 12.7 11.5 12.2 11.6 15.1 14.1 12.3 16.3
3. Pulses 4.8 4.2 6.2 4.7 4.9 4.8 6.4 4.7 4.2 7.1of which :i) Tur 2.3 2.2 2.4 2.4 2.7 2.3 3.1 2.3 2.5 2.9
b) Rabi 100.8 87.6 96.2 95.1 98.7 106.7 109.8 116.3 114.2 121.41. Rice 12.8 8.7 9.9 10.9 13.5 13.2 14.0 14.3 13.2 14.72. Wheat 72.8 65.8 72.2 68.6 69.4 75.8 78.6 80.7 80.8 85.93. Coarse Cereals 6.7 6.1 5.4 7.1 7.3 8.3 8.9 11.5 9.7 9.8
of which :i) Jowar 3.3 2.8 1.8 3.2 3.6 3.4 3.8 4.2 3.9 3.3ii) Maize 1.9 1.9 2.3 2.7 2.6 3.5 3.9 5.6 4.4 5.0
4. Pulses 8.5 7.0 8.7 8.4 8.5 9.4 8.4 9.9 10.5 11.0of which :i) Gram 5.5 4.2 5.7 5.5 5.6 6.3 5.8 7.1 7.5 8.3
B Non-foodgrains
1. Oilseeds++ 20.7 14.8 25.2 24.4 28.0 24.3 29.8 27.7 24.9 31.1of which :i) Groundnut 7.0 4.1 8.1 6.8 8.0 4.9 9.2 7.2 5.4 7.5ii) Rapeseed & Mustard 5.1 3.9 6.3 7.6 8.1 7.4 5.8 7.2 6.6 7.7iii) Sunflower 0.7 0.9 0.9 1.2 1.4 1.2 1.5 1.2 0.9 0.6iv) Soyabean 6.0 4.7 7.8 6.9 8.3 8.9 11.0 9.9 10.0 12.7
2. Sugarcane 297.2 287.4 233.9 237.1 281.2 355.5 348.2 285.0 292.3 339.2
3. Cotton @ 10.0 8.6 13.7 16.4 18.5 22.6 25.9 22.3 24.2 33.4
4. Jute and Mesta + 11.7 11.3 11.2 10.3 10.8 11.3 11.2 10.4 11.8 10.6
5. Tea* 851.4 846.0 878.7 906.8 948.9 973.1 987.0 972.8 991.2 966.76. Coffee* 300.6 275.3 270.5 275.5 274.0 288.0 262.0 262.3 289.6 299.0
# : Fourth Advance Estimates as on July 19, 2011.$ : Growth rates are based on Index of Agricultural Production with base triennium ending 1993-94=100. Data for 2010-11 are averages for period 1994-95 to
2007-08.@ : Million bales of 170 kg. each.+ : Million bales of 180 kg. each.++ : For nine oilseeds out of eleven in all.* : Million kilograms. Tea production for 2010-11 is average of 2001-02 to 2009-10.Source: Ministry of Agriculture, Government of India.

175
APPENDIX TABLES
APPENDIX TABLE 6: PROCUREMENT, OFF-TAKE AND STOCKS OF FOODGRAINS
(Million tonnes)
Year Procurement Off-take Stocks*
Rice Wheat Total Rice Wheat Total Rice Wheat Total #
1 2 3 4 5 6 7 8 9 10
1995-96 9.93 12.33 22.16 11.63 12.72 24.35 13.06 7.76 20.82
1996-97 11.88 8.16 20.04 12.31 13.32 25.63 13.17 3.24 16.41
1997-98 14.54 9.30 23.84 11.20 7.76 18.96 13.05 5.08 18.12
1998-99 11.55 12.65 24.20 11.83 8.90 20.73 12.16 9.66 21.82
1999-00 16.62 14.14 30.76 12.42 10.63 23.05 15.72 13.19 28.91
2000-01 18.93 16.36 35.29 10.42 7.79 18.21 23.19 21.50 44.98
2001-02 21.12 20.63 41.75 15.32 15.99 31.30 24.91 26.04 51.02
2002-03 19.00 19.03 38.03 24.85 24.99 49.84 17.16 15.65 32.81
2003-04 20.78 15.80 36.58 25.04 24.29 49.33 13.07 6.93 20.65
2004-05 24.04 16.80 40.83 23.20 18.27 41.47 13.34 4.07 17.97
2005-06 26.69 14.79 41.48 25.08 17.17 42.25 13.68 2.01 16.62
2006-07 26.31 9.23 35.53 25.06 11.71 36.77 13.17 4.70 17.93
2007-08 26.29 11.13 37.42 25.22 12.20 37.43 13.84 5.80 19.75
2008-09 32.84 22.69 55.53 24.62 14.88 39.50 21.60 13.43 35.58
2009-10 32.59 25.38 57.98 26.89 21.97 48.86 26.71 16.13 43.36
2010-11P 31.13 25.92 56.79 29.80 23.07 80.57 28.82 15.36 44.35
2011-12P 7.77 27.88 35.65 2.28 1.68 3.96 25.27 35.88 61.30
* : Stocks as at end-March.# : Includes coarse grains.P : Provisional.- : Not Available.Note : Off-take for 2011-12 is for the month of April. Procurement for 2011-12 is as on August 12, 2011.Source : Ministry of Food, Consumer Affairs and Public Distribution, Government of India.

176
ANNUAL REPORT
APPENDIX TABLE 7: TRENDS IN INDEX OF INDUSTRIAL PRODUCTION(Base : 2004-05=100)
Sector Mining & Quarrying Manufacturing Electricity General
Weight 14.2 75.5 10.3 100.0
Period Index Growth Rate Index Growth Rate Index Growth Rate Index Growth Rate(per cent) (per cent) (per cent) (per cent)
1 2 3 4 5 6 7 8 9
2006-07 107.5 5.2 126.8 15.0 112.8 7.3 122.6 12.9(5.3) (89.0) (5.6) (100.0)
2007-08 112.5 4.6 150.1 18.4 120.0 6.3 141.7 15.5(3.7) (92.4) (3.9) (100.0)
2008-09 115.4 2.6 153.8 2.5 123.3 2.7 145.2 2.5(11.5) (78.9) (9.6) (100.0)
2009-10 124.5 7.9 161.3 4.8 130.8 6.1 152.9 5.3(16.8) (73.1) (10.1) (100.0)
2010-11 P 131.0 5.2 175.7 9.0 138.0 5.5 165.5 8.2(7.3) (86.7) (5.9) (100.0)
2009-10April-June 117.4 6.2 149.9 -3.7 129.6 6.1 143.2 -1.8July-September 113.7 7.2 158.1 1.8 131.6 7.4 149.1 2.9October-December 127.1 7.5 162.0 6.1 127.8 3.8 153.5 6.1January-March 139.9 10.3 175.1 15.4 134.1 7.1 165.9 14.0April-September 115.5 6.7 154.0 -1.0 130.6 6.8 146.1 0.5October-March 133.5 9.0 168.5 10.7 131.0 5.4 159.7 10.1
2010-11 PApril-June 126.8 8.0 165.4 10.3 136.6 5.4 157.0 9.6July-September 120.9 6.3 169.8 7.4 134.4 2.1 159.2 6.8October-December 135.1 6.3 176.9 9.2 136.1 6.5 166.7 8.6January-March 141.4 1.0 190.7 8.9 145.0 8.1 179.0 7.9April-September 123.8 7.2 167.6 8.9 135.5 3.8 158.1 8.2October-March 138.2 3.5 183.8 9.1 140.6 7.3 172.9 8.3
P : Provisional.
Note : Figures in parentheses are relative contributions, computed as the ratio (in percentage terms) of the change in the index of the respective industry group to the
change in the overall index adjusted for the weight of the relevant industry group.
Source : Central Statistical Office.

177
APPENDIX TABLES
APPENDIX TABLE 8: VARIATIONS IN INDEX NUMBERS OF WHOLESALE PRICES(Base:2004-05 = 100)
(Per cent)
Major Group/Sub-group/Commodity Weight Variations
Year-on-Year Average Year-on-Year
March 2010 March 2011 2009-10 2010-11 July 2010 July 2011 P
1 2 3 4 5 6 7 8
All Commodities 100.0 10.4 9.7 3.8 9.6 10.0 9.2
I. Primary Articles 20.1 22.2 13.4 12.7 17.7 19.1 11.31. Food Articles 14.3 20.6 9.4 15.3 15.6 18.5 8.2
a) Cereals 3.4 10.5 3.5 12.6 5.3 8.3 5.3i) Rice 1.8 8.1 2.3 12.3 5.9 9.6 2.5ii) Wheat 1.1 14.7 0.2 12.8 3.0 6.5 1.9
b) Pulses 0.7 25.0 -4.0 22.4 3.2 14.4 -7.4c) Fruits and Vegetables 3.8 16.3 18.9 9.6 16.4 13.2 11.7d) Milk 3.2 24.9 4.4 18.8 20.1 26.1 10.8e) Eggs, Meat and Fish 2.4 35.5 13.5 20.8 25.5 31.4 9.2f) Condiments and Spices 0.6 33.7 20.4 20.8 33.6 43.5 2.3g) Tea and Coffee 0.2 -4.5 4.7 12.1 -7.3 -17.7 24.8
2. Non-Food Articles 4.3 20.4 27.3 5.5 22.3 15.3 15.5a) Fibres 0.9 20.5 87.7 1.6 41.7 16.2 29.7
i) Raw Cotton 0.7 20.0 103.0 -1.9 43.9 13.2 35.3b) Oilseeds 1.8 6.7 10.9 2.9 4.7 2.2 14.0c) Sugarcane 0.6 53.3 7.1 5.2 46.8 53.3 7.1
3. Minerals 1.5 37.9 15.2 8.8 24.8 31.6 25.0a) Iron Ore 0.2 42.1 40.2 -1.1 78.8 117.0 8.9b) Crude Petroleum 0.9 58.3 6.3 21.2 11.8 13.0 46.3
II. Fuel and Power 14.9 13.8 12.5 -2.1 12.3 13.3 12.01. Coal 2.1 7.9 13.3 3.4 5.7 7.9 13.32. Mineral Oils 9.4 18.6 14.7 -4.3 16.0 15.9 15.43. Electricity 3.5 3.4 3.6 1.0 5.4 8.6 -1.3
III. Manufactured Products 65.0 5.3 7.4 2.2 5.7 5.8 7.51. Food Products 10.0 15.1 2.4 13.5 3.7 7.3 7.6
a) Dairy Products 0.6 19.6 4.8 12.9 9.6 15.7 6.7b) Grain Mill Products 1.3 12.8 0.7 6.1 5.7 10.2 1.2c) Sugar, Khandsari and Gur 2.1 41.7 -7.8 51.6 -0.9 14.1 3.2d) Edible Oils 3.0 0.4 13.0 -5.9 5.4 2.3 14.1e) Oil Cakes 0.5 10.7 1.5 15.3 0.8 -3.5 5.8
2. Beverages, Tobacco and Tobacco Products 1.8 8.1 8.8 6.1 7.4 7.3 12.63. Textiles 7.3 9.1 18.3 3.4 12.1 10.1 12.9
a) Cotton Textiles 2.6 12.7 33.1 6.0 18.7 14.5 22.5b) Man Made Textiles 2.2 8.4 12.6 0.9 10.4 9.9 7.9
4. Wood and Wood Products 0.6 6.6 3.6 9.6 4.0 4.9 9.45. Paper and Paper Products 2.0 2.5 8.4 2.2 5.3 4.6 7.36. Leather and Leather Products 0.8 2.5 -1.5 4.9 -1.0 0.0 1.17. Rubber and Plastic Products 3.0 3.7 10.6 0.7 6.7 5.0 7.78. Chemicals and Chemical Products 12.0 3.7 7.4 -0.3 5.3 4.4 7.9
a) Basic Inorganic Chemicals 1.2 -0.6 4.1 -0.9 1.0 0.3 9.1b) Basic Organic Chemicals 2.0 10.8 8.8 -1.9 7.5 6.9 10.9c) Fertilizers 2.7 1.9 9.9 1.2 8.0 7.3 10.0d) Pesticides 0.5 -0.7 1.9 0.1 2.7 2.9 -0.6e) Drugs and Medicines 0.5 0.7 3.4 1.2 2.4 2.2 3.0
9. Non-Metallic Mineral Products 2.6 3.2 3.7 7.0 2.7 3.1 3.3a) Cement and Lime 1.4 2.3 1.7 7.5 1.2 2.5 0.5
10. Basic Metals, Alloys and Metal Products 10.7 2.2 11.7 -6.1 8.7 7.9 10.1a) Ferrous Metals 8.1 0.5 11.7 -9.0 8.7 7.7 9.8b) Non-Ferrous Metals 1.0 8.4 2.3 -3.2 5.3 6.9 2.5c) Metal Products 1.7 5.8 17.0 5.0 10.7 8.8 15.5
11. Machinery and Machine Tools 8.9 1.5 3.2 0.5 2.8 2.3 2.7a) Non-Electrical Machinery 1.0 7.5 1.3 3.3 2.8 4.5 1.1b) Electrical Machinery, Equipment and Batteries 2.3 -1.1 3.2 -1.3 1.5 -0.3 3.3
12. Transport, Equipment and Parts 5.2 1.2 3.6 3.1 3.0 3.8 2.9
P : Provisional.Source : Office of the Economic Adviser, Ministry of Commerce and Industry, Government of India.

178
ANNUAL REPORT
APPENDIX TABLE 9: VARIATIONS IN RESERVE MONEY( Amount in `crore)
Variations
ItemOutstanding
Financial year Year-on-year
as on March 2009-10 2010-11 up to Aug 13, 2010 up to Aug 12, 201131, 2011
Absolute Per cent Absolute Per cent Absolute Per cent Absolute Per cent
1 2 3 4 5 6 7 8 9 10
Reserve Money 13,76,881 1,67,688 17.0 2,21,195 19.1 2,43,754 26.1 1,93,523 16.5
(C.1+C.2+C.3 = S.1+S.2+S.3+S.4+S.5-S.6)
Components
C.1.Currency in Circulation 9,49,659 1,08,395 15.7 1,50,111 18.8 1,44,155 20.2 1,31,423 15.3
C.2.Bankers’ Deposits with the RBI 4,23,509 61,024 21.0 71,211 20.2 1,00,173 47.0 64,317 20.5of which :Scheduled Commercial Banks 4,02,656 56,474 20.4 68,720 20.6 95,592 47.9 62,368 21.1
C.3. ‘Other’ Deposits with the RBI 3,713 -1,731 -31.1 -126 -3.3 -574 -12.0 -2,216 -52.5
Sources
S.1. Net RBI Credit to Government (a+b) 3,96,555 1,50,006 – 1,84,969 – 2,02,713 – 1,60,964 –
a) Net RBI credit to CentralGovernment (i-ii) 3,94,035 1,49,820 – 1,82,454 – 2,02,725 – 1,60,740 –i) Claims on Central Government 3,94,135 65,185 – 1,71,462 – 1,44,542 – 1,60,740 –ii) Deposits of Central Government 100 -84,634 – -10,992 – -58,183 – -1 –
b) Net RBI credit to StateGovernments (i-ii) 2,520 186 – 2,515 – -12 – 224 –i) Claims on State Governments 2,919 -1,632 – 2,873 – -12 – 225 –ii) Deposits of State Governments 399 -1,818 – 358 – 0 – 1 –
S.2. RBI’s Claims on Commercial andCo-operative Banks 5,159 -9,188 – 3,990 – 1,132 – -11 –of which :Loans and Advances toScheduled Commercial Banks 5,115 -8,995 – 3,946 – 1,132 – -16 –
S.3. RBI’s Credit to Commercial Sector 2,164 -12,492 -90.4 836 63.0 -9,033 -87.2 385 29.1
S.4. Net Foreign Exchange Assetsof the RBI 13,28,553 -48,167 -3.8 96,605 7.8 -16,922 -1.3 1,14,144 8.9
S.5. Government’s Currency Liabilities 12,724 1,215 12.1 1,455 12.9 1,345 12.9 1,198 10.2to the Public
S.6. Net Non-monetary Liabilities of the RBI 3,68,274 -86,315 -22.3 66,660 22.1 -64,520 -16.2 83,157 25.0
S.7. Net Domestic Assets of the RBI 48,328 2,15,856 – 1,24,591 – 2,60,676 – 79,379 –(S.1+S.2+S.3+S.5-S.6)
Data are provisional.

179
APPENDIX TABLES
APPENDIX TABLE 10: VARIATIONS IN MONEY STOCK( Amount in `crore)
Variations
ItemOutstanding
Financial year Year-on-year
as on March 2009-10 2010-11 up to July 30, 2010 up to July 29, 201131, 2011
Absolute Per cent Absolute Per cent Absolute Per cent Absolute Per cent
1 2 3 4 5 6 7 8 9 10
Narrow Money (M1)[C.1+C.2(a)+C.3] 16,35,569 2,29,594 18.2 1,46,268 9.8 2,46,321 19.5 68,105 4.5
Broad Money (M3) 64,99,548 8,07,919 16.8 8,96,817 16.0 7,93,676 15.7 9,55,700 16.4(C.1+C.2+C.3 = S.1+S.2+S.3+S.4-S.5)
Components
C.1.Currency with the Public 9,14,197 1,02,043 15.3 1,46,704 19.1 1,38,465 20.5 1,20,965 14.9
C.2.Aggregate Deposits withBanks (a+b) 55,81,639 7,07,607 17.2 7,50,239 15.5 6,54,994 15.0 8,36,902 16.7a) Demand Deposits 7,17,660 1,29,282 22.0 -310 0.0 1,07,640 18.4 -50,692 -7.3b) Time Deposits 48,63,979 5,78,326 16.4 7,50,549 18.2 5,47,354 14.5 8,87,594 20.5
C.3. ‘Other’ Deposits with the RBI 3,713 -1,731 -31.1 -126 -3.3 216 5.1 -2,168 -48.5
Sources
S.1. Net Bank Credit toGovernment (A+B) 19,82,771 3,91,853 30.7 3,13,585 18.8 3,35,120 23.6 3,76,360 21.4
A. Net RBI credit toGovernment (a+b) 3,96,555 1,50,006 – 1,84,969 – 1,94,789 – 1,49,499 –a. Net RBI credit to
Central Government 3,94,035 1,49,820 – 1,82,454 – 1,94,789 – 1,49,483 –b. Net RBI credit to
State Governments 2,520 186 – 2,515 – 0 – 16 –
B. Other banks’ credit toGovernment 15,86,216 2,41,847 19.9 1,28,616 8.8 1,40,331 10.1 2,26,861 40.8
S.2. Bank Credit to CommercialSector (a+b) 42,35,406 4,76,516 15.8 7,43,997 21.3 5,98,612 19.7 6,54,967 18.0
A. RBI’s credit to commercial sector 2,164 -12,492 – 836 – -10,331 -88.6 474 35.8
B. Other banks’ credit tocommercial sector 42,33,242 4,89,008 16.3 7,43,161 21.3 6,08,943 20.1 6,54,493 18.0
S.3. Net Foreign Exchange Assets ofBanking Sector (A+B) 13,93,327 -70,715 -5.2 1,11,858 8.7 -20,047 -1.5 1,07,676 8.1
A. RBI’s net foreign exchange assets 13,28,553 -48,167 -3.8 96,605 7.8 -11,025 -0.8 84,775 6.6
B. Other banks’ net foreignexchange assets 64,774 -22,548 -31.3 15,254 30.8 -9,022 -17.7 22,900 54.7
S.4. Government’s CurrencyLiabilities to the Public 12,724 1,215 12.1 1,455 12.9 1,345 12.9 1,198 10.2
S.5. Banking Sector’s NetNon-Monetary Liabilities (A+B) 11,24,680 -9,050 -1.1 2,74,079 32.2 1,21,354 15.5 1,84,501 20.4
A. Net non-monetary liabilities of RBI 3,68,274 -86,315 -22.3 66,660 22.1 -63,009 -14.9 49,024 13.7
B. Net non-monetary liabilities ofother banks (residual) 7,56,406 77,265 16.4 2,07,419 37.8 1,84,363 51.3 1,35,477 24.9
Note : Data are provisional.

180
ANNUAL REPORT
APPENDIX TABLE 11: SECTORAL DEPLOYMENT OF GROSS BANK CREDIT(Amount in ` crore)
Sector Outstanding as on Variation during
March 27, 2009 March 26, 2010 March 25, 2011 2009-10 2010-11
Absolute Per cent Absolute Per cent
1 2 3 4 5 6 7 8
I Gross Bank Credit (II + III) 26,47,368 30,88,569 37,31,466 4,41,201 16.7 6,42,897 20.8
II Food Credit 45,544 48,562 64,111 3,018 6.6 15,549 32.0
III Non-food Credit (1 to 4) 26,01,825 30,40,007 36,67,354 4,38,182 16.8 6,27,347 20.6
1. Agriculture & Allied Activities 3,38,656 416,133 4,60,333 77,477 22.9 44,200 10.6
2. Industry(Micro & Small, Medium and Large ) 10,54,390 13,11,451 16,20,849 2,57,061 24.4 3,09,398 23.6
3. Services 6,46,299 7,26,790 9,00,801 80,491 12.5 1,74,011 23.9of which :
3.1 Transport Operators 39,302 52,516 65,463 13,214 33.6 12,947 24.7
3.2 Professional Services 44,257 43,401 60,271 -856 -1.9 16,870 38.9
3.3 Trade 1,44,377 1,64,497 1,86,286 20,120 13.9 21,789 13.2
3.4 Commercial Real Estate 92,421 92,128 1,11,836 -293 -0.3 19,708 21.4
3.5 Non-Banking FinancialCompanies (NBFCs) 98,853 1,13,441 1,75,577 14,588 14.8 62,136 54.8
4. Personal Loans 5,62,479 5,85,633 6,85,372 23,154 4.1 99,739 17.0of which :
4.1 Consumer Durables 8,187 8,294 10,156 107 1.3 1,862 22.4
4.2 Housing @ 2,79,365 3,00,929 3,46,110 21,564 7.7 45,181 15.0
4.3 Advances against Fixed Deposits 48,676 48,654 60,524 -22 0.0 11,870 24.4(Including FCNR(B),NRNR Deposits etc.)
4.4 Credit Card Outstanding 28,000 20,145 18,098 -7,855 -28.1 -2,047 -10.2
4.5 Education 28,579 36,863 43,710 8,284 29.0 6,847 18.6
Memo
5. Priority Sector 9,32,459 10,92,179 12,58,386 1,59,720 17.1 1,66,207 15.2of which :
5.1 Housing# 1,97,110 2,17,877 2,30,686 20,767 10.5 12,809 5.9
@ : Direct housing loans.# : Direct as well as indirect housing loan.Note : 1. Data are provisional and relate to select banks which cover 95 per cent of total non-food credit extended by all scheduled commercial banks.
2. Gross bank credit data include bills rediscounted with Reserve Bank, Exim Bank, other financial institutions and inter-bank participations.
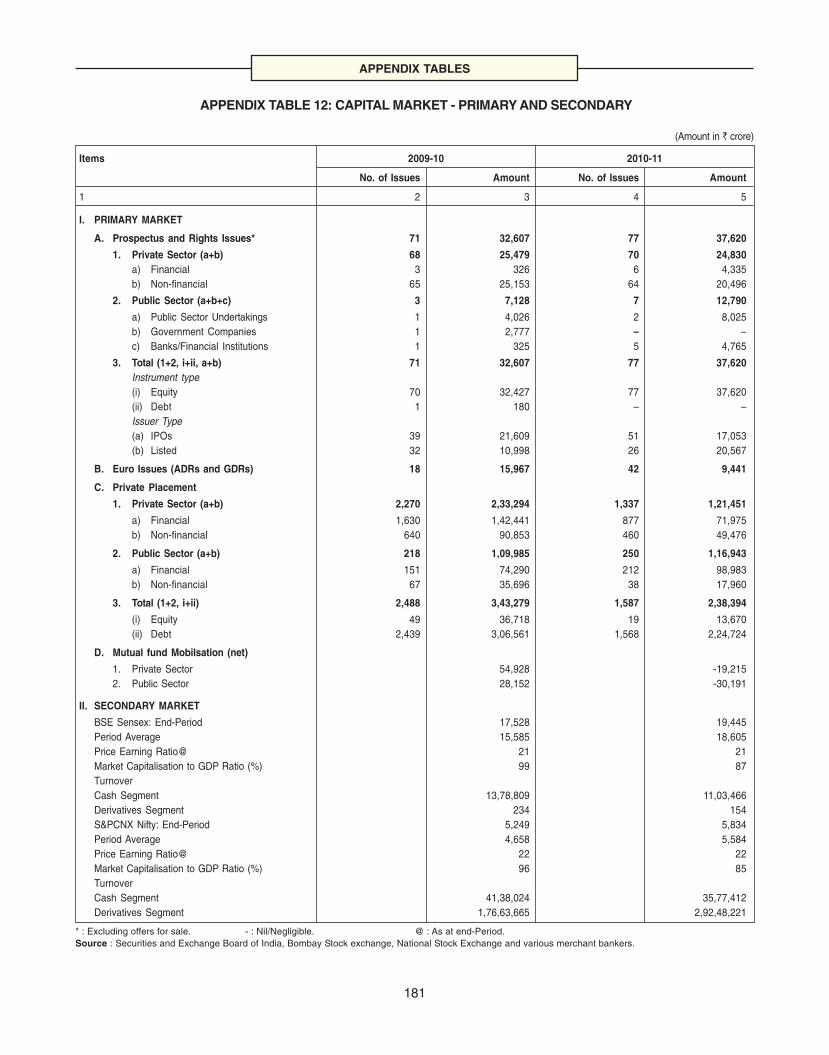
181
APPENDIX TABLES
APPENDIX TABLE 12: CAPITAL MARKET - PRIMARY AND SECONDARY
(Amount in ` crore)
Items 2009-10 2010-11
No. of Issues Amount No. of Issues Amount
1 2 3 4 5
I. PRIMARY MARKET
A. Prospectus and Rights Issues* 71 32,607 77 37,620
1. Private Sector (a+b) 68 25,479 70 24,830a) Financial 3 326 6 4,335b) Non-financial 65 25,153 64 20,496
2. Public Sector (a+b+c) 3 7,128 7 12,790
a) Public Sector Undertakings 1 4,026 2 8,025b) Government Companies 1 2,777 – –c) Banks/Financial Institutions 1 325 5 4,765
3. Total (1+2, i+ii, a+b) 71 32,607 77 37,620Instrument type(i) Equity 70 32,427 77 37,620(ii) Debt 1 180 – –Issuer Type(a) IPOs 39 21,609 51 17,053(b) Listed 32 10,998 26 20,567
B. Euro Issues (ADRs and GDRs) 18 15,967 42 9,441
C. Private Placement
1. Private Sector (a+b) 2,270 2,33,294 1,337 1,21,451
a) Financial 1,630 1,42,441 877 71,975b) Non-financial 640 90,853 460 49,476
2. Public Sector (a+b) 218 1,09,985 250 1,16,943
a) Financial 151 74,290 212 98,983b) Non-financial 67 35,696 38 17,960
3. Total (1+2, i+ii) 2,488 3,43,279 1,587 2,38,394
(i) Equity 49 36,718 19 13,670(ii) Debt 2,439 3,06,561 1,568 2,24,724
D. Mutual fund Mobilsation (net)
1. Private Sector 54,928 -19,2152. Public Sector 28,152 -30,191
II. SECONDARY MARKET
BSE Sensex: End-Period 17,528 19,445Period Average 15,585 18,605Price Earning Ratio@ 21 21Market Capitalisation to GDP Ratio (%) 99 87TurnoverCash Segment 13,78,809 11,03,466Derivatives Segment 234 154S&PCNX Nifty: End-Period 5,249 5,834Period Average 4,658 5,584Price Earning Ratio@ 22 22Market Capitalisation to GDP Ratio (%) 96 85TurnoverCash Segment 41,38,024 35,77,412Derivatives Segment 1,76,63,665 2,92,48,221
* : Excluding offers for sale. - : Nil/Negligible. @ : As at end-Period.Source : Securities and Exchange Board of India, Bombay Stock exchange, National Stock Exchange and various merchant bankers.

182
ANNUAL REPORT
APPENDIX TABLE 13: TURNOVER IN INDIAN DERIVATIVES MARKET(` Crore)
Year/Month Equity Derivatives Currency Derivatives Interest RateDerivatives
Index Futures Index Options Stock Futures Stock Forward Swap Exchange TradedOptions Currency Options Interest Rate
and Futures Swap
1 2 3 4 5 6 7 8 9
2008-09 35,81,870 37,31,512 34,79,657 2,29,227 25,54,994 40,65,695 3,11,389 49,04,752
2009-10 39,34,485 80,28,103 51,95,247 5,06,065 20,35,879 31,45,402 37,27,262 25,69,488
2010-11 43,56,909 1,72,69,366 54,95,757 10,30,343 28,90,222 41,12,539 84,06,307 47,46,390
2009-10
Apr 3,01,766 4,53,788 3,56,383 31,427 1,54,799 2,88,861 77,244 92,148
May 3,17,416 4,30,522 4,48,155 31,168 2,47,737 3,16,486 1,24,900 1,73,946
Jun 3,46,934 5,45,643 5,89,657 49,746 1,79,079 3,10,792 1,43,348 2,44,290
Jul 3,82,924 7,01,247 4,50,632 38,707 1,55,183 3,17,384 1,84,813 1,44,840
Aug 3,66,312 6,58,757 4,12,363 36,214 1,50,272 2,40,148 1,80,688 1,37,524
Sep 3,02,425 6,09,076 4,34,119 42,758 1,40,390 2,13,851 2,17,455 1,62,582
Oct 3,29,610 6,69,591 4,65,829 45,387 1,74,382 2,24,087 3,04,473 2,14,872
Nov 3,63,523 8,16,408 4,38,220 43,666 1,63,409 1,99,740 3,19,195 1,62,024
Dec 3,29,497 7,56,680 3,95,954 42,855 1,59,544 2,40,832 3,89,913 3,27,312
Jan 2,98,931 6,95,988 4,44,134 51,454 1,57,846 2,44,273 5,69,087 2,90,944
Feb 3,26,881 8,47,236 3,54,485 41,285 1,63,438 2,43,864 5,69,510 3,12,326
Mar 2,68,267 8,43,167 4,05,316 51,398 1,89,799 3,05,083 6,46,637 3,06,680
2010-11
Apr 2,79,573 9,05,472 4,09,844 76,731 1,74,250 2,64,596 7,19,304 2,44,826
May 3,95,617 1,21,458 4,31,593 79,832 2,70,782 2,97,173 7,82,755 3,09,516
Jun 3,72,268 11,69,943 4,21,843 71,547 2,32,419 3,10,394 7,52,470 5,32,618
Jul 2,89,424 10,43,354 4,23,422 73,710 1,95,144 3,16,990 5,33,369 5,50,084
Aug 2,99,133 11,57,466 4,96,267 1,00,865 2,22,722 3,44,994 4,92,257 5,13,510
Sep 3,83,876 16,88,469 5,55,581 1,08,470 2,49,383 3,20,629 8,68,526 3,12,260
Oct 4,02,463 17,05,514 6,08,830 1,07,693 3,12,475 4,28,143 9,05,836 346,354
Nov 4,24,790 19,02,944 5,39,872 98,241 2,72,365 3,89,511 6,76,984 2,77,176
Dec 3,22,806 15,19,280 4,32,644 82,391 2,14,508 3,37,549 5,43,544 3,41,326
Jan 3,84,486 19,62,516 4,11,149 83,685 2,17,049 3,12,753 6,60,076 5,72,318
Feb 4,02,852 20,44,353 4,01,307 80,876 2,38,612 3,27,239 5,97,965 3,35,470
Mar 3,99,621 20,48,597 3,63,405 66,303 2,90,511 4,62,568 8,73,221 4,10,932
2011-12
Apr 2,82,313 16,45,980 3,53,162 69,993 2,06,047 3,67,137 7,22,275 3,75,446
May 3,05,746 18,92,896 3,36,689 70,090 2,17,188 4,74,893 10,00,498 4,78,938
June 2,65,191 17,84,570 3,22,695 65,792 2,40,047 4,95,622 10,39,010 5,36,776
Source : RBI, BSE, NSE, CCIL and SEBI.

183
APPENDIX TABLES
APPENDIX TABLE 14: INDICES OF REAL EFFECTIVE EXCHANGE RATE (REER) AND NOMINAL EFFECTIVEEXCHANGE RATE (NEER) OF THE INDIAN RUPEE
Year/Month 36 - Currency Trade-based weights 6 - Currency Trade-based weights
(Base 2004-05=100) (Base 2004-05=100)
REER NEER REER NEER
1 2 3 4 5
2004-05 100.00 100.00 100.00 100.002005-06 103.10 102.24 105.17 103.042006-07 101.29 97.63 104.30 98.092007-08 108.52 104.75 112.76 104.622008-09 97.80 93.34 102.32 90.422009-10 (P) 94.74 90.94 101.97 87.072010-11 (P) 102.04 93.56 115.28 92.02
2009-10 (P)April 90.62 89.65 96.12 85.28May 91.89 90.59 98.51 86.48June 92.70 91.04 98.71 86.71July 92.03 89.59 97.84 85.22August 92.50 89.33 98.90 85.04September 91.72 88.35 98.48 84.18October 94.33 90.66 101.53 86.67November 95.66 90.67 102.86 86.56December 96.19 91.10 103.99 87.21January 99.11 92.63 107.33 89.30February 99.10 93.08 107.98 90.03March 101.08 94.56 111.43 92.19
2010-11 (P)April 103.78 96.35 116.00 94.70May 102.95 95.55 116.20 94.23June 102.30 94.66 115.21 93.50July 99.98 92.03 112.63 90.96August 99.57 92.02 112.72 90.92September 100.75 92.87 113.96 91.38October 102.66 94.51 115.19 92.32November 101.67 93.34 115.08 91.52December 103.52 93.82 117.94 92.47January 102.65 92.72 117.46 91.45February 101.78 92.32 115.72 90.37March 102.88 92.54 116.46 90.44
2011-12 (P)April 104.37 93.02 118.78 90.60May 101.20 91.79 117.19 89.48June 101.51 92.07 117.35 89.48
P : Provisional.Note : For detailed methodology of compilation of indices, see “Revision of Nominal Effective Exchange Rate (NEER) and Real Effective Exchange Rate
(REER) Indices”, Reserve Bank of India Bulletin, December 2005.

184
ANNUAL REPORT
APPENDIX TABLE 15: KEY FISCAL INDICATORS
(As per cent to GDP)
Year Primary Deficit Revenue Deficit Gross Fiscal Deficit Outstanding Liabilities@
1 2 3 4 5
Centre
1990-91 4.1 3.3 7.8 55.21995-96 0.9 2.5 5.1 50.92000-01 0.9 4.1 5.7 55.62007-08 -0.9 1.1 2.6 56.92008-09 2.6 4.5 6.0 56.62009-10 3.1 5.2 6.4 53.72010-11 RE 2.0 3.4 5.1 49.92011-12 BE 1.6 3.4 4.6 48.5
States*
1990-91 1.8 0.9 3.3 22.51995-96 0.8 0.7 2.6 20.92000-01 1.8 2.6 4.2 28.32007-08 -0.5 -0.9 1.5 26.62008-09 0.6 -0.2 2.4 26.32009-10 1.2 0.5 2.9 25.02010-11 RE 1.0 0.3 2.6 23.02011-12 BE 0.7 -0.2 2.2 22.4
Combined
1990-91 5.0 4.2 9.4 64.81995-96 1.6 3.2 6.5 61.12000-01 3.6 6.6 9.5 70.62007-08 -1.1 0.2 4.1 71.42008-09 3.4 4.3 8.5 72.12009-10 4.5 5.6 9.3 69.22010-11 RE 3.2 3.7 7.7 64.32011-12 BE 2.4 3.2 6.8 63.0
RE : Revised Estimates. BE : Budget Estimates.* : Data from 2009-10 onwards are provisional and based on budgets of 28 State governments of which five are Vote on Account.@ : Includes external liabilities of the Centre calculated at historical exchange rate.Note : Negative sign (-) indicates surplus in deficit indicators.Source : Budget documents of the Central and State governments.

185
APPENDIX TABLES
APPENDIX TABLE 16: BUDGETARY OPERATIONS OF THE STATE GOVERNMENTS
A : Measures of Deficit of State Governments (` crore)
Year Fiscal Deficit Primary Deficit Net RBI Conventional Revenue
Gross Net Gross Net Credit# Deficit Deficit
1 2 3 4 5 6 7 8
1990-91 18,786 14,531 10,131 8,280 420 -72 5,3091995-96 30,869 26,845 9,030 10,791 16 -2,680 8,6202000-01 87,922 85,576 36,936 45,550 -1,092 -2,379 55,3162007-08 75,455 68,964 -24,376 -18,230 1,140 -13,410 -42,9432008-09 1,34,589 1,29,690 31,634 43,092 -1,609 -8,959 -12,6722009-10* P 1,88,820 1,79,418 76,013 81,921 186 7,372 31,0182010-11* (RE) P 2,07,857 1,95,813 80,908 86,029 2,515 24,867 22,9162011-12* (BE) P 1,99,427 1,82,541 59,325 59,427 .. -16,136 -16,580
As Percentage to GDP at Current Market Prices
1990-91 3.30 2.55 1.78 1.45 0.07 -0.01 0.931995-96 2.59 2.25 0.76 0.91 0.00 -0.22 0.722000-01 4.18 4.07 1.76 2.17 -0.05 -0.11 2.632007-08 1.51 1.38 -0.49 -0.37 0.02 -0.27 -0.862008-09 2.41 2.32 0.57 0.77 -0.03 -0.16 -0.232009-10* P 2.88 2.74 1.16 1.25 0.00 0.11 0.472010-11* (RE) P 2.64 2.49 1.03 1.09 0.03 0.32 0.292011-12* (BE) P 2.22 2.03 0.66 0.66 .. -0.18 -0.18
B : Select Budgetary Variables of State Governments (Per cent)
Item 1990-00 2009-10 P 2010-11 P 2011-12 P(Average) (RE) (BE)
1 2 3 4 5
1. GFD / Total Expenditure (excluding recoveries) 22.4 19.0 17.0 14.72. Revenue Deficit / Revenue Expenditure 9.5 3.9 2.3 -1.53. Conventional Deficit / Aggregate Disbursements -0.04 0.01 0.6 -0.54. Revenue Deficit / GFD 36.2 16.4 11.0 -8.35. Non-Developmental Revenue Expenditure / Revenue Receipts 39.8 39.2 37.0 36.36. Interest Payments/Revenue Receipts 16.6 14.7 13.1 12.67. Developmental Expenditure / GDP 10.0 9.7 10.0 9.7
of which :Social Sector Expenditure / GDP 5.7 6.0 6.3 6.1
8. Non-Developmental Expenditure / GDP 4.6 4.7 4.7 4.69. States’ Own Tax Revenue/GDP 5.2 5.5 5.8 6.010. States’ Own Non Tax Revenue / GDP 1.7 1.4 1.3 1.1
RE : Revised Estimates. BE : Budget Estimates. .. : Not Available.P : Provisional data. GFD : Gross Fiscal Deficit.* : Data from 2009-10 onwards pertain to 28 State Governments of which five are Vote on Account.# : Data pertain to State governments having accounts with the Reserve Bank of India.Note : 1. Negative sign (-) indicates surplus in deficit indicators.
2. The net RBI credit to State governments refers to variations in loans and advances given to them by the RBI net of their incremental deposits with the RBI.Source : Budget Documents of the State Governments and the Reserve Bank Records.

186
ANNUAL REPORT
APPENDIX TABLE 17: INDIA’S EXPORTS AND IMPORTS
( US $ million)
Exports of principal commodities
Commodity/Group April-March
2007-08 2008-09 2009-10R 2010-11 P
1 2 3 4 5
I. Primary Products 27,551.9 25,335.4 26,396.5 35,358.7
A. Agricultural & Allied Products 18,432.1 17,534.9 17,734.1 24,696.1B. Ores & Minerals 9,119.8 7,800.5 8,662.5 10,662.6
II. Manufactured Goods 102,978.8 123,148.9 115,180.7 168,098.1
A. Leather & Manufactures 3,502.5 3,556.0 3,361.1 3,789.3B. Chemicals & Related Products 21,193.8 22,708.1 22,908.8 28,979.6C. Engineering Goods 37,365.2 47,285.6 38,271.3 68,784.1D. Textiles & Textile Products 19,425.7 20,016.4 19,853.0 23,312.2E. Gems & Jewellery 19,678.7 27,955.2 28,996.3 40,790.7F. Handicrafts 508.2 301.0 224.8 233.1
III. Petroleum Products 28,363.1 27,547.0 28,192.0 41,918.0
IV. Others 4,010.4 6,768.2 8,982.1 9,027.3
Total Exports (I+II+III+IV) 162,904.2 182,799.5 178,751.4 254,402.1
Imports of principal commodities
I. Bulk Imports 112,744.7 138,791.1 125,315.2 150,489.7
A. Petroleum, Petroleum Products & Related Material 79,644.5 93,671.7 87,135.9 106,068.2B. Bulk Consumption Goods 4,600.3 4,975.3 9,012.7 8,720.3C. Other Bulk Items 28,499.9 40,144.0 29,166.5 35,701.1
II. Non-Bulk Imports 138,694.4 160,042.8 163,057.8 202,085.4
A. Capital Goods 70,110.5 71,833.1 65,865.0 71,627.2B. Mainly Export Related Items 20,768.3 31,930.8 31,270.0 49,639.4C. Others 47,815.7 56,278.9 65,922.8 80,818.7
Total Imports (I+II) 251,439.2 298,833.9 288,372.9 352,575.0
P : Provisional. R : Revised.Source : DGCI & S.

187
APPENDIX TABLES
APPENDIX TABLE 18: INDIA’S OVERALL BALANCE OF PAYMENTS
` crore US $ million
Item 2008-09 2009-10 PR 2010-11 P 2008-09 2009-10 PR 2010-11 P
1 2 3 4 5 6 7
A. CURRENT ACCOUNT
1 Exports, f.o.b. 8,57,960 8,62,333 11,39,517 189,001 182,235 250,4682 Imports, c.i.f. 14,05,412 14,23,079 17,34,545 308,521 300,609 380,9353 Trade Balance -5,47,452 -5,60,746 -5,95,028 -119,520 -118,374 -130,4674 Invisibles, Net 4,19,821 3,80,120 3,92,494 91,605 79,991 86,186
a) ‘Non-Factor’ Services 2,48,406 1,69,843 2,17,058 53,916 35,726 47,664of which :Software Services 2,12,242 2,35,161 2,68,538 46,300 49,705 59,001
b) Income -32,923 -38,000 -67,734 -7,110 -8,040 -14,863c) Private Transfers 2,03,209 2,47,113 2,43,102 44,567 52,055 53,368d) Official Transfers 1,129 1,164 68 232 250 17
5 Current Account Balance -1,27,631 -1,80,626 -2,02,532 -27,915 -38,383 -44,281
B. CAPITAL ACCOUNT
1 Foreign Investment, Net (a+b) 22,685 2,43,641 1,72,154 5,785 51,167 37,434a) Direct Investment 87,734 89,675 32,776 19,816 18,771 7,142
of which :i) In India 1,70,819 1,57,894 1,06,598 37,672 33,124 23,364
Equity 1,25,621 1,09,349 62,970 27,863 22,907 13,792Re-invested Earnings 41,541 41,125 42,937 9,032 8,668 9,424Other Capital 3,657 7,420 691 776 1,549 148
ii) Abroad -83,085 -68,219 -73,822 -17,855 -14,353 -16,222Equity -63,889 -44,331 -34,946 -13,688 -9,314 -7,674Re-invested Earnings -4,986 -5,143 -4,939 -1,084 -1,084 -1,084Other Capital -14,210 -18,745 -33,937 -3,083 -3,955 -7,464
b) Portfolio Investment -65,049 1,53,966 1,39,378 -14,031 32,396 30,292In India -64,200 1,53,885 1,44,679 -13,854 32,376 31,471Abroad -849 81 -5301 -177 20 -1,179
2 External Assistance, Net 11,558 13,612 22,480 2,441 2,893 4,941Disbursements 24,435 27,863 35,868 5,232 5,898 7,881Amortisation 12,877 14,251 13,388 2,791 3,005 2,940
3 Commercial Borrowings, Net 36,530 13,183 54,336 7,862 2,808 11,927Disbursements 70,846 70,371 1,05,152 15,223 14,954 23,089Amortisation 34,316 57,188 50,816 7,361 12,146 11,162
4 Short Term Credit, Net -13,288 34,878 50,177 -1,985 7,558 10,991
5 Banking Capital -19,205 9,844 22,025 -3,246 2,084 4,963of which :NRI Deposits, Net 20,430 14,254 14,822 4,290 2,924 3,239
6 Rupee Debt Service -471 -452 -313 -100 -97 -69
7 Other Capital, Net @ -11,791 -62,574 -47,726 -3,990 -13,016 -10,440
8 Total Capital Account 26,018 2,52,132 2,73,133 6,768 53,397 59,747
C. Errors & Omissions 4,498 -7,269 -11,152 1,067 -1573 -2416
D. Overall Balance [A(5)+B(8)+C] -97,115 64,237 59,449 -20,080 13,441 13,050
E. Monetary Movements (F+G) 97,115 -64,237 -59,449 20,080 -13,441 -13,050
F. IMF, Net 0 0 0 0 0 0
G. Reserves and Monetary Gold (Increase -, Decrease +) 97,115 -64,237 -59,449 20,080 -13,441 -13,050of which : SDR allocation – -24,983 – – -5,160 –
P : Provisional. PR : Partially Revised.@ : Includes delayed export receipts, advance payments against imports, net funds held abroad and advances received pending issue of shares under FDI.Note : 1. Gold and silver brought by returning Indians have been included under imports, with a contra entry in private transfer receipts.
2. Data on exports and imports differ from those given by DGCI&S on account of differences in coverage, valuation and timing.

188
ANNUAL REPORT
APPENDIX TABLE 19: FOREIGN DIRECT INVESTMENT FLOWS TO INDIA:COUNTRY-WISE AND INDUSTRY-WISE
US $ million
Source/Industry 2006-07 2007-08 2008-09 2009-10 P 2010-11 P
1 2 3 4 5 6
Total FDI 9,307 19,425 22,697 22,461 14,939
Country-wise Inflows
Mauritius 3,780 9,518 10,165 9,801 5,616Singapore 582 2,827 3,360 2,218 1,540U.S.A 706 950 1,236 2,212 1,071Cyprus 58 570 1,211 1,623 571Japan 80 457 266 971 1,256Netherlands 559 601 682 804 1,417United Kingdom 1,809 508 690 643 538Germany 116 486 611 602 163UAE 215 226 234 373 188France 100 136 437 283 486Switzerland 57 192 135 96 133Hong Kong 60 106 155 137 209Spain 62 48 363 125 183South Korea 68 86 95 159 136Luxembourg – 15 23 40 248Others 1,055 2,699 3,035 2,376 1,184
Sector-wise Inflows
Manufacture 1,641 3,726 4,777 5,143 4,793Construction 967 2,551 2,237 3,516 1,599Financial Services 1,330 3,850 4,430 2,206 1,353Real Estate Activities 431 1,336 1,886 2,191 444Electricity and other Energy Generation, 174 829 669 1,877 1,338Distribution & TransmissionCommunication Services 423 66 2,067 1,852 1,228Business Services 2,425 1,158 643 1,554 569Miscellaneous Services 298 1,901 1,458 888 509Computer Services 824 1,035 1,647 866 843Restaurants & Hotels 153 280 343 671 218Retail & Wholesale Trade 47 200 294 536 391Mining 42 461 105 268 592Transport 165 816 401 220 344Trading 82 176 400 198 156Education, Research & Development 43 156 243 91 56Others 262 884 1,097 384 506
Note : Includes FDI through SIA/FIPB and RBI routes only.

189
APPENDIX TABLES
APPENDIX TABLE 20: INDIA’S FOREIGN EXCHANGE RESERVES
End of Foreign Exchange Reserves ( `crore) Foreign Exchange Reserves (US $ million) Total MovementMonth SDRs Gold # Foreign Reserve Total SDRs Gold # Foreign Reserve Total Foreign in Foreign
Currency Tranche (2+3+4+5) Currency Tranche (7+8+ 9+10) Exchange ExchangeAssets Position Assets Position Reserves Reserves
in IMF in IMF (in SDR (in SDRmillion) million)*
1 2 3 4 5 6 7 8 9 10 11 12 13
Mar-94 339 12,794 47,287 938 61,358 108 4,078 15,068 299 19,553 13,841 6,595Mar-95 23 13,752 66,005 1,050 80,830 7 4,370 20,809 331 25,517 16,352 2,511Mar-96 280 15,658 58,446 1,063 75,447 82 4,561 17,044 310 21,997 15,054 -1,298Mar-97 7 14,557 80,368 1,046 95,978 2 4,054 22,367 291 26,714 19,272 4,218Mar-98 4 13,394 1,02,507 1,117 1,17,022 1 3,391 25,975 283 29,650 22,200 2,929Mar-99 34 12,559 1,25,412 2,816 1,40,821 8 2,960 29,522 663 33,153 24,413 2,213Mar-00 16 12,973 1,52,924 2,870 1,68,783 4 2,974 35,058 658 38,694 28,728 4,315Mar-01 11 12,711 1,84,482 2,873 2,00,077 2 2,725 39,554 616 42,897 34,034 5,306Mar-02 50 14,868 2,49,118 2,977 2,67,013 10 3,047 51,049 610 54,716 43,876 9,842Mar-03 19 16,785 3,41,476 3,190 3,61,470 4 3,534 71,890 672 76,100 55,394 11,518Mar-04 10 18,216 4,66,215 5,688 4,90,129 2 4,198 107,448 1,311 112,959 76,298 20,904Mar-05 20 19,686 5,93,121 6,289 6,19,116 5 4,500 135,571 1,438 141,514 93,666 17,368Mar-06 12 25,674 6,47,327 3,374 6,76,387 3 5,755 145,108 756 151,622 105,231 11,565Jun-06 2 28,479 7,18,701 3,518 7,50,700 - 6,180 155,968 764 162,912 110,123 4,892Sep-06 6 28,506 7,27,733 3,502 7,59,747 1 6,202 158,340 762 165,305 111,967 6,736Dec-06 4 28,824 7,52,738 2,416 7,83,982 1 6,517 170,187 546 177,251 117,822 12,591Mar-07 8 29,573 8,36,597 2,044 8,68,222 2 6,784 191,924 469 199,179 131,890 26,659Jun-07 6 27,655 8,39,913 1,875 8,69,449 1 6,787 206,114 460 213,362 140,780 8,890Sep-07 8 29,275 9,53,581 1,740 9,84,604 2 7,367 239,955 438 247,762 159,164 27,274Dec-07 13 32,819 10,50,485 1,703 10,85,020 3 8,328 266,553 432 275,316 174,223 42,333Mar-08 74 40,124 11,96,023 1,744 12,37,965 18 10,039 299,230 436 309,723 188,339 56,449Jun-08 48 39,548 12,98,552 2,269 13,40,417 11 9,208 302,340 528 312,087 191,040 2,701Sep-08 17 40,205 13,01,645 2,194 13,44,061 4 8,565 277,300 467 286,336 183,876 -4,463Dec-08 13 41,110 11,94,790 4,248 12,40,161 3 8,485 246,603 877 255,968 166,184 -22,155Mar-09 6 48,793 12,30,066 5,000 12,83,865 1 9,577 241,426 981 251,985 168,544 -19,795Jun-09 2 46,914 12,16,345 5,974 12,69,235 1 9,800 254,093 1,248 265,142 170,814 2,270Sep-09 25,096 49,556 12,70,049 6,557 13,51,258 5,224 10,316 264,373 1,365 281,278 177,533 8,989Dec-09 24,128 85,387 12,07,065 6,655 13,23,235 5,169 18,292 258,583 1,426 283,470 180,820 12,276Mar-10 22,596 81,188 11,49,650 6,231 12,59,665 5,006 17,986 254,685 1,380 279,057 183,803 15,259Jun-10 22,719 92,704 11,63,266 6,118 12,84,807 4,875 19,894 249,628 1,313 275,710 186,429 2,626Sep-10 23,046 92,157 11,91,418 8,953 13,15,574 5,130 20,516 265,231 1,993 292,870 188,197 4,394Dec-10 22,753 1,00,686 12,00,077 8,838 13,32,353 5,078 22,470 267,814 1,972 297,334 193,070 9,267Mar-11 20,401 1,02,572 12,24,883 13,158 13,61,013 4,569 22,972 274,330 2,947 304,818 192,254 8,451
# : Gold has been valued close to international market price.* : Variations over the previous March.Note : 1. Gold holdings include acquisition of gold worth US $ 191million from the Government during 1991-92, US $ 29.4 million during 1992-93, US $ 139.3
million during 1993-94, US $ 315.0 million during 1994-95 and US $ 17.9 million during 1995-96. On the other hand, 1.27 tonnes of gold amountingto Rs. 43.55 crore (US $11.97 million), 38.9 tonnes of gold amounting to Rs. 1,485.22 crore (US $ 376.0 million) and 0.06 tonnes of gold amountingto Rs. 2.13 crore (US $ 0.5 million) were repurchased by the Central Government on November 13, 1997, April 1, 1998 and October 5, 1998respectively for meeting its redemption obligation under the Gold Bond Scheme.
2. Conversion of foreign currency assets into US dollar was done at exchange rates supplied by the IMF up to March 1999. Effective April 1, 1999, theconversion is at New York closing exchange rate.
3. Foreign currency assets excludes US $ 250.00 million (as also its equivalent in Indian Rupee) invested in foreign currency denominated bonds issuedby IIFC (UK) since March 20, 2009.

190
ANNUAL REPORT
APPENDIX TABLE 21: INDIA’S EXTERNAL DEBT(As at end-March)
` crore US $ million
Item 2009 R 2010 PR 2011 P 2009 R 2010 PR 2011 P
1 2 3 4 5 6 7
I. Multilateral 2,01,425 1,93,442 2,16,628 39,538 42,859 48,464A. Government borrowing 1,81,997 1,70,722 1,90,325 35,724 37,825 42,578
i) Concessional 1,27,771 1,16,046 1,20,651 25,080 25,711 26,991ii) Non-concessional 54,226 54,676 69,674 10,644 12,114 15,587
B. Non-Government borrowing 19,428 22,720 26,303 3,814 5,034 5,886i) Concessional 0 0 0 0 0 0ii) Non-concessional 19,428 22,720 26,303 3,814 5,034 5,886
II. Bilateral 104,997 1,01,974 1,15,983 20,610 22,593 25,953A. Government borrowing 74,662 71,584 80,794 14,655 15,860 18,075
i) Concessional 74,662 71,584 80,794 14,655 15,860 18,075ii) Non-concessional 0 0 0 0 0 0
B. Non-Government borrowing 30,335 30,390 35,189 5,955 6,733 7,878i) Concessional 3,262 3,169 4,101 641 702 917ii) Non-concessional 27,073 27,221 31,088 5,314 6,031 6,961
III. International Monetary Fund 5,188 27,264 28,163 1,018 6,041 6,308IV. Trade Credit 73,772 76,128 83,167 14,481 16,867 18,627
i) Buyers’ credit 64,046 66,965 73,328 12,572 14,837 16,425ii) Suppliers’ credit 3,234 2,938 2,814 635 651 630iii) Export credit component of bilateral credit 6,492 6,225 7,026 1,274 1,379 1,572iv) Export credit for defence purposes 0 0 0 0 0
V. Commercial Borrowings 3,18,209 3,19,556 3,94,070 62,461 70,800 88,267i) Commercial bank loans 2,19,925 2,02,618 2,59,095 43,169 44,891 58,034ii) Securitized borrowings (including FCCBs) $ 91,286 113,245 1,31,708 17,918 25,090 29,501iii) Loans/securitised borrowings, etc. 6,998 3,693 3,267 1,374 818 731iv) Self Liquidating Loans 0 0 0 0 0 0
VI. NRI & FC(B&O) Deposits (above one-year maturity) 2,10,118 2,17,062 2,30,813 41,554 47,890 51,682i) FCNR(B) 66,803 64,625 69,658 13,211 14,258 15,597ii) NR(E)RA 1,19,181 1,18,984 1,17,802 23,570 26,251 26,378iii) NRO 24,134 33,453 43,352 4,773 7,381 9,707
VII. Rupee Debt * 7,760 7,481 7,147 1,523 1,657 1,601i) Defence 6,935 6,710 6,416 1,361 1,486 1,437ii) Civilian + 825 771 731 162 171 164
VIII. Total Long-term Debt (I to VII) 9,21,469 9,42,908 10,75,970 181,185 208,707 240,902IX. Short-term Debt 2,20,656 2,36,188 2,90,147 43,313 52,329 64,990
i) Trade Related Credits 2,03,345 2,14,267 2,61,006 39,915 47,473 58,462ii) FII Investment in Govt. T-Bills & other instruments 10,522 15,153 24,214 2,065 3,357 5,424iii) Investment in Treasury Bills by foreign central 534 467 225 105 103 50
banks and international institutions etc.iv) External Debt Liabilities of
Central Bank and Commercial Banks 6,255 6,301 4,703 1,228 1,396 1,053
X. GROSS TOTAL 11,42,125 11,79,096 13,66,117 224,498 261,036 305,892
Concessional Debt 2,13,577 1,98,280 2,12,693 41,981 43,930 47,585As percentage of Total Debt 18.7 16.8 15.6 18.7 16.8 15.6
Short Term DebtAs percentage of Total Debt 19.3 20.0 21.2 19.3 20.0 21.2
Memo Items:
Debt Indicators :1. Debt Stock - GDP Ratio (in per cent) 20.5 18.0 17.3 20.5 18.0 17.32. Debt Service Ratio (per cent) (for fiscal year) 4.4 5.5 4.2 4.4 5.5 4.2
(including debt-servicing on non-civilian credits)
P : Provisional. R : Revised. PR : Partially Revised.$ : Includes net investment by 100 per cent FII debt funds.* : Debt owed to Russia denominated in Rupees and converted at current exchange rates, payable in exports.+ : Includes Rupee suppliers’ credit from end-March 1990 onwards.Note : Multilateral loans do not include revaluation of IBRD pooled loans and exchange rate adjustment under IDA loans for Pre-1971 credits.