Embed Size (px)
Citation preview
EQU
ITY
RESE
ARC
H RBC Dominion Securities Inc.Drew McReynolds, CFA,CA (Analyst)(416) [email protected] Lau (Associate)(416) [email protected]
Haran Posner (Analyst)(416) [email protected]
August 19, 2015
RBC Telecom Scenario ReportFibre-to-the-home: Playing the long gameIntroductionIn this report, we: (i) discuss why fibre-to-the-home (FTTH) matters forinvestors; (ii) identify the key factors that impact returns on FTTH; (iii)calculate the discounted payback period on FTTH; (iv) estimate the “blue-sky” cost of future FTTH for the telcos; and (v) show the valuation andROIC sensitivity to various FTTH scenarios.
Key takeaways• FTTH is a delta that will impact returns for investors. Over the
next decade, we believe FTTH will play an increasingly important rolein determining returns for investors given: (i) FTTH is a “leap-frog”technology; (ii) the Internet is changing the “own-the-home” game; (iii)the positive IPTV flow-through impact for the telcos will wane; (iv) a2017-2019 OTT inflection period and Telecom Big Bang could pressuretelco FTTN; (v) accelerated FTTH deployment will have meaningfulfinancial and strategic implications for all operators; and (vi) theseimplications could be a potential catalyst for sector consolidation.
• A long payback period under most scenarios. We calculate a discountedpayback period (DPP) of 11 years on an aerial build. Under our betterand bad cases, the payback period extends from 8 to 18 years. Takingour better case and assuming a 100% buried build, the DPP increasesfrom 8 years to 13 years highlighting the need for operators to expandthe aerial footprint where possible.
• “Blue-sky” cost of FTTH is not insignificant. Factoring in basicassumptions on FTTH coverage (75% of total footprint), subscriberpenetration (50% of FTTH footprint) and the percentage of aerial versusburied deployment in each footprint, we estimate the “blue-sky” futurecost of FTTH deployment and loading could be $9B for BCE, $5B forTELUS and $500MM Manitoba Telecom.
• Manageable valuation risk provided capex intensity remains stable.Under our stable capex intensity scenario, the valuation upside underour favourable revenue and margin outcome is reasonably balancedversus the downside under our unfavourable outcome (+19% versus -9%on average). Under our elevated capex intensity scenario, the downsideunder our unfavourable outcome heavily outweighs the upside underour favourable outcome (-27% versus +2% on average).
• For the moment, FTTH is neutral to our sector investment thesis. Givenmanageable valuation risk under our stable capex intensity scenario,FTTH is neutral to our sector investment thesis. This view is predicatedon BCE and TELUS maintaining stable capex intensity. While the mostlikely scenario in the near-term, over the medium-term, we see anincreased risk of elevated capex intensity, particularly should our OTTinflection period and Telecom Big Bang play out. Should the telcosenter a phase of elevated capex intensity, we will have to weigh theincremental growth opportunity but negative FCF impact against thelower capex risk profile and what should be competitive all-IP platformsof the cablecos.
Priced as of prior trading day's market close, EST (unless otherwise noted).All values in CAD unless otherwise noted.
For Required Non-U.S. Analyst and Conflicts Disclosures, see page 33.
Table of Contents Fibre-to-the-home: Playing the long game ........................................................................... 3
Big picture: Why FTTH matters now ..................................................................................... 5
FTTH economics 101 ........................................................................................................... 10
The Bell Aliant FTTH experience ......................................................................................... 15
Aerial FTTH discounted payback period .............................................................................. 19
The FTTH footprint in Canada ............................................................................................. 22
Valuation and ROIC sensitivity to FTTH scenarios ............................................................... 25
Summary of key operating and financial metrics ................................................................ 28
Comparable valuations ....................................................................................................... 29
Appendix A: Summary of select FTTH offerings .................................................................. 30
Previous RBC Telecom Scenario Reports............................................................................. 31
Companies mentioned ....................................................................................................... 32
RBC Telecom Scenario Report
August 19, 2015 2
Fibre-to-the-home: Playing the long game The purpose of the RBC Telecom Scenario Report series is to examine potential scenarios within the Canadian telecom sector that could have implications for investors. As scenarios consider a range of outcomes with uncertain probabilities, our primary objective is to provide additional qualitative and quantitative analysis that can bring incremental perspective to investors.
In this report, we: (i) discuss why fibre-to-the-home (FTTH) matters for investors; (ii) identify the key factors that impact returns on FTTH; (iii) calculate the discounted payback period on FTTH; (iv) estimate the “blue-sky” cost of future FTTH for the telcos; and (v) show the valuation and ROIC sensitivity to various FTTH scenarios.
Key takeaways FTTH is a delta that will impact returns for investors. Over the next decade, we believe FTTH will play an increasingly important role in determining returns for investors in the Canadian telecom sector given: (i) FTTH is a “leap-frog” technology and potentially one of the last in Canadian telecom; (ii) the Internet is increasingly changing the “own-the-home” game; (iii) the positive IPTV flow-through impact for the telcos will wane, potentially putting telco FTTN at a disadvantage to the cablecos; (iv) a 2017-2019 OTT inflection period and Telecom Big Bang could pressure telco FTTN; (v) accelerated FTTH deployment will have meaningful financial and strategic implications for all operators; and (vi) these implications could be a potential catalyst for sector consolidation.
Onus is on the operators to find the most “economically optimal path forward”. We believe the deployment of FTTH is the only realistic option for BCE and TELUS given the role each operator plays in ensuring Canada has a modern telecom infrastructure and given current telecom policy in Canada, which leans heavily on having more than one competitive facilities-based operator in any one market. With the discussion moving beyond “if” to “how”, we believe the onus is on each operator to find the most “economically optimal path forward” in order to maximize returns for investors.
A long payback period under most scenarios. Using the Bell Aliant cost experience (base case), we calculate a discounted payback period (DPP) of 11 years on an aerial build. Under our better and bad cases, the payback period extends from 8 to 18 years. Taking our better case and assuming a 100% buried build, the DPP increases from 8 years to 13 years highlighting the need for operators to expand the aerial footprint where possible.
Revenue uncertainty is the key return risk on FTTH, in our view. While near-term churn and ARPU benefits along with the potential for substantial longer-term cost savings are supportive of FTTH returns, we believe revenue uncertainty with respect to telephony and television substitution, wireline Internet substitution and Internet pricing power, is the key return risk.
“Blue-sky” cost of FTTH is not insignificant. Factoring in basic assumptions on FTTH coverage (75% of total footprint), subscriber penetration (50% of FTTH footprint) and the percentage of aerial versus buried deployment in each footprint, we estimate the “blue-sky” future cost of FTTH deployment and loading could be $9B for BCE, $5B for TELUS and $500MM Manitoba Telecom. These “blue-sky” estimates factor in average aerial and buried deployment costs of $600/premise and $1,750/premise, respectively, and an average cost per load of $900/premise.
RBC Telecom Scenario Report
August 19, 2015 3
Manageable valuation risk provided capex intensity remains stable. To understand how FTTH could impact the telco stocks, we examined the valuation and ROIC impact to various FTTH scenarios for each telco. Given the many approaches that can be taken to assess the FTTH impact, our approach is intended to address two important questions for investors: (i) if the telcos are successful in deploying FTTH at current capex intensity levels, what is the valuation and ROIC sensitivity to both favourable and unfavourable revenue and margin outcomes? (ii) if the telcos are not successful in deploying FTTH at current capex intensity levels but rather require an increase in capex intensity, what is the valuation sensitivity under this capex scenario to both favourable and unfavourable revenue and margin outcomes?
Under the stable capex intensity scenario: (i) the valuation upside under the favourable revenue and margin outcome is reasonably balanced compared to the downside under the unfavourable outcome (+19% versus -9% on average); and (ii) the differential in average ROIC between favourable and unfavourable outcomes is approximately 200bps-300bps. Under the elevated capex intensity scenario: (i) the downside under the unfavourable revenue and margin outcome heavily outweighs the upside under the favourable outcome (-27% versus +2% on average); and (ii) the differential in average ROIC between favourable and unfavourable outcomes is approximately 200bps-300bps. The differential in average ROIC between the stable capex intensity and elevated capex intensity scenarios is approximately 100bps.
Cost savings will be key to mitigating revenue weakness. We believe the outlook for traditional wireline revenue for the industry will increasingly be challenged. Wireline revenue weakness should have a manageable valuation impact provided wireline margins hold, if not improve, due to network efficiencies and mix. Should operators be able to generate substantial cost savings from FTTH (i.e., operating cost efficiencies, copper de-commissioning, economics of scope), the valuation and ROIC impact of wireline revenue weakness on FTTH returns should also be manageable. However, should the public market have a bias towards revenue growth as a key valuation driver of wireline multiples, and/or should a mismatch in the timing of wireline revenue pressure and cost savings result in temporary wireline margin pressure, valuation risk will increase.
For the moment, FTTH is neutral to our sector investment thesis Given manageable valuation risk under our stable capex intensity scenario, accelerated FTTH deployment by BCE and TELUS is neutral to our sector investment thesis. This view is predicated on the ability for BCE and TELUS to maintain stable capex intensity. While largely consistent with current guidance from each company, we do believe stable capex intensity is the most likely scenario in the near-term. Over the medium-term, however, we see an increased risk of elevated capex intensity, particularly should our OTT inflection period and Telecom Big Bang play out. Should the telcos enter a phase of elevated capex intensity, we will have to weigh the incremental growth opportunity but negative FCF impact against the lower capex risk profile and what should be competitive all-IP platforms of the cablecos.
RBC Telecom Scenario Report
August 19, 2015 4
Big picture: Why FTTH matters now FTTH has been on the radar screens of telecom investors since Verizon’s FTTH deployment beginning in 2004 and Bell Aliant’s accelerated FTTH deployment from 2009 through 2014. For investors, we believe FTTH opens up both investment opportunities and risks. Over the next decade, we believe FTTH will play an increasingly important role in determining returns for investors in the Canadian telecom sector, for the following reasons:
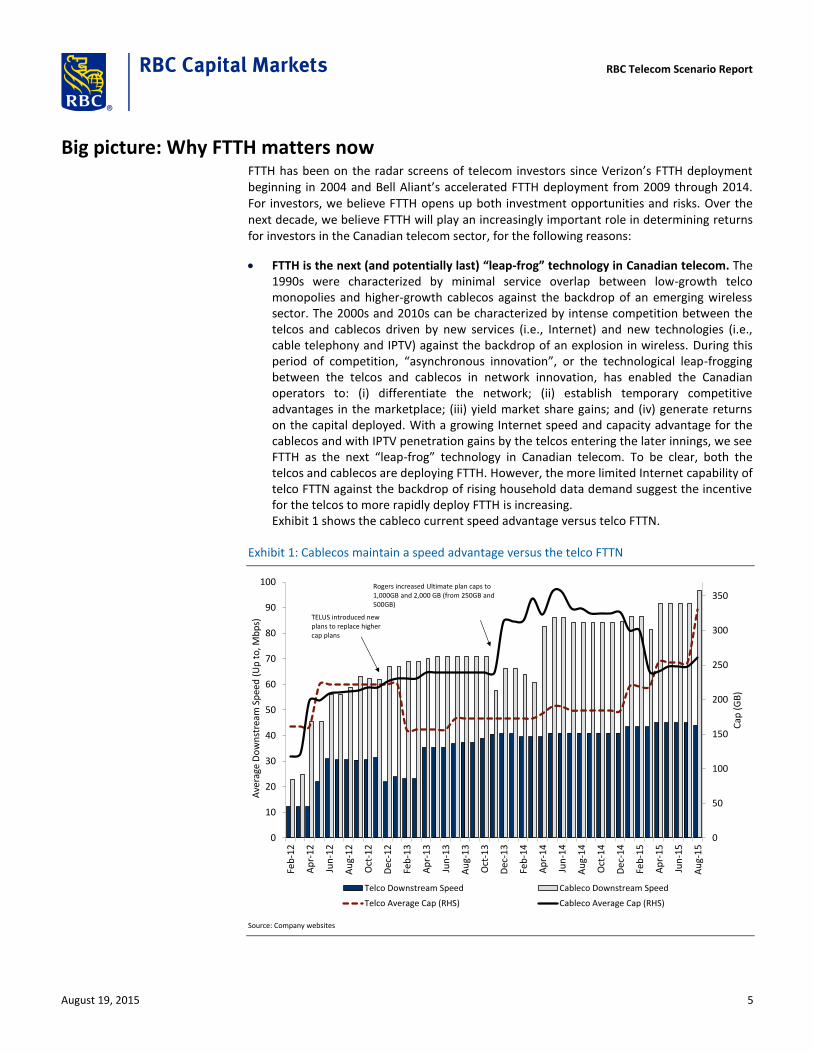
FTTH is the next (and potentially last) “leap-frog” technology in Canadian telecom. The 1990s were characterized by minimal service overlap between low-growth telco monopolies and higher-growth cablecos against the backdrop of an emerging wireless sector. The 2000s and 2010s can be characterized by intense competition between the telcos and cablecos driven by new services (i.e., Internet) and new technologies (i.e., cable telephony and IPTV) against the backdrop of an explosion in wireless. During this period of competition, “asynchronous innovation”, or the technological leap-frogging between the telcos and cablecos in network innovation, has enabled the Canadian operators to: (i) differentiate the network; (ii) establish temporary competitive advantages in the marketplace; (iii) yield market share gains; and (iv) generate returns on the capital deployed. With a growing Internet speed and capacity advantage for the cablecos and with IPTV penetration gains by the telcos entering the later innings, we see FTTH as the next “leap-frog” technology in Canadian telecom. To be clear, both the telcos and cablecos are deploying FTTH. However, the more limited Internet capability of telco FTTN against the backdrop of rising household data demand suggest the incentive for the telcos to more rapidly deploy FTTH is increasing. Exhibit 1 shows the cableco current speed advantage versus telco FTTN.
Exhibit 1: Cablecos maintain a speed advantage versus the telco FTTN
0
50
100
150
200
250
300
350
0
10
20
30
40
50
60
70
80
90
100
Feb
-12
Ap
r-1
2
Jun
-12
Au
g-1
2
Oct
-12
Dec
-12
Feb
-13
Ap
r-1
3
Jun
-13
Au
g-1
3
Oct
-13
Dec
-13
Feb
-14
Ap
r-1
4
Jun
-14
Au
g-1
4
Oct
-14
Dec
-14
Feb
-15
Ap
r-1
5
Jun
-15
Au
g-1
5
Cap
(G
B)
Ave
rage
Do
wn
stre
am S
pee
d (
Up
to
, Mb
ps)
Telco Downstream Speed Cableco Downstream Speed
Telco Average Cap (RHS) Cableco Average Cap (RHS)
Rogers increased Ultimate plan caps to 1,000GB and 2,000 GB (from 250GB and 500GB)
TELUS introduced new plans to replace higher cap plans
Source: Company websites
RBC Telecom Scenario Report
August 19, 2015 5
Internet is changing the “own the home” game. Since network innovation has enabled both telcos and cablecos to offer voice, video and data services, the primary goal for all telecom operators has been to own the home by bundling telephony, television and Internet. Although the cablecos took an early lead in offering the triple play, the telcos are successfully clawing back share by leveraging a superior IPTV product to gain new Internet toeholds. While owning the home remains a strategic priority for both telcos and cablecos, we believe the game to own the home is changing in three ways: (i) the Internet now carries disproportionately greater importance within the bundle as telephony and television substitution accelerate; (ii) new IP-based in-home services are emerging, such as home security and smart home monitoring; and (iii) household demand for seamless in-home/out-of-home IP connectivity is increasing. As a result, a competitive Internet offering will be critical to maintaining residential market share, anchoring new growth opportunities and achieving seamless in-home/out-of-home IP connectivity.
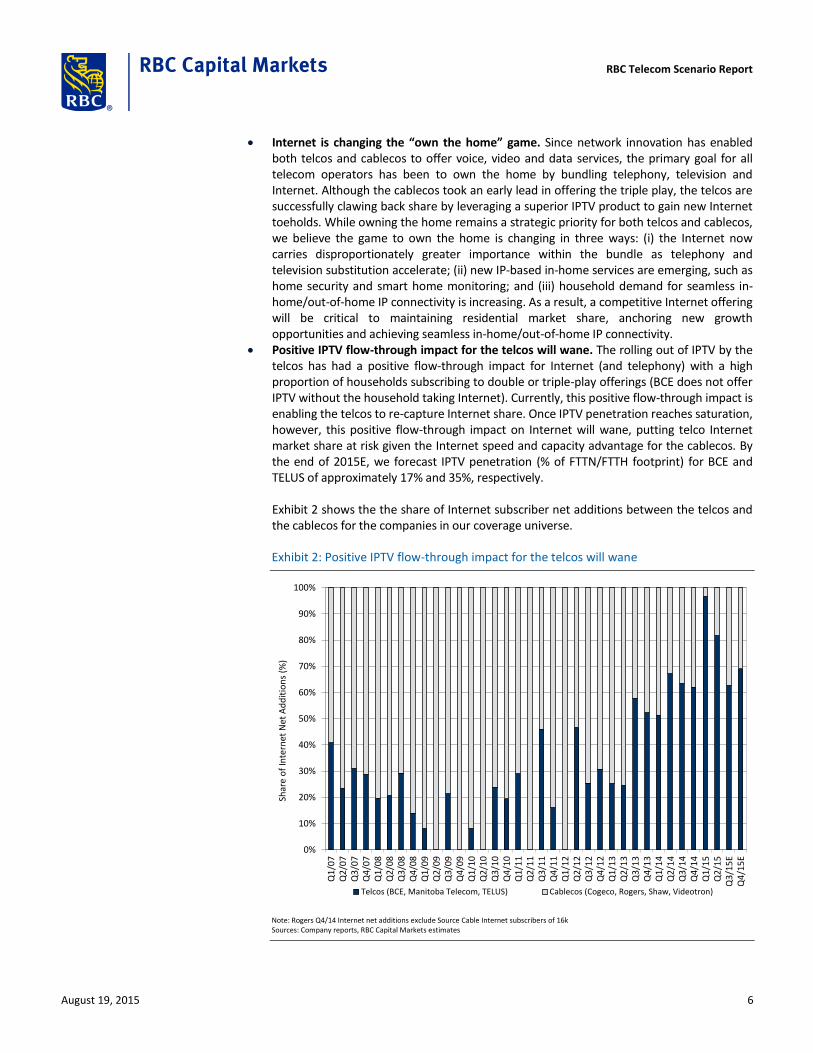
Positive IPTV flow-through impact for the telcos will wane. The rolling out of IPTV by the telcos has had a positive flow-through impact for Internet (and telephony) with a high proportion of households subscribing to double or triple-play offerings (BCE does not offer IPTV without the household taking Internet). Currently, this positive flow-through impact is enabling the telcos to re-capture Internet share. Once IPTV penetration reaches saturation, however, this positive flow-through impact on Internet will wane, putting telco Internet market share at risk given the Internet speed and capacity advantage for the cablecos. By the end of 2015E, we forecast IPTV penetration (% of FTTN/FTTH footprint) for BCE and TELUS of approximately 17% and 35%, respectively. Exhibit 2 shows the the share of Internet subscriber net additions between the telcos and the cablecos for the companies in our coverage universe.
Exhibit 2: Positive IPTV flow-through impact for the telcos will wane
0%
10%
20%
30%
40%
50%
60%
70%
80%
90%
100%
Q1
/07
Q2
/07
Q3
/07
Q4
/07
Q1
/08
Q2
/08
Q3
/08
Q4
/08
Q1
/09
Q2
/09
Q3
/09
Q4
/09
Q1
/10
Q2
/10
Q3
/10
Q4
/10
Q1
/11
Q2
/11
Q3
/11
Q4
/11
Q1
/12
Q2
/12
Q3
/12
Q4
/12
Q1
/13
Q2
/13
Q3
/13
Q4
/13
Q1
/14
Q2
/14
Q3
/14
Q4
/14
Q1
/15
Q2
/15
Q3
/15
EQ
4/1
5E
Shar
e o
f In
tern
et N
et A
dd
itio
ns
(%)
Telcos (BCE, Manitoba Telecom, TELUS) Cablecos (Cogeco, Rogers, Shaw, Videotron)
Note: Rogers Q4/14 Internet net additions exclude Source Cable Internet subscribers of 16k Sources: Company reports, RBC Capital Markets estimates
RBC Telecom Scenario Report
August 19, 2015 6
An OTT inflection period and Telecom Big Bang could pressure telco FTTN. In 2006, we identified a potential 2012-2015 broadcasting inflection period whereby the broadcasting business model in Canada would come under greater pressure. This inflection period is playing out. In 2011, we identified a potential 2017–2019 OTT inflection period whereby OTT services could become a more viable substitute for the current television system in Canada. This inflection period represents the collision of three important inflection points: (i) sufficient OTT buying power for premium television programming; (ii) a critical mass of Internet-enabled television households; and (iii) affordable and sufficient broadband speed to support OTT video consumption. In our view, the outcome of this inflection period will be accelerated OTT adoption and thus accelerated television substitution via cord-shaving or cord-cutting. Interestingly, our 2017-2019 OTT inflection period will coincide with full LTE deployment and high LTE penetration, the transition to all-IP for the cablecos, increased wireline-wireless network integration and a new unbundled television framework in Canada. Furthermore, Gartner forecasts that over 30% of all TVs manufactured in 2018 will be 4k with 4k streaming requiring a minimum download speed of 20 Mbps. Although these developments do not change the timing of our OTT inflection period, the likelihood that the rate at which video is unlocked from the current television ecosystem resembles more of a “big bang”, rather than an evolution, is rising. A big bang in OTT video would undoubtedly test the capacity of last-mile wireline networks in Canada. While higher Internet prices could help restore major supply-demand imbalances, the cableco speed advantage versus telco FTTN would likely be exploited putting the telcos at a structural disadvantage in the absence of FTTH.
Exhibit 3 shows how our 2012-2015 broadcasting inflection period and our 2017–2019 OTT inflection period line up with our Telecom Big Bang.
RBC Telecom Scenario Report
August 19, 2015 7
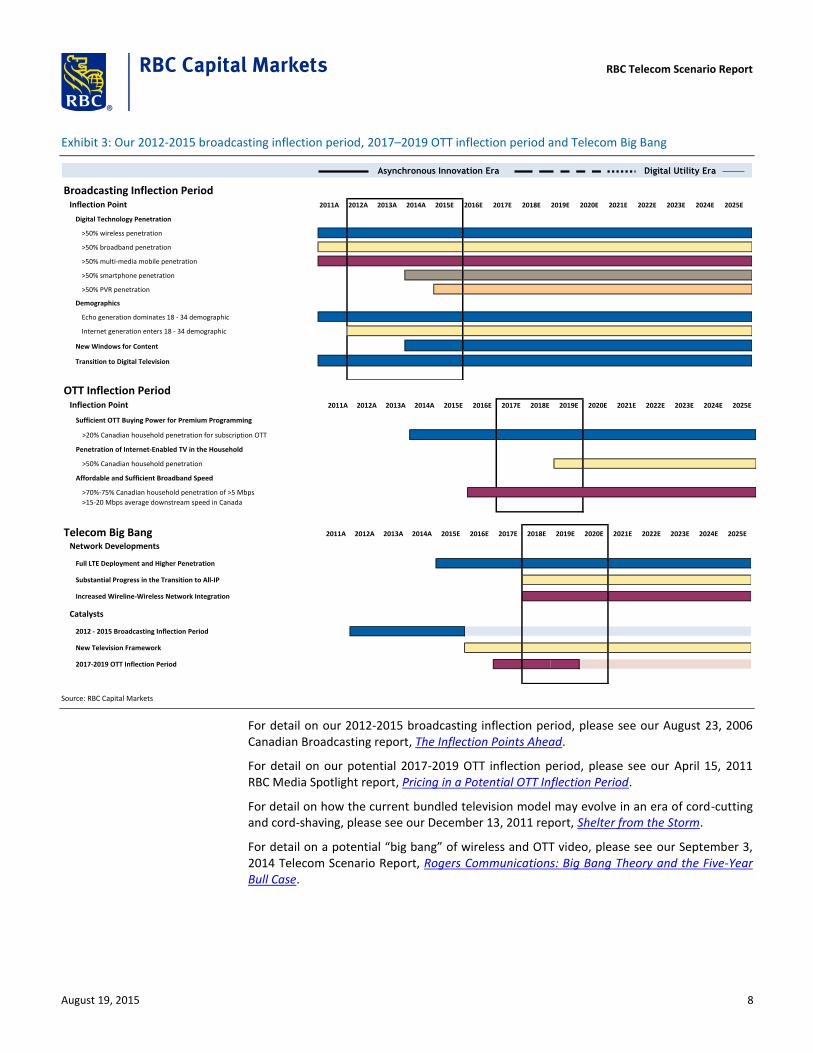
Exhibit 3: Our 2012-2015 broadcasting inflection period, 2017–2019 OTT inflection period and Telecom Big Bang
Asynchronous Innovation Era Digital Utility Era
Broadcasting Inflection PeriodInflection Point 2011A 2012A 2013A 2014A 2015E 2016E 2017E 2018E 2019E 2020E 2021E 2022E 2023E 2024E 2025E
Digital Technology Penetration
>50% wireless penetration
>50% broadband penetration
>50% multi-media mobile penetration
>50% smartphone penetration
>50% PVR penetration
Demographics
Echo generation dominates 18 - 34 demographic
Internet generation enters 18 - 34 demographic
New Windows for Content
Transition to Digital Television
OTT Inflection PeriodInflection Point 2011A 2012A 2013A 2014A 2015E 2016E 2017E 2018E 2019E 2020E 2021E 2022E 2023E 2024E 2025E
Sufficient OTT Buying Power for Premium Programming
>20% Canadian household penetration for subscription OTT
Penetration of Internet-Enabled TV in the Household
>50% Canadian household penetration
Affordable and Sufficient Broadband Speed
>70%-75% Canadian household penetration of >5 Mbps
>15-20 Mbps average downstream speed in Canada
Telecom Big Bang 2011A 2012A 2013A 2014A 2015E 2016E 2017E 2018E 2019E 2020E 2021E 2022E 2023E 2024E 2025E
Network Developments
Full LTE Deployment and Higher Penetration
Substantial Progress in the Transition to All-IP
Increased Wireline-Wireless Network Integration
Catalysts
2012 - 2015 Broadcasting Inflection Period
New Television Framework
2017-2019 OTT Inflection Period
Source: RBC Capital Markets
For detail on our 2012-2015 broadcasting inflection period, please see our August 23, 2006 Canadian Broadcasting report, The Inflection Points Ahead.
For detail on our potential 2017-2019 OTT inflection period, please see our April 15, 2011 RBC Media Spotlight report, Pricing in a Potential OTT Inflection Period.
For detail on how the current bundled television model may evolve in an era of cord-cutting and cord-shaving, please see our December 13, 2011 report, Shelter from the Storm.
For detail on a potential “big bang” of wireless and OTT video, please see our September 3, 2014 Telecom Scenario Report, Rogers Communications: Big Bang Theory and the Five-Year Bull Case.
RBC Telecom Scenario Report
August 19, 2015 8
Accelerated FTTH deployment will have meaningful financial and strategic implications for all operators. Up until 2015, FTTH deployment in Canada was largely limited to multi-dwelling units (i.e., condos, apartments), new housing developments and select overbuild locations on a tactical/experimental basis, with two exceptions: (i) Bell’s deployment of FTTH in Quebec City, which was completed in 2013; and (ii) Bell Aliant’s accelerated FTTH deployment in Atlantic Canada and rural Ontario between 2009 and 2014. In early 2015, BCE formally announced a shift from FTTN to FTTH deployment with “virtually all” incremental fibre investment being FTTH. While not as publicly committed to FTTH as BCE is at the moment, TELUS too acknowledged that the scale of the company’s FTTH deployment is increasing as was evidenced by the June announcement to commit to invest $1B in Edmonton over the next six years to cover 90% of homes and businesses with fibre. Accelerated FTTH deployment will have meaningful financial and strategic implications for all operators. Financially, the upfront cost of rolling out FTTH and subscriber loading is significant by almost any measure, and any unforeseen increase in capex and commensurate decrease in FCF, would likely depress telecom valuations. Strategically, the playing field could tilt in favour of FTTH where deployed, raising the risk of competitive imbalances in the market and irrational competitive responses, not unlike the initial $99/month competitive response to FTTH from Rogers in Newfoundland and New Brunswick in 2013. In addition, a too rapid a share shift to FTTH could trigger accelerated FTTH deployment (and/or DOCSIS 3.1 deployment) by the cablecos, raising the overall capital intensity for the industry and depressing telecom valuations. On the other side of the spectrum, delaying FTTH too long increases the risk of the telcos being caught off-guard by rising household data demand, or could open up the door for overbuilds by deeper-pocketed new entrants, such as Google. Given these financial and strategic implications, the ability for BCE and TELUS to deploy FTTH at a measured pace will be critical to minimizing any financial or strategic disruption.
A potential catalyst for sector consolidation. The deployment of FTTH in Canada will require significant investment over the next decade. Equally important, generating adequate returns on the capital deployed will require the combination of new revenue streams and continuous cost-efficiencies. In our view, this FTTH roadmap will favour scale operators with the financial capability to absorb the significant investment required. Against this backdrop: (i) sub-scale regional operators, such as Cogeco Cable, Manitoba Telecom and Quebecor could come under increased financial pressure potentially succumbing to the larger consolidators; and (ii) substantial cost savings under a Rogers – Shaw or BCE – TELUS wireline combination could be increasingly seen as an effective way to increase scale, generate cost savings to finance FTTH deployment and/or preserve wireline economics should wireline revenue pressure accelerate.
RBC Telecom Scenario Report
August 19, 2015 9
FTTH economics 101 Moving beyond “if” to “how” With a long payback on FTTH, many investors are questioning whether accelerating the deployment of fibre is the optimal use of excess capital for the telcos. Why not cede Internet victory to the cablecos in certain markets and ultimately exit residential wireline in these markets altogether? Arguably, FTTH will be the most costly “future proofing” of the telecom business in the history of the industry. Furthermore, where television and Internet market share and penetration gains helped finance and justify heavy investments in DSL/FTTN, what remains unclear is exactly what new services will help finance and justify the heavy investments in FTTH, particularly given rising telephony and television substitution.
Having said this, in our view, the deployment of FTTH is the only realistic option for BCE and TELUS given: (i) the size of BCE and TELUS and the role each company plays in ensuring Canada has a modern telecom infrastructure; and (ii) telecom policy, which leans heavily on having more than one competitive facilities-based operator in any one market. Therefore, we believe the FTTH debate should move beyond “if” to “how”. Importantly for investors, how can the returns on FTTH be maximized, and how could FTTH impact the stocks?
Factors that could impact returns on FTTH There are a number of factors that could impact returns on FTTH. For incumbent operators proceeding with FTTH, we believe the onus is on each operator to find the most “economically optimal path forward” in order to maximize returns for investors. The optimal path is likely to be different for each operator based on several revenue, cost, timing, regulatory and other considerations. Fortunately, FTTH can be deployed on a modular basis providing incumbent operators with some flexibility to modify deployment plans as conditions dictate.
Revenue considerations
Multiple revenue streams. The ability to amortize the cost of FTTH across multiple revenue streams will be a key determinant of the type of returns generated on FTTH. Multiple revenue streams can include traditional triple-play households (telephony, television, Internet), new services such as home monitoring and smart home applications, businesses within traditional residential footprints and new verticals such as healthcare and education.
Rate of customer up-sell. With FTTH, operators will look to up-sell households to higher-tiered packages helping to boost household ARPU. Early experience with FTTH by Verizon and Bell Aliant suggests a promising up-sell from the majority of FTTH customers. Adding to the appeal of FTTH is the symmetrical speed offered for both upload and download.
Lower customer churn. Improved customer satisfaction among FTTH households can significantly lower churn, helping to improve the returns generated on FTTH. Early experience with FTTH by Verizon and Bell Aliant point to a notable churn reduction.
Rate of telephony and television substitution. Among traditional triple-play households, steady telephony substitution and an expected increase in television substitution will reduce attach rates and could put downward pressure on traditional residential revenue. Offsetting this potential revenue drag for under-penetrated telcos should be continued IPTV market share gains.
RBC Telecom Scenario Report
August 19, 2015 10
Wireline Internet substitution. Potential wireline Internet substitution with 5G wireless networks that are capable of delivering theoretical speeds of 1 Gbps could negatively impact FTTH returns. Despite this eventual risk, the commercial deployment of 5G wireless networks are not expected to begin until 2020 at the earliest, suggesting the rate of wireline Internet substitution will remain relatively benign over the next decade.
Internet pricing power. A key determinant of the type of returns generated on FTTH will be the ability for telecom operators to increase Internet revenue by deploying a “more for more” Internet pricing strategy to offset telephony and television substitution. Internet pricing power will in part depend on the extent to which the tariffs around mandated wholesale Internet access to FTTH remain balanced.
Competitive response. A key determinant of the type of returns generated on FTTH will also be the competitive response by the cablecos, including: (i) the timing around the upgrade to DOCSIS 3.1 which too can deliver 1 Gbps speeds (Comcast is expected to be the first major North American U.S. cableco to deploy DOCSIS 3.1 in late 2015/early 2016 with field testing now underway); (ii) the all-IP transition; (iii) the rate/nature of cableco FTTH builds; and (iv) the pricing environment. While the initial $99/month competitive response to FTTH from Rogers in Newfoundland and New Brunswick is disconcerting, we would expect both BCE and TELUS to remain relatively disciplined on FTTH pricing with the cablecos largely following suit in the majority of footprints.
Cost considerations
Aerial versus buried FTTH. The ability to deploy FTTH using aerial infrastructure will be a key determinant of the type of returns generated on FTTH. Aerial FTTH can be up to 80% cheaper to deploy than buried FTTH (i.e., approximately $400-$700/premise for aerial FTTH deployment versus approximately $1,500-$2,000/premise for buried). In some instances, aerial footprints have some buried components which will increase the cost. To minimize the cost of FTTH, we expect each operator to aggressively explore all available infrastructure and installation options in order to maximize aerial deployment within the targeted total FTTH footprint. In addition to stringing fibre along traditional telephone and utility poles, innovative infrastructure options include sewer, water and gas pipes. Innovative installation options include the use of duct sharing, fibre blowers, bendable fibre, push-able fibre, new splicing techniques, cable de-coring, field boundaries and self-connection. From a topographical standpoint, FTTH deployment is often more complicated to deploy in hilly or mountainous terrain increasing the cost.
Realizing economies of scope on FTTH. Over the next decade, we expect wireline and wireless networks to become increasingly integrated driven by: (i) rising demand for data-heavy, seamless in-home and out-of-home services; and (ii) a potentially greater reliance by operators on network efficiency to maintain profitability/EBITDA should wireline revenue come under pressure. From a consumer perspective, a more homogenous wireline-wireless network infrastructure would be capable of delivering unified communications of new converged voice, data, and video services, such as advanced TV Everywhere and other video offerings, WiFi-carrier integration and location-agnostic content and services. From an operator perspective, a FTTH network can: (i) can support multiple services as well as new services; (ii) provide better support for wireless backhaul, which will be an increasingly important component of the wireless network, particularly as wireless data speeds increase with LTE Advanced/5G; (iii) facilitate the integration of a small-cell network (i.e., micro, pico, WiFi, indoor) with a traditional macro network, which can lower the effective cost of FTTH by allocating a portion of the deployment cost to
RBC Telecom Scenario Report
August 19, 2015 11
wireless; (iii) serve both the consumer and business markets; and (iv) meet the demand as major verticals transition to digital, such as healthcare and education. More broadly, wireline-wireless network integration can realize cost savings from a uniform network operating centre, uniform network management, more efficient network expansion and densification, and the creation of a single content depository.
Leveraging the existing FTTN network. The Canadian telcos have invested significantly in FTTN in recent years. Some of this investment can be used to support FTTH helping to lower the cost of FTTH deployment. In terms of overall economics, however, the incremental reduction in cost arising from a FTTH overbuild in a FTTN territory must be weighed against the revenue impact of cannibalizing existing FTTN subscribers (versus gaining entirely new subscribers with FTTH in non-FTTN territories).
Population density. Population density by neighbourhood will be a key determinant of the type of returns generated on FTTH. The ability to amortize the relatively fixed cost of FTTH deployment in any given area over a higher number of premises naturally lowers the cost per premise and should improve returns (all else being equal). For less dense rural areas, FTTH is unlikely to payout and thus telecom operators are better off deploying wireless technologies, such as satellite, fixed-wireless and/or LTE/5G wireless in these areas of the total footprint.
FTTH-driven operating cost efficiencies. The improved reliability of FTTH versus copper significantly reduces operating costs driven by: (i) a reduction in the volume of incoming customer calls and truck rolls, which represents the majority of variable costs for an operator (most fiber issues can be rectified at the central office); and (ii) lower network maintenance, in effect lowering or replacing the high cost of copper grooming. Currently, the average annual maintenance cost savings of FTTH is up to $100/home (US$110/home for Verizon). In addition, FTTH significantly reduces the cost per bit between the premise and network driven by new technologies, such as XGPON and WDM PON. In addition, the cost per bit is not linear in that as speed increases, the cost savings on a per bit basis increase at a higher rate.
Copper de-commissioning. Copper de-commissioning represents a considerable cost-savings opportunity for the telcos as the network duplication resulting from the FTTH overbuild is eliminated. Copper de-commissioning is unlikely to occur until FTTH has penetrated approximately 80% of the central office footprint (+/- 10%), at which time the remaining residential, business and wholesale customers can be economically migrated. Until this threshold is reached, migrating existing telephony customers that are not also Internet and/or television customers is too cost prohibitive. In the U.S., Verizon commenced copper de-commissioning in 2011 with the goal of reducing costs, up-selling customers and improving customer satisfaction. The targeted territories for FTTH migration and subsequent copper de-commissioning have included “chronic” copper areas (i.e., requiring two or more truck rolls every six months), municipalities with very old copper (i.e., >60 years) and damaged areas (i.e., New York City following Hurricane Sandy).
Timing considerations
Market share imbalances. Within our coverage universe, the Canadian telcos have an approximate 45% share of the residential and SMB Internet market while the Canadian cablecos have a 55% share. Given the track record in Canada of price discipline in a largely duopolistic market structure, we believe the long-term Internet market share expectation for each operator is 50%. With the cablecos currently offering approximately two times the Internet speed of that of the telcos, the telcos risk losing
RBC Telecom Scenario Report
August 19, 2015 12
Internet market share as household data demand rises, particularly post the peak of IPTV footprint expansion/penetration when the positive flow-through impact on Internet will wane. Given the importance of the Internet in owing the home, any material loss of Internet market share to the cablecos would likely trigger more rapid FTTH deployment by the telcos.
Household data demand. The proliferation in OTT video is driving household data demand. According to the CRTC, the average household in 2013 downloaded 45 GB per month (up 58% YoY) with 31% of households subscribing to Internet speeds >16 Mbps in 2013 versus 27% in 2012 and 10% in 2011. While the percentage of households subscribing to Internet speeds > 50 Mbps was only 5% in 2013 (versus 4% in 2012 and less than 1% in 2011), this percentage is only going to increase. At the moment, the large cablecos can largely offer Internet speeds of up to 250 Mbps over 95% of the footprint, which currently compares to 50 Mbps within a typical telco FTTN footprint (although Internet speeds of 100 Mbps are available in some territories). Excluding FTTH, the rollout of DOCSIS 3.1 will further boost speeds for the cablecos, while additional FTTN overlays could further boost speeds for the telcos. Although telco FTTN for the moment is “good enough” to meet most household demand and thus remain competitive, any meaningful step-up in household data demand (i.e., driven by our 2017-2019 OTT inflection period and Telecom Big Bang) could result in a major cableco advantage in the absence of FTTH.
High attach rates. The ability to amortize FTTH investment across multiple revenue streams is a key determinant of the type of returns generated on FTTH. Multiple revenue streams for traditional triple-play households naturally require high attach rates on telephony and television. Postponing FTTH deployment into the future risks realizing much lower attach rates as telephony and television substitution accelerate, which could impact the returns generated on FTTH. While monetizing the growth in data demand may help mitigate substitution effects, the desire to maximize revenue while triple-play demand is still meaningful could be justification for FTTH deployment sooner rather than later.
Municipal permitting and/or partnerships. Deploying FTTH requires obtaining municipal permits, the timing of which can vary considerably by municipality. In some instances, municipal permitting can be a gating factor for FTTH deployment. On a positive note, we expect forward-looking municipalities to take more of a partnership approach with the telecom industry whereby significant upfront FTTH deployment commitments are made in exchange for municipal access.
The FTTH cost curve. Over time, new technology has the potential to lower the FTTH cost curve with respect to both FTTH deployment (i.e., network and construction technique) and subscriber loading. For example, wireless technology in the home can reduce installation times for low-coaxed households, as well as lower the volume of service calls (by up to 25% for BCE). In addition, an increase in global FTTH deployments are lowering CPE costs.
Competition from new entrants. In Canada, there are a number of small operators that have deployed fibre in some capacity, such as Beanfield, CityWest, FibreMedia, Novus, Vianet and Wightman Telecom (to name a few). While new entrant FTTH overbuilds will remain a competitive threat to incumbent telecom operators, we believe the threat is greatest from large U.S. companies such as Google. In the U.S., Google has or is deploying FTTH in three cities (Kansas City was completed in 2013 with FTTH being rolled out in Austin and Provo). Following a 2014 announcement that Google would work with 34 cities in 9 metropolitans to explore future FTTH expansion, Google has since
RBC Telecom Scenario Report
August 19, 2015 13
confirmed that FTTH will be deployed in Nashville, Charlotte, Raleigh/Durham, Atlanta and Salt Lake City, with Phoenix, Portland, San Antonio and San Jose under future consideration.
Regulatory and other considerations
Mandated access to FTTH. On July 22, 2015, the CRTC released its decision following a review of wholesale wireline services. The wholesale services framework determines the rates, terms and conditions under which incumbent operators are required to provide network access to competitors. Surprisingly, the CRTC determined that mandated wholesale high-speed access (HSA) services will now apply to FTTH networks in addition to traditional DSL/copper/FTTN and DOCSIS/cable networks. Although mandated access to FTTH was ultimately expected, we did not expect the CRTC to mandate access at this juncture given the very early stages of FTTH deployment in Canada. While mandated access to FTTH could act as a dis-incentive for FTTH deployment, we expect the incumbents to largely proceed with current FTTH plans as the impact of this decision should be manageable for three reasons: (i) the use of Phase II costing, which should prevent an “unfair” tariff regime from being implemented; (ii) the requirement under the disaggregated wholesale HSA services model for competitors to invest in interconnection (which requires scale and is consistent with facilities-based competition); and (iii) the ability for incumbents to more aggressively push the quad-play as well as other services in the bundle should Internet re-sellers gain greater traction over time.
Government programs and tax incentives. Government-sponsored broadband programs can lower the net cost of FTTH deployment for private operators. For example, the federal government committed $305MM to “extend and enhance broadband internet service for Canadians in rural and Northern communities” in the 2014/2015 budget. In addition, tax incentives such as accelerated capital cost allowance may further incentivize FTTH investment.
Cost of capital. By any historical standard, the cost of capital for telecom operators is currently very low, which can incentivize investment and boost returns generated on FTTH (all else being equal).
RBC Telecom Scenario Report
August 19, 2015 14
The Bell Aliant FTTH experience Accelerated FTTH deployment by Bell Aliant from 2009 through 2014 offers one of the best insights for telecom investors into the economics of FTTH. Bell Aliant proceeded with an accelerated FTTH build primarily for two reasons: (i) approximately 80%-85% of the company’s footprint was aerial; and (ii) long loop lengths meant that the cost of deploying FTTH would have been largely similar to deploying FTTN. We aggregated all quantitative and qualitative data points that were disclosed over this accelerated build period, the primary sources of which included financial reports, all quarterly conference calls and our meetings with management.
The subscriber and (illustrative) revenue experience Bell Aliant indicated that all internal targets were being met or exceeded after a very short nine months into the FTTH build. By the end of 2014, the penetration of FibreOp Internet and television subscribers (% of FTTH footprint) were 25% and 22%, respectively. Key subscriber data points included: (i) FibreOP subscriber penetration (% of FTTH footprint) tracked ahead of the penetration curve for Verizon, which experienced >50% penetration in more mature markets after six years; (ii) FibreOP television and triple play attach rates of 90%-95% were higher than expected with a 30% improvement in RGU performance experienced in mature FTTH footprints; (iii) subscriber churn was lower than expected boosted by the high television attach rate; (iv) FibreOp subscribers consistently migrated to higher tiers with the vast majority of television subscribers (85%) taking PVR and HD options as well as more actively using VOD; (v) demand consistently outstripped Bell Aliant’s installation capacity; (vi) the revenue lift in a FTTH footprint typically exceeded the revenue drag in a non-FTTH footprint; and (vii) revenue growth turned positive in Atlantic Canada within two years of deploying FTTH, just prior to reaching 50% coverage of the total footprint.
Exhibit 4 summarizes the Bell Aliant FTTH subscriber experience. For illustrative purposes only, we show theoretical FTTH-related revenue assumptions with respect to Internet, television and telephony ARPU and telephony attach rates (i.e., Bell Aliant did not disclose specific FTTH revenue). Based on our assumptions, FibreOp revenue would have accounted for approximately 15% of Bell Aliant’s total wireline revenue by the end of 2014.
RBC Telecom Scenario Report
August 19, 2015 15
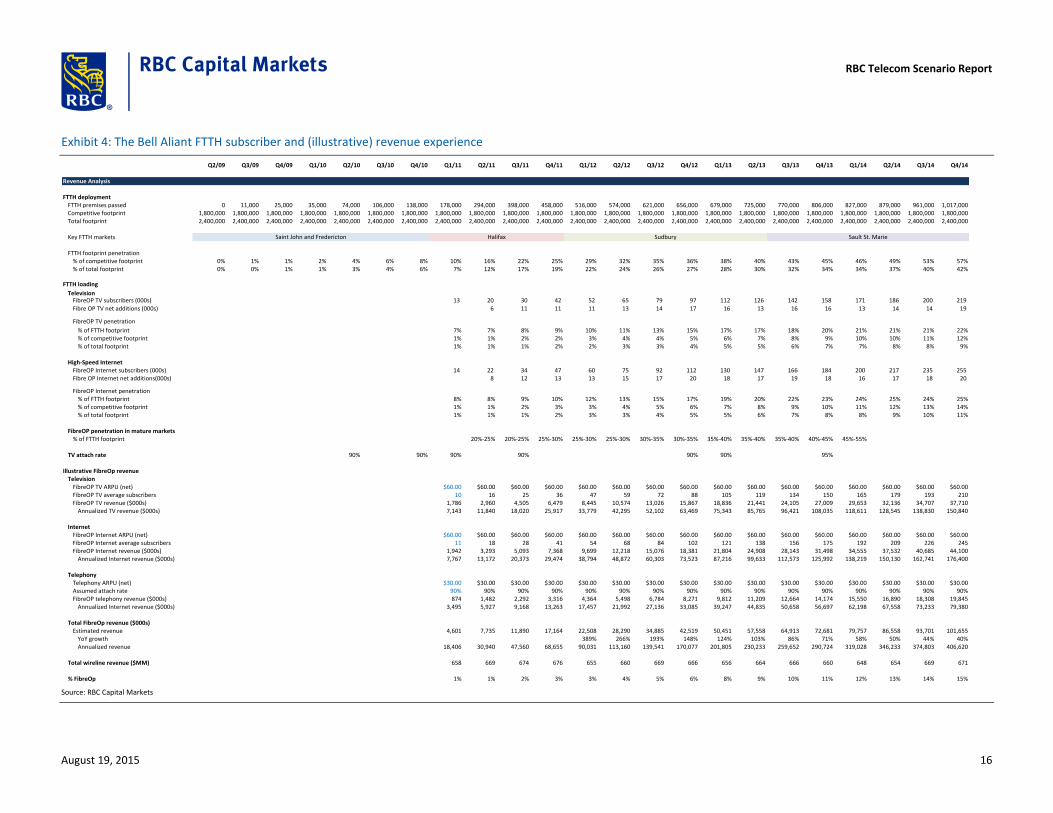
Exhibit 4: The Bell Aliant FTTH subscriber and (illustrative) revenue experience
Q2/09 Q3/09 Q4/09 Q1/10 Q2/10 Q3/10 Q4/10 Q1/11 Q2/11 Q3/11 Q4/11 Q1/12 Q2/12 Q3/12 Q4/12 Q1/13 Q2/13 Q3/13 Q4/13 Q1/14 Q2/14 Q3/14 Q4/14
Revenue Analysis
FTTH deploymentFTTH premises passed 0 11,000 25,000 35,000 74,000 106,000 138,000 178,000 294,000 398,000 458,000 516,000 574,000 621,000 656,000 679,000 725,000 770,000 806,000 827,000 879,000 961,000 1,017,000Competitive footprint 1,800,000 1,800,000 1,800,000 1,800,000 1,800,000 1,800,000 1,800,000 1,800,000 1,800,000 1,800,000 1,800,000 1,800,000 1,800,000 1,800,000 1,800,000 1,800,000 1,800,000 1,800,000 1,800,000 1,800,000 1,800,000 1,800,000 1,800,000Total footprint 2,400,000 2,400,000 2,400,000 2,400,000 2,400,000 2,400,000 2,400,000 2,400,000 2,400,000 2,400,000 2,400,000 2,400,000 2,400,000 2,400,000 2,400,000 2,400,000 2,400,000 2,400,000 2,400,000 2,400,000 2,400,000 2,400,000 2,400,000
Key FTTH markets
FTTH footprint penetration% of competitive footprint 0% 1% 1% 2% 4% 6% 8% 10% 16% 22% 25% 29% 32% 35% 36% 38% 40% 43% 45% 46% 49% 53% 57%% of total footprint 0% 0% 1% 1% 3% 4% 6% 7% 12% 17% 19% 22% 24% 26% 27% 28% 30% 32% 34% 34% 37% 40% 42%
FTTH loading
TelevisionFibreOP TV subscribers (000s) 13 20 30 42 52 65 79 97 112 126 142 158 171 186 200 219
Fibre OP TV net additions (000s) 6 11 11 11 13 14 17 16 13 16 16 13 14 14 19
FibreOP TV penetration
% of FTTH footprint 7% 7% 8% 9% 10% 11% 13% 15% 17% 17% 18% 20% 21% 21% 21% 22%% of competitive footprint 1% 1% 2% 2% 3% 4% 4% 5% 6% 7% 8% 9% 10% 10% 11% 12%% of total footprint 1% 1% 1% 2% 2% 3% 3% 4% 5% 5% 6% 7% 7% 8% 8% 9%
High-Speed InternetFibreOP Internet subscribers (000s) 14 22 34 47 60 75 92 112 130 147 166 184 200 217 235 255Fibre OP Internet net additions(000s) 8 12 13 13 15 17 20 18 17 19 18 16 17 18 20
FibreOP Internet penetration% of FTTH footprint 8% 8% 9% 10% 12% 13% 15% 17% 19% 20% 22% 23% 24% 25% 24% 25%% of competitive footprint 1% 1% 2% 3% 3% 4% 5% 6% 7% 8% 9% 10% 11% 12% 13% 14%% of total footprint 1% 1% 1% 2% 3% 3% 4% 5% 5% 6% 7% 8% 8% 9% 10% 11%
FibreOP penetration in mature markets% of FTTH footprint 20%-25% 20%-25% 25%-30% 25%-30% 25%-30% 30%-35% 30%-35% 35%-40% 35%-40% 35%-40% 40%-45% 45%-55%
TV attach rate 90% 90% 90% 90% 90% 90% 95%
Illustrative FibreOp revenue Television
FibreOP TV ARPU (net) $60.00 $60.00 $60.00 $60.00 $60.00 $60.00 $60.00 $60.00 $60.00 $60.00 $60.00 $60.00 $60.00 $60.00 $60.00 $60.00FibreOP TV average subscribers 10 16 25 36 47 59 72 88 105 119 134 150 165 179 193 210FibreOP TV revenue ($000s) 1,786 2,960 4,505 6,479 8,445 10,574 13,026 15,867 18,836 21,441 24,105 27,009 29,653 32,136 34,707 37,710
Annualized TV revenue ($000s) 7,143 11,840 18,020 25,917 33,779 42,295 52,102 63,469 75,343 85,765 96,421 108,035 118,611 128,545 138,830 150,840
InternetFibreOP Internet ARPU (net) $60.00 $60.00 $60.00 $60.00 $60.00 $60.00 $60.00 $60.00 $60.00 $60.00 $60.00 $60.00 $60.00 $60.00 $60.00 $60.00FibreOP Internet average subscribers 11 18 28 41 54 68 84 102 121 138 156 175 192 209 226 245FibreOP Internet revenue ($000s) 1,942 3,293 5,093 7,368 9,699 12,218 15,076 18,381 21,804 24,908 28,143 31,498 34,555 37,532 40,685 44,100
Annualized Internet revenue ($000s) 7,767 13,172 20,373 29,474 38,794 48,872 60,303 73,523 87,216 99,633 112,573 125,992 138,219 150,130 162,741 176,400
TelephonyTelephony ARPU (net) $30.00 $30.00 $30.00 $30.00 $30.00 $30.00 $30.00 $30.00 $30.00 $30.00 $30.00 $30.00 $30.00 $30.00 $30.00 $30.00Assumed attach rate 90% 90% 90% 90% 90% 90% 90% 90% 90% 90% 90% 90% 90% 90% 90% 90%FibreOP telephony revenue ($000s) 874 1,482 2,292 3,316 4,364 5,498 6,784 8,271 9,812 11,209 12,664 14,174 15,550 16,890 18,308 19,845
Annualized Internet revenue ($000s) 3,495 5,927 9,168 13,263 17,457 21,992 27,136 33,085 39,247 44,835 50,658 56,697 62,198 67,558 73,233 79,380
Total FibreOp revenue ($000s)Estimated revenue 4,601 7,735 11,890 17,164 22,508 28,290 34,885 42,519 50,451 57,558 64,913 72,681 79,757 86,558 93,701 101,655
YoY growth 389% 266% 193% 148% 124% 103% 86% 71% 58% 50% 44% 40%Annualized revenue 18,406 30,940 47,560 68,655 90,031 113,160 139,541 170,077 201,805 230,233 259,652 290,724 319,028 346,233 374,803 406,620
Total wireline revenue ($MM) 658 669 674 676 655 660 669 666 656 664 666 660 648 654 669 671
% FibreOp 1% 1% 2% 3% 3% 4% 5% 6% 8% 9% 10% 11% 12% 13% 14% 15%
Saint John and Fredericton Halifax Sudbury Sault St. Marie
Source: RBC Capital Markets
RBC Telecom Scenario Report
August 19, 2015 16
The cost experience We have constructed what we believe is a reasonably accurate model that reflects Bell Aliant’s cost of FTTH deployment and subscriber loading. We note that our model excludes undisclosed FTTH-related development and marketing costs. Key cost data points included: (i) an average cost per premise of approximately $500 over the accelerated build period with the cost ranging from $400 per premise in the dense/aerial footprints like Halifax to just under $600 per premise in less dense/aerial footprints; and (ii) a cost per load in the $900-$1,000 range. Based on these costs, from 2009 through 2014, Bell Aliant invested approximately $530MM to deploy FTTH to 1MM premises in Atlantic Canada and Ontario, and invested approximately $280MM to load 219k and 255k net FibreOp television and Internet subscribers, respectively, for a total cost of approximately $800MM. Other important data points included: (i) the average annual maintenance cost savings of FTTH was up to $100/home; (ii) after two years, installation times were averaging 5 hours, down from 7 hours six-to-nine months earlier; and (iii) wireless set-top boxes reduced installation times by about an hour, equating to about $100/home in savings net of equipment cost differentials.
Exhibit 5 summarizes what we believe is a reasonably accurate model that reflects Bell Aliant’s cost of FTTH deployment and subscriber loading.
RBC Telecom Scenario Report
August 19, 2015 17
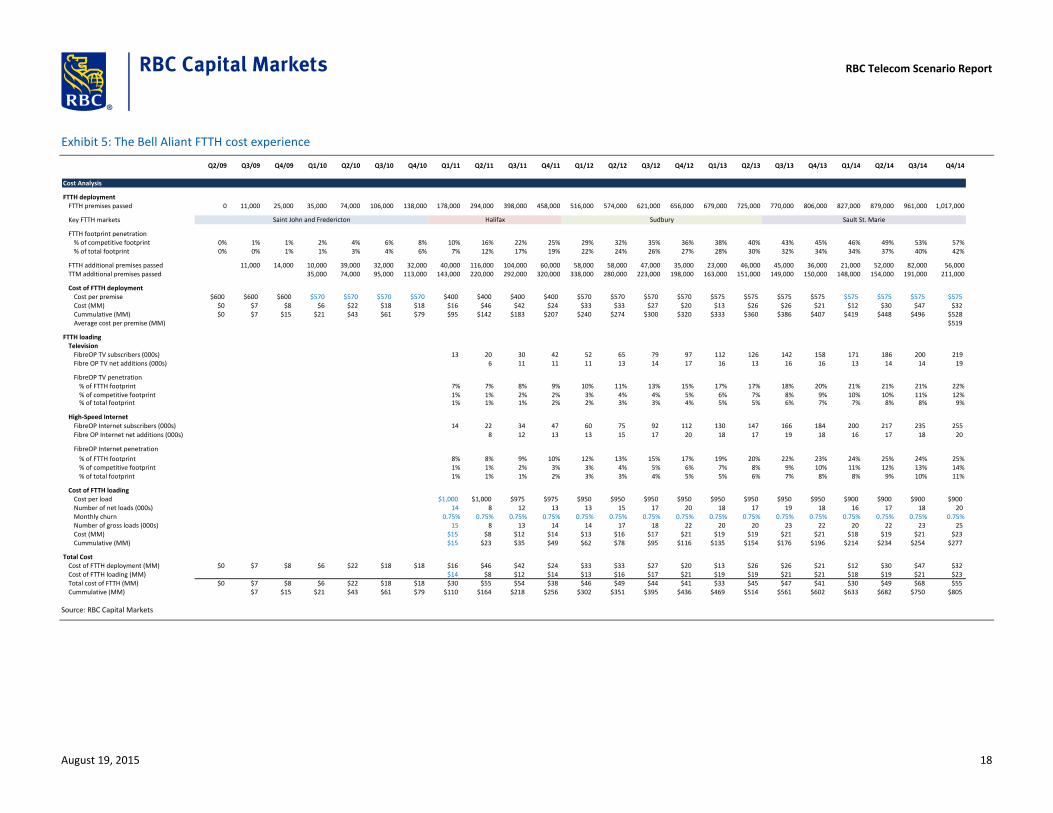
Exhibit 5: The Bell Aliant FTTH cost experience
Q2/09 Q3/09 Q4/09 Q1/10 Q2/10 Q3/10 Q4/10 Q1/11 Q2/11 Q3/11 Q4/11 Q1/12 Q2/12 Q3/12 Q4/12 Q1/13 Q2/13 Q3/13 Q4/13 Q1/14 Q2/14 Q3/14 Q4/14
Cost Analysis
FTTH deploymentFTTH premises passed 0 11,000 25,000 35,000 74,000 106,000 138,000 178,000 294,000 398,000 458,000 516,000 574,000 621,000 656,000 679,000 725,000 770,000 806,000 827,000 879,000 961,000 1,017,000
Key FTTH markets
FTTH footprint penetration% of competitive footprint 0% 1% 1% 2% 4% 6% 8% 10% 16% 22% 25% 29% 32% 35% 36% 38% 40% 43% 45% 46% 49% 53% 57%% of total footprint 0% 0% 1% 1% 3% 4% 6% 7% 12% 17% 19% 22% 24% 26% 27% 28% 30% 32% 34% 34% 37% 40% 42%
FTTH additional premises passed 11,000 14,000 10,000 39,000 32,000 32,000 40,000 116,000 104,000 60,000 58,000 58,000 47,000 35,000 23,000 46,000 45,000 36,000 21,000 52,000 82,000 56,000TTM additional premises passed 35,000 74,000 95,000 113,000 143,000 220,000 292,000 320,000 338,000 280,000 223,000 198,000 163,000 151,000 149,000 150,000 148,000 154,000 191,000 211,000
Cost of FTTH deploymentCost per premise $600 $600 $600 $570 $570 $570 $570 $400 $400 $400 $400 $570 $570 $570 $570 $575 $575 $575 $575 $575 $575 $575 $575Cost (MM) $0 $7 $8 $6 $22 $18 $18 $16 $46 $42 $24 $33 $33 $27 $20 $13 $26 $26 $21 $12 $30 $47 $32Cummulative (MM) $0 $7 $15 $21 $43 $61 $79 $95 $142 $183 $207 $240 $274 $300 $320 $333 $360 $386 $407 $419 $448 $496 $528Average cost per premise (MM) $519
FTTH loadingTelevision
FibreOP TV subscribers (000s) 13 20 30 42 52 65 79 97 112 126 142 158 171 186 200 219Fibre OP TV net additions (000s) 6 11 11 11 13 14 17 16 13 16 16 13 14 14 19
FibreOP TV penetration% of FTTH footprint 7% 7% 8% 9% 10% 11% 13% 15% 17% 17% 18% 20% 21% 21% 21% 22%% of competitive footprint 1% 1% 2% 2% 3% 4% 4% 5% 6% 7% 8% 9% 10% 10% 11% 12%% of total footprint 1% 1% 1% 2% 2% 3% 3% 4% 5% 5% 6% 7% 7% 8% 8% 9%
High-Speed Internet
FibreOP Internet subscribers (000s) 14 22 34 47 60 75 92 112 130 147 166 184 200 217 235 255
Fibre OP Internet net additions (000s) 8 12 13 13 15 17 20 18 17 19 18 16 17 18 20
FibreOP Internet penetration
% of FTTH footprint 8% 8% 9% 10% 12% 13% 15% 17% 19% 20% 22% 23% 24% 25% 24% 25%% of competitive footprint 1% 1% 2% 3% 3% 4% 5% 6% 7% 8% 9% 10% 11% 12% 13% 14%% of total footprint 1% 1% 1% 2% 3% 3% 4% 5% 5% 6% 7% 8% 8% 9% 10% 11%
Cost of FTTH loadingCost per load $1,000 $1,000 $975 $975 $950 $950 $950 $950 $950 $950 $950 $950 $900 $900 $900 $900Number of net loads (000s) 14 8 12 13 13 15 17 20 18 17 19 18 16 17 18 20Monthly churn 0.75% 0.75% 0.75% 0.75% 0.75% 0.75% 0.75% 0.75% 0.75% 0.75% 0.75% 0.75% 0.75% 0.75% 0.75% 0.75%Number of gross loads (000s) 15 8 13 14 14 17 18 22 20 20 23 22 20 22 23 25Cost (MM) $15 $8 $12 $14 $13 $16 $17 $21 $19 $19 $21 $21 $18 $19 $21 $23Cummulative (MM) $15 $23 $35 $49 $62 $78 $95 $116 $135 $154 $176 $196 $214 $234 $254 $277
Total CostCost of FTTH deployment (MM) $0 $7 $8 $6 $22 $18 $18 $16 $46 $42 $24 $33 $33 $27 $20 $13 $26 $26 $21 $12 $30 $47 $32Cost of FTTH loading (MM) $14 $8 $12 $14 $13 $16 $17 $21 $19 $19 $21 $21 $18 $19 $21 $23Total cost of FTTH (MM) $0 $7 $8 $6 $22 $18 $18 $30 $55 $54 $38 $46 $49 $44 $41 $33 $45 $47 $41 $30 $49 $68 $55Cummulative (MM) $7 $15 $21 $43 $61 $79 $110 $164 $218 $256 $302 $351 $395 $436 $469 $514 $561 $602 $633 $682 $750 $805
Saint John and Fredericton Halifax Sudbury Sault St. Marie
Source: RBC Capital Markets
RBC Telecom Scenario Report
August 19, 2015 18
Aerial FTTH discounted payback period A base case To better understand the potential returns on FTTH, we calculate a discounted payback period (DPP) for a theoretical “base case” aerial FTTH build that covers 1MM premises over 10-years on a straight-line basis using the cost per premise and cost per load as experienced by Bell Aliant. Under this scenario, the aerial FTTH build would payout in approximately 11 years. This calculation is generally consistent with Bell Aliant’s stated 7-8 year payback on its initial 600k premises passed and 10-year payback on the subsequent 400k premises passed.
The major assumptions underpinning our discounted payback period calculation include: (i) penetration rates for Internet, television, telephony that are consistent with that for Bell Aliant and Verizon, as well as penetration rates that factor in television and telephony substitution; (ii) a penetration rate for “other services” that directionally reflects current and future new telecom services, such as home monitoring and smart home applications; (iii) average monthly churn of 0.9%; (iv) ARPU growth/declines for Internet, television and telephony that reflect the shift in pricing power from television and telephony to Internet; (v) a steady increase in EBITDA margins reflecting an improving mix of growing higher-margin Internet and declining lower-margin television, as well as reflecting operating cost efficiencies generated from FTTH; (vi) a -1% annual decline in the average cost per premise passed beginning at $500 in year 1; (vii) a -3% annual decline in the average cost per load beginning at $900 in year 1; and (viii) a decline in maintenance capex intensity to low double-digits longer-term.
Our discounted payback period calculation factors in a year 1 EBITDA margin of 43%, which implicitly assumes an incumbent operator is able to leverage existing overhead. We believe this assumption is the most practical approach when analyzing FTTH returns for incumbent operators. In addition, our approach does not factor in the incremental benefits of FTTH versus the alternative of doing nothing. For example, in the absence of FTTH, we would expect the rate of telephony substitution to be higher and the share of the residential and SMB Internet market to be lower over time. While avoiding this more negative outcome of doing nothing may be justification for proceeding with FTTH, particularly for the Canadian telcos that do not want to cede the Internet market to the cablecos, our approach does not explicitly factor in the incremental “delta” versus the status quo.
For the purposes of simplicity, our discounted payback period analysis excludes the full economic benefit arising from economies of scope, such as supporting wireless and better servicing the business market as well as certain verticals, such as healthcare and education. While capturing the full economic benefit from economies of scope would directly improve the DPP, we would expect a still relatively long payback regardless.
Exhibit 6 summarizes our calculated aerial FTTH discounted payback period using the Bell Aliant cost experience.
RBC Telecom Scenario Report
August 19, 2015 19
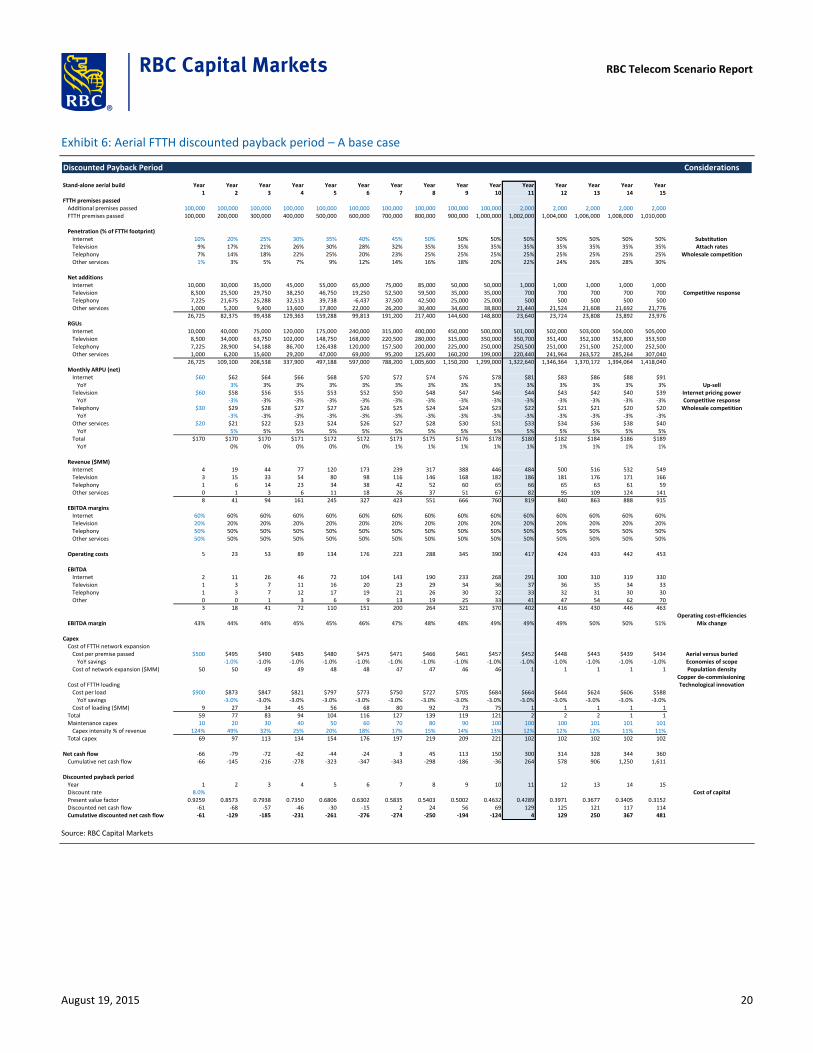
Exhibit 6: Aerial FTTH discounted payback period – A base case
Discounted Payback Period Considerations
Stand-alone aerial build Year Year Year Year Year Year Year Year Year Year Year Year Year Year Year1 2 3 4 5 6 7 8 9 10 11 12 13 14 15
FTTH premises passedAdditional premises passed 100,000 100,000 100,000 100,000 100,000 100,000 100,000 100,000 100,000 100,000 2,000 2,000 2,000 2,000 2,000FTTH premises passed 100,000 200,000 300,000 400,000 500,000 600,000 700,000 800,000 900,000 1,000,000 1,002,000 1,004,000 1,006,000 1,008,000 1,010,000
Penetration (% of FTTH footprint)Internet 10% 20% 25% 30% 35% 40% 45% 50% 50% 50% 50% 50% 50% 50% 50% Substitution Television 9% 17% 21% 26% 30% 28% 32% 35% 35% 35% 35% 35% 35% 35% 35% Attach ratesTelephony 7% 14% 18% 22% 25% 20% 23% 25% 25% 25% 25% 25% 25% 25% 25% Wholesale competitionOther services 1% 3% 5% 7% 9% 12% 14% 16% 18% 20% 22% 24% 26% 28% 30%
Net additionsInternet 10,000 30,000 35,000 45,000 55,000 65,000 75,000 85,000 50,000 50,000 1,000 1,000 1,000 1,000 1,000Television 8,500 25,500 29,750 38,250 46,750 19,250 52,500 59,500 35,000 35,000 700 700 700 700 700 Competitive responseTelephony 7,225 21,675 25,288 32,513 39,738 -6,437 37,500 42,500 25,000 25,000 500 500 500 500 500Other services 1,000 5,200 9,400 13,600 17,800 22,000 26,200 30,400 34,600 38,800 21,440 21,524 21,608 21,692 21,776
26,725 82,375 99,438 129,363 159,288 99,813 191,200 217,400 144,600 148,800 23,640 23,724 23,808 23,892 23,976RGUs
Internet 10,000 40,000 75,000 120,000 175,000 240,000 315,000 400,000 450,000 500,000 501,000 502,000 503,000 504,000 505,000Television 8,500 34,000 63,750 102,000 148,750 168,000 220,500 280,000 315,000 350,000 350,700 351,400 352,100 352,800 353,500Telephony 7,225 28,900 54,188 86,700 126,438 120,000 157,500 200,000 225,000 250,000 250,500 251,000 251,500 252,000 252,500Other services 1,000 6,200 15,600 29,200 47,000 69,000 95,200 125,600 160,200 199,000 220,440 241,964 263,572 285,264 307,040
26,725 109,100 208,538 337,900 497,188 597,000 788,200 1,005,600 1,150,200 1,299,000 1,322,640 1,346,364 1,370,172 1,394,064 1,418,040Monthly ARPU (net)
Internet $60 $62 $64 $66 $68 $70 $72 $74 $76 $78 $81 $83 $86 $88 $91YoY 3% 3% 3% 3% 3% 3% 3% 3% 3% 3% 3% 3% 3% 3% Up-sell
Television $60 $58 $56 $55 $53 $52 $50 $48 $47 $46 $44 $43 $42 $40 $39 Internet pricing powerYoY -3% -3% -3% -3% -3% -3% -3% -3% -3% -3% -3% -3% -3% -3% Competitive response
Telephony $30 $29 $28 $27 $27 $26 $25 $24 $24 $23 $22 $21 $21 $20 $20 Wholesale competitionYoY -3% -3% -3% -3% -3% -3% -3% -3% -3% -3% -3% -3% -3% -3%
Other services $20 $21 $22 $23 $24 $26 $27 $28 $30 $31 $33 $34 $36 $38 $40YoY 5% 5% 5% 5% 5% 5% 5% 5% 5% 5% 5% 5% 5% 5%
Total $170 $170 $170 $171 $172 $172 $173 $175 $176 $178 $180 $182 $184 $186 $189YoY 0% 0% 0% 0% 0% 1% 1% 1% 1% 1% 1% 1% 1% 1%
Revenue ($MM)Internet 4 19 44 77 120 173 239 317 388 446 484 500 516 532 549Television 3 15 33 54 80 98 116 146 168 182 186 181 176 171 166Telephony 1 6 14 23 34 38 42 52 60 65 66 65 63 61 59Other services 0 1 3 6 11 18 26 37 51 67 82 95 109 124 141
8 41 94 161 245 327 423 551 666 760 819 840 863 888 915EBITDA margins
Internet 60% 60% 60% 60% 60% 60% 60% 60% 60% 60% 60% 60% 60% 60% 60%Television 20% 20% 20% 20% 20% 20% 20% 20% 20% 20% 20% 20% 20% 20% 20%Telephony 50% 50% 50% 50% 50% 50% 50% 50% 50% 50% 50% 50% 50% 50% 50%Other services 50% 50% 50% 50% 50% 50% 50% 50% 50% 50% 50% 50% 50% 50% 50%
Operating costs 5 23 53 89 134 176 223 288 345 390 417 424 433 442 453
EBITDA Internet 2 11 26 46 72 104 143 190 233 268 291 300 310 319 330Television 1 3 7 11 16 20 23 29 34 36 37 36 35 34 33Telephony 1 3 7 12 17 19 21 26 30 32 33 32 31 30 30Other 0 0 1 3 6 9 13 19 25 33 41 47 54 62 70
3 18 41 72 110 151 200 264 321 370 402 416 430 446 463Operating cost-efficiencies
EBITDA margin 43% 44% 44% 45% 45% 46% 47% 48% 48% 49% 49% 49% 50% 50% 51% Mix change
CapexCost of FTTH network expansion
Cost per premise passed $500 $495 $490 $485 $480 $475 $471 $466 $461 $457 $452 $448 $443 $439 $434 Aerial versus buriedYoY savings -1.0% -1.0% -1.0% -1.0% -1.0% -1.0% -1.0% -1.0% -1.0% -1.0% -1.0% -1.0% -1.0% -1.0% Economies of scope
Cost of network expansion ($MM) 50 50 49 49 48 48 47 47 46 46 1 1 1 1 1 Population densityCopper de-commissioning
Cost of FTTH loading Technological innovationCost per load $900 $873 $847 $821 $797 $773 $750 $727 $705 $684 $664 $644 $624 $606 $588
YoY savings -3.0% -3.0% -3.0% -3.0% -3.0% -3.0% -3.0% -3.0% -3.0% -3.0% -3.0% -3.0% -3.0% -3.0%Cost of loading ($MM) 9 27 34 45 56 68 80 92 73 75 1 1 1 1 1
Total 59 77 83 94 104 116 127 139 119 121 2 2 2 1 1Maintenance capex 10 20 30 40 50 60 70 80 90 100 100 100 101 101 101
Capex intensity % of revenue 124% 49% 32% 25% 20% 18% 17% 15% 14% 13% 12% 12% 12% 11% 11%Total capex 69 97 113 134 154 176 197 219 209 221 102 102 102 102 102
Net cash flow -66 -79 -72 -62 -44 -24 3 45 113 150 300 314 328 344 360Cumulative net cash flow -66 -145 -216 -278 -323 -347 -343 -298 -186 -36 264 578 906 1,250 1,611
Discounted payback periodYear 1 2 3 4 5 6 7 8 9 10 11 12 13 14 15Discount rate 8.0% Cost of capitalPresent value factor 0.9259 0.8573 0.7938 0.7350 0.6806 0.6302 0.5835 0.5403 0.5002 0.4632 0.4289 0.3971 0.3677 0.3405 0.3152Discounted net cash flow -61 -68 -57 -46 -30 -15 2 24 56 69 129 125 121 117 114Cumulative discounted net cash flow -61 -129 -185 -231 -261 -276 -274 -250 -194 -124 4 129 250 367 481
Source: RBC Capital Markets
RBC Telecom Scenario Report
August 19, 2015 20
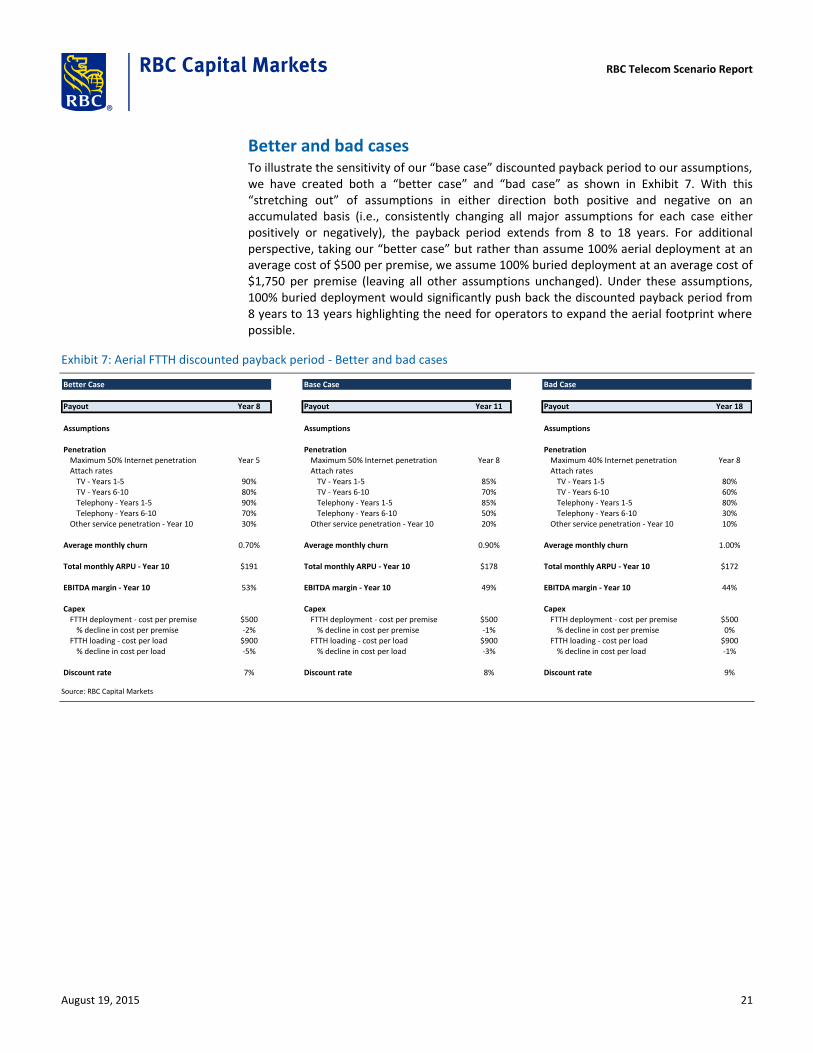
Better and bad cases To illustrate the sensitivity of our “base case” discounted payback period to our assumptions, we have created both a “better case” and “bad case” as shown in Exhibit 7. With this “stretching out” of assumptions in either direction both positive and negative on an accumulated basis (i.e., consistently changing all major assumptions for each case either positively or negatively), the payback period extends from 8 to 18 years. For additional perspective, taking our “better case” but rather than assume 100% aerial deployment at an average cost of $500 per premise, we assume 100% buried deployment at an average cost of $1,750 per premise (leaving all other assumptions unchanged). Under these assumptions, 100% buried deployment would significantly push back the discounted payback period from 8 years to 13 years highlighting the need for operators to expand the aerial footprint where possible.
Exhibit 7: Aerial FTTH discounted payback period - Better and bad cases
Better Case Base Case Bad Case
Payout Year 8 Payout Year 11 Payout Year 18
Assumptions Assumptions Assumptions
Penetration Penetration PenetrationMaximum 50% Internet penetration Year 5 Maximum 50% Internet penetration Year 8 Maximum 40% Internet penetration Year 8Attach rates Attach rates Attach rates
TV - Years 1-5 90% TV - Years 1-5 85% TV - Years 1-5 80%TV - Years 6-10 80% TV - Years 6-10 70% TV - Years 6-10 60%Telephony - Years 1-5 90% Telephony - Years 1-5 85% Telephony - Years 1-5 80%Telephony - Years 6-10 70% Telephony - Years 6-10 50% Telephony - Years 6-10 30%
Other service penetration - Year 10 30% Other service penetration - Year 10 20% Other service penetration - Year 10 10%
Average monthly churn 0.70% Average monthly churn 0.90% Average monthly churn 1.00%
Total monthly ARPU - Year 10 $191 Total monthly ARPU - Year 10 $178 Total monthly ARPU - Year 10 $172
EBITDA margin - Year 10 53% EBITDA margin - Year 10 49% EBITDA margin - Year 10 44%
Capex Capex CapexFTTH deployment - cost per premise $500 FTTH deployment - cost per premise $500 FTTH deployment - cost per premise $500
% decline in cost per premise -2% % decline in cost per premise -1% % decline in cost per premise 0%FTTH loading - cost per load $900 FTTH loading - cost per load $900 FTTH loading - cost per load $900
% decline in cost per load -5% % decline in cost per load -3% % decline in cost per load -1%
Discount rate 7% Discount rate 8% Discount rate 9%
Source: RBC Capital Markets
RBC Telecom Scenario Report
August 19, 2015 21
The FTTH footprint in Canada 2015 is the inflection point for accelerated FTTH deployment FTTH deployment in Canada is in the early innings. While both telcos and cablecos have deployed FTTH in greenfield developments for years, brownfield FTTH deployment (i.e., FTTH overbuilds in existing neighbourhoods) has been relatively limited with the level of commitment to deploy FTTH varying among the incumbents. To-date, the deployment of DOCSIS 3.0 by the cablecos and FTTN by the telcos have provided enough Internet capacity to meet household data demand. However, with the increase in household data demand showing no signs of slowing, FTTH is now coming into focus. Among the telcos under coverage, we estimate FTTH represents only 17% of the total footprint with FTTN/FTTH representing a broader 77% of the total footprint.
FTTH deployment roadmaps vary by telco BCE is the furthest along the FTTH deployment path – BCE is furthest along the FTTH
build among the Canadian telcos due in part to the acquisition of 100% of Bell Aliant in 2014 that added 1MM FTTH premises (42% of the Bell Aliant total footprint). In April, BCE announced a commitment to invest $20B in broadband investment (including wireless) by the end of 2020 with the company targeting approximately 8.5MM FTTH premises over what we estimate will be 7-10 years (eventually covering approximately 75% of the total footprint). FTTH represents approximately 22% of the total footprint of 10MM premises for BCE with FTTN/FTTH representing a much broader 78% of the total footprint. In June, BCE announced a commitment to cover 1.1MM premises in Toronto with fibre comprising 500k single-family homes, 450k MDUs and 150k businesses. The bulk of Toronto FTTH deployment will be completed by 2017. By the end of 2015, BCE expects FTTH to represent “30% of total customer locations”.
TELUS too is now accelerating FTTH deployment – For TELUS, details around FTTH deployment plans are less known. In February, TELUS confirmed an increased focus on FTTH deployment with the company taking a modular approach with the goal of maximizing economies of scope. At the moment, we estimate FTTH represents 7% of the total footprint of 3.8MM premises with FTTN/FTTH representing a much broader 74% of the total footprint (management indicated that 25% of the FTTx footprint is “fibre enabled” as of Q2/15). Management expects the bulk of FTTH deployment to be completed over the next 5-7 years. In June, the company announced a commitment to invest $1B in FTTH to cover 90% of premises in Edmonton.
Manitoba Telecom reaching the end of a largely unfinished 5-year plan – In 2010, Manitoba Telecom announced that by the end of 2015, the company intended to deploy FTTH to 120,000 premises in 20 communities. By the end of 2014, FTTH had reached 35k premises, increasing to 42k by Q2/15. At the moment, we estimate FTTH represents 8% of the total footprint of 500k premises for MTS with FTTN/FTTH representing a broader 70% of the total footprint.
The U.S. telco experience Verizon – Verizon commenced FTTH deployment in 2005. Verizon has indicated that the
average cost per premise under a blanket build is approximately US$1,000 with an average cost per load of approximately US$650-$700 and installation taking roughly 4-5 hours. Verizon’s FTTH deployment currently covers approximately 18MM premises, which represents just under 70% of the total consumer wireline footprint. By 2009 (i.e.,
RBC Telecom Scenario Report
August 19, 2015 22
five years after FTTH deployment began), FiOS television and Internet subscriber penetration was 28% and 25% of the FTTH footprint, respectively. By early 2015 (i.e., eleven years after FTTH deployment began), these penetration rates had increased to 36% and 42%, respectively. In most markets, penetration rates are approximately 40% with penetration reaching 50% in the more mature and less competitive markets. Other data points include: (i) the loading mix comprises Internet (39%), television (33%) and telephony (28%); and (ii) FiOS revenue per connection has declined from US$243 in 2010 to US$195 in 2015.
AT&T – In addition to steady greenfield deployment and “Project VIP”, which will cover 1MM businesses with fibre and is substantially complete, AT&T commenced its “GigaPower” FTTH deployment project in 2013 in Austin with the longer-term goal of bringing FTTH to 25 regions covering 100 cities. As of Q2/15, GigaPower was in 11 markets. As part of the DirectTV acquisition, the company has committed to deploy a 1Gbps service to 12MM premises, above its original target of 2MM premises.
The “blue-sky” cost of future FTTH Estimating the total future cost of FTTH deployment and loading by operator over the long-term is a challenge reflecting limited visibility around: (i) the extent to which aerial footprints can be expanded by leveraging existing infrastructure and new technology; (ii) the extent to which new technology and economies of scope can drive down the deployment and loading cost curves; (iii) extent to which changes in the competitive environment impact loading/subscriber penetration; (iv) the extent to which cheaper substitute technologies emerge to reduce the overall FTTH footprint, such as 5G wireless, fixed-wireless, satellite and FTTN overlays; and (v) the size of government-sponsored broadband programs, which can lower the net cost of FTTH deployment for private operators (i.e., such as the $305MM allocated in the 2014/2015 federal budget to “extend and enhance broadband internet service for Canadians in rural and Northern communities”).
Factoring in basic assumptions on FTTH coverage (75% of total footprint), subscriber penetration (50% of FTTH footprint) and the percentage of aerial versus buried deployment in each footprint, we estimate the “blue-sky” future cost of FTTH deployment and loading could be $9B for BCE, $5B for TELUS and $500MM Manitoba Telecom. These “blue-sky” estimates factor in average aerial and buried deployment costs of $600/premise and $1,750/premise, respectively, and an average cost per load of $900/premise.
Exhibit 8 provides a summary of estimated FTTH footprints, deployment roadmaps and the “blue-sky” cost of future FTTH for BCE, TELUS and Manitoba Telecom.
RBC Telecom Scenario Report
August 19, 2015 23
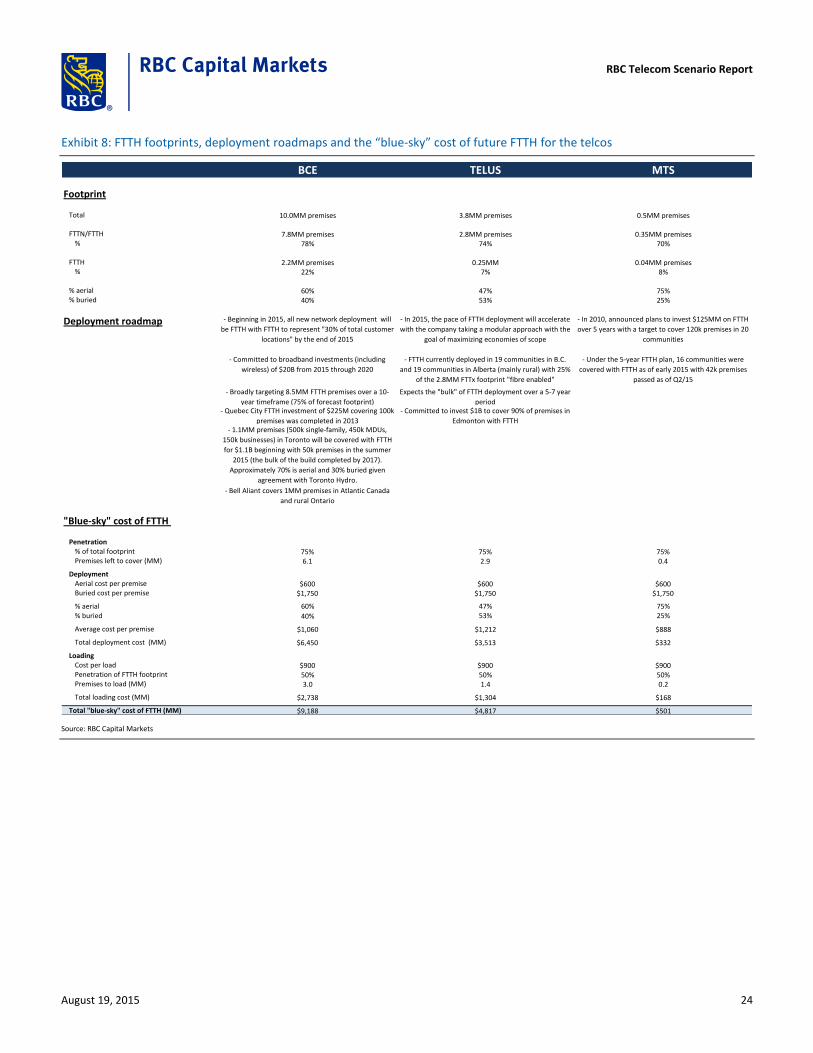
Exhibit 8: FTTH footprints, deployment roadmaps and the “blue-sky” cost of future FTTH for the telcos
BCE TELUS MTS
Footprint
Total 10.0MM premises 3.8MM premises 0.5MM premises
FTTN/FTTH 7.8MM premises 2.8MM premises 0.35MM premises% 78% 74% 70%
FTTH 2.2MM premises 0.25MM 0.04MM premises% 22% 7% 8%
% aerial 60% 47% 75%% buried 40% 53% 25%
Deployment roadmap - Beginning in 2015, all new network deployment will
be FTTH with FTTH to represent "30% of total customer
locations" by the end of 2015
- In 2015, the pace of FTTH deployment will accelerate
with the company taking a modular approach with the
goal of maximizing economies of scope
- In 2010, announced plans to invest $125MM on FTTH
over 5 years with a target to cover 120k premises in 20
communities
- Committed to broadband investments (including
wireless) of $20B from 2015 through 2020
- FTTH currently deployed in 19 communities in B.C.
and 19 communities in Alberta (mainly rural) with 25%
of the 2.8MM FTTx footprint "fibre enabled"
- Under the 5-year FTTH plan, 16 communities were
covered with FTTH as of early 2015 with 42k premises
passed as of Q2/15
- Broadly targeting 8.5MM FTTH premises over a 10-
year timeframe (75% of forecast footprint)
Expects the "bulk" of FTTH deployment over a 5-7 year
period- Quebec City FTTH investment of $225M covering 100k
premises was completed in 2013
- Committed to invest $1B to cover 90% of premises in
Edmonton with FTTH- 1.1MM premises (500k single-family, 450k MDUs,
150k businesses) in Toronto will be covered with FTTH
for $1.1B beginning with 50k premises in the summer
2015 (the bulk of the build completed by 2017).
Approximately 70% is aerial and 30% buried given
agreement with Toronto Hydro.
- Bell Aliant covers 1MM premises in Atlantic Canada
and rural Ontario
"Blue-sky" cost of FTTH
Penetration% of total footprint 75% 75% 75%Premises left to cover (MM) 6.1 2.9 0.4
DeploymentAerial cost per premise $600 $600 $600Buried cost per premise $1,750 $1,750 $1,750
% aerial 60% 47% 75%% buried 40% 53% 25%
Average cost per premise $1,060 $1,212 $888
Total deployment cost (MM) $6,450 $3,513 $332
Loading Cost per load $900 $900 $900Penetration of FTTH footprint 50% 50% 50%Premises to load (MM) 3.0 1.4 0.2
Total loading cost (MM) $2,738 $1,304 $168
Total "blue-sky" cost of FTTH (MM) $9,188 $4,817 $501
Source: RBC Capital Markets
RBC Telecom Scenario Report
August 19, 2015 24
Valuation and ROIC sensitivity to FTTH scenarios Our scenario approach To understand how FTTH could impact the telco stocks, we examined the valuation and ROIC impact to various FTTH scenarios for each telco. Given the many approaches that can be taken to assess the FTTH impact, our approach for the purposes of this report is intended to address two important questions for investors: (i) if the telcos are successful in deploying FTTH at current capex intensity levels, what is the valuation and ROIC sensitivity to both favourable and unfavourable revenue and margin outcomes? (ii) if the telcos are not successful in deploying FTTH at current capex intensity levels but rather require an increase in capex intensity, what is the valuation sensitivity under this capex scenario to both favourable and unfavourable revenue and margin outcomes? Given the multiple factors that can impact returns generated on FTTH (i.e., revenue, cost, timing, regulatory, other), for each capex scenario, our revenue and margin assumptions are intended to directionally capture what we believe is a reasonable range of outcomes.
A reasonable range of outcomes Our favourable outcomes are intended to simplistically capture the key positive revenue and margin benefits of FTTH. Our unfavourable outcomes are largely symmetrical to our favourable outcomes. For revenue, we increase and decrease our current annual wireline data revenue growth estimates for 2016E-2025E by +100bps and -100bps for the favourable and unfavourable outcomes, respectively. We believe this increase broadly captures the revenue impact from an increase in Internet market share to an eventual 50% share for each operator. For margins, we increase and decrease the average wireline EBITDA margin for 2016E-2025E by +200bps-250bps and -200bps-250bps for the favourable and unfavourable outcomes, respectively. We believe the increase broadly captures the operating cost efficiencies of FTTH. For capex, our “stable capex intensity” scenario assumes current capex intensity levels are maintained for 2016E-2025E. Our “elevated capex intensity” scenario assumes a +400bps increase in wireline capex intensity for 2016E-2025E. This increase is intended to broadly capture the risk of the telcos having to unexpectedly incur higher capex through the build and translates to an approximate 35%-50% increase in the cost of FTTH versus our “blue-sky” estimates.
For the purposes of simplicity, we do not: (i) change WACC and terminal growth rate assumptions under the two scenarios or favourable and unfavourable outcomes; (ii) account for a potential permanent “step-down” in capex post the FTTH deployment phase; (iii) ease the rate of deployment under unfavourable outcomes; (iv) make adjustments for market share and margin differentials between retail and wholesale subscribers; and (v) change dividend growth assumptions.
Manageable valuation risk provided capex intensity remains stable Under the stable capex intensity scenario: (i) the valuation upside under the favourable revenue and margin outcome is reasonably balanced compared to the downside under the unfavourable outcome (+19% versus -9% on average); and (ii) the differential in average ROIC between favourable and unfavourable outcomes is approximately 200bps-300bps. Under the elevated capex intensity scenario: (i) the downside under the unfavourable revenue and margin outcome heavily outweighs the upside under the favourable outcome (-27% versus
RBC Telecom Scenario Report
August 19, 2015 25
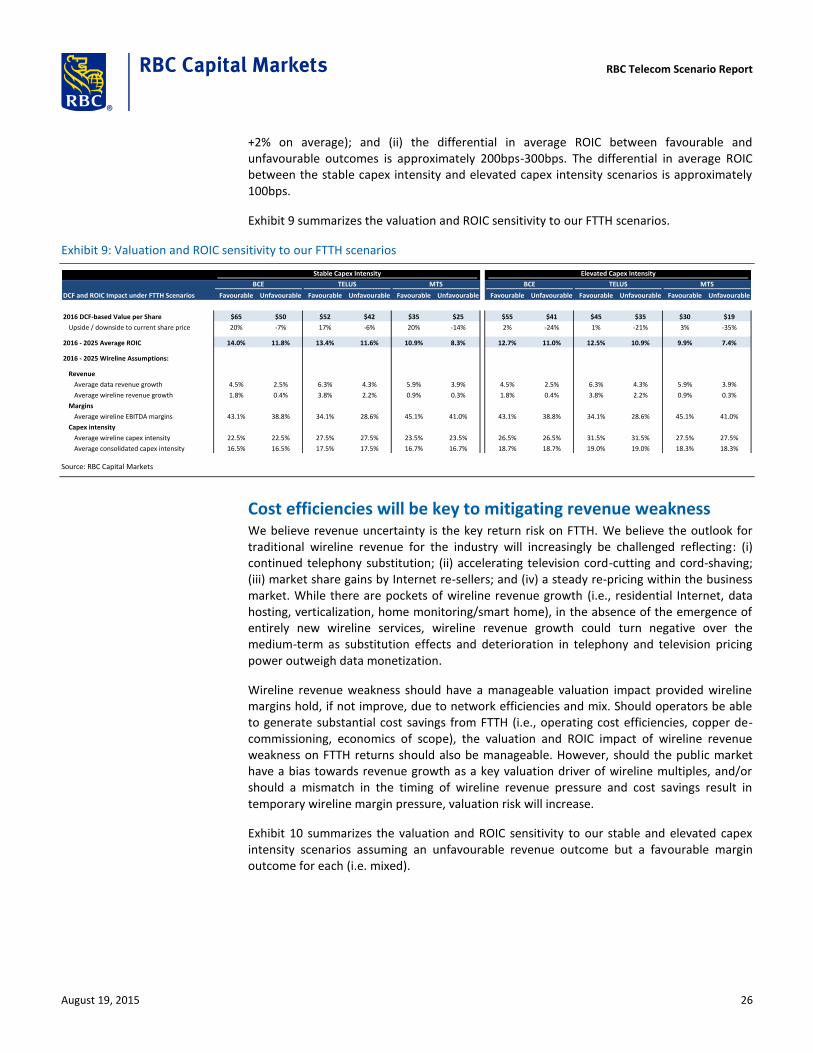
+2% on average); and (ii) the differential in average ROIC between favourable and unfavourable outcomes is approximately 200bps-300bps. The differential in average ROIC between the stable capex intensity and elevated capex intensity scenarios is approximately 100bps.
Exhibit 9 summarizes the valuation and ROIC sensitivity to our FTTH scenarios.
Exhibit 9: Valuation and ROIC sensitivity to our FTTH scenarios
DCF and ROIC Impact under FTTH Scenarios Favourable Unfavourable Favourable Unfavourable Favourable Unfavourable Favourable Unfavourable Favourable Unfavourable Favourable Unfavourable
2016 DCF-based Value per Share $65 $50 $52 $42 $35 $25 $55 $41 $45 $35 $30 $19
Upside / downside to current share price 20% -7% 17% -6% 20% -14% 2% -24% 1% -21% 3% -35%
2016 - 2025 Average ROIC 14.0% 11.8% 13.4% 11.6% 10.9% 8.3% 12.7% 11.0% 12.5% 10.9% 9.9% 7.4%
2016 - 2025 Wireline Assumptions:
Revenue
Average data revenue growth 4.5% 2.5% 6.3% 4.3% 5.9% 3.9% 4.5% 2.5% 6.3% 4.3% 5.9% 3.9%
Average wireline revenue growth 1.8% 0.4% 3.8% 2.2% 0.9% 0.3% 1.8% 0.4% 3.8% 2.2% 0.9% 0.3%
Margins
Average wireline EBITDA margins 43.1% 38.8% 34.1% 28.6% 45.1% 41.0% 43.1% 38.8% 34.1% 28.6% 45.1% 41.0%
Capex intensity
Average wireline capex intensity 22.5% 22.5% 27.5% 27.5% 23.5% 23.5% 26.5% 26.5% 31.5% 31.5% 27.5% 27.5%
Average consolidated capex intensity 16.5% 16.5% 17.5% 17.5% 16.7% 16.7% 18.7% 18.7% 19.0% 19.0% 18.3% 18.3%
BCE TELUS
Stable Capex Intensity Elevated Capex Intensity
BCE TELUS MTSMTS
Source: RBC Capital Markets
Cost efficiencies will be key to mitigating revenue weakness We believe revenue uncertainty is the key return risk on FTTH. We believe the outlook for traditional wireline revenue for the industry will increasingly be challenged reflecting: (i) continued telephony substitution; (ii) accelerating television cord-cutting and cord-shaving; (iii) market share gains by Internet re-sellers; and (iv) a steady re-pricing within the business market. While there are pockets of wireline revenue growth (i.e., residential Internet, data hosting, verticalization, home monitoring/smart home), in the absence of the emergence of entirely new wireline services, wireline revenue growth could turn negative over the medium-term as substitution effects and deterioration in telephony and television pricing power outweigh data monetization.
Wireline revenue weakness should have a manageable valuation impact provided wireline margins hold, if not improve, due to network efficiencies and mix. Should operators be able to generate substantial cost savings from FTTH (i.e., operating cost efficiencies, copper de-commissioning, economics of scope), the valuation and ROIC impact of wireline revenue weakness on FTTH returns should also be manageable. However, should the public market have a bias towards revenue growth as a key valuation driver of wireline multiples, and/or should a mismatch in the timing of wireline revenue pressure and cost savings result in temporary wireline margin pressure, valuation risk will increase.
Exhibit 10 summarizes the valuation and ROIC sensitivity to our stable and elevated capex intensity scenarios assuming an unfavourable revenue outcome but a favourable margin outcome for each (i.e. mixed).
RBC Telecom Scenario Report
August 19, 2015 26
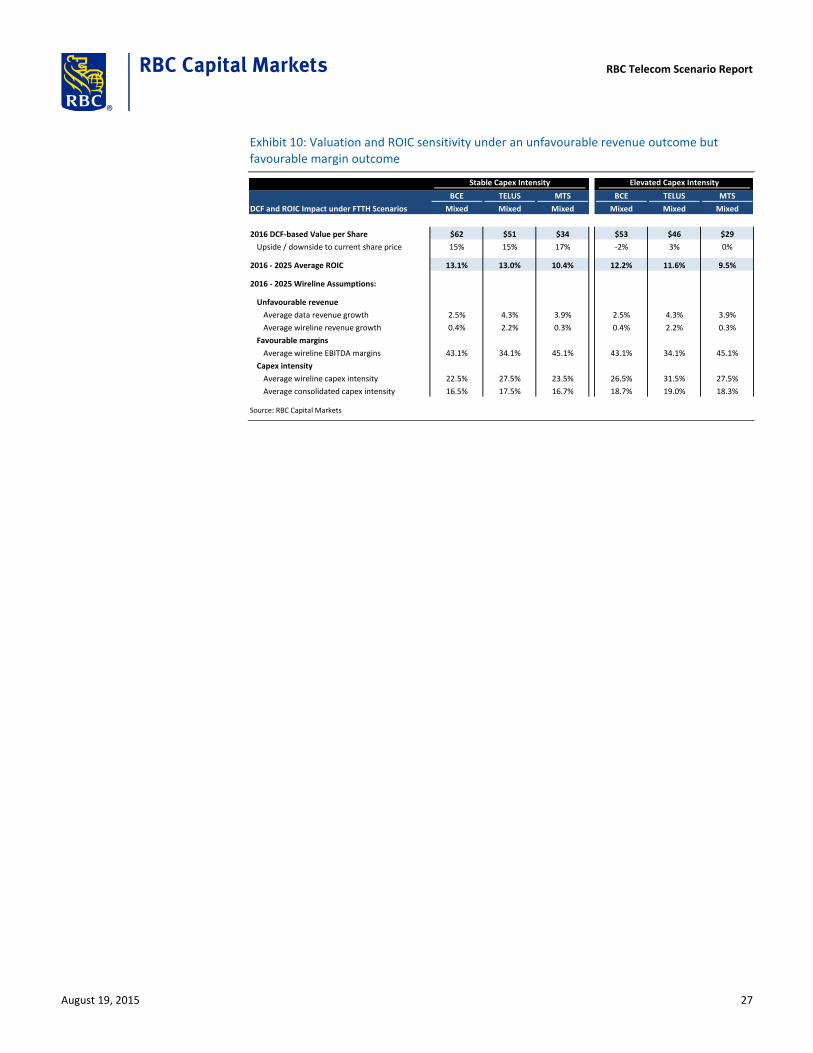
Exhibit 10: Valuation and ROIC sensitivity under an unfavourable revenue outcome but favourable margin outcome
BCE TELUS MTS BCE TELUS MTS
DCF and ROIC Impact under FTTH Scenarios Mixed Mixed Mixed Mixed Mixed Mixed
2016 DCF-based Value per Share $62 $51 $34 $53 $46 $29
Upside / downside to current share price 15% 15% 17% -2% 3% 0%
2016 - 2025 Average ROIC 13.1% 13.0% 10.4% 12.2% 11.6% 9.5%
2016 - 2025 Wireline Assumptions:
Unfavourable revenue
Average data revenue growth 2.5% 4.3% 3.9% 2.5% 4.3% 3.9%
Average wireline revenue growth 0.4% 2.2% 0.3% 0.4% 2.2% 0.3%
Favourable margins
Average wireline EBITDA margins 43.1% 34.1% 45.1% 43.1% 34.1% 45.1%
Capex intensity
Average wireline capex intensity 22.5% 27.5% 23.5% 26.5% 31.5% 27.5%
Average consolidated capex intensity 16.5% 17.5% 16.7% 18.7% 19.0% 18.3%
Stable Capex Intensity Elevated Capex Intensity
Source: RBC Capital Markets
RBC Telecom Scenario Report
August 19, 2015 27
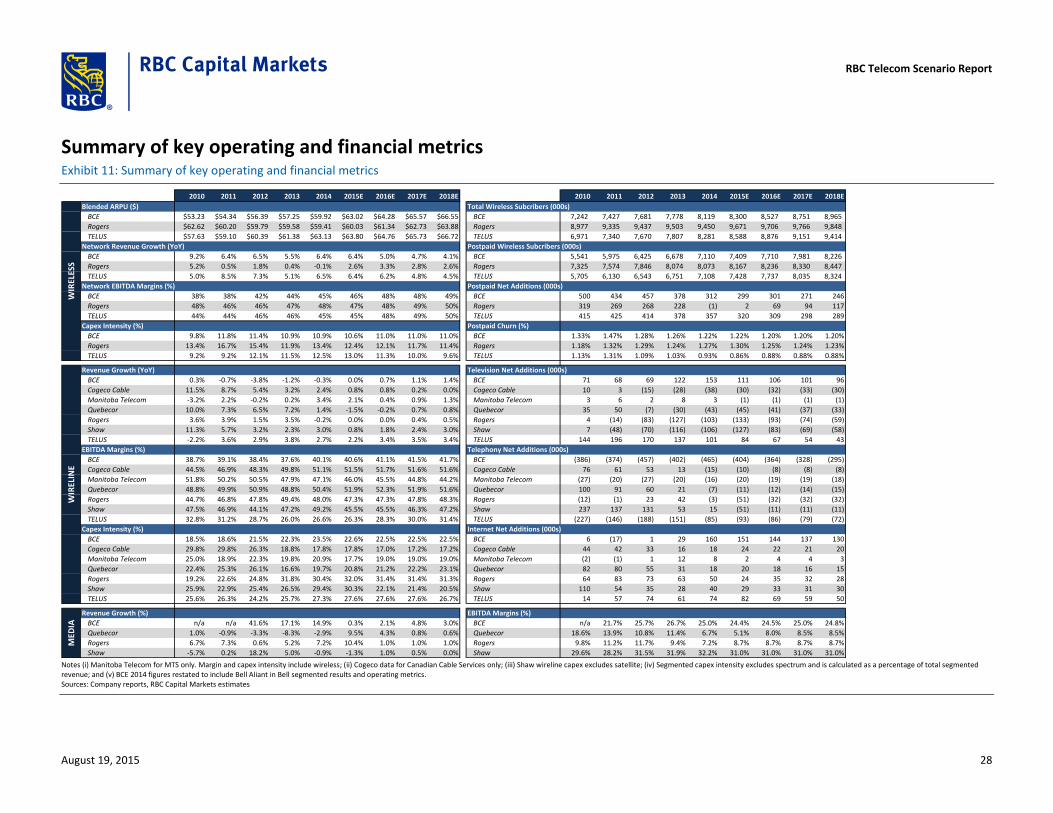
Summary of key operating and financial metrics Exhibit 11: Summary of key operating and financial metrics
2010 2011 2012 2013 2014 2015E 2016E 2017E 2018E 2010 2011 2012 2013 2014 2015E 2016E 2017E 2018E
Blended ARPU ($) Total Wireless Subcribers (000s)
BCE $53.23 $54.34 $56.39 $57.25 $59.92 $63.02 $64.28 $65.57 $66.55 BCE 7,242 7,427 7,681 7,778 8,119 8,300 8,527 8,751 8,965
Rogers $62.62 $60.20 $59.79 $59.58 $59.41 $60.03 $61.34 $62.73 $63.88 Rogers 8,977 9,335 9,437 9,503 9,450 9,671 9,706 9,766 9,848
TELUS $57.63 $59.10 $60.39 $61.38 $63.13 $63.80 $64.76 $65.73 $66.72 TELUS 6,971 7,340 7,670 7,807 8,281 8,588 8,876 9,151 9,414
Network Revenue Growth (YoY) Postpaid Wireless Subcribers (000s)
BCE 9.2% 6.4% 6.5% 5.5% 6.4% 6.4% 5.0% 4.7% 4.1% BCE 5,541 5,975 6,425 6,678 7,110 7,409 7,710 7,981 8,226
Rogers 5.2% 0.5% 1.8% 0.4% -0.1% 2.6% 3.3% 2.8% 2.6% Rogers 7,325 7,574 7,846 8,074 8,073 8,167 8,236 8,330 8,447
TELUS 5.0% 8.5% 7.3% 5.1% 6.5% 6.4% 6.2% 4.8% 4.5% TELUS 5,705 6,130 6,543 6,751 7,108 7,428 7,737 8,035 8,324
Network EBITDA Margins (%) Postpaid Net Additions (000s)
BCE 38% 38% 42% 44% 45% 46% 48% 48% 49% BCE 500 434 457 378 312 299 301 271 246
Rogers 48% 46% 46% 47% 48% 47% 48% 49% 50% Rogers 319 269 268 228 (1) 2 69 94 117
TELUS 44% 44% 46% 46% 45% 45% 48% 49% 50% TELUS 415 425 414 378 357 320 309 298 289
Capex Intensity (%) Postpaid Churn (%)
BCE 9.8% 11.8% 11.4% 10.9% 10.9% 10.6% 11.0% 11.0% 11.0% BCE 1.33% 1.47% 1.28% 1.26% 1.22% 1.22% 1.20% 1.20% 1.20%
Rogers 13.4% 16.7% 15.4% 11.9% 13.4% 12.4% 12.1% 11.7% 11.4% Rogers 1.18% 1.32% 1.29% 1.24% 1.27% 1.30% 1.25% 1.24% 1.23%
TELUS 9.2% 9.2% 12.1% 11.5% 12.5% 13.0% 11.3% 10.0% 9.6% TELUS 1.13% 1.31% 1.09% 1.03% 0.93% 0.86% 0.88% 0.88% 0.88%
Revenue Growth (YoY) Television Net Additions (000s)
BCE 0.3% -0.7% -3.8% -1.2% -0.3% 0.0% 0.7% 1.1% 1.4% BCE 71 68 69 122 153 111 106 101 96
Cogeco Cable 11.5% 8.7% 5.4% 3.2% 2.4% 0.8% 0.8% 0.2% 0.0% Cogeco Cable 10 3 (15) (28) (38) (30) (32) (33) (30)
Manitoba Telecom -3.2% 2.2% -0.2% 0.2% 3.4% 2.1% 0.4% 0.9% 1.3% Manitoba Telecom 3 6 2 8 3 (1) (1) (1) (1)
Quebecor 10.0% 7.3% 6.5% 7.2% 1.4% -1.5% -0.2% 0.7% 0.8% Quebecor 35 50 (7) (30) (43) (45) (41) (37) (33)
Rogers 3.6% 3.9% 1.5% 3.5% -0.2% 0.0% 0.0% 0.4% 0.5% Rogers 4 (14) (83) (127) (103) (133) (93) (74) (59)
Shaw 11.3% 5.7% 3.2% 2.3% 3.0% 0.8% 1.8% 2.4% 3.0% Shaw 7 (48) (70) (116) (106) (127) (83) (69) (58)
TELUS -2.2% 3.6% 2.9% 3.8% 2.7% 2.2% 3.4% 3.5% 3.4% TELUS 144 196 170 137 101 84 67 54 43
EBITDA Margins (%) Telephony Net Additions (000s)
BCE 38.7% 39.1% 38.4% 37.6% 40.1% 40.6% 41.1% 41.5% 41.7% BCE (386) (374) (457) (402) (465) (404) (364) (328) (295)
Cogeco Cable 44.5% 46.9% 48.3% 49.8% 51.1% 51.5% 51.7% 51.6% 51.6% Cogeco Cable 76 61 53 13 (15) (10) (8) (8) (8)
Manitoba Telecom 51.8% 50.2% 50.5% 47.9% 47.1% 46.0% 45.5% 44.8% 44.2% Manitoba Telecom (27) (20) (27) (20) (16) (20) (19) (19) (18)
Quebecor 48.8% 49.9% 50.9% 48.8% 50.4% 51.9% 52.3% 51.9% 51.6% Quebecor 100 91 60 21 (7) (11) (12) (14) (15)
Rogers 44.7% 46.8% 47.8% 49.4% 48.0% 47.3% 47.3% 47.8% 48.3% Rogers (12) (1) 23 42 (3) (51) (32) (32) (32)
Shaw 47.5% 46.9% 44.1% 47.2% 49.2% 45.5% 45.5% 46.3% 47.2% Shaw 237 137 131 53 15 (51) (11) (11) (11)
TELUS 32.8% 31.2% 28.7% 26.0% 26.6% 26.3% 28.3% 30.0% 31.4% TELUS (227) (146) (188) (151) (85) (93) (86) (79) (72)
Capex Intensity (%) Internet Net Additions (000s)
BCE 18.5% 18.6% 21.5% 22.3% 23.5% 22.6% 22.5% 22.5% 22.5% BCE 6 (17) 1 29 160 151 144 137 130
Cogeco Cable 29.8% 29.8% 26.3% 18.8% 17.8% 17.8% 17.0% 17.2% 17.2% Cogeco Cable 44 42 33 16 18 24 22 21 20
Manitoba Telecom 25.0% 18.9% 22.3% 19.8% 20.9% 17.7% 19.0% 19.0% 19.0% Manitoba Telecom (2) (1) 1 12 8 2 4 4 3
Quebecor 22.4% 25.3% 26.1% 16.6% 19.7% 20.8% 21.2% 22.2% 23.1% Quebecor 82 80 55 31 18 20 18 16 15
Rogers 19.2% 22.6% 24.8% 31.8% 30.4% 32.0% 31.4% 31.4% 31.3% Rogers 64 83 73 63 50 24 35 32 28
Shaw 25.9% 22.9% 25.4% 26.5% 29.4% 30.3% 22.1% 21.4% 20.5% Shaw 110 54 35 28 40 29 33 31 30
TELUS 25.6% 26.3% 24.2% 25.7% 27.3% 27.6% 27.6% 27.6% 26.7% TELUS 14 57 74 61 74 82 69 59 50
Revenue Growth (%) EBITDA Margins (%)
BCE n/a n/a 41.6% 17.1% 14.9% 0.3% 2.1% 4.8% 3.0% BCE n/a 21.7% 25.7% 26.7% 25.0% 24.4% 24.5% 25.0% 24.8%
Quebecor 1.0% -0.9% -3.3% -8.3% -2.9% 9.5% 4.3% 0.8% 0.6% Quebecor 18.6% 13.9% 10.8% 11.4% 6.7% 5.1% 8.0% 8.5% 8.5%
Rogers 6.7% 7.3% 0.6% 5.2% 7.2% 10.4% 1.0% 1.0% 1.0% Rogers 9.8% 11.2% 11.7% 9.4% 7.2% 8.7% 8.7% 8.7% 8.7%
Shaw -5.7% 0.2% 18.2% 5.0% -0.9% -1.3% 1.0% 0.5% 0.0% Shaw 29.6% 28.2% 31.5% 31.9% 32.2% 31.0% 31.0% 31.0% 31.0%
MED
IAW
IREL
ESS
WIR
ELIN
E
Notes (i) Manitoba Telecom for MTS only. Margin and capex intensity include wireless; (ii) Cogeco data for Canadian Cable Services only; (iii) Shaw wireline capex excludes satellite; (iv) Segmented capex intensity excludes spectrum and is calculated as a percentage of total segmented revenue; and (v) BCE 2014 figures restated to include Bell Aliant in Bell segmented results and operating metrics. Sources: Company reports, RBC Capital Markets estimates
RBC Telecom Scenario Report
August 19, 2015 28
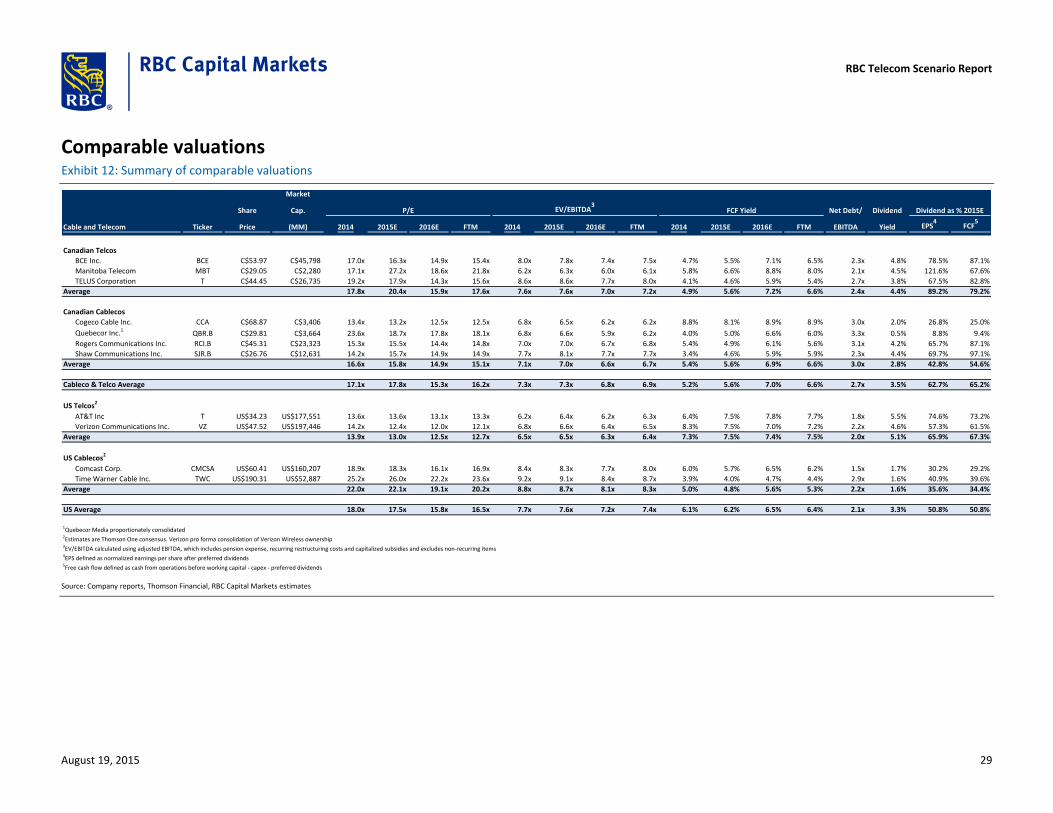
Comparable valuations Exhibit 12: Summary of comparable valuations
Market MARKET DATA
Share Cap. P/E EV/EBITDA3
Net Debt/ Dividend Dividend as % 2015E
Ticker Price (MM) 2014 2015E 2016E FTM 2014 2015E 2016E FTM 2014 2015E 2016E FTM EBITDA Yield EPS4
FCF5
Canadian Telcos
BCE Inc. BCE C$53.97 C$45,798 17.0x 16.3x 14.9x 15.4x 8.0x 7.8x 7.4x 7.5x 4.7% 5.5% 7.1% 6.5% 2.3x 4.8% 78.5% 87.1%
Manitoba Telecom MBT C$29.05 C$2,280 17.1x 27.2x 18.6x 21.8x 6.2x 6.3x 6.0x 6.1x 5.8% 6.6% 8.8% 8.0% 2.1x 4.5% 121.6% 67.6%
TELUS Corporation T C$44.45 C$26,735 19.2x 17.9x 14.3x 15.6x 8.6x 8.6x 7.7x 8.0x 4.1% 4.6% 5.9% 5.4% 2.7x 3.8% 67.5% 82.8%
Average 17.8x 20.4x 15.9x 17.6x 7.6x 7.6x 7.0x 7.2x 4.9% 5.6% 7.2% 6.6% 2.4x 4.4% 89.2% 79.2%
Canadian Cablecos
Cogeco Cable Inc. CCA C$68.87 C$3,406 13.4x 13.2x 12.5x 12.5x 6.8x 6.5x 6.2x 6.2x 8.8% 8.1% 8.9% 8.9% 3.0x 2.0% 26.8% 25.0%
Quebecor Inc.1QBR.B C$29.81 C$3,664 23.6x 18.7x 17.8x 18.1x 6.8x 6.6x 5.9x 6.2x 4.0% 5.0% 6.6% 6.0% 3.3x 0.5% 8.8% 9.4%
Rogers Communications Inc. RCI.B C$45.31 C$23,323 15.3x 15.5x 14.4x 14.8x 7.0x 7.0x 6.7x 6.8x 5.4% 4.9% 6.1% 5.6% 3.1x 4.2% 65.7% 87.1%
Shaw Communications Inc. SJR.B C$26.76 C$12,631 14.2x 15.7x 14.9x 14.9x 7.7x 8.1x 7.7x 7.7x 3.4% 4.6% 5.9% 5.9% 2.3x 4.4% 69.7% 97.1%
Average 16.6x 15.8x 14.9x 15.1x 7.1x 7.0x 6.6x 6.7x 5.4% 5.6% 6.9% 6.6% 3.0x 2.8% 42.8% 54.6%
Cableco & Telco Average 17.1x 17.8x 15.3x 16.2x 7.3x 7.3x 6.8x 6.9x 5.2% 5.6% 7.0% 6.6% 2.7x 3.5% 62.7% 65.2%
US Telcos2
AT&T Inc T US$34.23 US$177,551 13.6x 13.6x 13.1x 13.3x 6.2x 6.4x 6.2x 6.3x 6.4% 7.5% 7.8% 7.7% 1.8x 5.5% 74.6% 73.2%
Verizon Communications Inc. VZ US$47.52 US$197,446 14.2x 12.4x 12.0x 12.1x 6.8x 6.6x 6.4x 6.5x 8.3% 7.5% 7.0% 7.2% 2.2x 4.6% 57.3% 61.5%
Average 13.9x 13.0x 12.5x 12.7x 6.5x 6.5x 6.3x 6.4x 7.3% 7.5% 7.4% 7.5% 2.0x 5.1% 65.9% 67.3%
US Cablecos2
Comcast Corp. CMCSA US$60.41 US$160,207 18.9x 18.3x 16.1x 16.9x 8.4x 8.3x 7.7x 8.0x 6.0% 5.7% 6.5% 6.2% 1.5x 1.7% 30.2% 29.2%
Time Warner Cable Inc. TWC US$190.31 US$52,887 25.2x 26.0x 22.2x 23.6x 9.2x 9.1x 8.4x 8.7x 3.9% 4.0% 4.7% 4.4% 2.9x 1.6% 40.9% 39.6%
Average 22.0x 22.1x 19.1x 20.2x 8.8x 8.7x 8.1x 8.3x 5.0% 4.8% 5.6% 5.3% 2.2x 1.6% 35.6% 34.4%
US Average 18.0x 17.5x 15.8x 16.5x 7.7x 7.6x 7.2x 7.4x 6.1% 6.2% 6.5% 6.4% 2.1x 3.3% 50.8% 50.8%
1Quebecor Media proportionately consolidated2Estimates are Thomson One consensus. Verizon pro forma consolidation of Verizon Wireless ownership3EV/EBITDA calculated using adjusted EBITDA, which includes pension expense, recurring restructuring costs and capitalized subsidies and excludes non-recurring items4EPS defined as normalized earnings per share after preferred dividends5Free cash flow defined as cash from operations before working capital - capex - preferred dividends
Cable and Telecom
FCF Yield
Source: Company reports, Thomson Financial, RBC Capital Markets estimates
RBC Telecom Scenario Report
August 19, 2015 29
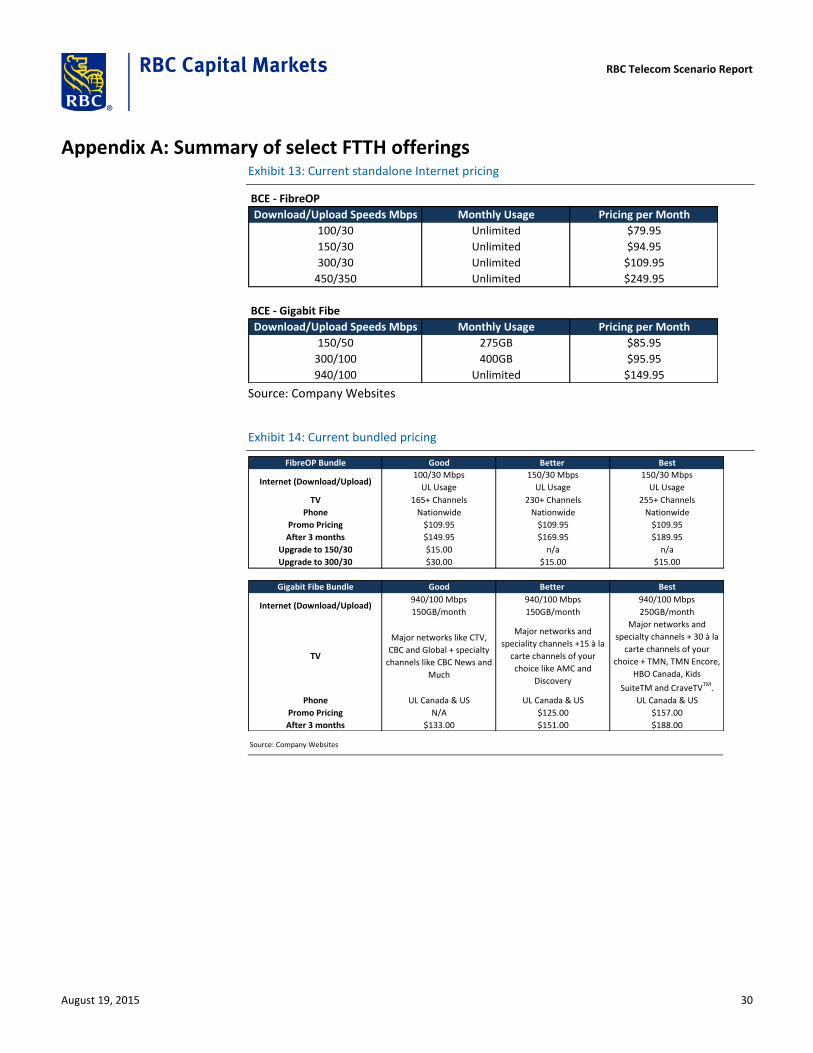
Appendix A: Summary of select FTTH offerings Exhibit 13: Current standalone Internet pricing
BCE - FibreOP
Download/Upload Speeds Mbps Monthly Usage Pricing per Month
100/30 Unlimited $79.95
150/30 Unlimited $94.95
300/30 Unlimited $109.95
450/350 Unlimited $249.95
BCE - Gigabit Fibe
Download/Upload Speeds Mbps Monthly Usage Pricing per Month
150/50 275GB $85.95
300/100 400GB $95.95
940/100 Unlimited $149.95
Source: Company Websites
Exhibit 14: Current bundled pricing
FibreOP Bundle Good Better Best
Internet (Download/Upload)100/30 Mbps
UL Usage
150/30 Mbps
UL Usage
150/30 Mbps
UL Usage
TV 165+ Channels 230+ Channels 255+ Channels
Phone Nationwide Nationwide Nationwide
Promo Pricing $109.95 $109.95 $109.95
After 3 months $149.95 $169.95 $189.95
Upgrade to 150/30 $15.00 n/a n/a
Upgrade to 300/30 $30.00 $15.00 $15.00
Gigabit Fibe Bundle Good Better Best
Internet (Download/Upload)940/100 Mbps
150GB/month
940/100 Mbps
150GB/month
940/100 Mbps
250GB/month
TV
Major networks like CTV,
CBC and Global + specialty
channels like CBC News and
Much
Major networks and
speciality channels +15 à la
carte channels of your
choice like AMC and
Discovery
Major networks and
specialty channels + 30 à la
carte channels of your
choice + TMN, TMN Encore,
HBO Canada, Kids
SuiteTM and CraveTVTM.
Phone UL Canada & US UL Canada & US UL Canada & US
Promo Pricing N/A $125.00 $157.00
After 3 months $133.00 $151.00 $188.00
Source: Company Websites
RBC Telecom Scenario Report
August 19, 2015 30
Previous RBC Telecom Scenario Reports The purpose of this report series is to examine potential scenarios within the Canadian telecom sector that could have implications for investors. As scenarios consider a range of outcomes with uncertain probabilities, our primary objective is to provide additional qualitative and quantitative analysis that can bring incremental perspective to investors.
September 3, 2014 – Rogers Communications - Big Bang Theory and the Five-Year Bull Case
October 10, 2013 – Sizing Up a BCE-Bell Aliant Transaction
January 15, 2013 – Personal Information Exchange
August 7, 2012 – Manitoba Telecom: On a Path to an End Game?
RBC Telecom Scenario Report
August 19, 2015 31
Companies mentioned BCE Inc. (TSX: BCE; $53.97; Outperform)
Cogeco Cable Inc. (TSX: CCA; $68.87; Outperform)
Manitoba Telecom Services Inc. (TSX: MBT; $29.05; Sector Perform)
Quebecor Inc. (TSX: QBR.B; $29.81, Outperform)
Rogers Communications Inc. (TSX: RCI.B; $45.31, Sector Perform)
Shaw Communications Inc. (TSX: SJR.B; $26.76; Sector Perform)
TELUS Corporation (TSX: T; $44.45; Outperform)
RBC Telecom Scenario Report
August 19, 2015 32
Required disclosures
Non-U.S. analyst disclosureDrew McReynolds, Jeffrey Lau and Haran Posner (i) are not registered/qualified as research analysts with the NYSE and/or FINRAand (ii) may not be associated persons of the RBC Capital Markets, LLC and therefore may not be subject to FINRA Rule 2711and NYSE Rule 472 restrictions on communications with a subject company, public appearances and trading securities held by aresearch analyst account.
Conflicts disclosuresThis product constitutes a compendium report (covers six or more subject companies). As such, RBC Capital Markets chooses toprovide specific disclosures for the subject companies by reference. To access conflict of interest and other disclosures for thesubject companies, clients should refer to https://www.rbccm.com/GLDisclosure/PublicWeb/DisclosureLookup.aspx?entityId=1.These disclosures are also available by sending a written request to RBC Capital Markets Research Publishing, P.O. Box 50, 200 BayStreet, Royal Bank Plaza, 29th Floor, South Tower, Toronto, Ontario M5J 2W7 or an email to [email protected].
The analyst(s) responsible for preparing this research report received compensation that is based upon various factors, includingtotal revenues of the member companies of RBC Capital Markets and its affiliates, a portion of which are or have been generatedby investment banking activities of the member companies of RBC Capital Markets and its affiliates.
Distribution of ratingsFor the purpose of ratings distributions, regulatory rules require member firms to assign ratings to one of three rating categories- Buy, Hold/Neutral, or Sell - regardless of a firm's own rating categories. Although RBC Capital Markets' ratings of Top Pick(TP)/Outperform (O), Sector Perform (SP), and Underperform (U) most closely correspond to Buy, Hold/Neutral and Sell, respectively,the meanings are not the same because our ratings are determined on a relative basis (as described below).
Distribution of ratings
RBC Capital Markets, Equity Research
As of 30-Jun-2015
Investment Banking
Serv./Past 12 Mos.
Rating Count Percent Count Percent
BUY [Top Pick & Outperform] 935 53.15 293 31.34
HOLD [Sector Perform] 707 40.19 124 17.54
SELL [Underperform] 117 6.65 6 5.13
Conflicts policyRBC Capital Markets Policy for Managing Conflicts of Interest in Relation to Investment Research is available from us on request.To access our current policy, clients should refer tohttps://www.rbccm.com/global/file-414164.pdfor send a request to RBC Capital Markets Research Publishing, P.O. Box 50, 200 Bay Street, Royal Bank Plaza, 29th Floor, SouthTower, Toronto, Ontario M5J 2W7. We reserve the right to amend or supplement this policy at any time.
Dissemination of research and short-term trade ideasRBC Capital Markets endeavors to make all reasonable efforts to provide research simultaneously to all eligible clients, havingregard to local time zones in overseas jurisdictions. RBC Capital Markets' equity research is posted to our proprietary websiteto ensure eligible clients receive coverage initiations and changes in ratings, targets and opinions in a timely manner. Additionaldistribution may be done by the sales personnel via email, fax, or other electronic means, or regular mail. Clients may alsoreceive our research via third party vendors. RBC Capital Markets also provides eligible clients with access to SPARC on the Firmsproprietary INSIGHT website, via email and via third-party vendors. SPARC contains market color and commentary regardingsubject companies on which the Firm currently provides equity research coverage. Research Analysts may, from time to time,
RBC Telecom Scenario Report
August 19, 2015 33
include short-term trade ideas in research reports and / or in SPARC. A short-term trade idea offers a short-term view onhow a security may trade, based on market and trading events, and the resulting trading opportunity that may be available. Ashort-term trade idea may differ from the price targets and recommendations in our published research reports reflecting theresearch analyst's views of the longer-term (one year) prospects of the subject company, as a result of the differing time horizons,methodologies and/or other factors. Thus, it is possible that a subject company's common equity that is considered a long-term'Sector Perform' or even an 'Underperform' might present a short-term buying opportunity as a result of temporary selling pressurein the market; conversely, a subject company's common equity rated a long-term 'Outperform' could be considered susceptibleto a short-term downward price correction. Short-term trade ideas are not ratings, nor are they part of any ratings system, andthe firm generally does not intend, nor undertakes any obligation, to maintain or update short-term trade ideas. Short-term tradeideas may not be suitable for all investors and have not been tailored to individual investor circumstances and objectives, andinvestors should make their own independent decisions regarding any securities or strategies discussed herein. Please contactyour investment advisor or institutional salesperson for more information regarding RBC Capital Markets' research.
Analyst certificationAll of the views expressed in this report accurately reflect the personal views of the responsible analyst(s) about any and all ofthe subject securities or issuers. No part of the compensation of the responsible analyst(s) named herein is, or will be, directly orindirectly, related to the specific recommendations or views expressed by the responsible analyst(s) in this report.
The Global Industry Classification Standard (“GICS”) was developed by and is the exclusive property and a service mark of MSCI Inc. (“MSCI”) and Standard & Poor’s Financial ServicesLLC (“S&P”) and is licensed for use by RBC. Neither MSCI, S&P, nor any other party involved in making or compiling the GICS or any GICS classifications makes any express or impliedwarranties or representations with respect to such standard or classification (or the results to be obtained by the use thereof), and all such parties hereby expressly disclaim all warrantiesof originality, accuracy, completeness, merchantability and fitness for a particular purpose with respect to any of such standard or classification. Without limiting any of the foregoing,in no event shall MSCI, S&P, any of their affiliates or any third party involved in making or compiling the GICS or any GICS classifications have any liability for any direct, indirect, special,punitive, consequential or any other damages (including lost profits) even if notified of the possibility of such damages.
Disclaimer
RBC Capital Markets is the business name used by certain branches and subsidiaries of the Royal Bank of Canada, including RBC Dominion Securities Inc., RBCCapital Markets, LLC, RBC Europe Limited, RBC Capital Markets (Hong Kong) Limited, Royal Bank of Canada, Hong Kong Branch and Royal Bank of Canada, SydneyBranch. The information contained in this report has been compiled by RBC Capital Markets from sources believed to be reliable, but no representation or warranty,express or implied, is made by Royal Bank of Canada, RBC Capital Markets, its affiliates or any other person as to its accuracy, completeness or correctness. Allopinions and estimates contained in this report constitute RBC Capital Markets' judgement as of the date of this report, are subject to change without notice andare provided in good faith but without legal responsibility. Nothing in this report constitutes legal, accounting or tax advice or individually tailored investmentadvice. This material is prepared for general circulation to clients and has been prepared without regard to the individual financial circumstances and objectives ofpersons who receive it. The investments or services contained in this report may not be suitable for you and it is recommended that you consult an independentinvestment advisor if you are in doubt about the suitability of such investments or services. This report is not an offer to sell or a solicitation of an offer to buyany securities. Past performance is not a guide to future performance, future returns are not guaranteed, and a loss of original capital may occur. RBC CapitalMarkets research analyst compensation is based in part on the overall profitability of RBC Capital Markets, which includes profits attributable to investment bankingrevenues. Every province in Canada, state in the U.S., and most countries throughout the world have their own laws regulating the types of securities and otherinvestment products which may be offered to their residents, as well as the process for doing so. As a result, the securities discussed in this report may not beeligible for sale in some jurisdictions. RBC Capital Markets may be restricted from publishing research reports, from time to time, due to regulatory restrictions and/or internal compliance policies. If this is the case, the latest published research reports available to clients may not reflect recent material changes in the applicableindustry and/or applicable subject companies. RBC Capital Markets research reports are current only as of the date set forth on the research reports. This report isnot, and under no circumstances should be construed as, a solicitation to act as securities broker or dealer in any jurisdiction by any person or company that is notlegally permitted to carry on the business of a securities broker or dealer in that jurisdiction. To the full extent permitted by law neither RBC Capital Markets norany of its affiliates, nor any other person, accepts any liability whatsoever for any direct or consequential loss arising from any use of this report or the informationcontained herein. No matter contained in this document may be reproduced or copied by any means without the prior consent of RBC Capital Markets.
Additional information is available on request.
To U.S. Residents:This publication has been approved by RBC Capital Markets, LLC (member FINRA, NYSE, SIPC), which is a U.S. registered broker-dealer and which acceptsresponsibility for this report and its dissemination in the United States. Any U.S. recipient of this report that is not a registered broker-dealer or a bank acting ina broker or dealer capacity and that wishes further information regarding, or to effect any transaction in, any of the securities discussed in this report, shouldcontact and place orders with RBC Capital Markets, LLC.To Canadian Residents:This publication has been approved by RBC Dominion Securities Inc.(member IIROC). Any Canadian recipient of this report that is not a Designated Institution inOntario, an Accredited Investor in British Columbia or Alberta or a Sophisticated Purchaser in Quebec (or similar permitted purchaser in any other province) andthat wishes further information regarding, or to effect any transaction in, any of the securities discussed in this report should contact and place orders with RBCDominion Securities Inc., which, without in any way limiting the foregoing, accepts responsibility for this report and its dissemination in Canada.To U.K. Residents:This publication has been approved by RBC Europe Limited ('RBCEL') which is authorized by the Prudential Regulation Authority and regulated by the FinancialConduct Authority ('FCA') and the Prudential Regulation Authority, in connection with its distribution in the United Kingdom. This material is not for general
RBC Telecom Scenario Report
August 19, 2015 34

distribution in the United Kingdom to retail clients, as defined under the rules of the FCA. However, targeted distribution may be made to selected retail clients ofRBC and its affiliates. RBCEL accepts responsibility for this report and its dissemination in the United Kingdom.To Persons Receiving This Advice in Australia:This material has been distributed in Australia by Royal Bank of Canada - Sydney Branch (ABN 86 076 940 880, AFSL No. 246521). This material has been preparedfor general circulation and does not take into account the objectives, financial situation or needs of any recipient. Accordingly, any recipient should, before acting onthis material, consider the appropriateness of this material having regard to their objectives, financial situation and needs. If this material relates to the acquisitionor possible acquisition of a particular financial product, a recipient in Australia should obtain any relevant disclosure document prepared in respect of that productand consider that document before making any decision about whether to acquire the product. This research report is not for retail investors as defined in section761G of the Corporations Act.To Hong Kong Residents:This publication is distributed in Hong Kong by RBC Capital Markets (Hong Kong) Limited and Royal Bank of Canada, Hong Kong Branch (both entities which areregulated by the Hong Kong Monetary Authority ('HKMA') and the Securities and Futures Commission ('SFC')). Financial Services provided to Australia: Financialservices may be provided in Australia in accordance with applicable law. Financial services provided by the Royal Bank of Canada, Hong Kong Branch are providedpursuant to the Royal Bank of Canada's Australian Financial Services Licence ('AFSL') (No. 246521). RBC Capital Markets (Hong Kong) Limited is exempt from therequirement to hold an AFSL under the Corporations Act 2001 in respect of the provision of such financial services. RBC Capital Markets (Hong Kong) Limited isregulated by the HKMA and the SFC under the laws of Hong Kong, which differ from Australian laws.To Singapore Residents:This publication is distributed in Singapore by the Royal Bank of Canada, Singapore Branch, a registered entity granted offshore bank licence by the MonetaryAuthority of Singapore. This material has been prepared for general circulation and does not take into account the objectives, financial situation, or needs of anyrecipient. You are advised to seek independent advice from a financial adviser before purchasing any product. If you do not obtain independent advice, you shouldconsider whether the product is suitable for you. Past performance is not indicative of future performance. If you have any questions related to this publication,please contact the Royal Bank of Canada, Singapore Branch. Royal Bank of Canada, Singapore Branch accepts responsibility for this report and its disseminationin Singapore.To Japanese Residents:Unless otherwise exempted by Japanese law, this publication is distributed in Japan by or through RBC Capital Markets (Japan) Ltd., a registered type one financialinstruments firm and/or Royal Bank of Canada, Tokyo Branch, a licensed foreign bank.
.® Registered trademark of Royal Bank of Canada. RBC Capital Markets is a trademark of Royal Bank of Canada. Used under license.Copyright © RBC Capital Markets, LLC 2015 - Member SIPC
Copyright © RBC Dominion Securities Inc. 2015 - Member Canadian Investor Protection FundCopyright © RBC Europe Limited 2015
Copyright © Royal Bank of Canada 2015All rights reserved
RBC Telecom Scenario Report
August 19, 2015 35


![FIS for the RBC/RBC Handover...4.2.1.1 The RBC/RBC communication shall be established according to the rules of the underlying RBC-RBC Safe Communication Interface [Subset-098]. Further](https://img.pdfslide.us/doc/110x75/5e331307d520b57b5677b3fa/fis-for-the-rbcrbc-handover-4211-the-rbcrbc-communication-shall-be-established.jpg)