Embed Size (px)
Citation preview
This report documents program activity and outcomes of offenders who participated in the suite of Drug Summit-funded treatment programs in NSW correctional centres over a three and a half year period to December 2010. This evaluation forms part of a broader initiative, the Corrections Treatment Outcome study (CTOS), which was designed to gauge the overall success of drug treatment programs provided to custody-based offenders within Corrective Services NSW. The CTOS methodology sought to examine the short and medium term cognitive and behavioural outcomes of program participants, identify factors affecting program success and explore the views of staff and participants involved. In addition to program entry and exit assessments, objective measures were derived from official records on offences in custody, detected drug use in custody and recidivism post-release. Findings at three years were encouraging with the attitudinal and behavioural improvements observed in program participants during custody supported by comparatively low recidivism rates post-release. Factors affecting program success are also reported. A key implication for service delivery is the need to identify ways to motivate and maintain treatment engagement in order to maximise program retention and completion rates.
Corrective Services NSW Corporate Research, Evaluation and Statistics
Corrections Treatment Outcome Study (CTOS) on offenders in drug treatment: Results from the Drug Summit demand reduction residential programs
KEY FINDINGS
Program activity
In the three and a half year period between July 2007 and December 2010, 321 offenders participated in custody-based Drug Summit-funded treatment programs. A total of 210 participants graduated from these programs during this period. For those with a program outcome determination within the period, the program completion rate was 67%. Participants of ATSI background showed a higher program completion rate than those of non-ATSI background (75% vs. 63%).
Reaching the target population The baseline profile of program entrants showed that these programs were reaching a drug-involved offender population of high risk and need. Around nine in ten participants (92%) had current drug-related offences and were classified as dependent on drugs (89%) just prior to their current custodial episode. A large majority (93%) of participants were classified as having a medium or higher reoffending risk level at baseline. More than one-third (34%) of participants had a history of psychiatric hospitalisation. More than one-third (39%) had been charged with a drug offence in custody before entering the program. Of those participants who had engaged in counselling or group-based treatment in the past, 40% had only done so while in NSW correctional facilities. Prison had provided the only exposure to psychology-based drug treatment for these inmates.
Outcomes and impacts When compared with baseline results, program graduates showed improvements in levels of abstinence from drug use (99% versus 80% abstinent from drugs in last 30 days), motivation to change (93% versus 87% in the action stage of problem resolution) and self-efficacy in relation to high-risk situations for drug use (median score 86 versus 66) and criminal activity (mean score of 94 versus 81). Among graduates, 66% had received referrals for ongoing treatment. Program graduates showed significant reductions in detected drug use with a decline in the rate of positive test results both three months (8%) and six months after program entry (12%), when compared with three months prior to program entry (27%). Program participants showed improvements in pro-social behaviour with a decline in offences in custody rates both three months (18%) and six months after program entry (14%), when compared with three months prior to program entry (24%). Of those program participants who had been released to the community for at least 12 months, 27% had returned to custody on a new sentence within 12 months. The Bolwara Transitional Centre program represented a key point of transition for survival in the community. The program was found to provide a protective factor for recidivism, with participants 30% less likely to return to custody than a non-program matched sample, after controlling for other risk factors.
Maria Kevin, Research and Evaluation Manager (AOD)
2
Definitions and explanatory notes
1. Drug/s: Includes alcohol and illicit drugs (AOD).
2. Getting SMART (Self-Management and Recovery Training) – moderate intensity group-based program of 12 sessions (24 hours). The orientation is cognitive-behavioural and psycho-educational with a focus on skill acquisition and self-management. It comprises four key areas: motivation to abstain, coping with urges, problem solving and lifestyle balance. The program was designed as an introduction to the principles of SMART Recovery®.
3. SMART Recovery® - cognitively-based, self-help program that is also available in the general community –
provides support meetings for participants in terms of maintaining relapse prevention and coping skills.
4. Bridge Program – group-based drug treatment program developed by the Salvation Army – six session (18 hours) program conducted over two weeks - cognitive-behavioural in orientation, addressing stages of change and coping skills.
5. Pathways - Criminal Conduct and Substance Abuse Treatment: Strategies for Self-Improvement and
Change: pathways to responsible living (Wanberg and Milkman, 2008) – intensive, 50 session (100 hours), group-based program that links drug use and criminal behaviour over three stages – Challenge to Change, Commitment to Change and Taking Ownership of Change. The orientation is cognitive-behavioural, focussing on skill acquisition and self-management.
6. AA/NA – Alcoholics Anonymous and Narcotics Anonymous - self-help programs for people with alcohol or
drug problems that are based on a set of guiding principles or 12 steps that outline a course of action for recovery from addiction.
7. Recidivism/reoffending – return to Corrective Services, NSW on a new custodial sentence subsequent to
being released to freedom.
8. ATSI – Aboriginal/Torres Strait Islander background.
9. OIMS – Offender Integrated Management System – the main electronic platform for recording, managing and obtaining information on offenders managed by CSNSW.
CONTENTS Introduction ...................................................................... 3 Method ............................................................................. 4 Results ............................................................................. 7 Program description ................................................... 7 Program activity .......................................................... 7 Program reach – participant profile ........................ 10 Program outcomes ................................................... 12 BTC – a key transition point .................................... 17 Program participants - perceptions ......................... 20 Program staff – perceptions .................................... 21 Discussion ...................................................................... 26 References ..................................................................... 29 Annexure ........................................................................ 31 List of Tables .................................................................. 34
ACKNOWLEDGEMENTS
• Simon Corben and Zachary Xie for programming, extracting and transforming data and assistance with analysis of recidivism and other official record data.
• Simon Eyland, Kyleigh Heggie and Abilio De Almeida Neto for supporting the project and providing critical review of the report.
• Kevin O’Sullivan, Offender Services and Programs for supporting the development of the Alcohol, Drugs and Addictions, Screening, Assessment and Evaluation data base.
• David Alcott for providing desktop publishing support.
• Program staff of POISE, Bolwara Transitional Centre and Phoenix for administering the pre- and post- assessment interviews with participants and assisting with follow-up interviews.
• Program participants for consenting to provide personal information to assist in the evaluation of their program.

3
INTRODUCTION All prior research on the NSW offender population has yielded high rates of drug-related offending and drug morbidity. More than two-thirds of offenders in custody report that their most recent offences were drug-related (Stathis, et al. 1991; Kevin, 2000; Kevin, 2003; Kevin, 2005; Kevin, 2007 and Kevin, 2010). According to Welt and colleagues, 2001 (cited in Stevens, et al. 2003) the association between drug use and criminal activity is “one of the most reliable results obtainable in criminology”. Moreover, drug use can exacerbate the frequency and severity of criminal activity and the two behaviours may become mutually sustaining. A number of meta-analytical studies have identified drug misuse as a reliable predictor of reoffending (Gendreau, et al. 1996; Bonta, et al. 1998; and Dowden and Brown, 2002). Similarly, findings on NSW offenders indicate that drug1 misuse is a dynamic risk factor in reoffending. Those with current drug-related offences are significantly more likely to have served prior prison terms than those whose offences are not drug-related (Kevin, 1992). Internationally there has been a growing emphasis on drug treatment in prison settings. This coincides with a growing body of evidence confirming the effectiveness of drug treatment on drug use and reoffending and health and employment outcomes (Prendergast, et al. 2002; Prendergast, et al. 2003; Pelissier, et al. 2003; and Stevens, et al. 2003). Generally treatment results have shown greater impact on health improvements than reductions in reoffending. Improved outcomes in terms of coping abilities, knowledge acquisition and self-confidence have also been reported (Peters, et al. 1993). A recent Campbell Collaboration review of the extant evidence concluded that participation in prison-based drug treatment programs was associated with modest reductions in post-treatment reoffending. Therapeutic community-style programs or more intensive programs demonstrated the strongest and most consistent reductions in reoffending (Mitchell, et al. 2006). The review also concluded that the most effective drug treatment programs were those that also addressed other problem areas in the lives of drug-involved offenders. Program retention and longer program length (at least several months) have been identified as key factors leading to drug treatment success (Prendegast, et al. 2000). Program integrity and program evaluation, high staff/participant ratios, drug testing, motivational techniques, cognitive-behavioural approaches and aftercare have all been linked to better drug treatment outcomes (Stevens, et al. 2003). The same authors also reported on individual characteristics that have been associated with program completion and better outcomes. These included age, legal status, educational level and employment history, mental health, motivational level, self-efficacy and primary drug of use. Program factors found to be predictive of drug treatment
engagement and retention in a prison setting are counsellor support and peer support (Welsh and McGrain, 2008). Strengthening social support within drug programs has also been associated with reductions in reoffending (Klebe and O’Keefe, 2004). Given that drug dependent offenders are commonly prolific offenders even modest reductions in their offending could be cost-effective (Gossop, et al. 2000). In further support of the cost-effectiveness of drug treatment, the Home Office Drug Treatment Outcome Study (DTORS) 2009 reported that drug treatment had around an 80 per cent chance of being cost-beneficial at the individual level. Although, it was not clear as to whether this translates to crime reduction at a societal level. The DTORS study concluded that most improvements in participants occur within the first few months of treatment and identified the need for treatment to be sufficiently flexible in delivery in order to meet the differing treatment needs of participants. Drug-involved offenders often present with multiple interrelated health, social and supervision needs. Behaviours (e.g., injecting drug use risk behaviour) and experiences (e.g., auxiliary services and prison sanctions) during imprisonment may also alter the determinants of future drug-related offending in an individual (Belenko, 2006). This implies that effective treatment paths are built on comprehensive assessments, referencing different points in time, including behaviour and interventions during custody. Drug-involved offenders enter treatment at critical times in their criminal careers (McGlothlin, et al. 1977 cited in Stevens at al. 2003). Evidence indicates that imprisonment can provide a timely threshold for intervention with drug-involved offenders. On arrival to prison, around half of all NSW offenders report experiencing drug withdrawal symptoms (Kevin, 2005; Kevin, 2007 & Kevin, 2010). That a vast number of offenders are experiencing drug-related morbidity on arrival to prison calls for significant supervision, monitoring and treatment resources. Addressing drug-related offending has become a priority area for the NSW government in attempting to reduce crime. Corrective Services, NSW (CSNSW) as the agency responsible for the management of offenders serving sentences in custody has a key role to play in this strategy. The 1999 NSW Drug Summit was a major government-led forum that resulted in a plan of action to address the damage caused by alcohol and drugs in society. CSNSW has received enhanced funding under the Drug Summit and subsequent Drug Budgets to deliver a range of drug demand reduction, harm reduction and supply reduction programs within the NSW correctional system. In turn, CSNSW has been required to evaluate the effectiveness of these programs and report on program outputs and outcomes. CSNSW provides a number of drug treatment modalities for imprisoned offenders across the state, ranging from structured group-based programs and individual counselling to a court mandated Compulsory Drug Treatment Correctional Centre. This report addresses
4
programs funded under Drug Budget Three from mid. 2007 to 2011. During this period there were three Drug Summit-funded demand reduction, residential programs in the NSW correctional system - Bolwara Transitional Centre (BTC) for female offenders at Emu Plains; POISE (Personal Ownership, Identity and Self-Empowerment) for female offenders at Emu Plains Correctional Centre; and Phoenix for male offenders at Cessnock Correctional Centre. BTC was a fully-funded, dedicated, pre-release initiative physically separated from the mainstream correctional complex. The program emphasised reintegration and community-based programs and employment. In comparison, POISE and Phoenix programs were relatively low cost programs that utilised CSNSW ‘off-the shelf’, manualised drug treatment programs and core correctional centre resources in program delivery. Rationale The evaluation of the CSNSW Drug Summit custody-based treatment programs has been incorporated into a broader framework of program evaluation known as the Corrections Treatment Outcome Study (CTOS). Custody-based drug treatment programs are typically discrete, low capacity programs. Graduate numbers are generally too low to enable the evaluation of program effects from which meaningful conclusions can be drawn. It was anticipated that CTOS would overcome this sample size limitation as results from CSNSW drug treatment programs would be evaluated as a composite treatment population. This approach is consistent with national and international trends in drug treatment program evaluation conducted in community-based settings (NTORS, 2003, DATOS, 2003, ATOS, 2007 and DTORS, 2009). These large, multi-site evaluation projects have provided evidence in favour of drug treatment. Interestingly, the results from DATOS and NTORS found that despite an overall treatment effect, the type or modality of drug treatment delivered had no significant effect on treatment outcome (Stevens, et al. 2003). While the CSNSW drug treatment programs vary on a number of factors, their theoretical underpinnings, goals and learning objectives and program elements are comparable. A supplementary aim of CTOS was to examine the utility and efficacy of the pre- and post-test evaluation framework. It also sought to determine whether the screening and assessment components were effective in identifying potential candidates for drug treatment – thus providing a valid entry mechanism into drug treatment. Insufficient attention to the role of client and treatment characteristics has been identified as a common weakness of prior drug treatment evaluations with offenders (Stevens, et al. 2003). The current study made attempts to redress this within a correctional context by examining a range of individual and program characteristics in relation to program outcome.
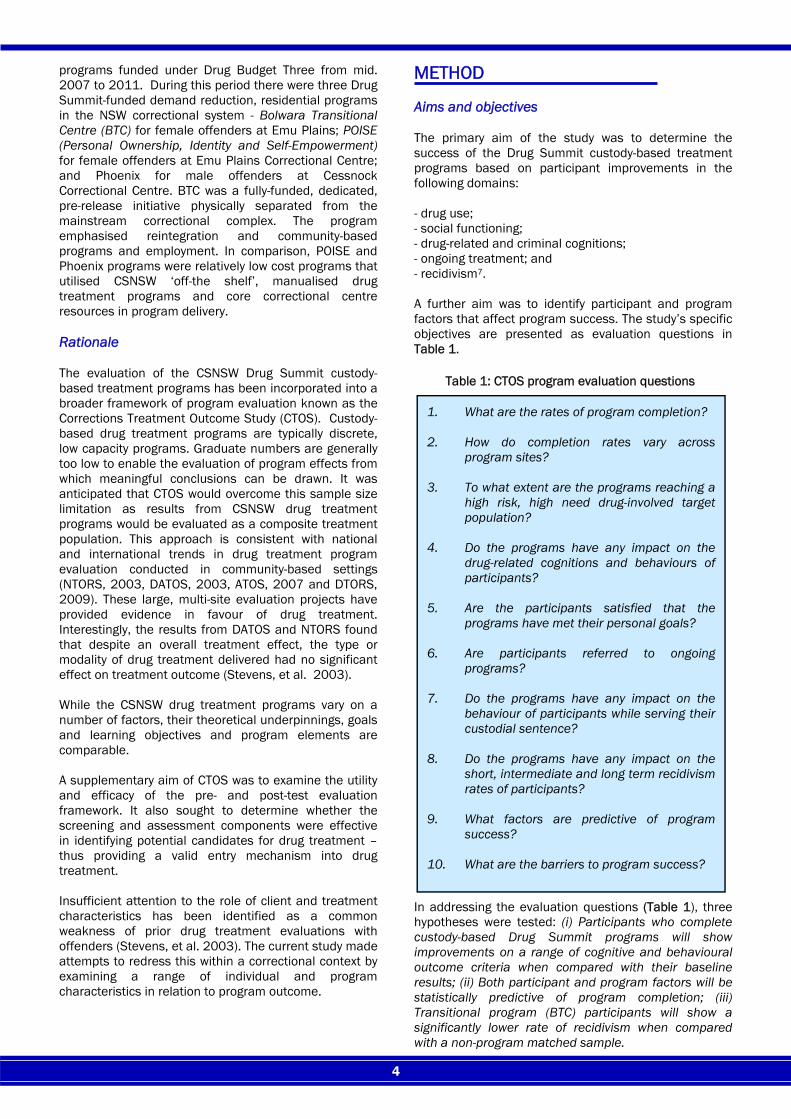
METHOD Aims and objectives The primary aim of the study was to determine the success of the Drug Summit custody-based treatment programs based on participant improvements in the following domains: - drug use; - social functioning; - drug-related and criminal cognitions; - ongoing treatment; and - recidivism7. A further aim was to identify participant and program factors that affect program success. The study’s specific objectives are presented as evaluation questions in Table 1.
In addressing the evaluation questions (Table 1), three hypotheses were tested: (i) Participants who complete custody-based Drug Summit programs will show improvements on a range of cognitive and behavioural outcome criteria when compared with their baseline results; (ii) Both participant and program factors will be statistically predictive of program completion; (iii) Transitional program (BTC) participants will show a significantly lower rate of recidivism when compared with a non-program matched sample.
1. What are the rates of program completion? 2. How do completion rates vary across
program sites? 3. To what extent are the programs reaching a
high risk, high need drug-involved target population?
4. Do the programs have any impact on the
drug-related cognitions and behaviours of participants?
5. Are the participants satisfied that the
programs have met their personal goals? 6. Are participants referred to ongoing
programs? 7. Do the programs have any impact on the
behaviour of participants while serving their custodial sentence?
8. Do the programs have any impact on the
short, intermediate and long term recidivism rates of participants?
9. What factors are predictive of program
success? 10. What are the barriers to program success?
Table 1: CTOS program evaluation questions
5
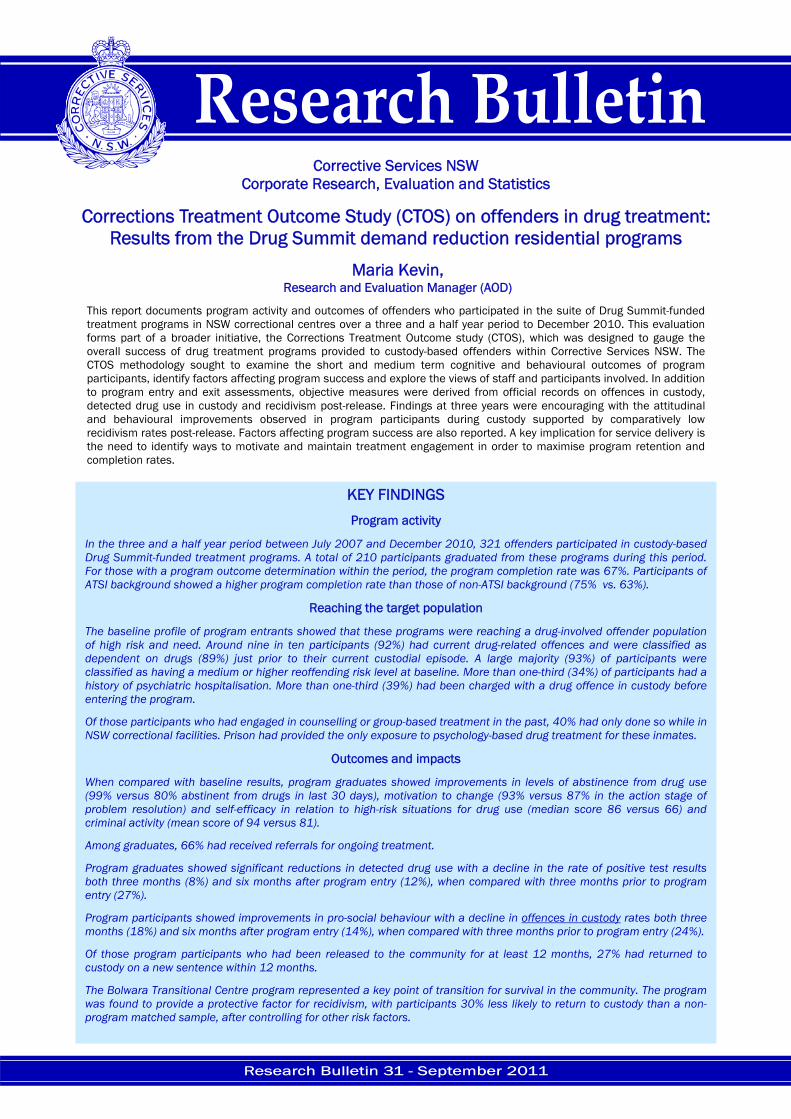
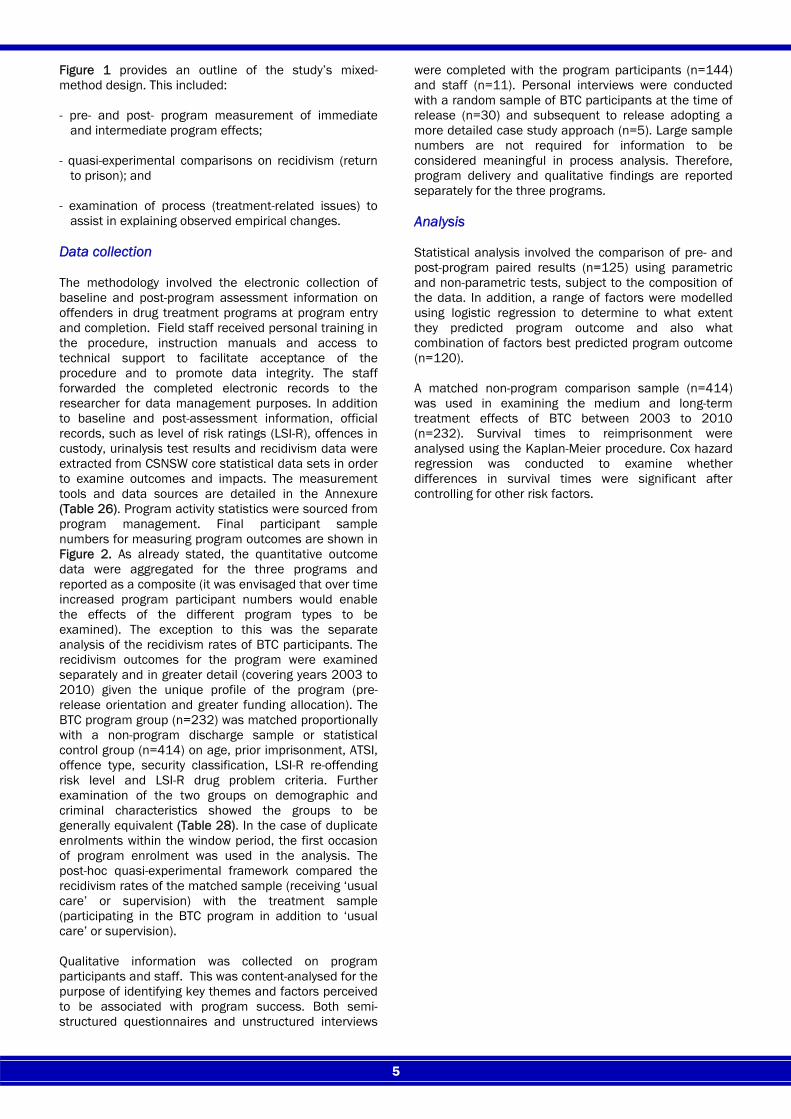
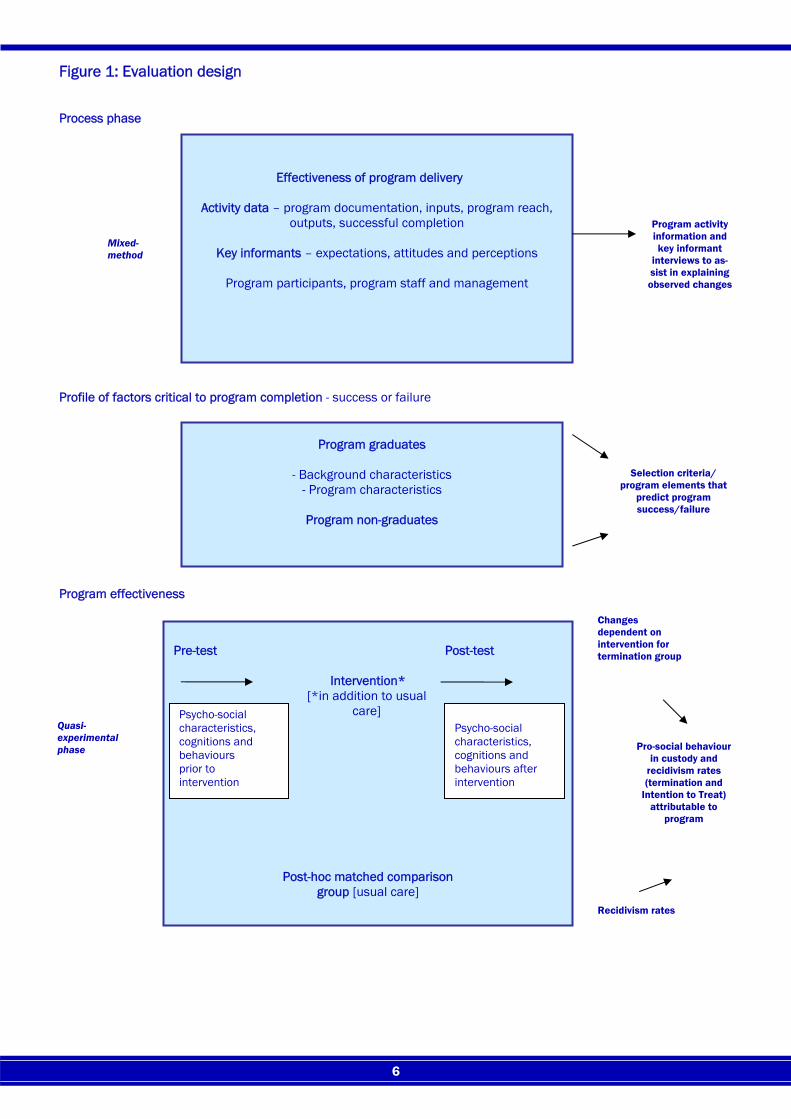
Figure 1 provides an outline of the study’s mixed-method design. This included: - pre- and post- program measurement of immediate
and intermediate program effects; - quasi-experimental comparisons on recidivism (return
to prison); and - examination of process (treatment-related issues) to
assist in explaining observed empirical changes. Data collection The methodology involved the electronic collection of baseline and post-program assessment information on offenders in drug treatment programs at program entry and completion. Field staff received personal training in the procedure, instruction manuals and access to technical support to facilitate acceptance of the procedure and to promote data integrity. The staff forwarded the completed electronic records to the researcher for data management purposes. In addition to baseline and post-assessment information, official records, such as level of risk ratings (LSI-R), offences in custody, urinalysis test results and recidivism data were extracted from CSNSW core statistical data sets in order to examine outcomes and impacts. The measurement tools and data sources are detailed in the Annexure (Table 26). Program activity statistics were sourced from program management. Final participant sample numbers for measuring program outcomes are shown in Figure 2. As already stated, the quantitative outcome data were aggregated for the three programs and reported as a composite (it was envisaged that over time increased program participant numbers would enable the effects of the different program types to be examined). The exception to this was the separate analysis of the recidivism rates of BTC participants. The recidivism outcomes for the program were examined separately and in greater detail (covering years 2003 to 2010) given the unique profile of the program (pre-release orientation and greater funding allocation). The BTC program group (n=232) was matched proportionally with a non-program discharge sample or statistical control group (n=414) on age, prior imprisonment, ATSI, offence type, security classification, LSI-R re-offending risk level and LSI-R drug problem criteria. Further examination of the two groups on demographic and criminal characteristics showed the groups to be generally equivalent (Table 28). In the case of duplicate enrolments within the window period, the first occasion of program enrolment was used in the analysis. The post-hoc quasi-experimental framework compared the recidivism rates of the matched sample (receiving ‘usual care’ or supervision) with the treatment sample (participating in the BTC program in addition to ‘usual care’ or supervision). Qualitative information was collected on program participants and staff. This was content-analysed for the purpose of identifying key themes and factors perceived to be associated with program success. Both semi-structured questionnaires and unstructured interviews
were completed with the program participants (n=144) and staff (n=11). Personal interviews were conducted with a random sample of BTC participants at the time of release (n=30) and subsequent to release adopting a more detailed case study approach (n=5). Large sample numbers are not required for information to be considered meaningful in process analysis. Therefore, program delivery and qualitative findings are reported separately for the three programs. Analysis Statistical analysis involved the comparison of pre- and post-program paired results (n=125) using parametric and non-parametric tests, subject to the composition of the data. In addition, a range of factors were modelled using logistic regression to determine to what extent they predicted program outcome and also what combination of factors best predicted program outcome (n=120). A matched non-program comparison sample (n=414) was used in examining the medium and long-term treatment effects of BTC between 2003 to 2010 (n=232). Survival times to reimprisonment were analysed using the Kaplan-Meier procedure. Cox hazard regression was conducted to examine whether differences in survival times were significant after controlling for other risk factors.
6
Figure 1: Evaluation design
Process phase
Profile of factors critical to program completion - success or failure
Program effectiveness
Effectiveness of program delivery
Activity data – program documentation, inputs, program reach, outputs, successful completion
Key informants – expectations, attitudes and perceptions
Program participants, program staff and management
Pre-test Post-test
Intervention* [*in addition to usual
care]
Post-hoc matched comparison group [usual care]
Psycho-social characteristics, cognitions and behaviours prior to intervention
Psycho-social characteristics, cognitions and behaviours after intervention
Program graduates
- Background characteristics - Program characteristics
Program non-graduates
Program activity information and key informant
interviews to as-sist in explaining observed changes
Pro-social behaviour in custody and
recidivism rates (termination and
Intention to Treat) attributable to
program
Selection criteria/program elements that
predict program success/failure
Quasi- experimental phase
Mixed- method
Recidivism rates
Changes dependent on intervention for termination group
7
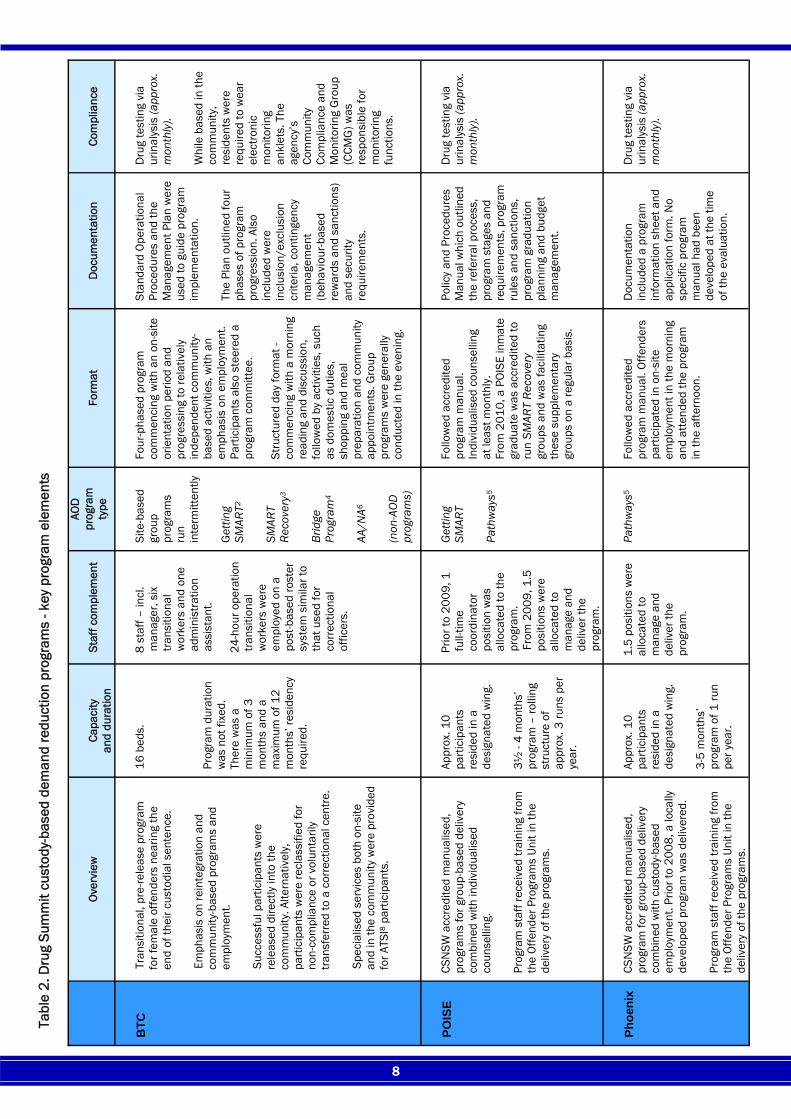
RESULTS 1. PROGRAM DESCRIPTION – key elements The three programs were comparable in terms of the targeted treatment population as well as the treatment approach and goals; vis a vis adherence to the principles of behaviour change theory with the aim of reducing the risk of drug-related offending and the associated harms. Key program elements are shown in Table 2. Eligibility Criteria Program eligibility criteria are detailed in the Annexure (Table 27). Eligibility criteria were broadly equivalent across the Drug Summit (DS) programs. The programs targeted drug-involved offenders with a medium-high risk of reoffending and a current minimum security classification status. Although participation was voluntary, participants may have been strongly encouraged by classification and case management teams to undertake these programs in order to progress through the correctional reclassification system and become eligible for parole. For such participants, the programs would be more accurately described as ‘quasi-compulsory’. It is noteworthy that offenders receiving pharmacotherapy treatment were eligible to participate in the programs, as were offenders with licit drug problems, such as alcohol. Approach The most commonly delivered group-based programs across the DS suite were Pathways and Getting SMART (Table 2). Both these programs are underpinned by social learning theory and the application of cognitive behavioural approaches. The behavioural orientation of both programs is increased skill acquisition and improved self-management. In delivering the Pathways program, POISE staff reportedly adopted alternative mediums, such as art therapy and drama in some of the program modules. The staff advised that in using these alternative mediums, the potential to meet the program’s learning objectives was maximised. Compliance In 2010 all three programs were testing participants for drug use via urinalysis approximately monthly. Responses to detected drug use varied across programs. BTC and POISE were abstinence-based programs and a positive non-prescribed drug test subsequent to program entry resulted in program termination. Phoenix adopted a case by case assessment to positive drug tests and factored overall program performance in making decisions about program termination. When a determination was made in favour of the drug using participant staying on the program, he was placed on a behaviour management plan during the remainder of his time in program. On occasions when program participants self-declared drug use, reportedly all three programs demonstrated greater leniency in their response.
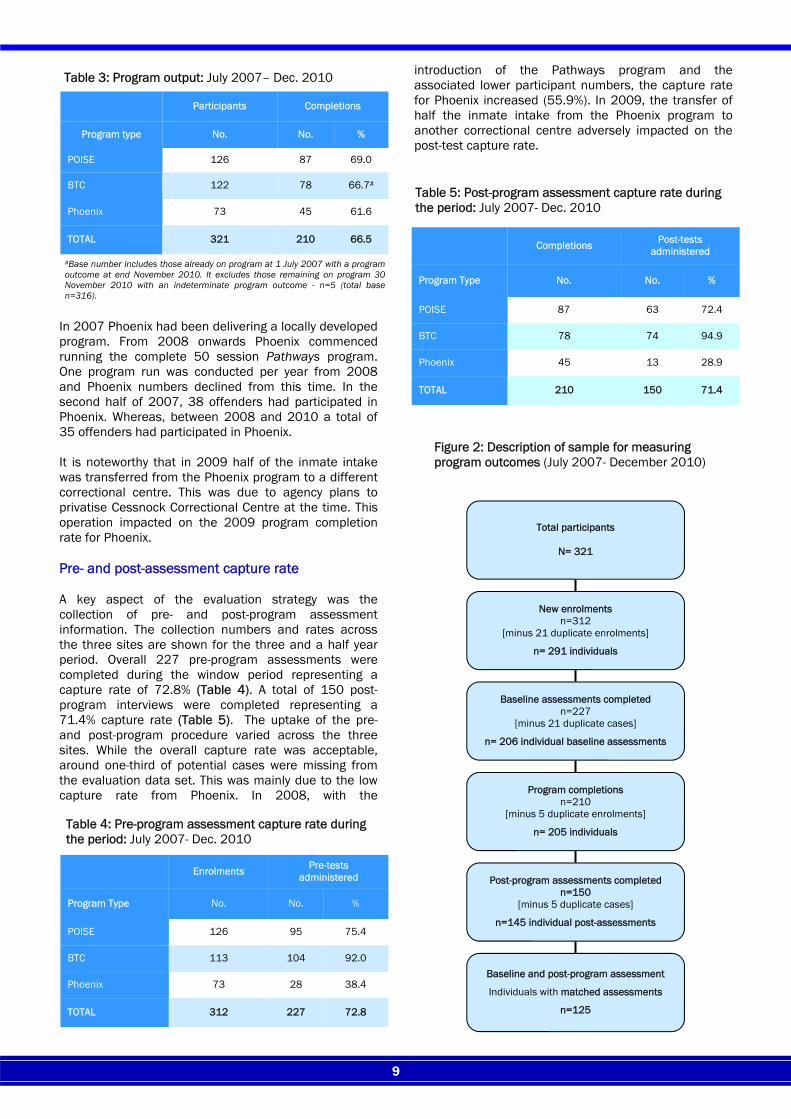
From late 2008, BTC participants were required to wear electronic monitoring anklets when involved in community activities. So while these participants may have progressed to a stage whereby they spent a great deal of their time away from the centre they were subject to surveillance. Aftercare All three DS programs initiated referrals for further treatment. Reportedly, the programs also encouraged participants to maintain contact subsequent to program completion. Such contact was particularly encouraged should the participants feel they were at risk of relapsing to drug use subsequent to program completion. Ongoing attendance at self-help groups was generally encouraged. 2. PROGRAM ACTIVITY Outputs A total of 321 offenders participated in a DS custody-based program between mid. 2007 and late 2010 (a period of approx. 3½ years). During this period, 210 participants completed their program. The completion rate for those with a program outcome determination (n=316) was 66.5%. A breakdown of program activity data by site is shown in Table 3. Overall the POISE program showed high throughput (n=126). The rolling program delivery format would account for this high throughput over the period. Prior to 2009, POISE was delineated into two program stages over four months (Getting SMART, followed by a modified version of Pathways). During this time, there were two program runs per year. From 2009, POISE became a single-stage program over three and a half months (solely the Pathways program) and there were three program runs per year. The rationale for the structural change was that due to the high demand for drug treatment by offenders at the centre, the reach of treatment would be maximised by offering the Getting SMART (hereafter SMART) program to the broader inmate population. In turn, the more intensive Pathways program would remain the domain of the POISE residential program. A total of 122 residents participated in BTC. During this time, 78 residents completed the program. According to program staff, women seeking treatment for their drug problem were encouraged to complete the POISE program before applying to BTC. As a result, there were some incidences of duplicate enrolments across programs over the period. Across POISE and BTC there were 21 duplicate enrolments. The nominal number who completed a DS program more than once in the study period precluded separate analysis for multiple enrolments. For the purpose of measuring immediate and intermediate program effects, the first recorded program completion was selected for inclusion in the analysis.
8
Over
view
Capa
city
an
d du
ratio
n
St
aff c
ompl
emen
t AO
D
prog
ram
ty
pe
Fo
rmat
Doc
umen
tatio
n
Com
plia
nce
BTC
Tr
ansi
tiona
l, pr
e-re
leas
e pr
ogra
m
for f
emal
e of
fend
ers
near
ing
the
end
of th
eir c
usto
dial
sen
tenc
e.
Emph
asis
on
rein
tegr
atio
n an
d co
mm
unity
-bas
ed p
rogr
ams
and
empl
oym
ent.
Succ
essf
ul p
artic
ipan
ts w
ere
rele
ased
dire
ctly
into
the
com
mun
ity. A
ltern
ativ
ely,
pa
rtici
pant
s w
ere
recl
assi
fied
for
non-
com
plia
nce
or v
olun
taril
y tra
nsfe
rred
to a
cor
rect
iona
l cen
tre.
Spec
ialis
ed s
ervi
ces
both
on-
site
an
d in
the
com
mun
ity w
ere
prov
ided
fo
r ATS
I8 pa
rtici
pant
s.
16 b
eds.
Pr
ogra
m d
urat
ion
was
not
fixe
d.
Ther
e w
as a
m
inim
um o
f 3
mon
ths
and
a m
axim
um o
f 12
mon
ths’
resi
denc
y re
quire
d.
8 s
taff
– in
cl.
man
ager
, six
tra
nsiti
onal
w
orke
rs a
nd o
ne
adm
inis
tratio
n as
sist
ant.
24-
hour
ope
ratio
n
trans
ition
al
wor
kers
wer
e em
ploy
ed o
n a
post
-bas
ed ro
ster
sy
stem
sim
ilar t
o th
at u
sed
for
corr
ectio
nal
offic
ers.
Site
-bas
ed
grou
p pr
ogra
ms
run
inte
rmitt
ently
G
ettin
g SM
ART2
SM
ART
Reco
very
3 Br
idge
Pr
ogra
m4
AA/N
A6
(non
-AOD
pr
ogra
ms)
Four
-pha
sed
prog
ram
co
mm
enci
ng w
ith a
n on
-site
or
ient
atio
n pe
riod
and
prog
ress
ing
to re
lativ
ely
inde
pend
ent c
omm
unity
-ba
sed
activ
ities
, with
an
emph
asis
on
empl
oym
ent.
Parti
cipa
nts
also
ste
ered
a
prog
ram
com
mitt
ee.
Stru
ctur
ed d
ay fo
rmat
- co
mm
enci
ng w
ith a
mor
ning
re
adin
g an
d di
scus
sion
, fo
llow
ed b
y ac
tiviti
es, s
uch
as d
omes
tic d
utie
s,
shop
ping
and
mea
l pr
epar
atio
n an
d co
mm
unity
ap
poin
tmen
ts. G
roup
pr
ogra
ms
wer
e ge
nera
lly
cond
ucte
d in
the
even
ing.
Stan
dard
Ope
ratio
nal
Proc
edur
es a
nd th
e M
anag
emen
t Pla
n w
ere
used
to g
uide
pro
gram
im
plem
enta
tion.
Th
e Pl
an o
utlin
ed fo
ur
phas
es o
f pro
gram
pr
ogre
ssio
n. A
lso
incl
uded
wer
e in
clus
ion/
excl
usio
n cr
iteria
, con
tinge
ncy
man
agem
ent
(beh
avio
ur-b
ased
re
war
ds a
nd s
anct
ions
) an
d se
curit
y re
quire
men
ts.
Dru
g te
stin
g vi
a ur
inal
ysis
(app
rox.
m
onth
ly).
Whi
le b
ased
in th
e co
mm
unity
, re
side
nts
wer
e re
quire
d to
wea
r el
ectro
nic
mon
itorin
g an
klet
s. T
he
agen
cy’s
Co
mm
unity
Co
mpl
ianc
e an
d M
onito
ring
Gro
up
(CCM
G) w
as
resp
onsi
ble
for
mon
itorin
g fu
nctio
ns.
POIS
E CS
NSW
acc
redi
ted
man
ualis
ed,
prog
ram
s fo
r gro
up-b
ased
del
iver
y co
mbi
ned
with
indi
vidu
alis
ed
coun
selli
ng.
Prog
ram
sta
ff re
ceiv
ed tr
aini
ng fr
om
the
Offe
nder
Pro
gram
s Un
it in
the
deliv
ery
of th
e pr
ogra
ms.
Appr
ox. 1
0 pa
rtici
pant
s re
side
d in
a
desi
gnat
ed w
ing.
3½
- 4
mon
ths’
pr
ogra
m –
rolli
ng
stru
ctur
e of
ap
prox
. 3 ru
ns p
er
year
.
Prio
r to
2009
, 1
full-
time
coor
dina
tor
posi
tion
was
al
loca
ted
to th
e pr
ogra
m.
Fro
m 2
009,
1.5
po
sitio
ns w
ere
allo
cate
d to
m
anag
e an
d de
liver
the
prog
ram
.
Get
ting
SMAR
T Pa
thw
ays5
Follo
wed
acc
redi
ted
prog
ram
man
ual.
Indi
vidu
alis
ed c
ouns
ellin
g at
leas
t mon
thly
. Fr
om 2
010,
a P
OISE
inm
ate
grad
uate
was
acc
redi
ted
to
run
SMAR
T Re
cove
ry
grou
ps a
nd w
as fa
cilit
atin
g th
ese
supp
lem
enta
ry
grou
ps o
n a
regu
lar b
asis
.
Polic
y an
d Pr
oced
ures
M
anua
l whi
ch o
utlin
ed
the
refe
rral
pro
cess
, pr
ogra
m s
tage
s an
d re
quire
men
ts, p
rogr
am
rule
s an
d sa
nctio
ns,
prog
ram
gra
duat
ion
plan
ning
and
bud
get
man
agem
ent.
Dru
g te
stin
g vi
a ur
inal
ysis
(app
rox.
m
onth
ly).
Phoe
nix
CSN
SW a
ccre
dite
d m
anua
lised
, pr
ogra
m fo
r gro
up-b
ased
del
iver
y co
mbi
ned
with
cus
tody
-bas
ed
empl
oym
ent.
Prio
r to
2008
, a lo
cally
de
velo
ped
prog
ram
was
del
iver
ed.
Prog
ram
sta
ff re
ceiv
ed tr
aini
ng fr
om
the
Offe
nder
Pro
gram
s Un
it in
the
deliv
ery
of th
e pr
ogra
ms.
Appr
ox. 1
0 pa
rtici
pant
s re
side
d in
a
desi
gnat
ed w
ing.
3-
5 m
onth
s’
prog
ram
of 1
run
per y
ear.
1.5
posi
tions
wer
e al
loca
ted
to
man
age
and
deliv
er th
e pr
ogra
m.
Path
way
s5
Follo
wed
acc
redi
ted
prog
ram
man
ual.
Offe
nder
s pa
rtici
pate
d in
on-
site
em
ploy
men
t in
the
mor
ning
an
d at
tend
ed th
e pr
ogra
m
in th
e af
tern
oon.
Doc
umen
tatio
n in
clud
ed a
pro
gram
in
form
atio
n sh
eet a
nd
appl
icat
ion
form
. No
spec
ific
prog
ram
m
anua
l had
bee
n de
velo
ped
at th
e tim
e of
the
eval
uatio
n.
Dru
g te
stin
g vi
a ur
inal
ysis
(app
rox.
m
onth
ly).
Tabl
e 2.
Dru
g Su
mm
it cu
stod
y-ba
sed
dem
and
redu
ctio
n pr
ogra
ms
- key
pro
gram
ele
men
ts
9
In 2007 Phoenix had been delivering a locally developed program. From 2008 onwards Phoenix commenced running the complete 50 session Pathways program. One program run was conducted per year from 2008 and Phoenix numbers declined from this time. In the second half of 2007, 38 offenders had participated in Phoenix. Whereas, between 2008 and 2010 a total of 35 offenders had participated in Phoenix. It is noteworthy that in 2009 half of the inmate intake was transferred from the Phoenix program to a different correctional centre. This was due to agency plans to privatise Cessnock Correctional Centre at the time. This operation impacted on the 2009 program completion rate for Phoenix. Pre- and post-assessment capture rate A key aspect of the evaluation strategy was the collection of pre- and post-program assessment information. The collection numbers and rates across the three sites are shown for the three and a half year period. Overall 227 pre-program assessments were completed during the window period representing a capture rate of 72.8% (Table 4). A total of 150 post-program interviews were completed representing a 71.4% capture rate (Table 5). The uptake of the pre- and post-program procedure varied across the three sites. While the overall capture rate was acceptable, around one-third of potential cases were missing from the evaluation data set. This was mainly due to the low capture rate from Phoenix. In 2008, with the
introduction of the Pathways program and the associated lower participant numbers, the capture rate for Phoenix increased (55.9%). In 2009, the transfer of half the inmate intake from the Phoenix program to another correctional centre adversely impacted on the post-test capture rate.
Enrolments Pre-tests administered
Program Type No. No. %
POISE 126 95 75.4
BTC 113 104 92.0
Phoenix 73 28 38.4
TOTAL 312 227 72.8
Table 4: Pre-program assessment capture rate during the period: July 2007- Dec. 2010
Participants Completions
Program type No. No. %
POISE 126 87 69.0
BTC 122 78 66.7#
Phoenix 73 45 61.6
TOTAL 321 210 66.5
Table 3: Program output: July 2007– Dec. 2010
#Base number includes those already on program at 1 July 2007 with a program outcome at end November 2010. It excludes those remaining on program 30 November 2010 with an indeterminate program outcome - n=5 (total base n=316).
Completions Post-tests administered
Program Type No. No. %
POISE 87 63 72.4
BTC 78 74 94.9
Phoenix 45 13 28.9
TOTAL 210 150 71.4
Table 5: Post-program assessment capture rate during the period: July 2007- Dec. 2010
Total participants
N= 321
New enrolments n=312
[minus 21 duplicate enrolments]
n= 291 individuals
Baseline assessments completed n=227
[minus 21 duplicate cases]
n= 206 individual baseline assessments
Program completions n=210
[minus 5 duplicate enrolments]
n= 205 individuals
Post-program assessments completed n=150
[minus 5 duplicate cases]
n=145 individual post-assessments
Baseline and post-program assessment
Individuals with matched assessments
n=125
Figure 2: Description of sample for measuring program outcomes (July 2007- December 2010)
10
3. PROGRAM REACH – PARTICIPANT PROFILE Given that drug treatment programs are a valued yet scarce resource it is important that they target high risk, high need drug-involved offenders. Accordingly a range of demographic, criminal history and psycho-social factors was collected on participants at program entry. These data were augmented with official records. The data were not only collected to examine the background and suitability of program participants, but also to investigate over time whether any of these factors affected program outcome (success vs. failure). The following section examines the characteristics of the participants who enrolled in the programs during the window period (July 2007 - December 2010). These findings serve to highlight the high level of drug misuse in the participant population and form a picture of a predominantly high risk, high need group. 3.1 Demographics and criminal history The large majority of program participants were female (84.0%) and more than one-third (36.9%) were of Aboriginal/Torres Strait Islander background (Table 6). Participants were on average 32.7 years of age (range=18-60 years). Just over half (54.4%) had never been married. In terms of educational background, 64.4% of participants had completed at least 10 years of schooling. Of participants, 14.4% had been earning income through employment in the three months prior to imprisonment. A further 15.4% were receiving the sole parent pension. In terms of criminal history, just under two-thirds (61.2%) had served a prior prison sentence and almost three-quarters (73.8%) had a prior conviction for a violent offence. A large majority of participants (92.1%) reported that their current offences were drug-related. Almost all (92.1%) of those with a prior imprisonment reported that their prior offences were also drug-related. Inclusion criteria for the programs stated that participants were to be classified at a medium or higher risk level on the LSI-R to be eligible for enrolment. Of those who participated in the program with an LSI-R rating on record (n=180), 93.1% were classified as medium or higher. In terms of offences committed in custody during the current custodial term, 38.8% of participants had been charged with a drug offence prior to program entry and 17.0% had been charged with an assault offence. 3.2 Current offences and drug-related offending patterns Participants were most likely to be serving sentences for breach of legal order (26.9%) or property offences (18.4%) (Table 7). Just over one tenth were serving sentences for assault (13.9%), drug (13.9%) or robbery (12.9%) offences. Of participants who were administered the screening procedure, 92.1% (n=117) attributed at least one of their offences to their use of alcohol and/or other drugs.
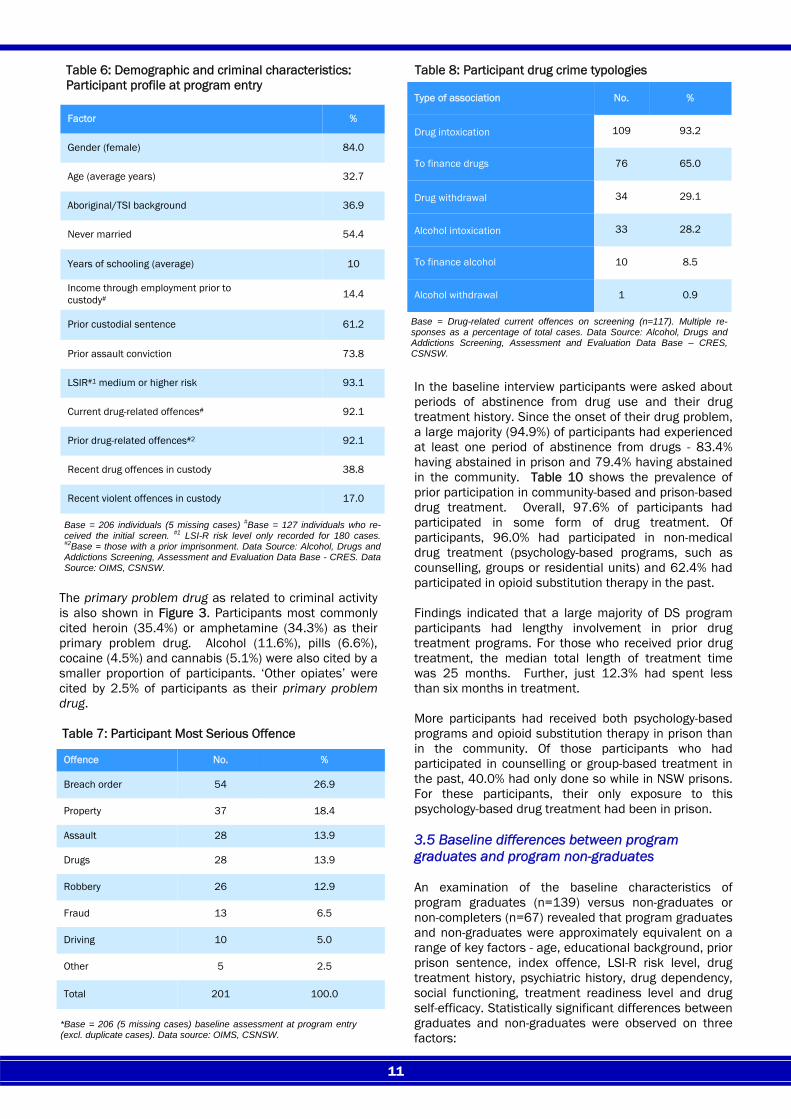
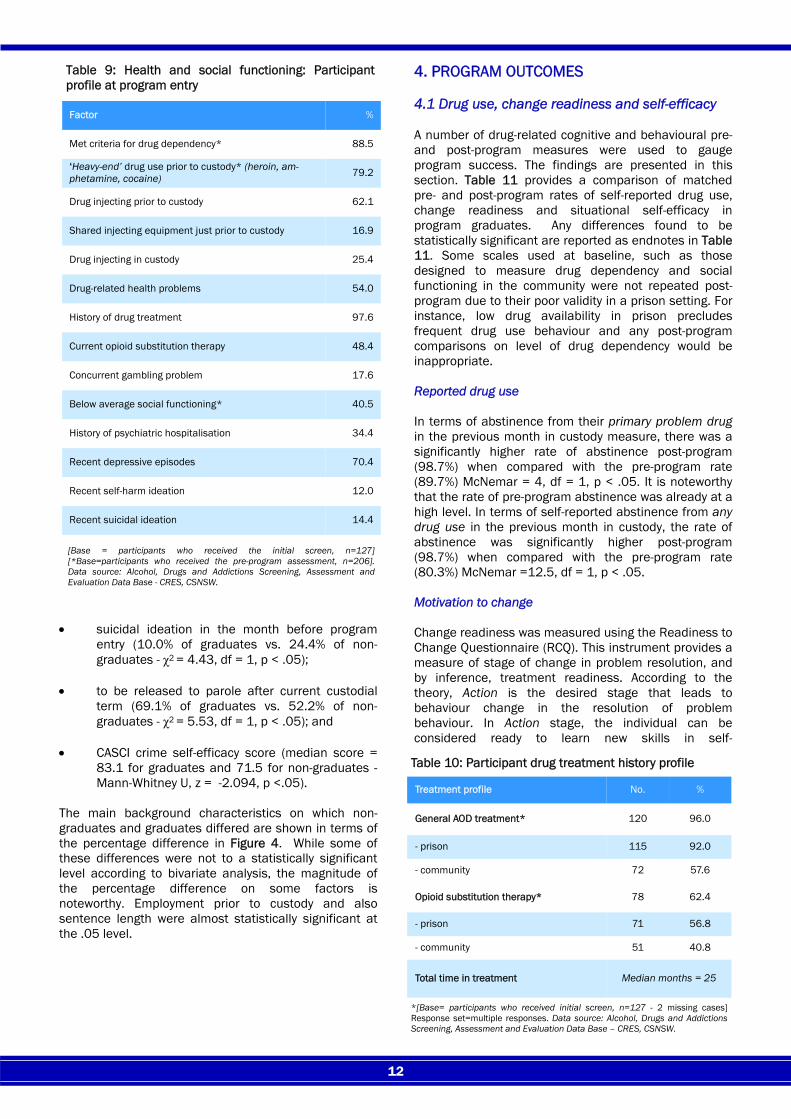
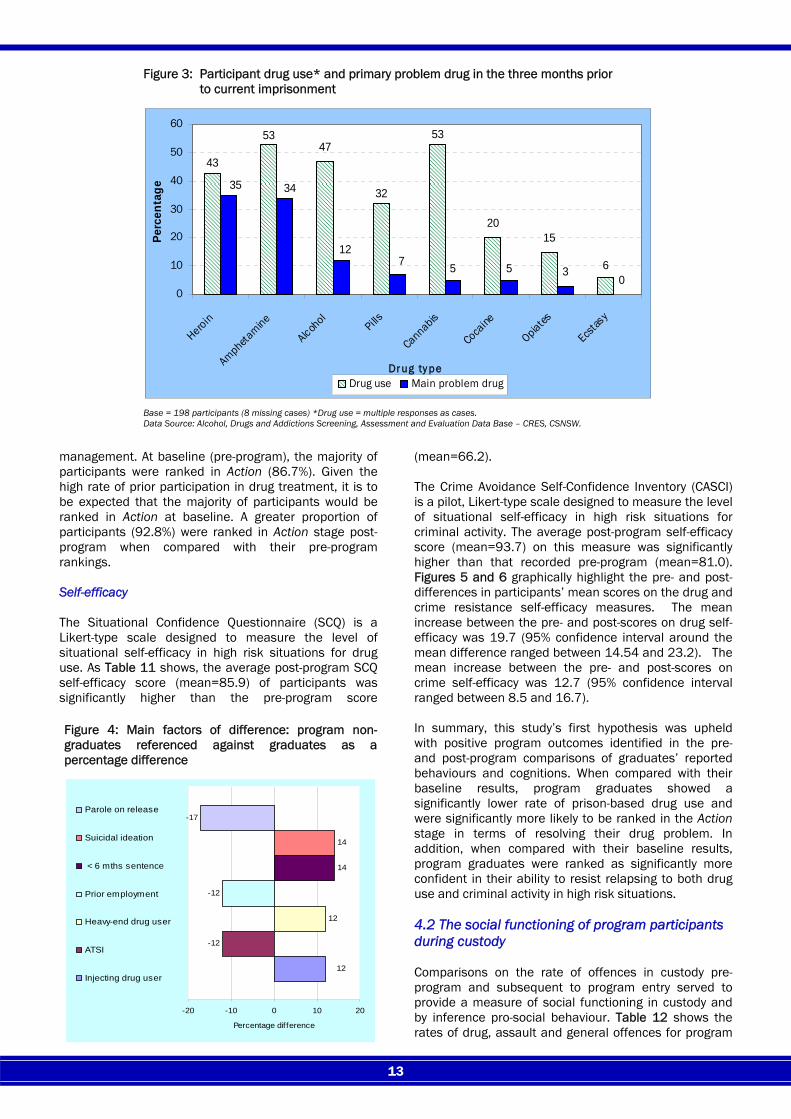
In identifying the nature of the association, participants had the opportunity to cite more than one type of association (Table 8). A large majority of those with drug-related offences reported that they were intoxicated by drugs at the time of offence (93.2%). In addition, the majority (65.0%) causally attributed their current offences to the need to finance drugs. Just over one-quarter reported that they were withdrawing from drugs (29.1%) or were intoxicated by alcohol (28.2%) at the time of their offence. 3.3 Health and social functioning The following findings derived from the baseline interviews indicate a high prevalence of drug-related morbidity in program participants (Table 9). A standardised scale (Severity of Dependency Scale) was used to measure drug dependency levels. Of all participants, 88.5% were rated as dependent on their main problem drug just prior to their current imprisonment episode. In the three months prior to current imprisonment, 79.2% had used a ‘heavy-end drug’ (heroin, amphetamine or cocaine) and 62.1% had injected drugs. Importantly, 25.4% reported injecting drugs while in prison. Using a standardised measure of social integration (social functioning sub-scale of the Opiate Treatment Index), 40.5% were rated as having below average social functioning just prior to imprisonment. Nearly all had a history of drug treatment (97.6%) and more than one-third (34.4%) had a history of psychiatric hospitalisation. Measures of recent emotional functioning indicated that almost three-quarters of participants (70.4%) had experienced a depressive episode, 12.0% reported self-harm ideation and 14.4% reported suicidal ideation in the last month. In summary, the examination of participant characteristics at baseline proved the programs to be effective in identifying suitable candidates (i.e., high risk, high need) for these targeted programs. The participant profile showed that a large majority had current and prior drug-related offences and a reoffending risk level of medium or higher. Most were assessed as dependent on drugs prior to their current custodial term and one-quarter had injected drugs in prison. More than one-third had recently been charged with a drug offence during their current custodial term. Further, in addition to meeting drug criteria, one-third had a history of psychiatric treatment and almost two-thirds had experienced a recent episode of depression. Subsequent analysis (Section 4.5) will involve the statistical modelling of these baseline characteristics with the program outcomes of participants in order to identify factors influencing program success versus failure. This in turn, should inform refinements in participant-program matching. 3.4 Recent drug use and treatment profile Participants self-reported patterns of drug use in the three months prior to imprisonment are shown in Figure 3. The most commonly used drugs were amphetamine (53.0%), cannabis (53.0%), alcohol (46.5%) and heroin (42.5%).
11
The primary problem drug as related to criminal activity is also shown in Figure 3. Participants most commonly cited heroin (35.4%) or amphetamine (34.3%) as their primary problem drug. Alcohol (11.6%), pills (6.6%), cocaine (4.5%) and cannabis (5.1%) were also cited by a smaller proportion of participants. ‘Other opiates’ were cited by 2.5% of participants as their primary problem drug.
In the baseline interview participants were asked about periods of abstinence from drug use and their drug treatment history. Since the onset of their drug problem, a large majority (94.9%) of participants had experienced at least one period of abstinence from drugs - 83.4% having abstained in prison and 79.4% having abstained in the community. Table 10 shows the prevalence of prior participation in community-based and prison-based drug treatment. Overall, 97.6% of participants had participated in some form of drug treatment. Of participants, 96.0% had participated in non-medical drug treatment (psychology-based programs, such as counselling, groups or residential units) and 62.4% had participated in opioid substitution therapy in the past. Findings indicated that a large majority of DS program participants had lengthy involvement in prior drug treatment programs. For those who received prior drug treatment, the median total length of treatment time was 25 months. Further, just 12.3% had spent less than six months in treatment. More participants had received both psychology-based programs and opioid substitution therapy in prison than in the community. Of those participants who had participated in counselling or group-based treatment in the past, 40.0% had only done so while in NSW prisons. For these participants, their only exposure to this psychology-based drug treatment had been in prison. 3.5 Baseline differences between program graduates and program non-graduates An examination of the baseline characteristics of program graduates (n=139) versus non-graduates or non-completers (n=67) revealed that program graduates and non-graduates were approximately equivalent on a range of key factors - age, educational background, prior prison sentence, index offence, LSI-R risk level, drug treatment history, psychiatric history, drug dependency, social functioning, treatment readiness level and drug self-efficacy. Statistically significant differences between graduates and non-graduates were observed on three factors:
Type of association No. %
Drug intoxication 109 93.2
To finance drugs 76 65.0
Drug withdrawal 34 29.1
Alcohol intoxication 33 28.2
To finance alcohol 10 8.5
Alcohol withdrawal 1 0.9
Table 8: Participant drug crime typologies
Base = Drug-related current offences on screening (n=117). Multiple re-sponses as a percentage of total cases. Data Source: Alcohol, Drugs and Addictions Screening, Assessment and Evaluation Data Base – CRES, CSNSW.
Table 6: Demographic and criminal characteristics: Participant profile at program entry
Factor %
Gender (female) 84.0
Age (average years) 32.7
Aboriginal/TSI background 36.9
Never married 54.4
Years of schooling (average) 10
Income through employment prior to custody# 14.4
Prior custodial sentence 61.2
Prior assault conviction 73.8
LSIR#1 medium or higher risk 93.1
Current drug-related offences# 92.1
Prior drug-related offences#2 92.1
Recent drug offences in custody 38.8
Recent violent offences in custody 17.0
Base = 206 individuals (5 missing cases) #Base = 127 individuals who re-ceived the initial screen. #1 LSI-R risk level only recorded for 180 cases. #2Base = those with a prior imprisonment. Data Source: Alcohol, Drugs and Addictions Screening, Assessment and Evaluation Data Base - CRES. Data Source: OIMS, CSNSW.
Offence No. %
Breach order 54 26.9
Property 37 18.4
Assault 28 13.9
Drugs 28 13.9
Robbery 26 12.9
Fraud 13 6.5
Driving 10 5.0
Other 5 2.5
Total 201 100.0
Table 7: Participant Most Serious Offence
*Base = 206 (5 missing cases) baseline assessment at program entry (excl. duplicate cases). Data source: OIMS, CSNSW.
12
• suicidal ideation in the month before program
entry (10.0% of graduates vs. 24.4% of non-graduates - χ2 = 4.43, df = 1, p < .05);
• to be released to parole after current custodial
term (69.1% of graduates vs. 52.2% of non-graduates - χ2 = 5.53, df = 1, p < .05); and
• CASCI crime self-efficacy score (median score =
83.1 for graduates and 71.5 for non-graduates - Mann-Whitney U, z = -2.094, p <.05).
The main background characteristics on which non-graduates and graduates differed are shown in terms of the percentage difference in Figure 4. While some of these differences were not to a statistically significant level according to bivariate analysis, the magnitude of the percentage difference on some factors is noteworthy. Employment prior to custody and also sentence length were almost statistically significant at the .05 level.
4. PROGRAM OUTCOMES 4.1 Drug use, change readiness and self-efficacy A number of drug-related cognitive and behavioural pre- and post-program measures were used to gauge program success. The findings are presented in this section. Table 11 provides a comparison of matched pre- and post-program rates of self-reported drug use, change readiness and situational self-efficacy in program graduates. Any differences found to be statistically significant are reported as endnotes in Table 11. Some scales used at baseline, such as those designed to measure drug dependency and social functioning in the community were not repeated post-program due to their poor validity in a prison setting. For instance, low drug availability in prison precludes frequent drug use behaviour and any post-program comparisons on level of drug dependency would be inappropriate. Reported drug use In terms of abstinence from their primary problem drug in the previous month in custody measure, there was a significantly higher rate of abstinence post-program (98.7%) when compared with the pre-program rate (89.7%) McNemar = 4, df = 1, p < .05. It is noteworthy that the rate of pre-program abstinence was already at a high level. In terms of self-reported abstinence from any drug use in the previous month in custody, the rate of abstinence was significantly higher post-program (98.7%) when compared with the pre-program rate (80.3%) McNemar =12.5, df = 1, p < .05. Motivation to change Change readiness was measured using the Readiness to Change Questionnaire (RCQ). This instrument provides a measure of stage of change in problem resolution, and by inference, treatment readiness. According to the theory, Action is the desired stage that leads to behaviour change in the resolution of problem behaviour. In Action stage, the individual can be considered ready to learn new skills in self-
Factor %
Met criteria for drug dependency* 88.5
‘Heavy-end’ drug use prior to custody* (heroin, am-phetamine, cocaine) 79.2
Drug injecting prior to custody 62.1
Shared injecting equipment just prior to custody 16.9
Drug injecting in custody 25.4
Drug-related health problems 54.0
History of drug treatment 97.6
Current opioid substitution therapy 48.4
Concurrent gambling problem 17.6
Below average social functioning* 40.5
History of psychiatric hospitalisation 34.4
Recent depressive episodes 70.4
Recent self-harm ideation 12.0
Recent suicidal ideation 14.4
Table 9: Health and social functioning: Participant profile at program entry
[Base = participants who received the initial screen, n=127] [*Base=participants who received the pre-program assessment, n=206]. Data source: Alcohol, Drugs and Addictions Screening, Assessment and Evaluation Data Base - CRES, CSNSW.
Treatment profile No. %
General AOD treatment* 120 96.0
- prison 115 92.0
- community 72 57.6
Opioid substitution therapy* 78 62.4
- prison 71 56.8
- community 51 40.8
Total time in treatment Median months = 25
Table 10: Participant drug treatment history profile
*[Base= participants who received initial screen, n=127 - 2 missing cases] Response set=multiple responses. Data source: Alcohol, Drugs and Addictions Screening, Assessment and Evaluation Data Base – CRES, CSNSW.
13
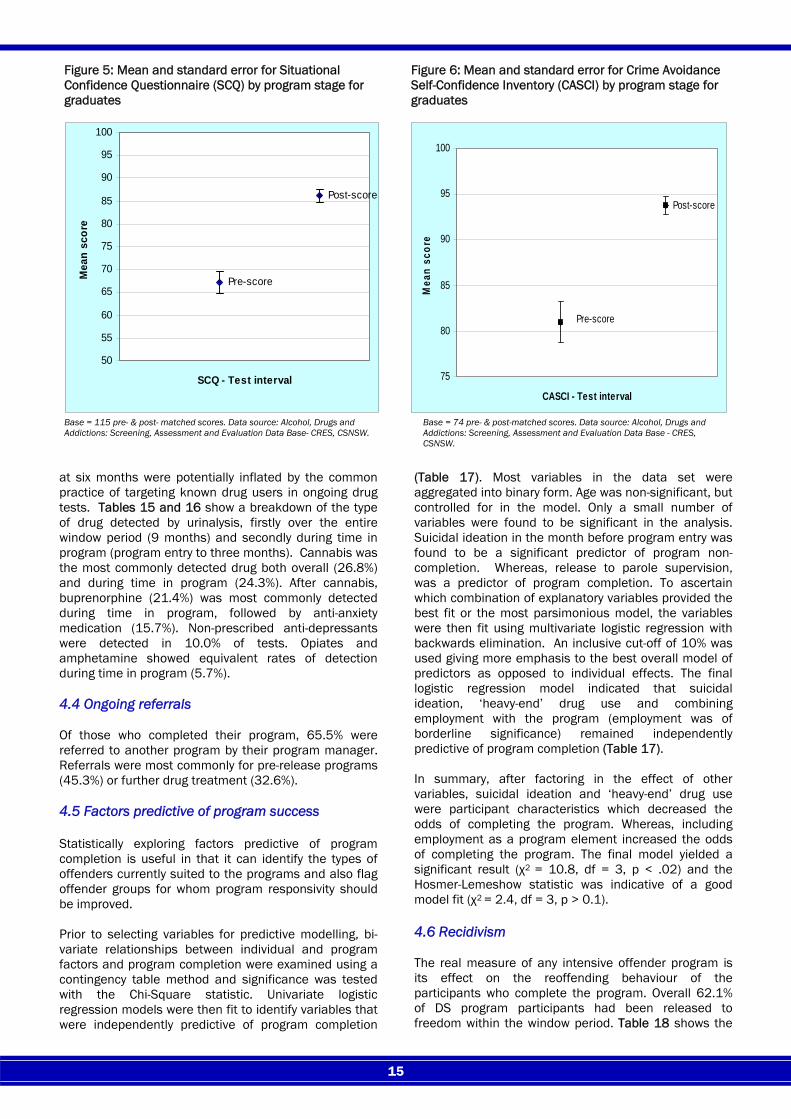
management. At baseline (pre-program), the majority of participants were ranked in Action (86.7%). Given the high rate of prior participation in drug treatment, it is to be expected that the majority of participants would be ranked in Action at baseline. A greater proportion of participants (92.8%) were ranked in Action stage post-program when compared with their pre-program rankings. Self-efficacy The Situational Confidence Questionnaire (SCQ) is a Likert-type scale designed to measure the level of situational self-efficacy in high risk situations for drug use. As Table 11 shows, the average post-program SCQ self-efficacy score (mean=85.9) of participants was significantly higher than the pre-program score
(mean=66.2). The Crime Avoidance Self-Confidence Inventory (CASCI) is a pilot, Likert-type scale designed to measure the level of situational self-efficacy in high risk situations for criminal activity. The average post-program self-efficacy score (mean=93.7) on this measure was significantly higher than that recorded pre-program (mean=81.0). Figures 5 and 6 graphically highlight the pre- and post- differences in participants’ mean scores on the drug and crime resistance self-efficacy measures. The mean increase between the pre- and post-scores on drug self-efficacy was 19.7 (95% confidence interval around the mean difference ranged between 14.54 and 23.2). The mean increase between the pre- and post-scores on crime self-efficacy was 12.7 (95% confidence interval ranged between 8.5 and 16.7). In summary, this study’s first hypothesis was upheld with positive program outcomes identified in the pre- and post-program comparisons of graduates’ reported behaviours and cognitions. When compared with their baseline results, program graduates showed a significantly lower rate of prison-based drug use and were significantly more likely to be ranked in the Action stage in terms of resolving their drug problem. In addition, when compared with their baseline results, program graduates were ranked as significantly more confident in their ability to resist relapsing to both drug use and criminal activity in high risk situations. 4.2 The social functioning of program participants during custody Comparisons on the rate of offences in custody pre-program and subsequent to program entry served to provide a measure of social functioning in custody and by inference pro-social behaviour. Table 12 shows the rates of drug, assault and general offences for program
47
2015
06
53 53
43
3234
12
3557
35
0
10
20
30
40
50
60
Heroin
Amphetamine
Alcohol
Pills
Cannabis
Cocaine
Opiates
Ecstas
y
Drug ty pe
Perc
enta
ge
Drug use Main problem drug
Figure 3: Participant drug use* and primary problem drug in the three months prior to current imprisonment
Base = 198 participants (8 missing cases) *Drug use = multiple responses as cases. Data Source: Alcohol, Drugs and Addictions Screening, Assessment and Evaluation Data Base – CRES, CSNSW.
-12
12
-12
14
14
-17
12
-20 -10 0 10 20
Percentage difference
Parole on release
Suicidal ideation
< 6 mths sentence
Prior employment
Heavy-end drug user
ATSI
Injecting drug user
Figure 4: Main factors of difference: program non-graduates referenced against graduates as a percentage difference

14
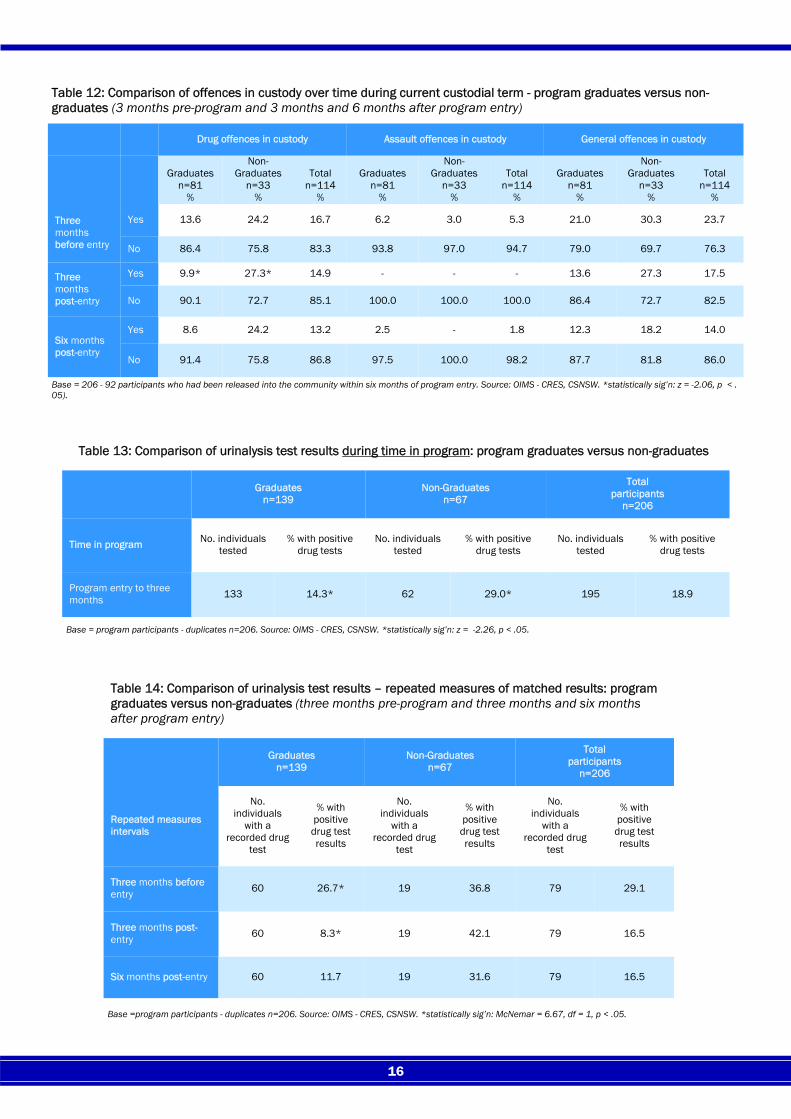
graduates and non-graduates at equal intervals - three months prior to program entry and three and six months after program entry. Those participants who were released into the community before the six-month follow-up period were excluded in the analysis (n=92). When compared with three months prior to program entry, it can be seen that rates of offences in custody for program graduates declined across all categories after program entry. Non-graduates also showed a decline in rates of general and violent offences over the period. The drug offence rates of non-graduates rose slightly during time in program. The drug offence in custody measure was the most direct and objective offence type by which to examine program impact on the target behaviour of drug use. Non-graduates were around twice as likely as graduates to be charged with a drug offence in custody at each reference point. The most significant difference between non-graduates and graduates was within three months of program entry in the category of drug offences (27.3% vs. 9.9% - z = -2.06, p < .05). Assault offences represent the most direct measure of anti-social behaviour from the data sources available. Allowing for the nominal rate of assault offences overall, assault offences in both graduates (6.2% to 2.5%) and non-graduates (3.0% to 0%) declined overall. Both graduates (21.0% to 12.3%) and non-graduates (30.3% to 18.2%) showed a steady decline in general offences over the period. Allowing for the modest number of non-graduates, findings did suggest that time spent in program had a positive effect on the social behaviour of participants. This represents gains, not only for the participants, but
also for prison management in terms of safety and security concerns and the day to day atmosphere of correctional centres. 4.3 Drug use by program participants during custody as measured by urinalysis Table 13 shows the urinalysis drug test results of program participants subsequent to entering the programs. Overall, 18.9% of those tested for drugs during the first three months of the programs received a positive result for drug use. Graduates (14.3%) were significantly less likely to receive a positive test result (z= -2.26, p < .05) when compared with non-graduates (29.0%). Table 14 examines changes in drug use behaviour over three time periods – before program entry and at two points in time after program entry. In total, 38.3% of individual participants (43.2% of graduates and 28.4% of non-graduates) had been tested in each of the three time periods to allow for matched comparisons. Across all three time periods, the positive drug test rate was higher for non-graduates when compared with graduates. At three months into the program, positive drug tests declined by more than half in tested graduates (8.3%) when compared with the pre-program rate (26.7%) - McNemar = 6.67, df = 1, p < .05. This declining trend did not appear to be sustained at the six month mark. At three months into the program, non-graduates showed an upward trend in positive drug test results (42.1%), when compared with the pre-program rate (36.8%). It is worth noting that the actual number of non-graduates with repeat tests was comparatively low which may have biased findings. A further qualifier to these findings is that the rates of positive drug tests
Measure Result Matched participants
Pre-program Post-program
Abstinence from use of primary problem drug in custody during last 30 days Abstinence – principal drug 89.7% 98.7%1
Abstinence from any drug use in custody during last 30 days Abstinence - any drug 80.3% 98.7%2
Stage of change (RCQ) Action stage 86.7% 92.8%
Drug self-efficacy (SCQ) Situational self-efficacy in relation to drug use (score) score=66.2(mean) score=85.93
(mean)
Crime self-efficacy (CASCI) @ Situational self-efficacy in relation to criminal activity (score)
score= 81.0 (mean)
score=93.74 (mean)
Table 11: Program outcomes – graduate profile: Paired comparisons on drug use, stage of change, drug self-efficacy and crime self-efficacy
*Based on pre- & post-matched screen and assessments (n=125). @The Crime Avoidance Self-Confidence Inventory (CASCI) is a pilot scale *maximum confidence score =100. Data source: Alcohol, Drugs and Addictions: Screening, Assessment and Evaluation Data Base - CRES, CSNSW. 1statistically sig’n: McNemar = 4.0, df = 1, p < .05. 2statistically sig’n: McNemar = 12.5, df = 1, p < .05. 3statistically sig’n: t (114) = 8.66, p < .001. 4 statistically sig’n: t (73) = 6.1, p < .001.
15
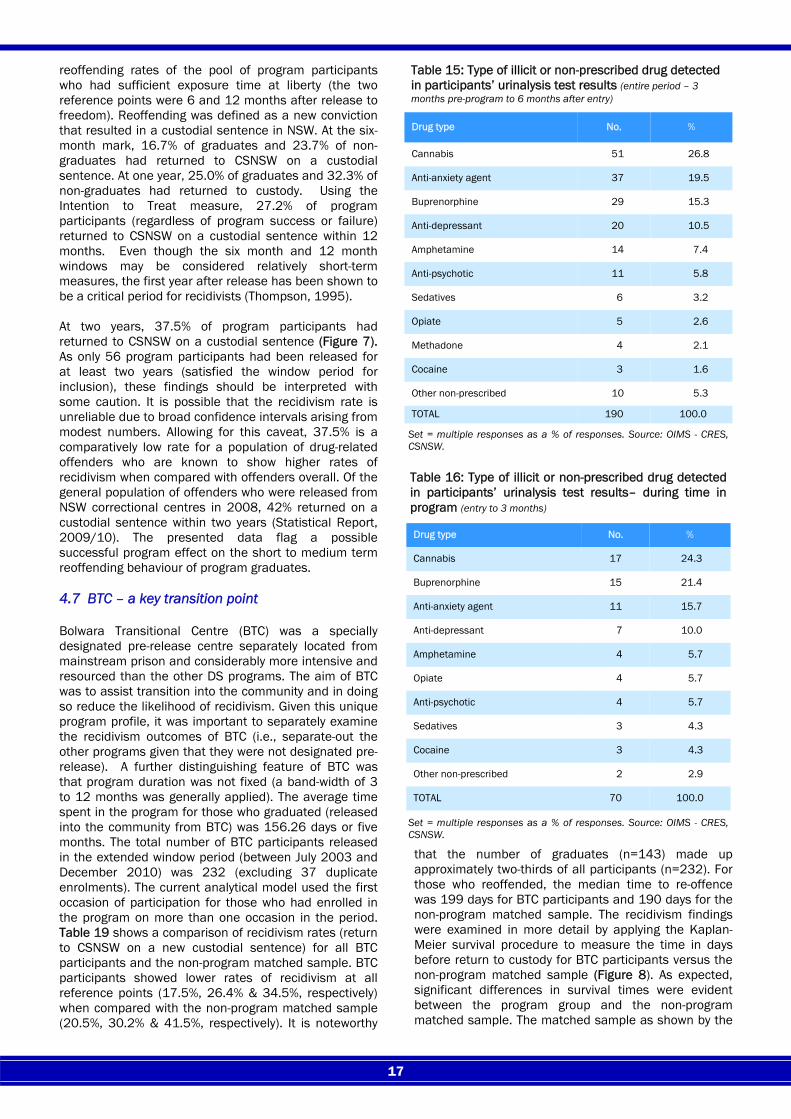
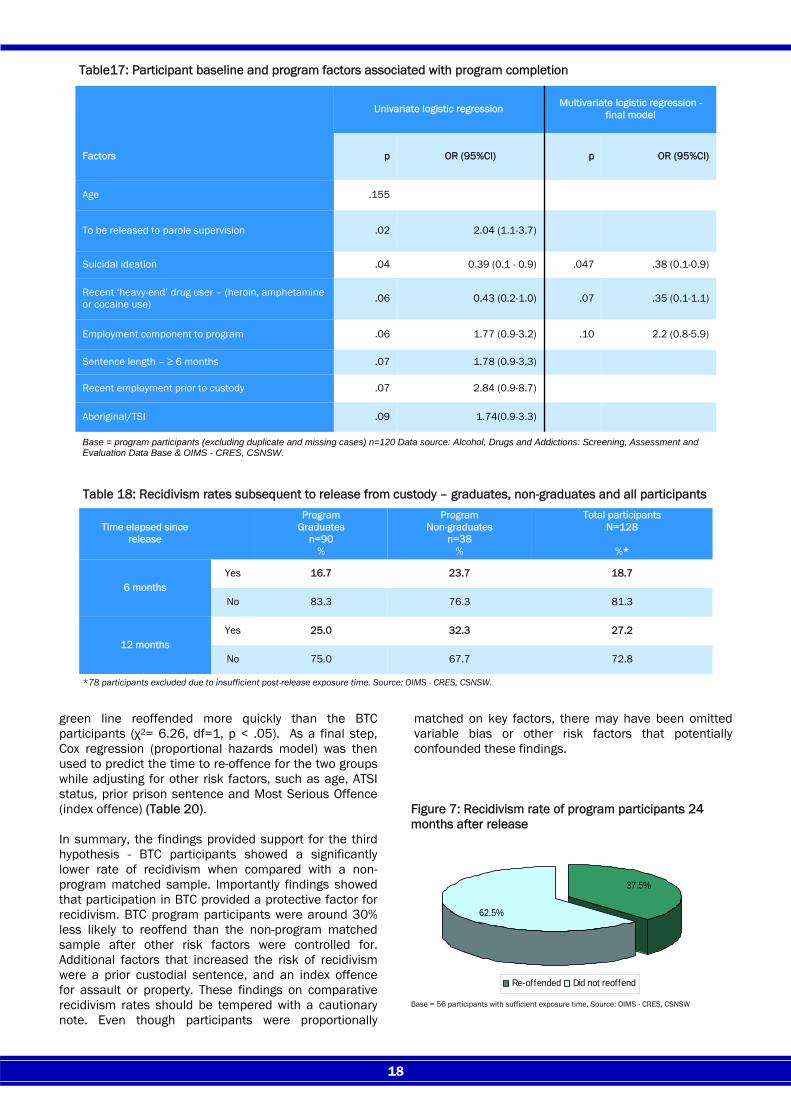
at six months were potentially inflated by the common practice of targeting known drug users in ongoing drug tests. Tables 15 and 16 show a breakdown of the type of drug detected by urinalysis, firstly over the entire window period (9 months) and secondly during time in program (program entry to three months). Cannabis was the most commonly detected drug both overall (26.8%) and during time in program (24.3%). After cannabis, buprenorphine (21.4%) was most commonly detected during time in program, followed by anti-anxiety medication (15.7%). Non-prescribed anti-depressants were detected in 10.0% of tests. Opiates and amphetamine showed equivalent rates of detection during time in program (5.7%). 4.4 Ongoing referrals Of those who completed their program, 65.5% were referred to another program by their program manager. Referrals were most commonly for pre-release programs (45.3%) or further drug treatment (32.6%). 4.5 Factors predictive of program success Statistically exploring factors predictive of program completion is useful in that it can identify the types of offenders currently suited to the programs and also flag offender groups for whom program responsivity should be improved. Prior to selecting variables for predictive modelling, bi-variate relationships between individual and program factors and program completion were examined using a contingency table method and significance was tested with the Chi-Square statistic. Univariate logistic regression models were then fit to identify variables that were independently predictive of program completion
(Table 17). Most variables in the data set were aggregated into binary form. Age was non-significant, but controlled for in the model. Only a small number of variables were found to be significant in the analysis. Suicidal ideation in the month before program entry was found to be a significant predictor of program non-completion. Whereas, release to parole supervision, was a predictor of program completion. To ascertain which combination of explanatory variables provided the best fit or the most parsimonious model, the variables were then fit using multivariate logistic regression with backwards elimination. An inclusive cut-off of 10% was used giving more emphasis to the best overall model of predictors as opposed to individual effects. The final logistic regression model indicated that suicidal ideation, ‘heavy-end’ drug use and combining employment with the program (employment was of borderline significance) remained independently predictive of program completion (Table 17). In summary, after factoring in the effect of other variables, suicidal ideation and ‘heavy-end’ drug use were participant characteristics which decreased the odds of completing the program. Whereas, including employment as a program element increased the odds of completing the program. The final model yielded a significant result (χ2 = 10.8, df = 3, p < .02) and the Hosmer-Lemeshow statistic was indicative of a good model fit (χ2 = 2.4, df = 3, p > 0.1). 4.6 Recidivism The real measure of any intensive offender program is its effect on the reoffending behaviour of the participants who complete the program. Overall 62.1% of DS program participants had been released to freedom within the window period. Table 18 shows the
Pre-score
Post-score
50
55
60
65
70
75
80
85
90
95
100
SCQ - Test interval
Mea
n sc
ore
Figure 5: Mean and standard error for Situational Confidence Questionnaire (SCQ) by program stage for graduates
Figure 6: Mean and standard error for Crime Avoidance Self-Confidence Inventory (CASCI) by program stage for graduates
Base = 115 pre- & post- matched scores. Data source: Alcohol, Drugs and Addictions: Screening, Assessment and Evaluation Data Base- CRES, CSNSW.
Post-score
Pre-score
75
80
85
90
95
100
CASCI - Test interval
Mea
n sc
ore
Base = 74 pre- & post-matched scores. Data source: Alcohol, Drugs and Addictions: Screening, Assessment and Evaluation Data Base - CRES, CSNSW.
16
Drug offences in custody Assault offences in custody General offences in custody
Graduates
n=81 %
Non-Graduates
n=33 %
Total
n=114 %
Graduates
n=81 %
Non-Graduates
n=33 %
Total
n=114 %
Graduates
n=81 %
Non-Graduates
n=33 %
Total
n=114 %
Three months before entry
Yes 13.6 24.2 16.7 6.2 3.0 5.3 21.0 30.3 23.7
No 86.4 75.8 83.3 93.8 97.0 94.7 79.0 69.7 76.3
Three months post-entry
Yes 9.9* 27.3* 14.9 - - - 13.6 27.3 17.5
No 90.1 72.7 85.1 100.0 100.0 100.0 86.4 72.7 82.5
Six months post-entry
Yes 8.6 24.2 13.2 2.5 - 1.8 12.3 18.2 14.0
No 91.4 75.8 86.8 97.5 100.0 98.2 87.7 81.8 86.0
Table 12: Comparison of offences in custody over time during current custodial term - program graduates versus non-graduates (3 months pre-program and 3 months and 6 months after program entry)
Base = 206 - 92 participants who had been released into the community within six months of program entry. Source: OIMS - CRES, CSNSW. *statistically sig’n: z = -2.06, p < . 05).
Graduates n=139
Non-Graduates n=67
Total participants
n=206
Time in program No. individuals tested
% with positive drug tests
No. individuals tested
% with positive drug tests
No. individuals tested
% with positive drug tests
Program entry to three months 133 14.3* 62 29.0* 195 18.9
Table 13: Comparison of urinalysis test results during time in program: program graduates versus non-graduates
Base = program participants - duplicates n=206. Source: OIMS - CRES, CSNSW. *statistically sig’n: z = -2.26, p < .05.
Graduates n=139
Non-Graduates n=67
Total participants
n=206
Repeated measures intervals
No. individuals
with a recorded drug
test
% with positive drug test results
No. individuals
with a recorded drug
test
% with positive drug test results
No. individuals
with a recorded drug
test
% with positive drug test results
Three months before entry 60 26.7* 19 36.8 79 29.1
Three months post-entry 60 8.3* 19 42.1 79 16.5
Six months post-entry 60 11.7 19 31.6 79 16.5
Table 14: Comparison of urinalysis test results – repeated measures of matched results: program graduates versus non-graduates (three months pre-program and three months and six months after program entry)
Base =program participants - duplicates n=206. Source: OIMS - CRES, CSNSW. *statistically sig’n: McNemar = 6.67, df = 1, p < .05.
17
reoffending rates of the pool of program participants who had sufficient exposure time at liberty (the two reference points were 6 and 12 months after release to freedom). Reoffending was defined as a new conviction that resulted in a custodial sentence in NSW. At the six-month mark, 16.7% of graduates and 23.7% of non-graduates had returned to CSNSW on a custodial sentence. At one year, 25.0% of graduates and 32.3% of non-graduates had returned to custody. Using the Intention to Treat measure, 27.2% of program participants (regardless of program success or failure) returned to CSNSW on a custodial sentence within 12 months. Even though the six month and 12 month windows may be considered relatively short-term measures, the first year after release has been shown to be a critical period for recidivists (Thompson, 1995). At two years, 37.5% of program participants had returned to CSNSW on a custodial sentence (Figure 7). As only 56 program participants had been released for at least two years (satisfied the window period for inclusion), these findings should be interpreted with some caution. It is possible that the recidivism rate is unreliable due to broad confidence intervals arising from modest numbers. Allowing for this caveat, 37.5% is a comparatively low rate for a population of drug-related offenders who are known to show higher rates of recidivism when compared with offenders overall. Of the general population of offenders who were released from NSW correctional centres in 2008, 42% returned on a custodial sentence within two years (Statistical Report, 2009/10). The presented data flag a possible successful program effect on the short to medium term reoffending behaviour of program graduates. 4.7 BTC – a key transition point Bolwara Transitional Centre (BTC) was a specially designated pre-release centre separately located from mainstream prison and considerably more intensive and resourced than the other DS programs. The aim of BTC was to assist transition into the community and in doing so reduce the likelihood of recidivism. Given this unique program profile, it was important to separately examine the recidivism outcomes of BTC (i.e., separate-out the other programs given that they were not designated pre-release). A further distinguishing feature of BTC was that program duration was not fixed (a band-width of 3 to 12 months was generally applied). The average time spent in the program for those who graduated (released into the community from BTC) was 156.26 days or five months. The total number of BTC participants released in the extended window period (between July 2003 and December 2010) was 232 (excluding 37 duplicate enrolments). The current analytical model used the first occasion of participation for those who had enrolled in the program on more than one occasion in the period. Table 19 shows a comparison of recidivism rates (return to CSNSW on a new custodial sentence) for all BTC participants and the non-program matched sample. BTC participants showed lower rates of recidivism at all reference points (17.5%, 26.4% & 34.5%, respectively) when compared with the non-program matched sample (20.5%, 30.2% & 41.5%, respectively). It is noteworthy
that the number of graduates (n=143) made up approximately two-thirds of all participants (n=232). For those who reoffended, the median time to re-offence was 199 days for BTC participants and 190 days for the non-program matched sample. The recidivism findings were examined in more detail by applying the Kaplan-Meier survival procedure to measure the time in days before return to custody for BTC participants versus the non-program matched sample (Figure 8). As expected, significant differences in survival times were evident between the program group and the non-program matched sample. The matched sample as shown by the
Table 15: Type of illicit or non-prescribed drug detected in participants’ urinalysis test results (entire period – 3 months pre-program to 6 months after entry)
Drug type No. %
Cannabis 51 26.8
Anti-anxiety agent 37 19.5
Buprenorphine 29 15.3
Anti-depressant 20 10.5
Amphetamine 14 7.4
Anti-psychotic 11 5.8
Sedatives 6 3.2
Opiate 5 2.6
Methadone 4 2.1
Cocaine 3 1.6
Other non-prescribed 10 5.3
TOTAL 190 100.0
Set = multiple responses as a % of responses. Source: OIMS - CRES, CSNSW.
Drug type No. %
Cannabis 17 24.3
Buprenorphine 15 21.4
Anti-anxiety agent 11 15.7
Anti-depressant 7 10.0
Amphetamine 4 5.7
Opiate 4 5.7
Anti-psychotic 4 5.7
Sedatives 3 4.3
Cocaine 3 4.3
Other non-prescribed 2 2.9
TOTAL 70 100.0
Table 16: Type of illicit or non-prescribed drug detected in participants’ urinalysis test results– during time in program (entry to 3 months)
Set = multiple responses as a % of responses. Source: OIMS - CRES, CSNSW.
18
green line reoffended more quickly than the BTC participants (χ2= 6.26, df=1, p < .05). As a final step, Cox regression (proportional hazards model) was then used to predict the time to re-offence for the two groups while adjusting for other risk factors, such as age, ATSI status, prior prison sentence and Most Serious Offence (index offence) (Table 20). In summary, the findings provided support for the third hypothesis - BTC participants showed a significantly lower rate of recidivism when compared with a non-program matched sample. Importantly findings showed that participation in BTC provided a protective factor for recidivism. BTC program participants were around 30% less likely to reoffend than the non-program matched sample after other risk factors were controlled for. Additional factors that increased the risk of recidivism were a prior custodial sentence, and an index offence for assault or property. These findings on comparative recidivism rates should be tempered with a cautionary note. Even though participants were proportionally
matched on key factors, there may have been omitted variable bias or other risk factors that potentially confounded these findings.
Univariate logistic regression Multivariate logistic regression - final model
Factors p OR (95%CI) p OR (95%CI)
Age .155
To be released to parole supervision .02 2.04 (1.1-3.7)
Suicidal ideation .04 0.39 (0.1 - 0.9) .047 .38 (0.1-0.9)
Recent ‘heavy-end’ drug user – (heroin, amphetamine or cocaine use) .06 0.43 (0.2-1.0) .07 .35 (0.1-1.1)
Employment component to program .06 1.77 (0.9-3.2) .10 2.2 (0.8-5.9)
Sentence length – ≥ 6 months .07 1.78 (0.9-3.3)
Recent employment prior to custody .07 2.84 (0.9-8.7)
Aboriginal/TSI .09 1.74(0.9-3.3)
Table17: Participant baseline and program factors associated with program completion
Base = program participants (excluding duplicate and missing cases) n=120 Data source: Alcohol, Drugs and Addictions: Screening, Assessment and Evaluation Data Base & OIMS - CRES, CSNSW.
Time elapsed since release
Program Graduates
n=90 %
Program Non-graduates
n=38 %
Total participants N=128
%*
6 months Yes 16.7 23.7 18.7
No 83.3 76.3 81.3
12 months Yes 25.0 32.3 27.2
No 75.0 67.7 72.8
Table 18: Recidivism rates subsequent to release from custody – graduates, non-graduates and all participants
*78 participants excluded due to insufficient post-release exposure time. Source: OIMS - CRES, CSNSW.
62.5%
37.5%
Re-offended Did not reoffend
Figure 7: Recidivism rate of program participants 24 months after release
Base = 56 participants with sufficient exposure time. Source: OIMS - CRES, CSNSW
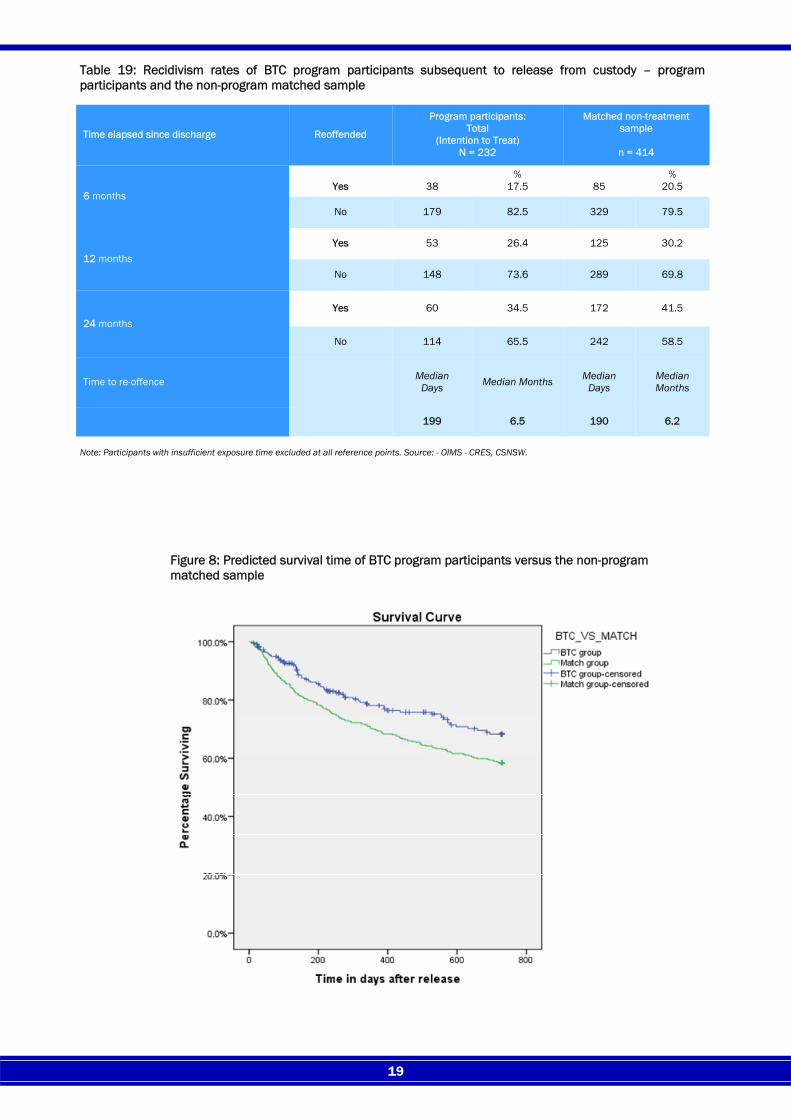
19
Table 19: Recidivism rates of BTC program participants subsequent to release from custody – program participants and the non-program matched sample
Time elapsed since discharge Reoffended
Program participants: Total
(Intention to Treat) N = 232
Matched non-treatment sample
n = 414
6 months
Yes
38
% 17.5
85
% 20.5
No 179 82.5 329 79.5
12 months Yes 53 26.4 125 30.2
No 148 73.6 289 69.8
24 months Yes 60 34.5 172 41.5
No 114 65.5 242 58.5
Time to re-offence Median Days Median Months Median
Days Median Months
199 6.5 190 6.2
Note: Participants with insufficient exposure time excluded at all reference points. Source: - OIMS - CRES, CSNSW.
Figure 8: Predicted survival time of BTC program participants versus the non-program matched sample
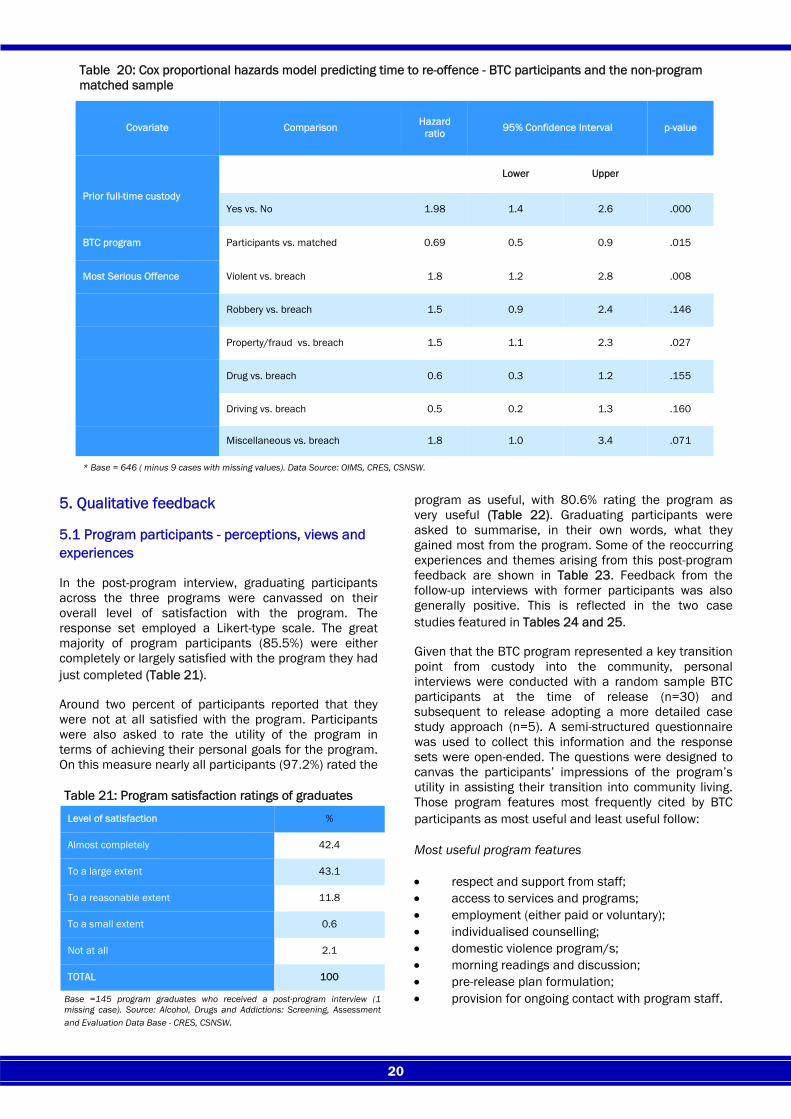
20
5. Qualitative feedback 5.1 Program participants - perceptions, views and experiences In the post-program interview, graduating participants across the three programs were canvassed on their overall level of satisfaction with the program. The response set employed a Likert-type scale. The great majority of program participants (85.5%) were either completely or largely satisfied with the program they had just completed (Table 21). Around two percent of participants reported that they were not at all satisfied with the program. Participants were also asked to rate the utility of the program in terms of achieving their personal goals for the program. On this measure nearly all participants (97.2%) rated the
program as useful, with 80.6% rating the program as very useful (Table 22). Graduating participants were asked to summarise, in their own words, what they gained most from the program. Some of the reoccurring experiences and themes arising from this post-program feedback are shown in Table 23. Feedback from the follow-up interviews with former participants was also generally positive. This is reflected in the two case studies featured in Tables 24 and 25. Given that the BTC program represented a key transition point from custody into the community, personal interviews were conducted with a random sample BTC participants at the time of release (n=30) and subsequent to release adopting a more detailed case study approach (n=5). A semi-structured questionnaire was used to collect this information and the response sets were open-ended. The questions were designed to canvas the participants’ impressions of the program’s utility in assisting their transition into community living. Those program features most frequently cited by BTC participants as most useful and least useful follow: Most useful program features • respect and support from staff; • access to services and programs; • employment (either paid or voluntary); • individualised counselling; • domestic violence program/s; • morning readings and discussion; • pre-release plan formulation; • provision for ongoing contact with program staff.
Covariate Comparison Hazard ratio 95% Confidence Interval p-value
Prior full-time custody
Lower Upper
Yes vs. No 1.98 1.4 2.6 .000
BTC program Participants vs. matched 0.69 0.5 0.9 .015
Most Serious Offence Violent vs. breach 1.8 1.2 2.8 .008
Robbery vs. breach 1.5 0.9 2.4 .146
Property/fraud vs. breach 1.5 1.1 2.3 .027
Drug vs. breach 0.6 0.3 1.2 .155
Driving vs. breach 0.5 0.2 1.3 .160
Miscellaneous vs. breach 1.8 1.0 3.4 .071
Table 20: Cox proportional hazards model predicting time to re-offence - BTC participants and the non-program matched sample
* Base = 646 ( minus 9 cases with missing values). Data Source: OIMS, CRES, CSNSW.
Level of satisfaction %
Almost completely 42.4
To a large extent 43.1
To a reasonable extent 11.8
To a small extent 0.6
Not at all 2.1
TOTAL 100
Table 21: Program satisfaction ratings of graduates
Base =145 program graduates who received a post-program interview (1 missing case). Source: Alcohol, Drugs and Addictions: Screening, Assessment and Evaluation Data Base - CRES, CSNSW.
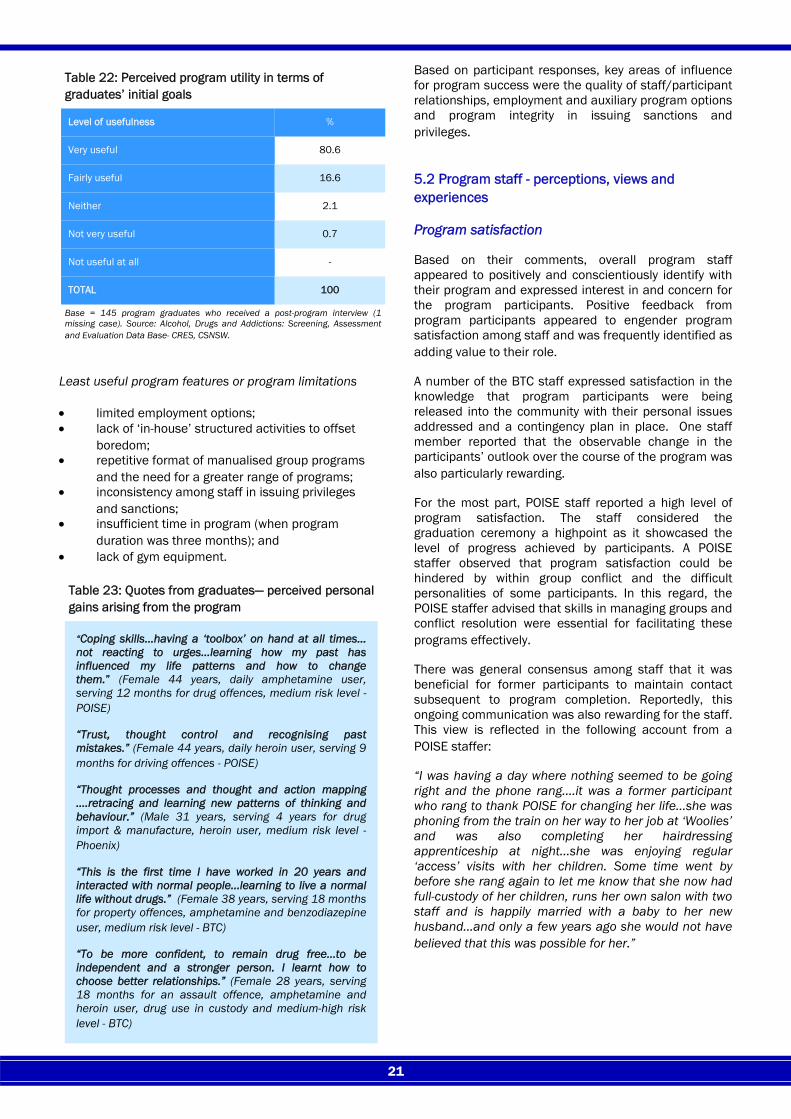
21
Least useful program features or program limitations • limited employment options; • lack of ‘in-house’ structured activities to offset
boredom; • repetitive format of manualised group programs
and the need for a greater range of programs; • inconsistency among staff in issuing privileges
and sanctions; • insufficient time in program (when program
duration was three months); and • lack of gym equipment.
Based on participant responses, key areas of influence for program success were the quality of staff/participant relationships, employment and auxiliary program options and program integrity in issuing sanctions and privileges. 5.2 Program staff - perceptions, views and experiences Program satisfaction Based on their comments, overall program staff appeared to positively and conscientiously identify with their program and expressed interest in and concern for the program participants. Positive feedback from program participants appeared to engender program satisfaction among staff and was frequently identified as adding value to their role. A number of the BTC staff expressed satisfaction in the knowledge that program participants were being released into the community with their personal issues addressed and a contingency plan in place. One staff member reported that the observable change in the participants’ outlook over the course of the program was also particularly rewarding. For the most part, POISE staff reported a high level of program satisfaction. The staff considered the graduation ceremony a highpoint as it showcased the level of progress achieved by participants. A POISE staffer observed that program satisfaction could be hindered by within group conflict and the difficult personalities of some participants. In this regard, the POISE staffer advised that skills in managing groups and conflict resolution were essential for facilitating these programs effectively. There was general consensus among staff that it was beneficial for former participants to maintain contact subsequent to program completion. Reportedly, this ongoing communication was also rewarding for the staff. This view is reflected in the following account from a POISE staffer: “I was having a day where nothing seemed to be going right and the phone rang….it was a former participant who rang to thank POISE for changing her life...she was phoning from the train on her way to her job at ‘Woolies’ and was also completing her hairdressing apprenticeship at night...she was enjoying regular ‘access’ visits with her children. Some time went by before she rang again to let me know that she now had full-custody of her children, runs her own salon with two staff and is happily married with a baby to her new husband...and only a few years ago she would not have believed that this was possible for her.”
Level of usefulness %
Very useful 80.6
Fairly useful 16.6
Neither 2.1
Not very useful 0.7
Not useful at all -
TOTAL 100
Table 22: Perceived program utility in terms of graduates’ initial goals
Base = 145 program graduates who received a post-program interview (1 missing case). Source: Alcohol, Drugs and Addictions: Screening, Assessment and Evaluation Data Base- CRES, CSNSW.
“Coping skills…having a ‘toolbox’ on hand at all times…not reacting to urges…learning how my past has influenced my life patterns and how to change them.” (Female 44 years, daily amphetamine user, serving 12 months for drug offences, medium risk level - POISE) “Trust, thought control and recognising past mistakes.” (Female 44 years, daily heroin user, serving 9 months for driving offences - POISE) “Thought processes and thought and action mapping ….retracing and learning new patterns of thinking and behaviour.” (Male 31 years, serving 4 years for drug import & manufacture, heroin user, medium risk level - Phoenix) “This is the first time I have worked in 20 years and interacted with normal people…learning to live a normal life without drugs.” (Female 38 years, serving 18 months for property offences, amphetamine and benzodiazepine user, medium risk level - BTC) “To be more confident, to remain drug free…to be independent and a stronger person. I learnt how to choose better relationships.” (Female 28 years, serving 18 months for an assault offence, amphetamine and heroin user, drug use in custody and medium-high risk level - BTC)
Table 23: Quotes from graduates— perceived personal gains arising from the program
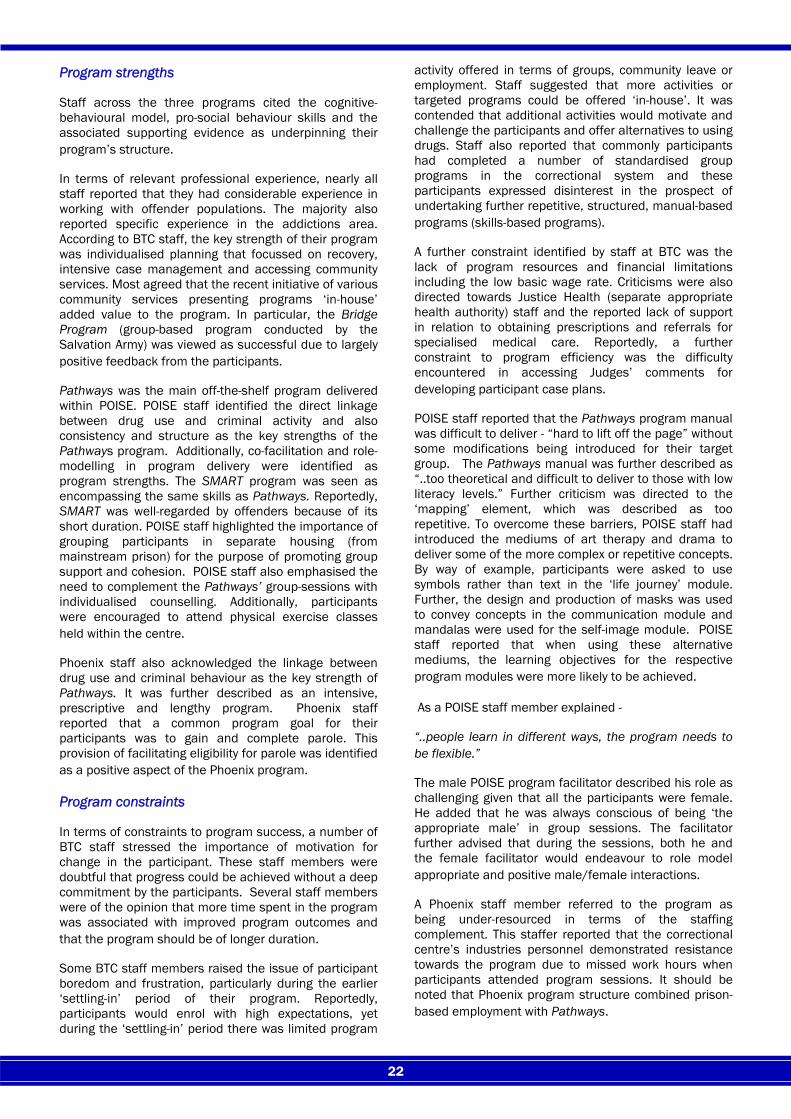
22
Program strengths Staff across the three programs cited the cognitive-behavioural model, pro-social behaviour skills and the associated supporting evidence as underpinning their program’s structure. In terms of relevant professional experience, nearly all staff reported that they had considerable experience in working with offender populations. The majority also reported specific experience in the addictions area. According to BTC staff, the key strength of their program was individualised planning that focussed on recovery, intensive case management and accessing community services. Most agreed that the recent initiative of various community services presenting programs ‘in-house’ added value to the program. In particular, the Bridge Program (group-based program conducted by the Salvation Army) was viewed as successful due to largely positive feedback from the participants. Pathways was the main off-the-shelf program delivered within POISE. POISE staff identified the direct linkage between drug use and criminal activity and also consistency and structure as the key strengths of the Pathways program. Additionally, co-facilitation and role-modelling in program delivery were identified as program strengths. The SMART program was seen as encompassing the same skills as Pathways. Reportedly, SMART was well-regarded by offenders because of its short duration. POISE staff highlighted the importance of grouping participants in separate housing (from mainstream prison) for the purpose of promoting group support and cohesion. POISE staff also emphasised the need to complement the Pathways’ group-sessions with individualised counselling. Additionally, participants were encouraged to attend physical exercise classes held within the centre. Phoenix staff also acknowledged the linkage between drug use and criminal behaviour as the key strength of Pathways. It was further described as an intensive, prescriptive and lengthy program. Phoenix staff reported that a common program goal for their participants was to gain and complete parole. This provision of facilitating eligibility for parole was identified as a positive aspect of the Phoenix program. Program constraints In terms of constraints to program success, a number of BTC staff stressed the importance of motivation for change in the participant. These staff members were doubtful that progress could be achieved without a deep commitment by the participants. Several staff members were of the opinion that more time spent in the program was associated with improved program outcomes and that the program should be of longer duration. Some BTC staff members raised the issue of participant boredom and frustration, particularly during the earlier ‘settling-in’ period of their program. Reportedly, participants would enrol with high expectations, yet during the ‘settling-in’ period there was limited program
activity offered in terms of groups, community leave or employment. Staff suggested that more activities or targeted programs could be offered ‘in-house’. It was contended that additional activities would motivate and challenge the participants and offer alternatives to using drugs. Staff also reported that commonly participants had completed a number of standardised group programs in the correctional system and these participants expressed disinterest in the prospect of undertaking further repetitive, structured, manual-based programs (skills-based programs). A further constraint identified by staff at BTC was the lack of program resources and financial limitations including the low basic wage rate. Criticisms were also directed towards Justice Health (separate appropriate health authority) staff and the reported lack of support in relation to obtaining prescriptions and referrals for specialised medical care. Reportedly, a further constraint to program efficiency was the difficulty encountered in accessing Judges’ comments for developing participant case plans. POISE staff reported that the Pathways program manual was difficult to deliver - “hard to lift off the page” without some modifications being introduced for their target group. The Pathways manual was further described as “..too theoretical and difficult to deliver to those with low literacy levels.” Further criticism was directed to the ‘mapping’ element, which was described as too repetitive. To overcome these barriers, POISE staff had introduced the mediums of art therapy and drama to deliver some of the more complex or repetitive concepts. By way of example, participants were asked to use symbols rather than text in the ‘life journey’ module. Further, the design and production of masks was used to convey concepts in the communication module and mandalas were used for the self-image module. POISE staff reported that when using these alternative mediums, the learning objectives for the respective program modules were more likely to be achieved. As a POISE staff member explained - “..people learn in different ways, the program needs to be flexible.” The male POISE program facilitator described his role as challenging given that all the participants were female. He added that he was always conscious of being ‘the appropriate male’ in group sessions. The facilitator further advised that during the sessions, both he and the female facilitator would endeavour to role model appropriate and positive male/female interactions. A Phoenix staff member referred to the program as being under-resourced in terms of the staffing complement. This staffer reported that the correctional centre’s industries personnel demonstrated resistance towards the program due to missed work hours when participants attended program sessions. It should be noted that Phoenix program structure combined prison-based employment with Pathways.
23
Finally, external influences, such as unanticipated participant transfers to different correctional centres were identified as having a negative impact, not only for the inmate transferred, but also for the cohesion of the participant group. Recommendations of program staff Overall staff feedback was positive. Findings were suggestive of the need for manual-based programs to be sufficiently flexible in operation to maintain group engagement and also to be sufficiently responsive to enable individual needs to be addressed. Responses also pointed to the need for ongoing promotion of these programs within the correctional system in order to facilitate centre cooperation and successful delivery. Finally, program management argued for the level and allocation of program resources to be subject to regular review. Following are specific recommendations put forward by staff: Pathways program • Augment Pathways with individualised counselling
sessions. • Review and improve the program manual. • Increase flexibility in group program delivery that
allows for alternative modes, such as drama and art therapy.
Transitional program (BTC) • The minimum program length be extended to six
months. • Include parenting skills as a program element. • Review basic wage for participants in line with other
correctional programs. • Increase the availability of ‘in-house’ services and
programs for those participants who are not based in the community during the day.
General • Isolate participant housing from the mainstream
prison population. • Increase the use of positive contingency models
(structured incentives for pro-social behaviour) in program structure.
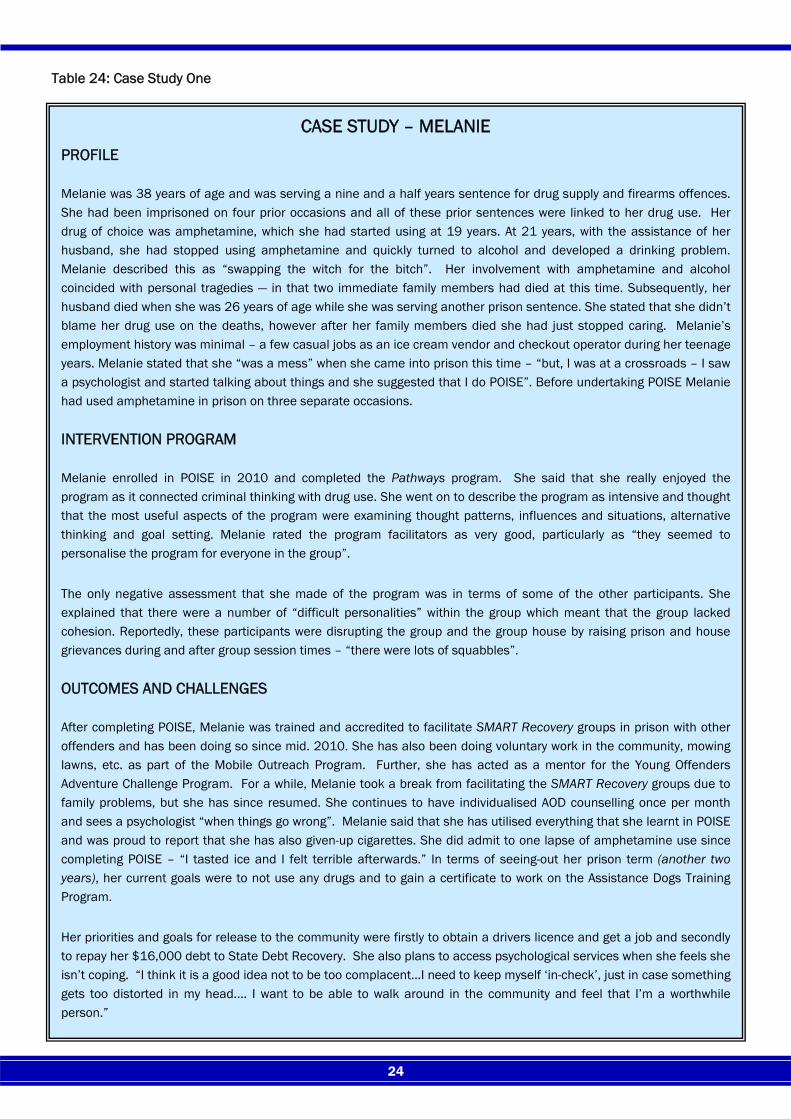
24
CASE STUDY – MELANIE PROFILE
Melanie was 38 years of age and was serving a nine and a half years sentence for drug supply and firearms offences. She had been imprisoned on four prior occasions and all of these prior sentences were linked to her drug use. Her drug of choice was amphetamine, which she had started using at 19 years. At 21 years, with the assistance of her husband, she had stopped using amphetamine and quickly turned to alcohol and developed a drinking problem. Melanie described this as “swapping the witch for the bitch”. Her involvement with amphetamine and alcohol coincided with personal tragedies — in that two immediate family members had died at this time. Subsequently, her husband died when she was 26 years of age while she was serving another prison sentence. She stated that she didn’t blame her drug use on the deaths, however after her family members died she had just stopped caring. Melanie’s employment history was minimal – a few casual jobs as an ice cream vendor and checkout operator during her teenage years. Melanie stated that she “was a mess” when she came into prison this time – “but, I was at a crossroads – I saw a psychologist and started talking about things and she suggested that I do POISE”. Before undertaking POISE Melanie had used amphetamine in prison on three separate occasions.
INTERVENTION PROGRAM
Melanie enrolled in POISE in 2010 and completed the Pathways program. She said that she really enjoyed the program as it connected criminal thinking with drug use. She went on to describe the program as intensive and thought that the most useful aspects of the program were examining thought patterns, influences and situations, alternative thinking and goal setting. Melanie rated the program facilitators as very good, particularly as “they seemed to personalise the program for everyone in the group”. The only negative assessment that she made of the program was in terms of some of the other participants. She explained that there were a number of “difficult personalities” within the group which meant that the group lacked cohesion. Reportedly, these participants were disrupting the group and the group house by raising prison and house grievances during and after group session times – “there were lots of squabbles”.
OUTCOMES AND CHALLENGES
After completing POISE, Melanie was trained and accredited to facilitate SMART Recovery groups in prison with other offenders and has been doing so since mid. 2010. She has also been doing voluntary work in the community, mowing lawns, etc. as part of the Mobile Outreach Program. Further, she has acted as a mentor for the Young Offenders Adventure Challenge Program. For a while, Melanie took a break from facilitating the SMART Recovery groups due to family problems, but she has since resumed. She continues to have individualised AOD counselling once per month and sees a psychologist “when things go wrong”. Melanie said that she has utilised everything that she learnt in POISE and was proud to report that she has also given-up cigarettes. She did admit to one lapse of amphetamine use since completing POISE – “I tasted ice and I felt terrible afterwards.” In terms of seeing-out her prison term (another two years), her current goals were to not use any drugs and to gain a certificate to work on the Assistance Dogs Training Program. Her priorities and goals for release to the community were firstly to obtain a drivers licence and get a job and secondly to repay her $16,000 debt to State Debt Recovery. She also plans to access psychological services when she feels she isn’t coping. “I think it is a good idea not to be too complacent…I need to keep myself ‘in-check’, just in case something gets too distorted in my head.... I want to be able to walk around in the community and feel that I’m a worthwhile person.”
Table 24: Case Study One
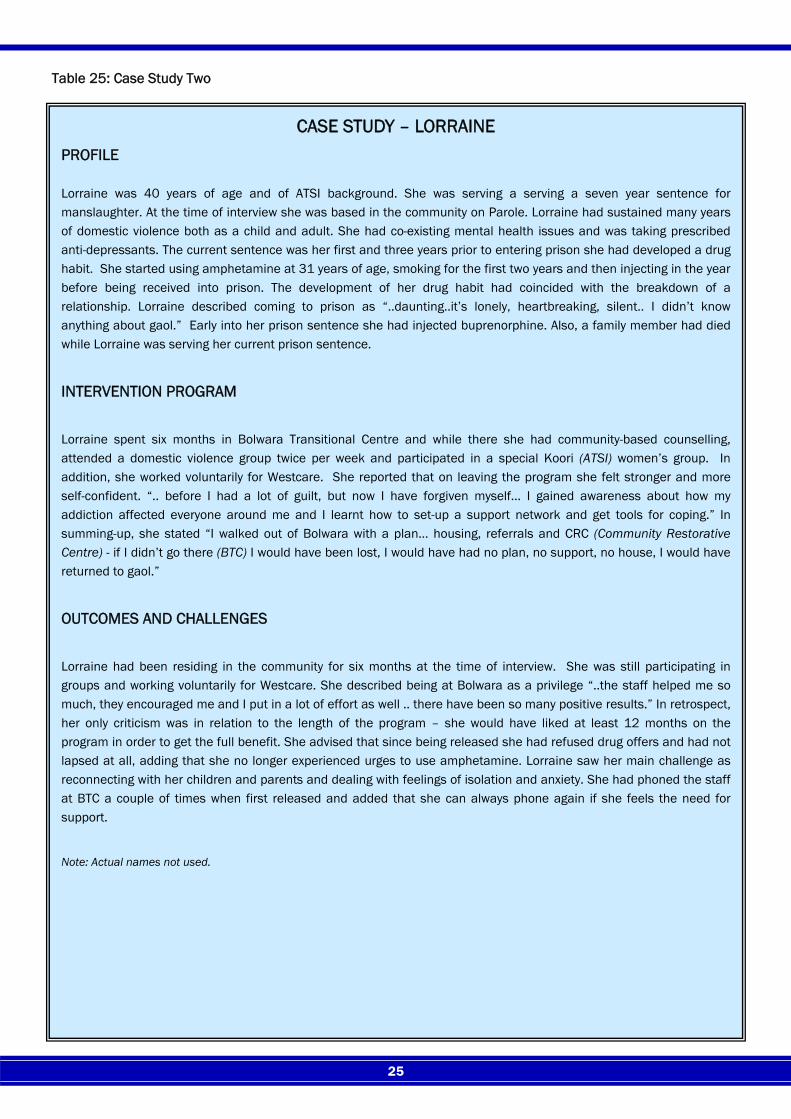
25
CASE STUDY – LORRAINE PROFILE
Lorraine was 40 years of age and of ATSI background. She was serving a serving a seven year sentence for manslaughter. At the time of interview she was based in the community on Parole. Lorraine had sustained many years of domestic violence both as a child and adult. She had co-existing mental health issues and was taking prescribed anti-depressants. The current sentence was her first and three years prior to entering prison she had developed a drug habit. She started using amphetamine at 31 years of age, smoking for the first two years and then injecting in the year before being received into prison. The development of her drug habit had coincided with the breakdown of a relationship. Lorraine described coming to prison as “..daunting..it’s lonely, heartbreaking, silent.. I didn’t know anything about gaol.” Early into her prison sentence she had injected buprenorphine. Also, a family member had died while Lorraine was serving her current prison sentence.
INTERVENTION PROGRAM
Lorraine spent six months in Bolwara Transitional Centre and while there she had community-based counselling, attended a domestic violence group twice per week and participated in a special Koori (ATSI) women’s group. In addition, she worked voluntarily for Westcare. She reported that on leaving the program she felt stronger and more self-confident. “.. before I had a lot of guilt, but now I have forgiven myself… I gained awareness about how my addiction affected everyone around me and I learnt how to set-up a support network and get tools for coping.” In summing-up, she stated “I walked out of Bolwara with a plan… housing, referrals and CRC (Community Restorative Centre) - if I didn’t go there (BTC) I would have been lost, I would have had no plan, no support, no house, I would have returned to gaol.”
OUTCOMES AND CHALLENGES
Lorraine had been residing in the community for six months at the time of interview. She was still participating in groups and working voluntarily for Westcare. She described being at Bolwara as a privilege “..the staff helped me so much, they encouraged me and I put in a lot of effort as well .. there have been so many positive results.” In retrospect, her only criticism was in relation to the length of the program – she would have liked at least 12 months on the program in order to get the full benefit. She advised that since being released she had refused drug offers and had not lapsed at all, adding that she no longer experienced urges to use amphetamine. Lorraine saw her main challenge as reconnecting with her children and parents and dealing with feelings of isolation and anxiety. She had phoned the staff at BTC a couple of times when first released and added that she can always phone again if she feels the need for support.
Note: Actual names not used.
Table 25: Case Study Two
26
DISCUSSION This report documents the evaluation of the Drug Summit-funded demand reduction programs with custody-based offenders in NSW. The period under review was the three and a half years between July 2007 and December 2010. In addition, the recidivism rates of BTC transitional centre participants were examined over a longer time span (2003 to 2010). The evaluation forms part of a larger evaluation initiative known as the Corrections Treatment Outcome Study (CTOS). Under the CTOS initiative, during the early years of program evaluation the results of different programs are aggregated and reported as a composite. The rationale behind such a process is that corrections programs are typically discrete with low threshold and completion numbers too modest to enable meaningful statistical conclusions to be drawn. The aggregation of program outcomes overcomes this limitation and would provide for an overall broad-based measure of custody-based drug treatment programs in NSW. Appropriate assessment procedures and tools are critical when potential candidates are numerous and treatment resources limited. The first phase of CTOS involved the development and pilot of a series of comprehensive, systematic tools for identifying suitable candidates for drug treatment. These screening and assessment research tools have been used in this current evaluation of the Drug Summit programs. The broad methodological framework devised, targeted the examination of program effects via repeated measures on program participants and a quasi-experimental comparison on reoffending behaviour. Qualitative information was also gathered on treatment-related issues too assist in explaining observed empirical changes. Limitations The current study was interested in the overall effects of the custody-based Drug Summit programs. The aggregated methodology did not control for variations in program length, program changes over time, staff/participant ratios, participant eligibility criteria or the responsivity target levels of the particular program. The findings of male and female participants were merged due to modest sample numbers. Given the gender breakdown of the treatment sample, these findings represent a predominantly female treatment sample (i.e., there was a female gender bias). The reported summary profile characteristics would not necessarily be representative of male participants. Allowing for the nominal number of males, no gender differences could be identified in program completion or recidivism rates. Selection bias is a common problem in treatment evaluation. Selection bias limits inferences and extrapolations across contexts. This is often due to the
self-selecting nature of treatment populations. In the current study this was attenuated to some extent by the implicit ‘quasi-compulsory’ nature of program enrolment during imprisonment. Sentenced offenders managed by CSNSW are required to address their offending behaviour. Participants who did not complete the program due to voluntary or involuntary withdrawal were not tested post-program. In the correctional system, early discharges are frequently sudden occasions and it is not feasible for staff to administer post-tests. Analysis of differences between program completers and non-completers was therefore limited to program entry characteristics and broad program factors. There were also some missing observations from the baseline interviews. Observed changes pre- and post-program for program completers were potentially larger than would be observed for all participants. It could also be argued that the observed changes post-program were due to a ‘treatment dose’ effect rather than these specific programs. As the large majority of participants had failed past attempts at drug treatment current findings indicate that there were short-medium term gains from these specific cognitive-behavioural programs. On completion of these current programs participants showed improvements on a number of drug-related measures relative to their program entry levels. There are power limitations to the recidivism findings due to low numbers. The program participant numbers released to freedom at two years were modest and consequently findings should be seen as preliminary. The study was unable to control for ‘pseudo-reconvictions’ – reimprisonment due to historic offences as opposed to new offences. The examination of changes in the frequency and severity of reoffending was beyond the scope of this study. Finally, the study’s definition of recidivism as re-imprisonment, while being the measure of interest for prison-based interventions, does not provide a definitive measure of reoffending per se. Given that the study is longitudinal in nature, larger participant numbers over time should overcome most of the above issues with subsequent analysis separating-out different program and participant profiles. It is noteworthy that the methodology adopted for this study was consistent with the criteria for inclusion in the 2006 Campbell Collaboration meta-analytical evaluation of custody-based drug treatment programs. Program activity In the three and a half year window period around 300 individuals participated in custody-based Drug Summit demand reduction programs. The program completion rate derived from completion numbers (67%) did not take into account such factors as inmate transfers or early releases which were beyond the control of program staff. This limitation of the data source may have artificially deflated the program completion rates. The evaluation methodology required program staff to
27
complete pre- and post-program assessments for the purposes of evaluation. Although the overall pre- and post-assessment capture rate was acceptable, one-third of cases were missing from the data set. The deficiency in data recording reduced the power of the evaluation in terms of analysis across programs and gender. Variations between program sites included differing staff complement, participant numbers moving in and out of program and intake format (closed versus open intake). This influenced the capacity of the staff to collect baseline information. A systems analysis at program site level would assist in identifying any barriers and needs in the assessment process. In light of the high demand and limited places on these programs, the administration of valid and comprehensive baseline and evaluation assessments is critical to program integrity and should be encouraged. Program reach These externally-funded programs have a crime reduction rationale underlying them. They should target those offenders whose drug use raises the likelihood of criminal behaviour. The baseline findings highlighted widespread drug involvement among participants and formed a picture of a predominantly high risk, high need group. The participant profile showed that a large majority had current and prior drug-related offences and a reoffending risk level of medium or higher. Most were assessed as dependent on drugs prior to their current custodial term and one-quarter had injected drugs in prison. An important baseline finding was that of all those participants who had participated in psychology-based drug treatment in the past, more than one-third had only done so whilst in NSW prisons. This finding provides support for the earlier documented findings that drug users enter treatment at serious points in their criminal careers. It also supports the premise that imprisonment provides a critical resource for intervention with drug-involved offenders. The present findings indicate that the CSNSW Drug Summit demand reduction programs have effectively identified suitable candidates for drug treatment and for the most part, participant-program matching has been appropriate. Program outcomes The research identified that positive program effects had been achieved. In the first instance, improvements in the post-program ratings of graduates’ cognitions and behaviours were encouraging. When compared with their baseline results, program graduates showed a significantly lower rate of self-reported prison-based drug use and were significantly more likely to be ranked in Action stage in terms of resolving their drug problem. When compared with baseline results, program graduates’ self-efficacy ratings in high risk situations for drug use and criminal activity had significantly improved
(i.e., their belief that they could reduce their drug use and criminal acts was heightened). As this information was collected by supervising field staff it could be argued that a response bias would be evident due to social desirability in the participants (i.e., in interview they gave the supervisor what they thought was the desirable answer). However in the short term, these positive findings were supported by the more objective measures of offences in custody, drug tests and reoffending on release. Overall findings on offences in custody indicated that time spent in program had a positive effect on the social behaviour of participants. This represents gains, not only for the individual participants, but also for prison management in terms of safety and security concerns and an improved living environment in prison. Three months after program entry there was a significant reduction in detected drug use for those who completed their program. The declining trend in detected drug use was not sustained at the six month mark. At program completion, most graduates reported being referred to other programs. These were most commonly drug or pre-release programs. To gain an understanding of how both individual and programmatic factors influenced program retention statistical modelling was used. The combination of participant and program factors most likely to predict program retention was: - recent suicidal ideation; - ‘heavy-end’ drug (heroin, amphetamine or cocaine)
use; and - an employment component to the program. After factoring in the effect of other variables, suicidal ideation at baseline and recent ‘heavy-end’ drug use were participant characteristics which decreased the odds of program retention. Including employment as a program element increased the odds of program retention. The incentive derived from income arising from employment may be influential in the finding on the association between employment and program retention. A number of locally developed screening and assessment measures were predictive of program completion. This lends support for their continued use in program assessment and program eligibility criteria. The individual characteristics found to be predictors of program completion in the current study are consistent with the extant research that has identified mental health at program entry and drug type as predictors of program success. Of further interest was that a higher proportion of ATSI participants completed their program when compared with non-ATSI participants. As dedicated auxiliary services were provided for ATSI offenders this finding is suggestive of the success of these dedicated services.
28
The above findings have implications for future refinements in participant-program matching. These findings emphasised the need to screen program candidates on their current emotional well-being (particularly suicidal ideation) at program entry in order to determine program suitability. The needs of those individuals experiencing suicidal ideation would be best served through targeted assistance for their emotional distress. The therapeutic value of undergoing a drug treatment program at this time would be questionable. The findings also indicated that more intensive case management would be required for those participants with ‘heavy-end’ drug problems in order to improve the program retention rates of this group. Contextual issues Overall staff reported high levels of job satisfaction and concern for the program participants. The three Drug Summit programs were also highly endorsed by participants on measures of satisfaction and utility. According to participants’ responses, key areas of influence for program success were: - high quality staff/participant relationships; - employment and auxiliary program options; and - program integrity in issuing sanctions and privileges. Staff responses reflected a need for the manual-based programs to be sufficiently flexible in operation to maintain group engagement and also to be sufficiently responsive to enable individual needs to be addressed. The importance of facilitator support and good relationships between staff and participants were frequently cited. The programs’ role in facilitating parole, as observed by staff, was confirmed by the empirical findings. Parole-based sentences (versus fixed-term) were predictive of program retention. A barrier to program retention, as identified by both participants and staff, was the disruption to group cohesion brought about by participant behaviours and issues transposed from the general prison environment. This finding highlights the importance of staff training in the areas of conflict resolution and group facilitation. It also lends support to the case of physically separating custody-based residential drug treatment programs from the mainstream prison environment. Post-release offending The real measure of any intensive offender program is its effect on the reoffending behaviour of the participants who completed the program. This measure should be tempered in the case of drug-involved offenders who present considerable challenges in treatment delivery. Drug dependency is a highly persistent and relapsing condition. Given that drug dependency is also known to escalate criminal activity, even modest reductions in the reoffending rates of this population are substantive. Around three-quarters of the current Drug Summit program participants had not returned to custody one year after release. These data
flag a positive program effect on the reoffending behaviour of participants. Consistent with prior research, program retention was found to be significantly associated with a reduction in reoffending. This calls for the development of ways to motivate and maintain treatment engagement in order to improve program retention rates. In this regard, the program practice of terminating participants who test positive for drug use should be reviewed. These drug using participants could be retained on the program but placed on an intensive behavioural management plan. Further, a management strategy of setting program completion targets for facilitators in the delivery of programs may serve to maximise program completion rates. The BTC program represented a key transition point for community survival. Importantly, treated offenders (participants) showed longer survival times to re-offence than non-treated (matched comparison sample). Participation in BTC provided a protective factor for recidivism after controlling for other risk factors. Regression analysis showed that program participants were around thirty per cent less likely to reoffend than the non-treated matched sample. This finding is supportive of the Campbell Collaboration’s conclusion that intensive prison-based drug treatment programs are more strongly associated with reductions in reoffending and drug use than other types of drug programs. Current findings flag support for the evaluation’s three broad hypotheses: - program completion was associated with significant
cognitive and behavioural improvements; - both participant and program characteristics were
found to be statistically predictive of program completion; and
- transitional program participants showed a significantly
lower rate of recidivism when compared with a non-program matched sample.
A key implication from this evaluation is that CSNSW custody-based Drug Summit programs have been successful on a number of outcome criteria. Most program participants completed their program and reported satisfaction. Importantly, there were substantial improvements in confidence to resist drug use and social functioning among participants and reductions in drug use and reoffending. There is a case for maintaining and strengthening intensive drug treatment programs based on these results. Custody-based residential drug treatment programs are a much sought after yet scarce resource. As already noted, the conduct of program evaluation itself has been linked to better drug treatment outcomes. It is important to evaluate these programs so that program effects can be identified and any positive effects maximised.
29
REFERENCES Annis, H, (1982), Situational Confidence Questionnaire, Addiction Research Foundation, Toronto, Canada. Belenko, S, (2006), Assessing Released Inmates for Substance-Abuse Related Service Needs, Crime and Delinquency, 52 (1). Bonta, J, Law, M, & Hanson, K, (1998), The prediction of criminal and violent recidivism among mentally disordered offenders: A meta-analysis, Psychological Bulletin, 123(2). Darke, S, Ross, J, & Teesson, M, (2007), The Australian Treatment Outcome Study (ATOS): What have we learnt about treatment for heroin dependence?, Volume 26(1). Darke, S, Ward, J, Hall, W, Heather, N & Wodak, A (1991), The Opiate Treatment Index (OTI) manual, NDARC Monograph 11. Sydney: National Drug and Alcohol Research Centre. Dowden, C & Brown, S, (2002), The role of substance abuse factors in predicting recidivism: A meta-analysis, Psychology, Crime and Law, 8(3). Drug Treatment Outcomes Research Study (DTORS) (2009): Final Outcomes report, Research Report, 24, Research, Development and Statistics Division, Home Office, London. Gendreau, P, Little, T, & Goggin, C, (1996), A Meta-analysis of the predictors of adult offender recidivism: What works! Criminology, 34(4). Gossop, M, Darke, S, Griffiths, P, Hando, J, Powis, B, Hall, W & Strang, J, (1995), The Severity of Dependence Scale (SDS): Psychometric properties of the SDS in English and Australian samples of heroin, cocaine and amphetamine users, Addiction, 90, 607-614. Gossop, M, Marsden, J, Stewart, D, & Kidd, T, (2003), National Treatment Outcome Research Study (NTORS): 4-5 year follow-up results, Addiction, 98(3). Gossop, M, Marsden, J, Stewart, D, & Rolf, A, (2000), The UK National Treatment Outcome Research Study and its implications, Drug and Alcohol Review, 19. Heather, N & Rollnick, S, & Bell, J (1993) Predictive Validity of the Readiness To Change Questionnaire, Addiction, 88, 1667-1677. Hubbard, R, Craddock, S, & Anderson, J, (2003) Overview of 5-year follow-up outcomes in the drug abuse treatment outcome studies (DATOS), Journal of Substance Abuse Treatment. Oct; 25(3). Kevin, M, (1992), Drug and Alcohol Exit Survey. Part 1. Drug & Alcohol Background of Inmates, Research & Statistics Unit, Research Publication No. 26, NSW Department of Corrective Services. Sydney.
Kevin, M, (2000), Addressing the Use of Drugs in Prison: A survey of prisoners in New South Wales, Research Publication No. 44. Corporate, Research, Evaluation and Statistics, NSW Department of Corrective Services, Sydney. Kevin, M, (2003), Addressing the Use of Drugs in Prison: Prevalence, nature and context, 2nd collection of a biennial survey of prisoners in New South Wales, Research Publication No. 45. Corporate, Research, Evaluation and Statistics, NSW Department of Corrective Services, Sydney. Kevin, M, (2005), Addressing the Use of Drugs in Prison: Prevalence, nature and context, 3rd collection of a biennial survey of prisoners in New South Wales, Research Publication No. 47. Corporate, Research, Evaluation and Statistics. NSW Department of Corrective Services, Sydney. Kevin, M, (2007), Drug-related patterns and trends in NSW inmates: Summary of the 2005-06 biennial data collection, Research Bulletin No. 23. Corporate, Research, Evaluation and Statistics, NSW Department of Corrective Services, Sydney. Kevin, M, (2010), Drug-related patterns and trends in NSW inmates: Overview of the 2007-08 biennial data collection, Research Bulletin No.27, Corporate, Research, Evaluation and Statistics, NSW Department of Corrective Services, Sydney. Klebe, K & O’Keefe, M, (2004), Outcome Evaluation of the Crossroads to Freedom House and Peer 1 Therapeutic Communities, Colorado Springs: University of Colorado. Lesieur, H & Blume, S, (1987), The South Oaks Gambling Screen: A New Instrument for the Identification of Pathological Gamblers, Am J Psychiatry, 1987, Sep; 144 (9): 1184-8. Murphy, D, Brecht, M, Herbeck, D, Evans, E, Huang, D, & Hser, Y, (2008), Longitudinal HIV risk behaviour among the Drug Abuse Treatment Outcome Studies (DATOS) adult sample. Evaluation Review. Feb; 32(1). Mitchell, O, Wilson, D, & Mackenzie, D, (2006), The Effectiveness of Incarceration-Based Drug Treatment on Criminal Behaviour, Campbell Systematic Reviews, The Campbell Collaboration, available at: http://www.campbellcollaboration.org. Pelissier, B, Camp, M, Gaes, G, Saylor, W, & Rhodes, R, (2003), Gender differences in outcomes from prison-based residential treatment, Journal of Substance Abuse Treatment, 24(2). Peters, R, Kearns, W, Murrin, M, & Dolente, A, (1993), Examining the effectiveness of in-jail substance abuse treatment, Journal of Offender Rehabilitation, 19(3). Prendergast, M, Podus, D, & Chang, E, (2000), Program factors and treatment outcomes in drug dependence
30
treatment: An examination using meta-analysis, Substance Use and Misuse, 35. Prendergast, M, Podus, D, Chang, E, & Urada, D, (2002), The effectiveness of drug abuse treatment: A meta-analysis of comparison group studies, Drug and Alcohol Dependence, 67. Prendergast, M, Hall, E, & Wexler, H, (2003), Multiple measures of outcome in assessing a prison-based drug treatment program, Journal of Offender Rehabilitation, 37 (3/4). Saunders, J Aasland, O, Babor, T, de le Fuente, J & Grant, M, (1993), Development of the alcohol use disorders identification test (AUDIT). WHO collaborative project on early detection of persons with harmful alcohol consumption—II, Addiction, 88, 791-804. Stathis, H, Eyland, S, & Bertram, S, (1991), Patterns of drug use among NSW prison receptions, Research Publication No. 23, Research and Statistics Division, NSW Department of Corrective Services, Sydney. Statistical Report 2009/10, Corporate, Research, Evaluation and Statistics, Corrective Services, NSW, Sydney. Stevens, A, Berto, D, Kerschl, V, Oeuvray, K, Van Ooyen, M, Steffan, E, Heckman, W, & Uchtenhagen, A, (2003), QCT Europe Summary Literature Review: The international literature on drugs, crime and treatment, EISS University of Kent, Canterbury U.K. Thompson, B, (1995), Recidivism in NSW General Study, Research Publication No. 31. Corporate, Research, Evaluation and Statistics, NSW Department of Corrective Services, Sydney. Welsh, W & McGrain, P, (2008), Predictors of therapeutic engagement in prison-based drug treatment, Drug and Alcohol Dependence, 96(3).
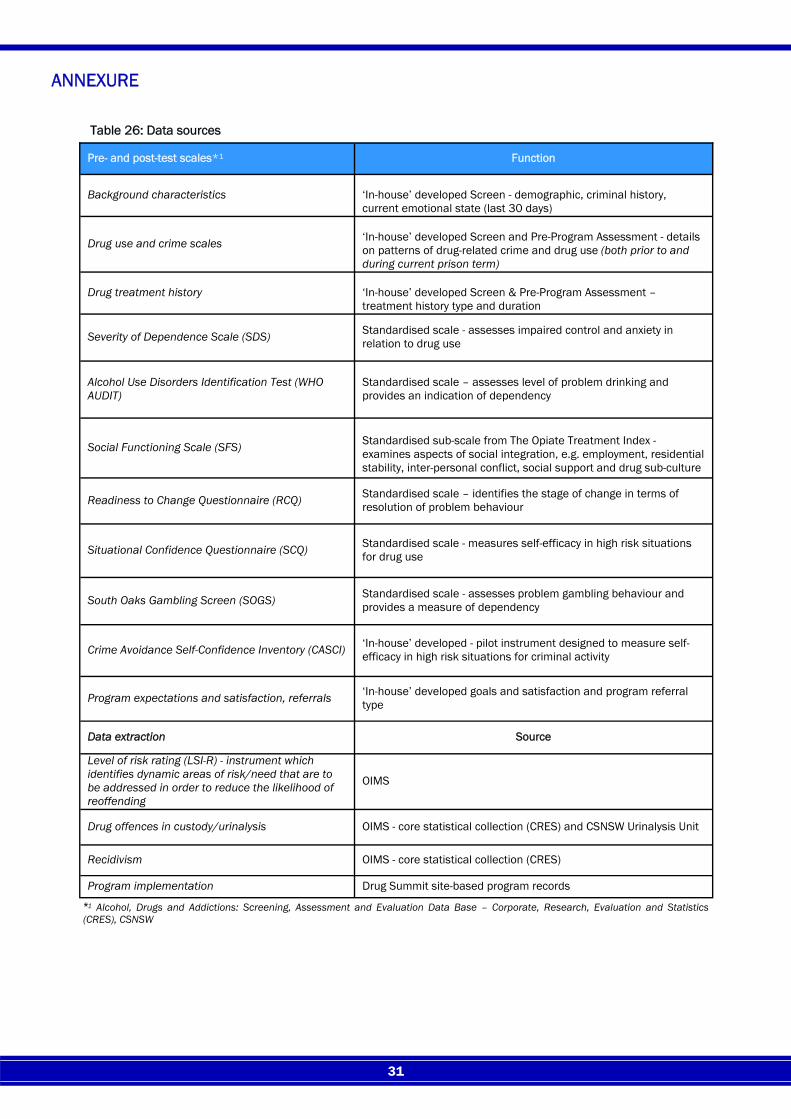
31
ANNEXURE
Table 26: Data sources
Pre- and post-test scales*1 Function
Background characteristics ‘In-house’ developed Screen - demographic, criminal history, current emotional state (last 30 days)
Drug use and crime scales
‘In-house’ developed Screen and Pre-Program Assessment - details on patterns of drug-related crime and drug use (both prior to and during current prison term)
Drug treatment history ‘In-house’ developed Screen & Pre-Program Assessment – treatment history type and duration
Severity of Dependence Scale (SDS) Standardised scale - assesses impaired control and anxiety in relation to drug use
Alcohol Use Disorders Identification Test (WHO AUDIT)
Standardised scale – assesses level of problem drinking and provides an indication of dependency
Social Functioning Scale (SFS)
Standardised sub-scale from The Opiate Treatment Index - examines aspects of social integration, e.g. employment, residential stability, inter-personal conflict, social support and drug sub-culture
Readiness to Change Questionnaire (RCQ) Standardised scale – identifies the stage of change in terms of resolution of problem behaviour
Situational Confidence Questionnaire (SCQ) Standardised scale - measures self-efficacy in high risk situations for drug use
South Oaks Gambling Screen (SOGS) Standardised scale - assesses problem gambling behaviour and provides a measure of dependency
Crime Avoidance Self-Confidence Inventory (CASCI) ‘In-house’ developed - pilot instrument designed to measure self-efficacy in high risk situations for criminal activity
Program expectations and satisfaction, referrals ‘In-house’ developed goals and satisfaction and program referral type
Data extraction Source
Level of risk rating (LSI-R) - instrument which identifies dynamic areas of risk/need that are to be addressed in order to reduce the likelihood of reoffending
OIMS
Drug offences in custody/urinalysis OIMS - core statistical collection (CRES) and CSNSW Urinalysis Unit
Recidivism OIMS - core statistical collection (CRES)
Program implementation Drug Summit site-based program records
*1 Alcohol, Drugs and Addictions: Screening, Assessment and Evaluation Data Base – Corporate, Research, Evaluation and Statistics (CRES), CSNSW
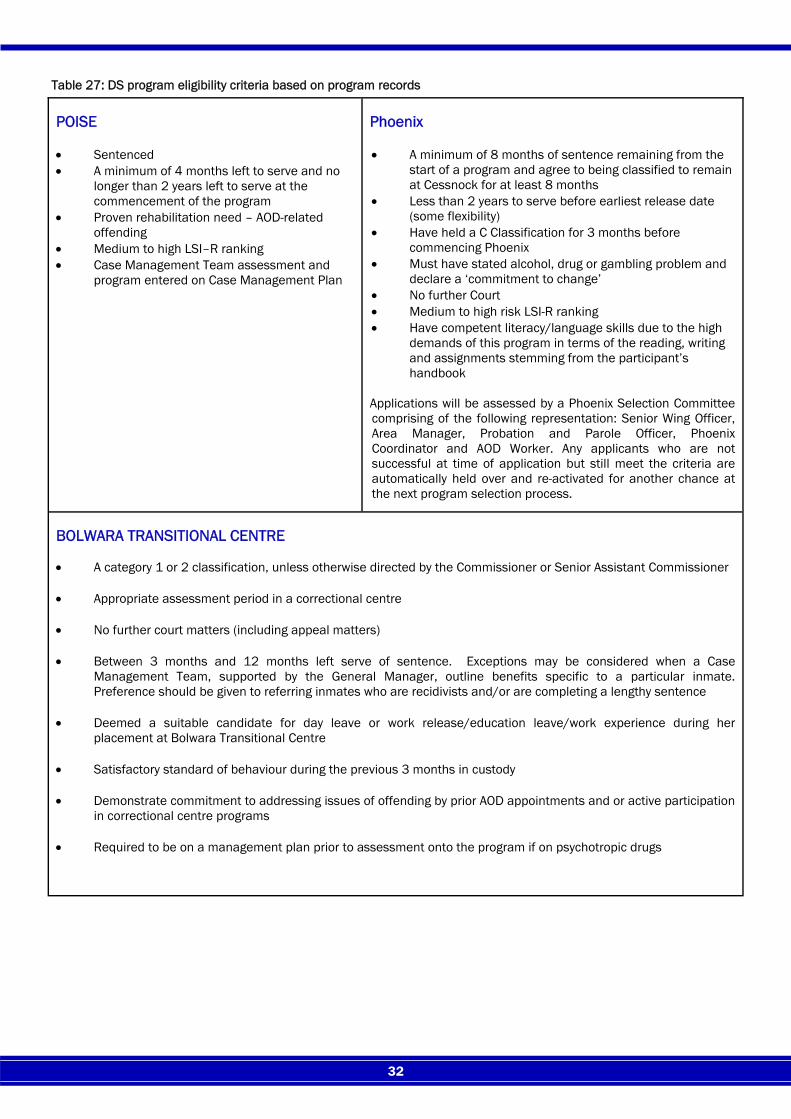
32
POISE • Sentenced • A minimum of 4 months left to serve and no
longer than 2 years left to serve at the commencement of the program
• Proven rehabilitation need – AOD-related offending
• Medium to high LSI–R ranking • Case Management Team assessment and
program entered on Case Management Plan
Phoenix • A minimum of 8 months of sentence remaining from the
start of a program and agree to being classified to remain at Cessnock for at least 8 months
• Less than 2 years to serve before earliest release date (some flexibility)
• Have held a C Classification for 3 months before commencing Phoenix
• Must have stated alcohol, drug or gambling problem and declare a ‘commitment to change’
• No further Court • Medium to high risk LSI-R ranking • Have competent literacy/language skills due to the high
demands of this program in terms of the reading, writing and assignments stemming from the participant’s handbook
Applications will be assessed by a Phoenix Selection Committee comprising of the following representation: Senior Wing Officer, Area Manager, Probation and Parole Officer, Phoenix Coordinator and AOD Worker. Any applicants who are not successful at time of application but still meet the criteria are automatically held over and re-activated for another chance at the next program selection process.
BOLWARA TRANSITIONAL CENTRE • A category 1 or 2 classification, unless otherwise directed by the Commissioner or Senior Assistant Commissioner • Appropriate assessment period in a correctional centre • No further court matters (including appeal matters) • Between 3 months and 12 months left serve of sentence. Exceptions may be considered when a Case
Management Team, supported by the General Manager, outline benefits specific to a particular inmate. Preference should be given to referring inmates who are recidivists and/or are completing a lengthy sentence
• Deemed a suitable candidate for day leave or work release/education leave/work experience during her
placement at Bolwara Transitional Centre • Satisfactory standard of behaviour during the previous 3 months in custody • Demonstrate commitment to addressing issues of offending by prior AOD appointments and or active participation
in correctional centre programs • Required to be on a management plan prior to assessment onto the program if on psychotropic drugs
Table 27: DS program eligibility criteria based on program records
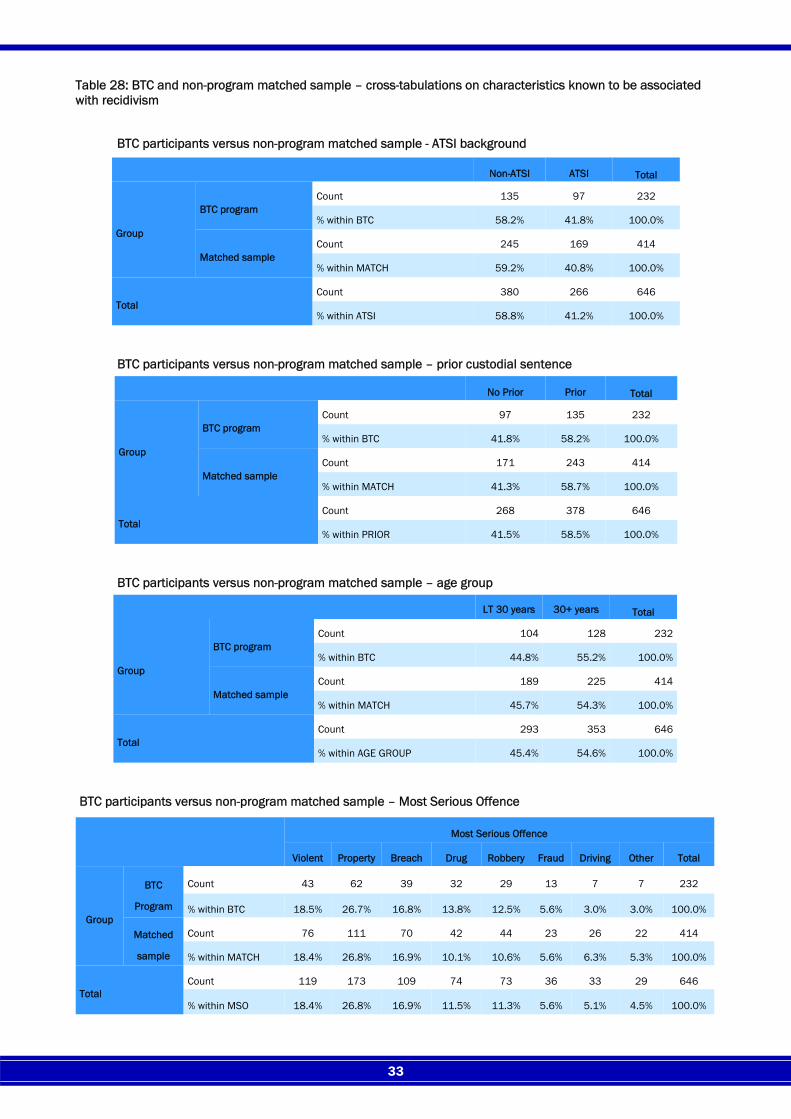
33
Table 28: BTC and non-program matched sample – cross-tabulations on characteristics known to be associated with recidivism
Non-ATSI ATSI
Total
Group
BTC program Count 135 97 232
% within BTC 58.2% 41.8% 100.0%
Matched sample Count 245 169 414
% within MATCH 59.2% 40.8% 100.0%
Total Count 380 266 646
% within ATSI 58.8% 41.2% 100.0%
BTC participants versus non-program matched sample - ATSI background
No Prior Prior
Total
Group
BTC program Count 97 135 232
% within BTC 41.8% 58.2% 100.0%
Matched sample Count 171 243 414
% within MATCH 41.3% 58.7% 100.0%
Total Count 268 378 646
% within PRIOR 41.5% 58.5% 100.0%
BTC participants versus non-program matched sample – prior custodial sentence
LT 30 years 30+ years
Total
Group
BTC program Count 104 128 232
% within BTC 44.8% 55.2% 100.0%
Matched sample Count 189 225 414
% within MATCH 45.7% 54.3% 100.0%
Total Count 293 353 646
% within AGE GROUP 45.4% 54.6% 100.0%
BTC participants versus non-program matched sample – age group
Most Serious Offence
Violent Property Breach Drug Robbery Fraud Driving Other Total
Group
BTC
Program
Count 43 62 39 32 29 13 7 7 232
% within BTC 18.5% 26.7% 16.8% 13.8% 12.5% 5.6% 3.0% 3.0% 100.0%
Matched
sample
Count 76 111 70 42 44 23 26 22 414
% within MATCH 18.4% 26.8% 16.9% 10.1% 10.6% 5.6% 6.3% 5.3% 100.0%
Total Count 119 173 109 74 73 36 33 29 646
% within MSO 18.4% 26.8% 16.9% 11.5% 11.3% 5.6% 5.1% 4.5% 100.0%
BTC participants versus non-program matched sample – Most Serious Offence
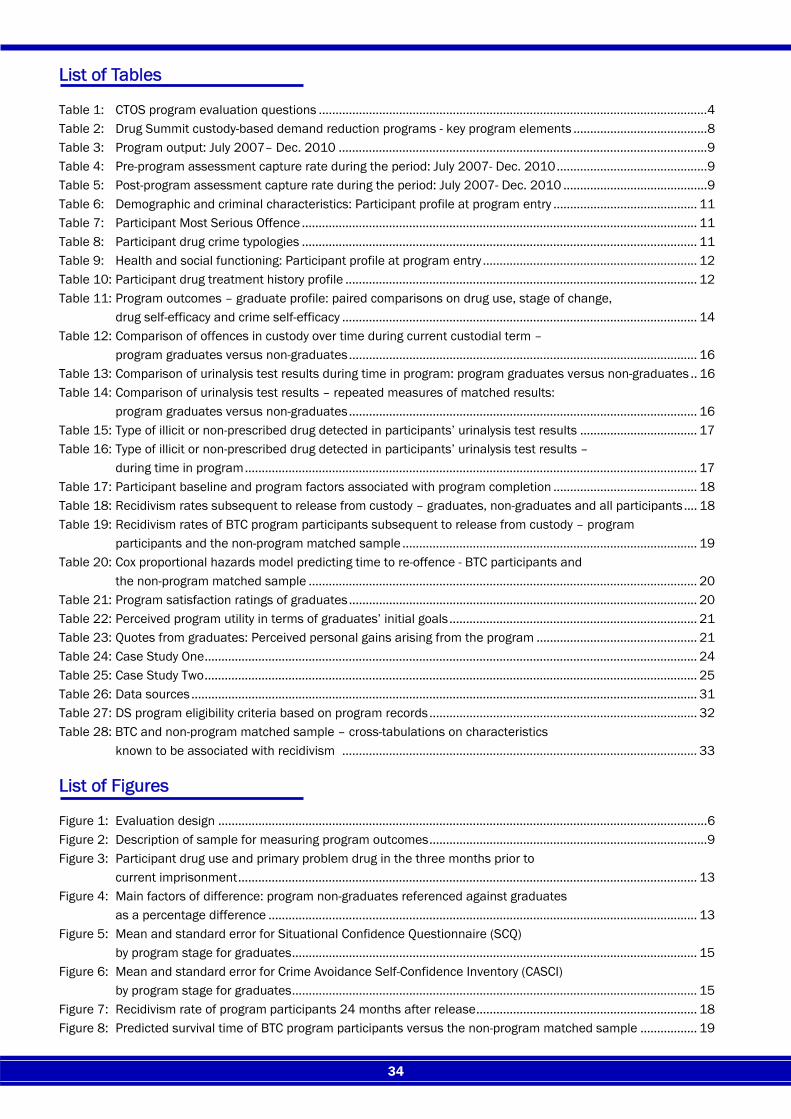
34
List of Tables Table 1: CTOS program evaluation questions ....................................................................................................................4 Table 2: Drug Summit custody-based demand reduction programs - key program elements ........................................8 Table 3: Program output: July 2007– Dec. 2010 ..............................................................................................................9 Table 4: Pre-program assessment capture rate during the period: July 2007- Dec. 2010.............................................9 Table 5: Post-program assessment capture rate during the period: July 2007- Dec. 2010 ...........................................9 Table 6: Demographic and criminal characteristics: Participant profile at program entry ........................................... 11 Table 7: Participant Most Serious Offence ...................................................................................................................... 11 Table 8: Participant drug crime typologies ...................................................................................................................... 11 Table 9: Health and social functioning: Participant profile at program entry ................................................................ 12 Table 10: Participant drug treatment history profile ......................................................................................................... 12 Table 11: Program outcomes – graduate profile: paired comparisons on drug use, stage of change, drug self-efficacy and crime self-efficacy .......................................................................................................... 14 Table 12: Comparison of offences in custody over time during current custodial term – program graduates versus non-graduates........................................................................................................ 16 Table 13: Comparison of urinalysis test results during time in program: program graduates versus non-graduates .. 16 Table 14: Comparison of urinalysis test results – repeated measures of matched results: program graduates versus non-graduates........................................................................................................ 16 Table 15: Type of illicit or non-prescribed drug detected in participants’ urinalysis test results ................................... 17 Table 16: Type of illicit or non-prescribed drug detected in participants’ urinalysis test results – during time in program....................................................................................................................................... 17 Table 17: Participant baseline and program factors associated with program completion ........................................... 18 Table 18: Recidivism rates subsequent to release from custody – graduates, non-graduates and all participants.... 18 Table 19: Recidivism rates of BTC program participants subsequent to release from custody – program participants and the non-program matched sample ........................................................................................ 19 Table 20: Cox proportional hazards model predicting time to re-offence - BTC participants and the non-program matched sample .................................................................................................................... 20 Table 21: Program satisfaction ratings of graduates........................................................................................................ 20 Table 22: Perceived program utility in terms of graduates’ initial goals.......................................................................... 21 Table 23: Quotes from graduates: Perceived personal gains arising from the program ................................................ 21 Table 24: Case Study One................................................................................................................................................... 24 Table 25: Case Study Two................................................................................................................................................... 25 Table 26: Data sources ....................................................................................................................................................... 31 Table 27: DS program eligibility criteria based on program records................................................................................ 32 Table 28: BTC and non-program matched sample – cross-tabulations on characteristics known to be associated with recidivism .......................................................................................................... 33 List of Figures Figure 1: Evaluation design ..................................................................................................................................................6 Figure 2: Description of sample for measuring program outcomes...................................................................................9 Figure 3: Participant drug use and primary problem drug in the three months prior to current imprisonment......................................................................................................................................... 13 Figure 4: Main factors of difference: program non-graduates referenced against graduates as a percentage difference ................................................................................................................................ 13 Figure 5: Mean and standard error for Situational Confidence Questionnaire (SCQ) by program stage for graduates......................................................................................................................... 15 Figure 6: Mean and standard error for Crime Avoidance Self-Confidence Inventory (CASCI) by program stage for graduates......................................................................................................................... 15 Figure 7: Recidivism rate of program participants 24 months after release.................................................................. 18 Figure 8: Predicted survival time of BTC program participants versus the non-program matched sample ................. 19

35
36
OTHER TITLES IN THIS SERIES 30. Offender Population Trends: Aged Offenders in
NSW. September 2011 29. The Utility of Level of Services Inventory—Revised
(LSI-R) Assessments within NSW Correctional Environments. January 2011
28. Women convicted or a violent offence in NSW:
2000 to 2009. August 2010 27. Drug-related patterns and trends in NSW inmates -
Overview of the 2007-08 biennial data collection. March 2010
26. Offender Population Trends: convicted Sex
Offenders in NSW. November 2009 25. Profile of Violent Behaviour by Inmates in NSW
correctional centres. March 2008 24. Drug-related statistics on NSW inmates: 2005.
June 2007.
23. Evaluation of the Drug and Alcohol Addiction and Relapse Prevention Programs in Community Offender Services. June 2007.
22. Escapes from NSW correctional centres - a critical
analysis. July 2006. 21. (Unpublished) 20. Remand Inmates in NSW – Some Statistics. June
2001. 19. The Alcohol and Other Drug Screen with Inmate
Receptions in New South Wales: A Pilot Initiative. May 1997.
18. Trends in Custodial Sentences in NSW: 1990-1995.
September 1996. 17. Reasons for Escape: Interviews with Recaptured
Escapees. June 1992. 16. Periodic Detention in NSW: Trends and Issues
1971-1991. August 1991. 15. Profile of NSW Periodic Detainees, 1991. June
1991. 14. NSW Corrective Services Industries and Offender
Post-release Employment. April 1991. 13. Escapes from NSW Gaols: What is the extent of the
problem, who are the escapees and what danger do they represent for the community? 1st July 1983 - 30th June, 1989. November 1989.
12. Census of unemployed Probation and Parole
clients, February, 1983. February 1983. 11. Parole in NSW: The interrelated problems of
education and unemployment. August 1982.
10. Parole in NSW: Weighing the Benefits, Dangers &
Opportunities. August 1982. 9. Violent offences and recidivism. June 1982. 8. Parole in NSW: Predicting successful completion.
August 1982. 7. Migrants’ understanding of the legal process: A
survey of prisoners in NSW gaols. 1982. 6. The threat from escapes: Some facts about prison
escapes. March 1982. 5. Language background and release from
indeterminate sentences. October 1981. 4. The impact of enforced separation on Prisoners’
Wives. October 1981. 3. Prediction of Performance in a Work Release
Programme. June 1981. 2. Language background of prisoners. December
1980. 1. Prisoner to population ratios in NSW, Victoria and
the Netherlands. December 1980.
Research Bulletin No. 31 ISSN 0729-2422
© Corrective Services NSW
Corporate Research, Evaluation & Statistics Corrective Services NSW
GPO Box 31 Sydney NSW 2001
Telephone: (02) 8346-1556 Facsimile: (02) 8346-1590
Email: [email protected] Web: http://www.correctiveservices.nsw.gov.au