Embed Size (px)
Citation preview
RB investor presentationHalf year 2017
24th July 2017
1

Rakesh KapoorChief Executive Officer
2
Disclaimer
Cautionary note concerning forward-looking statements
• This presentation contains statements with respect to the financial condition, results of operations and business of RB (the “Group”) and certain
of the plans and objectives of the Group that are forward-looking statements. Words such as ‘intends’, ‘targets’, or the negative of these terms
and other similar expressions of future performance or results, and their negatives, are intended to identify such forward-looking statements. In
particular, all statements that express forecasts, expectations and projections with respect to future matters, including targets for net revenue,
operating margin and cost efficiency, are forward-looking statements. Such statements are not historical facts, nor are they guarantees of future
performance.
• By their nature, forward-looking statements involve risk and uncertainty because they relate to events and depend on circumstances that will
occur in the future. There are a number of factors that could cause actual results and developments to differ materially from those expressed
or implied by these forward-looking statements, including many factors outside the Group’s control. Among other risks and uncertainties, the
material or principal factors which could cause actual results to differ materially are: the general economic, business, political and social
conditions in the key markets in which the Group operates; the ability of the Group to manage regulatory, tax and legal matters, including
changes thereto; the reliability of the Group’s technological infrastructure or that of third parties on which the Group relies; interruptions in the
Group’s supply chain and disruptions to its production facilities; the reputation of the Group’s global brands; and the recruitment and retention
of key management.
• These forward-looking statements speak only as of the date of this announcement. Except as required by any applicable law or regulation, the
Group expressly disclaims any obligation or undertaking to release publicly any updates or revisions to any forward-looking statements
contained herein to reflect any change in the Group’s expectations with regard thereto or any change in events, conditions or circumstances on
which any such statement is based.
3
Key messages
Significant progress on
portfolio transformation
M&A execution -ahead of schedule
Year of 2 halves
4
Cyber-AttackUpdate
RB & other companies affected.
Learnings and actions in H2
Business impact minimised
(investigation ongoing)
5
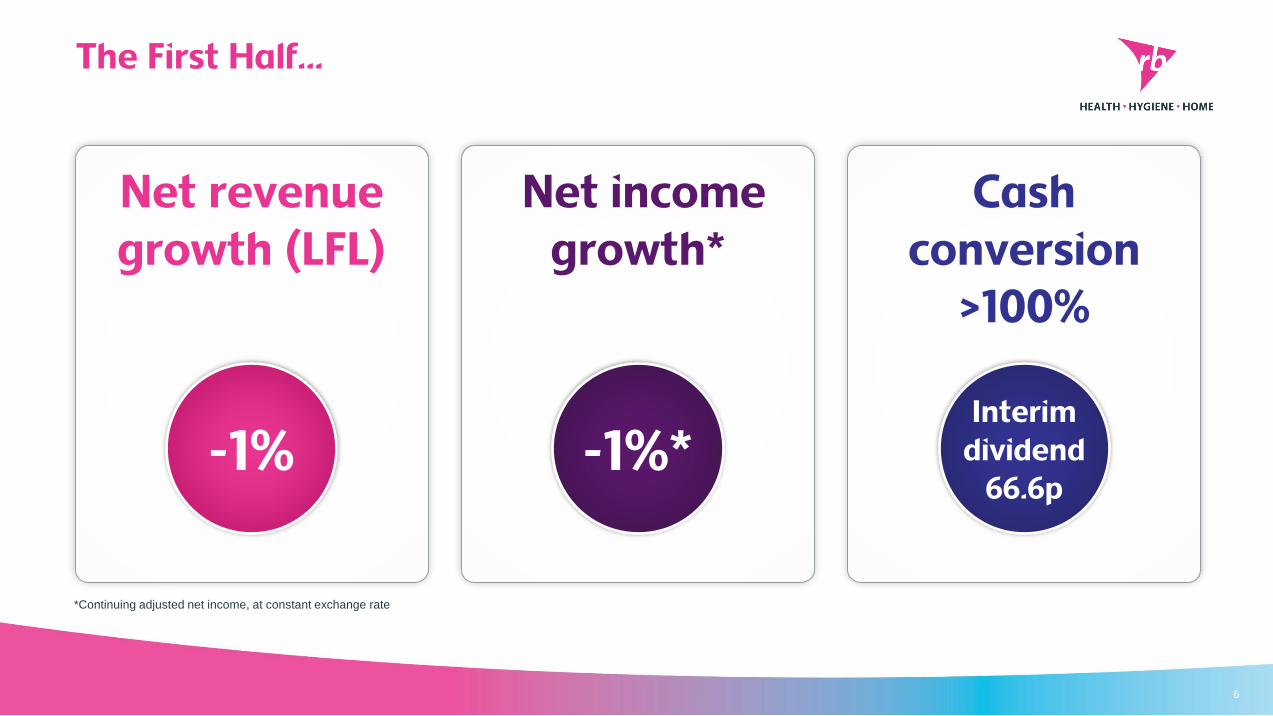
The First Half…
6
Net revenue growth (LFL)
Net income growth*
Cash conversion
>100%
-1% -1%*Interim
dividend66.6p
*Continuing adjusted net income, at constant exchange rate

Virtuous earnings – continued focus…(RB base business)
7
Grossmargin
Reinvestdrive
Netrevenuegrowth
Fixedcost
Operatingmargin
Flat
-10bps
+50bps
-1% LFL
-40bps(-26m*)*at constant exchange rate
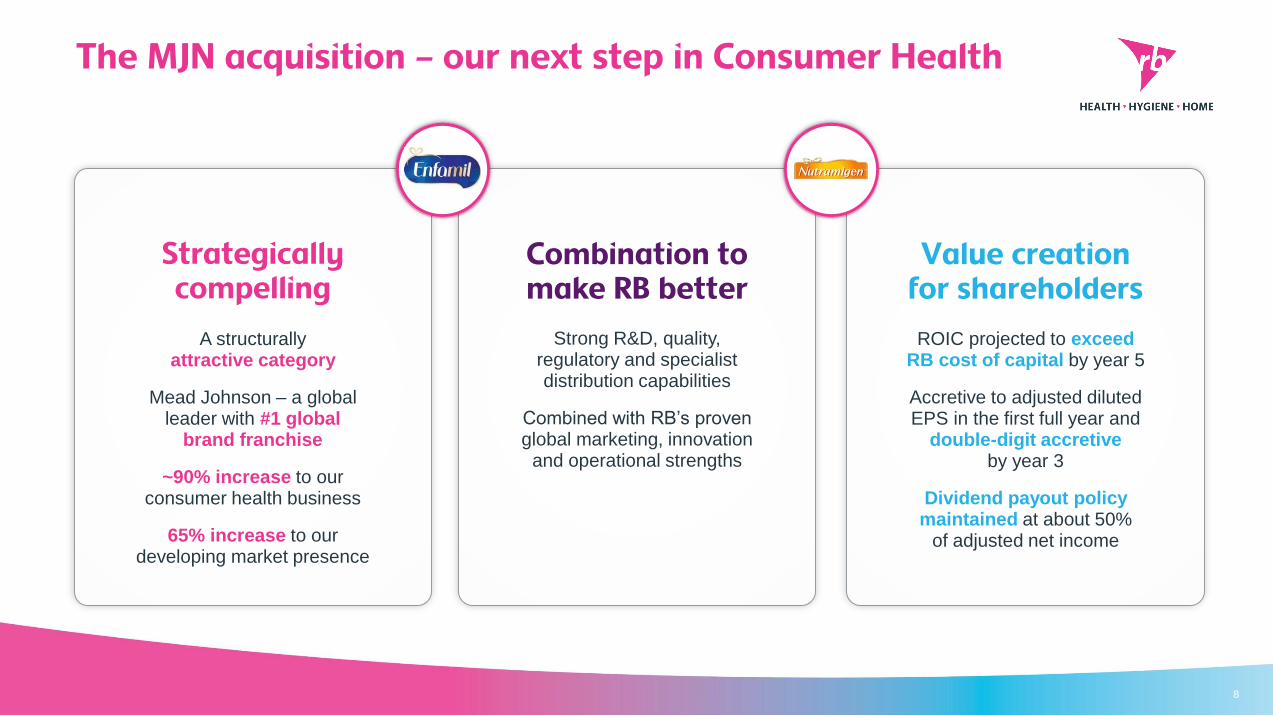
The MJN acquisition – our next step in Consumer Health
8
Strategicallycompelling
A structurally attractive category
Mead Johnson – a global leader with #1 global
brand franchise
~90% increase to our consumer health business
65% increase to our developing market presence
Combination to make RB better
Strong R&D, quality, regulatory and specialist distribution capabilities
Combined with RB’s proven global marketing, innovation
and operational strengths
Value creation for shareholders
ROIC projected to exceed RB cost of capital by year 5
Accretive to adjusted diluted EPS in the first full year and
double-digit accretiveby year 3
Dividend payout policy maintained at about 50%
of adjusted net income
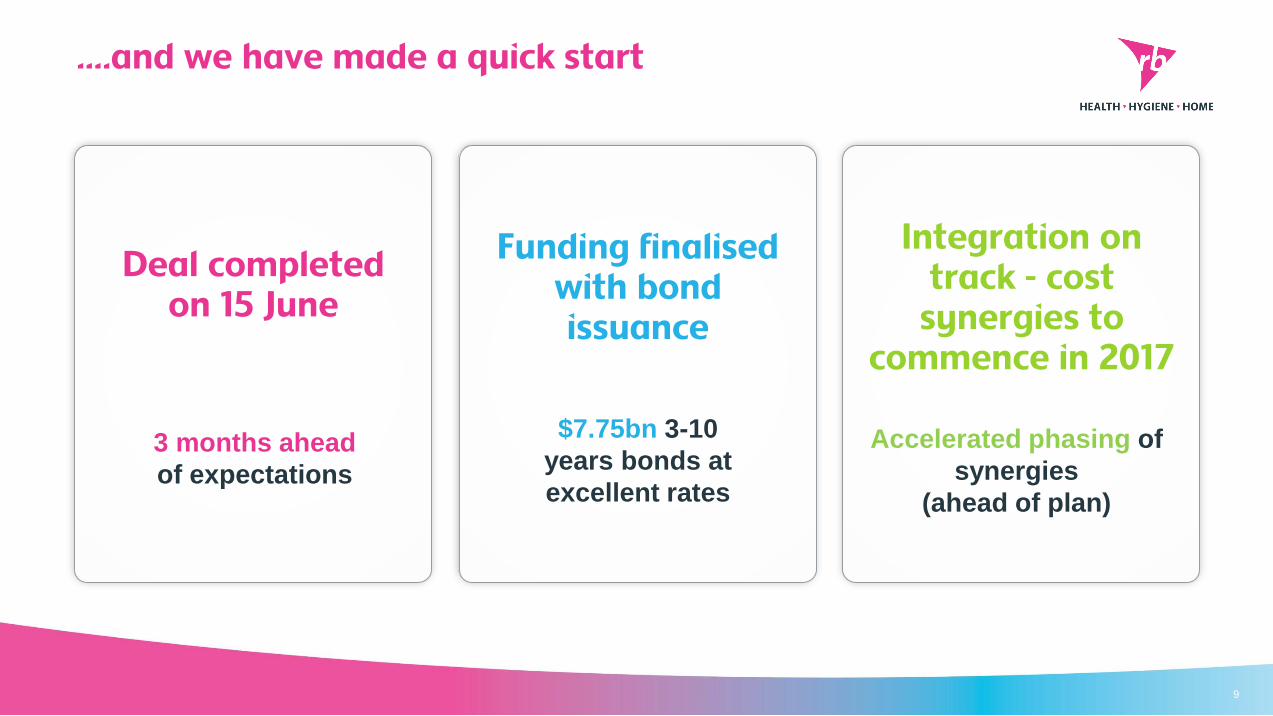
….and we have made a quick start
Funding finalised with bond issuance
$7.75bn 3-10
years bonds at
excellent rates
Integration on track - cost
synergies to commence in 2017
Accelerated phasing of
synergies
(ahead of plan)
Deal completed on 15 June
3 months ahead
of expectations
9
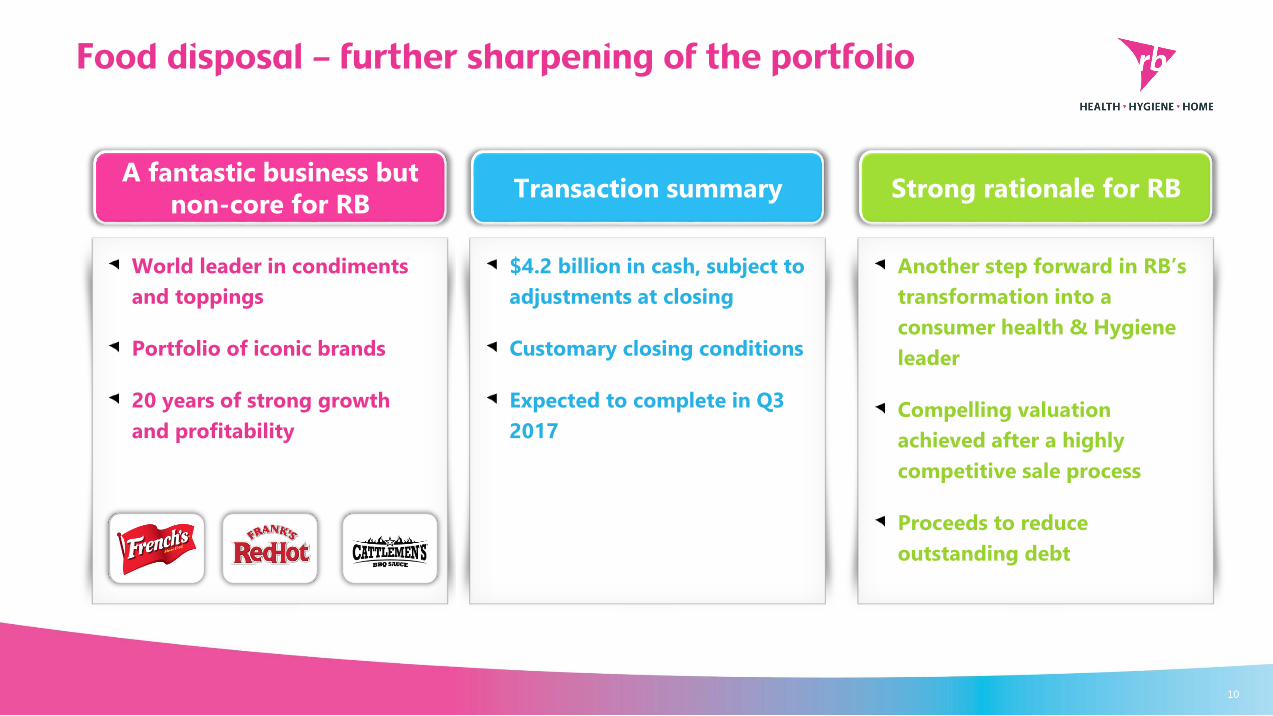
Food disposal – further sharpening of the portfolio
10
World leader in condiments
and toppings
Portfolio of iconic brands
20 years of strong growth
and profitability
A fantastic business but
non-core for RBTransaction summary Strong rationale for RB
$4.2 billion in cash, subject to
adjustments at closing
Customary closing conditions
Expected to complete in Q3
2017
Another step forward in RB’s
transformation into a
consumer health & Hygiene
leader
Compelling valuation
achieved after a highly
competitive sale process
Proceeds to reduce
outstanding debt
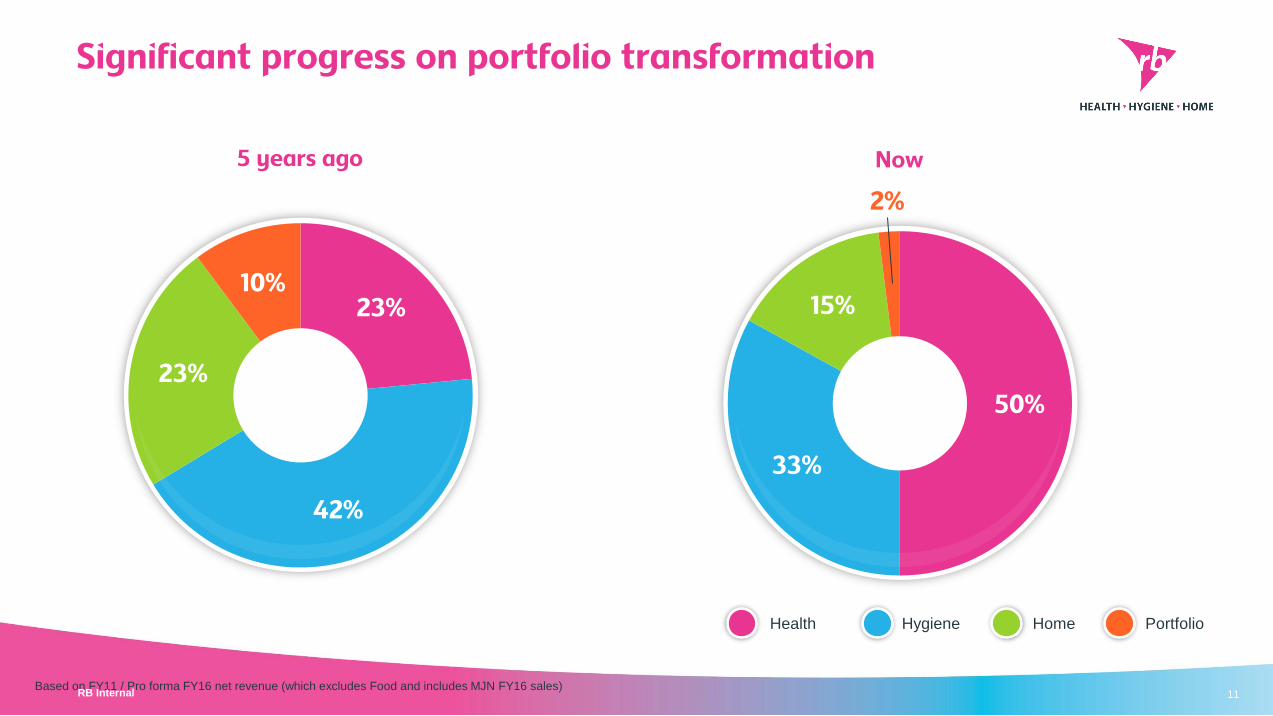
Significant progress on portfolio transformation
Health Hygiene Home Portfolio
23%
42%
23%
10%
5 years ago
50%
33%
15%
2%
Now
Based on FY11 / Pro forma FY16 net revenue (which excludes Food and includes MJN FY16 sales) RB Internal 11
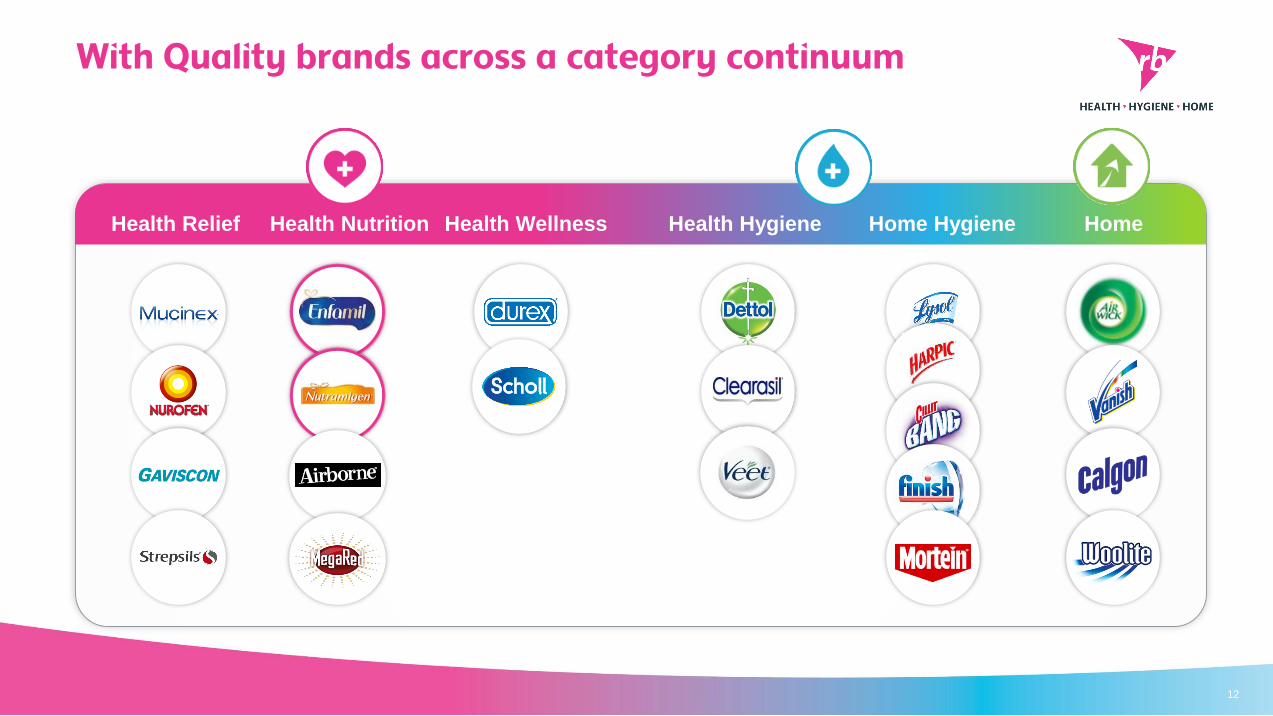
Health Relief Health Nutrition Health Wellness Health Hygiene Home Hygiene Home
12
With Quality brands across a category continuum
Adrian Hennah Chief Financial Officer
13
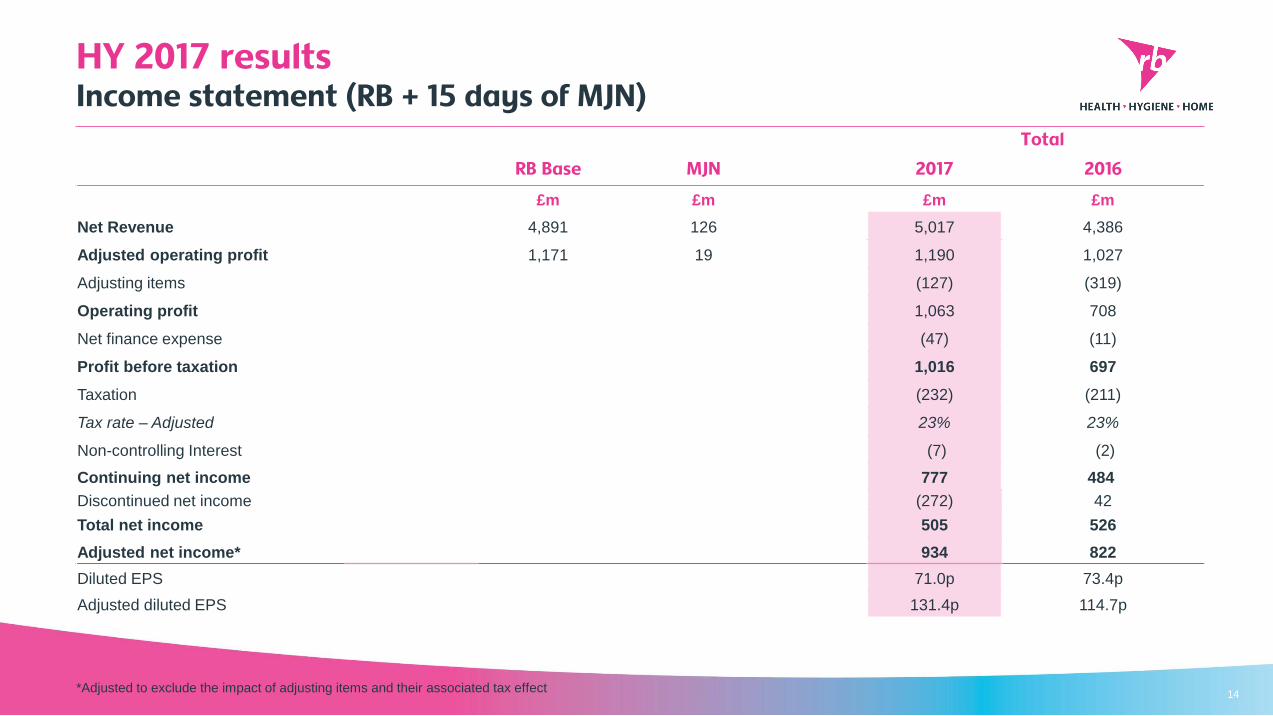
HY 2017 results Income statement (RB + 15 days of MJN)
*Adjusted to exclude the impact of adjusting items and their associated tax effect14
Total
RB Base MJN 2017 2016
£m £m £m £m
Net Revenue 4,891 126 5,017 4,386
Adjusted operating profit 1,171 19 1,190 1,027
Adjusting items (127) (319)
Operating profit 1,063 708
Net finance expense (47) (11)
Profit before taxation 1,016 697
Taxation (232) (211)
Tax rate – Adjusted 23% 23%
Non-controlling Interest (7) (2)
Continuing net income 777 484
Discontinued net income (272) 42
Total net income 505 526
Adjusted net income* 934 822
Diluted EPS 71.0p 73.4p
Adjusted diluted EPS 131.4p 114.7p
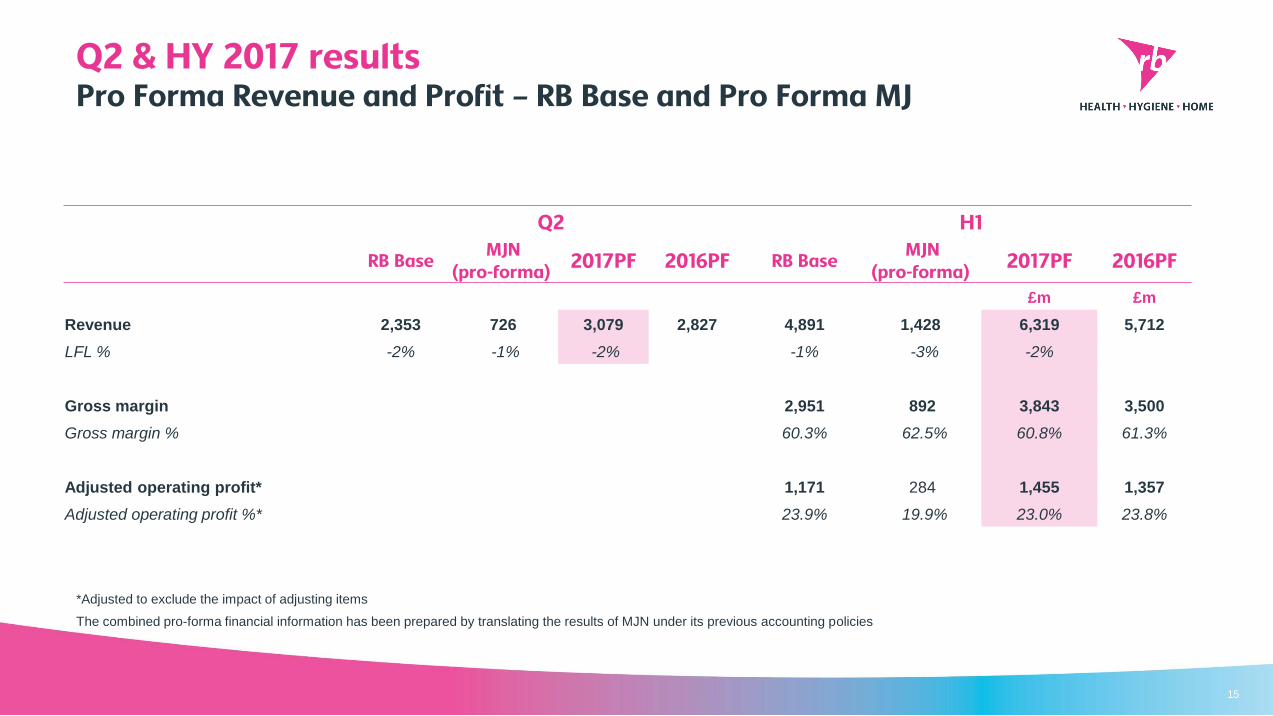
Q2 & HY 2017 resultsPro Forma Revenue and Profit – RB Base and Pro Forma MJ
*Adjusted to exclude the impact of adjusting items
The combined pro-forma financial information has been prepared by translating the results of MJN under its previous accounting policies
15
Q2 H1
RB BaseMJN
(pro-forma)2017PF 2016PF RB Base
MJN (pro-forma)
2017PF 2016PF
£m £m
Revenue 2,353 726 3,079 2,827 4,891 1,428 6,319 5,712
LFL % -2% -1% -2% -1% -3% -2%
Gross margin 2,951 892 3,843 3,500
Gross margin % 60.3% 62.5% 60.8% 61.3%
Adjusted operating profit* 1,171 284 1,455 1,357
Adjusted operating profit %* 23.9% 19.9% 23.0% 23.8%
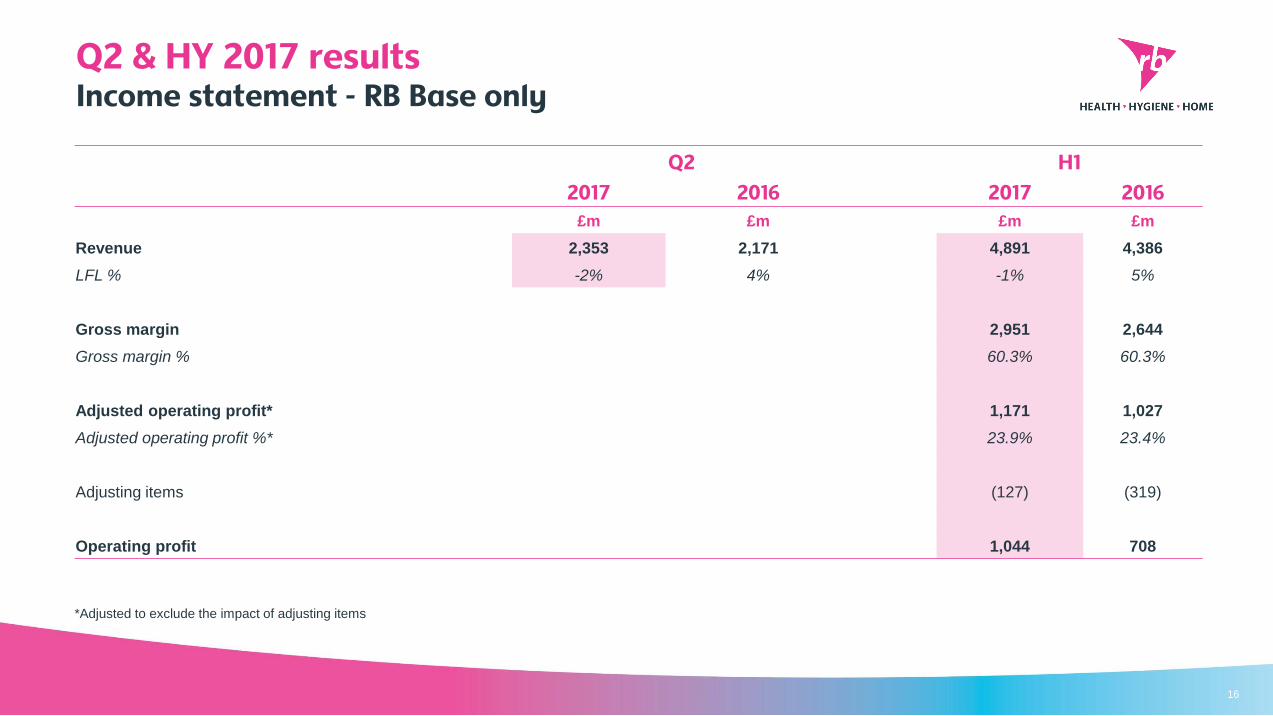
Q2 & HY 2017 resultsIncome statement - RB Base only
*Adjusted to exclude the impact of adjusting items
16
Q2 H1
2017 2016 2017 2016
£m £m £m £m
Revenue 2,353 2,171 4,891 4,386
LFL % -2% 4% -1% 5%
Gross margin 2,951 2,644
Gross margin % 60.3% 60.3%
Adjusted operating profit* 1,171 1,027
Adjusted operating profit %* 23.9% 23.4%
Adjusting items (127) (319)
Operating profit 1,044 708
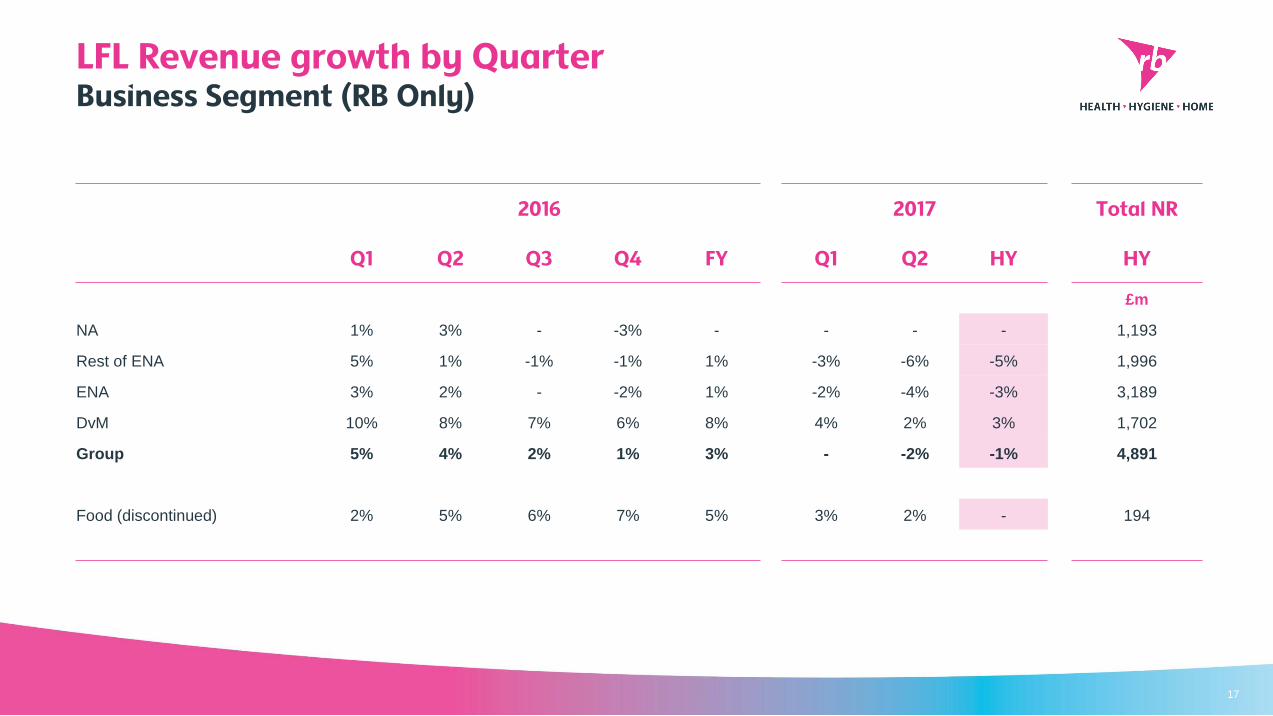
LFL Revenue growth by QuarterBusiness Segment (RB Only)
17
2016 2017 Total NR
Q1 Q2 Q3 Q4 FY Q1 Q2 HY HY
£m
NA 1% 3% - -3% - - - - 1,193
Rest of ENA 5% 1% -1% -1% 1% -3% -6% -5% 1,996
ENA 3% 2% - -2% 1% -2% -4% -3% 3,189
DvM 10% 8% 7% 6% 8% 4% 2% 3% 1,702
Group 5% 4% 2% 1% 3% - -2% -1% 4,891
Food (discontinued) 2% 5% 6% 7% 5% 3% 2% - 194
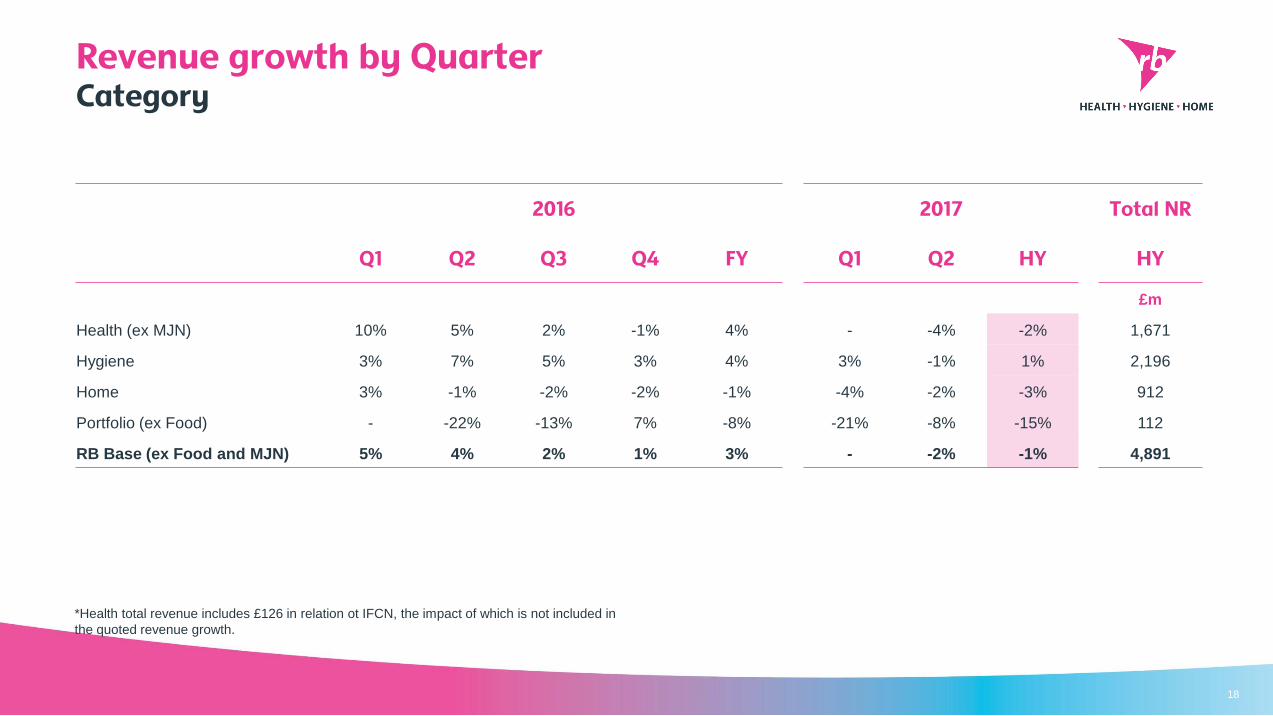
Revenue growth by QuarterCategory
18
*Health total revenue includes £126 in relation ot IFCN, the impact of which is not included in
the quoted revenue growth.
2016 2017 Total NR
Q1 Q2 Q3 Q4 FY Q1 Q2 HY HY
£m
Health (ex MJN) 10% 5% 2% -1% 4% - -4% -2% 1,671
Hygiene 3% 7% 5% 3% 4% 3% -1% 1% 2,196
Home 3% -1% -2% -2% -1% -4% -2% -3% 912
Portfolio (ex Food) - -22% -13% 7% -8% -21% -8% -15% 112
RB Base (ex Food and MJN) 5% 4% 2% 1% 3% - -2% -1% 4,891
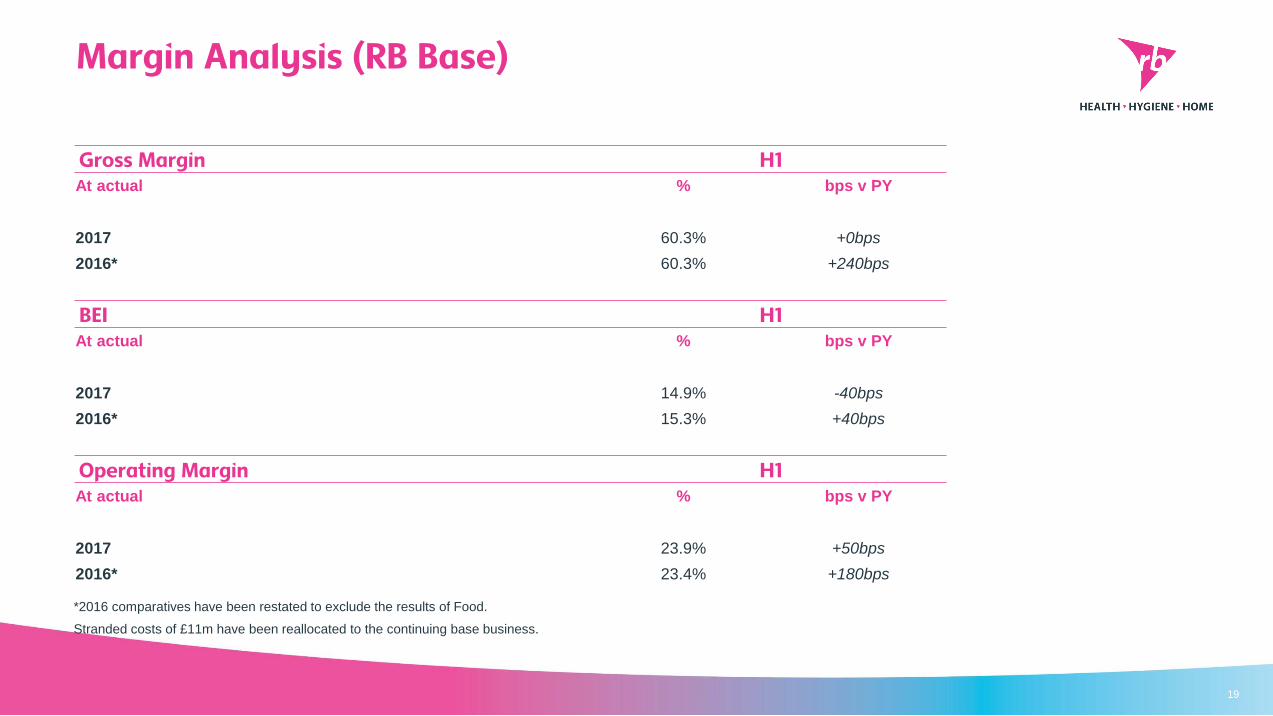
Margin Analysis (RB Base)
19
Gross Margin H1At actual % bps v PY
2017 60.3% +0bps
2016* 60.3% +240bps
BEI H1At actual % bps v PY
2017 14.9% -40bps
2016* 15.3% +40bps
Operating Margin H1At actual % bps v PY
2017 23.9% +50bps
2016* 23.4% +180bps
*2016 comparatives have been restated to exclude the results of Food.
Stranded costs of £11m have been reallocated to the continuing base business.
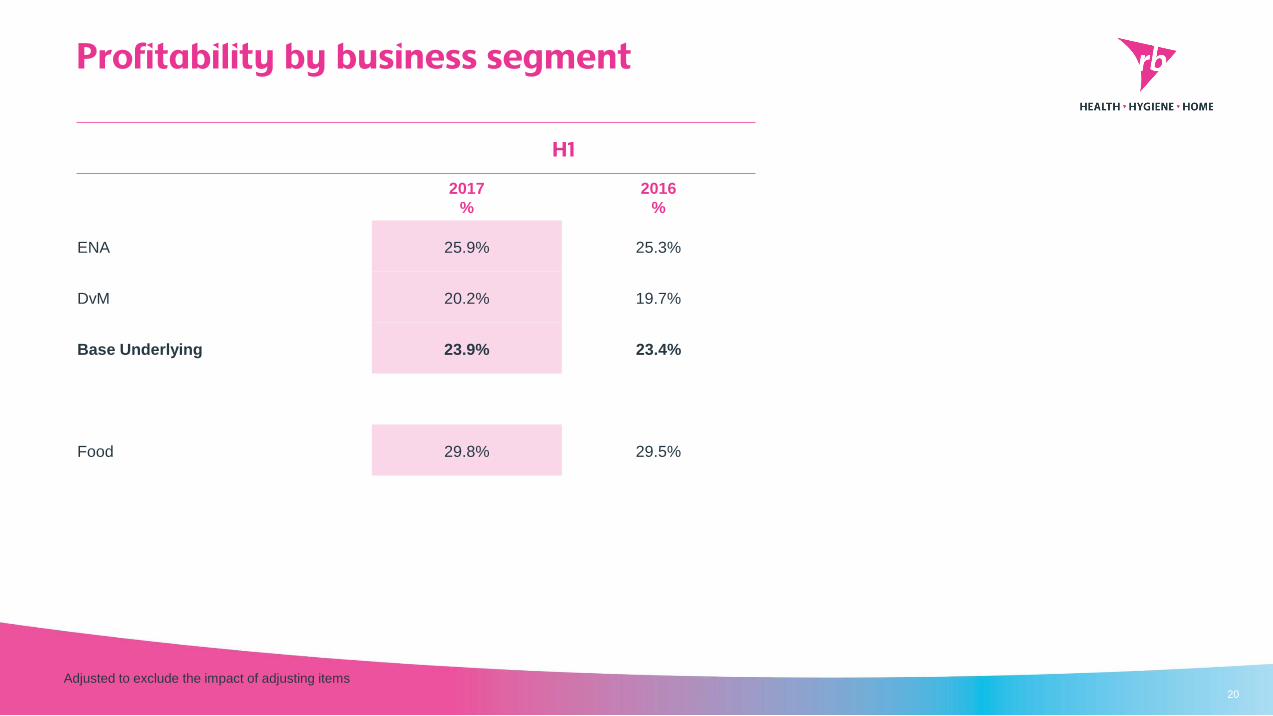
Profitability by business segment
Adjusted to exclude the impact of adjusting items20
H1
2017
%
2016
%
ENA 25.9% 25.3%
DvM 20.2% 19.7%
Base Underlying 23.9% 23.4%
Food 29.8% 29.5%
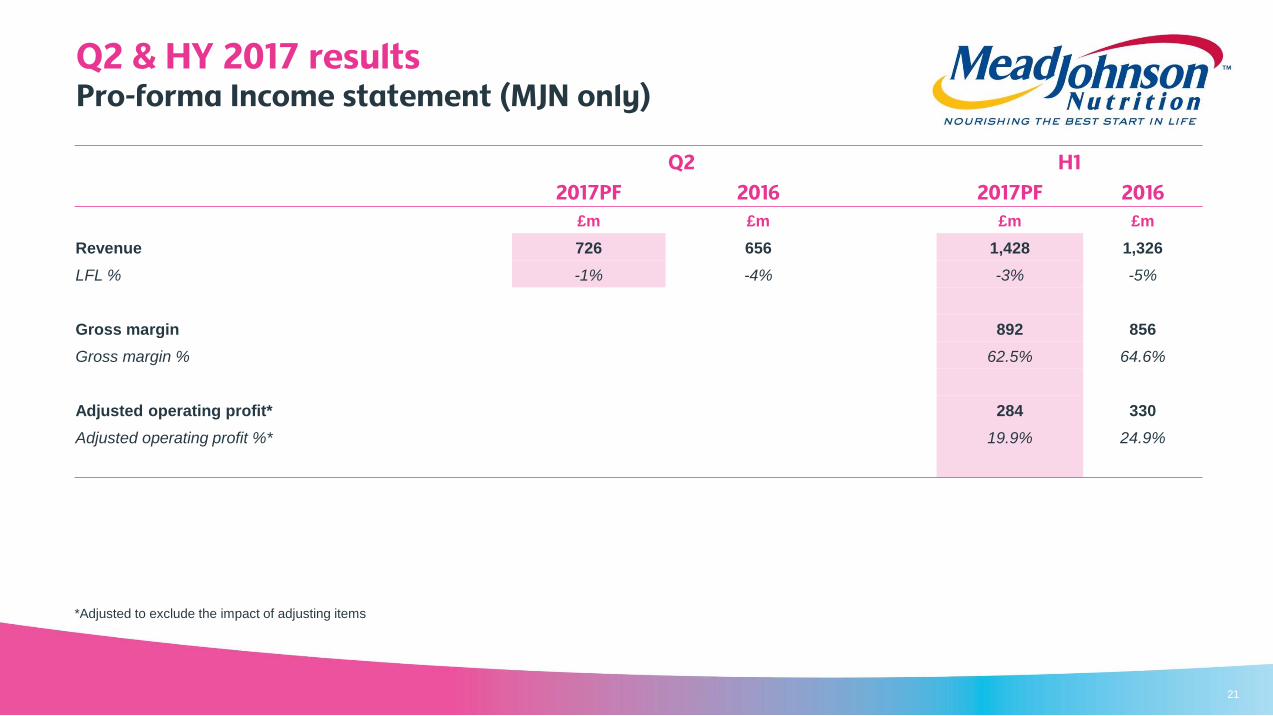
Q2 & HY 2017 resultsPro-forma Income statement (MJN only)
*Adjusted to exclude the impact of adjusting items
21
Q2 H1
2017PF 2016 2017PF 2016
£m £m £m £m
Revenue 726 656 1,428 1,326
LFL % -1% -4% -3% -5%
Gross margin 892 856
Gross margin % 62.5% 64.6%
Adjusted operating profit* 284 330
Adjusted operating profit %* 19.9% 24.9%
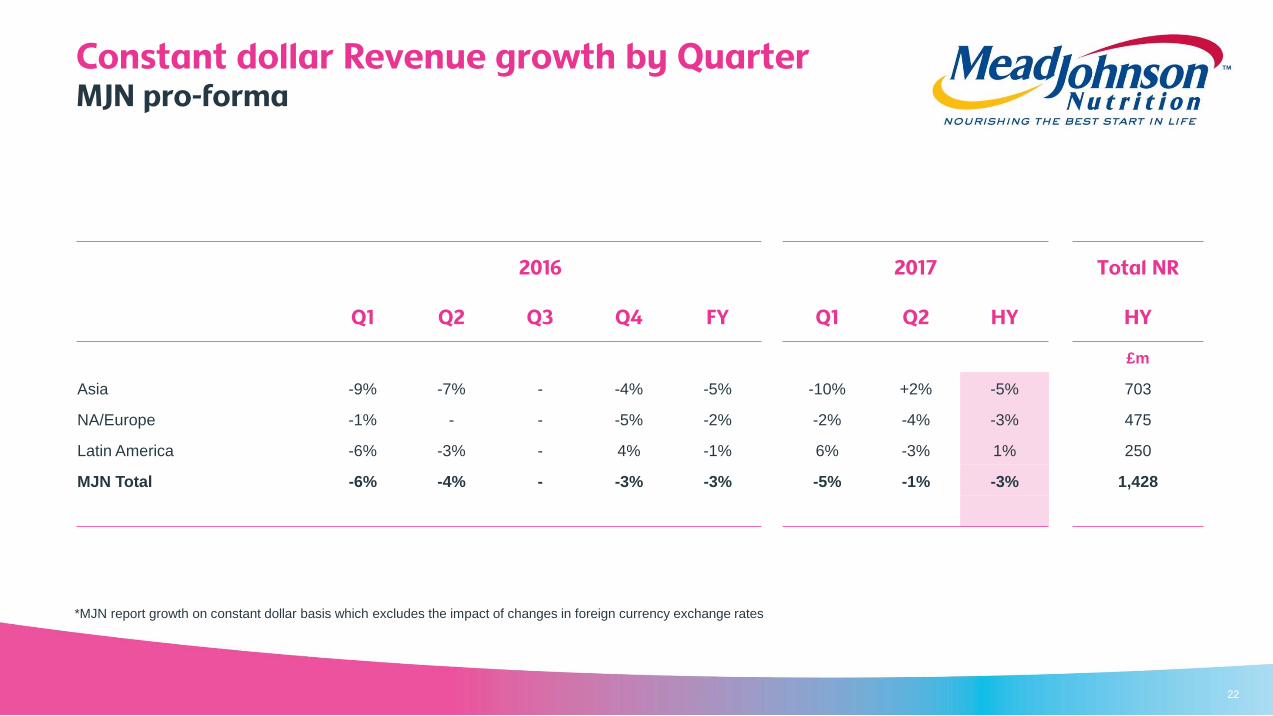
Constant dollar Revenue growth by QuarterMJN pro-forma
22
*MJN report growth on constant dollar basis which excludes the impact of changes in foreign currency exchange rates
2016 2017 Total NR
Q1 Q2 Q3 Q4 FY Q1 Q2 HY HY
£m
Asia -9% -7% - -4% -5% -10% +2% -5% 703
NA/Europe -1% - - -5% -2% -2% -4% -3% 475
Latin America -6% -3% - 4% -1% 6% -3% 1% 250
MJN Total -6% -4% - -3% -3% -5% -1% -3% 1,428

Margin Analysis (MJ ProForma)
23
Gross Margin H1At actual % bps v PY
2017 62.5% -210bps
2016 64.6% -10bps
Advertising & Promotion H1At actual % bps v PY
2017 18.4% +170bps
2016 16.7% +100bps
Non GAAP EBIT* H1At actual % bps v PY
2017 19.9% -500bps
2016 24.9% +50bps
*Non GAAP EBIT excludes specified items as reported by MJN under its previous accounting policies
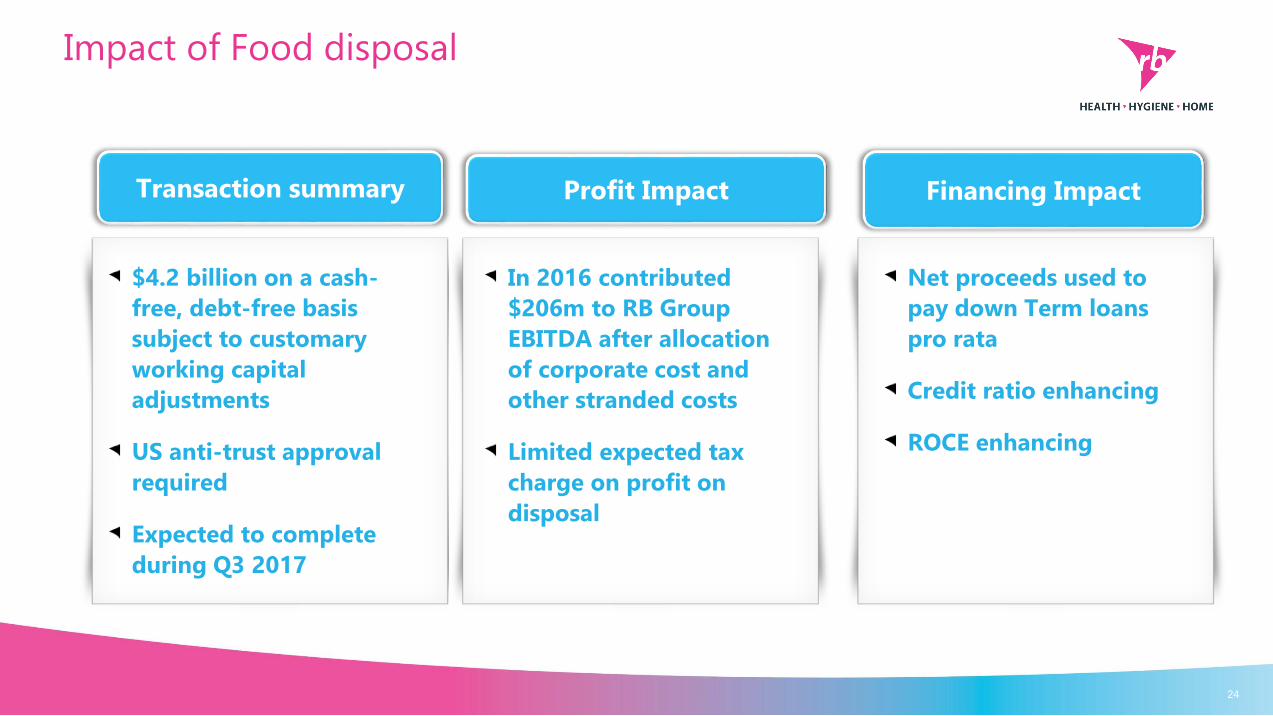
Impact of Food disposal
24
Transaction summary
$4.2 billion on a cash-
free, debt-free basis
subject to customary
working capital
adjustments
US anti-trust approval
required
Expected to complete
during Q3 2017
Profit Impact Financing Impact
In 2016 contributed
$206m to RB Group
EBITDA after allocation
of corporate cost and
other stranded costs
Limited expected tax
charge on profit on
disposal
Net proceeds used to
pay down Term loans
pro rata
Credit ratio enhancing
ROCE enhancing
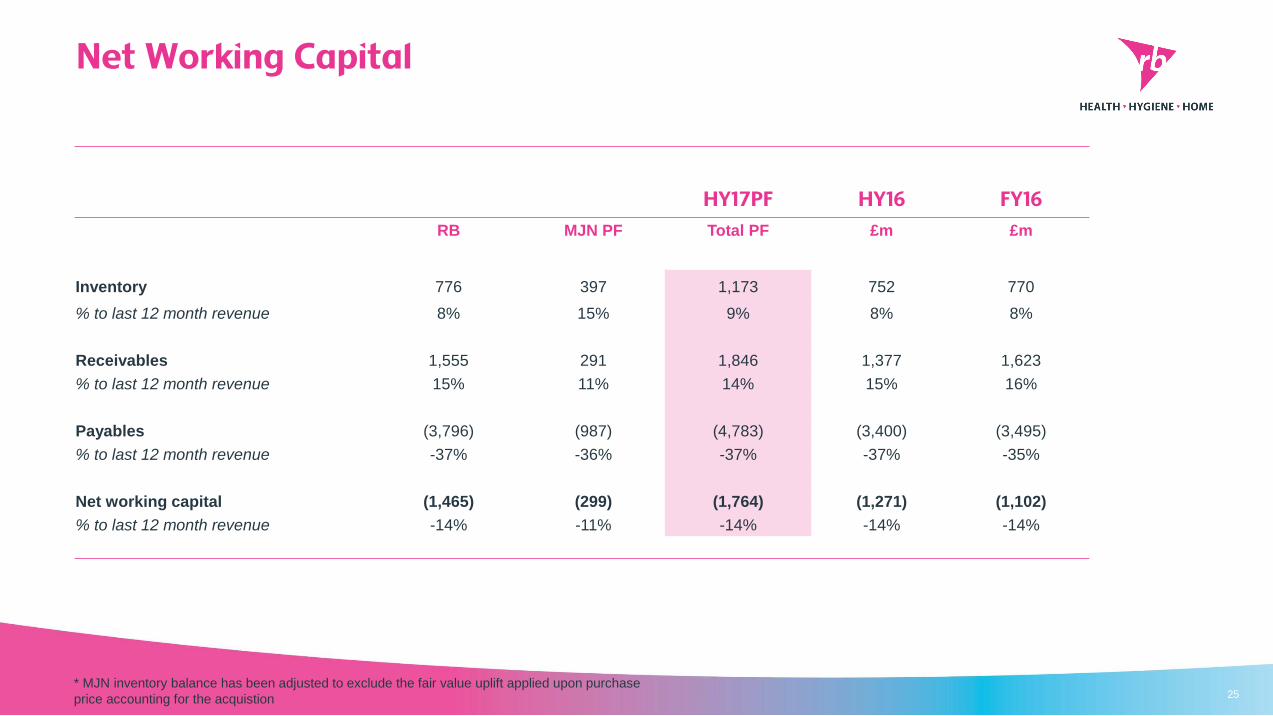
Net Working Capital
25
HY17PF HY16 FY16
RB MJN PF Total PF £m £m
Inventory 776 397 1,173 752 770
% to last 12 month revenue 8% 15% 9% 8% 8%
Receivables 1,555 291 1,846 1,377 1,623
% to last 12 month revenue 15% 11% 14% 15% 16%
Payables (3,796) (987) (4,783) (3,400) (3,495)
% to last 12 month revenue -37% -36% -37% -37% -35%
Net working capital (1,465) (299) (1,764) (1,271) (1,102)
% to last 12 month revenue -14% -11% -14% -14% -14%
* MJN inventory balance has been adjusted to exclude the fair value uplift applied upon purchase
price accounting for the acquistion
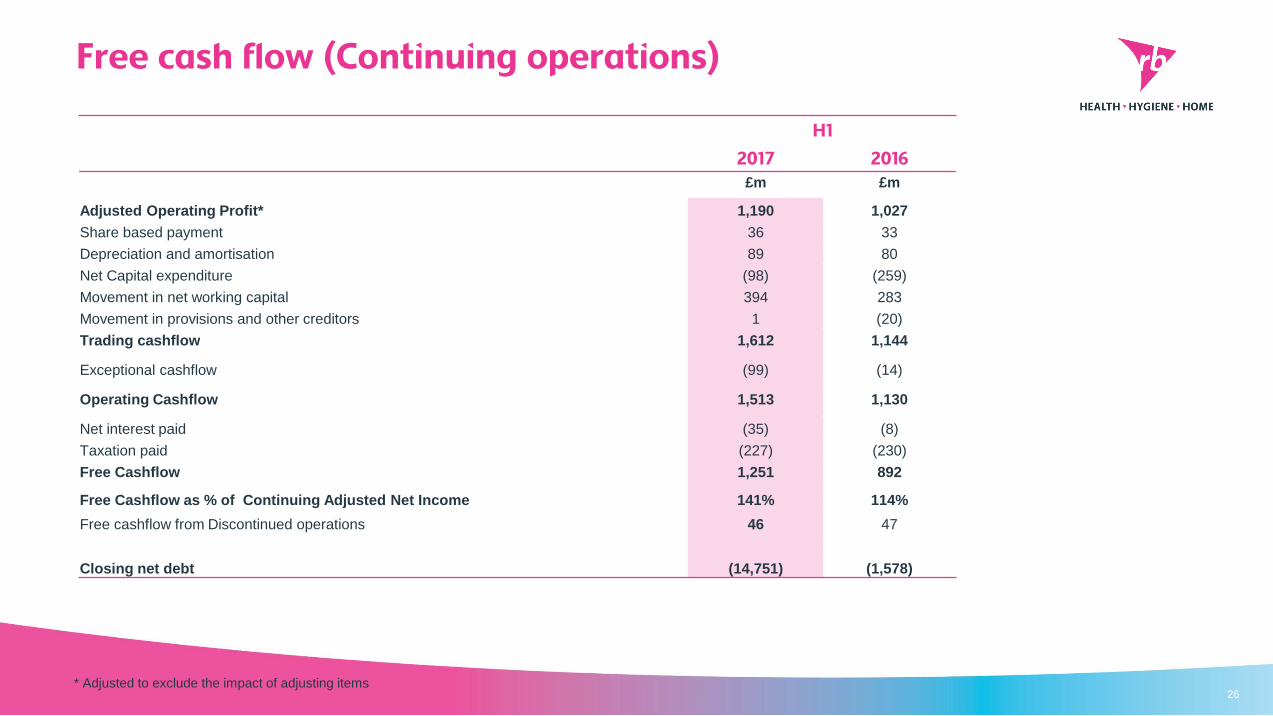
Free cash flow (Continuing operations)
26
H1
2017 2016£m £m
Adjusted Operating Profit* 1,190 1,027
Share based payment 36 33
Depreciation and amortisation 89 80
Net Capital expenditure (98) (259)
Movement in net working capital 394 283
Movement in provisions and other creditors 1 (20)
Trading cashflow 1,612 1,144
Exceptional cashflow (99) (14)
Operating Cashflow 1,513 1,130
Net interest paid (35) (8)
Taxation paid (227) (230)
Free Cashflow 1,251 892
Free Cashflow as % of Continuing Adjusted Net Income 141% 114%
Free cashflow from Discontinued operations 46 47
Closing net debt (14,751) (1,578)
* Adjusted to exclude the impact of adjusting items
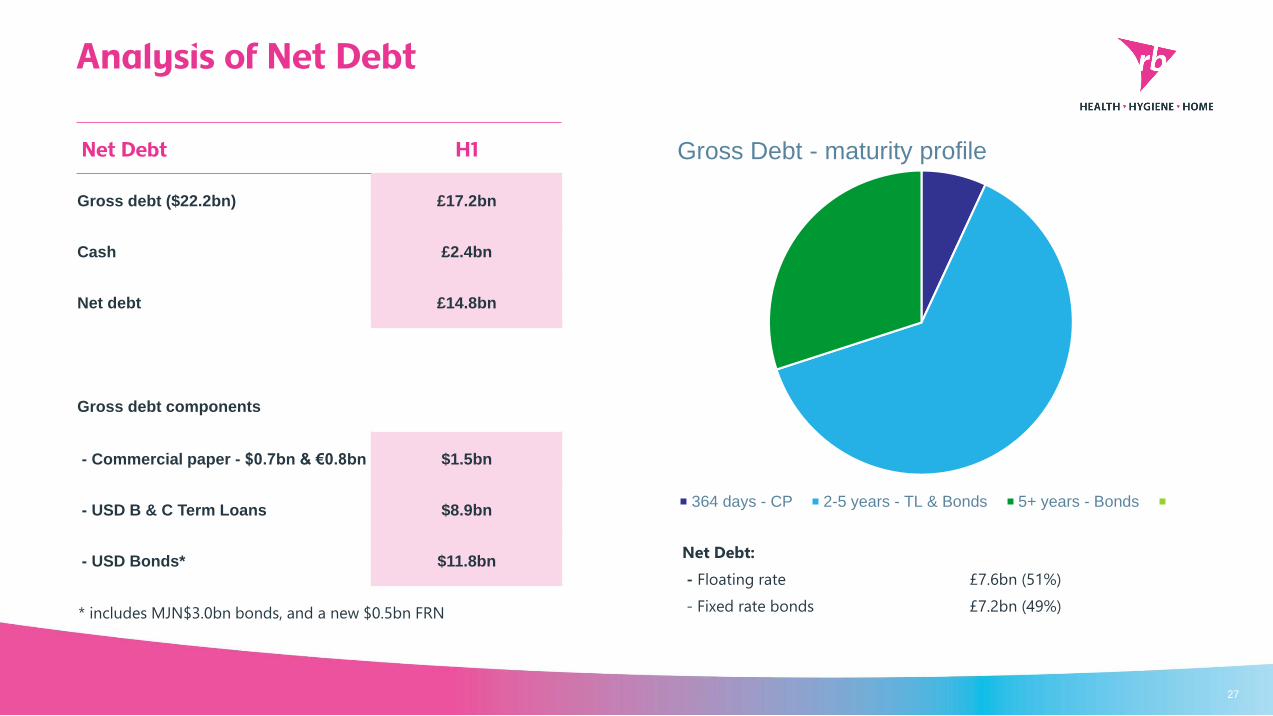
27
* includes Mead Johnson $3bn bonds, and a new $0.5bn
Gross Debt - maturity profile
364 days - CP 2-5 years - TL & Bonds 5+ years - Bonds
Net Debt:
- Floating rate £7.6bn (51%)
- Fixed rate bonds £7.2bn (49%)
Analysis of Net Debt
Net Debt H1
Gross debt ($22.2bn) £17.2bn
Cash £2.4bn
Net debt £14.8bn
Gross debt components
- Commercial paper - $0.7bn & €0.8bn $1.5bn
- USD B & C Term Loans $8.9bn
- USD Bonds* $11.8bn
* includes MJN$3.0bn bonds, and a new $0.5bn FRN
Other Matters
28
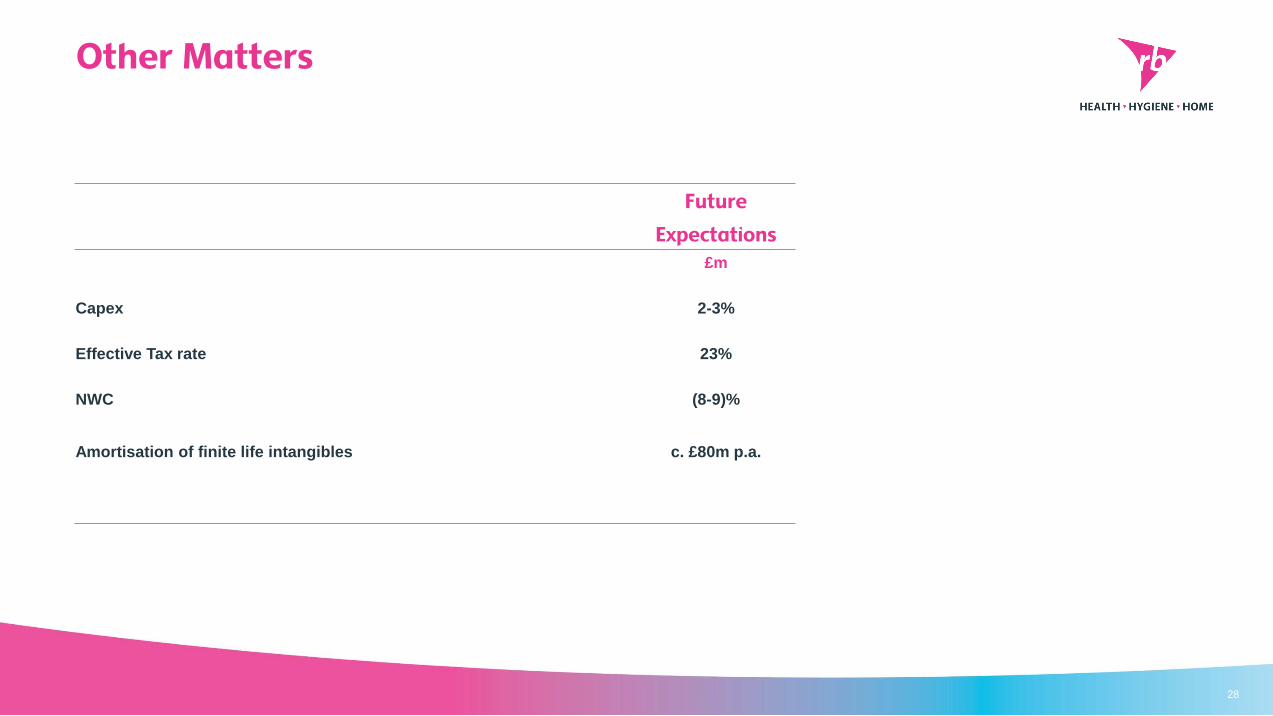
Future
Expectations
£m
Capex 2-3%
Effective Tax rate 23%
NWC (8-9)%
Amortisation of finite life intangibles c. £80m p.a.

Rakesh KapoorChief executive officer
29

New initiatives for H2 2017
30

31

32
Scholl® Value-priced Express Pedi
Scholl® Value-priced Express PediValue-for-money. Soft feet effortlessly. More convenient than a manual foot file,
offering a visible difference

Durex® Naturals Intimate Gel Water based lubricant – contains 100% natural ingredients, with pre-biotics that support natural
flora and pH balance
Durex® Naturals Intimate Gel
33
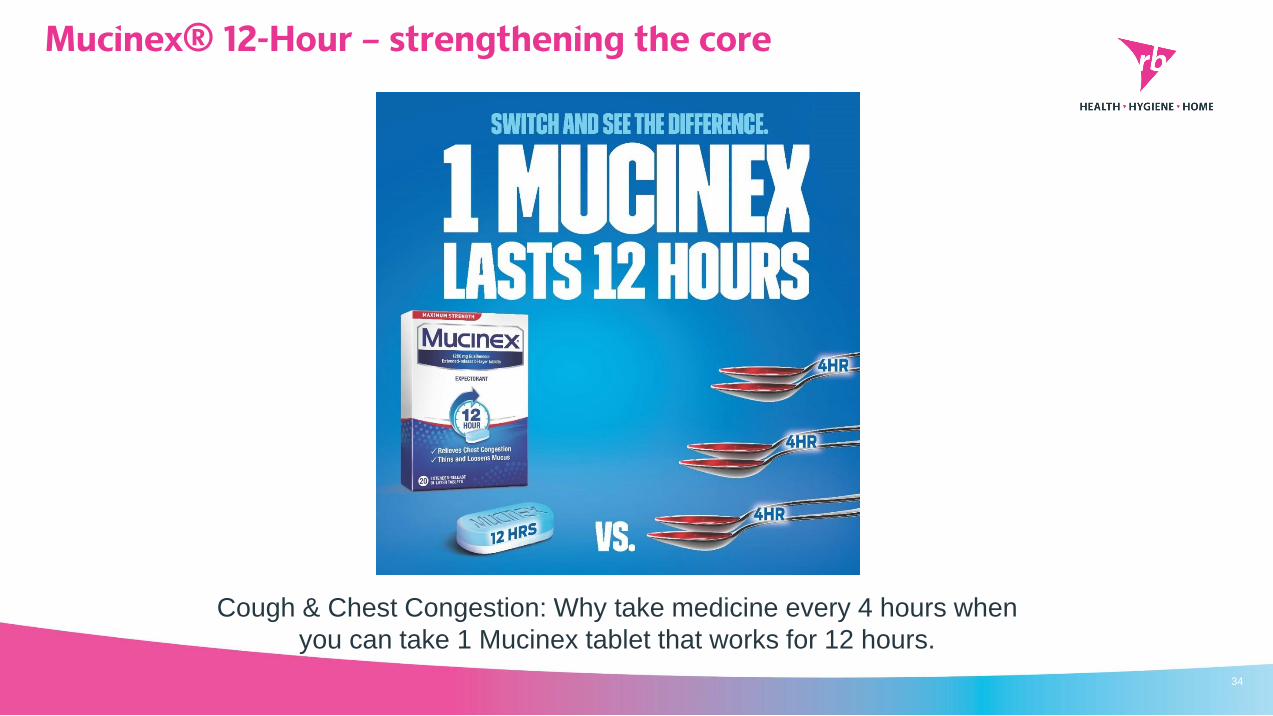
Mucinex® 12-Hour – strengthening the core
34
Cough & Chest Congestion: Why take medicine every 4 hours when
you can take 1 Mucinex tablet that works for 12 hours.
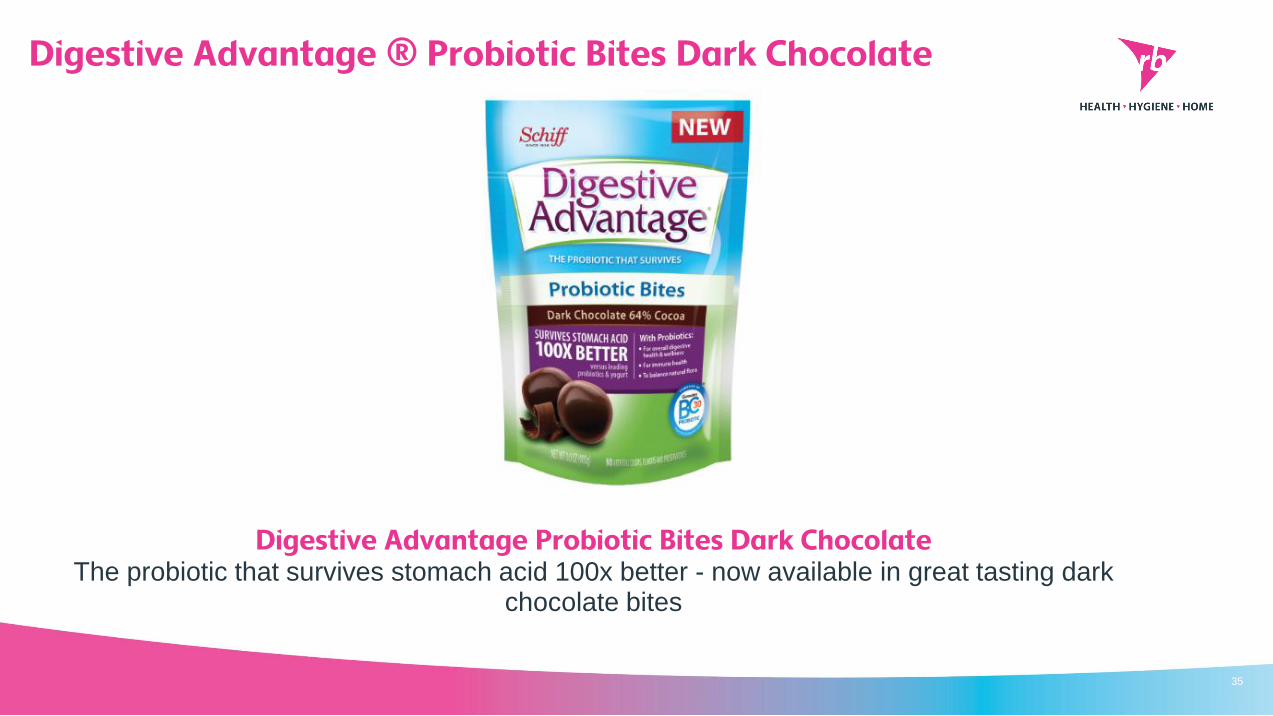
Digestive Advantage ® Probiotic Bites Dark Chocolate
Digestive Advantage Probiotic Bites Dark ChocolateThe probiotic that survives stomach acid 100x better - now available in great tasting dark
chocolate bites
35

Air pollution reaching a global tipping point
36
China
Gulf
California
India
#4 largest cause of death globally killing 10 people every minute
Mexico
London
Air Quality (PM2.5) is Invisible
AQI 103Outdoor e.g. tube entrance
AQI 270On tube platform

SiTi® – endorsed by Dettol® - protecting urban consumers against air pollution.
RB Internal37

SiTi – endorsed by Dettol - Connected at the heart
Personalized data drives personalised solutions
+
38
In-nose filtersMask + Micro VentMonitor

39
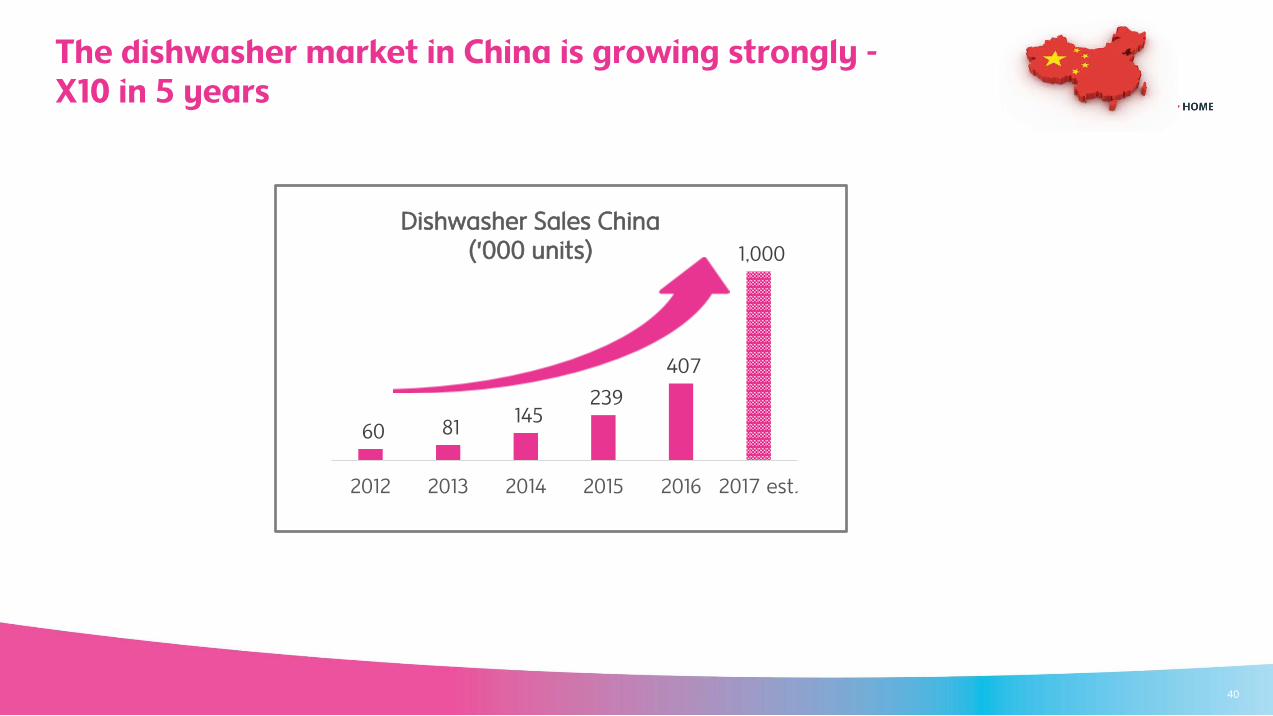
The dishwasher market in China is growing strongly -X10 in 5 years
60 81 145
239
407
1,000
2012 2013 2014 2015 2016 2017 est.
Dishwasher Sales China ('000 units)
40
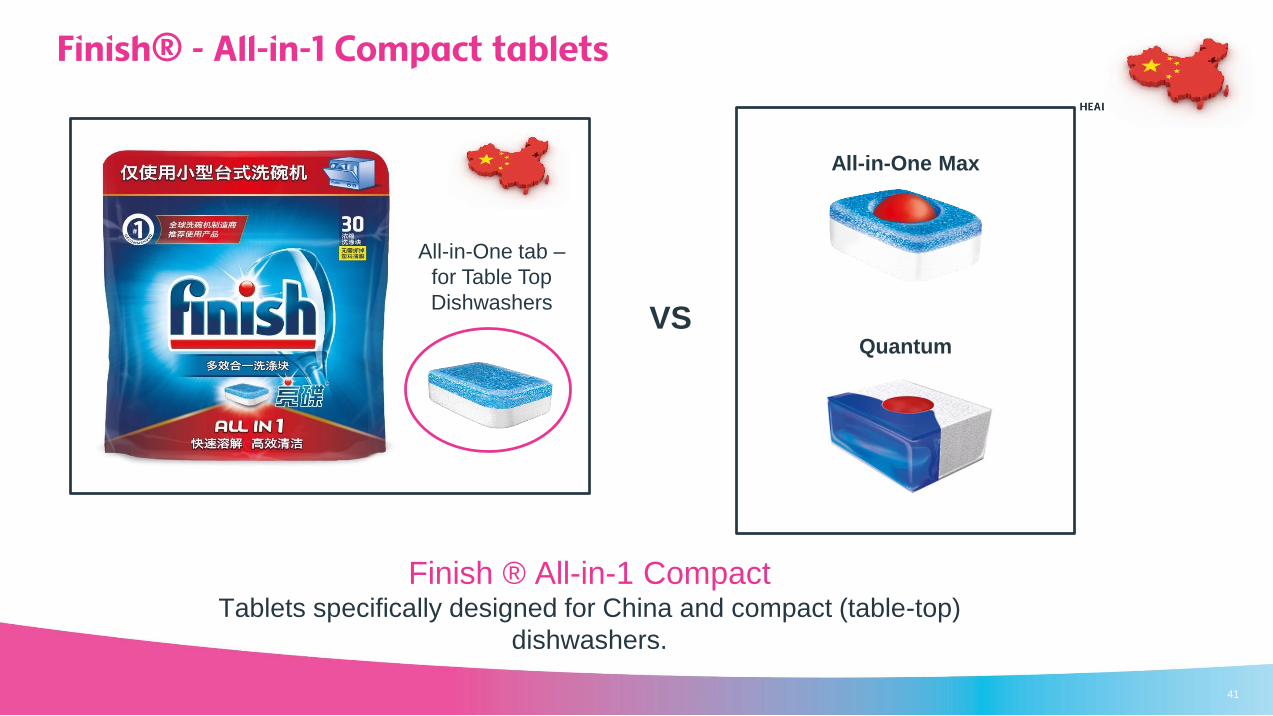
Finish ® All-in-1 Compact Tablets specifically designed for China and compact (table-top)
dishwashers.
Finish® - All-in-1 Compact tablets
All-in-One tab –
for Table Top
Dishwashers
All-in-One Max
QuantumVS
41

Lysol® New Disinfecting Wipes
Lysol® New Disinfecting WipesNew wipes made with a new material to help pick up bacteria and dirt. Kill 99.9% of germs.
Also available in a new range of fragrances
42
NEW wipe with new material NEW wipe fragrances
New wipe material
to help pick up dirt
& bacteria

43
Veja Gold – unbeatable results even on the toughest stains!BEST ever Veja formula with increased actives to provide 2x more cleaning
power, throughout the house
Veja® Gold – Re-launch across the range

44

Vanish® – “Whites instantly Whiter after one Wash”
45
Vanish® – “Whites Instantly Whiter after one Wash”There's nothing nicer than crisp whites when it comes to shirts, linen and towels

VIPoo by AirWick®
VIPoo by Air Wick® Keep Nasty Smells in Your bowl!
4
6
RB Internal
2017 Targets
47
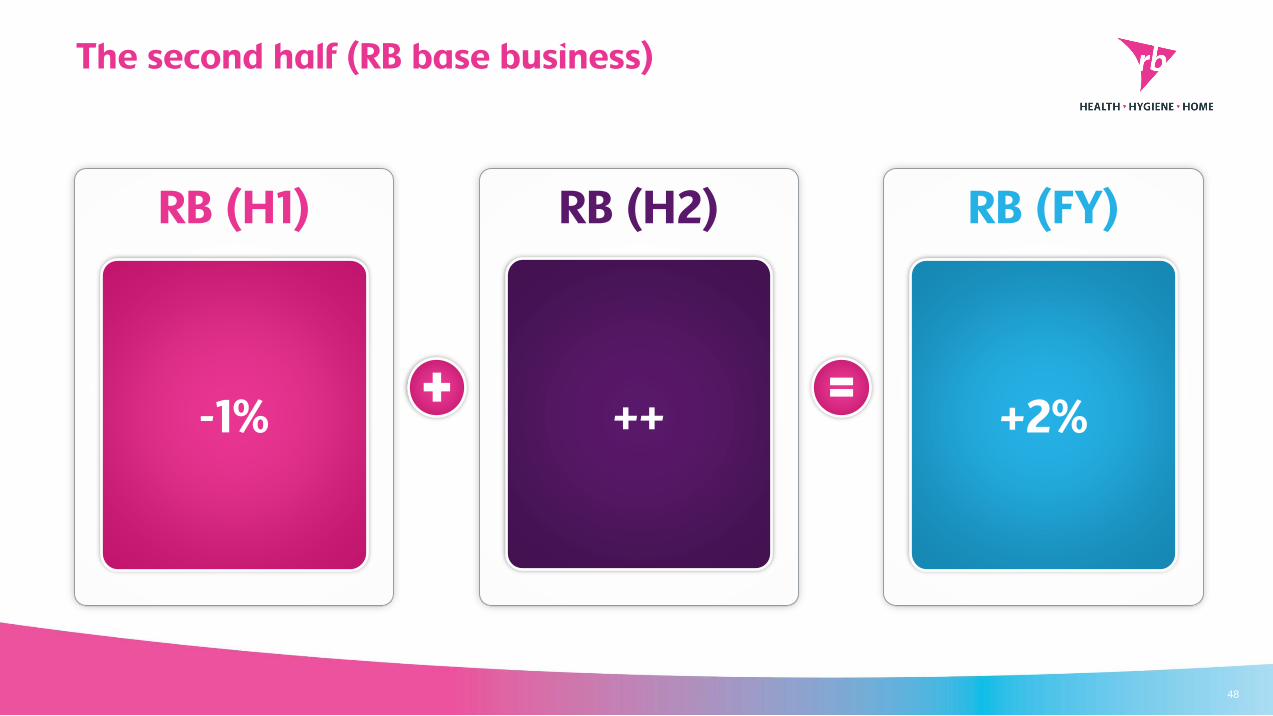
The second half (RB base business)
48
RB (H1)
-1%
RB (H2)
++
RB (FY)
+2%
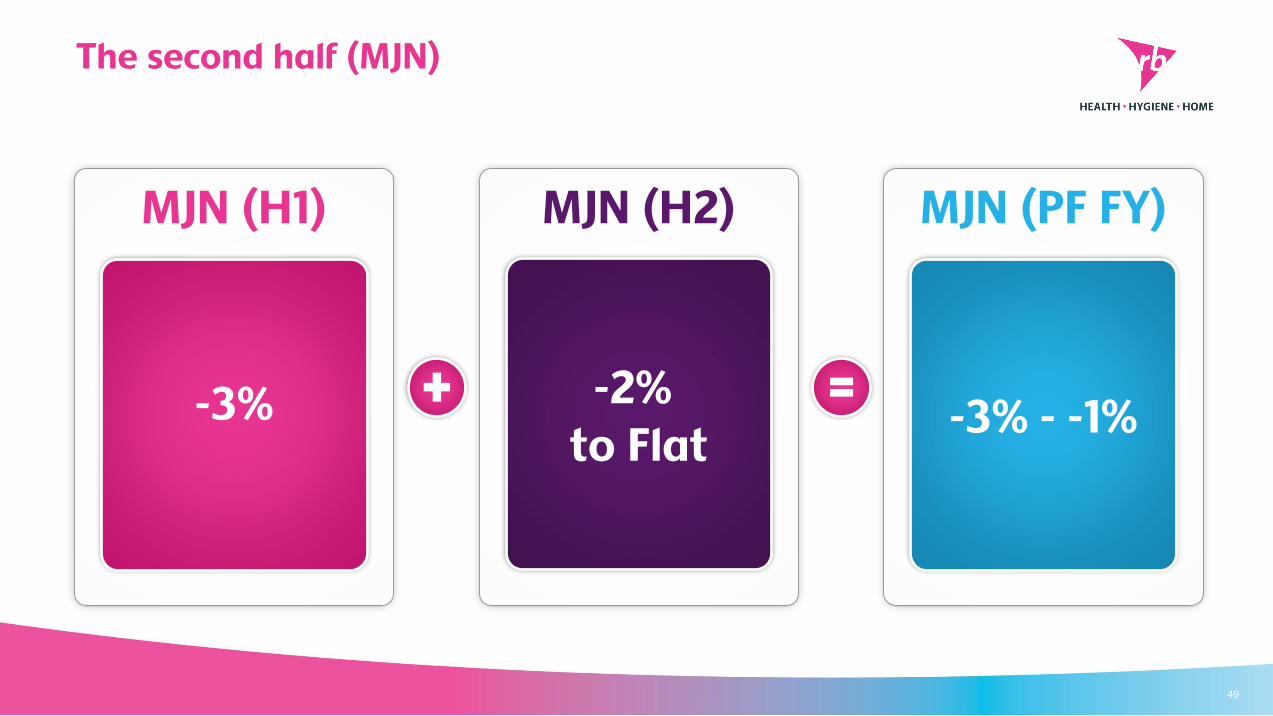
The second half (MJN)
49
MJN (H1)
-3%
MJN (H2)
-2% to Flat
MJN (PF FY)
-3% - -1%
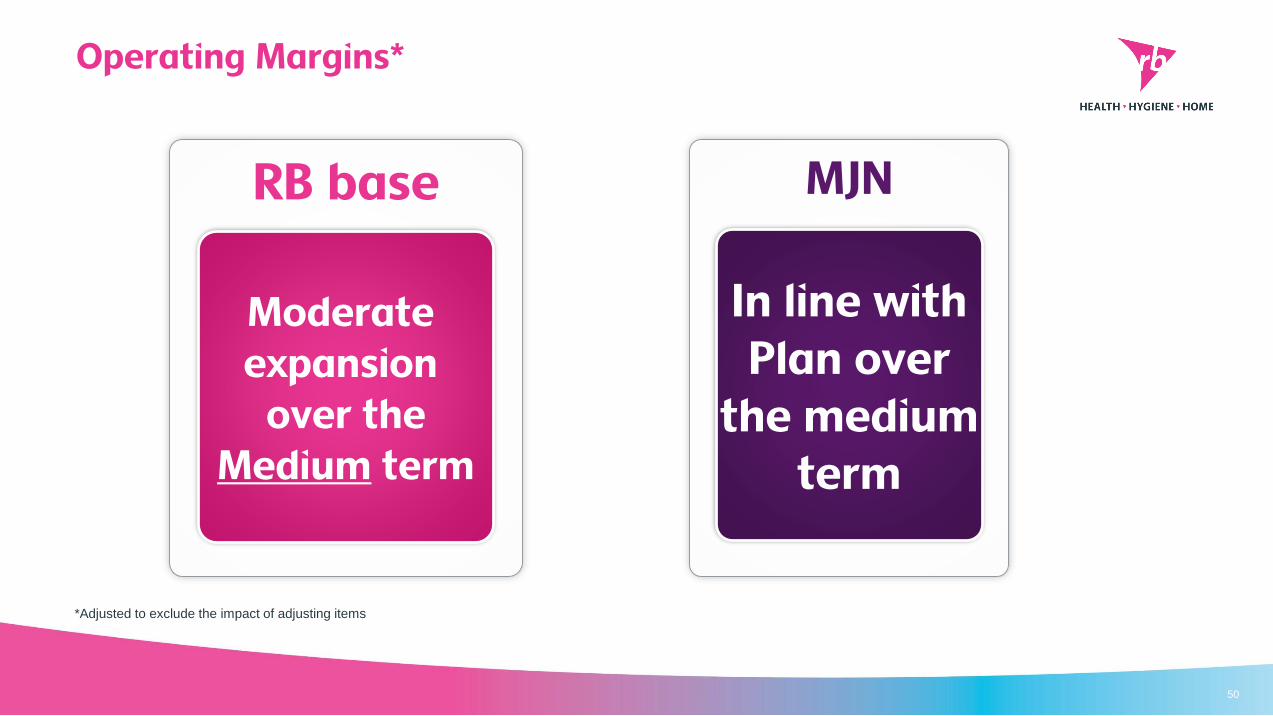
Operating Margins*
50
RB base
Moderate expansion
over theMedium term
*Adjusted to exclude the impact of adjusting items
MJN
In line withPlan over
the mediumterm
Q&A
51
Appendices
52
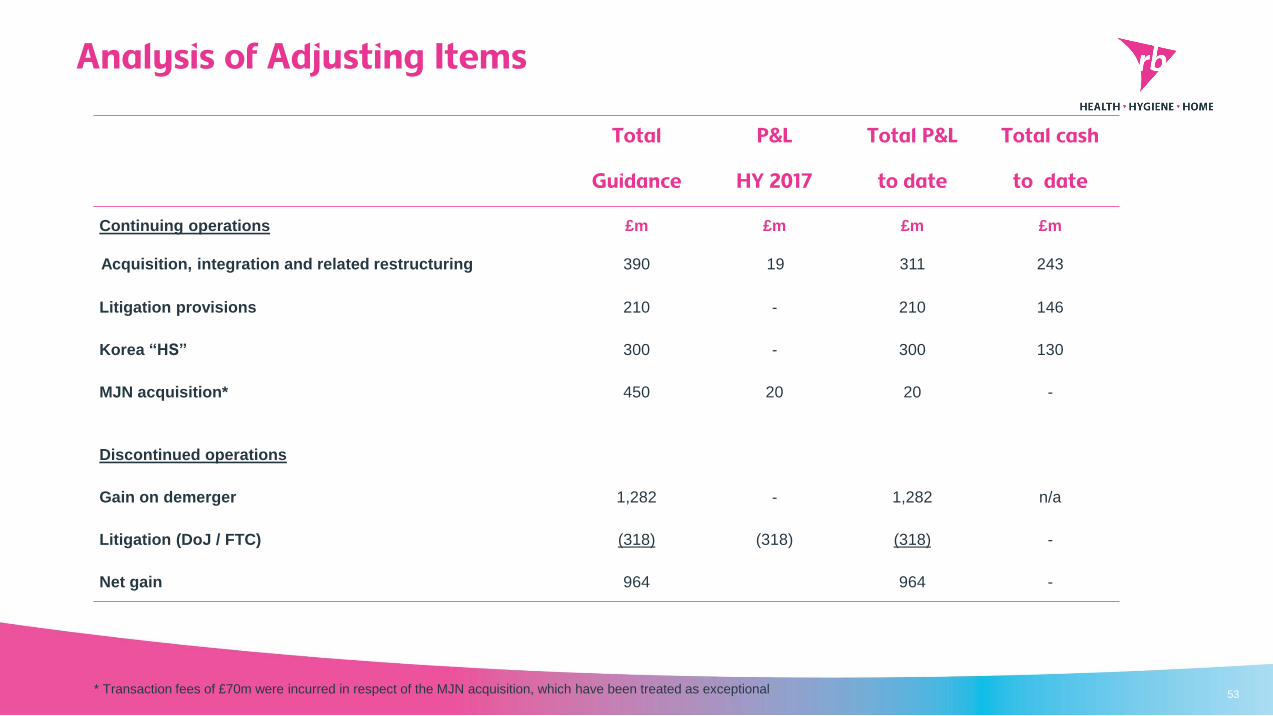
Analysis of Adjusting Items
53
Total P&L Total P&L Total cash
Guidance HY 2017 to date to date
Continuing operations £m £m £m £m
Acquisition, integration and related restructuring 390 19 311 243
Litigation provisions 210 - 210 146
Korea “HS” 300 - 300 130
MJN acquisition* 450 20 20 -
Discontinued operations
Gain on demerger 1,282 - 1,282 n/a
Litigation (DoJ / FTC) (318) (318) (318) -
Net gain 964 964 -
* Transaction fees of £70m were incurred in respect of the MJN acquisition, which have been treated as exceptional
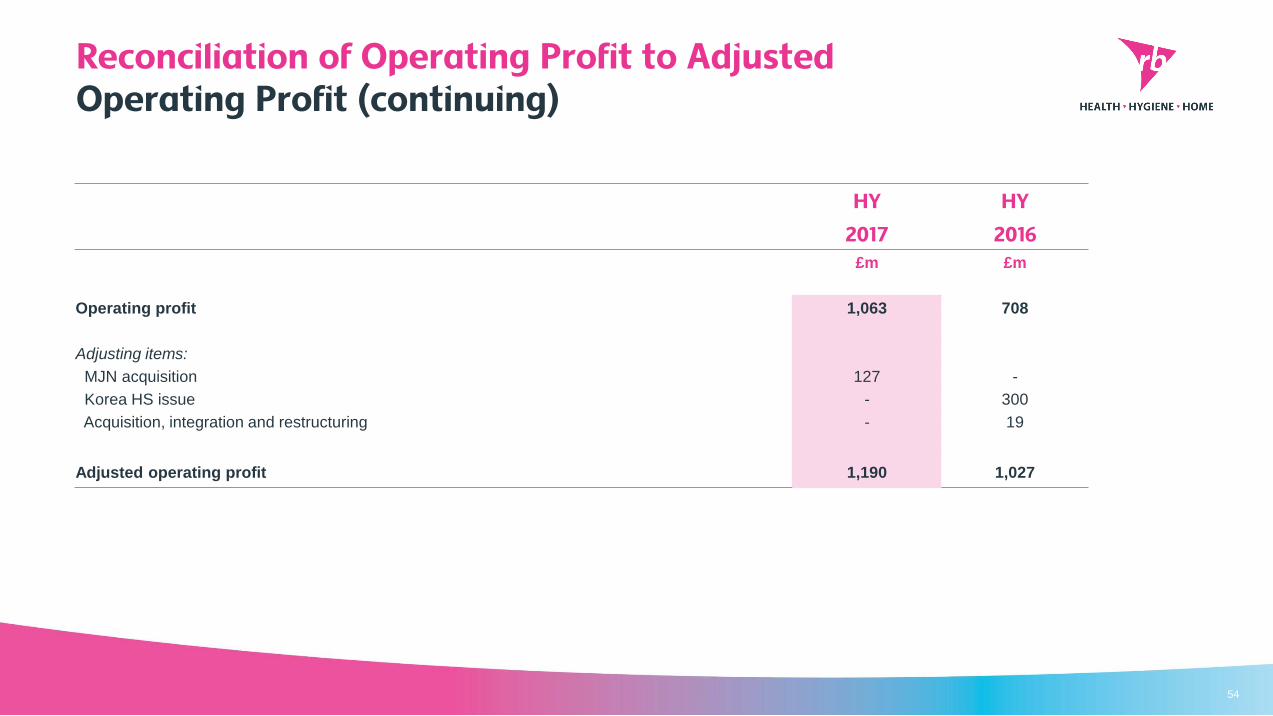
Reconciliation of Operating Profit to AdjustedOperating Profit (continuing)
54
HY HY
2017 2016
£m £m
Operating profit 1,063 708
Adjusting items:
MJN acquisition 127 -
Korea HS issue - 300
Acquisition, integration and restructuring - 19
Adjusted operating profit 1,190 1,027
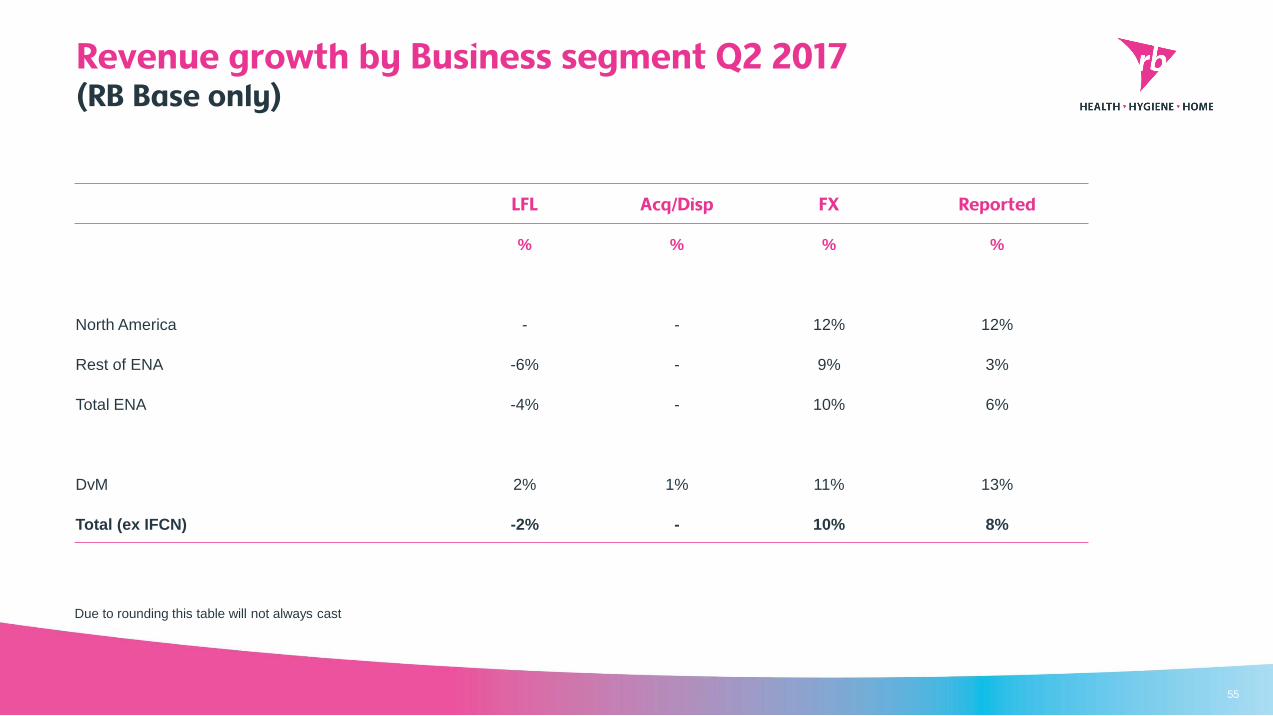
Revenue growth by Business segment Q2 2017(RB Base only)
55
Due to rounding this table will not always cast
LFL Acq/Disp FX Reported
% % % %
North America - - 12% 12%
Rest of ENA -6% - 9% 3%
Total ENA -4% - 10% 6%
DvM 2% 1% 11% 13%
Total (ex IFCN) -2% - 10% 8%
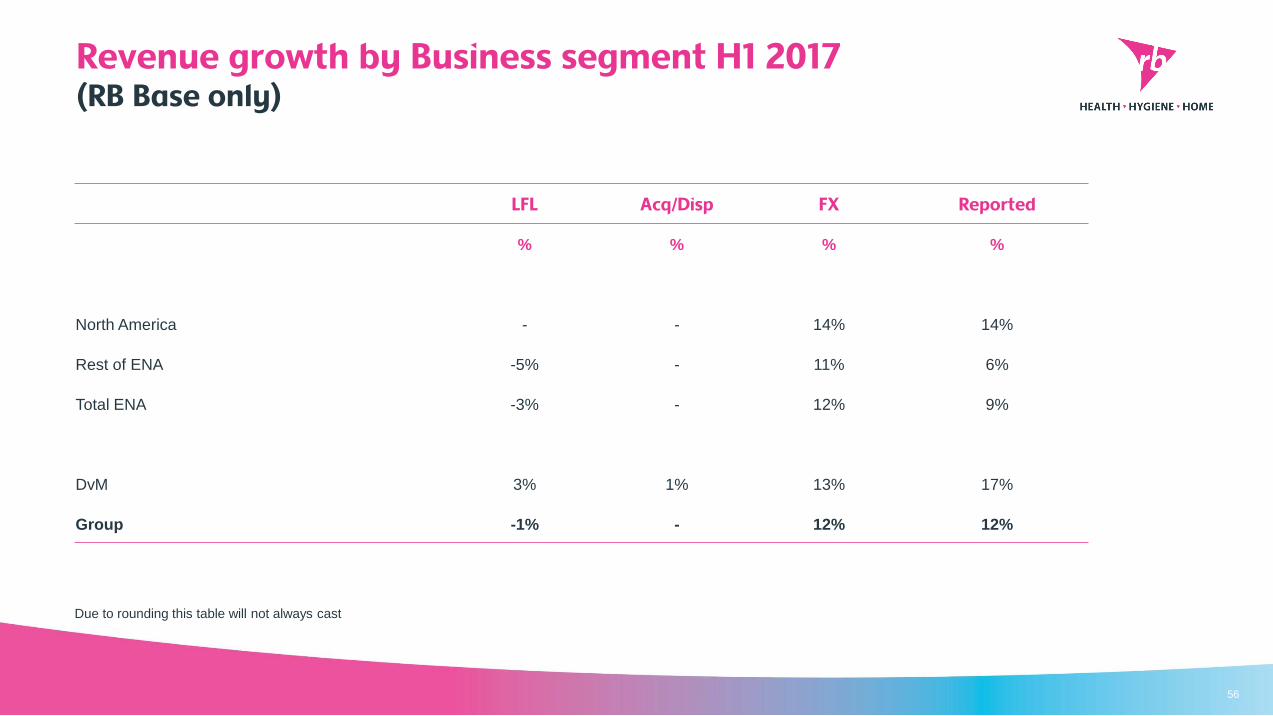
Revenue growth by Business segment H1 2017(RB Base only)
56
Due to rounding this table will not always cast
LFL Acq/Disp FX Reported
% % % %
North America - - 14% 14%
Rest of ENA -5% - 11% 6%
Total ENA -3% - 12% 9%
DvM 3% 1% 13% 17%
Group -1% - 12% 12%
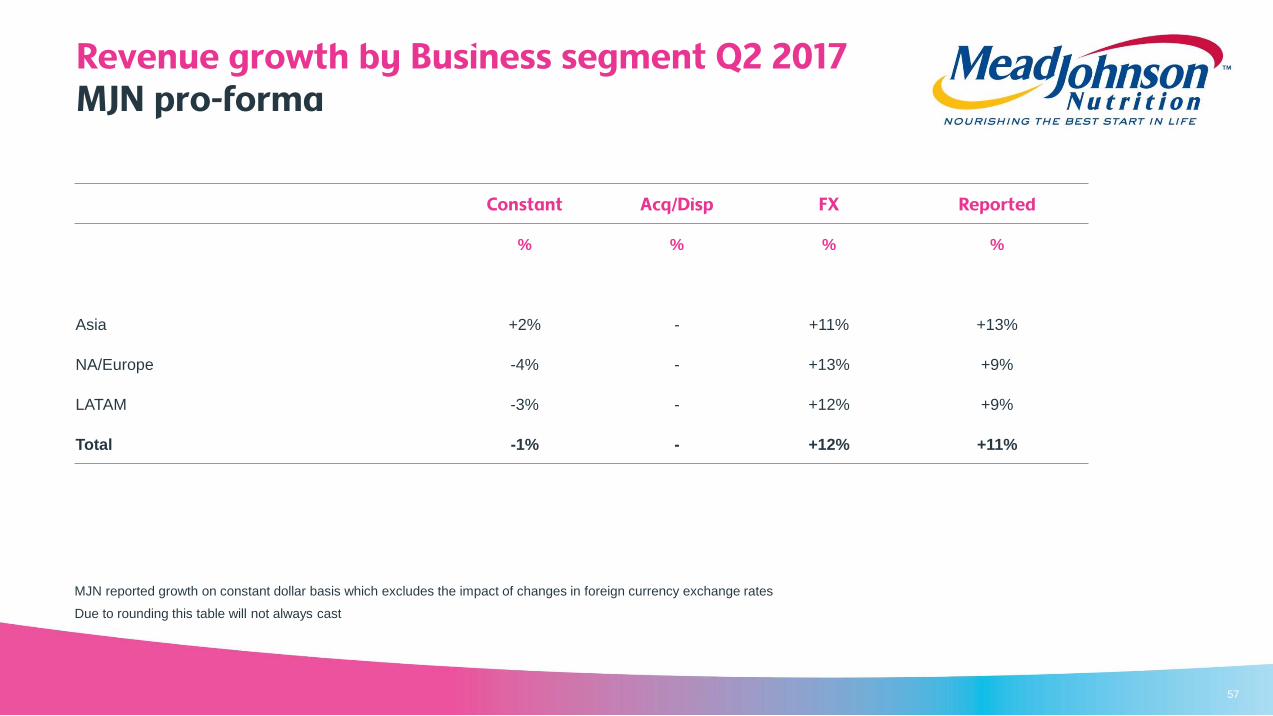
Revenue growth by Business segment Q2 2017MJN pro-forma
57
Constant Acq/Disp FX Reported
% % % %
Asia +2% - +11% +13%
NA/Europe -4% - +13% +9%
LATAM -3% - +12% +9%
Total -1% - +12% +11%
Due to rounding this table will not always cast
MJN reported growth on constant dollar basis which excludes the impact of changes in foreign currency exchange rates
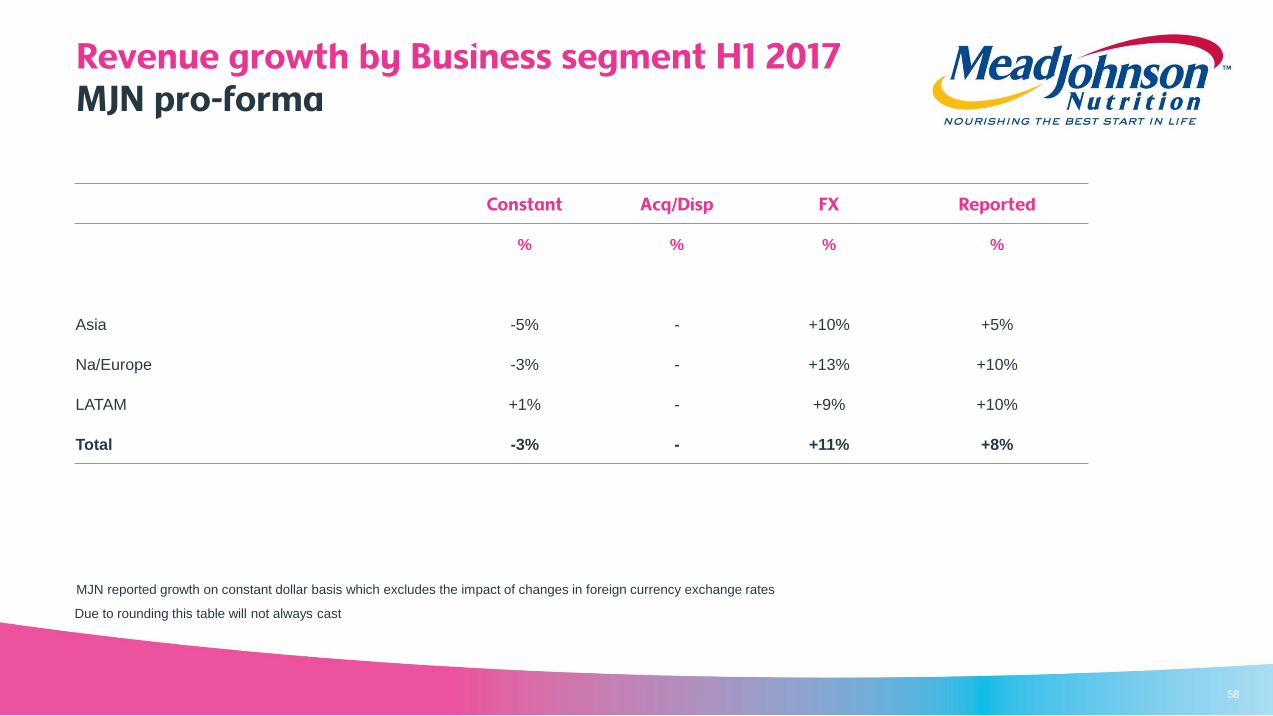
Revenue growth by Business segment H1 2017MJN pro-forma
58
Due to rounding this table will not always cast
Constant Acq/Disp FX Reported
% % % %
Asia -5% - +10% +5%
Na/Europe -3% - +13% +10%
LATAM +1% - +9% +10%
Total -3% - +11% +8%
MJN reported growth on constant dollar basis which excludes the impact of changes in foreign currency exchange rates
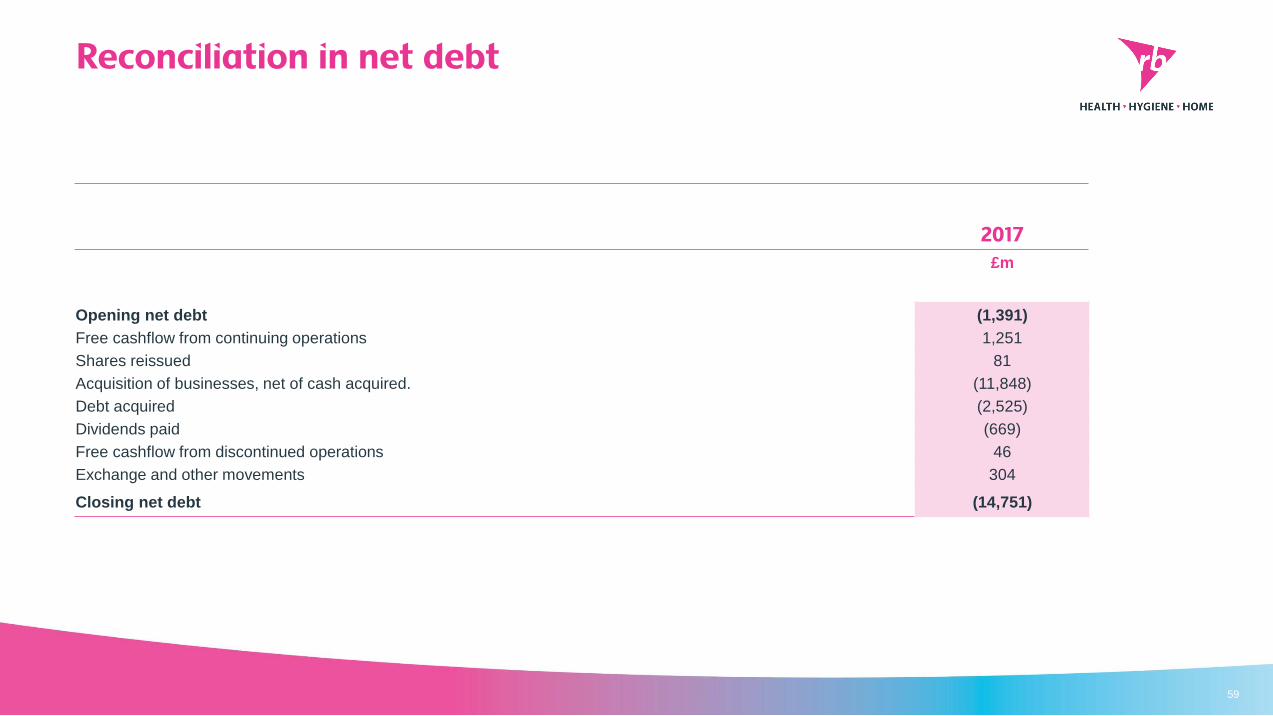
Reconciliation in net debt
59
2017
£m
Opening net debt (1,391)
Free cashflow from continuing operations 1,251
Shares reissued 81
Acquisition of businesses, net of cash acquired. (11,848)
Debt acquired (2,525)
Dividends paid (669)
Free cashflow from discontinued operations 46
Exchange and other movements 304
Closing net debt (14,751)
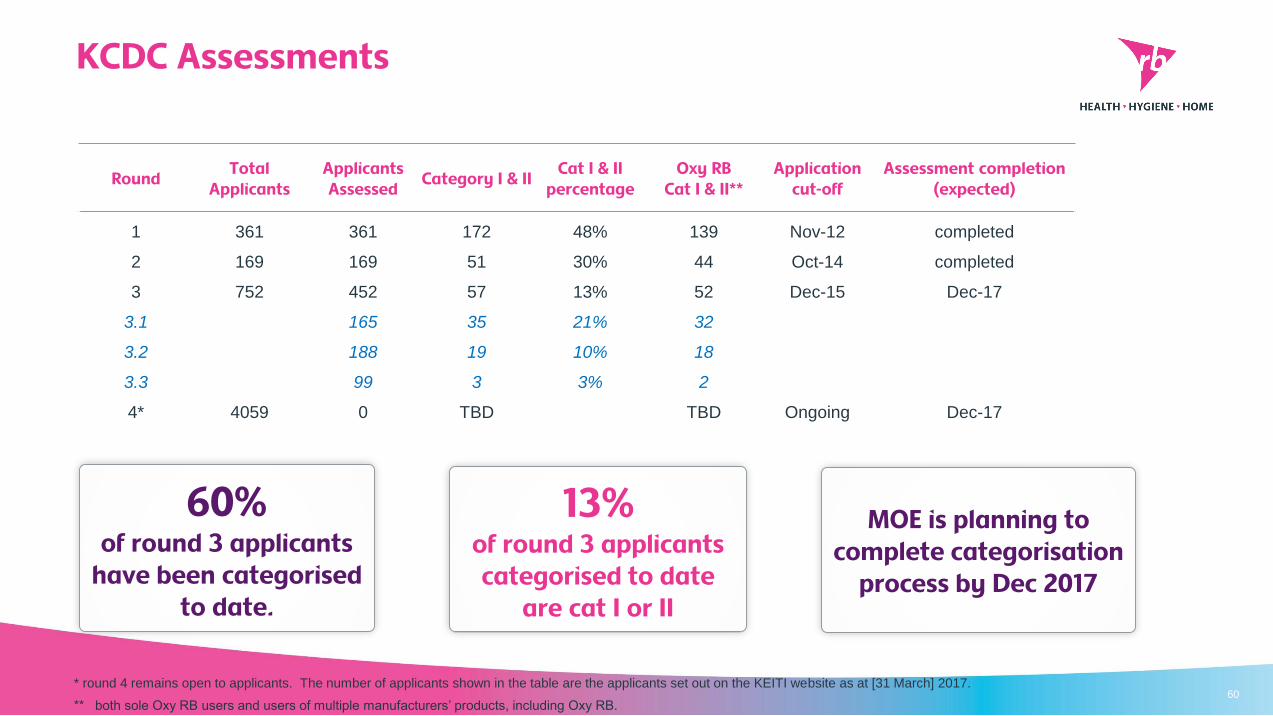
KCDC Assessments
RoundTotal
ApplicantsApplicants Assessed
Category I & IICat I & II
percentageOxy RB
Cat I & II**Application
cut-off Assessment completion
(expected)
1 361 361 172 48% 139 Nov-12 completed
2 169 169 51 30% 44 Oct-14 completed
3 752 452 57 13% 52 Dec-15 Dec-17
3.1 165 35 21% 32
3.2 188 19 10% 18
3.3 99 3 3% 2
4* 4059 0 TBD TBD Ongoing Dec-17
60% of round 3 applicants
have been categorised to date.
13%of round 3 applicants categorised to date
are cat I or II
MOE is planning to complete categorisation
process by Dec 2017
60* round 4 remains open to applicants. The number of applicants shown in the table are the applicants set out on the KEITI website as at [31 March] 2017.
** both sole Oxy RB users and users of multiple manufacturers’ products, including Oxy RB.
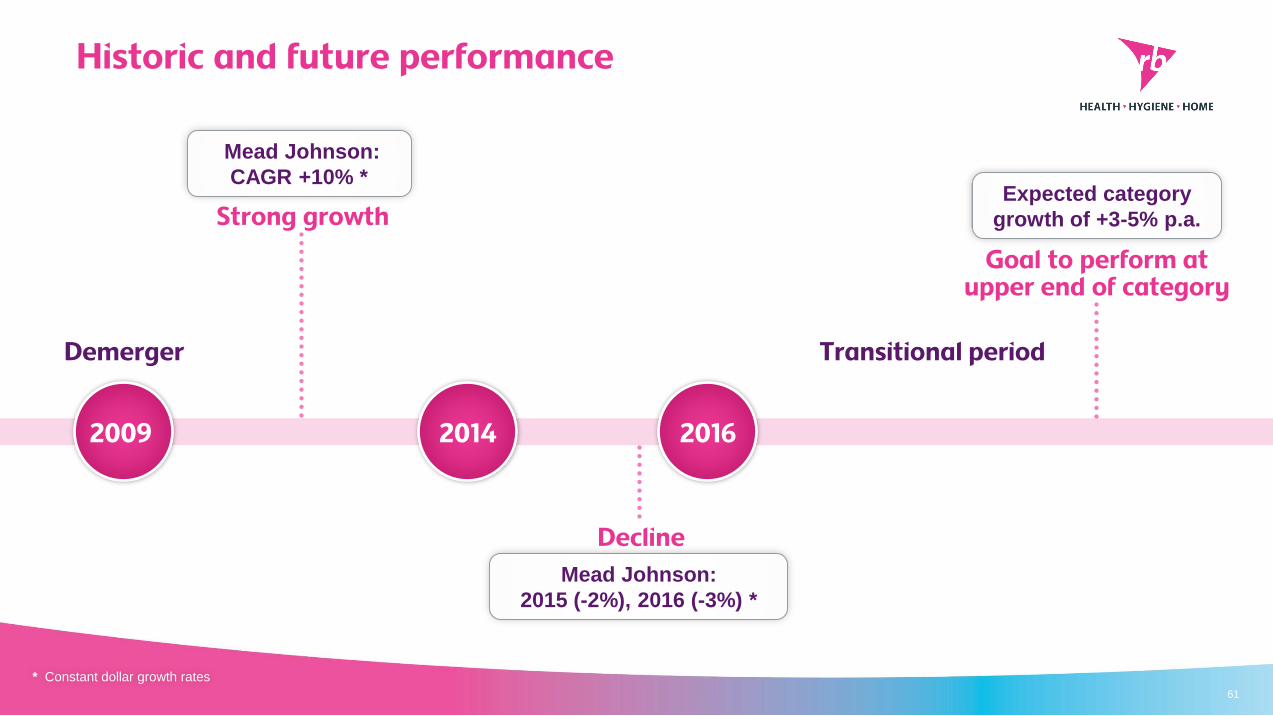
Historic and future performance
61
2009 2016
Mead Johnson:
CAGR +10% *
Mead Johnson:
2015 (-2%), 2016 (-3%) *
Expected category
growth of +3-5% p.a.Strong growth
Decline
Demerger
Goal to perform at upper end of category
Transitional period
2014
* Constant dollar growth rates
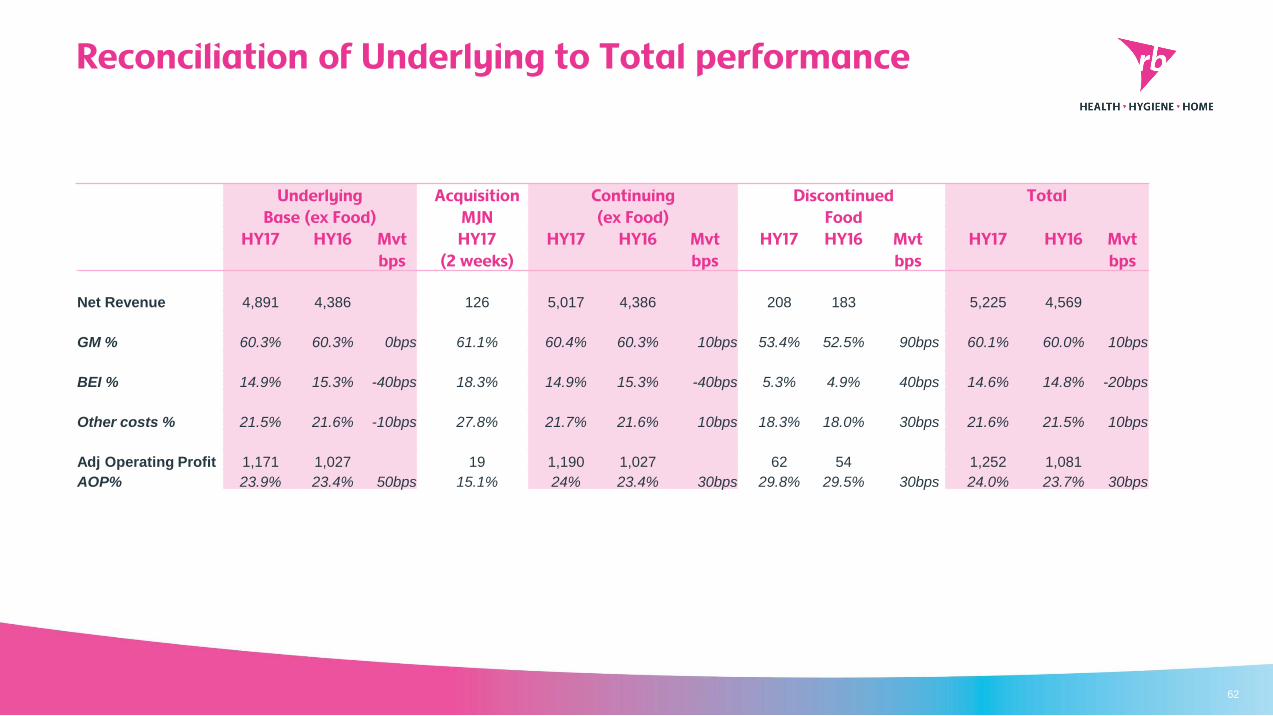
Reconciliation of Underlying to Total performance
62
Underlying Acquisition Continuing Discontinued Total
Base (ex Food) MJN (ex Food) Food
HY17 HY16 Mvt HY17 HY17 HY16 Mvt HY17 HY16 Mvt HY17 HY16 Mvt
bps (2 weeks) bps bps bps
Net Revenue 4,891 4,386 126 5,017 4,386 208 183 5,225 4,569
GM % 60.3% 60.3% 0bps 61.1% 60.4% 60.3% 10bps 53.4% 52.5% 90bps 60.1% 60.0% 10bps
BEI % 14.9% 15.3% -40bps 18.3% 14.9% 15.3% -40bps 5.3% 4.9% 40bps 14.6% 14.8% -20bps
Other costs % 21.5% 21.6% -10bps 27.8% 21.7% 21.6% 10bps 18.3% 18.0% 30bps 21.6% 21.5% 10bps
Adj Operating Profit 1,171 1,027 19 1,190 1,027 62 54 1,252 1,081
AOP% 23.9% 23.4% 50bps 15.1% 24% 23.4% 30bps 29.8% 29.5% 30bps 24.0% 23.7% 30bps