Embed Size (px)
Citation preview
razakschool.utm.my
PROCEEDINGS OF THE 2nd
MASTER PROJECT SYMPOSIUM
UNIVERSITI TEKNOLOGI MALAYSIA
KUALA LUMPUR
ISBN 978-967-15384-7-0
ii
Copyright © 2018 by UTM Razak School. All rights reserved.
No part of this publication may be reproduced, distributed, or transmitted in any form
or by any means, including photocopying, recording, or other electronic or
mechanical methods, without the prior written permission of the publisher, except in
the case of brief quotations embodied in critical reviews and certain other non-
commercial uses permitted by copyright law. For permission requests, write to the
publisher, addressed “Attention: Permissions Coordinator,” at the address below.
Published by:
UTM Razak School of Engineering and Advanced Technology
Universiti Teknologi Malaysia
Level 7, Razak Tower
Jalan Sultan Yahya Petra, 54100 Kuala Lumpur
MALAYSIA
http://razakschool.utm.my
First Printing, April 2018
Printed in Malaysia
iii
Editors:
Nor Raihana Mohd Ali
Hayati @ Habibah Abdul Talib
Siti Zura A. Jalil @ Zainuddin
Habibah @ Norehan Hj. Haron
Samira Albati Kamaruddin
Roslina Mohammad
Siti Armiza Mohd Aris
Sharifah Alwiah Syed Abd. Rahman
Mohd Nabil Muhtazaruddin
Rahimah Muhamad
Fatimah Salim
Sa’ardin Abdul Aziz
Shamsul Sarip
Nor Fazilah Mohd Hashim
Book cover designed by:
Karmila Khalid
iv
About Master Project Symposium
The 2nd
Master Project Symposium was held on 22 – 26 May 2017 for Semester 2
Session 2016/2017 at Menara Razak, Universiti Teknologi Malaysia (UTM) Kuala
Lumpur. This symposium is organized every semester by Master Project Committee,
UTM Razak School of Engineering and Advanced Technology to fulfil the
requirement of Executive Master in Occupational Safety and Health Management,
Master of Engineering Business Management, Master of Professional Science and
Master of Science (System Engineering).
This symposium aims to provide a platform for students to share their research
processes and outcomes among UTM Razak School members and at the same time
receive inputs from the audience to improve their research. Students are exposed to
various engineering business management issues by identifying the current issues in
their workplaces and addressing the issue through their research.
The papers presented in the symposium are compiled into proceedings with the aim to
share with others the research conducted by the students and findings that relates to
the current practices of many of the industries in Malaysia. An index of keywords
from all papers is included at the end of the proceedings. All participants and readers
can enjoy reading the proceedings and gain inspirations for further research and
application into education and practice.
v
Contents
Title Page No
Master of Engineering Business Management
Improvement on the Compliance of Project Documentation for
High Speed Broadband Project
Siti Norfatihah Ahmad Shariff and Rudzidatul Akmam Dziyauddin
1
Case Study on Citizen Relationship Management at Local
Authorities of Kuala Lumpur
Mageswary Appalanayadu and Noor Hamizah Hussain
8
The Impact of Transactional Uncertainties in Supply Chain on
Sales Performance
Izzah Yahya and Normawati Mohd Shariff
15
Factors Affecting the Decision in Providing Training and
Development in Small Medium Sized Engineering Companies
Muhammad Asyraf Ibrahim and Raihana Mohdali
25
Critical Success Factors of Implementing Knowledge Management
at LK Edu Private Tuition Center in Malaysia
Lim Seng Huat and Muhammad Fathi Yusof
32
Organizational Commitment towards Job Satisfaction in an Oil and
Gas Company in Sarawak
Mohammad Syafril Bahar and Hayati Habibah Abdul Talib
39
Project Delays Monitoring in Ministry of Health of Malaysia
Ahmad Al-Muhaymin Abd Wahab and Rahimah Muhamad
46
The Influence of Sales Skills towards Sales Engineer’s Performance
M Syahril Sudirman and Nik Hasnaa Nik Mahmood
54
Public Project Delay Monitoring By Implementation Coordination
Unit
Nor Azirah Abdul Ghani and Syuhaida Ismail
63
Impact of Team Integration on Project Delivery Performance in
Mass Rapid Transit Project
Nur Liyana Mohamad Nasir and Rafizah Musa
70
vi
Title Page No
Relationship between Engineer’s Emotional Intelligence Behaviour
and Sales Performance
Jessica Marie Arokiasamy and Roslizar Mat Ali
76
An Improvement of Building Service Management at Public Low
Cost Housing
Nadia Arib and Siti Uzairiah Mohd Tobi
84
Master of Science (Systems Engineering)
Lean Manufacturing System for Production Improvement Using
Line Balancing and Kaizen Approach
Ahmad Syazwan Afiq Abdul Karim, Siti Armiza Mohd Aris, Nurul
Aini Bani and Abdul Yasser Abd Fatah
92
The Impact of Fiber Reinforced Plastic Camouflage on the RF
Signal Strength
Muhammad Hanis Omar and Siti Zura A. Jalil
99
Master of Professional Science
Queuing System Model at Secondary School Coopmart
Ahmad Ridhuan Hamdan, Ruzana Ishak and Nik Nadzirah Nik
Mohamed
107
Inventory Management in Cafeteria Using Linear Programming
Mohd Fais Usop, Ruzana Ishak and Hayati Habibah Abdul Talib
114
Executive Master of Occupational Safety and Health Management
Evaluation of Occupational Stress of Royal Malaysian Navy Radar
Plotters
Wong Boon Wei and Normawati Mohd Shariff
121
Safety Culture among the Construction Workers in Rapid Rail
Project
Fazila Kamarudin and Norazli Othman
128
Job Satisfaction and Work Stress in Human Resources Management
Department of XYZ Bank Headquarter
Mohamad Adzim Samsudin and Noor Hamizah Hussain
136
vii
Title Page No
Elements in Personal Behaviour for Occupational Safety of
Motorcycle Riders
Kesevan Rarusuraman and Habibah @ Norehan Haron
146
Risk Assessment of Centralized Chlorine Gas System at Rubber
Glove Manufacturing Plant
Mohamed Anuar Idris and Shreeshivadasan Chelliapan
153
Risk Assessment of Excavation Works in the Vicinity of
Underground Utilities at Construction Site
Mohd Nazrul Mat Noor and Samira Albati Kamaruddin
164
5S Techniques at Neptune Air Warehouse
Nurul Amirah Jamaludin and Noor Hamizah Hussain
170
Safety Practices on Assembly Line at Al-Ghazi Tractors Limited,
Pakistan
Nausherwan Aadil, Astuty Amrin and Noor Hamizah Hussain
177
Level of Workers Awareness on the Globally Harmonized System
of Labelling and SDS at Workplace
Zuriana Zainal and Shamsul Sarip
183
Heat Exposure Assessment among Technicians in Machinery Room
onboard 24th
Corvette Laksamana Class Warship
Ahmad Tarmidzi Mohd Ideris and Siti Armiza Mohd Aris
195
Safety Awareness and Practices among XYZSB Workers towards
Occupational Safety and Health
Muhammad Faiz Md Haled, and Wan Normeza Wan Zakaria
,
200
Index 207
Proceedings of the 2nd
Master Project Symposium
1
Improvement on the Compliance of Project
Documentation for High Speed Broadband
Project
Siti Norfatihah Ahmad Shariffa and Rudzidatul Akmam Dziyauddin
b
UTM Razak School of Engineering and Advanced Technology, Universiti Teknologi
Malaysia, Jalan Sultan Yahya Petra, 54100 Kuala Lumpur, Malaysia [email protected],
Abstract – The implementation of High Speed Broadband (HSBB) network by
Telekom Malaysia is collaboration project with the Government Malaysia to deploy
the access, domestic, core and international networks required to deliver an end-to-
end HSBB infrastructure. Government of Malaysia has privileges to verify HSBB
expenditure within the project year by appointing Independent Consultant to ensure
Government fund is fully utilized for the purposes of HSBB project. In order to ensure
a smooth operation to the activity of the verification, improvement of the compliance
of project documentation will be implemented in HSBB projects. This research will
examines the improvement on the compliance of project documentation for HSBB
projects. The sample data was collecting from 110 HSBB projects in year 2015. Then
the analysis was done by interviewing the project management office and project
manager that involve in implementing the HSBB projects. The study is expected to
improve the compliance of project documentation for future HSBB projects.
Keywords: Project Documentation, High Speed Broadband, Telekom Malaysia
1.0 INTRODUCTION
Telekom Malaysia (TM) as the main service provider for High Speed Broadband
(HSBB) network had launch HSBB product known as a UNIFI in 24 March 2010
(Bernama, 2010). “UniFi” names come from "Uni" meaning that unity and
brotherhood, and "Fi" symbolized fibre-optics. The Government of Malaysia,
represented by Kementerian Penerangan, Komunikasi dan Kebudayaan and TM have
signed a Public Private Partnership (PPP) Agreement on September 2008. Under the
terms of the Agreement, TM agrees to undertake the roll-out of the HSBB Projects in
collaboration with the Government to deploy the access, domestic, core and
international networks required to deliver an end-to-end HSBB infrastructure. Based
on HSBB PPP Agreement that was duly signed on September 2008, the Government
of Malaysia has privileges to verify HSBB expenditure within the project year by
appointing Independent Consultant to ensure Government fund is fully utilized for the
purposes of HSBB project. The scope of the Government Independent Consultant
includes verifying the appropriateness of expenditure charged to HSBB project.
Inappropriate expenditure claimed by TM may be subjected to refund and also be
Proceedings of the 2nd
Master Project Symposium
2
charged for false claims. Due to this requirement, TM has to ensure that all the
expenditure records and document pertaining to HSBB expenditure are accurate and
complete. All the required records need to be updated promptly and safely kept. In
trying to mitigate the above potential issues, HSBB expenditure and physical
verification activity were introduced. In order to ensure a smooth operation to the
activity of the verification, improvement on the compliance for project documentation
will be implemented in HSBB projects in Phase 2.
2.0 LITERATURE REVIEW
HSBB is stands for High Speed Broadband delivering bandwidth at network speeds of
10Mbps and above through fixed line only as compared with normal broadband
delivered at network speeds ranging from 384Kbps to less than 10Mbps through fixed
line or Digital Subscriber Line and wireless mode such as 3G(HSDPA), WiMax or
WiFi (Arshad, 2008). At a political level, high speed broadband was seen as a
mechanism to transform Malaysia into a high-income country. Prime Minister Dato’
Sri Mohammad Najib bin Tun Abdul Razak stated that “High speed broadband is a
key enabler to transform Malaysia as a middle-income nation to a high-income
nation” (Gunaratne, 2014).
High speed broadband delivered to consumers and businesses will be through a mix
of Fibre-to-the-Home (FTTH), Ethernet-to-the-Home (ETTH) and Very High Speed
Digital Subscriber Line (VDSL2) technologies. In greenfield (new development)
areas FTTH will be the pre-dominant technology used for both residential and
commercial properties, whereas, brownfield (existing development) areas will be
served by FTTH, ETTH and VDSL2 technologies depending on the types of
properties and services to be deployed (Arshad, 2008).
Broadband has turned into Telekom Malaysia’s center business since the demerger of
its versatile business in 2008. In Malaysia, the high speed broadband technology will
be implemented mainly in industrial areas, cities, towns and the various development
regions including cyber cities and cyber centers, technology parks and the Iskandar
Development Region in the southern part of Peninsular Malaysia (Shittu et al. 2013).
TM as the main provider and of the high speed broadband service stands up in the
market with their namely Unifi high speed broadband product (Arshad, 2008).
The 10 year HSBB Phase 2 project extend includes the deployment of additional
access and center limit covering state capitals and selected major towns throughout
the nation. It incorporates arranging, planning, usage, operation and support of HSBB
network infrastructure and services. The aggregate cost of the HSBB 2 speculation for
a time of ten years is RM1.8 billion whereby the Government will contribute RM500
million and the rest of the RM1.3 billion will be contributed by TM. The aggregate
cost of the SUBB speculation for a time of ten years is RM1.6 billion with the
Government contributing RM600 million and TM contributing RM1.0 billion
(Gunaratne, 2014).
Claim verification process for HSBB projects in TM is verification on the expenditure
that covered documentation, financial and technical and after that verification on the
physical.
Proceedings of the 2nd
Master Project Symposium
3
3.0 METHODOLOGY
3.1 Preliminary Studies
The preliminary studies are the first stage of the work before the start of data
collection. In this stage, the method of reading, discussion and observation were
conducted to obtain information about the study to be performed. A literature review
was conducted to establish a common knowledge about the topic of research and it is
known as initial data. Through a literature review, research framework can more
clearly establish. Initial data and general information obtained from published
journals, information from the internet, the research work that has been published
before, the standard procedure in the project and books
3.2 Sampling Data from Projects
The sampling data are collected from the HSBB projects in Phase 2 in year 2015 are
known as the quantitative data. The sample data will be collected from project with
status complete and eligible to be included for the purpose of claim verification.
Referring to the research background, all HSBB projects in Phase 2 within 10 years
period, is to be verified and validate for claim verification by independent consultant
appointed by government. So HSBB projects in year 2015 are eligible to be included
for the purpose of claim verification. The data collected for this research is 110
projects from HSBB projects in Phase 2. This sample data will be filled in with
checklist from claim verification documentation. Every item in the checklist is
standard documentation checklist and expenditure checklist for the claim verification
process. Every item in the checklist is as per Table 1.
3.3 Interview
This data is then augmented with qualitative data by interviews the Project
Management Office (PMO) representative, project managers and experienced staff.
The project managers or the projects owner with failed or problem projects is selected
for the interview. The project managers with status success projects are also
participated for the interview to get clear view on the detail of checklist
documentation. Interview is great approach in the process of collecting more
information on claim verification process for HSBB projects in TM. The information
obtained is all about how project managers handle the HSBB projects, the claim
verification process, level of competence, problem or risk involvement and
recommendations for improvement of existing processes.
3.4 Data Collection and Analysis
To facilitate data analysis, Microsoft Excel 2010/2015 will be used for quantitative
data. Thematic analysis is applied to identify and further information and explanation
on the claim verification process.
Proceedings of the 2nd
Master Project Symposium
4
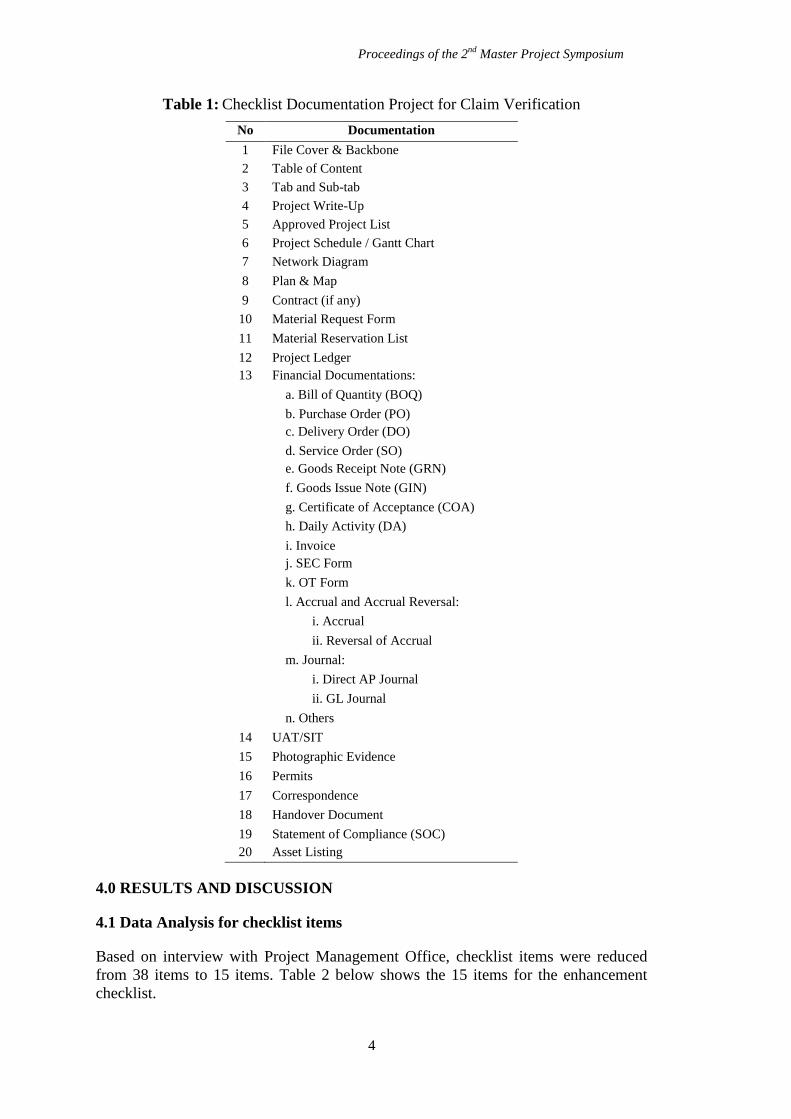
Table 1: Checklist Documentation Project for Claim Verification
No Documentation
1 File Cover & Backbone
2 Table of Content
3 Tab and Sub-tab
4 Project Write-Up
5 Approved Project List
6 Project Schedule / Gantt Chart
7 Network Diagram
8 Plan & Map
9 Contract (if any)
10 Material Request Form
11 Material Reservation List
12 Project Ledger
13 Financial Documentations:
a. Bill of Quantity (BOQ)
b. Purchase Order (PO)
c. Delivery Order (DO)
d. Service Order (SO)
e. Goods Receipt Note (GRN)
f. Goods Issue Note (GIN)
g. Certificate of Acceptance (COA)
h. Daily Activity (DA)
i. Invoice
j. SEC Form
k. OT Form
l. Accrual and Accrual Reversal:
i. Accrual
ii. Reversal of Accrual
m. Journal:
i. Direct AP Journal
ii. GL Journal
n. Others
14 UAT/SIT
15 Photographic Evidence
16 Permits
17 Correspondence
18 Handover Document
19 Statement of Compliance (SOC)
20 Asset Listing
4.0 RESULTS AND DISCUSSION
4.1 Data Analysis for checklist items
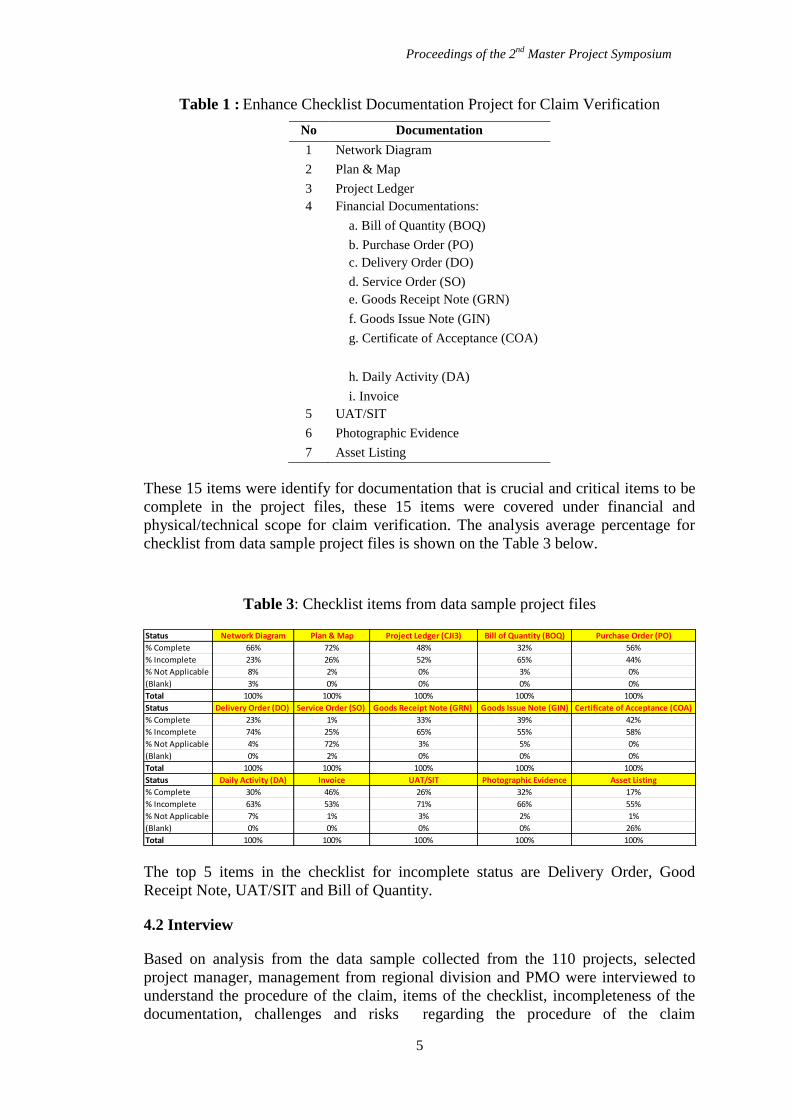
Based on interview with Project Management Office, checklist items were reduced
from 38 items to 15 items. Table 2 below shows the 15 items for the enhancement
checklist.
Proceedings of the 2nd
Master Project Symposium
5
Table 1 : Enhance Checklist Documentation Project for Claim Verification
No Documentation
1 Network Diagram
2 Plan & Map
3 Project Ledger
4 Financial Documentations:
a. Bill of Quantity (BOQ)
b. Purchase Order (PO)
c. Delivery Order (DO)
d. Service Order (SO)
e. Goods Receipt Note (GRN)
f. Goods Issue Note (GIN)
g. Certificate of Acceptance (COA)
h. Daily Activity (DA)
i. Invoice
5 UAT/SIT
6 Photographic Evidence
7 Asset Listing
These 15 items were identify for documentation that is crucial and critical items to be
complete in the project files, these 15 items were covered under financial and
physical/technical scope for claim verification. The analysis average percentage for
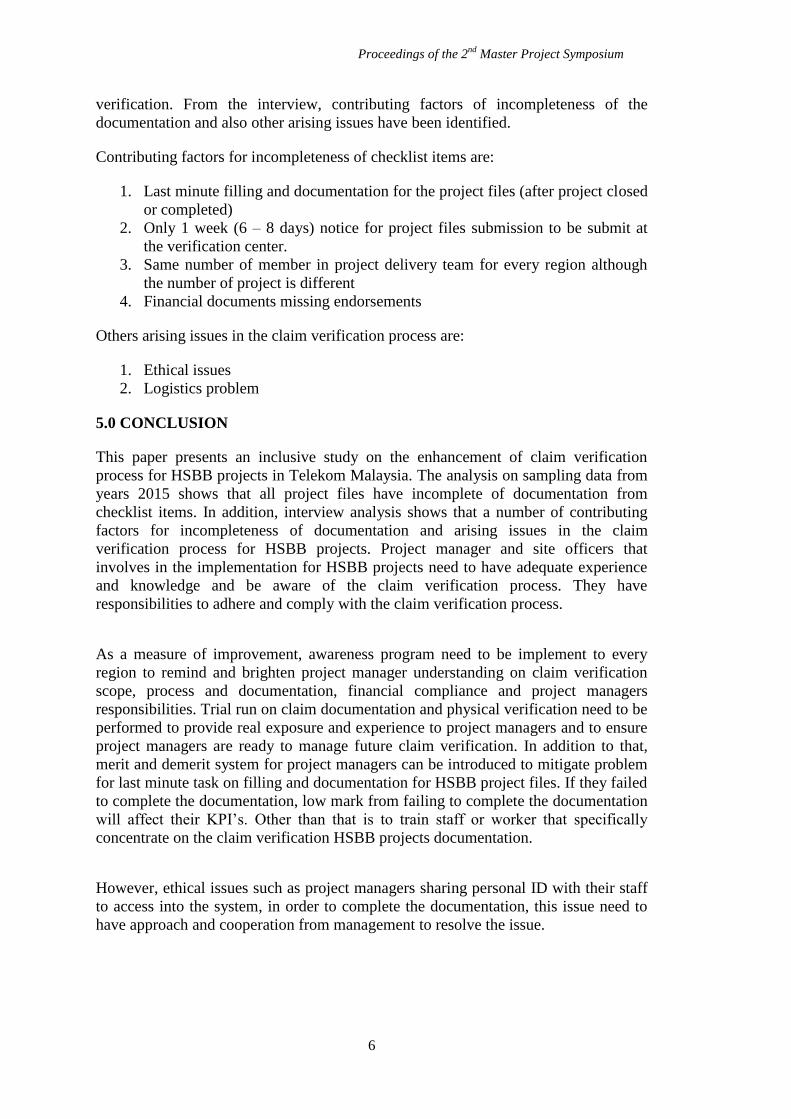
checklist from data sample project files is shown on the Table 3 below.
Table 3: Checklist items from data sample project files
The top 5 items in the checklist for incomplete status are Delivery Order, Good
Receipt Note, UAT/SIT and Bill of Quantity.
4.2 Interview
Based on analysis from the data sample collected from the 110 projects, selected
project manager, management from regional division and PMO were interviewed to
understand the procedure of the claim, items of the checklist, incompleteness of the
documentation, challenges and risks regarding the procedure of the claim
Status Network Diagram Plan & Map Project Ledger (CJI3) Bill of Quantity (BOQ) Purchase Order (PO)
% Complete 66% 72% 48% 32% 56%
% Incomplete 23% 26% 52% 65% 44%
% Not Applicable 8% 2% 0% 3% 0%
(Blank) 3% 0% 0% 0% 0%
Total 100% 100% 100% 100% 100%
Status Delivery Order (DO) Service Order (SO) Goods Receipt Note (GRN) Goods Issue Note (GIN) Certificate of Acceptance (COA)
% Complete 23% 1% 33% 39% 42%
% Incomplete 74% 25% 65% 55% 58%
% Not Applicable 4% 72% 3% 5% 0%
(Blank) 0% 2% 0% 0% 0%
Total 100% 100% 100% 100% 100%
Status Daily Activity (DA) Invoice UAT/SIT Photographic Evidence Asset Listing
% Complete 30% 46% 26% 32% 17%
% Incomplete 63% 53% 71% 66% 55%
% Not Applicable 7% 1% 3% 2% 1%
(Blank) 0% 0% 0% 0% 26%
Total 100% 100% 100% 100% 100%
Proceedings of the 2nd
Master Project Symposium
6
verification. From the interview, contributing factors of incompleteness of the
documentation and also other arising issues have been identified.
Contributing factors for incompleteness of checklist items are:
1. Last minute filling and documentation for the project files (after project closed
or completed)
2. Only 1 week (6 – 8 days) notice for project files submission to be submit at
the verification center.
3. Same number of member in project delivery team for every region although
the number of project is different
4. Financial documents missing endorsements
Others arising issues in the claim verification process are:
1. Ethical issues
2. Logistics problem
5.0 CONCLUSION
This paper presents an inclusive study on the enhancement of claim verification
process for HSBB projects in Telekom Malaysia. The analysis on sampling data from
years 2015 shows that all project files have incomplete of documentation from
checklist items. In addition, interview analysis shows that a number of contributing
factors for incompleteness of documentation and arising issues in the claim
verification process for HSBB projects. Project manager and site officers that
involves in the implementation for HSBB projects need to have adequate experience
and knowledge and be aware of the claim verification process. They have
responsibilities to adhere and comply with the claim verification process.
As a measure of improvement, awareness program need to be implement to every
region to remind and brighten project manager understanding on claim verification
scope, process and documentation, financial compliance and project managers
responsibilities. Trial run on claim documentation and physical verification need to be
performed to provide real exposure and experience to project managers and to ensure
project managers are ready to manage future claim verification. In addition to that,
merit and demerit system for project managers can be introduced to mitigate problem
for last minute task on filling and documentation for HSBB project files. If they failed
to complete the documentation, low mark from failing to complete the documentation
will affect their KPI’s. Other than that is to train staff or worker that specifically
concentrate on the claim verification HSBB projects documentation.
However, ethical issues such as project managers sharing personal ID with their staff
to access into the system, in order to complete the documentation, this issue need to
have approach and cooperation from management to resolve the issue.

Proceedings of the 2nd
Master Project Symposium
7
REFERENCES
Arshad, A. (2008). HSBB Knowledge Bank. Retrieved 21-May-2016, 2016, from
https://securevpn.tm.com.my/workgroups/strategy/hsbb/Pages/,DanaInfo=1intra
+Home.aspx
Bernama. (2010, 24 March 2010). TM Introduces UniFi, The Malaysian Insider.
Retrieved from http://www.themalaysianinsider.com/index.php/business/57389-
tm-launches-unifi-high-speed-broadband-
Gunaratne, R. L. (2014). High Speed Broadband Network in Malaysia.
Shittu, A. J. K., Osman, N. H., Osman, W. R. S., & Adedokun-Shittu, N. A. (2013).
The Evolution of High Speed Broadband Technology and its Impact on
Malaysian Society. World Applied Sciences Journal, 28(8), 1146-1153.
UniFi. Retrieved 28-May-2016, 2016, from https://en.wikipedia.org/wiki/UniFi
Proceedings of the 2nd
Master Project Symposium
8
Case Study on Citizen Relationship
Management at Local Authorities of
Kuala Lumpur
Mageswary Appalanayadua and Noor Hamizah Hussain
b
UTM Razak School of Engineering and Advanced Technology, Universiti Teknologi
Malaysia, Jalan Sultan Yahya Petra, 54100 Kuala Lumpur, Malaysia a [email protected],
Abstract – Good urban governance means they deliver services to citizen efficiently
and effectively in an inevitably way to citizen’s needs. The demand leads government
especially local governments to implement the Citizen Relationship Management
(CiRM). However, local citizens are yet 100% participate in the CiRM as a solution
to service quality. Therefore, the need to identify Information Technology (IT) officers
who also act as a system developers perspective on CiRM are important, where they
are the direct people who handle CSFs in CiRM as well playing a role in introducing
each of developed system to the public. Seven critical success factors (CSFs) were
identified in this research. The adapted questionnaire has been distributed to 95 IT
officers. The data collected guides the researcher to pursue investigate the
relationship between CiRM CSFs and the current existing CiRM. The data was
analyzed using correlation for understanding of current situation of CiRM. The
results lead to the proposed guideline to enhance the citizen participation in CiRM to
make government and the services provided more accessible and to ensure social
inclusion by making use of Information and Communication Technology (ICT) more
effectively.
Keywords: Citizen Relationship Management (CiRM), Local Governmnet, CSF, ICT
1.0 INTRODUCTION
Nowadays government have recognised the need to improve their relationship with
citizens and to put citizen’ needs at the centre of government thinking said Zamanian
et. al, (2011). Thus forming strategic relationships with citizen is crucial to
government long-term success. The essential purpose of citizen relationship
management is to shift from government-oriented management into citizen-oriented
(Bahari, 2013). Many local governments have been actively promoting
implementation of their services and information systems in various ways Napitupulu
et. al, (2014). Meanwhile, according to Bahari (2013) CiRM is considered as
implication of information and communication technology in order to improve public
services and strengthen support to public policies. However, CiRM implementation is
not straightforward. Thus, this project too has encountered many problems, be it in
developed or developing countries. Critical success factors (CSFs) that could spur the
growth and success of CiRM initiates in Local government are identified by several
authors (Azizan, 2011; Irani et. al, 2010; Keramati et. al, 2011, Lawson-Body et. al,
Proceedings of the 2nd
Master Project Symposium
9
2011, Napitupulu et. al, 2014 and Nfuka et. al, 2011)). Thus, citizen participation also
contribute as one of factor for successful CiRM where citizen participation can bring
very fruitful results to control corruption, to judge government policies (Sharma et. al,
2013), to make better delivery of government services, cost saving by electronically,
citizen empowerment, especially in decision-making and effective services in the
accountability process in public and private sectors.
According to Bahari (2013) public service in Malaysia operates similarly to
commercial companies where they face unprecedented pressure to improve service
quality while progressing lowering their cost, at the same time they are expected to
become more accountable, transparent, customer or citizen-focused and responsive to
stakeholders needs. The performance of the Malaysia government, especially the local
government like Kuala Lumpur City Hall (KLCH) has been subjected to various
criticisms based on the increasing number of complaints from the public regarding the
poor service provided. To solve all the problems which related to citizen service
quality, KLCH considering in establishing electronic services to their citizens and
becoming citizen-oriented. However, not many who use the online applications for
services from City Hall. Meanwhile the others still prefer the manual-base where they
come to KLCH counters to settle their problems or get any services.
This research is to examine the relationship between CiRM CSF and current CiRM
status, as well to propose a guideline for better practices in enhancing public
participation. The research objectives can be further detailed as follows: to identify
what are the IT official perception on CiRM implementation base on CSF; to evaluate
the relationship between CSF and current status of CiRM; and to propose a guideline
for better practices to enhance public participation in CiRM.
2.0 LITERATURE REVIEW
In Bahari (2012) mentioned the importance of CiRM has grown significantly in the
last few years at all levels of the government needs and is used to respond quickly and
accurately to citizens’ needs. CiRM is a collection of management methods and
information technologies used by governments to interact effectively with citizens.
CiRM technologies are widely used to improve citizen service levels (Keramati et al.
(2011). In CiRM book written by Schellong (2008), CiRM defined as strategy
enabled by technology with a broad citizen-focused, to maintain and optimize
relationship and encourage participation. This represents a working definition because
CiRM is an emerging research area. CiRM is not a theory but rather a management
concept.
The main goal of CiRM is to create and optimize the relationship with citizen by
embedding their opinions throughout public administration instead within a certain
processes or agency, certain hierarchy level or elected officials (Gagliardi et al. 2017).
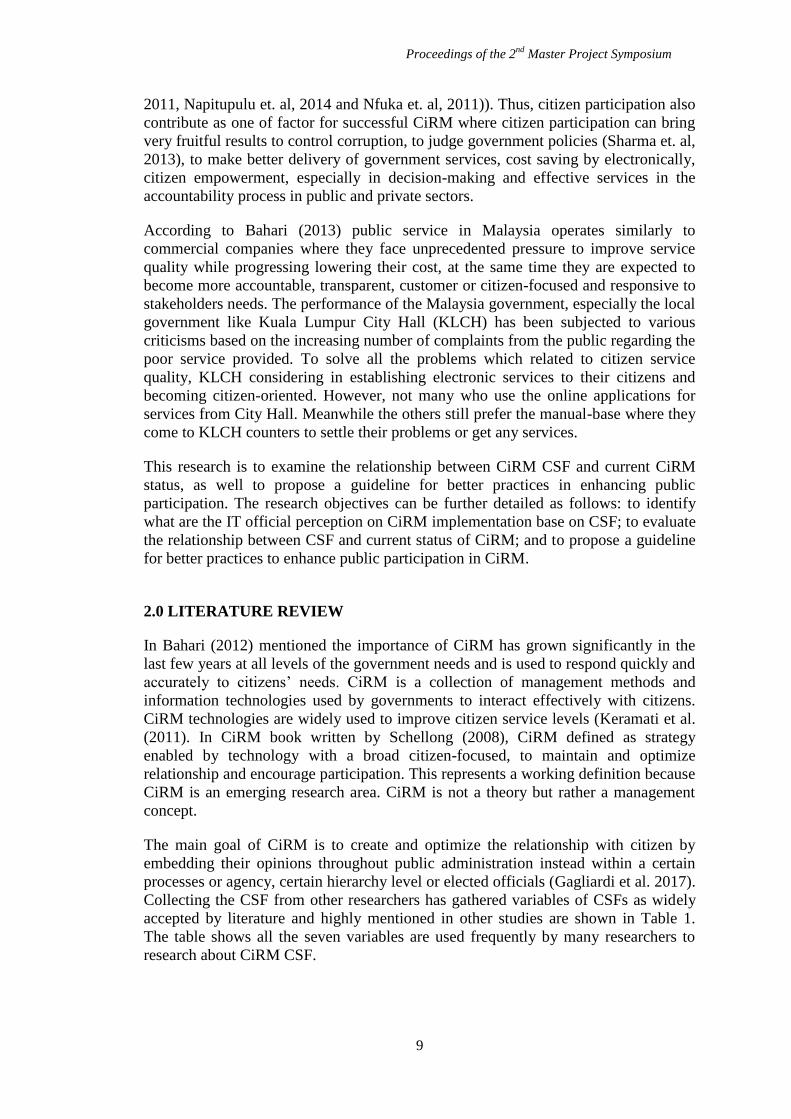
Collecting the CSF from other researchers has gathered variables of CSFs as widely
accepted by literature and highly mentioned in other studies are shown in Table 1.
The table shows all the seven variables are used frequently by many researchers to
research about CiRM CSF.
Proceedings of the 2nd
Master Project Symposium
10
Table 1: Frame of References
To
p
Man
agem
ent
sup
po
rt
Kn
ow
led
ge
Man
agem
ent
Pro
cess
Info
rmat
ion
Tec
hn
olo
gy
Org
aniz
atio
n
Ch
ang
e
Man
agem
ent
Cit
izen
Co
nce
rn
1 Napitupulu et. al, (2014) √
√
2 Nfuka and Rusu (2011) √
√
√ √
3 Lawson-Body et al. (2011) √
√ √ √ √ √
4 Keramati et al. (2011) √ √
√
5 Azizan (2011) √ √ √ √
√ √
6 Irani et al. (2010)
√ √
7 Sadegh Saremi (2009) √ √ √ √ √ √ √
Good public participation practices can help governments to be more accountable and
responsive (Sharma et al. 2013), and also improve the public’s perception of
governmental performance and the value the public receives from the government. In
the early of millennium year Suh (2004) mentioned citizen or public participation can
be classified into two categories: political participation such as voting in elections or
getting involved in political proceeding and administrative participation such as
demanding for or keeping a close watch on administration operation and this agreed
by many other recent researchers such as Alathur et. al, (2016); Gagliardi et al.
(2017); Haider et. al, (2015).
3.0 METHODOLOGY
Quantitative research approach has been utilized. The data collected from academic
papers and questionnaires. The populations is 95 of IT officers. According to Krejcie
and Morgan (1970) table the sampling size is 76. The respondents were given
sufficient time of 2 weeks to complete the questionnaires. 80 completed
questionnaires were returned therefore, the response rate of the questionnaire was
82.4%.
4.0 RESULTS AND DISCUSSION
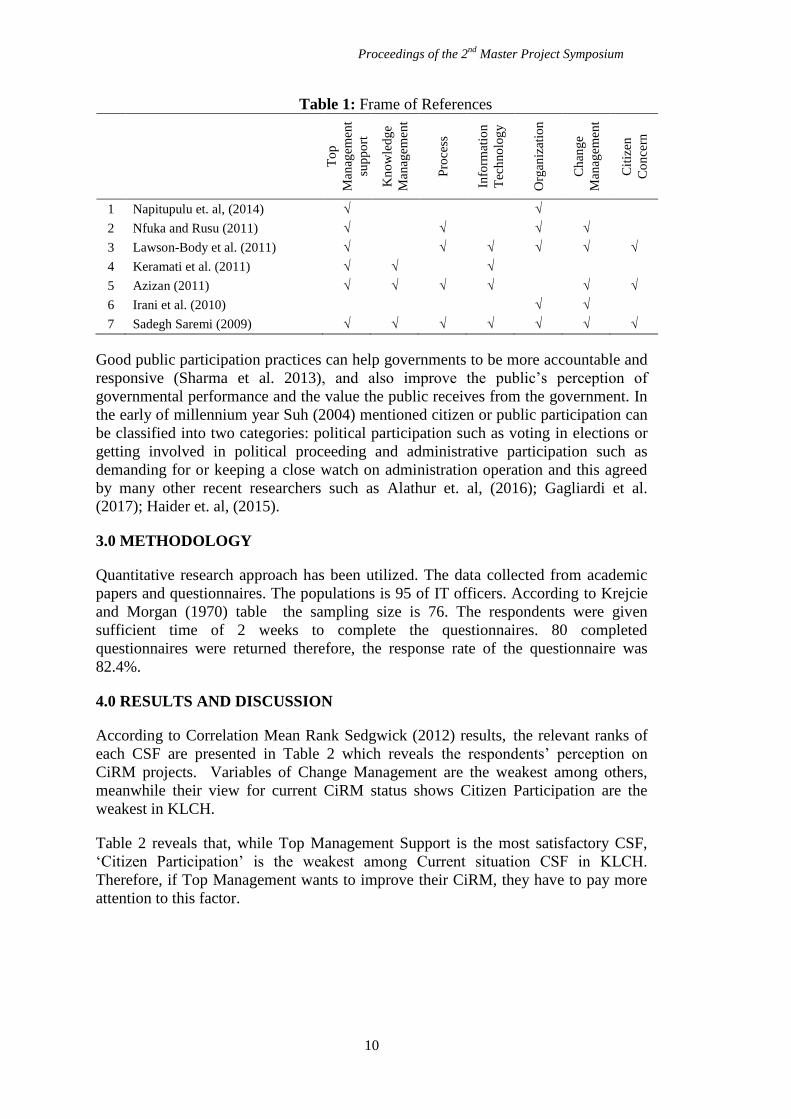
According to Correlation Mean Rank Sedgwick (2012) results, the relevant ranks of
each CSF are presented in Table 2 which reveals the respondents’ perception on
CiRM projects. Variables of Change Management are the weakest among others,
meanwhile their view for current CiRM status shows Citizen Participation are the
weakest in KLCH.
Table 2 reveals that, while Top Management Support is the most satisfactory CSF,
‘Citizen Participation’ is the weakest among Current situation CSF in KLCH.
Therefore, if Top Management wants to improve their CiRM, they have to pay more
attention to this factor.
Proceedings of the 2nd
Master Project Symposium
11
Table 2: Ranking CSF of Current Status
Factors Mean Rank Perception
ICT 3.93
Citizen concern 3.98
Top management support 4.02
Organisation 3.80
Change management 3.76
Process 3.94
Knowledge management 4.03
Current Status
Top management support 4.00
Service quality 3.89
Supportive ICT infrastructure 3.83
Good planning 3.83
Employee involvement 3.64
Citizen participation 3.53
Challenges 3.87
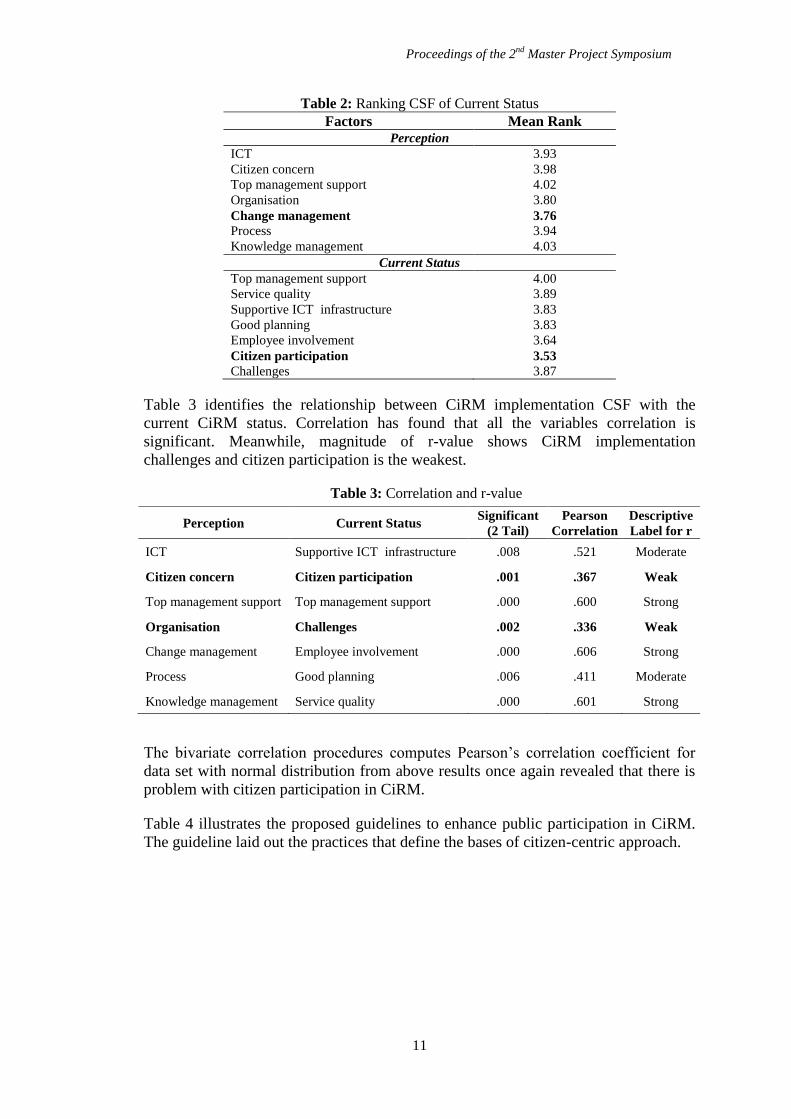
Table 3 identifies the relationship between CiRM implementation CSF with the
current CiRM status. Correlation has found that all the variables correlation is
significant. Meanwhile, magnitude of r-value shows CiRM implementation
challenges and citizen participation is the weakest.
Table 3: Correlation and r-value
The bivariate correlation procedures computes Pearson’s correlation coefficient for
data set with normal distribution from above results once again revealed that there is
problem with citizen participation in CiRM.
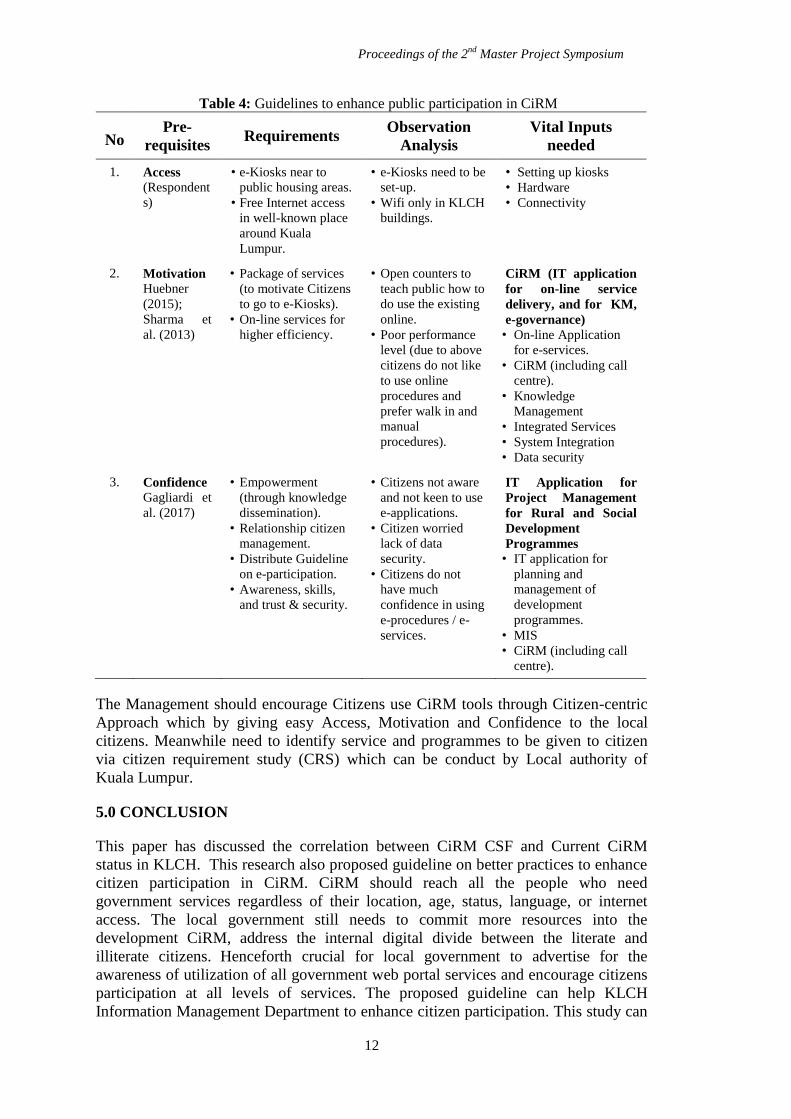
Table 4 illustrates the proposed guidelines to enhance public participation in CiRM.
The guideline laid out the practices that define the bases of citizen-centric approach.
Perception Current Status Significant
(2 Tail)
Pearson
Correlation
Descriptive
Label for r
ICT Supportive ICT infrastructure .008 .521 Moderate
Citizen concern Citizen participation .001 .367 Weak
Top management support Top management support .000 .600 Strong
Organisation Challenges .002 .336 Weak
Change management Employee involvement .000 .606 Strong
Process Good planning .006 .411 Moderate
Knowledge management Service quality .000 .601 Strong
Proceedings of the 2nd
Master Project Symposium
12
Table 4: Guidelines to enhance public participation in CiRM
No Pre-
requisites Requirements
Observation
Analysis
Vital Inputs
needed
1. Access (Respondent
s)
• e-Kiosks near to
public housing areas.
• Free Internet access
in well-known place
around Kuala
Lumpur.
• e-Kiosks need to be
set-up.
• Wifi only in KLCH
buildings.
• Setting up kiosks
• Hardware
• Connectivity
2. Motivation Huebner
(2015);
Sharma et
al. (2013)
• Package of services
(to motivate Citizens
to go to e-Kiosks).
• On-line services for
higher efficiency.
• Open counters to
teach public how to
do use the existing
online.
• Poor performance
level (due to above
citizens do not like
to use online
procedures and
prefer walk in and
manual
procedures).
CiRM (IT application
for on-line service
delivery, and for KM,
e-governance)
• On-line Application
for e-services.
• CiRM (including call
centre).
• Knowledge
Management
• Integrated Services
• System Integration
• Data security
3. Confidence
Gagliardi et
al. (2017)
• Empowerment
(through knowledge
dissemination).
• Relationship citizen
management.
• Distribute Guideline
on e-participation.
• Awareness, skills,
and trust & security.
• Citizens not aware
and not keen to use
e-applications.
• Citizen worried
lack of data
security.
• Citizens do not
have much
confidence in using
e-procedures / e-
services.
IT Application for
Project Management
for Rural and Social
Development
Programmes • IT application for
planning and
management of
development
programmes.
• MIS
• CiRM (including call
centre).
The Management should encourage Citizens use CiRM tools through Citizen-centric
Approach which by giving easy Access, Motivation and Confidence to the local
citizens. Meanwhile need to identify service and programmes to be given to citizen
via citizen requirement study (CRS) which can be conduct by Local authority of
Kuala Lumpur.
5.0 CONCLUSION
This paper has discussed the correlation between CiRM CSF and Current CiRM
status in KLCH. This research also proposed guideline on better practices to enhance
citizen participation in CiRM. CiRM should reach all the people who need
government services regardless of their location, age, status, language, or internet
access. The local government still needs to commit more resources into the
development CiRM, address the internal digital divide between the literate and
illiterate citizens. Henceforth crucial for local government to advertise for the
awareness of utilization of all government web portal services and encourage citizens
participation at all levels of services. The proposed guideline can help KLCH
Information Management Department to enhance citizen participation. This study can
Proceedings of the 2nd
Master Project Symposium
13
be references too, for other local Governments in Malaysia. However, the results
cannot be the representative for the other countries local governments and as well
other Malaysian local Government this due to similar studies in other local
government may result in different results because of different cultures, different
technologies, and others.
REFERENCES
Alathur, S., Ilavarasan, P. V., & Gupta, M. (2016). Determinants of e-participation in the
citizens and the government initiatives: Insights from India. Socio-Economic Planning
Sciences, 55, 25-35.
Azizan, N. (2011). Critical success factors for knowledge transfer via Australian and
Malaysian government education websites: a comparative case study.
Bahari, M. (2012). Citizen relationship management implementation in local government-
towards a theoretical research framework. Journal of Information Systems Research
and Innovation, 2, 51-61.
Bahari, M. (2013). Citizen relationship management implementation in Malaysian local
governments. Brunel University, School of Information Systems, Computing and
Mathematics.
Gagliardi, D., Schina, L., Sarcinella, M. L., Mangialardi, G., Niglia, F., & Corallo, A. (2017).
Information and communication technologies and public participation: interactive maps
and value added for citizens. Government Information Quarterly, 34(1), 153-166.
Haider, Z., Shuwen, C., & Hyder, S. Citizens’ participation in e-government services: A
Comparative Study of Pakistan & Singapore. IOSR Journal of Electronics and
Communication Engineering, 9(6), 35-38.
Huebner, J. P. (2015). E-Participation and Citizen Relationship Management in Urban
Governance: Tools and Methods. Public Affairs and Administration: Concepts,
Methodologies, Tools, and Applications: Concepts, Methodologies, Tools, and
Applications, 11.
Irani, Z., Kamal, M., Angelopoulos, S., Kitsios, F., & Papadopoulos, T. (2010). New service
development in e-government: identifying critical success factors. Transforming
Government: People, Process and Policy, 4(1), 95-118.
Keramati, A., Saremi, M. S., & Afshari–Mofrad, M. (2011). Citizen relationship management
critical success factors: An empirical study of municipality of Tehran. International
Journal of Electronic Governance, 4(4), 322-347.
Krejcie, R. V., & Morgan, D. W. (1970). Determining sample size for research activities.
Educational and psychological measurement, 30(3), 607-610.
Lawson-Body, A., Willoughby, L., Mukankusi, L., & Logossah, K. (2011). The critical
success factors for public sector CRM implementation. Journal of Computer
Information Systems, 52(2), 42-50.
Napitupulu, D., & Sensuse, D. I. (2014). The critical success factors study for e-government
implementation. International Journal of Computer Application, 89(16).
Nfuka, E. N., & Rusu, L. (2011). The effect of critical success factors on IT governance
performance. Industrial Management & Data Systems, 111(9), 1418-1448.
Sadegh Saremi, M. (2009). Critical success factors in citizen relationship management.
Schellong, A. (2008). Citizen relationship management: A study of CRM in government (Vol.
560): Peter Lang.
Sedgwick, P. (2012). Pearson’s correlation coefficient. Bmj, 345(7).
Sharma, G., Bao, X., & Peng, L. (2013). Public participation and ethical issues on e-
governance: A study perspective in Nepal. Electronic Journal of E-Government, 12(1).
Suh, S. (2004). Promoting citizen participation in e-government. See: http://unpan1. un.
org/intradoc/groups/public/documents/un/unpan020076. pdf.

Proceedings of the 2nd
Master Project Symposium
14
Zamanian, M., Khaji, M. R., & Emamian, S. M. S. (2011). The value chain of citizen
relationship management (CzRM): A framework for improvement. African Journal of
Business Management, 5(22), 8909.
Proceedings of the 2nd
Master Project Symposium
15
The Impact of Transactional Uncertainties in
Supply Chain on Sales Performance
Izzah Yahyaa and Normawati Mohd Shariff
b
UTM Razak School of Engineering and Advanced Technology, Universiti Teknologi
Malaysia, Jalan Sultan Yahya Petra 54100 Kuala Lumpur, Malaysia [email protected],
Abstract – This study investigates the impact of supply chain uncertainty on sales
performance at a major food supplier in the Klang Valley. The following clusters of
source of uncertainty were identified: stock availability, order forecast horizon and
administrative decision process. Data were collected by using JD Edwards system, a
software package used by organization to support a diverse set of business process
such as distribution, financial, inventory, procurement and fixed asset. The three
sources of transactional uncertainties were the independent variables, and company
sales performance was the dependent variable. The data collected from beginning of
January 2016 until end of the year on December 2016. The total reported number of
related sales orders was 90,603. From regression analysis, correlation shows positive
correlation between all independent variable and dependent variable but there were
negative correlation between independent variable which were order forecast horizon
and administrative decision with stock availability. Based on standard coefficient
three source of uncertainty was significant and the factors contribute most to sales
performance was stock availability.
Keywords: Supply chain management, source of uncertainty, sales performance
1.0 INTRODUCTION
Existing literature have generally described supply chain management as involving an
end to end process starting from raw material until the “product” is sent to the
customer (Borodin, 2016). Ballou (2004) defined supply chain as all activities
associated with the transformation and flow of goods and services, including their
attendant information flows, from the sources of raw materials to end users, while
Mentzer et al, (2001) defined supply chain as a set of three or more entities, whether
organizations or individuals, that are directly involved in the upstream and
downstream flows of products, services, finances, and/or information from a source to
a customer.
Supply-chain uncertainty is a problem with which every logistic manager faces (Hult
et al., 2010). Its performance can be influenced by many factors and problems may
occur from different sources due to the complexity of global supply-chain networks,
which include the potential for delivery delays and quality problems (Bhatnagar and
Sohal, 2005). According to Vorst and Beulens (2002), supply chain uncertainty refers
to decision making situations in the supply chain in which the decision maker does
not know definitely what to decide as he is either uncertain about the objectives of
Proceedings of the 2nd
Master Project Symposium
16
supply chain, lacks information or understanding of the supply chain or its
environment; lacks information processing capacities; is unable to accurately predict
the impact of possible control actions on supply chain behaviour; or, lacks effective
control actions (non- controllability). In a case study about food supply chain of
salads in Netherlands, Vorst, Beulens, Wit, and Beek (1998) identified four main
clusters of source of uncertainty which are order forecast horizon, input data,
administrative decision and inherent uncertainties. The study concluded that supply
chain performance can improve when uncertainties are reduced or eliminated.
Supply chain practices must move toward sustainability because component of
organization businesses process, to review performance, and to adopt sustainable
services and products to satisfy consumer (Cronin et al., 2011; Keating et al., 2008).
Boonitt and Pongpanarat (2011) and Cho et al. (2012) develop framework for service
supply chain performance measurement and emphasized performance measures in
addressing the service supply chain processes. Moreover, sustainable service is a
component of sustainable plans and operation that could decrease negative
environmental impact and improved consumers and producers benefit, (Kotlerand
Armstrong, 2010; López and Zúñiga, 2014).
Since transactional uncertainties can predict supply chain performance increase or
decrease by knowing which factor has the biggest impact on sales performance will
enable the organization to enhance supply chain management decision at strategic,
tactical and operational levels. In turn, improvement in the management of supply
chain would inevitably contribute substantially to the profits of the organization and
its financial sustainability.
Accordingly, in this paper, the impact of transactional uncertainties on the sales
performance at the organization, a major dairy product supplier in Malaysia, is
addressed. The investigation is timely because previously, the company has never
conducted any study to examine the extent the factors related to uncertainty influence
its sales performance. Sales report from January to October 2016 shows that 67% of
the sales amount is successful in transaction. And more that 33% is consider as non-
successful transaction. Although, the percentage of non-successful transaction appears
to be reasonably low, but when converting into ringgit, the amount is equal to RM7.4
million per year. If the main factor of transactional uncertainties cannot be reduce or
eliminated, this amount consider as loss to the organization.
This study explores the impact of transactional uncertainties within supply chain on
the sales performance in the food supply industry. In order to achieve this, the
following objectives were identified to fulfil the aim of this research. First, the focus
was to find the factors that contribute to uncertainties in transaction at the company.
Secondly, it analyzed which of the factors of uncertainties in transaction contribute
the most to SP. Finally, this paper concludes with some recommendations of
measures that could be taken to improve sales performance at the company. This
research was only conducted in one food supplier Company in Malaysia and no
comparison has been done. It focused on Modern Trade Retailers which is the key
account at the organization.
Proceedings of the 2nd
Master Project Symposium
17
2.0 LITERATURE REVIEW
Supply Chain Management (SCM) is an essential element to operational efficiency.
SCM can be applied to customer satisfaction and company success, as well as within
societal settings, including medical missions; disaster relief operations and other kinds
of emergencies; cultural evolution; and it can help improve quality of life.
Based on Ross (1998), SCM often use complicated terminology, had limit
management’s understanding of the concept and its effectiveness for practical
application. The SCM concept came up in 1960s according to Huan, (2004). In order
to success in business, companies have to focus on their supply chain. In 1997 top
managers had recognized the significance of having effective supply chain to create
competitive advantage according to Higginson and Alam (1997) and Cooper et al
(1997). Solvang (2001) writes that one of the biggest challenges for manufacturing
supply chains is to continuously improve their performance so that their
competitiveness can be sustained in long term. Tummala et al. (2006) stated to make
changes to the supply chain helps to lower cost and enables a company to more easily
compete based on the price.
In Supply Chain Risk Management (SCRM) literature, risk only associated with
issues that may lead to negative outcomes (Hillson, 2006, Peck,2006, Wager and
Bode, 2008). Risk sometimes is interpreted as unreliable and uncertain resources
creating supply chain interruption, whereas uncertainty can be explained as matching
risk between supply and demand in supply chain processes. Tang, O. and N. Musa
(2011), believe that two dimensions are important in discussing risk: the outcome of
risk impact and expectation of risk sources. As in most literature, Tang, O. and N.
Musa (2011), also agree that risk issue is associated with negative consequences of
impact (Christopher and Lee, 2004, Paulson, 2005, Spekman and Davis, 2005,
Wagner and Bode, 2006). Risk event should be expected as supplier has quality
deficiencies experienced by Robert Bosch GmbH, Wagner and Bode, (2006) or
unexpected such as wars, strikes or terrorist attacks, (Christopher and Lee, 2004;
Kleindorfer and Saad, 2005; Quinn, 2006). Based on Tang, O. and N. Musa (2011)
opinion, a better definition of supply chain risk should refer to i) events with small
probability but may occur abruptly, and ii) these events bring substantial negative
consequences to the system.
To improve supply chain performance, Vorst et al., (1998) were come out with four
main clusters of sources of uncertainty which impact the operational performance.
The four-main cluster are order forecast horizon, input data, administrative and
decision processes, and inherent uncertainties. While Snyder et al. (2012) described
supply chain uncertainty should include disruptions, yield uncertainty, capacity
uncertainty, lead-time uncertainty, and input cost uncertainty.
The first dimension of transactional uncertainty is input data available for this study
we use stock availability to fix the company terms. The availability and transparency
of information in supply chain has the potential to reduce cost and increase customer
satisfaction. According to Lewis and Naim, (1995), to provide real time information
on stock level and stock availability, inventory control system must be updated and
well managed. If the information not updated the order forecast horizon becomes even
larger. Besides, to eliminate transaction issues, information on customer demand must
Proceedings of the 2nd
Master Project Symposium
18
be available in the right format. The specification of data decision can be a source of
uncertainty. For this study we will classify the met order with successful order and the
unsuccessful order drop because of out of stock.
The second dimension of transactional uncertainty is order forecast horizon. This is
referring to the time period from order placement to the recipient of goods. Once
retailer send the order to the organization, all sales estimation within the time frame
must be taken into account. Based on Vorst et al., (1998) model, they differentiate the
total order forecast horizon into two category which are order lead time and order
sales period. Order lead time is starting the moment order is placed until the order
goods are delivered. The order sales period is the time period between two successful
deliveries. In this study, the order date is based on time different starting from the
order receive from retailers until the order deliver to the retailers.
The third dimension refers to administrative and decision processes, in particular to
decision policies and the influence of human behaviour. The application of ordering
and production rules, use of local demand and inventory information and comparison
of internal costs with local service provider at fixed points in time. Additional
uncertainty is created by ignoring or aggregating information in administrative or
decision policies. Customer service need to make a decision to proceed or to cancel
order if there is price different in the sales order. This paper will show the decision
policies that are related to operational performance. The relationship between the
retailers to order and human decision towards supply chain management.
Performance measurement is defined as the process of quantifying effectiveness and
efficiency of action (Neely, Gregory, and Platts, 1995). Performance measures
dealing with suppliers, delivery performance, customer service, and inventory and
logistics cost in a SCM, (Gunasekaran, Patel, and Tirtiroglu, 2001). When customer
requirements are met it is called effectiveness and firm’s resources economy is
consider as efficiency measure when providing a pre-specified level of customer
satisfaction (Pasutham, 2012). Performance measurement systems are described to
quantify both the efficiency and effectiveness of action as the overall set of factors
used (Pasutham, 2012).
Based on the three dimension stated above this paper is to analyze the main factor
contribute to supply chain uncertainty and recommend some measure to help
company to improve the sales performance. For this study we will focus on the supply
chain uncertainty and sales performance only.
3.0 METHODOLOGY
Data was collected from JD Edwards EnterpriseOne (JDE). JDE is an integrated
applications suite of comprehensive enterprise resource planning software that
combines value, standards-based technology, and deep industry experience into a
business solution with a low total cost of ownership. This system used by the
company to support a diverse set of business process such as distribution, financial,
inventory, procurement and fixed asset. Microsoft SQL Server 2008 was used to
extract the raw data because the data involve very large. All the sales order created by
the Customer Service was extracted from sales order table. The data collected from
beginning of January 2016 until end of the year on December 2016. The total reported
number of related sales orders was 90,603.
Proceedings of the 2nd
Master Project Symposium
19
All the raw data were sorted by document number, item number, order date request,
request date to deliver, order status, unit price, unit cost, unit of measurement, stock
availability and key account.
The tabulated data were based on stock availability, order forecast horizon, and
administrative decision. This information we get based on the order status populated
in the system status setting and configuration at JDE.
For this study we focused on three main factors: stock availability, order forecast
horizon, and administrative decision processes. The factor of inherent uncertainty as
mention by Vorst et al., (1998), was left out because this factor is based on the
fluctuation in supply performance due to natural variations in quality, seasonal
patterns and variable yield which is not applicable to the organization supply chain.
The method use to analyze the three independent variables with one dependent
variable is Multiple Regression analysis. The independent variables are stock
availability (𝑋1) measured in unit order forecast horizon (𝑋2) measured in period, and
administrative decision (𝑋3) measured in ringgit, and the dependent variable (𝑌) is the
sales performance which measured in ringgit.
4.0 RESULTS AND DISCUSSION
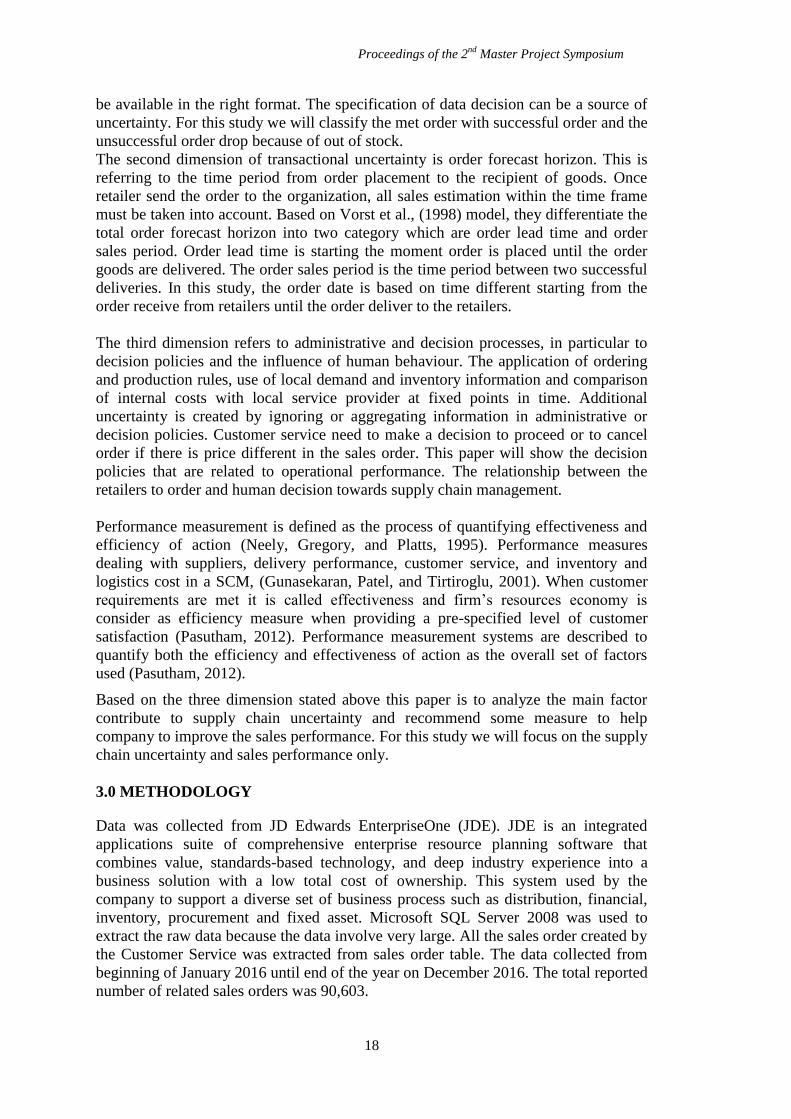
Table 1 shows the correlation coefficient reflect both the magnitude and direction of
the relationship between two independent variable. The correlation coefficient
between Stock availability and Sales performance shows positive value which is equal
to 0.913. While order forecast horizon correlation coefficient with sales performance
is equal to 0.044 with positive amount. The third independent variable is equal to
0.395 with positive amount. All the correlation coefficient is positive therefore when
an increase in one variable is related to an increase in the other variable in the
coefficient or vice versa. Between this three variable show that stock availability
value is near to 1.000, it show that stock availability is the highest impact of the
relationship with sales performance compared to order forecast horizon and
administrative and decision.
Table 1: Correlations and shared variance (n = 90,603)
Sales Performance,
𝑌
Stock
availability,
𝑋1
Order forecast
horizon,
𝑋2
Administrative
decision,
𝑋3
Sales Performance, 𝑌 1.000
Stock availability, 𝑋1 0.913 1.000
Order forecast horizon,
𝑋2
0.044 -0.003 1.000
Administrative decision,
𝑋3
0.395 -0.001 0.002 1.000
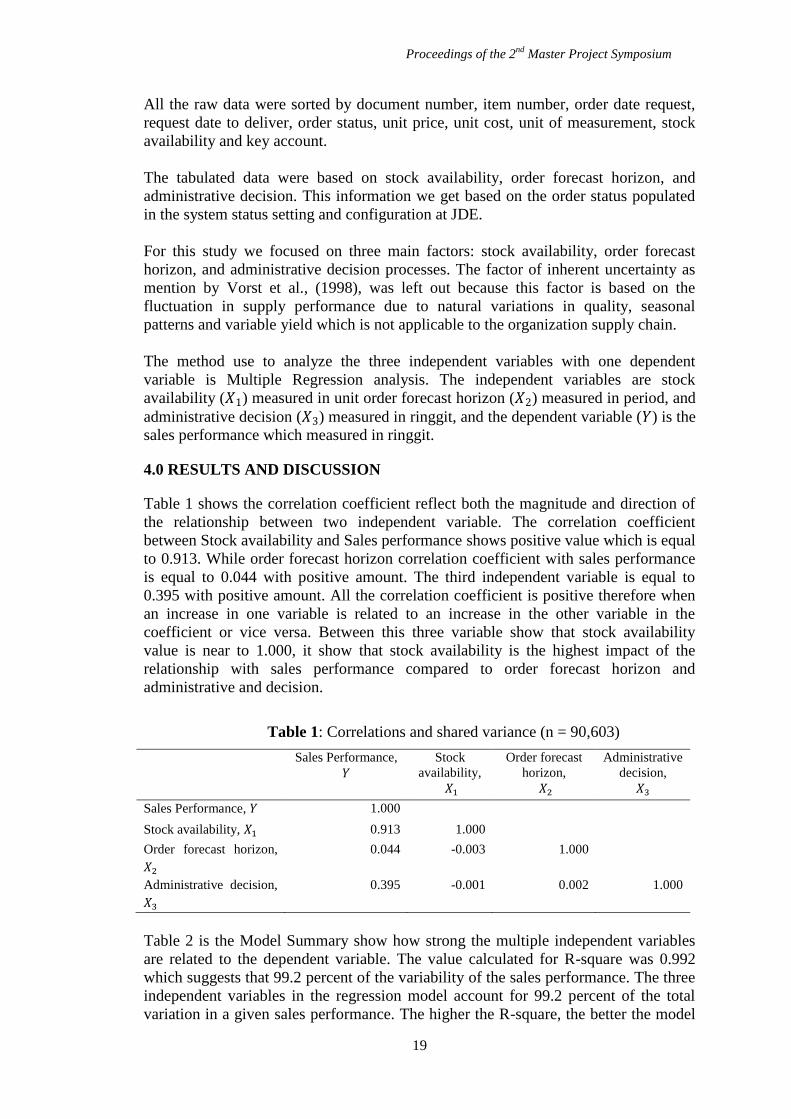
Table 2 is the Model Summary show how strong the multiple independent variables
are related to the dependent variable. The value calculated for R-square was 0.992
which suggests that 99.2 percent of the variability of the sales performance. The three
independent variables in the regression model account for 99.2 percent of the total
variation in a given sales performance. The higher the R-square, the better the model
Proceedings of the 2nd
Master Project Symposium
20
fits the data. The adjusted R-square is a modified R-square that takes into account
how many variables are included in the model. The adjusted R-square shows the same
amount as R-square, the percentage shows that the three independents variable are
highly contribute to the sales performance.
Table 2: Model Summary based on Correlation and Regression Analysis
Model R R Square
Adjusted R
Square
Std. Error of the
Estimate
1 .996a .992 .992 509.72622
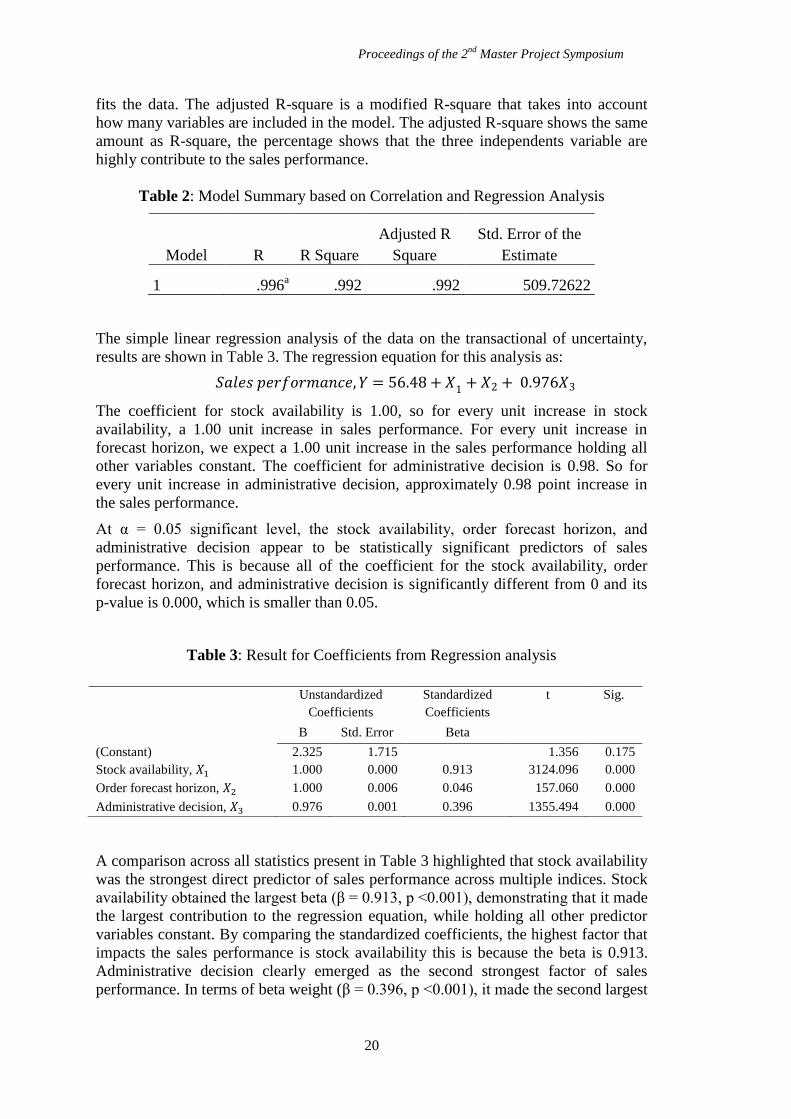
The simple linear regression analysis of the data on the transactional of uncertainty,
results are shown in Table 3. The regression equation for this analysis as:
𝑆𝑎𝑙𝑒𝑠 𝑝𝑒𝑟𝑓𝑜𝑟𝑚𝑎𝑛𝑐𝑒, 𝑌 = 56.48 + 𝑋1 +𝑋2 + 0.976𝑋3
The coefficient for stock availability is 1.00, so for every unit increase in stock
availability, a 1.00 unit increase in sales performance. For every unit increase in
forecast horizon, we expect a 1.00 unit increase in the sales performance holding all
other variables constant. The coefficient for administrative decision is 0.98. So for
every unit increase in administrative decision, approximately 0.98 point increase in
the sales performance.
At α = 0.05 significant level, the stock availability, order forecast horizon, and
administrative decision appear to be statistically significant predictors of sales
performance. This is because all of the coefficient for the stock availability, order
forecast horizon, and administrative decision is significantly different from 0 and its
p-value is 0.000, which is smaller than 0.05.
Table 3: Result for Coefficients from Regression analysis
A comparison across all statistics present in Table 3 highlighted that stock availability
was the strongest direct predictor of sales performance across multiple indices. Stock
availability obtained the largest beta (β = 0.913, p <0.001), demonstrating that it made
the largest contribution to the regression equation, while holding all other predictor
variables constant. By comparing the standardized coefficients, the highest factor that
impacts the sales performance is stock availability this is because the beta is 0.913.
Administrative decision clearly emerged as the second strongest factor of sales
performance. In terms of beta weight (β = 0.396, p <0.001), it made the second largest
Unstandardized
Coefficients
Standardized
Coefficients
t Sig.
B Std. Error Beta
(Constant) 2.325 1.715 1.356 0.175
Stock availability, 𝑋1 1.000 0.000 0.913 3124.096 0.000
Order forecast horizon, 𝑋2 1.000 0.006 0.046 157.060 0.000
Administrative decision, 𝑋3 0.976 0.001 0.396 1355.494 0.000
Proceedings of the 2nd
Master Project Symposium
21
contribution factor to the regression equation when holding all other predictors
constant.
In order words, stock availability is the most factor contribute to improve the sales
performance. If this main factor is reduced or eliminated, the sales performance will
directly increase. Overall, these findings support how stock availability is the most
significant direct contributor and administrative decision was the second most
important direct contributor to impact of the sales performance.
From the finding above the highest factor that contributes to the uncertainties of
transaction is stock availability. Based on the Vorst, Beulens, Wit, and Beek (1998),
previous study the stock availability is related to the information availability and
transparency of the stock availability. The less information the organization has the
more uncertain its transaction. This is because lack of information affects the sales
person decision making ability to stock purchase. Information helps to ensure that
customers can receive material when and where they require it. This support by Fisher
(1997) to reduce uncertainty related to innovative products which are characterized by
a short product lifecycle and a wide variety of products and Simangunsong, (2012),
elaborate by applying a shorter stock replacement cycle (less than one month) than the
minimum product life cycle (6 months), the organization has sufficient time to sell off
excess stocks in the case of end-of-product-life items. The stock information should
be updated in real time to the sales person. Therefore the stock can be placed on time.
Order forecast horizon is the different of the purchase order date and the request
delivery date from the retailers. Customer service need to ensure the order had
process within the time range. For delivery can divided into local and outstation
delivery. For local location customer service need to ensure the sales order process
and send to the warehouse within one day, while outstation the time lead to deliver is
within 3 days. The Monczka et al. (2009) mention, that problems with order
processing have involved accepting orders before determining if adequate production
capacity is available, not coordinating order processing with order scheduling, and
using internal production dates instead of the customer’s preferred date to schedule
the order. Order processing is an important part of supply chain management as it
represents a link between the manufacture and the external customer.
Administrative decision use of local demand and inventory information and
comparison of internal costs with local service provider at fixed points in time.
Additional uncertainty is created by ignoring or aggregating information in
administrative or decision policies. Customer service need to make a decision to
proceed or to cancel order if there is price different in the sales order. The order can
only flow if the retails price is greater and equal to the system based price. To ensure
the performance can increase the system setting by including the criteria of the price
different.
As a result, the stock availability is the main factor of transactional uncertainty at the
company. The stock information should be updated in real time to the sales person.
Proceedings of the 2nd
Master Project Symposium
22
5.0 CONCLUSION
In conclusion, all the three-source uncertainty discussed is the factor that contribute to
sales performance increase or decrease. Based on the result, find that the stock
availability is the most factor that effect sales performance. By controlling the quality
of inputs, lead times, and increase delivery reliability can improve performance. A
critical stock take of operation research applications and emphasized ability to address
the complexity supply chains, particularly where flexibility and sustainability are key
system goals. The organization must have the strategy to reduce and eliminate the
stock availability factor. Demand forecasting is a significant work for every party in a
supply chain, the accuracy of demand forecast is important to organization because
the quality of its forecast often affects the performance of the entire supply chain.
Lean process can be implemented to provide a flow of goods, services and
technologies from suppliers to customers without creating waste. Therefore, it is
imperative for leanness to organize a highly efficient and integrated production and
logistics process through which manufacturers can increase productivity and reduce
process-related costs to produce high-volume products. Such a high volume of
production processes requires high efficiency through automation and real-time
information sharing within an organization. The limitation of the study refer to the
small size and to reduce possibility of the findings to be generalized within food
supply industry. Future research proposed includes more empirical research in order
to further investigate in stock availability when do the forecasting to ensure the stock
on hand not over purchase or out of stock.
REFERENCES
Ballou, R. H. (2004). Business logistics/Supply chain management : planning,
organizing, and controlling the Supply chain (5 ed.). Pearson Prentice Hall,
Upper Saddle River, N.J.
Bhatnagar, R. and Sohal, A.S., 2005. Supply chain competitiveness: measuring the
impact of location factors, uncertainty and manufacturing practices.
Technovation, 25 (5), 443–456.
Boonitt,S.,Pongpanarat,C.,2011. Measuring service supply chain management
processes: the application of the Q-sort technique. Int. J. Innov. Manag.
Technol. 2 (3),217–221.
Borodin, V., Bourtembourg, J., Hnaien, F., & Labadie, N. (2016). Handling
uncertainty in agricultural supply chain management: A state of the art.
European Journal of Operational Research, 254, 348-359.
Cho, D.W., Lee, Y.H., Ahn, S.H.,Hwang, M.K.,2012. A framework for measuring the
performance of service supply chain management. Comput.Ind.Eng.62, 801–
818.
Cronin, J.J.,Smith,J.S.,Gleim,M.R.,Ramirez,E.,Martinez,J.D.,2011.Green marketing
strategies: an examination of stake holders and the opportunities they
present.J.Acad.Mark.Sci.39(1),158–174.
Fisher, M.L., 1997. What is the right supply chain for your product? Harvard
Business Review, 75 (2), 105–116.
Gunasekaran, A., Patel, C., & Tirtiroglu, E. (2001). Performance measures and
metrics in a supply chain environment. International Journal of Operations &
Production Management, 21(1/2), 71-87.
Proceedings of the 2nd
Master Project Symposium
23
Guoa, C., Liua, X., Jina, M., & Lv, Z. (2016). The research on optimization of auto
supply chain network robust model under macroeconomic fluctuations. Chaos,
Solitons and Fractals, 89(105-114).
Higgins, A , Miller, C. , Archer, A. , Ton, T. , Fletcher, C. , & McAllister, R. (2010).
Challenges of operations research practice in agricultural value chains. Journal
of the Operational Research Society, 61 (6), 964–973 .
Hillson, D., 2006, Integrated risk management as a framework for organisational
success. In: PMI Global Congress proceedings, 2006, Seattle, WA.
Hult, G.T.M., Craighead, C.W., and Ketchen, D.J., 2010. Risk uncertainty and supply
chain decisions: a real options perspective. Decision Sciences, 41 (3), 435–458.
Jasti, N.V.K., Kodali, R., 2015. A critical review of lean supply chain management
frameworks: proposed framework. Prod. Plan. Control 26 (13), 1051–1068.
Keating,B.,Quazi,A.Q.,Kriz,A.,Coltman,T.,2008. In pursuit of a sustainable supply
chain: insights from Westpac Banking Corporation. Supply Chain Manag.: Int.J.
13(3),175–179.
Kotler, P., Armstrong, G, 2010. Principles of Marketing Prentice Hall, UK.
L.Nathans, L., Oswald, F. L., & Nimon, K. (2012). Interpreting Multiple Linear
Regression: A Guidebook of Variable Importance. Practical Assessment,
Research & Evaluation, 17(9), 1-19.
Lewis, J. C., & Naim, M. M. (1995). Benchmarking of after market supply chains.
International Journal of Production, Planning and Control, 6(3), 258-269.
López, L.,Zúñiga,R.,2014.Dynamicsofjudicialservicesupplychains.J.Bus.Res.671447–
1454.
Mentzer, J. T., DeWitt, W., Keebler, J. S., Min, S., Nix, N. W., Smith, C. D., &
Zacharia, Z. G. (2001). Defining Supply Chain Management Journal of
Business Logistics, 22(2).
Neely, A., Gregory, M., & Platts, K. (1995). Performance measurement systems
design: a literature review and research agenda. . International Journal of
Operations & Production Management, 15(4), 80-116.
Pasutham, A. (2012). Supply Chain Performance Measurement Framework: Case
Studies of Thai Manufacturers (Doctoral Thesis), Aston University
Birmingham.
Peck, H., 2006. Reconciling supply chain vulnerability, risk and supply chain
management. International Journal of Logistics: research and Applications, 9
(2), 127–142.
Ross, David Frederick (1998), Competing Through Supply Chain Management, New
York, NY:Chapman & Hall.
Simangunsong, E., Hendry, L. C., & Stevenson, M. (2012). Supply chain uncertainty:
a review and theoritical foundation for future research. International Journal of
Production Research, 50(16), 4493-4593.
Syntetos, A . A . , Babai, Z. , Boylan, J. E. , Kolassa, S. , & Nikolopoulos, K. (2016).
Supply chain forecasting: Theory, practice, their gap and the future. European
Journal of Operational Research, 252 (1), 1–26 .
Tan, K.-C., Kannan, V. R., Handfield, R. B., & Ghosh, S. (1999). Supply chain
management: an empirical study of its impact on performance. International
Journal of Operations & Production Management, 19(10), 1034-1052.
Vorst, J. G. A. J. v. d., & Beulens, A. J. M. (2002). Identifying sources of uncertainty
to generate supply chain redesign strategies. International Journal of Physical
Distribution & Logistics Management, 32(6), 409-430.

Proceedings of the 2nd
Master Project Symposium
24
Vorst, J. G. A. J. V. D., Beulens, A. J. M., Wit, W. D., & Beek, P. V. (1998). Supply
Chain Management in Foods Chains: Improving Performance by Reducing
Uncertainty. Information Systems in Logistics and Transportation, 5(6), 487-
499.
Wagner, S.M. and Bode, C., 2008. An empirical examination of supply chain
performance along several dimensions of risk. Journal of Business Logistics, 29
(1), 307–325.
Proceedings of the 2nd
Master Project Symposium
25
Factors Affecting the Decision in Providing
Training and Development in Small Medium
Sized Engineering Companies
Muhammad Asyraf Ibrahima and Raihana Mohdali
b
UTM Razak School of Engineering and Advanced Technology, Universiti Teknologi
Malaysia, Jalan Sultan Yahya Petra 54100 Kuala Lumpur, Malaysia
Abstract – One of the main factors identified for the death of small medium
enterprises (SMEs) within five years is due to the losing of talented human capital
that have the knowledge and skills gap due to the lack of training in the organization.
In other words, neglecting training and development in the organization do not only
affecting the employees but also the performance of the organization. The objective of
this study is to determine the factors affecting the management decision in providing
training and development for employees. This study employed qualitative method
namely face-to-face interviews with six respondents who are responsible for training
and development of the organization. The scope of study only focused on small
medium sized engineering company which includes engineering services and
manufacturing. It is found that there are two major factors namely regulatory
requirement and deficit and improvement of the performance. Other factors identified
are availability of resources, time, lack of suitable training, and requirement of
project and client. The limitation identified in this study is the information provided
by the respondents is limited and general. The findings of this study might help SMEs
and the authority that are monitoring the development of the SMEs in Malaysia to
strongly emphasize on the importance of training and development for the employees
of the organization in ensuring a stable growth of the industry.
Keywords: Training and development; Small and Medium-sized company
1.0 INTRODUCTION
Training and development is one of the main human resource functions. It plays an
important role to improve the effectiveness of the human capital in the organization
and consequently to contribute to a better performance of the organization. However,
the study by Cegos in 2015 showed that there was a decreasing trend of the number of
employees trained in the country from 93% to 85% (Ang, 2015). The report
highlighted Malaysia as to be out of sync with the developments of other Asia Pacific
countries in terms of the amount of corporate training provided by the organizations.
Countries such as Singapore and Australia showed an increase of four percent and
18% respectively in employees training, engagement between learning professionals
and learners and a collaboration and encouragement in learning culture.
The lack of training and development is evident in many organizations. Providing
training in developing human capital relates to the decision on investment particularly
Proceedings of the 2nd
Master Project Symposium
26
for small and medium enterprises (SME). According to market research, 55% of
SMEs do not survive over five years due to lose out on talent and human capital apart
from funding and poor finances (The Star, 2015). The talent shortage issues faced by
SMEs owners are due to training gap in the organization. The chief executive of
Human Resources Development Fund (HRDF), C.M. Vignaesvaran stated that this is
very common among Malaysian SMEs as most do not consider external training
program for their employees (Wong, 2016). In order to gain competitive advantage,
upskilling and reskilling of the talents are needed to meet the challenging demands of
the dynamic global business and trade. HRDF chief executive also stated that local
talents in this context will need to possess qualities that will help employers to
achieve global competitiveness and to be at par with their competitors as being
accentuated in the Eleventh Malaysia Plan.
Since training and development of human capital is vital to the organization’s
performance, it is interested to understand the factors that influence the management
decision in providing the training and development to the employee. The objective of
this study is to determine the factors affecting the management decision in providing
training and development for employees. This study only includes the Small and
Medium Enterprises (SMEs) that focused on the engineering sector specifically in
manufacturing and engineering services. The scale for manufacturing is based on the
sales turnover from RM300,000 to not exceeding RM50 million or employees from
five to not exceeding 200 and for services and other sectors is based on the sales
turnover from RM300,000 to not exceeding RM20 million or employees from five to
not exceeding 75 (Bank Negara Malaysia, 2013).
2.0 FACTORS AFFECTING THE MANAGEMENT DECISION IN
PROVIDING TRAINING AND DEVELOPMENT FOR EMPLOYEES
There are several factors identified in prior studies that affect the decision for the
organizations to provide training and development for their employees. Ae study on
factors affecting management decision in providing structured training and
development to employees which focused on SMEs identifies that the performance
deficits is one of the primary factors (Coetzer et al., 2012). Ridoutt et al. (2002) find
that concern of quality is one of the factors that relates to the productivity or
performance of the employee in several industries including manufacturing. Based on
a study conducted in Kenya, Atieno (2013) has also found the similar finding in a
hotel industry that training and development appear to be the major factor to enhance
productivity and improve performance of the organization.
Another factor which is apparent in prior studies is regulatory requirement by the
relevant authorities as clearly evident in a study conducted by Coetzer et al. (2012). In
a manufacturing industry, training does not only driven by the factors of concern of
quality, new or changed technology and change in work organization but also the
government licensing and regulation (Riddout et al., 2002).
Fund and budget allocation is also part of the factors that has been identified from the
literature. A study by Waziri et al. (2013) on public organizations in Tanzania finds
that the fund availability and allocation plays the important role to implement training
program in an organization. The finding of the study also indicates that insufficient
funds have caused staff to be provided with irrelevant training which does not support
their career advancement. Mndeme (2011) has also found that the shortage of training
Proceedings of the 2nd
Master Project Symposium
27
budget is one of the organization factors that affecting the training program
implementation in parastatal organizations in Tanzania and surprisingly, the training
for budget these organizations was clearly used for another business functions.
However, study by Kum et al. (2011) on Escon Consulting Firm find that only 10% of
the respondents agree that lack of resources affects training while 80 % of the
respondents disagreed that a lack of resources affects training and other 10% were
neutral on that matter.
Apart from that, lack of awareness on training and development program by
employees also affecting the decision to provide training and development by
organization. Awareness is found to be among the most significance factors in
implementing training and development in organizations (Waziri et al., 2013). Based
on a study conducted on SMEs by Coetzer et al. (2011), it is found that employees are
not proactive to strive for opportunity in training and development of the
organization. This is evident in a study conducted by Mndeme (2011), only 45.3% of
the respondents are aware on the existence of training programs in their company.
This probably shows the real attitude of the employees in self-developing their own
career path that probably leads to the management decision in offering training and
development programs for the organizations.
There are several other factors that have been identified from the literature. The
commitment of the management and time (Waziri et al., 2013), the need to match
employee specifications with the job requirements and stake holders (Atieno, 2013)
and fear of the employees to leave the company training and lack of suitable training
and development opportunities for employees (Coetzer et al., 2012) are among the
factors that have least influence on the management decision in providing training and
development for their employees.
3.0 RESEARCH METHODOLOGY
This study adopted qualitative study which involved face-to-face interviews. There
were six respondents from small and medium enterprises (SMEs) that only focused on
engineering companies specifically manufacturing and engineering services. The
selected respondents were the persons who are responsible for training and
development in the organization. The interview instrument was self-developed based
on relevant literatures. This instrument was used as guidance for the researcher to
ensure respondents provide the responses as required. During the interview sessions,
the information gathered were clarified by repeating the main ideas which help to
confirm the information given as well to offer opportunity for respondents to provide
any additional information. The duration of the interview sessions were in average of
one hour.
For data analysis, the procedure of the data analysis for qualitative research was
adopted based on Creswell (2013). The process of data analysis started with
transcribing the recorded information into text by the researcher. In order to better
organization of the data, it was checked, sorted and arrange based on the question.
The process of data analysis was then proceed with analyzing the converted data and
relevant information were collected. Next is the coding process where it involved with
grouping data into themes. The sentences, phrases or paragraphs were sorted into
codes, and codes were sorted into wider themes. The process continued with themes
were sorted into larger perspective. Certain terms are labelled to these themes based
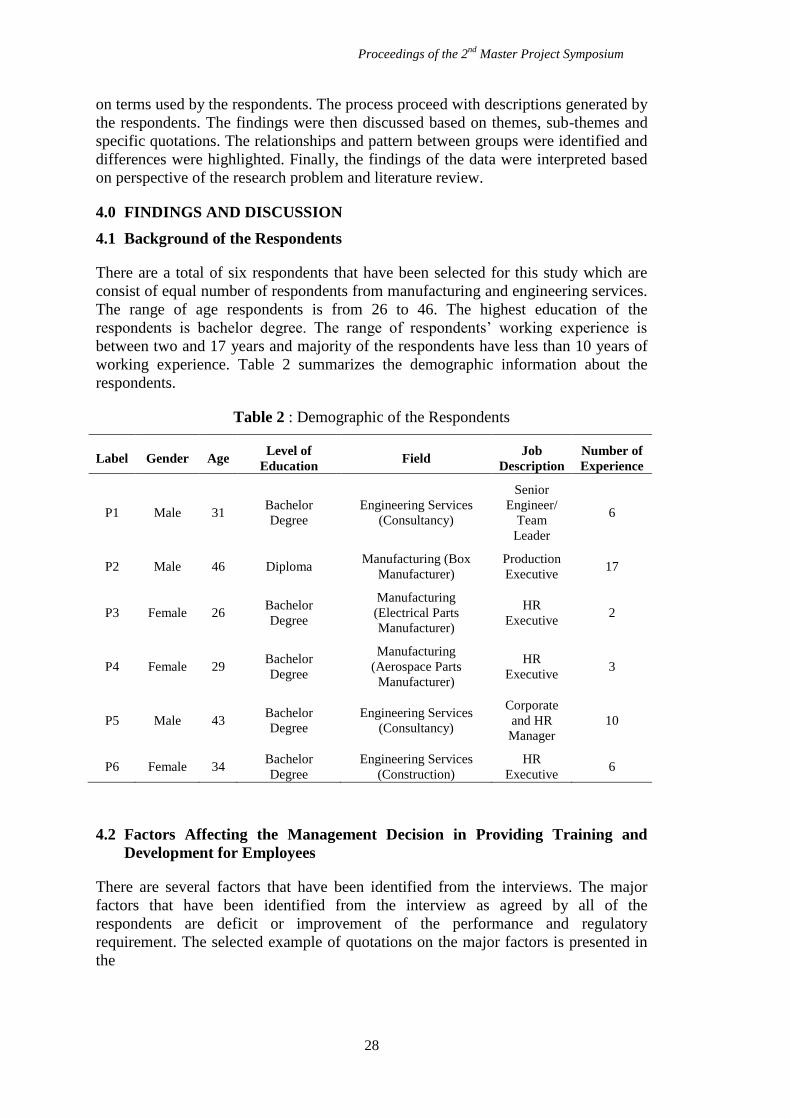
Proceedings of the 2nd
Master Project Symposium
28
on terms used by the respondents. The process proceed with descriptions generated by
the respondents. The findings were then discussed based on themes, sub-themes and
specific quotations. The relationships and pattern between groups were identified and
differences were highlighted. Finally, the findings of the data were interpreted based
on perspective of the research problem and literature review.
4.0 FINDINGS AND DISCUSSION
4.1 Background of the Respondents
There are a total of six respondents that have been selected for this study which are
consist of equal number of respondents from manufacturing and engineering services.
The range of age respondents is from 26 to 46. The highest education of the
respondents is bachelor degree. The range of respondents’ working experience is
between two and 17 years and majority of the respondents have less than 10 years of
working experience. Table 2 summarizes the demographic information about the
respondents.
Table 2 : Demographic of the Respondents
Label Gender Age Level of
Education Field
Job
Description
Number of
Experience
P1 Male 31 Bachelor
Degree
Engineering Services
(Consultancy)
Senior
Engineer/
Team
Leader
6
P2 Male 46 Diploma Manufacturing (Box
Manufacturer)
Production
Executive 17
P3 Female 26 Bachelor
Degree
Manufacturing
(Electrical Parts
Manufacturer)
HR
Executive 2
P4 Female 29 Bachelor
Degree
Manufacturing
(Aerospace Parts
Manufacturer)
HR
Executive 3
P5 Male 43 Bachelor
Degree
Engineering Services
(Consultancy)
Corporate
and HR
Manager
10
P6 Female 34 Bachelor
Degree
Engineering Services
(Construction)
HR
Executive 6
4.2 Factors Affecting the Management Decision in Providing Training and
Development for Employees
There are several factors that have been identified from the interviews. The major
factors that have been identified from the interview as agreed by all of the
respondents are deficit or improvement of the performance and regulatory
requirement. The selected example of quotations on the major factors is presented in
the
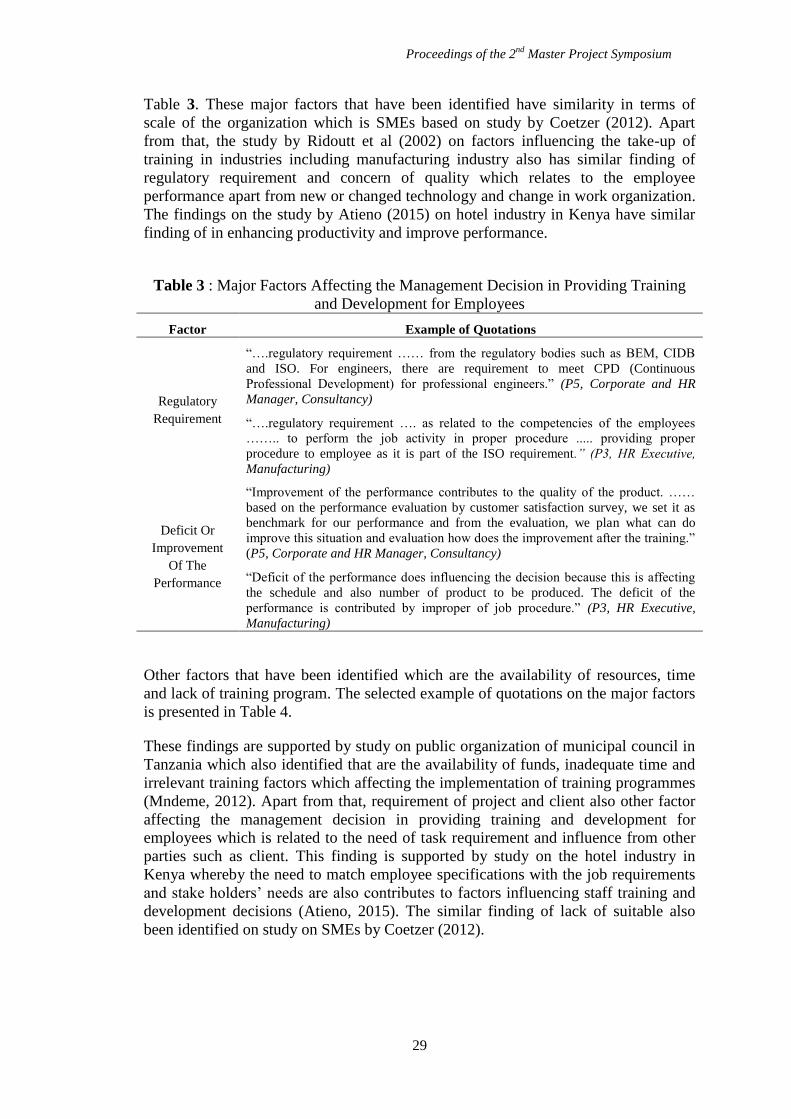
Proceedings of the 2nd
Master Project Symposium
29
Table 3. These major factors that have been identified have similarity in terms of
scale of the organization which is SMEs based on study by Coetzer (2012). Apart
from that, the study by Ridoutt et al (2002) on factors influencing the take-up of
training in industries including manufacturing industry also has similar finding of
regulatory requirement and concern of quality which relates to the employee
performance apart from new or changed technology and change in work organization.
The findings on the study by Atieno (2015) on hotel industry in Kenya have similar
finding of in enhancing productivity and improve performance.
Table 3 : Major Factors Affecting the Management Decision in Providing Training
and Development for Employees
Factor Example of Quotations
Regulatory
Requirement
“….regulatory requirement …… from the regulatory bodies such as BEM, CIDB
and ISO. For engineers, there are requirement to meet CPD (Continuous
Professional Development) for professional engineers.” (P5, Corporate and HR
Manager, Consultancy)
“….regulatory requirement …. as related to the competencies of the employees
…….. to perform the job activity in proper procedure ..... providing proper
procedure to employee as it is part of the ISO requirement.” (P3, HR Executive,
Manufacturing)
Deficit Or
Improvement
Of The
Performance
“Improvement of the performance contributes to the quality of the product. ……
based on the performance evaluation by customer satisfaction survey, we set it as
benchmark for our performance and from the evaluation, we plan what can do
improve this situation and evaluation how does the improvement after the training.”
(P5, Corporate and HR Manager, Consultancy)
“Deficit of the performance does influencing the decision because this is affecting
the schedule and also number of product to be produced. The deficit of the
performance is contributed by improper of job procedure.” (P3, HR Executive,
Manufacturing)
Other factors that have been identified which are the availability of resources, time
and lack of training program. The selected example of quotations on the major factors
is presented in Table 4.
These findings are supported by study on public organization of municipal council in
Tanzania which also identified that are the availability of funds, inadequate time and
irrelevant training factors which affecting the implementation of training programmes
(Mndeme, 2012). Apart from that, requirement of project and client also other factor
affecting the management decision in providing training and development for
employees which is related to the need of task requirement and influence from other
parties such as client. This finding is supported by study on the hotel industry in
Kenya whereby the need to match employee specifications with the job requirements
and stake holders’ needs are also contributes to factors influencing staff training and
development decisions (Atieno, 2015). The similar finding of lack of suitable also
been identified on study on SMEs by Coetzer (2012).
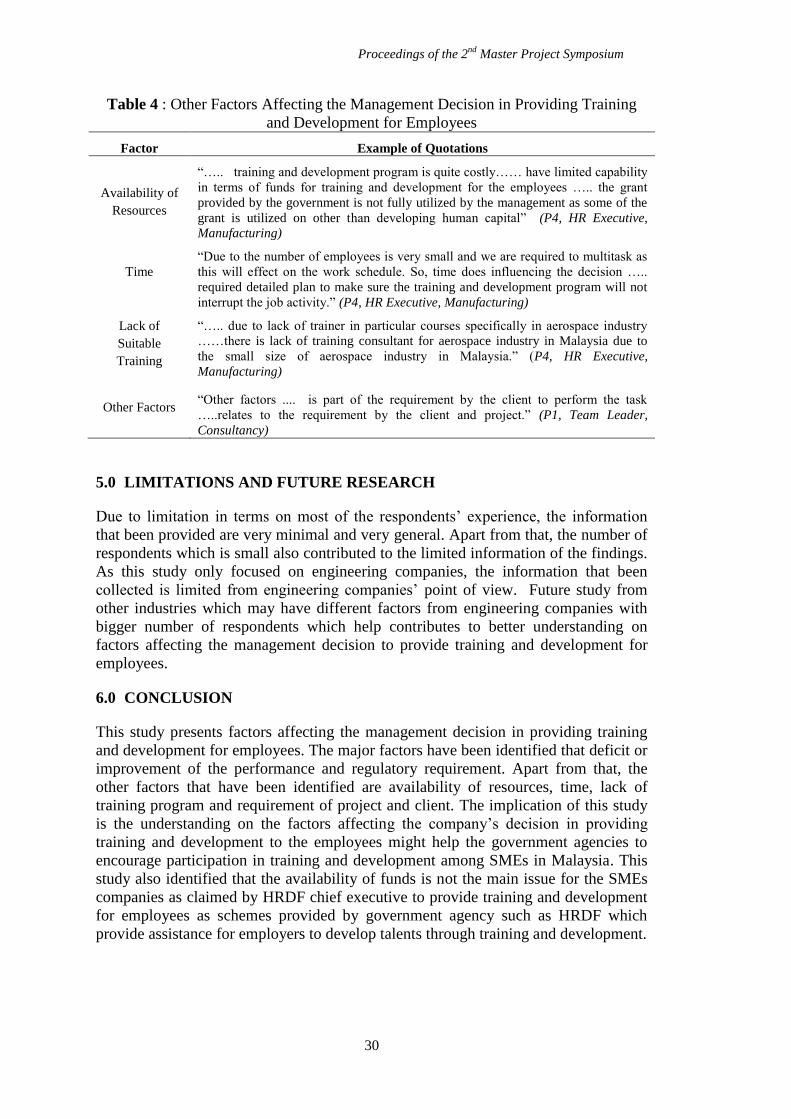
Proceedings of the 2nd
Master Project Symposium
30
Table 4 : Other Factors Affecting the Management Decision in Providing Training
and Development for Employees
Factor Example of Quotations
Availability of
Resources
“….. training and development program is quite costly…… have limited capability
in terms of funds for training and development for the employees ….. the grant
provided by the government is not fully utilized by the management as some of the
grant is utilized on other than developing human capital” (P4, HR Executive,
Manufacturing)
Time
“Due to the number of employees is very small and we are required to multitask as
this will effect on the work schedule. So, time does influencing the decision …..
required detailed plan to make sure the training and development program will not
interrupt the job activity.” (P4, HR Executive, Manufacturing)
Lack of
Suitable
Training
“….. due to lack of trainer in particular courses specifically in aerospace industry
……there is lack of training consultant for aerospace industry in Malaysia due to
the small size of aerospace industry in Malaysia.” (P4, HR Executive,
Manufacturing)
Other Factors “Other factors .... is part of the requirement by the client to perform the task
…..relates to the requirement by the client and project.” (P1, Team Leader,
Consultancy)
5.0 LIMITATIONS AND FUTURE RESEARCH
Due to limitation in terms on most of the respondents’ experience, the information
that been provided are very minimal and very general. Apart from that, the number of
respondents which is small also contributed to the limited information of the findings.
As this study only focused on engineering companies, the information that been
collected is limited from engineering companies’ point of view. Future study from
other industries which may have different factors from engineering companies with
bigger number of respondents which help contributes to better understanding on
factors affecting the management decision to provide training and development for
employees.
6.0 CONCLUSION
This study presents factors affecting the management decision in providing training
and development for employees. The major factors have been identified that deficit or
improvement of the performance and regulatory requirement. Apart from that, the
other factors that have been identified are availability of resources, time, lack of
training program and requirement of project and client. The implication of this study
is the understanding on the factors affecting the company’s decision in providing
training and development to the employees might help the government agencies to
encourage participation in training and development among SMEs in Malaysia. This
study also identified that the availability of funds is not the main issue for the SMEs
companies as claimed by HRDF chief executive to provide training and development
for employees as schemes provided by government agency such as HRDF which
provide assistance for employers to develop talents through training and development.
Proceedings of the 2nd
Master Project Symposium
31
REFERENCES
Ang, J. (2015, March 3). Employees in Malaysia are “desperate” for training.
Retrieved from http://www.humanresourcesonline.net/state-apac-workplace-
learning-positive-3-years/
Atieno, J. I. (2015). Factors influencing staff training and development decisions in
state-owned hotels in western Kenya (Doctoral dissertation, University of
Nairobi).
Bank Negara Malaysia, Development Finance and Enterprise Department . (2013).
Circular on New Definition of S mall and Medium Enterprises (SMEs).
Coetzer, A., Redmond, J., & Sharafizad, J. (2012). Decision making regarding access
to training and development in medium-sized enterprises: An exploratory
study using the Critical Incident Technique. European Journal of Training
and Development, 36(4), 426-447
Creswell, J. W. (2013). Research Design: Qualitative, Quantitative and Mixed
Methods Approaches. Thousand Oaks, CA: Sage Publications.
Kum, F. D., Cowden, R., & Karodia, A. M. (2014). The impact of training and
development on employee performance: A case study of ESCON Consulting.
Singaporean Journal of Business Economics and Management Studies, 3(3),
72-105.
Mndeme, I. S. (2011). Factors Limiting Effective Implementation Of Training
Programmes In Parastatal Organizations In Tanzania: A Case Study of
Tanzania Electric Supply Company Limited, Dar-Es-Salaam And Coast Zone
(Doctoral dissertation, OPEN UNIVERSITY OF TANZANIA).
Ridoutt, L., Hummel, K., Dutneall, R., & Smith, C. S. (2002). Factors influencing the
implementation of training and learning in the workplace. National Centre for
Vocational Education Research.
The Star, Train to be the best . (2015, July 27). The Star. Retrieved from
http://www.thestar.com.my/metro/smebiz/focus/2015/07/27/train-to-be-the-
best/
Waziri, F., & Stephen, T. (2013). Factors Influencing Implementation of Training
Programme in Public Organizations in Tanzania: The Study of Temeke
Municipal Council. Developing Country Studies, 3(10), 94-99.
Wong, J. (2016, May 1). Upskilling the Malaysian workforce. Borneo Post Online.
Retrieved from http://www.theborneopost.com/2016/05/01/upskilling-the-
malaysian-workforce/
Proceedings of the 2nd
Master Project Symposium
32
Critical Success Factors of Implementing
Knowledge Management at LK Edu Private
Tuition Center in Malaysia
Lim Seng Huata and Muhammad Fathi Yusof
b
UTM Razak School of Engineering and Advanced Technology, Universiti Teknologi
Malaysia, Jalan Sultan Yahya Petra 54100 Kuala Lumpur, Malaysia a,[email protected],
Abstract – This study is to identify critical success factors, analyze the benefits and
identifies the relationship between the critical success factors and perceived benefits
of implementing knowledge management at LK EDU private tuition center in
Malaysia. This study was conducted at one of the private tuition group, LK EDU,
which has 5 branches at Klang Valley. Data was collected by using distributing
questionnaires to 50 tutors at LK EDU and IBM SPSS for Windows version was used
for data analysis on this research. Critical success factor is independent variable, and
perceived benefits as dependent variable. Multiple regression method is used to
identify the relationship between the critical success factors and perceived benefits.
Keywords: Knowledge management, critical success factors, tuition centre
1.0 INTRODUCTION
New range of business improvement philosophies, approaches and methodologies
were continuously developed throughout the 1980s and 1990s. This development has
been largely focus on various combinations of business practice and academic theory.
There are many examples of these approaches organizational learning, the learning
organization, total quality management, business process reengineering. Knowledge
management has started to emerge as an area of interest in academia and
organizational practice in more recently (McAdam & McCreedy, 1999).
Conscious integration of people, processes and technology involved in designing,
capturing and implementing the intellectual infrastructure of an organization is
knowledge management approach (Petrides, 2004). The role of knowledge
management in the improvement of organizational competitive advantage through
sharing of best practices, achieving better decision making, and faster response to key
institutional issues, better process handling and improved people skills is important.
In this new economy, in order to innovate, and their ability to learn, adapt and change
become a core competency for survival, individuals and companies are obliged to
focus on maintaining and enhancing their knowledge capital (Bhusry & Ranjan,
2011).
Proceedings of the 2nd
Master Project Symposium
33
The Malaysia Ministry of Education (Education, 2015) issued a mission statement
reflecting the national aspiration: “To develop a world class quality education system
which will realize the full potential of the individual and fulfil the aspirations of the
Malaysian nation”. In Vision 2020, Malaysia wants to be a developed country in year
2020. It is importance change from an information society to a knowledge society
and finally to a value-based knowledge society.
The new era of the knowledge economy requires a workforce with a high level of skill
and educational attainment since 2000 onwards. Public institutions were upgraded to
accommodate increasing demand for places and the curriculum was reviewed to
increase the knowledge content. Besides that, public institutions also incorporate new
emerging technologies. To ensure parity with urban areas, teaching and learning
facilities and educational support services were expanded to rural area(Malaysia,
2001).
Despite of all the great competitiveness in this market, Malaysia has recorded a
number of 2,967 registered tuition centers in year 2010. The number of student who
enrolled in these tuition centers was approaching 200 thousand. The unregistered
home-based tuition center was not being reported in that figure. Thus, the actually
number of tuition center and students could be out of expectation. Furthermore, a
private tutor is believed to be able to earn an income from RM4 000 to RM10 000 a
month depending on his credibility and reputation. This offer is very much better than
a university fresh graduated, or even a manager of a company (Nair, 2012).
The objectives of the study are:
i. To analyze the benefits of implementing knowledge management at
LK EDU private tuition center in Malaysia.
ii. To identify critical success factors of implementing knowledge
management at LK EDU private tuition center in Malaysia.
iii. To identify the relationship between the critical success factors and
perceived benefits.
This study will focus on critical success factors of implementing KM at LK EDU
private tuition in Malaysia. By understanding critical success factors of implementing
KM, private tuition center will aware the importance of implementing KM in their
center’s current and future performance. Tuition center will put more attention on
those factors in order to perceived benefits of KM.
Knowledge management system (KMS) is useful to those tuition centers that are
planning to implement or already implementing. KMS will provide critical success
factors to be considered. Besides that, the relationship between KM benefits and
critical success factors of implementing KM may be useful in tuition center. Other
than that, the KMS in tuition center is advisable for the center to maintain and
catalyze their academic excellence.
The scope of the research is focus on private tuition center in Malaysia. This is
because most existing research on higher education institutions and not consider on
the needs of Private tuition center.
Proceedings of the 2nd
Master Project Symposium
34
2.0 KNOWLEDGE MANAGEMENT
According to Hossain and Yu (2004), shift in market skills of Malaysia moved from
an agricultural economy to an industrial economy, and then moves from the
industrial economy to an information economy and lastly to knowledge economy.
The critical success factor of implementation knowledge management are
organizational culture, top management leadership, technology, education and
training, tutor participation and teamwork. Organization culture was the largest
obstacle faced by organizations to create a successful knowledge-based enterprise
(Goh, 2002). Chase (1997), Goh (2002), Hasanali (2002), H. Lee and Choi (2003)
mention that organisation is the factor of implementation knowledge management.
Drucker (1995) mentioned that the foundation of effective leadership is thinking
through the organization’s mission, defining it and establishing it in order to manage
knowledge effectively. Based on the literature (Chase, 1997; F.Drucker, 1995; Goh,
2002; Kermally, 2002), top management leadership is critical success factor of
implementation knowledge management. There is a need for effective user support
and user education and training in order to make knowledge management successful
(Koenig, 2003; Kramer, Klebl, & Zobel, 2010). According to the literature (Choy,
2005; Syed, 2014; Weber & Weber, 2001), tutor participation and teamwork (Cohen
& Bailey, 1997; Greengard, 1998; Nonaka & Press., 1995) are critical success factor
of implementing knowledge management in an organization.
Refer to the literature (Alavi & Leidner, 2001; Averweg, 2012; Bhatt, 2001; S. M.
Lee & Hong, 2002; Luan & Serban, 2002; Wong & Aspinwall, 2003) if effectively
managed to augment knowledge sharing in the organization, technology plays an
important role. The benefit of implementation of knowledge management are cost
reduction (Becerra-Fernandez, Gonzalez, & Sabherwal, 2004; McAdam & McCreedy,
1999), increase the level of creativity and innovation (Becerra-Fernandez et al., 2004),
improve effectiveness and efficiency (McAdam & McCreedy, 1999), improve the
quality performance(Becerra-Fernandez et al., 2004; McAdam & McCreedy, 1999)
and increase the staff competencies(Becerra-Fernandez et al., 2004).
3.0 RESEARCH METHODOLOGY
The research design, approaches used and the rationale for selecting procedures,
methods and analysis techniques. This research consists of the following areas:
research design, data collection methods, and survey research and of design
questionnaires, pilot testing the questionnaire survey, sampling selection and
statistical analysis of data. There are six independent variables used in this research
which are organization cultural, top management leadership, technology, education
and training, tutor participation and teamwork to determine the critical success factors
of implementing knowledge management. The dependent variable for this research is
perceived benefit of knowledge management.
The quantitative approach was used by using questionnaire to collect the data in this
research paper to investigate the relationship between critical success factors of
knowledge management and the benefits of implementation knowledge management.
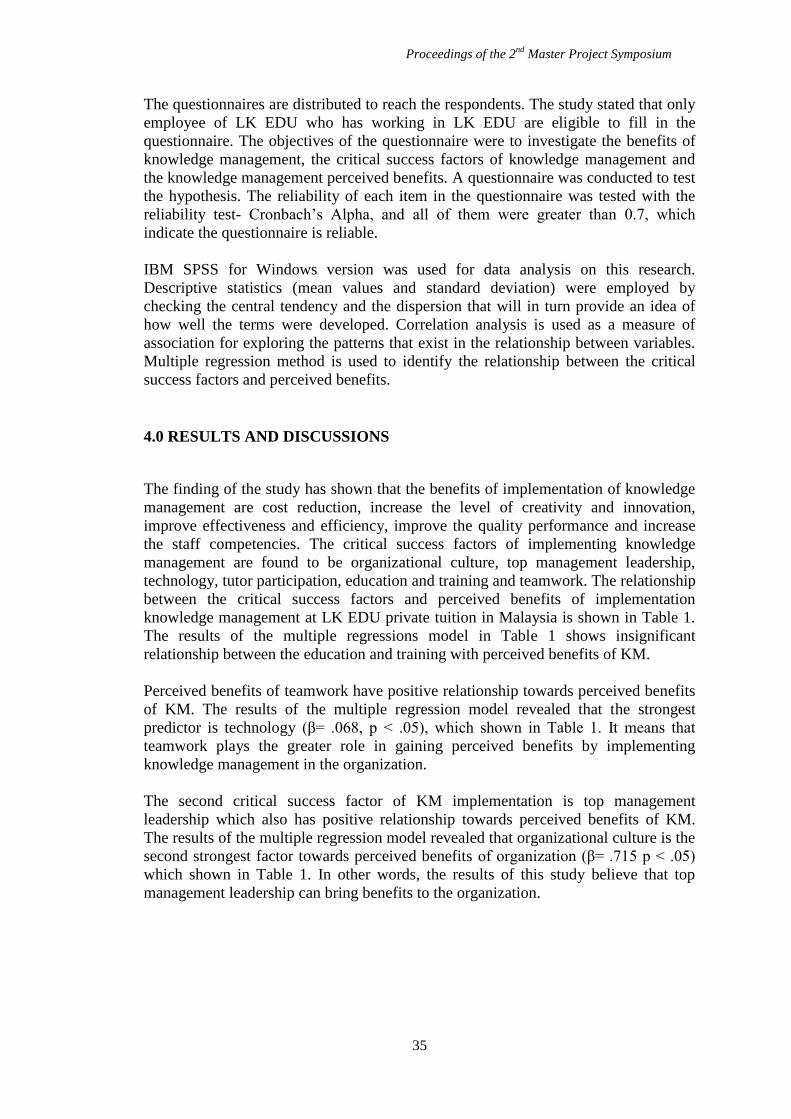
Proceedings of the 2nd
Master Project Symposium
35
The questionnaires are distributed to reach the respondents. The study stated that only
employee of LK EDU who has working in LK EDU are eligible to fill in the
questionnaire. The objectives of the questionnaire were to investigate the benefits of
knowledge management, the critical success factors of knowledge management and
the knowledge management perceived benefits. A questionnaire was conducted to test
the hypothesis. The reliability of each item in the questionnaire was tested with the
reliability test- Cronbach’s Alpha, and all of them were greater than 0.7, which
indicate the questionnaire is reliable.
IBM SPSS for Windows version was used for data analysis on this research.
Descriptive statistics (mean values and standard deviation) were employed by
checking the central tendency and the dispersion that will in turn provide an idea of
how well the terms were developed. Correlation analysis is used as a measure of
association for exploring the patterns that exist in the relationship between variables.
Multiple regression method is used to identify the relationship between the critical
success factors and perceived benefits.
4.0 RESULTS AND DISCUSSIONS
The finding of the study has shown that the benefits of implementation of knowledge
management are cost reduction, increase the level of creativity and innovation,
improve effectiveness and efficiency, improve the quality performance and increase
the staff competencies. The critical success factors of implementing knowledge
management are found to be organizational culture, top management leadership,
technology, tutor participation, education and training and teamwork. The relationship
between the critical success factors and perceived benefits of implementation
knowledge management at LK EDU private tuition in Malaysia is shown in Table 1.
The results of the multiple regressions model in Table 1 shows insignificant
relationship between the education and training with perceived benefits of KM.
Perceived benefits of teamwork have positive relationship towards perceived benefits
of KM. The results of the multiple regression model revealed that the strongest
predictor is technology (β= .068, p < .05), which shown in Table 1. It means that
teamwork plays the greater role in gaining perceived benefits by implementing
knowledge management in the organization.
The second critical success factor of KM implementation is top management
leadership which also has positive relationship towards perceived benefits of KM.
The results of the multiple regression model revealed that organizational culture is the
second strongest factor towards perceived benefits of organization (β= .715 p < .05)
which shown in Table 1. In other words, the results of this study believe that top
management leadership can bring benefits to the organization.
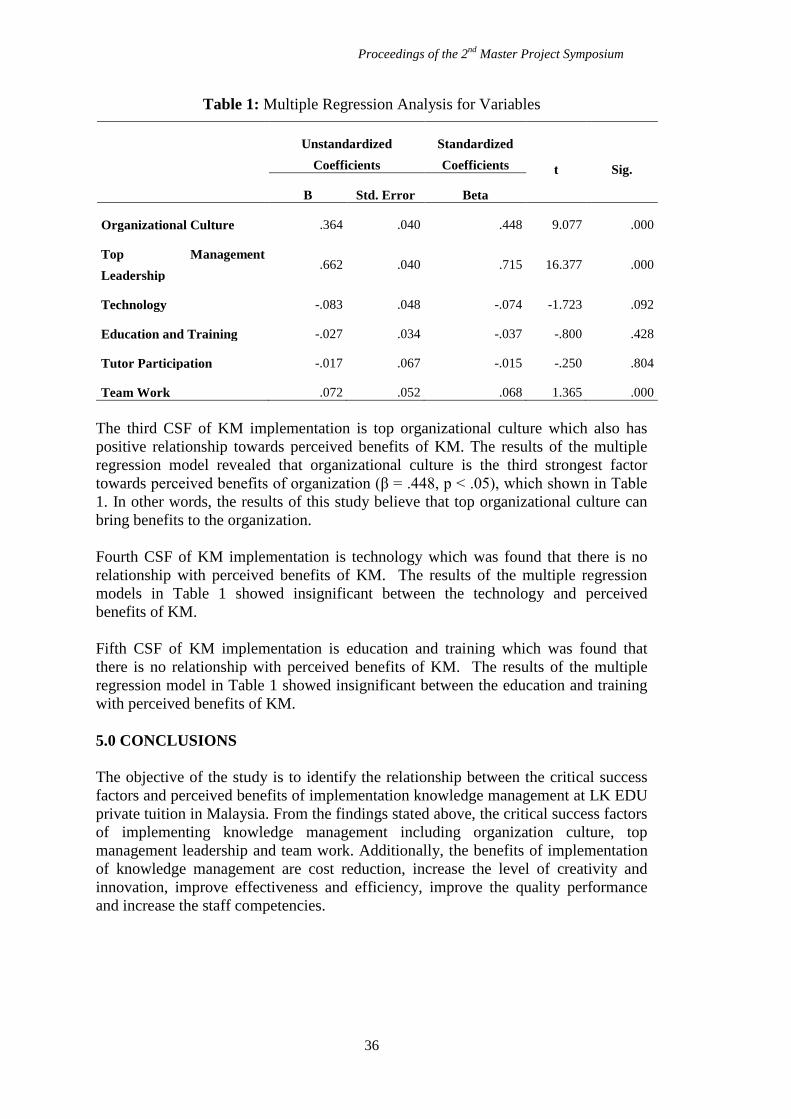
Proceedings of the 2nd
Master Project Symposium
36
Table 1: Multiple Regression Analysis for Variables
Unstandardized
Coefficients
Standardized
Coefficients t Sig.
B Std. Error Beta
Organizational Culture .364 .040 .448 9.077 .000
Top Management
Leadership .662 .040 .715 16.377 .000
Technology -.083 .048 -.074 -1.723 .092
Education and Training -.027 .034 -.037 -.800 .428
Tutor Participation -.017 .067 -.015 -.250 .804
Team Work .072 .052 .068 1.365 .000
The third CSF of KM implementation is top organizational culture which also has
positive relationship towards perceived benefits of KM. The results of the multiple
regression model revealed that organizational culture is the third strongest factor
towards perceived benefits of organization (β = .448, p < .05), which shown in Table
1. In other words, the results of this study believe that top organizational culture can
bring benefits to the organization.
Fourth CSF of KM implementation is technology which was found that there is no
relationship with perceived benefits of KM. The results of the multiple regression
models in Table 1 showed insignificant between the technology and perceived
benefits of KM.
Fifth CSF of KM implementation is education and training which was found that
there is no relationship with perceived benefits of KM. The results of the multiple
regression model in Table 1 showed insignificant between the education and training
with perceived benefits of KM.
5.0 CONCLUSIONS
The objective of the study is to identify the relationship between the critical success
factors and perceived benefits of implementation knowledge management at LK EDU
private tuition in Malaysia. From the findings stated above, the critical success factors
of implementing knowledge management including organization culture, top
management leadership and team work. Additionally, the benefits of implementation
of knowledge management are cost reduction, increase the level of creativity and
innovation, improve effectiveness and efficiency, improve the quality performance
and increase the staff competencies.
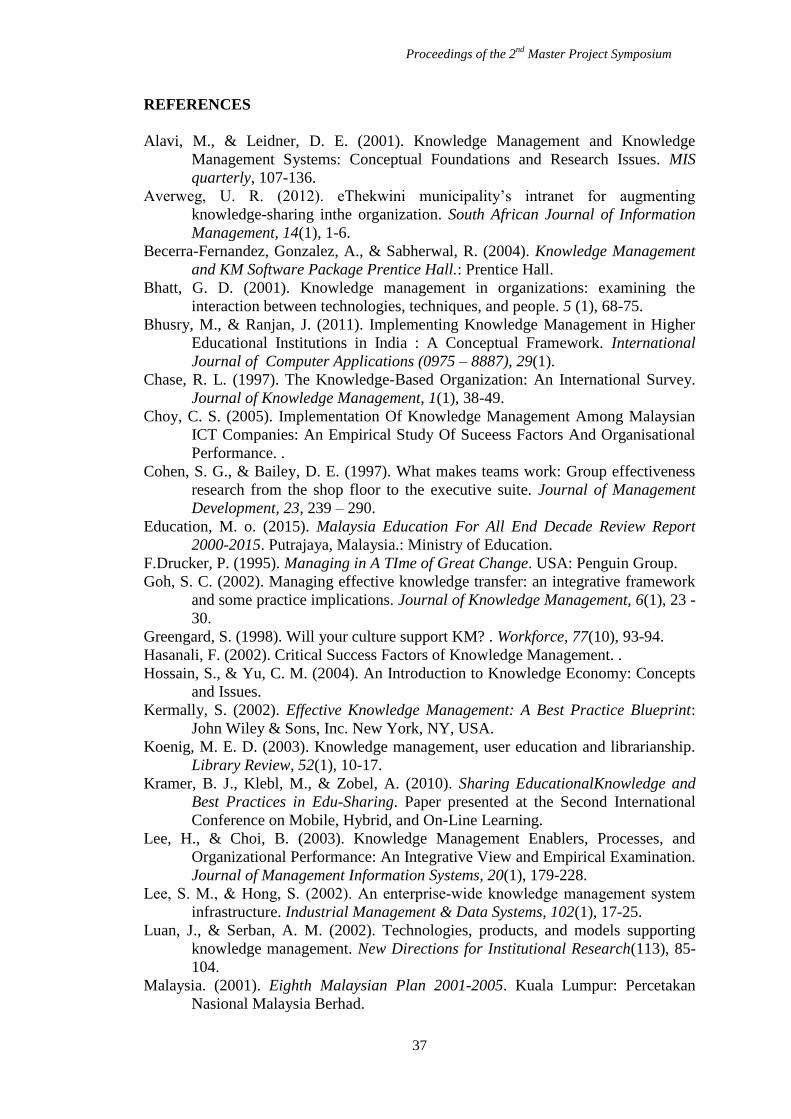
Proceedings of the 2nd
Master Project Symposium
37
REFERENCES
Alavi, M., & Leidner, D. E. (2001). Knowledge Management and Knowledge
Management Systems: Conceptual Foundations and Research Issues. MIS
quarterly, 107-136.
Averweg, U. R. (2012). eThekwini municipality’s intranet for augmenting
knowledge-sharing inthe organization. South African Journal of Information
Management, 14(1), 1-6.
Becerra-Fernandez, Gonzalez, A., & Sabherwal, R. (2004). Knowledge Management
and KM Software Package Prentice Hall.: Prentice Hall.
Bhatt, G. D. (2001). Knowledge management in organizations: examining the
interaction between technologies, techniques, and people. 5 (1), 68-75.
Bhusry, M., & Ranjan, J. (2011). Implementing Knowledge Management in Higher
Educational Institutions in India : A Conceptual Framework. International
Journal of Computer Applications (0975 – 8887), 29(1).
Chase, R. L. (1997). The Knowledge-Based Organization: An International Survey.
Journal of Knowledge Management, 1(1), 38-49.
Choy, C. S. (2005). Implementation Of Knowledge Management Among Malaysian
ICT Companies: An Empirical Study Of Suceess Factors And Organisational
Performance. .
Cohen, S. G., & Bailey, D. E. (1997). What makes teams work: Group effectiveness
research from the shop floor to the executive suite. Journal of Management
Development, 23, 239 – 290.
Education, M. o. (2015). Malaysia Education For All End Decade Review Report
2000-2015. Putrajaya, Malaysia.: Ministry of Education.
F.Drucker, P. (1995). Managing in A TIme of Great Change. USA: Penguin Group.
Goh, S. C. (2002). Managing effective knowledge transfer: an integrative framework
and some practice implications. Journal of Knowledge Management, 6(1), 23 -
30.
Greengard, S. (1998). Will your culture support KM? . Workforce, 77(10), 93-94.
Hasanali, F. (2002). Critical Success Factors of Knowledge Management. .
Hossain, S., & Yu, C. M. (2004). An Introduction to Knowledge Economy: Concepts
and Issues.
Kermally, S. (2002). Effective Knowledge Management: A Best Practice Blueprint:
John Wiley & Sons, Inc. New York, NY, USA.
Koenig, M. E. D. (2003). Knowledge management, user education and librarianship.
Library Review, 52(1), 10-17.
Kramer, B. J., Klebl, M., & Zobel, A. (2010). Sharing EducationalKnowledge and
Best Practices in Edu-Sharing. Paper presented at the Second International
Conference on Mobile, Hybrid, and On-Line Learning.
Lee, H., & Choi, B. (2003). Knowledge Management Enablers, Processes, and
Organizational Performance: An Integrative View and Empirical Examination.
Journal of Management Information Systems, 20(1), 179-228.
Lee, S. M., & Hong, S. (2002). An enterprise‐wide knowledge management system
infrastructure. Industrial Management & Data Systems, 102(1), 17-25.
Luan, J., & Serban, A. M. (2002). Technologies, products, and models supporting
knowledge management. New Directions for Institutional Research(113), 85-
104.
Malaysia. (2001). Eighth Malaysian Plan 2001-2005. Kuala Lumpur: Percetakan
Nasional Malaysia Berhad.
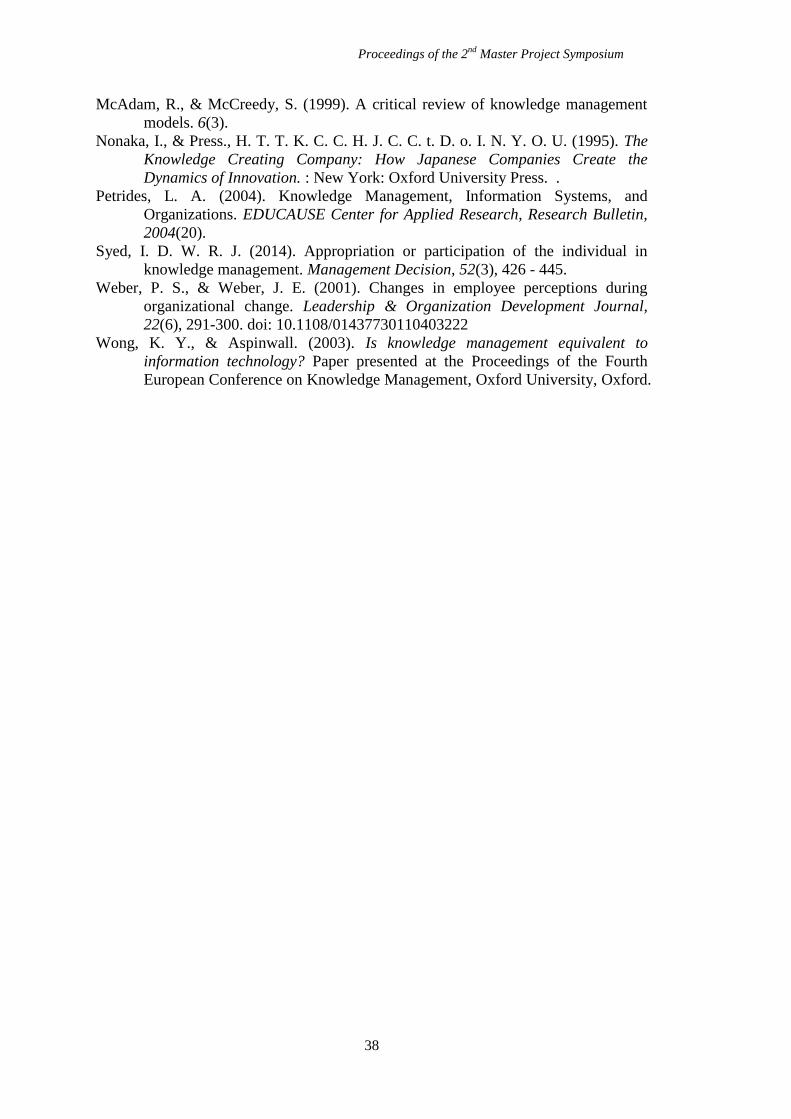
Proceedings of the 2nd
Master Project Symposium
38
McAdam, R., & McCreedy, S. (1999). A critical review of knowledge management
models. 6(3).
Nonaka, I., & Press., H. T. T. K. C. C. H. J. C. C. t. D. o. I. N. Y. O. U. (1995). The
Knowledge Creating Company: How Japanese Companies Create the
Dynamics of Innovation. : New York: Oxford University Press. .
Petrides, L. A. (2004). Knowledge Management, Information Systems, and
Organizations. EDUCAUSE Center for Applied Research, Research Bulletin,
2004(20).
Syed, I. D. W. R. J. (2014). Appropriation or participation of the individual in
knowledge management. Management Decision, 52(3), 426 - 445.
Weber, P. S., & Weber, J. E. (2001). Changes in employee perceptions during
organizational change. Leadership & Organization Development Journal,
22(6), 291-300. doi: 10.1108/01437730110403222
Wong, K. Y., & Aspinwall. (2003). Is knowledge management equivalent to
information technology? Paper presented at the Proceedings of the Fourth
European Conference on Knowledge Management, Oxford University, Oxford.

Proceedings of the 2nd
Master Project Symposium
39
Organizational Commitment towards Job
Satisfaction in an Oil and Gas Company in
Sarawak
Mohammad Syafril Bahara
and Hayati Habibah Abdul Talibb
UTM Razak School of Engineering and Advanced Technology, Universiti Teknologi
Malaysia, 54100, Kuala Lumpur, Malaysia a,
[email protected], [email protected]
Abstract – Oil and Gas Industry is consider as dying industry with many employees
were retrenched, relocated and restructured due to the vastly dropped of crude oil
price. Most companies required to explore a preferred method to ensure the
competent one is retained. Prior studies suggested that the one who have better
intuition towards remain in the same company have better understanding on
organizational commitment thus increase their job satisfaction. This paper explores
organizational commitment relationship towards job satisfaction among staffs in an
oil and gas company in Sarawak, Malaysia. The questionnaire containing 7
demographic questions, 62 survey items (instruments: Organizational Commitment
Questionnaire, Job Satisfaction Survey, and two pre-determined answer questions)
hosted by the researcher were distributed among staffs in Engineering Department of
the Company. Only affective commitment was significant and positively related to all
aspects of job satisfaction, while normative commitment was only negatively related
on one aspects (operating conditions) and continuance commitment on three aspects
(operating conditions, promotion, and nature of work) of job satisfaction. The most
rewarding aspect of job satisfaction as a staffs in the company was “Pay” (47
responses), and the most frustrating aspect was “operating conditions” (16
responses).
Keywords: Affective Commitment, Continuance Commitment, Normative Commitment, Job
Satisfaction, Organizational Commitment, Oil and Gas
1.0 INTRODUCTION
The price of crude oil was significantly dropped from US$80 per barrel to US$30 per
barrel and this trending was not seen in over a long time. This sudden and trending
fall has had recondite a chain of effect on the entire oil and gas industry all around the
world. This cause all of the oil and gas companies in all over the world was highly
impacted in terms of financial, mostly. These matters required companies to perform
downsizing which includes of restructured, retrenchment and most of the employees
were letting go. From the company point of view, little specific method is known to
retain the one whom have a better commitment towards organization. Due to current
situation occurred where unstable of crude oil price and forecasting for the next 5
years will be maintain low, many who retained are prefer to go for other industries
Proceedings of the 2nd
Master Project Symposium
40
such as manufacturing, construction, automobile and many more. This caused the
inclined of turnover intention among employees. To encounter this problem, the
researcher believe that knowing the organizational commitment relationship towards
job satisfaction among staffs are vital at this point to ensure Human Resource
Management (HRM) retaining the skilled and experience ones with the lowest
turnover intention.
Many researches have been organized in the area of behaviour in organization related
to work ethics such as job satisfaction, organizational commitment and organizational
culture (Harun & Salleh, 2014). The important of organizational commitment was
emerged because of its association with the role behaviour or behaviour outside of its
character in any organization such as absenteeism (Nagar, 2012). According to
Okpara (2004), they explained that the variables most general used is organizational
commitment as precedents to anticipate job satisfaction which shown less determine
of turnover intention.
2.0 LITERATURE REVIEW
2.1 Organizational Commitment
Organizational commitment refers to attitude and emotion attached to the mission and
vision of an organization, to employee’s role, involvement, and identification in an
organization (Okpara, 2004). In basis, an appraisal of the conformity between an
employees’ own values and beliefs are aspects to measure organizational commitment
of employees in the organization. Individual’s willingness to commit to organizational
goals is one of the characteristics of organizational commitment. When employees are
provided with opportunity to learn and grow, significantly they perceived
commitment to remain in their current organization is higher (Swailes, 2002).
According to Ayeni (2007), commitment is “a relation and connection of the
employee to the organization with multidimensional construct”. Different pattern can
be taken by commitment and can be controlled at distinctive constituencies in
particular organization. Organizational commitment also can be divided into three
elements: affective, continuance and normative.
2.2 Job Satisfaction
Job satisfaction is a complex construct and describe as a personal’s feeling, evaluative
and affective impacts towards employee job. Many researches are present which link
the job satisfaction with turnover intentions (Abraham, 1999). Job satisfaction and
organizational commitment are the most important subjects in the research of job-
related perspective (Kontoghiorghes & Bryant, 2004). Job satisfaction can be classify
using a one-dimensional model for overall job satisfaction or a multidimensional
model capturing the independent aspects that influence the emotional state of job
satisfaction. The different aspects are independent and should be measured separately
to capture the degree of influence each has on job satisfaction. Hylton (2014) utilized
seven subscales to measure independent aspects of job satisfaction which are pay,
promotion, supervision, fringe benefits, contingent rewards, operating conditions, co-
workers, nature of work, and communication.
The relationship of organizational commitment towards job satisfaction and turnover
intention are more supported by many studies which perceive organizational
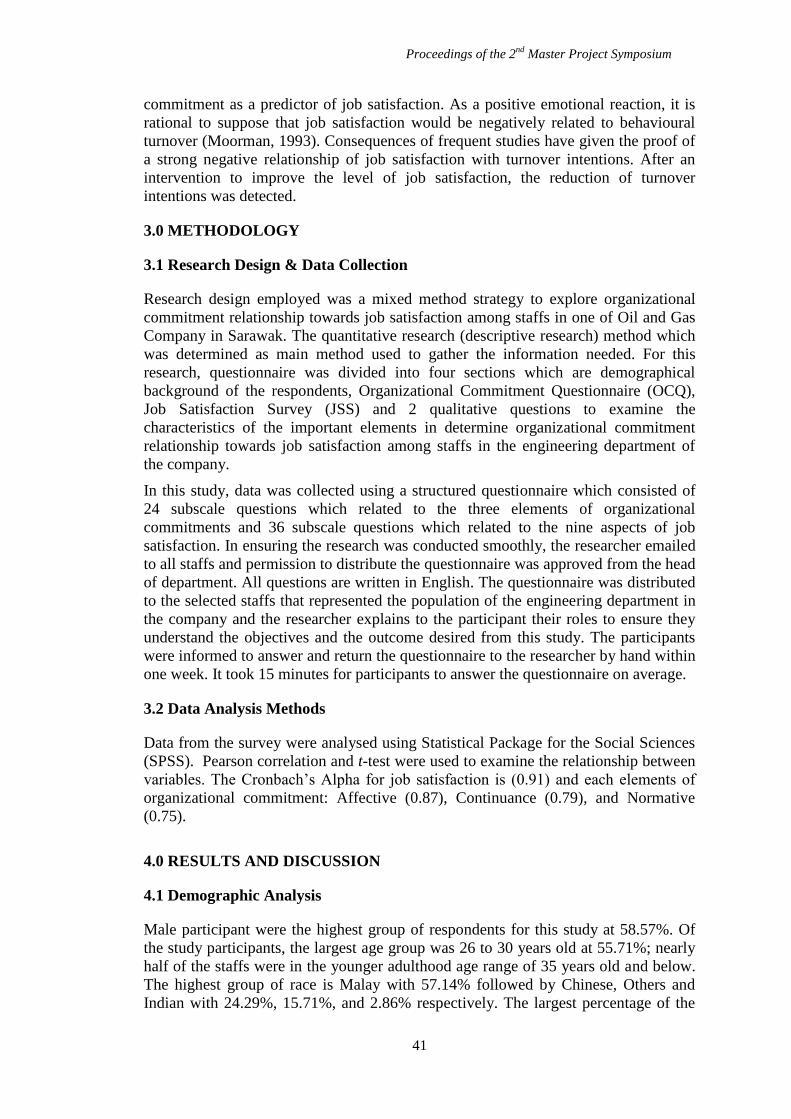
Proceedings of the 2nd
Master Project Symposium
41
commitment as a predictor of job satisfaction. As a positive emotional reaction, it is
rational to suppose that job satisfaction would be negatively related to behavioural
turnover (Moorman, 1993). Consequences of frequent studies have given the proof of
a strong negative relationship of job satisfaction with turnover intentions. After an
intervention to improve the level of job satisfaction, the reduction of turnover
intentions was detected.
3.0 METHODOLOGY
3.1 Research Design & Data Collection
Research design employed was a mixed method strategy to explore organizational
commitment relationship towards job satisfaction among staffs in one of Oil and Gas
Company in Sarawak. The quantitative research (descriptive research) method which
was determined as main method used to gather the information needed. For this
research, questionnaire was divided into four sections which are demographical
background of the respondents, Organizational Commitment Questionnaire (OCQ),
Job Satisfaction Survey (JSS) and 2 qualitative questions to examine the
characteristics of the important elements in determine organizational commitment
relationship towards job satisfaction among staffs in the engineering department of
the company.
In this study, data was collected using a structured questionnaire which consisted of
24 subscale questions which related to the three elements of organizational
commitments and 36 subscale questions which related to the nine aspects of job
satisfaction. In ensuring the research was conducted smoothly, the researcher emailed
to all staffs and permission to distribute the questionnaire was approved from the head
of department. All questions are written in English. The questionnaire was distributed
to the selected staffs that represented the population of the engineering department in
the company and the researcher explains to the participant their roles to ensure they
understand the objectives and the outcome desired from this study. The participants
were informed to answer and return the questionnaire to the researcher by hand within
one week. It took 15 minutes for participants to answer the questionnaire on average.
3.2 Data Analysis Methods
Data from the survey were analysed using Statistical Package for the Social Sciences
(SPSS). Pearson correlation and t-test were used to examine the relationship between
variables. The Cronbach’s Alpha for job satisfaction is (0.91) and each elements of
organizational commitment: Affective (0.87), Continuance (0.79), and Normative
(0.75).
4.0 RESULTS AND DISCUSSION
4.1 Demographic Analysis
Male participant were the highest group of respondents for this study at 58.57%. Of
the study participants, the largest age group was 26 to 30 years old at 55.71%; nearly
half of the staffs were in the younger adulthood age range of 35 years old and below.
The highest group of race is Malay with 57.14% followed by Chinese, Others and
Indian with 24.29%, 15.71%, and 2.86% respectively. The largest percentage of the
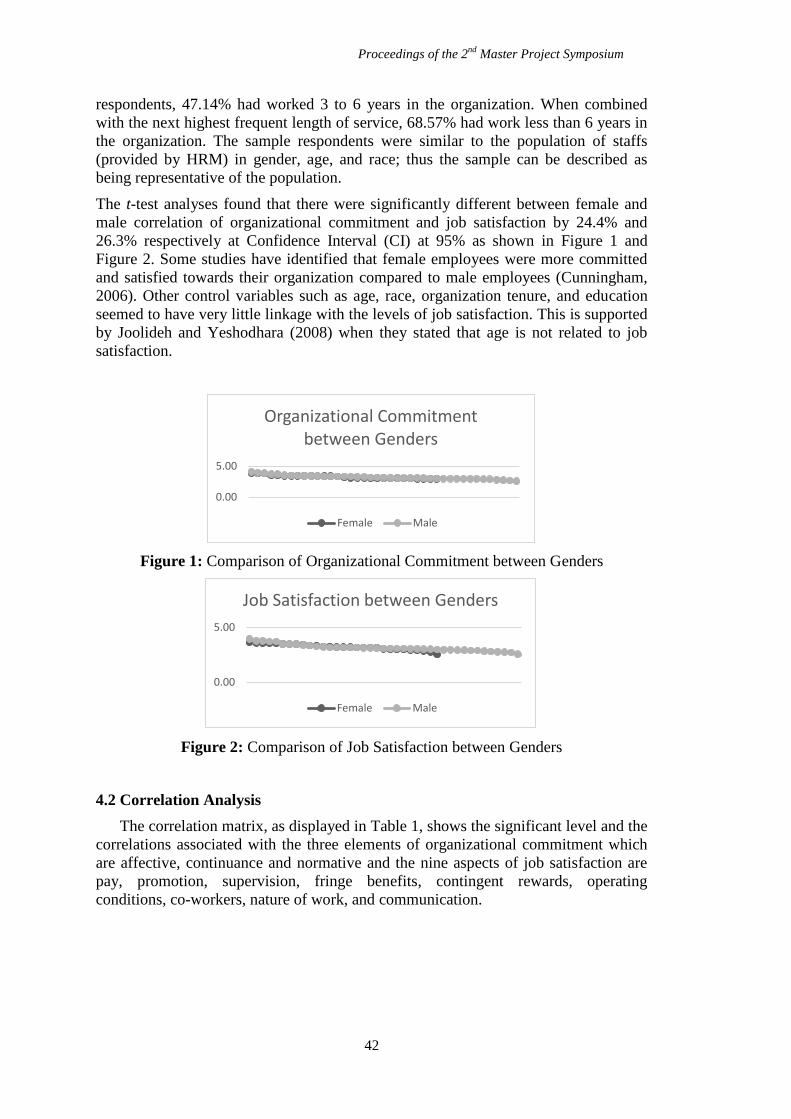
Proceedings of the 2nd
Master Project Symposium
42
respondents, 47.14% had worked 3 to 6 years in the organization. When combined
with the next highest frequent length of service, 68.57% had work less than 6 years in
the organization. The sample respondents were similar to the population of staffs
(provided by HRM) in gender, age, and race; thus the sample can be described as
being representative of the population.
The t-test analyses found that there were significantly different between female and
male correlation of organizational commitment and job satisfaction by 24.4% and
26.3% respectively at Confidence Interval (CI) at 95% as shown in Figure 1 and
Figure 2. Some studies have identified that female employees were more committed
and satisfied towards their organization compared to male employees (Cunningham,
2006). Other control variables such as age, race, organization tenure, and education
seemed to have very little linkage with the levels of job satisfaction. This is supported
by Joolideh and Yeshodhara (2008) when they stated that age is not related to job
satisfaction.
Figure 1: Comparison of Organizational Commitment between Genders
Figure 2: Comparison of Job Satisfaction between Genders
4.2 Correlation Analysis
The correlation matrix, as displayed in Table 1, shows the significant level and the
correlations associated with the three elements of organizational commitment which
are affective, continuance and normative and the nine aspects of job satisfaction are
pay, promotion, supervision, fringe benefits, contingent rewards, operating
conditions, co-workers, nature of work, and communication.
0.00
5.00
Organizational Commitment between Genders
Female Male
0.00
5.00
Job Satisfaction between Genders
Female Male
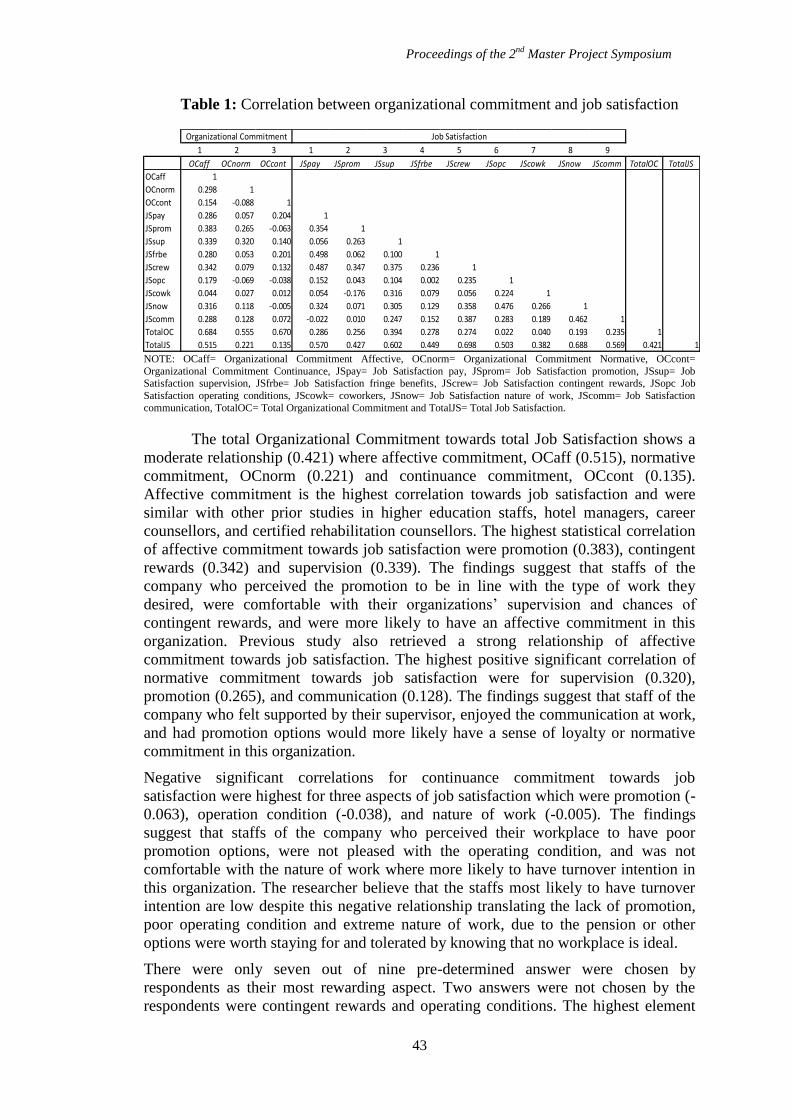
Proceedings of the 2nd
Master Project Symposium
43
Table 1: Correlation between organizational commitment and job satisfaction
NOTE: OCaff= Organizational Commitment Affective, OCnorm= Organizational Commitment Normative, OCcont=
Organizational Commitment Continuance, JSpay= Job Satisfaction pay, JSprom= Job Satisfaction promotion, JSsup= Job Satisfaction supervision, JSfrbe= Job Satisfaction fringe benefits, JScrew= Job Satisfaction contingent rewards, JSopc Job
Satisfaction operating conditions, JScowk= coworkers, JSnow= Job Satisfaction nature of work, JScomm= Job Satisfaction
communication, TotalOC= Total Organizational Commitment and TotalJS= Total Job Satisfaction.
The total Organizational Commitment towards total Job Satisfaction shows a
moderate relationship (0.421) where affective commitment, OCaff (0.515), normative
commitment, OCnorm (0.221) and continuance commitment, OCcont (0.135).
Affective commitment is the highest correlation towards job satisfaction and were
similar with other prior studies in higher education staffs, hotel managers, career
counsellors, and certified rehabilitation counsellors. The highest statistical correlation
of affective commitment towards job satisfaction were promotion (0.383), contingent
rewards (0.342) and supervision (0.339). The findings suggest that staffs of the
company who perceived the promotion to be in line with the type of work they
desired, were comfortable with their organizations’ supervision and chances of
contingent rewards, and were more likely to have an affective commitment in this
organization. Previous study also retrieved a strong relationship of affective
commitment towards job satisfaction. The highest positive significant correlation of
normative commitment towards job satisfaction were for supervision (0.320),
promotion (0.265), and communication (0.128). The findings suggest that staff of the
company who felt supported by their supervisor, enjoyed the communication at work,
and had promotion options would more likely have a sense of loyalty or normative
commitment in this organization.
Negative significant correlations for continuance commitment towards job
satisfaction were highest for three aspects of job satisfaction which were promotion (-
0.063), operation condition (-0.038), and nature of work (-0.005). The findings
suggest that staffs of the company who perceived their workplace to have poor
promotion options, were not pleased with the operating condition, and was not
comfortable with the nature of work where more likely to have turnover intention in
this organization. The researcher believe that the staffs most likely to have turnover
intention are low despite this negative relationship translating the lack of promotion,
poor operating condition and extreme nature of work, due to the pension or other
options were worth staying for and tolerated by knowing that no workplace is ideal.
There were only seven out of nine pre-determined answer were chosen by
respondents as their most rewarding aspect. Two answers were not chosen by the
respondents were contingent rewards and operating conditions. The highest element
1 2 3 1 2 3 4 5 6 7 8 9
OCaff OCnorm OCcont JSpay JSprom JSsup JSfrbe JScrew JSopc JScowk JSnow JScomm TotalOC TotalJS
OCaff 1
OCnorm 0.298 1
OCcont 0.154 -0.088 1
JSpay 0.286 0.057 0.204 1
JSprom 0.383 0.265 -0.063 0.354 1
JSsup 0.339 0.320 0.140 0.056 0.263 1
JSfrbe 0.280 0.053 0.201 0.498 0.062 0.100 1
JScrew 0.342 0.079 0.132 0.487 0.347 0.375 0.236 1
JSopc 0.179 -0.069 -0.038 0.152 0.043 0.104 0.002 0.235 1
JScowk 0.044 0.027 0.012 0.054 -0.176 0.316 0.079 0.056 0.224 1
JSnow 0.316 0.118 -0.005 0.324 0.071 0.305 0.129 0.358 0.476 0.266 1
JScomm 0.288 0.128 0.072 -0.022 0.010 0.247 0.152 0.387 0.283 0.189 0.462 1
TotalOC 0.684 0.555 0.670 0.286 0.256 0.394 0.278 0.274 0.022 0.040 0.193 0.235 1
TotalJS 0.515 0.221 0.135 0.570 0.427 0.602 0.449 0.698 0.503 0.382 0.688 0.569 0.421 1
Organizational Commitment Job Satisfaction
Proceedings of the 2nd
Master Project Symposium
44
of job satisfaction was chosen as rewarding aspect by respondents is pay followed by
nature of work and co-workers. All of nine pre-determined answer were chosen by
respondents as their most frustrating aspect. The highest element of job satisfaction
was chosen as frustrating aspect by respondents is operating conditions followed by
supervision and nature of work.
The findings indicated that the staffs had moderate relationship between
organizational commitments towards job satisfaction. Based on the observations, the
type of jobs the staffs did and their workplace environment may have contributed to
this finding. As results suggested that there were several aspects that shall be focusing
on by management to ensure the improvement of organizational commitment to
increase job satisfaction. For example, staffs perceived that promotion as one of the
important aspect because they are fully understand and aware of the requirement to
get promoted which are to close gaps in technical assessment, attending skill group
trainings, and achieve good rating in Key Performance Indicator (KPI). Little not
agree with this requirement because they felt that some of the topics to close gap in
technical assessment were not related with the work they did and KPI rating was not
always translating the job done. In addition supervision also contributed as one of the
important aspect perceived by staffs in the company. By providing the learning
opportunities of skill development for technical managers may have implication on
the organizational commitment and job satisfaction among staffs in the company.
5.0 CONCLUSION
This paper presents an inclusive review on organizational commitment relationship
towards job satisfaction among staffs in an oil and gas company. Through survey
conducted, it was prevalent that there were significant and positively organizational
commitment relationship towards job satisfaction among staffs. The incorporation of
improving organizational commitment of staffs in the company would be important
step in addressing the job satisfaction among them. The admixture of the results of the
relationship could be part of the company success planning, employee policies, staffs
training and development, and operating procedures of the oil and gas company.
REFERENCES
Harun, H. and Salleh, R. “Job Satisfaction, Organizational Commitment and Stress
among Offshore Oil and Gas Platform Employees.” Asian Social Science Vol.
10, No. 11 (2014).
Nagar, K. “Organizational Commitment and Job Satisfaction among teachers.” Times
of Burnout, VIKALPA Vol. 3, No. 2, (2012): 43-60.
Okpara, J.O. “Job Satisfaction and Organizational Commitment: Are there
Differences between American and Nigerian managers employed?” Academy of
Business & Administrative Sciences, Briarcliffe College, Switzerland (2004).
Swailes, S. “Organizational commitment: A Critique of the Construct and Measures.”
International Journal of management Reviews Vol. 4, No. 2 (2002): 155-178.
Ayeni, C.O. and Phopola, S.O. “Work Motivation, Job Satisfaction, and
Organizational Commitment of Library Personnel in Academic and Research
Libraries in Oyo State, Nigeria.” Library Philosophy and Practice (2007).
Proceedings of the 2nd
Master Project Symposium
45
Abraham, R. “The Impact of Emotional Dissonance on Organizational Commitment
and Intention to Turnover.” The Journal of Psychology Vol. 133, No. 4 (1999):
441-55.
Kontoghiorghes, C. and Bryant, N. “Exploring Employee Commitment in a Service
Organization in the Health Care Insurance Industry.” Organization
Development Journal Vol. 22, No. 3 (2004): 59-73.
Hylton, T. E. “The Relationship between Job Satisfactions, Organizational
Commitment, and Turnover Intent among Certified Rehabilitation Counselors”.
Michigan State University, Michigan (2014).
Moorman, R. H. et al. “Treating Employees Fairly and Organizational Citizenship
Behaviour: Sorting the Effects of Job Satisfaction, Organizational Commitment
and Procedural Justice.” Employee Responsibilities and Rights Vol. 6, No. 3
(1993): 484-489.
Cunningham, G. B. “The Relationships among Commitment to Change, Coping with
Change, and Turnover Intentions.” European Journal of Work and
Organizational Psychology Vol. 15, No. 1 (2006): 29-45.
Joolideh F. and Yeshodhara K. “Organizational Commitment among High School
Teacher of India and Iran.” Journal of Educational Administration Vol. 47,
No.1, (2008): 127-136.
Proceedings of the 2nd
Master Project Symposium
46
Project Delays Monitoring in Ministry of
Health of Malaysia
Ahmad Al-Muhaymin Abd Wahab1,a
and Rahimah Muhamad2,b
1Unit Urus Setia Dan Kewangan, Bahagian Pengurusan Sumber Manusia. Wisma
Pertahanan, Kementerian Pertahanan Malaysia, Jalan Padang Tembak, 50634 Kuala
Lumpur, Malaysia 2UTM Razak School of Engineering and Advanced Technology, Universiti Teknologi
Malaysia, Jalan Sultan Yahya Petra, 54100 Kuala Lumpur, Malaysia [email protected],
Abstract – Construction delays are considered as the time overrun in the project completion
from the project milestone as per contract. Project delays can occur due to many factors
involving client or owner, consultants, contractors and third party. Construction delays
affects government development planning and spending in the 5 year Malaysia Plans to
provide efficient public facilities and infrastructures. In the Fourth Rolling Plan of the Tenth
Malaysia Plan (10th MP), RM1.797 billion was allocated to the Ministry of Health Malaysia
(MOH) for 376 projects such as building hospitals and clinics. Such tremendous budget was
to ensure the smooth sailing of the projects implementation. This research attempts to
investigate and study the causes of project delays and project monitoring practices in the
Ministry of Health (MOH) during 10th Malaysia Plan. To investigate the factors of
construction delays and project monitoring practices in MOH, a structured questionnaire
survey was distributed to 77 respondents from MOH, Public Work Department (PWD),
Implementation Coordination Unit, Prime Minister’s Department (ICU JPM), consultants
and contractors. Data analysis was carried out by using frequency analysis based on the
respondents profile and Average Index (AI) to determine the delay factors and the degree of
significance of each factor. The result showed that 25 of the 26 factors of construction delay
are significant. Current project monitoring procedures and tools implemented by MOH, PWD
and ICU JPM are still relevant and effective but need to be constantly improved.
Keywords: Factors, Construction delay, Project monitoring, Government, Ministry of Health,
Malaysia
1.0 INTRODUCTION
Construction industry in Malaysia is growing rapidly and has become an integral
component of the country’s economic development. In general, Malaysian
construction industry is primarily driven by the expansion of local economic activities
(Hamzah et al., 2012). The Malaysian Government is identified as the biggest client
in the construction industry focusing mainly on the building of public facilities and
infrastructures such as schools, hospitals, clinics, public housings and roads. Under
the Ninth Malaysia Plan (9th
MP), 78% or RM179 billion from RM230 billion total
budget allocation was allocated for the implementation of physical projects.
Subsequently, 60% or RM138 billion from RM230 billion budget allocation was
allocated to implement physical projects under the 10th
MP (JPM, 2010).
Proceedings of the 2nd
Master Project Symposium
47
However, the construction industry in Malaysia always constantly faced with delays
problem during implementation. The factors involved in the construction delays
include client, contractors, consultants, resources and external factors. In Malaysia, a
study had identified 24 causes of delay identified in construction industries (Hamzah
et al., 2012) while another study pointed out 130 causes of delay which were divided
into 31 different categories (Tawil et al., 2014). Another research to investigate a
government project delay in Kedah grouped the delay causes into seven categories
(Othman & Ismail, 2014).
Similarly, project delays also occur in other countries like Ghana, Jordan and
Pakistan. A research by Frank D.K. Fugar and Adwoa B. Agyyakwah-Baah
concluded that clients, consultants and contractors are the most influential factors of
the 32 delay factors identified in construction projects in Ghana (Fugar & Agyakwah-
baah, 2010). In Jordan, a study identified 55 delay causes but stated that only 22 delay
causes were significant to the projects performance (Samarah & A.Bekr, 2016). In
construction industry of Pakistan, another study concluded that there were 20 delay
causes which the researchers then grouped into six main delay categories: clients,
contractors, consultants, contract, project condition and external factors (Haseeb et al.,
2011).
Construction project delays can be expressed as the time overrun, or extension of time
behind the date agreed upon by the contract parties (Samarah & A.Bekr, 2016).
Another study concluded that respondents shared similar opinion that delay means
deviation from the originally planned period (Riazi et al., 2013). According to ICU
JPM, project delay is defined as project delayed for more than one month. Sick
project is defined as project delayed more than two months from planned schedule
and the contractors are unable to complete the project (JPM, 2015). Generally, project
delay is defined as project delayed in certain period as compared to the original
schedule or agreed contract period.
The objectives of this study are to investigate the causes of MOH construction project
delays under the 10th
Malaysia Plan and to evaluate current monitoring practices of
MOH projects. Based on the findings, this study will recommend some measures to
improve the current construction monitoring practices of the Ministry of Health
(MOH). This research is mainly focused on the factors of construction delays and
project monitoring in MOH. The researcher chooses to focus on MOH as previous
studies were only focussed on project delays in government sector in general but not
on specific agency. Additionally, the nature of MOH projects is also different from
other government agencies because of the project scope and specifications. This
research attempts to investigate and understand the causes of construction delays and
project monitoring in MOH. In achieving this aim, it is necessary to thoroughly
review the existing reports from the various agency, journal, research and government
circular.
2.0 CONSTRUCTION DELAYS IN MINISTRY OF HEALTH (MOH)
Over the five years of the 10th MP implementation since 2011, a total of 11, 997
projects were implemented over various stages. By the end of 31 December 2015,
however, only 9,017 projects managed to be completed while 2,890 projects were still
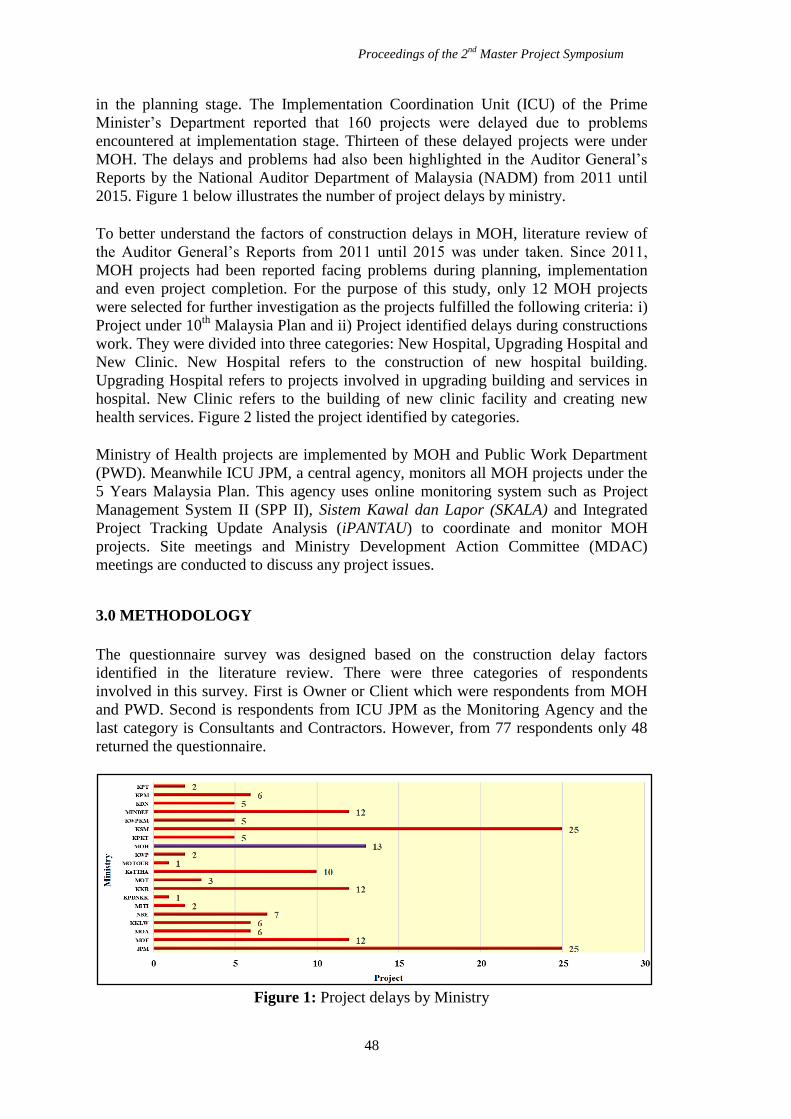
Proceedings of the 2nd
Master Project Symposium
48
in the planning stage. The Implementation Coordination Unit (ICU) of the Prime
Minister’s Department reported that 160 projects were delayed due to problems
encountered at implementation stage. Thirteen of these delayed projects were under
MOH. The delays and problems had also been highlighted in the Auditor General’s
Reports by the National Auditor Department of Malaysia (NADM) from 2011 until
2015. Figure 1 below illustrates the number of project delays by ministry.
To better understand the factors of construction delays in MOH, literature review of
the Auditor General’s Reports from 2011 until 2015 was under taken. Since 2011,
MOH projects had been reported facing problems during planning, implementation
and even project completion. For the purpose of this study, only 12 MOH projects
were selected for further investigation as the projects fulfilled the following criteria: i)
Project under 10th
Malaysia Plan and ii) Project identified delays during constructions
work. They were divided into three categories: New Hospital, Upgrading Hospital and
New Clinic. New Hospital refers to the construction of new hospital building.
Upgrading Hospital refers to projects involved in upgrading building and services in
hospital. New Clinic refers to the building of new clinic facility and creating new
health services. Figure 2 listed the project identified by categories.
Ministry of Health projects are implemented by MOH and Public Work Department
(PWD). Meanwhile ICU JPM, a central agency, monitors all MOH projects under the
5 Years Malaysia Plan. This agency uses online monitoring system such as Project
Management System II (SPP II), Sistem Kawal dan Lapor (SKALA) and Integrated
Project Tracking Update Analysis (iPANTAU) to coordinate and monitor MOH
projects. Site meetings and Ministry Development Action Committee (MDAC)
meetings are conducted to discuss any project issues.
3.0 METHODOLOGY
The questionnaire survey was designed based on the construction delay factors
identified in the literature review. There were three categories of respondents
involved in this survey. First is Owner or Client which were respondents from MOH
and PWD. Second is respondents from ICU JPM as the Monitoring Agency and the
last category is Consultants and Contractors. However, from 77 respondents only 48
returned the questionnaire.
Figure 1: Project delays by Ministry
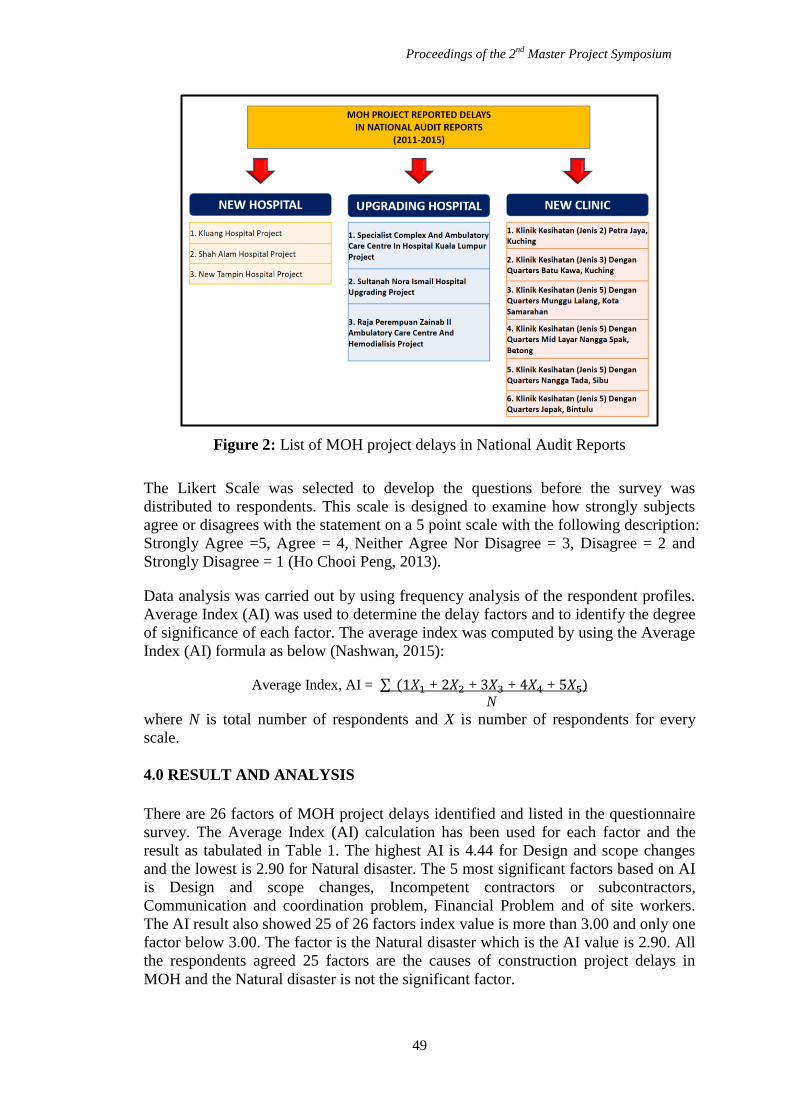
Proceedings of the 2nd
Master Project Symposium
49
Figure 2: List of MOH project delays in National Audit Reports
The Likert Scale was selected to develop the questions before the survey was
distributed to respondents. This scale is designed to examine how strongly subjects
agree or disagrees with the statement on a 5 point scale with the following description:
Strongly Agree =5, Agree = 4, Neither Agree Nor Disagree = 3, Disagree = 2 and
Strongly Disagree = 1 (Ho Chooi Peng, 2013).
Data analysis was carried out by using frequency analysis of the respondent profiles.
Average Index (AI) was used to determine the delay factors and to identify the degree
of significance of each factor. The average index was computed by using the Average
Index (AI) formula as below (Nashwan, 2015):
Average Index, AI = ∑ (1𝑋1 + 2𝑋2 + 3𝑋3 + 4𝑋4 + 5𝑋5)
N
where N is total number of respondents and X is number of respondents for every
scale.
4.0 RESULT AND ANALYSIS
There are 26 factors of MOH project delays identified and listed in the questionnaire
survey. The Average Index (AI) calculation has been used for each factor and the
result as tabulated in Table 1. The highest AI is 4.44 for Design and scope changes
and the lowest is 2.90 for Natural disaster. The 5 most significant factors based on AI
is Design and scope changes, Incompetent contractors or subcontractors,
Communication and coordination problem, Financial Problem and of site workers.
The AI result also showed 25 of 26 factors index value is more than 3.00 and only one
factor below 3.00. The factor is the Natural disaster which is the AI value is 2.90. All
the respondents agreed 25 factors are the causes of construction project delays in
MOH and the Natural disaster is not the significant factor.
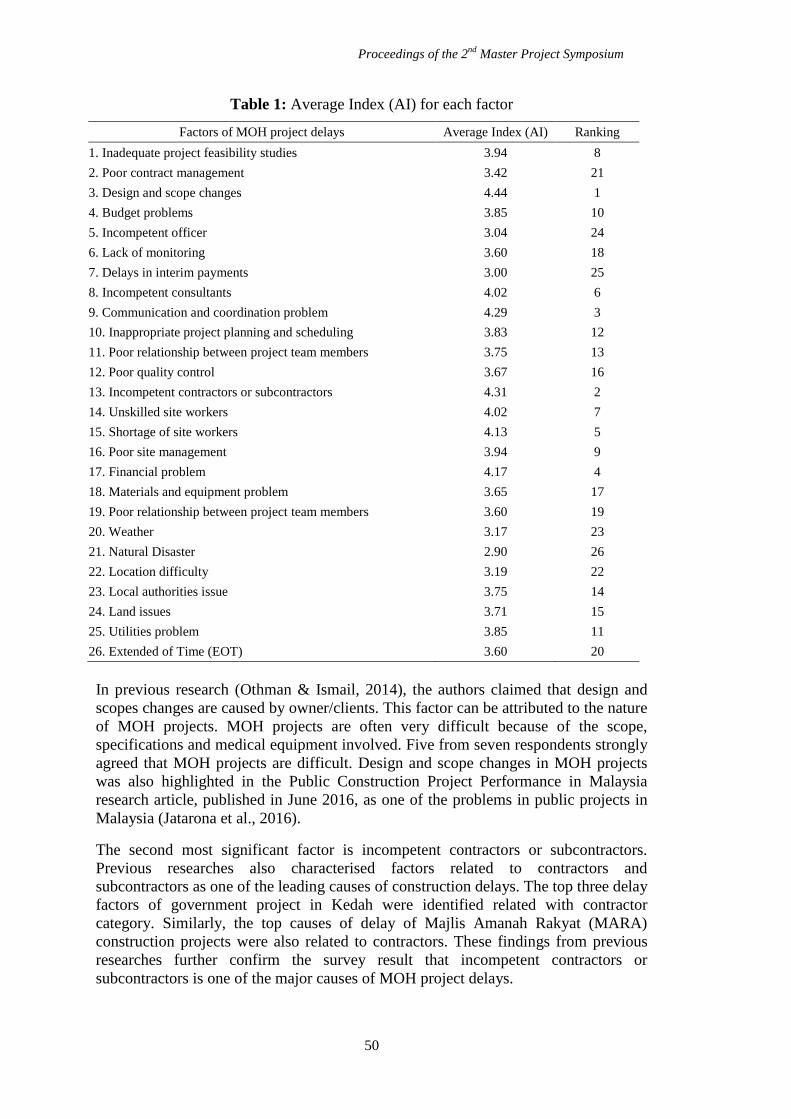
Proceedings of the 2nd
Master Project Symposium
50
Table 1: Average Index (AI) for each factor
Factors of MOH project delays Average Index (AI) Ranking
1. Inadequate project feasibility studies 3.94 8
2. Poor contract management 3.42 21
3. Design and scope changes 4.44 1
4. Budget problems 3.85 10
5. Incompetent officer 3.04 24
6. Lack of monitoring 3.60 18
7. Delays in interim payments 3.00 25
8. Incompetent consultants 4.02 6
9. Communication and coordination problem 4.29 3
10. Inappropriate project planning and scheduling 3.83 12
11. Poor relationship between project team members 3.75 13
12. Poor quality control 3.67 16
13. Incompetent contractors or subcontractors 4.31 2
14. Unskilled site workers 4.02 7
15. Shortage of site workers 4.13 5
16. Poor site management 3.94 9
17. Financial problem 4.17 4
18. Materials and equipment problem 3.65 17
19. Poor relationship between project team members 3.60 19
20. Weather 3.17 23
21. Natural Disaster 2.90 26
22. Location difficulty 3.19 22
23. Local authorities issue 3.75 14
24. Land issues 3.71 15
25. Utilities problem 3.85 11
26. Extended of Time (EOT) 3.60 20
In previous research (Othman & Ismail, 2014), the authors claimed that design and
scopes changes are caused by owner/clients. This factor can be attributed to the nature
of MOH projects. MOH projects are often very difficult because of the scope,
specifications and medical equipment involved. Five from seven respondents strongly
agreed that MOH projects are difficult. Design and scope changes in MOH projects
was also highlighted in the Public Construction Project Performance in Malaysia
research article, published in June 2016, as one of the problems in public projects in
Malaysia (Jatarona et al., 2016).
The second most significant factor is incompetent contractors or subcontractors.
Previous researches also characterised factors related to contractors and
subcontractors as one of the leading causes of construction delays. The top three delay
factors of government project in Kedah were identified related with contractor
category. Similarly, the top causes of delay of Majlis Amanah Rakyat (MARA)
construction projects were also related to contractors. These findings from previous
researches further confirm the survey result that incompetent contractors or
subcontractors is one of the major causes of MOH project delays.
Proceedings of the 2nd
Master Project Symposium
51
Based on the findings in this study, the top ten construction delay factors in MOH
projects are: 1) Design and Scope Change, 2) Incompetent contractors or
subcontractors, 3) Communication and coordination problem, 4) Financial problems,
5) Shortage of site workers, 6) Incompetent consultants, 7) Unskilled site workers, 8)
Inadequate project feasibility studies, 9) Poor site management and 10) Budget
problem. Six out of the ten factors fall under consultant and contractor category.
Meanwhile, the other four factors are under client or owner category. As a conclusion,
the construction delays in MOH are predominantly caused by client/owner, consultant
and contractor. In order to overcome this, a combined effort involving all parties is
crucial to troubleshoot problems during MOH project implementation and improve
monitoring activity.
Results from Section C and D of the questionnaire survey that focused on MOH
project monitoring aspects are shown in Table 2 and Table 3, respectively. Section C
has eight questions and Section D has seven questions. Section C was answered by
respondents from MOH, PWD and ICU JPM. Meanwhile, Section D was answered by
respondents from consultants and contractors category. MOH and PWD are grouped
into client category and ICU JPM is a monitoring agency. These sections are very
important in measuring the respondents’ awareness of current project monitoring
practices in MOH and to identify if improvement actions by government are needed.
As seen in Table 2, the highest AI of 4.20 indicates that the immediate actions have
been taken to ensure MOH projects back on schedule. The lowest AI of 2.85 shows
that the current practices for monitoring MOH projects are outdated. Although
respondents agreed that the monitoring agencies take immediate actions to ensure
MOH projects are back on schedule, the agencies have a difficulties to execute the
action. Also, the agencies have proper project monitoring practices, current online
project monitoring tools and meeting platform are still relevant and effective. The
cooperation between government agencies to monitor the MOH project issues
statement is also agreed by respondents with an AI of 3.76. However, the AI for
respondents on understanding about government procedures in project monitoring is
second lowest that is 3.33. Respondents are ought to understand and familiarise
themselves with the procedures and the agencies which are MOH, PWD and ICU
JPM need to give serious attention to this matter.
Table 3 shows the consultants and contractors give their feedback regarding on the
monitoring aspect of MOH projects. Only seven respondents from consultants and
contractors gave their feedback that is 14.58% from 48 respondents. The highest AI of
4.86 shows that the respondents follow a proper procedure to monitor MOH projects
during construction. Majority of respondents agreed with a proper monitoring
procedures by Gantt chart and site diary. The AI for MOH and the agencies in
assisting the consultants and contractors during project implementation is indicates as
4.71. The same AI of 4.57 are obtained for MOH and government agencies to
improve their system of project monitoring procedures. Although the average scores
of AI in Table 3 is found significantly higher for monitoring the project, their systems
monitoring procedures need to be updated. Respondents also aware that MOH
projects are very difficult because of project scopes, specifications and medical
equipment with an average of 4.14. The lowest average of 3.86 is significantly shows
that the respondents disagreed with the issues of project quality are due to the failure
monitoring by the consultants and contractors.
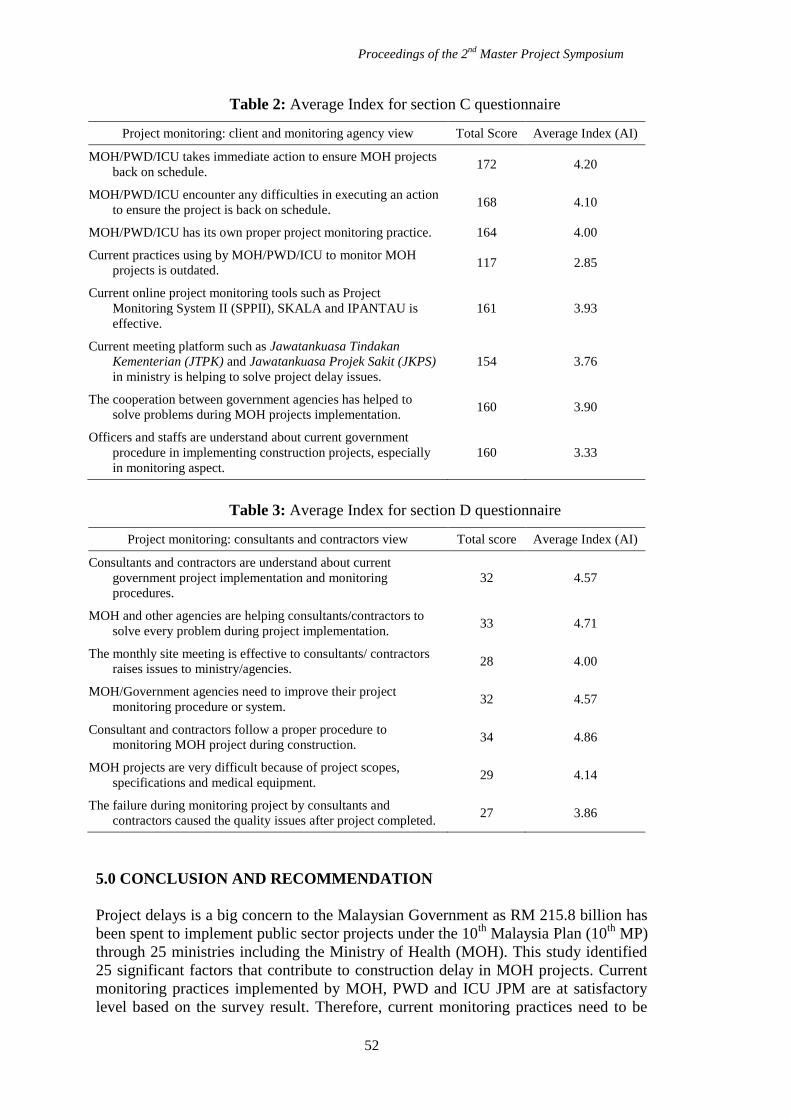
Proceedings of the 2nd
Master Project Symposium
52
Table 2: Average Index for section C questionnaire
Project monitoring: client and monitoring agency view Total Score Average Index (AI)
MOH/PWD/ICU takes immediate action to ensure MOH projects
back on schedule. 172 4.20
MOH/PWD/ICU encounter any difficulties in executing an action
to ensure the project is back on schedule. 168 4.10
MOH/PWD/ICU has its own proper project monitoring practice. 164 4.00
Current practices using by MOH/PWD/ICU to monitor MOH
projects is outdated. 117 2.85
Current online project monitoring tools such as Project
Monitoring System II (SPPII), SKALA and IPANTAU is
effective.
161 3.93
Current meeting platform such as Jawatankuasa Tindakan
Kementerian (JTPK) and Jawatankuasa Projek Sakit (JKPS)
in ministry is helping to solve project delay issues.
154 3.76
The cooperation between government agencies has helped to
solve problems during MOH projects implementation. 160 3.90
Officers and staffs are understand about current government
procedure in implementing construction projects, especially
in monitoring aspect.
160 3.33
Table 3: Average Index for section D questionnaire
Project monitoring: consultants and contractors view Total score Average Index (AI)
Consultants and contractors are understand about current
government project implementation and monitoring
procedures.
32 4.57
MOH and other agencies are helping consultants/contractors to
solve every problem during project implementation. 33 4.71
The monthly site meeting is effective to consultants/ contractors
raises issues to ministry/agencies. 28 4.00
MOH/Government agencies need to improve their project
monitoring procedure or system. 32 4.57
Consultant and contractors follow a proper procedure to
monitoring MOH project during construction. 34 4.86
MOH projects are very difficult because of project scopes,
specifications and medical equipment. 29 4.14
The failure during monitoring project by consultants and
contractors caused the quality issues after project completed. 27 3.86
5.0 CONCLUSION AND RECOMMENDATION
Project delays is a big concern to the Malaysian Government as RM 215.8 billion has
been spent to implement public sector projects under the 10th
Malaysia Plan (10th
MP)
through 25 ministries including the Ministry of Health (MOH). This study identified
25 significant factors that contribute to construction delay in MOH projects. Current
monitoring practices implemented by MOH, PWD and ICU JPM are at satisfactory
level based on the survey result. Therefore, current monitoring practices need to be
Proceedings of the 2nd
Master Project Symposium
53
improved to be more effective and responsive to address problems encountered during
the implementation of MOH projects.
The findings of this study also suggest that MOH, PWD and ICU JPM should carry
out the following action: 1) Appoint technical person in the same field to monitor the
project implementation. 2) Setup a competent team in health construction and select
contractor with special criteria which is experience in health construction project. 3)
The design and scope for MOH project need to be finalized before construction begin.
4) Project quality monitoring activity or process need to improve and giving priority
by MOH, PWD and ICU JPM.
REFERENCES
Fugar, F. D. K., & Agyakwah-baah, A. B. (2010). Delays in Building Construction
Projects in Ghana. Australasian Journal of Construction Economics and
Building, 10(1/2), 103–116.
Hamzah, N., Khoiry, M. a, Arshad, I., Badaruzzaman, W. H. W., & Tawil, N. M.
(2012). Identification of the causes of construction delay in Malaysia. World
Academy of Science, Engineering and Technology, 72(12), 312–317.
Haseeb, M., Xinhai-Lu, Bibi, A., Maloof-ud-Dyian, & Rabbani, W. (2011). Problems
of Projects and Effects of Delays in the Construction Industry of Pakistan.
Australian Journal of Business and Management Research, 1(5), 41–50.
Ho Chooi Peng (2013). Research Methodology Manual. National Institute of Public
Administration (INTAN).
Jabatan Perdana Menteri, U. P. E. (2010). Rancangan Malaysia Kesepuluh 2011-
2015. Rancangan Malaysia Kesepuluh 2011-2015, 193–251.
Jabatan Perdana Menteri, U. P. P. (2015). Pengurusan Projek Awam : Konsep
Pratikal Dan Realiti. Unit Penyelarasan Pelaksanaan, Jabatan Perdana Menteri
(ICU JPM).
Jatarona, N. A., Yusof, A., & Ismail, S. (2016). Public construction projects
performance In Malaysia. Journal of Southeast Asian Research, 2016(Vol.
2016(2016), Article ID 940838,).
Nashwan Al-Emad, S. N. (2015). Identification of Delay Factors from Mecca’s
Construction Experts Perpective. International Journal of Sustainable
Construction Engineering & Technology, Vol. 6(No. 2), 16–25.
Othman, A., & Ismail, S. (2014). Delay in Government Project Delivery in Kedah,
Malaysia. Recent Advances in Civil Engineering and Mechanics, 248–254.
Riazi, S., Riazi, M., & Lamari, F. (2013). Public Sector Project Delay : The Malaysian
Perspective and the Way Forward. In Proceedings of the 19th CIB World
Building Congress, Brisbane 2013 : Construction and Society, Queensland
University of Technology, Brisbane Convention & Exhibition Centre, QLD,
Australia.
Samarah, A., & A. Bekr, G. (2016). Causes and Effects of Delay in Public
Construction Projects in Jordan. American Journal of Engineering Research
(AJER), 5(5), 87–94.
Tawil, N. M., Khoiry, M. A., Hamzah, N., & Arshad, I. (2014). A Pilot Survey on
Causes of Delay in Malaysian Construction Project. MATEC Web of
Conferences, 10(January), 1–8.
Proceedings of the 2nd
Master Project Symposium
54
The Influence of Sales Skills towards Sales
Engineer’s Performance
M Syahril Sudirmana
and Nik Hasnaa Nik Mahmoodb
UTM Razak School of Engineering and Advanced Technology Universiti Teknologi
Malaysia, 54100 Kuala Lumpur, Malaysia [email protected]
,
Abstract – This paper discusses a study on the influence of sales skills acquired from training
on Sales Engineer’s performance in analytical equipment industry. The sales skills in this
study include interpersonal skills, salesmanship skills, technical skills and marketing skills.
The objectives of the study were to identify sales related training attended by Analytical
Equipment Sales Engineer, to examine the level of sales skills and performance among
Analytical Equipment Sales Engineer, to examine the relationship between sales skills with
sales engineer’s performance and to examine the influence of sales skills on Analytical
Equipment Sales Engineer performance. Data was gathered from 50 Analytical Equipment
Sales Engineer within eight companies in Selangor. Data were analysed using both
descriptive and inferential statistic namely frequencies, mean, Pearson Correlation and
regression. The finding of the study shows the type of trainings attended by sales engineers
and their level of sales skills and performance were evaluated. The results of Pearson
correlation analysis show positive relationship between sales skills and performance.
Surprisingly, regression analysis showed that only salesmanship skills, interpersonal skills
and technical skills have influence towards sales engineer’s performance while marketing
skills shown no impact towards performance.
Keywords: Sales skills, Sales engineer, Sales performance, Training
1.0 INTRODUCTION
This study investigates the influence of sales skills acquired from training towards the
performance of analytical equipment sales engineer as expected by the company.
Sales engineer are known as personnel that carry both responsibilities as salesperson
and engineer at the same time. The transition of sales engineer to knowledge worker
once started due to the shift of mass production to mass customization in engineering
industry as stated by Darr (2006) and this transition has brought about the growing
interdependence between social and technical skills in the work of Sales Engineers.
As stated by Avlonitis and Panagopoulos (2010), sales team needs to deliver
outstanding performance as they are representing the image of the company. The
judgments made by customers always based on the behaviour and attitudes of the
employees. The sales team is an important team in a company that will generate sales
with industrial clients which enables profit realization, especially for which operate
within business to business type of companies, as they are very contingent upon the
sales team to grow within modern markets. Every company needs to learn and adapt
Proceedings of the 2nd
Master Project Symposium
55
with the new knowledge and skills to face the new challenges to perform their jobs
efficiently and effectively. Hence, in order to improve sales skills among Sales
Engineer, related trainings are required.
Botha, Nieman and Van Vuuren (2006) in their study conducted in South Africa
highlighted that one way of enhancing related skills in respective industry is by
providing training and education to potential and existing employees. Bhatti and Kaur
(2010) emphasized that training is among the most essential and the best human
resource method for enhancing organizational and workers’ productivity to achieve
the goal of an organization.
Sales Engineer plays an increasingly important role as many products and services,
especially those purchased by large companies and institutions are highly complex.
According to the studies from annual reports among selected companies, the
performance for sales engineer is under achieved. For example, the company is
expected to achieve sales target which is RM2 million per year. However, according
to the report, sales engineer only managed to get sales in range RM500,000 to
RM1,200,000 per year. This scenario happened within all companies that being
studied in this research.
Marshall et al. (2000) identified that improving sales performance is a main goal for
companies to increase competitiveness in the market. Although there are many factors
that determined to contribute to salesperson performance, Churchill et al. (2000)
revealed that sales skills are one of the key individual-level determinants that
contribute to salesperson performance. Related sales skills for Sales Engineers to
perform their responsibilities include interpersonal skills, salesmanship skills,
technical skills and marketing skills. Futrell (2006) added that recruiting highly
skilled salesperson for the companies is very important.
Hence, the objective of this research is to identify sales related training attended by
Sales Engineer among the selected companies. In addition, this research will examine
the level of sales skills among Analytical Equipment Sales Engineer. After that, their
sales performance will be identified. Then, the relationship between sales skills with
sales engineer’s performance will be examined and the influence of sales skills on
Sales Engineer’s performance can be acknowledged.
2.0 LITERATURE REVIEW
Training refers to bridging the gap between the current performance and the standard
desired performance. It could be deliver through various methods such as coaching
and mentoring, peer’s cooperation and participation by the subordinates (Elnaga and
Imran, 2013). As industries undergo rapid change, the need to sort, add, discard, and
ultimately integrate new knowledge and skills with that which was learned yesterday
is a challenging task. Due to that, training is the main and important human resources
ways in developing the productivity of the company and employee effectiveness
(Khalilur Rahman et al., 2015).
Hence, Cosh et al. (1998) emphasized that formal approach for organizations to
update employees’ acquisition of job-related skills, knowledge and ability (SKA) is
by training. From a human capital theory perspective, training is investment rather
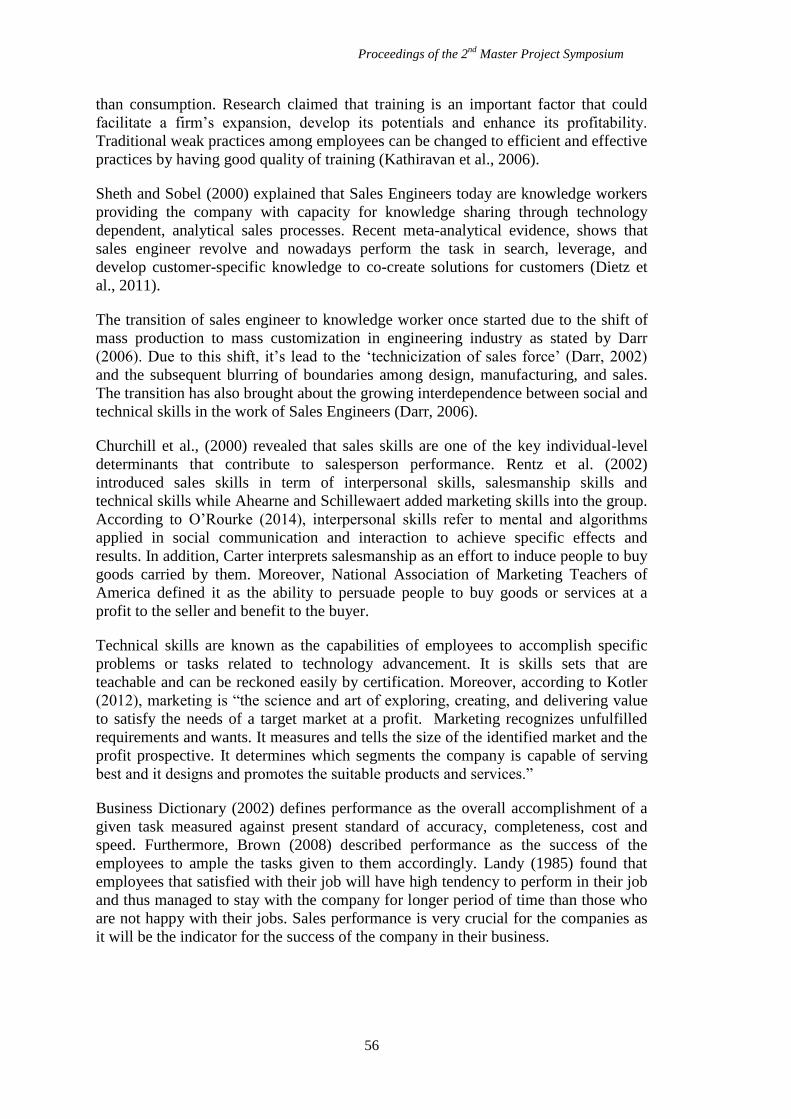
Proceedings of the 2nd
Master Project Symposium
56
than consumption. Research claimed that training is an important factor that could
facilitate a firm’s expansion, develop its potentials and enhance its profitability.
Traditional weak practices among employees can be changed to efficient and effective
practices by having good quality of training (Kathiravan et al., 2006).
Sheth and Sobel (2000) explained that Sales Engineers today are knowledge workers
providing the company with capacity for knowledge sharing through technology
dependent, analytical sales processes. Recent meta-analytical evidence, shows that
sales engineer revolve and nowadays perform the task in search, leverage, and
develop customer-specific knowledge to co-create solutions for customers (Dietz et
al., 2011).
The transition of sales engineer to knowledge worker once started due to the shift of
mass production to mass customization in engineering industry as stated by Darr
(2006). Due to this shift, it’s lead to the ‘technicization of sales force’ (Darr, 2002)
and the subsequent blurring of boundaries among design, manufacturing, and sales.
The transition has also brought about the growing interdependence between social and
technical skills in the work of Sales Engineers (Darr, 2006).
Churchill et al., (2000) revealed that sales skills are one of the key individual-level
determinants that contribute to salesperson performance. Rentz et al. (2002)
introduced sales skills in term of interpersonal skills, salesmanship skills and
technical skills while Ahearne and Schillewaert added marketing skills into the group.
According to O’Rourke (2014), interpersonal skills refer to mental and algorithms
applied in social communication and interaction to achieve specific effects and
results. In addition, Carter interprets salesmanship as an effort to induce people to buy
goods carried by them. Moreover, National Association of Marketing Teachers of
America defined it as the ability to persuade people to buy goods or services at a
profit to the seller and benefit to the buyer.
Technical skills are known as the capabilities of employees to accomplish specific
problems or tasks related to technology advancement. It is skills sets that are
teachable and can be reckoned easily by certification. Moreover, according to Kotler
(2012), marketing is “the science and art of exploring, creating, and delivering value
to satisfy the needs of a target market at a profit. Marketing recognizes unfulfilled
requirements and wants. It measures and tells the size of the identified market and the
profit prospective. It determines which segments the company is capable of serving
best and it designs and promotes the suitable products and services.”
Business Dictionary (2002) defines performance as the overall accomplishment of a
given task measured against present standard of accuracy, completeness, cost and
speed. Furthermore, Brown (2008) described performance as the success of the
employees to ample the tasks given to them accordingly. Landy (1985) found that
employees that satisfied with their job will have high tendency to perform in their job
and thus managed to stay with the company for longer period of time than those who
are not happy with their jobs. Sales performance is very crucial for the companies as
it will be the indicator for the success of the company in their business.
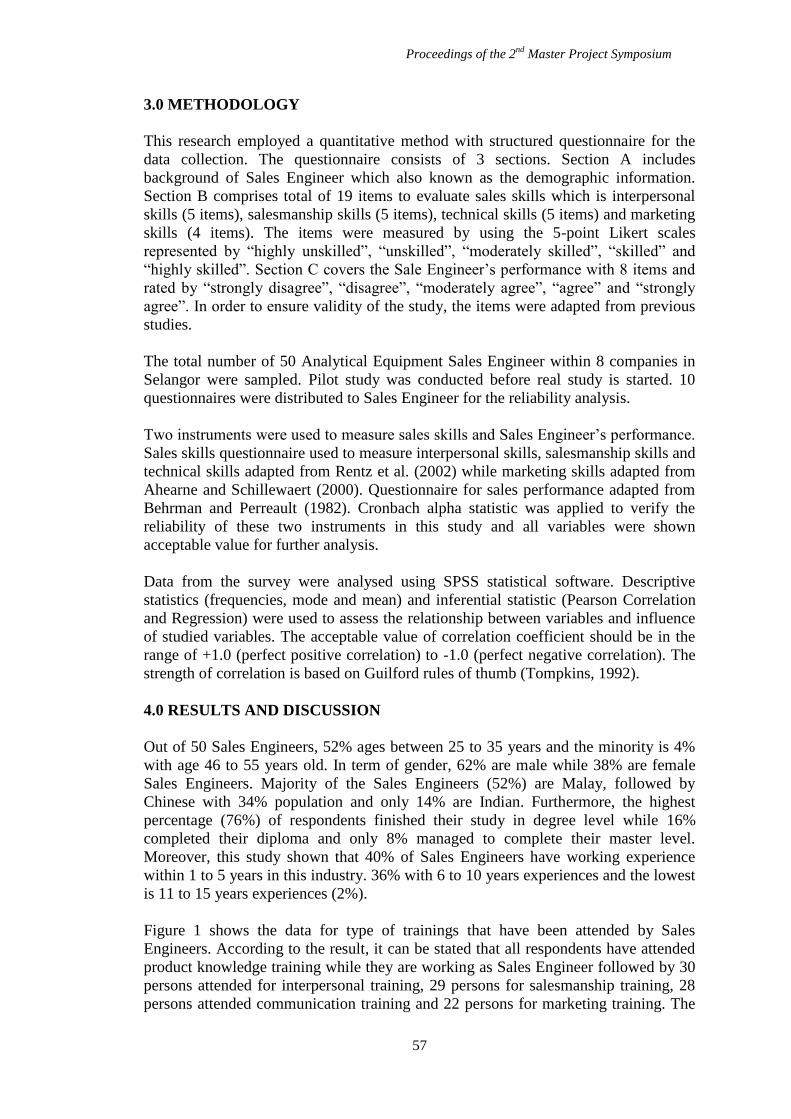
Proceedings of the 2nd
Master Project Symposium
57
3.0 METHODOLOGY
This research employed a quantitative method with structured questionnaire for the
data collection. The questionnaire consists of 3 sections. Section A includes
background of Sales Engineer which also known as the demographic information.
Section B comprises total of 19 items to evaluate sales skills which is interpersonal
skills (5 items), salesmanship skills (5 items), technical skills (5 items) and marketing
skills (4 items). The items were measured by using the 5-point Likert scales
represented by “highly unskilled”, “unskilled”, “moderately skilled”, “skilled” and
“highly skilled”. Section C covers the Sale Engineer’s performance with 8 items and
rated by “strongly disagree”, “disagree”, “moderately agree”, “agree” and “strongly
agree”. In order to ensure validity of the study, the items were adapted from previous
studies.
The total number of 50 Analytical Equipment Sales Engineer within 8 companies in
Selangor were sampled. Pilot study was conducted before real study is started. 10
questionnaires were distributed to Sales Engineer for the reliability analysis.
Two instruments were used to measure sales skills and Sales Engineer’s performance.
Sales skills questionnaire used to measure interpersonal skills, salesmanship skills and
technical skills adapted from Rentz et al. (2002) while marketing skills adapted from
Ahearne and Schillewaert (2000). Questionnaire for sales performance adapted from
Behrman and Perreault (1982). Cronbach alpha statistic was applied to verify the
reliability of these two instruments in this study and all variables were shown
acceptable value for further analysis.
Data from the survey were analysed using SPSS statistical software. Descriptive
statistics (frequencies, mode and mean) and inferential statistic (Pearson Correlation
and Regression) were used to assess the relationship between variables and influence
of studied variables. The acceptable value of correlation coefficient should be in the
range of +1.0 (perfect positive correlation) to -1.0 (perfect negative correlation). The
strength of correlation is based on Guilford rules of thumb (Tompkins, 1992).
4.0 RESULTS AND DISCUSSION
Out of 50 Sales Engineers, 52% ages between 25 to 35 years and the minority is 4%
with age 46 to 55 years old. In term of gender, 62% are male while 38% are female
Sales Engineers. Majority of the Sales Engineers (52%) are Malay, followed by
Chinese with 34% population and only 14% are Indian. Furthermore, the highest
percentage (76%) of respondents finished their study in degree level while 16%
completed their diploma and only 8% managed to complete their master level.
Moreover, this study shown that 40% of Sales Engineers have working experience
within 1 to 5 years in this industry. 36% with 6 to 10 years experiences and the lowest
is 11 to 15 years experiences (2%).
Figure 1 shows the data for type of trainings that have been attended by Sales
Engineers. According to the result, it can be stated that all respondents have attended
product knowledge training while they are working as Sales Engineer followed by 30
persons attended for interpersonal training, 29 persons for salesmanship training, 28
persons attended communication training and 22 persons for marketing training. The
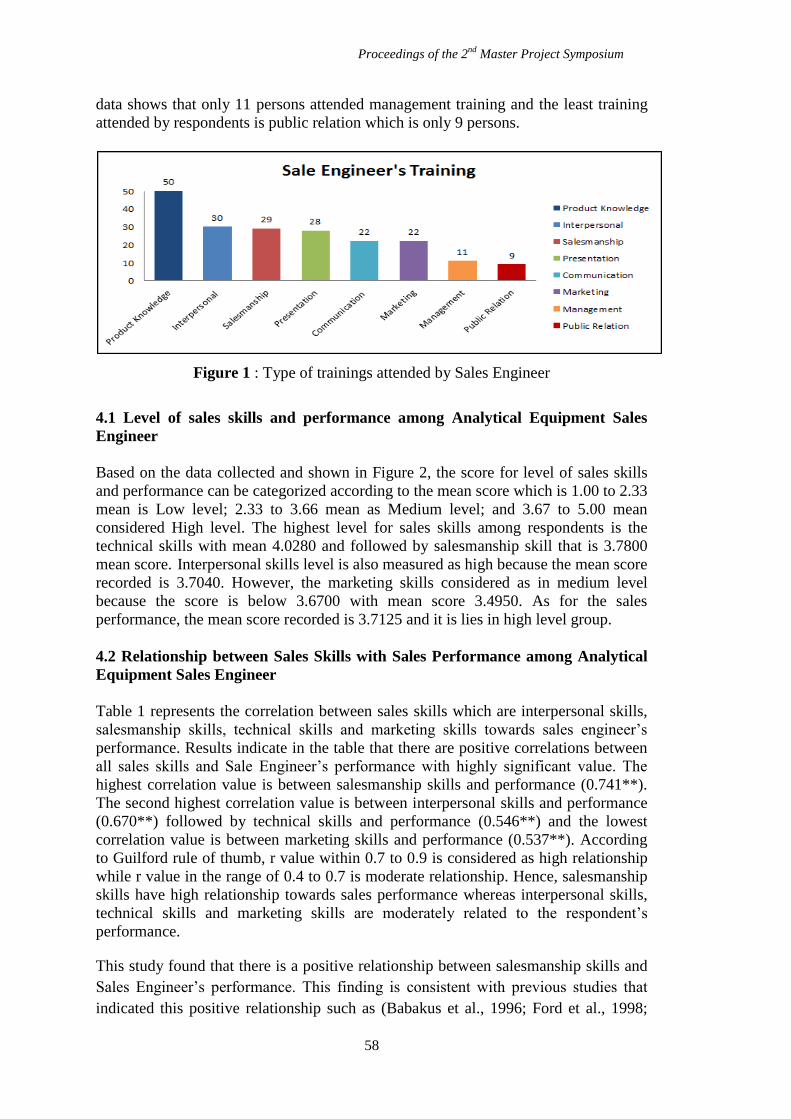
Proceedings of the 2nd
Master Project Symposium
58
data shows that only 11 persons attended management training and the least training
attended by respondents is public relation which is only 9 persons.
Figure 1 : Type of trainings attended by Sales Engineer
4.1 Level of sales skills and performance among Analytical Equipment Sales
Engineer
Based on the data collected and shown in Figure 2, the score for level of sales skills
and performance can be categorized according to the mean score which is 1.00 to 2.33
mean is Low level; 2.33 to 3.66 mean as Medium level; and 3.67 to 5.00 mean
considered High level. The highest level for sales skills among respondents is the
technical skills with mean 4.0280 and followed by salesmanship skill that is 3.7800
mean score. Interpersonal skills level is also measured as high because the mean score
recorded is 3.7040. However, the marketing skills considered as in medium level
because the score is below 3.6700 with mean score 3.4950. As for the sales
performance, the mean score recorded is 3.7125 and it is lies in high level group.
4.2 Relationship between Sales Skills with Sales Performance among Analytical
Equipment Sales Engineer
Table 1 represents the correlation between sales skills which are interpersonal skills,
salesmanship skills, technical skills and marketing skills towards sales engineer’s
performance. Results indicate in the table that there are positive correlations between
all sales skills and Sale Engineer’s performance with highly significant value. The
highest correlation value is between salesmanship skills and performance (0.741**).
The second highest correlation value is between interpersonal skills and performance
(0.670**) followed by technical skills and performance (0.546**) and the lowest
correlation value is between marketing skills and performance (0.537**). According
to Guilford rule of thumb, r value within 0.7 to 0.9 is considered as high relationship
while r value in the range of 0.4 to 0.7 is moderate relationship. Hence, salesmanship
skills have high relationship towards sales performance whereas interpersonal skills,
technical skills and marketing skills are moderately related to the respondent’s
performance.
This study found that there is a positive relationship between salesmanship skills and
Sales Engineer’s performance. This finding is consistent with previous studies that
indicated this positive relationship such as (Babakus et al., 1996; Ford et al., 1998;
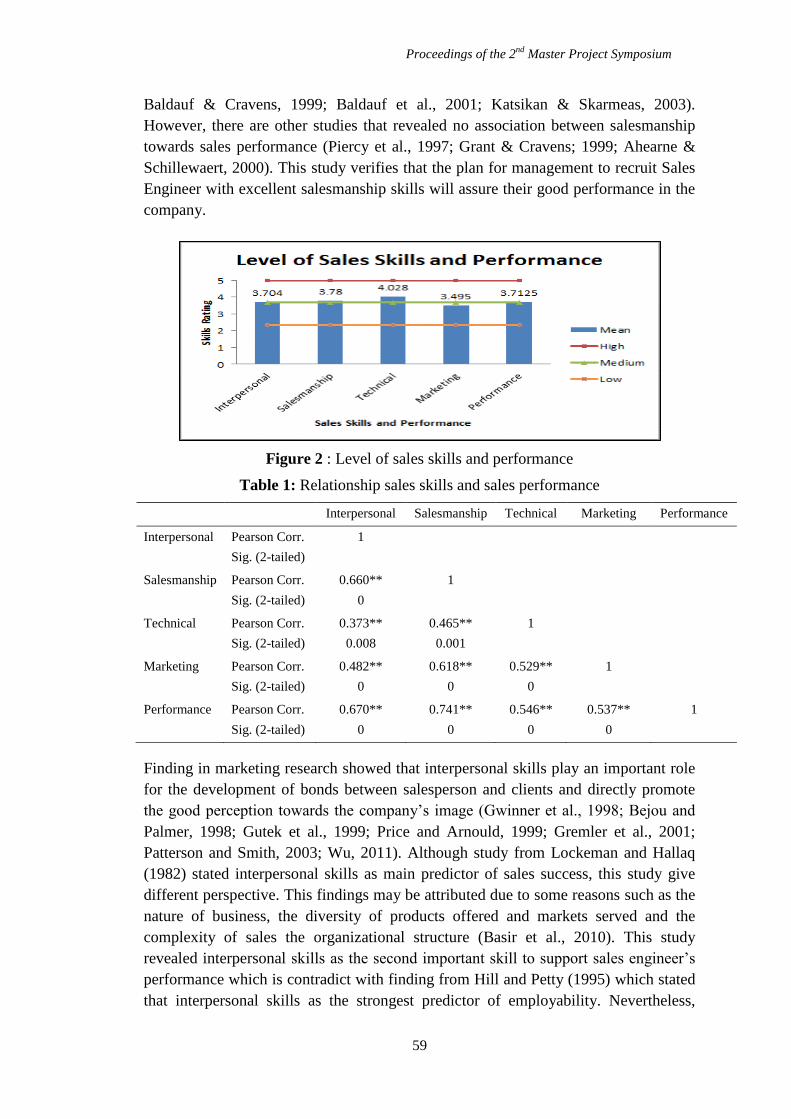
Proceedings of the 2nd
Master Project Symposium
59
Baldauf & Cravens, 1999; Baldauf et al., 2001; Katsikan & Skarmeas, 2003).
However, there are other studies that revealed no association between salesmanship
towards sales performance (Piercy et al., 1997; Grant & Cravens; 1999; Ahearne &
Schillewaert, 2000). This study verifies that the plan for management to recruit Sales
Engineer with excellent salesmanship skills will assure their good performance in the
company.
Figure 2 : Level of sales skills and performance
Table 1: Relationship sales skills and sales performance
Interpersonal Salesmanship Technical Marketing Performance
Interpersonal Pearson Corr.
Sig. (2-tailed)
1
Salesmanship Pearson Corr.
Sig. (2-tailed)
0.660**
0
1
Technical Pearson Corr.
Sig. (2-tailed)
0.373**
0.008
0.465**
0.001
1
Marketing Pearson Corr.
Sig. (2-tailed)
0.482**
0
0.618**
0
0.529**
0
1
Performance Pearson Corr.
Sig. (2-tailed)
0.670**
0
0.741**
0
0.546**
0
0.537**
0
1
Finding in marketing research showed that interpersonal skills play an important role
for the development of bonds between salesperson and clients and directly promote
the good perception towards the company’s image (Gwinner et al., 1998; Bejou and
Palmer, 1998; Gutek et al., 1999; Price and Arnould, 1999; Gremler et al., 2001;
Patterson and Smith, 2003; Wu, 2011). Although study from Lockeman and Hallaq
(1982) stated interpersonal skills as main predictor of sales success, this study give
different perspective. This findings may be attributed due to some reasons such as the
nature of business, the diversity of products offered and markets served and the
complexity of sales the organizational structure (Basir et al., 2010). This study
revealed interpersonal skills as the second important skill to support sales engineer’s
performance which is contradict with finding from Hill and Petty (1995) which stated
that interpersonal skills as the strongest predictor of employability. Nevertheless,
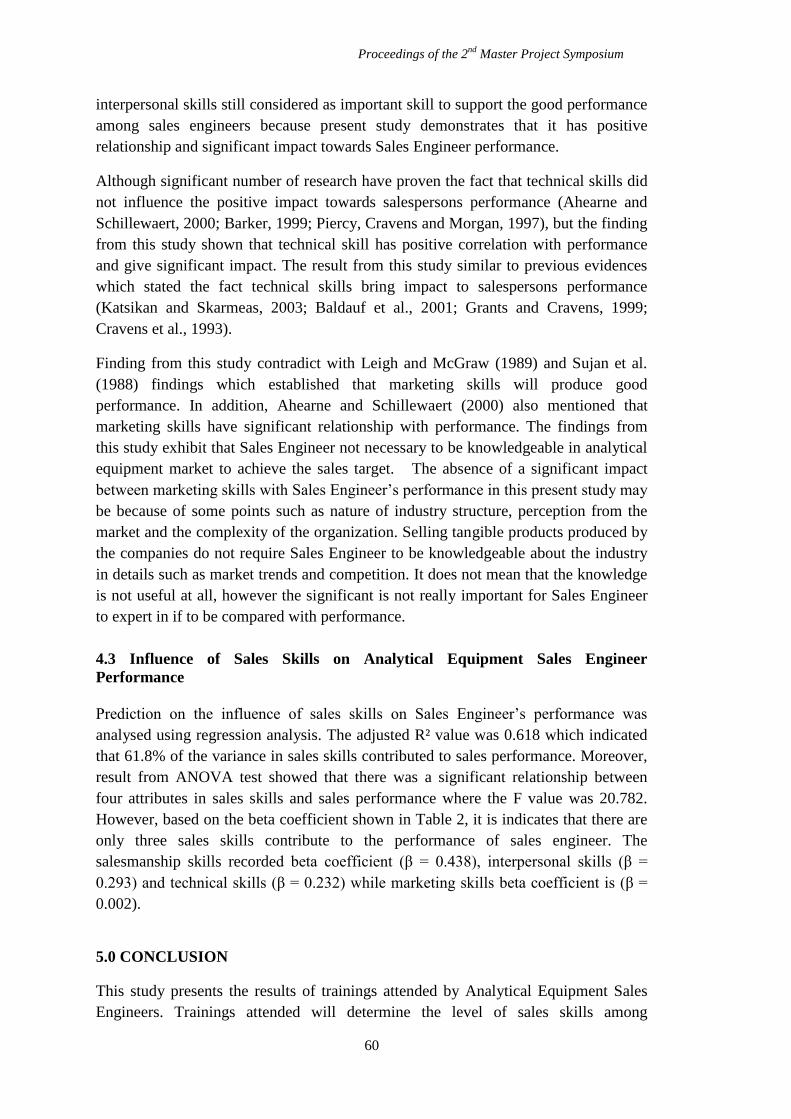
Proceedings of the 2nd
Master Project Symposium
60
interpersonal skills still considered as important skill to support the good performance
among sales engineers because present study demonstrates that it has positive
relationship and significant impact towards Sales Engineer performance.
Although significant number of research have proven the fact that technical skills did
not influence the positive impact towards salespersons performance (Ahearne and
Schillewaert, 2000; Barker, 1999; Piercy, Cravens and Morgan, 1997), but the finding
from this study shown that technical skill has positive correlation with performance
and give significant impact. The result from this study similar to previous evidences
which stated the fact technical skills bring impact to salespersons performance
(Katsikan and Skarmeas, 2003; Baldauf et al., 2001; Grants and Cravens, 1999;
Cravens et al., 1993).
Finding from this study contradict with Leigh and McGraw (1989) and Sujan et al.
(1988) findings which established that marketing skills will produce good
performance. In addition, Ahearne and Schillewaert (2000) also mentioned that
marketing skills have significant relationship with performance. The findings from
this study exhibit that Sales Engineer not necessary to be knowledgeable in analytical
equipment market to achieve the sales target. The absence of a significant impact
between marketing skills with Sales Engineer’s performance in this present study may
be because of some points such as nature of industry structure, perception from the
market and the complexity of the organization. Selling tangible products produced by
the companies do not require Sales Engineer to be knowledgeable about the industry
in details such as market trends and competition. It does not mean that the knowledge
is not useful at all, however the significant is not really important for Sales Engineer
to expert in if to be compared with performance.
4.3 Influence of Sales Skills on Analytical Equipment Sales Engineer
Performance
Prediction on the influence of sales skills on Sales Engineer’s performance was
analysed using regression analysis. The adjusted R² value was 0.618 which indicated
that 61.8% of the variance in sales skills contributed to sales performance. Moreover,
result from ANOVA test showed that there was a significant relationship between
four attributes in sales skills and sales performance where the F value was 20.782.
However, based on the beta coefficient shown in Table 2, it is indicates that there are
only three sales skills contribute to the performance of sales engineer. The
salesmanship skills recorded beta coefficient (β = 0.438), interpersonal skills (β =
0.293) and technical skills (β = 0.232) while marketing skills beta coefficient is (β =
0.002).
5.0 CONCLUSION
This study presents the results of trainings attended by Analytical Equipment Sales
Engineers. Trainings attended will determine the level of sales skills among
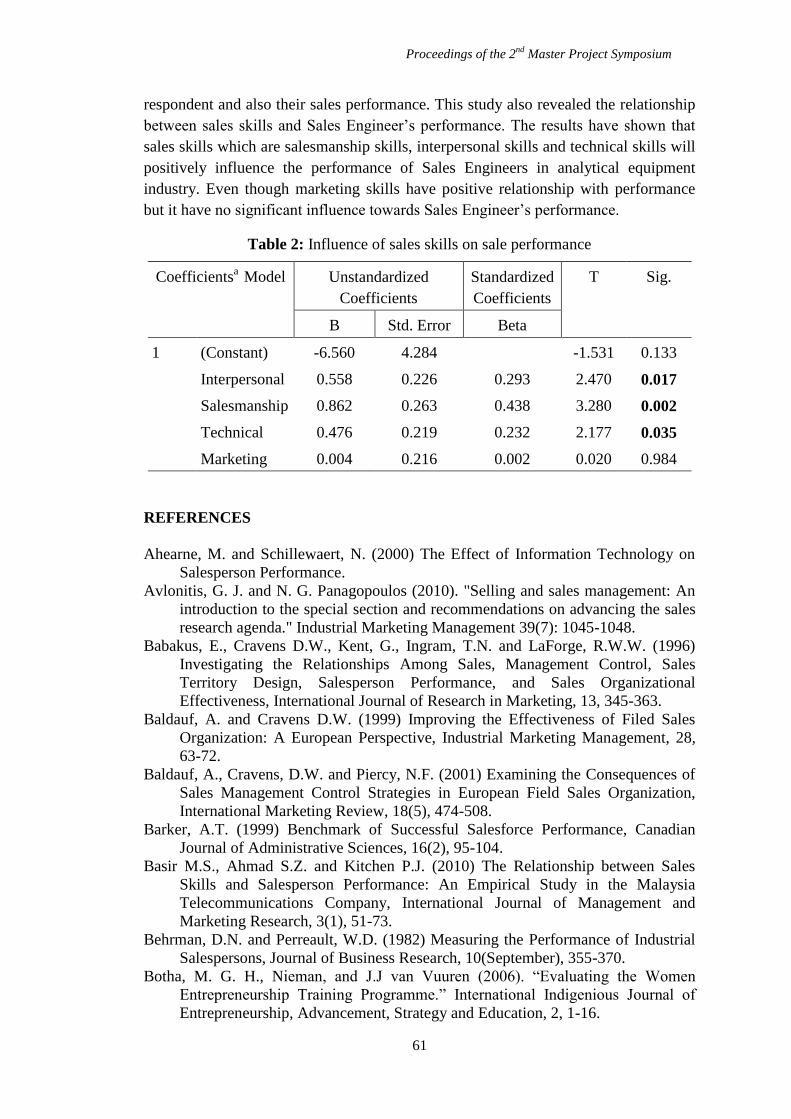
Proceedings of the 2nd
Master Project Symposium
61
respondent and also their sales performance. This study also revealed the relationship
between sales skills and Sales Engineer’s performance. The results have shown that
sales skills which are salesmanship skills, interpersonal skills and technical skills will
positively influence the performance of Sales Engineers in analytical equipment
industry. Even though marketing skills have positive relationship with performance
but it have no significant influence towards Sales Engineer’s performance.
Table 2: Influence of sales skills on sale performance
Coefficientsa
Model Unstandardized
Coefficients
Standardized
Coefficients
T Sig.
B Std. Error Beta
1 (Constant) -6.560 4.284 -1.531 0.133
Interpersonal 0.558 0.226 0.293 2.470 0.017
Salesmanship 0.862 0.263 0.438 3.280 0.002
Technical 0.476 0.219 0.232 2.177 0.035
Marketing 0.004 0.216 0.002 0.020 0.984
REFERENCES
Ahearne, M. and Schillewaert, N. (2000) The Effect of Information Technology on
Salesperson Performance.
Avlonitis, G. J. and N. G. Panagopoulos (2010). "Selling and sales management: An
introduction to the special section and recommendations on advancing the sales
research agenda." Industrial Marketing Management 39(7): 1045-1048.
Babakus, E., Cravens D.W., Kent, G., Ingram, T.N. and LaForge, R.W.W. (1996)
Investigating the Relationships Among Sales, Management Control, Sales
Territory Design, Salesperson Performance, and Sales Organizational
Effectiveness, International Journal of Research in Marketing, 13, 345-363.
Baldauf, A. and Cravens D.W. (1999) Improving the Effectiveness of Filed Sales
Organization: A European Perspective, Industrial Marketing Management, 28,
63-72.
Baldauf, A., Cravens, D.W. and Piercy, N.F. (2001) Examining the Consequences of
Sales Management Control Strategies in European Field Sales Organization,
International Marketing Review, 18(5), 474-508.
Barker, A.T. (1999) Benchmark of Successful Salesforce Performance, Canadian
Journal of Administrative Sciences, 16(2), 95-104.
Basir M.S., Ahmad S.Z. and Kitchen P.J. (2010) The Relationship between Sales
Skills and Salesperson Performance: An Empirical Study in the Malaysia
Telecommunications Company, International Journal of Management and
Marketing Research, 3(1), 51-73.
Behrman, D.N. and Perreault, W.D. (1982) Measuring the Performance of Industrial
Salespersons, Journal of Business Research, 10(September), 355-370.
Botha, M. G. H., Nieman, and J.J van Vuuren (2006). “Evaluating the Women
Entrepreneurship Training Programme.” International Indigenious Journal of
Entrepreneurship, Advancement, Strategy and Education, 2, 1-16.
Proceedings of the 2nd
Master Project Symposium
62
Churchill, G.A., Ford, N.M., Johnson, M.W. and Walker, Jr. O.C. (2000) Sales Force
Management (6th ed.). Singapore: McGraw-Hill Co.
Cosh, A., Duncan, J. and Hughes, A. (1998). “Investing in training and small firm
growth and survival: an empirical analysis for the UK 1987 – 1997”. DFEE
Research Report RR36. London: HMSO.
Cravens, D.W., Ingram, T., LaForge, R.W. and Yong, C.E. (1993) Behavior-based
and Outcome-based Salesforce Control System, Journal of Marketing,
57(October), 47-59.
Darr, A., 2006. Selling Technology: The Changing Shapes of Sales in an Information
Economy.Cornell University Press, Ithaca, NY.
Elnaga, A. and Imran, A. (2013). “The Effect of Training on Employee Performance.
European.” Journal of Business and Management, 5, 137.
Futrell, C.M. (2006) Fundamental of Selling: Customer for Life Through Services
(9th Ed.). McGraw-Hill Irwin: New York.
Grant, K. and Cravens, D.W. (1999) Examining the Antecedents of Sales
Organization Effectiveness: An Australian Study, European Journal of
Marketing, 33(9/10), 945-957.
Hill, R.B. and Petty, G.C. (1995) A New Look at the Employability Skills: A Factor
Analysis of the Occupational Work Ethic, Journal of Vocational Education
Research, 20(4), 50-73.
Katsikan, E.S. and Skarmeas, D. (2003) Organizational and Managerial Drivers of
Effective Export Sales Organizations, European Journal of Marketing,
37(11/12), 1723-1745.
Khalilur Rahman et al. (2015). “The impact of salesperson training on organizational
outcomes.” Journal of Scientific Research and Development, 8 (2).
Kotler, P., and Keller, K. L. (2012). Marketing Management. Prentice Hall, 14th
Edition.
Leigh, T.W. and McGraw, P.F. (1989) Mapping the Procedural Knowledge of
Industrial Sales Personnel: A Script-theoretic Investigation, Journal of
Marketing, 53(January), 16-34.
Lockeman, B.D. and Hallaq, J.H. (1982) Who Are Your Successful Salespeople?,
Academy of Marketing Science Journal, 10(4), 457-472.
Muhammad Awais Bhatti, Sharan Kaur, (2010). "The role of individual and training
design factors on training transfer.", Journal of European Industrial Training, 34
(7), 656-672.
Rentz, J.C., Shepherd, D., Armen, Tashchian, A., Dabholkar, P.A. and Ladd, R.T.
(2002) A Measure of Selling Skill: Scale Development and Validation, The
Journal of Personal Selling & Sales Management, 22(Winter), 13-21.
Sheth, J.N., & Sobel, A. (2000). Clients for life: How great professionals develop
breakthrough relationships (1st ed.). New York: Simon and Schuster.
Sujan, H., Mita, S. and Bettman, J.R. (1988b) Knowledge Structure Differences
Between More Effective and Less Effective Salespeople, Journal of Marketing
Research, 25(February), 81-86.
Tompkins, C. A. (1992). "Using and Interpreting Linear Regression and Correlation
Analyses: Some Cautions and Consideration." Clinical Aphasiology, 21.
Proceedings of the 2nd
Master Project Symposium
63
Public Project Delay Monitoring By
Implementation Coordination Unit
Nor Azirah Abdul Ghania and Syuhaida Ismail
b
UTM Razak School of Advance Engineering and Technology
Universiti Teknologi Malaysia Kuala Lumpur, 54100 Kuala Lumpur a
[email protected], [email protected]
Abstract – Malaysian government places high priority on the construction industry
by allocating 60 percent from the total allocation for physical development of public
project delivery. However, 113 on-going project are delayed and facing shortfalls in
spending expenditure. Thus, it is important that these delay and over-budget
problems being tackled by the Implementation Coordination Unit (ICU), who
coordinates and monitors the implementation of the public projects. Hence, this
paper is undertaken with the aim of evaluating the effectiveness in monitoring
delayed pubic projects by ICU. This aim is achieved via objectives of identifying the
causes of public project delay based on the monitoring by ICU, examining the
monitoring tools currently used by ICU in monitoring public project delay, and
proposing improvement measures for effective monitoring of the public project delay
by ICU. Data was collected via document review, which is subsequently validated via
questionnaire survey on the purposive sample of 16 monitoring officers at ICU and
analysed via Microsoft Excel. It is found that the main causes of delayed public
projects are contributed by contractor-related followed by project implementation-
related, utility-related, land and site-related problems. Project monitoring systems
currently used by ICU are Project Monitoring System II (PMS II) and Integrated
Project and Tracking Analysis Updates (iPANTAU), which are claimed by the
respondents as effective to identify and solve the problem of public project delay. The
top proposed improvement measure for PMS II and iPANTAU are developing
contractor score rating system based on their performance in PMS II and improve
competency of monitoring officers, particularly on identifying the causes of delay
before keying in the data into iPANTAU, respectively. This paper is expected to
enhance the efficiency of these systems by providing accurate information needed to
the stakeholders.
Keywords: Public project delay, monitoring tools, Implementation Coordination Unit, Malaysia
1.0 INTRODUCTION
Malaysia aims towards becoming a high-income advanced nation by 2020.
Construction sector was the fourth important sector in Malaysia (EPU, 2010).
According to Economic Planning Unit (2010), construction sector was contributed
about RM327 billion or 5.2 percent from total Gross Domestic Product (GDP).
Despite from that, it is reported that project deliverable performance and execution in
Malaysia reduced dramatically due to poor cost and time management of the projects
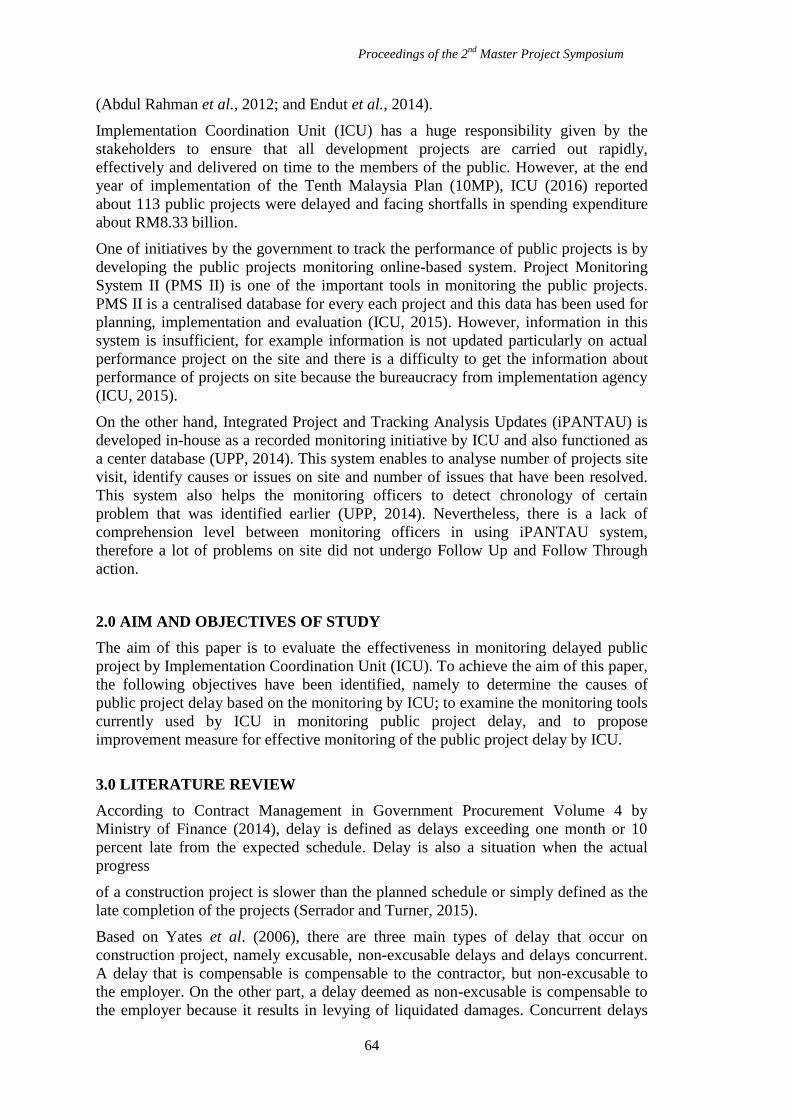
Proceedings of the 2nd
Master Project Symposium
64
(Abdul Rahman et al., 2012; and Endut et al., 2014).
Implementation Coordination Unit (ICU) has a huge responsibility given by the
stakeholders to ensure that all development projects are carried out rapidly,
effectively and delivered on time to the members of the public. However, at the end
year of implementation of the Tenth Malaysia Plan (10MP), ICU (2016) reported
about 113 public projects were delayed and facing shortfalls in spending expenditure
about RM8.33 billion.
One of initiatives by the government to track the performance of public projects is by
developing the public projects monitoring online-based system. Project Monitoring
System II (PMS II) is one of the important tools in monitoring the public projects.
PMS II is a centralised database for every each project and this data has been used for
planning, implementation and evaluation (ICU, 2015). However, information in this
system is insufficient, for example information is not updated particularly on actual
performance project on the site and there is a difficulty to get the information about
performance of projects on site because the bureaucracy from implementation agency
(ICU, 2015).
On the other hand, Integrated Project and Tracking Analysis Updates (iPANTAU) is
developed in-house as a recorded monitoring initiative by ICU and also functioned as
a center database (UPP, 2014). This system enables to analyse number of projects site
visit, identify causes or issues on site and number of issues that have been resolved.
This system also helps the monitoring officers to detect chronology of certain
problem that was identified earlier (UPP, 2014). Nevertheless, there is a lack of
comprehension level between monitoring officers in using iPANTAU system,
therefore a lot of problems on site did not undergo Follow Up and Follow Through
action.
2.0 AIM AND OBJECTIVES OF STUDY
The aim of this paper is to evaluate the effectiveness in monitoring delayed public
project by Implementation Coordination Unit (ICU). To achieve the aim of this paper,
the following objectives have been identified, namely to determine the causes of
public project delay based on the monitoring by ICU; to examine the monitoring tools
currently used by ICU in monitoring public project delay, and to propose
improvement measure for effective monitoring of the public project delay by ICU.
3.0 LITERATURE REVIEW
According to Contract Management in Government Procurement Volume 4 by
Ministry of Finance (2014), delay is defined as delays exceeding one month or 10
percent late from the expected schedule. Delay is also a situation when the actual
progress
of a construction project is slower than the planned schedule or simply defined as the
late completion of the projects (Serrador and Turner, 2015).
Based on Yates et al. (2006), there are three main types of delay that occur on
construction project, namely excusable, non-excusable delays and delays concurrent.
A delay that is compensable is compensable to the contractor, but non-excusable to
the employer. On the other part, a delay deemed as non-excusable is compensable to
the employer because it results in levying of liquidated damages. Concurrent delays

Proceedings of the 2nd
Master Project Symposium
65
happened when more than one factor delays the project at the same time or in
overlapping periods of moment (Hamzah et al., 2011).
Nurul et al. (2016) also identified 69 low performance factors and divided these into
five groups, such as (1) early investigation cases, (2) design phase, (3) contract phase,
(4) construction phase and (5) upon closing phase. Othman and Ismail (2014) list out
7 categories of causes identified from 72 causes of delayed project, such as (1)
client/owner, (2) consultant, (3) contractor, (4) manpower, (5) material, (6) equipment
and (7) external factor. Ramanathan et al. (2012) concluded that the highest 5
rankings causes of delay are related to (1) owner/client, (2) contractor, (3) design-
related, (4) labour/manpower and lastly (5) consultant and contractual relationship.
Basically, monitoring the public project produces a lot of information that is required
by the top management to track the work progress at site. Key Performance Indicator
(KPI) is also identified as a monitoring tool that measures assessment and success
performance of a project (Cox et al., 2003). Mean while, project outcome monitoring
was a proactive and transparent mechanism for managing the assignment of new
projects to project managers and for evaluating the performance efficiency of the
completed projects and their responsible project managers (Cao and Hoffman, 2011).
On the other hand, value management in public project management was defined as a
process to reduce cost at the lowest cost of the project by identifying which elements
that can reduce the costs without sacrificing the quality and function of the project
(UPP, 2015). Others tool are the Project Monitoring System (PMS), which can help
senior project management, project directors, project managers etc., in monitoring and
assessing project performance (Cheung et al., 2004).
Knowledge is the important element in project management system. Liao and Qi
(2009) suggested to combine project and organisation procession in the knowledge
management system to articulate the linkages between technical and deployment as
well as feedback on projects.
4.0 RESEARCH METHODOLOGY
This paper used triangulation method (quantitative) through document review as well
as structured questions from questionnaire survey in validating the findings from
document review as research methodology. This paper was conducted in five stages,
starting with literature review, followed with data collection, data analysis, data
interpretation and conclusion of the paper.
The second phase was data collection. To achieve the first objective in identifying the
causes of public project delay based on the monitoring by Implementation
Coordination Unit (ICU), data compilation on the documents review from Project
Monitoring System II (PMS II) and Integrated Project and Tracking Analysis Updates
(iPANTAU) was undertaken. Data analysis via Microsoft Excel followed by data
interpretation were carried out. Eventually, these findings are validated via
questionnaire survey on a set of purposive sample involving 16 monitoring officers at
ICU and reanalysed via Microsoft Excel. This questionnaire survey involves the 5-
point Likert scale of agreement (1 referring to strongly disagree to 5 which indicates
strongly agree) and importance (1 referring to least important to 5 which indicates
most important), following Poh (2016) who carries out research on key performance
indicators (KPI) for medium size contractors in Malaysia. As for the purpose of this
paper, the mean 3.5 and above signifies the level of agree and important, respectively.
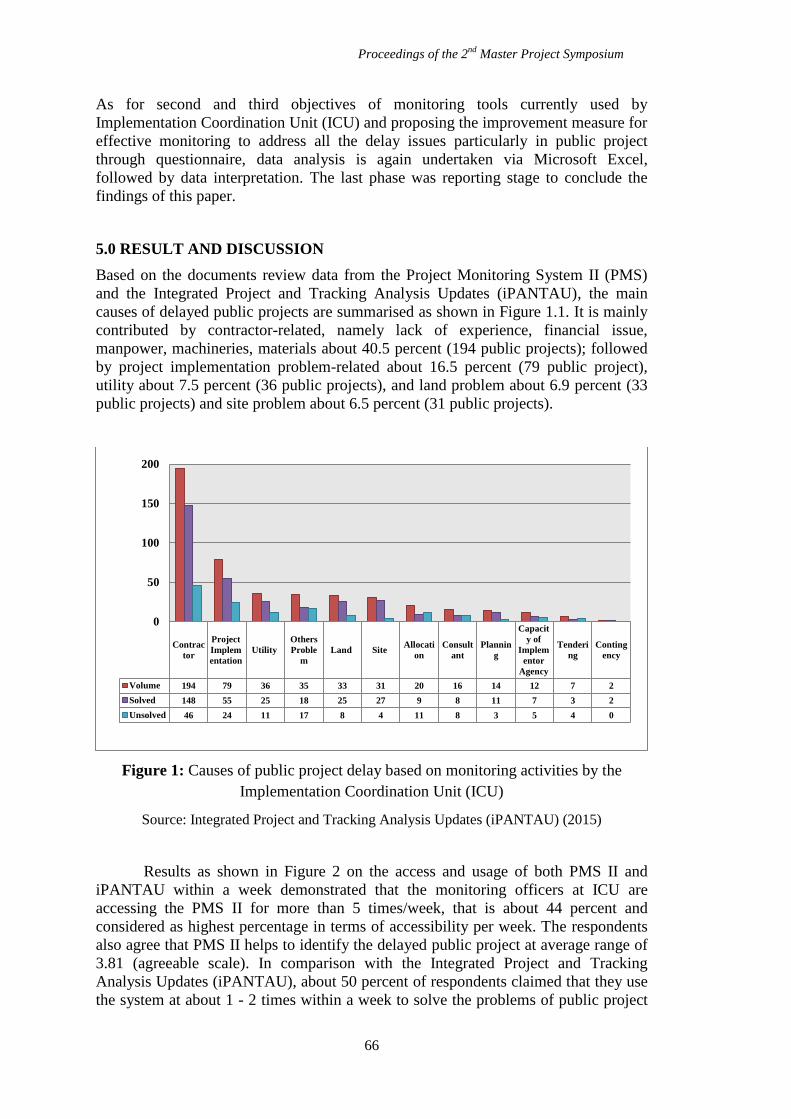
Proceedings of the 2nd
Master Project Symposium
66
As for second and third objectives of monitoring tools currently used by
Implementation Coordination Unit (ICU) and proposing the improvement measure for
effective monitoring to address all the delay issues particularly in public project
through questionnaire, data analysis is again undertaken via Microsoft Excel,
followed by data interpretation. The last phase was reporting stage to conclude the
findings of this paper.
5.0 RESULT AND DISCUSSION
Based on the documents review data from the Project Monitoring System II (PMS)
and the Integrated Project and Tracking Analysis Updates (iPANTAU), the main
causes of delayed public projects are summarised as shown in Figure 1.1. It is mainly
contributed by contractor-related, namely lack of experience, financial issue,
manpower, machineries, materials about 40.5 percent (194 public projects); followed
by project implementation problem-related about 16.5 percent (79 public project),
utility about 7.5 percent (36 public projects), and land problem about 6.9 percent (33
public projects) and site problem about 6.5 percent (31 public projects).
Figure 1: Causes of public project delay based on monitoring activities by the
Implementation Coordination Unit (ICU)
Source: Integrated Project and Tracking Analysis Updates (iPANTAU) (2015)
Results as shown in Figure 2 on the access and usage of both PMS II and
iPANTAU within a week demonstrated that the monitoring officers at ICU are
accessing the PMS II for more than 5 times/week, that is about 44 percent and
considered as highest percentage in terms of accessibility per week. The respondents
also agree that PMS II helps to identify the delayed public project at average range of
3.81 (agreeable scale). In comparison with the Integrated Project and Tracking
Analysis Updates (iPANTAU), about 50 percent of respondents claimed that they use
the system at about 1 - 2 times within a week to solve the problems of public project
Contrac
tor
Project
Implem
entation
Utility
Others
Proble
m
Land SiteAllocati
on
Consult
ant
Plannin
g
Capacit
y of
Implem
entor
Agency
Tenderi
ng
Conting
ency
Volume 194 79 36 35 33 31 20 16 14 12 7 2
Solved 148 55 25 18 25 27 9 8 11 7 3 2
Unsolved 46 24 11 17 8 4 11 8 3 5 4 0
0
50
100
150
200
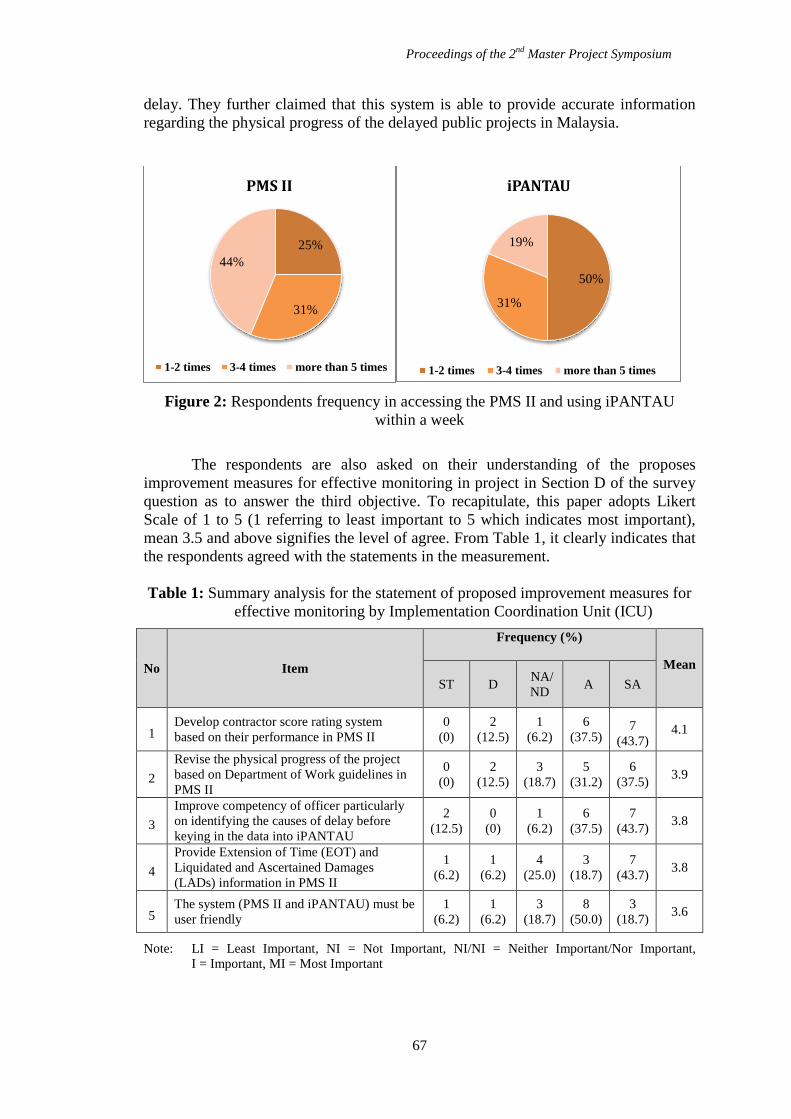
Proceedings of the 2nd
Master Project Symposium
67
delay. They further claimed that this system is able to provide accurate information
regarding the physical progress of the delayed public projects in Malaysia.
Figure 2: Respondents frequency in accessing the PMS II and using iPANTAU
within a week
The respondents are also asked on their understanding of the proposes
improvement measures for effective monitoring in project in Section D of the survey
question as to answer the third objective. To recapitulate, this paper adopts Likert
Scale of 1 to 5 (1 referring to least important to 5 which indicates most important),
mean 3.5 and above signifies the level of agree. From Table 1, it clearly indicates that
the respondents agreed with the statements in the measurement.
Table 1: Summary analysis for the statement of proposed improvement measures for
effective monitoring by Implementation Coordination Unit (ICU)
No Item
Frequency (%)
Mean
ST D NA/
ND A SA
1 Develop contractor score rating system
based on their performance in PMS II
0
(0)
2
(12.5)
1
(6.2)
6
(37.5) 7
(43.7) 4.1
2
Revise the physical progress of the project
based on Department of Work guidelines in
PMS II
0
(0)
2
(12.5)
3
(18.7)
5
(31.2)
6
(37.5) 3.9
3
Improve competency of officer particularly
on identifying the causes of delay before
keying in the data into iPANTAU
2
(12.5)
0
(0)
1
(6.2)
6
(37.5)
7
(43.7) 3.8
4
Provide Extension of Time (EOT) and
Liquidated and Ascertained Damages
(LADs) information in PMS II
1
(6.2)
1
(6.2)
4
(25.0)
3
(18.7)
7
(43.7) 3.8
5 The system (PMS II and iPANTAU) must be
user friendly
1
(6.2)
1
(6.2)
3
(18.7)
8
(50.0)
3
(18.7) 3.6
Note: LI = Least Important, NI = Not Important, NI/NI = Neither Important/Nor Important,
I = Important, MI = Most Important
25%
31%
44%
PMS II
1-2 times 3-4 times more than 5 times
50%
31%
19%
iPANTAU
1-2 times 3-4 times more than 5 times
Proceedings of the 2nd
Master Project Symposium
68
6.0 CONCLUSION
This paper has successfully achieved its aim and objectives in evaluating the
effectiveness in monitoring delayed public projects by the Implementation
Coordination Unit (ICU) as well as identifying the causes of public project delay
based on the monitoring by ICU, examining the monitoring tools currently used by
ICU in monitoring public project delay, and proposing improvement measures for
effective monitoring of the public project delay by ICU, respectively. This paper finds
that the top five causes of public project delay based on the monitoring by ICU are
contractor, project implementation, utility, land and site problem; whilst the
monitoring tools currently used by ICU in monitoring public project delay are Project
Monitoring System II (PMS) and Integrated Project and Tracking Analysis Updates
(iPANTAU).
It is also found by this paper that the top five proposed improvement measures for
effective monitoring of the public project delay by ICU are Develop contractor score
rating system based on their performance in PMS II, Revise the physical progress of
the project based on Department of Work guidelines in PMS II, Improve competency
of officer particularly on identifying the causes of delay before keying in the data into
iPANTAU, Provide Extension of Time (EOT) and Liquidated and Ascertained
Damages (LADs) information in PMS II and The system (PMS II and iPANTAU)
must be user friendly.
Thus, effective project management system is seen by this paper as helping the
Implementation Coordination Unit (ICU) in identifying causes the delay, monitoring
the delay project and solving the problems in public projects in Malaysia. In overall,
this paper has successfully proposed improvement measures to give more impact and
accurate information of the projects when the monitoring officers are performing their
jobs, especially in preparing the reports to the top management.
REFERENCES
Cao, Q., & Hoffman, J. J. (2011). A case study approach for developing a project
performance evaluation system. International Journal of Project Management,
29(2), 155–164. http://doi.org/10.1016/j.ijproman.2010.02.010.
Cheung, S. O., Suen, H. C. H., & Cheung, K. K. W. (2004). PPMS: a Web-based
construction project performance monitoring system. Automation in
Construction, 13(3), 361–376. Retrieved from
http://dx.doi.org/10.1016/j.autcon.2003.12.001
Cox, R. F., Issa, R. R. a., & Ahrens, D. (2003). Management’s Perception of Key
Performance Indicators for Construction. Journal of Construction Engineering
and Management, 129(2), 142–151. http://doi.org/10.1061/(ASCE)0733-
9364(2003)129:2(142)
Endut, I. R., Akintoye, A., & Kelly, J. (2005). Cost and Time Overruns of Projects in
Malaysia. ICONDA Prooceedings of the 2nd Scottish Conference for
Postgraduate Researchers of the Built and Natural Environment (PRoBE),
(2001), 243–252.
Hamzah, N., Khoiry, M. A., Arshad, I., Tawil, N. M., & Che Ani, A. I. (2011). Cause
of construction delay - Theoretical framework. In Procedia Engineering (Vol.
20, pp. 490–495). http://doi.org/10.1016/j.proeng.2011.11.192.
Nurul, A. J., Aminah, M. Y., Syuhaida, I., & Chai, C. S. (2016). Public construction
Proceedings of the 2nd
Master Project Symposium
69
projects performance in Malaysia. Journal of Southeast Asian Research,
2016(2016), 1–29. http://doi.org/10.1017/CBO9781107415324.004
Othman, A., & Ismail, S. (2014). Delay in Government Project Delivery in Kedah,
Malaysia. Recent Advances in Civil Engineering and Mechanics, 248–254.
Retrieved from http://www.syuhaidaismail.com
Jabatan Perdana Menteri, Unit Penyelarasan Pelaksanaan. (2014). Taklimat
Pengenalan SPP II.
Jabatan Perdana Menteri, U. P. E. (2015). Buku Merah UPE, JPM : Langkah-
Langkah Penambahbaikan Pelaksanaan Projek Pembangunan Rancangan
Malaysia Lima Tahun (RMLT).
Jabatan Perdana Menteri, U. P. P. (2015). Laporan Tahunan ICU 2015 : Pemangkin
Pembangunan Negara. Putrajaya.
Jabatan Perdana Menteri, U. P. P. (2015). Pengurusan Projek Awam : Konsep
Pratikal Dan Realiti.
Liao, Y., & Qi, L. (2009). Knowledge management system in project-based
organizations. In 2009 International Conference on Management of e-Commerce
and e-Government, ICMeCG 2009 (pp. 156–159).
http://doi.org/10.1109/ICMeCG.2009.99
Poh, N. K. (2016). Framework of Project Management Key Performance Indicators
for Medium-Sized Building Construction Industry in Malaysia.
Ramanathan, C., Narayanan, S. P., & Idrus, A. B. (2012). Construction delays causing
risks on time and cost - A critical review. Australasian Journal of Construction
Economics and Building. http://doi.org/10.5130/ajceb.v12i1.2330
Serrador, P., & Turner, R. (2015). The relationship between project success and
project efficiency. Project Management Journal, 46(1), 30–39.
http://doi.org/10.1002/pmj.21468
Yates, J. K., Asce, M., & Epstein, A. (2006). Avoiding and Minimizing Construction
Delay Claim Disputes in Relational Contracting. Journal of Professional Issues
in Engineering Education and Practice, 132(April), 168–179.
http://doi.org/10.1061/(ASCE)1052-3928(2006)132:2(168)
Proceedings of the 2nd
Master Project Symposium
70
Impact of Team Integration on Project
Delivery Performance in Mass Rapid Transit
Project
Nur Liyana Mohamad Nasir a
and Rafizah Musab
UTM Razak School of Engineering and Advanced Technology, Universiti Teknologi
Malaysia, Jalan Sultan Yahya Petra 54100 Kuala Lumpur, Malaysia [email protected],
Abstract – An overview of factors in effective communication in view of team
integration is the aim of the paper, based on questionnaire survey that distributed
among project team in MRT project. Through the document review, there were 15 key
indicators in team integration and only four key indicators being measured as factors
of effective communication and investigate the relationship among that factors
towards team integration and project delivery performance. The last objective is to
propose an effective communication index in MRT project. As for conclusion, it
shows that the four indicator of effective communication have a strong relationship
towards the team integration and project delivery performance. The rank order
effective communication factor is focusing goal and objective, free flow
communication, sharing information and collective understanding respectively.
Keywords: Team integration, Project delivery performance, Effective communication
1.0 INTRODUCTION
The fragmentation structure in approaching the project delivery had been criticized on
their performance as a project delivery in the construction industry (Latham, 1994).
Therefore, the concept of integration, coordination and communication need to be
applied to overcome this issue. Construction project is likely to practice traditional
procurement. The client will appoint their consultants for the designation works
meanwhile contractor will carry out the construction part. The contractor has been
choosing through tendering process. However, those concept does not encourage
during stage in the traditional procurement at construction stage (Latham, 1994, Love
and P.E.D., 1998). Hence, the element of the contract can give difficulty to be
efficient in the collaboration and cooperation (Love and P.E.D., 1998). It can be seen
that throughout the traditional procurement, it gives negative impact on team dynamic
and teamwork to meet contract deliverables and thus need to propose on the best
solution (Forgues and Koskela, 2009). If the project team fail to have team integration
in the early phase of construction, it can cause problem in planning which leads to
delay hence harm the overall project (Arditi, 2002). The output of the study
investigates the relationship factors of effective communication in team integration
and project delivery performance. The analysis of this study is based on the working
experience of project team during construction of MRT Line 1.
Proceedings of the 2nd
Master Project Symposium
71
1.1 Problem Statement
Lack of effective communication between stakeholders make the process of project
cycle do not meet the contract deliverables. During the launching ceremony of MRT
project, the client make a target to start the operation of MRT Line 1 for the phase 1 at
the end of 2016 meanwhile for phase 2 at early of 2017. There are about 8 packages
with different contractors for this project. There are works that cannot be completed
on the target date of opening operation. The clients pushing their contractors to work
double but they still give a lot of variation order. A lot of changing in structural
design during construction occurred especially on station buildings part. These
problems have given impact on the delay of project completion date. However, it can
be reduced with the effective communication between stakeholders. The problem
occurred during the construction stage gives impact on cost, time and quality of the
project. The contractors have a limited time to carry out their jobs, thus the quality of
the works not become the priority anymore. They are competing to complete their
jobs.
2.0 LITERATURE REVIEW
2.1Team Integration
Team integration is defined as one of the organization or disciplines with different
objectives, aims and cultures merge into a single cohesive unit and mutually
supporting unit (Baiden et al., 2006). The traditional procurement method does not
apply the true concept of integration in the construction project. Thus, without full
encouraging on integration, coordination and communication, it cannot overcome the
fragmentation. Fail to comply the integration during the early phase of construction
project may effect on the planning, delay hence harm the overall project outcomes
(Arditi, 2002). Topic of team integration gives reflect on the fragmented working
environment and collaborative working issues (Construction, 2003). Few steps need
to be taken in order to have great team integration in working environment. All
project teams need to strategies the concept of team integration and collective
strength which has potential to positively influence project outcomes (Jorgensen and
Emmitt, 2009). There are some hindrances in working environment for project teams
to comply team integration due to lack of collaboration, inconsistent shared vision,
poor communication and inadequate participation (Excellent, 2004).
Based on 15 key indicators in conceptual framework that adapted from (Ibrahim et al.,
2013), four key indicators have been chosen and critically reviewed in this research.
The indicators are focusing on goal and objectives, collective understanding, free flow
communication and sharing information. Focusing on goal and objectives is one of
the key indicators of team integration in construction project (Baiden et al., 2003,
Moore, 1999). Dainty ARJ et al., (2001) stated that the efficiency and success of
project are depending on focus on single items. Without hardworking effort of focus
and work together towards common goals, the overall project effectiveness and
efficiency cannot be achieved (Love and P.E.D., 1998) . Besides that, collective
understanding is one of vital indicator of team integration for project success. OGC
(2003) stated that collective responsibility and decision making of project cost and
maintenance of facilities, sustainability, speed of delivery, design quality, and the
efficiency of operation team is the contribution from early phase of team integration.
Love and P.E.D.(1998) mentioned that free flow communication gives influence on
Proceedings of the 2nd
Master Project Symposium
72
team effectiveness, integration of works, efficiency during supervision, job
satisfaction and overall organizational effectiveness.
2.2 Effective Communication
The way of communication between stakeholders in the construction project is
important. As one of the successful communication strategy, it is important to know
the mistakes, barriers in the communication. Failure in effective communication will
give problem in project delivery performance. Communication is boundless as the
view of group of mistakes. According to Cervone (2014), project communication is
failed when the direction of communication is in unmannerly, communicating status
update being focused and the expectation from teams are outward. Besides, effective
communication provides an important route to compete among construction firms.
2.3 Project Performance
Astley et al., (1990) stated that the successful of project is based on the outstanding
results in budget, schedule and quality. In addition, if the projects comply all the
technical requirements and performance specification which they gaining high level
satisfaction among the project stakeholders also categorize under project success (De
Wit, 1988). Zhang and Fan (2013) stated that project performance criteria for
construction project can be classified into few groups such as meeting project overall
performance, meeting owner’s requirements, meeting project’s multiple goal and
stakeholders’ satisfaction. Meeting project overall performance will be based on time,
cost and quality meanwhile indicators of meeting project’s multiple goal are health
and safety and environment, absence of conflicts, risk management and claim
management.
3.0 RESEARCH METHODOLOGY
Data collection instrument for this research was a survey questionnaire. Unit of
analysis was a completed MRT project. Questionnaire was developed through a
review of past literature and cooperation from project team.
The study pinned its team integration among the contractors in the construction site of
MRT Project Line 1. The sample size is focusing on project team located at site.
Respondents are from the age of 25 to 65 years old which have more than one years
of experience knowledges. Data was measured quantitatively by using SPSS in order
to evaluate the relationship factors of effective communication in team integration.
4.0 RESULTS AND DISCUSSION
4.1 Results
A total of 40 questionnaires were distributed to the selected contractors in MRT
project. Based on the cross tabulation shows in Table 1, this study is dominant by
engineer with less than 5 years experience about 35%. Nevertheless, the second
dominant is also by engineer but having 5 to 10 years experience and the least is from
manager and supervisor level about 5% whom both of them having 5 to 10 years
experience. It indicates that the project team is young generation who have high
optimism in construction industry.
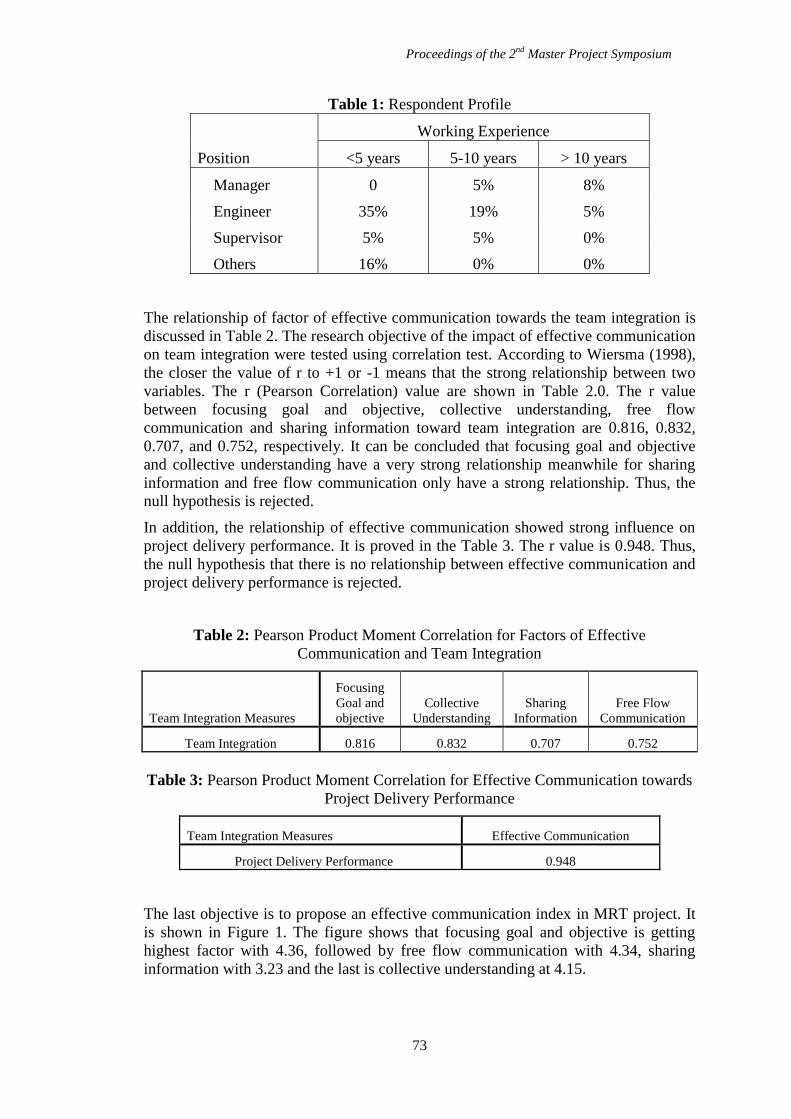
Proceedings of the 2nd
Master Project Symposium
73
Table 1: Respondent Profile
Position
Working Experience
<5 years 5-10 years > 10 years
Manager 0 5% 8%
Engineer 35% 19% 5%
Supervisor 5% 5% 0%
Others 16% 0% 0%
The relationship of factor of effective communication towards the team integration is
discussed in Table 2. The research objective of the impact of effective communication
on team integration were tested using correlation test. According to Wiersma (1998),
the closer the value of r to +1 or -1 means that the strong relationship between two
variables. The r (Pearson Correlation) value are shown in Table 2.0. The r value
between focusing goal and objective, collective understanding, free flow
communication and sharing information toward team integration are 0.816, 0.832,
0.707, and 0.752, respectively. It can be concluded that focusing goal and objective
and collective understanding have a very strong relationship meanwhile for sharing
information and free flow communication only have a strong relationship. Thus, the
null hypothesis is rejected.
In addition, the relationship of effective communication showed strong influence on
project delivery performance. It is proved in the Table 3. The r value is 0.948. Thus,
the null hypothesis that there is no relationship between effective communication and
project delivery performance is rejected.
Table 2: Pearson Product Moment Correlation for Factors of Effective
Communication and Team Integration
Team Integration Measures
Focusing
Goal and
objective
Collective
Understanding
Sharing
Information
Free Flow
Communication
Team Integration 0.816 0.832 0.707 0.752
Table 3: Pearson Product Moment Correlation for Effective Communication towards
Project Delivery Performance
Team Integration Measures Effective Communication
Project Delivery Performance 0.948
The last objective is to propose an effective communication index in MRT project. It
is shown in Figure 1. The figure shows that focusing goal and objective is getting
highest factor with 4.36, followed by free flow communication with 4.34, sharing
information with 3.23 and the last is collective understanding at 4.15.
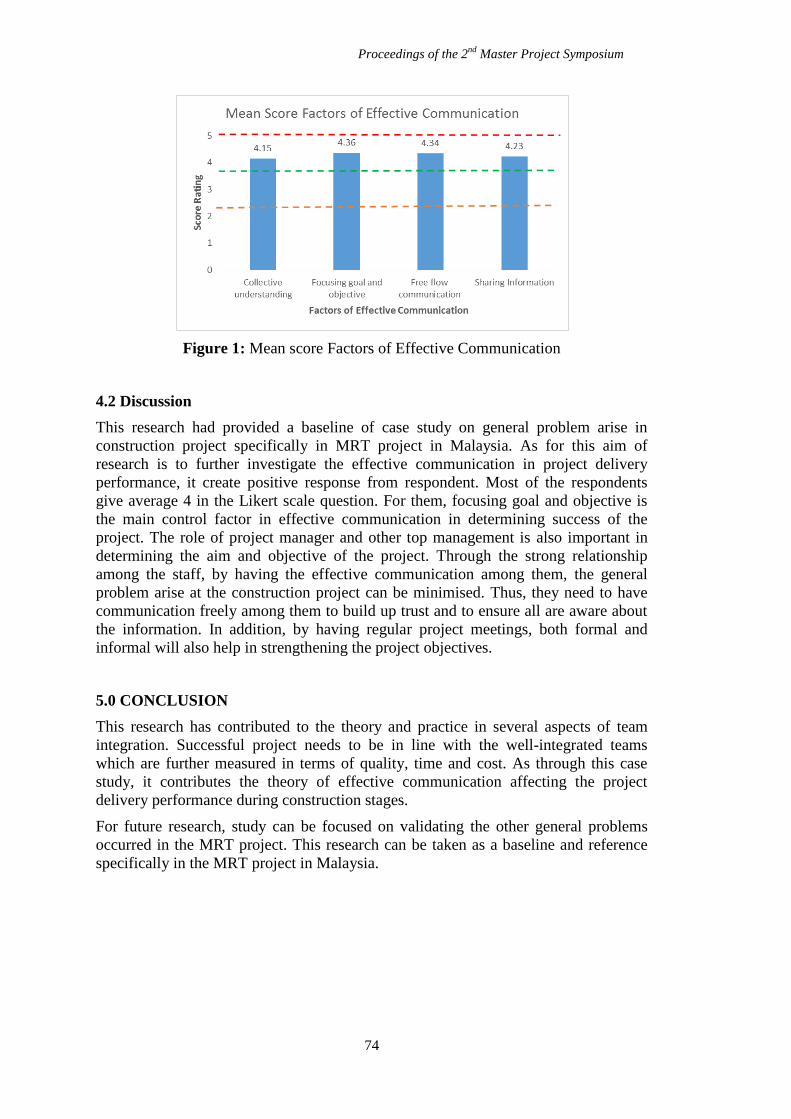
Proceedings of the 2nd
Master Project Symposium
74
Figure 1: Mean score Factors of Effective Communication
4.2 Discussion
This research had provided a baseline of case study on general problem arise in
construction project specifically in MRT project in Malaysia. As for this aim of
research is to further investigate the effective communication in project delivery
performance, it create positive response from respondent. Most of the respondents
give average 4 in the Likert scale question. For them, focusing goal and objective is
the main control factor in effective communication in determining success of the
project. The role of project manager and other top management is also important in
determining the aim and objective of the project. Through the strong relationship
among the staff, by having the effective communication among them, the general
problem arise at the construction project can be minimised. Thus, they need to have
communication freely among them to build up trust and to ensure all are aware about
the information. In addition, by having regular project meetings, both formal and
informal will also help in strengthening the project objectives.
5.0 CONCLUSION
This research has contributed to the theory and practice in several aspects of team
integration. Successful project needs to be in line with the well-integrated teams
which are further measured in terms of quality, time and cost. As through this case
study, it contributes the theory of effective communication affecting the project
delivery performance during construction stages.
For future research, study can be focused on validating the other general problems
occurred in the MRT project. This research can be taken as a baseline and reference
specifically in the MRT project in Malaysia.
Proceedings of the 2nd
Master Project Symposium
75
REFERENCES
arditi, D., Elhassan, A. and Toklu, Y.C.(2002). Constructability analysis in the design
firm. Journal of Construction Engineering and Management, 128, 117-126.
Astley, Graham, W. & Zajac, E. J. (1990). Beyond Dyadic Exchange: Functional
Interdependence and Sub-unit Power. Organization Studies, 11, 481-501.
Baiden, B.K., Price, A.D.F. & Dainty (2003). Looking beyond processes: Human
factors in team integration. In: GREENWOOD, D. J. E. (ed.) 19th Annual
ARCOM Conference. 3-5 September 2003: University of Brighton
,Association of Researchers in Construction Management.
Baiden, B.K., Price, A.D.F., Dainty & A.R.J (2006). The extent of team integration
within construction projects. International Journal of Project Management 24,
13-23.
Cervone, H. F. (2014). Effective communication for project success OCLC Systems
and Services :International digital library perspectives,, 30, 74-77.
Construction, A. E. I. (2003). The integrated project team: team working and
partnering. In: COMMERCE, O. O. G. (ed.). London: Procurement guide.
Dainty ARJ, Briscoe GH & SJ, M. (2001). New perspectives on construction supply
chain integration. Supply Chain Management. An International Journal of
Project Management, 6, 163-73.
De Wit, A. (1988). Measurement of project success. International Journal of Project
Management 6. EXCELLENT, C. (2004). Teamworking, . In: EXCELLENT,
C. (ed.). Watford.
Forgues, D. & Koskela, L. (2009). The influence of a collaborative procurement
approach using integrated design in construction on project team performance
International Journal of Managing Projects in Business 2, 370-385.
Ibrahim, K. I., Costello, S. B. & Wilkinson (2013). Key practice indicators of team
integration in construction projects: a review team Performance Management,
19, 132-152.
Jorgensen, B. & Emmitt, S. (2009). Investigating the integration of design and
construction from a "lean" perspective. Construction Innovation:Information,
Process, Management, 9, 225-240.
Latham, M. (1994). Constructing the Team. Joint Review of Procurement and
Contractual Arrangements in the United Kingdom Construction Industry: .
Wiley: London.
Love & P.E.D. (1998). Concurrent engineering: a strategy for procuring construction
projects. International Journal of Project Management, 16, 375-83.
Moore, D. R. A. D., A.R.J. (1999). Integrated project teams’ performance in
managing unexpected change events. Team Performance Management, 5,
212-222.
OGC (2003). Achieving Excellence in Construction, Procurement Guide 05. In:
TEAM, T. I. P. (ed.). London: Office of Goverment Commerce.
Wiersma, W. (1998). Research methods in education : an introduction. In: BACON.,
A. (ed.). Boston.
Zhang, L. & Fan, W. (2013). Improving performance of construction projects: " A
project manager’s emotional intelligence approach". Engineering,
Construction and Architectural Management, 20, 195-207.
Proceedings of the 2nd
Master Project Symposium
76
Relationship between Engineer’s Emotional
Intelligence Behaviour and Sales Performance
Jessica Marie Arokiasamy a
and Roslizar Mat Alib
UTM Razak School of Engineering and Advanced Technology, Universiti Teknologi
Malaysia, Jalan Sultan Yahya Petra, 54100 Kuala Lumpur, Malaysia [email protected],
Abstract – Business environment in today’s world is rapidly changing and highly
competitive. In order to gain competitive advantage, organizations must take full
advantage in optimizing their work forces and put high pressure towards their
employee’s performance especially on sales team because sales performance enables
profit realization. The sales team is front liners who need to deliver outstanding
performance, which leads to customer retention and long term relationship between
two organizations. Emotional Intelligence (EI) is a successful tool for personal and
professional life such as sales engineers. Employing a sample of 50 sales engineers,
the aim of this research is to identify the level of Emotional Intelligence behaviour
exhibited by sales person and used as a tool to increase the sales performance.
Emerging research has shown that emotional intelligence positively supports sales
performance. The benefit of demonstrating very high frequency of emotional
intelligence in the workplace is vast especially to sales engineers. The Genos
Emotional Intelligence Inventory (full self-rater version) was distributed to 55 sales
engineers. The findings demonstrated that the overall level of EI is high with sales
performance achieved 76 – 100%. The findings proved that those who achieved
>100% + sales performance exhibit very high level frequency of emotional
intelligence.
Keywords: Emotional Intelligence, Sales Performance, Sales Engineers
1.0 INTRODUCTION
The sales team is an important team in an organization in generating sales with
industrial consumers which enables profit realization, especially for which operate
within business to business type of companies, as they are very reliant upon the sales
team to grow and prosper within contemporary markets (Avlonitis & Panagopoulos,
2010). Emotional Intelligence (EI) or "the ability to monitor one's own and others
feelings and emotions, to differentiate among them, to use this information to guide
one's thinking and actions and effectively manage the emotions of others" (Giorgi,
Mancuso, & Perez, 2014) has been associated with sales performance (Rojell,
Pettijohn, & Parker, 2006). In order to gain competitive advantage, organizations put
high pressure towards the employee's performance especially on sales team because
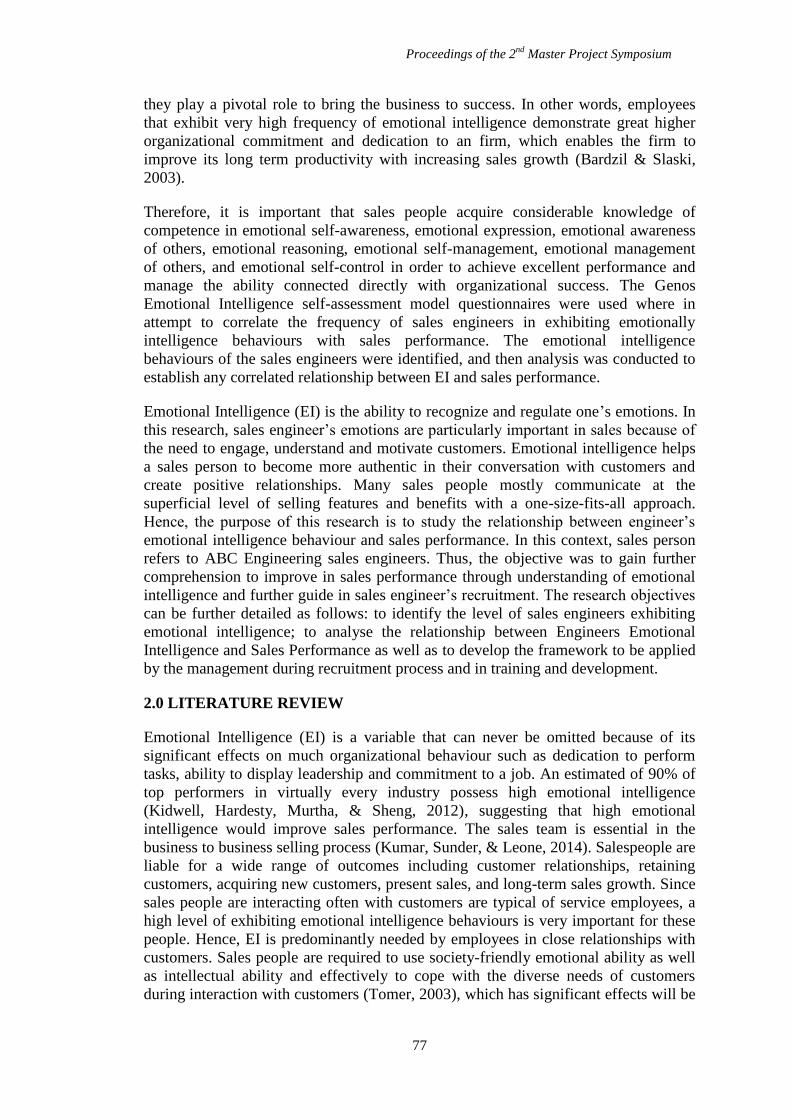
Proceedings of the 2nd
Master Project Symposium
77
they play a pivotal role to bring the business to success. In other words, employees
that exhibit very high frequency of emotional intelligence demonstrate great higher
organizational commitment and dedication to an firm, which enables the firm to
improve its long term productivity with increasing sales growth (Bardzil & Slaski,
2003).
Therefore, it is important that sales people acquire considerable knowledge of
competence in emotional self-awareness, emotional expression, emotional awareness
of others, emotional reasoning, emotional self-management, emotional management
of others, and emotional self-control in order to achieve excellent performance and
manage the ability connected directly with organizational success. The Genos
Emotional Intelligence self-assessment model questionnaires were used where in
attempt to correlate the frequency of sales engineers in exhibiting emotionally
intelligence behaviours with sales performance. The emotional intelligence
behaviours of the sales engineers were identified, and then analysis was conducted to
establish any correlated relationship between EI and sales performance.
Emotional Intelligence (EI) is the ability to recognize and regulate one’s emotions. In
this research, sales engineer’s emotions are particularly important in sales because of
the need to engage, understand and motivate customers. Emotional intelligence helps
a sales person to become more authentic in their conversation with customers and
create positive relationships. Many sales people mostly communicate at the
superficial level of selling features and benefits with a one-size-fits-all approach.
Hence, the purpose of this research is to study the relationship between engineer’s
emotional intelligence behaviour and sales performance. In this context, sales person
refers to ABC Engineering sales engineers. Thus, the objective was to gain further
comprehension to improve in sales performance through understanding of emotional
intelligence and further guide in sales engineer’s recruitment. The research objectives
can be further detailed as follows: to identify the level of sales engineers exhibiting
emotional intelligence; to analyse the relationship between Engineers Emotional
Intelligence and Sales Performance as well as to develop the framework to be applied
by the management during recruitment process and in training and development.
2.0 LITERATURE REVIEW
Emotional Intelligence (EI) is a variable that can never be omitted because of its
significant effects on much organizational behaviour such as dedication to perform
tasks, ability to display leadership and commitment to a job. An estimated of 90% of
top performers in virtually every industry possess high emotional intelligence
(Kidwell, Hardesty, Murtha, & Sheng, 2012), suggesting that high emotional
intelligence would improve sales performance. The sales team is essential in the
business to business selling process (Kumar, Sunder, & Leone, 2014). Salespeople are
liable for a wide range of outcomes including customer relationships, retaining
customers, acquiring new customers, present sales, and long-term sales growth. Since
sales people are interacting often with customers are typical of service employees, a
high level of exhibiting emotional intelligence behaviours is very important for these
people. Hence, EI is predominantly needed by employees in close relationships with
customers. Sales people are required to use society-friendly emotional ability as well
as intellectual ability and effectively to cope with the diverse needs of customers
during interaction with customers (Tomer, 2003), which has significant effects will be

Proceedings of the 2nd
Master Project Symposium
78
exerted on their selling attitude. This demonstrates that sales people exhibiting higher
levels of emotional intelligence are more likely to have better sales performance.
3.0 METHODOLOGY
3.1 Research Design and Research Instrument
A quantitative method was applied to collect the primary data to analyse the
relationship between emotional intelligence behaviour and sales performance.The
secondary data collected from academic papers. The Genos Emotional Intelligence is
used as primary data collection which was designed specifically for the use in
workplace for training and development to aid human resources (HR) professionals
involved with identification, selection, training and development of employees
(Palmer, Stough, Harmer, & Gignac, 2009). It contains 70-item multi-rater assessment
which comprises a general factor of total EI, as well as seven oblique factors as
outlined in Table 1.
Table 1: Genos EI Model
EI Skill Description
Emotional Self-Awareness
The skill of perceiving and understanding one’s own
emotions
Emotional Expression The skill of effectively expressing one’s own emotions
Emotional Awareness of Others The skill of perceiving and understanding others’ emotions
Emotional Reasoning
The skill of utilizing emotional information in decision
making
Emotional Self-Management The skill of effectively managing one’s own emotions
Emotional Management of Others The skill of influencing the moods and emotions of others
Emotional Self-Control
The skill of effectively controlling strong emotions
experienced
Note: Adapted from The Genos Emotional Intelligence Inventory: A Measure Designed Specifically
for Workplace
Based on Genos Emotional Intelligence (EI) Inventory: Technical Manual, the EI
inventory is applicable for adults above 18 years old and is specific for workplace
setting as it has high workplace face validity. The total emotional intelligence scales
of this study had an acceptable internal consistency of Alpha Cronbach (α= 0.91). The
EI inventory items are scored on a 5-point Likert scale; ‘1=Almost Never‛,
‛2=Seldom‛, ‛3=Sometimes‛‚4=Usually‛ and ‚5=Almost Always‛. The total score will
represent the frequency how often an individual engages in an emotional intelligence
behaviours in their work settings, which in this research, it is focused to sales
department.
3.2 Data Collections and Procedures
The sample consisted of 50 sales engineers from sales department in ABC
Engineering. A total of 55 questionnaires were distributed however only 50 were
returned completely filled. Data for this research was collected using quantitative
research, which included sections on demographic profile, sales training, sales
performance and emotional intelligence. The frequency analysis obtained in this
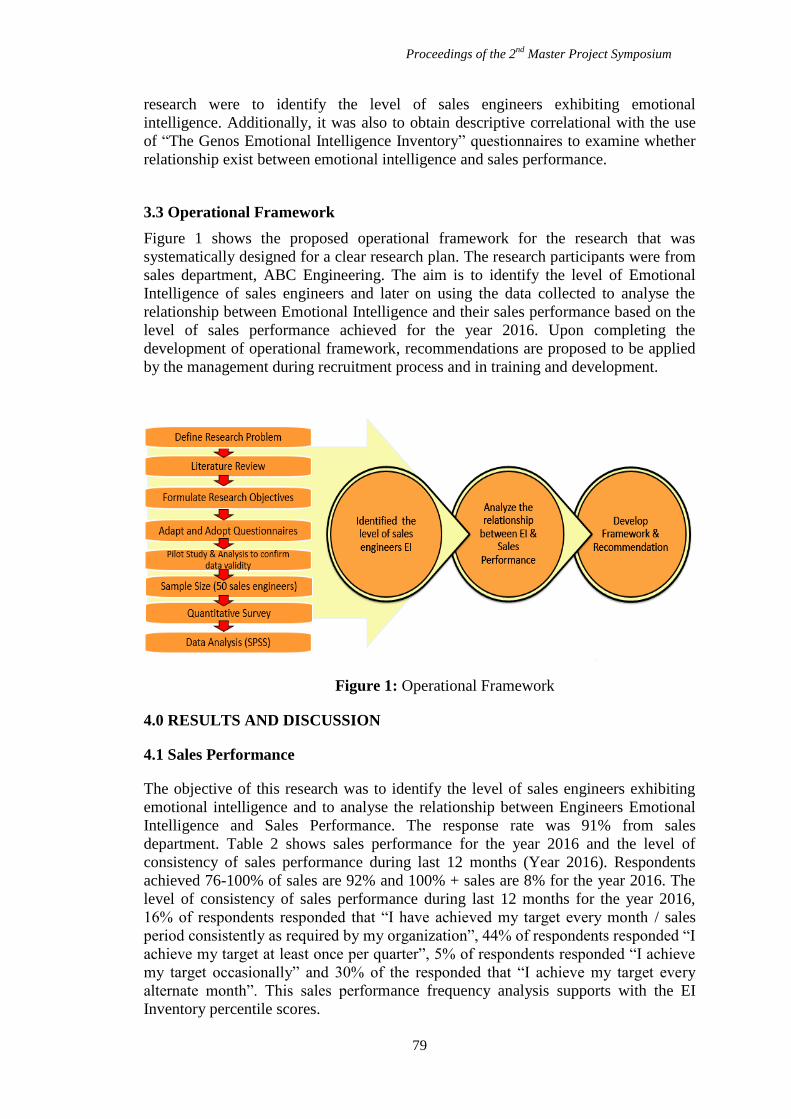
Proceedings of the 2nd
Master Project Symposium
79
research were to identify the level of sales engineers exhibiting emotional
intelligence. Additionally, it was also to obtain descriptive correlational with the use
of “The Genos Emotional Intelligence Inventory” questionnaires to examine whether
relationship exist between emotional intelligence and sales performance.
3.3 Operational Framework
Figure 1 shows the proposed operational framework for the research that was
systematically designed for a clear research plan. The research participants were from
sales department, ABC Engineering. The aim is to identify the level of Emotional
Intelligence of sales engineers and later on using the data collected to analyse the
relationship between Emotional Intelligence and their sales performance based on the
level of sales performance achieved for the year 2016. Upon completing the
development of operational framework, recommendations are proposed to be applied
by the management during recruitment process and in training and development.
Figure 1: Operational Framework
4.0 RESULTS AND DISCUSSION
4.1 Sales Performance
The objective of this research was to identify the level of sales engineers exhibiting
emotional intelligence and to analyse the relationship between Engineers Emotional
Intelligence and Sales Performance. The response rate was 91% from sales
department. Table 2 shows sales performance for the year 2016 and the level of
consistency of sales performance during last 12 months (Year 2016). Respondents
achieved 76-100% of sales are 92% and 100% + sales are 8% for the year 2016. The
level of consistency of sales performance during last 12 months for the year 2016,
16% of respondents responded that “I have achieved my target every month / sales
period consistently as required by my organization”, 44% of respondents responded “I
achieve my target at least once per quarter”, 5% of respondents responded “I achieve
my target occasionally” and 30% of the responded that “I achieve my target every
alternate month”. This sales performance frequency analysis supports with the EI
Inventory percentile scores.
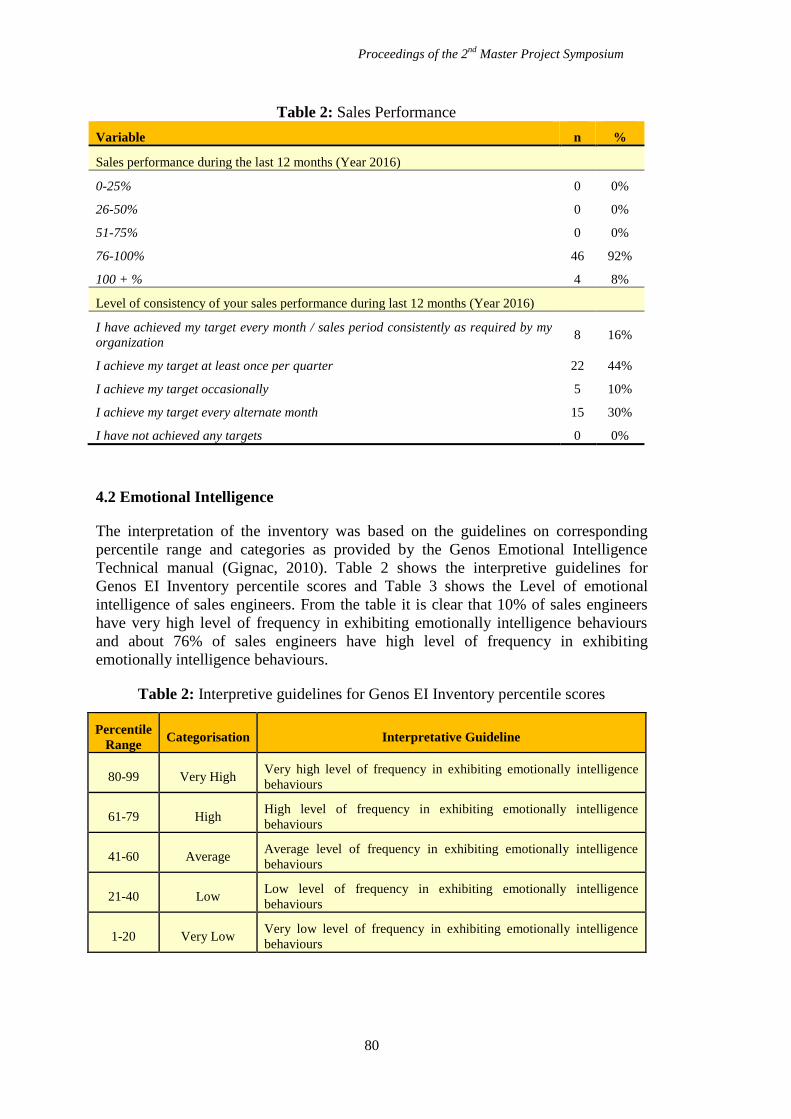
Proceedings of the 2nd
Master Project Symposium
80
Table 2: Sales Performance
Variable n %
Sales performance during the last 12 months (Year 2016)
0-25% 0 0%
26-50% 0 0%
51-75% 0 0%
76-100% 46 92%
100 + % 4 8%
Level of consistency of your sales performance during last 12 months (Year 2016)
I have achieved my target every month / sales period consistently as required by my
organization 8 16%
I achieve my target at least once per quarter 22 44%
I achieve my target occasionally 5 10%
I achieve my target every alternate month 15 30%
I have not achieved any targets 0 0%
4.2 Emotional Intelligence
The interpretation of the inventory was based on the guidelines on corresponding
percentile range and categories as provided by the Genos Emotional Intelligence
Technical manual (Gignac, 2010). Table 2 shows the interpretive guidelines for
Genos EI Inventory percentile scores and Table 3 shows the Level of emotional
intelligence of sales engineers. From the table it is clear that 10% of sales engineers
have very high level of frequency in exhibiting emotionally intelligence behaviours
and about 76% of sales engineers have high level of frequency in exhibiting
emotionally intelligence behaviours.
Table 2: Interpretive guidelines for Genos EI Inventory percentile scores
Percentile
Range Categorisation Interpretative Guideline
80-99 Very High Very high level of frequency in exhibiting emotionally intelligence
behaviours
61-79 High High level of frequency in exhibiting emotionally intelligence
behaviours
41-60 Average Average level of frequency in exhibiting emotionally intelligence
behaviours
21-40 Low Low level of frequency in exhibiting emotionally intelligence
behaviours
1-20 Very Low Very low level of frequency in exhibiting emotionally intelligence
behaviours
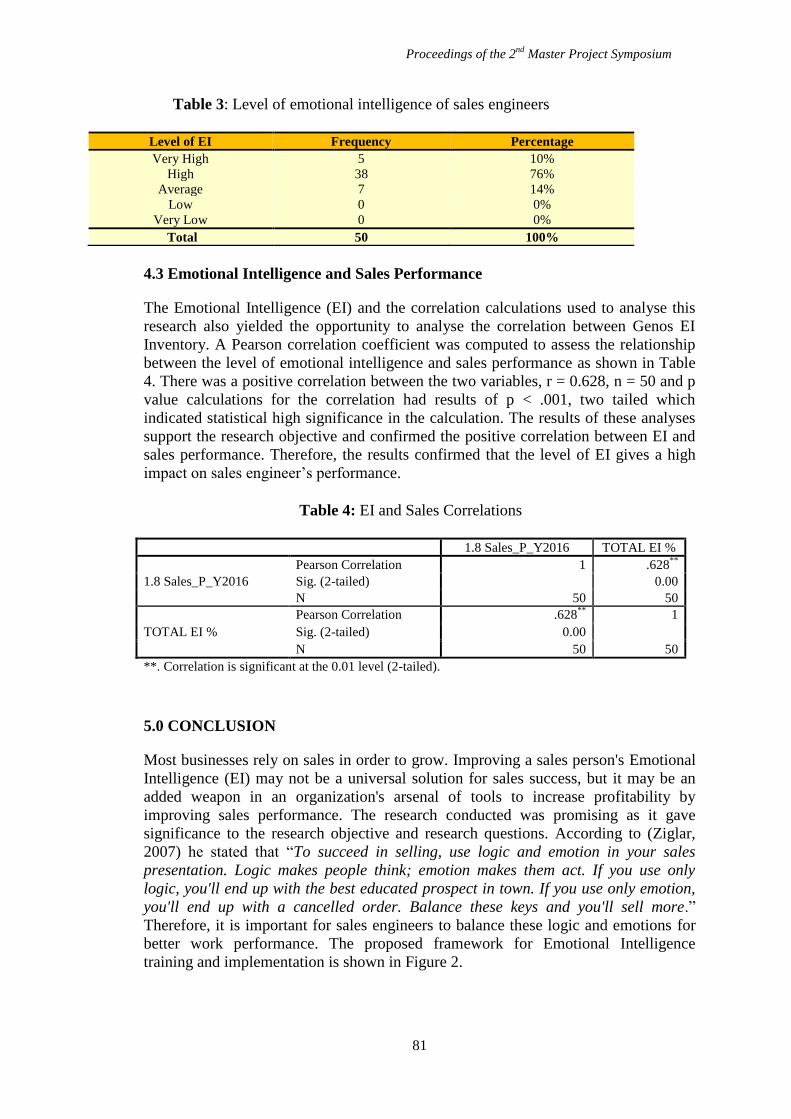
Proceedings of the 2nd
Master Project Symposium
81
4.3 Emotional Intelligence and Sales Performance
The Emotional Intelligence (EI) and the correlation calculations used to analyse this
research also yielded the opportunity to analyse the correlation between Genos EI
Inventory. A Pearson correlation coefficient was computed to assess the relationship
between the level of emotional intelligence and sales performance as shown in Table
4. There was a positive correlation between the two variables, r = 0.628, n = 50 and p
value calculations for the correlation had results of p < .001, two tailed which
indicated statistical high significance in the calculation. The results of these analyses
support the research objective and confirmed the positive correlation between EI and
sales performance. Therefore, the results confirmed that the level of EI gives a high
impact on sales engineer’s performance.
5.0 CONCLUSION
Most businesses rely on sales in order to grow. Improving a sales person's Emotional
Intelligence (EI) may not be a universal solution for sales success, but it may be an
added weapon in an organization's arsenal of tools to increase profitability by
improving sales performance. The research conducted was promising as it gave
significance to the research objective and research questions. According to (Ziglar,
2007) he stated that “To succeed in selling, use logic and emotion in your sales
presentation. Logic makes people think; emotion makes them act. If you use only
logic, you'll end up with the best educated prospect in town. If you use only emotion,
you'll end up with a cancelled order. Balance these keys and you'll sell more.”
Therefore, it is important for sales engineers to balance these logic and emotions for
better work performance. The proposed framework for Emotional Intelligence
training and implementation is shown in Figure 2.
Table 3: Level of emotional intelligence of sales engineers
Level of EI Frequency Percentage
Very High 5 10%
High 38 76%
Average 7 14%
Low 0 0%
Very Low 0 0%
Total 50 100%
Table 4: EI and Sales Correlations
1.8 Sales_P_Y2016 TOTAL EI %
1.8 Sales_P_Y2016
Pearson Correlation 1 .628**
Sig. (2-tailed) 0.00
N 50 50
TOTAL EI %
Pearson Correlation .628**
1
Sig. (2-tailed) 0.00
N 50 50
**. Correlation is significant at the 0.01 level (2-tailed).
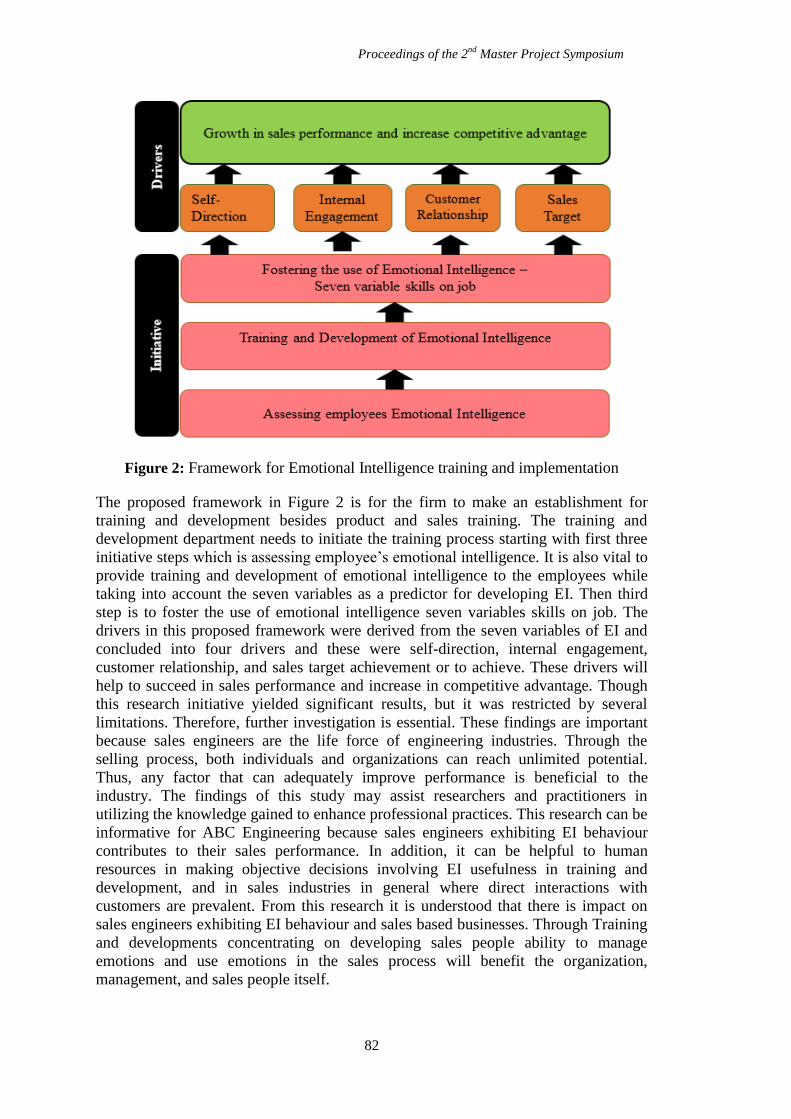
Proceedings of the 2nd
Master Project Symposium
82
Figure 2: Framework for Emotional Intelligence training and implementation
The proposed framework in Figure 2 is for the firm to make an establishment for
training and development besides product and sales training. The training and
development department needs to initiate the training process starting with first three
initiative steps which is assessing employee’s emotional intelligence. It is also vital to
provide training and development of emotional intelligence to the employees while
taking into account the seven variables as a predictor for developing EI. Then third
step is to foster the use of emotional intelligence seven variables skills on job. The
drivers in this proposed framework were derived from the seven variables of EI and
concluded into four drivers and these were self-direction, internal engagement,
customer relationship, and sales target achievement or to achieve. These drivers will
help to succeed in sales performance and increase in competitive advantage. Though
this research initiative yielded significant results, but it was restricted by several
limitations. Therefore, further investigation is essential. These findings are important
because sales engineers are the life force of engineering industries. Through the
selling process, both individuals and organizations can reach unlimited potential.
Thus, any factor that can adequately improve performance is beneficial to the
industry. The findings of this study may assist researchers and practitioners in
utilizing the knowledge gained to enhance professional practices. This research can be
informative for ABC Engineering because sales engineers exhibiting EI behaviour
contributes to their sales performance. In addition, it can be helpful to human
resources in making objective decisions involving EI usefulness in training and
development, and in sales industries in general where direct interactions with
customers are prevalent. From this research it is understood that there is impact on
sales engineers exhibiting EI behaviour and sales based businesses. Through Training
and developments concentrating on developing sales people ability to manage
emotions and use emotions in the sales process will benefit the organization,
management, and sales people itself.
Proceedings of the 2nd
Master Project Symposium
83
REFERENCES
Avlonitis, G. J., & Panagopoulos, N. G. (2010). Selling and sales management: An
introduction to the special section and recommendations on advancing the
sales research agenda. Industrial Marketing Management, 39(7), 1045-1048.
Bardzil, P., & Slaski, M. (2003). Emotional intelligence: Fundamental competencies
for enhanced service provision. Managing Service Quality: An International
Journal, 13(2), 97-104.
Gignac, G. E. (2010). Genos Emotional Intelligence Inventory. Technical Manual
(2nd Ed.), Sydney, Waterloo, NSW, 10-36.
Giorgi, G., Mancuso, S., & Perez, F. J. F. (2014). Organizational emotional
intelligence and top selling. Europe’s Journal of Psychology, 10(4), 712-725.
Kidwell, B., Hardesty, D. M., Murtha, B. R., & Sheng, S. (2012). A closer look at
emotional intelligence in marketing exchange. GfK Marketing Intelligence
Review, 4(1), 24-31.
Kumar, V., Sunder, S., & Leone, R. P. (2014). Measuring and managing a
salesperson's future value to the firm. Journal of Marketing research, 51(5),
591-608.
Palmer, B. R., Stough, C., Harmer, R., & Gignac, G. (2009). The Genos Emotional
Intelligence Inventory: A measure designed specifically for workplace
applications Assessing Emotional Intelligence (pp. 103-117): Springer.
Rojell, E. J., Pettijohn, C. E., & Parker, R. S. (2006). Emotional intelligence and
dispositional affectivity as predictors of performance in salespeople. Journal
of Marketing Theory and Practice, 14(2), 113-124.
Tomer, J. F. (2003). Personal capital and emotional intelligence: an increasingly
important intangible source of economic growth. Eastern Economic Journal,
29(3), 453-470.
Ziglar, Z. (2007). Ziglar on selling: The ultimate handbook for the complete sales
professional: Thomas Nelson Inc.
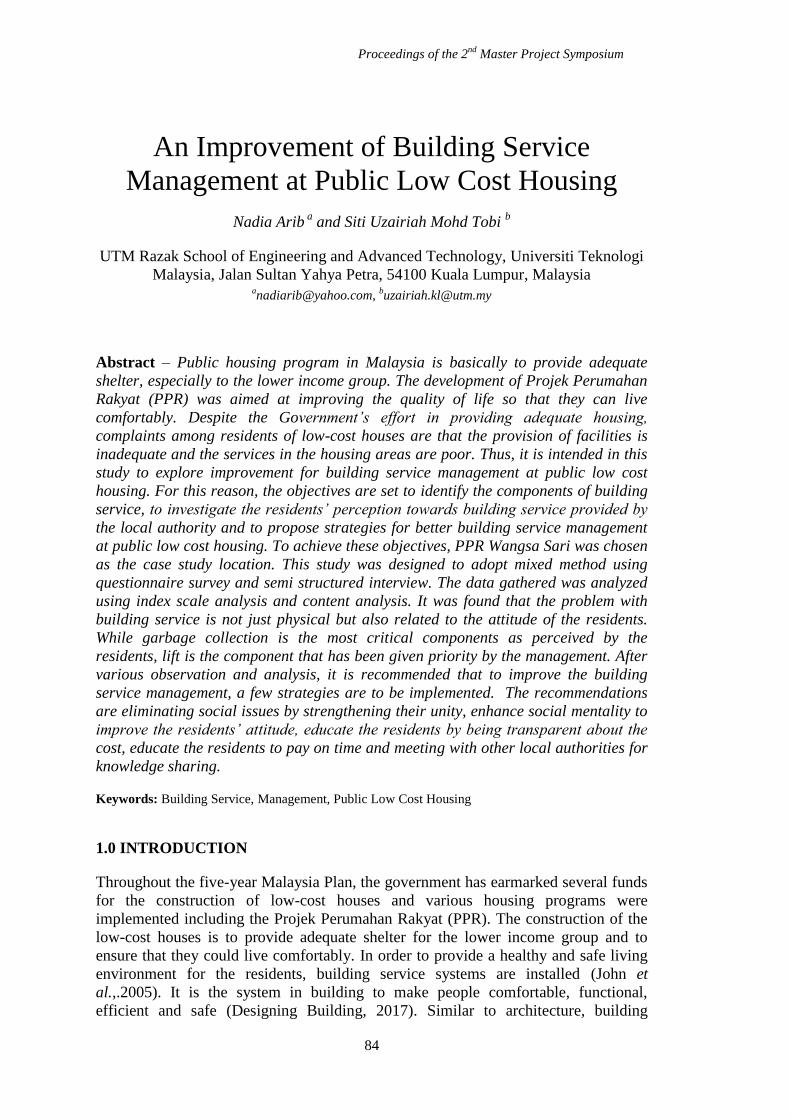
Proceedings of the 2nd
Master Project Symposium
84
An Improvement of Building Service
Management at Public Low Cost Housing
Nadia Arib a and Siti Uzairiah Mohd Tobi
b
UTM Razak School of Engineering and Advanced Technology, Universiti Teknologi
Malaysia, Jalan Sultan Yahya Petra, 54100 Kuala Lumpur, Malaysia [email protected],
Abstract – Public housing program in Malaysia is basically to provide adequate
shelter, especially to the lower income group. The development of Projek Perumahan
Rakyat (PPR) was aimed at improving the quality of life so that they can live
comfortably. Despite the Government’s effort in providing adequate housing,
complaints among residents of low-cost houses are that the provision of facilities is
inadequate and the services in the housing areas are poor. Thus, it is intended in this
study to explore improvement for building service management at public low cost
housing. For this reason, the objectives are set to identify the components of building
service, to investigate the residents’ perception towards building service provided by
the local authority and to propose strategies for better building service management
at public low cost housing. To achieve these objectives, PPR Wangsa Sari was chosen
as the case study location. This study was designed to adopt mixed method using
questionnaire survey and semi structured interview. The data gathered was analyzed
using index scale analysis and content analysis. It was found that the problem with
building service is not just physical but also related to the attitude of the residents.
While garbage collection is the most critical components as perceived by the
residents, lift is the component that has been given priority by the management. After
various observation and analysis, it is recommended that to improve the building
service management, a few strategies are to be implemented. The recommendations
are eliminating social issues by strengthening their unity, enhance social mentality to
improve the residents’ attitude, educate the residents by being transparent about the
cost, educate the residents to pay on time and meeting with other local authorities for
knowledge sharing.
Keywords: Building Service, Management, Public Low Cost Housing
1.0 INTRODUCTION
Throughout the five-year Malaysia Plan, the government has earmarked several funds
for the construction of low-cost houses and various housing programs were
implemented including the Projek Perumahan Rakyat (PPR). The construction of the
low-cost houses is to provide adequate shelter for the lower income group and to
ensure that they could live comfortably. In order to provide a healthy and safe living
environment for the residents, building service systems are installed (John et
al.,.2005). It is the system in building to make people comfortable, functional,
efficient and safe (Designing Building, 2017). Similar to architecture, building
Proceedings of the 2nd
Master Project Symposium
85
services are much required for the comfort, convenience and environmentally friendly
operation of buildings (Ramli et al.).
1.1 Problem Statement
Despite Malaysian government’s effort in providing adequate housing, the complaint
among residents of low-cost houses is that the provision of facilities is inadequate and
the services in the housing areas are poor. This situation if not properly addressed
may ultimately create a stressful living environment. Challenges faced by Malaysia is
not only in providing affordable housing for the low income group but also in keeping
the unit in good health so that it can serve its intended functions throughout its entire
lifespan without drastically upsetting its basic features and use so that people can live
and work in harmony (Samikon et al., 2013).
A number of reasons may be adduced on why building performs poorly in meeting
users’ need and expectation. What is considered as important by the residents and
maintenance department may differ and the disagreement on the priority order of
completing maintenance demand may result in residents’ dissatisfaction over the state
of repair of the building (Abdullah et al., 2012 ). Whenever deficiencies in the public
building are encountered, it is expected of the government’s responsibilities to plan
implementation strategies if it requires any physical construction. According to Salleh
et al. (2011), the role played by the management in managing the housing
environment is crucial especially in tenanted housing. A classical study suggested that
good housing management could increase the degree contentment of tenants in their
housing (Onibokun et al., 1974). For this reason, the need to investigate the residents’
perception towards building service in low-cost housing has become necessary in
order to foresee the requirements for building management strategy.
1.2 Objective of Study
There are several objectives of the study that has been identified. The objectives are:
1) To identify the components of building service
2) To investigate residents’ perception towards building service by local authority
3) To propose strategies for better building service management at PPR
2.0 LITERATURE REVIEW
Studies on housing have gone past the investigation of the physical, structural and
functional fundamentals of one's regional center called "house" (Hayward, 1977 and
Lawrence and Roderick, 1987). Increasing interest is presently demonstrated towards
the investigation of residents’ perception, how individuals view or think about their
housing and how it influences their lives. In building research, perception evaluation
is a means to understand the force that drives residents’ needs and enables facilities
managers to make decisions and improvements to meet those needs (Aye et al.,
2005).
2.1 Building Service
Building service refers to the design, installation, operation and monitoring of the
mechanical and electrical system such as electrical supply, lighting, ventilation,
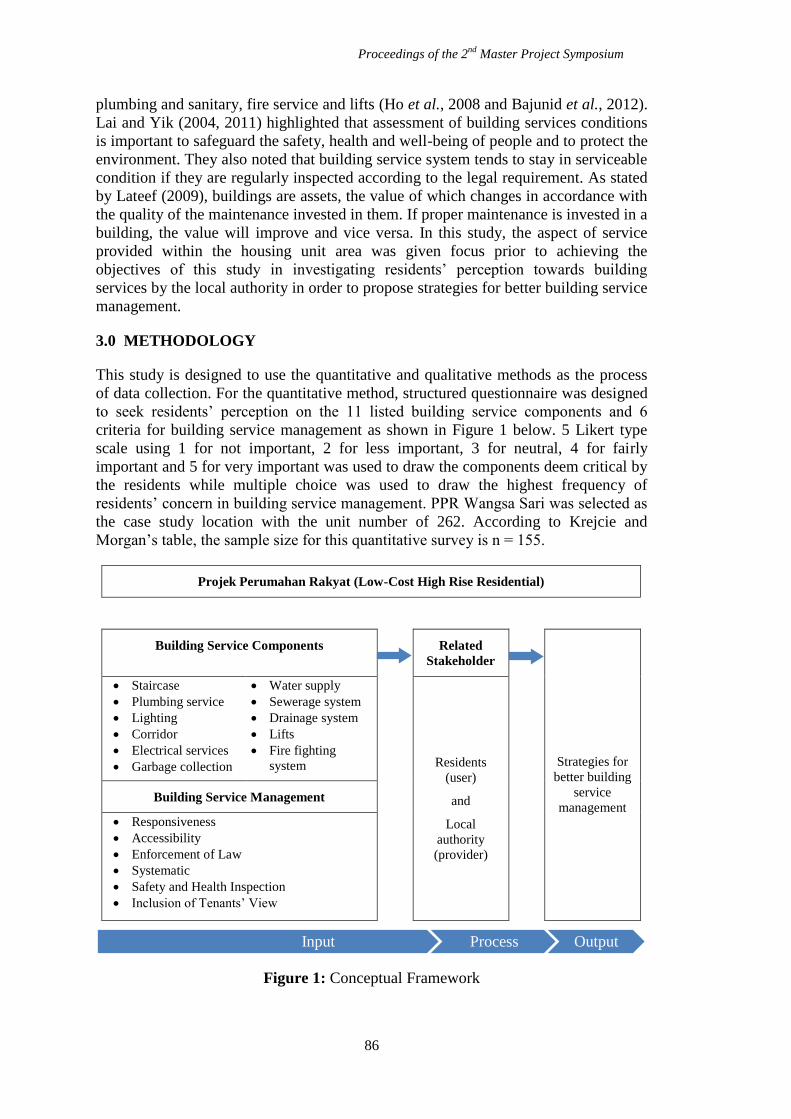
Proceedings of the 2nd
Master Project Symposium
86
plumbing and sanitary, fire service and lifts (Ho et al., 2008 and Bajunid et al., 2012).
Lai and Yik (2004, 2011) highlighted that assessment of building services conditions
is important to safeguard the safety, health and well-being of people and to protect the
environment. They also noted that building service system tends to stay in serviceable
condition if they are regularly inspected according to the legal requirement. As stated
by Lateef (2009), buildings are assets, the value of which changes in accordance with
the quality of the maintenance invested in them. If proper maintenance is invested in a
building, the value will improve and vice versa. In this study, the aspect of service
provided within the housing unit area was given focus prior to achieving the
objectives of this study in investigating residents’ perception towards building
services by the local authority in order to propose strategies for better building service
management.
3.0 METHODOLOGY
This study is designed to use the quantitative and qualitative methods as the process
of data collection. For the quantitative method, structured questionnaire was designed
to seek residents’ perception on the 11 listed building service components and 6
criteria for building service management as shown in Figure 1 below. 5 Likert type
scale using 1 for not important, 2 for less important, 3 for neutral, 4 for fairly
important and 5 for very important was used to draw the components deem critical by
the residents while multiple choice was used to draw the highest frequency of
residents’ concern in building service management. PPR Wangsa Sari was selected as
the case study location with the unit number of 262. According to Krejcie and
Morgan’s table, the sample size for this quantitative survey is n = 155.
Projek Perumahan Rakyat (Low-Cost High Rise Residential)
Building Service Components Related
Stakeholder
Strategies for
better building
service
management
Staircase
Plumbing service
Lighting
Corridor
Electrical services
Garbage collection
Water supply
Sewerage system
Drainage system
Lifts
Fire fighting
system
Residents
(user)
and
Local
authority
(provider)
Building Service Management
Responsiveness
Accessibility
Enforcement of Law
Systematic
Safety and Health Inspection
Inclusion of Tenants’ View
Figure 1: Conceptual Framework
Input Process Output
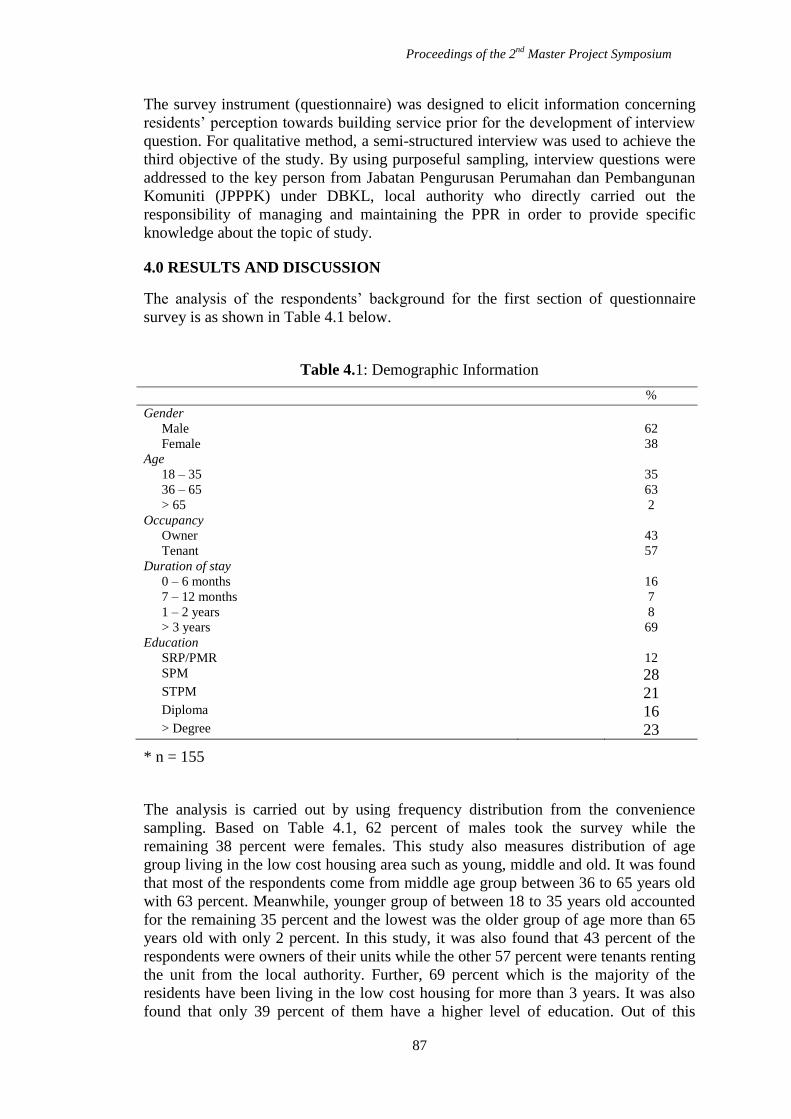
Proceedings of the 2nd
Master Project Symposium
87
The survey instrument (questionnaire) was designed to elicit information concerning
residents’ perception towards building service prior for the development of interview
question. For qualitative method, a semi-structured interview was used to achieve the
third objective of the study. By using purposeful sampling, interview questions were
addressed to the key person from Jabatan Pengurusan Perumahan dan Pembangunan
Komuniti (JPPPK) under DBKL, local authority who directly carried out the
responsibility of managing and maintaining the PPR in order to provide specific
knowledge about the topic of study.
4.0 RESULTS AND DISCUSSION
The analysis of the respondents’ background for the first section of questionnaire
survey is as shown in Table 4.1 below.
Table 4.1: Demographic Information
%
Gender
Male 62
Female 38
Age
18 – 35 35
36 – 65 63
> 65 2
Occupancy
Owner 43
Tenant 57
Duration of stay
0 – 6 months 16
7 – 12 months 7
1 – 2 years 8
> 3 years 69
Education
SRP/PMR 12
SPM 28 STPM 21 Diploma 16 > Degree 23
* n = 155
The analysis is carried out by using frequency distribution from the convenience
sampling. Based on Table 4.1, 62 percent of males took the survey while the
remaining 38 percent were females. This study also measures distribution of age
group living in the low cost housing area such as young, middle and old. It was found
that most of the respondents come from middle age group between 36 to 65 years old
with 63 percent. Meanwhile, younger group of between 18 to 35 years old accounted
for the remaining 35 percent and the lowest was the older group of age more than 65
years old with only 2 percent. In this study, it was also found that 43 percent of the
respondents were owners of their units while the other 57 percent were tenants renting
the unit from the local authority. Further, 69 percent which is the majority of the
residents have been living in the low cost housing for more than 3 years. It was also
found that only 39 percent of them have a higher level of education. Out of this
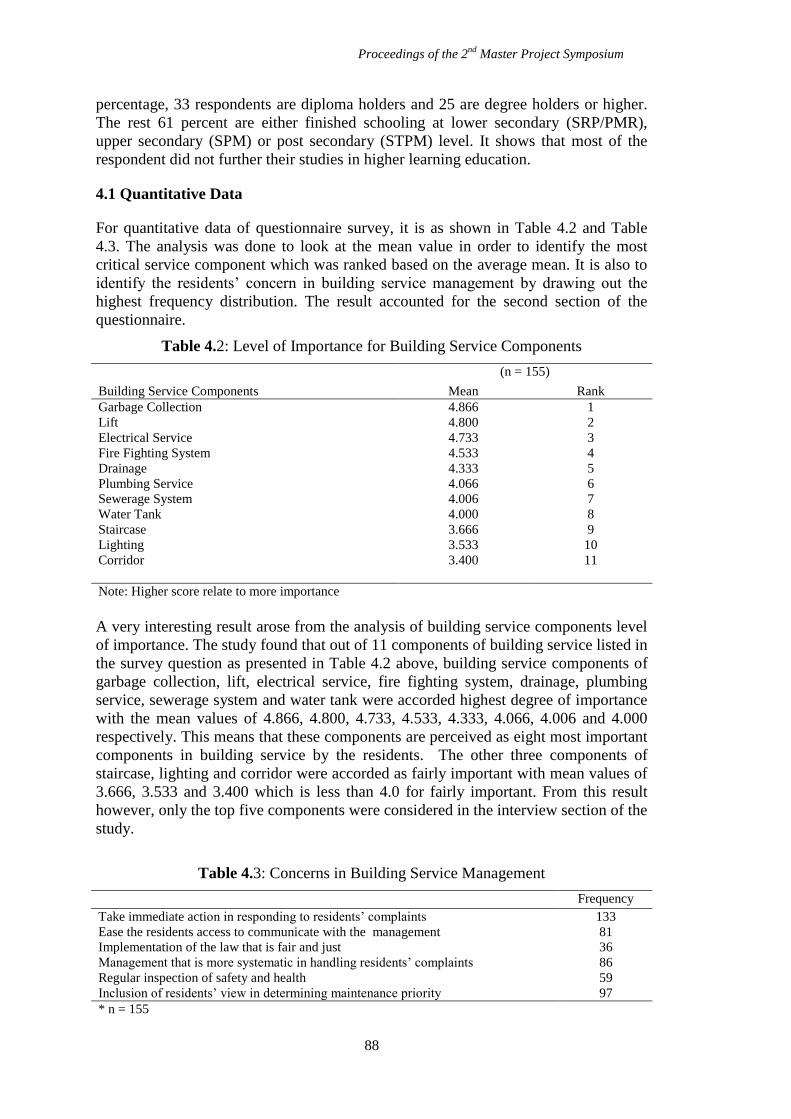
Proceedings of the 2nd
Master Project Symposium
88
percentage, 33 respondents are diploma holders and 25 are degree holders or higher.
The rest 61 percent are either finished schooling at lower secondary (SRP/PMR),
upper secondary (SPM) or post secondary (STPM) level. It shows that most of the
respondent did not further their studies in higher learning education.
4.1 Quantitative Data
For quantitative data of questionnaire survey, it is as shown in Table 4.2 and Table
4.3. The analysis was done to look at the mean value in order to identify the most
critical service component which was ranked based on the average mean. It is also to
identify the residents’ concern in building service management by drawing out the
highest frequency distribution. The result accounted for the second section of the
questionnaire.
Table 4.2: Level of Importance for Building Service Components
(n = 155)
Building Service Components Mean Rank
Garbage Collection 4.866 1
Lift 4.800 2
Electrical Service 4.733 3
Fire Fighting System 4.533 4
Drainage 4.333 5
Plumbing Service 4.066 6
Sewerage System 4.006 7
Water Tank 4.000 8
Staircase 3.666 9
Lighting 3.533 10
Corridor 3.400 11
Note: Higher score relate to more importance
A very interesting result arose from the analysis of building service components level
of importance. The study found that out of 11 components of building service listed in
the survey question as presented in Table 4.2 above, building service components of
garbage collection, lift, electrical service, fire fighting system, drainage, plumbing
service, sewerage system and water tank were accorded highest degree of importance
with the mean values of 4.866, 4.800, 4.733, 4.533, 4.333, 4.066, 4.006 and 4.000
respectively. This means that these components are perceived as eight most important
components in building service by the residents. The other three components of
staircase, lighting and corridor were accorded as fairly important with mean values of
3.666, 3.533 and 3.400 which is less than 4.0 for fairly important. From this result
however, only the top five components were considered in the interview section of the
study.
Table 4.3: Concerns in Building Service Management
Frequency
Take immediate action in responding to residents’ complaints 133
Ease the residents access to communicate with the management 81
Implementation of the law that is fair and just 36
Management that is more systematic in handling residents’ complaints 86
Regular inspection of safety and health 59
Inclusion of residents’ view in determining maintenance priority 97
* n = 155
Proceedings of the 2nd
Master Project Symposium
89
Based on the frequency distribution, the residents are most concern with the
management responsiveness with the frequency distribution of 133. The residents
want the management to take immediate action in responding to residents’ complaints
as part of the method for improvement.
4.2 Qualitative Data
The analysis of interview transcript was done by using content analysis in order to
identify the emerging pattern from the respondents that have been interviewed. The
respondents are the 3 main officers chosen based on their criteria because they are the
main officers that manage the PPR. For the qualitative data, the discussions are
structured to look at the four main contexts of study which are the building service
components, building service management, maintenance fund and Government
initiatives in improving building service management. Results from the content
analysis done from the interview data are summarized as shown in Table 4.4.
Based on the result obtained, recommendations for appropriate strategies in
improving building service management are:
• Eliminate social issues by strengthening their unity.
DBKL can help the residents by providing assistant and all the help they need to
empower their residential association so that they can be heard by the public. Such
support can be in terms of providing space for them to carry out their activities or
by providing channels for advertising their programme for the residents.
• Social mentality to improve the residents’ attitude
Scheduled talk or seminars should be provided to the residents regarding the
attitude, vandalism, cleanliness and living in harmony. The content of the talk
should emphasize on how crucial it is to implement good values for a prosperous
living in the neighborhood and how their attitude can have an impact on the
properties health.
• Educate the residents about the cost of maintaining the services
Local authority should educate the residents by being transparent about the cost of
maintaining the services. Explain how cooperation from the residents in taking
care of their units as well as their related surrounding areas is very important in
order to keep the building in good health so that it can serve its intended
functions.
• Educate residents to pay on time
The low rentals that are charged to the residents are already making it hard for the
local authority to maintain the provided service efficiently. Therefore, the
residents need to know the importance of paying the rental if they want to live
comfortably.
• Meeting with other Local Authority for knowledge sharing
Local authorities should once in a while make a group meeting to discuss among
them the best strategies in maintaining the services. They can make a comparison
on how they manage their property and how they handle the residents to come out
with the most successful method for management.
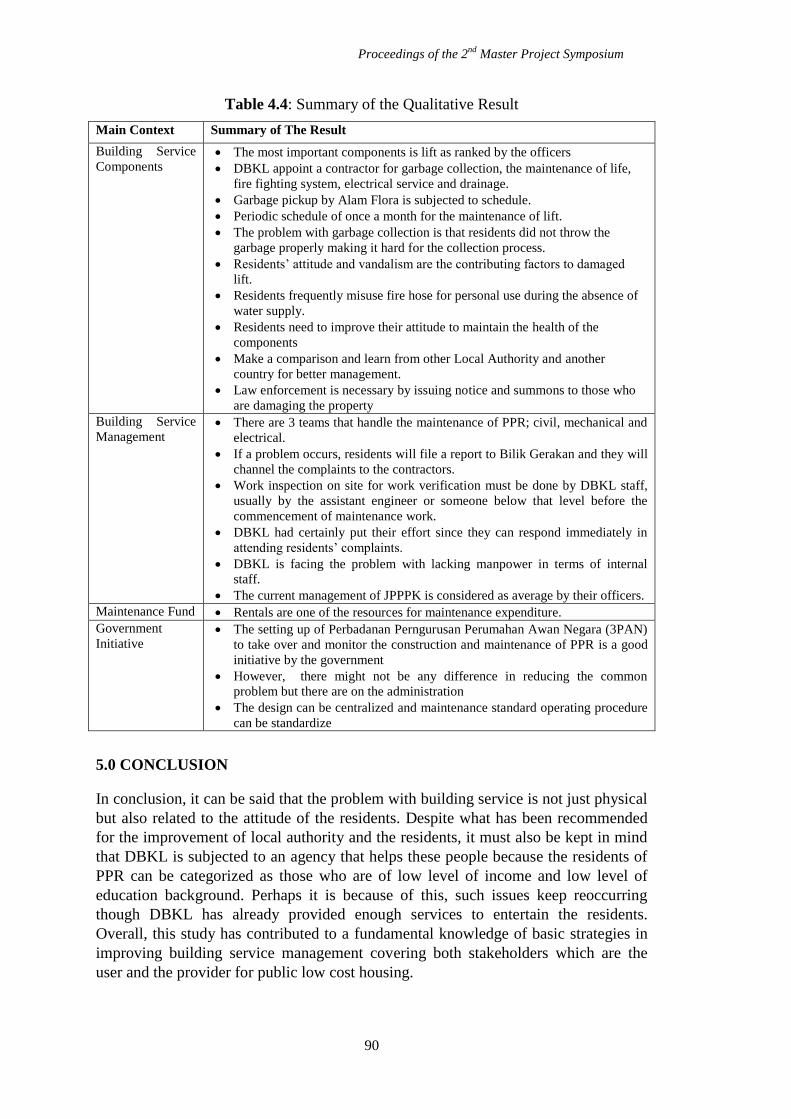
Proceedings of the 2nd
Master Project Symposium
90
Table 4.4: Summary of the Qualitative Result
Main Context Summary of The Result
Building Service
Components The most important components is lift as ranked by the officers
DBKL appoint a contractor for garbage collection, the maintenance of life,
fire fighting system, electrical service and drainage.
Garbage pickup by Alam Flora is subjected to schedule.
Periodic schedule of once a month for the maintenance of lift.
The problem with garbage collection is that residents did not throw the
garbage properly making it hard for the collection process.
Residents’ attitude and vandalism are the contributing factors to damaged
lift.
Residents frequently misuse fire hose for personal use during the absence of
water supply.
Residents need to improve their attitude to maintain the health of the
components
Make a comparison and learn from other Local Authority and another
country for better management.
Law enforcement is necessary by issuing notice and summons to those who
are damaging the property
Building Service
Management There are 3 teams that handle the maintenance of PPR; civil, mechanical and
electrical.
If a problem occurs, residents will file a report to Bilik Gerakan and they will
channel the complaints to the contractors.
Work inspection on site for work verification must be done by DBKL staff,
usually by the assistant engineer or someone below that level before the
commencement of maintenance work.
DBKL had certainly put their effort since they can respond immediately in
attending residents’ complaints.
DBKL is facing the problem with lacking manpower in terms of internal
staff.
The current management of JPPPK is considered as average by their officers.
Maintenance Fund Rentals are one of the resources for maintenance expenditure.
Government
Initiative The setting up of Perbadanan Perngurusan Perumahan Awan Negara (3PAN)
to take over and monitor the construction and maintenance of PPR is a good
initiative by the government
However, there might not be any difference in reducing the common
problem but there are on the administration
The design can be centralized and maintenance standard operating procedure
can be standardize
5.0 CONCLUSION
In conclusion, it can be said that the problem with building service is not just physical
but also related to the attitude of the residents. Despite what has been recommended
for the improvement of local authority and the residents, it must also be kept in mind
that DBKL is subjected to an agency that helps these people because the residents of
PPR can be categorized as those who are of low level of income and low level of
education background. Perhaps it is because of this, such issues keep reoccurring
though DBKL has already provided enough services to entertain the residents.
Overall, this study has contributed to a fundamental knowledge of basic strategies in
improving building service management covering both stakeholders which are the
user and the provider for public low cost housing.
Proceedings of the 2nd
Master Project Symposium
91
REFERENCES
Abdullah, Shardy, Sarah Zubedy, and Nurul‘Ulyani Mohd Najib (2012):. Residents’
maintenance priorities preference: The case of public housing in
Malaysia. Procedia-Social and Behavioral Sciences 62, 508-513.
Aye, Lu, W. W. S. Charters, M. Chiazor, and J. R. W. Robinson 2005. Evaluation of
occupant perception and satisfaction in two new office buildings. In
Renewable Energy for a Sustainable Future–a challenge for a post carbon
world, in: Proceedings of the 43rd Annual conference of Australian and New
Zealand Solar Energy Society, pp. 1-8.
Bajunid, Anniz Fazli Ibrahim, and Mazlin Ghazali (2012). Affordable mosaic
housing: rethinking low-cost housing. Procedia-Social and Behavioral
Sciences 49, 245-256.
Designing Buildings. “Building services engineer. Designing Buildings Wiki.
https://www.designingbuildings.co.uk/wiki/Building_services_engineer
(accessed May 2, 2017).
Hayward, G. D (1977). Housing research and the concept of home. Housing Educator
Journal 4, no. 3, 110–121.
Ho, Daniel Chi-Wing, Kwong-Wing Chau, Alex King-Chung Cheung, Yung Yau,
Siu-Kei Wong, Hing-Fung Leung, Stephen Siu-Yu Lau, and Wah-Sang Wong
(2008). A survey of the health and safety conditions of apartment buildings in
Hong Kong. Building and Environment 43, no. 5, 764-775.
John, G. A., D. J. Clements-Croome, V. Fairey, and H. M. Loy (2005). Contextual
prerequisites for the application of ILS principles to the building services
industry. Engineering, Construction and Architectural Management 12, no. 4,
307-328.
Lai, Joseph HK, and Francis WH Yik (2004). Law and building services maintenance
in Hong Kong. HKIE transactions 11, no. 1, 7-14.
Lai, Joseph HK, and Francis WH Yik (2011). An analytical method to evaluate
facility management services for residential buildings. Building and
Environment 46, no. 1, 165-175.
Lateef, Olanrewaju Abdul (2009). Building maintenance management in
Malaysia. Journal of Building Appraisal 4, no. 3, 207-214.
Lawrence, Roderick J. What makes a house a home?. Environment and Behavior 19,
no. 2 (1987): 154-168.
Onibokun, Adepoju G. Evaluating consumers' satisfaction with housing: An
application of a systems approach. Journal of the American Institute of
Planners 40, no. 3 (1974): 189-200.
Ramli, Azuin, Zainal Abidin Akasah, and Mohd Idrus Mohd Masirin. Assessing
Safety and Health Factors Influencing Performance of Malaysian Low-Cost
Housing.
Salleh, Nor Aini, Nor'Aini Yusof, Abdul Ghani Salleh, and Noraini Johari (2011).
Tenant satisfaction in public housing and its relationship with rent arrears:
Majlis Bandaraya Ipoh, Perak, Malaysia. International Journal of Trade,
Economics and Finance 2, no. 1, 10.
Samikon, S., Z. U. L. H. A. B. R. I. Ismail, A. Hashim, and N. Nasir (2013).
Managing adaptation in low-cost public housing: A conceptual
framework. Energy, Environmental and Structural Engineering Series 9.
Proceedings of the 2nd
Master Project Symposium
92
Lean Manufacturing System for Production
Improvement Using Line Balancing and
Kaizen Approach
Ahmad Syazwan Afiq Abdul Karima, Siti Armiza Mohd Aris
b, Nurul Aini Bani
c, and
Abdul Yasser Abd Fatahd
UTM Razak School of Engineering and Advanced Technology, Universiti Teknologi
Malaysia, Jalan Sultan Yahya Petra, 54100 Kuala Lumpur, Malaysia [email protected],
Abstract – This project presents optimization and efficiency improvement of the
automotive production line for Instrument Panel by using line balancing in Perodua
Global Manufacturing Sdn. Bhd. (PGM). Implementation of Lean to regulate works
on floor has increased the manufacturing performance. Several improvement steps
have been applied throughout the project to measure the impact of improving the
current system such as rearranging the layout of the parts rack, eliminating
unnecessary activities of the assembly processes, reducing the cycle time, and
balancing manpower workload using line balancing techniques such as Yamazumi
chart and Kaizen Activity. The The results obtained from the implementation of these
techniques have been compared with the pre-implementation data to observe the
significance of the improvement made. It is hoped that the continuous improvement
made would help the company to implement Kaizen techniques in other parts of the
assembly process.
Keywords: Lean Manufacturing, Line Balancing, Kaizen, Eliminate Waste
1.0 INTRODUCTION
Lean manufacturing, lean enterprise, or lean production, often simply, "lean", is a
production practice that considers the expenditure of resources for any goal other than
the creation of value for the end customer to be wasteful, and thus a target for
elimination (Rose et al., 2011). Working from the perspective of the customer who
consumes a product or service, "value" is defined as any action or process that a
customer would be willing to pay for, with the approach to ideally design the
processes and to harmonize them in a way that they perfectly fit together. To do so,
all unnecessary items are identified and the process is designed to be as lean as
possible (Okpala, 2014). The targets: maximum efficiency, clearly defined
responsibilities, accurately described processes, traceable ways of communication.
For process optimization, kaizen as coined in Japanese is a management concept,
which focuses on the gradual improvement of processes and on the development of
people so that they are able to solve the problems and the desired results can be
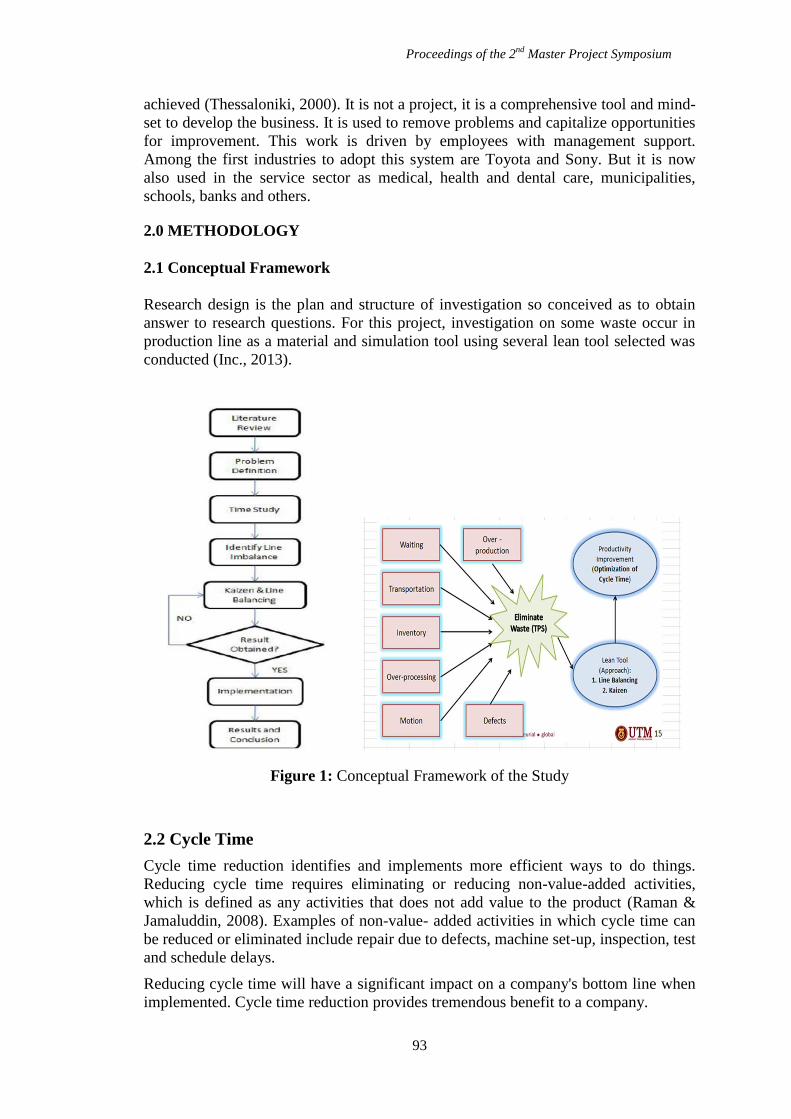
Proceedings of the 2nd
Master Project Symposium
93
achieved (Thessaloniki, 2000). It is not a project, it is a comprehensive tool and mind-
set to develop the business. It is used to remove problems and capitalize opportunities
for improvement. This work is driven by employees with management support.
Among the first industries to adopt this system are Toyota and Sony. But it is now
also used in the service sector as medical, health and dental care, municipalities,
schools, banks and others.
2.0 METHODOLOGY
2.1 Conceptual Framework
Research design is the plan and structure of investigation so conceived as to obtain
answer to research questions. For this project, investigation on some waste occur in
production line as a material and simulation tool using several lean tool selected was
conducted (Inc., 2013).
Figure 1: Conceptual Framework of the Study
2.2 Cycle Time
Cycle time reduction identifies and implements more efficient ways to do things.
Reducing cycle time requires eliminating or reducing non-value-added activities,
which is defined as any activities that does not add value to the product (Raman &
Jamaluddin, 2008). Examples of non-value- added activities in which cycle time can
be reduced or eliminated include repair due to defects, machine set-up, inspection, test
and schedule delays.
Reducing cycle time will have a significant impact on a company's bottom line when
implemented. Cycle time reduction provides tremendous benefit to a company.

Proceedings of the 2nd
Master Project Symposium
94
Formulation ;
2.3 Yamazumi Chart
Yamazumi is a Japanese word that literally means to stack up. Process tasks are
individually represented in a stacked bar chart, and these can be categorized as either
Value Added, Non-Value Added or Waste. The mean duration time of each task is
recorded and displayed within the bar chart. Each of the process tasks is stacked to
represent the entire process step (Becker, 1998). The Yamazumi chart can be used for
both Waste Elimination or Line Balancing activity. Process steps can be rearranged or
deleted to optimise and balance the target process.
Formulation ;
3.0 CASE STUDY
The aim of the paper is to eliminate waste condition in Instrument Panel (IP)
Assembly Line Shop at Perodua. The study was carried out to overcome the delays
that occurs in the transfer process by supply operator. What can be seen is part of a
sub part assembly line to IP main line did not follow a predetermined time round.
Through preliminary observations, it was found that the operator had to wait a long
time due to supply trolley waiting in the sub assembly buffer until full. The next
chapter will discuss on the method to rectify this issue.
3.1 Observation of Process Layout
Dashboard assembly production line of the PGM consists of five workstation main
lines, four workstation subs, three workstation SPS, and two quality gates. Each
workstation carry out different processes with specific work sequences to produce one
complete product. The main activity in PGM is assembling of dashboard. During the
observation, essential data such as waste on part handling and production flow had
been gathered for the analysis purpose. The workstations layout at the automotive
dashboard assembly production line are shown in Figure-2.
Man Power = Total Workstation CT /
Tact Time
(CT : Cycle Time)
Tact Time = PT day /
Customer Demand day
(PT : Production Time)
Efficiency = Total Workstation CT /
TT x Number of Workers
(TT : Tact Time)
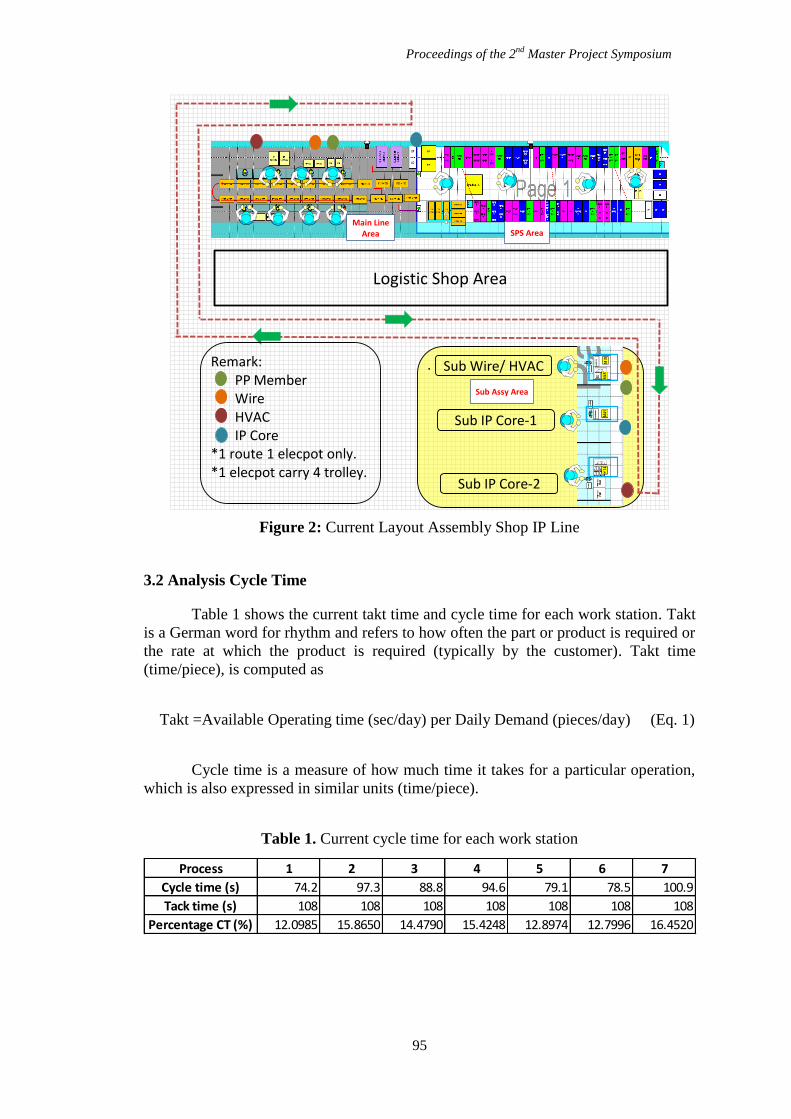
Proceedings of the 2nd
Master Project Symposium
95
Figure 2: Current Layout Assembly Shop IP Line
3.2 Analysis Cycle Time
Table 1 shows the current takt time and cycle time for each work station. Takt
is a German word for rhythm and refers to how often the part or product is required or
the rate at which the product is required (typically by the customer). Takt time
(time/piece), is computed as
Takt =Available Operating time (sec/day) per Daily Demand (pieces/day) (Eq. 1)
Cycle time is a measure of how much time it takes for a particular operation,
which is also expressed in similar units (time/piece).
Table 1. Current cycle time for each work station
.
Logistic Shop Aread
Sub Wire/ HVAC
Sub IP Core-1
Sub IP Core-2
Remark:PP MemberWireHVACIP Core
*1 route 1 elecpot only.*1 elecpot carry 4 trolley.
SPS AreaMain Line
Area
Sub Assy Area
Process 1 2 3 4 5 6 7
Cycle time (s) 74.2 97.3 88.8 94.6 79.1 78.5 100.9
Tack time (s) 108 108 108 108 108 108 108
Percentage CT (%) 12.0985 15.8650 14.4790 15.4248 12.8974 12.7996 16.4520
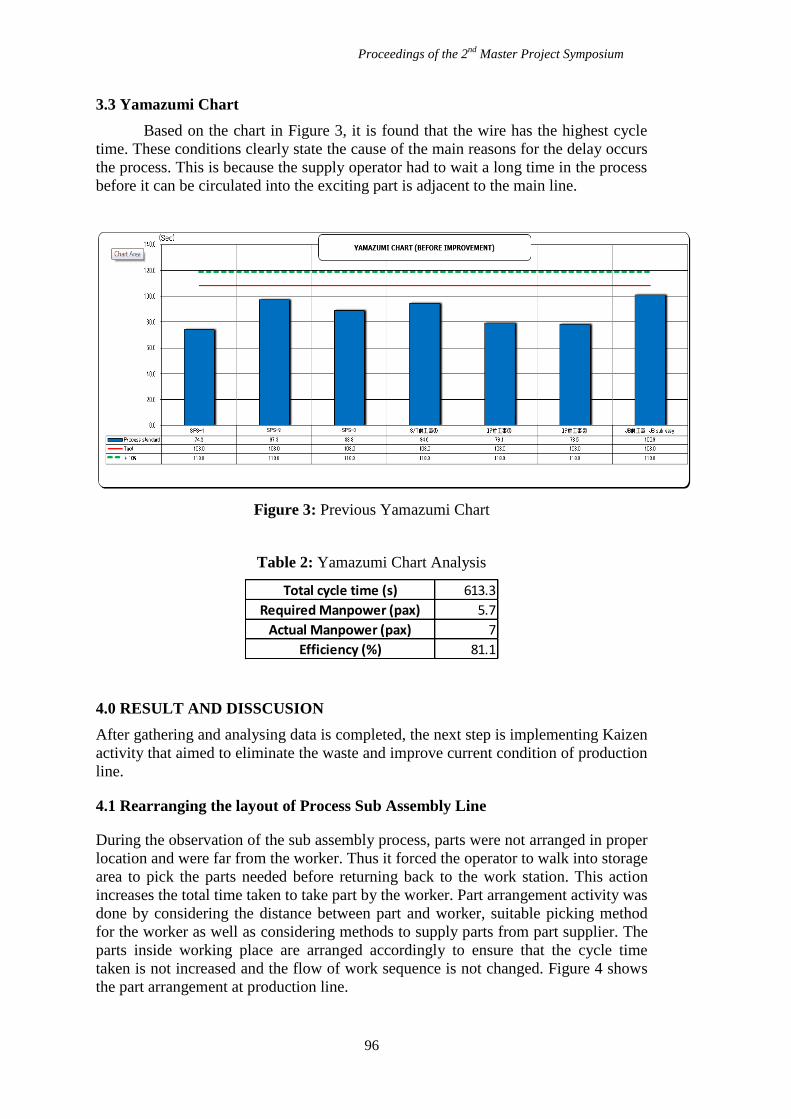
Proceedings of the 2nd
Master Project Symposium
96
3.3 Yamazumi Chart
Based on the chart in Figure 3, it is found that the wire has the highest cycle
time. These conditions clearly state the cause of the main reasons for the delay occurs
the process. This is because the supply operator had to wait a long time in the process
before it can be circulated into the exciting part is adjacent to the main line.
Figure 3: Previous Yamazumi Chart
Table 2: Yamazumi Chart Analysis
4.0 RESULT AND DISSCUSION
After gathering and analysing data is completed, the next step is implementing Kaizen
activity that aimed to eliminate the waste and improve current condition of production
line.
4.1 Rearranging the layout of Process Sub Assembly Line
During the observation of the sub assembly process, parts were not arranged in proper
location and were far from the worker. Thus it forced the operator to walk into storage
area to pick the parts needed before returning back to the work station. This action
increases the total time taken to take part by the worker. Part arrangement activity was
done by considering the distance between part and worker, suitable picking method
for the worker as well as considering methods to supply parts from part supplier. The
parts inside working place are arranged accordingly to ensure that the cycle time
taken is not increased and the flow of work sequence is not changed. Figure 4 shows
the part arrangement at production line.
613.3
5.7
7
81.1
Total cycle time (s)
Required Manpower (pax)
Efficiency (%)
Actual Manpower (pax)
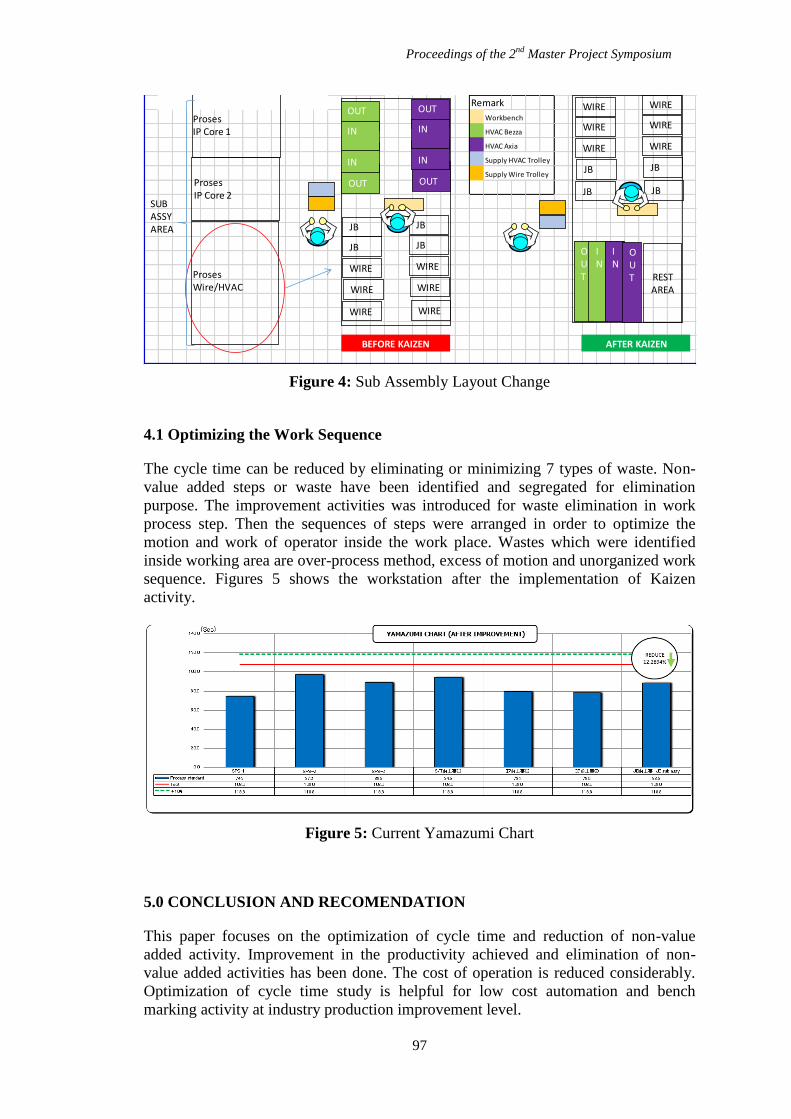
Proceedings of the 2nd
Master Project Symposium
97
Figure 4: Sub Assembly Layout Change
4.1 Optimizing the Work Sequence
The cycle time can be reduced by eliminating or minimizing 7 types of waste. Non-
value added steps or waste have been identified and segregated for elimination
purpose. The improvement activities was introduced for waste elimination in work
process step. Then the sequences of steps were arranged in order to optimize the
motion and work of operator inside the work place. Wastes which were identified
inside working area are over-process method, excess of motion and unorganized work
sequence. Figures 5 shows the workstation after the implementation of Kaizen
activity.
Figure 5: Current Yamazumi Chart
5.0 CONCLUSION AND RECOMENDATION
This paper focuses on the optimization of cycle time and reduction of non-value
added activity. Improvement in the productivity achieved and elimination of non-
value added activities has been done. The cost of operation is reduced considerably.
Optimization of cycle time study is helpful for low cost automation and bench
marking activity at industry production improvement level.
Remark
Workbench
HVAC Bezza
HVAC Axia
Supply HVAC Trolley
Supply Wire Trolley
Proses IP Core 1
Proses IP Core 2
Proses Wire/HVAC
OUT
OUT
IN
IN
OUT
OUT
IN
IN
JB
WIRE
WIRE
JB
JB
WIRE
WIRE
JB
WIRE WIRE
WIRE
JB
WIRE
WIRE
WIRE
JB
WIRE
WIRE
JB JB
OUT
IN
IN
OUT
BEFORE KAIZEN AFTER KAIZEN
REST AREA
SUB ASSY AREA
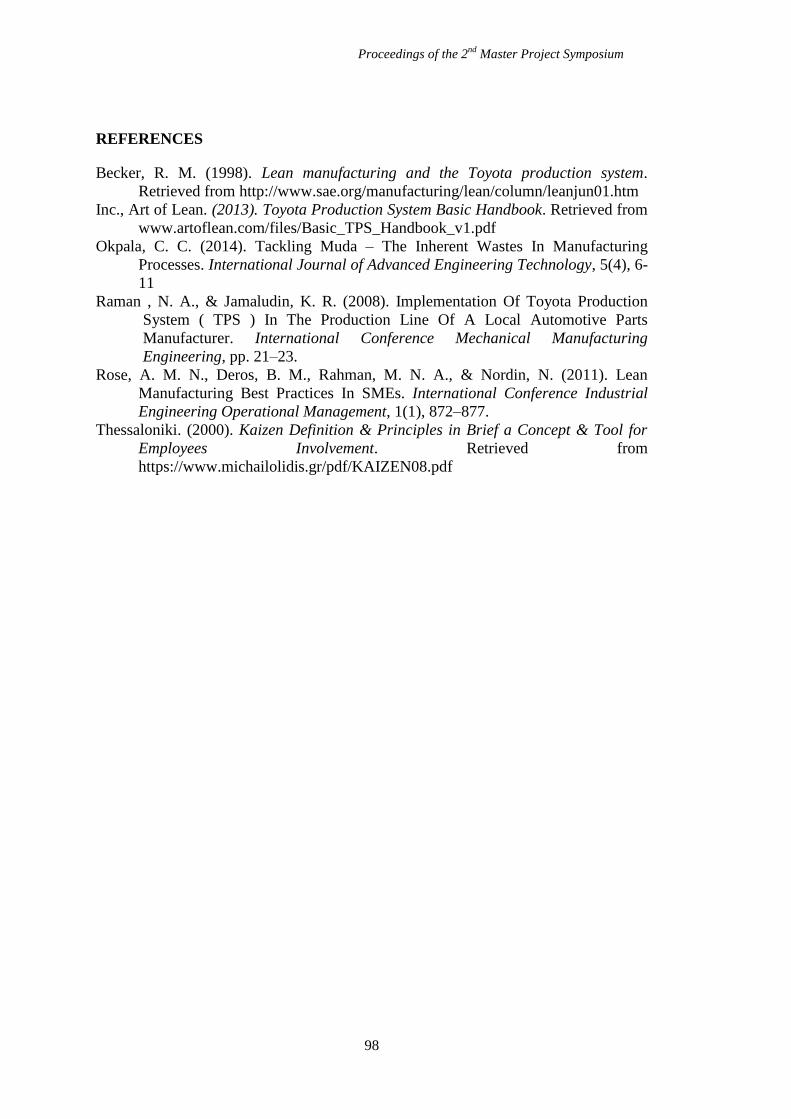
Proceedings of the 2nd
Master Project Symposium
98
REFERENCES
Becker, R. M. (1998). Lean manufacturing and the Toyota production system.
Retrieved from http://www.sae.org/manufacturing/lean/column/leanjun01.htm
Inc., Art of Lean. (2013). Toyota Production System Basic Handbook. Retrieved from
www.artoflean.com/files/Basic_TPS_Handbook_v1.pdf
Okpala, C. C. (2014). Tackling Muda – The Inherent Wastes In Manufacturing
Processes. International Journal of Advanced Engineering Technology, 5(4), 6-
11
Raman , N. A., & Jamaludin, K. R. (2008). Implementation Of Toyota Production
System ( TPS ) In The Production Line Of A Local Automotive Parts
Manufacturer. International Conference Mechanical Manufacturing
Engineering, pp. 21–23.
Rose, A. M. N., Deros, B. M., Rahman, M. N. A., & Nordin, N. (2011). Lean
Manufacturing Best Practices In SMEs. International Conference Industrial
Engineering Operational Management, 1(1), 872–877.
Thessaloniki. (2000). Kaizen Definition & Principles in Brief a Concept & Tool for
Employees Involvement. Retrieved from
https://www.michailolidis.gr/pdf/KAIZEN08.pdf
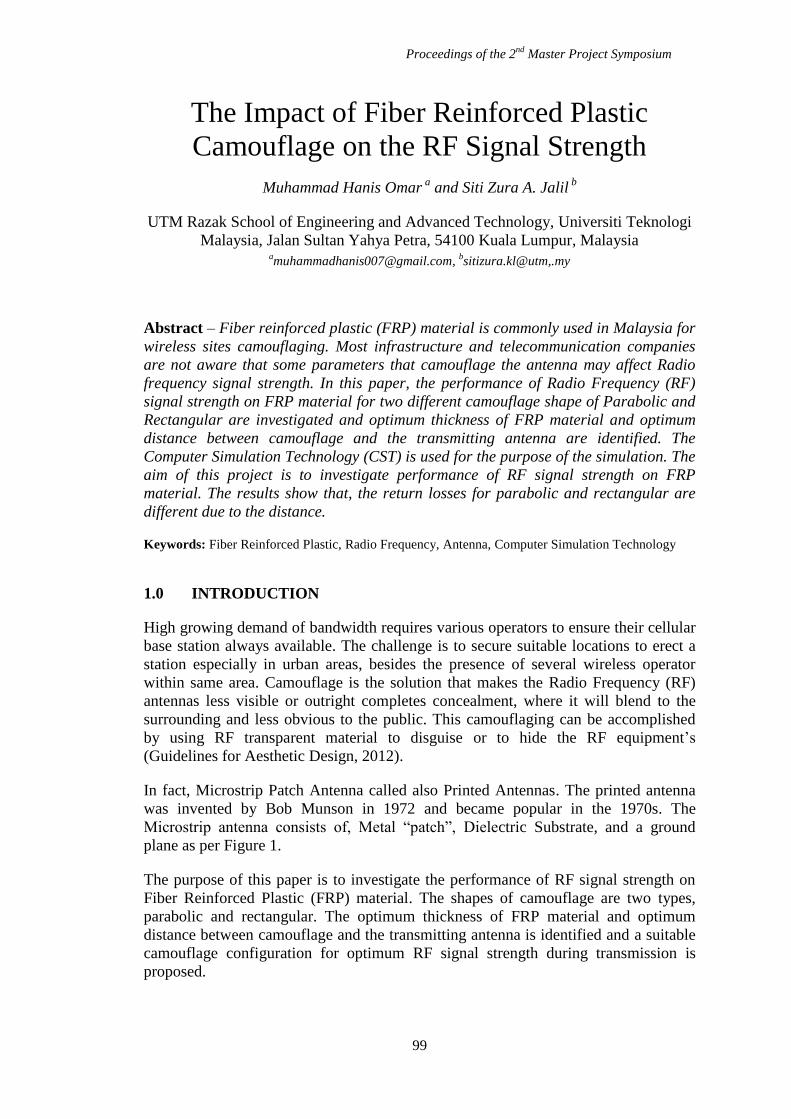
Proceedings of the 2nd
Master Project Symposium
99
The Impact of Fiber Reinforced Plastic
Camouflage on the RF Signal Strength
Muhammad Hanis Omar a
and Siti Zura A. Jalil b
UTM Razak School of Engineering and Advanced Technology, Universiti Teknologi
Malaysia, Jalan Sultan Yahya Petra, 54100 Kuala Lumpur, Malaysia [email protected],
bsitizura.kl@utm,.my
Abstract – Fiber reinforced plastic (FRP) material is commonly used in Malaysia for
wireless sites camouflaging. Most infrastructure and telecommunication companies
are not aware that some parameters that camouflage the antenna may affect Radio
frequency signal strength. In this paper, the performance of Radio Frequency (RF)
signal strength on FRP material for two different camouflage shape of Parabolic and
Rectangular are investigated and optimum thickness of FRP material and optimum
distance between camouflage and the transmitting antenna are identified. The
Computer Simulation Technology (CST) is used for the purpose of the simulation. The
aim of this project is to investigate performance of RF signal strength on FRP
material. The results show that, the return losses for parabolic and rectangular are
different due to the distance.
Keywords: Fiber Reinforced Plastic, Radio Frequency, Antenna, Computer Simulation Technology
1.0 INTRODUCTION
High growing demand of bandwidth requires various operators to ensure their cellular
base station always available. The challenge is to secure suitable locations to erect a
station especially in urban areas, besides the presence of several wireless operator
within same area. Camouflage is the solution that makes the Radio Frequency (RF)
antennas less visible or outright completes concealment, where it will blend to the
surrounding and less obvious to the public. This camouflaging can be accomplished
by using RF transparent material to disguise or to hide the RF equipment’s
(Guidelines for Aesthetic Design, 2012).
In fact, Microstrip Patch Antenna called also Printed Antennas. The printed antenna
was invented by Bob Munson in 1972 and became popular in the 1970s. The
Microstrip antenna consists of, Metal “patch”, Dielectric Substrate, and a ground
plane as per Figure 1.
The purpose of this paper is to investigate the performance of RF signal strength on
Fiber Reinforced Plastic (FRP) material. The shapes of camouflage are two types,
parabolic and rectangular. The optimum thickness of FRP material and optimum
distance between camouflage and the transmitting antenna is identified and a suitable
camouflage configuration for optimum RF signal strength during transmission is
proposed.
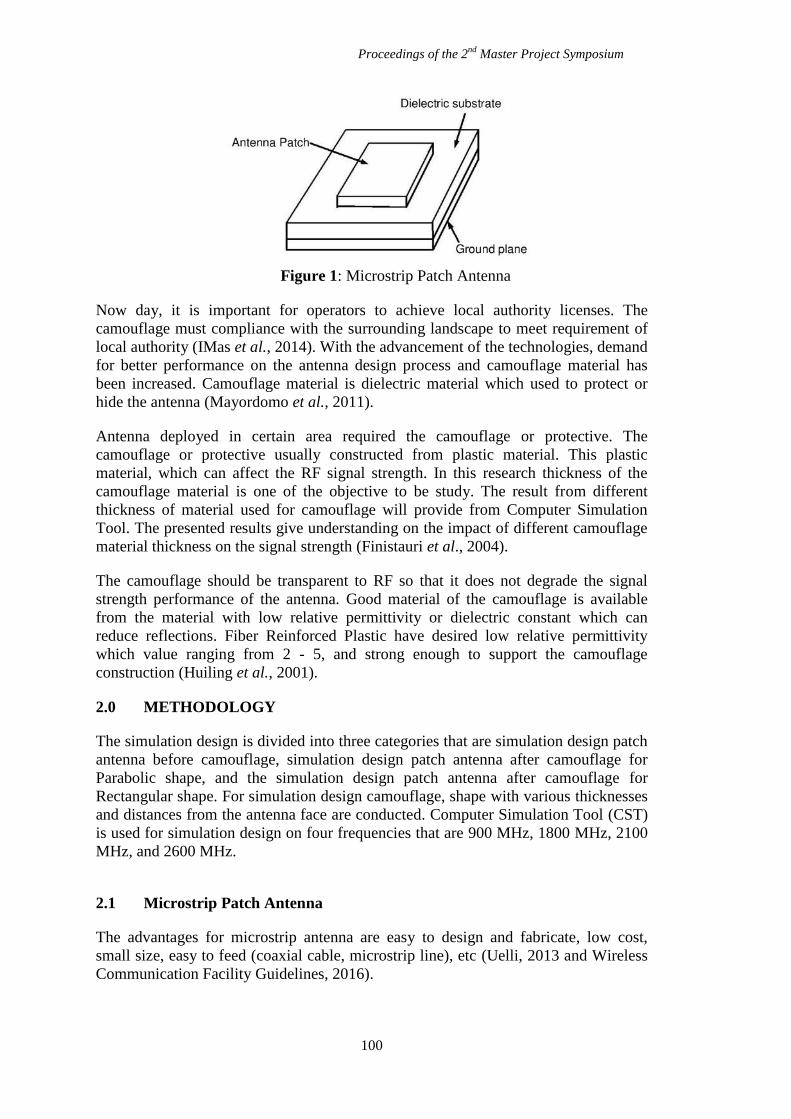
Proceedings of the 2nd
Master Project Symposium
100
Figure 1: Microstrip Patch Antenna
Now day, it is important for operators to achieve local authority licenses. The
camouflage must compliance with the surrounding landscape to meet requirement of
local authority (IMas et al., 2014). With the advancement of the technologies, demand
for better performance on the antenna design process and camouflage material has
been increased. Camouflage material is dielectric material which used to protect or
hide the antenna (Mayordomo et al., 2011).
Antenna deployed in certain area required the camouflage or protective. The
camouflage or protective usually constructed from plastic material. This plastic
material, which can affect the RF signal strength. In this research thickness of the
camouflage material is one of the objective to be study. The result from different
thickness of material used for camouflage will provide from Computer Simulation
Tool. The presented results give understanding on the impact of different camouflage
material thickness on the signal strength (Finistauri et al., 2004).
The camouflage should be transparent to RF so that it does not degrade the signal
strength performance of the antenna. Good material of the camouflage is available
from the material with low relative permittivity or dielectric constant which can
reduce reflections. Fiber Reinforced Plastic have desired low relative permittivity
which value ranging from 2 - 5, and strong enough to support the camouflage
construction (Huiling et al., 2001).
2.0 METHODOLOGY
The simulation design is divided into three categories that are simulation design patch
antenna before camouflage, simulation design patch antenna after camouflage for
Parabolic shape, and the simulation design patch antenna after camouflage for
Rectangular shape. For simulation design camouflage, shape with various thicknesses
and distances from the antenna face are conducted. Computer Simulation Tool (CST)
is used for simulation design on four frequencies that are 900 MHz, 1800 MHz, 2100
MHz, and 2600 MHz.
2.1 Microstrip Patch Antenna
The advantages for microstrip antenna are easy to design and fabricate, low cost,
small size, easy to feed (coaxial cable, microstrip line), etc (Uelli, 2013 and Wireless
Communication Facility Guidelines, 2016).
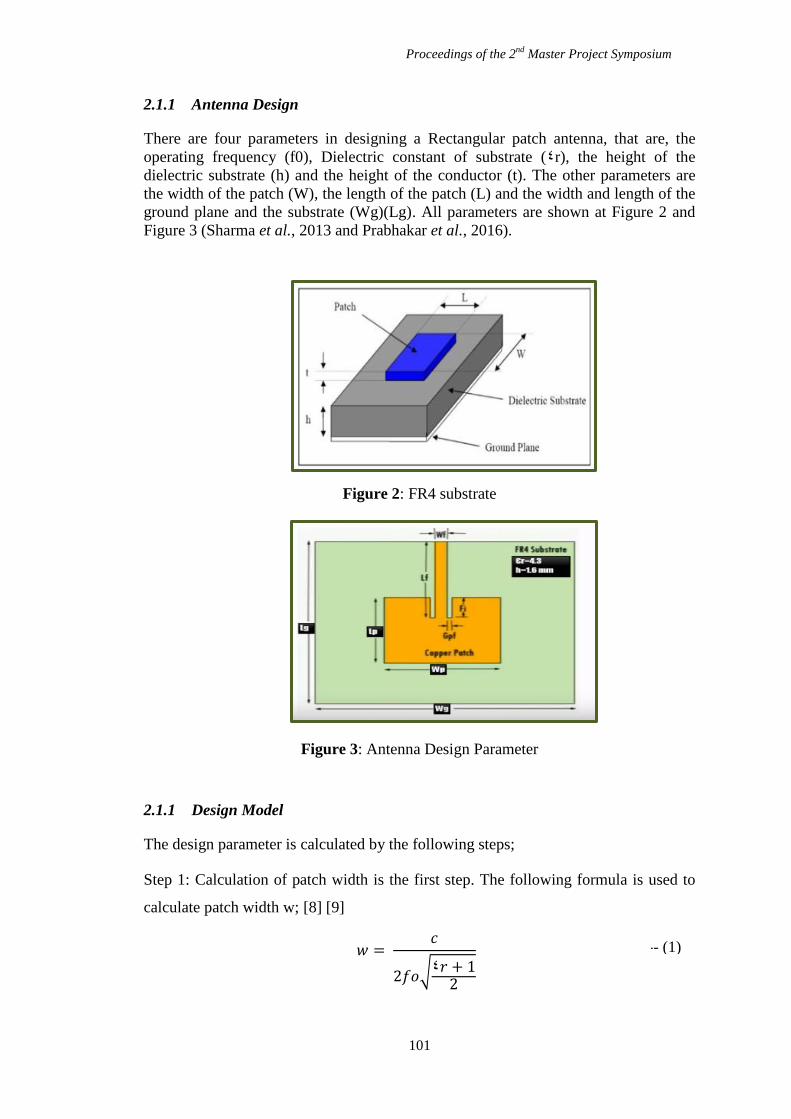
Proceedings of the 2nd
Master Project Symposium
101
2.1.1 Antenna Design
There are four parameters in designing a Rectangular patch antenna, that are, the
operating frequency (f0), Dielectric constant of substrate (٤r), the height of the
dielectric substrate (h) and the height of the conductor (t). The other parameters are
the width of the patch (W), the length of the patch (L) and the width and length of the
ground plane and the substrate (Wg)(Lg). All parameters are shown at Figure 2 and
Figure 3 (Sharma et al., 2013 and Prabhakar et al., 2016).
Figure 2: FR4 substrate
Figure 3: Antenna Design Parameter
2.1.1 Design Model
The design parameter is calculated by the following steps;
Step 1: Calculation of patch width is the first step. The following formula is used to
calculate patch width w; [8] [9]
𝑤 = 𝑐
2𝑓𝑜√٤𝑟 + 12
----- (1)
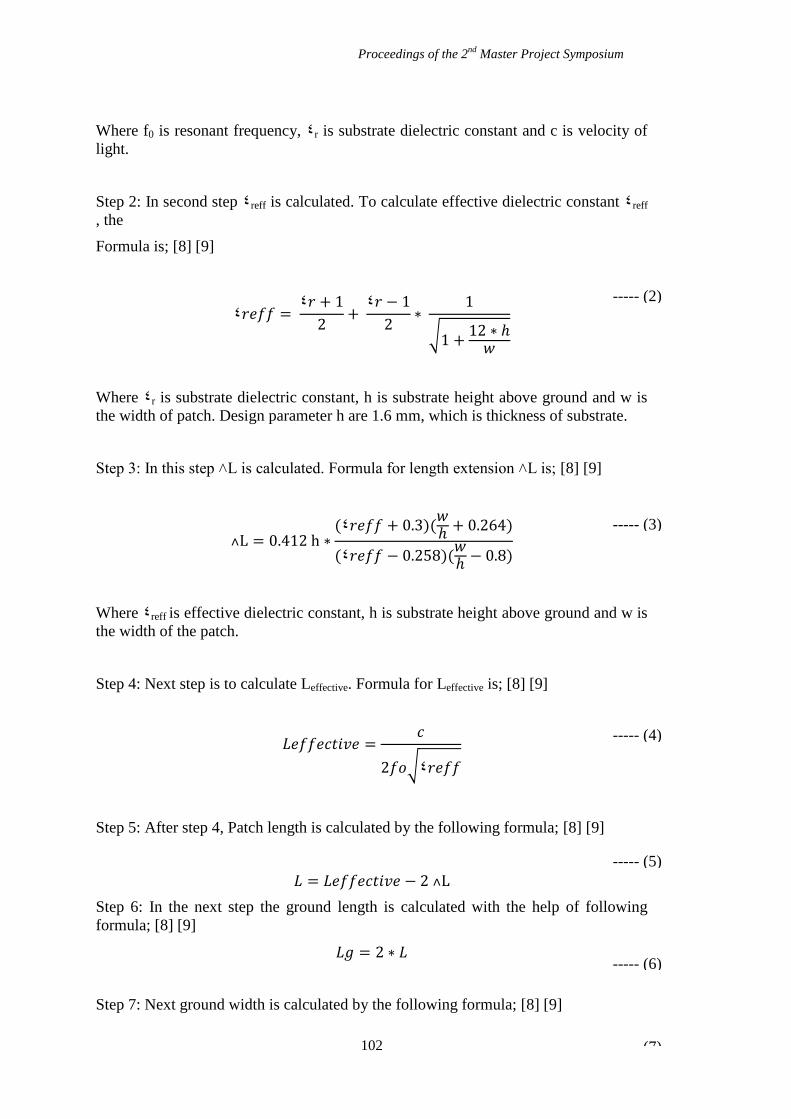
Proceedings of the 2nd
Master Project Symposium
102
Where f0 is resonant frequency, ٤r is substrate dielectric constant and c is velocity of
light.
Step 2: In second step ٤reff is calculated. To calculate effective dielectric constant ٤reff
, the
Formula is; [8] [9]
٤𝑟𝑒𝑓𝑓 = ٤𝑟 + 1
2+ ٤𝑟 − 1
2∗
1
√1 +12 ∗ ℎ𝑤
Where ٤r is substrate dielectric constant, h is substrate height above ground and w is
the width of patch. Design parameter h are 1.6 mm, which is thickness of substrate.
Step 3: In this step ˄L is calculated. Formula for length extension ˄L is; [8] [9]
˄L = 0.412 h ∗(٤𝑟𝑒𝑓𝑓 + 0.3)(
𝑤ℎ+ 0.264)
(٤𝑟𝑒𝑓𝑓 − 0.258)(𝑤ℎ− 0.8)
Where ٤reff is effective dielectric constant, h is substrate height above ground and w is
the width of the patch.
Step 4: Next step is to calculate Leffective. Formula for Leffective is; [8] [9]
𝐿𝑒𝑓𝑓𝑒𝑐𝑡𝑖𝑣𝑒 =𝑐
2𝑓𝑜√٤𝑟𝑒𝑓𝑓
Step 5: After step 4, Patch length is calculated by the following formula; [8] [9]
𝐿 = 𝐿𝑒𝑓𝑓𝑒𝑐𝑡𝑖𝑣𝑒 − 2 ˄L
Step 6: In the next step the ground length is calculated with the help of following
formula; [8] [9]
𝐿𝑔 = 2 ∗ 𝐿
Step 7: Next ground width is calculated by the following formula; [8] [9]
----- (2)
----- (3)
----- (4)
----- (5)
----- (6)
----- (7)
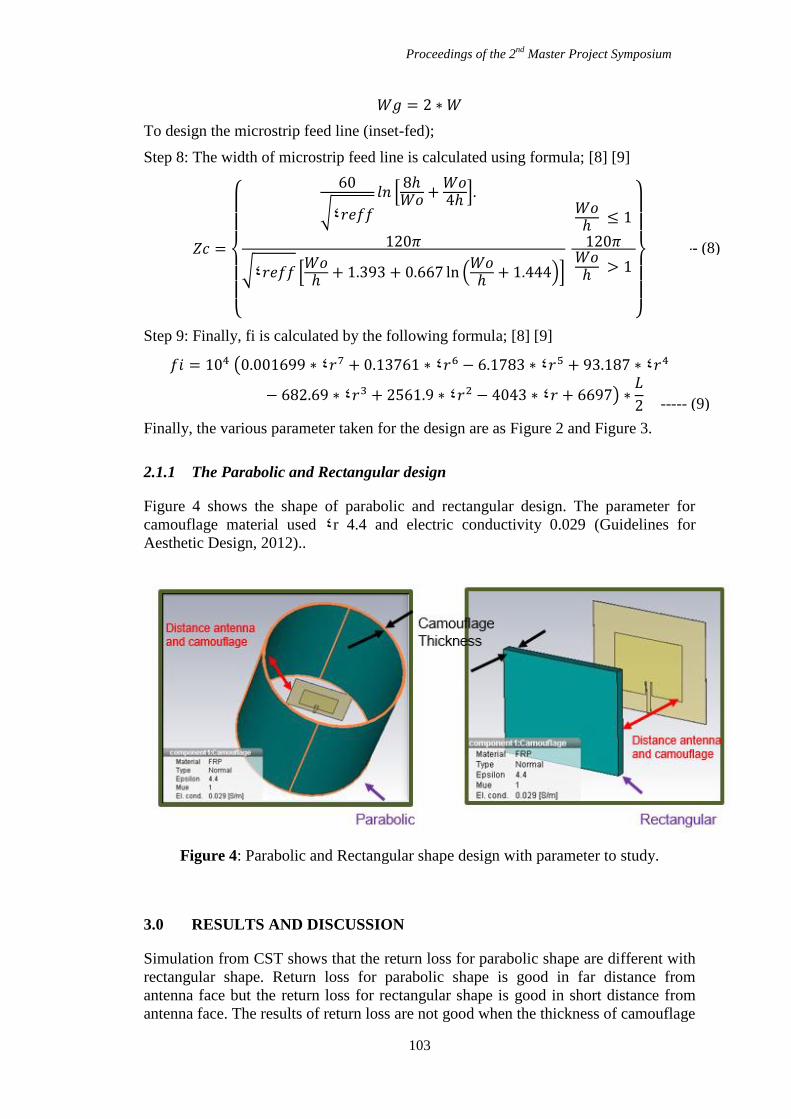
Proceedings of the 2nd
Master Project Symposium
103
𝑊𝑔 = 2 ∗𝑊
To design the microstrip feed line (inset-fed);
Step 8: The width of microstrip feed line is calculated using formula; [8] [9]
𝑍𝑐 =
{
60
√٤𝑟𝑒𝑓𝑓
𝑙𝑛 [8ℎ𝑊𝑜 +
𝑊𝑜4ℎ].
120𝜋
√٤𝑟𝑒𝑓𝑓 [𝑊𝑜ℎ+ 1.393 + 0.667 ln (
𝑊𝑜ℎ+ 1.444)]
𝑊𝑜ℎ ≤ 1
120𝜋𝑊𝑜ℎ > 1
}
Step 9: Finally, fi is calculated by the following formula; [8] [9]
𝑓𝑖 = 104 (0.001699 ∗ ٤𝑟7 + 0.13761 ∗ ٤𝑟6 − 6.1783 ∗ ٤𝑟5 + 93.187 ∗ ٤𝑟4
− 682.69 ∗ ٤𝑟3 + 2561.9 ∗ ٤𝑟2 − 4043 ∗ ٤𝑟 + 6697) ∗𝐿
2
Finally, the various parameter taken for the design are as Figure 2 and Figure 3.
2.1.1 The Parabolic and Rectangular design
Figure 4 shows the shape of parabolic and rectangular design. The parameter for
camouflage material used ٤r 4.4 and electric conductivity 0.029 (Guidelines for
Aesthetic Design, 2012)..
Figure 4: Parabolic and Rectangular shape design with parameter to study.
3.0 RESULTS AND DISCUSSION
Simulation from CST shows that the return loss for parabolic shape are different with
rectangular shape. Return loss for parabolic shape is good in far distance from
antenna face but the return loss for rectangular shape is good in short distance from
antenna face. The results of return loss are not good when the thickness of camouflage
----- (8)
----- (9)
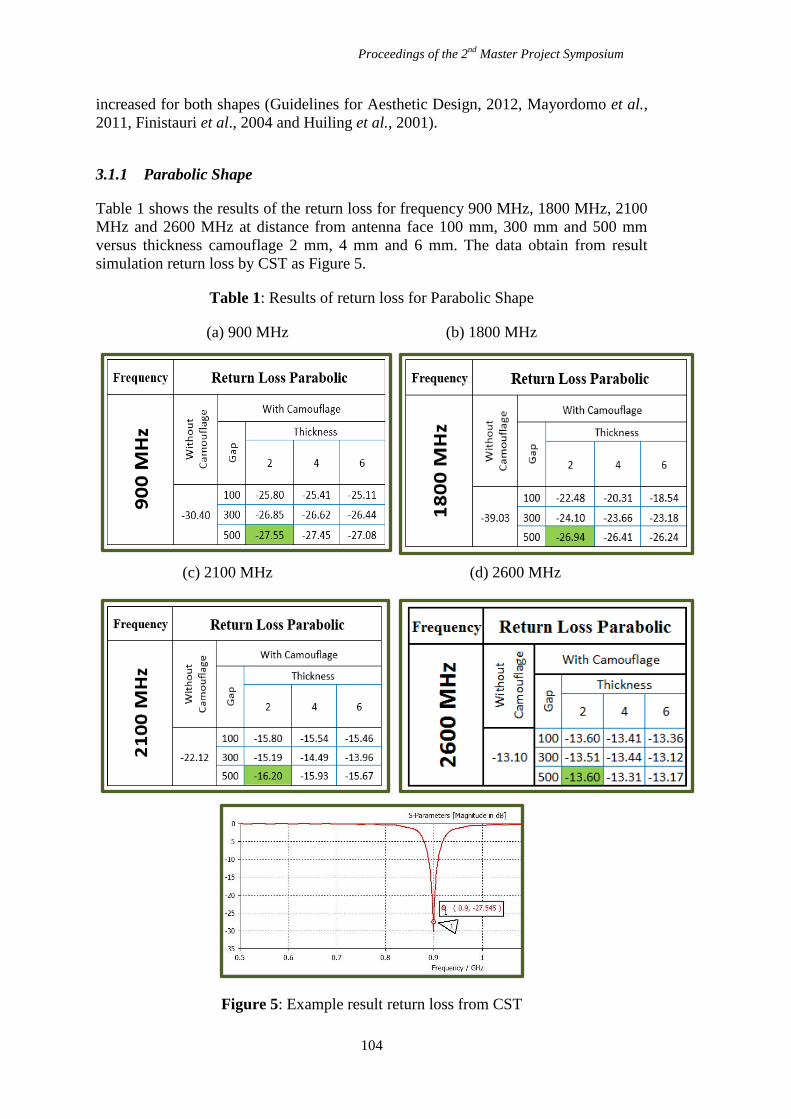
Proceedings of the 2nd
Master Project Symposium
104
increased for both shapes (Guidelines for Aesthetic Design, 2012, Mayordomo et al.,
2011, Finistauri et al., 2004 and Huiling et al., 2001).
3.1.1 Parabolic Shape
Table 1 shows the results of the return loss for frequency 900 MHz, 1800 MHz, 2100
MHz and 2600 MHz at distance from antenna face 100 mm, 300 mm and 500 mm
versus thickness camouflage 2 mm, 4 mm and 6 mm. The data obtain from result
simulation return loss by CST as Figure 5.
Table 1: Results of return loss for Parabolic Shape
(a) 900 MHz (b) 1800 MHz
(c) 2100 MHz (d) 2600 MHz
Figure 5: Example result return loss from CST
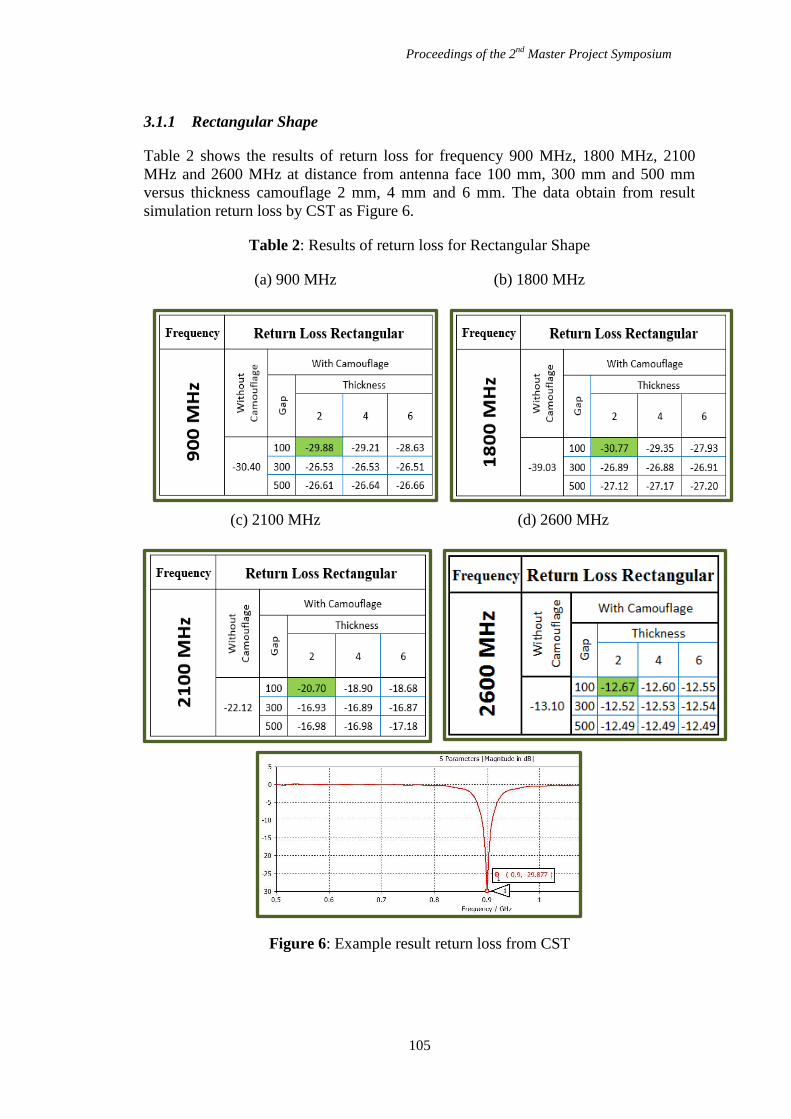
Proceedings of the 2nd
Master Project Symposium
105
3.1.1 Rectangular Shape
Table 2 shows the results of return loss for frequency 900 MHz, 1800 MHz, 2100
MHz and 2600 MHz at distance from antenna face 100 mm, 300 mm and 500 mm
versus thickness camouflage 2 mm, 4 mm and 6 mm. The data obtain from result
simulation return loss by CST as Figure 6.
Table 2: Results of return loss for Rectangular Shape
(a) 900 MHz (b) 1800 MHz
(c) 2100 MHz (d) 2600 MHz
Figure 6: Example result return loss from CST
Proceedings of the 2nd
Master Project Symposium
106
4.0 CONCLUSION
This paper presented a performance of RF signal strength on FRP material for two
different camouflage shapes of Parabolic and Rectangular and optimum thickness of
FRP material and optimum distance between camouflage and the face transmitting
antenna. The results show the return loss for parabolic and rectangular are different
due to distance and thickness.
REFERENCES
Development Service Department, January 4, 2016. Wireless Communication Facility
(WCF) Guidelines, City of San Diego.
Guidelines for Aesthetic Design, SOPP for Aesthetic Design, 2012_V5, Celcom,
Digi, Maxis, Umobile.
Huiling Jiang, H. Arai and Y. Ebine (2001), Antenna-radome interaction of 2GHz
band 120/spl deg/ beam antenna, IEEE Antennas and Propagation Society
International Symposium. Digest. Held in conjunction with: USNC/URSI
National Radio Science Meeting (Cat. No.01CH37229), Boston, MA, USA, pp.
66-69 vol.3.
I. Mayordomo, T. Dräger and J. Bernhard (2011), Technical challenges for the
integration of passive HF RFID technology in FRP composite materials, IEEE
International Conference on RFID-Technologies and Applications (RFID-TA),
pp. 445-450.
IMas. Rodriguez, H. C. Nguyen, T. B. Sorensen and O. Franek (2014), Base Station
Antenna Pattern Distortion in. Practical Urban Deployment Scenarios, IEEE
80th Vehicular Technology Conference (VTC2014-Fall), Vancouver, BC, pp. 1-
6.
Prabhakar, D., P. Mallikarjuna Rao, and M. Satyanarayana (2016), Design of
rectangular patch antenna array with multiple slots by using mitered bend feed
network for multi-band applications. IEEE International Conference on
ElectroMagnetic Interference & Compatibility (INCEMIC).
S. Finistauri, G. Marrocco, G. D'Orio, M. Motta and S. De Polo (2004), Investigation
on pattern distortion of landscape-compliant 3G base-station antennas, IEEE
Antennas and Propagation Society Symposium, pp. 1054-1057, Vol.1.
Sharma, Amit, Atal Rai, and Reeta Verma (2013), Design and simulation of dual band
rectangular patch antenna for Bluetooth and Wimax applications. IJERA 3.5,
pp. 329-332.
Uelli, M.A. (2013), Introduction of Fibre-Reinforced Polymers-Polymers and
Composites: Concepts, Properties and Processes. INTECH Open Access
Publisher.
Proceedings of the 2nd
Master Project Symposium
107
Queuing System Model at Secondary School
Coopmart
Ahmad Ridhuan Hamdana, Ruzana Ishak
b and Nik Nadzirah Nik Mohamed
c
Razak School of Engineering and Advanced Technology Universiti Teknologi
Malaysia, 54100 Kuala Lumpur, Malaysia a [email protected],
Abstract – In today’s modern days, waiting in line is inevitable. This is very much
related to the commitments towards fast paced lifestyle, daily chores and activities.
Technically lines occur when there is surplus of demand over service in supply. This
can also happen when resources are limited. These situations are common
phenomenon that happens in daily lives when customers or individuals need a service
and have to queue due to high demand of the service. It can be either enjoyable or
dissatisfying experience depending on the situation when a queue occurs. Despite
advancements in technology that have improvised the waiting-line process, queue
management remains a significant hurdle for every company owner to overcome. In
line to the situation, this study is to determine the effectiveness of the waiting line
using Queuing Theory at Coopmart MRSM Alor Gajah. The specific objectives of
this study are to determine the customers congestion at the payment counter, to
identify the queuing system performance parameter and to propose the effectiveness
of queuing system in the Coopmart MRSM Alor Gajah. Waiting and service time of
students at Coopmart Koperasi MRSM at Alor Gajah are studied in 3 times period
that we consider as peak hours in two types of counter which are for boys and girls.
From the data collection, we observed it using queuing theory and M/M/1/∞/∞
queuing model will be implemented. From results, it’s show that for optimum service
level, the counter must be change from one to two counter each side. The summary
and findings of the study shall be used as guideline for the management of Coopmart
MRSM Alor Gajah in deciding improvement of its operation.
Keywords: queuing theory, queuing system, queue system performance parameter
1.0 INTRODUCTION
The Queuing Theory is a branch of knowledge in operation research that concerns the
analysis of queues when a customer arrives at a service centre and must wait in a line
before being served. The theory focuses on how organizations can serve a number of
customers who demand services while queuing. A conclusion yielded by Bank et al.
(2001) shows that delayed queues and queuing problems are the most common
features in our daily life situations such as at a fast-food outlet, cinema, road traffic
but also in more technical environments such as in manufacturing, computer
networking and telecommunications.
Proceedings of the 2nd
Master Project Symposium
108
Owners especially store owners that have to attend to large numbers of customers at a
time have attempted to measure and manage queues to quicken the customer
procession, increase sales and profit, increase productivity and operation efficiency,
increase satisfaction levels and increase customer loyalty in using the service
provided. However, to decrease waiting time is easier said than done. It requires
extensive investments whether to use advanced technology in speeding up waiting
lines, increase attendants that take care of servers or simply improving the
environment system, location and space of waiting without queuing for the comfort of
customers such as the ones used in most banks, private hospitals and government
agencies.
Similarly, the same situation is encountered in Coopmart MRSM Alor Gajah. To date
there is no research conducted study on the waiting line caused by massive inflow of
customers especially during recess hour. Several possibilities such as limited
operating hours and goods sold policy are the potential causes of the long waiting line
at the payment counters. The present study was done to statistically study the waiting
line and congestion at Coopmart MRSM Alor Gajah. Data from the study was
analysed and applied onto queuing theory model for validation and forecast using
multiple serving counter improvement suggestion.
2.0 LITERATURE REVIEW
Total checkout service time is defined as the time a consumer is prepared to be served
and joins the waiting line to the time a consumer is being served and obtains receipts
for payment of items bought. A wait for service is said to be the time a customer is
prepared to receive service until the time the service starts (Taylor, 1994).
Many studies in the past have been conducted to evaluate how waiting in checkout
lines impact the customers. A number of these studies, most notably conducted by the
likes of Weisselburg (1969), Crahill et al. (1977), Foote (1976), and Jones et al.
(1980), have tried to explore how to shorten the waiting time in queuing lines by
observing how costumers perceive varying wait times in waiting lines and how its
influences their behaviour towards the store they shop. These researches have further
supported that time plays an important role in consumer behaviour. As such, the focus
of their study was to minimize the time that customers spent waiting in a queue.
Jones et al. (1980) explained that a major issue that managers of grocery stores
confront every day is to ensure consumers are checked out as soon as possible after
shopping for their goods. This fact is considered important in maintaining good
owner-customer relations. Hui et al. (1998) gave a conclusion that a delay during the
service stage could affect perceived response by a consumer whilst queuing. Taylor
(1994), Tom & Lucey (1995) concluded that customers’ blame to the cause of delay
greatly influenced their emotional response. Vinta (1999) explained that national
chains of grocery stores use queuing models in their systems in order to find out the
total number of checkout counters that are needed to be open to ensure that consumers
will only have to wait for no more than 15 minutes at the start of a queue
Proceedings of the 2nd
Master Project Symposium
109
As a conclusion from the review of literature in this research, it is clear that both time
and convenience play important roles that managers should oversee when choosing
and applying the best checkout systems for their establishment. Until now, retail
industrial managers are applying various techniques and learning of new in checkout
systems to aid them in improving the current process of customer checkout.
3.0 METHODOLOGY
3.1 Research procedure
A quantitative research approach was used in the research. Assisted by 10 research
assistant, data of daily record of waiting line within five school days are taken from
Girls Payment Counter (GPC) and Boys Payment Counter (BPC). Instruments of
individual research assistant for this study are digital watch, queuing form and pen
were used. Participants in the study were student customers throughout the three time
study period. Queuing systems method was used in study the data, with additional
questionnaire distributed to complement data from the study.
This two dedicated serving counter was found that the system was fit for the M/M/1
queuing model. This study of queuing systems done by data gathered from the study
were compiled and summarized into Microsoft Excel spreadsheet. By running an
online calculator at http://www.supositorio.com/rcalc/rcalclite.htm which made
available to be used, the data was validated.
3.2 M/M/1 Queuing Model
The study adopted a Queuing Model in the form of: M /M /C: FCFS /∞/∞ where:
M = Markovian (or Poisson) arrivals and exponential service time.
C = Single-server.
FCFS = First come, first served.
∞ = Infinite system limit.
∞ = Infinite source limit.
For analysis of M/M/1 queuing model, the following variables will be investigated:
λ = Mean arrival rate (number of arrivals per unit of time)
μ = Mean service rate per server
= Utilization Factor
P(0) = Probability of zero customers in the system
Ls = Average number of units (customers) in the system
Lq = Average number of customers in the queue (waiting to be served),
Ws = Average waiting time in the system
Wq = Average waiting time in the queue
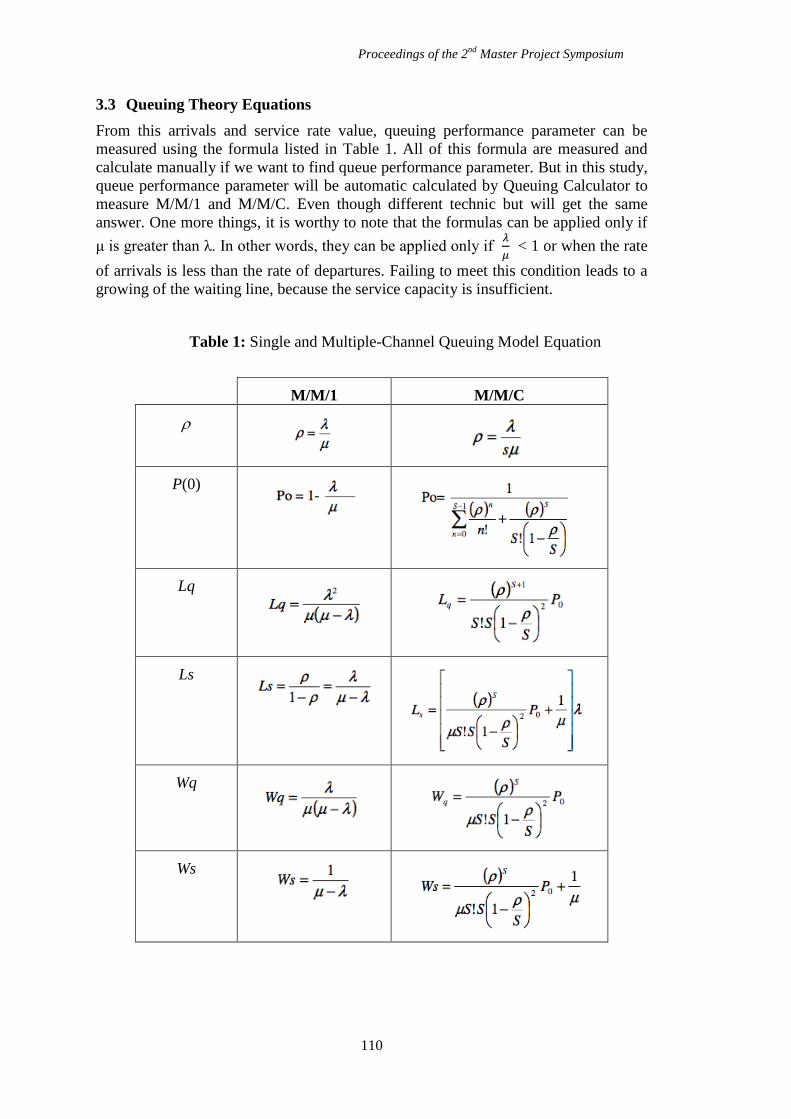
Proceedings of the 2nd
Master Project Symposium
110
3.3 Queuing Theory Equations
From this arrivals and service rate value, queuing performance parameter can be
measured using the formula listed in Table 1. All of this formula are measured and
calculate manually if we want to find queue performance parameter. But in this study,
queue performance parameter will be automatic calculated by Queuing Calculator to
measure M/M/1 and M/M/C. Even though different technic but will get the same
answer. One more things, it is worthy to note that the formulas can be applied only if
μ is greater than λ. In other words, they can be applied only if 𝜆
𝜇 < 1 or when the rate
of arrivals is less than the rate of departures. Failing to meet this condition leads to a
growing of the waiting line, because the service capacity is insufficient.
Table 1: Single and Multiple-Channel Queuing Model Equation
M/M/1 M/M/C
P(0)
Lq
Ls
Wq
Ws
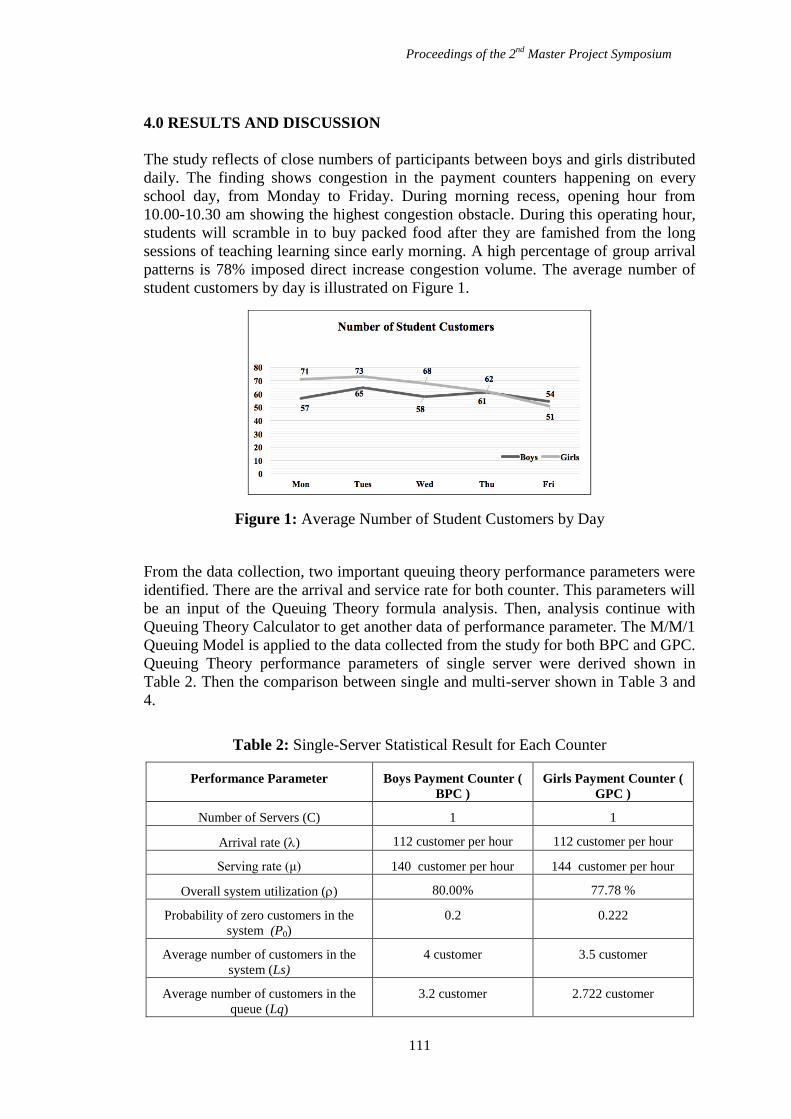
Proceedings of the 2nd
Master Project Symposium
111
4.0 RESULTS AND DISCUSSION
The study reflects of close numbers of participants between boys and girls distributed
daily. The finding shows congestion in the payment counters happening on every
school day, from Monday to Friday. During morning recess, opening hour from
10.00-10.30 am showing the highest congestion obstacle. During this operating hour,
students will scramble in to buy packed food after they are famished from the long
sessions of teaching learning since early morning. A high percentage of group arrival
patterns is 78% imposed direct increase congestion volume. The average number of
student customers by day is illustrated on Figure 1.
Figure 1: Average Number of Student Customers by Day
From the data collection, two important queuing theory performance parameters were
identified. There are the arrival and service rate for both counter. This parameters will
be an input of the Queuing Theory formula analysis. Then, analysis continue with
Queuing Theory Calculator to get another data of performance parameter. The M/M/1
Queuing Model is applied to the data collected from the study for both BPC and GPC.
Queuing Theory performance parameters of single server were derived shown in
Table 2. Then the comparison between single and multi-server shown in Table 3 and
4.
Table 2: Single-Server Statistical Result for Each Counter
Performance Parameter Boys Payment Counter (
BPC )
Girls Payment Counter (
GPC )
Number of Servers (C) 1 1
Arrival rate () 112 customer per hour 112 customer per hour
Serving rate (μ) 140 customer per hour 144 customer per hour
Overall system utilization () 80.00% 77.78 %
Probability of zero customers in the
system (P0)
0.2 0.222
Average number of customers in the
system (Ls)
4 customer 3.5 customer
Average number of customers in the
queue (Lq)
3.2 customer 2.722 customer
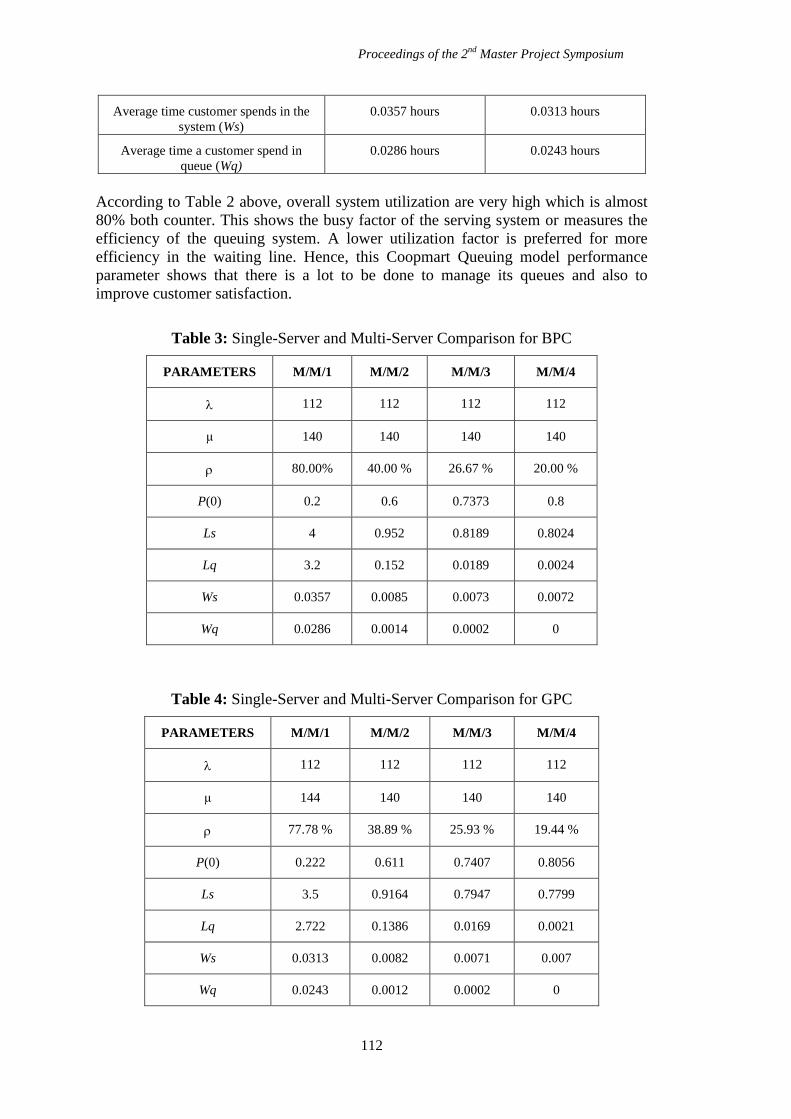
Proceedings of the 2nd
Master Project Symposium
112
Average time customer spends in the
system (Ws)
0.0357 hours 0.0313 hours
Average time a customer spend in
queue (Wq)
0.0286 hours 0.0243 hours
According to Table 2 above, overall system utilization are very high which is almost
80% both counter. This shows the busy factor of the serving system or measures the
efficiency of the queuing system. A lower utilization factor is preferred for more
efficiency in the waiting line. Hence, this Coopmart Queuing model performance
parameter shows that there is a lot to be done to manage its queues and also to
improve customer satisfaction.
Table 3: Single-Server and Multi-Server Comparison for BPC
PARAMETERS M/M/1 M/M/2 M/M/3 M/M/4
112 112 112 112
μ 140 140 140 140
80.00% 40.00 % 26.67 % 20.00 %
P(0) 0.2 0.6 0.7373 0.8
Ls 4 0.952 0.8189 0.8024
Lq 3.2 0.152 0.0189 0.0024
Ws 0.0357 0.0085 0.0073 0.0072
Wq 0.0286 0.0014 0.0002 0
Table 4: Single-Server and Multi-Server Comparison for GPC
PARAMETERS M/M/1 M/M/2 M/M/3 M/M/4
112 112 112 112
μ 144 140 140 140
77.78 % 38.89 % 25.93 % 19.44 %
P(0) 0.222 0.611 0.7407 0.8056
Ls 3.5 0.9164 0.7947 0.7799
Lq 2.722 0.1386 0.0169 0.0021
Ws 0.0313 0.0082 0.0071 0.007
Wq 0.0243 0.0012 0.0002 0
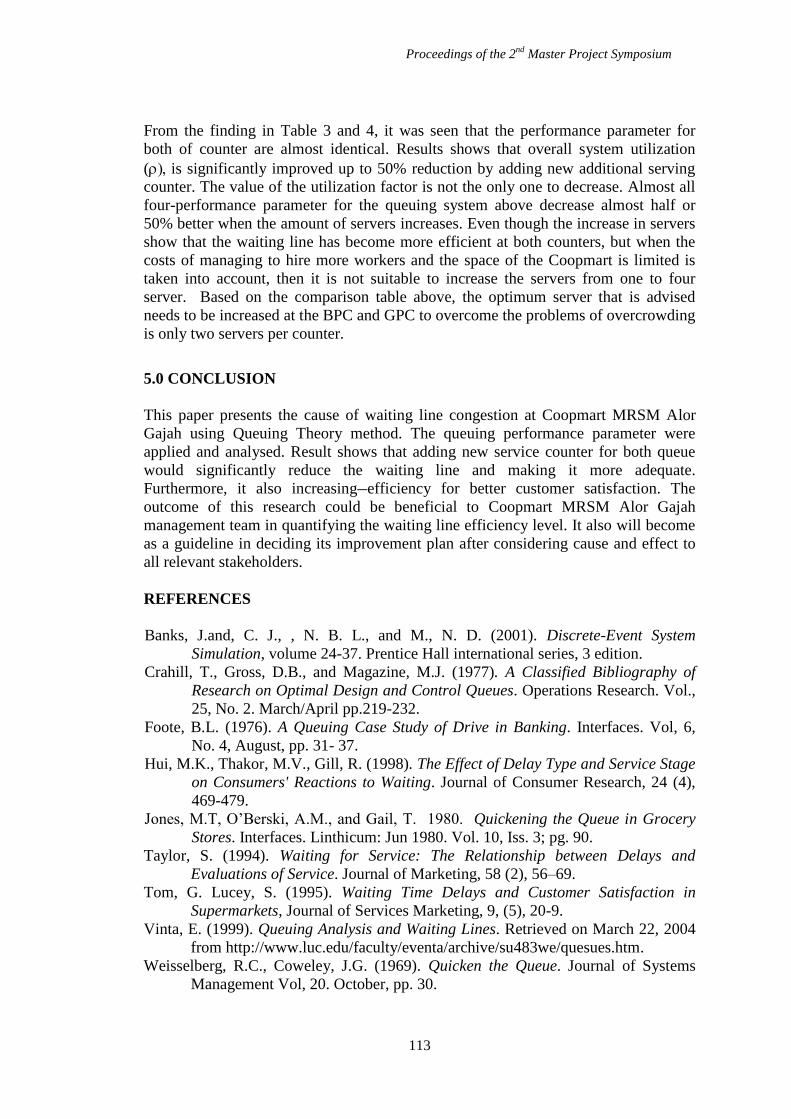
Proceedings of the 2nd
Master Project Symposium
113
From the finding in Table 3 and 4, it was seen that the performance parameter for
both of counter are almost identical. Results shows that overall system utilization
(is significantly improved up to 50% reduction by adding new additional serving
counter. The value of the utilization factor is not the only one to decrease. Almost all
four-performance parameter for the queuing system above decrease almost half or
50% better when the amount of servers increases. Even though the increase in servers
show that the waiting line has become more efficient at both counters, but when the
costs of managing to hire more workers and the space of the Coopmart is limited is
taken into account, then it is not suitable to increase the servers from one to four
server. Based on the comparison table above, the optimum server that is advised
needs to be increased at the BPC and GPC to overcome the problems of overcrowding
is only two servers per counter.
5.0 CONCLUSION
This paper presents the cause of waiting line congestion at Coopmart MRSM Alor
Gajah using Queuing Theory method. The queuing performance parameter were
applied and analysed. Result shows that adding new service counter for both queue
would significantly reduce the waiting line and making it more adequate.
Furthermore, it also increasing efficiency for better customer satisfaction. The
outcome of this research could be beneficial to Coopmart MRSM Alor Gajah
management team in quantifying the waiting line efficiency level. It also will become
as a guideline in deciding its improvement plan after considering cause and effect to
all relevant stakeholders.
REFERENCES
Banks, J.and, C. J., , N. B. L., and M., N. D. (2001). Discrete-Event System
Simulation, volume 24-37. Prentice Hall international series, 3 edition.
Crahill, T., Gross, D.B., and Magazine, M.J. (1977). A Classified Bibliography of
Research on Optimal Design and Control Queues. Operations Research. Vol.,
25, No. 2. March/April pp.219-232.
Foote, B.L. (1976). A Queuing Case Study of Drive in Banking. Interfaces. Vol, 6,
No. 4, August, pp. 31- 37.
Hui, M.K., Thakor, M.V., Gill, R. (1998). The Effect of Delay Type and Service Stage
on Consumers' Reactions to Waiting. Journal of Consumer Research, 24 (4),
469-479.
Jones, M.T, O’Berski, A.M., and Gail, T. 1980. Quickening the Queue in Grocery
Stores. Interfaces. Linthicum: Jun 1980. Vol. 10, Iss. 3; pg. 90.
Taylor, S. (1994). Waiting for Service: The Relationship between Delays and
Evaluations of Service. Journal of Marketing, 58 (2), 56–69.
Tom, G. Lucey, S. (1995). Waiting Time Delays and Customer Satisfaction in
Supermarkets, Journal of Services Marketing, 9, (5), 20-9.
Vinta, E. (1999). Queuing Analysis and Waiting Lines. Retrieved on March 22, 2004
from http://www.luc.edu/faculty/eventa/archive/su483we/quesues.htm.
Weisselberg, R.C., Coweley, J.G. (1969). Quicken the Queue. Journal of Systems
Management Vol, 20. October, pp. 30.
Proceedings of the 2nd
Master Project Symposium
114
Inventory Management in Cafeteria Using
Linear Programming
Mohd Fais Usopa, Ruzana Ishak
b and Hayati Habibah Abdul Talib
c
UTM Razak School of Engineering and Advanced Technology, Universiti Teknologi
Malaysia, Jalan Sultan Yahya Petra, 54100 Kuala Lumpur, Malaysia [email protected],
Abstract – Inventory management is an important factor in running a business. It
plays a big role of managing the stock in cafeteria. If the inventory management is
fail to manage wisely, it will affect the profit of the cafeteria. Therefore, the purpose
of this study is to improve the inventory management in school cafeteria. Most of the
cafeteria in Malaysia are not manage their stock well. In this study, we are using two
difference ways in order to improve the inventory management in cafeteria. The first
method is provide the database system that can improved the management of the stock
in weekly basis. Second method is using Linear Programming Model to get the
optimal range of the inventory needed for selected categories. Data was collected by
using the Periodic Inventory System at the end of week within three months and this
study was conducted at one of the boarding school’s cafeteria in Melaka. The results
shown the effectiveness of using these two methods and will be very helpful to the
cafeteria management in organizing their inventory. Moreover, the finding in this
study can reduce the cost of operation and give more profit. Besides that, this study
also provide the Standards of Procedure (SOP) for the inventory management in
Cafeteria.
Keywords: Inventory Management, Linear Programming, Database, Stock.
1.0 INTRODUCTION
Inventory is the major important factor in various company background related to the
construction, production, food and beverages, oil and gas and others field. Inventory
also the major current asset to the company and very important input to the final
product. Inventory terms is referring to the materials or goods used by a certain
company for purpose of produce something related to the business or sale (Sidhu et al.
2014). It also includes the items, which are used as supportive materials to facilitate
production.
As stated by Hashim et al. (2012), an organizations that manages food and beverages
products or services, in preparing for a food product, ingredients and recipes should
be supported by availability of the raw ingredients in the store. It means that, in order
to make the production of the food according to the demand, the company must have
some effective method to manage the inventory.
According to American Production and Inventory Control Society (APICS), inventory
is defined as an item in storage or resources that are in phase of transformations that
Proceedings of the 2nd
Master Project Symposium
115
have economic value that will be used for continuous operation in the manufacturing
process of a product before distributing to customers. If the inventory not well
organizes, the financial health of the company will be affected and the objective of the
company to get the optimal profit cannot be achieved.
Among the benefits of inventory management, first to reduced inventory cost
resulting from using the efficient matching of requirement to stock. Second, to
prevent the shortages of stock to avoid repeat order on the same items through the
urgent needs. Third, to capture on audit trail of the entire inventory movement details
to resolve queries. Lastly, the company can monitor the flow of the inventory and not
to keep bulky stock in the store which can increase the cost of the company.
Therefore, this study is to improve the inventory management in school cafeteria. By
using two difference method. The first method is providing the database system that
can improved the management of the stock in weekly basis. Second, is using the
Linear Programming Model to get the optimal range of the inventory needed for
selected categories.
2.0 LITERATURE REVIEW
Inventory management is a vital function to help insure the success of manufacturing,
distribution, production and other companies. The effectiveness of inventory
management systems is measured by how successful of a company in providing low
inventory investment, maximum throughput, low costs and get high levels of
customer service (Imeokparia, 2013). All business, from small to large, needs to do
another inventory management to keep track of supplies they provide for internal use
or to sell (Khabbazi et al. 2013).
Service quality is one of the vital determinants of customer satisfaction and it will
directly affect the organizational success especially in the service industry such as fast
food restaurants or cafeteria. Therefore, service quality measurement should be done
frequently and in a timely manner to obtain an accurate current level of service
quality (Gilbert et al. 2004). Therefore, in order to maintain the service satisfaction of
the costumers, the inventory should be managed effectively and efficiently in the
company.
The method of managing the inventory in effectively and efficiently is by providing
the procedure to the cafeteria. According to Moule & Giavara (1995), all the policies,
methods, standards and procedures are the set of comprehensive process in managing
the inventory. The process including the following major purpose. First to ensure all
the processes and deliverables of the company consistence. Second to implement the
effective measurement of quality for the service provided by the company. Third to
extend the used of IT database to support on the system. Forth to prevent from redo
the known problems. Fifth to improve communication by standardizing the
methodology. Sixth to facilitate and reinforce the new process and techniques.
Besides that, inventory management can be done by using the Linear Programming
Model. Linear programming is a mathematical method to achieve the optimum
solution (such as maximum profit or minimize cost) in a mathematical model for
some list of requirements, that is, constraints. Linear Programming is a tool to
optimize decision-making process. Taha (2014) mentioned that linear programming
could be used to solve problems which variables, constraints and objective function
can be identified.
Proceedings of the 2nd
Master Project Symposium
116
3.0 METHODOLOGY
The study was conducted at one of the boarding school’s cafeteria in Melaka. The
capacity of the school is around 1100 peoples including teachers, staffs and students.
The operation hours of the cafeteria are between 7.30 am to 3.00 pm and 9.00 pm to
11.30 pm. The optimization approach was employed as the method to give suggestion
about the needed of stock by selected category in a week.
3.1 Data Collection
There are a few types of data needed in order to manage the inventory of the cafeteria.
These includes the stock in and out of each item, the cost of the item and the gross
income of the daily sales. For data collection of the inventory, Periodic Inventory
System (PeriodIS) was used in the study. The person in charge will fill up all the
particulars in the inventory form and transferred in the PeriodIS. The process of
collecting data was done weekly within twelve weeks of the cafeteria operation time.
The data was collected according to six categories such as Meat – Poultry, Fish –
Seafood, Vegetables, Herbs and Spices, Grocery and Drinks. In each category, there
are more details items data need to be collected.
3.2 Food Stocktake Database (FSD)
Food Stocktake Database (FSD) is the template of Microsoft Excel developed by
Alex Bejanishvili (2013) from SpreadSheet 123 website. The purpose of counting the
food and drink items is to put on a value of all the food and drink stock on hand. In
FSD, some of valuable information that was useful to the management of cafeteria
can be used. It gives a quick overview of the Cost of Inventory at The Opening and
Closing, Forecasted Profit Margins and Cost Variances. All these information can be
tracked on weekly basis for a period of four weeks. FSD gives the exact variance on
the basis of purchases log, stock count (stock out), and stock closing. From the
information, FSD can gives summary of Monthly Gross and Net Income, and Monthly
Gross Profit and Gross Profit Margin. The total Gross Profit is the difference
between Net Income (Sales Tax 6%) and The Cost of Goods Sold (COGS). The Cost
of Goods Sold is calculated as sum of the Cost of Inventory at Opening and the
Purchases minus with the sum of Cost of Inventory at Closing.
3.3 Development of Inventory Model
The aim of the inventory model is to find the minimum range of inventory needed for
the selected categories in a week. The Linear Programming Model (LPM) was
developed in order to give the figures of the Stock In for a week to the management.
By this approach, the cafeteria can reduce more problems such as shortages of stock
and store it longer period in a freezer which may reduce the freshness of the items.
The study was focussing on two perishable stock categories which are Meat – Poultry
and Fish – Seafood. Therefore, from the range of the stock needed, it will help the
management of cafeteria in minimizing the cost of operation. Indirectly this will
increase the weekly income of the cafeteria. The study was used LPM in separate
process according to the category.
Proceedings of the 2nd
Master Project Symposium
117
3.3.1 Decision Variables
The decision variables for this study are items that have been used in Meat – Poultry
and Fish – Seafood categories. There are
xi where i = 1, 2, 3 … j (j is the number of items in the category)
3.3.2 Objective Function
The objective function for this study is to minimize the weekly cost of the stock, Z by
category. Then, the objective function of this study is given by:
Minimize, Z = ∑ 𝑐𝑖𝑥𝑖𝑗𝑖 where i = 1, 2, 3 … j (1)
where Z refer to the weekly cost of the stock, ci represent the cost of each stock.
3.3.3 Constraints
Three constraints were involved in this study including the cost of the stock is less by
10 % from the averages of cost of goods sold constraints, the inventory needed by
each stock in the category, and the nonnegative constraints.
i. The cost of the stock is less by 10% from weekly averages of cost of goods
sold (COGS):
∑ 𝑐𝑖𝑥𝑖𝑗𝑖 ≤ 𝐶𝑂𝐺𝑆 (2)
ii. The inventory needed
xi = mi i = 1, 2, … j (3)
iii. Nonnegative
xi 0 i = 1, 2, … j (4)
Hence, Microsoft Excel Solver is used to solve the linear programming model and
generate the optimal solutions.
3.4 The Standard Operating Procedures (SOP)
Based on the developed model in 3.3, to find the solution and to contribute some
improvements of the inventory management in school cafeteria, a Standard Operating
Procedures (SOP) will be introduced to the manager. In this study, all the workers
which are involved in the inventory management of the school cafeteria will follow
the SOP in stock count in and out of the inventory
4.0 RESULTS AND DISCUSSION
The result of the analysis from the Food Stocktake Database are shown in Table 1.
The gross profit was increased from January to March after the cafeteria able to
manage the inventory. Moreover, the gross profit margin also increased from 31.22%
to 38.66% at the end of March. This indicate that the system is successful improved
the inventory of the cafeteria. Figure 1 and 2 represent the result of gross profit and
gross profit margin in graphical way.
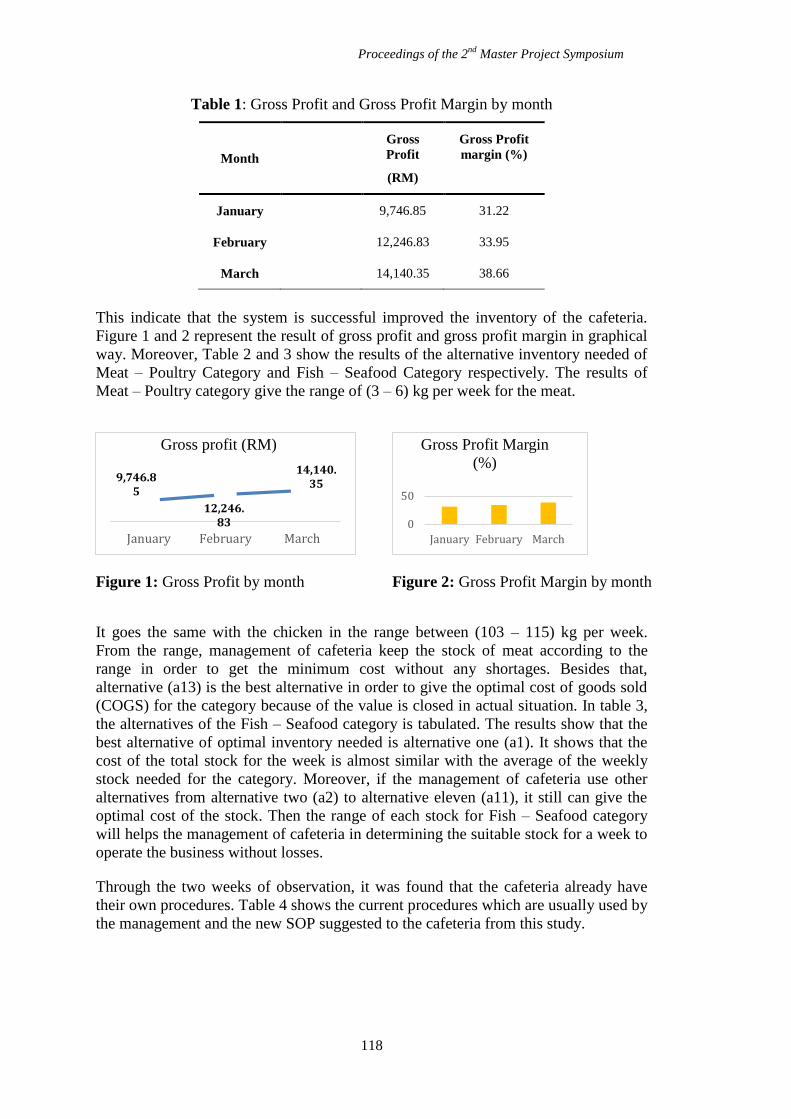
Proceedings of the 2nd
Master Project Symposium
118
Table 1: Gross Profit and Gross Profit Margin by month
Month
Gross
Profit
(RM)
Gross Profit
margin (%)
January 9,746.85 31.22
February 12,246.83 33.95
March 14,140.35 38.66
This indicate that the system is successful improved the inventory of the cafeteria.
Figure 1 and 2 represent the result of gross profit and gross profit margin in graphical
way. Moreover, Table 2 and 3 show the results of the alternative inventory needed of
Meat – Poultry Category and Fish – Seafood Category respectively. The results of
Meat – Poultry category give the range of (3 – 6) kg per week for the meat.
Figure 1: Gross Profit by month
Figure 2: Gross Profit Margin by month
It goes the same with the chicken in the range between (103 – 115) kg per week.
From the range, management of cafeteria keep the stock of meat according to the
range in order to get the minimum cost without any shortages. Besides that,
alternative (a13) is the best alternative in order to give the optimal cost of goods sold
(COGS) for the category because of the value is closed in actual situation. In table 3,
the alternatives of the Fish – Seafood category is tabulated. The results show that the
best alternative of optimal inventory needed is alternative one (a1). It shows that the
cost of the total stock for the week is almost similar with the average of the weekly
stock needed for the category. Moreover, if the management of cafeteria use other
alternatives from alternative two (a2) to alternative eleven (a11), it still can give the
optimal cost of the stock. Then the range of each stock for Fish – Seafood category
will helps the management of cafeteria in determining the suitable stock for a week to
operate the business without losses.
Through the two weeks of observation, it was found that the cafeteria already have
their own procedures. Table 4 shows the current procedures which are usually used by
the management and the new SOP suggested to the cafeteria from this study.
9,746.85
12,246.83
14,140.35
January February March
Gross profit (RM)
0
50
January February March
Gross Profit Margin
(%)
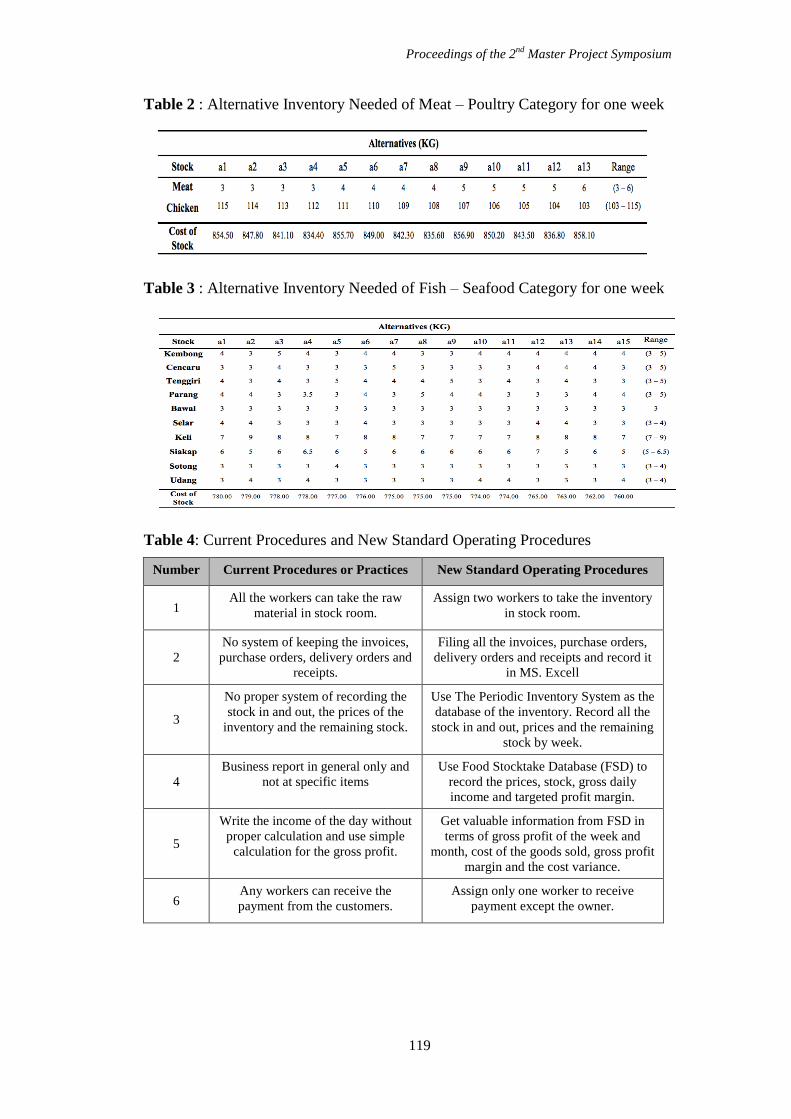
Proceedings of the 2nd
Master Project Symposium
119
Table 2 : Alternative Inventory Needed of Meat – Poultry Category for one week
Table 3 : Alternative Inventory Needed of Fish – Seafood Category for one week
Table 4: Current Procedures and New Standard Operating Procedures
Number Current Procedures or Practices New Standard Operating Procedures
1 All the workers can take the raw
material in stock room.
Assign two workers to take the inventory
in stock room.
2
No system of keeping the invoices,
purchase orders, delivery orders and
receipts.
Filing all the invoices, purchase orders,
delivery orders and receipts and record it
in MS. Excell
3
No proper system of recording the
stock in and out, the prices of the
inventory and the remaining stock.
Use The Periodic Inventory System as the
database of the inventory. Record all the
stock in and out, prices and the remaining
stock by week.
4
Business report in general only and
not at specific items
Use Food Stocktake Database (FSD) to
record the prices, stock, gross daily
income and targeted profit margin.
5
Write the income of the day without
proper calculation and use simple
calculation for the gross profit.
Get valuable information from FSD in
terms of gross profit of the week and
month, cost of the goods sold, gross profit
margin and the cost variance.
6 Any workers can receive the
payment from the customers.
Assign only one worker to receive
payment except the owner.
Proceedings of the 2nd
Master Project Symposium
120
5.0 CONCLUSION
This study has produced the solutions of the inventory management in cafeteria by
providing the system of managing the inventory. The implementation of the database
inventory system also helped the management in managing their inventory. All the
stock was tracked by the system called Periodic Inventory System. In this system, the
Stock In and Stock Out of the inventory was counted and evaluated. By this system,
the management will detect the Cost of Goods Sold of each category weekly. Then it
will helped them in order to organize their budget in future.
Moreover, the inventory models provide method to the management of cafeteria in
order to get the range of inventory needed according to the selected category per
week. With this, the management can get the minimum cost of the stock to maximize
the profit. This study also has updated the SOP by re-arrange and improved it for
better management.
REFERENCES
Bejanishvili, A. (2013, August 20). Spread Sheet123. Retrieved from
www.spreadsheet123.com: https://www.spreadsheet123.com/ExcelTemplates/food-stocktake-template.html Gilbert, G. R., Veloutsou, C., Goode, M. M. H., & Moutinho, L. (2004). Measuring
customer satisfaction in the fast food industry:a cross-national approach, 371-383.
Hashim, N.L., Mohd Ghouse, N.Z., & Ismail, N. (2012). A Requirement Model For
Managing Inventory of Raw Materials. , (July), pp.4–6.
Imeokparia, L., (2013). Inventory Management System and Performance of Food and
Beverages Companies in Nigeria. , 6(1), pp.24–30.
Khabbazi, M.R., Hasan M.K., Shapi’i A., Sulaiman R., & Taei-Zadeh A. (2013).
Inventory System And Functionality Evaluation For Production Logistics. ,
54(3), pp.377–387.
Moule, B., & Giavara, L. (1995). Policies, Procedures and standard. Information
Management & Computer Security, 3(3), 7-16
Sindhu, S., Dr. Nirmalkumar, K. & Krishnamoorthy, V. (2014). Performance
Analysis of Inventory Management System in Construction Industries in India.
3(4), pp.11488–11493.
Taha, H. (2014) Operations Research: An Introduction, (8th
.Ed), International,
Singapore: Prentice-Hall
Proceedings of the 2nd
Master Project Symposium
121
Evaluation of Occupational Stress of Royal
Malaysian Navy Radar Plotters
Wong Boon Weia, Normawati Mohd Shariff
b
UTM Razak School of Engineering and Advanced Technology, Universiti Teknologi
Malaysia, Jalan Sultan Yahya Petra, 54100 Kuala Lumpur, Malaysia [email protected],
Abstract – Radar Plotting (RDP) is a highly important and sensitive industry, as
personnel are required to not only be highly vigilant, but to be in an environment
dealing directly with national security throughout their careers. The number of
reported and recorded disciplinary cases involving RDP personnel is relatively high
as compared to other specialisations. One should especially note that this number
has been increasing since 2012, and doubled in 2014 as compared to 2013. This
study’s purpose is to identify the levels of occupational stress and its dominant
sources amongst Royal Malaysian Navy (RMN) Radar Plotters (RDP). RDPs for the
purpose of this study are defined as those who take on primary RDP roles on RMN
ships and RMN operation units onshore. Additionally, this study also sought to
compare occupational stress levels between supervisory and non-supervisory RDP
personnel. The National Institute for Occupational Safety and Health (NIOSH)
Generic Job Stress Questionnaire was used to achieve the stated objectives.
Descriptive statistical analysis was used to analyse the mean score for the five
dimensions and an independent-samples t-test was used to compare occupational
stress levels. Results showed that RDP personnel face a high level of occupational
stress and supervisory RDP personnel experience higher stress levels than non-
supervisory RDP personnel in the dimensions of Job Roles, Job Requirements, and
Physical Environment. However, supervisory RDP personnel were more satisfied
and felt less pressure with their job, while reporting better social support from
superiors. It is anticipated that the findings of this study will provide valuable
information to RMN to develop relevant stress management measures for RDP
personnel in the future.
Keywords: Naval Personnel, Occupational Stress, NIOSH Generic Job Stress Questionnaire
1.0 INTRODUCTION
The RMN’s primary roles are to defend national maritime interests from any threat to
the country's sovereignty, as well as safeguarding territorial integrity and security,
including the preservation of life and property, while fulfilling a secondary role of
supporting local law enforcement agencies in carrying out their tasks. RDP is one of
the specialisations under the Seaman Branch. Currently, there are approximately 350
RDP personnel undertaking a primary RDP role. Generally, RDPs’ main roles
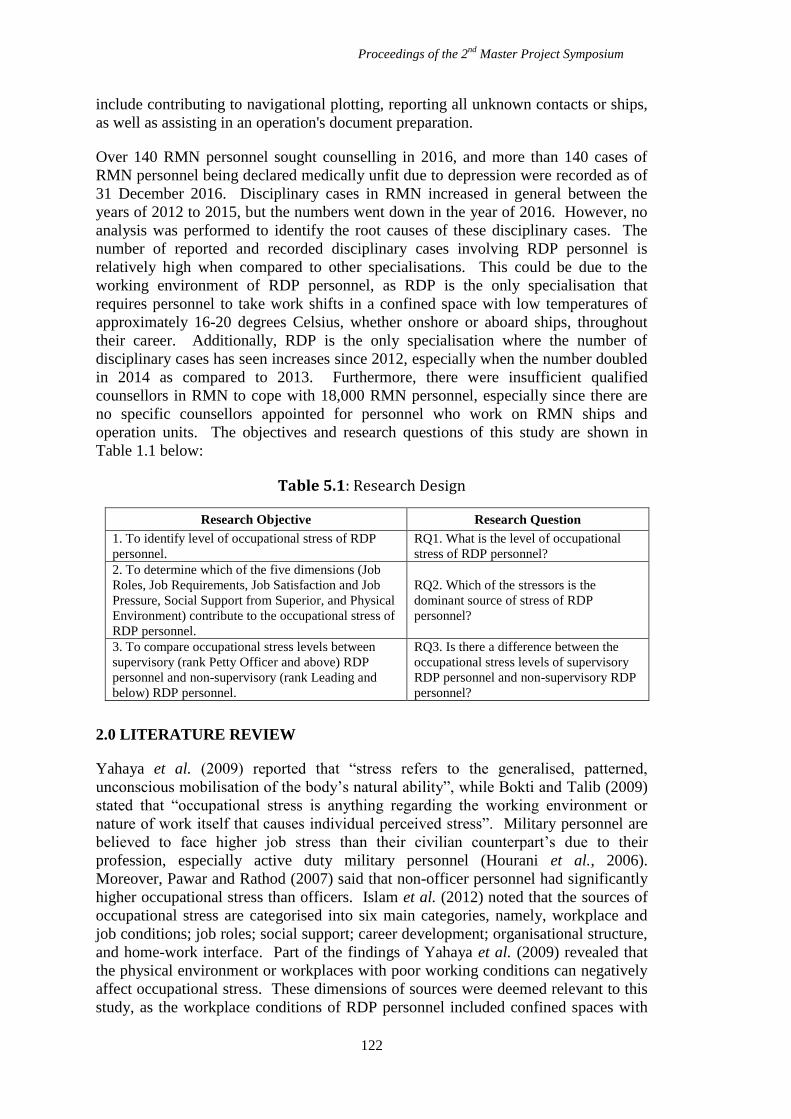
Proceedings of the 2nd
Master Project Symposium
122
include contributing to navigational plotting, reporting all unknown contacts or ships,
as well as assisting in an operation's document preparation.
Over 140 RMN personnel sought counselling in 2016, and more than 140 cases of
RMN personnel being declared medically unfit due to depression were recorded as of
31 December 2016. Disciplinary cases in RMN increased in general between the
years of 2012 to 2015, but the numbers went down in the year of 2016. However, no
analysis was performed to identify the root causes of these disciplinary cases. The
number of reported and recorded disciplinary cases involving RDP personnel is
relatively high when compared to other specialisations. This could be due to the
working environment of RDP personnel, as RDP is the only specialisation that
requires personnel to take work shifts in a confined space with low temperatures of
approximately 16-20 degrees Celsius, whether onshore or aboard ships, throughout
their career. Additionally, RDP is the only specialisation where the number of
disciplinary cases has seen increases since 2012, especially when the number doubled
in 2014 as compared to 2013. Furthermore, there were insufficient qualified
counsellors in RMN to cope with 18,000 RMN personnel, especially since there are
no specific counsellors appointed for personnel who work on RMN ships and
operation units. The objectives and research questions of this study are shown in
Table 1.1 below:
Table 5.1: Research Design
Research Objective Research Question
1. To identify level of occupational stress of RDP
personnel. RQ1. What is the level of occupational
stress of RDP personnel?
2. To determine which of the five dimensions (Job
Roles, Job Requirements, Job Satisfaction and Job
Pressure, Social Support from Superior, and Physical
Environment) contribute to the occupational stress of
RDP personnel.
RQ2. Which of the stressors is the
dominant source of stress of RDP
personnel?
3. To compare occupational stress levels between
supervisory (rank Petty Officer and above) RDP
personnel and non-supervisory (rank Leading and
below) RDP personnel.
RQ3. Is there a difference between the
occupational stress levels of supervisory
RDP personnel and non-supervisory RDP
personnel?
2.0 LITERATURE REVIEW
Yahaya et al. (2009) reported that “stress refers to the generalised, patterned,
unconscious mobilisation of the body’s natural ability”, while Bokti and Talib (2009)
stated that “occupational stress is anything regarding the working environment or
nature of work itself that causes individual perceived stress”. Military personnel are
believed to face higher job stress than their civilian counterpart’s due to their
profession, especially active duty military personnel (Hourani et al., 2006).
Moreover, Pawar and Rathod (2007) said that non-officer personnel had significantly
higher occupational stress than officers. Islam et al. (2012) noted that the sources of
occupational stress are categorised into six main categories, namely, workplace and
job conditions; job roles; social support; career development; organisational structure,
and home-work interface. Part of the findings of Yahaya et al. (2009) revealed that
the physical environment or workplaces with poor working conditions can negatively
affect occupational stress. These dimensions of sources were deemed relevant to this
study, as the workplace conditions of RDP personnel included confined spaces with
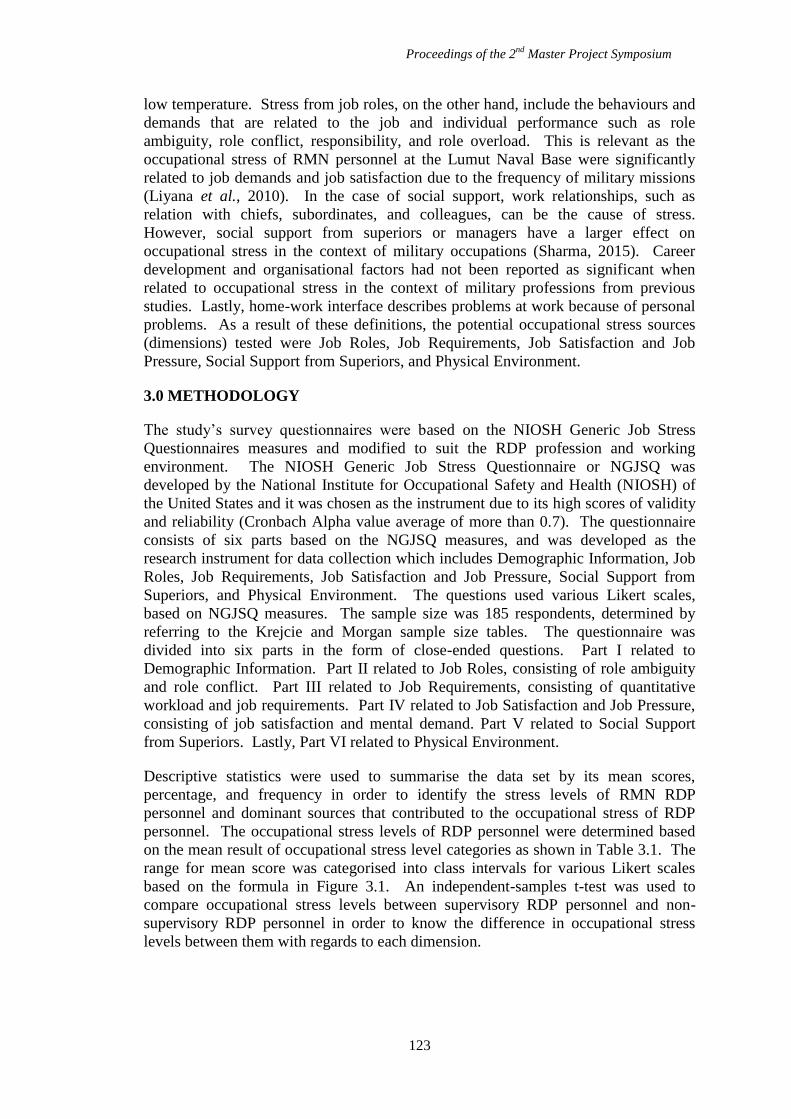
Proceedings of the 2nd
Master Project Symposium
123
low temperature. Stress from job roles, on the other hand, include the behaviours and
demands that are related to the job and individual performance such as role
ambiguity, role conflict, responsibility, and role overload. This is relevant as the
occupational stress of RMN personnel at the Lumut Naval Base were significantly
related to job demands and job satisfaction due to the frequency of military missions
(Liyana et al., 2010). In the case of social support, work relationships, such as
relation with chiefs, subordinates, and colleagues, can be the cause of stress.
However, social support from superiors or managers have a larger effect on
occupational stress in the context of military occupations (Sharma, 2015). Career
development and organisational factors had not been reported as significant when
related to occupational stress in the context of military professions from previous
studies. Lastly, home-work interface describes problems at work because of personal
problems. As a result of these definitions, the potential occupational stress sources
(dimensions) tested were Job Roles, Job Requirements, Job Satisfaction and Job
Pressure, Social Support from Superiors, and Physical Environment.
3.0 METHODOLOGY
The study’s survey questionnaires were based on the NIOSH Generic Job Stress
Questionnaires measures and modified to suit the RDP profession and working
environment. The NIOSH Generic Job Stress Questionnaire or NGJSQ was
developed by the National Institute for Occupational Safety and Health (NIOSH) of
the United States and it was chosen as the instrument due to its high scores of validity
and reliability (Cronbach Alpha value average of more than 0.7). The questionnaire
consists of six parts based on the NGJSQ measures, and was developed as the
research instrument for data collection which includes Demographic Information, Job
Roles, Job Requirements, Job Satisfaction and Job Pressure, Social Support from
Superiors, and Physical Environment. The questions used various Likert scales,
based on NGJSQ measures. The sample size was 185 respondents, determined by
referring to the Krejcie and Morgan sample size tables. The questionnaire was
divided into six parts in the form of close-ended questions. Part I related to
Demographic Information. Part II related to Job Roles, consisting of role ambiguity
and role conflict. Part III related to Job Requirements, consisting of quantitative
workload and job requirements. Part IV related to Job Satisfaction and Job Pressure,
consisting of job satisfaction and mental demand. Part V related to Social Support
from Superiors. Lastly, Part VI related to Physical Environment.
Descriptive statistics were used to summarise the data set by its mean scores,
percentage, and frequency in order to identify the stress levels of RMN RDP
personnel and dominant sources that contributed to the occupational stress of RDP
personnel. The occupational stress levels of RDP personnel were determined based
on the mean result of occupational stress level categories as shown in Table 3.1. The
range for mean score was categorised into class intervals for various Likert scales
based on the formula in Figure 3.1. An independent-samples t-test was used to
compare occupational stress levels between supervisory RDP personnel and non-
supervisory RDP personnel in order to know the difference in occupational stress
levels between them with regards to each dimension.
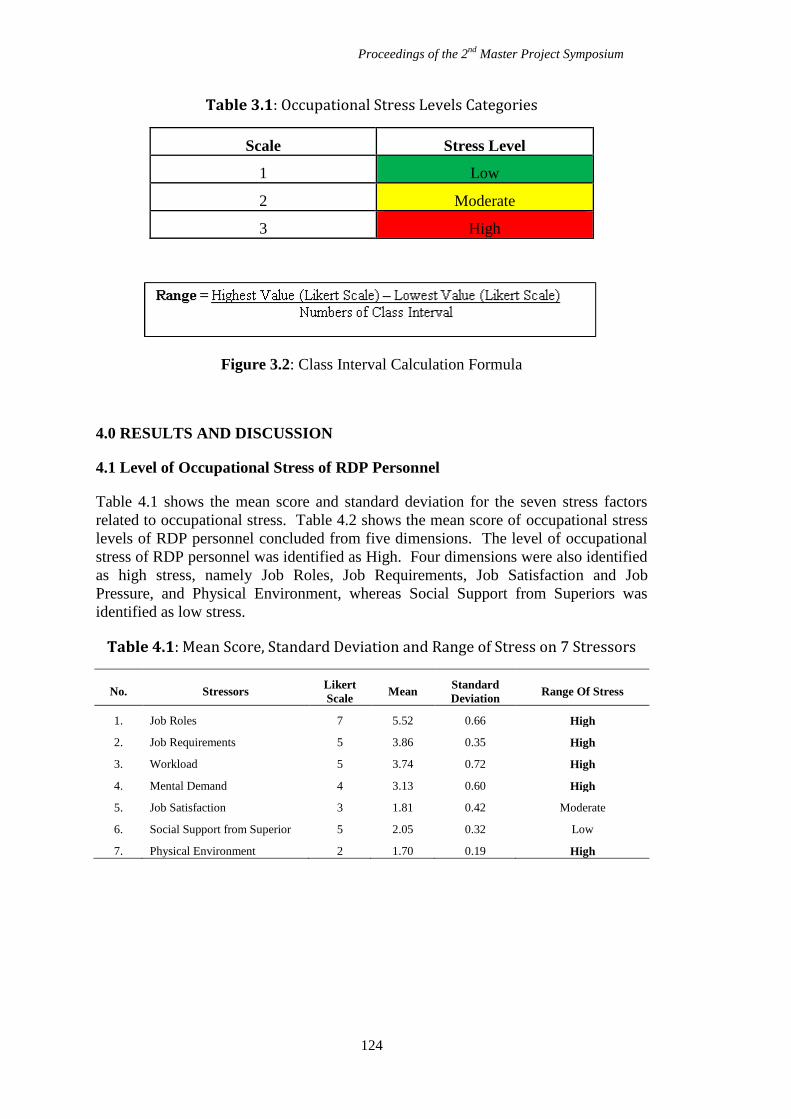
Proceedings of the 2nd
Master Project Symposium
124
Table 3.1: Occupational Stress Levels Categories
Scale Stress Level
1 Low
2 Moderate
3 High
Figure 3.2: Class Interval Calculation Formula
4.0 RESULTS AND DISCUSSION
4.1 Level of Occupational Stress of RDP Personnel
Table 4.1 shows the mean score and standard deviation for the seven stress factors
related to occupational stress. Table 4.2 shows the mean score of occupational stress
levels of RDP personnel concluded from five dimensions. The level of occupational
stress of RDP personnel was identified as High. Four dimensions were also identified
as high stress, namely Job Roles, Job Requirements, Job Satisfaction and Job
Pressure, and Physical Environment, whereas Social Support from Superiors was
identified as low stress.
Table 4.1: Mean Score, Standard Deviation and Range of Stress on 7 Stressors
No. Stressors Likert
Scale Mean
Standard
Deviation Range Of Stress
1. Job Roles 7 5.52 0.66 High
2. Job Requirements 5 3.86 0.35 High
3. Workload 5 3.74 0.72 High
4. Mental Demand 4 3.13 0.60 High
5. Job Satisfaction 3 1.81 0.42 Moderate
6. Social Support from Superior 5 2.05 0.32 Low
7. Physical Environment 2 1.70 0.19 High
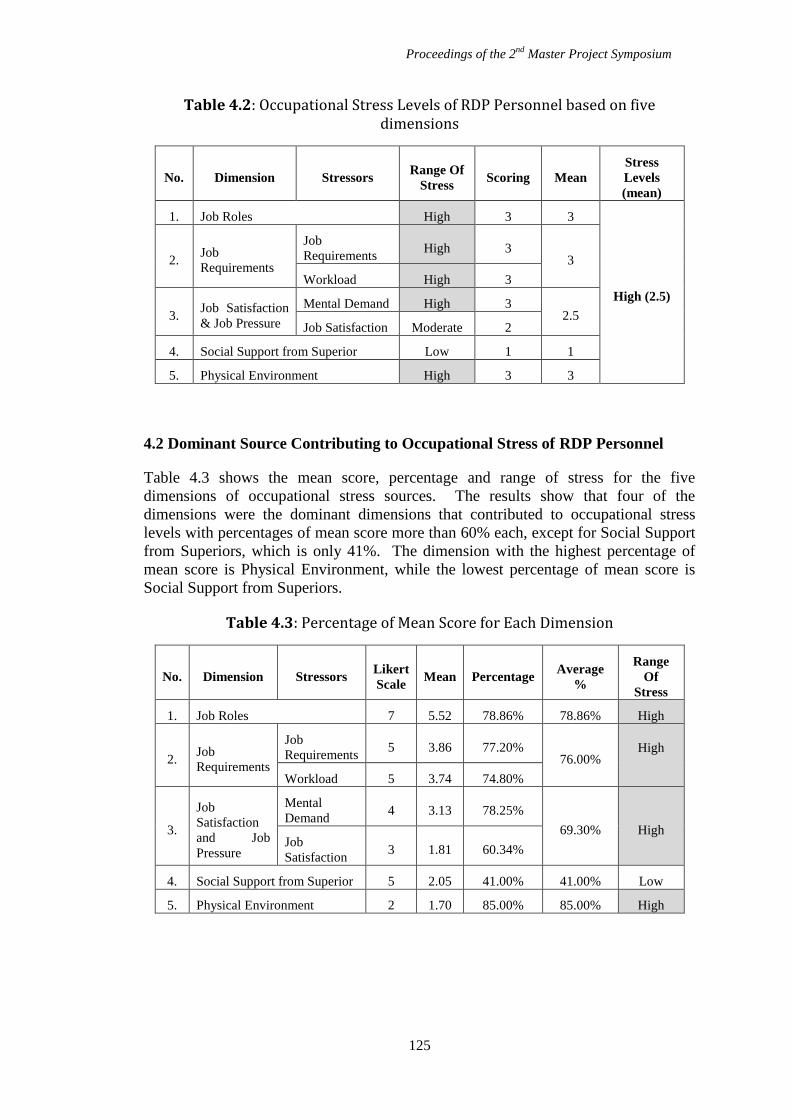
Proceedings of the 2nd
Master Project Symposium
125
Table 4.2: Occupational Stress Levels of RDP Personnel based on five dimensions
No. Dimension Stressors Range Of
Stress Scoring Mean
Stress
Levels
(mean)
1. Job Roles High 3 3
High (2.5)
2. Job
Requirements
Job
Requirements High 3
3
Workload High 3
3. Job Satisfaction
& Job Pressure
Mental Demand High 3 2.5
Job Satisfaction Moderate 2
4. Social Support from Superior Low 1 1
5. Physical Environment High 3 3
4.2 Dominant Source Contributing to Occupational Stress of RDP Personnel
Table 4.3 shows the mean score, percentage and range of stress for the five
dimensions of occupational stress sources. The results show that four of the
dimensions were the dominant dimensions that contributed to occupational stress
levels with percentages of mean score more than 60% each, except for Social Support
from Superiors, which is only 41%. The dimension with the highest percentage of
mean score is Physical Environment, while the lowest percentage of mean score is
Social Support from Superiors.
Table 4.3: Percentage of Mean Score for Each Dimension
No. Dimension Stressors Likert
Scale Mean Percentage
Average
%
Range
Of
Stress
1. Job Roles 7 5.52 78.86% 78.86% High
2. Job
Requirements
Job
Requirements 5 3.86 77.20%
76.00% High
Workload 5 3.74 74.80%
3.
Job
Satisfaction
and Job
Pressure
Mental
Demand 4 3.13 78.25%
69.30% High Job
Satisfaction 3 1.81 60.34%
4. Social Support from Superior 5 2.05 41.00% 41.00% Low
5. Physical Environment 2 1.70 85.00% 85.00% High
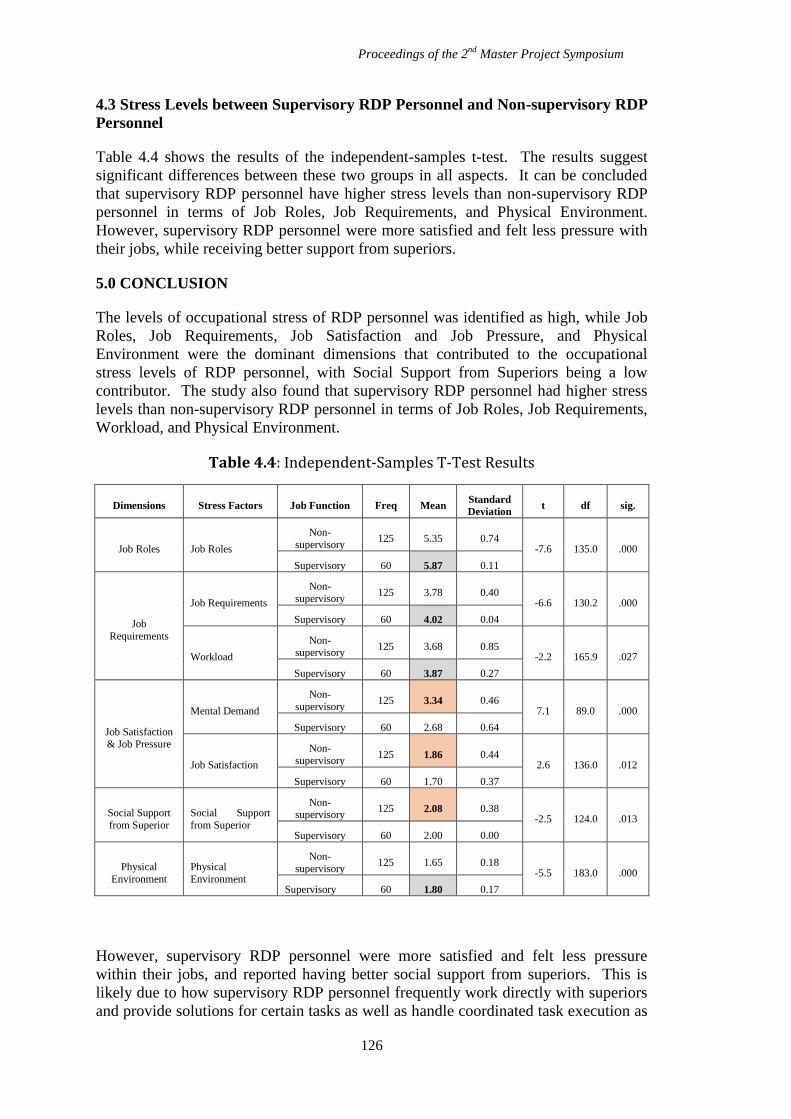
Proceedings of the 2nd
Master Project Symposium
126
4.3 Stress Levels between Supervisory RDP Personnel and Non-supervisory RDP
Personnel
Table 4.4 shows the results of the independent-samples t-test. The results suggest
significant differences between these two groups in all aspects. It can be concluded
that supervisory RDP personnel have higher stress levels than non-supervisory RDP
personnel in terms of Job Roles, Job Requirements, and Physical Environment.
However, supervisory RDP personnel were more satisfied and felt less pressure with
their jobs, while receiving better support from superiors.
5.0 CONCLUSION
The levels of occupational stress of RDP personnel was identified as high, while Job
Roles, Job Requirements, Job Satisfaction and Job Pressure, and Physical
Environment were the dominant dimensions that contributed to the occupational
stress levels of RDP personnel, with Social Support from Superiors being a low
contributor. The study also found that supervisory RDP personnel had higher stress
levels than non-supervisory RDP personnel in terms of Job Roles, Job Requirements,
Workload, and Physical Environment.
Table 4.4: Independent-Samples T-Test Results
Dimensions Stress Factors Job Function Freq Mean Standard
Deviation t df sig.
Job Roles Job Roles
Non-
supervisory 125 5.35 0.74
-7.6 135.0 .000
Supervisory 60 5.87 0.11
Job
Requirements
Job Requirements
Non-
supervisory 125 3.78 0.40
-6.6 130.2 .000
Supervisory 60 4.02 0.04
Workload
Non-supervisory
125 3.68 0.85 -2.2 165.9 .027
Supervisory 60 3.87 0.27
Job Satisfaction & Job Pressure
Mental Demand
Non-
supervisory 125 3.34 0.46
7.1 89.0 .000
Supervisory 60 2.68 0.64
Job Satisfaction
Non-
supervisory 125 1.86 0.44
2.6 136.0 .012
Supervisory 60 1.70 0.37
Social Support
from Superior
Social Support
from Superior
Non-supervisory
125 2.08 0.38 -2.5 124.0 .013
Supervisory 60 2.00 0.00
Physical
Environment
Physical
Environment
Non-
supervisory 125 1.65 0.18
-5.5 183.0 .000
Supervisory 60 1.80 0.17
However, supervisory RDP personnel were more satisfied and felt less pressure
within their jobs, and reported having better social support from superiors. This is
likely due to how supervisory RDP personnel frequently work directly with superiors
and provide solutions for certain tasks as well as handle coordinated task execution as
Proceedings of the 2nd
Master Project Symposium
127
compared to non-supervisory RDP personnel, who work by following orders.
Supervisory RDP personnel, perhaps due to higher rank, may expect and receive
better treatment from superiors, such as, for example, obtaining better workplace
conditions. Supervisory RDP personnel were generally more satisfied and felt less
pressure, probably due to longer service durations and a better working experience, as
well as having gotten used to the job. These findings may contribute to occupational
stress management in related fields. Future researchers may use these findings as a
guidance to focus on improvement of occupational safety and health in RMN.
REFERENCES
Bokti, N. L. M., & Talib, M. A. (2009). A preliminary study on occupational stress
and job satisfaction among male navy personnel at a naval base in Lumut,
Malaysia. The Journal of International Social Research, 2(9), 299-307.
Hourani, L. L., Williams, T. V., & Kress, A. M. (2006). Stress, mental health, and job
performance among active duty military personnel: findings from the 2002
Department of Defense Health-Related Behaviors Survey. Military
medicine, 171(9), 849.
Islam, J., Mohajan, H., & Datta, R. (2012). Stress management policy analysis: a
preventative approach. International Journal of Economics and Research, 3
(6), 1-17.
Liyana, N., Bokti, M., & Talib, M. A. (2010). Tekanan kerja, motivasi dan kepuasan
kerja tentera laut armada tentera laut diraja Malaysia. Jurnal
Kemanusiaan, 15.
Pawar, A. A., & Rathod, J. (2007). Occupational stress in naval personnel. Medical
Journal Armed Forces India, 63(2), 154-156.
Sharma, S. (2015). Occupational stress in the armed forces: An Indian army
perspective. IIMB Management Review, 27(3), 185-195.
Yahaya, A., Yahaya, N., Arshad, K., Ismail, J., Jaalam, S., & Zakariya, Z. (2009).
Occupational stress and its effects towards the organization management.
Journal of Social Science. 5(4), 390-397.
Proceedings of the 2nd
Master Project Symposium
128
Safety Culture Among the Construction
Workers in Rapid Rail Project
Fazila Kamarudina and Norazli Othman
b
UTM Razak School of Engineering and Advanced Technology, Universiti Teknologi
Malaysia, Jalan Sultan Yahya Petra, 54100 Kuala Lumpur, Malaysia [email protected],
Abstract – The project owner has applied stringent safety requirements in additional
to compliance to legal requirement, however incident still occurred on site.
Therefore, this study will identify the cause of accident, determine the factors
affecting the safe behavior and propose framework in in order to achieve safe culture
in mass rapid project construction. The methodology is divided into three which is
the questionnaire survey, site observation and data review. The questionnaire survey
is divided into five factors affecting behaviors namely management safety
commitment, social support, safety knowledge and safety performance. Site
observation was carried out with a prepared checklist that focus on the workers
behavior at site with 30 sample from each contractor. Findings reveal that most
accident are due to unsafe behavior. More than 80% of respondent agree that safe
behavior is important but the site observation reveal that the workers’ safe behavior
required further improvement. Therefore, it is crucial to establish safety behavior
program to ensure safe behavior among workers. The development of safety culture
does not rely on top management by simply providing control measures such as
standard operating procedures, tool box briefing, PPE and others onsite only but it
must be instill through the workers attitude and mind in each individual in the
organization. Safety culture framework is proposed focusing on behavioral stage
whereby organization need to have behavioral program which is supported by the
management commitment, safety training, communication, participation and resource
allocation.
Keywords: Safety Culture, safe behaviour, construction
1.0 INTRODUCTION
Every time when there is an accident at construction site, the responsible parties begin
investigating the root cause and how could it be prevented in the first place. Although
the investigation and problem-solving process been carried out, fault finding is
normal and there is always be reasons for occurrence of the accident. Normally and
most conveniently, workers are to be blame for the accident because of the
carelessness and inattentive while performing their tasks. Almost none of the accident
findings concluded other facts that are more important such as unavailability of
suitable equipment, unavailability of procedures and training, unprotected machine,
Proceedings of the 2nd
Master Project Symposium
129
and absence of hazard identification. It is important to investigate the unsafe behavior
of workers and factors affecting their behavior which lead to an accident. Since
behaviors are a function of their consequences, culture formation can be thought of as
a series of behaviors and consequences (Faridah et al., 2011).
According to Hong Kong Special Administrative Region, Labour Department, 2012,
approximately 80% of accidents on construction are caused by unsafe human
behaviour with majorities of the fatalities due to falling from heights, striking against
or being struck by moving object, or being struck specifically by moving vehicles. In
Malaysia, among all the occupational sectors, construction sector is listed as the
highest fatal accidents in 2015 and 2014 reported by Department Occupational Safety
and Health (DOSH) and the third most occupational accident cases reported to
DOSH. In year 2014 the total number of victims reported involved in the construction
sectors accidents are 72, 94 and 6 respectively for Death (D), Non-Permanent
Disability (NPD) and Permanent Disability (PD) reported by DOSH. However, in
year 2015, the number of the victims reported by DOSH in construction accidents are
88, 138, and 11 respectively for D, NPD and PD. There is an increase figure of
victims involved in year 2014 of 172 victims to 231 victims in year 2015 and the
highest fatalities cases among all sector is become a major concern not only to the
construction industry but also the authorities.
2.0 LITERATURE REVIEW
Safety culture is divided into three components i.e psychological aspect (how people
feel), behavioural aspect (what people do) and situational aspects (what organisational
has) (Cooper, 2000). It is defined as the product of shared values, beliefs, attitudes,
and pattern of behaviour based on top-down approach practices that are concerned
with minimizing the exposure to conditions considered dangerous or injurious to the
entire group members on a self-regulatory basis (Faridah, 2011). The psychological
aspects of the Safety Culture refers “How people feel” about safety and safety
management systems and this represent the beliefs, attitudes, values and perception of
individuals and groups at all level of the organization, which are often referred as the
safety climate (Faridah, 2011) . Behavioral aspects are concerned with “what people
do” within the organization which includes the safety related activities, action and
behaviors exhibited by employees which also can be described as organizational
factors(Faridah, 2011. The situational aspects of Safety Culture describe “what the
organization has” and this reflected in the organisation’s policies, operating
procedures, management system, control systems, communication flows and
workflow systems and these aspects can also be described as corporate factors
(Faridah, 2011).
The Reciprocal Safety Culture Model by Cooper is used for the development of the
framework for this study. This is because the characteristic of these factors
constitutes Psychological, Behavioral and Situational factors which allow
triangulations of the perspectives in the context of safety culture within the
organization (Faridah et al., 2010). These three elements also mirror those accident
causation relationship by number of researcher (Faridah et al., 2010). Furthermore,
the model itself promotes self-regulation which are consistent to the definition of
safety culture as “the product of shared values, beliefs, attitudes and patterns of
Proceedings of the 2nd
Master Project Symposium
130
behavior, based on top-down approach practices that are concerned with minimizing
the exposure to conditions which are dangerous and harmful to the entire group
members on a self-regulatory basis (Faridah et al., 2004).
One of the main element in safety culture is behavioral aspect. There are many
factors affecting the safe behavior of the construction workers. However, for the
purpose of this research the factors affecting safe behavior will limit to management
commitment, social support, project progress, motivation and knowledge and safety
performance.
Behavior is anything someone does or says. It is an action or reaction person or things
in response to external or internal stimuli (Choudhry, 2014). According to the theory,
behavior is determined by the behavioral intention to emit the behavior. The theory
proposed that behavior is affected by behavioral intentions which, in turn, are affected
by attitudes toward the act and by subjective norms (Choudhry, 2012).
3.0 METHODOLOGY
The research is based on data review of accident causation analysis, questionnaire and
site observation. Data review of this study is focus on accident causation which is
due to unsafe act an unsafe condition. Review of accident analysis is carried out for
only reportable accident case to DOSH. Reportable accident to DOSH includes
fatalities, permanent disabilities, temporary disabilities and dangerous occurrence.
From the total number of reportable accident, the root cause of each incident will be
segregated into unsafe act and unsafe condition.
Survey questionnaire is distributed to the contractors selected for this study. A total
of 210 questionnaires is distributed for three (3) contractor in rapid rail project. The
survey questionnaire consists of two (2) part i.e. Section 1 – Demographic
Information and Section 2 – Safe Behavior. On demographic information (Section 1),
the questionnaire will enquire on participant’s gender, age, highest qualification,
working experience, workers trade, and employment category. Since construction
industries involves in hard labor, it is expected most of the participant is male with
highest education of (SPM) or diploma. Expected working experience will be
between 3-8 years. Employment category divided into local and foreigner.
Section 2 of the questionnaire enquire the participants to respond to 5 main segments
on the questionnaire i.e. the management safety commitment, social support, project
completion pressure and safety knowledge. The questionnaire is developed in
5 points - Likert scale from Strongly Disagree to Strongly Agree. Each segment is
detailed down to 4 to 5 questions. On management safety commitment, four (4) main
factors were asked i.e. priority on safety operation, safety welfare, management effort
to upgrade safety facilities and reduce safety problem and prevention of occurrence
for safety related incident. On social support, respondent will be asked on whether
their supervisor and co-worker will caution them if they are working at risk, is the
supervisor makes on going and frequent inspection on safe behavior. For project
completion pressure, respondent will be asked if they are making short cut to get their
job done in timely manner, are they always being hurried by supervisor and safety is
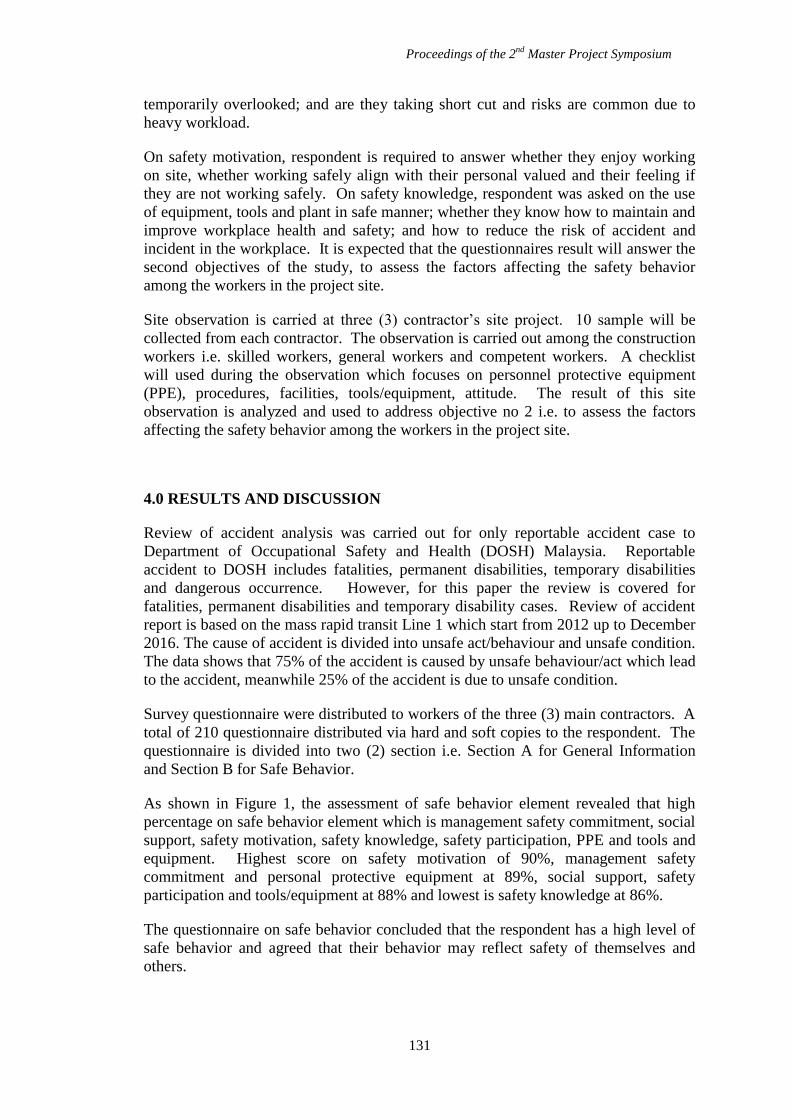
Proceedings of the 2nd
Master Project Symposium
131
temporarily overlooked; and are they taking short cut and risks are common due to
heavy workload.
On safety motivation, respondent is required to answer whether they enjoy working
on site, whether working safely align with their personal valued and their feeling if
they are not working safely. On safety knowledge, respondent was asked on the use
of equipment, tools and plant in safe manner; whether they know how to maintain and
improve workplace health and safety; and how to reduce the risk of accident and
incident in the workplace. It is expected that the questionnaires result will answer the
second objectives of the study, to assess the factors affecting the safety behavior
among the workers in the project site.
Site observation is carried at three (3) contractor’s site project. 10 sample will be
collected from each contractor. The observation is carried out among the construction
workers i.e. skilled workers, general workers and competent workers. A checklist
will used during the observation which focuses on personnel protective equipment
(PPE), procedures, facilities, tools/equipment, attitude. The result of this site
observation is analyzed and used to address objective no 2 i.e. to assess the factors
affecting the safety behavior among the workers in the project site.
4.0 RESULTS AND DISCUSSION
Review of accident analysis was carried out for only reportable accident case to
Department of Occupational Safety and Health (DOSH) Malaysia. Reportable
accident to DOSH includes fatalities, permanent disabilities, temporary disabilities
and dangerous occurrence. However, for this paper the review is covered for
fatalities, permanent disabilities and temporary disability cases. Review of accident
report is based on the mass rapid transit Line 1 which start from 2012 up to December
2016. The cause of accident is divided into unsafe act/behaviour and unsafe condition.
The data shows that 75% of the accident is caused by unsafe behaviour/act which lead
to the accident, meanwhile 25% of the accident is due to unsafe condition.
Survey questionnaire were distributed to workers of the three (3) main contractors. A
total of 210 questionnaire distributed via hard and soft copies to the respondent. The
questionnaire is divided into two (2) section i.e. Section A for General Information
and Section B for Safe Behavior.
As shown in Figure 1, the assessment of safe behavior element revealed that high
percentage on safe behavior element which is management safety commitment, social
support, safety motivation, safety knowledge, safety participation, PPE and tools and
equipment. Highest score on safety motivation of 90%, management safety
commitment and personal protective equipment at 89%, social support, safety
participation and tools/equipment at 88% and lowest is safety knowledge at 86%.
The questionnaire on safe behavior concluded that the respondent has a high level of
safe behavior and agreed that their behavior may reflect safety of themselves and
others.
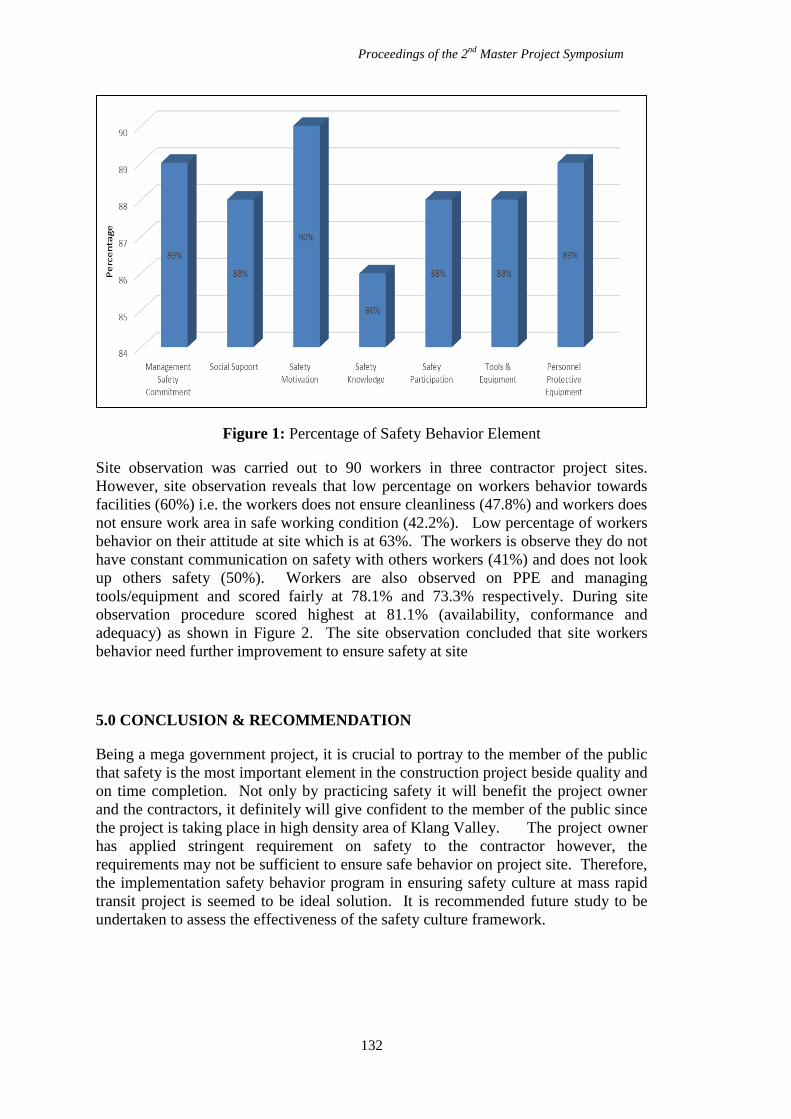
Proceedings of the 2nd
Master Project Symposium
132
Figure 1: Percentage of Safety Behavior Element
Site observation was carried out to 90 workers in three contractor project sites.
However, site observation reveals that low percentage on workers behavior towards
facilities (60%) i.e. the workers does not ensure cleanliness (47.8%) and workers does
not ensure work area in safe working condition (42.2%). Low percentage of workers
behavior on their attitude at site which is at 63%. The workers is observe they do not
have constant communication on safety with others workers (41%) and does not look
up others safety (50%). Workers are also observed on PPE and managing
tools/equipment and scored fairly at 78.1% and 73.3% respectively. During site
observation procedure scored highest at 81.1% (availability, conformance and
adequacy) as shown in Figure 2. The site observation concluded that site workers
behavior need further improvement to ensure safety at site
5.0 CONCLUSION & RECOMMENDATION
Being a mega government project, it is crucial to portray to the member of the public
that safety is the most important element in the construction project beside quality and
on time completion. Not only by practicing safety it will benefit the project owner
and the contractors, it definitely will give confident to the member of the public since
the project is taking place in high density area of Klang Valley. The project owner
has applied stringent requirement on safety to the contractor however, the
requirements may not be sufficient to ensure safe behavior on project site. Therefore,
the implementation safety behavior program in ensuring safety culture at mass rapid
transit project is seemed to be ideal solution. It is recommended future study to be
undertaken to assess the effectiveness of the safety culture framework.
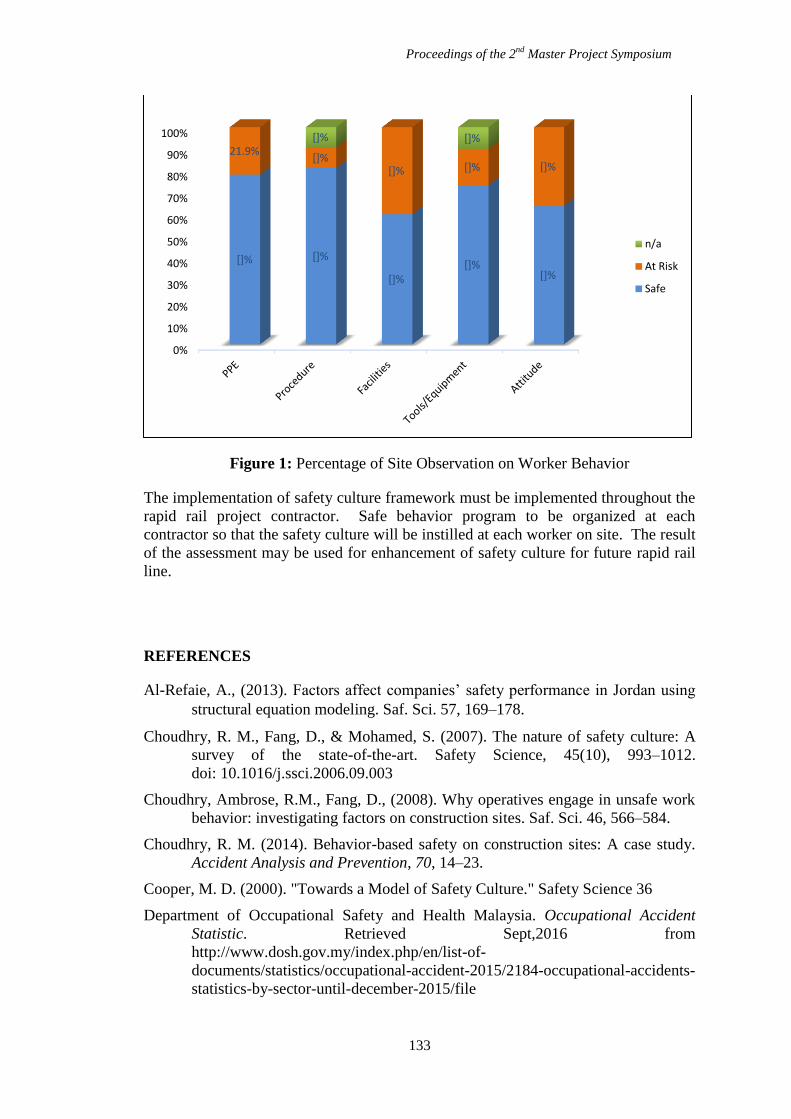
Proceedings of the 2nd
Master Project Symposium
133
Figure 1: Percentage of Site Observation on Worker Behavior
The implementation of safety culture framework must be implemented throughout the
rapid rail project contractor. Safe behavior program to be organized at each
contractor so that the safety culture will be instilled at each worker on site. The result
of the assessment may be used for enhancement of safety culture for future rapid rail
line.
REFERENCES
Al-Refaie, A., (2013). Factors affect companies’ safety performance in Jordan using
structural equation modeling. Saf. Sci. 57, 169–178.
Choudhry, R. M., Fang, D., & Mohamed, S. (2007). The nature of safety culture: A
survey of the state-of-the-art. Safety Science, 45(10), 993–1012.
doi: 10.1016/j.ssci.2006.09.003
Choudhry, Ambrose, R.M., Fang, D., (2008). Why operatives engage in unsafe work
behavior: investigating factors on construction sites. Saf. Sci. 46, 566–584.
Choudhry, R. M. (2014). Behavior-based safety on construction sites: A case study.
Accident Analysis and Prevention, 70, 14–23.
Cooper, M. D. (2000). "Towards a Model of Safety Culture." Safety Science 36
Department of Occupational Safety and Health Malaysia. Occupational Accident
Statistic. Retrieved Sept,2016 from
http://www.dosh.gov.my/index.php/en/list-of-
documents/statistics/occupational-accident-2015/2184-occupational-accidents-
statistics-by-sector-until-december-2015/file
0%
10%
20%
30%
40%
50%
60%
70%
80%
90%
100%
[]% []%
[]% []%
[]%
21.9% []%
[]% []% []%
[]% []%
n/a
At Risk
Safe
Proceedings of the 2nd
Master Project Symposium
134
Guldenmund, F. W. (2010). Understanding and Exploring Safety Culture. (Published
Dissertation). Oisterwijk, Netherlands: Uitgeverij Boxpress
Guo, B., Yiu, T.W., 2013. How traditional construction safety performance indicators
fail to capture the reality of safety. In: Yiu, T.W., Gonzalez, V. (Eds.),
Austrlasian Universities Building Education Association Conference,
Auckland, New Zealand.
Guo, B. H. W., Yiu, T. W., & González, V. A. (2016). Predicting safety behavior in
the construction industry: Development and test of an integrative model.
Safety Science, 84, 1–11. http://doi.org/10.1016/j.ssci.2015.11.020
Faridah, I., Ahmad, N., Isnaini Janipha, N.A., and Ismail, R. (2011). Assessing the
Behavioural Factors’ of Safety Culture for the Malaysian Construction
Companies. Proceedings ASEAN Conference on Environment-Behaviour
Studies (AcE-Bs 2011), Bandung, Indonesia, 15-17 June 2011
Ismail, F., Ahmad, N., Ismail, R., & Janipha, N. A. I. (2012). The Behavioural
Factors’ Characteristics of Safety Culture. Journal of Asian Behavioural
Studies, 2, 67–75.
Fruhen, L.S., Mearns, K.J., Flin, R., Kirwan, B., 2013. Skills, knowledge and senior
managers’ demonstrations of safety commitment. Saf. Sci.
Hinze, J., Thurman, S., Wehle, A., 2013b. Leading indicators of construction safety
performance. Saf. Sci. 51, 23–28.
Hardison, D., Behm, M., Hallowell, M.R., Fonooni, H., 2014. Identifying
construction supervisor competencies for effective site safety. Saf. Sci. 65,
45–53.
Hsu, S.H., Lee, C.C., Wu, M.C., Takano, K., 2010. The influence of organizational
factors on safety in Taiwanese high-risk industries. J. Loss Prevention Process
Ind. 23, 646–653.
Health and Safety Executive, 2009. Annual Statistics Report, 2009. Retrieved from
http://www.hse.gov.uk/aboutus/reports/hsinhse0911.pdf
Hong Kong Special Administration Region, Labor Department, 2012
Lingard, H., Cooke, T., Blismas, N., 2012. Do perceptions of supervisors’ safety
responses mediate the relationship between perceptions of the organizational
safety climate and incident rates in the construction supply chain? J. Constr.
Eng. Manage. 138, 234–241
Molenaar, K.R., Park, J.-I., Washington, S., 2009. Framework for measuring
corporate safety culture and its impact on construction safety performance. J.
Constr. Eng. Manage. 135, 488–496
Neal, A., Griffin, M.A., Hart, P.M., 2000. The impact of organizational climate on
safety climate and individual behavior. Saf. Sci. 34, 99–109
Neal, A., Griffin, M., 2004. Safety climate and safety at work. In: Barling, J., Frone,
M.R. (Eds.), The Psychology of Workplace Safety. Psychological
Association, United States, pp. 15–34.
Proceedings of the 2nd
Master Project Symposium
135
Parker, S.K., Axtell, C.M., Turner, N., 2001. Designing a safer workplace.
Importance of job autonomy, communication quality, and supportive
supervisors. J. Occup. Health Psychol. 6 (3).
Pidgeon, N. (1991). Safety Culture and Risk Management in Organisation. Journal of
Cross-Cultural Psychology. 22, 129-140.
Peterson, D., 2000. The Behavioral Approach To Safety Management. Prof. Saf. 45
(3),37–41.
Sampson, J.M., DeArmond, S., Chen, P.Y., 2014. Role of safety stressors and social
support on safety performance. Saf. Sci. 64, 137–145
Sunindijo, R Y and Zou, P X W (2013) ‘The roles of emotional intelligence,
interpersonal skill, and transformational leadership on improving construction
safety performance’, Australasian Journal of Construction Economics and
Building, 13 (3) 97-113
U.S. Department of Transportation (2011). Safety Culture A Significant Driver
Affecting Safety in Transportation. Research Paper Prepared for the US DOT
Safety Council, 1–19.
Vinodkumar, M.N., Bhasi, M., 2010. Safety management practices and safety
behaviour: assessing the mediating role of safety knowledge and motivation.
Accident Anal. Prevention 42, 2082–2093
Zhou, Q., Fang, D., Mohamed, S., 2010. Safety climate improvement: case study in a
Chinese construction company. J. Constr. Eng. Manage. 137, 86–95.
Zohar, D., 2010. Thirty years of safety climate research: reflections and future
directions. Accident Anal. Prevention 42, 1517–1522

Proceedings of the 2nd
Master Project Symposium
136
Job Satisfaction and Work Stress in
Human Resources Management
Department of XYZ Bank Headquarter
Mohamad Adzim Samsudina and Noor Hamizah Hussain
b
UTM Razak School of Engineering and Advance Technology, Universiti Teknolgi
Malaysia, Jalan Sulta Yahya Petra, 54100 Kuala Lumpur, Malaysia [email protected],
Abstract
Banking sector is a one of the challenging and stressful job. Poor job satisfaction will
lead to high stress and could affect employees’ life. The aim of this study is to
investigate the variables of job satisfaction and work stress in order to determine the
relationship between job satisfaction and work stress. The finding can then be used to
recommend factors in order to increase job satisfaction and reduce work stress
amongst employee at Human Resource Management Department (HRMD) are of
XYZ Bank Headquarter (HQ). These findings would provide the XYZ Bank the result
of job satisfaction and work stress experienced by the employee so that intervention
could be implemented. The sample were 45 employees from HRMD of XYZ Bank
HQ. A set of questionnaires was administered to evaluate employees’ perception on
job satisfaction and work stress levels. Informed consent was obtained from the
various position of employee at HRMD of XYZ Bank HQ and privacy of
participation was ensured. The five (5) hypothesis was formulated to determine the
prevalence of job satisfaction and work stress factor among employee. Statistical
analyses included correlation as well as descriptive statistics was used. The results of
the study indicate there is a statistically significant with medium positive correlation
between job satisfaction and work stress. The results may not be suitable to generalize
the findings to other population, but as a representative to an organization of the same
department and sector. The recommended factors to increase job satisfaction and
reduce work stress was introduced using the suitable training and hence provide job
security for employee.
1.0 INTRODUCTION
The banking sector in Malaysia has undergone incredible changes with increased
competition, increased levels of deregulation, which has facilitated the Malaysian
Banking system and has placed huge pressure and has created poor job satisfaction on
bank employees which result high number of work stress (Ling, Bahron, & Boroh,
2014). Job satisfaction is the measure of individual’s perception of his or her job, both
in terms of financial and non-financial factors and has effects for how well the
employee is motivated to do their job (Hanna, Kee, & Robertson, 2017).
Proceedings of the 2nd
Master Project Symposium
137
Stress has become a certain part of human life and makes life difficult and people
need to handle with proper way (Riaz et al., 2016). The life of the employees has
become very difficult, due to which their mental and health gets affected. In 2000,
Malaysia going forward to privatization, and globalization. All sectors including
banking sector have undergo major reforms, including (Yadav & Dabhade, 2014).
With the opening of the banking sector, XYZ Bank had to face fierce competition
from private and foreign banks. The productivity of the work force determines the
achievement of company. In an age of highly competitive market, bank employees are
exposed to numbers of stressor factor that can affect them on all aspects of life (Jedin
& Abidin, 2013).
2.0 RESEARCH METHODOLOGY
For this study, the research method that had been used is to collect data were survey
questionnaire.
2.1 Research Design
This study is a quantitative study. The type of investigation was Correlation Analysis
in nature. This study was distributed the questionnaire to the respondent as the
method to collected the data. Besides, this is a cross-sectional study.
The hypothesis and research questions as given below:
H1. Poor work environment will lead to lower employee job satisfaction.
H2. Attitude toward change will lead to lower employee job satisfaction.
H3. Workload would increase the level of employee work stress.
H4. Role conflict would increase the level of employee work stress.
H5. Interpersonal at Workplace would increase the level of employee work
stress.
2.2 Research Instrument
The instrument that used in this study is a questionnaire. A questionnaire is a
reformulated written set of questions to which respondents record their answers,
usually within rather closely defined alternatives. Questionnaires are generally
designed to collect large numbers of quantitative data. They can be administered
personally distributed.
The research objectives (RO) can be further detailed as follows:
RO1. To investigate the variable of job satisfaction and work stress.
RO2. To evaluate relationship between job satisfaction and work stress.
RO3. To recommend factor to increase job satisfaction and reduce work
stress.
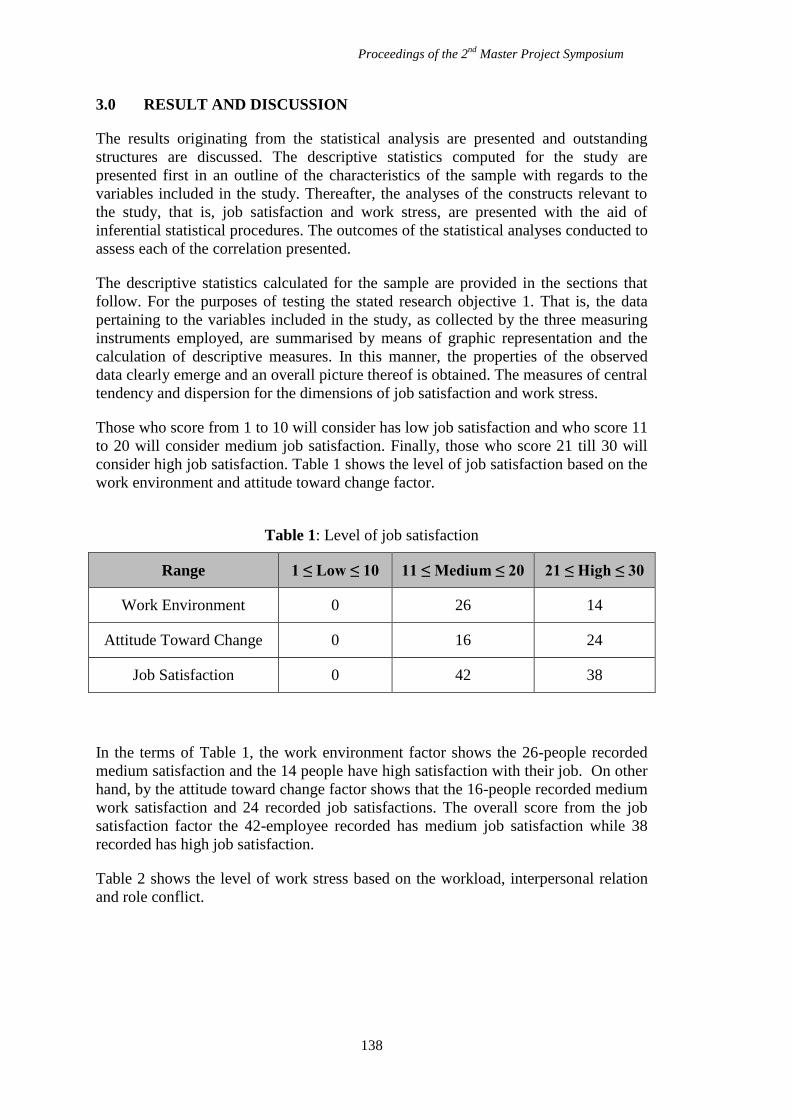
Proceedings of the 2nd
Master Project Symposium
138
3.0 RESULT AND DISCUSSION
The results originating from the statistical analysis are presented and outstanding
structures are discussed. The descriptive statistics computed for the study are
presented first in an outline of the characteristics of the sample with regards to the
variables included in the study. Thereafter, the analyses of the constructs relevant to
the study, that is, job satisfaction and work stress, are presented with the aid of
inferential statistical procedures. The outcomes of the statistical analyses conducted to
assess each of the correlation presented.
The descriptive statistics calculated for the sample are provided in the sections that
follow. For the purposes of testing the stated research objective 1. That is, the data
pertaining to the variables included in the study, as collected by the three measuring
instruments employed, are summarised by means of graphic representation and the
calculation of descriptive measures. In this manner, the properties of the observed
data clearly emerge and an overall picture thereof is obtained. The measures of central
tendency and dispersion for the dimensions of job satisfaction and work stress.
Those who score from 1 to 10 will consider has low job satisfaction and who score 11
to 20 will consider medium job satisfaction. Finally, those who score 21 till 30 will
consider high job satisfaction. Table 1 shows the level of job satisfaction based on the
work environment and attitude toward change factor.
Table 1: Level of job satisfaction
Range 1 ≤ Low ≤ 10 11 ≤ Medium ≤ 20 21 ≤ High ≤ 30
Work Environment 0 26 14
Attitude Toward Change 0 16 24
Job Satisfaction 0 42 38
In the terms of Table 1, the work environment factor shows the 26-people recorded
medium satisfaction and the 14 people have high satisfaction with their job. On other
hand, by the attitude toward change factor shows that the 16-people recorded medium
work satisfaction and 24 recorded job satisfactions. The overall score from the job
satisfaction factor the 42-employee recorded has medium job satisfaction while 38
recorded has high job satisfaction.
Table 2 shows the level of work stress based on the workload, interpersonal relation
and role conflict.
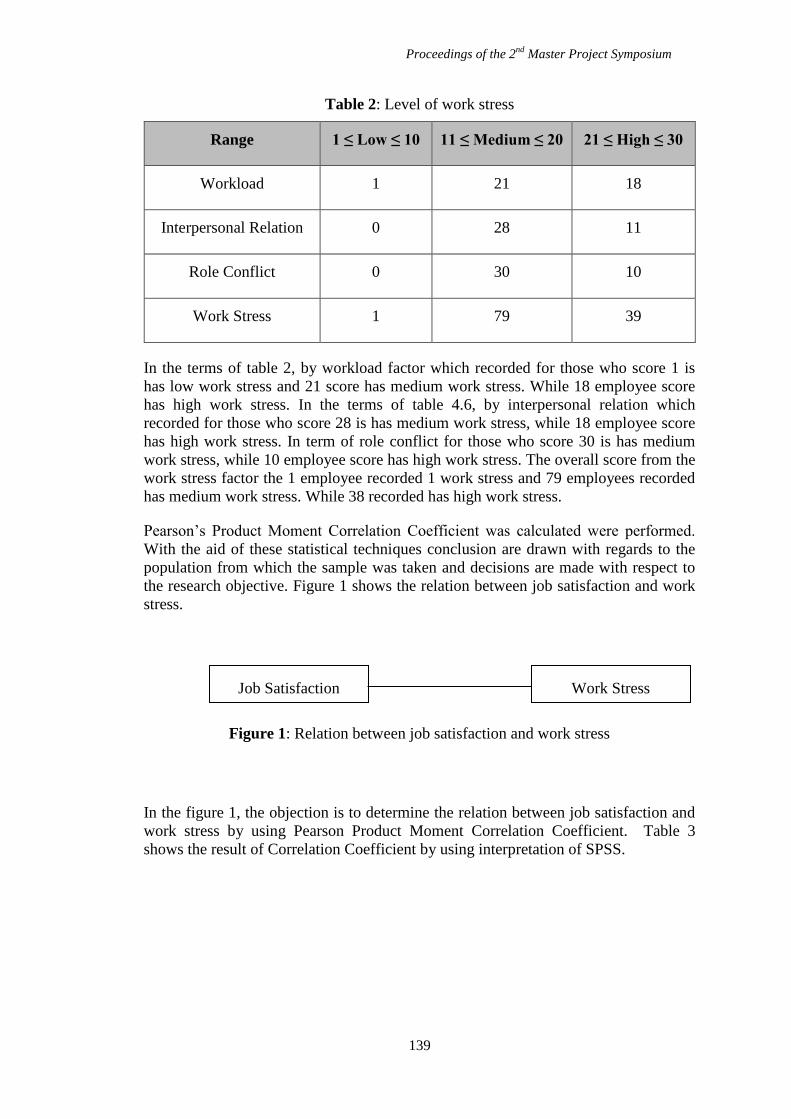
Proceedings of the 2nd
Master Project Symposium
139
Table 2: Level of work stress
Range 1 ≤ Low ≤ 10 11 ≤ Medium ≤ 20 21 ≤ High ≤ 30
Workload 1 21 18
Interpersonal Relation 0 28 11
Role Conflict 0 30 10
Work Stress 1 79 39
In the terms of table 2, by workload factor which recorded for those who score 1 is
has low work stress and 21 score has medium work stress. While 18 employee score
has high work stress. In the terms of table 4.6, by interpersonal relation which
recorded for those who score 28 is has medium work stress, while 18 employee score
has high work stress. In term of role conflict for those who score 30 is has medium
work stress, while 10 employee score has high work stress. The overall score from the
work stress factor the 1 employee recorded 1 work stress and 79 employees recorded
has medium work stress. While 38 recorded has high work stress.
Pearson’s Product Moment Correlation Coefficient was calculated were performed.
With the aid of these statistical techniques conclusion are drawn with regards to the
population from which the sample was taken and decisions are made with respect to
the research objective. Figure 1 shows the relation between job satisfaction and work
stress.
Figure 1: Relation between job satisfaction and work stress
In the figure 1, the objection is to determine the relation between job satisfaction and
work stress by using Pearson Product Moment Correlation Coefficient. Table 3
shows the result of Correlation Coefficient by using interpretation of SPSS.
Work Stress Job Satisfaction
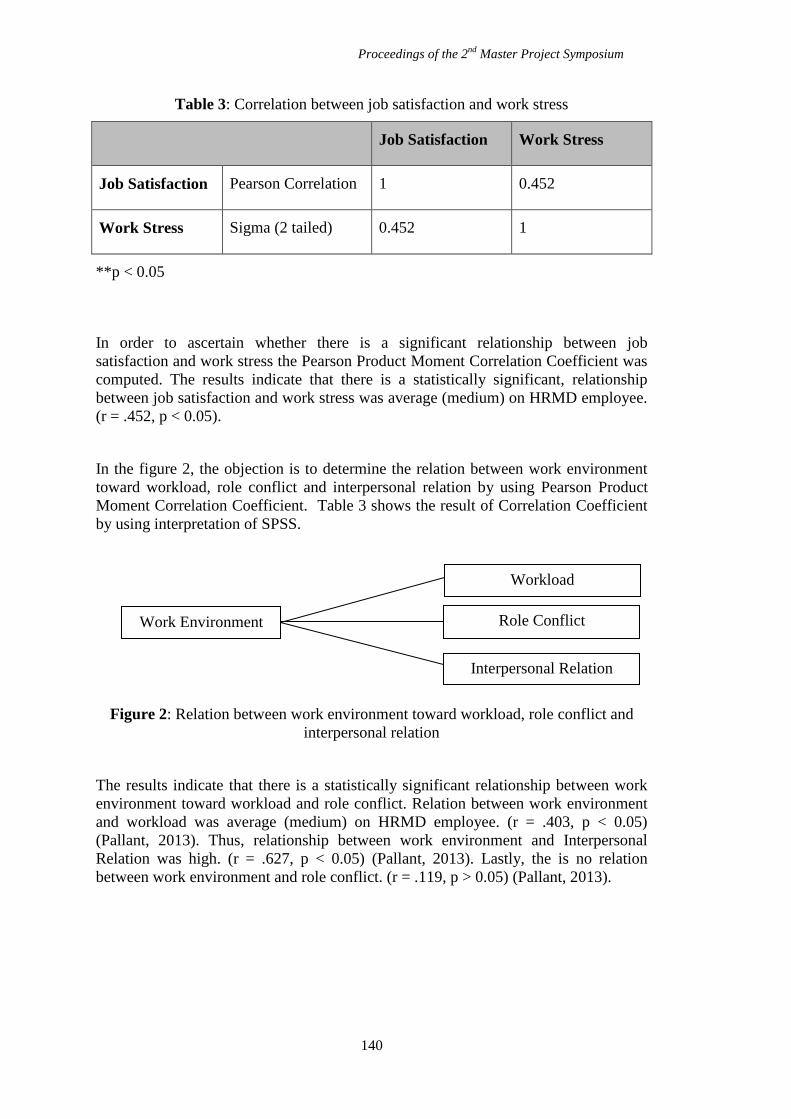
Proceedings of the 2nd
Master Project Symposium
140
Table 3: Correlation between job satisfaction and work stress
Job Satisfaction Work Stress
Job Satisfaction Pearson Correlation 1 0.452
Work Stress Sigma (2 tailed) 0.452 1
**p < 0.05
In order to ascertain whether there is a significant relationship between job
satisfaction and work stress the Pearson Product Moment Correlation Coefficient was
computed. The results indicate that there is a statistically significant, relationship
between job satisfaction and work stress was average (medium) on HRMD employee.
(r = .452, p < 0.05).
In the figure 2, the objection is to determine the relation between work environment
toward workload, role conflict and interpersonal relation by using Pearson Product
Moment Correlation Coefficient. Table 3 shows the result of Correlation Coefficient
by using interpretation of SPSS.
Figure 2: Relation between work environment toward workload, role conflict and
interpersonal relation
The results indicate that there is a statistically significant relationship between work
environment toward workload and role conflict. Relation between work environment
and workload was average (medium) on HRMD employee. (r = .403, p < 0.05)
(Pallant, 2013). Thus, relationship between work environment and Interpersonal
Relation was high. (r = .627, p < 0.05) (Pallant, 2013). Lastly, the is no relation
between work environment and role conflict. (r = .119, p > 0.05) (Pallant, 2013).
Work Environment
Workload
Interpersonal Relation
Role Conflict
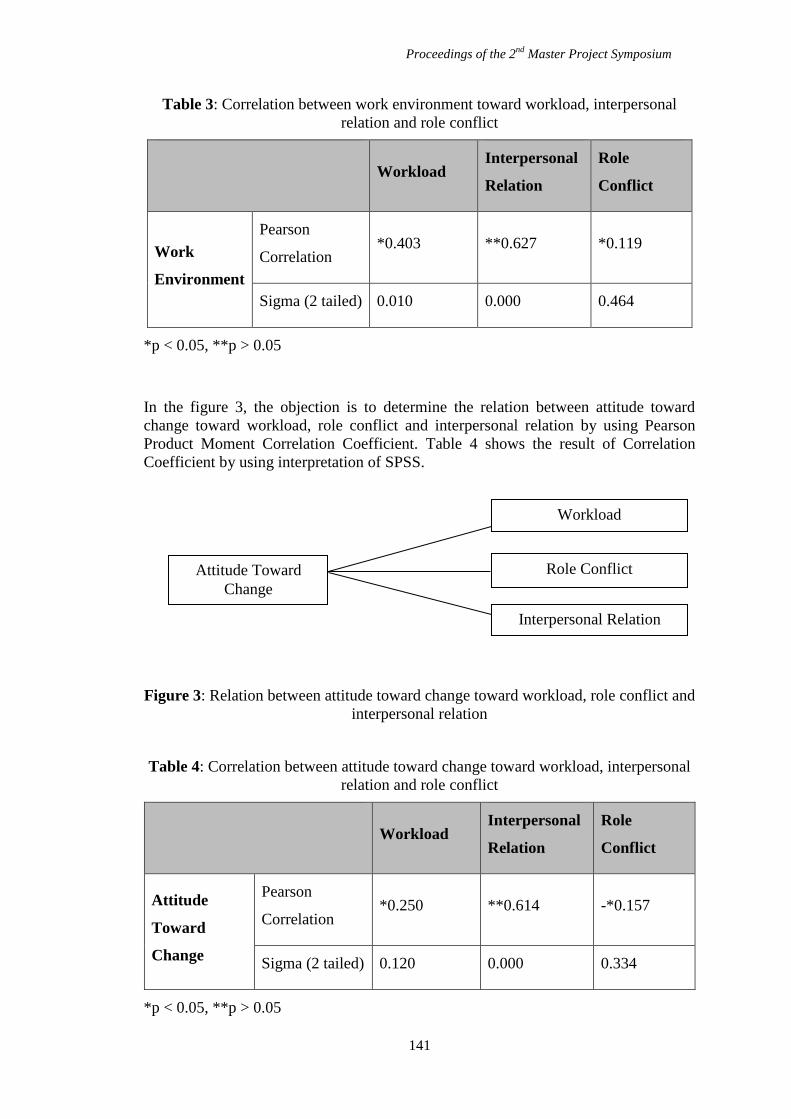
Proceedings of the 2nd
Master Project Symposium
141
Table 3: Correlation between work environment toward workload, interpersonal
relation and role conflict
Workload
Interpersonal
Relation
Role
Conflict
Work
Environment
Pearson
Correlation *0.403 **0.627 *0.119
Sigma (2 tailed) 0.010 0.000 0.464
*p < 0.05, **p > 0.05
In the figure 3, the objection is to determine the relation between attitude toward
change toward workload, role conflict and interpersonal relation by using Pearson
Product Moment Correlation Coefficient. Table 4 shows the result of Correlation
Coefficient by using interpretation of SPSS.
Figure 3: Relation between attitude toward change toward workload, role conflict and
interpersonal relation
Table 4: Correlation between attitude toward change toward workload, interpersonal
relation and role conflict
Workload
Interpersonal
Relation
Role
Conflict
Attitude
Toward
Change
Pearson
Correlation *0.250 **0.614 -*0.157
Sigma (2 tailed) 0.120 0.000 0.334
*p < 0.05, **p > 0.05
Attitude Toward
Change
Interpersonal Relation
Role Conflict
Workload
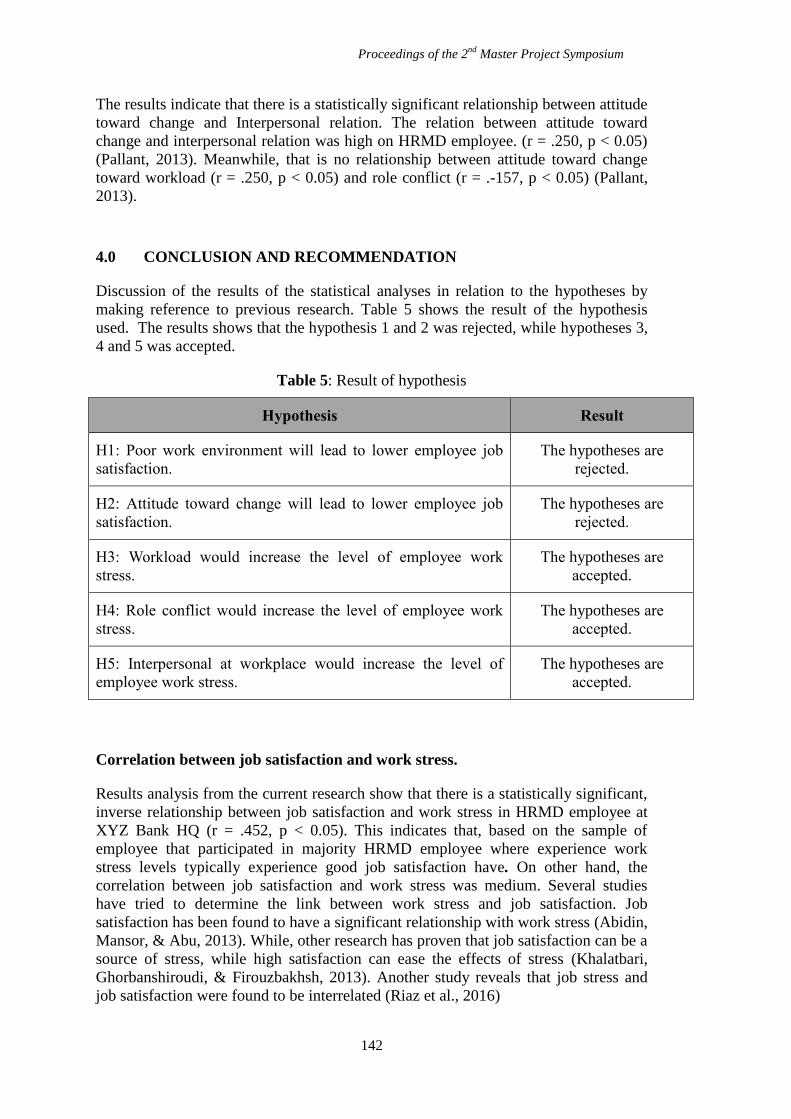
Proceedings of the 2nd
Master Project Symposium
142
The results indicate that there is a statistically significant relationship between attitude
toward change and Interpersonal relation. The relation between attitude toward
change and interpersonal relation was high on HRMD employee. (r = .250, p < 0.05)
(Pallant, 2013). Meanwhile, that is no relationship between attitude toward change
toward workload (r = .250, p < 0.05) and role conflict (r = .-157, p < 0.05) (Pallant,
2013).
4.0 CONCLUSION AND RECOMMENDATION
Discussion of the results of the statistical analyses in relation to the hypotheses by
making reference to previous research. Table 5 shows the result of the hypothesis
used. The results shows that the hypothesis 1 and 2 was rejected, while hypotheses 3,
4 and 5 was accepted.
Table 5: Result of hypothesis
Hypothesis Result
H1: Poor work environment will lead to lower employee job
satisfaction.
The hypotheses are
rejected.
H2: Attitude toward change will lead to lower employee job
satisfaction.
The hypotheses are
rejected.
H3: Workload would increase the level of employee work
stress.
The hypotheses are
accepted.
H4: Role conflict would increase the level of employee work
stress.
The hypotheses are
accepted.
H5: Interpersonal at workplace would increase the level of
employee work stress.
The hypotheses are
accepted.
Correlation between job satisfaction and work stress.
Results analysis from the current research show that there is a statistically significant,
inverse relationship between job satisfaction and work stress in HRMD employee at
XYZ Bank HQ (r = .452, p < 0.05). This indicates that, based on the sample of
employee that participated in majority HRMD employee where experience work
stress levels typically experience good job satisfaction have. On other hand, the
correlation between job satisfaction and work stress was medium. Several studies
have tried to determine the link between work stress and job satisfaction. Job
satisfaction has been found to have a significant relationship with work stress (Abidin,
Mansor, & Abu, 2013). While, other research has proven that job satisfaction can be a
source of stress, while high satisfaction can ease the effects of stress (Khalatbari,
Ghorbanshiroudi, & Firouzbakhsh, 2013). Another study reveals that job stress and
job satisfaction were found to be interrelated (Riaz et al., 2016)
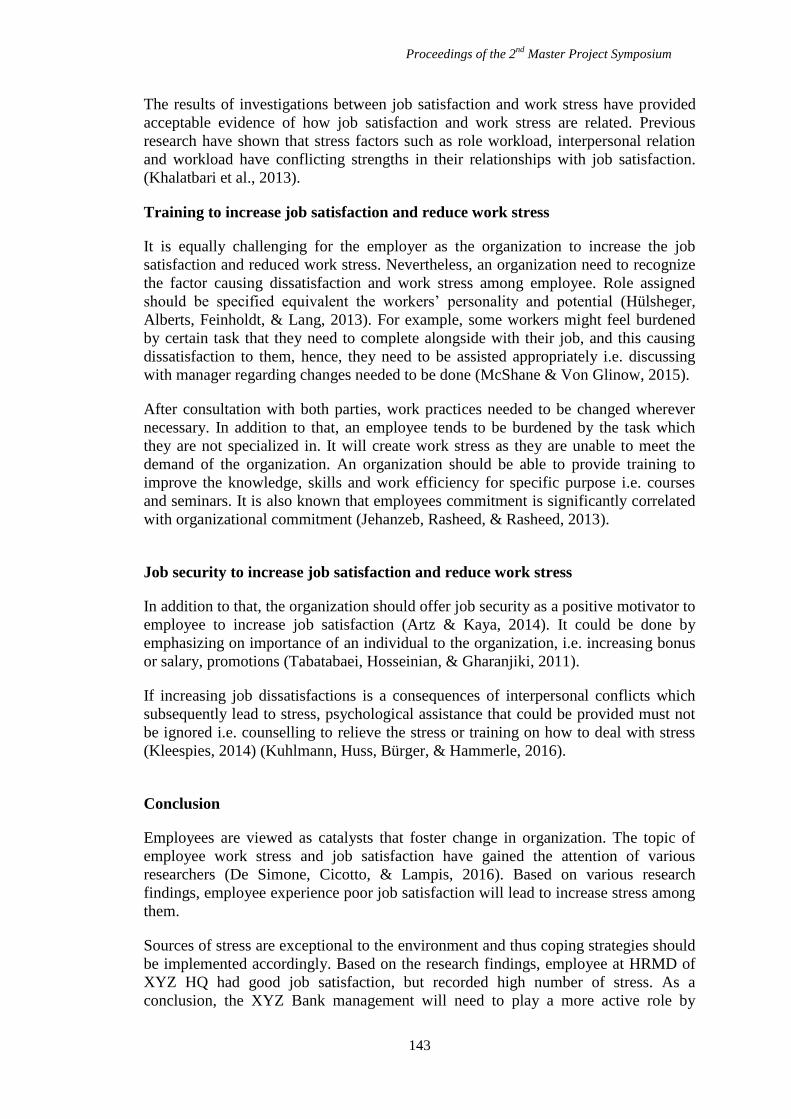
Proceedings of the 2nd
Master Project Symposium
143
The results of investigations between job satisfaction and work stress have provided
acceptable evidence of how job satisfaction and work stress are related. Previous
research have shown that stress factors such as role workload, interpersonal relation
and workload have conflicting strengths in their relationships with job satisfaction.
(Khalatbari et al., 2013).
Training to increase job satisfaction and reduce work stress
It is equally challenging for the employer as the organization to increase the job
satisfaction and reduced work stress. Nevertheless, an organization need to recognize
the factor causing dissatisfaction and work stress among employee. Role assigned
should be specified equivalent the workers’ personality and potential (Hülsheger,
Alberts, Feinholdt, & Lang, 2013). For example, some workers might feel burdened
by certain task that they need to complete alongside with their job, and this causing
dissatisfaction to them, hence, they need to be assisted appropriately i.e. discussing
with manager regarding changes needed to be done (McShane & Von Glinow, 2015).
After consultation with both parties, work practices needed to be changed wherever
necessary. In addition to that, an employee tends to be burdened by the task which
they are not specialized in. It will create work stress as they are unable to meet the
demand of the organization. An organization should be able to provide training to
improve the knowledge, skills and work efficiency for specific purpose i.e. courses
and seminars. It is also known that employees commitment is significantly correlated
with organizational commitment (Jehanzeb, Rasheed, & Rasheed, 2013).
Job security to increase job satisfaction and reduce work stress
In addition to that, the organization should offer job security as a positive motivator to
employee to increase job satisfaction (Artz & Kaya, 2014). It could be done by
emphasizing on importance of an individual to the organization, i.e. increasing bonus
or salary, promotions (Tabatabaei, Hosseinian, & Gharanjiki, 2011).
If increasing job dissatisfactions is a consequences of interpersonal conflicts which
subsequently lead to stress, psychological assistance that could be provided must not
be ignored i.e. counselling to relieve the stress or training on how to deal with stress
(Kleespies, 2014) (Kuhlmann, Huss, Bürger, & Hammerle, 2016).
Conclusion
Employees are viewed as catalysts that foster change in organization. The topic of
employee work stress and job satisfaction have gained the attention of various
researchers (De Simone, Cicotto, & Lampis, 2016). Based on various research
findings, employee experience poor job satisfaction will lead to increase stress among
them.
Sources of stress are exceptional to the environment and thus coping strategies should
be implemented accordingly. Based on the research findings, employee at HRMD of
XYZ HQ had good job satisfaction, but recorded high number of stress. As a
conclusion, the XYZ Bank management will need to play a more active role by
Proceedings of the 2nd
Master Project Symposium
144
reducing stress and improves the bank atmosphere as both are attribution of stress.
Nevertheless, intervention should be implemented as an organizational initiative
rather than individual effort, that the stress management is not burdensome. More
research regarding the job satisfaction and work stress in banking sector should be
done in the future as a purpose of comparison i.e. between local and foreign bank.
In the conclusion, employee at HRMD of XYZ Bank have recorded good job
satisfaction but high level of work stress. On other hand, there are average correlation
between job satisfaction and work stress. Finally, in order to increase job satisfaction
and work stress the suitable training was proposed and recommend the Bank
management to increase job security to their employee.
REFERENCES
Abidin, N. I. Z., Mansor, M. F., & Abu, N. H. (2013). Factors Influencing Work
Stress among Expatriate Managers: A Study of Government-Linked
Companies in Malaysia. Australian Journal of Basic and Applied Sciences,
7(8), 979-990.
Artz, B., & Kaya, I. (2014). The impact of job security on job satisfaction in
economic contractions versus expansions. Applied Economics, 46(24), 2873-
2890.
De Simone, S., Cicotto, G., & Lampis, J. (2016). Occupational stress, job satisfaction
and physical health in teachers. Revue Européenne de Psychologie
Appliquée/European Review of Applied Psychology, 66(2), 65-77. doi:
http://dx.doi.org/10.1016/j.erap.2016.03.002
Hanna, B., Kee, K. F., & Robertson, B. W. (2017). Positive impacts of social media at
work: Job satisfaction, job calling, and Facebook use among co-workers.
Paper presented at the SHS Web of Conferences.
Hülsheger, U. R., Alberts, H. J., Feinholdt, A., & Lang, J. W. (2013). Benefits of
mindfulness at work: the role of mindfulness in emotion regulation, emotional
exhaustion, and job satisfaction. Journal of Applied Psychology, 98(2), 310.
Jedin, M. H., & Abidin, N. I. Z. (2013). Work Stress Among Expatriate Managers In
Malaysia's Goverment-Linked Companies.
Jehanzeb, K., Rasheed, A., & Rasheed, M. F. (2013). Organizational commitment and
turnover intentions: Impact of employee's training in private sector of saudi
arabia. International Journal of Business and Management, 8(8), 79.
Khalatbari, J., Ghorbanshiroudi, S., & Firouzbakhsh, M. (2013). Correlation of Job
Stress, Job Satisfaction, Job Motivation and Burnout and Feeling Stress.
Procedia - Social and Behavioral Sciences, 84, 860-863. doi:
http://dx.doi.org/10.1016/j.sbspro.2013.06.662
Kleespies, P. M. (2014). Training to reduce stress in dealing with behavioral
emergencies: American Psychological Association.
Proceedings of the 2nd
Master Project Symposium
145
Kuhlmann, S., Huss, M., Bürger, A., & Hammerle, F. (2016). Coping with stress in
medical students: results of a randomized controlled trial using a mindfulness-
based stress prevention training (MediMind) in Germany. BMC Medical
Education, 16(1), 316.
Ling, A. W., Bahron, A., & Boroh, P. (2014). A study on role stress and job
satisfaction among bank employees in Kota Kinabalu, Sabah. International
Journal of Research in Management & Business Studies, 1(2), 19-23.
McShane, S. L., & Von Glinow, M. A. (2015). Organizational Behavior 7/e.
Pallant, J. (2013). SPSS survival manual: McGraw-Hill Education (UK).
Riaz, M., Ahmad, N., Riaz, M., Murtaza, G., Khan, T., & Firdous, H. (2016). Impact
of Job Stress on Employee Job Satisfaction. International Review of
Management and Business Research, 5(4), 1370.
Tabatabaei, S., Hosseinian, S., & Gharanjiki, B. (2011). General Health, Stress
Associated to the Work and Job Satisfaction of Hormozgan Cement Factory
Employees in Iran. Procedia - Social and Behavioral Sciences, 30, 1897-1901.
doi: http://dx.doi.org/10.1016/j.sbspro.2011.10.369
Yadav, R. K., & Dabhade, N. (2014). Work Life Balance and Job Satisfaction among
the Working Women of Banking and Education Sector–A Comparative Study.
International Letters of Social and Humanistic Sciences(21), 181-201.
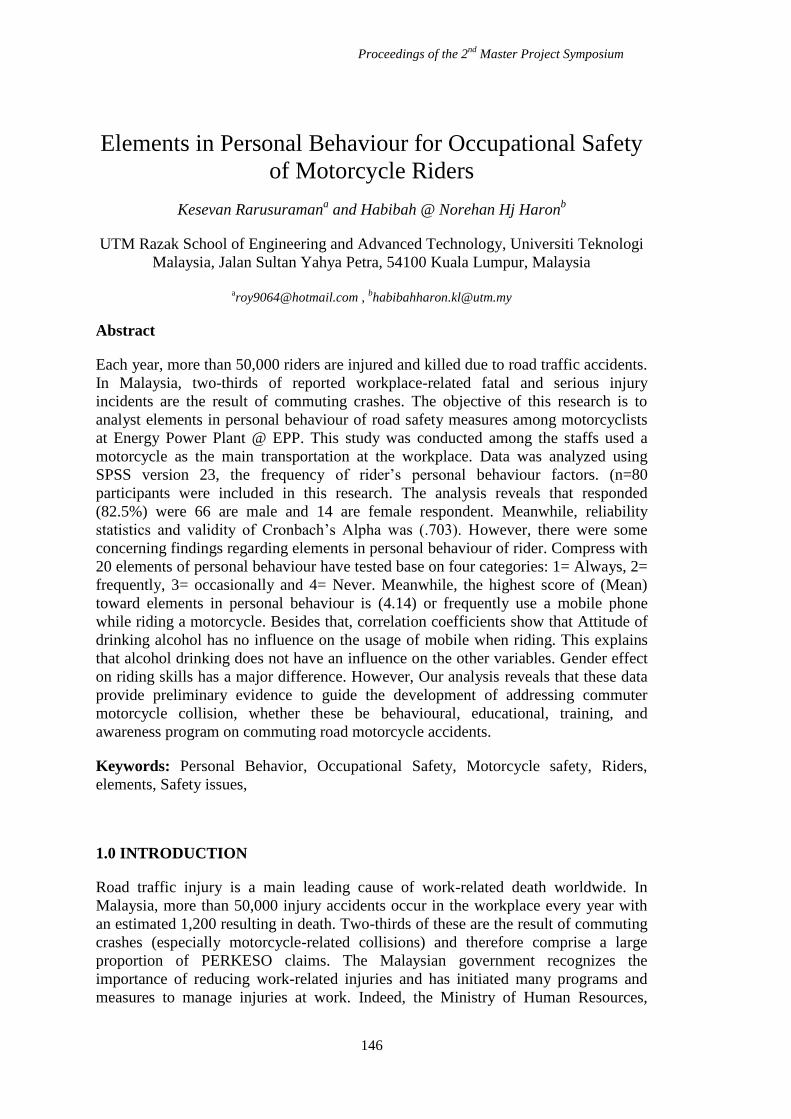
Proceedings of the 2nd
Master Project Symposium
146
Elements in Personal Behaviour for Occupational Safety
of Motorcycle Riders
Kesevan Rarusuramana and Habibah @ Norehan Hj Haron
b
UTM Razak School of Engineering and Advanced Technology, Universiti Teknologi
Malaysia, Jalan Sultan Yahya Petra, 54100 Kuala Lumpur, Malaysia
Abstract
Each year, more than 50,000 riders are injured and killed due to road traffic accidents.
In Malaysia, two-thirds of reported workplace-related fatal and serious injury
incidents are the result of commuting crashes. The objective of this research is to
analyst elements in personal behaviour of road safety measures among motorcyclists
at Energy Power Plant @ EPP. This study was conducted among the staffs used a
motorcycle as the main transportation at the workplace. Data was analyzed using
SPSS version 23, the frequency of rider’s personal behaviour factors. (n=80
participants were included in this research. The analysis reveals that responded
(82.5%) were 66 are male and 14 are female respondent. Meanwhile, reliability
statistics and validity of Cronbach’s Alpha was (.703). However, there were some
concerning findings regarding elements in personal behaviour of rider. Compress with
20 elements of personal behaviour have tested base on four categories: 1= Always, 2=
frequently, 3= occasionally and 4= Never. Meanwhile, the highest score of (Mean)
toward elements in personal behaviour is (4.14) or frequently use a mobile phone
while riding a motorcycle. Besides that, correlation coefficients show that Attitude of
drinking alcohol has no influence on the usage of mobile when riding. This explains
that alcohol drinking does not have an influence on the other variables. Gender effect
on riding skills has a major difference. However, Our analysis reveals that these data
provide preliminary evidence to guide the development of addressing commuter
motorcycle collision, whether these be behavioural, educational, training, and
awareness program on commuting road motorcycle accidents.
Keywords: Personal Behavior, Occupational Safety, Motorcycle safety, Riders,
elements, Safety issues,
1.0 INTRODUCTION
Road traffic injury is a main leading cause of work-related death worldwide. In
Malaysia, more than 50,000 injury accidents occur in the workplace every year with
an estimated 1,200 resulting in death. Two-thirds of these are the result of commuting
crashes (especially motorcycle-related collisions) and therefore comprise a large
proportion of PERKESO claims. The Malaysian government recognizes the
importance of reducing work-related injuries and has initiated many programs and
measures to manage injuries at work. Indeed, the Ministry of Human Resources,
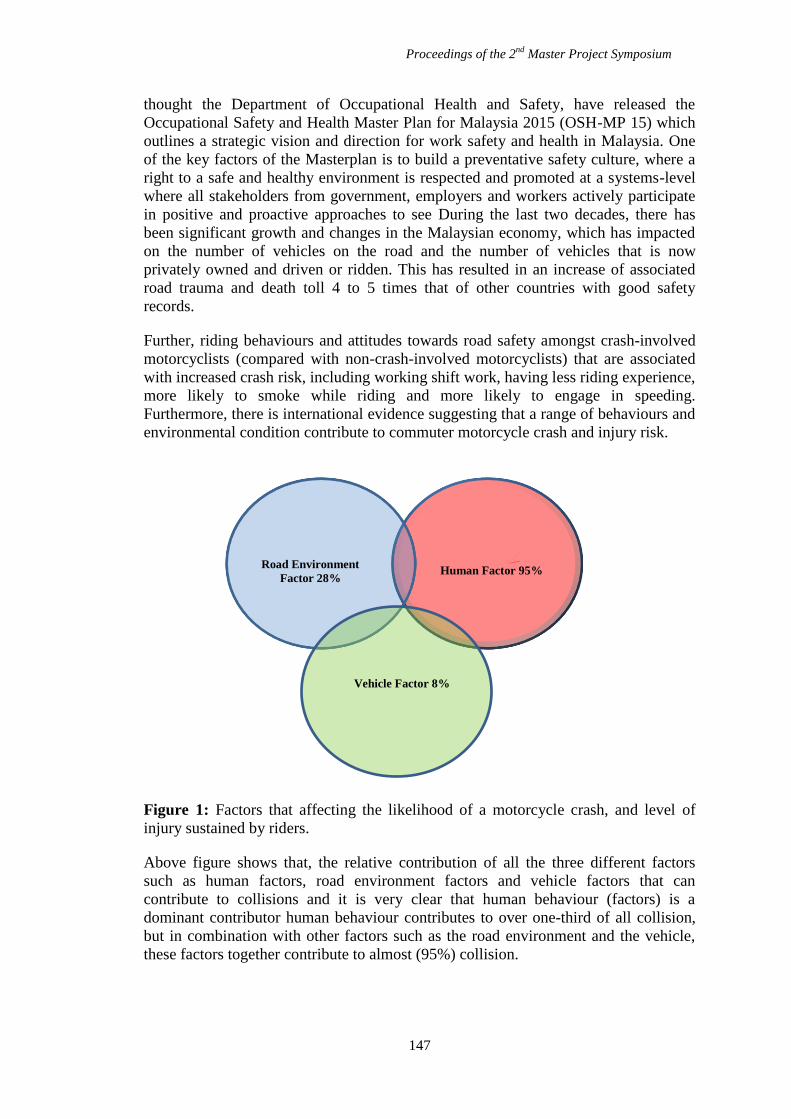
Proceedings of the 2nd
Master Project Symposium
147
thought the Department of Occupational Health and Safety, have released the
Occupational Safety and Health Master Plan for Malaysia 2015 (OSH-MP 15) which
outlines a strategic vision and direction for work safety and health in Malaysia. One
of the key factors of the Masterplan is to build a preventative safety culture, where a
right to a safe and healthy environment is respected and promoted at a systems-level
where all stakeholders from government, employers and workers actively participate
in positive and proactive approaches to see During the last two decades, there has
been significant growth and changes in the Malaysian economy, which has impacted
on the number of vehicles on the road and the number of vehicles that is now
privately owned and driven or ridden. This has resulted in an increase of associated
road trauma and death toll 4 to 5 times that of other countries with good safety
records.
Further, riding behaviours and attitudes towards road safety amongst crash-involved
motorcyclists (compared with non-crash-involved motorcyclists) that are associated
with increased crash risk, including working shift work, having less riding experience,
more likely to smoke while riding and more likely to engage in speeding.
Furthermore, there is international evidence suggesting that a range of behaviours and
environmental condition contribute to commuter motorcycle crash and injury risk.
Figure 1: Factors that affecting the likelihood of a motorcycle crash, and level of
injury sustained by riders.
Above figure shows that, the relative contribution of all the three different factors
such as human factors, road environment factors and vehicle factors that can
contribute to collisions and it is very clear that human behaviour (factors) is a
dominant contributor human behaviour contributes to over one-third of all collision,
but in combination with other factors such as the road environment and the vehicle,
these factors together contribute to almost (95%) collision.
Human Factor 95% Road Environment
Factor 28%
Vehicle Factor 8%
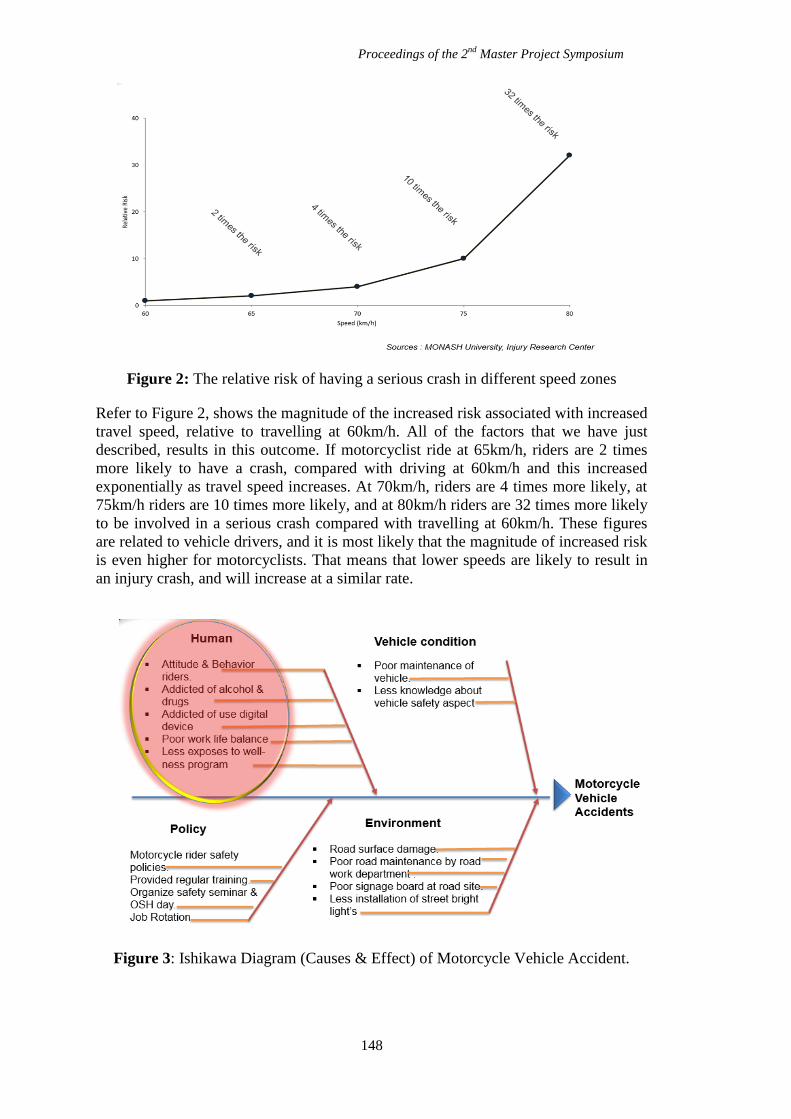
Proceedings of the 2nd
Master Project Symposium
148
Figure 2: The relative risk of having a serious crash in different speed zones
Refer to Figure 2, shows the magnitude of the increased risk associated with increased
travel speed, relative to travelling at 60km/h. All of the factors that we have just
described, results in this outcome. If motorcyclist ride at 65km/h, riders are 2 times
more likely to have a crash, compared with driving at 60km/h and this increased
exponentially as travel speed increases. At 70km/h, riders are 4 times more likely, at
75km/h riders are 10 times more likely, and at 80km/h riders are 32 times more likely
to be involved in a serious crash compared with travelling at 60km/h. These figures
are related to vehicle drivers, and it is most likely that the magnitude of increased risk
is even higher for motorcyclists. That means that lower speeds are likely to result in
an injury crash, and will increase at a similar rate.
Figure 3: Ishikawa Diagram (Causes & Effect) of Motorcycle Vehicle Accident.
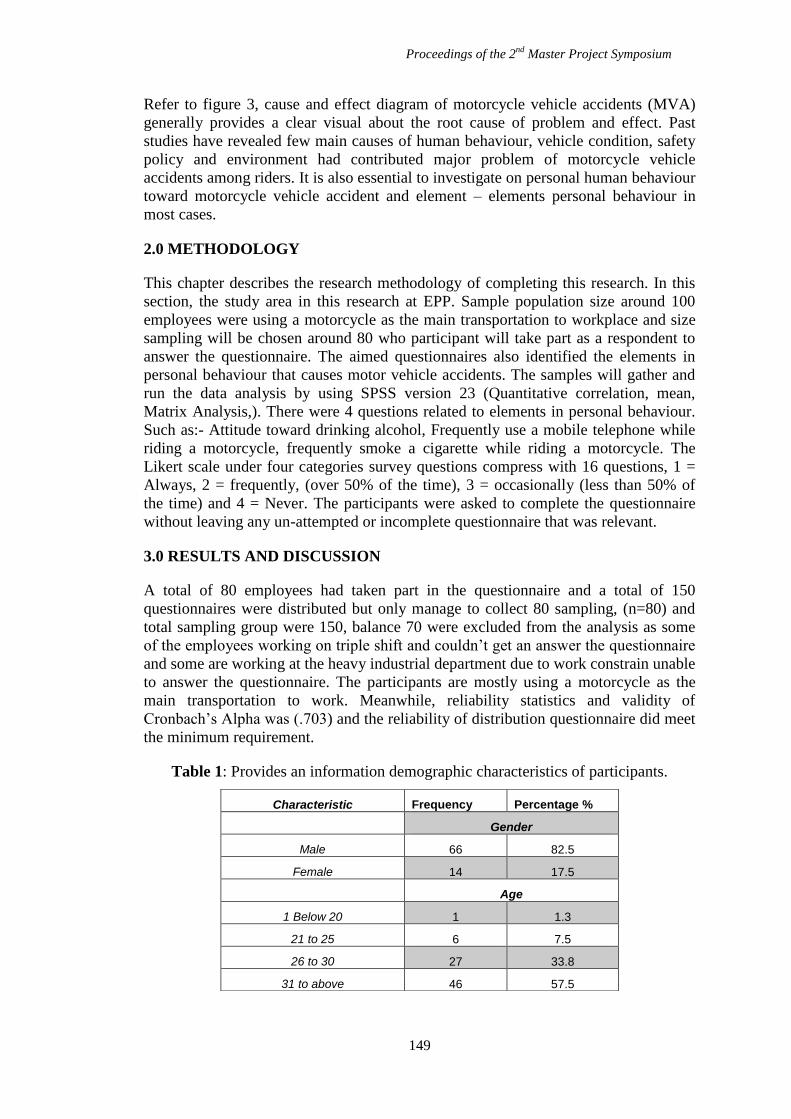
Proceedings of the 2nd
Master Project Symposium
149
Refer to figure 3, cause and effect diagram of motorcycle vehicle accidents (MVA)
generally provides a clear visual about the root cause of problem and effect. Past
studies have revealed few main causes of human behaviour, vehicle condition, safety
policy and environment had contributed major problem of motorcycle vehicle
accidents among riders. It is also essential to investigate on personal human behaviour
toward motorcycle vehicle accident and element – elements personal behaviour in
most cases.
2.0 METHODOLOGY
This chapter describes the research methodology of completing this research. In this
section, the study area in this research at EPP. Sample population size around 100
employees were using a motorcycle as the main transportation to workplace and size
sampling will be chosen around 80 who participant will take part as a respondent to
answer the questionnaire. The aimed questionnaires also identified the elements in
personal behaviour that causes motor vehicle accidents. The samples will gather and
run the data analysis by using SPSS version 23 (Quantitative correlation, mean,
Matrix Analysis,). There were 4 questions related to elements in personal behaviour.
Such as:- Attitude toward drinking alcohol, Frequently use a mobile telephone while
riding a motorcycle, frequently smoke a cigarette while riding a motorcycle. The
Likert scale under four categories survey questions compress with 16 questions, 1 =
Always, 2 = frequently, (over 50% of the time), 3 = occasionally (less than 50% of
the time) and 4 = Never. The participants were asked to complete the questionnaire
without leaving any un-attempted or incomplete questionnaire that was relevant.
3.0 RESULTS AND DISCUSSION
A total of 80 employees had taken part in the questionnaire and a total of 150
questionnaires were distributed but only manage to collect 80 sampling, (n=80) and
total sampling group were 150, balance 70 were excluded from the analysis as some
of the employees working on triple shift and couldn’t get an answer the questionnaire
and some are working at the heavy industrial department due to work constrain unable
to answer the questionnaire. The participants are mostly using a motorcycle as the
main transportation to work. Meanwhile, reliability statistics and validity of
Cronbach’s Alpha was (.703) and the reliability of distribution questionnaire did meet
the minimum requirement.
Table 1: Provides an information demographic characteristics of participants.
Characteristic Frequency Percentage %
Gender
Male 66 82.5
Female 14 17.5
Age
1 Below 20 1 1.3
21 to 25 6 7.5
26 to 30 27 33.8
31 to above 46 57.5
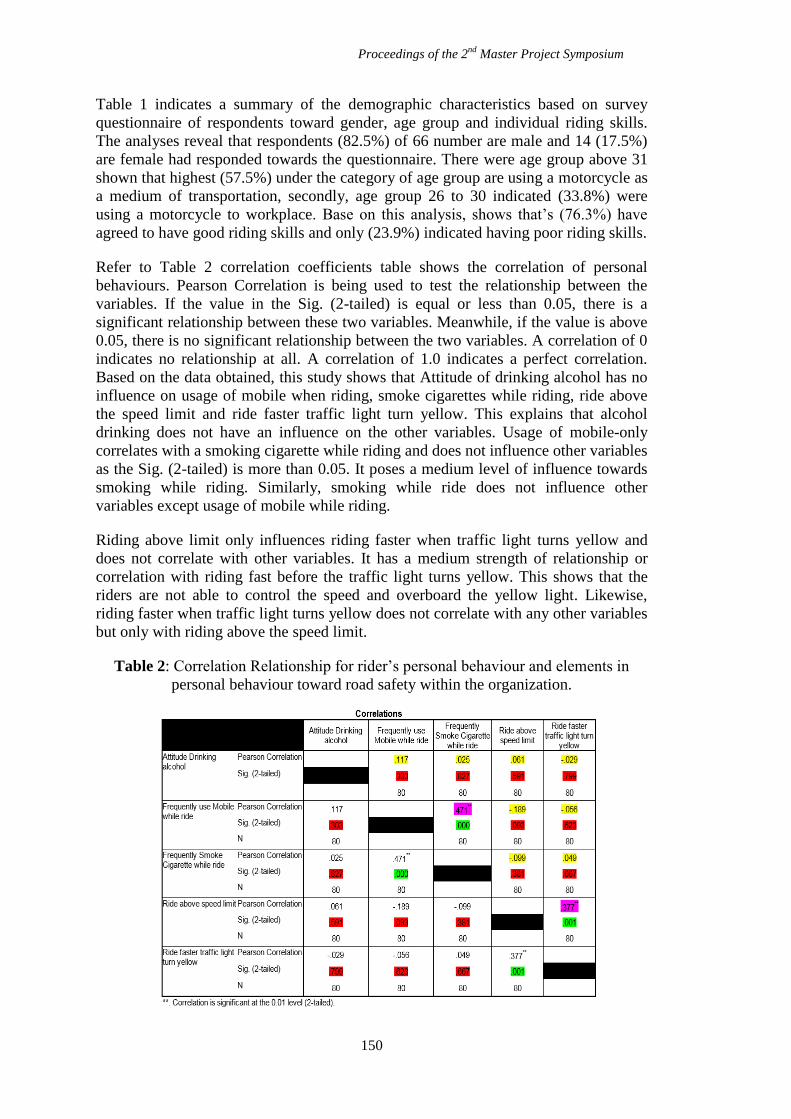
Proceedings of the 2nd
Master Project Symposium
150
Table 1 indicates a summary of the demographic characteristics based on survey
questionnaire of respondents toward gender, age group and individual riding skills.
The analyses reveal that respondents (82.5%) of 66 number are male and 14 (17.5%)
are female had responded towards the questionnaire. There were age group above 31
shown that highest (57.5%) under the category of age group are using a motorcycle as
a medium of transportation, secondly, age group 26 to 30 indicated (33.8%) were
using a motorcycle to workplace. Base on this analysis, shows that’s (76.3%) have
agreed to have good riding skills and only (23.9%) indicated having poor riding skills.
Refer to Table 2 correlation coefficients table shows the correlation of personal
behaviours. Pearson Correlation is being used to test the relationship between the
variables. If the value in the Sig. (2-tailed) is equal or less than 0.05, there is a
significant relationship between these two variables. Meanwhile, if the value is above
0.05, there is no significant relationship between the two variables. A correlation of 0
indicates no relationship at all. A correlation of 1.0 indicates a perfect correlation.
Based on the data obtained, this study shows that Attitude of drinking alcohol has no
influence on usage of mobile when riding, smoke cigarettes while riding, ride above
the speed limit and ride faster traffic light turn yellow. This explains that alcohol
drinking does not have an influence on the other variables. Usage of mobile-only
correlates with a smoking cigarette while riding and does not influence other variables
as the Sig. (2-tailed) is more than 0.05. It poses a medium level of influence towards
smoking while riding. Similarly, smoking while ride does not influence other
variables except usage of mobile while riding.
Riding above limit only influences riding faster when traffic light turns yellow and
does not correlate with other variables. It has a medium strength of relationship or
correlation with riding fast before the traffic light turns yellow. This shows that the
riders are not able to control the speed and overboard the yellow light. Likewise,
riding faster when traffic light turns yellow does not correlate with any other variables
but only with riding above the speed limit.
Table 2: Correlation Relationship for rider’s personal behaviour and elements in
personal behaviour toward road safety within the organization.
Proceedings of the 2nd
Master Project Symposium
151
4.0 CONCLUSION
This chapter provides results and overall looking deeper into their personal behaviour
among riders that have a good understanding in terms of road safety knowledge.
Furthermore, riding skills is another important element for riders to engage on riding
a motorcycle on the road and commute with other type of vehicles on the road. On
the other hand, most of the respondent agreed that two-wheel transportation always
have high chances to expose on commuting road accident. In terms, road accident the
ratio is only 70 percent can be control by motorcycle riders on commuting road
accidents and balance 30 percent depends on other road users. If we compare with the
ratio 30 or 70 in either situation personal behaviour of rider can cause motorcycle
fatalities and permanent damages amongst other stakeholders’. Has been the major
contribution to engage motorcycle crashes among riders on several factors such as
speeding, personal riders’ behaviour, environmental and consuming alcohol or drugs
while riding. Concerning on riders knowledge about road safety especially wearing a
helmet and wear tightly while riding a motorcycle is two different activities will
determine the level of critical head injuries. Head injuries caused in commuting road
motorcycle accident can be prevented by wearing the helmet with tightly and this
behaviour will minimize the fatalities risk with the additional head is very important
organs in human life. Our analysis reveals that, these data provide preliminary
evidence to guide the development of any initiative addressing commuter motorcycle
collisions, whether these be behavioural, educational, training, and awareness
program on commuting road motorcycle accidents.
REFERENCES
Ane Williamson, D. A. L., Simon Folkard, Jane Stutts, Theodore K, Courtney, Jennie
L.Connor. (2011). Thr link between fatigue and safety. ELSEVIER, 43.
Carvalho, h. B. d. (2016). Alcohol and drug involvement in motorcycle driver injuries
in the city of Sao Paulo, Brazil: Analysis of crash culpability and other
associated factors ELSEVIER.
Hany M.Hassan, M. S., Mohammad Kishta, Atef M.Garib, Hussain A.Al-Harthei.
(2016). Investigation of drivers' behaviour towards speeds using crash data
and self-reported questionnaire. ELSEVIER, 98, 348-358.
Heraclito Barbosa de Carvalho, G. A., Marcelo Rosa Rezende, Celso Bernin, Jorge
santos Silva, Vilma Leyton, Julia Maria D'Andrea Greve. (2015). Alcohol and
drug involvement in motorcycle driver injuries in the city of Sao Paulo, Brazil
Analysis of crash culpability and other associated factors. ELSEVIER, 162.
Jennifer Oxley, J. Y., Mano Deepa Ravi, Effie Hoareau, Mohammed Azman Aziz
Mohammed, Harun Bakar, Saraswathy Venkataraman, Prame Kumar Nair.
(22 Sep 2015). Commuter motorcycle crashes in Malaysia An understanding
of contributing factors. Annals of Advances in Automotive Medicine.
L. de Rome, R. I., M. Fitzharris, N.Haworth, S.Heritier, D.Richardson. (2012).
Effectiveness of motorcycle protective clothing, Riders health outcomes in the
six month following a crash. ELSEVIER, 43, 2035 - 2045.
Proceedings of the 2nd
Master Project Symposium
152
Muhammad Marizwan Abdul Manan, A. V. (2012). Motorcycle Fatalities in
Malaysia. ELSEVIER, 36.
Nur Hidayah Ab Aziz, A. A. Y. (2015). The Employer's Duties and Liabilities in
Commuting Accidents in Malaysia: Law and Management. ELSEVIER, 211,
1-7.
Nur Sabahiah Abdul Sukor, A. K. M. t., Satoshi Fujii. (2016). Analysis of correlation
between psychological factors and self-reported behaviour of motorcyclists in
Malaysia, depending on self-reported usage of different types of motorcycle
facility ELSEVIER.
Stijn Dhondt, C. M., Nathalie Terryn, Fredriek Van Malderan, Koen Putman. (2013).
Health burden of road traffic accidents, an analysis of clinical data on
disability and mortality exposure rates in Flanders and Brussels. ELSEVIER,
50, 659-666.
Teferi Abegaz, Y. B., Alemayehu Worku, Abebe Assrat, Abebayehu Assefa. (2014).
Effects of excessive speeding and falling asleep while driving on crash injury
severity in Ethiopia A generalized ordered logit model analysis ELSEVIER,
71, 15-21.
Younshik Chung, T.-J. S., Byoung-Jo Yoon. (2013). Injury severity in delivery -
motorcycle to vehicle crashes in the Seoul metropolitan area. ELSEVIER.

Proceedings of the 2nd
Master Project Symposium
153
Risk Assessment of Centralized Chlorine Gas
System at Rubber Glove Manufacturing Plant
Mohamed Anuar Idrisa
and Shreeshivadasan Chelliapanb
UTM Razak School of Engineering and Advanced Technology, Universiti Teknologi
Malaysia, Jalan Sultan Yahya Petra, 54100 Kuala Lumpur, Malaysia [email protected],
Abstract – As a glove manufacturing plant, chemical is one of the most highly used
material. Some chemical give an impact to the human health, environmental aspect as
well as physical hazard such as highly flammable gas. In this study, the assessment of
risk and recommendation of control measures of exposure to chlorine gas was
identified. Besides the accidental release of chlorine gas incident, ill health issues
also another aspect that should be taken care off. Medical leave record for the
personnel those who involved in chlorination process are highly related to respiratory
problem. Between 2010 until 2016, 39.2% from the sick leave record was related to
chlorine-induced illness symptoms. From the study found that there were strong
relation between the exposure to chlorine and health issues. Extra cautions and
special safety control were needed for better. The study also recommended further
improvement in current control measures such as engineering control aspect besides,
skill and competency of the workers. A concept of safety by design, inherently safety
and fail-safe system was taken into consideration during this study. Data analysis was
carried out to compared the chlorine concentration before the improvement and after
improvement and found that there were significant different. After improvement taken
place, found that the chlorine concentration inside the chlorine room decreased from
1.15ppm to 0.089ppm in average. This will improve safety control of centralized
chlorine manifold system for better and safer working environment.
Keywords: Chlorine, Chemical Hazard, Chlorine Health Effect
1.0 INTRODUCTION
According to the report by MARGMA (Malaysia Rubber Glove
Manufacturers Association) during 28th
Annual General Meeting 2016, there are 104
glove factories in Malaysia which represent for 55 companies. Estimated global
demand for year 2016 is 216.2 billion pieces which 63% or 133.6 billion produced by
Malaysian manufacturer. It is a critical fact that gloves are a necessary protective
device and very importance medical tools. Even, when a child is born into this world
the first thing it touches is a pair of gloves.
In market, there are many type of gloves which design and produce according
to the user’s need, requirement and expectation. Different type of gloves may use
different type of material such as natural rubber gloves, nitrile gloves, vinyl gloves,
neoprene gloves or polyurethane gloves. Some gloves is reusable and mostly are
Proceedings of the 2nd
Master Project Symposium
154
disposable. Glove applications are also very wide in different market or industry such
as machinery, oil and gas, chemical, automotive, healthcare, electronic industry, food
processing and many more. The purpose of using glove also might be differ such as
for general purposes, chemical or liquid protection, and product protection or for
personal protective equipment. In this study, we were focused on disposable latex
gloves for electronic industry as well as for healthcare industry or known as
cleanroom powder free gloves.
Glove manufacturing process started from blending or mixing the material
such as latex, vulcanizing agent, colour pigment, anti-oxidant and crosslinking agent.
After compounded latex completed and well blended it will be transfered to latex
dipping tank at glove production line through a flexible poly vinyl chloride (PVC)
hose by gravity. During dipping and curring processes, the latex glove will form when
a hand mold is dipped inside latex solution in latex dipping tank. After thin layer of
latex film form on the hand mold, it will be conveyed to curring oven for the
vulcanizing process.
After the glove completely cure, it will be dipped inside chlorine solution bath
followed by alkaline and subsequently dipped inside water bath for rinsing. Finally,
the glove will passed through the drying oven before it will be stripped out from the
mold partially by pneumatic stripping nozzle as well as stripping operator. The whole
process of dipping is a continous process.
The next process is called off-line chlorination and it used chlorin solution
which is created by mixing of sodium hypo and acid hydrochloric with automatic
preset composition by computerization system. For general understanding, the process
is quite similar to normal laundry but the different is using chlorinator machine. After
completed off-line chlorination, the glove will further rinse by ultra-pure water before
it being dry by dryer. Final stage of cleanroom glove manufacturing process are
sorting and packing. Every single glove will be checked and inspected for any defect
before it deliver to end users.
2.0 LITERATURE REVIEW
In general, most of the activities with regards to glove manufacturing process are
highly involved of chemical. Furthermore, the working environment especially at
dipping process, are noisy, hot and a lot of manual handling and repeatative work.
However, all necessary action already taken place to manage the situation in order to
prevent it from leading to any incident or ill health problem. Local exhaust ventilation
(LEV) – wet scrubber and dust collector, air-cooled supply, work rotation system,
sound insulation booth, machine guarding, training and competency program as well
as providing the appropriate personal protective equipment to the workers are already
inplace to minimized the exposure of the workers to the hazard that existed. Among
those chemical, chlorine gas is the most toxic that we are using in our operation. In
our proces, the chlorine used for glove surface treatment. As a latex’s natural
characteristic, it has surface tacky and tense to stick to each other and very difficult to
donning. Chlorine will remove the surface tackiness and make it easy to donning as
well as will not stick to each other.
Chlorine is highly irritating when inhaled, and is common toxic industrial gas
causing tissue damage in the airways followed by an acute inflammatory response
Proceedings of the 2nd
Master Project Symposium
155
(Elisabeth et al.,2006; Sivaprakash & Karthikeyan, 2014; Sung-Woo Han et al.
2016). It can burn moist body surface such as eyes, nose, throat, lungs and wet skin.
In contact with water, chlorine produces hydrochloric and hypochlorous acids
(Boskabady, 2012; Pallavi et.al, 2013; Gaskin et.al, 2013; Wang et.al., 2012). In
characteristic, chlorine gas have sharp, pungent and penetrating odour. Molecular
weight 2.5 times heavier than air. Greenish-yellow color when concentration in the air
more than 1,000 part per million (ppm). The rate of exposure for time weighted
average, eight hour at 0.5 ppm (Undang-undang Malaysia, 2005). Whereas, United
State, National Institute for Occupational Safety and Health (NIOSH) rate at 10 ppm
for Immediate Danger to Life or Health (IDLH).
Although chlorine is potentially one of the most hazardous substances
manufactured, transported and handled, it provides more chemical industry’s turnover
and industry’s manpower works in chlorine-related activities (Sivaprakash &
Karthikeyan, 2014). The key to success in business particulally those involve with
high risk operation lies in the effective management of the risks (Purdy &
Wasilewski, 1994). Without taking risks, we cannot advance and prosper, yet, if we
are incautious, our losses can exceed our gains. On the other hand, too conservative
an approach to risk control stifles benefits and progress. However, the most successful
companies and individuals are those who discover the optimum risk to cost balance.
For optimization, we need to manage risks in the most cost-effective manner. It is
clear, that before risks can be managed, they need to be analysed and assessed (Liu,
2012; Rui, 2014).
Inhalation of chlorine causes long-standing lung inflammation and airway
hyper responsiveness. The sample of mice were used in technical experimental which
exposed to chlorine with pre-set time with specific concentration of chlorine level
(Jonasson, 2013; Boskabady, 2012; Sivaprakash & Karthikeyan, 2014). Toxic effects
when exposed to chlorine gas can be classified to as two groups; ie – early and late
effects which both are highly dependent on exposure dose (Lurati, 2015; Chen, 2011).
Exposure to chlorine effected or may cause acute neutrophilic inflammation in lung
tissue and airways, pulmonary oedema and parabrachial distribution of fibrotic
depositions.
Estimated exposure time and concentration of toxic chemicals can be
predicting for the adverse effects (Boris, 2014; White & Martin, 2010). The software
package called EAGLE, which implements the algorithm and used to estimate the
time and space varying toxic agent density. Tabulates three Acute Exposure Guideline
Levels (AEGLs) to predict the onset of these adverse effects from specific length
exposures to specific concentrations of toxic chemicals, included chlorine for a
general population.
The effect on health symptoms after exposure to chlorine leakage were
discussed. Conducted based on real case study. Health examination was performed to
the works those suspected of exposure to chlorine gas (Lurati, 2015; Sung-Woo Han
et al. 2016).
Proceedings of the 2nd
Master Project Symposium
156
3.0 METHODOLOGY
3.1 Research Design
Most of the approaches are using the practical application of knowledge. It
involves the application of basic knowledge for the solution of a particular problem
and evaluation of new concepts. The sources of data collected for the study was
compiled from the monitoring data of chlorine gas concentration by using chlorine
gas detector with data logger and survey conducted. In conducting survey,
questionnaires were used to gather the data on relation between dependent variables
such as knowledge, skill and competency as well as exposure time of the workers to
the chlorination process with the chlorine-induced health impacts. To analyse the
chlorine concentration, quantitative analysis was used.
Chlorine gas sensor completed with real time data logger with present time interval at
10 second per reading. Model used: HYDRO.
To analyse workers or crew knowledge, skill and competency, quantitative analysis
method was use. All 68 workers or crew from the production section whom directly
involved with chlorine are used as respondents. A set of questioners were given to
each and every one of them.
4.0 RESULTS AND DISCUSSION
Chlorine is known as a hazardous chemical. Highly exposed to chlorine may
lead to have adverse effect to the human health (Elisabeth et al.,2006; Sivaprakash &
Karthikeyan, 2014; Sung-Woo Han et al. 2016). Chlorine may cause acute and
chronic health effect such as burn out moist body surface like skin, eyes, nose, throat
or damage in respiratory system which can cause death (Jonasson et.al., 2013; Khan
et.al., 2015; Gaskin et.al., 2013; Rui et.al., 2014).
The study is conducted to assess the concentration of chlorine inside the
chlorine room while the technical or production crew do the drum replacement. As
normal standard operation, the drum was replaced in the interval at once in 5 to 8
working days. Average time the crew spent inside the chlorine room also being
assessed and take into consideration for the study. During drum replacement, the crew
will have o chlorine room. All safety procedure such as entry permit until PPE
compliance should be comply at all time before and during entering the chlorine
room. Only trained and authorized crew will be allowed to enter the room. At all time,
the room locked up and secured the assess key at security control room.
Chlorine concentration were measured by fixed chlorine gas detector which
located near to landing valve or supply manifold header. Data collected and recorded
by realtime recorder at the interval once data per every 10 second. Although the data
in continuously logged by the data logger and plotted by electronic chart, but the data
of chlorine analyzed when then crew inside the room. The logged data was extracted
by special software from the data bank. Analysis was done by microsoft excel as well
as SPSS.
Data collected in between of 12 January until 2 March 2017. From the
analysis found that the level of chlorine concentration during drum replacement by
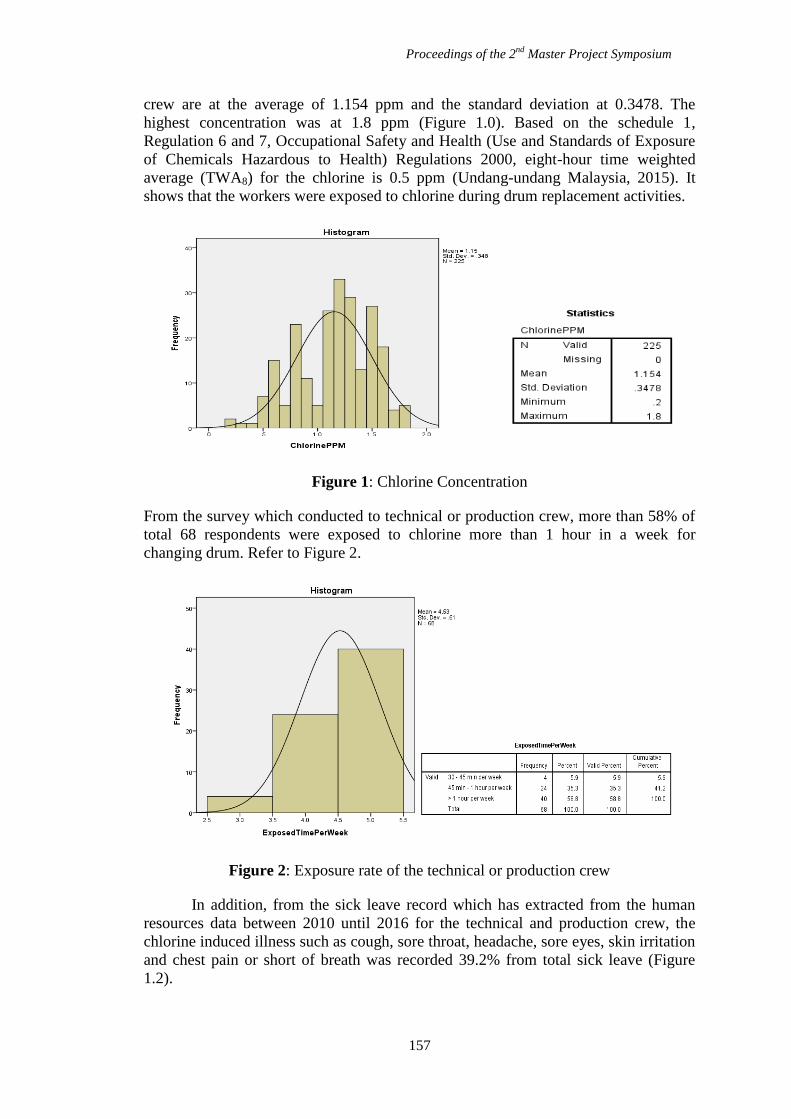
Proceedings of the 2nd
Master Project Symposium
157
crew are at the average of 1.154 ppm and the standard deviation at 0.3478. The
highest concentration was at 1.8 ppm (Figure 1.0). Based on the schedule 1,
Regulation 6 and 7, Occupational Safety and Health (Use and Standards of Exposure
of Chemicals Hazardous to Health) Regulations 2000, eight-hour time weighted
average (TWA8) for the chlorine is 0.5 ppm (Undang-undang Malaysia, 2015). It
shows that the workers were exposed to chlorine during drum replacement activities.
Figure 1: Chlorine Concentration
From the survey which conducted to technical or production crew, more than 58% of
total 68 respondents were exposed to chlorine more than 1 hour in a week for
changing drum. Refer to Figure 2.
Figure 2: Exposure rate of the technical or production crew
In addition, from the sick leave record which has extracted from the human
resources data between 2010 until 2016 for the technical and production crew, the
chlorine induced illness such as cough, sore throat, headache, sore eyes, skin irritation
and chest pain or short of breath was recorded 39.2% from total sick leave (Figure
1.2).
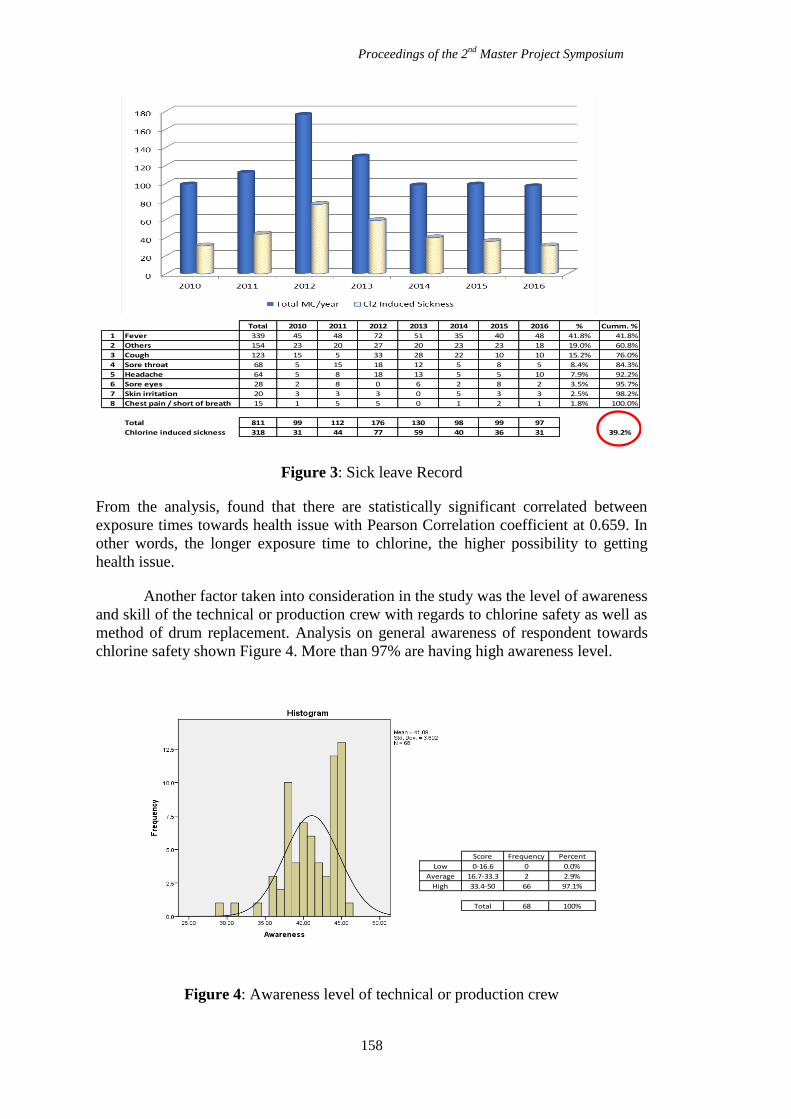
Proceedings of the 2nd
Master Project Symposium
158
Figure 3: Sick leave Record
From the analysis, found that there are statistically significant correlated between
exposure times towards health issue with Pearson Correlation coefficient at 0.659. In
other words, the longer exposure time to chlorine, the higher possibility to getting
health issue.
Another factor taken into consideration in the study was the level of awareness
and skill of the technical or production crew with regards to chlorine safety as well as
method of drum replacement. Analysis on general awareness of respondent towards
chlorine safety shown Figure 4. More than 97% are having high awareness level.
Figure 4: Awareness level of technical or production crew
Total 2010 2011 2012 2013 2014 2015 2016 % Cumm. %
1 Fever 339 45 48 72 51 35 40 48 41.8% 41.8%
2 Others 154 23 20 27 20 23 23 18 19.0% 60.8%
3 Cough 123 15 5 33 28 22 10 10 15.2% 76.0%
4 Sore throat 68 5 15 18 12 5 8 5 8.4% 84.3%
5 Headache 64 5 8 18 13 5 5 10 7.9% 92.2%
6 Sore eyes 28 2 8 0 6 2 8 2 3.5% 95.7%
7 Skin irritation 20 3 3 3 0 5 3 3 2.5% 98.2%
8 Chest pain / short of breath 15 1 5 5 0 1 2 1 1.8% 100.0%
Total 811 99 112 176 130 98 99 97
Chlorine induced sickness 318 31 44 77 59 40 36 31 39.2%
Score Frequency Percent
Low 0-16.6 0 0.0%
Average 16.7-33.3 2 2.9%
High 33.4-50 66 97.1%
Total 68 100%
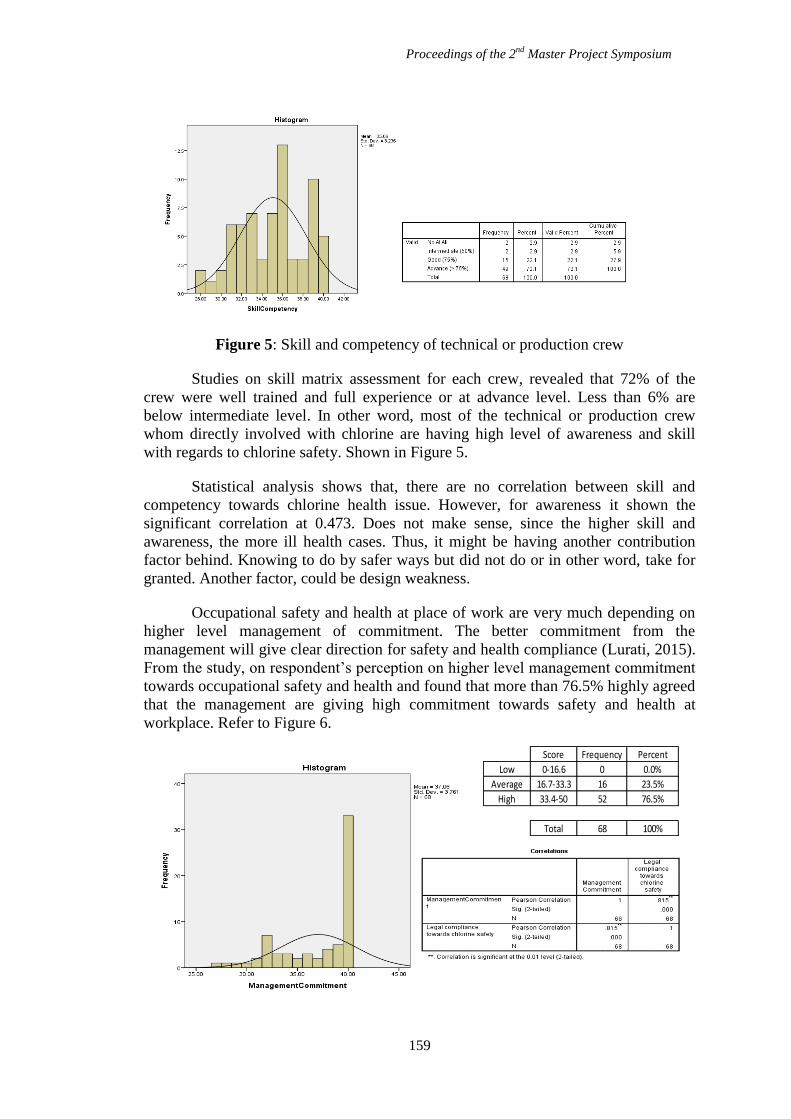
Proceedings of the 2nd
Master Project Symposium
159
Figure 5: Skill and competency of technical or production crew
Studies on skill matrix assessment for each crew, revealed that 72% of the
crew were well trained and full experience or at advance level. Less than 6% are
below intermediate level. In other word, most of the technical or production crew
whom directly involved with chlorine are having high level of awareness and skill
with regards to chlorine safety. Shown in Figure 5.
Statistical analysis shows that, there are no correlation between skill and
competency towards chlorine health issue. However, for awareness it shown the
significant correlation at 0.473. Does not make sense, since the higher skill and
awareness, the more ill health cases. Thus, it might be having another contribution
factor behind. Knowing to do by safer ways but did not do or in other word, take for
granted. Another factor, could be design weakness.
Occupational safety and health at place of work are very much depending on
higher level management of commitment. The better commitment from the
management will give clear direction for safety and health compliance (Lurati, 2015).
From the study, on respondent’s perception on higher level management commitment
towards occupational safety and health and found that more than 76.5% highly agreed
that the management are giving high commitment towards safety and health at
workplace. Refer to Figure 6.
Score Frequency Percent
Low 0-16.6 0 0.0%
Average 16.7-33.3 16 23.5%
High 33.4-50 52 76.5%
Total 68 100%
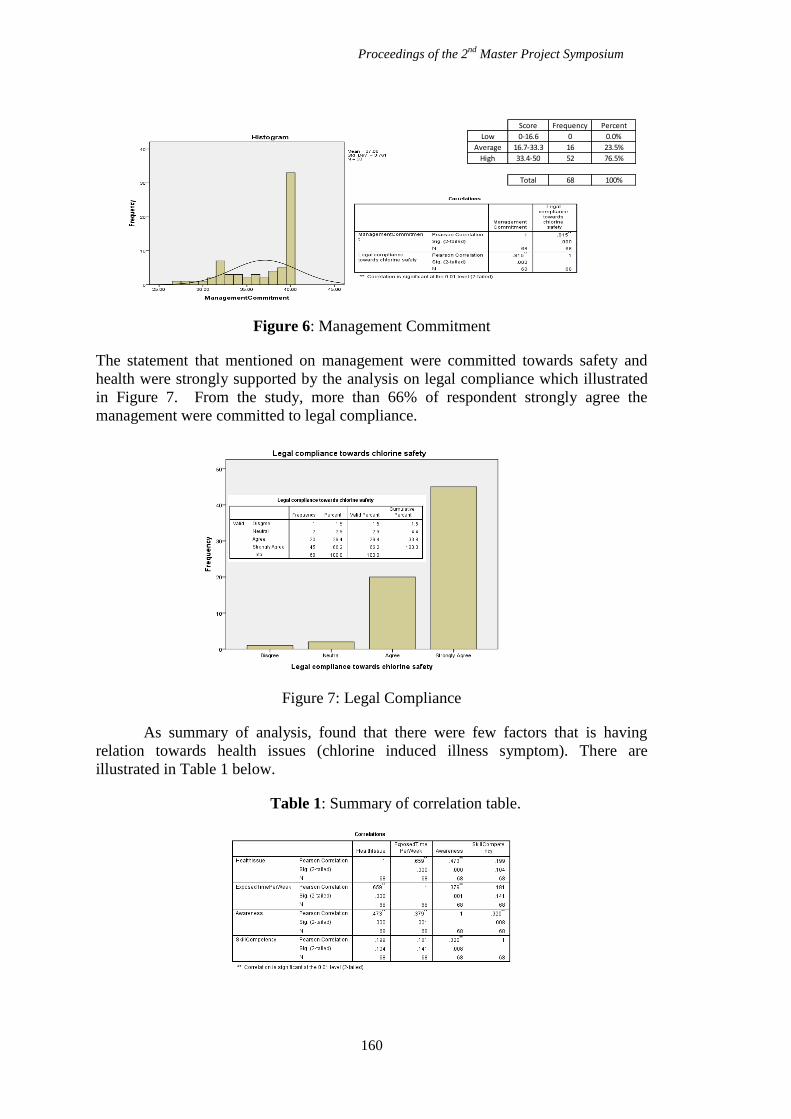
Proceedings of the 2nd
Master Project Symposium
160
Figure 6: Management Commitment
The statement that mentioned on management were committed towards safety and
health were strongly supported by the analysis on legal compliance which illustrated
in Figure 7. From the study, more than 66% of respondent strongly agree the
management were committed to legal compliance.
Figure 7: Legal Compliance
As summary of analysis, found that there were few factors that is having
relation towards health issues (chlorine induced illness symptom). There are
illustrated in Table 1 below.
Table 1: Summary of correlation table.
Score Frequency Percent
Low 0-16.6 0 0.0%
Average 16.7-33.3 16 23.5%
High 33.4-50 52 76.5%
Total 68 100%
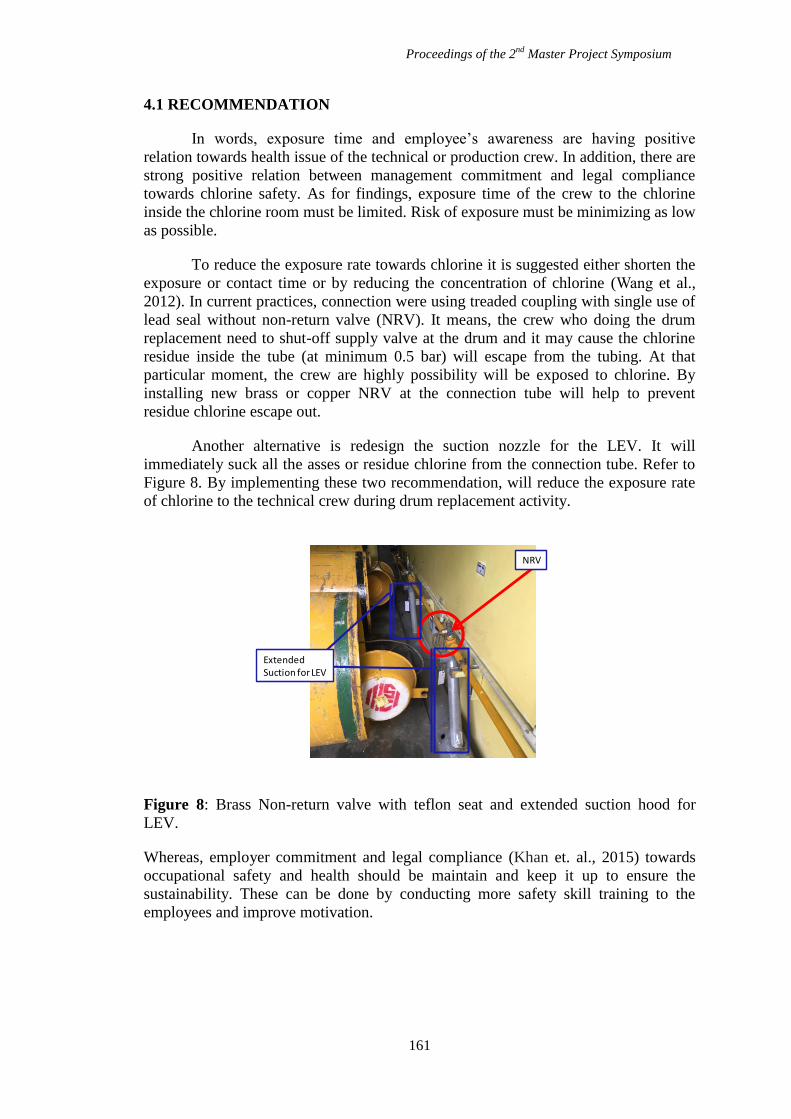
Proceedings of the 2nd
Master Project Symposium
161
4.1 RECOMMENDATION
In words, exposure time and employee’s awareness are having positive
relation towards health issue of the technical or production crew. In addition, there are
strong positive relation between management commitment and legal compliance
towards chlorine safety. As for findings, exposure time of the crew to the chlorine
inside the chlorine room must be limited. Risk of exposure must be minimizing as low
as possible.
To reduce the exposure rate towards chlorine it is suggested either shorten the
exposure or contact time or by reducing the concentration of chlorine (Wang et al.,
2012). In current practices, connection were using treaded coupling with single use of
lead seal without non-return valve (NRV). It means, the crew who doing the drum
replacement need to shut-off supply valve at the drum and it may cause the chlorine
residue inside the tube (at minimum 0.5 bar) will escape from the tubing. At that
particular moment, the crew are highly possibility will be exposed to chlorine. By
installing new brass or copper NRV at the connection tube will help to prevent
residue chlorine escape out.
Another alternative is redesign the suction nozzle for the LEV. It will
immediately suck all the asses or residue chlorine from the connection tube. Refer to
Figure 8. By implementing these two recommendation, will reduce the exposure rate
of chlorine to the technical crew during drum replacement activity.
Figure 8: Brass Non-return valve with teflon seat and extended suction hood for
LEV.
Whereas, employer commitment and legal compliance (Khan et. al., 2015) towards
occupational safety and health should be maintain and keep it up to ensure the
sustainability. These can be done by conducting more safety skill training to the
employees and improve motivation.
ExtendedSuction for LEV
NRV
Proceedings of the 2nd
Master Project Symposium
162
5.0 CONCLUSION
In conclusion, this study found that the risk management for the centralized
chlorine gas system needs to take further improvement. Extra cautions and special
safety control are needed for better and safer working environment. This study also
recommends further improvement in current control measures which will focus on
engineering control aspect besides, skill and competency of the workers. A concept of
safety by design, inherently safety and fail-safe system was taken into consideration
during the study.
REFERENCES:
Alladi Mohan, S. Naveen Kumar, M.H. Rao, S. Bollineni and I.Chiranjeevi
Manohar (2010) Acute Accidental Exposure to Chlorine Gas : Clinical
Presentation, Pulmonary Functions and Outcomes (The Indian Journal of
Chest Diseases & Allied Sciences), 52, pp 149-152.
Ann Lurati (2015). Occupational-Related Chemical Injuries. A review of the
literature (Workplace Health & Safety), 63, 284-287.
Boris, J. P., & Patnaik, G. (2014). Acute Exposure Guideline Levels (AEGLs)
For Time Varying Toxic Plumes (No. NRL/MR/6003--14-9493). Naval
Research Lab Washington DC Lab For Computational Physics and Fluid
Dynamics.
Carl W.White and James G. Martin (2010) Chlorine Gas Inhalation. Human
Clinical Evidence of Toxicity and Experience in Animal Models. (Proceedings
of The American Thoracic Society, Vol. 7, pp 257-263.
Elisabeth Wigenstam, Linda Elfsmark, Bo Koch, Anders Bucht and Sofia Jonasson
(2016) Acute Respiratory Changes and Pulmonary Inflammation Involving a
Pathway of TGF- Induction ia a Rat Model of Chlorine-induced Lung
Injury (Toxicology and Applied Pharmacology) Vol. 309, pp 44-54.
JIA Liu (2012). Analysis of Liquid Chlorine Leakage and Emergency
Response Measures (Advanced Materials Research, College of Safety Science
and Engineering, Liaoning Technical University, China), 518-523, pp 1859-
1862.
Jonasson, S., Koch, B., and Bucht, A. (2013). Inhalation of Chlorine Causes Long-
standing Lung Inflammation and Airway Hyperresponsiveness in a Murine
Model of Chemical - induced Lung Injury. Toxicology, 303, 34-42.
Khan, F., Rathnayaka, S., and Ahmed, S. (2015). Methods and Models in
Process Safety and Risk Management: Past, Present and Future. Process
Safety and Environmental Protection, 98, 116-147.
Proceedings of the 2nd
Master Project Symposium
163
MH Boskabady, M Esmaeilizadeh and M Boskabady (2012) The Effect of
Exposure to Chlorine on Pulmonary Function Tests and Respiratory and
Allergic Symptoms in Iranian Lifeguards (Toxicology and Industrial Health)
Vol. 30(3), pp 218-224.
Pallavi P. Balte, Kathleen A. Clark, Lawrence C. Mohr, Wilried J. Karmaus,
David Van Sickle and Erik R. Svendsen (2013) The Immediate Pulmonary
Disease Pattern following Exposure to High Concentrations of Chlorine Gas
(Hindawi Pulmonary Medicine)Vol. 2013, pp 1-8.
Purdy, G., and Wasilewski, M. (1994). Risk Management Strategies for Chlorine
Installations. Journal of loss prevention in the process industries, 7(2), 147-
156.
Sharyn Gaskin, Dino Pisaniello, John W.Edwards, David Bromwich, Sue Reed,
Micheal Logan and Christina Baxter (2013). Chlorine and Hydrogen Cyanide
Gas Interactions With Human Skin: In Vitro Studies to Inform Skin
Permeation and Decontamination in HAZMAT Incidents (Journal of
Hazardous Materials) Vol. 262, pp 759-765.
Sivaprakash, P. and Karthikeyan, L. M. (2014). A Study on Handling of
Hazardous Chemicals in Engineering Industries. APCBEE Procedia, 9, 187-
191.
Sung-Woo Han, Won-Jun Choi, Min-Kee Yi, Seng-Ho Song, Dong-Hoon Lee
and Sang-Hwan Han (2016) Acute Respiratory Symptoms and Evacuation-
related Behavior After Exposure to Chlorine Leakage (Annals of Occupational
and Environmental Medicine, BioMed Central), (2016), 28:29
Tze-Ming Benson Chen, Harjoth Malli, David M. Maslove, Helena Wang and
Ware G.Kuschner (2011) Toxic Inhalation Exposures (Journal of Intensive
Care Medician)Vol. 28(6), pp 323-333.
Wang Rui, Zhang Mingguang, Chen Yinting and Qian Chengjiang (2014). Study
on Safety Capacity of Chemical Industrial Park in Operation Stage (2014
International Symposium on Safety Science and Technology)
Xuefeng Wang, Jiajia Xie and Yinghui Liu (2012) RFID Application in
Dangerous Chemicals Safety Management (Applied Mechanics and Materials)
Vol. 198-199, pp 1261-1264.
Undang-Undang Malaysia, Akta Keselamatan Dan Kesihatan Pekerjaan Dan
Peraturan-Peraturan 1994, MDC PUBLISHERS SDN. BHD. January, 2005
Proceedings of the 2nd
Master Project Symposium
164
Risk Assessment of Excavation Works in the
Vicinity of Underground Utilities at
Construction Site
Mohd Nazrul Mat Noora and Samira Albati Kamaruddin
b
UTM Razak School of Engineering and Advanced Technology, Universiti Teknologi
Malaysia, Jalan Sultan Yahya Petra, 54100 Kuala Lumpur, Malaysia [email protected],
Abstract – Excavation works is one of the risky activities in construction industry
that need hazards identification to control the risk. Risk assessment has become an
important way in preventing and minimizing accidents rate in construction industry.
The study was carried out with the aim to propose an improvement of the current
work procedure for safe excavation works in vicinity of underground utilities.
Questionnaire survey was distributed to foundation and drainage network installation
construction personnel consists of site managers, site engineers, site supervisors,
safety officers and safety supervisors. Analysis of mean index value and frequency
were performed and the results were aligned with likelihood and severity of hazards
based on DOSH risk matrix to determine the risk rating. The findings of risk
assessment show that hazards were rated as high risk and medium risk. Higher scores
of mean value greater than 4.0 were recorded for all suggested safe work practice for
excavation works in the vicinity of underground utilities. These suggest that the
proposed improvement of work procedure will include all safe work suggestion to
prevent and minimize accidents at construction sites.
Keywords: Safe work procedure, Safe excavation, Ground work, Risk matrix, Construction industry
1.0 INTRODUCTION
Unsafe conditions and practices in excavation works or ground works can cause
accident, fatality and injury to human, property damages, bad effects to environment
and poor production rate. Excavation works require high safety concern to avoid
serious accident occurrence to the involved workers. According to Aksorn and
Hadikusumo (2007), improper excavation methods is the major contributor to
accident in construction industry. Whereas Cheng and Teizer (2014) agreed that
accidents in construction projects frequently occurred due to construction process at
sites that are very closed to with the workers, property or other equipment. The results
are usually the fatality, serious injury and significant collateral damages to the
property. Based on a DOSH study (2015), construction workers were killed and
injured during excavation works because of no safety precaution. In 2015, five of 33
fatality cases in construction sites were caused by excavation works and ground work.
Excavation works in the vicinity of underground public utilities such as water
pipelines, sewer lines, utility cables and gas pipelines have uncertainty conditions
Proceedings of the 2nd
Master Project Symposium
165
which create opportunities for risk to cause over expenditure or financial loss. Any
accident occurrence also caused injury to people or damage to property (Jannadi,
2008). According to Jaw and Hashim (2013), many underground utilities were buried
under a road pavement or walkway many years ago by different utility installer
companies or contractors. Rapid demand of utility services has resulted new
underground utility construction, installation and maintenance. Interruption of
established and implemented utility services occurred due to excavation of unknown
existing underground utilities location. The interruption triggered inconvenient caused
to residential and building occupants and created hazards related to fire and explosion.
In the case of hazards, risk assessment is needed as a systematic method to identify
hazards associated with activities and analyse the level of risk for each hazard. The
identified hazards usually cannot be fully eliminated. Hence, the hazards need to be
defined and the risk level can be analysed through quantitative or qualitative method.
Results gathered from the risk assessment are very important to improve contractors’
performance during implementation of occupational safety and health management at
construction site (Paithankar, 2011). Risk assessment can show factors influencing an
occurrence of accident (Lee at al., 2012). The system of risk assessment calculated
risk indices based on statistical analysis and risk influences factor. The risk for each
task or job are estimated based on likelihood and severity with known specific type of
risk at the construction site. With the structured risk assessment, this study aimed to
improve the safe work procedures for excavation works in the vicinity of underground
utilities.
2.0 METHODOLOGY
Structured questionnaires that consists of three sections were developed based on
specific type of hazards for excavation work listed in Occupational Safety and Health
Administration (OSHA), Safe Work Australia and Health and Safety Executive
(HSE). From the list, cave-ins, fall into trench, struck by construction vehicles and
underground utilities were identified as the major type of hazards. First section
consists of demographic questions pertaining to respondent’s background including
age, roles, education level and working experience. Second section relates the risk
assessment based on likelihood of occurrence and severity of hazards. A five-point
Likert scale were used to represent the rating of risk matrix recommended by DOSH
(2008). The risk matrix is a multiplication of rating value between severity and
likelihood. In the third section, questions were formulated to indicate suggestion of
safe work practice for excavation works in the vicinity of underground utilities. A
five-point Likert scale ranging from one (strongly disagree) to five (strongly agree)
were used to measure each variable. Questionnaires were distributed to site personnel
at a Malaysia Rapid Transit (MRT) construction project near Damansara, Selangor
with total population of 50. By referring to Krejcie and Morgan (1970), the sampling
size needed is 44. The collected data was analysed using Statistical Package for Social
Science (SPSS) version 23 and Microsoft Excel 2010. Ten samples were used as a
pilot test and the reliability was determined by using Cronbach’ alpha. Frequency
analysis and mean index were used in the analysis.
Proceedings of the 2nd
Master Project Symposium
166
3.0 RESULTS AND DISCUSSION
For the pilot test, the Cronbach’s alpha coefficient of all items is 0.899. It shows that
the items have relatively high internal consistency. No elimination is needed since the
reliability coefficient is higher than 0.70. Results of demographic, risk assessment and
safe work procedure are discussed here with the data shown in Tables 1 and 2.
3.1 Demographic
The demographic data shows that 38 of respondents were male aged between 30 to 40
years old. Majority of the respondents were site supervisor (31.8%) and site engineer
(38.6%). Most of the respondents (68.2%) have the working experience more than
five years. The percentage of working experience between five to ten years and more
than ten years are the same. Half respondents (50%) are graduated from university
with first degree and postgraduate level. It shows that, the respondents have sufficient
education level and knowledge to choose possible likelihood and severity rating value
of the excavation work hazards and give suggestion for the safe work procedure.
3.2 Risk Assessment
As mentioned above, four types of hazards for excavation work were identified from
three different safety organizations. The overall results of risk assessment for hazards
of excavation work in the vicinity of underground utilities at construction site are
shown in Table 1. Five hazards have high risk rating and the remaining hazards are
rated as medium risk. No low risk rating is obtained from this risk assessment.
For the cave-ins hazard, working in the trench without support or struts is considered
high risk. While load near to the top of trench has the lowest mean value. The highest
risk rating for working in the trench without support or strut was also mentioned as
serious hazard and pose the greatest risk to fatality in OSHA (2015). An unprotected
trench and excavation can be an early grave for the workers.
All causes of fall into trench hazards were rated as medium risk in which no fall
protection, barricade and guardrail surrounded the trench has the highest mean value.
The lowest mean value of this hazard is no signage near the trench. A study by Mosly
(2015) also found that the fall protection, barricade and guardrail surrounded the
trench can prevent workers or publics from fall into the trench. For the struck by
construction vehicle hazards, the highest mean value is belongs to operation without
flagman or banksman, meanwhile the lowest mean value is the operator’s blind spot
during machinery operation. Esmaeili and Hallowell (2012) also agreed that the
struck-by injuries is a leading proximal cause of fatal injuries. It is usually caused by
falls and contact that exists between workers and heavy equipment. In underground
utilities type of hazard, all causes are considered as high risk. These include
unavailable of underground utilities mapping, scanning inspection and trial pit.
3.3 Suggestion of Safe Work Practices
Table 2 shows the results of opinion for excavation safe work practices. The highest
mean value was 4.48 for the three (3) opinions of safe work practices. Most of the
respondents agreed with suggestion of approved permit to work prior start work,
standing supervision during excavation works and wearing personal protective
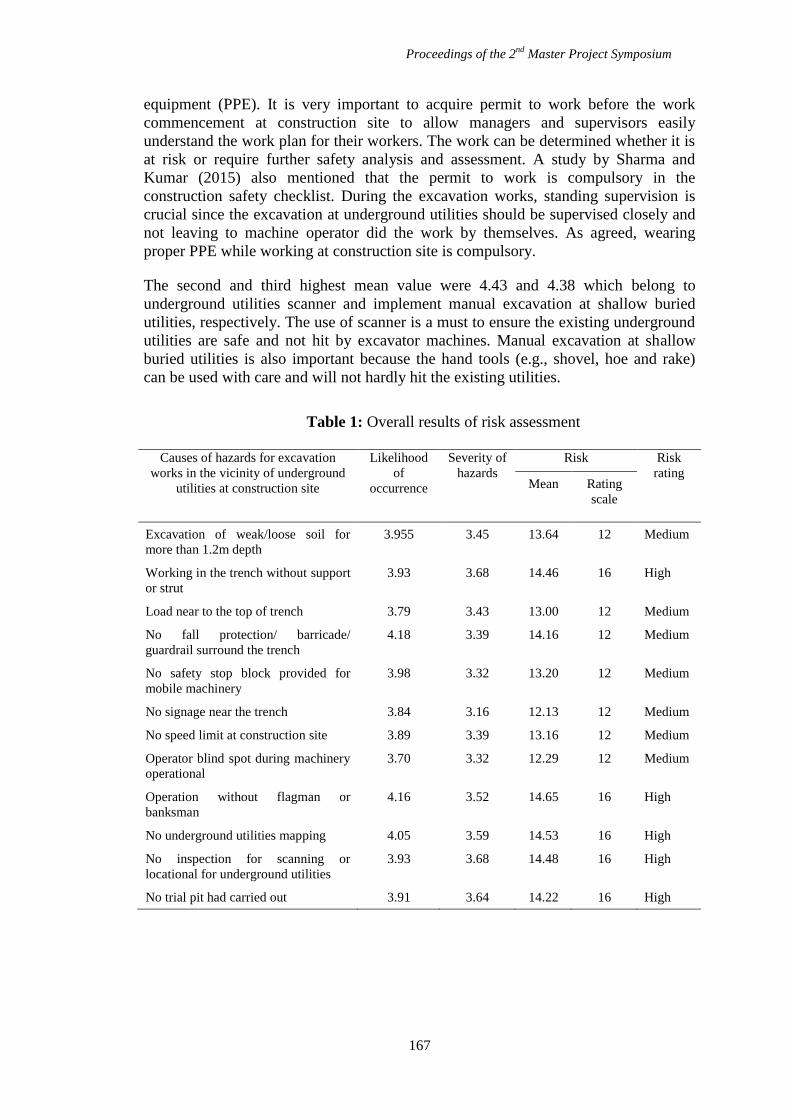
Proceedings of the 2nd
Master Project Symposium
167
equipment (PPE). It is very important to acquire permit to work before the work
commencement at construction site to allow managers and supervisors easily
understand the work plan for their workers. The work can be determined whether it is
at risk or require further safety analysis and assessment. A study by Sharma and
Kumar (2015) also mentioned that the permit to work is compulsory in the
construction safety checklist. During the excavation works, standing supervision is
crucial since the excavation at underground utilities should be supervised closely and
not leaving to machine operator did the work by themselves. As agreed, wearing
proper PPE while working at construction site is compulsory.
The second and third highest mean value were 4.43 and 4.38 which belong to
underground utilities scanner and implement manual excavation at shallow buried
utilities, respectively. The use of scanner is a must to ensure the existing underground
utilities are safe and not hit by excavator machines. Manual excavation at shallow
buried utilities is also important because the hand tools (e.g., shovel, hoe and rake)
can be used with care and will not hardly hit the existing utilities.
Table 1: Overall results of risk assessment
Causes of hazards for excavation
works in the vicinity of underground
utilities at construction site
Likelihood
of
occurrence
Severity of
hazards
Risk Risk
rating Mean Rating
scale
Excavation of weak/loose soil for
more than 1.2m depth
3.955 3.45 13.64 12 Medium
Working in the trench without support
or strut
3.93 3.68 14.46 16 High
Load near to the top of trench 3.79 3.43 13.00 12 Medium
No fall protection/ barricade/
guardrail surround the trench
4.18 3.39 14.16 12 Medium
No safety stop block provided for
mobile machinery
3.98 3.32 13.20 12 Medium
No signage near the trench 3.84 3.16 12.13 12 Medium
No speed limit at construction site 3.89 3.39 13.16 12 Medium
Operator blind spot during machinery
operational
3.70 3.32 12.29 12 Medium
Operation without flagman or
banksman
4.16 3.52 14.65 16 High
No underground utilities mapping 4.05 3.59 14.53 16 High
No inspection for scanning or
locational for underground utilities
3.93 3.68 14.48 16 High
No trial pit had carried out 3.91 3.64 14.22 16 High

Proceedings of the 2nd
Master Project Symposium
168
Table 2: Results of opinion for safe work practices for the excavation work
Safe work practices for the excavation works Mean value
Approved permit to work prior start work 4.48
Standing supervision during excavation works 4.48
Wearing personal protective equipment (PPE) 4.48
Using underground utility scanner 4.43
Implement manual excavation at shallow buried utilities 4.39
Excavation checklist and site inspection 4.36
Provide safe access and egress 4.36
Provide temporary trench support for trench if more than 1.5m depth 4.36
Checking the underground utilities mapping drawing 4.34
Full time flagman or banksman 4.27
4.0 CONCLUSION
This paper presents an inclusive risk assessment for excavation works in the vicinity
of underground utilities. Hazards associated with excavation works in the vicinity of
underground utilities were assessed by involving respondents at the construction
project site. The mean index analysis was implemented to find the highest mean value
of the risk rating. Risk matrix was used to determine the risk rating for the risk
assessment. The findings show that working in the trench without support or strut;
operation without flagman or banksman; no underground utilities mapping; no
inspection for scanning or locational for underground utilities; and no trial pit had
carried out were rated as high risk. Improvement of the existing work procedure for
excavation works in the vicinity of underground utilities is proposed based on the
findings from this study. The findings also proved that all suggestion can be used to
improve the safe work procedure for excavation works in the vicinity of underground
utilities. From the suggestion, the highly recommended work procedure are the
approved permit to work prior start work; standing supervision during excavation
works; and wearing personal protective equipment (PPE). In future, it is also useful if
the questionnaire survey could be distributed to other construction project sites that
related to excavation works in the vicinity of underground utilities.
REFERENCES
Aksorn & Hadikusumo (2007). The unsafe acts and the decision-to-err factors of Thai
construction workers. Journal of Construction in Developing Countries, 12, 1-
25.
Cheng, T. & Teizer, J. (2014). Crane Operator Visibility of Ground Operations.
Journal of Computing in Civil Engineering, 28, 15.
DOSH (2008). Guidelines for Hazard Identification, Risk Assessment and Risk
Control (HIRARC), Malaysia: Department of Occupational Safety and Health,
Ministry of Human Resources.
Proceedings of the 2nd
Master Project Symposium
169
DOSH 2015. Excavation Safety. Tapak Selamat: Bahagian Keselamatan Tapak Bina
Malaysia: Department of Occupational Safety And Health, Malaysia.
Esmaeili, B. & Hallowell, M. (2012). Attribute-based Risk Model for Measuring
Safety Risk of Struck-by Accidents. Construction Research Congress.
Jannadi, O. A. (2008). Risks Associated With Trenching Works in Saudi Arabia.
Building and Environment 43 776–781.
Jaw, S. W. & Hashim, M. (2013). Locational Accuracy of Underground Utility
Mapping Using Ground Penetrating Radar. Tunnelling and Underground
Space Technology 20-29.
Krejcie, R. V. & Morgan, D. W. (1970). Determining Sample Size for Research
Activities. Educational and Psychological Measurement 30, 607-610.
Lee, H.-S., Kim, H., Park, M., Teo, E. A. L. & Lee, K.-P. (2012). Construction Risk
Assessment Using Site Influence Factors. Journal of Computing in Civil
Engineering, 26, 319-330.
Mosly, I. (2015). Safety Performance in the Construction Industry of Saudi Arabia.
International Journal of Construction Engineering and Management 4(6).
OSHA (2015). Trenching and Excavation Safety, USA: Occupational Safety and
Health Administration, U.S. Department of Labor.
Paithankar, A. (2011). Hazard Identification And Risk Analysis In Mining Industry.
National Institute of Technology, Rourkela.
Proceedings of the 2nd
Master Project Symposium
170
5S Techniques at Neptune Air Warehouse
Nurul Amirah Jamaludina and Noor Hamizah Hussain
b
UTM Razak School of Engineering and Advanced Technology, Universiti Teknologi
Malaysia, Kuala Lumpur, Malaysia [email protected],
Abstract – This paper presents an application of 5S Techniques at Neptune Air
Warehouse. Neptune Air Sdn. Bhd. is an aviation company located in Ara
Damansara, Malaysia. The aim of this paper is to design a warehouse layout based
on 5S Technique application. 5S is the foundation of lean manufacturing and it is a
part of Kaizen – a system of continual improvement. 5S was developed in Japan and
was founded by Hiroyuki Hirano. The 5S technique is used to organize, clean,
standardized and maintain the discipline at the workplace in pursuit of sustainable
improvements in the productivity, to optimize cost and to reduce waste in an
organization. Photos of before and after 5S Techniques application were taken for
comparison purposes. In addition, Google Sketchup 2017 was used to simulate the 5S
Techniques application of Neptune Air Warehouse. It can be concluded that Neptune
Air warehouse can be designed based on 5S technique as it will contribute to lots of
advantages and benefits.
Keywords: 5S Technique, Warehouse, Safety, Kaizen
1.0 INTRODUCTION
The 5S concept has been introduced to Japanese companies in early 1980s. The 5S is
precisely five abbreviations of Japanese terms with 5 initials of S such as Seiri (sort),
Seiton (set in order), Seiso(shine), Seiketsu (standardize) and Shitsuke (sustain). 5S is
a method or managing tool that can create quality, neat and safe working
environments in an organisation. It is also used to ensure compliance with standards
as well as to foster continuous improvements in any organisation. The 5S are used to
create a good working environment and to eliminate waste as well. It is a systematic
and methodical approach allowing an employer to organise their workplace in the
safest and most efficient manner. According to Occupational Safety and Health Act
Section 15(1), the duty of every employer and self-employed person are to ensure as
far as reasonably practicable the safety, health, and welfare of their employee at the
workplace (MDC, 2014).
Neptune Air is a cargo airline company based in Malaysia, where its’
headquarter is located in Ara Damansara and has a branch office located in Penang
International Airport. Neptune Air has one warehouse that is located in Ara
Damansara. The warehouse is being used to keep furniture, documents, aircraft tools,
aircraft spare parts etc. Warehouse can be defined as a planned space for the storage
and handling of good and material. Accidents and injuries can happen at the
Proceedings of the 2nd
Master Project Symposium
171
workplace such as a warehouse. The warehouse is playing a more critical role than it
ever has in the success or failure of businesses (Cakmak, Gunay, Aybakan, & Tanyas,
2012).Warehouse problems could affect the warehouse operations, therefore it is vital
for organizations to ensure the smooth running of their warehouses.
2.0 LITERATURE REVIEW
From day to day, large number of employees suffer from serious occupational injury
and disease at the workplace from all around the world (Vries, Koster, & Stam, 2016).
Warehouse, which is one of the supply chain elements, plays a vital role in the
success or failure of the company (Cakmak et. al, 2012). The crucial aspect that
needs to be considered in the process is utilizing the use of the space allocated to each
item. (Addy-Tayie, 2012). The total distribution systems and activities should be
considered external and internally before designing the warehouse (Moran, 2017).
5S is a basic foundation of Lean Manufacturing systems. It is a tool for cleaning,
sorting, organizing and providing the necessary groundwork for work place
improvement. By following the 5S methodology, it shows significant improvements
to safety, productivity, efficiency and housekeeping (Agrahari, Dangle, & Chandratre,
2015). A well-organised workplace contributes to a safe and efficient production
environment, which will increase the employee morale, promotes the feeling of
ownership, pride in their work and ownership of their responsibilities. (Randhawa &
Ahuja, 2017).
The relationship of the 5Ss with other improvement programmes, known as Lean-
thinking or Lean-Kaizen (Suárez‐Barraza & Ramis‐Pujol, 2012). Kaizen is a
Japanese word which means continual improvement. Kaizen events are related to lean
production. Proper action must then be taken to decrease the risk to the lowest level
reasonably practicable. Workers must follow correct work systems introduced by their
employer to encourage safety during the handling of loads. (Basahel, 2015)
3.0 METHODOLOGY
Researcher has applied the 5S technique based on studies from the previous
researchers. Steps of the 5S Techniques are as follows and were applied at Neptune
Air warehouse accordingly.
3.1 Seiri (Sorting)
The first step of the 5S technique is Seiri. By implementing Seiri where the sorting
process through the content of warehouse, keeping only the important items needed to
complete the task by removing unnecessary items. Aircraft parts, aircraft materials,
furniture, aircraft tools, boxes etc that are rarely used should be moved to a separate
and common storage area. Items that are not used were recycled or removed. Scrap
materials were sent directly to the recycling bin. In addition, aircraft parts were
divided into three categories namely serviceable, unserviceable and scrap. During
items classification, some of the items were returned to their owner. If the owner
cannot be identified, the items were brought to the fourth step in 5S sorting of red
tagging. If an item cannot be identified or classified, or if ownership cannot be
Proceedings of the 2nd
Master Project Symposium
172
determined, then it should be red tagged. Red tagged items that were not claimed after
a long period such as two weeks were recycled or disposed off.
3.2 Seiton (Set in Order)
The second step of the 5S technique is Seiton. The process of seiton is organise,
arrange, and identify everything in the work area, as well as throughout warehouse so
that items can be efficiently and effectively retrieved and returned to their proper
storage location. This step was focusing on creating efficient and effective storage
systems to enable person-in-charge to find the tools, materials, and supplies they
need, and those tools, materials, and supplies could be returned to their proper storage
locations. Employees’ most frequently used tools should reside in easy-to-access
areas with the least restrictions possible. The purpose is to minimise the need for the
repeated movement to reach over the items required by placing the most frequently
used tools and supplies closest to the station operator and less utilised items were
shifted to other secluded areas. To accomplish these goals, all aircraft parts were put
in boxes and labeled according to their category. Storage areas, racks, shelves, and
cabinets were clearly marked with signs and labels. Labels were placed on the outside
of doors to identify the storage space. The interior shelves were properly labeled
therefore each individual item can be consistently and easily returned to their proper
storage locations.
3.3 Seiso (Shine)
The third step of the 5S technique is Seiso. The process of seiso can be defined as
thorough cleaning at the warehouse. In this phase, Neptune Air staff should clean,
sweep, polish and vacuum along with other thing needed to attain perfect order. 5S
shine is everyone’s responsibility not just the job of cleaner. The best idea is to have
those who work in the warehouse would also be the one who are responsible for
cleaning such area at the end of each day. Safety can be guaranteed by keeping the
entire warehouse clean and neat. For example, keeping floors clear of dust and debris
helps reducing the risk of trips, slips, and falls – an extremely common cause of
warehouse injury. Cleaning was used as an inspection tool. Clear expectations are
necessary for positive employee interactions and, ultimately gain better results. In
addition, regular and thorough cleaning help to prevent degradation of machinery and
tool as well as in ensuring the lifespan of these items and subsequently reduce future
cost of replacement and maintenance. Cleaning roster has been prepared for Neptune
Air staff as well.
3.4 Seiketsu (Standardize)
The fourth step of the 5S technique is Seiketsu. The process of seiketsu focused on
standardisation in making the first three S’s, Seiri, Seiton, and Seiso a constant
routine. The emphasis in this step focused on visual management as an important to
always act as quickly as possible (Osada, 1991).5S work structure has been developed
for the warehouse operation in order to support the new proposed practices and turn
them into real practice. The purpose of standardisation is to make sure that everyone
in the company follows the same procedure, the same names of items, the same size
of signalisation/floor marking, shapes, colours, etc. Standardisation will also help to
do the right thing the right way every time. The 5S checklist has been developed and
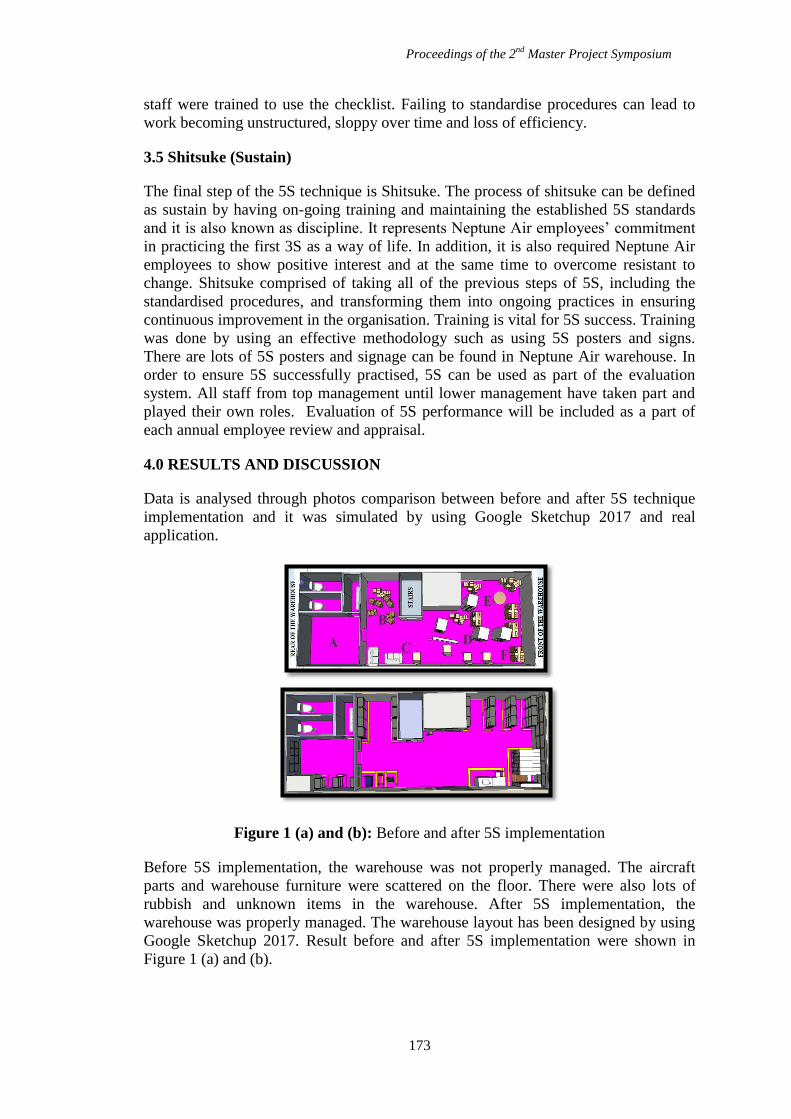
Proceedings of the 2nd
Master Project Symposium
173
staff were trained to use the checklist. Failing to standardise procedures can lead to
work becoming unstructured, sloppy over time and loss of efficiency.
3.5 Shitsuke (Sustain)
The final step of the 5S technique is Shitsuke. The process of shitsuke can be defined
as sustain by having on-going training and maintaining the established 5S standards
and it is also known as discipline. It represents Neptune Air employees’ commitment
in practicing the first 3S as a way of life. In addition, it is also required Neptune Air
employees to show positive interest and at the same time to overcome resistant to
change. Shitsuke comprised of taking all of the previous steps of 5S, including the
standardised procedures, and transforming them into ongoing practices in ensuring
continuous improvement in the organisation. Training is vital for 5S success. Training
was done by using an effective methodology such as using 5S posters and signs.
There are lots of 5S posters and signage can be found in Neptune Air warehouse. In
order to ensure 5S successfully practised, 5S can be used as part of the evaluation
system. All staff from top management until lower management have taken part and
played their own roles. Evaluation of 5S performance will be included as a part of
each annual employee review and appraisal.
4.0 RESULTS AND DISCUSSION
Data is analysed through photos comparison between before and after 5S technique
implementation and it was simulated by using Google Sketchup 2017 and real
application.
Figure 1 (a) and (b): Before and after 5S implementation
Before 5S implementation, the warehouse was not properly managed. The aircraft
parts and warehouse furniture were scattered on the floor. There were also lots of
rubbish and unknown items in the warehouse. After 5S implementation, the
warehouse was properly managed. The warehouse layout has been designed by using
Google Sketchup 2017. Result before and after 5S implementation were shown in
Figure 1 (a) and (b).
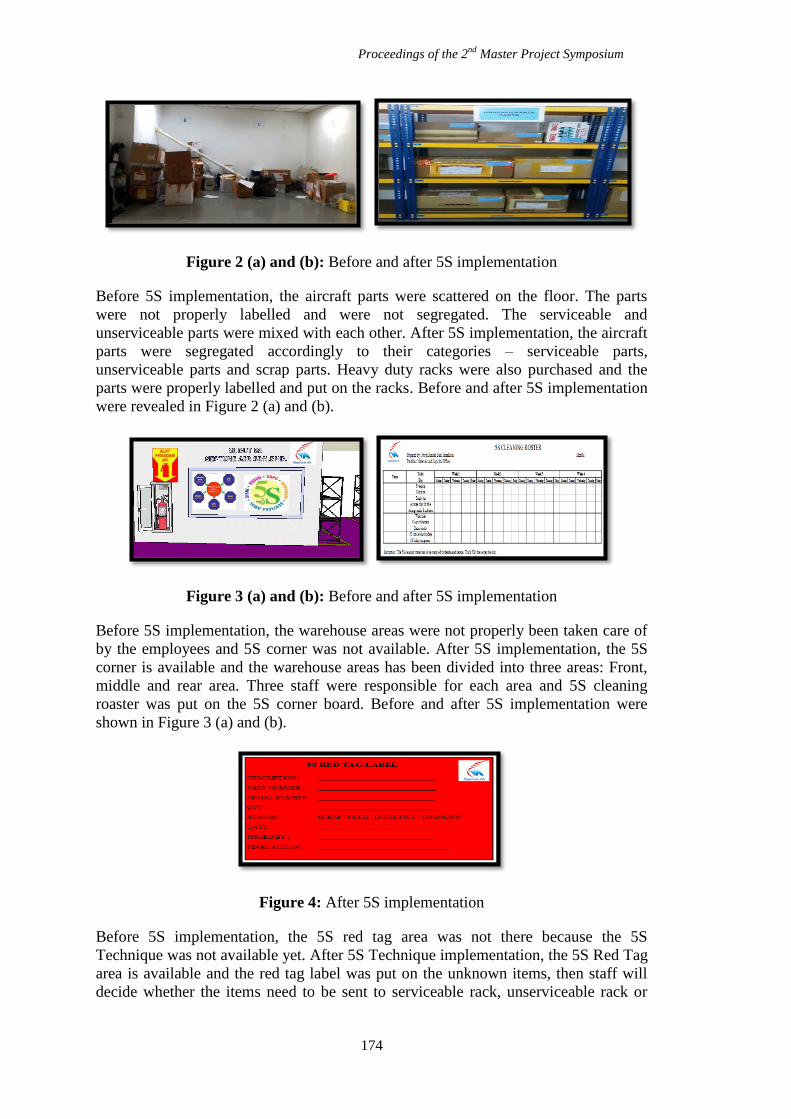
Proceedings of the 2nd
Master Project Symposium
174
Figure 2 (a) and (b): Before and after 5S implementation
Before 5S implementation, the aircraft parts were scattered on the floor. The parts
were not properly labelled and were not segregated. The serviceable and
unserviceable parts were mixed with each other. After 5S implementation, the aircraft
parts were segregated accordingly to their categories – serviceable parts,
unserviceable parts and scrap parts. Heavy duty racks were also purchased and the
parts were properly labelled and put on the racks. Before and after 5S implementation
were revealed in Figure 2 (a) and (b).
Figure 3 (a) and (b): Before and after 5S implementation
Before 5S implementation, the warehouse areas were not properly been taken care of
by the employees and 5S corner was not available. After 5S implementation, the 5S
corner is available and the warehouse areas has been divided into three areas: Front,
middle and rear area. Three staff were responsible for each area and 5S cleaning
roaster was put on the 5S corner board. Before and after 5S implementation were
shown in Figure 3 (a) and (b).
Figure 4: After 5S implementation
Before 5S implementation, the 5S red tag area was not there because the 5S
Technique was not available yet. After 5S Technique implementation, the 5S Red Tag
area is available and the red tag label was put on the unknown items, then staff will
decide whether the items need to be sent to serviceable rack, unserviceable rack or
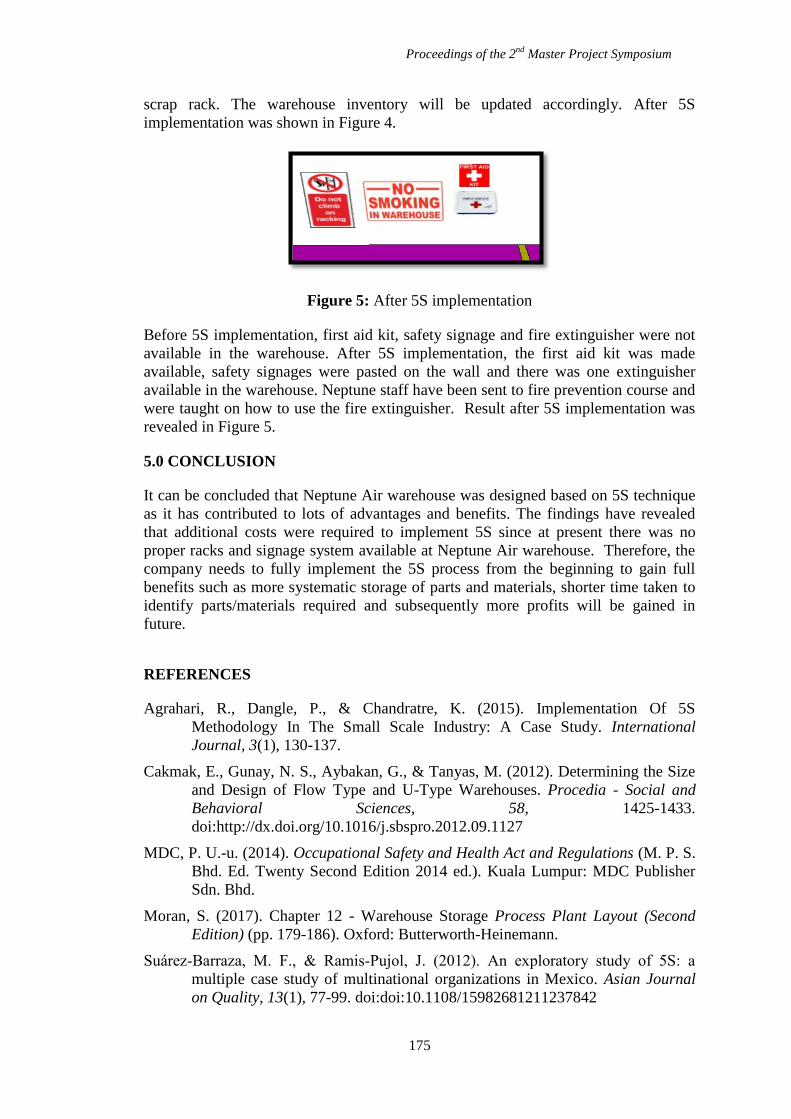
Proceedings of the 2nd
Master Project Symposium
175
scrap rack. The warehouse inventory will be updated accordingly. After 5S
implementation was shown in Figure 4.
Figure 5: After 5S implementation
Before 5S implementation, first aid kit, safety signage and fire extinguisher were not
available in the warehouse. After 5S implementation, the first aid kit was made
available, safety signages were pasted on the wall and there was one extinguisher
available in the warehouse. Neptune staff have been sent to fire prevention course and
were taught on how to use the fire extinguisher. Result after 5S implementation was
revealed in Figure 5.
5.0 CONCLUSION
It can be concluded that Neptune Air warehouse was designed based on 5S technique
as it has contributed to lots of advantages and benefits. The findings have revealed
that additional costs were required to implement 5S since at present there was no
proper racks and signage system available at Neptune Air warehouse. Therefore, the
company needs to fully implement the 5S process from the beginning to gain full
benefits such as more systematic storage of parts and materials, shorter time taken to
identify parts/materials required and subsequently more profits will be gained in
future.
REFERENCES
Agrahari, R., Dangle, P., & Chandratre, K. (2015). Implementation Of 5S
Methodology In The Small Scale Industry: A Case Study. International
Journal, 3(1), 130-137.
Cakmak, E., Gunay, N. S., Aybakan, G., & Tanyas, M. (2012). Determining the Size
and Design of Flow Type and U-Type Warehouses. Procedia - Social and
Behavioral Sciences, 58, 1425-1433.
doi:http://dx.doi.org/10.1016/j.sbspro.2012.09.1127
MDC, P. U.-u. (2014). Occupational Safety and Health Act and Regulations (M. P. S.
Bhd. Ed. Twenty Second Edition 2014 ed.). Kuala Lumpur: MDC Publisher
Sdn. Bhd.
Moran, S. (2017). Chapter 12 - Warehouse Storage Process Plant Layout (Second
Edition) (pp. 179-186). Oxford: Butterworth-Heinemann.
Suárez‐Barraza, M. F., & Ramis‐Pujol, J. (2012). An exploratory study of 5S: a
multiple case study of multinational organizations in Mexico. Asian Journal
on Quality, 13(1), 77-99. doi:doi:10.1108/15982681211237842
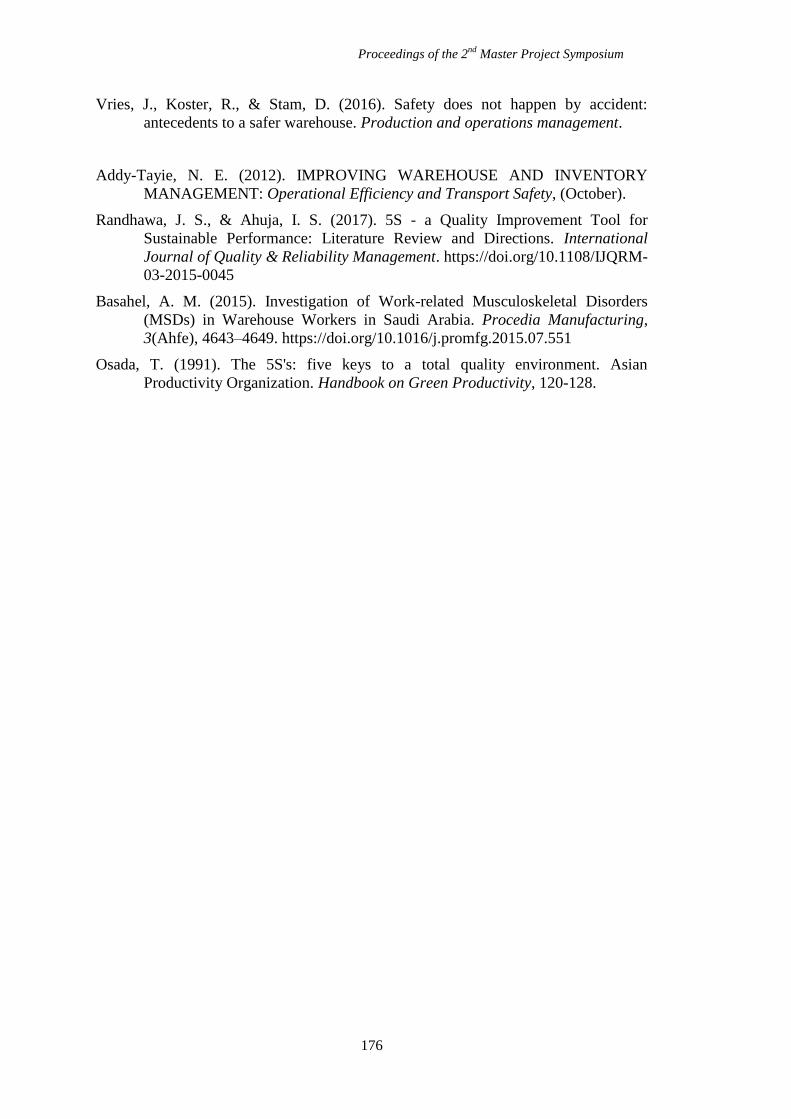
Proceedings of the 2nd
Master Project Symposium
176
Vries, J., Koster, R., & Stam, D. (2016). Safety does not happen by accident:
antecedents to a safer warehouse. Production and operations management.
Addy-Tayie, N. E. (2012). IMPROVING WAREHOUSE AND INVENTORY
MANAGEMENT: Operational Efficiency and Transport Safety, (October).
Randhawa, J. S., & Ahuja, I. S. (2017). 5S - a Quality Improvement Tool for
Sustainable Performance: Literature Review and Directions. International
Journal of Quality & Reliability Management. https://doi.org/10.1108/IJQRM-
03-2015-0045
Basahel, A. M. (2015). Investigation of Work-related Musculoskeletal Disorders
(MSDs) in Warehouse Workers in Saudi Arabia. Procedia Manufacturing,
3(Ahfe), 4643–4649. https://doi.org/10.1016/j.promfg.2015.07.551
Osada, T. (1991). The 5S's: five keys to a total quality environment. Asian
Productivity Organization. Handbook on Green Productivity, 120-128.
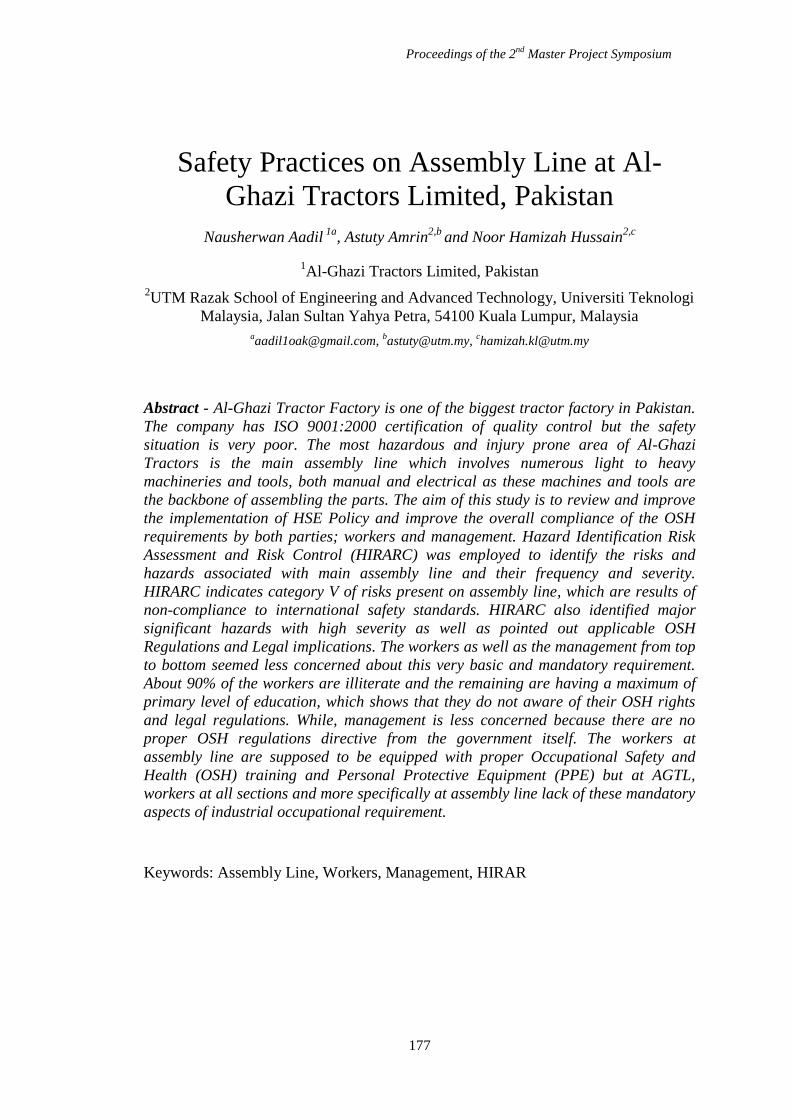
Proceedings of the 2nd
Master Project Symposium
177
Safety Practices on Assembly Line at Al-
Ghazi Tractors Limited, Pakistan
Nausherwan Aadil 1a
, Astuty Amrin2,b
and Noor Hamizah Hussain2,c
1Al-Ghazi Tractors Limited, Pakistan
2UTM Razak School of Engineering and Advanced Technology, Universiti Teknologi
Malaysia, Jalan Sultan Yahya Petra, 54100 Kuala Lumpur, Malaysia [email protected],
Abstract - Al-Ghazi Tractor Factory is one of the biggest tractor factory in Pakistan.
The company has ISO 9001:2000 certification of quality control but the safety
situation is very poor. The most hazardous and injury prone area of Al-Ghazi
Tractors is the main assembly line which involves numerous light to heavy
machineries and tools, both manual and electrical as these machines and tools are
the backbone of assembling the parts. The aim of this study is to review and improve
the implementation of HSE Policy and improve the overall compliance of the OSH
requirements by both parties; workers and management. Hazard Identification Risk
Assessment and Risk Control (HIRARC) was employed to identify the risks and
hazards associated with main assembly line and their frequency and severity.
HIRARC indicates category V of risks present on assembly line, which are results of
non-compliance to international safety standards. HIRARC also identified major
significant hazards with high severity as well as pointed out applicable OSH
Regulations and Legal implications. The workers as well as the management from top
to bottom seemed less concerned about this very basic and mandatory requirement.
About 90% of the workers are illiterate and the remaining are having a maximum of
primary level of education, which shows that they do not aware of their OSH rights
and legal regulations. While, management is less concerned because there are no
proper OSH regulations directive from the government itself. The workers at
assembly line are supposed to be equipped with proper Occupational Safety and
Health (OSH) training and Personal Protective Equipment (PPE) but at AGTL,
workers at all sections and more specifically at assembly line lack of these mandatory
aspects of industrial occupational requirement.
Keywords: Assembly Line, Workers, Management, HIRAR
Proceedings of the 2nd
Master Project Symposium
178
1.0 INTRODUCTION
Al-Ghazi Tractor Factory is one of the biggest tractor factory in Pakistan. It was
incorporated on June 26, 1983 and started its operation in September 1983. The
factory was privatized in 1991 and currently a subsidiary company of Al-Futtaim
group of UAE. As per the company, it is recognized for corporate excellence and
“Best Corporate Performance”. In dealing with management and operational tasks
related to safety and health of the workers, the management has adopted a Safety
Policy as referred in Figure 1.
Figure 1: Al-Ghazi Tractors Limited OSH Policy (www.alghazitractors.com)
At AGTL safety situation is considered very poor. Overall workers are lack of basic
and proper health and safety services. More specifically, the workers at main
assembly line are more prone to occupational hazards and serious health injuries as
they are associated with different machines and tools ranging from light to heavy and
manual to electrical. Workers at assembly line are lack some of the basic safety
requirements like PPEs, machine handling, HSE training resulting in exposure to
serious injuries and health issues.
The figure 2 below is an actual image taken at the assembly line in the factory. It is
quite clear and highlighted that workers are not wearing proper PPEs during their
work on assembly. This image was basically taken for official website that is why
workers are at least wearing a common uniform but in reality, worker are in direr
situation despite the claim from management that they are keen on maintaining
optimum level of HSSEQ to provide safe working facilities to the workers.
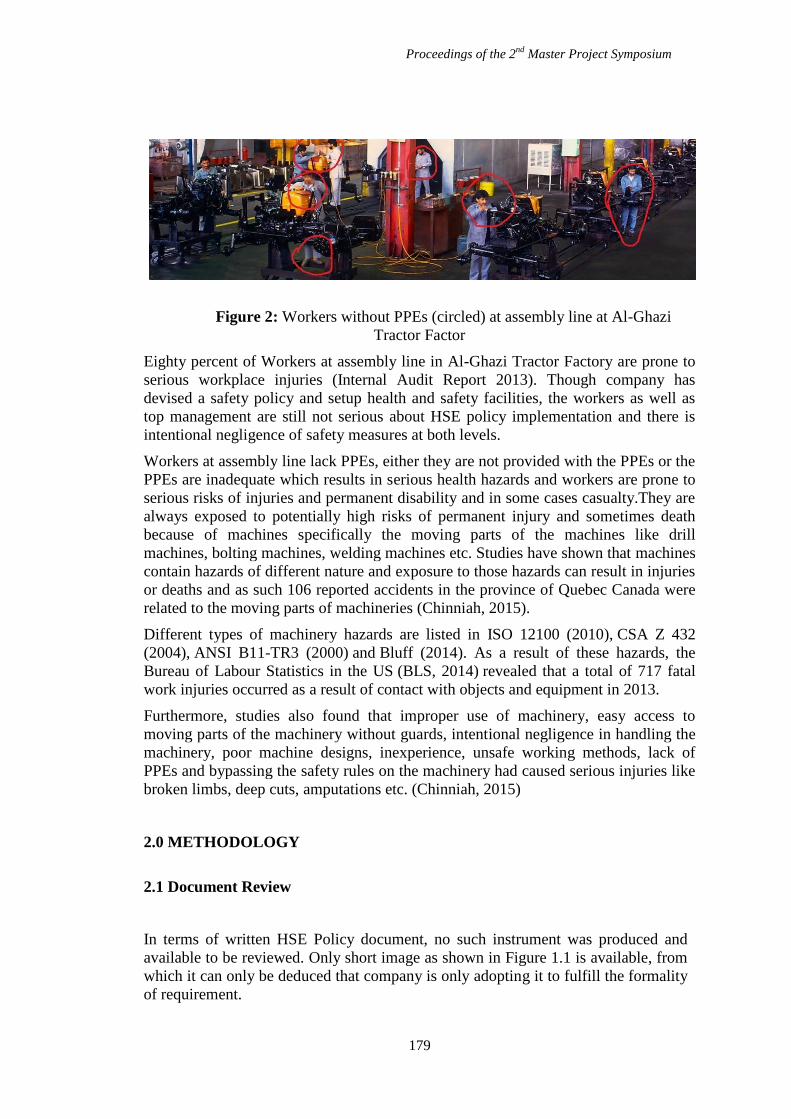
Proceedings of the 2nd
Master Project Symposium
179
Figure 2: Workers without PPEs (circled) at assembly line at Al-Ghazi
Tractor Factor
Eighty percent of Workers at assembly line in Al-Ghazi Tractor Factory are prone to
serious workplace injuries (Internal Audit Report 2013). Though company has
devised a safety policy and setup health and safety facilities, the workers as well as
top management are still not serious about HSE policy implementation and there is
intentional negligence of safety measures at both levels.
Workers at assembly line lack PPEs, either they are not provided with the PPEs or the
PPEs are inadequate which results in serious health hazards and workers are prone to
serious risks of injuries and permanent disability and in some cases casualty.They are
always exposed to potentially high risks of permanent injury and sometimes death
because of machines specifically the moving parts of the machines like drill
machines, bolting machines, welding machines etc. Studies have shown that machines
contain hazards of different nature and exposure to those hazards can result in injuries
or deaths and as such 106 reported accidents in the province of Quebec Canada were
related to the moving parts of machineries (Chinniah, 2015).
Different types of machinery hazards are listed in ISO 12100 (2010), CSA Z 432
(2004), ANSI B11-TR3 (2000) and Bluff (2014). As a result of these hazards, the
Bureau of Labour Statistics in the US (BLS, 2014) revealed that a total of 717 fatal
work injuries occurred as a result of contact with objects and equipment in 2013.
Furthermore, studies also found that improper use of machinery, easy access to
moving parts of the machinery without guards, intentional negligence in handling the
machinery, poor machine designs, inexperience, unsafe working methods, lack of
PPEs and bypassing the safety rules on the machinery had caused serious injuries like
broken limbs, deep cuts, amputations etc. (Chinniah, 2015)
2.0 METHODOLOGY
2.1 Document Review
In terms of written HSE Policy document, no such instrument was produced and
available to be reviewed. Only short image as shown in Figure 1.1 is available, from
which it can only be deduced that company is only adopting it to fulfill the formality
of requirement.
Proceedings of the 2nd
Master Project Symposium
180
2.2 Qualitative Interviews
A structured interview was conducted with the “Head of Assembly Line” who was
also in-charge of safety matters at assembly line. His main role is to solve technical
issues at assembly line but he is also responsible for safe work practices at assembly
line. Analyses of the interviews revealed that the company has no set policy of
occupational safety and health and offers only basic health facilities and emergency
first aid as part of the work contract with workers. Apart from these benefits, no
separate compensations are being provided in case of any workplace accidents and
injuries. There is no specific health and safety training for workers as well.
Apart from this structured interview, an unstructured interview was also conducted
with a worker at assembly line. From this interview, it can be deduced that workers
are aware of their safety but they don’t have any knowledge of occupational safety
and health standards and regulations. They are also unaware of their basic rights as
employees of the company set under international standards and regulations. The
analysis also showed that company has no designated safety officer or any safety
specialist person to provide safety guidelines.
2.3 HIRARC
Hazard Identification Risk Assessment and Risk Control (HIRARC) is a qualitative
tool used in this study to identify the types and nature of risks and hazards present on
assembly line and their frequency and severity was assessed through a 4x4 risk
matrix.
3.0 RESULTS AND DISCUSSION
As for document review is concerned, because there was no written document
provided and only source is the figure 1.1which shows AGTL’s safety policy, it is
clear that the only priority is product safety and there is very minimal focus on
worker’s health and safety. Only facility being provided is firs aid and medical
allowance which is part of their job contracts. Furthermore, the company is only
ISO9001:2000 certified which is for product quality. Company has neither OSH
certification nor it has proper safety guidelines.
From the analysis of HIRARC, it is evident that the company is not complying with
any safety standards. Company has no set policy for health and safety and lack a safe
system of work. There are numerous hazards and risks being posed to workers and no
proper supervision is provided. Frequent hazards and risk at assembly line are shown
in table 1.
Analyses of the interviews indicated clearly the company are lacking a proper
safety policy and has no safety department. Company just provides basic health
facility and has no safe working system in place. Workers on the other hand are least
bothered about their workplace safety and health. They are uneducated and have no
safety training and orientation. Their attitude towards safety is a barrier in developing
and implementing safety policy. Even though company has a safety committee but
that committee is more to product safety and has little contribution towards workers’
Proceedings of the 2nd
Master Project Symposium
181
health and safety. There is no safety training program being offered by the company
to workers. In given situation, workers’ health and safety is being compromised.
Table 1: Frequent Hazards and Risks at AGTL Assembly Line
4.0 CONCLUSION
This paper provides an inclusive review on lack of safety measures and safety
standards on assembly line at Al-Ghazi Tractors Limited. The results from interviews
and HIRARC, indicate the lack of intent from top management as well as workers and
non-compliance of international safety regulations. No document article was available
to be reviewed. HIRARC indicates category V of risks present on assembly line,
which are results of non-compliance to international safety standards. HIRARC also
identified major significant hazards with high severity as well as pointed out
applicable OSH Regulations and Legal implications. OHSAS18001:2000 Standards to
be implemented and OHSAS18001:2007 Certification is required. Workers’ attitude
and behaviour is also a big barrier. Zero tolerance policy towards safety is required.
Provision of proper PPEs should be mandatory for safe working practices. Periodic
and continuous counselling and education of workers is also required. Safety Training
of workers is highly recommended.
ACKNOWLEDGEMENTS
The authors would like to express the greatest appreciation and utmost gratitude to
Al-Ghazi Tractors Limited, Pakistan and UTM Razak School of Engineering &
Advanced Technology and Universiti Teknologi Malaysia (UTM) for all support
given in making the study a success.
Hazards Risks & Consequences
Cutting and Grinding Machines Cuts, bruises, amputation
Drill machines Deep cuts, electrocution
Unguarded Machines Amputation, cuts, permanent injuries
Paint thinner, fumes Skin diseases, respiratory disorders
Noise Hearing impairment
Lubricant and oil splashes Skin diseases, eye diseases
Electric wires on floor Electrocution, trips and falls
Falling objects Permanent injuries, fatality

Proceedings of the 2nd
Master Project Symposium
182
REFERENCES
Chinniah, Yuvin. "Analysis and prevention of serious and fatal accidents related to
moving parts of machinery." Safety science 75 (2015): 163-173.
Naderpour, M., Lu, J., & Zhang, G. (2014). An intelligent situation awareness support
system for safety-critical environments. Decision Support Systems, 59, 325-
340.
Naderpour, Mohsen, Jie Lu, and Guangquan Zhang. "A safety-critical decision
support system evaluation using situation awareness and workload
measures." Reliability Engineering & System Safety 150 (2016): 147-159.
Proceedings of the 2nd
Master Project Symposium
183
Level of Workers Awareness on the Globally
Harmonized System of Labelling and SDS at
Workplace
Zuriana Zainal a
and Shamsul Sarip b
UTM Razak School of Engineering and Advanced Technology, Universiti Teknologi
Malaysia, Jalan Sultan Yahya Petra, 54100 Kuala Lumpur, Malaysia [email protected],
Abstract - Chemical labelling and Safety Data Sheets (SDS) has been used around the
world, but there may have a significant difference between each country although the
hazard classification is similar. A system, known as the Global Harmonized System
(GHS) aimed to harmonize Classification, SDS and Labelling of Chemicals has been
introduced and endorsed by the United Nations Economic and Social Council
(ECOSOC). The objective of this study was to explore the awareness of employers,
contractors and workers toward the changes of GHS label and SDS format. A
questionnaire survey had been carried out in chemical plant for one hundred (n=100)
workers and factors that influence the awareness will be analysed using SPSS 23.
Most of the respondents somewhat aware with the adoption of the GHS SDS and label
format even though have never been trained on the system. The outcome of the studies
will be a good benchmark in developing training manual in the workplace.
Keywords: Label, SDS, GHS, Awareness, Training.
1.0 INTRODUCTION
Chemical manufacturing companies are growing rapidly all over the world.
Each company has producing various type of chemicals. Chemicals that need to be
shipped out to distributor, supplier and users need to be labelled and to have Safety
Data sheet. Formerly, different country has a different design of pictogram used in the
label and different format of MSDS even though the hazard classification is similar.
Nowadays, chemicals can be very beneficial in life for people and
environment, but beside the benefits of these products, there is also potential for
adverse effects to health. As a result, in a way to convey the information through
labels or safety data sheets (SDS) most of countries and organizations have
established their own standard and regulation. There are various type of chemicals
available, harmonization and standardization of regulation is required. Protective
measures which will be implemented according to those who use substances with the
establishment of chemical hazard information systems (Nation, 2011).
Proceedings of the 2nd
Master Project Symposium
184
Currently, OSHA (US) still not adopted the Globally Harmonized System as a
part of the regulation, even though it will have significant impact on the format of
Safety Data Sheet and labelling that will be used in trading and marketing
(Boelhouwer, 2009).
Globally Harmonized System for classification and labelling of chemicals is a
universally established system substances or the mixtures as physical, health and
environmental hazard. GHS is not only focusing on protecting human health and
environment but also will aid in promoting the chemical trade (Mohktar and Murad,
2010). Malaysia is among highest manufactures and exports chemical products after
electrical and electronic products.
In Malaysia, GHS implementation quite challenging especially on knowledge of
classification of chemicals such as mixture. This is due to in Malaysia there are very
limited number of expertise in toxicologist, industrial hygienist and occupational
health practitioner. The hazard classification in the GHS is highly technical and
required certain background and expertise to understand it accurately (Morita and
Morikawa, 2011).
Department of Safety and Health (DOSH) has adopted GHS via Classification,
Packaging and Safety Data Sheet Regulations 2013(CLASS 2013). It was issued in
October 2013 which had replaced the Occupational Safety and Health (Classification,
Packaging and Labelling of hazardous chemicals) Regulations 1997. Apart from
Classification, labelling and Safety Data Sheet Regulation 2013, Industry Code of
Practice on Chemicals Classification and Hazard Communication (ICOP) issued on
16 April 2014 had been established as a guidance document for classification, label
and SDS system for all industries in Malaysia. One year grace period has been given
to industry to comply with CLASS Regulations 2013 and ICOP since it was
published. Chemical manufacturers, importers, formulators, and distributors require to
classify, label and package chemicals, and compile safety data sheets according to the
Industry Code of Practice (ICOP) which is aligned with UN GHS.
GHS label and SDS adoption may cause four significant changes that will be
standardized which, signal word, hazard statement, pictograms and changes from
Material Safety Data sheet (MSDS) to Safety data sheet (SDS) (Campoverde and
Lamberts, 2014).
The goal of this study is to evaluate the level of workers awareness on the adoption of
GHS on the label and SDS format in chemical plant. This paper will present the
finding of the survey conducted at chemical plant in Kerteh to evaluate the worker’s
awareness on the SDS and label format changes due to adoption of Globally
Harmonize system.
Proceedings of the 2nd
Master Project Symposium
185
2.0 METHODOLOGY
2.1 Subject and study sites
This cross sectional study was conducted at chemical plant located in Kerteh between
month of November and December 2016. In this study, staff selected from various
department while for contractors the selection were based on their nature of work in
plant. The questionnaire has been distributed to the workers and researcher assisted
the participants by explaining the objective of the study to the respondents. The
respondents were given 10 minutes to complete the questionnaire. Two samples of
SDS and label were selected to evaluate the company commitment toward the
adoption GHS format of labelling and SDS.
2.2 Survey instrument
A pilot questionnaire entitled ‘‘Study on workers awareness on the Globally
Harmonize system on Label and SDS in workplace” was conducted in October 2016
involving plant staff, and HSE practitioner from other industries for reviewing.
Comments from five experts were received, and the questionnaire was modified
subsequently.
The questionnaire is designed to be a multi-choice question except for workers
experience and company commitment, Likert-type scale will be used with five
ratings: Extremely aware, Moderately aware, somewhat aware, slightly aware and not
at all aware. For section B, there are four Yes/No question in order to identify the
respondent understanding on GHS. Total 39 questions will be asked in the
questionnaire.
The data’s gathered from the questionnaire such as company scale, age, year of
experience, education levels and awareness of SDS and label were analyze using
SPSS 23 for Windows 13.0. The reliability of the questionnaire was analyzed through
the Cronbach’s alpha coefficient. Chi-square test was used to examine the relationship
between education background and level of awareness of adoption of GHS Label and
SDS.
3.0 RESULTS AND DISCUSSION
3.1 Reliability test
Table 1 presented the reliability study for the tested questionnaire. This value is
accepted for reliability testing. The α-Cronbach’s coefficient need to be more than 0.7
to have a good acceptably in study.
Table 1: Reliability Test
Questionnaire Number of items Cronbach’s Alpha
Adoption of GHS Label and SDS system
at workplace
26 0.958
Proceedings of the 2nd
Master Project Symposium
186
3.2 General information of respondent
One hundred (n=100) respondents had been selected to participate in this study.
Table 2 illustrated the results obtained from data background of the workers in this
study. The respondents comprised of 84% of male and 16% of female. Most of
participants work in the oil and gas industries and has a vast experience on handling
chemicals. For this study, the data collection involved of 64 staffs, 33 in-house
contractor and 3 from other expertise. Most of the respondents have a different
educational background, 13 % of the respondents only received education up to
certification, 32% received education in diploma level, 26 % received education in
bachelor degree and only 2 % received education up to master degrees. Respondent
age is between 20 and 59 year old.
Table 2: Demographic data of the population.
Aspect Descriptive Percentage
(%)
Gender Male
Female
84
16
Age distribution
Education level
Company scale
Working experience
>20
20 – 30
30 – 40
40 -50
50 – 59
Master degree
Bachelor Degree
Diploma
Certificates
Higher education level
Others
Staff
Contractor (in-house)
Others
< 1 year
> 1 years
5 - 10 years
11-15 years
>15 years
1
42
38
16
4
2
26
32
13
20
5
64
33
3
6
30
35
18
11
3.3 Adoption of GHS at Workplace
3.3.1 Management commitment
During the survey two sets of SDS documents and product label were selected. It
shows that SDS created was fully adopted GHS format. The SDS selection has 16
elements while the label has six standard elements. It shows that the company have
fully adopt the GHS system in the workplace whereby all SDS and label had followed
the format of GHS.
Based on the survey data, in average 58% of respondent somewhat aware on the
changes done by the management of GHS label and SDS. Figure 1 illustrated the
response of the respondents on the company commitment on adoption GHS SDS and
label. Almost 64% respondents indicate that the management contacting the
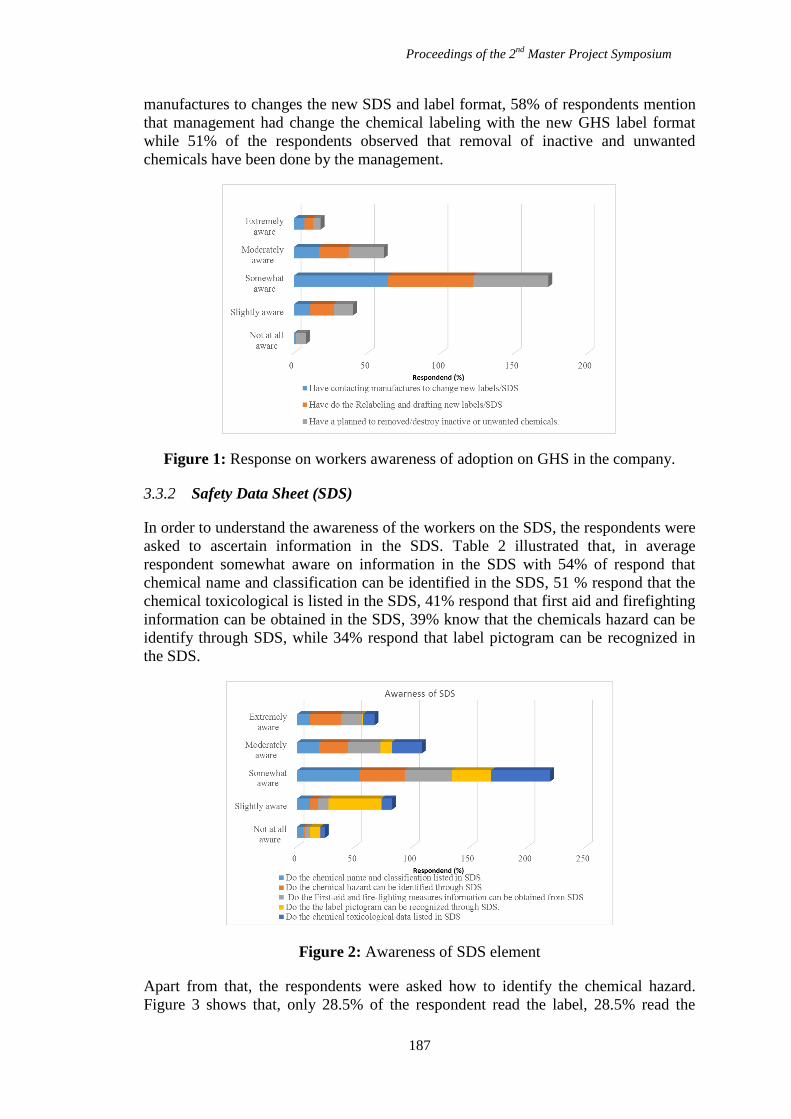
Proceedings of the 2nd
Master Project Symposium
187
manufactures to changes the new SDS and label format, 58% of respondents mention
that management had change the chemical labeling with the new GHS label format
while 51% of the respondents observed that removal of inactive and unwanted
chemicals have been done by the management.
Figure 1: Response on workers awareness of adoption on GHS in the company.
3.3.2 Safety Data Sheet (SDS)
In order to understand the awareness of the workers on the SDS, the respondents were
asked to ascertain information in the SDS. Table 2 illustrated that, in average
respondent somewhat aware on information in the SDS with 54% of respond that
chemical name and classification can be identified in the SDS, 51 % respond that the
chemical toxicological is listed in the SDS, 41% respond that first aid and firefighting
information can be obtained in the SDS, 39% know that the chemicals hazard can be
identify through SDS, while 34% respond that label pictogram can be recognized in
the SDS.
Figure 2: Awareness of SDS element
Apart from that, the respondents were asked how to identify the chemical hazard.
Figure 3 shows that, only 28.5% of the respondent read the label, 28.5% read the
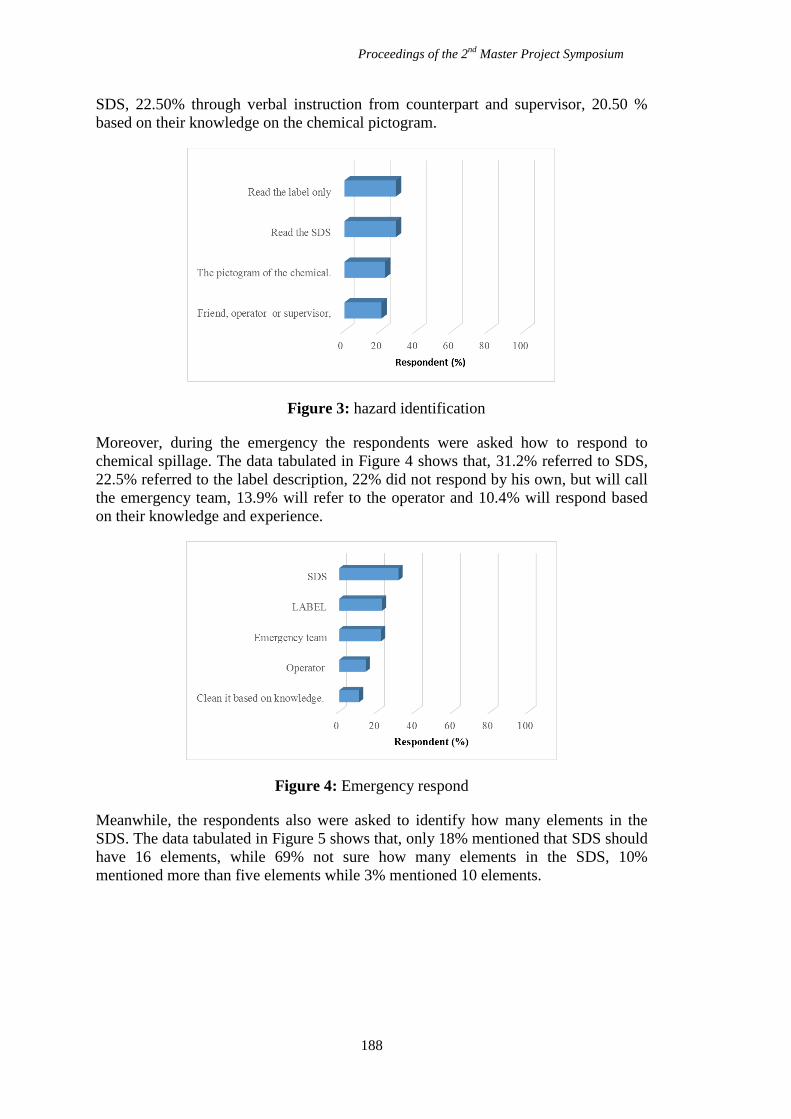
Proceedings of the 2nd
Master Project Symposium
188
SDS, 22.50% through verbal instruction from counterpart and supervisor, 20.50 %
based on their knowledge on the chemical pictogram.
Figure 3: hazard identification
Moreover, during the emergency the respondents were asked how to respond to
chemical spillage. The data tabulated in Figure 4 shows that, 31.2% referred to SDS,
22.5% referred to the label description, 22% did not respond by his own, but will call
the emergency team, 13.9% will refer to the operator and 10.4% will respond based
on their knowledge and experience.
Figure 4: Emergency respond
Meanwhile, the respondents also were asked to identify how many elements in the
SDS. The data tabulated in Figure 5 shows that, only 18% mentioned that SDS should
have 16 elements, while 69% not sure how many elements in the SDS, 10%
mentioned more than five elements while 3% mentioned 10 elements.
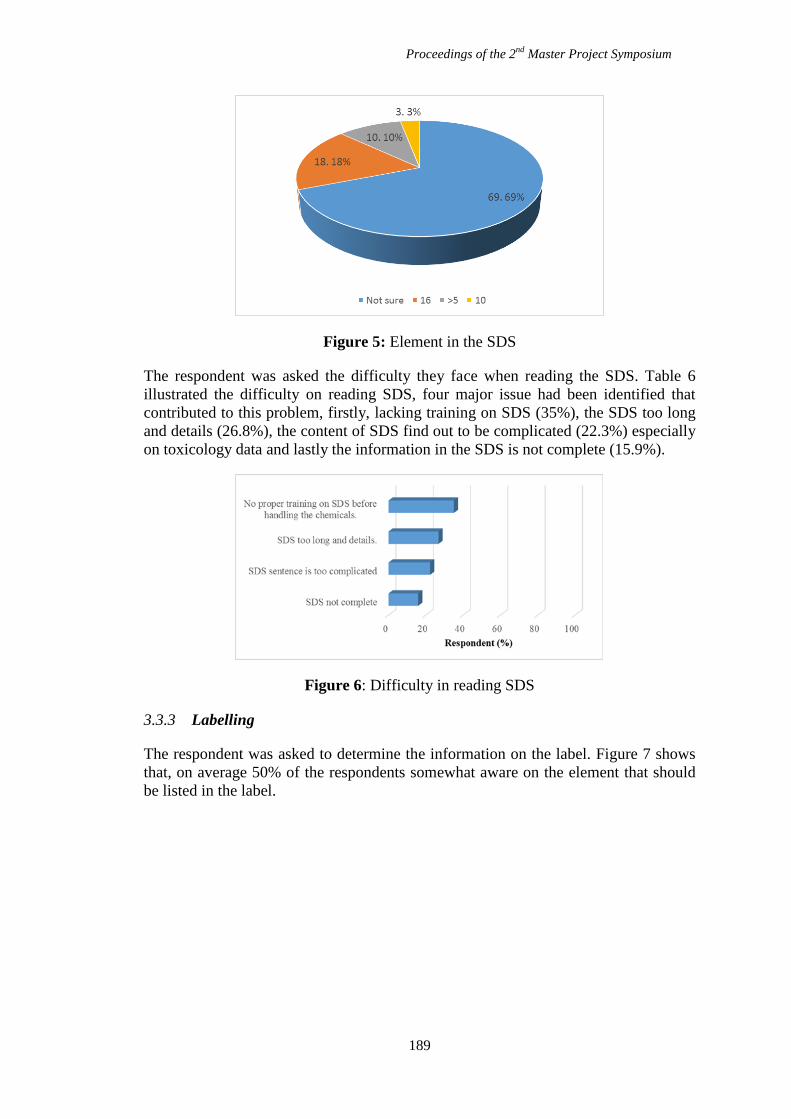
Proceedings of the 2nd
Master Project Symposium
189
Figure 5: Element in the SDS
The respondent was asked the difficulty they face when reading the SDS. Table 6
illustrated the difficulty on reading SDS, four major issue had been identified that
contributed to this problem, firstly, lacking training on SDS (35%), the SDS too long
and details (26.8%), the content of SDS find out to be complicated (22.3%) especially
on toxicology data and lastly the information in the SDS is not complete (15.9%).
Figure 6: Difficulty in reading SDS
3.3.3 Labelling
The respondent was asked to determine the information on the label. Figure 7 shows
that, on average 50% of the respondents somewhat aware on the element that should
be listed in the label.
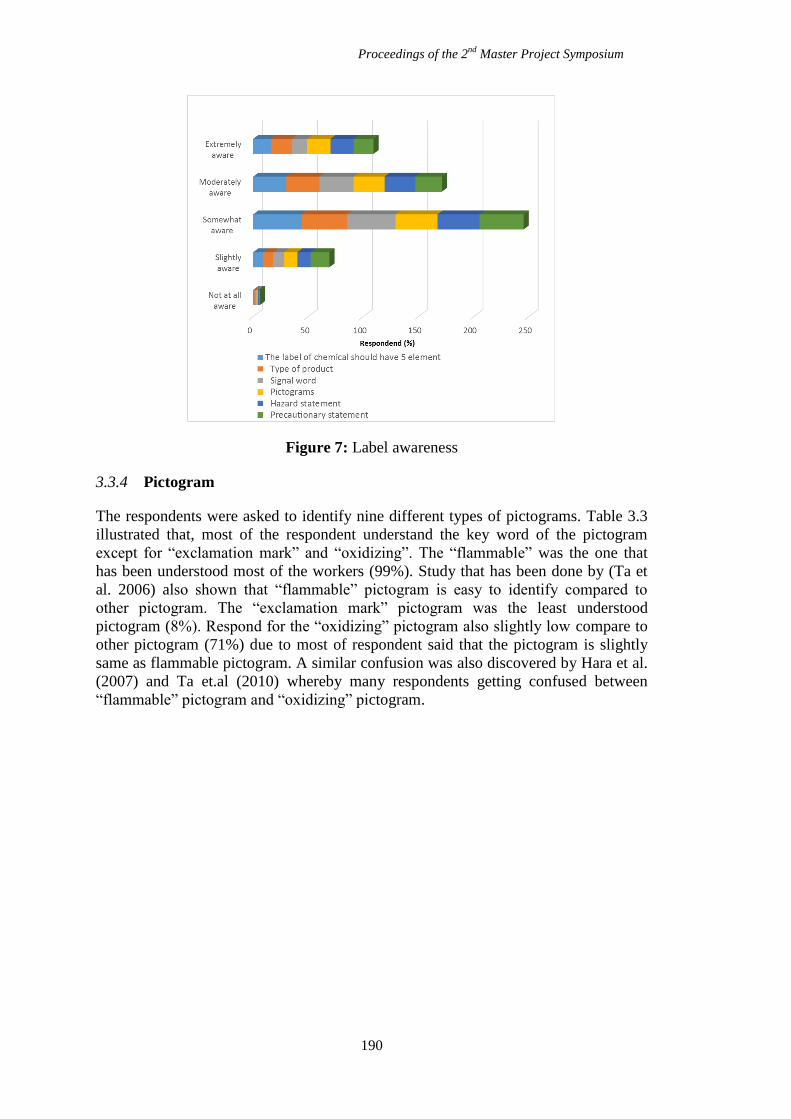
Proceedings of the 2nd
Master Project Symposium
190
Figure 7: Label awareness
3.3.4 Pictogram
The respondents were asked to identify nine different types of pictograms. Table 3.3
illustrated that, most of the respondent understand the key word of the pictogram
except for “exclamation mark” and “oxidizing”. The “flammable” was the one that
has been understood most of the workers (99%). Study that has been done by (Ta et
al. 2006) also shown that “flammable” pictogram is easy to identify compared to
other pictogram. The “exclamation mark” pictogram was the least understood
pictogram (8%). Respond for the “oxidizing” pictogram also slightly low compare to
other pictogram (71%) due to most of respondent said that the pictogram is slightly
same as flammable pictogram. A similar confusion was also discovered by Hara et al.
(2007) and Ta et.al (2010) whereby many respondents getting confused between
“flammable” pictogram and “oxidizing” pictogram.
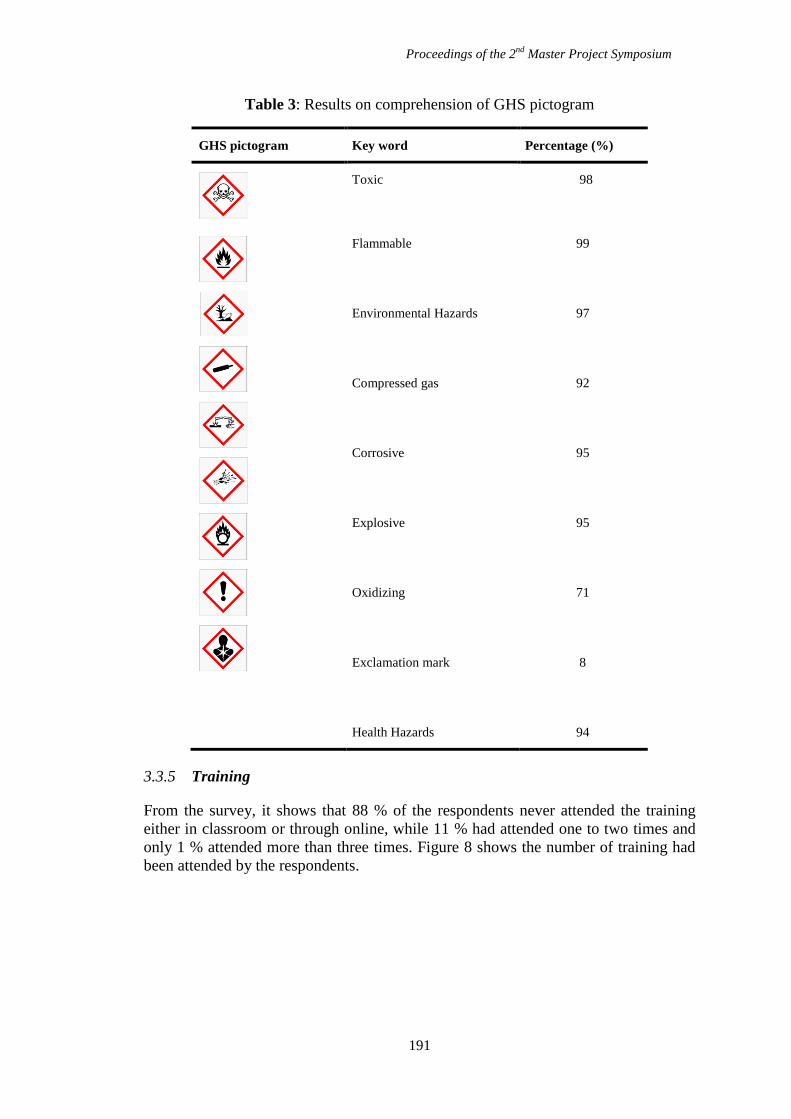
Proceedings of the 2nd
Master Project Symposium
191
Table 3: Results on comprehension of GHS pictogram
GHS pictogram Key word Percentage (%)
Toxic 98
Flammable
Environmental Hazards
Compressed gas
Corrosive
Explosive
Oxidizing
Exclamation mark
Health Hazards
99
97
92
95
95
71
8
94
3.3.5 Training
From the survey, it shows that 88 % of the respondents never attended the training
either in classroom or through online, while 11 % had attended one to two times and
only 1 % attended more than three times. Figure 8 shows the number of training had
been attended by the respondents.
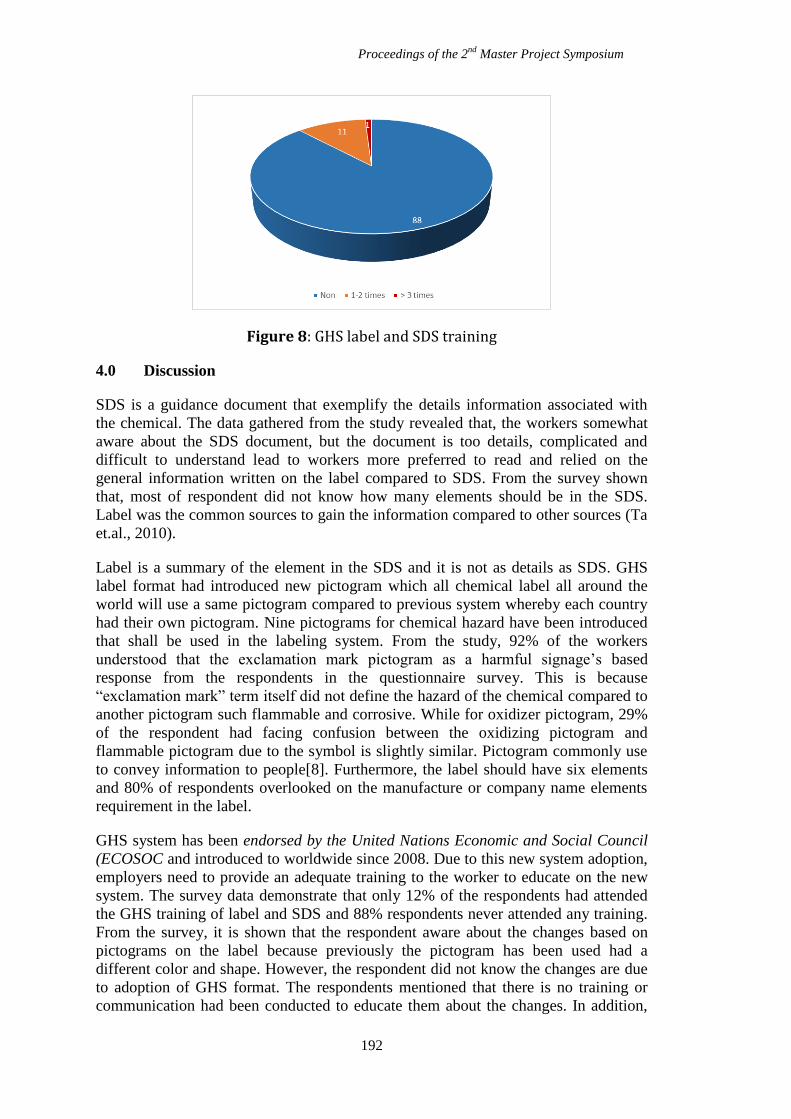
Proceedings of the 2nd
Master Project Symposium
192
Figure 8: GHS label and SDS training
4.0 Discussion
SDS is a guidance document that exemplify the details information associated with
the chemical. The data gathered from the study revealed that, the workers somewhat
aware about the SDS document, but the document is too details, complicated and
difficult to understand lead to workers more preferred to read and relied on the
general information written on the label compared to SDS. From the survey shown
that, most of respondent did not know how many elements should be in the SDS.
Label was the common sources to gain the information compared to other sources (Ta
et.al., 2010).
Label is a summary of the element in the SDS and it is not as details as SDS. GHS
label format had introduced new pictogram which all chemical label all around the
world will use a same pictogram compared to previous system whereby each country
had their own pictogram. Nine pictograms for chemical hazard have been introduced
that shall be used in the labeling system. From the study, 92% of the workers
understood that the exclamation mark pictogram as a harmful signage’s based
response from the respondents in the questionnaire survey. This is because
“exclamation mark” term itself did not define the hazard of the chemical compared to
another pictogram such flammable and corrosive. While for oxidizer pictogram, 29%
of the respondent had facing confusion between the oxidizing pictogram and
flammable pictogram due to the symbol is slightly similar. Pictogram commonly use
to convey information to people[8]. Furthermore, the label should have six elements
and 80% of respondents overlooked on the manufacture or company name elements
requirement in the label.
GHS system has been endorsed by the United Nations Economic and Social Council
(ECOSOC and introduced to worldwide since 2008. Due to this new system adoption,
employers need to provide an adequate training to the worker to educate on the new
system. The survey data demonstrate that only 12% of the respondents had attended
the GHS training of label and SDS and 88% respondents never attended any training.
From the survey, it is shown that the respondent aware about the changes based on
pictograms on the label because previously the pictogram has been used had a
different color and shape. However, the respondent did not know the changes are due
to adoption of GHS format. The respondents mentioned that there is no training or
communication had been conducted to educate them about the changes. In addition,
Proceedings of the 2nd
Master Project Symposium
193
the company has just in operated for two years and most of the chemical purchases
will use GHS labels and SDS format. Almost 90% of respondents agreed by attending
training it will enhance their knowledge on the new GHS Label and SDS format.
SDS and label training will educate the respondent on how to identify the chemical
hazard, proper handling of chemical, first aid responds, chemical toxicological,
transportation’s and emergency respond during incident and accident involve of
chemicals. Each chemical has a different hazard and method of response during
emergency. For instance, in case there is an accident involve of major chemical
spillages, the workers need to know which section in SDS need to be referred so that
it will ease the workers to identify type material to be used to clean up the spillage
and to dispose the chemical in proper way. A study done by Phillips (1999) revealed
that workers had read the SDS after been trained. As such, it was suggested to
develop a training manual which will help overcome these obstacles of understanding
and awareness among the workers.
According to Dalvie et al. (2014) training need to be developed to ensure the users
recognize the items that not really remember or comprehend, but it is important to
understand. Training can be divided into two categories, which is formal and informal
training. For this study, it was suggested to develop the SDS and label guideline in
order to guide the workers to comprehend the element in SDS and label. The
guideline which will be focused on the sixteen elements listed in SDS and each
section will discuss in detail. While for formal training it was suggested to develop a
learning module.
5.0 CONCLUSION
The study found out that the awareness of respondent towards GHS SDS and label is
still moderate. Even though, most of the respondent never attended any GHS label &
SDS training but still somewhat aware on the changes. From the results, it was
suggested to develop a training manual to equip the workers on the GHS SDS and
label system.
REFERENCES
Nation, U., Globally harmonized system of classification and labelling of chemicals.:
New York. United Nation, 2011.
Boelhouwer, E.J., A.K. Piper, and J. Davis. The Use of Hazard and Precautionary
Symbols on GHS Safety Data Sheets. in Proceedings of the Human Factors
and Ergonomics Society Annual Meeting. 2009. Sage Publications.
Mokhtar, M.B., G.C. Ta, and M.W. Murad, An essential step for environmental
protection: Towards a sound chemical management system in Malaysia.
Journal of Chemical Health and Safety, 2010. 17(5): p. 13-20.
Morita, T. and K. Morikawa, Expert review for GHS classification of chemicals on
health effects. Industrial health, 2011. 49(5): p. 559-565.
E.V.Campoverde, H.M., M.Lamberts, How do the Hazard Communication Standard
(HCS) and the globally Harmonized system (GHS) apply to your client.
Floride State Horticultural society, 2014. Proc.Fla.State
Hort.Soc.127:2014(2014): p. 174-176.
Ta, G.C., et al., Analysis of the comprehensibility of chemical hazard communication
tools at the industrial workplace. Industrial health, 2010. 48(6): p. 835-844.
Proceedings of the 2nd
Master Project Symposium
194
Hara, K., et al., Results of recognition tests on Japanese subjects of the labels
presently used in Japan and the UN-GHS labels. Journal of occupational
health, 2007. 49(4): p. 260-267.
Boelhouwer, E., et al., Comprehension of hazard communication: Effects of
pictograms on safety data sheets and labels. Journal of safety research, 2013.
46: p. 145-155.
Phillips, C.C., et al., The efficacy of material safety data sheets and worker
acceptability. Journal of safety research, 1999. 30(2): p. 113-122.
Dalvie, M.A., H.-A. Rother, and L. London, Chemical hazard communication
comprehensibility in South Africa: Safety implications for the adoption of the
globally harmonised system of classification and labelling of chemicals.
Safety science, 2014. 61: p. 51-58.
Proceedings of the 2nd
Master Project Symposium
195
Heat Exposure Assessment among Technicians
in Machinery Room onboard 24th Corvette
Laksamana Class Warship
Ahmad Tarmidzi Mohd Ideris a
and Siti Armiza Mohd Arisb
UTM Razak School of Engineering and Advanced Technology,UniversitiTeknologi
Malaysia, Kuala Lumpur, Malaysia [email protected],
Abstract – Some warship compartments are undoubtedly considered severe hot
environment due to high-temperature values produced by rotating machinery.
Besides, it also depended on the external conditions such as weather and design of the
warship, which contributes to high-temperature in specific compartments. Such
inconvenient situations which related to space, noise, vibration and poor air quality
inside the warship compartment further increase high prevalence risk to the
associated technicians. The technicians on board 24th Corvette, Laksamana Class
Warship are exposed to this high temperature especially in machinery room during
maintenance or rectification routine. This situation has increased the prevalence risk
of heat exposure which may cause heat stroke, dehydration, excessive fatigue, light-
headedness to convulsions and unconsciousness. Thus, this research is to examine the
awareness state among technicians regarding the heat exposure they faced in
machinery room during the daily routine and to propose an action plan to increase
awareness state among technicians regarding heat exposure in the workplace. The
variables that have been chosen in the study were knowledge awareness, personal
influences, environmental influences, interpersonal influences and management
influences. The statistical analysis technique was applied in the study by using The
Pearson-correlation coefficient, and the result shows that the environmental impacts
and management authorities have a significant positive relationship with awareness
state among technicians. Therefore, Royal Malaysian Navy (RMN) should consider a
guideline for improvements.
Keywords: Ship Compartment, Machineries, Heat Exposure, Prevalence Risk, Awareness State.
1.0 INTRODUCTION
Warship spaces contain environments of high heat and low humidity, including
engineering spaces, galleys, sculleries, laundries, and weather decks in hot climates
especially during flight deck operations, exercises and drills. Sustained high
temperatures leading to heat stress conditions can lower work performance and
morale and impair mental alertness, increasing the risk of workplace accidents, and
ultimately compromising the readiness of the ship. Severe heat stress can lead to heat-
related illnesses, disabilities, and even death.
Proceedings of the 2nd
Master Project Symposium
196
Unlike internal living and service areas which can be easily equipped with air-
conditioning systems and decks which affected only by the external climate, thermo-
hygrometric conditions in machinery room are affected by the external climate, the
ventilation and the heat given off by the rotating and heat produced components such
as heat exchangers, pipes, cooling, and fuel pre-heaters, pumps, motors, compressor
and etcetera through convection and radiation. This occurrence results in increasing
air temperature values from 10°C to 30°C higher than the external temperature.
Consequently, the thermo-hygrometric conditions in the machinery room can be
extremely dangerous towards maintenance personnel.
Even in the recent past, several surveys which have been devoted to the
characterization of working conditions onboard ships have shown that the engine
crew suffer the highest overall levels of stress followed by the deck and engine
officers especially because of the higher levels of heat stress. Moreover, although it is
widely accepted that the machinery room is a very hazardous environment, the
interest of researchers in the field has been mainly focused on the identification of the
main risk factors to be taken into account at the design and management level rather
than on systematic studies devoted to the thermo-hygrometric characterization of such
special work environments.
2.0 METHODOLOGY
2.1 Materials and Method
This study uses a quantitative method where the questions were prepared
constructively, to gather awareness among technicians regarding heat exposure.
Technicians who participated in this study worked in machinery room daily. Through
the survey, the questions reflected the awareness state of technicians regarding heat
exposure by knowledge awareness, personal influences, environmental influences,
interpersonal influences and management influences. The quantitative method was
chosen to collect data due to its flexibility to obtain results regardless of differences in
demographics background.
2.1.1 Population and Sample
The focus population in the study were the technicians who worked onboard the
Laksamana Class Warship. The sample size was taken using Krejcie and Morgan
Table, which involves 60 technicians. The questionnaires were distributed to all
targeted respondents that work inside the machinery room daily. Before the primary
survey started, a pilot test survey was conducted among 10 of the sample population.
The questionnaires were edited according to the comments for easy understanding by
the respondents.
2.1.2 Survey
A structured questionnaire was developed based on the pilot test survey outcome. The
questionnaire was divided into six sections based on the awareness state of heat
exposure among technicians. The questions included the demographic factors such as
age, rank and years of service in the RMN, marital status and academic qualification
followed by five influences factors that contribute to the awareness state. The
influences factors that were analysed included the knowledge awareness, personal
influences, environmental influences, interpersonal influences and management
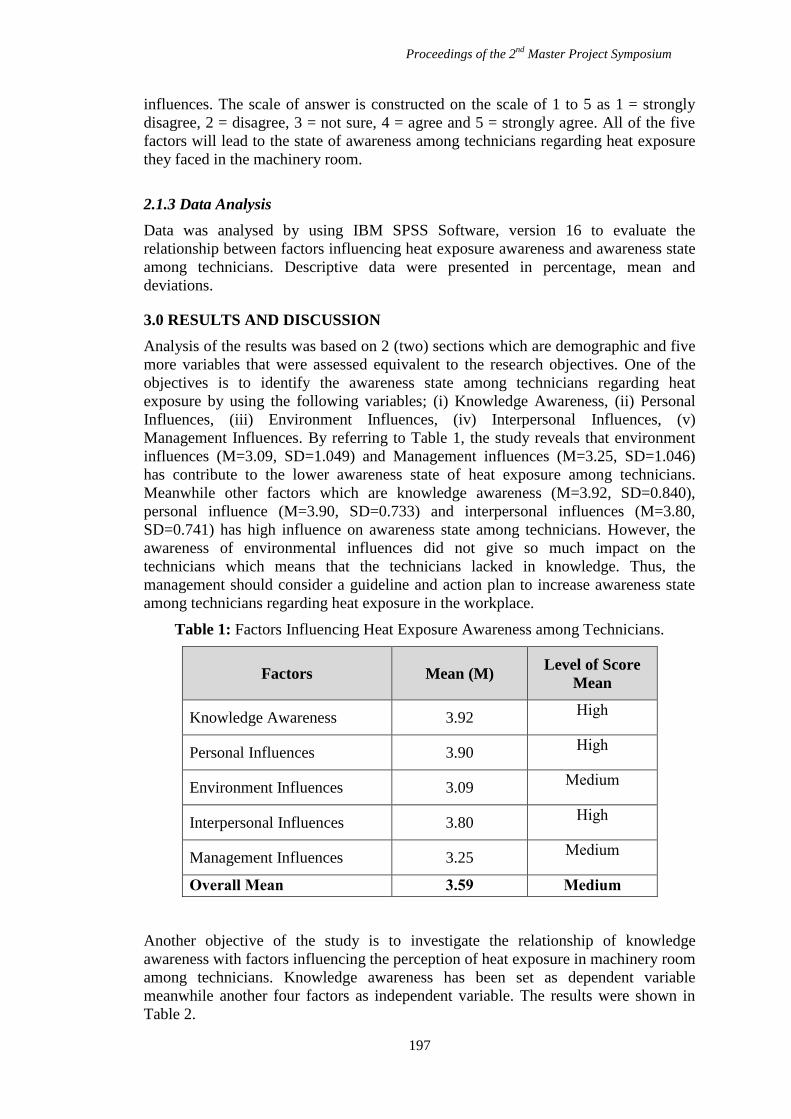
Proceedings of the 2nd
Master Project Symposium
197
influences. The scale of answer is constructed on the scale of 1 to 5 as 1 = strongly
disagree, 2 = disagree, 3 = not sure, 4 = agree and 5 = strongly agree. All of the five
factors will lead to the state of awareness among technicians regarding heat exposure
they faced in the machinery room.
2.1.3 Data Analysis
Data was analysed by using IBM SPSS Software, version 16 to evaluate the
relationship between factors influencing heat exposure awareness and awareness state
among technicians. Descriptive data were presented in percentage, mean and
deviations.
3.0 RESULTS AND DISCUSSION
Analysis of the results was based on 2 (two) sections which are demographic and five
more variables that were assessed equivalent to the research objectives. One of the
objectives is to identify the awareness state among technicians regarding heat
exposure by using the following variables; (i) Knowledge Awareness, (ii) Personal
Influences, (iii) Environment Influences, (iv) Interpersonal Influences, (v)
Management Influences. By referring to Table 1, the study reveals that environment
influences (M=3.09, SD=1.049) and Management influences (M=3.25, SD=1.046)
has contribute to the lower awareness state of heat exposure among technicians.
Meanwhile other factors which are knowledge awareness (M=3.92, SD=0.840),
personal influence (M=3.90, SD=0.733) and interpersonal influences (M=3.80,
SD=0.741) has high influence on awareness state among technicians. However, the
awareness of environmental influences did not give so much impact on the
technicians which means that the technicians lacked in knowledge. Thus, the
management should consider a guideline and action plan to increase awareness state
among technicians regarding heat exposure in the workplace.
Table 1: Factors Influencing Heat Exposure Awareness among Technicians.
Factors Mean (M) Level of Score
Mean
Knowledge Awareness 3.92 High
Personal Influences 3.90 High
Environment Influences 3.09 Medium
Interpersonal Influences 3.80 High
Management Influences 3.25 Medium
Overall Mean 3.59 Medium
Another objective of the study is to investigate the relationship of knowledge
awareness with factors influencing the perception of heat exposure in machinery room
among technicians. Knowledge awareness has been set as dependent variable
meanwhile another four factors as independent variable. The results were shown in
Table 2.
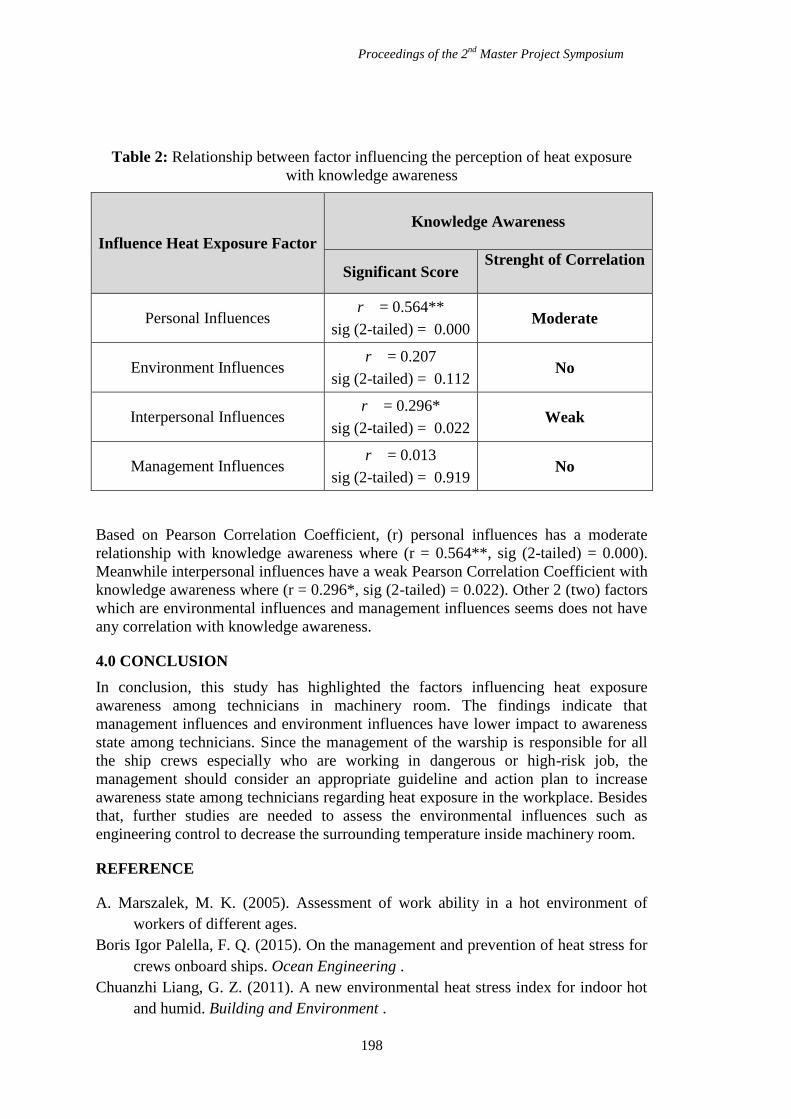
Proceedings of the 2nd
Master Project Symposium
198
Table 2: Relationship between factor influencing the perception of heat exposure
with knowledge awareness
Influence Heat Exposure Factor
Knowledge Awareness
Significant Score Strenght of Correlation
Personal Influences r = 0.564**
sig (2-tailed) = 0.000 Moderate
Environment Influences r = 0.207
sig (2-tailed) = 0.112 No
Interpersonal Influences r = 0.296*
sig (2-tailed) = 0.022 Weak
Management Influences r = 0.013
sig (2-tailed) = 0.919 No
Based on Pearson Correlation Coefficient, (r) personal influences has a moderate
relationship with knowledge awareness where (r = 0.564**, sig (2-tailed) = 0.000).
Meanwhile interpersonal influences have a weak Pearson Correlation Coefficient with
knowledge awareness where (r = 0.296*, sig (2-tailed) = 0.022). Other 2 (two) factors
which are environmental influences and management influences seems does not have
any correlation with knowledge awareness.
4.0 CONCLUSION
In conclusion, this study has highlighted the factors influencing heat exposure
awareness among technicians in machinery room. The findings indicate that
management influences and environment influences have lower impact to awareness
state among technicians. Since the management of the warship is responsible for all
the ship crews especially who are working in dangerous or high-risk job, the
management should consider an appropriate guideline and action plan to increase
awareness state among technicians regarding heat exposure in the workplace. Besides
that, further studies are needed to assess the environmental influences such as
engineering control to decrease the surrounding temperature inside machinery room.
REFERENCE
A. Marszalek, M. K. (2005). Assessment of work ability in a hot environment of
workers of different ages.
Boris Igor Palella, F. Q. (2015). On the management and prevention of heat stress for
crews onboard ships. Ocean Engineering .
Chuanzhi Liang, G. Z. (2011). A new environmental heat stress index for indoor hot
and humid. Building and Environment .
Proceedings of the 2nd
Master Project Symposium
199
Dandan Shen, N. Z. (2015). Influence of the temperature and Relative humidity on
human heat acclimatization during training in extremely hot environments.
Building and Environment .
E.K. O’Neal, P. B. (2010). Effects of work in a hot environment on repeated
performances of multiple types of simple mental tasks. International Journal of
Industrial Ergonomics .
HORIE, S. (2013). Prevention of Heat Stress Disorders in the Workplace.
Proceedings of the 2nd
Master Project Symposium
200
Safety Awareness and Practices among
XYZSB Workers towards Occupational Safety
and Health
Muhammad Faiz Md Haled,a
and Wan Normeza Wan Zakaria,b
UTM Razak School of Engineering and Advance Technology, UniversitiTeknolgi
Malaysia, JalanSultaYahya Petra, 54100 Kuala Lumpur, Malaysia
Abstract - This study is to identify the safety awareness among workers at the
construction site for underground cable installation job. This issue was raised due to
accidents that happened at the site. Accidents at workplace had caused company’s
expenses increase and affect its reputation. After identified the level of awareness
based on worker’s perception and officer observation, the next step is to improve the
safety awareness at construction site. Methodology used to collect the data is using
questionnaire to 55 total respondents (workers) and 1 respondent (officer). The
questionnaire pertaining about demographic, PPE, working training, safety
instruction, working manual and tool box.
Keywords: Safety, OSH, Accident
1.0 INTRODUCTION
Nowadays telecommunication has become an essential to everybody. Every aspect of
telecommunication is needed to keep people stay connected. Besides that,
telecommunication is a root for a company to keep operating. This all prove that
telecommunication is very important in this modern day.
First before we can enjoy the telecommunication facility, it started with the first stage
which is cable installation. The first phase of telecommunication is installation of
cable from one point to other point. Recently most of the copper cable was changed to
fibre cable. By changing to fibre cable, telecommunication service has become faster
due to all data is transferred using light speed. The usage of fibre cable has proven to
be efficient than copper cable.
Underground cable installation is a main job that done by XYZSB. XYZSB is a
Malaysian company incorporated in 1987. It is a well-established, dynamic enterprise
with its activities in mechanical and electrical (M&E) and telecommunication
industries. The company’s main activity is underground telecommunication cable
installation, civil work for underground telecommunication cable installation, and
telecommunication cable termination.
Proceedings of the 2nd
Master Project Symposium
201
2.0 LITERATURE REVIEW
This chapter will provide the overview of literature that related to the problem stated
in previous chapter.
2.1 Level of Safety Awareness among Workers
Many research was done in order to measure the worker’s safety awareness and their
understanding towards safety in term of work procedure and usage of machinery at
workplace. Studied stated there are many perceptions indicating that accidents in
construction projects, which can range from minor injuries to loss of life, are
originated from workers’ unsafe acts (Hinze, J.W., Construction Safety. New Jersey
Prentice-Hall, Inc., 1997)
2.2 Company Contribution
Company plays important role to implement the safety and health in workplace.
cording to Reason, 1997, safety program should be initiated from top management of
an organization. The top management should formulate a policy indicating a
commitment to safety.Marsh et al. (1998) have shown that management commitment
was the most significant measure to determine and influence safety performance.
2.3 Safety Attitude among Workers
The result of accident is due to the workers itself on how their behaviour at
workplace. The term "attitude" is derived from the subjects of social sciences,
particularly in the field of social psychology or psychology in general. "Attitudes"
simply stated, are defined as "a tendency to react positively or negatively towards an
object or a person" (Sartain et al. 1974).
2.4 Training
M.N. Vinodkum ar*, M. Bhasib (2010), identifying Safety training as the most
important safety management practice that predicts safety knowledge, safety
motivation, safety compliance and safety participation.
Management need to provide training to avoid and eliminate accident and workplace
hazard, the contractors should establish and implement procedures for education and
training of their employees about OSH.
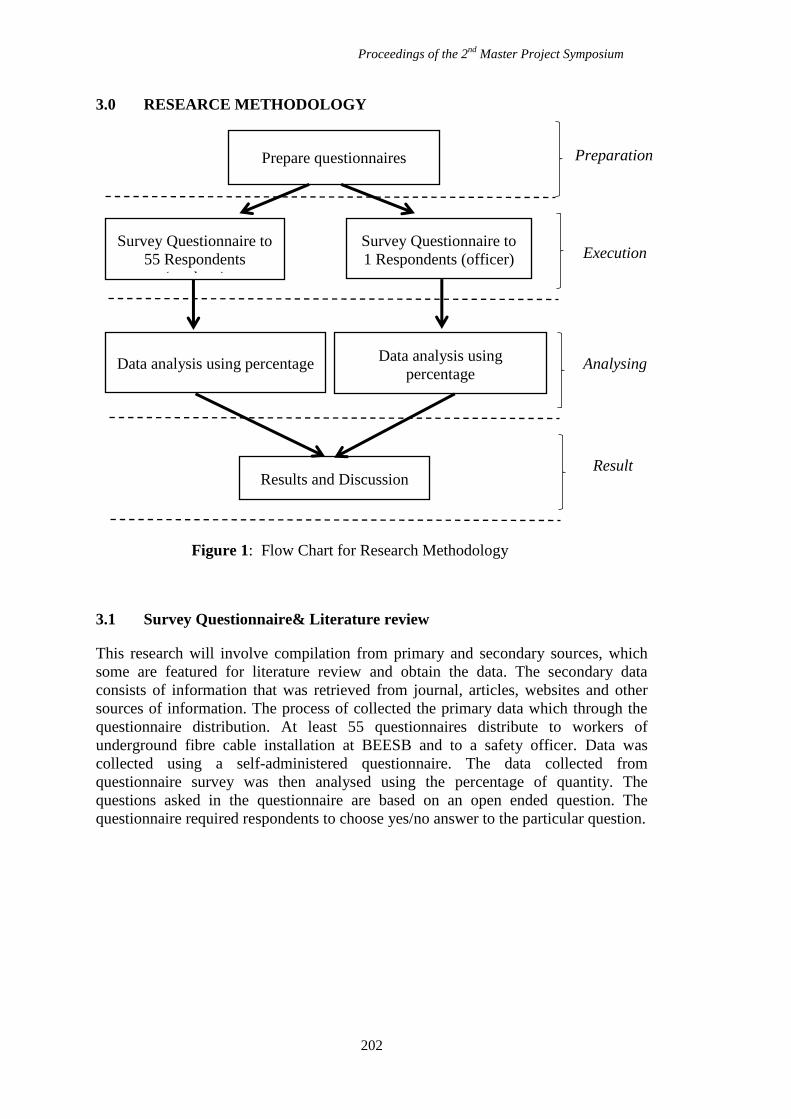
Proceedings of the 2nd
Master Project Symposium
202
3.0 RESEARCE METHODOLOGY
Figure 1: Flow Chart for Research Methodology
3.1 Survey Questionnaire& Literature review
This research will involve compilation from primary and secondary sources, which
some are featured for literature review and obtain the data. The secondary data
consists of information that was retrieved from journal, articles, websites and other
sources of information. The process of collected the primary data which through the
questionnaire distribution. At least 55 questionnaires distribute to workers of
underground fibre cable installation at BEESB and to a safety officer. Data was
collected using a self-administered questionnaire. The data collected from
questionnaire survey was then analysed using the percentage of quantity. The
questions asked in the questionnaire are based on an open ended question. The
questionnaire required respondents to choose yes/no answer to the particular question.
Prepare questionnaires
Survey Questionnaire to
55 Respondents
(workers)
Survey Questionnaire to
1 Respondents (officer)
Data analysis using percentage
Results and Discussion
Data analysis using
percentage
Preparation
Execution
Analysing
Result
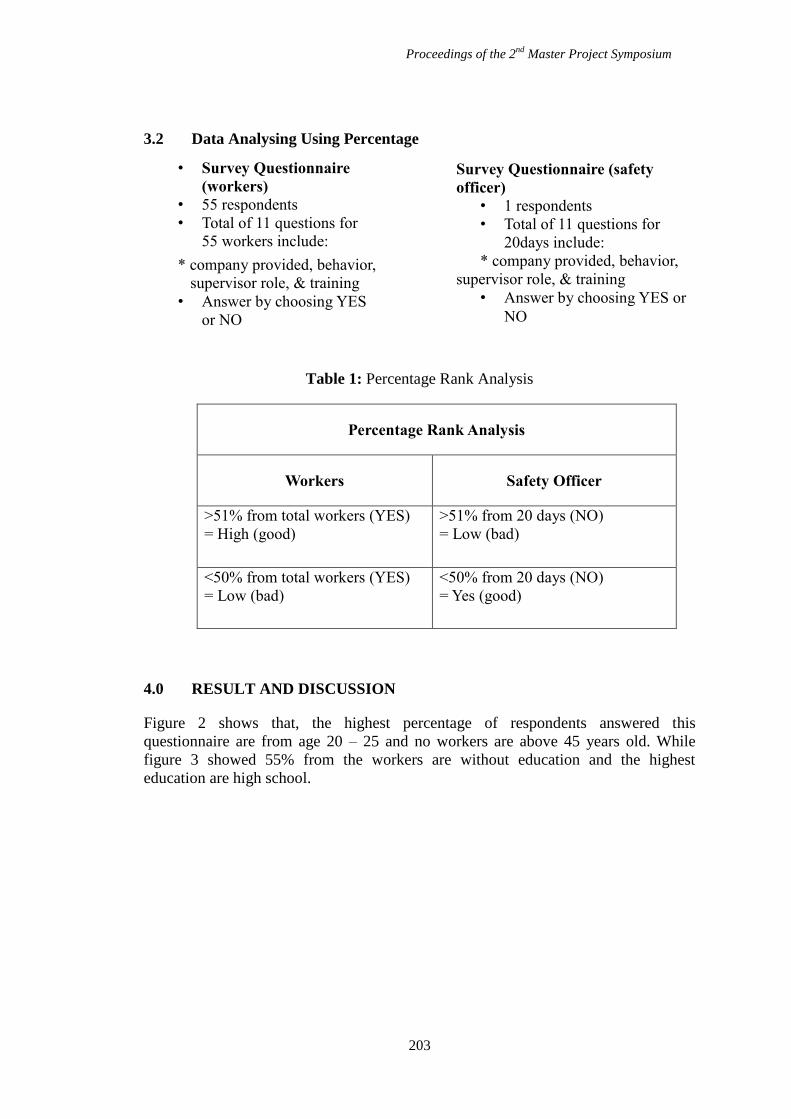
Proceedings of the 2nd
Master Project Symposium
203
3.2 Data Analysing Using Percentage
Table 1: Percentage Rank Analysis
Percentage Rank Analysis
Workers Safety Officer
>51% from total workers (YES)
= High (good)
>51% from 20 days (NO)
= Low (bad)
<50% from total workers (YES)
= Low (bad)
<50% from 20 days (NO)
= Yes (good)
4.0 RESULT AND DISCUSSION
Figure 2 shows that, the highest percentage of respondents answered this
questionnaire are from age 20 – 25 and no workers are above 45 years old. While
figure 3 showed 55% from the workers are without education and the highest
education are high school.
• Survey Questionnaire
(workers)
• 55 respondents
• Total of 11 questions for
55 workers include:
* company provided, behavior,
supervisor role, & training
• Answer by choosing YES
or NO
Survey Questionnaire (safety
officer)
• 1 respondents
• Total of 11 questions for
20days include:
* company provided, behavior,
supervisor role, & training
• Answer by choosing YES or
NO
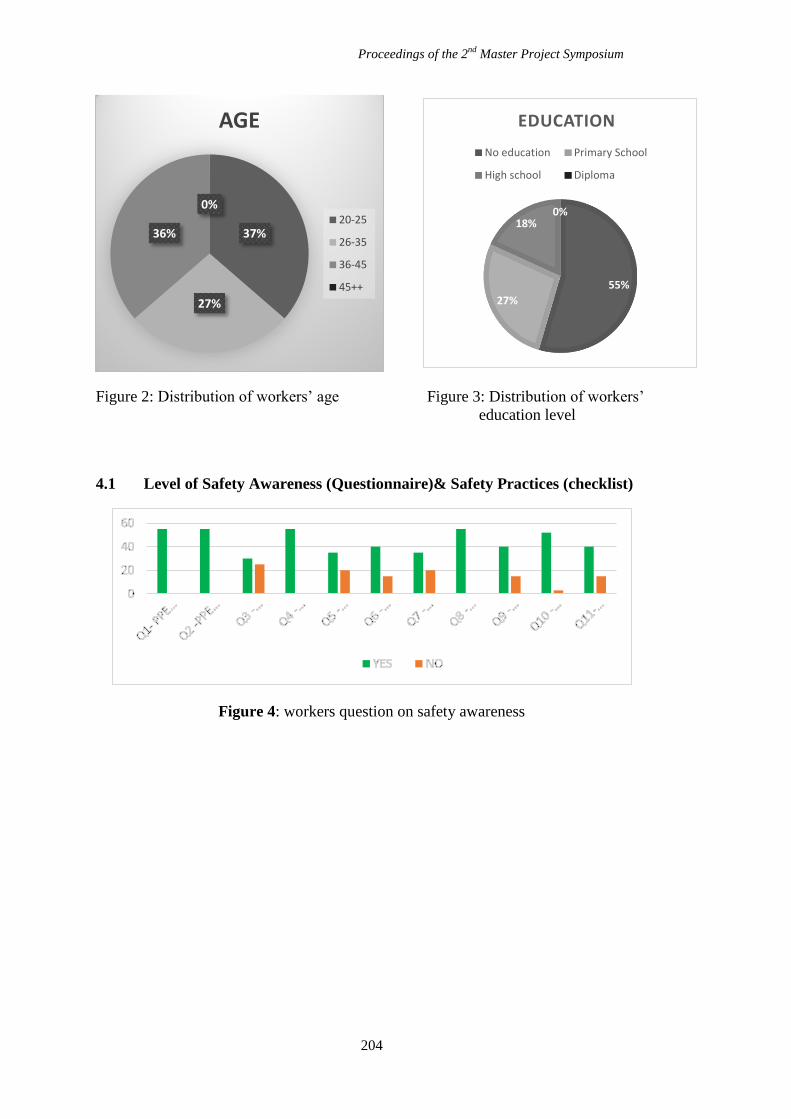
Proceedings of the 2nd
Master Project Symposium
204
55%
27%
18% 0%
EDUCATION
No education Primary School
High school Diploma
Figure 2: Distribution of workers’ age Figure 3: Distribution of workers’
education level
4.1 Level of Safety Awareness (Questionnaire)& Safety Practices (checklist)
Figure 4: workers question on safety awareness
37%
27%
36%
0%
AGE
20-25
26-35
36-45
45++
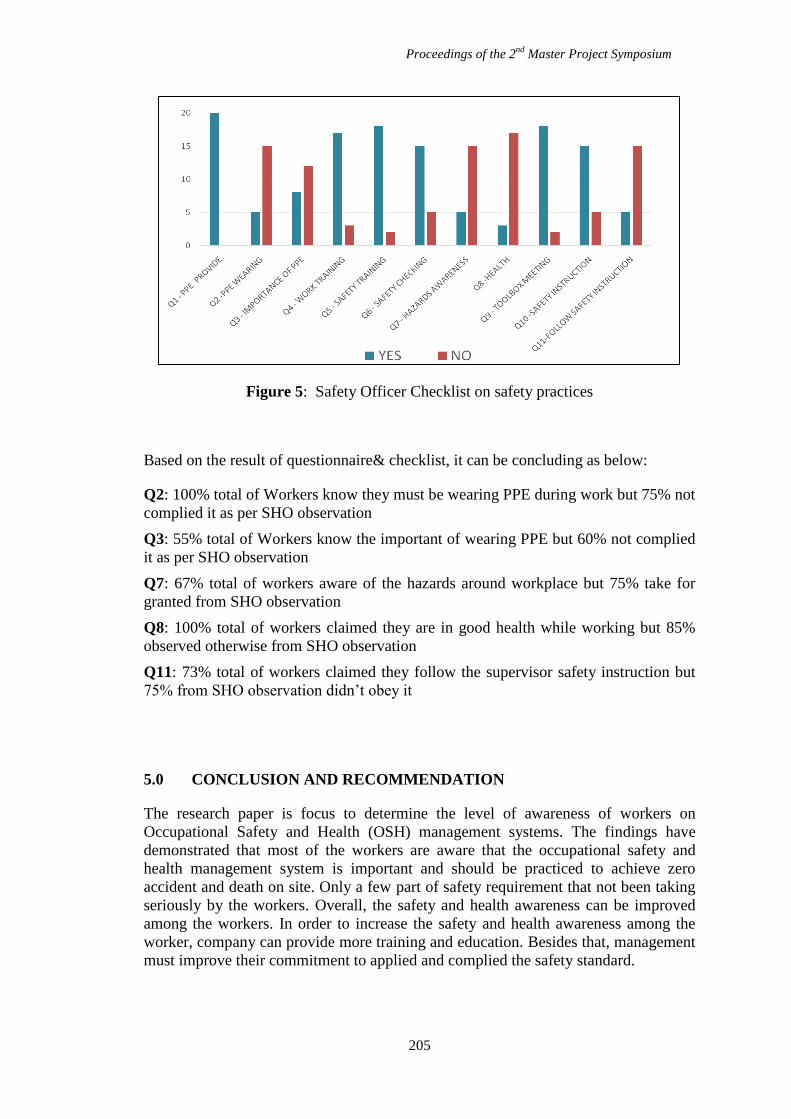
Proceedings of the 2nd
Master Project Symposium
205
Figure 5: Safety Officer Checklist on safety practices
Based on the result of questionnaire& checklist, it can be concluding as below:
Q2: 100% total of Workers know they must be wearing PPE during work but 75% not
complied it as per SHO observation
Q3: 55% total of Workers know the important of wearing PPE but 60% not complied
it as per SHO observation
Q7: 67% total of workers aware of the hazards around workplace but 75% take for
granted from SHO observation
Q8: 100% total of workers claimed they are in good health while working but 85%
observed otherwise from SHO observation
Q11: 73% total of workers claimed they follow the supervisor safety instruction but
75% from SHO observation didn’t obey it
5.0 CONCLUSION AND RECOMMENDATION
The research paper is focus to determine the level of awareness of workers on
Occupational Safety and Health (OSH) management systems. The findings have
demonstrated that most of the workers are aware that the occupational safety and
health management system is important and should be practiced to achieve zero
accident and death on site. Only a few part of safety requirement that not been taking
seriously by the workers. Overall, the safety and health awareness can be improved
among the workers. In order to increase the safety and health awareness among the
worker, company can provide more training and education. Besides that, management
must improve their commitment to applied and complied the safety standard.
Proceedings of the 2nd
Master Project Symposium
206
REFERENCE
Andi, 2008 - Construction Workers Perceptions Toward Safety Culture
Edwin Omo-Ono Sawacha, 1993 -An Investigation Into Safety Attitudes And Safety
Performance In The Construction Industry
Rómel G. Solís-Carcaño, Ricardo J. Franco-Poot, 2014 -Construction Workers’
Perceptions of Safety Practices: A Case Study in Mexico
Brikend Aziri. Job Satisfaction: A Literature Review, Faculti of Business and
Economics, South European University, Ilindeska 1200, Tetovo Makedonia.
Management Research and Practice Vol. 3 Issues 4 (2011) PP: 77-86
F.A. Zulkefli, N. Md Ulang, F. Baharum, 2014 - Construction Health and Safety:
Effectiveness of Safety Incentive Programme
Patrick L. Yorio*, Jan K. Wachter, 2014-The impact of human performance focused
safety and health management practices on injury and illness rates: Do size
and industry matter?
Jan K. Wachter*, Patrick L. Yorio / 2013 - A system of safety management practices
and worker engagement for reducing and preventing accidents: An empirical
and theoretical investigation
Proceedings of the 2nd
Master Project Symposium
207
Index A
Accident (128-131), 133, 135, 146, 148, 149, (151-153), 162, 164, 165, 169, 170,
176, 179, 180, 182, 193, 195, 200, 201, 205, 206
Affective Commitment 39, 43
Antenna (99-101), (103-106)
Assembly Line 94, 96, (177-181)
Awareness 6, 12, 27, 51, 77, 78, 146, 151, 158, 159, 161, 182, 183, 184, 185, 187,
190, 193, 195, 196, 197, 198, 200, 201, 204, 205
Awareness State (195-198)
B
Building Service (84-91)
C
Chemical Hazard 153, 183, 187, (192-194)
Chlorine (153-163)
Chlorine Health Effect 153
Citizen Relationship Management (CiRM) 8
Computer Simulation Technology 99
Construction 28, 40, (46-53), (63-65), (68-72), 74, 75, 84, 85, 90, 91, 100, 114, 120,
(128-135), (164-169), 200, 201, 206
Construction delay (46-48), (50-53), 68, 69
Construction industry 46, 47, 53, 63, 69, 70, 72, 75, 129, 134, 164, 169, 206
Continuance Commitment 39, 43
Critical success factors 8, 13, (32-37)
CSF 8, 9, 10, 11, 12, 36
D Database 64, (114-117), 119, 120
E
Effective communication (70-75)
Elements (40-42), 65, 129, 146, 149, 150, 171, 186, 188, 192, 193
Eliminate Waste 92, 94, 170
Emotional Intelligence (75-83), 135
F
Factors 6, 8, 11, 13, 15, 16, 18, 19, 22, (25-37), (46-53), 55, 62, 65, 70, (72-75), 78,
90, 91, 123, 124, 126, (128-131), 133, 134, 136, 143, 144, (146-148), 151, 152, 160,
165, 168, 169, 183, 193, (196-198)
Fiber Reinforced Plastic 99, 100
G
Global Harmonized System 183
GHS (183-187), (191-194)
Government (1-3), (8-10), 12, 13, 26, 30, 46, 47, (50-53), 63, 64, 69, 84, 85, 89, 90,
108, 132, 144, 146, 147, 177
Proceedings of the 2nd
Master Project Symposium
208
Ground work 164
H
HIRARC 168, 177, 180, 181
I
ICT 8, 11, 37,
Implementation Coordination Unit, Malaysia 63
Information and Communication Technology 8
Inventory Management 114, 115, 117, 120, 176
J
Job Satisfaction (39-45), 72, (122-127), (136-140), (142-145), 206
K
Kaizen 92, (96-98), 170, 171
Knowledge management (10-12), (32-38), 65, 69
L
Label 11, 27, 28, 172, 174, (183-190), (192-194)
Lean Manufacturing 92, 98, 170, 171
Linear Programming (114-117)
Line Balancing 92, 94
Local Government 8, 9, 12, 13
H
Heat Exposure (195-198)
High Speed Broadband 1, 2, 7
M
Machineries 66, 177, 179, 195
Management 1, (3-6), (8-18), (21-38), 40, 44, 48, 50, 51, 53, 58, 59, (61-65),
68, 69, 72, 74, 75, (77-79), (82-86), (88-93), 98, 107, (113-118), 120, 121,
(127-131), 135, 136, (143-145), 152, 155, (159-163), 165, 169, 172, 173,
(176-179), 181, 186, 187, 193, (195-198), 201, 205, 206
Ministry of Health, Malaysia 46
Monitoring tools 51, 52, 63, 64, 66, 68
Motorcycle safety 146
N
Naval Personnel 121, 127
NIOSH Generic Job Stress Questionnaire 121, 123
Normative Commitment 39, 43
O
Occupational Safety and Health 121, 123, 127, 129, 131, 133, 147, 155, 157,
159, 161, 165, (168-170), 175, 177, 180, 184, 200, 205
Occupational Stress (121-127), 144
Oil and Gas 39, 41, 44, 114, 154, 186
Organizational Commitment (39-45), 77, 143, 144
Proceedings of the 2nd
Master Project Symposium
209
OSH 147, 177, 178, 180, 181, 200, 201, 205
P
Personal Behavior 146,(149-151)
Prevalence Risk 195
Project delivery performance 70, (72-74)
Project Documentation 1, 2
Project monitoring 46, 47, 51, 52, (63-66), 68
Public Low Cost Housing 84, 90
Public project delay (63-66), 68
Q
Queue system performance parameter 107
Queuing system 107, 109, 112, 113
Queuing theory 107, 108, 110, 111, 113
R
Radio Frequency 99
Riders (146-151)
Risk matrix 164, 165, 168, 180
S
Safe behaviour 128, 131
Safe excavation 164
Safety 72, 86, 88, 91, 121, 123, (127-135), 146, 147, (149-151), 153, (155-172), (175-
184), 187, 193, 194, (200-206)
Safety Culture (128-130), (132-135), 147, 206
Safety Data Sheets 183, 184, 193, 194
Safety issues 146
Safe work procedure (164-166), 168
Sales engineer (54-61), (76-82)
Sales skills (54-61)
Sales Performance 15, 16, (18-22), (54-61), (76-82)
SDS (183-189), 192, 193
Ship Compartment 195
Small and Medium-sized company 25
Source of uncertainty 15, 16, 18
Stock 15, (17-22), (114-120)
Supply chain management (15-18), (21-24), 75
T
Team integration (70-75)
Telekom Malaysia 1, 2, 6
Training (25-31), (34-36), 44, (54-58), (60-62), (77-79), 81, 82, 128, 136, (143-146),
151, 154, 161, 173, 177, 178, 180, 181, 183, 189, (191-193), 199, 200, 201, 203, 205
Training and development (25-31), 44, (77-79), 82
Tuition centre 32
W
Warehouse 21, (170-176)

Proceedings of the 2nd
Master Project Symposium
210
Worker 6, 40, (42-44), (49-51), (54-56), 94, 96, 113, 117, 119, 128, (130-133),
143, 144, 147, 153, 154, 156, 157, 162, 164, (166-168), 171, (176-181), (183-
187), 190, (192-194), 198, (200-206)
5S Technique (170-175)