Embed Size (px)
Citation preview

2007PERFORMANCEPRINCIPLE-DRIVEN
A N N U A L R E P O R T

shor
t pag
e tr
im li
ne
Driven by commitment to clients, conservative management, and dedication to our
associates and communities, Raymond James performs because of adherence to the firm’s
founding values and focus on an ambitious but realistic vision for the future. Our philosophy
isn’t complicated, but it’s proven. Most important …
4Message from the Chai rman and CEO
7Interview with the Pres iden t and COO
9Principle-DrivenPer formance
19 Mission Statement
20 F inanc ia l Repor t
88Board of Directors,Execut ive Of f icers
89 Operat ing Commit tee
A $100 investment in Raymond James Financial stock in 2002 would have increased to
$289 in 2007, outperforming both the S&P 500 and our peers, as represented by the Dow
Jones U.S. Investment Services Index.
1
�����������������������������������������������
90Corpora t e andShareholder In format ion
OUR STRONG FOUNDATION PRODUCES CONSISTENT
RESULTS FOR RAYMOND JAMES’ SHAREHOLDERS.
�����������������������������������������������������������������
����
���
����
����
����
����
����
���� ���� ���� ���� ����
������
������
������
������
������
������
������
������
������
������
������
������
������
������
������
������
������
������
���������� ������������������������������
©2007 Standard & Poors, a division of The McGraw-Hill Companies, Inc. All rights reserved. researchdatagroup.com/S&P.htm

(a) Gives effect to the three-for-two stock splits paid on March 22, 2006, and March 24, 2004. (b) Amounts include a $16 million reversal of a legal reserve related to the settlement of the Corporex case. Excluding this reversal, net income was $87,678,000 for the year and basic and diluted net income per share were $0.82 and $0.80, respectively. (c) Includes revenues of $65 million from
Raymond James Ltd., which was acquired January 1, 2001. Inclusive of amortization of goodwill, expense related to an employee retention fund, amortization of a noncompete agreement and interest, the acquisition had a negative impact of $.04 per share diluted. (d) Amount includes mortgage notes payable, Federal Home Loan Bank advances and loans related to real estate owed
by variable interest entities that are nonrecourse to the Company.
10-YEAR FINANCIAL SUMMARY
Gross RevenuesNet RevenuesNet IncomeNet Income per Share (a)
Basic DilutedWeighted Average Common Shares Outstanding – Basic (a)
Weighted Average Common/Common Equivalent Shares Outstanding – Diluted (a)
Cash Dividends Declared per Share (a)
Total AssetsLong-Term DebtShareholders’ EquityShares Outstanding (a)
Shareholder’s Equity per Share at End of Period (a)
RESULTS
FINANCIALCONDITION
$ 1,082,907,000951,898,00092,704,000
.86
.82
108,360,000
112,390,000.11
3,852,737,00044,767,000
509,898,000108,603,000
4.70
$ 1,232,206,0001,082,712,000
85,090,000
.79
.78
107,114,000
109,010,000.12
5,030,715,00044,183,000
558,486,000106,295,000
5.25
$ 1,707,441,0001,478,789,000
125,195,000
1.201.19
104,156,000
105,452,000.13
6,308,816,00098,555,000
650,518,000104,147,000
6.25
$ 1,670,990,0001,442,639,000
96,410,000
.90
.88
107,243,000
109,799,000.16
6,372,054,000147,879,000770,876,000108,482,000
7.11
Y E A R E N D E D 9 · 2 8 · 0 1Y E A R E N D E D 9 · 2 9 · 0 0Y E A R E N D E D 9 · 2 4 · 9 9
2001(b,c)200019991998
Y E A R E N D E D 9 · 2 5 · 9 8
�����������
�� ���� �� �� ��
���������
�������������
�������������
��
��
��
��
��
��
��
��
��
��
��
��
A consistent increase in recurring fee revenues has been led by the popularity of fee-based account alternatives in the firm’s Private Client Group and growing interest earnings at Raymond James Bank.
2

(a) Gives effect to the three-for-two stock splits paid on March 22, 2006, and March 24, 2004. (b) Amounts include a $16 million reversal of a legal reserve related to the settlement of the Corporex case. Excluding this reversal, net income was $87,678,000 for the year and basic and diluted net income per share were $0.82 and $0.80, respectively. (c) Includes revenues of $65 million from
Raymond James Ltd., which was acquired January 1, 2001. Inclusive of amortization of goodwill, expense related to an employee retention fund, amortization of a noncompete agreement and interest, the acquisition had a negative impact of $.04 per share diluted. (d) Amount includes mortgage notes payable, Federal Home Loan Bank advances and loans related to real estate owed
by variable interest entities that are nonrecourse to the Company.
�������������������
���� �������� ���� ����
����������
�� ���� �� ��
��������������������������
�� ����� ��� ����� ���� �� ��
18%11%17%
14%14%
3%
3%25%
41%(25%)20%2%17%
$ 1,517,423,0001,441,088,000
79,303,000
.72
.71
109,517,000
111,666,000.16
6,040,303,000147,153,000
839,636,000109,517,000
7.67
$ 1,497,571,0001,451,960,000
86,317,000
.79
.78
109,236,000
110,624,000.16
6,911,638,000167,013,000924,735,000109,148,000
8.47
$ 1,829,776,0001,781,259,000
127,575,000
1.161.14
110,093,000
111,603,000.17
7,621,846,000174,223,000
1,065,213,000110,769,000
9.62
$ 3,109,579,0002,609,915,000
250,430,000
2.172.11
115,608,000
118,693,000.40
16,254,168,000214,864,000
1,757,814,000116,649,000
15.07
Y E A R E N D E D 9 - 3 0 - 0 7
$ 2,168,196,0002,050,407,000
151,046,000
1.371.33
110,217,000
113,048,000.21
8,369,256,000280,784,000
1,241,823,000113,394,000
10.95
$ 2,645,578,0002,348,908,000
214,342,000
1.901.85
112,614,000
115,738,000.32
11,516,650,000286,712,000
1,463,869,000114,064,000
12.83
Y E A R E N D E D 9 · 3 0 · 0 6Y E A R E N D E D 9 · 3 0 · 0 5Y E A R E N D E D 9 · 2 4 · 0 4Y E A R E N D E D 9 · 2 6 · 0 3Y E A R E N D E D 9 · 2 7 · 0 2
year/year increase200720062005200420032002
New records were achieved in 2007, with gross revenues crossing $3 billion for the first time and net revenues reaching $2.6 billion, up 18% and 11%, respectively, over the prior year.
A 17% increase over fiscal 2006 resulted in record earnings of $250 million this year, more than tripling over the past five years.
3
(d) (d) (d)

���������������������������������
��������
���
������
�
11 PRIVATE CLIENT GROUP
13 EQUITY & FIXED INCOME CAPITAL MARKETS
15 ASSET MANAGEMENT GROUP
17 RAYMOND JAMES BANK
OTHER
Investment and financial planning services are provided for 1.6 million accounts through more than 4,750 advisors who have access to a broad range of internally developed and externally provided products and services.
Institutional sales, investment banking, syndicate, equity research, trading and public finance combine to serve public and corporate clients. In addition, investments in low-income housing are syndicated by Raymond James Tax Credit Funds.
This segment includes proprietary asset management, account administration, internally sponsored mutual funds, nonaffiliated private portfolio management, nondiscretionary fee-based programs and the Raymond James Trust Companies.
The bank provides FDIC-insured deposit accounts, including the primary sweep option for brokerage accounts, participates in corporate loan syndications, purchases residential whole loan packages, and provides lending products to commercial and retail clients.
This category includes the firm’s proprietary capital operations, as well as international joint-venture operations in emerging markets, stock loan/borrow and miscellaneous other corporate areas.
Dear Fellow Shareholders,
In spite of $90 oil, a subprime crisis, a depreciating dollar, renewed inflation concerns
and the threat of a recession, the stock market has been amazingly resilient this year.
As I write this letter, however, it is making an effort to give back some of its gains.
More pertinently, the financial services stocks are being punished, sometimes quite
appropriately, for the losses associated with their lack of conservative practices in the
subprime lending business. Blinded by momentum in real estate prices, relatively low
rates of unemployment and growing consumer spending, mortgage lenders neglected
to practice due diligence and adhere to appropriate lending standards, assuring that
ill-advised mortgages would be issued. Those loans were assembled into pools and
sold to a seemingly endless number of voracious buyers. Needless to say, the bubble
burst, covering those lenders and pool owners with losses that are arduous to assess
given the difficulty in valuing the underlying collateral.
One might think that I’m reciting this preamble to justify underperformance in
fiscal year 2007. Nothing could be further from the truth. Raymond James Financial
generated superb results in the year ended September 2007. Annual gross revenues
grew 18% to a record level of $3.1 billion. Net revenues increased 11% to $2.6 billion.
A new record of $250 million in net income was achieved, up 17% from last year.
Diluted earnings per share reached $2.11, compared to $1.85 in a robust 2006. At
September 30, 2007, the book value per share was $15.07. The after-tax margin on net
revenues was 9.6% and the rate of return on average equity was 15.6%.
The Private Client Group again propelled the improvement as its pre-tax profit of
$220 million vaulted 30% over last year and contributed 56% of firm pre-tax profits.
The Capital Markets segment’s contribution declined by 12% to $69 million in spite of
record merger and acquisition fees as both fixed income and corporate underwriting
were affected by volatile markets. The Asset Management Group generated a $61
million pre-tax contribution, a healthy 24% increase as good performance and net
sales growth expanded assets under management to $37 billion. Raymond James
Bank’s contribution to pre-tax profits surged 69% to $27 million, as deposits were
inflated by a change to the bank sweep and by robust organic growth. At the same
time, Raymond James Bank benefited from the sudden availability of good loans at
discounted prices in the secondary market as other financial institutions scrambled
for liquidity.
���������������������������������
����
����
����
������
�
4
M E S S A G E F R O M T H E C H A I R M A N A N D C E O
2007 GROSS REVENUES
2007 PRE-TAX EARNINGS

| In its January 8, 2007, edition, Forbes included Raymond James Financial as one of the “400 Best
Big Companies in America” for the sixth consecutive year.
| The Wealth Solutions department was established to coalesce all of our existing products and
services for the high-net-worth segment of our clientele. Its personnel have launched education
programs and designed marketing support materials for our financial advisors as well as assisted
in the design of specific solutions for individual high-net-worth clients.
| Raymond James Financial Services revitalized its recruiting effort by replacing existing and
adding new recruiters who have been relocated from the home office to the regions for which
they are responsible. Moreover, a more aggressive recruiting package was designed to capitalize
on our unique appeal to independence, which has become attractive to financial advisors whose
lives have been roiled by industry consolidation.
| The Investment Banking department earned its largest fee in history from the acquisitions services
it provided to the NS Group, contributing to a record year in merger and acquisitions fees.
| BusinessWeek’s March 5 edition ranked Raymond James 16th on its list of the top 25 “client-
pleasing brands” nationally, a tribute to both the service provided by our financial advisors and to
the dedicated staff of associates who back them up in the branches and our home offices.
| The subprime crisis’ relative lack of impact on Raymond James reflected the superior risk
management techniques employed by the Fixed Income department and Raymond James Bank,
as well as our conservative philosophy, dedication to rigorous due diligence procedures and daily
execution in accordance with best practices.
| We augmented our commitment to proprietary capital investments and to external venture
capital funds to utilize excess capital more effectively at higher rates of return and to enhance
our Capital Markets’ ability to secure corporate clients and investors. As an example of that
effort, Raymond James Capital made several acquisitions in the event photography business
with another merchant bank to create EPG, Inc., a platform company established to consolidate
certain companies in that industry.
| Ballast Point Ventures, our affiliated venture capital firm, is in the process of raising $125 million
in its second fund. As a result of the success to date in its first fund, demand is vibrant.
| Raymond James ranked fourth in the 2007 J.D. Power and Associates Financial Advisor
Satisfaction Study, which, while gratifying, leaves room for improvement.
| Our Research department ranked 13th of 280 brokerage firms in the May 13 edition of The
Wall Street Journal. Furthermore, its Analysts’ Best Picks for 2007, Focus List and Strong Buy 1
recommendations have performed extremely well.
5
2007 SIGNIF ICANT EVENTS, ACCOMPLISHMENTS AND UNDERTAKINGS

�� �� �� ��
�����������������������������
��
�� �������������
��
| Our new client statement was ranked third among 23 competitors by Dalbar, Inc.,
and received its highest designation, “excellent.”
| Twenty of RJFS’ independent contractor financial advisors were included among
Registered Rep. magazine’s “America’s Top 100 Independent Advisors.” Two
of Raymond James & Associates’ financial advisors were included among the
magazine’s “Top 100 Wirehouse Advisors.” Three Raymond James financial
advisors – Judith McGee, Margaret Starner and Sherri Stephens – made Barron’s
list of “Top 100 Women Advisors” and Mark Smith was named one of Registered
Rep.’s “Ten Outstanding Advisors.” We are proud of these award recipients and
the rest of our financial advisors, all of whom have earned the respect of their
clients through living up to our “Service 1stSM” client commitment.
The preceding list of accomplishments reminds me that we have much for which to
be thankful and that we celebrated our 45th anniversary year in style. Although the
outlook for the rest of fiscal year 2008 is obscured by the economic clouds of credit
malaise, slowing growth, expensive commodities and the decreasing purchasing
value of the U.S. dollar, business has been reasonably good for the Private Client
Group, albeit more difficult for Capital Markets so far. Although the voyage may
be bumpy in the next year, I remain optimistic about the stability of our ship.
Since 1993, Dr. Paul W. Marshall, Professor of Management Practice at Harvard
Business School, has served on our board and as chairman of its Corporate
Governance, Nominating and Compensation Committees with distinction. His
high intellect, complemented by his years of teaching and facilitating business case
discussions in the classroom, has challenged conventional wisdom and provoked
all of us to consider all points of view in our pursuit of good decisions. While he
will continue to serve until our February board meeting, he will not stand for re-
election due to our tenure policies. Thank you, Paul, for your contributions to the
success of Raymond James Financial.
Best wishes for a happy, healthy and prosperous New Year!
Thomas A. James
Chairman and CEO
December 18, 2007
6
�����������
��������
����
���� ��������� ����� �����
�� ���� �� ��
NET INTEREST INCOME$ MILLIONS
Following the general market downturn in 2002 and 2003, the firm has returned to consistently achieving its target range of 15% to 20% return on equity.
Net interest earnings increased by $54 million, with 81% of that increase a result of Raymond James Bank’s explosive growth in loan balances, which more than doubled during the year.

7
You are a member of the board of directors for the Securities Industry and Financial Markets Association (SIFMA), as well as chairman of its Private Client Group Steering Committee, and are known for being a staunch advocate of the need to review and revise industry regulations. Why is this issue especially important now?
This is a unique time for our industry. The rules by which we’re governed were originally created in the 1930s
and ’40s. While they have evolved to a small degree, they remain largely focused on what has traditionally been
a transaction-based industry. In short, decisions are based on rules from 60-plus years ago, even though the
environment has changed to one that looks at clients holistically, one in which advice comes first, before transactions
are made. That translates into technical compliance, but with results that are often functionally inappropriate.
Most firms are seeing this change in terms of where their revenues are derived. For Raymond James, recurring
revenues outstripped transactional revenues for the first time in 2006, a gap that has continued to widen. This has
been largely influenced by rapid growth in interest earnings as Raymond James Bank became the primary taxable
sweep alternative for brokerage accounts, but it also indicates the shift in our Private Client Group from a largely
commission-based structure to more emphasis on fee-based services, a change I believe is indicative of clients seeing
the benefits of advice and becoming more willing to pay for it.
Updating our system of regulation is simply necessary to ensure the laws that govern firms like ours – and that
protect investors – are truly reflective of the atmosphere in which we operate and give clients the ability to meet
their needs through varied and appropriate choices.
I N T E R V I E W W I T H T H E P R E S I D E N T A N D C O O
���� ����� ������� �� �� �� ��
�����������������������������
����������������
The 18% increase in client assets for the year is a direct result of continued success in Private Client Group recruiting.
TOTAL CLIENT ASSETS$ BILLIONS

8
Chet Helck
President and COO
���� ���� ������ �� �� �� ��
�������������������������������������
��������������
Raymond James’ stock price rose from $29.24 to $32.85 during fiscal 2007, with the firm’s market capitalization approaching $4 billion and liquidity increasing as outside ownership of shares reached 58%.
TOTAL MARKET CAPITALIZATION$ BILLIONS
One major development this year was the introduction of the Financial Industry Regulatory Authority, or FINRA, which combines the regulatory arms of the New York Stock Exchange and the National Association of Securities Dealers. What are the benefits of this merger?
In the past, we were held to standards by both self-regulatory organizations, which often meant duplicating efforts
and, in some cases, trying to reconcile conflicting rules. Improving clarity and gaining related cost efficiencies
were major incentives for the merger. However, it also provides an opportunity to rethink our approach to
regulation as an industry and, as I mentioned before, to better account for the more advice-centric nature of
today’s environment. My hope is that FINRA can move toward a more principle-based approach to rulemaking
that benefits clients, as well as firms like ours.
In light of the changes in the industry, what is Raymond James doing to position itself as a leader that will meet client needs while continuing to perform for shareholders?
Our firm was built with financial planning as its base. While we’ve expanded into a full array of complementary
businesses, we’ve done so in a way that supports the fundamental principles of our firm: creating additional
resources for advisors, providing new opportunities for clients and solidifying our base through diversification
of our core businesses, all while maintaining a conservative approach to growth. Other companies have had to
shift their focus to meet the demand for a more advice-centered, relationship-based model between advisors
and clients, and have also had to reassess their overall business models in light of short-sighted decisions. As a
company, we’ve been able to avoid significant impact from market turmoil, which reflects the principle-based
performance that is truly key to our current success, as well as to our future growth.
I T WA S A RE CORD YE A R BE C A USE R AYMOND J A ME S H A S S TAYED T RUE
T O OUR F OUNDING P RINC IP L E S , T HE T E NE T S T H AT K E E P US S T RONG,
NO M AT T E R T HE BUS INE S S E N V IRONME N T. I T W A S A RE CORD Y E A R
BE C A USE A S SOC I A T E S IN E A CH OF OUR M A JOR BUS INE S S UNI T S –
P RI VAT E C L IE N T GROUP, C A P I TA L M A RK E T S , A S SE T M A N A GE ME N T A ND
R AY MOND J A ME S B A NK – SH A RE VA L UE S T H AT DRI V E P E RF ORM A NCE
F OR OUR C L IE N T S A ND, IN T URN, T HE F IRM’ S SUC CE S S .
WA S A R E C O R D Y E A R F O R R AY M O N D J A M E S
Against a backdrop of volatile
markets, sky-rocketing energy
prices, a weakening dollar and
an apparently deteriorating U.S.
economy … as other firms in our
industry have struggled to contend
with their exposure to the subprime
meltdown and as difficulties have
confronted almost all areas of the
financial markets … 2007
9

At Raymond James, the engine that propels long-term performance is our people ... people who
value independence, who are intelligent and innovative, who recognize that integrity isn’t a
word, it’s a way of life.
Raymond James’ advisors and associates understand and embrace a corporate philosophy that
is guided by our mission and demonstrated through our core values:
PRINCIPLE-DRIVEN PERFORMANCE
COMMITMENT TO CLIENTSWe are dedicated to our clients’ success and the achievement of their unique financial objectives through the highest quality service and advice.
A CONSERVATIVE APPROACHWe consider decision making to be a thoughtful process that should account for not only short-term outcomes but lasting stability, for both clients and our firm.
DEDICATION TO OUR ASSOCIATES
AND COMMUNITIES
We value a culture that supports professional and personal fulfillment, as well as social responsibility.
1 0
THE RAYMOND JAMES PLEDGE
We, the associates of Raymond James, commit our energies, intellect and knowledge to attaining
the financial objectives of our clients by providing the highest possible level of service and delivering
superior investment alternatives. We believe that putting the financial well-being of our clients first
ultimately serves the best interests of our shareholders, our communities and ourselves. Remaining
responsive to the needs of our clients in a financial environment characterized by constant change
is our continuing challenge.

EXPANDINGCLIENT RELATIONSHIPS
INDEPENDENCE,
It takes trust to put your financial future in someone else’s hands. But
every day, clients look to their Raymond James financial advisors to help
them realize their dreams. In turn, more and more advisors each year
join the Private Client Group because they have similar confidence in the
resources and support of Raymond James.
Respect for independence, trust in the integrity of others and the comfort
of a company that still values people ... these are principles that lead to
success for clients and advisors.
PRIVATE CLIENT GROUP
1 1
In another record year for the Private Client
Group, commissions and fees rose more than
15% to $1.5 billion, as recruiting and average
advisor production momentum continued.
Raymond James’ well-deserved reputation as a firm that understands that client
needs are unique and respects freedom for advisors has attracted more than 330
advisors in 2007 to the firm’s five U.S. affiliation options – traditional employee,
independent employee, independent advisor, bank affiliate or independent
registered investment advisor. While total U.S. advisor count year-over-year was
down slightly due to high minimum production standards, an inflection point
was reached in the last quarter of 2007 as the balance between recruiting and
intentional attrition leveled out and actual increases were realized.
In addition to domestic growth, exporting the independent business model
to Canada and the United Kingdom began to show traction. Raymond James
Ltd. is one of the few significant non-bank owned firms in Canada and, while
the total advisor count increased only modestly for 2007, recruiting activity has
picked up. Meanwhile, London-based Raymond James Investment Services,
while small, has been among the fastest-growing U.K. wealth management
firms, with asset size increasing from to £79 million ($164 million) in 2002 to
£1.1 billion ($2.3 billion) in 2007.
��� �����
���������������������������������������
�������������������� �� �� �� ����
SECURITIES COMMISSIONS & FEES$ MILLIONS
�������������
��������������
�������
�������
�������
�������
�������
E M P H A S I Z I N G

Recruiting will continue to be a focus
for the Private Client Group, but
ensuring that advisors have access
to a wide array of investment alterna-
tives, support and resources is key to
their ongoing growth. In 2008, the
firm is investing heavily in systems
enhancements that will better recognize
full client relationships, which should
translate into improved service to
advisors and clients, more targeted
offerings – such as legacy planning and
packaged retirement income solutions –
and, ultimately, deeper and more
profitable client relationships
for advisors and the firm.
1 2
RAYMOND JAMES WAS
RECOGNIZED IN BusinessWeek’s
“CUSTOMER SERVICE ELITE”
LIST, WHICH RANKED THE
FIRM IN THE
TOP 20 AMONG HIGHLY REGARDED
SERVICE COMPANIES FROM A
WIDE VARIETY OF INDUSTRIES.
Recruiting results have driven much of the Private Client Group’s growth, but
overall average advisor production exceeded targets for all affiliations, reflecting
both new advisors and increased assets for existing advisors. In North America,
total client assets neared $215 billion and close to 69,000 new accounts were
added during the year.
Both new recruits and long-time Raymond James advisors benefit from a unique
blend of smaller-firm attention and world-class resources, as well as the ability
to run their practices and own their books of business. The firm is continuously
identifying ways to better support all advisors, through comprehensive practice
management tools, customized marketing
resources and high-quality support for their
client relationships. One example in 2007 was
the introduction of a new client statement,
which launched in January and is rated as
one of the top three statements in the industry
by the nation’s leading financial services market research and consulting firm,
based on excellence in efficiency, effectiveness and positive customer experience.
Included on the statement: performance reporting for most accounts, providing
further transparency for clients and accountability for advisors, which reinforces
Raymond James’ ongoing commitment to performing for clients.
The Wealth Solutions
Group works with
advisors to help meet
the more complex needs
of higher-net-worth
investors. In 2007, the
group hosted more than
250 clients and their
advisors in private visits
to the firm’s corporate
headquarters to help
assess each investor’s
situation and design
personalized plans.
FROM LEFT: FRED WHALEY, PATRICK O’CONNOR, SHANNON REID, CHIP BAUDER AND SAM ASPINWALL
168FI V E -Y E AR PERCENTAGE INCREASE IN CLIENT ASSETS UNDER ADMINIS TRATION

EQUITY & FIXED INCOMECAPITAL MARKETS
1 3
������������������
��������������
�������������
��� ������ ����� ������� ���� �� ��
�������������������������
����������
�������
�� ����� ��� ����� ���� �� ��
TARGETEDSatisfying a client one time isn’t enough. Building strong relationships –
especially for the varied needs of corporations, institutions and
municipalities – requires in-depth understanding of each client’s
objectives, superior service and reliable results with every interaction.
Raymond James Capital Markets has achieved widespread recognition
for doing just that, earning not only respect in the United States and
abroad, but – most important – the repeat business of clients.
F O C U S W I T H A N
Vibrant merger and acquisition activity in Investment
Banking as well as continued growth in Public Finance
underwritings combined to help drive performance for
Capital Markets, even as volatile markets depressed
some areas of the segment’s business.
Against the backdrop of an extremely volatile year, Raymond James Capital
Markets continued to provide unique solutions for clients in a complex
business environment.
Raymond James’ reputation
for high-quality research is
expanding around the globe.
In addition to the U.S. team’s
success – as represented
here by several of the
group’s award-winning
senior analysts – the firm’s
international affiliates are
also being recognized. Efforts
to maintain these quality
standards throughout all
geographic regions began in
2007 with the introduction of
the Global Research Council.
INTERNATIONAL REACH
FROM LEFT: BILL CROW, CHRIS QUILTY, PAUL PURYEAR, RIC PRENTISS AND BRIAN ALEXANDER

1 4
Overall, investment banking revenues for the firm increased 21% over last year,
driven principally by a sharp surge in merger and acquisition advisory fees,
which improved 34% year-over-year. This offset a somewhat slower environment
in public equity underwritings as clients dealt with a more volatile market.
The firm’s international corporate finance teams were also active. Raymond
James and its affiliates in Latin America led or co-led public offerings for clients
in excess of $1.9 billion in 2007 and Raymond James Securities Turkey acted as
the sell-side advisor in a $101 million transaction between a major international
news corporation and Turkish state television. The transaction was one of the
largest transactions in Turkey by a local investment banking team without the
involvement of foreign investment bankers.
Raymond James Equity Research is also more global than ever, with over 1,000
companies under coverage worldwide. Along with more than 40 senior analysts
in the United States covering over 665 companies within eight industry groups,
another 40 analysts in Canada, Europe, Turkey and Latin America follow close to
400 companies. To support this international presence and ensure coordination, the
firm’s Global Research Council was formed in 2007.
Raymond James’ analysts in the United States continue to be among the most
respected in the industry. They have been consistently recognized in the The Wall
Street Journal’s annual “Best on the Street” survey – ranking third overall among
all major U.S. investment banks in cumulative awards over the past five years, with
35 honors during that period.
That reputation is expanding internationally as well, with Raymond James’
Argentinian and Turkish equity research teams ranked first and third, respectively,
among competitors in their local markets in published rankings.
In 2007, Fixed Income’s Public Finance banking team continued its dual focus on
middle market general governmental transactions and specialty sectors including
healthcare, housing and senior living. The department enhanced its reach by
adding an additional office in the Midwest and adding staff in its other existing
offices. The group acted as lead manager in 61 transactions for a total par amount
of $2 billion, with more than 51% of those transactions representing repeat business
with existing clients.
Finally, Raymond James Tax Credit Funds (RJTCF), one of the nation’s leading
syndicators of low-income housing tax credit investing, raised more than $375
million in equity, up 35% over 2006. Since inception of the tax credit program in
1986, RJTCF has raised over $1.7 billion for over 1,150 properties in 42 states.
Focusing on meaningful
relationships with clients and deep
understanding of specific market
segments, both investment banking
and public finance should continue
to drive performance by leveraging
current client relationships and
expanding within their target areas.
In addition, integration between
Raymond James Tax Credit Funds
and Fixed Income, which began to
take shape in 2007, should help both
groups continue to perform for their
clients and shareholders.
The Wall Street Journal does not endorse, sponsor or approve Raymond James’ investment programs.

Hire the right people and they’ll do what’s right for their clients. That’s a
sentiment shared throughout Raymond James, and one that is especially
apparent in Asset Management. Fund managers are respected for their
distinctive styles and are encouraged to maintain discipline by staying
true to their investment philosophies rather than chasing market trends.
1 5
ASSET MANAGEMENT GROUPThe variety of account types, investment
styles and sales channels offered by the Asset
Management Group allowed for growth in
assets under management, a result of both
new investments and market performance.
QUALITYMANAGERS DRIVE
PERFORMANCE����������������������
���� ���� ������������������ �� �� �� ����
TOTAL ASSETS UNDER MANAGEMENT$ BILLIONS
����������������������������������������������������
�������������������
While manager performance is key to providing quality asset management
services, developing products to meet specific client needs is also important.
From fully customized management for institutional and high-net-worth
clients to proprietary allocation programs that bring those resources to the
firm’s Private Client Group clients, Raymond James Asset Management is
helping to meet the objectives of a broad range of investors.
Eagle Asset Management is a significant contributor to this business
unit’s success. Driven by a core group of managers who adhere to their
individual investment philosophies
and disciplines, more than 80% of
Eagle’s major programs outperformed
their benchmarks in fiscal year 2007.
Others have recognized this success:
Each equity program is available
through at least one outside broker/dealer. Retail sales through external
platforms reached $900 million in 2007, which represented 60% of Eagle’s
total retail sales for the year.
Eagle also serves as a subadvisor to Heritage Asset Management, another
of Raymond James’ asset management subsidiaries. Currently, Heritage
manages $4 billion in assets through open-end mutual funds, with the
309%GROWTH IN SALES OF SEPARATELY MANAGED ACCOUNTS OVER FIVE YEARS

majority of that total representing accounts outside of Raymond James –
demonstrating further acceptance of Raymond James’ asset management
products into the broader marketplace.
Over 400 institutional accounts are managed by Eagle, representing $7.6 billion
in assets. Meanwhile, that same institutional-quality management is available to
Raymond James’ retail clients through two asset allocation programs, Raymond
James Consulting Services and the Freedom Account.
These programs allow Private Client Group financial advisors to offer their
clients the benefits of the firm’s asset management professionals within targeted
portfolios developed for specific client needs. For example, a Retirement Income
Solution was added to the Freedom program in 2007 to address the concerns of
the growing retiree population. Sales of separately managed accounts reached
$4.5 billion, compared to $1.1 billion five years ago, with more than 70% of
Raymond James advisors with annual production of $200,000 or greater now
using at least one of these options with their clients.
Continued attention to attracting
top managers, providing consistent
investment performance for clients
and adding new products to meet
the varied needs of investors will
drive Asset Management in 2008.
One development already in the
works: Awad Asset Management,
whose investment management team
changed in November 2006, will
continue its focus on conservative
small-cap management from proven,
experienced managers, but under a
new name – Eagle Boston Investment
Management – and as a subsidiary
of Eagle Asset Management.
1 6
Todd McCallister is one of
only eight fund managers
in the country who have
been named to Barron’s Top
100 list for six years in a
row. He and co-manager
Stacey Serafini-Thomas
believe the success of the
Heritage Mid-Cap Stock
Fund is largely due to
the freedom they have to
remain committed to their
investment philosophy,
especially during difficult
market environments.
Raymond James’ culture
of independence pays off:
The fund boasts 10-year
performance in the 14th
percentile and has been
recognized with a Morning-
star five-star ranking.
TODD MCCALLISTER AND STACEY SERAFINI-THOMAS

GROWTHOUTSTANDING
Clients today want more than investment advice, they expect a range of
solutions, including cash management and lending services. Raymond
James Bank has met that need by providing extremely competitive deposit
accounts, as well as by offering loans for both individuals and corporations.
1 7
RAYMOND JAMES BANKA combination of exceptional asset and loan
growth resulted in Raymond James Bank more
than doubling its contribution to firm revenues
from 4.34 % in 2006 to 9 % in 2007.
���� ���� ����
����������������������
������������
�� �� �� �� ����
���������������������
�������� ���� ������������
��������������� �����������������
�� �� �� �� ����
A N D C O N T I N U E D C O N S E R VAT I S M
TOTAL ASSETS$ BILLIONS
TOTAL LOANS$ BILLIONS
DARLENE MCCONNELL, MARK MOODY AND TOM MACINA
The aggressive growth
of Raymond James
Bank’s loan portfolio has
not been at the expense
of conservative lending
practices that fully eval-
ate risk, not only at loan
inception, but over the
life of each loan. The
bank’s lending and credit
risk teams work together
to ensure quality: While
the overall net loan port-
folio increased by 106%
in 2007, nonperforming
loans were 0.12%, far
below national averages.

5.6TOTAL DEPOSIT S IN BILLIONS OF DOLL ARS
Along with additional funds that
can be swept from the firm’s other
accounts into RJBDP – with the
next phase scheduled for fiscal 2008 –
ongoing organic growth in the program
is expected with the continued
expansion in the Private Client
Group. Larger balances mean greater
flexibility, allowing Raymond James
Bank to develop additional product
offerings to serve the needs of both
retail and corporate clients in all
areas of the firm.
1 8
CLIENT BROKERAGE
SWEEP DEPOSITS INTO
RAYMOND JAMES BANK
EARN INTEREST IN LINE
WITH MONEY MARKET
FUNDS, AT LEAST 100
BASIS POINTS
HIGHERTHAN AT MOST
OTHER FIRMS.
In a year where words like “crisis” and “meltdown” were used by even the most
moderate pundits to describe the nation’s credit crunch, Raymond James Bank’s
recent growth in deposits and the availability of quality loans selling at discounts
coincided to create an extremely attractive opportunity to expand the bank’s loan
portfolio and prime this business unit for significant future growth.
Total deposits at Raymond James Bank reached $5.6 billion in 2007, an increase
of 99% over the prior year, with more than $1.3 billion of this growth related
to the latest movement of client deposits to the Raymond James Bank Deposit
Program (RJBDP). An additional $1.5 billion in organic growth also contributed
to the total, fueled by recruiting results within the Private Client Group, where
attracting record numbers of employee advisors also meant adding many of their
clients to RJBDP.
The influx of funds – deposits have increased six-fold over the past five years –
allowed Raymond James Bank to take advantage of credit market conditions,
purchasing or originating more than $1.24 billion in loans in the last quarter
of fiscal 2007 alone.
Meanwhile, the bank’s long-standing conservative lending practices were
maintained. In fact, greater scale has resulted in increased opportunities and
more selectivity. That scale has also translated to increased corporate loan
limits, which has in turn expanded the bank’s
ability to extend additional credit to existing
clients. Strategic integration with Raymond James’
other business units also drove loan growth. For
example, approximately 35% of all bank corporate
lending clients have a Raymond James Capital Markets relationship. On the
retail side, a growing number of Private Client Group advisors turned to the
bank for their clients’ residential lending needs. In total, residential mortgage
loans increased 46% over 2006.
Of course, the sharp increase in loans, which more than doubled during fiscal 2007,
also meant a significant increase in loan loss reserves. Those reserves increased to $47
million, although actual loan charge-offs for the year were $1.1 million, representing
only .02% of total loans outstanding. Since banking regulations and accounting
practices require the establishment of these reserves upon loan origination –
before any profit from the loans is realized – this sharp upswing in loss provisions
depressed profitability for the bank in 2007, offsetting even significantly amplified
interest earnings. However, while additional loan growth will mean added
reserves, increased earnings from the larger overall loan portfolio should bode well
for future profitability, assuming actual losses remain minimal.

1 9
Our business is people and their
financial well-being. Therefore, in
the pursuit of our goals, we will
conduct ourselves in accordance
with these precepts:
MISSIONSTATEMENT
| Our clients always come first.
| We must provide the highest level of service and integrity.
| Assisting our clients in the attainment of their financial
objectives is our most worthy enterprise.
| We must communicate with our clients clearly and frequently.
| Teamwork – cooperating and providing assistance and support
to our fellow associates – is fundamental to sustaining a quality
work environment that nurtures opportunities for unparalleled
service, personal growth and job satisfaction.
| Continuing education is necessary to maintain the timeliness
of investment knowledge, tax law information and financial
planning techniques.
| Innovation is requisite to our survival in a changing world.
| To emulate other members of our industry requires us to
continue to work hard; to excel beyond our peers requires
us to provide an even higher caliber of service to our clients.
| We must give something back to the communities in which
we live and work.

20
MARKET FOR REGISTRANT'S COMMON EQUITY, RELATED SHAREHOLDER MATTERS AND ISSUER PURCHASES OF EQUITY SECURITIES
The Company's common stock is traded on the NYSE under the symbol “RJF”. At November 19, 2007 there were approximately 14,000 holders of the Company's common stock. The following table sets forth for the periods indicated the high and low trades for the common stock (as adjusted for the three-for-two stock split in March 2006):
2007 2006 High Low High Low
First Quarter $ 33.63 $ 28.53 $ 25.72 $ 20.25 Second Quarter 32.52 27.38 31.45 24.47 Third Quarter 34.62 29.10 31.66 26.34 Fourth Quarter 36.00 28.65 30.57 26.45
See Quarterly Financial Information on page 87 of this report for the amount of the quarterly dividends paid. The Company expects to continue paying cash dividends. However, the payment and rate of dividends on the Company's common stock is subject to several factors including operating results, financial requirements of the Company, and the availability of funds from the Company's subsidiaries, including the broker-dealer subsidiaries, which may be subject to restrictions under the net capital rules of the SEC, FINRA and the IDA; and RJBank, which may be subject to restrictions by federal banking agencies. Such restrictions have never limited the Company's dividend payments. (See Note 19 of the Notes to Consolidated Financial Statements for more information on the capital restrictions placed on RJBank and the Company's broker-dealer subsidiaries). See Note 15 of the Notes to Consolidated Financial Statements for information regarding repurchased shares of the Company's common stock.
MANAGEMENT'S DISCUSSION AND ANALYSIS OF FINANCIAL CONDITION AND RESULTS OF OPERATIONS
Factors Affecting “Forward-Looking Statements” From time to time, the Company may publish “forward-looking statements” within the meaning of Section 27A of the Securities Act of 1933, as amended, and Section 21E of the Securities and Exchange Act of 1934, as amended, or make oral statements that constitute forward-looking statements. These forward-looking statements may relate to such matters as anticipated financial performance, future revenues or earnings, business prospects, projected ventures, new products, anticipated market performance, and similar matters. The Private Securities Litigation Reform Act of 1995 provides a safe harbor for forward-looking statements. In order to comply with the terms of the safe harbor, the Company cautions readers that a variety of factors could cause the Company's actual results to differ materially from the anticipated results or other expectations expressed in the Company's forward-looking statements. These risks and uncertainties, many of which are beyond the Company's control, are discussed in the section entitled Risk Factors on page 42 of this report. The Company does not undertake any obligation to publicly update or revise any forward-looking statements. Overview The following Management’s Discussion and Analysis is intended to help the reader understand the results of operations and the financial condition of the Company. Management’s Discussion and Analysis is provided as a supplement to, and should be read in conjunction with, the Company’s consolidated financial statements and accompanying notes to the consolidated financial statements.
The Company’s results continue to be highly correlated to the direction of the U.S. equity markets and are subject to volatility due to changes in interest rates, valuation of financial instruments, economic and political trends and industry competition. During 2007, the market was impacted by rising energy prices, a housing market slowdown, a subprime lending collapse, a growing economy, a weakening US dollar and stable interest rates. The Company’s Private Client Group’s recruiting and retention of Financial Advisors was positively impacted by industry consolidation. RJBank benefited from the widening interest rate spreads and the availability of attractive loan purchases as a result of the subprime lending crisis.

21
Results of Operations - Total Company The Company currently operates through the following eight business segments: Private Client Group; Capital Markets; Asset Management; RJBank; Emerging Markets; Stock Loan/Borrow; Proprietary Capital and certain corporate activities in the Other segment. The following table presents consolidated and segment financial information for the Company for the years indicated:
Year Ended September 30, September 30, September 30, 2007 2006 2005 (in 000's) Total Company Revenues $ 3,109,579 $ 2,645,578 $ 2,168,196 Pre-tax Earnings 392,224 342,066 247,971 Private Client Group Revenues 1,938,154 1,679,813 1,397,578 Pre-tax Earnings 219,864 168,519 102,245 Capital Markets Revenues 506,498 487,419 455,151 Pre-tax Earnings 68,966 78,221 77,333 Asset Management Revenues 234,875 207,821 179,845 Pre-tax Earnings 60,517 48,749 40,442 RJBank Revenues 279,572 114,692 45,448 Pre-tax Earnings 27,005 16,003 14,204 Emerging Markets Revenues 59,083 55,263 38,768 Pre-tax Earnings 3,640 2,857 5,927 Stock Loan/Borrow Revenues 68,685 59,947 31,876 Pre-tax Earnings 5,003 8,001 5,962 Proprietary Capital Revenues 8,280 17,312 10,952 Pre-tax Earnings 3,577 8,468 4,182 Other Revenues 14,432 23,311 8,578 Pre-tax Earnings (Loss) 3,652 11,248 (2,324)
Year ended September 30, 2007 Compared with the Year ended September 30, 2006 - Total Company The Company had record annual revenues and earnings for the fourth consecutive year, with 2007 total revenues surpassing $3 billion and net income surpassing $250 million. Revenues exceeded the prior year by 18% while net income exceeded the prior year by 17%. Net revenues were $2.6 billion, or up 11% over the prior year, thus positive operating leverage was realized. Non-interest expenses also rose by 11%. Once again, results were driven by an increase in net interest earnings, which were up 31%. All of the Company’s four major segments had higher revenues and three of the four had higher pre-tax income than in the prior year.
Year ended September 30, 2006 Compared with the Year ended September 30, 2005 - Total Company The Company had record annual revenues and earnings for the third consecutive year, with net revenues surpassing $2.3 billion. Non-interest expenses rose by 12%, contrasted to a 15% increase in net revenues. Net income exceeded $200 million for the first time in the Company's history, up 42% from the prior year. All of the Company’s four major segments had higher revenues and pre-tax income than in the prior year, driven by a 36% increase in net interest earnings (see table below) combined with solid increases in investment advisory fees (14%) and securities commissions and fees (10%), a modest (6%) increase in investment banking revenues and an increase in financial service fees (33%). Total firm net revenues increased 15%, while pre-tax profits after consideration of minority interest were up 38% over the prior year.

22
Net Interest Analysis The following table presents average balance data and interest income and expense data for the Company, as well as the related net interest income:
Year Ended September 30, 2007 September 30, 2006 September 30, 2005 Operating Average Operating Average Operating Average Average Interest Yield/ Average Interest Yield/ Average Interest Yield/
Balance Inc./Exp. Cost Balance Inc./Exp. Cost Balance Inc./Exp. Cost ($ in 000's) Interest-Earning Assets:
Margin Balances $1,401,931 $ 108,368 7.73% $1,327,121 $ 98,417 7.42% $1,218,486 $ 68,125 5.59% Assets Segregated Pursuant
to Regulations and Other Segregated Assets 3,738,106 195,356 5.23% 2,983,853 141,741 4.75% 2,390,174 65,847 2.75%
Interest-Earning Assets of RJBank (1) 4,544,875 278,248 6.12% 1,967,225 114,065 5.80% 1,055,684 45,017 4.26%
Stock Borrow 68,685 59,947 31,876 Interest-Earning Assets
of Variable Interest Entities 955 1,008 822 Other 75,380 54,803 33,875
Total Interest Income 726,992 469,981 245,562
Interest-Bearing Liabilities:
Client Interest Program $4,619,292 204,158 4.42% $3,793,570 143,428 3.78% $3,228,443 58,486 1.81% Interest-Bearing Liabilities
of RJBank (1) 4,187,365 193,747 4.63% 1,796,481 73,529 4.09% 966,627 22,020 2.28% Stock Loan 59,276 47,593 22,873 Interest-Bearing Liabilities of
Variable Interest Entities 6,972 8,368 3,934 Other 35,511 23,752 10,476
Total Interest Expense 499,664 296,670 117,789
Net Interest Income $ 227,328 $ 173,311 $ 127,773
(1) See Results of Operations - RJBank on page 28 of this report for details.
Net interest income at RJBank increased over 100%, representing 81% of the $54 million increase in the Company’s net interest earnings. Average interest-earning assets at RJBank increased 131% over the prior year. Average bank loan balances have doubled from $1.6 billion to $3.2 billion. This increase was funded by a second bulk transfer of client cash deposits of $1.3 billion in March 2007 and growth in new client cash balances which are a result of the positive recruiting results. Average customer margin balances grew modestly during 2007, thus the increased client cash balances in the firm’s Client Interest Program led to a significant increase in assets segregated pursuant to regulations. Net interest on the stock loan/borrow business declined 24%, due to decreased interest spreads despite slightly higher balances. Other interest revenue and expense include earnings on corporate cash, inventory balances, interest on overnight borrowings and the mortgage on the headquarters facility.

23
Results of Operations - Private Client Group The following table presents consolidated financial information for the Private Client Group segment for the years indicated:
Year Ended September 30, % Incr. September 30, % Incr. September 30, 2007 (Decr.) 2006 (Decr.) 2005 ($ in 000's) Revenues:
Securities Commissions And Fees $ 1,451,899 15% $ 1,262,751 12% $ 1,132,291 Interest 317,378 28% 248,709 77% 140,807 Financial Service Fees 85,018 (9%) 93,421 40% 66,774 Other 83,859 12% 74,932 30% 57,706
Total Revenues 1,938,154 15% 1,679,813 20% 1,397,578
Interest Expense 192,722 38% 139,593 130% 60,796 Net Revenues 1,745,432 13% 1,540,220 15% 1,336,782
Non-Interest Expenses:
Sales Commissions 1,070,479 14% 940,567 14% 825,889 Admin & Incentive Comp and Benefit Costs 265,038 13% 233,684 13% 207,368 Communications and Information Processing 55,224 4% 53,064 8% 49,183 Occupancy and Equipment 57,310 12% 51,101 11% 46,114 Business Development 57,216 13% 50,555 21% 41,719 Clearance and Other 20,449 (52%) 42,836 (34%) 65,166
Total Non-Interest Expenses 1,525,716 11% 1,371,807 11% 1,235,439 Income Before Taxes and Minority Interest 219,716 30% 168,413 66% 101,343 Minority Interest (148) (106) (902)
Pre-tax Earnings $ 219,864 30% $ 168,519 65% $ 102,245 Margin on Net Revenues 12.6% 10.9% 7.6%
The following table presents a summary of Private Client Group Financial Advisors as of the periods indicated:
Independent 2007 2006 Employee Contractors Total Total Private Client Group - Financial Advisors:
RJA 1,087 - 1,087 1,028 RJFS - 3,068 3,068 3,254 RJ Ltd 186 139 325 312 RJIS - 81 81 71
Total Financial Advisors 1,273 3,288 4,561 4,665
Year ended September 30, 2007 Compared with the Year ended September 30, 2006 – Private Client Group The Private Client Group (“PCG”) was significantly impacted by the successful recruiting of employee Financial Advisors and increased productivity throughout domestic PCG. RJA added a net 59 employee Financial Advisors and increased average production per Financial Advisor 22% to $493,000, resulting in a 31% increase in RJA PCG securities commissions and fees. Average assets under management per RJA Financial Advisor increased 24% to $72 million. RJA continues to benefit from the industry consolidation and the resultant unrest and Financial Advisor turnover. Securities commissions and fees increased 10% in RJFS despite a 6% decline in the number of Financial Advisors, most of which was by design in the strategic upgrading initiative. The increased commission and fee revenue is the result of a 16% increase in average production to $316,000 per Financial Advisor. RJ Ltd’s 4% increase in number of Financial Advisors generated a 6.5% increase in securities commissions and fees. Financial service fees in the prior year included a one-time adjustment of approximately $10 million related to the change in accounting for IRA fees. Excluding this adjustment, financial service fees increased modestly over the prior year. Other revenue increased $9 million, or 12% over the prior year, as a result of increased mutual fund networking and educational and marketing support fees from mutual fund companies. Commission expense within PCG was up 14%, relatively proportional to the increase in commission revenues and fees of 15%. Administrative compensation, occupancy and business development expenses increased proportionately to net revenues. These increases include expenses associated with new branches, sales support staff, home office visits and account transfer fees. Information processing expenses rose only 4% and reflect the benefit of operating leverage despite continued investment in systems upgrades. The decrease in other expense is the result of lower legal costs and settlements as the last of the outstanding large cases related to the 2000 – 2002 market decline were settled in the prior year. Overall PCG margins increased by 16% over the prior year, reaching 12.6%.

24
Year ended September 30, 2006 Compared with the Year ended September 30, 2005 – Private Client Group The Private Client Group's results include a $130 million increase in commission and fee revenues. While commission and fee revenues increased in the PCG segment of all three broker-dealers, the increases were far more significant in RJA and RJ Ltd. where there has been an increase in the number of Financial Advisors due to successful recruiting. RJA added a net 65 employee Financial Advisors and increased the average production from $379,000 in fiscal 2005 to $404,000 in fiscal 2006. In addition, average assets under management per RJA Financial Advisor has increased to an all time high of $58 million from $50 million at September 2005. RJA has successfully focused on recruiting high-producing Financial Advisors and continued to benefit from industry consolidation. RJA commissions and fees increased 23%. RJ Ltd. added 20 employee Financial Advisors and 13 independent contractor Financial Advisors. RJ Ltd. commissions and fees increased 27%. The modest 5.7% increase in RJFS commissions and fees is primarily attributable to a $65.7 million, or 15.6%, increase in fee based business and mutual fund trailing commissions.
PCG net interest earnings increased 36% over the prior fiscal year, a combined result of increased client margin balances (up 9%) and increased customer cash balances, on which a spread is earned. Net interest represented 65% of the segment's pre-tax earnings, down from 78% in fiscal 2005. Financial service fees in the PCG segment increased $26.6 million, or 40% over the prior year. The increase included a one-time adjustment of approximately $10 million related to a change from cash to accrual accounting for IRA fees. The increase in other revenue of $17.2 million is predominantly made up of increased mutual fund networking fees and the newly introduced educational and marketing support fee from mutual fund companies. Commission expenses increased 2% more than commission revenue, the result of an increased number of independent contractors (who receive higher payouts) in RJ Ltd, the advances associated with recruiting at RJA and higher payout levels to more productive Financial Advisors. Administrative and incentive compensation increased due to the increase in the segment’s profits and an increased number of support staff related to the growing number of Financial Advisors in RJA and increased compliance staff in RJFS. Business development expense increased as it includes advertising costs and increased travel and other expenses related to recruiting. Other expenses declined as prior years' expense included historically high legal costs and settlements related to the 2000 – 2002 market decline. PCG margins increased by more than 3% over the prior year, reaching 10.9%. The prior year was negatively impacted by the historically high legal costs and settlements, and the expense of the early stages of the independent contractor business in the UK and at RJ Ltd.

25
Results of Operations – Capital Markets The following table presents consolidated financial information for the Capital Markets segment for the years indicated: Year Ended September 30, % Incr. September 30, % Incr. September 30, 2007 (Decr.) 2006 (Decr.) 2005 ($ in 000's) Revenues:
Institutional Sales Commissions: Equity $ 210,343 (3%) $ 217,840 13% $ 193,001 Fixed Income 44,454 6% 41,830 (37%) 66,431
Underwriting Fees 93,712 11% 84,303 8% 77,900 Mergers & Acquisitions Fees 59,929 34% 44,693 5% 42,576 Private Placement Fees 2,262 (3%) 2,334 (56%) 5,338 Trading Profits 9,262 (58%) 21,876 15% 19,089 Raymond James Tax Credit Funds 35,123 11% 31,710 19% 26,630 Interest 46,772 29% 36,311 74% 20,847 Other 4,641 (29%) 6,522 95% 3,339
Total Revenue 506,498 4% 487,419 7% 455,151 Interest Expense 56,841 23% 46,126 133% 19,838
Net Revenues 449,657 2% 441,293 1% 435,313 Non-Interest Expenses
Sales Commissions 98,903 2% 96,649 (3%) 99,223 Admin & Incentive Comp and Benefit Costs 204,512 2% 200,453 2% 197,170 Communications and Information Processing 32,366 20% 27,084 13% 24,071 Occupancy and Equipment 13,196 9% 12,073 (4%) 12,563 Business Development 23,468 6% 22,177 17% 18,995 Clearance and Other 23,054 16% 19,907 38% 14,395
Total Non-Interest Expense 395,499 5% 378,343 3% 366,417 Income Before Taxes and Minority Interest 54,158 (14%) 62,950 (9%) 68,896 Minority Interest (14,808) (15,271) (8,437)
Pre-tax Earnings $ 68,966 (12%) $ 78,221 1% $ 77,333 Year ended September 30, 2007 Compared with the Year ended September 30, 2006 – Capital Markets The Capital Markets segment pre-tax earnings declined 12% despite a 2% increase in net revenues. Commission revenue was down slightly, the net of a decline in equity commissions related to the decline in commissions generated by underwriting transactions, and an increase in fixed income commissions, a result of the increased volatility. Commissions generated by underwriting transactions reached a record $41 million in the prior year and were only $22 million in the current year. The increase in underwriting fees included increases of $3 million at RJA, despite a decline in the number of deals from 97 to 78, and $3 million at RJ Ltd. on 30 deals versus 29 in the prior year. Merger and acquisition fees were up $15 million, reaching an all time record level of $60 million for the year. During fiscal 2007, RJA closed 15 individual merger and acquisition transactions with fees in excess of $1 million. Trading profits were down 58% from the prior year, reflecting a particularly difficult fixed income trading environment during the fourth quarter. As credit issues drove fixed income product values down there was a flight to quality and the firm’s economic hedges (short positions in US Treasuries) contributed additional losses. Meanwhile, there were also increased losses in equity customer facilitations and OTC market making. Raymond James Tax Credit Fund (“RJTCF”) revenues increased 11% as they invested $375 million for institutional investors versus $277 million in the prior year. Interest revenue increased related to higher average fixed income inventory levels. Expenses were generally in line with revenue growth with two exceptions. Communications and information processing increased predominantly due to increased costs associated with market information systems and software development costs. Other expense reflects a shift to the use of electronic and other non-exchange clearing methods and includes transaction related underwriting expenses incurred by RJTCF. Year ended September 30, 2006 Compared with the Year ended September 30, 2005 – Capital Markets The Capital Markets segment’s revenues and pre-tax profits increased just slightly from the prior year’s record results. Commission revenues in the segment were flat, as a 37% decline in fixed income commissions was offset by the 13% increase in institutional equity commissions, the latter continuing to be fueled by an active new issue market. RJA equity market conditions remained strong, allowing RJA to complete 97 managed or co-managed domestic underwritings, just one short of the record 98 underwritings completed in fiscal 2005. RJ Ltd. completed a record 29 managed or co-managed underwritings, up nine from fiscal 2005. Merger and acquisition fees increased modestly from the prior year's record level, offsetting the decline in private placement fees. Equity Capital Market's most active strategic business units in fiscal 2006 were Energy, Technology, Financial Services and Real Estate.

26
The $16 million increase in interest income, predominantly on RJA's fixed income inventories, was offset by an equal increase in interest expense to finance these inventories. Higher interest income and expenses were primarily the result of higher interest rates. RJTCF's revenues were up 19%, to $31.7 million, as RJTCF invested over $277 million for institutional investors in 78 real estate transactions compared to $250 million in 93 deals in fiscal 2005. Non-interest expense increased 3% over the prior year, with the most significant increase in other expense. This increase was due to increases within the RJTCF variable interest entities (“VIEs”), of which 99% is eliminated through minority interest.
Results of Operations - Asset Management The following table presents consolidated financial information for the Asset Management segment for the years indicated: Year Ended September 30, % Incr. September 30, % Incr. September 30, 2007 (Decr.) 2006 (Decr.) 2005 ($ in 000's) Revenues
Investment Advisory Fees $ 192,763 14% $ 169,055 14% $ 148,393 Other 42,112 9% 38,766 23% 31,452
Total Revenues 234,875 13% 207,821 16% 179,845
Expenses Admin & Incentive Comp and Benefit Costs 72,887 9% 66,689 14% 58,343 Communications and Information Processing 18,360 11% 16,523 12% 14,722 Occupancy and Equipment 4,296 3% 4,163 4% 4,003 Business Development 8,876 6% 8,379 16% 7,216 Investment Advisory Fees 46,368 18% 39,281 19% 33,062 Other 22,945 (3%) 23,588 8% 21,853
Total Expenses 173,732 10% 158,623 14% 139,199 Income Before Taxes and Minority Interest 61,143 24% 49,198 21% 40,646 Minority Interest 626 449 204
Pre-tax Earnings $ 60,517 24% $ 48,749 21% $ 40,442

27
The following table presents assets under management at the dates indicated:
September 30, % Incr. September 30, % Incr. September 30, 2007 (Decr.) 2006 (Decr.) 2005
Assets Under Management: ($ in 000's) Eagle Asset Mgmt., Inc.
Retail $ 6,925,930 24% $ 5,600,806 19% $ 4,719,275 Institutional 7,601,374 11% 6,862,611 1% 6,823,906
Total Eagle 14,527,304 17% 12,463,417 8% 11,543,181 Heritage Family of Mutual Funds
Money Market 5,524,598 (12%) 6,306,508 4% 6,058,612 Other 3,956,677 32% 3,004,816 19% 2,534,975
Total Heritage 9,481,275 2% 9,311,324 8% 8,593,587 Raymond James Consulting Services 9,638,691 22% 7,915,168 20% 6,573,448 Awad Asset Management 622,860 (37%) 996,353 (18%) 1,222,199 Freedom Accounts 8,144,920 59% 5,122,733 105% 2,496,772
Total Assets Under Management 42,415,050 18% 35,808,995 18% 30,429,187
Less: Assets Managed for Affiliated Entities (5,305,506) 33% (3,991,281) 36% (2,936,804)
Third Party Assets Under Management $ 37,109,544 17% $ 31,817,714 16% $ 27,492,383
Year ended September 30, 2007 Compared with the Year ended September 30, 2006 - Asset Management The Asset Management segment has benefited significantly from the successful recruiting in PCG. New Financial Advisors bring additional client assets, a portion of which is often directed into an asset management alternative. In addition, both Eagle and Heritage have been successful in their efforts to increase their presence on outside broker-dealer platforms. Eagle’s retail sales to outside broker-dealers were 33% of their total 2007 sales, while Heritage’s were 78% of their total sales. Revenues in this segment increased 13% on a 17% increase in assets under management, as there continues to be some fee compression. Expenses increased only 10%, generating a 24% increase in pre-tax earnings and a 26% margin as a result of operating leverage. Money market fund balances declined as a result of the transfer of $1.3 billion to RJBank in March 2007. Year ended September 30, 2006 Compared with the Year ended September 30, 2005 - Asset Management Investment Advisory fees increased over $20 million, or 14%, on a 16% increase in assets under management. Increases in assets under management were positively impacted by the recruiting of RJA Financial Advisors. New Financial Advisors brought significant assets into the Company's asset management programs, particularly Eagle and Raymond James Consulting Services (“RJCS”). New managed assets brought in by RJA Financial Advisors totaled $3.9 billion for fiscal 2006, a 70% increase over $2.3 billion added in fiscal 2005. Eagle's total retail assets increased 19% over the prior year. Of Eagle's retail asset total, 35% were introduced by Financial Advisors outside the Raymond James system. Account cancellations exceeded sales in Eagle's institutional accounts due to the loss of a few significant accounts and the closing of the Institutional Growth division in September. RJCS offers 40 independent investment advisors to the Company's clients. Assets managed within the program increased 20% over the prior year. The Company's managed mutual fund product (Freedom) continued to experience significant growth (105%) as this concept continues to be embraced by clients and Financial Advisors. Heritage Asset Management's non-money market funds increased 19% with 65% of the sales through broker-dealers outside of the Raymond James family. Heritage money market accounts increased 4% despite the movement of just over $1 billion to RJBank sweep option during the year. Expenses in this segment increased $19 million (14%) with $8 million of that increase in compensation. The Compensation increase included increased salary expense, costs associated with closing Eagle's institutional growth division, and increased incentive compensation related to the 21% increase in pre-tax profits. The other notable increase in expense was a $6.2 million (19%) increase in investment advisory fees related to the growth in assets in accounts managed by independent investment advisors.

28
Results of Operations - RJBank The following table presents consolidated financial information for RJBank for the years indicated:
Year Ended
September 30, % Incr. September 30, % Incr. September 30, 2007 (Decr.) 2006 (Decr.) 2005 ($ in 000's) Interest Earnings
Interest Income $ 278,248 144% $ 114,065 153% $ 45,017 Interest Expense 193,747 163% 73,529 234% 22,020
Net Interest Income 84,501 108% 40,536 76% 22,997
Other Income 1,324 111% 627 45% 431 Net Revenues 85,825 109% 41,163 76% 23,428
Non-Interest Expense
Employee Compensation and Benefits 7,778 27% 6,135 14% 5,388 Communications and Information Processing 1,052 16% 907 14% 799 Occupancy and Equipment 719 14% 629 32% 478 Provision for Loan Losses and Unfunded
Commitments 32,150 134% 13,760 891% 1,388 Other 17,121 359% 3,729 218% 1,171
Total Non-Interest Expense 58,820 134% 25,160 173% 9,224 Pre-tax Earnings $ 27,005 69% $ 16,003 13% $ 14,204
Year ended September 30, 2007 Compared with the Year ended September 30, 2006 - RJBank The Company completed its second bulk transfer of cash balances into the RJBank Deposit Program in March 2007, moving another $1.3 billion. This, combined with organic growth from the influx of new client assets, resulted in a $2.6 billion increase in average deposit balances. This increase in average deposit balances provided the funding for the $1.6 billion increase in average loan balances. This increase was 38% purchased residential mortgage pools and 62% corporate loans, 98% of which are purchased interests in corporate loan syndications with the remainder originated by RJBank. As a result of this growth, RJBank net interest income increased 108% to $84.5 million. Due to robust loan growth, the associated allowance for loan losses that are established upon recording a new loan and making new unfunded commitments required a provision of over $32 million in 2007. Accordingly, RJBank’s pre-tax income increased only 69%. During periods of growth when new loans are originated or purchased, an allowance for loan losses is established for potential losses inherent in those new loans. Accordingly, a robust period of growth generally results in charges to earnings in that period, while the benefits of higher interest earnings are realized in later periods. Year ended September 30, 2006 Compared with the Year ended September 30, 2005 - RJBank Assets at RJBank grew a substantial $1.8 billion during the year. The increase was driven by a $1.7 billion increase in deposits, $1.3 billion of which were redirected from the Company’s Heritage Cash Trust or customer brokerage accounts, representing the introduction of a new sweep program for certain brokerage accounts. This alternative offers clients a money market equivalent interest rate and FDIC insurance. The Company intends to expand this offering over the next several years, transferring an additional $2 to $4 billion. During the year, RJBank deployed $1.3 billion of the increased deposits into loans. Purchased residential loan pools increased $700 million and corporate loans increased $600 million. This growth, combined with increased rates, generated an increase in net interest income of nearly $18 million. Pre-tax income increased only $1.8 million, due to the $13.8 million provision for loan loss associated with the increase in loans outstanding.

29
The following table presents average balance data and operating interest income and expense data for the Company's banking operations, as well as the related interest yields and rates and interest spread for the years indicated:
Year Ended September 30, 2007 September 30, 2006 September 30, 2005 Operating Average Operating Average Operating Average Average Interest Yield/ Average Interest Yield/ Average Interest Yield/
Balance Inc./Exp.(2) Cost Balance Inc./Exp. Cost Balance Inc./Exp. Cost ($ in 000’s)
(continued on next page) Interest-Earning Banking Assets:
Loans, Net of Unearned Income (1) $ 3,180,331 $204,959 6.44% $ 1,601,708 $ 95,366 5.95% $ 800,566 $ 37,163 4.64%
Reverse Repurchase Agreements 878,822 46,438 5.28% 122,301 6,497 5.31% - - -
Agency Mortgage backed Securities 199,514 11,086 5.56% 157,454 7,833 4.97% 181,419 5,561 3.07%
Non-agency Collateralized Mortgage Obligations 229,108 12,808 5.59% 21,204 1,151 5.43% 5,791 208 3.59%
Other Government Agency Obligations - - - 8,314 404 4.86% - - -
Corporate Debt and Asset Backed Securities - - - 8,839 499 5.65% 2,986 109 3.65%
Money Market Funds, Cash and Cash Equivalents 49,979 2,533 5.07% 34,469 1,607 4.66% 59,869 1,778 2.97% FHLB Stock 7,121 424 5.95% 12,936 708 5.47% 5,053 198 3.92%
Total Interest-Earning Banking Assets 4,544,875 278,248 6.12% 1,967,225 114,065 5.80% 1,055,684 45,017 4.26%
Non-Interest-Earning Banking Assets 16,410 13,329 8,327
Total Banking Assets $ 4,561,285 $ 1,980,554 $ 1,064,011
Interest-Bearing Banking Liabilities:
Retail Deposits: Certificates of Deposit $ 239,478 $ 11,021 4.60% $ 269,949 $ 10,872 4.03% $ 191,097 $ 6,577 3.44% Money Market, Savings,
and NOW (2) Accounts 3,890,955 179,741 4.62% 1,293,104 51,313 3.97% 698,895 12,041 1.72% FHLB Advances 56,932 2,985 5.24% 233,428 11,344 4.86% 76,635 3,402 4.44%
Total Interest-Bearing
Banking Liabilities 4,187,365 193,747 4.63% 1,796,481 73,529 4.09% 966,627 22,020 2.28% Non-Interest-Bearing Banking Liabilities 98,117 11,781 7,933
Total Banking
Liabilities 4,285,482 1,808,262 974,560 Total Banking
Shareholder's Equity 275,803 172,292 89,451
Total Banking Liabilities and Shareholder's Equity $ 4,561,285 $ 1,980,554 $ 1,064,011
(continued on next page)

30
Year Ended September 30, 2007 September 30, 2006 September 30, 2005 Operating Average Operating Average Operating Average Average
Interest Yield/ Average Interest Yield/ Average Interest Yield/ Balance
Inc./Exp. Cost Balance Inc./Exp. Cost Balance Inc./Exp. Cost ($ in 000’s)
(continued) Excess of Interest- Earning Banking Assets Over Interest- Bearing Banking Liabilities/Net Operating Interest Income $ 357,510 $ 84,501 $ 170,744 $ 40,536 $ 89,057 $ 22,997
Bank Net Operating
Interest (3): Spread 1.49% 1.71% 1.98% Margin (Net Yield on
Interest- Earning Bank Assets) 1.86% 2.06% 2.18%
Ratio of Interest Earning Banking Assets to Interest- Bearing Banking Liabilities 108.54% 109.50% 109.21%
Return On Average (4): Total Banking Assets 0.38% 0.48% 0.81% Total Banking
Shareholder's Equity 6.27% 5.54% 9.59% Average Equity to Average Total Banking Assets 6.05% 8.70% 8.41%
(1) Corporate loans purchased are recorded in the loan portfolio as of the earlier of the settlement date or the delayed settlement compensation commencement date.
Unsettled floating rate loans recognized in the loan portfolio earn compensation from the loan’s seller for the delayed settlement at the net margin over LIBOR. The funded equivalent yield of Loans, Net of Unearned Income above would be 6.58% for 2007 if the unsettled loans had earned at the full loan rate. Additionally, nonaccrual loans are included in the average loan balances. Income on such nonaccrual loans is recognized on a cash basis. Fee income on loans included in interest income for the years ended September 2007, 2006, and 2005, respectively was $8.1 million, $3.5 million, and $0.7 million.
(2) Negotiable Order of Withdrawal (“NOW”) account. (3) The decline in interest spreads is due to the growth in the deposit balances from two bulk transfers of client deposits of $1.3 billion each to RJBank, which were then
invested over time. This process left significant cash balances invested at low rates until the cash could be deployed and used to purchase loans, depressing overall interest spreads.
(4) RJBank has gone through a period of rapid loan growth and accordingly established allowances for loan losses for potential losses inherent in the loan portfolios. These
charges to earnings have a negative impact on returns during periods of loan growth.

31
Increases and decreases in operating interest income and operating interest expense result from changes in average balances (volume) of interest-earning banking assets and liabilities, as well as changes in average interest rates. The following table shows the effect that these factors had on the interest earned on RJBank's interest-earning assets and the interest incurred on its interest-bearing liabilities. The effect of changes in volume is determined by multiplying the change in volume by the previous year's average yield/cost. Similarly, the effect of rate changes is calculated by multiplying the change in average yield/cost by the previous year's volume. Changes applicable to both volume and rate have been allocated proportionately.
2007 Compared to 2006 2006 Compared to 2005 Increase (Decrease) Due To Increase (Decrease) Due To Volume Rate Total Volume Rate Total (in 000’s) Interest Revenue Interest-Earning Banking Assets:
Loans, Net of Unearned Income $ 93,992 $ 15,601 $ 109,593 $ 37,190 $ 21,013 $ 58,203 Reverse Repurchase Agreements 40,189 (248) 39,941 6,497 - 6,497 Agency Mortgage Backed Securities 2,092 1,161 3,253 (735) 3,007 2,272 Non-agency Collateralized Mortgage Obligations 11,285 372 11,657 554 389 943 Other Government Agency Obligations (404) - (404) 404 - 404 Corporate Debt and Asset Backed Securities (499) - (499) 214 176 390 Money Market Funds, Cash and Cash Equivalents 723 203 926 (754) 583 (171) FHLB Stock (318) 34 (284) 309 201 510
Total Interest-Earning Banking Assets $ 147,060 $ 17,123 $ 164,183 $ 43,679 $ 25,369 $ 69,048
Interest Expense Interest-Bearing Banking Liabilities:
Retail Deposits: Certificates Of Deposit $ (1,227) $ 1,377 150 $ 2,714 $ 1,581 $ 4,295 Money Market, Savings and
NOW Accounts 103,372 25,055 128,427 10,272 29,000 39,272 FHLB Advances (8,577) 218 (8,359) 6,960 982 7,942
Total Interest-Bearing Banking Liabilities 93,568 26,650 120,218 19,946 31,563 51,509
Change in Net Operating Interest Income $ 53,492 $ (9,527) $ 43,965 $ 23,733 $ (6,194) $ 17,539

32
Results of Operations – Emerging Markets
Year Ended September 30, % Incr. September 30, % Incr. September 30, 2007 (Decr.) 2006 (Decr.) 2005 ($ in 000's)Revenues
Securities Commissions and Investment Banking Fees $ 41,879 (4%) $ 43,703 46% $ 29,928
Investment Advisory Fees 2,846 48% 1,919 (34%) 2,890 Interest Income 4,042 11% 3,647 90% 1,919 Trading Profits 5,254 41% 3,720 18% 3,141 Other 5,062 123% 2,274 156% 890
Total Revenues 59,083 7% 55,263 43% 38,768 Interest Expense 1,075 (27%) 1,467 195% 497
Net Revenues 58,008 8% 53,796 41% 38,271 Non-Interest Expense
Compensation Expense 28,071 (4%) 29,185 48% 19,758 Other Expense 23,302 17% 19,867 93% 10,294
Total Non-Interest Expense 51,373 5% 49,052 63% 30,052 Minority Interest 2,995 1,887 2,292
Pre-tax Earnings $ 3,640 27% $ 2,857 (52%) $ 5,927 Year ended September 30, 2007 Compared with the Year ended September 30, 2006 – Emerging Markets This segment consists of the results of the Company’s joint ventures in Argentina, Uruguay and Turkey. Securities commissions declined in Turkey, increased in Argentina, and the joint venture in India generated $2 million in commissions in fiscal 2006 whereas none were included in fiscal 2007 due to the Company’s sale of its interest in this joint venture early in 2007. Investment banking revenues were flat. Trading profits increased $3.5 million in Argentina, stemming from a large volume of ADR trades. Other income includes the $2.5 million gain on the sale of the Company’s interest in its joint venture in India. The $2 million increase in expense is predominantly related to the accrual of estimated tax liabilities in Turkey. Year ended September 30, 2006 Compared with the Year ended September 30, 2005 – Emerging Markets This segment consists of the results of the Company’s joint ventures in India, Argentina, Uruguay and Turkey. Securities commissions increased $9 million or 31% over the prior year. The vast majority of this increase was in the Company’s joint venture in Turkey. Investment banking revenues were $2.7 million, primarily from a single large Latin American underwriting fee. Investment Advisory fees declined as the Company generated $1 million less in asset management fees in India. The $20 million increase in expense is made up predominantly of a $10 million increase in compensation related to increased revenues and increased other expense related to the accrual of an estimated tax liability in Turkey.
Results of Operations – Stock Loan/Borrow
Year Ended September 30, % Incr. September 30, % Incr. September 30, 2007 (Decr.) 2006 (Decr.) 2005 ($ in 000's) Interest Income and Expense
Interest Income $ 68,685 15% $ 59,947 88% $ 31,876 Interest Expense 59,276 25% 47,593 108% 22,873
Net Interest Income 9,409 (24%) 12,354 37% 9,003 Expenses 4,406 1% 4,353 43% 3,041
Pre-tax Earnings $ 5,003 (37%) $ 8,001 34% $ 5,962

33
Year ended September 30, 2007 Compared with the Year ended September 30, 2006 – Stock Loan/Borrow The Company’s stock borrow balances averaged $1.1 billion during fiscal year 2007 vs. $1.0 billion in fiscal 2006. The Company’s stock loan balances are predominantly the result of a matched-book however, box loan/borrow balances are also carried. As the Company’s stock loan business is predominantly a matched-book business, stock borrow balances were similar. Average spreads decreased from 2.0% in fiscal 2006 to 0.5% in 2007, resulting in a 24% decrease in net interest income and a 37% decrease in pre-tax profits. Year ended September 30, 2006 Compared with the Year ended September 30, 2005 – Stock Loan/Borrow The Company’s stock borrow balances averaged $1.0 billion during fiscal year 2006 vs. $1.1 billion in fiscal 2005. As the Company’s stock loan business is predominantly a matched-book business, stock loan balances were similar. Average spreads increased from 0.9% in fiscal 2005 to 2.0% in 2006 largely due to rising interest rates, resulting in a 37% increase in net interest income and a 34% increase in pre-tax profits. Results of Operations – Proprietary Capital The following table presents consolidated financial information for the Propriety Capital segment for the years indicated:
Year Ended September 30, % Incr. September 30, % Incr. September 30, 2007 (Decr.) 2006 (Decr.) 2005 ($ in 000's) Revenues
Investment Advisory Fees $ 746 (54%) $ 1,625 (38%) $ 2,608 Other 7,534 (52%) 15,687 88% 8,344
Total Revenues 8,280 (52%) 17,312 58% 10,952
Expenses Compensation Expense 2,348 (21%) 2,959 50% 1,976 Other Expenses 747 (26%) 1,003 114% 469
Total Expenses 3,095 (22%) 3,962 62% 2,445 Minority Interest 1,608 4,882 4,325
Pre-tax Earnings $ 3,577 (58%) $ 8,468 102% $ 4,182
Year ended September 30, 2007 Compared with the Year ended September 30, 2006 – Proprietary Capital Proprietary Capital results are driven by the valuations made within Raymond James Capital, Inc., Raymond James Capital Partners, L.P., Ballast Point Ventures, L.P., the EIF Funds and the third party private equity funds in which RJF is invested. Fiscal 2006 included write-ups within Ballast Point of $3.6 million versus a write-down of $1 million in fiscal 2007. Fiscal 2007 included valuation adjustments to the RJF private equity investment portfolio. Year ended September 30, 2006 Compared with the Year ended September 30, 2005 – Proprietary Capital Fiscal 2006 included the $3.6 million write-up on Ballast Point investments. Fiscal 2006 also included net valuation adjustments to the RJF private equity investment portfolio of $3.2 million versus $1.4 million in 2005.
Results of Operations - Other The following table presents consolidated financial information for the Other segment for the years indicated:
Year Ended September 30, % Incr. September 30, % Incr. September 30, 2007 (Decr.) 2006 (Decr.) 2005
($ in 000's) Revenues
Interest Income $ 7,773 89% $ 4,114 (10%) $ 4,588 Other 6,659 (65%) 19,197 381% 3,990
Total Revenues 14,432 (38%) 23,311 172% 8,578 Other Expense 10,780 (11%) 12,063 11% 10,902
Pre-tax Earnings (Loss) $ 3,652 (68%) $ 11,248 584% $ (2,324)
Year ended September 30, 2007 Compared with the Year ended September 30, 2006 - Other Revenue in the Other segment includes $1 million in gains on corporate investments, including Eagle asset managed accounts, and nearly $3 million in proceeds from company owned life insurance. Interest income represents earnings on available corporate cash balances. Expenses in this segment are predominantly executive compensation.

34
Year ended September 30, 2006 Compared with the Year ended September 30, 2005 - Other Revenue in the Other segment includes the $16.1 million pre-tax gain from the sale of the Company's NYSE and Montreal Exchange seats, and approximately $3 million from other corporate investments. Statement of Financial Condition Analysis The Company’s statement of financial condition consists primarily of cash and cash equivalents (a large portion of which are segregated for the benefit of customers), receivables and payables. The items represented in the statement of financial condition are primarily liquid in nature, providing the Company with flexibility in financing its business. Total assets of $16.3 billion at September 30, 2007 were up approximately 41% over September 30, 2006. Most of this increase is due to the significant increases in reverse repurchase agreements, brokerage client cash deposits (leading to a similar increase in segregated cash balances on the asset side), and growth of RJBank, with the increased loan balances being largely funded by deposits. RJBank loan balances increased significantly as the Company continued to increase its use of a newly introduced bank sweep offering to brokerage customers. The Company initiated the first phase of this option in July 2006 and the second phase took place in March 2007. The Company plans to continue to expand use of this offering for the next several years, which will result in continued growth in RJBank balances. The other significant increase in assets was in Available For Sale Securities. Trade and Other Payables increased $311.9 million from the prior year primarily due to RJBank’s purchases of $300.6 million in syndicated loans which were not settled as of September 30, 2007. The broker-dealer gross assets and liabilities, including trading inventory, stock loan/borrow, receivables and payables from/to brokers, dealers and clearing organizations and clients fluctuate with the Company's business levels and overall market conditions.
Liquidity and Capital Resources Cash provided by operating activities during the fiscal year ended September 30, 2007 was approximately $436.6 million, primarily attributable to the increase in brokerage client deposits (directly correlated to the increase in segregated assets), an increase in payables associated with the Company’s stock loan/borrowed business, an increase in payables to broker-dealers and clearing organizations, an increase in securities sold under agreements to repurchase, and an increase in trading instruments sold but not yet purchased. This was partially offset by an increase in segregated assets, and an increase in receivables from brokerage clients. Investing activities used $2.9 billion, which is primarily due to activity at RJBank, including loans originated and purchased, purchases of securities under agreements to resell, and purchases of available for sale securities. This was partially offset by loan repayments at RJBank and maturations and repayments of available for sale securities. Financing activities provided $2.7 billion, the result of an increase in deposits at RJBank and cash provided from the exercise of stock options and employee stock purchases. This was partially offset by the payment of cash dividends and the repayments of borrowings. At September 30, 2007 and September 30, 2006, the Company had loans payable of $122.6 million and $141.6 million, respectively. The balance at September 30, 2007 is comprised of a $65 million loan for its home-office complex, $55 million in Federal Home Loan Bank advances (RJBank), and various short-term borrowings totaling $2.6 million (used to fund increased levels of trading instruments). In addition, the Company and its subsidiaries have the following lines of credit: RJF has a committed $200 million line of credit, RJA has uncommitted bank lines of credit aggregating $1.035 billion with commercial banks, Raymond James Credit Corporation has a line of credit for $25 million, and RJ Ltd. has a CDN$40 million uncommitted line of credit (see Note 10 of the Notes to the Consolidated Financial Statements for further information on the Company's lines of credit). There were no outstanding balances against these lines of credit at September 30, 2007. The Company’s committed $200 million line of credit is subject to a 0.125% per annum facility fee. RJBank has $55.0 million in FHLB advances outstanding at September 30, 2007, which are comprised of one short-term, fixed rate advance and several long-term, fixed rate advances. RJBank had $1.32 billion in credit available from the FHLB at September 30, 2007. During the three months ended June 30, 2007, RJA entered into a $500 million uncommitted tri-party repurchase agreement line of credit. Under this agreement, the Company pledges certain of its trading inventory as collateral against borrowings on this line. The required market value of the collateral is generally 102% of the cash borrowed. The rate is set each day at 25 basis points over the opening Fed Funds rate and this agreement can be terminated by any party on any business day. Under this agreement, there were secured short-term borrowings of $195,000,000 outstanding at September 30, 2007 which are included in Securities Sold Under Agreement to Repurchase. The Company’s joint ventures in Turkey and Argentina have multiple settlement lines of credit. The Company has guaranteed certain of these settlement lines of credit as follows: four in Turkey totaling $22.5 million and one in Argentina for $3 million. At September 30, 2007, there were no outstanding balances on the settlement lines in Argentina or Turkey. At September 30, 2007, the aggregate unsecured settlement lines of credit available were $76.5 million, and there were outstanding balances of $2.7 million on these lines. The Company has also from time to time authorized performance guarantees for the completion of trades with counterparties in Argentina and Turkey. At September 30, 2007, there were no outstanding performance guarantees in Argentina or Turkey. As of September 30, 2007, the Company's liabilities are comprised primarily of brokerage client payables of $5.7 billion at the broker-dealer subsidiaries and deposits of $5.6 billion at RJBank, as well as deposits held on stock loan transactions of $1.3 billion. The Company primarily acts as an intermediary in stock loan/borrow transactions. As a result, the liability associated with the stock loan transactions is related to the $1.3 billion receivable comprised of the Company's cash deposits for stock borrowed transactions. To meet its obligations to clients, the Company has approximately $4.8 billion in cash and segregated assets segregated. The Company also has client brokerage receivables of $1.7 billion and $4.7 billion in loans at RJBank. The Company will continue its implementation of a new cash sweep option available to its clients from RJBank. This new cash sweep option will require substantial capital to be contributed to RJBank to meet regulatory requirements, and therefore may require the Company to infuse an additional $150 to $200 million over the next several years for this purpose.

35
As of September 30, 2007, RJBank had not settled the purchases of $300.6 million in syndicated loans. These loans are expected to be settled during the three months ended December 31, 2007. The Company has committed a total of $46.6 million, in amounts ranging from $200,000 to $2 million, to 41 different independent venture capital or private equity partnerships. As of September 30, 2007, the Company has invested $30.4 million of that amount and has received $27 million in distributions. The Company expects to increase its net investment in external private equity funds up to $50 million. Additionally, the Company is the general partner in two internally sponsored private equity limited partnerships to which it has committed $14 million. Of that amount, the Company has invested $12.2 million and has received $8.6 million in distributions as of September 30, 2007. The Company’s Board of Directors approved the use of up to $200 million in mezzanine financing to facilitate investment banking transactions. As of September 30, 2007, the Company had not utilized this investment facility. During the first quarter of fiscal year 2008, the Company entered into a credit agreement and pursuant to this agreement, the Company funded a $37.5 million loan participation. The Board of Directors also approved the use of up to $50 million for investment in proprietary merchant banking opportunities. As of September 30, 2007, the Company has invested $13.1 million. Management has been authorized by the Board of Directors to repurchase its common stock at their discretion for general corporate purposes. There is no formal stock repurchase plan at this time. In May 2004 the Board authorized the repurchase of up to $75 million of shares. As of September 30, 2007 the unused portion of this authorization was $65.4 million. The Company has committed to lend to or guarantee obligations of its wholly owned subsidiary, RJTCF, of up to $100 million upon request, subject to certain limitations as well as annual review and renewal. RJTCF borrows in order to invest in partnerships which purchase and develop properties qualifying for tax credits. These investments in project partnerships are then sold to various tax credit funds, which have third party investors, and for which RJTCF serves as the managing member or general partner. RJTCF typically sells these investments within 90 days of their acquisition, and the proceeds from the sales are used to repay RJTCF’s borrowings. Additionally, RJTCF may make short-term loans or advances to project partnerships on behalf of the tax credit funds in which it serves as managing member or general partner. At September 30, 2007, cash funded to invest in either loans or investments in project partnerships was $38.7 million. In addition, at September 30, 2007, RJTCF is committed to additional future fundings of $6.1 million related to project partnerships that have not yet been sold to various tax credit funds. In September 2007, Sirchie Acquisition Company, LLC (“SAC”), a 100% owned indirect subsidiary of the Company, entered into two agreements. Under the Stock Purchase Agreement SAC will acquire 51% of the common stock of Law Enforcement Associates Corporation from two sellers. Under the Stock and Asset Purchase Agreement with several sellers, SAC will acquire substantially all of the business, assets, and properties of Sirchie Finger Print Laboratories, Inc., the assets or stock of several other companies and certain real estate. SAC and sellers negotiated a single purchase price for all of the items to be acquired under the two agreements. At closing, one of the sellers will become a member of SAC. The Company’s share of the purchase price obligation is approximately $50 million. The closing of the two agreements is expected to occur before January 31, 2008. The Company believes its existing assets, which are highly liquid in nature, together with funds generated from operations, should provide adequate funds for continuing operations. The Company is the lessor in a leveraged commercial aircraft transaction with Continental Airlines, Inc. (“Continental”). The Company's ability to realize its expected return is dependent upon this airline’s ability to fulfill its lease obligation. In the event that this airline defaults on its lease commitment and the Trustee for the debt holders is unable to re-lease or sell the plane with adequate terms, the Company would suffer a loss of some or all of its investment. The value of the Company’s leveraged lease with Continental was approximately $9.9 million as of September 30, 2007. The Company's equity investment represented 20% of the aggregate purchase price; the remaining 80% was funded by public debt issued in the form of equipment trust certificates. The residual value of the aircraft at the end of the lease term of approximately 17 years is projected to be 15% of the original cost. This lease expires in May 2014. Although Continental remains current on its lease payments to the Company, the inability of Continental to make its lease payments, or the termination or modification of the lease through a bankruptcy proceeding, could result in the write-down of the Company's investment and the acceleration of certain income tax payments. The Company continues to monitor this lessee for specific events or circumstances that would increase the likelihood of a default on Continental’s obligations under this lease. The Company was also the lessor in a leveraged commercial aircraft transaction with Delta Air Lines, Inc. (“Delta”). Delta filed for bankruptcy protection on September 14, 2005. Accordingly, the Company recorded a $6.5 million pre-tax charge in 2005 to fully reserve the balance of its investment in the leveraged lease of an aircraft to Delta. The Company had taken a $4 million pre-tax charge in 2004 to partially reserve for this investment. No amount of these charges represented a cash expenditure. During the second quarter of fiscal 2007, the Company sold its interest in the Delta transaction for $2 million, which was recognized as a pre-tax gain within Other Revenue. Upon closing, certain income tax obligations of approximately $8.5 million were accelerated and paid during the quarter. These tax payments did not impact net earnings, as these amounts were previously recorded as deferred tax liabilities. The Company’s Turkish affiliate was assessed for the year 2001 approximately $7.6 million by the Turkish tax authorities. This affiliate is vigorously contesting most aspects of this assessment and has filed an appeal with the Turkish Counsel of State. A significant portion of the matters at issue involved the activities of an employee terminated in 2004. Audits of 2002 through 2004 are anticipated and their outcome is unknown in light of the change in methodology from the prior year’s audit and the pending litigation. As such, the potential tax liability combined for these subsequent years could range from a few hundred thousand dollars to $7.5 million. As of September 30, 2007, this affiliate had total capital of approximately $12.2 million, of which the Company owns approximately 73%. The Company's broker-dealer subsidiaries are subject to requirements of the SEC and the IDA relating to liquidity and capital standards. The domestic broker-dealer subsidiaries of the Company are subject to the requirements of the Uniform Net Capital Rule (Rule 15c3-1) under the Securities Exchange Act of 1934.

36
RJA, a member firm of FINRA, is also subject to the rules of FINRA, whose requirements are substantially the same. Rule 15c3-1 requires that aggregate indebtedness, as defined, not exceed 15 times net capital, as defined. Rule 15c3-1 also provides for an “alternative net capital requirement”, which RJA, RJFS, and HFD have elected. It requires that minimum net capital, as defined, be equal to the greater of $250,000 or two percent of Aggregate Debit Items arising from client transactions. FINRA may require a member firm to reduce its business if its net capital is less than four percent of Aggregate Debit Items and may prohibit a member firm from expanding its business and declaring cash dividends if its net capital is less than five percent of Aggregate Debit Items. RJA, RJFS, and HFD all had net capital in excess of minimum requirements as of September 30, 2007. RJ Ltd. is subject to the Minimum Capital Rule (By-Law No. 17 of the IDA) and the Early Warning System (By-Law No. 30 of the IDA). The Minimum Capital Rule requires that every member shall have and maintain at all times Risk Adjusted Capital greater than zero calculated in accordance with Form 1 (Joint Regulatory Financial Questionnaire and Report) and with such requirements as the Board of Directors of the IDA may from time to time prescribe. Insufficient Risk Adjusted Capital may result in suspension from membership in the stock exchanges or the IDA. The Early Warning System is designed to provide advance warning that a member firm is encountering financial difficulties. This system imposes certain sanctions on members who are designated in Early Warning Level 1 or Level 2 according to its capital, profitability, liquidity position, frequency of designation or at the discretion of the IDA. Restrictions on business activities and capital transactions, early filing requirements, and mandated corrective measures are sanctions that may be imposed as part of the Early Warning System. RJ Ltd. was not in Early Warning Level 1 or Level 2 during fiscal 2007 or 2006. RJBank is subject to various regulatory and capital requirements administered by the federal banking agencies. Failure to meet minimum capital requirements can initiate certain mandatory - and possibly additional discretionary - actions by regulators. Under capital adequacy guidelines and the regulatory framework for prompt corrective action, RJBank must meet specific capital guidelines that involve quantitative measures of RJBank's assets, liabilities, and certain off-balance sheet items as calculated under regulatory accounting practices. RJBank's capital amounts and classification are also subject to qualitative judgments by the regulators about components, risk weightings, and other factors. Quantitative measures established by regulation to ensure capital adequacy require RJBank to maintain minimum amounts and ratios of Total and Tier I Capital (as defined in the regulations) to risk-weighted assets (as defined). Management believes, as of September 30, 2007, that the Bank meets all capital adequacy requirements to which it is subject.
Critical Accounting Policies The Company’s financial statements and accompanying notes are prepared in accordance with accounting principles generally accepted in the U.S. The following is a summary of the Company’s critical accounting policies. For a full description of these and other accounting policies, see Note 1 of the Notes to the Consolidated Financial Statements. The Company believes that of its significant accounting policies, those described below involve a high degree of judgment and complexity. These critical accounting policies require estimates and assumptions that affect the amounts of assets, liabilities, revenues and expenses reported in the consolidated financial statements. Due to their nature, estimates involve judgments based upon available information. Actual results or amounts could differ from estimates and the difference could have a material impact on the consolidated financial statements. Therefore, understanding these policies is important in understanding the reported results of operations and the financial position of the Company. Valuation of Securities and Other Assets “Trading instruments” and “Available for sale securities” are reflected in the Consolidated Statements of Financial Condition at fair value or amounts that approximate fair value. In accordance with SFAS 115, “Accounting for Certain Investments in Debt and Equity Securities”, unrealized gains and losses related to these financial instruments are reflected in net income or other comprehensive income, depending on the underlying purpose of the instrument. The following table presents the Company’s trading instruments and available for sale securities segregated into trading securities (i.e., non-derivative), derivative contracts, and available for sale securities:
September 30, 2007
Financial
Instruments Owned at Fair Value
Financial Instruments Sold
but not yet Purchased at Fair Value
(in 000’s) Trading Securities $ 437,158 $ 141,284 Derivative Contracts 30,603 8,445 Available for Sale Securities 569,952 -
Total $ 1,037,713 $ 149,729

37
Trading Securities, Available for Sale Securities and Derivative Contracts When available, the Company uses prices from independent sources such as listed market prices, or broker or dealer price quotations to derive the fair value of the instruments. For investments in illiquid, privately held or other securities that do not have readily determinable fair values, the Company uses estimated fair values as determined by management. Fair values for derivative contracts are obtained from pricing models that consider current market and contractual prices for the underlying financial instruments, as well as time value and yield curve or volatility factors underlying the positions. The following table presents the carrying value of trading securities, available for sale securities, and derivative contracts for which fair value is measured based on quoted prices or other independent sources versus those for which fair value is determined by management:
September 30, 2007
Financial Instruments Owned at Fair
Value
Financial Instruments Sold
but not yet Purchased at Fair Value
(in 000’s) Fair Value Based on Quoted Prices and Independent Sources $ 1,003,543 $ 141,284 Fair Value Determined by Management 34,170 8,445
Total $ 1,037,713 $ 149,729 Investment in Leveraged Leases The Company is the lessor in a leveraged commercial aircraft transaction with Continental. The Company's ability to realize its expected return is dependent upon this airline’s ability to fulfill its lease obligation. In the event that this airline defaults on its lease commitment and the Trustee for the debt holders is unable to re-lease or sell the plane with adequate terms, the Company would suffer a loss of some or all of its investment. The value of the Company’s leveraged lease with Continental was approximately $9.9 million as of September 30, 2007. The Company's equity investment represented 20% of the aggregate purchase price; the remaining 80% was funded by public debt issued in the form of equipment trust certificates. The residual value of the aircraft at the end of the lease term of approximately 17 years is projected to be 15% of the original cost. This lease expires in May 2014. Although Continental remains current on its lease payments to the Company, the inability of Continental to make its lease payments, or the termination or modification of the lease through a bankruptcy proceeding, could result in the write-down of the Company's investment and the acceleration of certain income tax payments. The Company continues to monitor this lessee for specific events or circumstances that would increase the likelihood of a default on Continental’s obligations under this lease. The Company was also the lessor in a leveraged commercial aircraft transaction with Delta. Delta filed for bankruptcy protection on September 14, 2005. Accordingly, the Company recorded a $6.5 million pre-tax charge in 2005 to fully reserve the balance of its investment in the leveraged lease of an aircraft to Delta. The Company had taken a $4 million pre-tax charge in 2004 to partially reserve for this investment. No amount of these charges represented a cash expenditure. During the second quarter of fiscal 2007, the Company sold its interest in the Delta transaction for $2 million, which was recognized as a pre-tax gain within Other Revenue. Upon closing, certain income tax obligations of approximately $8.5 million were accelerated and paid during the quarter. These tax payments did not impact net earnings, as these amounts were previously recorded as deferred tax liabilities. Goodwill Goodwill is related to the acquisitions of Roney & Co. (now part of RJA) and Goepel McDermid, Inc. (now called Raymond James Ltd.). This goodwill, totaling $63 million, was allocated to the reporting units within the Private Client Group and Capital Markets segments pursuant to SFAS No. 142, “Goodwill and Other Intangible Assets”. Goodwill represents the excess cost of a business acquisition over the fair value of the net assets acquired. In accordance with this pronouncement, indefinite-life intangible assets and goodwill are not amortized. Rather, they are subject to impairment testing on an annual basis, or more often if events or circumstances indicate there may be impairment. This test involves assigning tangible assets and liabilities, identified intangible assets and goodwill to reporting units and comparing the fair value of each reporting unit to its carrying amount. If the fair value is less than the carrying amount, a further test is required to measure the amount of the impairment. When available, the Company uses recent, comparable transactions to estimate the fair value of the respective reporting units. The Company calculates an estimated fair value based on multiples of revenues, earnings, and book value of comparable transactions. However, when such comparable transactions are not available or have become outdated, the Company uses discounted cash flow scenarios to estimate the fair value of the reporting units. As of September 30, 2007, goodwill had been allocated to the Private Client Group of RJA, and both the Private Client Group and Capital Markets segments of Raymond James Limited (“RJ Ltd.”). As of the most recent impairment test, the Company determined that the carrying value of the goodwill for each reporting unit had not been impaired. However, changes in current circumstances or business conditions could result in an impairment of goodwill. As required, the Company will continue to perform impairment testing on an annual basis or when an event occurs or circumstances change that would more likely than not reduce the fair value of a reporting unit below its carrying amount. Reserves The Company recognizes liabilities for contingencies when there is an exposure that, when fully analyzed, indicates it is both probable that a liability has been incurred and the amount of loss can be reasonably estimated. When a range of probable loss can be estimated, the Company accrues the most likely amount; if not determinable, the Company accrues at least the minimum of the range of probable loss.

38
The Company records reserves related to legal proceedings in Trade and Other Payables. Such reserves are established and maintained in accordance with Statement of Financial Accounting Standard (“SFAS”) No. 5, "Accounting for Contingencies", and Financial Interpretation No. 14, “Reasonable Estimation of the Amount of a Loss”. The determination of these reserve amounts requires significant judgment on the part of management. Management considers many factors including, but not limited to: the amount of the claim; the amount of the loss in the client's account; the basis and validity of the claim; the possibility of wrongdoing on the part of an employee of the Company; previous results in similar cases; and legal precedents and case law. Each legal proceeding is reviewed with counsel in each accounting period and the reserve is adjusted as deemed appropriate by management. Lastly, each case is reviewed to determine if it is probable that insurance coverage will apply, in which case the reserve is reduced accordingly. Any change in the reserve amount is recorded in the consolidated financial statements and is recognized as a charge/credit to earnings in that period. The Company also records reserves or allowances for doubtful accounts related to client receivables and loans. Client receivables at the broker-dealers are generally collateralized by securities owned by the brokerage clients. Therefore, when a receivable is considered to be impaired, the amount of the impairment is generally measured based on the fair value of the securities acting as collateral, which is measured based on current prices from independent sources such as listed market prices or broker-dealer price quotations. Client loans at RJBank are generally collateralized by real estate or other property. RJBank provides for both an allowance for losses in accordance with SFAS No. 5 and a reserve for individually impaired loans in accordance with SFAS No. 114, “Accounting by a Creditor for Impairment of a Loan”. The calculation of the SFAS No. 5 allowance is subjective as management segregates the loan portfolio into different homogeneous classes and assigns each class an allowance percentage based on the perceived risk associated with that class of loans. During the fiscal year, RJBank re-evaluated and implemented changes to the loan loss reserve methodology in conjunction with a revision to the corporate loan grading process. The new loan grading process was revised and expanded to provide more specific and detailed risk measurement across the corporate loan portfolio. The factors taken into consideration when assigning the reserve percentage to each reserve category include estimates of borrower default probabilities and collateral values; trends in delinquencies; volume and terms; changes in geographic distribution, lending policies, local, regional, and national economic conditions; concentrations of credit risk and past loss history. In addition, the Company provides for potential losses inherent in RJBank’s unfunded lending commitments using the criteria above, further adjusted for an estimated probability of funding. For individual loans identified as impaired, RJBank measures impairment based on the present value of expected future cash flows discounted at the loan's effective interest rate, the loan's observable market price, or the fair value of the collateral if the loan is collateral dependent. At September 30, 2007, the amortized cost of all RJBank loans was $4.7 billion and an allowance for loan losses of $47 million was recorded against that balance. The total allowance for loan losses, including $6.8 million in reserves for off-balance sheet exposures maintained in Trade and Other Payables, is equal to 1.15% of the amortized cost of the loan portfolio.

39
The following table allocates RJBank’s allowance for loan losses by loan category:
September 30,
2007 September 30,
2006 September 30,
2005 September 24,
2004 September 26,
2003 ($ in 000’s) Commercial Loans: Allowance $ 4,471 $ 3,663 $ 1,574 $ 1,372 $ 1,172 Total Commercial Loans
as a % of Loans Receivable 7% 12% 14% 18% 17% Real Estate Construction Loans: Allowance $ 2,121 $ 548 $ 567 $ 383 $ 102 Total Real Estate Construction Loans
as a % of Loans Receivable 3% 2% 3% 5% 2% Commercial Real Estate Loans: Allowance $ 35,766 $ 10,603 $ 2,878 $ 826 $ 602 Total Commercial Real Estate Loans
as a % of Loans Receivable 49% 28% 14% 11% 12% Residential Mortgage Loans: Allowance $ 4,659 $ 3,878 $ 2,537 $ 5,044 $ 4,006 Total Residential Mortgage Loans
as a % of Loans Receivable 41% 58% 69% 66% 69% Consumer Loans: Allowance $ 5 $ 2 $ 37 $ 17 $ 28 Total Consumer Loans
as a % of Loans Receivable 0% 0% 0% 0% 0% Total: Allowance $ 47,022 $ 18,694 $ 7,593 $ 7,642 $ 5,910
% of Total Loans Receivable 100% 100% 100% 100% 100%
The Company also makes loans or pays advances to Financial Advisors, primarily for recruiting and retention purposes. The Company provides for an allowance for doubtful accounts based on an evaluation of the Company’s ability to collect such receivables. The Company’s ongoing evaluation includes the review of specific accounts of Financial Advisors no longer associated with the Company and the Company’s historical collection experience. At September 30, 2007 the receivable from Financial Advisors was $115.1 million, which is net of an allowance of $3.8 million for estimated uncollectibility.
Income Taxes SFAS No. 109, “Accounting for Income Taxes”, establishes financial accounting and reporting standards for the effect of income taxes. The objectives of accounting for income taxes are to recognize the amount of taxes payable or refundable for the current year and deferred tax liabilities and assets for the future tax consequences of events that have been recognized in the Company’s financial statements or tax returns. Judgment is required in assessing the future tax consequences of events that have been recognized in the Company’s financial statements or tax returns. Variations in the actual outcome of these future tax consequences could materially impact the Company’s financial position, results of operations, or cash flows. Effects of recently issued accounting standards, not yet adopted In June 2006, the Financial Accounting Standards Board (“FASB”) issued Interpretation No. 48, “Accounting for Uncertainty in Income Taxes” (“FIN 48”), which clarifies the accounting for uncertainty in income taxes recognized in an enterprise’s financial statements in accordance with SFAS No. 109. FIN 48 establishes a recognition threshold and measurement attribute for the financial statement recognition and measurement of a tax position taken or expected to be taken in a tax return. This interpretation uses a two-step process to determine the amount of a tax benefit to record for a tax position if it is more likely than not to be sustained. The amount of the benefit is then measured to be the highest tax benefit that is greater than 50% likely to be realized upon ultimate settlement with a taxing authority that has full knowledge of all relevant information. This interpretation also provides guidance on derecognition, classification, interest and penalties, accounting in interim periods, disclosure, and transition. The Company will be required to adopt FIN No. 48 as of October 1, 2007. The Company does not expect this interpretation to have a material impact on its consolidated financial statements for the fiscal year ending September 30, 2008.
In July 2006, the FASB issued Staff Position (“FSP”) No. FAS 13-2, “Accounting for a Change or Projected Change in the Timing of Cash Flows Relating to Income Taxes Generated by a Leveraged Lease Transaction” (“FSP FAS 13-2”). This FSP addresses how a change in the timing of cash flows relating to income taxes generated by a leveraged lease transaction affects the accounting by a lessor for that lease. FSP FAS 13-2 is effective for fiscal years beginning after December 15, 2006 (October 1, 2007 for the Company). The Company does not expect this FSP to have a material impact on its consolidated financial statements for the fiscal year ending September 30, 2008.

40
In September 2006, the SEC issued Staff Accounting Bulletin No. 108, “Considering the Effects of Prior Year Misstatements when Quantifying Misstatements in the Current Year Financial Statements” (“SAB 108”). SAB 108 addresses how the effects of prior year uncorrected misstatements should be considered when quantifying misstatements in current year financial statements. SAB 108 requires an entity to quantify misstatements using a balance sheet and income statement approach and to evaluate whether either approach results in quantifying an error that is material in light of relevant quantitative and qualitative factors. The guidance is effective for annual financial statements covering the first fiscal year ending after November 15, 2006. This guidance did not have an impact on the Company’s consolidated financial statements for the fiscal year ended September 30, 2007. In September 2006, the FASB issued Statement of Financial Accounting Standards No. 157, “Fair Value Measurements” (“SFAS 157”). SFAS 157 defines fair value, establishes a framework for measuring fair value and expands disclosures about fair-value measurements required under other accounting pronouncements but does not change existing guidance as to whether or not an instrument is carried at fair value. SFAS 157 is effective for financial statements issued for fiscal years beginning after November 15, 2007 (October 1, 2008 for the Company), and interim periods within those fiscal years. The Company does not expect SFAS 157 to have a material impact on the consolidated financial statements of the Company. In February 2007, the FASB issued Statement of Financial Accounting Standards No. 159, “The Fair Value Option for Financial Assets and Financial Liabilities” (“SFAS 159”). SFAS 159 allows companies to elect to follow fair value accounting for certain financial assets and liabilities on an instrument by instrument basis. SFAS 159 is applicable only to certain financial instruments and is effective for fiscal years beginning after November 15, 2007 (October 1, 2008 for the Company). The Company has not yet completed its assessment of what impact, if any, SFAS 159 will have on its consolidated financial statements. In April 2007, the FASB issued Staff Position FIN No. 39-1, "Amendment of FASB Interpretation No. 39." FSP FIN No. 39-1 defines "right of setoff" and specifies what conditions must be met for a derivative contract to qualify for this right of setoff. FSP FIN No. 39-1 also addresses the applicability of a right of setoff to derivative instruments and clarifies the circumstances in which it is appropriate to offset amounts recognized for those instruments in the statement of financial position. In addition, this FSP permits offsetting of fair value amounts recognized for multiple derivative instruments executed with the same counterparty under a master netting arrangement and fair value amounts recognized for the right to reclaim cash collateral (a receivable) or the obligation to return cash collateral (a payable) arising from the same master netting arrangement as the derivative instruments. This interpretation is effective for fiscal years beginning after November 15, 2007 (October 1, 2008 for the Company), with early application permitted. The Company is currently evaluating the impact the adoption of FSP FIN No. 39-1 will have on its consolidated financial statements. In May 2007, the FASB issued FSP FIN No. 46R-7, "Application of FASB Interpretation No. 46(R) to Investment Companies." FSP FIN No. 46R-7 amends the scope of the exception to FIN 46R to state that investments accounted for at fair value in accordance with the specialized accounting guidance in the American Institute of Certified Public Accountants ("AICPA") Audit and Accounting Guide, Investment Companies, are not subject to consolidation under FIN 46R. This interpretation is effective for fiscal years beginning on or after December 15, 2007 (October 1, 2008 for the Company). The Company is currently evaluating the impact the adoption of FSP FIN No. 46R-7 will have on its consolidated financial statements. In June 2007, the Accounting Standards Executive Committee of the AICPA issued Statement of Position ("SOP") 07-1, "Clarification of the Scope of the Audit and Accounting Guide Investment Companies and Accounting by Parent Companies and Equity Method Investors for Investments in Investment Companies." This SOP provides guidance for determining whether an entity is within the scope of the AICPA Audit and Accounting Guide Investment Companies (the "Guide"). Additionally, it provides guidance as to whether a parent company or an equity method investor can apply the specialized industry accounting principles of the Guide (referred to as investment company accounting). This SOP is effective for fiscal years beginning on or after December 15, 2007 (October 1, 2008 for the Company), with early application encouraged. The Company is currently evaluating the impact the adoption of SOP 07-1 will have on its consolidated financial statements. Off Balance Sheet Arrangements Information concerning the Company's off balance sheet arrangements are included in Note 20 of the Notes to the Consolidated Financial Statements. Such information is hereby incorporated by reference.

41
Contractual Obligations The Company has contractual obligations to make future payments in connection with its short and long-term debt, non-cancelable lease agreements, partnership investments, commitments to extend credit, loans purchased but not settled, underwriting commitments and a naming rights agreement (see Note 13 of the Notes to the Consolidated Financial Statements for further information on the Company's commitments). The following table sets forth these contractual obligations by fiscal year:
Total 2008 2009 2010 2011 2012 Thereafter (in 000’s) Long-Term Debt $ 119,955 $ 7,731 $ 2,891 $ 8,060 $48,239 $ 3,429 $ 49,605 Variable Interest Entities’ Loans Payable(1) 116,479 13,839 13,267 12,720 12,748 13,036 50,869 Short-Term Debt 2,685 2,685 - - - - - Operating Leases 100,453 28,711 22,249 19,327 12,498 8,811 8,857 Investments – Private Equity Partnerships(2) 21,400 21,400 - - - - -
Certificates of Deposit 239,534 128,032 51,703 30,323 21,960 7,516 - Commitments to Extend Credit - RJBank(3) 1,757,541 1,757,541 - - - - -
RJBank Loans Purchased, Not Yet Settled 300,644 300,644 - - - - -
Commitments to Real Estate Partnerships(4) 11,200 11,200 - - - - -
Underwriting Commitments 11,794 11,794 - - - - - Naming Rights for Raymond James Stadium 30,089 3,152 3,278 3,409 3,545 3,687 13,018
Total $2,711,774 $2,286,729 $93,388 $73,839 $98,990 $36,479 $122,349
(1) Loans which are non-recourse to the Company. See Notes 6 and 10 in the Notes to the Consolidated Financial Statements for additional information. (2) The Company has committed a total of $46.6 million, in amounts ranging from $200,000 to $2 million, to 41 different independent venture capital or private equity
partnerships. As of September 30, 2007, the Company has invested $30.4 million of that amount and has received $27 million in distributions. Additionally, the Company is the general partner in two internally sponsored private equity limited partnerships to which it has committed $14 million. Of that amount, the Company has invested $12.2 million and has received $8.6 million in distributions as of September 30, 2007. Although the combined remaining balance of $21.4 million has been included in fiscal year 2008 above, the contributions to the partnerships may occur after that time and are dependent upon the timing of the capital calls by the general partners.
(3) Because many commitments expire without being funded in whole or part, the contract amounts are not estimates of future cash flows. (4) RJTCF is committed to additional future fundings related to real estate partnerships.
Effects of Inflation The Company's assets are primarily liquid in nature and are not significantly affected by inflation. However, the rate of inflation affects the Company's expenses, including employee compensation, communications and occupancy, which may not be readily recoverable through charges for services provided by the Company.

42
RISK FACTORS The Company’s operations and financial results are subject to various risks and uncertainties, including those described below, that could adversely affect its business, financial condition, results of operations, cash flows, and the trading price of its common stock.
Economic and Political Developments and Their Impact on Securities Markets Could Adversely Affect the Company’s Business The Company is engaged in various financial services businesses. As such, the Company is directly affected by general economic and political conditions, changes in the rate of inflation and the related impact on securities markets, fluctuations in interest and currency rates, investor confidence, and changes in volume and price levels of the securities markets. Severe market fluctuations or weak economic conditions could reduce the Company’s trading volume and net revenues and adversely affect its profitability.
The Company Faces Intense Competition The Company is engaged in intensely competitive businesses. Competitive pressures experienced by the Company could have an adverse affect on its business, results of operations, financial condition and liquidity.
Regulatory and Legal Developments Could Adversely Affect the Company’s Business The securities industry is subject to extensive regulation and broker-dealers are subject to regulations covering all aspects of the securities business. The Company could be subject to civil liability, criminal liability, or sanctions, including revocation of its subsidiaries’ registrations as investment advisors or broker-dealers, revocation of the licenses of its Financial Advisors, censures, fines, or a temporary suspension or permanent bar from conducting business, if it violates such laws or regulations. Any such liability or sanction could have a material adverse effect on the Company’s financial condition, results of operations, and business prospects. The Company’s banking operations also expose it to a risk of loss resulting from failure to comply with banking laws. In addition, the regulatory environment in which the Company operates frequently changes and has seen significant increased regulation in recent years. The Company may be adversely affected as a result of new or revised legislation or regulations, changes in federal, state or foreign tax laws, or by changes in the interpretation or enforcement of existing laws and regulations.
The Company’s Business Is Highly Dependent on Technology The Company’s businesses rely extensively on electronic data processing and communications systems, and its continued success will depend upon its ability to successfully maintain and upgrade the capability of those systems and retain skilled information technology employees. Failure of those systems, which could result from events beyond the Company’s control, could result in financial losses, liability to clients and damage to the Company’s reputation. The Company Is Exposed to Market Risk The Company, directly and indirectly, is affected by changes in market conditions. Market risk generally represents the risk that values of assets and liabilities or revenues will be adversely affected by changes in market conditions. For example, changes in interest rates could adversely affect the Company’s net interest margin – the difference between the yield the Company earns on its assets and the interest rate the Company pays for deposits and other sources of funding – which could in turn affect the Company’s net interest income and earnings. Market risk is inherent in the financial instruments associated with the Company’s operations and activities including loans, deposits, securities, short-term borrowings, long-term debt, trading account assets and liabilities, and derivatives. Market conditions that may shift from time to time, thereby exposing the Company to market risk, include fluctuations in interest rates, equity prices, and price deterioration or changes in value due to changes in market perception or actual credit quality of an issuer. The Company Is Exposed to Credit Risk The credit quality of the Company’s loan and investment portfolios can have a significant impact on earnings. Credit risk is the risk of loss from a debtor’s inability to meet financial obligations in accordance with agreed upon terms. Risks associated with credit quality include adverse changes in the financial performance or condition of the Company’s debtors that could affect the debtors’ repayment of outstanding obligations, and that the strength of the U.S. economy may be different than expected resulting in deterioration in credit quality or a reduced demand for credit.
The Company Is Exposed to Operational Risk The Company’s diverse operations are exposed to risk of loss resulting from inadequate or failed internal processes, people and systems, or from external events. Operational risk exists in every activity, function, or unit of the Company, and includes: internal or external fraud, employment and hiring practices, an error in meeting a professional obligation, business disruption or system failures, and failed transaction processing. Also, increasing use of automated technology has the potential to amplify risks from manual or system processing errors, including outsourced operations. Damage to the Company’s reputation could also result from a significant operational loss. The Company’s Operations Could Be Adversely Affected by Serious Weather Conditions The Company’s principal operations are located in St. Petersburg, Florida. During 2004 and 2005, there was a significant increase in hurricane activity on the Gulf Coast which directly affected other parts of Florida. While the Company has a business continuity plan that permits significant operations to be conducted from its Southfield, Michigan location, the Company’s operations could be adversely affected by hurricanes or other serious weather conditions that could affect processing of transactions and communications. In addition, as a result of high levels of storm induced damage during these years in Florida and along the Gulf Coast, insurance coverage for wind and flood damage has become harder to obtain and substantially more expensive. As a consequence, the Company has been forced to pay more for the limited coverage it obtained and self-insure against these risks to a greater degree than in the past.

43
The Company’s Business is Dependent on Fees Generated from the Distribution of Financial Products and on Fees Earned from the Management of Client Accounts By Our Asset Management Subsidiaries A large portion of the Company’s revenues are derived from fees generated from the distribution of financial products such as mutual funds and variable annuities. Changes in the structure or amount of the fees paid by the sponsors of these products could directly affect the Company’s revenues and profits. Further, changes in market values or in the fee structure of asset management accounts could affect the Company’s revenues and profits. Insurance Risks The Company’s operations and financial results are subject to risks and uncertainties related to its use of a combination of insurance, self-insured retention and self-insurance for a number of risks, including, without limitation, property and casualty, workers’ compensation, general liability, and the Company-funded portion of employee-related health care benefits.
Other Risks See “Quantitative and Qualitative Disclosures About Market Risk” below regarding the Company’s exposure to, and approaches to managing, market risk, interest rate risk, equity price risk, credit risk, operational risk and regulatory and legal risk.

44
QUANTITATIVE AND QUALITATIVE DISCLOSURES ABOUT MARKET RISK
RISK MANAGEMENT Risks are an inherent part of the Company's business and activities. Management of these risks is critical to the Company's fiscal soundness and profitability. Risk management at the Company is a multi-faceted process that requires communication, judgment and knowledge of financial products and markets. The Company's senior management takes an active role in the risk management process and requires specific administrative and business functions to assist in the identification, assessment, monitoring and control of various risks. The principal risks involved in the Company's business activities are market, credit, operational, and regulatory and legal.
Market Risk Market risk is the risk of loss to the Company resulting from changes in interest rates and equity prices. The Company has exposure to market risk primarily through its broker-dealer and banking operations. The Company's broker-dealer subsidiaries, primarily RJA, trade tax exempt and taxable debt obligations and act as an active market maker in approximately 340 over-the-counter equity securities. In connection with these activities, the Company maintains inventories in order to ensure availability of securities and to facilitate client transactions. Additionally, the Company, primarily within its Canadian broker-dealer subsidiary, invests for its own proprietary equity investment account. The following table represents the fair value of trading instruments associated with the Company's broker-dealer client facilitation, market-making activities and proprietary trading activities:
September 30, 2007 September 30, 2006 Instruments Instruments Sold but Sold but Trading Not Yet Trading Not Yet Instruments Purchased Instruments Purchased (in 000's)
Marketable:
Municipal $ 200,024 $ 54 $ 192,028 $ 5 Corporate 56,069 952 134,431 968 Government 83,322 45,275 37,793 31,636 Agency 47,123 60,829 68,380 34,023
Total Debt Securities 386,538 107,110 432,632 66,632 Derivative Contracts 30,603 8,445 20,904 8,309 Equity Securities 46,913 34,174 29,532 19,068 Other Securities 3,707 - 2,703 -
Total $ 467,761 $ 149,729 $ 485,771 $ 94,009 Changes in value of the Company's trading inventory may result from fluctuations in interest rates, credit ratings of the issuer, equity prices and the correlation among these factors. The Company manages its trading inventory by product type and has established trading divisions that have responsibility for each product type. The Company's primary method of controlling risk in its trading inventory is through the establishment and monitoring of limits on the dollar amount of securities positions that can be entered into and other risk-based limits; limits are established both for categories of securities (e.g., OTC equities, corporate bonds, municipal bonds) and for individual traders. As of September 30, 2007, the absolute fixed income and equity inventory limits were $1,955,000,000 and $83,600,000, respectively. The Company's trading activities were well within these limits at September 30, 2007. Position limits in trading inventory accounts are monitored on a daily basis. Consolidated position and exposure reports are prepared and distributed to senior management. Limit violations are carefully monitored. Management also monitors inventory levels and trading results, as well as inventory aging, pricing, concentration and securities ratings. For derivatives, primarily interest rate swaps, the Company monitors exposure in its derivatives subsidiary daily based on established limits with respect to a number of factors, including interest rate, spread, ratio, basis, and volatility risk. These exposures are monitored both on a total portfolio basis and separately for selected maturity periods.
Interest Rate Risk The Company is exposed to interest rate risk as a result of maintaining trading inventories of fixed income instruments and actively manages this risk using hedging techniques that involve swaps, futures, and U.S. Treasury obligations. The Company monitors, on a daily basis, the Value-at-Risk (“VaR”) in its institutional Fixed Income trading portfolios (cash instruments and interest rate derivatives). VaR is an appropriate statistical technique for estimating the potential loss in trading portfolios due to typical adverse market movements over a specified time horizon with a suitable confidence level. To calculate VaR, the Company uses historical simulation. This approach assumes that historical changes in market conditions are representative of future changes. The simulation is based upon daily market data for the previous twelve months. VaR is reported at a 99% confidence level, based on a one-day time horizon. This means that the Company could expect to incur losses greater than those predicted by the VaR estimates only once in every 100 trading days, or about 2.5 times a year. During the fiscal year ended September 30, 2007, the reported daily loss in the institutional Fixed Income trading portfolio exceeded the predicted VaR five times, due in part, to volatile movements in bond prices experienced during the fourth fiscal quarter.

45
However, trading losses on a single day could exceed the reported VaR by significant amounts in unusually volatile markets and might accumulate over a longer time horizon, such as a number of consecutive trading days. Accordingly, management employs additional interest rate risk controls including position limits, a daily review of trading results, review of the status of aged inventory, independent controls on pricing, monitoring of concentration risk, and review of issuer ratings. The following tables set forth the high, low, and daily average VaR for the Company's overall institutional portfolio during the twelve months ended September 30, 2007, with the corresponding dollar value of the Company's portfolio:
Twelve Months Ended September 30, 2007 VaR at September 30, September 30, High Low Daily Average 2007 2006 ($ in 000's) Daily VaR $ 1,098 $ 226 $ 536 $ 232 $ 483 Related Portfolio Value (Net)* $ 334,309 $ 282,240 $ 357,728 $ 278,605 $ 312,917 VaR as a Percent
of Portfolio Value 0.33% 0.08% 0.16% 0.08% 0.15% *Portfolio value achieved on the day of the VaR calculation. The modeling of the risk characteristics of trading positions involves a number of assumptions and approximations. While management believes that its assumptions and approximations are reasonable, there is no uniform industry methodology for estimating VaR, and different assumptions or approximations could produce materially different VaR estimates. As a result, VaR statistics are more reliable when used as indicators of risk levels and trends within a firm than as a basis for inferring differences in risk-taking across firms. Additional information is discussed under Derivative Financial Instruments in Note 11 of the Notes to the Consolidated Financial Statements. RJBank maintains an earning asset portfolio that is comprised of mortgage, corporate and consumer loans, as well as mortgage backed securities, securities purchased under resale agreements, and other investments. Those earning assets are funded in part by its obligations to clients, including NOW accounts, demand deposits, money market accounts, savings accounts, and certificates of deposit; and FHLB advances. Based on the current earning asset portfolio of RJBank, market risk for RJBank is limited primarily to interest rate risk. RJBank analyzes interest rate risk based on forecasted net interest income, which is the net amount of interest received and interest paid, and the net portfolio valuation, both in a range of interest rate scenarios. The following table represents the carrying value of RJBank's assets and liabilities that are subject to market risk. This table does not include financial instruments with limited market risk exposure due to offsetting asset and liability positions, short holding periods or short periods of time until the interest rate resets. RJBank Financial Instruments with Market Risk (as described above):
September 30, September 30, 2007 2006 (in 000's)
Mortgage Backed Securities $ 382,455 $ 151,437 Loans Receivable, Net 2,020,530 1,282,504
Total Assets with Market Risk $ 2,402,985 $ 1,433,941 Certificates of Deposit $ 185,729 $ 255,360 Federal Home Loan Bank Advances 50,000 60,000
Total Liabilities with Market Risk $ 235,729 $ 315,360

46
The following table shows the distribution of those RJBank loans that mature in more than one year between fixed and adjustable interest rate loans at September 30, 2007:
Interest Rate Type Fixed Adjustable Total (in 000’s) Commercial Loans $ 2,188 $ 340,538 $ 342,726 Real Estate Construction Loans - 102,037 102,037 Commercial Real Estate Loans 7,141 2,184,092 2,191,233 Residential Mortgage Loans 23,134 1,911,411 1,934,545 Consumer Loans - 3,017 3,017
Total Loans $ 32,463 $ 4,541,095 $ 4,573,558
One of the core objectives of RJBank's Asset/Liability Management Committee is to manage the sensitivity of net interest income to changes in market interest rates. The Asset/Liability Management Committee uses several measures to monitor and limit RJBank's interest rate risk including scenario analysis, interest repricing gap analysis and limits, and net portfolio value limits. Simulation models and estimation techniques are used to assess the sensitivity of the net interest income stream to movements in interest rates. Assumptions about consumer behavior play an important role in these calculations; this is particularly relevant for loans such as mortgages where the client has the right, but not the obligation, to repay before the scheduled maturity. The sensitivity of net interest income to interest rate conditions is estimated for a variety of scenarios. Assuming an immediate and lasting shift of 100 basis points in the term structure of interest rates, RJBank's sensitivity analysis indicates that an upward movement would decrease RJBank's net interest income by 10.25% in the first year after the rate increase, whereas a downward shift of the same magnitude would increase RJBank's net interest income by 6.91%. These sensitivity figures are based on positions as of September 30, 2007, and are subject to certain simplifying assumptions, including that management takes no corrective action.
Equity Price Risk The Company is exposed to equity price risk as a consequence of making markets in equity securities and the investment activities of RJA and RJ Ltd. The U.S. broker-dealer activities are primarily client-driven, with the objective of meeting clients' needs while earning a trading profit to compensate for the risk associated with carrying inventory. The Company attempts to reduce the risk of loss inherent in its inventory of equity securities by monitoring those security positions constantly throughout each day and establishing position limits. The Company's Canadian broker-dealer has a proprietary trading business with 26 traders. The average aggregate inventory held for proprietary trading during the year ended September 30, 2007 was CDN$12,257,443. The Company's equity securities inventories are priced on a regular basis and there are no material unrecorded gains or losses.
Credit Risk The Company is engaged in various trading and brokerage activities whose counterparties primarily include broker-dealers, banks and other financial institutions. The Company is exposed to risk that these counterparties may not fulfill their obligations. The risk of default depends on the creditworthiness of the counterparty and/or the issuer of the instrument. The Company manages this risk by imposing and monitoring individual and aggregate position limits within each business segment for each counterparty, conducting regular credit reviews of financial counterparties, reviewing security and loan concentrations, holding and marking to market collateral on certain transactions and conducting business through clearing organizations, which guarantee performance. The Company's client activities involve the execution, settlement, and financing of various transactions on behalf of its clients. Client activities are transacted on either a cash or margin basis. Credit exposure associated with the Company's Private Client Group results primarily from customer margin accounts, which are monitored daily and are collateralized. When clients execute a purchase the Company is at some risk that the client will renege on the trade. If this occurs, the Company may have to liquidate the position at a loss. However, most private clients have available funds in the account before the trade is executed. The Company monitors exposure to industry sectors and individual securities and performs analysis on a regular basis in connection with its margin lending activities. The Company adjusts its margin requirements if it believes its risk exposure is not appropriate based on market conditions. In addition, RJBank offers a variety of loan products including residential mortgage, commercial real estate, and consumer loans, which are collateralized, and corporate loans for which the borrower is carefully evaluated and monitored. RJBank's policy is to require customers to provide such collateral prior to the disbursement of approved loans. The amount of collateral obtained, if it is deemed necessary by RJBank upon extension of credit, is based on management's credit evaluation of the counterparty. Collateral held varies but may include accounts receivable, inventory, residential real estate, and income-producing commercial properties. When using derivative financial instruments to hedge exposures to changes in interest rates, RJBank exposes itself to credit risk with those counterparties also. RJBank minimizes the credit or repayment risk of derivative instruments by entering into transactions only with high-quality counterparties whose credit rating is investment grade. The Company is subject to concentration risk if it holds large positions, extends large loans to, or has large commitments with a single counterparty, borrower, or group of similar counterparties or borrowers (e.g. in the same industry). Securities purchased under agreements to resell consist entirely of securities issued by the U.S. government or its agencies. Receivables from and payables to clients and stock borrow and lending activities are conducted with a large number of clients and counterparties and potential concentration is carefully monitored. Inventory and investment positions taken and commitments made, including underwritings, may involve exposure to individual issuers and businesses. The Company seeks to limit this risk through careful review of the underlying business

47
and the use of limits established by senior management, taking into consideration factors including the financial strength of the counterparty, the size of the position or commitment, the expected duration of the position or commitment and other positions or commitments outstanding. The Company is the lessor in a leveraged commercial aircraft transaction with Continental. The Company's ability to realize its expected return is dependent upon the airline’s ability to fulfill its lease obligation. In the event that the airline defaults on its lease commitments and the Trustee for the debt holders is unable to re-lease or sell the plane with adequate terms, the Company would suffer a loss of some or all of its investment. Although Continental remains current on its lease payments to the Company, the inability of Continental to make its lease payments, or the termination or modification of the lease through a bankruptcy proceeding, could result in the write-down of the Company's investment and the acceleration of certain income tax payments. The Company continues to monitor this lessee for specific events or circumstances that would increase the likelihood of a default on Continental’s obligations under this lease.
Operational Risk Operational risk generally refers to the risk of loss resulting from the Company's operations, including, but not limited to, business disruptions, improper or unauthorized execution and processing of transactions, deficiencies in the Company's technology or financial operating systems and inadequacies or breaches in the Company's control processes. The Company operates different businesses in diverse markets and is reliant on the ability of its employees and systems to process a large number of transactions. These risks are less direct than credit and market risk, but managing them is critical, particularly in a rapidly changing environment with increasing transaction volumes. In the event of a breakdown or improper operation of systems or improper action by employees, the Company could suffer financial loss, regulatory sanctions and damage to its reputation. In order to mitigate and control operational risk, the Company has developed and continues to enhance specific policies and procedures that are designed to identify and manage operational risk at appropriate levels throughout the organization and within such departments as Accounting, Operations, Information Technology, Legal, Compliance and Internal Audit. These control mechanisms attempt to ensure that operational policies and procedures are being followed and that the Company's various businesses are operating within established corporate policies and limits. Business continuity plans exist for critical systems, and redundancies are built into the systems as deemed appropriate. A Compliance and Standards Committee comprised of senior executives meets monthly to consider policy issues. The Committee reviews material customer complaints and litigation, as well as issues in operating departments, for the purpose of identifying issues that present risk exposure to customers or to the Company. The Committee adopts policies to deal with these issues, which are then disseminated throughout the Company. The Company has established a Quality of Markets Committee that meets regularly to monitor the best execution activities of the trading departments within the Company as they relate to customer orders. This Committee is comprised of representatives from the OTC Trading, Listed Trading, Options, Municipal Trading, Taxable Trading, Compliance and Legal Departments and is under the direction of a senior officer of the Company. This Committee reviews reports from OTC Trading, Listed Trading, Options, Municipal Trading and Taxable Trading departments and recommends action for improvement when necessary. Regulatory and Legal Risk Legal risk includes the risk of Private Client Group customer claims, the possibility of sizable adverse legal judgments and non-compliance with applicable legal and regulatory requirements. The Company is generally subject to extensive regulation in the different jurisdictions in which it conducts business. Regulatory oversight of the securities industry has become increasingly demanding over the past several years and the Company, as well as others in the industry, has been directly affected by this increased regulatory scrutiny. The Company has comprehensive procedures addressing issues such as regulatory capital requirements, sales and trading practices, use of and safekeeping of customer funds, extension of credit, collection activities, money-laundering and record keeping. The Company and its subsidiaries have designated Anti-money Laundering Compliance Officers who monitor compliance with regulations adopted under the U.S.A. Patriot Act. The Company acts as an underwriter or selling group member in both equity and fixed income product offerings. Particularly when acting as lead or co-lead manager, the Company has financial and legal exposure. To manage this exposure, a committee of senior executives review proposed underwriting commitments to assess the quality of the offering and the adequacy of due diligence investigation. The Company's major business units have compliance departments that are responsible for regularly reviewing and revising compliance and supervisory procedures to conform to changes in applicable regulations. During the past year, the number of claims has continued to decline to more historic levels. While these claims may not be the result of any wrongdoing, the Company does, at a minimum, incur costs associated with investigating and defending against such claims. See further discussion on the Company's reserve policy under "Critical Accounting Policies" on page 36 of this report; see also Notes 14 and 19 of the Notes to the Consolidated Financial Statements.

48
CONTROLS AND PROCEDURES
Disclosure controls are procedures designed to ensure that information required to be disclosed in the Company's reports filed under the Exchange Act, such as this report, is recorded, processed, summarized, and reported within the time periods specified in the SEC's rules and forms. Disclosure controls are also designed to ensure that such information is accumulated and communicated to management, including the Chief Executive Officer and Chief Financial Officer, as appropriate to allow timely decisions regarding required disclosure. In designing and evaluating the disclosure controls and procedures, management recognized that any controls and procedures, no matter how well designed and operated, can provide only reasonable, not absolute, assurance of achieving the desired control objectives, as the Company's are designed to do, and management necessarily was required to apply its judgment in evaluating the cost-benefit relationship of possible controls and procedures. Under the supervision and with the participation of the Company’s management, including the Chief Executive Officer and Chief Financial Officer, the Company has evaluated the effectiveness of its disclosure controls and procedures pursuant to Exchange Act Rule 13a-15(b) as of the end of the period covered by this report. Based on that evaluation, the Chief Executive Officer and Chief Financial Officer have concluded that these disclosure controls and procedures are effective. There were no changes in the Company’s internal control over financial reporting during the year ended September 30, 2007 that have materially affected, or are reasonably likely to materially affect, the Company’s internal control over financial reporting.
REPORT OF MANAGEMENT ON INTERNAL CONTROL OVER FINANCIAL REPORTING
The Company’s management is responsible for establishing and maintaining adequate internal control over financial reporting for the Company. Internal control over financial reporting is a process to provide reasonable assurance regarding the reliability of the Company’s financial reporting for external purposes in accordance with accounting principles generally accepted in the United States. Internal control over financial reporting includes maintaining records that in reasonable detail accurately and fairly reflect the Company’s transactions; providing reasonable assurance that transactions are recorded as necessary for preparation of its financial statements; providing reasonable assurance that receipts and expenditures of Company assets are made in accordance with management authorization; and providing reasonable assurance that unauthorized acquisition, use or disposition of Company assets that could have a material effect on the Company’s financial statements would be prevented or detected on a timely basis. Because of its inherent limitations, internal control over financial reporting is not intended to provide absolute assurance that a misstatement of the Company’s financial statements would be prevented or detected. Management conducted an evaluation of the effectiveness of the Company’s internal control over financial reporting based on the framework in Internal Control – Integrated Framework issued by the Committee of Sponsoring Organizations of the Treadway Commission (COSO). Based on this evaluation, management concluded that the Company’s internal control over financial reporting was effective as of September 30, 2007. KPMG LLP, who audited and reported on the consolidated financial statements of the Company included in this report, has issued an attestation report on the Company’s internal control over financial reporting as of September 30, 2007 (included below).

49
REPORT OF INDEPENDENT REGISTERED PUBLIC ACCOUNTING FIRM The Board of Directors and Shareholders Raymond James Financial, Inc.: We have audited Raymond James Financial, Inc.’s internal control over financial reporting as of September 30, 2007, based on criteria established in Internal Control—Integrated Framework issued by the Committee of Sponsoring Organizations of the Treadway Commission (COSO). Raymond James Financial, Inc.’s management is responsible for maintaining effective internal control over financial reporting and for its assessment of the effectiveness of internal control over financial reporting, included in the accompanying Report of Management on Internal Control Over Financial Reporting. Our responsibility is to express an opinion on the Company’s internal control over financial reporting based on our audit. We conducted our audit in accordance with the standards of the Public Company Accounting Oversight Board (United States). Those standards require that we plan and perform the audit to obtain reasonable assurance about whether effective internal control over financial reporting was maintained in all material respects. Our audit included obtaining an understanding of internal control over financial reporting, assessing the risk that a material weakness exists, and testing and evaluating the design and operating effectiveness of internal control based on the assessed risk. Our audit also included performing such other procedures as we considered necessary in the circumstances. We believe that our audit provides a reasonable basis for our opinion. A company's internal control over financial reporting is a process designed to provide reasonable assurance regarding the reliability of financial reporting and the preparation of financial statements for external purposes in accordance with generally accepted accounting principles. A company's internal control over financial reporting includes those policies and procedures that (1) pertain to the maintenance of records that, in reasonable detail, accurately and fairly reflect the transactions and dispositions of the assets of the company; (2) provide reasonable assurance that transactions are recorded as necessary to permit preparation of financial statements in accordance with generally accepted accounting principles, and that receipts and expenditures of the company are being made only in accordance with authorizations of management and directors of the company; and (3) provide reasonable assurance regarding prevention or timely detection of unauthorized acquisition, use, or disposition of the company’s assets that could have a material effect on the financial statements. Because of its inherent limitations, internal control over financial reporting may not prevent or detect misstatements. Also, projections of any evaluation of effectiveness to future periods are subject to the risk that controls may become inadequate because of changes in conditions, or that the degree of compliance with the policies or procedures may deteriorate. In our opinion, Raymond James Financial, Inc. maintained, in all material respects, effective internal control over financial reporting as of September 30, 2007, based on criteria established in Internal Control—Integrated Framework issued by the Committee of Sponsoring Organizations of the Treadway Commission (COSO). We also have audited, in accordance with the standards of the Public Company Accounting Oversight Board (United States), the Consolidated Statements of Financial Condition of Raymond James Financial, Inc. and subsidiaries as of September 30, 2007 and 2006, and the related Consolidated Statements of Income and Comprehensive Income, Changes in Shareholders’ Equity, and Cash Flows for each of the years in the three-year period ended September 30, 2007, and our report dated November 29, 2007 expressed an unqualified opinion on those consolidated financial statements. KPMG LLP Tampa, Florida November 29, 2007 Certified Public Accountants

50
REPORT OF INDEPENDENT REGISTERED PUBLIC ACCOUNTING FIRM
The Board of Directors and Shareholders Raymond James Financial, Inc.: We have audited the accompanying Consolidated Statements of Financial Condition of Raymond James Financial, Inc. and subsidiaries as of September 30, 2007 and 2006, and the related Consolidated Statements of Income and Comprehensive Income, Changes in Shareholders’ Equity, and Cash Flows for each of the years in the three-year period ended September 30, 2007. These consolidated financial statements are the responsibility of the Company’s management. Our responsibility is to express an opinion on these consolidated financial statements based on our audits. We conducted our audits in accordance with the standards of the Public Company Accounting Oversight Board (United States). Those standards require that we plan and perform the audit to obtain reasonable assurance about whether the financial statements are free of material misstatement. An audit includes examining, on a test basis, evidence supporting the amounts and disclosures in the financial statements. An audit also includes assessing the accounting principles used and significant estimates made by management, as well as evaluating the overall financial statement presentation. We believe that our audits provide a reasonable basis for our opinion. In our opinion, the consolidated financial statements referred to above present fairly, in all material respects, the financial position of Raymond James Financial, Inc. and subsidiaries as of September 30, 2007 and 2006, and the results of their operations and their cash flows for each of the years in the three-year period ended September 30, 2007, in conformity with U.S. generally accepted accounting principles. We also have audited, in accordance with the standards of the Public Company Accounting Oversight Board (United States), the effectiveness of Raymond James Financial, Inc.’s internal control over financial reporting as of September 30, 2007, based on criteria established in Internal Control—Integrated Framework issued by the Committee of Sponsoring Organizations of the Treadway Commission (COSO), and our report dated November 29, 2007 expressed an unqualified opinion on the effectiveness of the Company’s internal control over financial reporting.
KPMG LLP Tampa, Florida November 29, 2007 Certified Public Accountants

51
RAYMOND JAMES FINANCIAL, INC. AND SUBSIDIARIES CONSOLIDATED STATEMENTS OF FINANCIAL CONDITION
September 30, September 30, 2007 2006 (in 000’s) Assets: Cash and Cash Equivalents $ 644,943 $ 392,418 Assets Segregated Pursuant to Regulations and Other Segregated Assets 4,127,667 3,366,703 Securities Purchased under Agreements to Resell and Other Collateralized Financings 1,295,004 849,333 Financial Instruments:
Trading Instruments, at Fair Value 467,761 485,771 Available for Sale Securities, at Fair Value 569,952 280,580 Other Investments, at Fair Value 90,637 66,726
Receivables: Brokerage Clients, Net 1,704,300 1,504,607 Stock Borrowed 1,292,265 1,068,102 Bank Loans, Net 4,664,209 2,262,832 Brokers-Dealers and Clearing Organizations 228,865 210,443 Other 315,227 290,294
Investments in Real Estate Partnerships - Held by Variable Interest Entities 221,147 227,963 Property and Equipment, Net 166,963 142,780 Deferred Income Taxes, Net 107,922 94,957 Deposits With Clearing Organizations 36,416 30,780 Goodwill 62,575 62,575 Prepaid Expenses and Other Assets 258,315 179,786 $ 16,254,168 $ 11,516,650 Liabilities And Shareholders' Equity: Loans Payable $ 122,640 $ 141,638 Loans Payable Related to Investments by Variable Interest Entities in Real Estate Partnerships 116,479 193,647 Payables:
Brokerage Clients 5,675,860 4,552,227 Stock Loaned 1,280,747 1,235,104 Bank Deposits 5,585,259 2,806,880 Brokers-Dealers and Clearing Organizations 128,298 79,646 Trade and Other 450,008 138,091
Trading Instruments Sold but Not Yet Purchased, at Fair Value 149,729 94,009 Securities Sold Under Agreements to Repurchase 393,282 301,110 Accrued Compensation, Commissions and Benefits 356,627 321,224 Income Taxes Payable 7,755 34,294 14,266,684 9,897,870
Minority Interests 229,670 154,911
Shareholders' Equity
Preferred Stock; $.10 Par Value; Authorized 10,000,000 Shares; Issued and Outstanding -0- Shares - -
Common Stock; $.01 Par Value; Authorized 180,000,000 Shares; Issued 120,903,331 at September 30, 2007 and 117,655,883 at September 30, 2006 1,176 1,150
Shares Exchangeable into Common Stock; 273,042 at September 30, 2007 and 362,197 at September 30, 2006 3,504 4,649
Additional Paid-In Capital 277,095 205,198 Retained Earnings 1,461,898 1,258,446 Accumulated Other Comprehensive Income 30,191 12,095
1,773,864 1,481,538 Less: 1,005,668 and 1,270,015 Common Shares in Treasury, at Cost (16,050) (17,669)
1,757,814 1,463,869 $ 16,254,168 $ 11,516,650
See accompanying Notes to Consolidated Financial Statements.

52
RAYMOND JAMES FINANCIAL, INC. AND SUBSIDIARIES CONSOLIDATED STATEMENTS OF INCOME AND COMPREHENSIVE INCOME
(in 000’s, except per share amounts) Year Ended
September 30, September 30, September 30, 2007 2006 2005
Revenues: Securities Commissions and Fees $ 1,740,717 $ 1,561,504 $ 1,421,908 Investment Banking 192,114 158,598 150,166 Investment Advisory Fees 206,076 179,366 157,428 Interest 726,992 469,981 245,562 Net Trading Profits 16,476 27,156 24,612 Financial Service Fees 125,214 128,811 97,213 Other 101,990 120,162 71,307
Total Revenues 3,109,579 2,645,578 2,168,196
Interest Expense 499,664 296,670 117,789
Net Revenues 2,609,915 2,348,908 2,050,407
Non-Interest Expenses: Compensation, Commissions and Benefits 1,766,690 1,601,037 1,429,104 Communications and Information Processing 114,161 103,576 91,881 Occupancy and Equipment Costs 79,881 72,593 66,948 Clearance and Floor Brokerage 30,746 28,329 24,063 Business Development 88,067 78,579 67,802 Investment Advisory Fees 47,452 40,524 34,191 Other 100,421 90,363 90,965
Total Non-Interest Expenses 2,227,418 2,015,001 1,804,954
Minority Interest in Subsidiaries (9,727) (8,159) (2,518)
Income Before Provision for Income Taxes 392,224 342,066 247,971
Provision for Income Taxes 141,794 127,724 96,925
Net Income $ 250,430 $ 214,342 $ 151,046
Net Income per Share-Basic $ 2.17 $ 1.90 $ 1.37 Net Income per Share-Diluted $ 2.11 $ 1.85 $ 1.33 Weighted Average Common Shares
Outstanding-Basic* 115,608 112,614 110,217
Weighted Average Common and Common Equivalent Shares Outstanding-Diluted* 118,693 115,738 113,048
Cash Dividend per Common Share* $ 0.40 $ 0.32 $ 0.21
Net Income $ 250,430 $ 214,342 $ 151,046 Other Comprehensive Income:
Net Unrealized (Loss) Gain on Available for Sale Securities, Net of Tax (2,150) 217 79
Net Unrealized Gain on Interest Rate Swaps Accounted for as Cash Flow Hedges, Net of Tax - 44 882
Net Change in Currency Translations, Net of Tax 20,246 2,202 4,796 Total Comprehensive Income $ 268,526 $ 216,805 $ 156,803
*2005 amounts have been adjusted for the March 22, 2006 3-for-2 stock split.
See accompanying Notes to Consolidated Financial Statements.

53
RAYMOND JAMES FINANCIAL, INC. AND SUBSIDIARIES CONSOLIDATED STATEMENTS OF CHANGES IN SHAREHOLDERS' EQUITY
(in 000’s, except per share amounts)
Shares Accumu- Exchangeable Addi- lated Other into tional Compre- Treasury Stock Total Common Stock Common Stock Paid-in Retained hensive Common Shareholders' Shares Amount Shares Amount Capital Earnings Income Shares Amount Equity Balances at September 24, 2004 75,322 $ 753 285 $5,493 $127,405 $957,317 $ 3,875 (1,761) $(29,630) $1,065,213
Net Income Fiscal 2005 151,046 151,046 Cash Dividends - Common Stock
($.21 per Share)* (26,300) (26,300)Purchase of Treasury Shares 62 (6) (177) (115)Employee Stock Purchases 329 3 9,622 9,625 Exercise of Stock Options 916 9 13,961 54 913 14,883 Grant of Restricted Shares 5,678 457 7,690 13,368 Stock Option Expense 8,346 8,346 Net Unrealized Gain on Available for Sale
Securities ** 79 79 Net Unrealized Gain on Interest
Rate Swaps Accounted for as Cash Flow Hedges ** 882 882
Net Change In Currency Translations ** 4,796 4,796 Balances at September 30, 2005 76,567 $ 765 285 $5,493 $165,074 $1,082,063 $ 9,632 (1,256) $(21,204) $1,241,823
Net Income Fiscal 2006 214,342 214,342 Cash Dividends - Common Stock
($.32 per Share) (37,570) (37,570)Purchase of Treasury Shares (126) (5,580) (5,580)3-For2 Stock Split 38,945 389 129 (389) (426) Employee Stock Purchases 321 3 10,710 10,713 Exchangeable Shares 52 (52) (844) 844 Exercise of Stock Options 987 10 19,721 290 4,761 24,492 Grant of Restricted Shares 784 8 248 4,354 4,362 Restricted Stock Expense 11,308 11,308 Stock Option Expense 13,773 13,773 Restricted Stock Units 1,584 1,584 APIC Reclass Related to Unvested
Restricted Stock Grants (25) (17,816) (17,841)Net Unrealized Gain on Available for Sale
Securities ** 217 217 Net Unrealized Gain on Interest Rate
Swaps Accounted for as Cash Flow Hedges ** 44 44
Net Change in Currency Translations ** 2,202 2,202 Balances at September 30, 2006 117,656 $1,150 362 $4,649 $205,198 $1,258,446 $12,095 (1,270) $(17,669) $1,463,869
Net Income Fiscal 2007 250,430 250,430 Cash Dividends - Common Stock
($.40 per Share) (48,488) (48,488)Purchase of Treasury Shares (70) (2,208) (2,208)Employee Stock Purchases 445 4 14,096 (7) 14,093 Exchangeable Shares 89 (89) (1,145) 1,145 Exercise of Stock Options 1,734 17 25,098 125 1,839 26,954 Grant of Restricted Shares 979 5 (2,000) 209 1,995 Restricted Stock Expense 19,321 19,321 Stock Option Expense 12,361 12,361 Restricted Stock Unit Expense 1,828 1,828 APIC Reclass Related to Unvested
Independent Contractor Stock Options 48 48 Net Unrealized Loss on Available for Sale
Securities ** (2,150) (2,150)Net Change in Currency Translations ** 20,246 20,246 Other ** 1,510 1,510 Balances at September 30, 2007 120,903 $1,176 273 $3,504 $277,095 $1,461,898 $30,191 (1,006) $(16,050) $1,757,814 .* Adjusted to reflect 3-for-2 stock split paid on March 22, 2006. ** Net of tax See accompanying Notes to Consolidated Financial Statements

54
RAYMOND JAMES FINANCIAL, INC. AND SUBSIDIARIES CONSOLIDATED STATEMENTS OF CASH FLOWS
(in 000’s) (continued on next page)
Year Ended
September 30, September 30, September 30, 2007 2006 2005
Cash Flows From Operating Activities: Net Income $ 250,430 $ 214,342 $ 151,046 Adjustments to Reconcile Net Income to Net
Cash Provided by (Used in) Operating Activities: Depreciation and Amortization 22,631 19,173 17,781 Excess Tax Benefits from Stock-Based Payment Arrangements (612) (1,646) - Deferred Income Taxes (11,515) (6,097) (15,301) Unrealized Gains, Premium and Discount Amortization
on Available for Sale Securities and Other Securities 790 196 (794) Ineffectiveness of Interest Rate Swaps Accounted for as
Cash Flow Hedges - - 208 Impairment on Leveraged Lease Investments - - 6,534 Loss (Gain) on Sale of Property and Equipment 20 143 (106) Gain on Sale of Loans Available for Sale (518) (413) (421) Gain on Sale of Joint Venture Interest (2,559) - - Provision for Loan Loss, Legal Proceedings, Bad Debts and Other Accruals 37,138 31,011 39,854 Stock-Based Compensation Expense 36,563 29,820 17,031
(Increase) Decrease in Operating Assets:
Assets Segregated Pursuant to Regulations and Other Segregated Assets (739,025) (868,505) (74,595) Receivables:
Brokerage Clients, Net (179,030) (78,980) (151,938) Stock Borrowed (224,163) 11,747 457,030 Brokers-Dealers and Clearing Organizations (9,301) (99,683) 14,784 Other (122,198) (39,084) (47,526)
Securities Purchased Under Agreements to Resell and Other Collateralized Financings, Net of Securities Sold Under Agreements to Repurchase 100,708 132,979 (91,925)
Trading Instruments, Net 74,770 (166,678) (6,694) Proceeds from Sale of Loans Available for Sale 39,778 15,875 34,902 Origination of Loans Available for Sale (39,695) (14,349) (36,036) Prepaid Expenses and Other Assets (2,451) (32,171) (31,864) Minority Interest (9,727) (8,159) (2,518)
Increase (Decrease) in Operating Liabilities:
Payables: Brokerage Clients 1,062,194 784,692 418,858 Stock Loaned 45,643 119,509 (481,522) Brokers-Dealers and Clearing Organizations 46,751 (66,623) 72,011 Trade and Other 54,379 (3,179) (12,181)
Accrued Compensation, Commissions and Benefits 33,086 20,016 43,595 Income Taxes Payable (27,516) 2,681 (697)
Net Cash Provided by (Used in) Operating Activities 436,571 (3,383) 319,516
See accompanying Notes to Consolidated Financial Statements.

55
RAYMOND JAMES FINANCIAL, INC. AND SUBSIDIARIES CONSOLIDATED STATEMENTS OF CASH FLOWS
(in 000’s) (continued)
Year Ended September 30, September 30, September 30,
2007 2006 2005
Cash Flows from Investing Activities: Additions to Property and Equipment, Net (46,081) (27,280) (30,154) Proceeds from Sale of Joint Venture Interest, Net of Cash Disposed 3,514 - - Loan Originations and Purchases (4,133,345) (2,318,831) (691,302) Loan Repayments 1,997,824 1,044,015 379,298 Purchases of Other Investments (15,639) (66,726) - Investments in Real Estate Partnerships-Held by Variable
Interest Entities (18,078) (89,735) (75,967) Loans to Investor Members of Variable Interest Entities Related to Investments
in Real Estate Partnerships - (42,715) (46,286) Repayments of Loans by Investor Members of Variable Interest Entities Related
to Investments in Real Estate Partnerships 16,619 10,898 - Securities Purchased Under Agreements to Resell, Net (445,000) (460,000) - Sale of Available for Sale Securities 81 252 9,250 Purchases of Available for Sale Securities (396,450) (1,180,414) (60,536) Available for Sale Securities Maturations and Repayments 102,700 1,087,624 71,671
Net Cash Used in Investing Activities (2,933,855) (2,042,912) (444,026)
Cash Flows from Financing Activities:
Proceeds from Borrowed Funds, Net - 8,464 16,542 Repayments of Mortgage and Borrowings, Net (18,872) (13,288) (6,473) Proceeds from Borrowed Funds Related to Investments by Variable Interest
Entities in Real Estate Partnerships 6,744 54,249 74,921 Repayments of Borrowed Funds Related to Investments by Variable Interest
Entities in Real Estate Partnerships (36,339) (5,382) (3,665) Proceeds from Capital Contributed to Variable Interest Entities Related to
Investments in Real Estate Partnerships 66,201 83,215 32,051 Minority Interest (42,659) (11,176) (4,210) Exercise of Stock Options and Employee Stock Purchases 38,076 33,120 23,066 Increase in Bank Deposits 2,778,379 1,730,860 302,984 Purchase of Treasury Stock (578) (5,100) (115) Cash Dividends on Common Stock (48,488) (37,570) (26,300) Excess Tax Benefits from Stock-Based Payment Arrangements 612 1,646 -
Net Cash Provided by Financing Activities 2,743,076 1,839,038 408,801
Currency Adjustment:
Effect of Exchange Rate Changes on Cash 3,079 2,202 4,796 Net Increase (Decrease) in Cash and Cash Equivalents 248,871 (205,055) 289,087 Cash Resulting from Consolidation of Variable Interest Entities Related to
Investments in Real Estate Partnerships (291) - 20,851 Cash Resulting from Consolidation of Limited Partnerships 3,945 - - Cash and Cash Equivalents at Beginning of Year 392,418 597,473 287,535
Cash and Cash Equivalents at End of Year $ 644,943 $ 392,418 $ 597,473
Supplemental Disclosures of Cash Flow Information: Cash Paid for Interest $ 498,175 $ 294,215 $ 116,553 Cash Paid for Income Taxes $ 177,087 $ 129,480 $ 113,476
See accompanying Notes to Consolidated Financial Statements.

56
RAYMOND JAMES FINANCIAL, INC. AND SUBSIDIARIES NOTES TO CONSOLIDATED FINANCIAL STATEMENTS
Note 1 - SUMMARY OF SIGNIFICANT ACCOUNTING POLICIES: Description of Business Raymond James Financial, Inc. (“RJF”) is a holding company headquartered in Florida whose subsidiaries are engaged in various financial services businesses, including the underwriting, distribution, trading and brokerage of equity and debt securities and the sale of mutual funds and other investment products. In addition, some of these subsidiaries provide investment management services for retail and institutional clients and banking and trust services. The accounting and reporting policies of Raymond James Financial, Inc. and its subsidiaries (the “Company”) conform to accounting principles generally accepted in the United States of America (“U.S.”), the more significant of which are summarized below: Basis of Presentation The consolidated financial statements include the accounts of RJF and its consolidated subsidiaries that are generally controlled through a majority voting interest. All material consolidated subsidiaries are 100% owned by the Company. In accordance with Financial Accounting Standards Board (“FASB”) Interpretation (“FIN”) No. 46R, “Consolidation of Variable Interest Entities” (“FIN 46R”), the Company also consolidates any variable interest entities (“VIEs”) of which it is the primary beneficiary, as defined. Additional information is provided in Note 6 below. When the Company does not have a controlling interest in an entity, but exerts significant influence over the entity, the Company applies the equity method of accounting. All material intercompany balances and transactions have been eliminated in consolidation. Effective October 1, 2006, the Company adopted Emerging Issues Task Force (“EITF”) Issue 04-5, “Determining Whether a General Partner, or the General Partners as a Group, Controls a Limited Partnership or Similar Entity When the Limited Partners Have Certain Rights,” for partnerships created before and not subsequently modified after June 29, 2005. As a result, the Company consolidated three partnerships beginning in the three months ended December 31, 2006. As of September 30, 2007, these partnerships had assets of approximately $77.1 million. Management Estimates and Assumptions The preparation of consolidated financial statements in conformity with accounting principles generally accepted in the U.S. requires management to make estimates and assumptions that affect the reported amounts of assets and liabilities, disclosure of contingent assets and liabilities at the date of the consolidated financial statements and the reported amounts of revenues and expenses during the reporting period. Actual results could differ from those estimates and could have a material impact on the consolidated financial statements.
Reporting Period The Company’s quarters end on the last day of each calendar quarter. Recognition of Revenues Securities transactions and related commission revenues and expenses are recorded on a trade date basis. Investment banking revenues are recorded at the time a transaction is completed and the related income is reasonably determinable. Investment banking revenues include management fees and underwriting fees, net of reimbursable expenses, earned in connection with the distribution of the underwritten securities, merger and acquisition fees, private placement fees and limited partnership distributions. The Company earns investment advisory fees based on the value of clients' portfolios. These fees are recorded ratably over the period earned. Financial service fees include per account fees such as IRA fees, transaction fees on fee based accounts, service fees and distribution fees received from mutual funds. Under clearing agreements, the Company clears trades for unaffiliated correspondent brokers and retains a portion of commissions as a fee for its services. Correspondent clearing revenues are recorded net of commissions remitted and included in other revenue. Total commissions generated by correspondents were $39,634,000, $29,985,000, and $28,957,000 and commissions remitted totaled $34,004,000, $25,049,000, and $24,435,000 for the years ended September 30, 2007, September 30, 2006, and September 30, 2005, respectively. Cash and Cash Equivalents Cash equivalents are highly liquid investments with original maturities of 90 days or less, other than those used for trading purposes.
Assets Segregated Pursuant to Regulations and Other Segregated Assets In accordance with Rule 15c3-3 of the Securities Exchange Act of 1934, Raymond James & Associates (“RJA”), as a broker-dealer carrying client accounts, is subject to requirements related to maintaining cash or qualified securities in a segregated reserve account for the exclusive benefit of its clients. In addition, Raymond James Limited (“RJ Ltd.”) is required to hold client Registered Retirement Savings Plan funds in trust. Segregated assets at September 30, 2007 and September 30, 2006 consist of cash and cash equivalents.

57
Repurchase Agreements and Other Collateralized Financings The Company purchases short-term securities under agreements to resell (“reverse repurchase agreements”). Additionally, the Company sells securities under agreements to repurchase (“repurchase agreements”). Both reverse repurchase and repurchase agreements are accounted for as collateralized financings and are carried at contractual amounts plus accrued interest. Other than Raymond James Bank’s (“RJBank”) policy described below, it is the Company's policy to obtain possession of collateral with a market value equal to or in excess of the principal amount loaned under the reverse repurchase agreements. To ensure that the market value of the underlying collateral remains sufficient, the collateral is valued daily, and the Company may require counterparties to deposit additional collateral (or may return collateral to counterparties) when appropriate. Other collateralized financings include secured call loans receivable held by RJ Ltd. These financings represent loans of excess cash to financial institutions which are fully collateralized by treasury bills and bear interest at call loan rates. RJBank’s reverse repurchase agreements are accounted for as collateralized investing transactions and are recorded at the amounts at which the securities were acquired plus accrued interest. Securities obtained under the resale agreements have a market value equal to or exceeding the principal amount of the resale agreements. The securities are held by third party custodians and are segregated under written agreements that recognize RJBank’s interest in the securities. The securities purchased are primarily mortgage backed securities or collateralized mortgage obligations (“CMOs”) issued by U.S. agencies. The market value of securities purchased is monitored and collateral is obtained from or returned to the counterparty when appropriate. These reverse repurchase agreements generally mature on the next business day. RJBank has the right to sell, transfer or pledge the securities purchased under agreements to resell. Financial Instruments Trading instruments are comprised primarily of the financial instruments held by the Company's broker-dealer subsidiaries. These instruments are recorded at fair value with unrealized gains and losses reflected in current period earnings. Fair values are generally based on prices from independent sources, such as listed market prices or broker or dealer price quotations. For investments in illiquid and privately held securities that do not have readily determinable fair values through quoted market prices, the determination of fair value is based upon consideration of available information, including types of securities, current financial information, restrictions on dispositions, market values of underlying securities and quotations for similar instruments. Available for sale securities are comprised primarily of CMOs and mortgage related debt. Debt and equity securities classified as available for sale are reported at fair value with unrealized gains or losses, net of deferred taxes, reported in shareholders' equity as a component of accumulated other comprehensive income. Fair values of the debt securities are estimated based on bid quotations received from securities dealers or, if quoted market prices are not available, then the fair value is estimated using quoted market prices for similar securities, pricing models, or discounted cash flow analyses, using observable market data where available. All realized gains and losses are determined on a specific identification basis and are included in current period earnings. Additionally, any unrealized losses deemed to be other than temporary are included in current period earnings and a new cost basis for the security is established. Many factors are considered to determine whether an impairment is other-than-temporary, including whether the Company has the ability and intent to hold the investment until a market price recovery and whether evidence indicating the cost of the investment is recoverable outweighs evidence to the contrary. Evidence considered in this assessment includes the reasons for the impairment, the severity and duration of the impairment, changes in value subsequent to year-end, and forecasted performance of the security. Brokerage Client Receivables and Allowance for Doubtful Accounts Brokerage client receivables include receivables of the Company's asset management and broker-dealer subsidiaries. The receivables from asset management clients are primarily for accrued asset management service fees, while the receivables from broker-dealer clients are principally for amounts due on cash and margin transactions and are generally collateralized by securities owned by the clients. Both the receivables from the asset management and broker-dealer clients are reported at their outstanding principal balance, adjusted for any allowance for doubtful accounts. When a broker-dealer receivable is considered to be impaired, the amount of the impairment is generally measured based on the fair value of the securities acting as collateral, which is measured based on current prices from independent sources such as listed market prices or broker-dealer price quotations. Securities owned by customers, including those that collateralize margin or other similar transactions, are not reflected in the Consolidated Statements of Financial Condition. The Company also makes loans or pays advances to Financial Advisors, primarily for recruiting and retention purposes. The Company provides for an allowance for doubtful accounts based on an evaluation of the Company’s ability to collect such receivables. The Company’s ongoing evaluation includes the review of specific accounts of Financial Advisors no longer associated with the Company and the Company’s historical collection experience. When the review of these accounts indicates that further collection activity is highly unlikely, the loans are written off and the corresponding allowance for doubtful accounts is reversed. Securities Borrowed and Securities Loaned Securities borrowed and securities loaned transactions are reported as collateralized financings and recorded at the amount of collateral advanced or received. Securities borrowed transactions generally require the Company to deposit cash with the lender. With respect to securities loaned, the Company generally receives collateral in the form of cash in an amount in excess of the market value of securities loaned. The Company monitors the market value of securities borrowed and loaned on a daily basis, with additional collateral obtained or refunded as necessary.
Bank Client Loans and Allowances for Losses Bank loans are primarily comprised of loans originated or purchased by RJBank and include commercial and residential mortgage loans, as well as non-real estate commercial and consumer loans. The Company records these loans at amortized cost, adjusted for an allowance for loan loss. Included in amortized cost are any deferred fees or loan origination costs plus the unamortized premiums or discounts on purchased loans. Syndicated loans purchased are reported as of the earlier of the settlement date or the delayed settlement compensation commencement date.

58
Loan origination fees, net of related costs, are capitalized and recognized in interest income using the interest or straight-line method, or proportionate to the amount of principal payments, over the contractual life of the loans. Residential mortgage loans originated and intended for sale in the secondary market are carried at the lower of cost or estimated fair value in the aggregate. Gains and losses on sales of these assets are included as a component of other income, while interest collected on these assets is included in interest income. Net unrealized losses are recognized through a valuation allowance by charges to income. Client loans at RJBank are generally collateralized by real estate or other property. RJBank provides for both an allowance for losses in accordance with Statement of Financial Accounting Standard (“SFAS”) No. 5, "Accounting for Contingencies" (“SFAS 5”), and a reserve for individually impaired loans in accordance with SFAS No. 114, “Accounting by a Creditor for Impairment of a Loan”. The calculation of the SFAS 5 allowance is subjective as management segregates the loan portfolio into different homogeneous classes and assigns each class an allowance percentage based on the perceived risk associated with that class of loans. The factors taken into consideration when assigning the reserve percentage to each reserve category include estimates of borrower default probabilities and collateral values; trends in delinquencies; volume and terms; changes in geographic distribution, lending policies, local, regional, and national economic conditions; concentrations of credit risk and past loss history. In addition, the Company provides for potential losses inherent in RJBank’s unfunded lending commitments using the criteria above, further adjusted for an estimated probability of funding. For individual loans identified as impaired, RJBank measures impairment based on the present value of expected future cash flows discounted at the loan's effective interest rate, the loan's observable market price, or the fair value of the collateral if the loan is collateral dependent. At September 30, 2007, the amortized cost of all RJBank loans was $4.7 billion and an allowance for loan losses of $47 million was recorded against that balance. RJBank also has $6.8 million in reserves for off-balance sheet exposures maintained in Trade and Other Payables. The total allowance for losses and reserves for unfunded commitments is equal to 1.15% of the amortized cost of the loan portfolio. Once RJBank has identified a loan as impaired, the accrual of interest on the loan is discontinued when either principal or interest becomes 90 days past due or when the full timely collection of interest or principal becomes uncertain. When a loan is placed on nonaccrual status, the accrued and unpaid interest receivable is written off and accretion of the net deferred loan origination fees ceases. The loan is accounted for on the cash or cost recovery method thereafter until qualifying for return to accrual status. When the uncollectibility of a loan balance is believed to be confirmed, loan losses are charged against the allowance and subsequent recoveries, if any, are credited to the allowance. Real estate acquired in the settlement of loans, including through, or in lieu of, loan foreclosure, is initially recorded at the lower of cost or estimated fair value less estimated selling costs, establishing a new cost basis. Subsequent to foreclosure, valuations are periodically performed by management and the assets are carried at the lower of the carrying amount or fair value, as determined by a current appraisal, less estimated costs to sell. Costs relating to development and improvement of the property are capitalized, whereas those relating to holding the property are charged to operations.
Investments in Real Estate Partnerships- Held by Variable Interest Entities A wholly owned subsidiary of the Company is the managing member or general partner in several separate tax credit housing funds. Additional information is presented in Note 6 below. These funds invest in limited partnerships which purchase and develop affordable housing properties qualifying for federal and state tax credits. As of September 30, 2007 and September 30, 2006, the investments related to these limited partnerships totaled approximately $221.1 million and $228.0 million, respectively, on the Company’s Consolidated Statements of Financial Condition. Property and Equipment Property, equipment and leasehold improvements are stated at cost less accumulated depreciation and amortization. Depreciation of assets is primarily provided for using the straight-line method over the estimated useful lives of the assets, which range from two to seven years for software, two to five for furniture and equipment and 10 to 31 years for buildings and land improvements. Leasehold improvements are amortized using the straight-line method over the shorter of the lease term or the estimated useful lives of the assets. Additions, improvements and expenditures for repairs and maintenance that significantly extend the useful life of an asset are capitalized. Other expenditures for repairs and maintenance are charged to operations in the period incurred. Gains and losses on disposals of property and equipment are reflected in income in the period realized. Goodwill Goodwill is related to the acquisitions of Roney & Co. (now part of RJA) and Goepel McDermid, Inc. (now called Raymond James Ltd.). This goodwill, totaling $63 million, was allocated to the reporting units within the Private Client Group and Capital Markets segments pursuant to SFAS No. 142, “Goodwill and Other Intangible Assets”. Goodwill represents the excess cost of a business acquisition over the fair value of the net assets acquired. In accordance with this pronouncement, indefinite-life intangible assets and goodwill are not amortized. Rather, they are subject to impairment testing on an annual basis, or more often if events or circumstances indicate there may be impairment. This test involves assigning tangible assets and liabilities, identified intangible assets and goodwill to reporting units and comparing the fair value of each reporting unit to its carrying amount. If the fair value is less than the carrying amount, a further test is required to measure the amount of the impairment. When available, the Company uses recent, comparable transactions to estimate the fair value of the respective reporting units. The Company calculates an estimated fair value based on multiples of revenues, earnings, and book value of comparable transactions. However, when such comparable transactions are not available or have become outdated, the Company uses discounted cash flow scenarios to estimate the fair value of the reporting units. As of September 30, 2007, goodwill had been allocated to the Private Client Group of RJA, and both the Private Client Group and Capital Markets segments of RJ Ltd. As of the most recent impairment test, the Company determined that the carrying value of the goodwill for each reporting unit had not been impaired. However, changes in current circumstances or business conditions could result in an impairment of goodwill. As required, the Company will continue to perform

59
impairment testing on an annual basis or when an event occurs or circumstances change that would more likely than not reduce the fair value of a reporting unit below its carrying amount. Legal Reserves The Company recognizes liabilities for contingencies when there is an exposure that, when fully analyzed, indicates it is both probable that a liability has been incurred and the amount of loss can be reasonably estimated. When a range of probable loss can be estimated, the Company accrues the most likely amount; if not determinable, the Company accrues at least the minimum of the range of probable loss. The Company records reserves related to legal proceedings in Trade and Other Payables. Such reserves are established and maintained in accordance with SFAS 5 and FIN No. 14, “Reasonable Estimation of the Amount of a Loss”. The determination of these reserve amounts requires significant judgment on the part of management. Management considers many factors including, but not limited to: the amount of the claim; the amount of the loss in the client's account; the basis and validity of the claim; the possibility of wrongdoing on the part of an employee of the Company; previous results in similar cases; and legal precedents and case law. Each legal proceeding is reviewed with counsel in each accounting period and the reserve is adjusted as deemed appropriate by management. Lastly, each case is reviewed to determine if it is probable that insurance coverage will apply, in which case the reserve is reduced accordingly. Any change in the reserve amount is recorded in the consolidated financial statements and is recognized as a charge/credit to earnings in that period. Stock Compensation Effective October 1, 2005, the Company adopted SFAS No. 123R, “Share-Based Payment”, which requires the measurement and recognition of compensation expense for all share-based payment awards made to employees and directors based on estimated fair values. Given that the Company had adopted the fair value recognition provisions as of September 28, 2002, using the modified prospective method of adoption within the provisions of SFAS No. 148 “Accounting for Stock-Based Compensation – Transition and Disclosure”, the adoption of SFAS No. 123R did not have a material impact on the Company’s accounting for employee stock-based compensation. At September 30, 2007, the Company had multiple stock-based employee compensation plans, which are described more fully in Note 17 below. In addition, the Company has two stock option plans for its independent contractor Financial Advisors, which are described more fully in Note 18 below. The Company accounts for share-based awards to its independent contractor Financial Advisors in accordance with EITF No. 96-18, “Accounting for Equity Instruments That are Issued to Other Than Employees for Acquiring, or in Conjunction with Selling, Goods or Services” and EITF 00-19, “Accounting for Derivative Financial Instruments Indexed to, and Potentially Settled in, a Company’s Own Stock”. As a result, these awards are revalued at each reporting date for purposes of measuring compensation expense associated with these awards. Compensation expense is recognized for all stock-based compensation with future service requirements over the relevant vesting periods using the straight-line method. Derivative Financial Instruments The Company accounts for derivative financial instruments and hedging activities in accordance with SFAS No. 133, "Accounting for Derivative Instruments and Hedging Activities", as subsequently amended by SFAS No. 137, "Accounting for Derivative Instruments and Hedging Activities - Deferral of the Effective Date of FASB Statements No. 133", SFAS No. 138, "Accounting for Certain Derivative Instruments and Certain Hedging Activities", and SFAS No. 149, "Amendments of Statement 133 on Derivative Instruments and Hedging Activities", which establishes accounting and reporting standards for derivatives and hedging activities. These statements establish standards for designating a derivative as a hedge. Derivatives in a broker-dealer or those that do not meet the criteria for designation as a hedge are accounted for as trading account assets and liabilities, and recorded at fair value in the statement of financial condition with the realized and unrealized gains or losses recorded in the consolidated statement of income for that period. Under FIN 39, “Offsetting of Amounts Related to Certain Contracts”, the Company elects to net-by-counterparty the fair value of interest rate swap contracts entered into by the Fixed Income Trading group. Certain contracts contain a legally enforceable master netting arrangement and therefore, the fair value of those swap contracts are netted by counterparty in the Consolidated Statements of Financial Condition. The Company uses interest rate swaps as well as future contracts as part of its fixed income business. In addition, the Company enters into interest rate swaps which are, in turn, substantially economically hedged with counterparties. These positions are marked to market with the gain or loss and the related interest recorded in Net Trading Profits within the statement of income for the period. Any collateral exchanged as part of the swap agreement is recorded in broker receivables and payables in the Consolidated Statements of Financial Condition for the period.
Leases The Company leases office space and equipment under operating leases. The Company recognizes rent expense related to these operating leases on a straight-line basis over the lease term. The lease term commences on the earlier of the date when the Company becomes legally obligated for the rent payments or the date on which the Company takes possession of the property. For tenant improvement allowances and rent holidays, the Company records a deferred rent liability in other liabilities in the Consolidated Statements of Financial Condition and amortizes the deferred rent over the lease term as a reduction to rent expense in the consolidated statement of income.
Foreign Currency Translation The Company consolidates its foreign subsidiaries and joint ventures. The statement of financial condition of the subsidiaries and joint ventures are translated at exchange rates as of the period end. The statements of income are translated at an average exchange rate for the period. The gains or losses resulting from translating foreign currency financial statements into U.S. dollars are included in shareholders' equity as a component of Accumulated Other Comprehensive Income.

60
Income Taxes The Company utilizes the asset and liability approach defined in SFAS No. 109, “Accounting for Income Taxes”, which requires the recognition of deferred tax assets and liabilities for the expected future tax consequences of temporary differences between the financial statement amounts and the tax bases of assets and liabilities. Earnings per Share (“EPS”) Basic EPS is calculated by dividing earnings available to common stockholders by the weighted-average number of common shares outstanding. Diluted EPS is similar to basic EPS, but adjusts for the effect of the potential issuance of common shares by application of the treasury stock method. Reclassifications Certain revisions and reclassifications have been made to the consolidated financial statements of the prior years to conform to the current year presentation. As a result, Financial Service Fees revenue and Investment Advisory Fees expense increased by approximately $12.8 million and $11.2 million, respectively, for the years ended September 30, 2006 and 2005. These revisions did not impact the Company’s net income for the years ended September 30, 2006 and 2005. The Company also reclassified certain amounts from cash to segregated assets and reverse repurchase agreements on its 2006 and 2005 Consolidated Statements of Financial Condition and related cash flow activity on its 2006 and 2005 Consolidated Statements of Cash Flows. For fiscal year 2006, $176.8 million was reclassified from cash to segregated assets and $72.5 million was reclassified from cash to securities purchased under agreements to resell. For fiscal year 2005, $146.4 million was reclassified from cash to segregated assets and $137.3 million was reclassified from cash to securities purchased under agreements to resell. These revisions did not impact the Company’s net income for the years ended September 30, 2006 and 2005. In the quarter ended September 30, 2007, a new segment was established: Proprietary Capital. The components of this segment were previously included in the Asset Management and Other segments. Reclassifications have been made in the segment disclosure for previous years to conform to this presentation. Additional information is provided in Note 22 below. NOTE 2 – TRADING INSTRUMENTS AND TRADING INSTRUMENTS SOLD BUT NOT YET PURCHASED: September 30, 2007 September 30, 2006 Instruments Instruments Sold but Sold but Trading Not Yet Trading Not Yet Instruments Purchased Instruments Purchased (in 000's)
Marketable:
Municipal Obligations $ 200,024 $ 54 $ 192,028 $ 5 Corporate Obligations 56,069 952 134,431 968 Government Obligations 83,322 45,275 37,793 31,636 Agencies 47,123 60,829 68,380 34,023
Total Debt Securities 386,538 107,110 432,632 66,632 Derivative Contracts 30,603 8,445 20,904 8,309 Equity Securities 46,913 34,174 29,532 19,068 Other Securities 3,707 - 2,703 -
Total $ 467,761 $ 149,729 $ 485,771 $ 94,009 Mortgage backed securities of $48.9 million and $77.1 million at September 30, 2007 and September 30, 2006, respectively, are included in Corporate Obligations and Agencies in the table above. Mortgage backed securities sold but not yet purchased of $60.8 million and $34 million at September 30, 2007 and September 30, 2006, respectively, are included in Agencies in the table above. Net unrealized (losses) gains related to open trading positions at September 30, 2007, September 30, 2006, and September 30, 2005 were $(726,000), $4,387,000, and $(1,257,000), respectively. NOTE 3 - AVAILABLE FOR SALE SECURITIES: Available for sale securities are comprised primarily of CMOs, mortgage related debt, and certain equity securities of the Company's non-broker-dealer subsidiaries, principally RJBank. There were proceeds from the sale of available for sale securities of $81,000 for the year ended September 30, 2007, $252,000 for the year ended September 30, 2006 and $9,250,000 for the year ended September 30, 2005. The realized gains and losses related to the sale of available for sale securities were immaterial to the consolidated financial statements for all years presented.

61
The amortized cost and estimated market values of securities available for sale at September 30, 2007, September 30, 2006 and September 30, 2005 are as follows:
September 30, 2007 Gross Gross Unrealized Unrealized Cost Basis Gains Losses Fair Value (in 000's) Available for Sale Securities:
Agency Mortgage Backed Securities $ 189,816 $ 283 $ (404) $ 189,695 Non-Agency Collateralized Mortgage Obligations 382,980 239 (3,003) 380,216
Total RJBank Available for Sale Securities 572,796 522 (3,407) 569,911
Other 3 38 - 41
Total Available for Sale Securities $ 572,799 $ 560 $ (3,407) $ 569,952
September 30, 2006 Gross Gross Unrealized Unrealized Cost Basis Gains Losses Fair Value (in 000's) Available for Sale Securities:
Agency Mortgage Backed Securities $ 142,084 $ 495 $ (27) $ 142,552 Non-Agency Collateralized Mortgage Obligations 137,753 363 (156) 137,960
Total RJBank Available for Sale Securities 279,837 858 (183) 280,512
Other 110 - (42) 68
Total Available for Sale Securities $ 279,947 $ 858 $ (225) $ 280,580
September 30, 2005 Gross Gross Unrealized Unrealized Cost Basis Gains Losses Fair Value (in 000's) Available for Sale Securities:
Agency Mortgage Backed Securities $ 182,066 $ 485 $ (34) $ 182,517 Non-Agency Collateralized Mortgage Obligations 5,166 - (171) 4,995 Municipal Bonds 5 - - 5
Total RJBank Available for Sale Securities 187,237 485 (205) 187,517
Other 27 5 - 32
Total Available for Sale Securities $ 187,264 $ 490 $ (205) $ 187,549

62
The following table shows the scheduled maturities, carrying values and current yields for RJBank's available for sale securities at September 30, 2007. Since RJBank’s available for sale securities are backed by mortgages, actual maturities will differ from contractual maturities because borrowers may have the right to call or prepay obligations with or without prepayment penalties.
After One But After Five But Within One Year Within Five Years Within Ten Years After Ten Years Total Weighted Weighted Weighted Weighted Weighted Balance Average Balance Average Balance Average Balance Average Balance Average Due Yield Due Yield Due Yield Due Yield Due Yield ($ in 000’s) Agency
Mortgage Backed Securities $ 96 5.51% $ - - $ 10,646 5.48% $ 178,953 5.47% $ 189,695 5.47%
Non-Agency Collateralized Mortgage Obligations - - - - - - 380,216 5.65% 380,216 5.65% $ 96 $ - $ 10,646 $ 559,169 $ 569,911
The following table shows RJBank’s investments’ gross unrealized losses and fair value, aggregated by investment category and length of time the individual securities have been in a continuous unrealized loss position, at September 30, 2007:
Less than 12 Months 12 Months or More Total Estimated Estimated Estimated
Fair Unrealize
d Fair Unrealize
d Fair Unrealized Value Losses Value Losses Value Losses (in 000’s) Agency Mortgage Backed Securities $ 99,726 $ (347) $ 22,475 $ (57) $ 122,201 $ (404) Non-Agency Collateralized
Mortgage Obligations 300,176 (2,897) 8,244 (106) 308,420 (3,003) Total Temporarily
Impaired Securities $ 399,902 $ (3,244) $ 30,719 $ (163) $ 430,621 $ (3,407)
The reference point for determining when securities are in a loss position is fiscal year-end. As such, it is possible that a security had a fair value that exceeded its amortized cost on other days during the past twelve-month period. The unrealized losses at September 30, 2007, were primarily caused by interest rate changes and market irregularities. The Federal National Mortgage Association or Federal Home Loan Mortgage Corporation guarantees the contractual cash flows of the agency collateralized mortgage obligation securities. As of September 30, 2007, $359 million of the non-agency collateralized mortgage obligations are rated AAA, and $21 million are investment grade rated below AAA. All of the non-agency securities carry various amounts of credit enhancement, and none are collateralized with subprime loans. It is expected that the securities would not be settled at a price less than the amortized cost of the investment. Because the decline in fair value is attributable to changes in interest rates and market irregularities and not credit quality, and because the Company has the ability and intent to hold these investments until a fair value recovery or maturity, these investments are not considered "other-than-temporarily" impaired.
NOTE 4 - RECEIVABLES FROM AND PAYABLES TO BROKERAGE CLIENTS: Receivables from Brokerage Clients Receivables from brokerage clients include amounts arising from normal cash and margin transactions and fees receivable. Margin receivables are collateralized by securities owned by brokerage clients. Such collateral is not reflected in the accompanying consolidated financial statements. The amount receivable from clients at September 30, 2007 and September 30, 2006 is as follows:
September 30, September 30, 2007 2006
(in 000's) Brokerage Client Receivables $ 1,704,944 $ 1,505,126 Allowance For Doubtful Accounts (644) (519)
Brokerage Client Receivables, Net $ 1,704,300 $ 1,504,607

63
Payables to Brokerage Clients Payables to brokerage clients include brokerage client funds on deposits awaiting reinvestment. The following table presents a summary of such payables at September 30, 2007 and September 30, 2006:
September 30, September 30, 2007 2006 (in 000's) Brokerage Client Payables:
Interest Bearing $ 5,115,215 $ 4,140,197 Non-Interest Bearing 560,645 412,030
Total Brokerage Client Payables $ 5,675,860 $ 4,552,227 Interest expense on brokerage client payables for the years ended September 30, 2007, September 30, 2006, and September 30, 2005 was $204,158,000, $143,428,000, and $58,486,000, respectively.
NOTE 5 – BANK LOANS, NET:
Bank client receivables are primarily comprised of loans originated or purchased by RJBank and include commercial and residential real estate loans, as well as commercial and consumer loans. These receivables are collateralized by first or second mortgages on residential or other real property, by other assets of the borrower, or are unsecured. The following table presents the balance and associated percentage of each major loan category in RJBank's portfolio, including loans receivable and loans available for sale:
September 30, September 30, September 30, September 24, September 26, 2007 2006 2005 2004 2003 Balance % Balance % Balance % Balance % Balance %
($ in 000’s) Commercial
Loans $ 343,783 7% $ 272,957 12% $ 144,254 14% $ 124,243 18% $ 93,985 17% Real Estate
Construction Loans 123,664 3% 34,325 2% 32,563 3% 34,838 5% 10,231 2%
Commercial Real Estate Loans 2,317,840 49% 653,695 28% 136,375 14% 75,632 11% 70,723 12%
Residential Mortgage Loans 1,934,645 41% 1,322,908 58% 690,242 69% 457,921 66% 389,686 69%
Consumer Loans 4,541 0% 1,917 0% 2,752 0% 1,568 0% 1,689 0%
Total Loans 4,724,473 100% 2,285,802 100% 1,006,186 100% 694,202 100% 566,314 100%
Net Unearned
Income and Deferred Expenses (1) (13,242) (4,276) 1,688 112 1,268
Allowance for Loan Losses (47,022) (18,694) (7,593) (7,642) (5,910)
(60,264) (22,970) (5,905) (7,530) (4,642)
Loans, Net $ 4,664,209 $
2,262,832 $ 1,000,281 $ 686,672 $ 561,672 (1) Includes purchase premiums, purchase discounts, and net deferred origination fees and costs.

64
At September 30, 2007 and September 30, 2006, $55,000,000 and $60,000,000 in Federal Home Loan Bank (“FHLB”) advances, respectively, were secured by a blanket lien on RJBank's residential mortgage loan portfolio.
At September 30, 2007 and 2006, RJBank had $5,064,000 and $1,137,000 in loans available for sale, respectively. RJBank's gain from the sale of originated loans available for sale was $518,000, $413,000, and $421,000 for the years ended September 30, 2007, September 30, 2006, and September 30, 2005, respectively. Certain officers, directors, and affiliates, and their related interests were indebted to RJBank for $999,000 and $294,000 at September 30, 2007 and September 30, 2006, respectively. All such loans were made in the ordinary course of the business. Interest income on loans, net of unearned income, for the years ended September 30, 2007, 2006, and 2005 was $205.0 million, $95.4 million, and $37.2 million, respectively. The following table shows the contractual maturities of RJBank’s loan portfolio at September 30, 2007, including contractual principal repayments. This table does not, however, include any estimates of prepayments. These prepayments could significantly shorten the average loan lives and cause the actual timing of the loan repayments to differ from those shown in the following table:
Due in 1 Year or Less 1 Year – 5 Years >5 Years Total (in 000’s) Commercial Loans $ 1,057 $ 98,207 $ 244,519 $ 343,783 Real Estate Construction Loans 21,627 101,129 908 123,664 Commercial Real Estate Loans 126,607 1,189,656 1,001,577 2,317,840 Residential Mortgage Loans 100 4,601 1,929,944 1,934,645 Consumer Loans 1,524 3,017 - 4,541
Total Loans $ 150,915 $ 1,396,610 $ 3,176,948 $ 4,724,473
RJBank classifies loans as nonperforming when full and timely collection of interest or principal becomes uncertain or when they are 90 days past due. The following table shows the comparative data for nonperforming loans and assets:
September 30, September 30, September 30, September 24, September 26, 2007 2006 2005 2004 2003 ($ in 000’s) Nonaccrual Loans $ 1,391 $ 2,091 $ 117 $ 801 $ 215 Accruing Loans Which are 90 Days Past Due 2,674 - 1,200 125 -
Total Nonperforming Loans 4,065 2,091 1,317 926 215
Real Estate Owned and Other
Repossessed Assets, Net 1,653 - - - -
Total Nonperforming Assets, Net $ 5,718 $ 2,091 $ 1,317 $ 926 $ 215
Total Nonperforming Loans as a
Percentage of Total Loans, Net 0.12% 0.09% 0.13% 0.13% 0.04%
The gross interest income related to non-performing loans, which would have been recorded had these loans been current in accordance with their original terms and had been outstanding throughout the period or since origination, and the interest income recognized on these loans for the year ended, September 30, 2007 were immaterial to the consolidated financial statements. As of September 30, 2007, there were no impaired loans. There were no troubled debt restructurings for any of the periods presented above.

65
Changes in the allowance for loan losses at RJBank were as follows:
Year Ended September 30, September 30, September 30, September 24, September 26, 2007 2006 2005 2004 2003 ($ in 000’s) Allowance for Loan Losses, Beginning of Period $ 18,694 $ 7,593 $ 7,642 $ 5,910 $ 5,109
Provision For Loan Losses 29,410 11,153 1,037 1,732 801 Transfer to Reserve for Unfunded Commitments (1,086)
Charge-Offs: Commercial Loans - - - - - Real Estate Construction
Loans (629) - - - - Commercial Real Estate Loans - - - - - Residential Mortgage Loans (454) (61) - - - Consumer Loans - - - - -
Total Charge-Offs (1,083) (61) - - -
Recoveries:
Commercial Loans - - - - - Real Estate Construction
Loans - - - - - Commercial Real Estate Loans - - - - - Residential Mortgage Loans 1 9 - - - Consumer Loans - - - - -
Total Recoveries 1 9 - - -
Net Charge-Offs (1,082) (52) - - - Allowance for Loan Losses, End of Period $ 47,022 $ 18,694 $ 7,593 $ 7,642 $ 5,910
Net Charge-Offs to Average Bank Loans, Net Outstanding 0.03% 0.00% 0.00% 0.00% 0.00%
The calculation of the allowance is subjective as management segregates the loan portfolio into different homogeneous classes and assigns each class an allowance percentage based on the perceived risk associated with that class of loans. The factors taken into consideration when assigning the reserve percentage to each reserve category include estimates of borrower default probabilities and collateral values; trends in delinquencies; volume and terms; changes in geographic distribution, lending policies, local, regional, and national economic conditions; concentrations of credit risk and past loss history. In addition, the Company provides for potential losses inherent in RJBank’s unfunded lending commitments using the criteria above, further adjusted for an estimated probability of funding. In addition to the allowance for loan losses shown net of Bank Loans, Net, RJBank had reserves for unfunded lending commitments included in Trade and Other Payables of $6.78 million and $4.05 million for the years ended September 30, 2007 and 2006. RJBank’s net interest income after provision for loan losses for the years ended September 30, 2007, 2006, and 2005 was $52.4 million, $26.8 million, and $21.6 million, respectively. RJBank originates and purchases portfolios of loans that have certain features that may be viewed as increasing its exposure to nonpayment risk by the borrower. Specifically, RJBank originates and purchases residential loans that subject the borrower to payment increases over the life of the loan or have high loan-to-value (“LTV”) ratios. These features, including interest-only features and high LTV ratios, may be considered non-traditional for residential mortgages. RJBank does not originate or purchase residential loans that have terms that permit negative amortization features or are option adjustable rate mortgages.

66
The table below summarizes the level of exposure from each type of loan at September 30, 2007, 2006, and 2005:
Year Ended September 30, September 30, September 30, 2007 2006 2005 (in 000’s) Interest-Only Adjustable Rate Mortgage Loans Where Borrowers May Be Subject to Payment Increases $ 1,614,576 $ 1,051,099 $ 449,811
Residential Mortgage Loans with High Loan-to-Value Ratios $ 734 $ 1,323 $ 538
Loans where borrowers may be subject to payment increases include adjustable rate mortgage loans with terms that initially require payment of interest only, that may result in payments increasing significantly when the interest-only period ends and the loan principal begins to amortize. These loans are underwritten based on a variety of factors including the borrower’s credit history, debt to income ratio, employment, the LTV ratio, and the borrower’s disposable income and cash reserves. In instances where the borrower is of lower credit standing, the loans are typically underwritten to have a lower LTV ratio and/or other mitigating factors. High LTV loans include all mortgage loans where the LTV is greater than 90% and the borrower has not purchased private mortgage insurance (“PMI”). High LTV loans may also include residential mortgage products where a mortgage and home equity loan are simultaneously established for the same property. The maximum original LTV ratio for the mortgage portfolio with no PMI or other security is 100%. NOTE 6 - VARIABLE INTEREST ENTITIES (“VIEs”):
Under the provisions of FIN 46R the Company has determined that Raymond James Employee Investment Funds I and II (the “EIF Funds”), Comprehensive Software Systems, Inc. (“CSS”), certain entities in which Raymond James Tax Credit Funds, Inc. (“RJTCF”) owns variable interests, various partnerships involving real estate, and a trust fund established for employee retention purposes are VIEs. Of these, the Company has determined that the EIF Funds, certain tax credit fund partnerships/LLCs, and the trust fund should be consolidated in the financial statements as the Company is the primary beneficiary. The following table summarizes the balance sheets of the variable interest entities consolidated by the Company:
*Included in common shares in treasury in the Company’s Consolidated Statements of Financial Condition.
September 30, September 30, 2007 2006 (in 000's) Assets:
Cash and Cash Equivalents $ 6,406 $ 17,622 Receivables, Other 32,675 88,145 Investments in Real Estate Partnerships – Held by Variable Interest Entities 221,147 227,963 Trust Fund Investment in Parent Company Common Stock* 6,450 5,100 Prepaid Expenses and Other Assets 24,894 16,426
Total Assets $ 291,572 $ 355,256
Liabilities and Shareholders’ Equity: Loans Payable Related to Investments by Variable Interest Entities in Real Estate
Partnerships $ 116,479 $ 193,647 Trade and Other 849 279 Intercompany Payable 8,203 16,098
Total Liabilities 125,531 210,024 Minority Interests 162,319 143,217 Shareholders' Equity 3,722 2,015
Total Liabilities and Shareholders' Equity $ 291,572 $ 355,256

67
The following table summarizes the statements of income of the variable interest entities consolidated by the Company:
Year Ended September 30, September 30, September 30, 2007 2006 2005 (in 000’s) Revenues:
Interest $ 955 $ 1,009 $ 822 Other 2,580 4,397 4,248
Total Revenues 3,535 5,406 5,070
Interest Expense 6,972 8,368 3,934
Net Revenues (3,437) (2,962) 1,136 Non-Interest Expenses:
Compensation, Commissions and Benefits 1,828 1,584 - Other 10,430 9,246 5,759
Total Non-Interest Expense 12,258 10,830 5,759 Minority Interest in Earnings of Subsidiaries (13,858) (12,245) (4,631) Income Before Provision for Income Taxes (1,837) (1,547) 8 Provision for Income Taxes - - -
Net (Loss) Income $ (1,837) $ (1,547) $ 8 The EIF Funds are limited partnerships, for which the Company is the general partner, that invest in the merchant banking and private equity activities of the Company and other unaffiliated venture capital limited partnerships. The EIF Funds were established as compensation and retention measures for certain qualified key employees of the Company. The Company makes non-recourse loans to these employees for two-thirds of the purchase price per unit. The loans and applicable interest are to be repaid based on the earnings of the EIF Funds. The Company is deemed to be the primary beneficiary, and accordingly, consolidates the EIF Funds, which had combined assets of approximately $17.4 million at September 30, 2007. None of those assets act as collateral for any obligations of the EIF Funds. The Company's exposure to loss is limited to its contributions and the non-recourse loans funded to the employee investors, for which their partnership interests serve as collateral. At September 30, 2007 that exposure is approximately $5.1 million. CSS was formed by a group of broker-dealer firms, including the Company, to develop a back-office software system. CSS had assets of $4.1 million at September 30, 2007. As of September 30, 2007, the Company owns approximately 42% of CSS. The Company's exposure to loss is limited to its capital contributions. The Company is not the primary beneficiary of CSS and accounts for its investment using the equity method of accounting. The carrying value of the Company’s investment in CSS is zero at September 30, 2007. CSS has agreed in principal to be acquired by an affiliate of a shareholder. No distributions to shareholders are anticipated. RJTCF is a wholly owned subsidiary of RJF and is the managing member or general partner in approximately 49 separate tax credit housing funds having one or more investor members or limited partners. These tax credit housing funds are organized as limited liability companies or limited partnerships for the purpose of investing in limited partnerships which purchase and develop low income housing properties qualifying for tax credits. As of September 30, 2007, 47 of these tax credit housing funds are VIEs as defined by FIN 46R, and RJTCF’s interest in these tax credit housing funds which are VIEs range from .01% to 1.0%. RJTCF has concluded that it is the primary beneficiary in approximately one fifth of these tax credit housing funds, and accordingly, consolidates these funds, which have combined assets of approximately $267.7 million at September 30, 2007. None of those assets act as collateral for any obligations of these funds. The Company's exposure to loss is limited to its investments in, advances to, and receivables due from these funds and at September 30, 2007, that exposure is approximately $6.9 million. RJTCF is not the primary beneficiary of the remaining tax credit housing funds it determined to be VIEs and accordingly the Company does not consolidate these funds. The Company's exposure to loss is limited to its investments in, advances to, and receivables due from these funds and at September 30, 2007, that exposure is approximately $26.8 million. The two remaining tax credit housing funds that have been determined not to be VIEs are wholly owned by RJTCF and are included in the Company’s consolidated financial statements. During September 30, 2007, only one of these funds had any material activity. These funds typically hold interests in certain tax credit limited partnerships for less than 90 days. The fund had assets of approximately $1.1 million at September 30, 2007.

68
As of September 30, 2007, the Company has a variable interest in several limited partnerships involved in various real estate activities, in which a subsidiary is the general partner. The Company is not the primary beneficiary of these partnerships and accordingly the Company does not consolidate these partnerships. These partnerships have assets of approximately $11 million at September 30, 2007. The Company's exposure to loss is limited to its capital contributions. The carrying value of the Company's investment in these partnerships is not material at September 30, 2007. One of the Company’s restricted stock plans is associated with a trust fund which was established through the Company’s wholly owned Canadian subsidiary. This trust fund was established and funded to enable the trust fund to acquire Company common stock in the open market to be used to settle restricted stock units granted as a retention vehicle for certain employees of the Canadian subsidiary. For financial statement purposes, the Company is deemed to be the primary beneficiary in accordance with FIN 46R, and accordingly, consolidates this trust fund, which has assets of approximately $6.5 million at September 30, 2007. None of those assets are specifically pledged as collateral for any obligations of the trust fund. The Company's exposure to loss is limited to its contributions to the trust fund and at September 30, 2007, that exposure is approximately $6.5 million.
NOTE 7 – LEVERAGED LEASES The Company is the lessor in a leveraged commercial aircraft transaction with Continental Airlines, Inc. (“Continental"). The Company's ability to realize its expected return is dependent upon this airline’s ability to fulfill its lease obligation. In the event that this airline defaults on its lease commitment and the Trustee for the debt holders is unable to re-lease or sell the plane with adequate terms, the Company would suffer a loss of some or all of its investment. The value of the Company’s leveraged lease with Continental was approximately $9.9 million as of September 30, 2007. The Company's equity investment represented 20% of the aggregate purchase price; the remaining 80% was funded by public debt issued in the form of equipment trust certificates. The residual value of the aircraft at the end of the lease term of approximately 17 years is projected to be 15% of the original cost. This lease expires in May 2014.
September 30, September 30, 2007 2006 (in 000's) Rents Receivable (Net of Principal And
Interest on the Non-Recourse Debt) $ 7,591 $ 8,576 Unguaranteed Residual Values 8,012 8,012 Unearned Income (5,702) (5,706) Investment in Leveraged Leases 9,901 10,882 Deferred Taxes arising from Leveraged Leases (10,420) (19,796)
Net Investment in Leveraged Leases $ (519) $ (8,914)
Although Continental remains current on its lease payments to the Company, the inability of Continental to make its lease payments, or the termination or modification of the lease through a bankruptcy proceeding, could result in the write-down of the Company's investment and the acceleration of certain income tax payments. The Company continues to monitor this lessee for specific events or circumstances that would increase the likelihood of a default on Continental’s obligations under this lease. The Company was also the lessor in a leveraged commercial aircraft transaction with Delta Air Lines, Inc. (“Delta”). Delta filed for bankruptcy protection on September 14, 2005. Accordingly, the Company recorded a $6.5 million pre-tax charge in 2005 to fully reserve the balance of its investment in the leveraged lease of an aircraft to Delta. The Company had taken a $4 million pre-tax charge in 2004 to partially reserve for this investment. No amount of these charges represented a cash expenditure. During the second quarter of fiscal 2007, the Company sold its interest in the Delta transaction for $2 million, which was recognized as a pre-tax gain within Other Revenue. Upon closing, certain income tax obligations of approximately $8.5 million were accelerated and paid during the quarter. These tax payments did not impact net earnings, as these amounts were previously recorded as deferred tax liabilities. NOTE 8 - PROPERTY AND EQUIPMENT:
September 30, September 30, 2007 2006 (in 000's) Land $ 18,644 $ 18,644 Construction in Process 1,621 233 Software Development 7,573 4,522 Buildings, Leasehold and Land Improvements 142,329 137,117 Furniture, Fixtures, and Equipment 182,851 155,198 353,018 315,714 Less: Accumulated Depreciation
and Amortization (186,055) (172,934) $ 166,963 $ 142,780
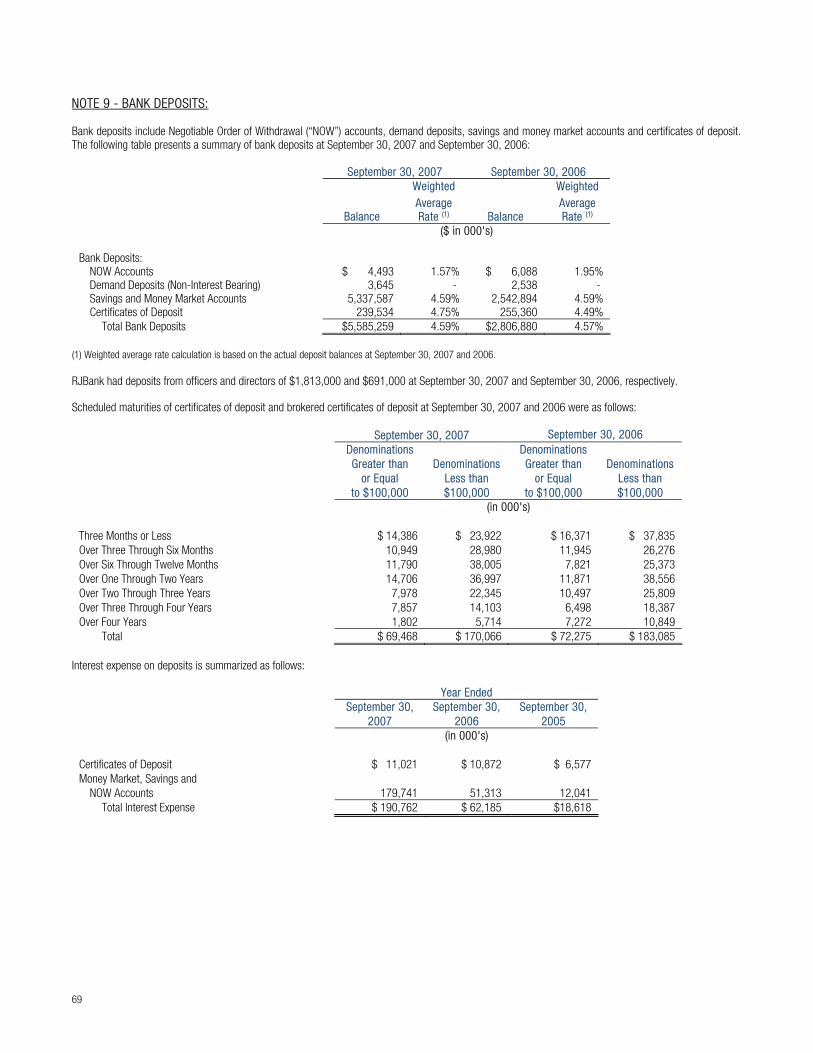
69
NOTE 9 - BANK DEPOSITS: Bank deposits include Negotiable Order of Withdrawal (“NOW”) accounts, demand deposits, savings and money market accounts and certificates of deposit. The following table presents a summary of bank deposits at September 30, 2007 and September 30, 2006:
September 30, 2007 September 30, 2006 Weighted Weighted Average Average Balance Rate (1) Balance Rate (1) ($ in 000's) Bank Deposits:
NOW Accounts $ 4,493 1.57% $ 6,088 1.95% Demand Deposits (Non-Interest Bearing) 3,645 - 2,538 - Savings and Money Market Accounts 5,337,587 4.59% 2,542,894 4.59% Certificates of Deposit 239,534 4.75% 255,360 4.49%
Total Bank Deposits $5,585,259 4.59% $2,806,880 4.57%
(1) Weighted average rate calculation is based on the actual deposit balances at September 30, 2007 and 2006.
RJBank had deposits from officers and directors of $1,813,000 and $691,000 at September 30, 2007 and September 30, 2006, respectively.
Scheduled maturities of certificates of deposit and brokered certificates of deposit at September 30, 2007 and 2006 were as follows:
September 30, 2007 September 30, 2006 Denominations Denominations Greater than Denominations Greater than Denominations or Equal Less than or Equal Less than to $100,000 $100,000 to $100,000 $100,000 (in 000's) Three Months or Less $ 14,386 $ 23,922 $ 16,371 $ 37,835 Over Three Through Six Months 10,949 28,980 11,945 26,276 Over Six Through Twelve Months 11,790 38,005 7,821 25,373 Over One Through Two Years 14,706 36,997 11,871 38,556 Over Two Through Three Years 7,978 22,345 10,497 25,809 Over Three Through Four Years 7,857 14,103 6,498 18,387 Over Four Years 1,802 5,714 7,272 10,849
Total $ 69,468 $ 170,066 $ 72,275 $ 183,085
Interest expense on deposits is summarized as follows:
Year Ended September 30, September 30, September 30, 2007 2006 2005 (in 000's) Certificates of Deposit $ 11,021 $ 10,872 $ 6,577 Money Market, Savings and
NOW Accounts 179,741 51,313 12,041 Total Interest Expense $ 190,762 $ 62,185 $18,618
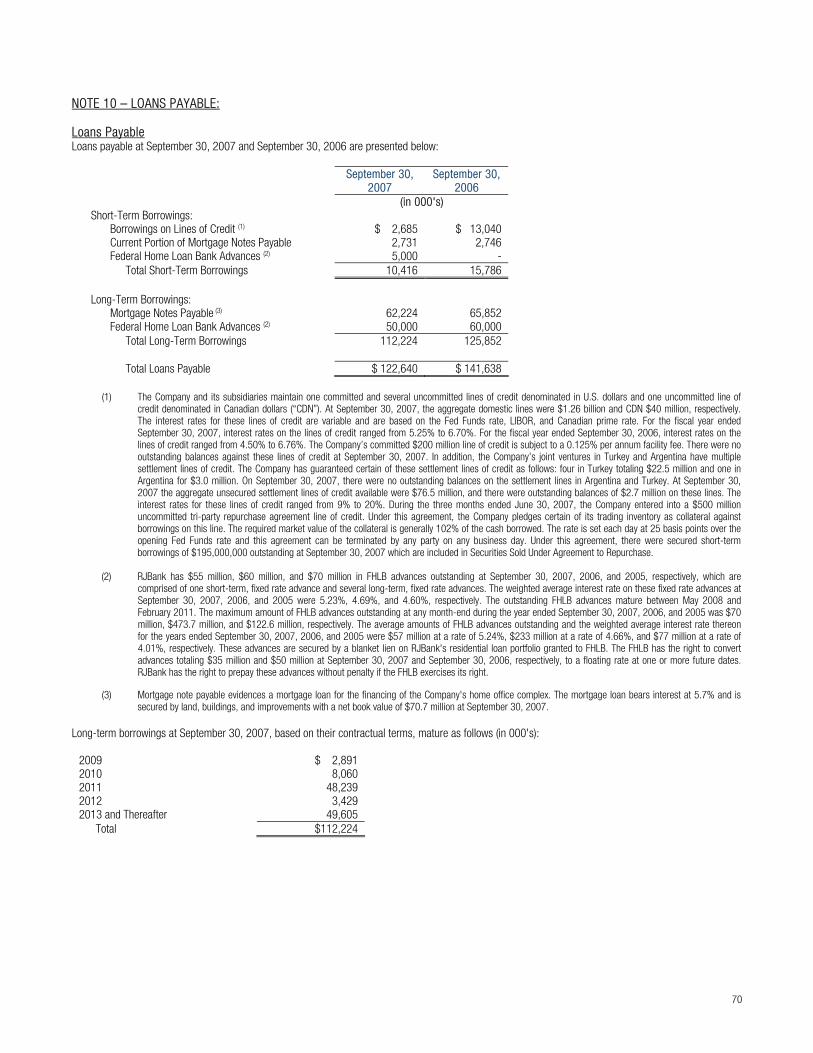
70
NOTE 10 – LOANS PAYABLE: Loans Payable Loans payable at September 30, 2007 and September 30, 2006 are presented below:
September 30, September 30, 2007 2006
(in 000's) Short-Term Borrowings:
Borrowings on Lines of Credit (1) $ 2,685 $ 13,040 Current Portion of Mortgage Notes Payable 2,731 2,746 Federal Home Loan Bank Advances (2) 5,000 -
Total Short-Term Borrowings 10,416 15,786 Long-Term Borrowings:
Mortgage Notes Payable (3) 62,224 65,852 Federal Home Loan Bank Advances (2) 50,000 60,000
Total Long-Term Borrowings 112,224 125,852
Total Loans Payable $ 122,640 $ 141,638
(1) The Company and its subsidiaries maintain one committed and several uncommitted lines of credit denominated in U.S. dollars and one uncommitted line of credit denominated in Canadian dollars (“CDN”). At September 30, 2007, the aggregate domestic lines were $1.26 billion and CDN $40 million, respectively. The interest rates for these lines of credit are variable and are based on the Fed Funds rate, LIBOR, and Canadian prime rate. For the fiscal year ended September 30, 2007, interest rates on the lines of credit ranged from 5.25% to 6.70%. For the fiscal year ended September 30, 2006, interest rates on the lines of credit ranged from 4.50% to 6.76%. The Company’s committed $200 million line of credit is subject to a 0.125% per annum facility fee. There were no outstanding balances against these lines of credit at September 30, 2007. In addition, the Company’s joint ventures in Turkey and Argentina have multiple settlement lines of credit. The Company has guaranteed certain of these settlement lines of credit as follows: four in Turkey totaling $22.5 million and one in Argentina for $3.0 million. On September 30, 2007, there were no outstanding balances on the settlement lines in Argentina and Turkey. At September 30, 2007 the aggregate unsecured settlement lines of credit available were $76.5 million, and there were outstanding balances of $2.7 million on these lines. The interest rates for these lines of credit ranged from 9% to 20%. During the three months ended June 30, 2007, the Company entered into a $500 million uncommitted tri-party repurchase agreement line of credit. Under this agreement, the Company pledges certain of its trading inventory as collateral against borrowings on this line. The required market value of the collateral is generally 102% of the cash borrowed. The rate is set each day at 25 basis points over the opening Fed Funds rate and this agreement can be terminated by any party on any business day. Under this agreement, there were secured short-term borrowings of $195,000,000 outstanding at September 30, 2007 which are included in Securities Sold Under Agreement to Repurchase.
(2) RJBank has $55 million, $60 million, and $70 million in FHLB advances outstanding at September 30, 2007, 2006, and 2005, respectively, which are
comprised of one short-term, fixed rate advance and several long-term, fixed rate advances. The weighted average interest rate on these fixed rate advances at September 30, 2007, 2006, and 2005 were 5.23%, 4.69%, and 4.60%, respectively. The outstanding FHLB advances mature between May 2008 and February 2011. The maximum amount of FHLB advances outstanding at any month-end during the year ended September 30, 2007, 2006, and 2005 was $70 million, $473.7 million, and $122.6 million, respectively. The average amounts of FHLB advances outstanding and the weighted average interest rate thereon for the years ended September 30, 2007, 2006, and 2005 were $57 million at a rate of 5.24%, $233 million at a rate of 4.66%, and $77 million at a rate of 4.01%, respectively. These advances are secured by a blanket lien on RJBank's residential loan portfolio granted to FHLB. The FHLB has the right to convert advances totaling $35 million and $50 million at September 30, 2007 and September 30, 2006, respectively, to a floating rate at one or more future dates. RJBank has the right to prepay these advances without penalty if the FHLB exercises its right.
(3) Mortgage note payable evidences a mortgage loan for the financing of the Company's home office complex. The mortgage loan bears interest at 5.7% and is secured by land, buildings, and improvements with a net book value of $70.7 million at September 30, 2007.
Long-term borrowings at September 30, 2007, based on their contractual terms, mature as follows (in 000's):
2009 $ 2,891 2010 8,060 2011 48,239 2012 3,429 2013 and Thereafter 49,605
Total $112,224

71
Loans Payable Related to Investments by Variable Interest Entities in Real Estate Partnerships The borrowings of certain VIEs’ are comprised of several loans, which are non-recourse to the Company. See Note 6 of the Notes to Consolidated Financial Statements for additional information regarding the entities deemed to be variable interest entities under FIN 46R, which are consolidated by the Company. VIEs’ loans payable at September 30, 2007 and September 30, 2006 are presented below:
September 30, September 30, 2007 2006
(in 000's) Current Portion of Loans Payable $ 13,839 $ 32,787 Long-Term Portion of Loans Payable 102,640 160,860
Total Loans Payable $116,479 $193,647
VIEs’ long-term borrowings at September 30, 2007, based on their contractual terms, mature as follows (in 000's):
2009 $ 13,267 2010 12,720 2011 12,748 2012 13,036 2013 and Thereafter 50,869
Total $102,640 NOTE 11 – DERIVATIVE FINANCIAL INSTRUMENTS:
The Company uses interest rate swaps as well as futures contracts as part of its fixed income business. These positions are marked to market with the gain or loss and the related interest recorded in Net Trading Profits within the statement of income for the period. Any collateral exchanged as part of the swap agreement is recorded in Broker Receivables and Payables in the Consolidated Statements of Financial Condition for the period. At September 30, 2007 and September 30, 2006, the Company had outstanding interest rate derivative contracts with notional amounts of $3.5 billion and $2.3 billion, respectively. The notional amount of a derivative contract does not change hands; it is simply used as a reference to calculate payments. Accordingly, the notional amount of the Company’s derivative contracts outstanding at September 30, 2007 vastly exceeds the possible losses that could arise from such transactions. The net market value of all open swap positions at September 30, 2007 and September 30, 2006 was $22.2 million and $13 million, respectively. The Company is exposed to credit losses in the event of nonperformance by the counterparties to its interest rate swap agreements. The Company performs a credit evaluation of counterparties prior to entering into swap transactions and monitors their credit standings. Currently, the Company anticipates that all counterparties will be able to fully satisfy their obligations under those agreements. The Company may require collateral from counterparties to support these obligations as established by the credit threshold specified by the agreement and/or as a result of monitoring the credit standing of the counterparties. The Company is also exposed to interest rate risk related to its interest rate swap agreements. The Company monitors exposure in its derivatives subsidiary daily based on established limits with respect to a number of factors, including interest rate, spread, ratio and basis, and volatility risks. These exposures are monitored both on a total portfolio basis and separately for selected maturity periods. NOTE 12 - INCOME TAXES:
The provision (benefit) for income taxes consists of the following:
Year Ended September 30, September 30, September 30, 2007 2006 2005 (in 000’s) Current Provision:
Federal $ 142,531 $ 102,665 $ 78,783 State 17,098 16,844 15,483 International (5,813) 13,379 8,231
153,816 132,888 102,497 Deferred benefit:
Federal (26,132) (3,742) (3,058) State (1,463) (495) (1,867) International 15,573 (927) (647)
(12,022) (5,164) (5,572) $ 141,794 $ 127,724 $ 96,925

72
The Company's income tax expense differs from the amount computed by applying the statutory federal income tax rate due to the following:
Year Ended September 30, September 30, September 30, 2007 2006 2005 (in 000’s) Provision Calculated at Statutory Rates $ 137,279 $ 119,723 $ 85,909 State Income Taxes, Net of Federal Benefit 10,163 10,627 8,851 Other (5,648) (2,626) 2,165 $ 141,794 $ 127,724 $ 96,925
U.S. and international components of income before income taxes were as follows:
Year Ended September 30, September 30, September 30, 2007 2006 2005 (in 000’s) U.S. $ 356,591 $ 308,003 $ 230,790 International 35,633 34,063 17,181
Income Before Provision for Income Taxes $ 392,224 $ 342,066 $ 247,971 The major deferred tax asset (liability) items, as computed under SFAS 109, are as follows:
September 30, September 30, 2007 2006 (in 000’s) Deferred Tax Assets:
Deferred Compensation $ 65,392 $ 56,584 Capital Expenditures 10,812 7,286 Accrued Expenses 49,036 40,904 Unrealized Loss 3,035 1,932 Net Operating Loss Carryforward 5,259 13,496
Total Deferred Tax Assets 133,534 120,202 Deferred Tax Liabilities:
Aircraft Leases (10,420) (19,796) Other (15,192) (5,449)
Total Deferred Tax Liabilities (25,612) (25,245) Net Deferred Tax Assets $ 107,922 $ 94,957
The Company has recorded a deferred tax asset at September 30, 2007 and September 30, 2006. A deferred tax asset has also been recognized for net operating loss carryforwards that will expire between 2008 and 2016. No valuation allowance as defined by SFAS 109 is required for the years then ended as Management believes that it is more likely than not the deferred tax asset is realizable. The “American Jobs Creation Act of 2004” provides for a one-time deduction for qualifying repatriations of foreign earnings in either fiscal year 2005 or 2006. The 85% dividends received deduction can result in a lower tax rate if the eligible dividends are reinvested within the limitations and requirements of Internal Revenue Code Section 965. During fiscal year 2006, the Company repatriated $1.9 million in extraordinary dividends and recorded a tax liability of $102,000. To the degree that the cumulative undistributed earnings of non-U.S. subsidiaries were permanently invested, no deferred U.S. federal income taxes have been provided. The Company has provided for U.S. deferred income taxes in the amount of $11.6 million on undistributed earnings not considered permanently reinvested in its non-U.S. subsidiaries.
NOTE 13 – COMMITMENTS AND CONTINGENCIES:
Long-term lease agreements expire at various times through 2017. Minimum annual rentals under such agreements for the succeeding five fiscal years are approximately: $28.7 million in 2008, $22.2 million in 2009, $19.3 million in 2010, $12.5 million in 2011, $8.8 million in 2012 and $8.9 million thereafter. Rental expense incurred under all leases, including equipment under short-term agreements, aggregated $40 million, $34.3 million and $31.9 million in 2007, 2006 and 2005, respectively. See Note 7 of the Notes to Consolidated Financial Statements with respect to the Company's interest in certain commercial aircraft leveraged leases.

73
At September 30, 2007 and September 30, 2006, no securities other than FHLB stock were pledged by RJBank as collateral with the FHLB for advances. In addition to the FHLB stock pledged as collateral for advances, RJBank provided the FHLB with a blanket lien against RJBank's entire portfolio of residential mortgage loans. As of September 30, 2007, RJBank has entered into reverse repurchase agreements totaling $905 million with two counterparties, with individual exposures of $500 million and $405 million. Although RJBank is exposed to risk that these counterparties may not fulfill their contractual obligations, the risk of default is minimal due to the creditworthiness of these counterparties, collateral received and the short duration of these agreements. As of September 30, 2007, RJBank had not settled the purchases of $300.6 million in syndicated loans. These loans are expected to be settled during the three months ended December 31, 2007. See Note 20 of the Notes to Consolidated Financial Statements with respect to RJBank’s commitments to extend credit and other credit-related off balance sheet financial instruments such as standby letters of credit and loan purchases. As part of an effort to increase brand awareness, the Company entered into a stadium naming rights contract in July 1998. The contract expires in 2016 and has a 4% annual escalator. Expenses of $3.0 million, $2.9 million and $2.8 million were recognized in the fiscal 2007, 2006 and 2005, respectively. In the normal course of business, the Company enters into underwriting commitments. Transactions relating to such commitments of RJA that were open at September 30, 2007 and were subsequently settled had no material effect on the consolidated financial statements as of that date. Transactions relating to such commitments of RJ Ltd. that were recorded and open at September 30, 2007 were approximately $11.8 million. The Company utilizes client marginable securities to satisfy deposits with clearing organizations. At September 30, 2007, the Company had client margin securities valued at $135.7 million pledged with a clearing organization to meet the point in time requirement of $67.5 million. At September 30, 2006, the Company had client margin securities valued at $93.5 million pledged with a clearing organization to meet the point in time requirement of $57.4 million. In September 2007, Sirchie Acquisition Company, LLC (“SAC”), a 100% owned indirect subsidiary of the Company, entered into two agreements. Under the Stock Purchase Agreement SAC will acquire 51% of the common stock of Law Enforcement Associates Corporation from two sellers. Under the Stock and Asset Purchase Agreement with several sellers, SAC will acquire substantially all of the business, assets, and properties of Sirchie Finger Print Laboratories, Inc., the assets or stock of several other companies and certain real estate. SAC and sellers negotiated a single purchase price for all of the items to be acquired under the two agreements. At closing, one of the sellers will become a member of SAC. The Company’s share of the purchase price obligation is approximately $50 million. The closing of the two agreements is expected to occur before January 31, 2008. The Company has committed a total of $46.6 million, in amounts ranging from $200,000 to $2 million, to 41 different independent venture capital or private equity partnerships. As of September 30, 2007, the Company has invested $30.4 million of that amount and has received $27 million in distributions. Additionally, the Company is the general partner in two internally sponsored private equity limited partnerships to which it has committed $14 million. Of that amount, the Company has invested $12.2 million and has received $8.6 million in distributions as of September 30, 2007. The Company is the general partner in EIF Funds. These limited partnerships invest in the merchant banking and private equity activities of the Company and other unaffiliated venture capital limited partnerships. The EIF Funds were established as compensation and retention measures for certain qualified key employees of the Company. At September 30, 2007, the funds have unfunded commitments of $3.4 million. At September 30, 2007, the approximate market values of collateral received that can be repledged by the Company, were:
Sources of Collateral (In 000's): Securities Purchased Under Agreements to Resell and Other
Collateralized Financings $ 1,310,415 Securities Received in Securities Borrowed Vs. Cash Transactions 1,279,127 Collateral Received for Margin Loans 1,472,819
Total $ 4,062,361
During the year certain collateral was repledged. At September 30, 2007, the approximate market values of this portion of collateral and financial instruments owned that were repledged by the Company, were:
Uses of Collateral and Trading Securities (In 000's): Securities Purchased Under Agreements to Resell and Other
Collateralized Financings $ 253,522 Securities Received in Securities Borrowed Vs. Cash Transactions 1,248,775 Collateral Received for Margin Loans 148,596
Total $ 1,650,893
In the normal course of business, certain subsidiaries of the Company act as general partner and may be contingently liable for activities of various limited partnerships. These partnerships engaged primarily in real estate activities. In the opinion of the Company, such liabilities, if any, for the obligations of the partnerships will not in the aggregate have a material adverse effect on the Company's consolidated financial position.

74
The Company and its subsidiaries maintain one committed and several uncommitted lines of credit denominated in U.S. dollars and one uncommitted line of credit denominated in Canadian dollars (“CDN”). At September 30, 2007, the aggregate domestic lines were $1.26 billion and CDN $40 million, respectively. There were no outstanding balances against these lines of credit at September 30, 2007. The interest rates for these lines of credit are variable and are based on the Fed Funds rate, LIBOR, and Canadian prime rate. The Company’s committed $200 million line of credit is subject to a 0.125% per annum facility fee. RJBank has $55 million in FHLB advances outstanding at September 30, 2007, which are comprised of one short-term, fixed rate advance and several long-term, fixed rate advances. RJBank had $1.32 billion in credit available from the FHLB at September 30, 2007. During the three months ended June 30, 2007, the Company entered into a $500 million uncommitted tri-party repurchase agreement line of credit. Under this agreement, the Company pledges certain of its trading inventory as collateral against borrowings on this line. The required market value of the collateral is generally 102% of the cash borrowed. The rate is set each day at 25 basis points over the opening Fed Funds rate and this agreement can be terminated by any party on any business day. Under this agreement, there were secured short-term borrowings of $195,000,000 outstanding at September 30, 2007 which are included in Securities Sold Under Agreement to Repurchase. The Company’s joint ventures in Turkey and Argentina have multiple settlement lines of credit. The Company has guaranteed certain of these settlement lines of credit as follows: four in Turkey totaling $22.5 million and one in Argentina for $3.0 million. On September 30, 2007, there were no outstanding balances on the settlement lines in Argentina and Turkey. At September 30, 2007 the aggregate unsecured settlement lines of credit available were $76.5 million, and there were outstanding balances of $2.7 million on these lines. The Company has also from time to time authorized performance guarantees for the completion of trades with counterparties in Argentina and Turkey. At September 30, 2007, there were no outstanding performance guarantees in Argentina or Turkey. The Company guarantees the existing mortgage debt of RJA of approximately $65 million. The Company guarantees interest rate swap obligations of RJ Capital Services, Inc. The Company has also committed to lend to or guarantee obligations of RJTCF of up to $100 million upon request, subject to certain limitations as well as annual review and renewal. RJTCF borrows in order to invest in partnerships which purchase and develop properties qualifying for tax credits. These investments in project partnerships are then sold to various tax credit funds, which have third party investors, and for which RJTCF serves as the managing member or general partner. RJTCF typically sells these investments within 90 days of their acquisition, and the proceeds from the sales are used to repay RJTCF’s borrowings. Additionally, RJTCF may make short-term loans or advances to project partnerships on behalf of the tax credit funds in which it serves as managing member or general partner. At September 30, 2007, cash funded to invest in either loans or investments in project partnerships was $38.7 million. In addition, at September 30, 2007, RJTCF is committed to additional future fundings of $6.1 million related to project partnerships that have not yet been sold to various tax credit funds. RJTCF has also issued certain guarantees to various third parties related to elements of specific performance of certain project partnerships which have been sold to various tax credit funds. RJTCF is not the primary guarantor of these obligations which aggregate to a cumulative maximum obligation of approximately $5.1 million as of September 30, 2007. See Note 14 of the Notes to Consolidated Financial Statements with respect to the Company's legal and regulatory proceedings.
NOTE 14 – LEGAL AND REGULATORY PROCEEDINGS:
As a result of the extensive regulation of the securities industry, the Company's broker-dealer subsidiaries are subject to regular reviews and inspections by regulatory authorities and self-regulatory organizations, which can result in the imposition of sanctions for regulatory violations, ranging from non-monetary censure to fines and, in serious cases, temporary or permanent suspension from business. In addition, from time to time regulatory agencies and self-regulatory organizations institute investigations into industry practices, which can also result in the imposition of such sanctions. Raymond James Yatyrym Menkul Kyymetler A. S., (“RJY”), the Company’s Turkish affiliate, was assessed for the year 2001 approximately $7.6 million by the Turkish tax authorities. The authorities applied a significantly different methodology than in the prior year’s audit which the Turkish tax court affirmed. RJY is vigorously contesting most aspects of this assessment and has filed an appeal with the Turkish Counsel of State. A significant portion of the matters at issue involved the activities of an employee terminated in 2004. Audits of 2002 through 2004 are anticipated and their outcome is unknown in light of the change in methodology and the pending litigation. As such, the potential tax liability combined for these subsequent years could range from a few hundred thousand dollars to $7.5 million. The Company has recorded a provision for loss in its consolidated financial statements for its net equity interest in this joint venture. As of September 30, 2007, RJY had total capital of approximately $12.2 million, of which the Company owns approximately 73%. The Company is a defendant or co-defendant in various lawsuits and arbitrations incidental to its securities business. The Company is contesting the allegations in these cases and believes that there are meritorious defenses in each of these lawsuits and arbitrations. In view of the number and diversity of claims against the Company, the number of jurisdictions in which litigation is pending and the inherent difficulty of predicting the outcome of litigation and other claims, the Company cannot state with certainty what the eventual outcome of pending litigation or other claims will be. In the opinion of the Company's management, based on current available information, review with outside legal counsel, and consideration of amounts provided for in the accompanying consolidated financial statements with respect to these matters, ultimate resolution of these matters will not have a material adverse impact on the Company's financial position or results of operations. However, resolution of one or more of these matters may have a material effect on the results of operations in any future period, depending upon the ultimate resolution of those matters and upon the level of income for such period.

75
NOTE 15 - CAPITAL TRANSACTIONS:
The following table presents information on a monthly basis for purchases of the Company’s stock for the quarter ended September 30, 2007:
Number of Average Period Shares Purchased (1) Price Per Share July 1, 2007 – July 31, 2007 - $ - August 1, 2007 – August 31, 2007 - - September 1, 2007 – September 30, 2007 1,548 33.64
Total 1,548 $33.64
(1) The Company does not have a formal stock repurchase plan. Shares are repurchased at the discretion of management pursuant to prior authorization from the Board of Directors. On May 20, 2004, the Board of Directors authorized purchases of up to $75 million. Since that date 461,500 shares have been repurchased for a total of $9.6 million, leaving $65.4 million available to repurchase shares. Historically the Company has considered such purchases when the price of its stock approaches 1.5 times book value or when employees surrender shares as payment for option exercises. The decision to repurchase shares is subject to cash availability and other factors. During 2007 and 2006, 69,986 and 189,664 shares were repurchased at an average price of $31.54 and $28.97, respectively. During the three months ended December 31, 2006, 42,618 shares were purchased for the trust fund that was established and funded to acquire Company common stock in the open market to be used to settle restricted stock units granted as a retention vehicle for certain employees of the Company’s wholly owned Canadian subsidiary (see Note 17 below for more information on this trust fund). With the exception of the shares purchased through this trust fund, the Company only purchased shares during the balance of the year that were surrendered by employees as a payment for option exercises.
NOTE 16 - OTHER COMPREHENSIVE INCOME: The activity in other comprehensive income and related tax effects are as follows: September 30, September 30, September 30, 2007 2006 2005 (in 000's) Net Unrealized (Loss) Gain on Available for Sale Securities, Net of
Tax Effect Of ($1,217) in 2007, $129 in 2006, and $51 in 2005 $ (2,150) $ 217 $ 79 Net Unrealized Gain on Interest Rate Swaps Accounted for as Cash Flow
Hedges, Net of Tax Effect of $0 in 2007, $28 in 2006, and $566 in 2005 - 44 882
Net Change in Currency Translations, Net of Tax Effect of $11,463 in
2007, $1,312 in 2006, and $3,078 in 2005 20,246 2,202 4,796
Other Comprehensive Income $ 18,096 $ 2,463 $ 5,757 The components of accumulated other comprehensive income, net of income taxes: September 30, September 30, 2007 2006 (in 000's) Net Unrealized (Loss) Gain on Securities Available for Sale, Net of Tax Effect of ($998) in 2007
and $245 in 2006 $ (1,747) $ 403 Net Currency Translations, Net of Tax Effect of $18,593 in 2007 and $7,285 in 2006 31,938 11,692
Accumulated Other Comprehensive Income $ 30,191 $ 12,095 NOTE 17 - EMPLOYEE BENEFIT PLANS: The Company's profit sharing plan and employee stock ownership plan provide certain death, disability or retirement benefits for all employees who meet certain service requirements. The plans are noncontributory. Contributions by the Company, if any, are determined annually by the Company’s Board of Directors on a discretionary basis and are recognized as compensation cost throughout the year. Benefits become fully vested after seven years of qualified service. All shares owned by the ESOP are included in earnings per share calculations. Cash dividends paid to the ESOP are reflected as a reduction of

76
retained earnings. The number of shares of RJF common stock held by the ESOP at September 30, 2007 and 2006 was approximately 5,538,000 and 5,370,000, respectively. The Company also offers a plan pursuant to section 401(k) of the Internal Revenue Code, which provides for the Company to match 100% of the first $500 and 50% of the next $500 of compensation deferred by each participant annually. The Company's Long Term Incentive Plan (“LTIP”) is a non-qualified deferred compensation plan that provides benefits to employees who meet certain compensation or production requirements. The Company has purchased and holds life insurance on the lives of most of those employees participating in the LTIP, to earn a competitive rate of return for participants and to provide a source of funds available to satisfy its obligations under this plan. Contributions to the qualified plans and the LTIP contribution for management are made in amounts approved annually by the Board of Directors. Compensation expense includes aggregate contributions to these plans of $40,476,439, $36,912,285, and $26,872,875 for fiscal years 2007, 2006, and 2005, respectively. Stock-Based Compensation Plans At September 30, 2007, the Company had multiple stock-based employee compensation plans, which are described below. The Company issues new shares under all plans approved by shareholders. Effective October 1, 2005, the Company adopted SFAS No. 123R, “Share-Based Payment”. The adoption of this statement did not have a material impact on the Company’s consolidated financial statements given that it adopted the fair value recognition provisions of SFAS No. 123 effective September 28, 2002 using the modified prospective application transition method within the provisions of SFAS No. 148, “Accounting for Stock-Based Compensation – Transition and Disclosure”. Prior to the adoption of SFAS No. 123R, benefits of tax deductions in excess of recognized compensation costs were reported as operating cash flows. SFAS No. 123R requires excess tax benefits to be reported as a financing cash inflow rather than as a reduction of taxes paid, as part of operating cash flows. Fixed Stock Option Plans The Company has two qualified and two non-qualified fixed stock option plans available for grants to employees and members of the Company’s Board of Directors. Under the 2002 Incentive Stock Option Plan, one of the Company’s qualified plans, the Company may grant options to its management personnel for up to 9,000,000 shares of common stock. The 2002 Plan was established to replace, on substantially the same terms and conditions, the 1992 Plan. As of September 30, 2007, the 1992 Plan still has options outstanding. Options are granted to key administrative employees and Financial Advisors of Raymond James & Associates, Inc. who achieve certain gross commission levels. Options are exercisable in the 36th to 72nd months following the date of grant and only in the event that the grantee is an employee of the Company at that time, disabled, deceased or recently retired. As noted above, the Company has two non-qualified fixed stock option plans. Under the first of those plans, the Company may grant up to 854,298 shares of common stock to the Company's outside directors. Options vest over a three-year period from grant date provided that the director is still serving on the Board of the Company. Under the Company's second non-qualified stock option plan, the Company may grant up to 2,531,250 shares of common stock to key management personnel. Option terms are specified in individual agreements and expire on a date no later than the tenth anniversary of the grant date. Under all fixed stock option plans, the exercise price of each option equals the market price of the Company's stock on the date of grant. The Company’s net income for the years ended September 30, 2007, September 30, 2006, and September 30, 2005 includes $5.9 million, $5.6 million, and $6.2 million, respectively, of compensation costs and $212,000, $281,000, and $293,000, respectively of income tax benefits related to the Company’s four fixed stock option plans available for grants to employees and members of its Board of Directors. These amounts may not be representative of future stock-based compensation expense since the estimated fair value of stock options is amortized to expense straight line over the vesting period and additional options may be granted in future years. The fair value of each fixed option grant for these plans is estimated on the date of grant using the Black-Scholes option pricing model with the following weighted average assumptions used for stock option grants in years ended 2007, 2006, and 2005:
2007 2006 2005 Dividend Yield 1.32% 1.19% 1.10% Expected Volatility 29.44% 29.38% 38.56% Risk-free Interest Rate 4.68% 4.41% 3.69% Expected Lives 4.8 yrs 4.9 yrs 5.1 yrs
The dividend yield assumption is based on the Company’s current declared dividend as a percentage of the stock price. The expected volatility assumption for the current period and fiscal 2006 is based on the Company’s historical stock price and is a weighted average combining (1) the volatility of the most recent year, (2) the volatility of the most recent time period equal to the expected lives assumption, and (3) the annualized volatility of the price of the Company’s stock since the late 1980’s. The expected volatility used by the Company in fiscal 2005 was based on the annualized volatility of the price of the Company’s stock since the late 1980’s. The risk-free interest rate assumption is based on the U.S. Treasury yield curve in effect at the time of grant of the options. The expected lives assumption is based on the average of (1) the assumption that all outstanding options will be exercised at the midpoint between their vesting date and full contractual term and (2) the assumption that all outstanding options will be exercised at their full contractual term.

77
A summary of option activity of the Company's four fixed stock option plans available for grants to employees and members of its Board of Directors for the year ended September 30, 2007 is presented below:
Weighted Weighted Average Average Remaining Aggregate Options For Exercise Contractual Intrinsic
Shares Price ($) Term (Years) Value ($) Outstanding at
October 1, 2006 5,354,323 $ 18.02 - $ - Granted 268,872 31.71 - - Exercised (1,475,530) 14.29 - - Canceled (148,539) 21.13 - - Expired (13,500) 15.06 - - Outstanding at
September 30, 2007 3,985,626 $ 20.19 2.52 $ 50,459,546 Exercisable at
September 30, 2007 1,002,972 $ 15.26 1.05 $ 17,644,932 As of September 30, 2007, there was $9.6 million of total unrecognized compensation cost related to stock options for these plans. These costs are expected to be recognized over a weighted average period of approximately 2.2 years. The weighted average grant date fair value of stock options granted under these plans during the years ended September 30, 2007, September 30, 2006 and September 30, 2005 was $9.37 per share, $7.36 per share and $6.44 per share, respectively. The total intrinsic value of stock options exercised for these plans during the years ended September 30, 2007, September 30, 2006 and September 30, 2005 was $25.0 million, $15.3 million and $11.2 million, respectively. The total grant date fair value of stock options vested for these plans during the years ended September 30, 2007, September 30, 2006 and September 30, 2005 was $8.0 million, $5.4 million and $7.0 million, respectively. Cash received from stock option exercises for these plans for the year ended September 30, 2007 was $20.2 million. The actual tax benefit realized for the tax deductions from option exercise for these stock option plans was $612,000 for the year ended September 30, 2007. Restricted Stock Plan Under the 2005 Restricted Stock Plan the Company is authorized to issue up to 4,250,000 restricted stock units or restricted shares of common stock to employees and independent contractors. The 2005 Plan was established to replace, on substantially the same terms and conditions, the 1999 Plan. During the three months ended March 31, 2006, this plan was amended to allow the issuance of restricted stock units as retention measures for certain employees of the Company. In addition, the Company, through its wholly owned Canadian subsidiary, established a trust fund which is associated with the 2005 Plan. This trust fund was established and funded to enable the trust fund to acquire Company common stock in the open market to be used to settle restricted stock units granted as a retention vehicle for certain employees of the Canadian subsidiary. Awards under this plan may be granted by the Company in connection with initial employment or under various retention plans for individuals who are responsible for a contribution to the management, growth, and/or profitability of the Company. These awards are forfeitable in the event of termination other than for death, disability or retirement. The compensation cost is recognized over the vesting period of the awards and is calculated as the market value of the awards on the date of grant. The following employee related activity occurred during the year ended September 30, 2007:
Weighted Average Grant Date Shares/Units Fair Value ($)
Nonvested at October 1, 2006 1,855,869 $ 21.77
Granted 930,060 30.73 Vested (139,526) 17.02 Canceled (95,735) 25.04 Nonvested at
September 30, 2007 2,550,668 $ 25.30 The Company’s net income for the year ended September 30, 2007 includes $11.7 million of compensation costs and $4.5 million of income tax benefits related to the Company’s Restricted Stock Plan. The Company’s net income for the years ended September 30, 2006 and September 30, 2005 includes $7.5 million and $3.7 million, respectively, of compensation costs and $2.9 million and $1.4 million, respectively, of income tax benefits related to this plan.

78
As of September 30, 2007, there was $44.2 million of total unrecognized compensation cost related to grants under the Company’s Restricted Stock Plan. These costs are expected to be recognized over a weighted average period of approximately 3.4 years. The total fair value of shares vested under this plan during the year ended September 30, 2007 was $2.4 million. Employee Stock Purchase Plan Under the 2003 Employee Stock Purchase Plan, the Company is authorized to issue up to 3,375,000 shares of common stock to its full-time employees, nearly all of whom are eligible to participate. Under the terms of the Plan, employees can choose each year to have up to 20% of their annual compensation specified to purchase the Company's common stock. Share purchases in any calendar year are limited to the lesser of 1,000 shares or shares with a market value of $25,000. The purchase price of the stock is 85% of the market price on the day prior to the purchase date. Under the Plan the Company sold approximately 444,000, 379,000 and 493,000 shares to employees during the years ended September 30, 2007, September 30, 2006 and September 30, 2005, respectively. The compensation cost is calculated as the value of the 15% discount from market value and was $2.1 million, $1.6 million and $1.4 million during the years ended September 30, 2007, September 30, 2006 and September 30, 2005, respectively.
Stock Bonus Plan The Company's 2007 Stock Bonus Plan authorizes the Company to issue up to 3,000,000 restricted shares to officers and certain other employees in lieu of cash for 10% to 20% of annual bonus amounts in excess of $250,000. The 2007 Plan was established to replace, on substantially the same terms and conditions, the 1999 Plan. The determination of the number of shares to be granted may encompass a discount from market value at the discretion of the Compensation Committee of the Board of Directors. Under the plan the shares are generally restricted for a three year period, during which time the shares are forfeitable in the event of voluntary termination other than for death, disability or retirement. The compensation cost is recognized over the three-year vesting period based on the market value of the shares on the date of grant. The following activity occurred during the year ended September 30, 2007:
Weighted Average Grant Date Shares Fair Value ($)
Nonvested at October 1, 2006 989,946 $ 21.49
Granted 339,969 30.73 Vested (217,145) 16.75 Canceled (16,989) 25.06 Nonvested at
September 30, 2007 1,095,781 $ 25.24 The Company’s net income for the year ended September 30, 2007 includes $9.1 million of compensation costs and $3.5 million of income tax benefits related to the Company’s Stock Bonus Plan. The Company’s net income for the years ended September 30, 2006 and September 30, 2005 includes $5.4 million and $3.5 million, respectively, of compensation costs and $2.0 million and $1.3 million, respectively, of income tax benefits related to this plan. As of September 30, 2007, there was $10.2 million of total unrecognized compensation cost related to grants under the Company’s Stock Bonus Plan. These costs are expected to be recognized over a weighted average period of approximately 1.2 years. The total fair value of shares vested under this plan during the fiscal year ended September 30, 2007 was $3.6 million. Employee Investment Funds Certain key employees of the Company participate in the Raymond James Employee Investment Funds I and II, which are limited partnerships that invest in the merchant banking and venture capital activities of the Company and other unaffiliated venture capital limited partnerships. The Company makes non-recourse loans to these employees for two thirds of the purchase price per unit. The loans and applicable interest are to be repaid based solely on the distributions from the funds. NOTE 18 – NON-EMPLOYEE STOCK-BASED COMPENSATION:
Under two of its non-qualified fixed stock option plans, the Company may grant stock options to its independent contractor Financial Advisors. Under the 2007 Stock Option Plan for Independent Contractors, the Company may grant up to 2,000,000 shares of common stock to independent contractor Financial Advisors. The 2007 Plan was established to replace, on substantially the same terms and conditions, the 1990 Plan. As of September 30, 2007, the 1990 Plan still has options outstanding. Options are exercisable five years after grant date provided that the Financial Advisors are still associated with the Company, disabled, deceased or recently retired. Under these fixed stock option plans, the exercise price of each option equals the market price of the Company's stock on the date of grant. Prior to fiscal 2006, the Company valued stock options awarded to its independent contractor Financial Advisors at fair value on the date of grant and amortized these options over their expected service period in accordance with SFAS No. 123. However, after further analysis on the application of SFAS No. 123R, the SEC guidance contained in Staff Accounting Bulletin (“SAB”) No. 107, and Emerging Issues Task Force (“EITF”) No. 96-18, “Accounting for Equity Instruments That are Issued to Other Than Employees for Acquiring, or in Conjunction with Selling, Goods or Services”, to these non-employee awards, the Company concluded that absent a specific performance commitment, these grants are to be measured at their vesting date fair value and their fair value

79
estimated at reporting dates prior to that time. The compensation expense recognized each period should be based on the most recent estimated value. The Company’s recording of compensation expenses prior to fiscal 2006 for these grants were an estimate based on grant date fair value. Fiscal 2006 includes the effect of the change for that year. The effect on years prior to fiscal 2006 was not material. Further, in accordance with EITF 00-19, “Accounting for Derivative Financial Instruments Indexed to, and Potentially Settled in, a Company’s Own Stock,” the Company classifies these non-employee awards as liabilities at fair value upon vesting, with changes in fair value reported in earnings until these awards are exercised or forfeited. The Company’s net income for the years ended September 30, 2007, September 30, 2006, and September 30, 2005 includes $7.0 million, $9.7 million, and $2.1 million, respectively, of compensation costs and $2.7 million, $3.7 million, and $804,000, respectively, net of income tax benefits related to option grants to its independent contractor Financial Advisors. The fair value of each fixed option grant awarded to an independent contractor Financial Advisor is estimated on the date of grant and periodically revalued using the Black-Scholes option pricing model with the following weighted average assumptions used for fiscal years ended 2007, 2006, and 2005:
2007 2006 2005 Dividend Yield 1.27% 1.11% 1.10% Expected Volatility 29.65% 30.89% 38.20% Risk-free Interest Rate 4.70% 4.62% 3.37% Expected Lives 2.92 yrs 2.76 yrs 2.56 yrs
The dividend yield assumption is based on the Company’s current declared dividend as a percentage of the stock price. The expected volatility assumption for the current period and fiscal 2006 is based on the Company’s historical stock price and is a weighted average combining (1) the volatility of the most recent year, (2) the volatility of the most recent time period equal to the expected lives assumption, and (3) the annualized volatility of the price of the Company’s stock since the late 1980’s. The expected volatility used by the Company in fiscal 2005 was based on the annualized volatility of the price of the Company’s stock since the late 1980’s. The risk-free interest rate assumption is based on the U.S. Treasury yield curve in effect at each point in time the options are valued. The expected lives assumption is based on the difference between the option’s vesting date plus 90 days (the average exercise period) and the date of the current reporting period. A summary of option activity of the Company's fixed stock option plans under which awards are granted to its independent contractor Financial Advisors for the year ended September 30, 2007 is presented below:
Weighted Weighted Average Average Remaining Aggregate Options For Exercise Contractual Intrinsic
Shares Price ($) Term (Years) Value ($) Outstanding at
October 1, 2006 1,687,325 $ 16.64 - - Granted 327,200 31.78 - - Exercised (383,728) 15.27 - - Canceled (58,568) 17.73 - - Expired (4,263) 19.62 - - Outstanding at
September 30, 2007 1,567,966 $ 20.25 3.17 $ 19,761,733 Exercisable at
September 30, 2007 107,675 $ 13.54 0.71 $ 2,078,723 As of September 30, 2007, there was $7.7 million of total unrecognized compensation cost related to unvested stock options granted to its independent contractor Financial Advisors based on estimated fair value at that date. These costs are expected to be recognized over a weighted average period of approximately 2.3 years. The weighted average grant date fair value of stock options granted under these plans during the years ended September 30, 2007, September 30, 2006 and September 30, 2005 was $9.70 per share, $11.87 per share and $9.51 per share, respectively. The total intrinsic value of stock options exercised for these plans during the years ended September 30, 2007, September 30, 2006 and September 30, 2005 was $6.1 million, $5.6 million and $2.7 million, respectively. The total estimated fair value of stock options vested for these plans during the years ended September 30, 2007, September 30, 2006 and September 30, 2005 was $6.2 million, $4.1 million and $3.5 million, respectively. Cash received from stock option exercises for these plans for the year ended September 30, 2007 was $5.9 million. There were no actual tax benefits realized for the tax deductions from option exercise of awards to its independent contractor Financial Advisors for the year ended September 30, 2007.

80
Under the 2005 Restricted Stock Plan the Company may grant restricted shares of common stock or restricted stock units to employees and independent contractor Financial Advisors. The following activity for independent contractor Financial Advisors occurred during the year ended September 30, 2007:
Weighted Average Grant Date Shares Fair Value ($)
Nonvested at October 1, 2006 - -
Granted 75,850 $32.85 Vested (549) 32.85 Canceled (900) 32.85 Nonvested at
September 30, 2007 74,401 $32.85 The Company’s net income for the year ended September 30, 2007 includes $276,000 of compensation costs and $105,000 of income tax benefits related to restricted shares granted to its independent contractor Financial Advisors. As of September 30, 2007, there was $2.0 million of total unrecognized compensation cost related to grants issued to its independent contractor Financial Advisors based on estimated fair value at that date. These costs are expected to be recognized over a weighted average period of approximately 4.7 years. The total fair value of shares vested under this plan during the year ended September 30, 2007 was $18,000.
NOTE 19 - REGULATIONS AND CAPITAL REQUIREMENTS: Certain broker-dealer subsidiaries of the Company are subject to the requirements of the Uniform Net Capital Rule (Rule 15c3-1) under the Securities Exchange Act of 1934. RJA, a member firm of the Financial Industry Regulatory Authority (“FINRA”), is also subject to the rules of FINRA, whose requirements are substantially the same. Rule 15c3-1 requires that aggregate indebtedness, as defined, not exceed 15 times net capital, as defined. Rule 15c3-1 also provides for an “alternative net capital requirement”, which RJA, Raymond James Financial Services, Inc. (“RJFS”) and Heritage Fund Distributors, Inc. (“HFD”) have elected. It requires that minimum net capital, as defined, be equal to the greater of $250,000 or two percent of Aggregate Debit Items arising from client transactions. FINRA may require a member firm to reduce its business if its net capital is less than four percent of Aggregate Debit Items and may prohibit a member firm from expanding its business and declaring cash dividends if its net capital is less than five percent of Aggregate Debit Items. The net capital position of RJA at September 30, 2007 and September 30, 2006 was as follows:
September 30, September 30, 2007 2006
($ in 000's) Raymond James & Associates, Inc.: (Alternative Method Elected)
Net Capital as a Percent of Aggregate Debit Items 21.94% 27.58%
Net Capital $ 332,873 $ 369,443 Less: Required Net Capital (30,344) (26,793)
Excess Net Capital $ 302,529 $ 342,650 At September 30, 2007 and September 30, 2006, RJFS had no Aggregate Debit Items and therefore the minimum net capital of $250,000 was applicable. The net capital position of RJFS at September 30, 2007 and September 30, 2006 was as follows:
September 30, September 30, 2007 2006
(in 000's) Raymond James Financial Services, Inc.: (Alternative Method Elected)
Net Capital $ 70,583 $ 41,200 Less: Required Net Capital (250) (250)
Excess Net Capital $ 70,333 $ 40,950

81
At September 30, 2007 and September 30, 2006, HFD had no Aggregate Debit Items and therefore the minimum net capital of $250,000 was applicable. The net capital position of HFD at September 30, 2007 and September 30, 2006 was as follows:
September 30, September 30, 2007 2006
(in 000’s) Heritage Fund Distributors, Inc. (Alternative Method Elected)
Net Capital $ 6,039 $ 1,669 Less: Required Net Capital (250) (250)
Excess Net Capital $ 5,789 $ 1,419
RJ Ltd. is subject to the Minimum Capital Rule (By-Law No. 17 of the Investment Dealers Association ("IDA") and the Early Warning System (By-Law No. 30 of the IDA). The Minimum Capital Rule requires that every member shall have and maintain at all times Risk Adjusted Capital greater than zero calculated in accordance with Form 1 (Joint Regulatory Financial Questionnaire and Report) and with such requirements as the Board of Directors of the IDA may from time to time prescribe. Insufficient Risk Adjusted Capital may result in suspension from membership in the stock exchanges or the IDA. The Early Warning System is designed to provide advance warning that a member firm is encountering financial difficulties. This system imposes certain sanctions on members who are designated in Early Warning Level 1 or Level 2 according to their capital, profitability, liquidity position, frequency of designation or at the discretion of the IDA. Restrictions on business activities and capital transactions, early filing requirements, and mandated corrective measures are sanctions that may be imposed as part of the Early Warning System. RJ Ltd. was not in Early Warning Level 1 or Level 2 at September 30, 2007 or September 30, 2006. The Risk Adjusted Capital of RJ Ltd. was CDN $47,724,293 and CDN $42,841,000 September 30, 2007 and September 30, 2006, respectively. The Company’s other domestic and international broker-dealers are in compliance with and meet all net capital requirements. RJBank is subject to various regulatory and capital requirements administered by the federal banking agencies. Failure to meet minimum capital requirements can initiate certain mandatory - and possibly additional discretionary - actions by regulators. Under capital adequacy guidelines and the regulatory framework for prompt corrective action, RJBank must meet specific capital guidelines that involve quantitative measures of RJBank's assets, liabilities, and certain off-balance sheet items as calculated under regulatory accounting practices. RJBank's capital amounts and classification are also subject to qualitative judgments by the regulators about components, risk weightings, and other factors. Quantitative measures established by regulation to ensure capital adequacy require RJBank to maintain minimum amounts and ratios (set forth in the table below) of total and Tier I Capital (as defined in the regulations) to risk-weighted assets (as defined). Management believes that, as of September 30, 2007, RJBank meets all capital adequacy requirements to which it is subject.

82
As of September 30, 2007, the most recent notification from the Office of Thrift Supervision categorized RJBank as “well capitalized” under the regulatory framework for prompt corrective action. To be categorized as “well capitalized”, RJBank must maintain minimum total risk-based, Tier I risk-based, and Tier I leverage ratios as set forth in the table below. There are no conditions or events since that notification that management believes have changed RJBank's category.
To be well capitalized Requirement for capital under prompt adequacy corrective action Actual purposes provisions Amount Ratio Amount Ratio Amount Ratio
($ in 000's) As of September 30, 2007:
Total Capital (to Risk-Weighted Assets) $ 420,704 10.1% $ 332,832 8.0% $ 416,040 10.0%
Tier I Capital (to Risk-Weighted Assets) 368,699 8.9% 166,416 4.0% 249,624 6.0%
Tier I Capital (to Average Assets) 368,699 5.8% 253,048 4.0% 316,309 5.0%
As of September 30, 2006:
Total Capital (to Risk-Weighted Assets) $ 219,339 12.0% $ 146,716 8.0% $ 183,396 10.0%
Tier I Capital (to Risk-Weighted Assets) 196,415 10.7% 73,358 4.0% 110,037 6.0%
Tier I Capital (to Average Assets) 196,415 6.4% 122,975 4.0% 153,719 5.0%
NOTE 20 - FINANCIAL INSTRUMENTS WITH OFF-BALANCE SHEET RISK:
In the normal course of business, the Company purchases and sells securities as either principal or agent on behalf of its clients. If either the client or counterparty fails to perform, the Company may be required to discharge the obligations of the nonperforming party. In such circumstances, the Company may sustain a loss if the market value of the security or futures contract is different from the contract value of the transaction. The Company also acts as an intermediary between broker-dealers and other financial institutions whereby the Company borrows securities from one broker-dealer and then lends them to another. Securities borrowed and securities loaned are carried at the amounts of cash collateral advanced and received in connection with the transactions. The Company measures the market value of the securities borrowed and loaned against the cash collateral on a daily basis. The market value of securities borrowed and securities loaned was $1,159,689,000 and $1,159,615,000, respectively, at September 30, 2007 and $1,034,563,000 and $1,197,215,000, respectively, at September 30, 2006. The contract value of securities borrowed and securities loaned was $1,200,798,000 and $1,204,702,000, respectively, at September 30, 2007 and $1,068,102,000 and $1,235,104,000, respectively, at September 30, 2006. Additional cash is obtained as necessary to ensure such transactions are adequately collateralized. If another party to the transaction fails to perform as agreed (for example failure to deliver a security or failure to pay for a security), the Company may incur a loss if the market value of the security is different from the contract amount of the transaction. The Company has also loaned, to brokers-dealers and other financial institutions, securities owned by clients and others for which it has received cash or other collateral. The market value of securities loaned was $74,074,000 at September 30, 2007. If a borrowing institution or broker-dealer does not return a security, the Company may be obligated to purchase the security in order to return it to the owner. In such circumstances, the Company may incur a loss equal to the amount by which the market value of the security on the date of nonperformance exceeds the value of the collateral received from the financial institution or the broker-dealer. The Company has sold securities that it does not currently own, and will therefore, be obligated to purchase such securities at a future date. The Company has recorded $138.4 million and $94 million at September 30, 2007 and September 30, 2006, respectively, which represents the market value of the related securities at such dates. The Company is subject to loss if the market price of those securities not covered by a hedged position increases subsequent to fiscal year end. The Company utilizes short government obligations and equity securities to economically hedge long proprietary inventory positions. At September 30, 2007, the Company had $106,010,000 in short government obligations and $11,048,000 in short equity securities, which represented economic hedge positions. At September 30, 2006, the Company had $31,636,000 in short government obligations, $34,023,000 in short agency securities and $19,068,000 in short equity securities, which represented hedge positions. The Company enters into security transactions involving forward settlement. Forward contracts provide for the delayed delivery of the underlying instrument. The Company has entered into transactions with contract values of $2,036,818,000 and $2,304,629,000 and market values of $2,033,023,000 and $2,297,824,000 as of September 30, 2007 and September 30, 2006, respectively. The contractual amounts related to these financial instruments reflect the volume and activity and do not reflect the amounts at risk. The gain or loss on these transactions is recognized on a trade date basis. Transactions

83
involving future settlement give rise to market risk, which represents the potential loss that can be caused by a change in the market value of a particular financial instrument. The Company's exposure to market risk is determined by a number of factors, including the duration, size, composition and diversification of positions held, the absolute and relative levels of interest rates, and market volatility. The credit risk for these transactions is limited to the unrealized market valuation gains recorded in the Consolidated Statements of Financial Condition. The majority of the Company's transactions, and consequently, the concentration of its credit exposure is with clients, broker-dealers and other financial institutions in the U.S. These activities primarily involve collateralized arrangements and may result in credit exposure in the event that the counterparty fails to meet its contractual obligations. The Company's exposure to credit risk can be directly impacted by volatile securities markets, which may impair the ability of counterparties to satisfy their contractual obligations. The Company seeks to control its credit risk through a variety of reporting and control procedures, including establishing credit limits based upon a review of the counterparties' financial condition and credit ratings. The Company monitors collateral levels on a daily basis for compliance with regulatory and internal guidelines and requests changes in collateral levels as appropriate. RJBank has outstanding at any time a significant number of commitments to extend credit and other credit-related off balance sheet financial instruments such as standby letters of credit and loan purchases. These arrangements are subject to strict credit control assessments and each customer’s credit worthiness is evaluated on a case-by-case basis. A summary of commitments to extend credit and other credit-related off balance sheet financial instruments outstanding at September 30, 2007 and 2006, is as follows: September 30, September 30, 2007 2006 (in 000's) Standby Letters of Credit $ 100,397 $ 55,193 Open End Consumer Lines of Credit 27,871 25,772 Commercial Lines of Credit 1,218,690 760,253 Unfunded Loan Commitments - Variable Rate 397,752 264,663 Unfunded Loan Commitments - Fixed Rate 12,831 6,412
Because many loan commitments expire without being funded in whole or part, the contract amounts are not estimates of future cash flows. Credit risk represents the accounting loss that would be recognized at the reporting date if counterparties failed completely to perform as contracted. The credit risk amounts are equal to the contractual amounts, assuming that the amounts are fully advanced and that the collateral or other security is of no value. RJBank uses the same credit approval and monitoring process in extending loan commitments and other credit-related off balance sheet instruments as it does in making loans. RJBank’s policy is generally to require customers to provide collateral at the time of closing. The amount of collateral obtained, if it is deemed necessary by RJBank upon extension of credit, is based on RJBank’s credit evaluation of the borrower. Collateral held varies but may include accounts receivable, inventory, real estate, and income producing commercial properties. In the normal course of business, RJBank issues, or participates in the issuance of, financial standby letters of credit whereby it provides an irrevocable guarantee of payment in the event the letter of credit is drawn down by the beneficiary. As of September 30, 2007, $100.4 million of such letters of credit were outstanding. Of the letters of credit outstanding, $100 million are underwritten as part of a larger corporate credit relationship. In the event that a letter of credit is drawn down, RJBank would pursue repayment from the account party under the existing borrowing relationship, or would liquidate collateral, or both. The proceeds from repayment or liquidation of collateral are expected to satisfy the maximum potential future amount of any payments of amounts drawn down under the existing letters of credit. At September 30, 2007, RJBank had $1.6 million in unearned fees related to these instruments. The credit risk involved in issuing letters of credit is essentially the same as that involved with extending loan commitments to clients, and accordingly, RJBank uses a credit evaluation process and collateral requirements similar to those for loan commitments.

84
NOTE 21 – EARNINGS PER SHARE:
The following table presents the computation of basic and diluted earnings per share:
Year Ended September 30, September 30, September 30, 2007 2006 2005 (in 000’s, except per share amounts) Net Income $ 250,430 $ 214,342 $ 151,046 Weighted Average Common Shares
Outstanding During the Period* 115,608 112,614 110,217 Dilutive Effect of Stock Options and Awards (1)* 3,085 3,124 2,831 Weighted Average Diluted Common
Shares (1)* 118,693 115,738 113,048 Net Income per Share – Basic* $ 2.17 $ 1.90 $ 1.37 Net Income per Share - Diluted (1)* $ 2.11 $ 1.85 $ 1.33 Securities Excluded from Weighted Average
Diluted Common Shares Because Their Effect Would Be Antidilutive* 1,321 0 108
*2005 amounts have been adjusted for the March 22, 2006 3-for-2 stock split. (1) Diluted earnings per share is computed on the basis of the weighted average number of shares of common stock plus the effect of dilutive potential common shares
outstanding during the period using the treasury stock method. Dilutive potential common shares include stock options, units and awards. NOTE 22 – SEGMENT ANALYSIS: SFAS No. 131, “Disclosures about Segments of an Enterprise and Related Information”, establishes standards for reporting information about operating segments. Operating segments are defined as components of an enterprise about which separate financial information is available that is evaluated regularly by the chief operating decision maker, or decision making group, in deciding how to allocate resources and in assessing performance. Revisions have been made in the segment disclosures for the fiscal years ended September 30, 2006 and 2005 to conform to the current period presentation. As a result, financial service fees revenue and investment advisory fees expense increased by approximately $12.8 million and $11.2 million, respectively, for the fiscal years ended September 30, 2006 and 2005 in the Asset Management segment. These revisions did not impact the Company’s net income for the fiscal years ended September 30, 2006 and 2005. The Company currently operates through the following eight business segments: Private Client Group; Capital Markets; Asset Management; RJBank; Emerging Markets; Stock Loan/Borrow; Proprietary Capital and various corporate activities combined in the "Other" segment. In the quarter ended September 30, 2007, a new segment was established: Proprietary Capital. The components of this segment were previously included in Asset Management and Other. Reclassifications have been made in the segment disclosure for previous years to conform to this presentation. The business segments are based upon factors such as the services provided and the distribution channels served and are consistent with how the Company assesses performance and determines how to allocate resources throughout the Company and its subsidiaries. The financial results of the Company's segments are presented using the same policies as those described in Note 1, “Summary of Significant Accounting Policies”. Segment data includes charges allocating corporate overhead and benefits to each segment. Intersegment revenues, charges, receivables and payables are eliminated between segments upon consolidation. The Private Client Group segment includes the retail branches of the Company's broker-dealer subsidiaries located throughout the U.S., Canada and the United Kingdom. These branches provide securities brokerage services including the sale of equities, mutual funds, fixed income products and insurance products to their individual clients. The segment includes net interest earnings on client margin loans and cash balances. Additionally, this segment includes the correspondent clearing services that the Company provides to other broker-dealer firms. The Capital Markets segment includes institutional sales and trading in the U.S., Canada and Europe. It provides securities brokerage, trading, and research services to institutions with an emphasis on the sale of U.S. and Canadian equities and fixed income products. This segment also includes the Company's management of and participation in underwritings, merger and acquisition services, public finance activities, and the operations of Raymond James Tax Credit Funds.

85
The Asset Management segment includes investment portfolio management services of Eagle Asset Management, Inc., Awad Asset Management, Inc., and Raymond James Consulting Services (RJA’s asset management services division), mutual fund management by Heritage Asset Management, Inc., and trust services of Raymond James Trust Company and Raymond James Trust Company West. In addition to the asset management services noted above, this segment also offers fee-based programs to clients who have contracted for portfolio management services from outside money managers. RJBank is a separate segment, which provides consumer, residential, and commercial loans, as well as FDIC-insured deposit accounts to clients of the Company's broker-dealer subsidiaries and to the general public. The Emerging Markets segment includes various joint ventures in Turkey and Latin America. These joint ventures operate in securities brokerage, investment banking and asset management. The Stock Loan/Borrow segment involves the borrowing and lending of securities from and to other broker-dealers, financial institutions and other counterparties, generally as an intermediary. The Proprietary Capital segment consists of the Company’s principal capital and private equity activities including: various direct and third party private equity and merchant banking investments (including Raymond James Capital, Inc. a captive private equity business), Special Situations Investments, the EIF Funds, and two private equity funds sponsored by the Company: Raymond James Capital Partners, L.P., and Ballast Point Ventures, L.P. The Other segment includes certain corporate activities of the Company.
Information concerning operations in these segments of business is as follows:
Year Ended September 30, September 30, September 30, 2007 2006 2005
(in 000’s) Revenues:
Private Client Group $ 1,938,154 $ 1,679,813 $ 1,397,578 Capital Markets 506,498 487,419 455,151 Asset Management 234,875 207,821 179,845 RJBank 279,572 114,692 45,448 Emerging Markets 59,083 55,263 38,768 Stock Loan/Borrow 68,685 59,947 31,876 Proprietary Capital 8,280 17,312 10,952 Other 14,432 23,311 8,578
Total Revenues $ 3,109,579 $ 2,645,578 $ 2,168,196 Income Before Provision for Income Taxes:
Private Client Group $ 219,864 $ 168,519 $ 102,245 Capital Markets 68,966 78,221 77,333 Asset Management 60,517 48,749 40,442 RJBank 27,005 16,003 14,204 Emerging Markets 3,640 2,857 5,927 Stock Loan/Borrow 5,003 8,001 5,962 Proprietary Capital 3,577 8,468 4,182 Other 3,652 11,248 (2,324)
Pre-Tax Income $ 392,224 $ 342,066 $ 247,971
Year Ended September 30, September 30, September 30, 2007 2006 2005
(in 000’s) Net Interest Income (Expense):
Private Client Group $ 124,656 $ 109,116 $ 80,011 Capital Markets (8,566) (8,036) 1,009 Asset Management 1,535 1,096 394 RJBank 84,501 40,536 22,997 Emerging Markets 2,967 2,180 1,422 Stock Loan/Borrow 9,409 12,354 9,003 Proprietary Capital 1,122 290 102 Other 11,704 15,775 12,835
Net Interest Income (Expense) $ 227,328 $ 173,311 $ 127,773

86
The following table presents the Company's total assets on a segment basis:
September 30, September 30, 2007 2006 (in 000’s) Total Assets:
Private Client Group * $ 6,608,059 $ 5,370,018 Capital Markets ** 1,533,273 1,369,479 Asset Management 95,894 66,007 RJBank 6,312,966 3,074,782 Emerging Markets 104,238 58,950 Stock Loan/Borrow 1,302,937 1,250,857 Proprietary Capital 115,062 57,254 Other 181,739 269,303
Total $ 16,254,168 $ 11,516,650 *Includes $46 million of goodwill allocated pursuant to SFAS No. 142, "Goodwill and Other Intangible Assets". **Includes $17 million of goodwill allocated pursuant to SFAS No. 142. The Company has operations in the U.S., Canada, Europe and joint ventures in Turkey and Latin America. Substantially all long-lived assets are located in the U.S. Revenues, classified by the major geographic areas in which they are earned, were as follows:
Year Ended
September 30, September 30, September 30, 2007 2006 2005 (in 000’s) Revenues:
United States $ 2,757,314 $ 2,322,518 $ 1,923,776 Canada 249,372 222,365 162,525 Europe 52,156 52,489 46,432 Other 50,737 48,206 35,463
Total $ 3,109,579 $ 2,645,578 $ 2,168,196 The Company has $18.4 million invested in emerging market joint ventures, which carry greater risk than amounts invested in developed markets.

87
*****
QUARTERLY FINANCIAL INFORMATION (unaudited)
2007 1st Qtr. 2nd Qtr. 3rd Qtr. 4th Qtr. (in 000’s, except per share data) Revenues $ 709,629 $ 738,271 $ 822,753 $ 838,926 Net Revenues 603,900 625,719 688,660 691,636 Non-Interest Expenses 513,109 530,764 583,133 600,412 Income Before Income Taxes 93,766 92,955 109,898 95,605 Net Income 59,395 59,715 68,353 62,967 Net Income per Share – Basic .52 .52 .59 .54 Net Income per Share – Diluted(1) .50 .50 .57 .53 Dividends Declared per Share .10 .10 .10 .10
2006 1st Qtr. 2nd Qtr. 3rd Qtr. 4th Qtr. (in 000’s, except per share data) Revenues(2) $ 578,397 $ 660,023 $ 714,665 $ 692,493 Net Revenues(2) 529,586 596,007 632,976 590,339 Non-Interest Expenses(2) 458,766 504,743 538,647 512,845 Income Before Income Taxes 71,335 95,310 96,502 78,919 Net Income 45,109 61,531 56,774 50,928 Net Income per Share - Basic(3) .41 .54 .50 .45 Net Income per Share - Diluted(3) .40 .53 .48 .44 Dividends Declared per Share(3) .08 .08 .08 .08
(1) Due to rounding the quarterly results do not add to the total for the year. (2) Financial service fees revenue and investment advisory fees expense were revised to conform to the current year presentation. These revisions did not impact the Company’s
prior period net income. See Note 1 to the Consolidated Financial Statements for further information. (3) Adjusted for three-for-two stock split paid on March 22, 2006.

OTHER EXECUTIVE OFFICERS
Jennifer C. AckartController and Chief Accounting Officer, Raymond James Financial
George CataneseSenior Vice President and Chief Risk Officer,Raymond James Financial
Paul L. MateckiGeneral Counsel/Director of Compliance, Corporate Secretary, Raymond James Financial
RAYMOND JAMES FINANCIAL, INC. BOARD OF DIRECTORS
Angela M. Biever Vice President, Managing Director, Consumer Internet,Intel Capital
Francis S. Godbold Vice Chairman, Raymond James Financial
H. William Habermeyer Jr. Retired; Former President and CEO,Progress Energy Florida
Chet Helck President and COO, Raymond James Financial
Thomas A. James Chairman of the Board and CEO,Raymond James Financial
Dr. Paul Marshall Professor of Management Practice,Harvard Graduate School of Business Administration
Paul C. Reilly Chairman, Korn/Ferry International, Executive recruiting
Robert P. Saltzman Retired; Former President and CEO,Jackson National Life Insurance Company
Kenneth A. Shields Chairman and CEO, Conifex, Inc.,Pursuing acquisitions in the Canadian forest products industry
Wick Simmons Retired securities industry executive
88

89
RAYMOND JAMES FINANCIAL, INC. OPERATING COMMITTEE
Richard G. Averitt III Chairman and CEO, Raymond James Financial Services
Timothy Eitel Chief Information Officer, Raymond James Financial
Chet Helck President and COO, Raymond James Financial
Thomas A. James Chairman of the Board and CEO, Raymond James Financial
Jeffrey P. Julien Senior Vice President, Finance, and Chief Financial Officer,Raymond James Financial
Richard K. Riess Executive Vice President and Managing Director, Asset Management,Raymond James Financial
Van C. Sayler Head of Fixed Income Capital Markets, Raymond James & Associates
Thomas R. Tremaine Executive Vice President, Operations and Administration,Raymond James & Associates
Jeffrey E. Trocin Head of Equity Capital Markets, Raymond James & Associates
Dennis W. Zank President, Raymond James & Associates
Peter Bailey President and CEO, Raymond James Ltd.
Steve Raney* President and CEO, Raymond James Bank
*Effective January 1, 2008

CORPORATE AND SHAREHOLDER INFORMATION
Number of Shareholders At December 20, 2007, there were approximately 14,000 shareholders
of record.
10-K; Certifications A copy of the annual report to the Securities and Exchange Commission
on form 10-K is available, without charge, upon request in writing to
Investor Relations Department, Raymond James Financial, Inc., 880
Carillon Parkway, St. Petersburg, Florida 33716, or by emailing investor.
Raymond James has included, as exhibits to its 2007 Annual Report on
form 10-K, certifications of its chief executive officer and chief financial
officer as to the quality of the company’s public disclosure. Raymond
James’ chief executive officer has also submitted to the New York Stock
Exchange a certification that he is not aware of any violations by the
company of the NYSE corporate listing standards.
Annual Meeting The 2007 annual meeting of shareholders will be conducted at Raymond
James Financial’s international headquarters in The Raymond James
Financial Center, 880 Carillon Parkway, St. Petersburg, Florida, on
February 14, 2008, at 4:30 p.m.
The meeting will be broadcast live via streaming audio on
raymondjames.com.
Notice of the annual meeting, proxy statement and proxy voting
instructions accompany this report to shareholders. Quarterly reports
are mailed to shareholders in February,
May, August and November.
Electronic Delivery If you are interested in electronic delivery of future copies
of this report, please see the proxy voting instructions.
Transfer Agent and Registrar Mellon Investor Services LLC
85 Challenger Road
Ridgefield Park, NJ 07660
800-756-3353
melloninvestor.com
Independent Auditors KPMG LLP
New York Stock Exchange Symbol RJF
Covering Analysts Lauren Smith
Keefe, Bruyette and Woods
Douglas Sipkin
Wachovia Capital Markets, LLC
David Trone
Fox-Pitt Kelton Cochran Caronia Waller
William F. Tanona
Goldman Sachs & Co.
Principal Subsidiaries Raymond James & Associates, Inc.
Securities broker/dealer
Member New York Stock Exchange
Raymond James Financial Services, Inc.
Securities broker/dealer
Member Financial Industry Regulatory Authority
Raymond James Ltd.
Canadian securities broker/dealer
Member Toronto Stock Exchange
Eagle Asset Management, Inc.
Asset management
Heritage Asset Management, Inc.
Mutual fund management
Raymond James Bank, FSB
Federally chartered savings and loan
Raymond James Trust Companies
Trust Services
90

91
This page left intentionally blank.

International Headquarters: The Raymond James Financial Center
880 Carillon Parkway | St. Petersburg, FL 33716
raymondjames.com
©2007 Raymond James Financial, Inc.