Embed Size (px)
Citation preview
RAVEN’S™ APM-IIIPROGRESSIVE MATRICES
MANUALPART I
RAVEN’STM Advanced Progressive Matrices(APM-III)
GLOBAL NORMS COMPOSITION TABLES
2017

Copyright © 2015 NCS Pearson, Inc. All rights reserved.
Warning: No part of this publication may be reproduced or transmitted in any form or by any means, electronic or mechanical, including photocopy, recording, or any information storage and retrieval system, without permission in writing from the copyright owner.
Pearson, TalentLens, and Raven’s Progressive Matrices are trademarks in the U.S. and/or other countries of Pearson Education, Inc., or its affiliate(s).
Portions of this work were previously published. Produced in the United States of America.
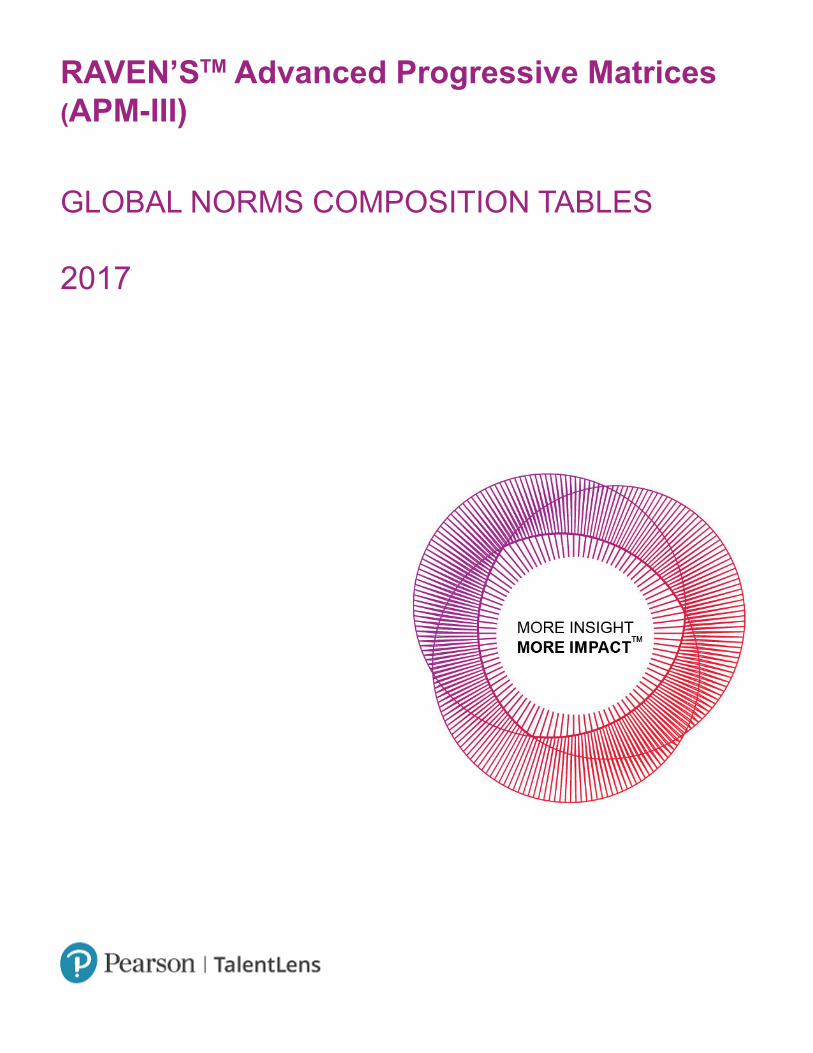
RAVEN’S Advanced Progressive MatricesAPM-III
Norm Group Sample Composition
Copyright © 2015 NCS Pearson, Inc. All rights reserved. 3
UNITED STATES
Values represent percentages of the norm group ineach demographic category Ex
ecut
ives
Dire
ctor
s
Man
ager
s
Prof
essi
onna
ls/
Indi
vidu
al C
ontr
ibut
ors
Sample Size 363 428 342 199INDUSTRY
Aerospace, Aviation - 1 1 -
Arts, Entertainment, Media 1 - 1 1
Construction 1 1 2 3
Education 1 - 1 9
Energy, Utilities 1 1 1 1
Financial Services, Banking, Insurance 7 2 3 41
Government, Public Service, Defense <1 1 2 1
Health Care 6 3 3 4
Hospitality, Tourism 15 16 19 1Information Technology, High-Tech, Telecommunications 8 3 2 9
Manufacturing & Production 12 8 18 7
Pharmaceuticals, Biotechnology 13 23 19 3
Professional, Business Services 4 <1 2 8
Publishing, Printing 1 - <1 1
Real Estate 1 1 1 1
Retail & Wholesale 19 29 9 5
Transportation Warehousing 2 2 2 1
Other/Not Applicable 11 10 16 6*UK English, Norwegian, Danish, Swedish, Italian, Japanese, Simplified Chinese, and US Spanish will also usethe US English Manager Norm group
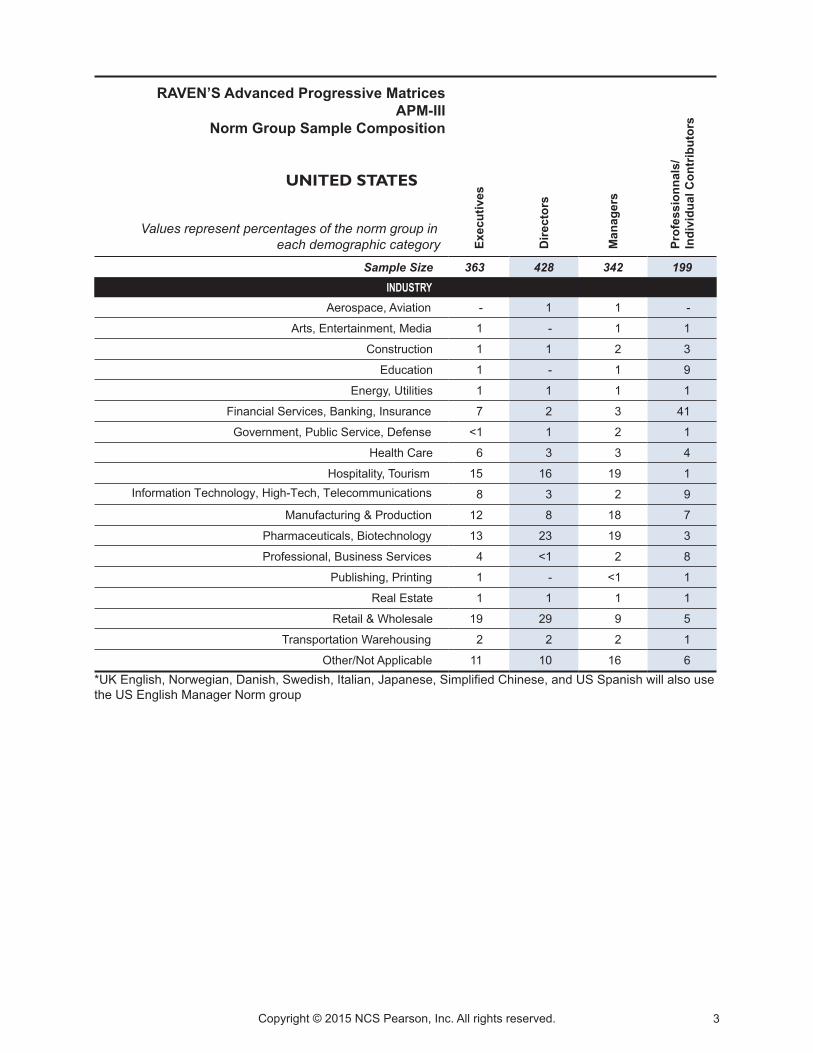
RAVEN’S Advanced Progressive MatricesAPM-III
Norm Group Sample Composition
Copyright © 2015 NCS Pearson, Inc. All rights reserved. 4
UNITED STATES
Values represent percentages of the norm group ineach demographic category Ex
ecut
ives
Dire
ctor
s
Man
ager
s
Prof
essi
onna
ls/
Indi
vidu
al C
ontr
ibut
ors
Sample Size 363 428 342 199OCCUPATIONAccountant 3 2 1 2
Adjuster - <1 - -
Administrative Assistant - - <1 -
Buyer 1 3 <1 1
Consultant 3 2 2 9
Customer Service Representative - <1 2 -
Distribution and Warehouse Personnel 1 - - -
Engineer 2 1 2 6
Field Service - <1 - -
Financial Analyst 2 2 2 22
Human Resource Professional 8 7 4 3
Information Technology Professional 6 6 2 7
Loan Officer <1 - - 1
Logistics Planner - <1 <1 -
Maintenance - - 1 -
Marketing Professional 10 7 7 4
Medical Professional 1 1 <1 -
Merchandise Planner 1 1 - 1
Other 59 59 62 33
Procurement - <1 1 1
Product Design <1 <1 <1 1
Production Planning & Scheduling - - <1 1
Production Supervisor - <1 1 -
Production Support Personnel <1 - <1 -
Project Manager - 2 2 -
Sales Representative 2 4 9 4
Teaching Professional <1 - - 6
Underwriter - - - 2
Did not report - - <1 -*UK English, Norwegian, Danish, Swedish, Italian, Japanese, Simplified Chinese, and US Spanish will also usethe US English Manager Norm group
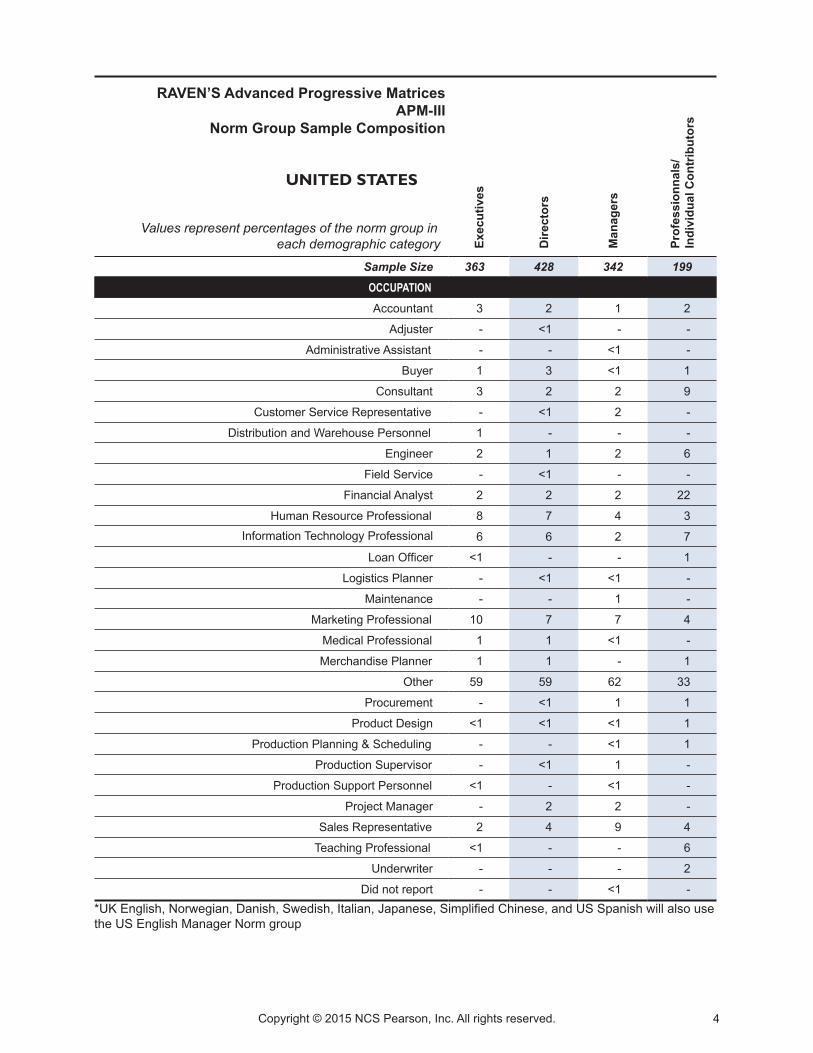
RAVEN’S Advanced Progressive MatricesAPM-III
Norm Group Sample Composition
Copyright © 2015 NCS Pearson, Inc. All rights reserved. 5
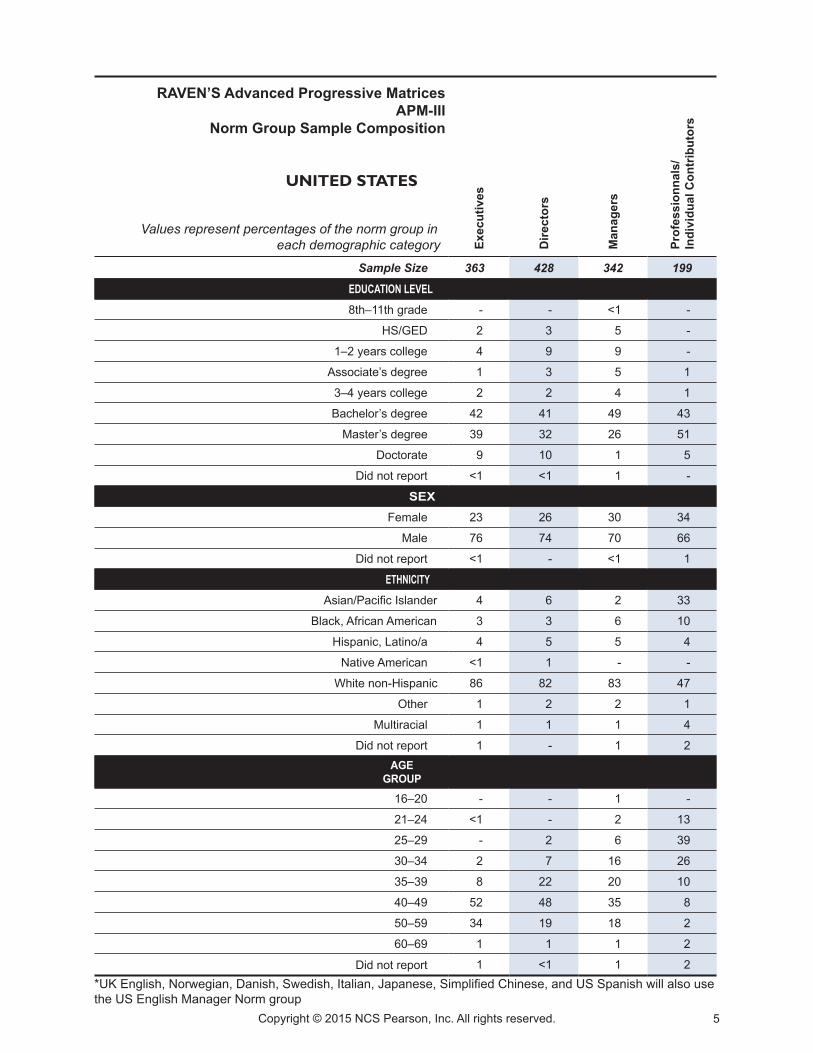
UNITED STATES
Values represent percentages of the norm group ineach demographic category Ex
ecut
ives
Dire
ctor
s
Man
ager
s
Prof
essi
onna
ls/
Indi
vidu
al C
ontr
ibut
ors
Sample Size 363 428 342 199
EDUCATION LEVEL8th–11th grade - - <1 -
HS/GED 2 3 5 -
1–2 years college 4 9 9 -
Associate’s degree 1 3 5 1
3–4 years college 2 2 4 1
Bachelor’s degree 42 41 49 43
Master’s degree 39 32 26 51
Doctorate 9 10 1 5
Did not report <1 <1 1 -
SEXFemale 23 26 30 34
Male 76 74 70 66
Did not report <1 - <1 1
ETHNICITYAsian/Pacific Islander 4 6 2 33
Black, African American 3 3 6 10
Hispanic, Latino/a 4 5 5 4
Native American <1 1 - -
White non-Hispanic 86 82 83 47
Other 1 2 2 1
Multiracial 1 1 1 4
Did not report 1 - 1 2AGE
GROUP
16–20 - - 1 -
21–24 <1 - 2 13
25–29 - 2 6 39
30–34 2 7 16 26
35–39 8 22 20 10
40–49 52 48 35 8
50–59 34 19 18 2
60–69 1 1 1 2
Did not report 1 <1 1 2*UK English, Norwegian, Danish, Swedish, Italian, Japanese, Simplified Chinese, and US Spanish will also usethe US English Manager Norm group
RAVEN’S Advanced Progressive MatricesAPM-III
Norm Group Sample Composition
Copyright © 2015 NCS Pearson, Inc. All rights reserved. 6
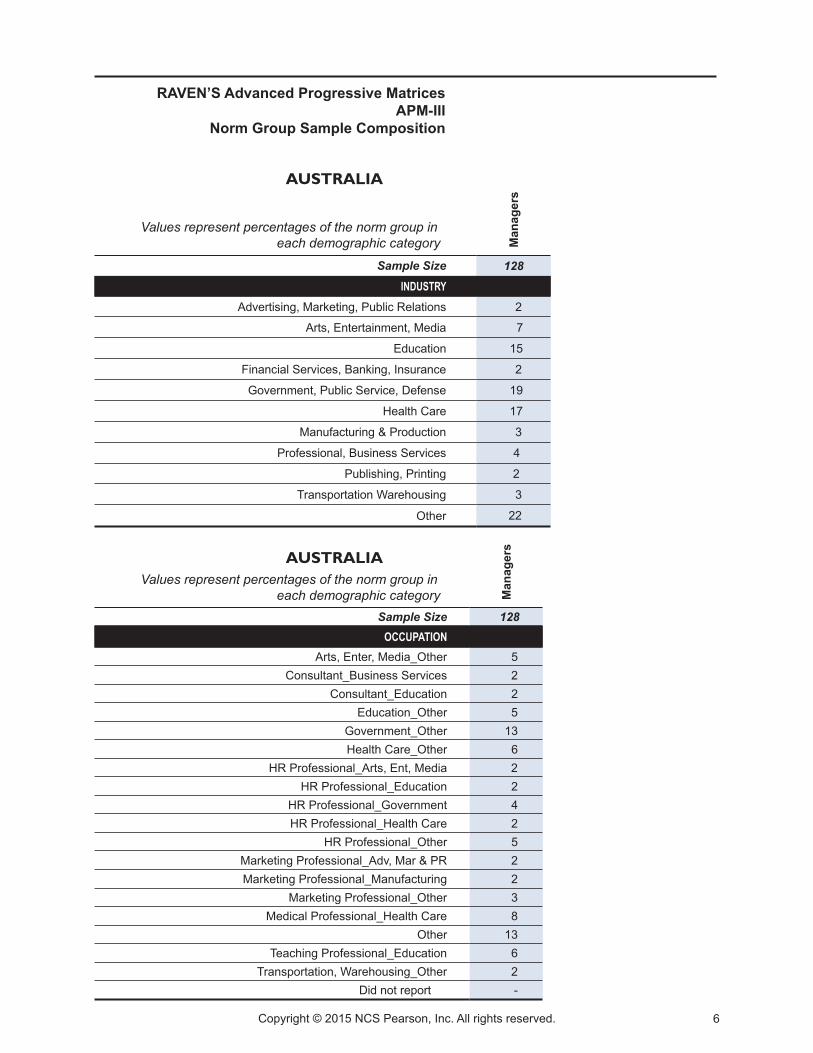
AUSTRALIA
Values represent percentages of the norm group ineach demographic category M
anag
ers
Sample Size 128INDUSTRY
Advertising, Marketing, Public Relations 2
Arts, Entertainment, Media 7
Education 15
Financial Services, Banking, Insurance 2
Government, Public Service, Defense 19
Health Care 17
Manufacturing & Production 3
Professional, Business Services 4
Publishing, Printing 2
Transportation Warehousing 3
Other 22
AUSTRALIAValues represent percentages of the norm group in
each demographic category Man
ager
s
Sample Size 128OCCUPATION
Arts, Enter, Media_Other 5Consultant_Business Services 2
Consultant_Education 2Education_Other 5
Government_Other 13Health Care_Other 6
HR Professional_Arts, Ent, Media 2HR Professional_Education 2
HR Professional_Government 4HR Professional_Health Care 2
HR Professional_Other 5Marketing Professional_Adv, Mar & PR 2Marketing Professional_Manufacturing 2
Marketing Professional_Other 3Medical Professional_Health Care 8
Other 13Teaching Professional_Education 6
Transportation, Warehousing_Other 2Did not report -
RAVEN’S Advanced Progressive MatricesAPM-III
Norm Group Sample Composition
Copyright © 2015 NCS Pearson, Inc. All rights reserved. 7
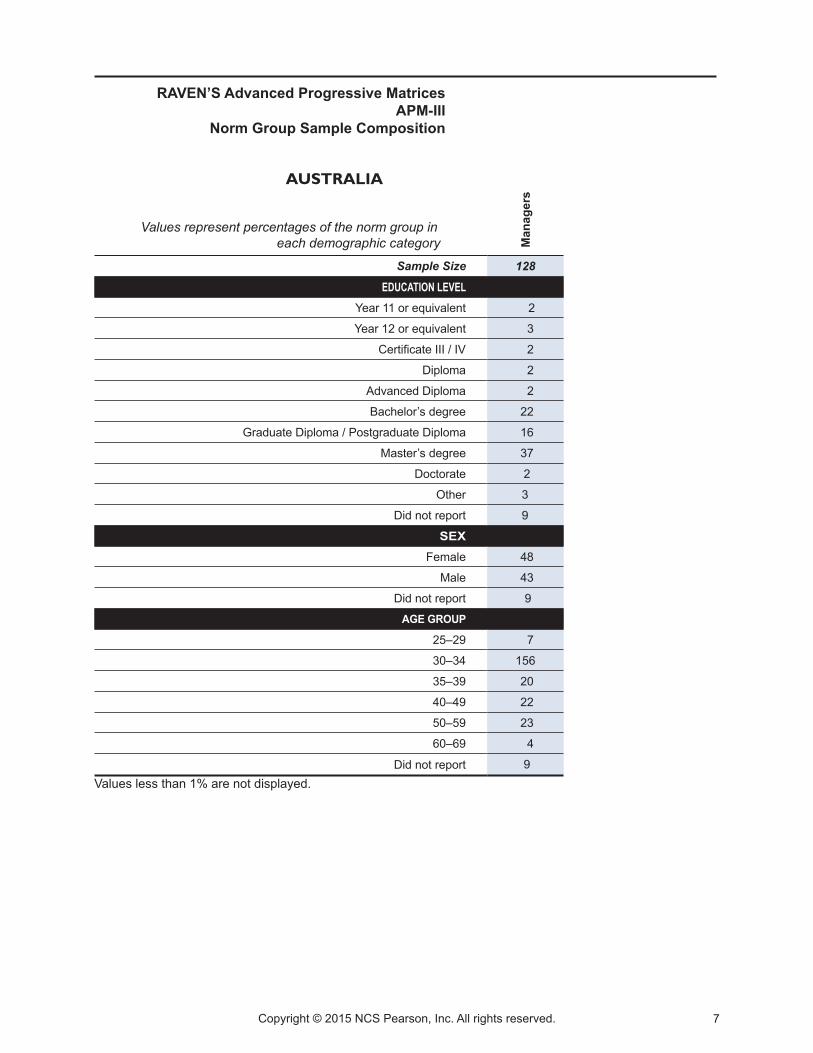
AUSTRALIA
Values represent percentages of the norm group ineach demographic category M
anag
ers
Sample Size 128
EDUCATION LEVELYear 11 or equivalent 2
Year 12 or equivalent 3
Certificate III / IV 2
Diploma 2
Advanced Diploma 2
Bachelor’s degree 22
Graduate Diploma / Postgraduate Diploma 16
Master’s degree 37
Doctorate 2
Other 3
Did not report 9
SEXFemale 48
Male 43
Did not report 9
AGE GROUP
25–29 7
30–34 156
35–39 20
40–49 22
50–59 23
60–69 4
Did not report 9Values less than 1% are not displayed.
RAVEN’S Advanced Progressive MatricesAPM-III
Norm Group Sample Composition
Copyright © 2015 NCS Pearson, Inc. All rights reserved. 8
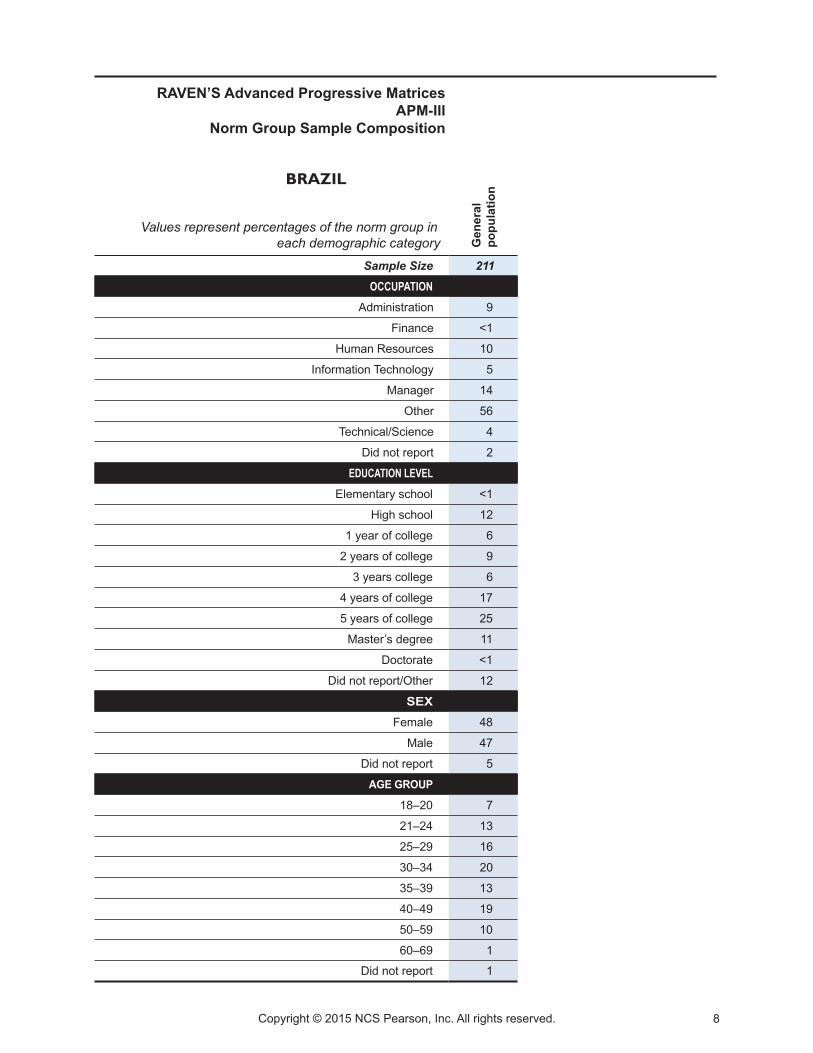
BRAZIL
Values represent percentages of the norm group ineach demographic category G
ener
alpo
pula
tion
Sample Size 211OCCUPATION
Administration 9
Finance <1
Human Resources 10
Information Technology 5
Manager 14
Other 56
Technical/Science 4
Did not report 2
EDUCATION LEVELElementary school <1
High school 12
1 year of college 6
2 years of college 9
3 years college 6
4 years of college 17
5 years of college 25
Master’s degree 11
Doctorate <1
Did not report/Other 12
SEXFemale 48
Male 47
Did not report 5
AGE GROUP
18–20 7
21–24 13
25–29 16
30–34 20
35–39 13
40–49 19
50–59 10
60–69 1
Did not report 1
RAVEN’S Advanced Progressive MatricesAPM-III
Norm Group Sample Composition
Copyright © 2015 NCS Pearson, Inc. All rights reserved. 9
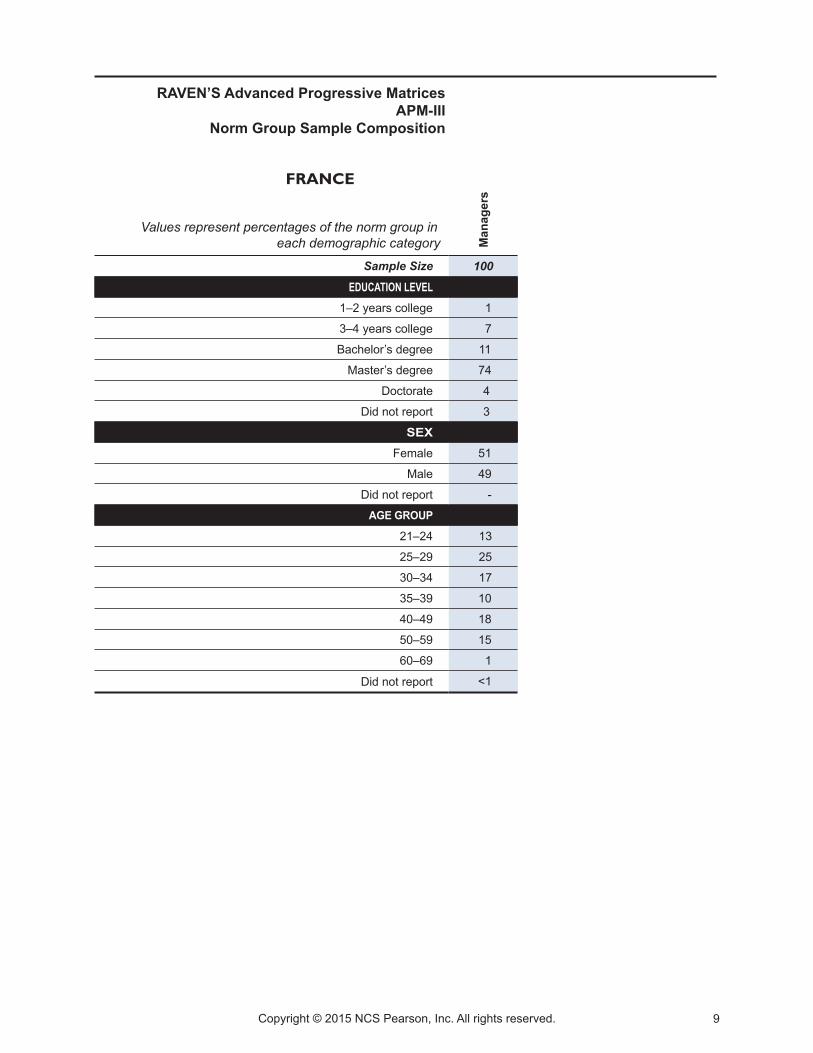
FRANCE
Values represent percentages of the norm group ineach demographic category M
anag
ers
Sample Size 100
EDUCATION LEVEL1–2 years college 1
3–4 years college 7
Bachelor’s degree 11
Master’s degree 74
Doctorate 4
Did not report 3
SEXFemale 51
Male 49
Did not report -
AGE GROUP
21–24 13
25–29 25
30–34 17
35–39 10
40–49 18
50–59 15
60–69 1
Did not report <1
RAVEN’S Advanced Progressive MatricesAPM-III
Norm Group Sample Composition
Copyright © 2015 NCS Pearson, Inc. All rights reserved. 10
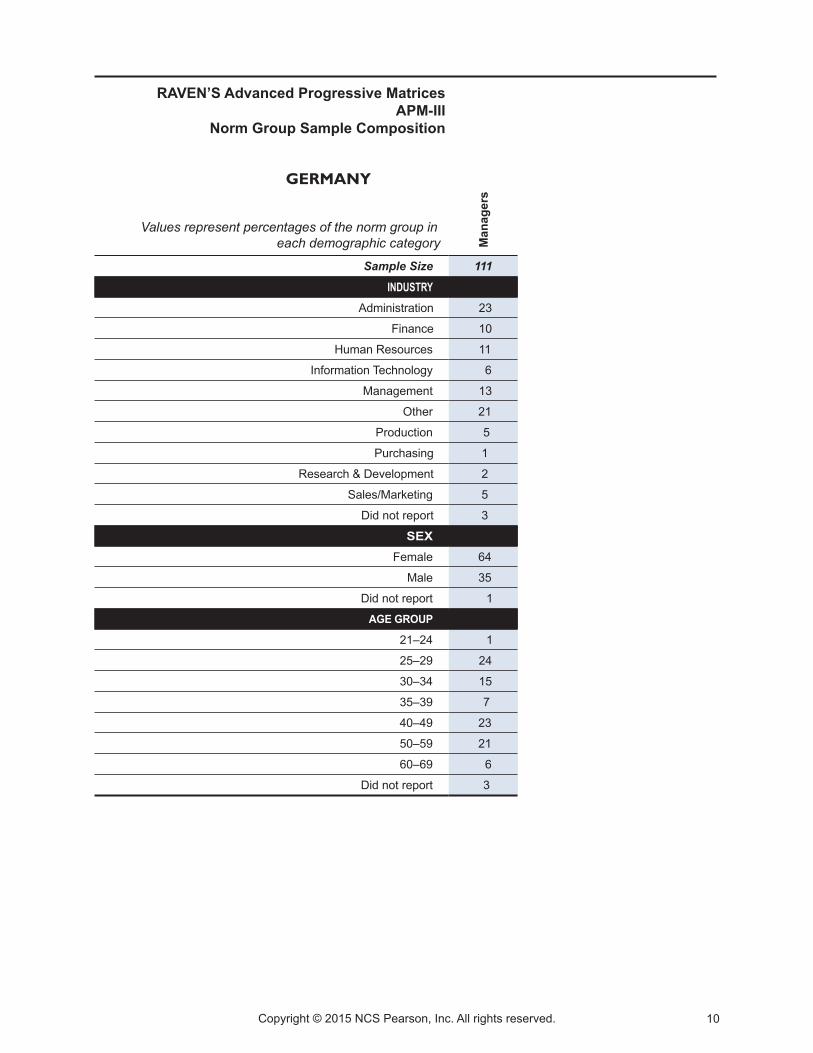
GERMANY
Values represent percentages of the norm group ineach demographic category M
anag
ers
Sample Size 111
INDUSTRYAdministration 23
Finance 10
Human Resources 11
Information Technology 6
Management 13
Other 21
Production 5
Purchasing 1
Research & Development 2
Sales/Marketing 5
Did not report 3
SEXFemale 64
Male 35
Did not report 1
AGE GROUP
21–24 1
25–29 24
30–34 15
35–39 7
40–49 23
50–59 21
60–69 6
Did not report 3
RAVEN’S Advanced Progressive MatricesAPM-III
Norm Group Sample Composition
Copyright © 2015 NCS Pearson, Inc. All rights reserved. 11
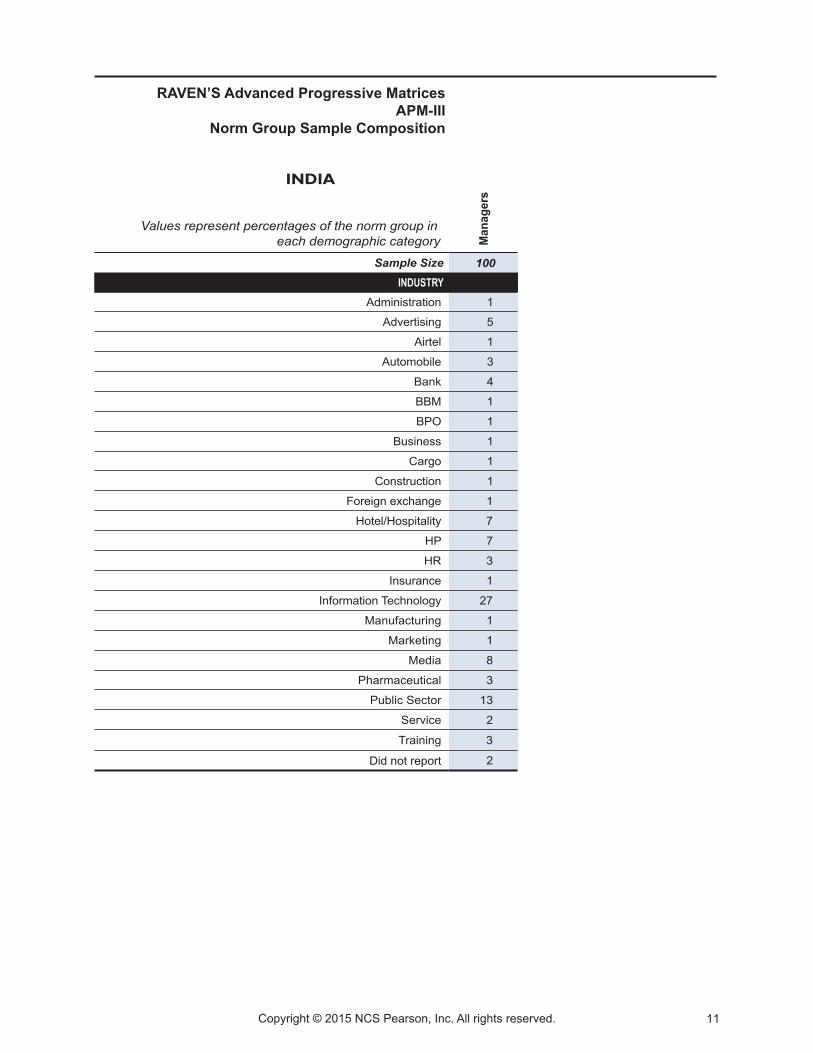
INDIA
Values represent percentages of the norm group ineach demographic category M
anag
ers
Sample Size 100INDUSTRY
Administration 1
Advertising 5
Airtel 1
Automobile 3
Bank 4
BBM 1
BPO 1
Business 1
Cargo 1
Construction 1
Foreign exchange 1
Hotel/Hospitality 7
HP 7
HR 3
Insurance 1
Information Technology 27
Manufacturing 1
Marketing 1
Media 8
Pharmaceutical 3
Public Sector 13
Service 2
Training 3
Did not report 2
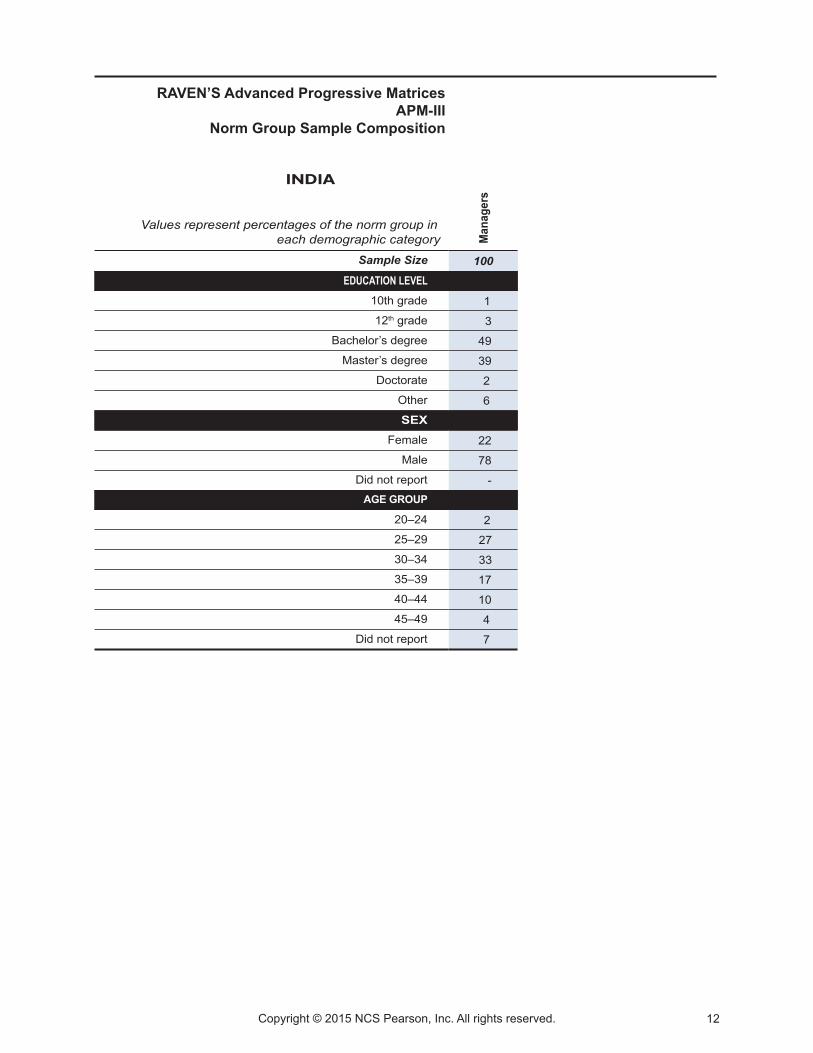
RAVEN’S Advanced Progressive MatricesAPM-III
Norm Group Sample Composition
Copyright © 2015 NCS Pearson, Inc. All rights reserved. 12
INDIA
Values represent percentages of the norm group ineach demographic category M
anag
ers
Sample Size 100EDUCATION LEVEL
10th grade 1
12th grade 3
Bachelor’s degree 49
Master’s degree 39
Doctorate 2
Other 6
SEXFemale 22
Male 78
Did not report -AGE GROUP
20–24 2
25–29 27
30–34 33
35–39 17
40–44 10
45–49 4
Did not report 7
RAVEN’S Advanced Progressive MatricesAPM-III
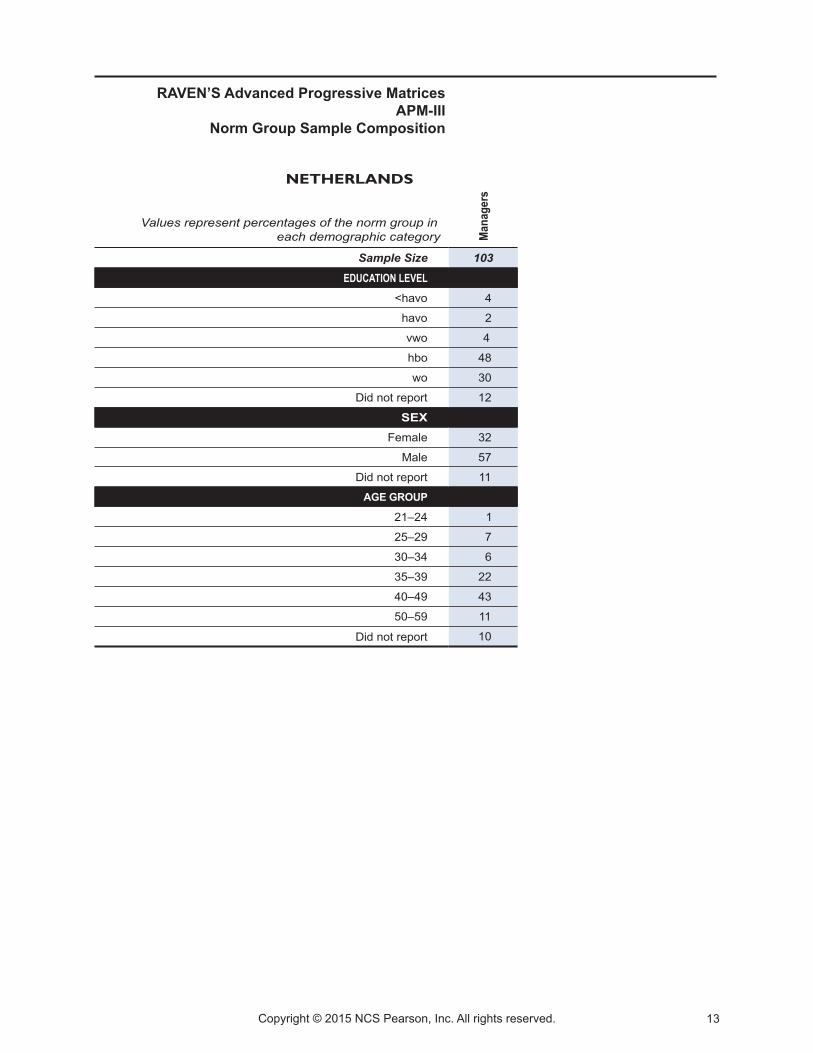
Norm Group Sample Composition
Copyright © 2015 NCS Pearson, Inc. All rights reserved. 13
NETHERLANDS
Values represent percentages of the norm group ineach demographic category M
anag
ers
Sample Size 103
EDUCATION LEVEL<havo 4
havo 2
vwo 4
hbo 48
wo 30
Did not report 12
SEXFemale 32
Male 57
Did not report 11
AGE GROUP
21–24 1
25–29 7
30–34 6
35–39 22
40–49 43
50–59 11
Did not report 10
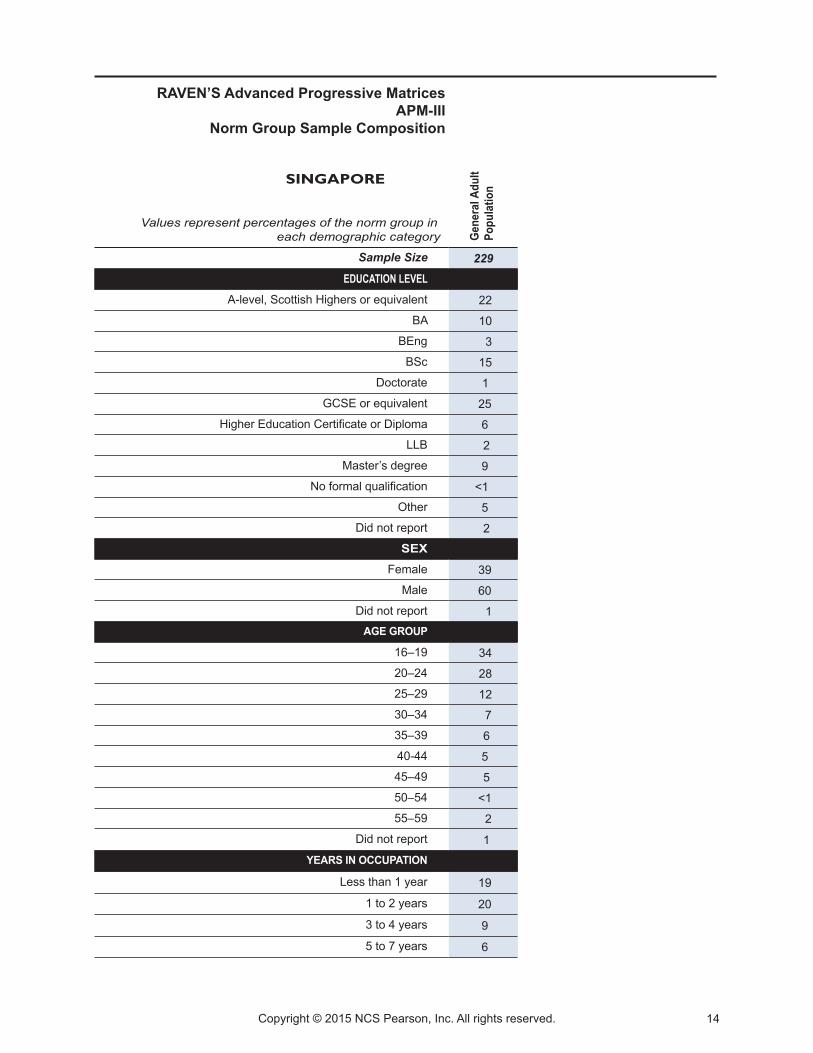
RAVEN’S Advanced Progressive MatricesAPM-III
Norm Group Sample Composition
Copyright © 2015 NCS Pearson, Inc. All rights reserved. 14
SINGAPORE
Values represent percentages of the norm group ineach demographic category Ge
nera
l Adu
lt Po
pula
tion
Sample Size 229EDUCATION LEVEL
A-level, Scottish Highers or equivalent 22
BA 10
BEng 3
BSc 15
Doctorate 1
GCSE or equivalent 25
Higher Education Certificate or Diploma 6
LLB 2
Master’s degree 9
No formal qualification <1
Other 5
Did not report 2
SEXFemale 39
Male 60
Did not report 1AGE GROUP
16–19 34
20–24 28
25–29 12
30–34 7
35–39 6
40-44 5
45–49 5
50–54 <1
55–59 2
Did not report 1
YEARS IN OCCUPATION
Less than 1 year 19
1 to 2 years 20
3 to 4 years 9
5 to 7 years 6
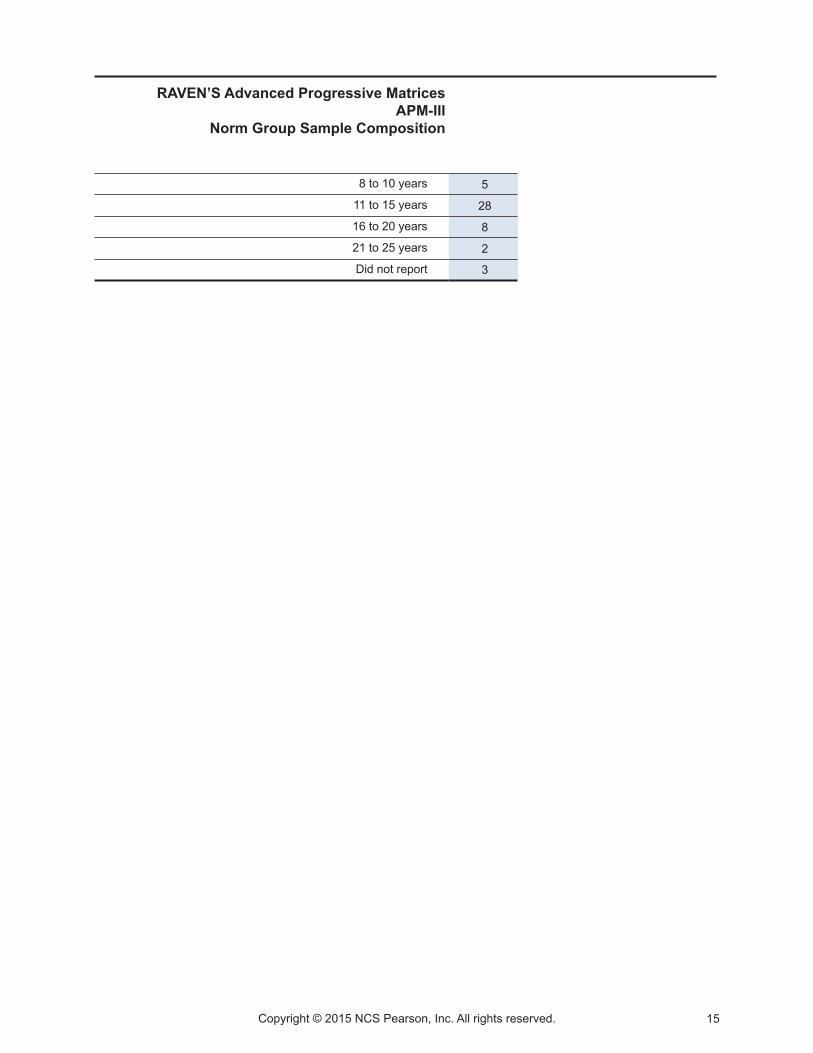
RAVEN’S Advanced Progressive MatricesAPM-III
Norm Group Sample Composition
Copyright © 2015 NCS Pearson, Inc. All rights reserved. 15
8 to 10 years 5
11 to 15 years 28
16 to 20 years 8
21 to 25 years 2
Did not report 3