Embed Size (px)
Citation preview

A study on “RATIO ANALYSIS” at Amara raja batteries limited ,Tirupati.
JAWAHARLAL NEHRU TECHNOLOGIAL UNIVERSITY,ANANTAPURAMU
Submitted By: Under the guidance of: R.MALLIKARJUNA Dr.P.JAYARAMI REDDY 130A1E0061 M.B.A,Ph.D
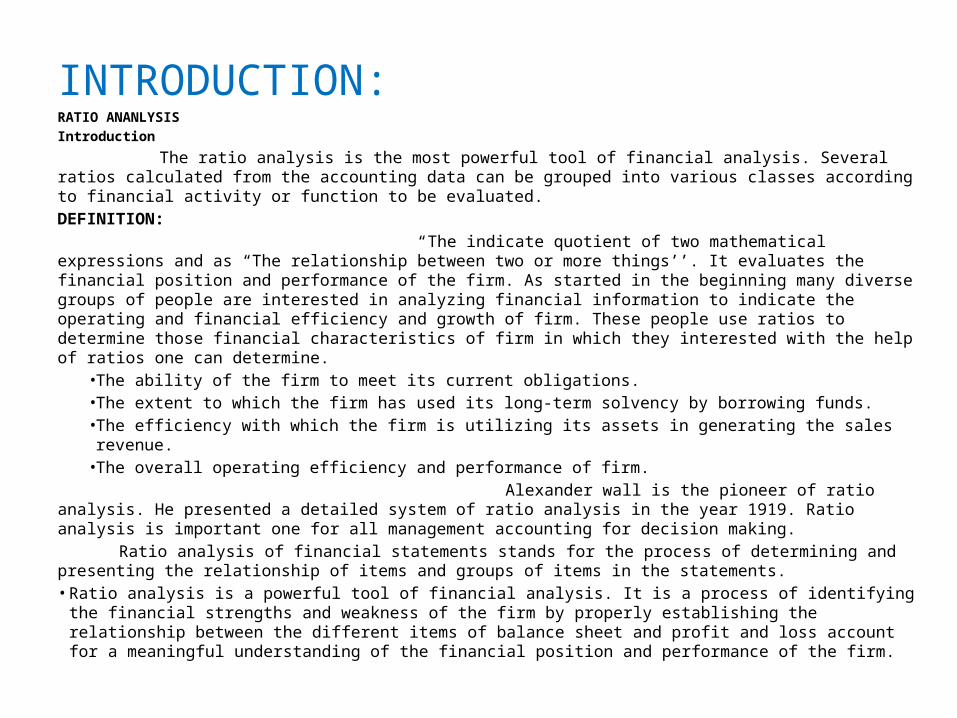
INTRODUCTION:RATIO ANANLYSISIntroduction
The ratio analysis is the most powerful tool of financial analysis. Several ratios calculated from the accounting data can be grouped into various classes according to financial activity or function to be evaluated.DEFINITION: “The indicate quotient of two mathematical expressions and as “The relationship between two or more things’’. It evaluates the financial position and performance of the firm. As started in the beginning many diverse groups of people are interested in analyzing financial information to indicate the operating and financial efficiency and growth of firm. These people use ratios to determine those financial characteristics of firm in which they interested with the help of ratios one can determine.
• The ability of the firm to meet its current obligations.• The extent to which the firm has used its long-term solvency by borrowing funds.• The efficiency with which the firm is utilizing its assets in generating the sales revenue.• The overall operating efficiency and performance of firm.
Alexander wall is the pioneer of ratio analysis. He presented a detailed system of ratio analysis in the year 1919. Ratio analysis is important one for all management accounting for decision making. Ratio analysis of financial statements stands for the process of determining and presenting the relationship of items and groups of items in the statements.• Ratio analysis is a powerful tool of financial analysis. It is a process of identifying the financial
strengths and weakness of the firm by properly establishing the relationship between the different items of balance sheet and profit and loss account for a meaningful understanding of the financial position and performance of the firm.
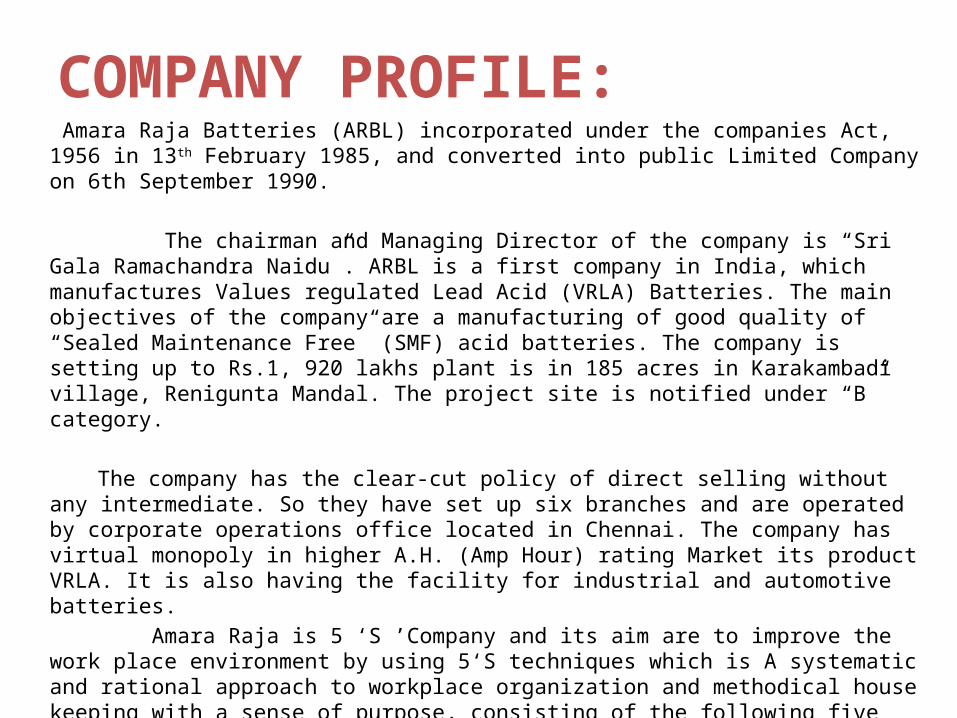
COMPANY PROFILE: Amara Raja Batteries (ARBL) incorporated under the companies Act, 1956 in 13th February 1985, and converted into public Limited Company on 6th September 1990. The chairman and Managing Director of the company is “Sri Gala Ramachandra Naidu”. ARBL is a first company in India, which manufactures Values regulated Lead Acid (VRLA) Batteries. The main objectives of the company are a manufacturing of good quality of “Sealed Maintenance Free” (SMF) acid batteries. The company is setting up to Rs.1, 920 lakhs plant is in 185 acres in Karakambadi village, Renigunta Mandal. The project site is notified under “B” category.
The company has the clear-cut policy of direct selling without any intermediate. So they have set up six branches and are operated by corporate operations office located in Chennai. The company has virtual monopoly in higher A.H. (Amp Hour) rating Market its product VRLA. It is also having the facility for industrial and automotive batteries. Amara Raja is 5 ‘S ’Company and its aim are to improve the work place environment by using 5‘S techniques which is A systematic and rational approach to workplace organization and methodical house keeping with a sense of purpose, consisting of the following five elements
SEIRI - Sort out SEITON -Systematic arrangement
SEISO -Spic and span SEIKETSU -Standardization
SHITSUKI -Self discipline

NEED OF THE STUDY:
The study has great significance and provides benefits to various parties whom directly or indirectly with the company.
To express the relationship between different financial aspects in such a way that it allows the user to draw conclusions about the performance, strengths and weaknesses of the company.
To diagnose the information contained in financial statement so as to judge the profitability of the firm.
The study helps to know a liquidity, solvency, profitability and turnover position of the company.
SCOPE OF THE STUDY:
The scope of the study is limited to collecting financial data published in the annual reports of the company every year. The analysis is done to suggest the possible solutions. The study is carried out for 5 years (2009–14). The present study is confined to only Amara raja batteries Limited only.
OBJECTIVE OF THE STUDY:
To study and analyze the financial position of the Company through ratio analysis
To analyze the profitability position of the ARBL. To determine the long term solvency position of ARBL. To suggest the feasible solution to improve the overall
efficiency of the ARBL.
RESEARCH METHODOLOGY: The main aim of the study is to know the financial performance of the Amara raja batteries limited, Tirupati, Chittoor Dist.
Research
Any efforts which are directed to study of strategy needed to identify the problems and selection of best solutions for better results are known as research.
Research Design
In view of the objects of the study listed above an exploratory research design has been adopted. Exploratory research is one which is largely interprets and already available information and it lays particular emphasis on analysis and interpretation of the existing and available information.
To know the financial status of the company. To know the credit worthiness of the company. To offer suggestions based on research finding.
Data Collection Methods
Primary Data
Information collected from internal guide and finance manager.
Secondary data
Company balance sheet and profit and loss account.
Company’s annual reports
Company websites
www.amararaja.co.in
www.arbl.com
Books
Financial management : I.M. Pandey
Financial management : Prasanna Chandra
TOOLS AND TECHNIQUES Time –series analysis Cross sectional analysis
LIMITATION OF THE STUDY:The following are the limitation of the study
The study was limited to only five years Financial Data. The study is purely based on secondary data which were
taken primarily from Published annual reports of Amararaja batteries Ltd.,
There is no set industry standard for comparison and hence the inference is made on general standards.
The ratio is calculated from past financial statements and these are not indicators of future.
DATA ANALYSIS AND INTERPRETATION
LIQUIDITY RATIO’S: A.CURRENT RATIO
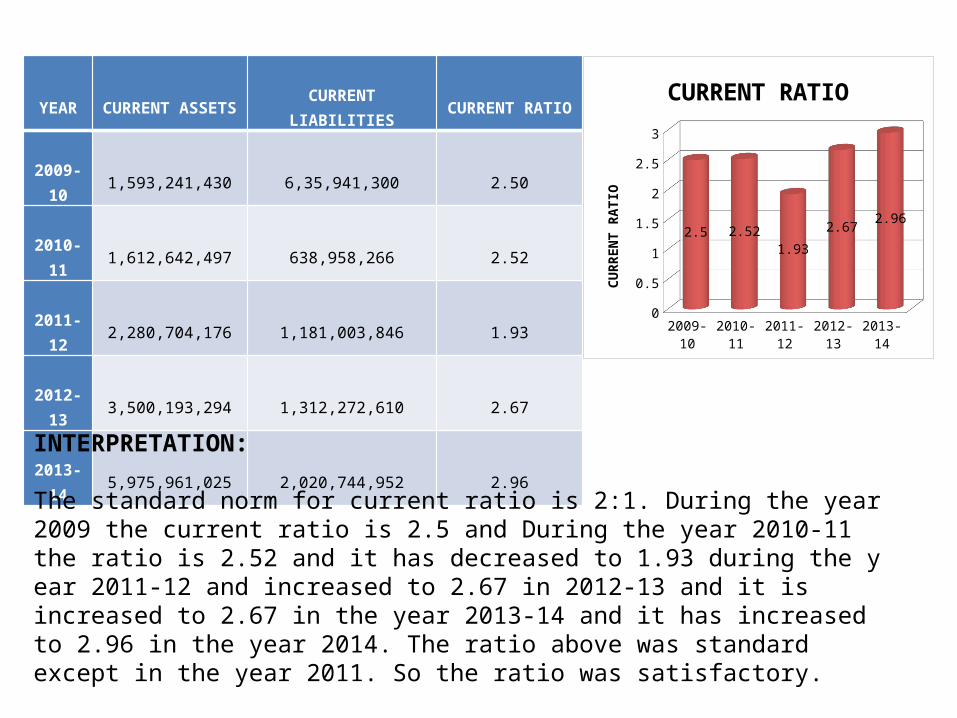
The current ratio is the between all current assets and all current liabilities; another way of expressing liquidity. It is a measure of the firm’s short-term solvency. It indicates the availability of current assets in rupees for every one rupee of current liability. A ratio of greater than one means that the firm has more current assets than current claims against them.
CURRENT ASSETS
CURRENT RATIO= -----------------------------------
CURRENT LIABILITIES
YEAR
CURRENT ASSETS
CURRENT LIABILITIES
CURRENT RATIO
2009-10
1,593,241,430
6,35,941,300
2.50
2010-11
1,612,642,497
638,958,266
2.52
2011-12
2,280,704,176
1,181,003,846
1.93
2012-13
3,500,193,294
1,312,272,610
2.67
2013-14
5,975,961,025
2,020,744,952
2.96
2009-10
2010-11
2011-12
2012-13
2013-14
current ra-tio
2.5 2.52 1.93 2.67 2.96
0.250.75
1.25
1.752.25
2.75
2.5 2.521.93
2.67 2.96
CURRENT RATIO
CURR
ENT
RATI
O
INTERPRETATION: The standard norm for current ratio is 2:1. During the year 2009 the current ratio is 2.5 and During the year 2010-11 the ratio is 2.52 and it has decreased to 1.93 during the y ear 2011-12 and increased to 2.67 in 2012-13 and it is increased to 2.67 in the year 2013-14 and it has increased to 2.96 in the year 2014. The ratio above was standard except in the year 2011. So the ratio was satisfactory.
B. QUICK RATIO
Quick ratio establishes a relationship between quick, or liquid, assets and current liabilities. An asset is liquid if it can be converted into cash immediately or reasonably soon without a loss of value.
QUICK ASSETS QUICK RATIO= -------------------------------- CURRENT LIABILITIES
YEAR
QUICK ASSETS
CURRENT LIABILITIES
QUICK RATIO
2009-
10
1,171,600,450
628,525,100
1.86
2010-
11
1,171,683,584
638,958,266
1.83
2011-
12
1,708,741,955
1,181,003,846
1.45
2012-
13
2,578,479,879
1,312,272,610
1.96
2013-
14
4,032,625,321
2,020,744,952
1.99
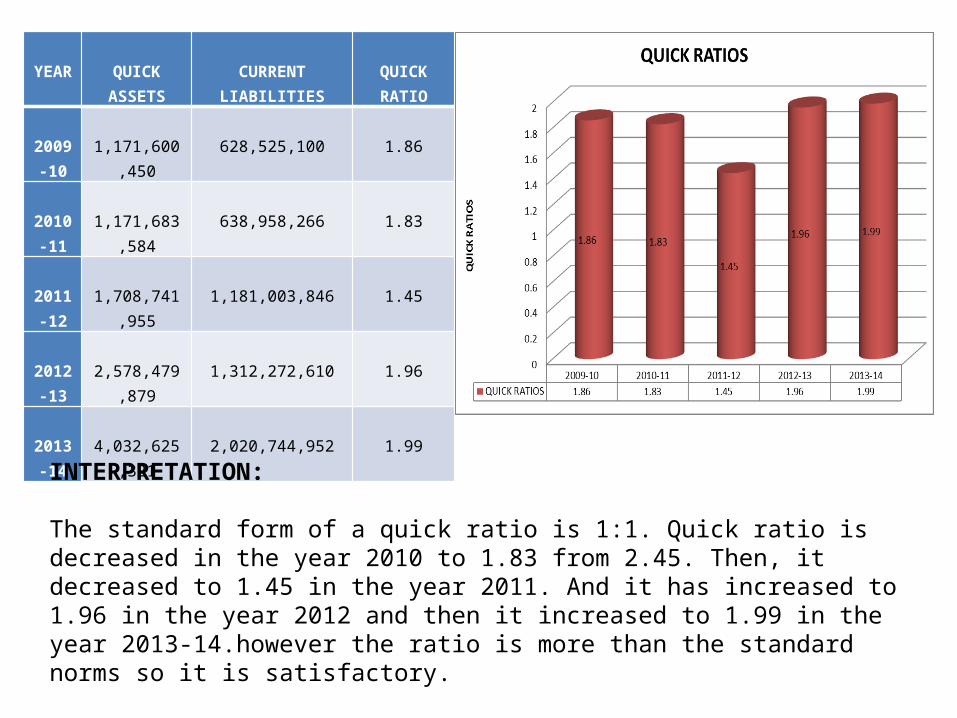
INTERPRETATION: The standard form of a quick ratio is 1:1. Quick ratio is decreased in the year 2010 to 1.83 from 2.45. Then, it decreased to 1.45 in the year 2011. And it has increased to 1.96 in the year 2012 and then it increased to 1.99 in the year 2013-14.however the ratio is more than the standard norms so it is satisfactory.
2.LEVERAGE RATIOS
A. TOTAL DEBT RATIO
TOTAL DEBT TOTAL DEBT RATIO= ------------------------------------------ TOTAL DEBT+ NET WORTH
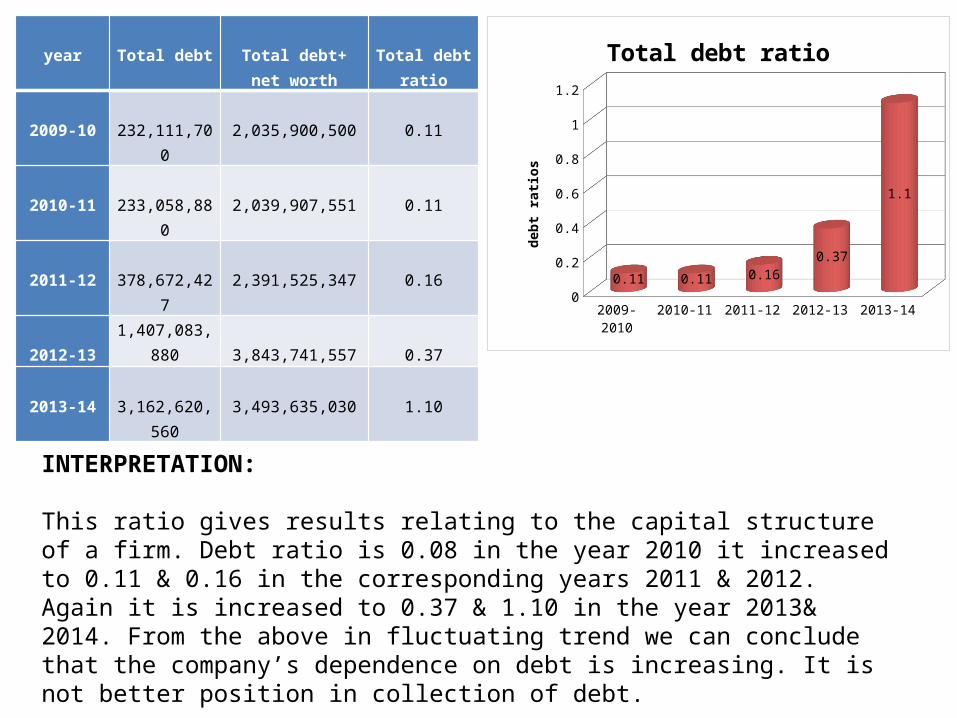
year
Total debt
Total debt+ net
worth
Total debt
ratio
2009-10
232,111,700
2,035,900,500
0.11
2010-11
233,058,880
2,039,907,551
0.11
2011-12
378,672,427
2,391,525,347
0.16
2012-13
1,407,083,880 3,843,741,557
0.37
2013-14
3,162,620,560
3,493,635,030
1.10
2009-2010 2010-11 2011-12 2012-13 2013-14
Total debt ratio
0.11 0.11 0.16 0.37 1.1
0.1
0.3
0.5
0.7
0.9
1.1
0.11 0.11 0.160.37
1.1
Total debt ratio
debt
rati
os
INTERPRETATION: This ratio gives results relating to the capital structure of a firm. Debt ratio is 0.08 in the year 2010 it increased to 0.11 & 0.16 in the corresponding years 2011 & 2012. Again it is increased to 0.37 & 1.10 in the year 2013& 2014. From the above in fluctuating trend we can conclude that the company’s dependence on debt is increasing. It is not better position in collection of debt.
B.DEBT EQUITY RATIO
Debt equity ratio indicates the relationship describing the lenders contribution for each rupee of the owner’s contribution is called debt- equity ratio. Debt equity ratio is computed by dividing Long term Liabilities divided by Equity. Lower debt – equity ratio higher the degree of protection. A debt-equity ratio of 2:1 is considered ideal.
LONG TERM DEBTS
DEBT EQUITY RATIO= ----------------------------------
EQUITY CAPITAL
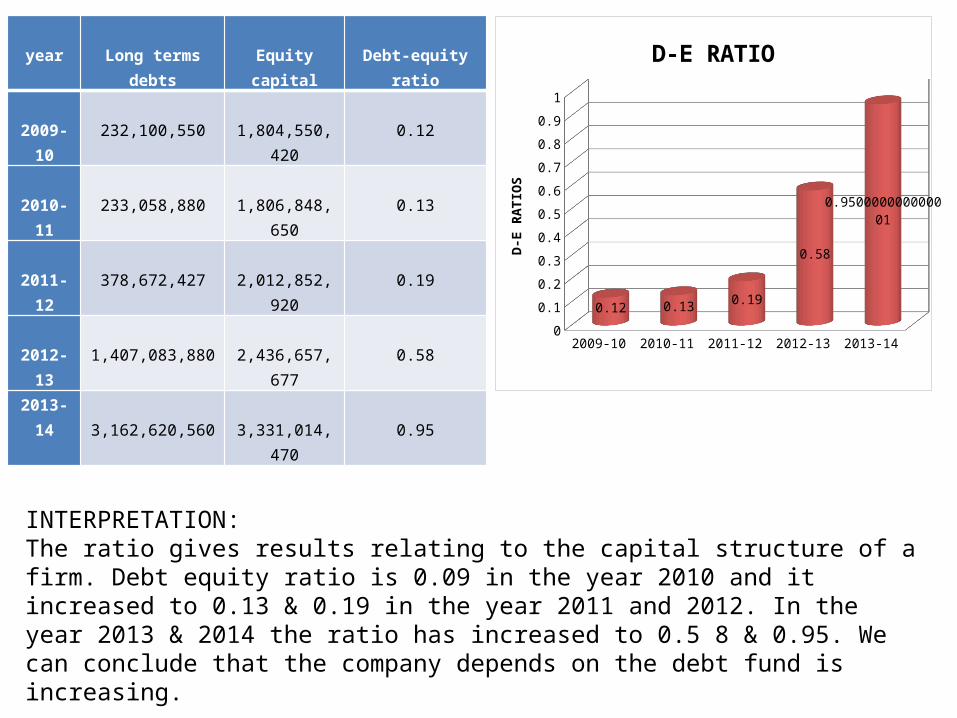
year
Long terms debts
Equity capital
Debt-equity ratio
2009-10
232,100,550
1,804,550,420
0.12
2010-11
233,058,880
1,806,848,650
0.13
2011-12
378,672,427
2,012,852,920
0.19
2012-13
1,407,083,880
2,436,657,677
0.58
2013-14 3,162,620,560
3,331,014,470
0.95
2009-10 2010-11 2011-12 2012-13 2013-14
D-E RATIO 0.12 0.13 0.19 0.58 0.950000000000001
0.05
0.15
0.25
0.35
0.45
0.55
0.65
0.75
0.85
0.95
0.12 0.13 0.19
0.58
0.950000000000001
D-E RATIO
D-E
RATI
OS
INTERPRETATION:The ratio gives results relating to the capital structure of a firm. Debt equity ratio is 0.09 in the year 2010 and it increased to 0.13 & 0.19 in the year 2011 and 2012. In the year 2013 & 2014 the ratio has increased to 0.5 8 & 0.95. We can conclude that the company depends on the debt fund is increasing.

ACTIVITY TATIO :A. INVENTORY TURN OVER RATIO
It indicates the firm efficiency of the firm in producing and selling its product. It is calculated by dividing the cost of goods sold by the average inventory.
COST OF GOODS SOLD INVENTORY TURNOVER RATIO= --------------------------------
AVERAGE INVENTIRY
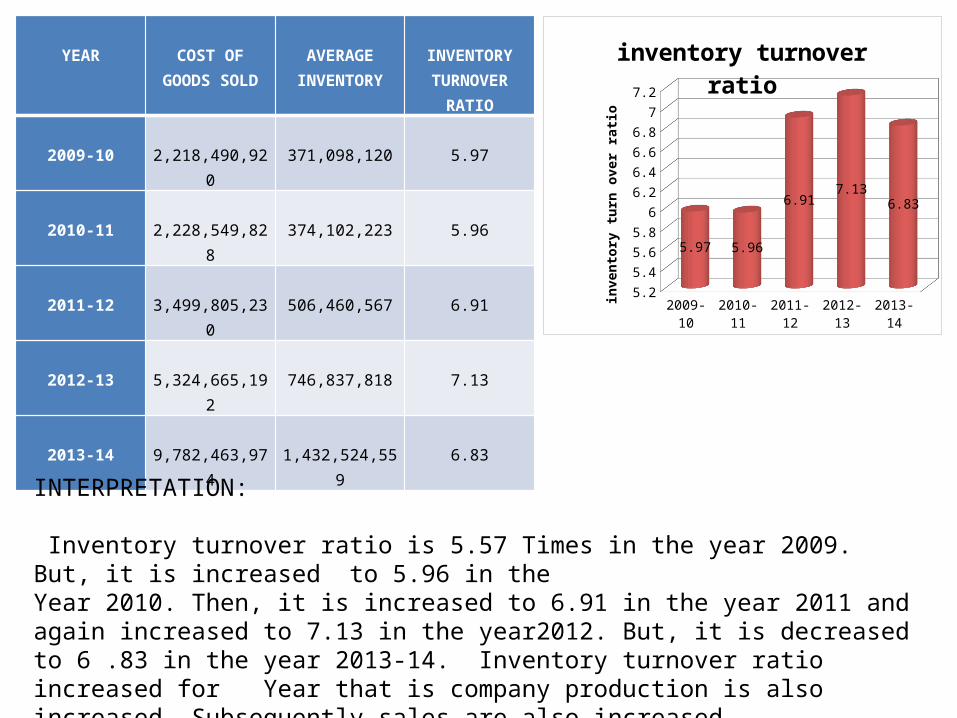
YEAR
COST OF GOODS
SOLD
AVERAGE
INVENTORY
INVENTORY TURNOVER
RATIO
2009-10
2,218,490,920
371,098,120
5.97
2010-11
2,228,549,828
374,102,223
5.96
2011-12
3,499,805,230
506,460,567
6.91
2012-13
5,324,665,192
746,837,818
7.13
2013-14
9,782,463,974
1,432,524,559
6.83
2009-10 2010-11 2011-12 2012-13 2013-14
in-ventory turnover ra-tio
5.97 5.96 6.91 7.13 6.83
5.35.55.75.96.16.36.56.76.97.1
5.97 5.96
6.917.13
6.83
inventory turnover ratio
inve
nto
ry t
urn
ove
r ra
tio
INTERPRETATION: Inventory turnover ratio is 5.57 Times in the year 2009. But, it is increased to 5.96 in theYear 2010. Then, it is increased to 6.91 in the year 2011 and again increased to 7.13 in the year2012. But, it is decreased to 6 .83 in the year 2013-14. Inventory turnover ratio increased for Year that is company production is also increased. Subsequently sales are also increased.
B. DEBTORS TURNOVER RATIO
It is found out by dividing t he credit sales by average debtors. Debtor’s turnover indicates the number of times debtor’s turnover each year.
salesDebtors turnover ratio=------------------------------ Average debtors

year
sales
Average debtors
Debtors turnover
ratio
2009-10
2,596,350,100
550,720,552
4.71
2010-11
2,685,436,096
560,689,881
4.79
2011-12
4,458,29 5,779
753,113,338
5.92
2012-13
7,451,03 2,998
1 ,158,032,767 6.43
2013-14
13,499,867,499
1 ,862,113,498 7.25
2009-10 2010-11 2011-12 2012-13 2013-14
DEBTORS TURNOVER RA-TIO
4.71 4.79 5.92 6.43 7.25
0.5
1.5
2.5
3.5
4.5
5.5
6.5
7.5
4.71 4.795.92 6.43
7.25
DEBTORS TURNOVER RATIO
DEB
TOR
S TU
RN
OV
ER R
ATI
O
INTERPRETATION: Debtor’s turnover ratio is 4.71 times in the year 2010 and it is increased to 4.7 9 times in the year 2011 and increased to 5.92 times in the year 2012 and it increased t o 6.43 times &7.25 times in the years 2013 &2014.
PROFITABILITY RATIOS
A. GROSS PROFIT RATIO:
This ratio shows that the margin left after meeting manufacturing costs. It measures the efficiency of production as well as pricing.
GROSS PROFIT
GROSS PROFIT RATIO= ----------------------------
NET SALES
Gross profit= Net sales-Cost of goods sold
Cost of goods sold= Opening stock+ material consumed+ mfg .exp- closing stock
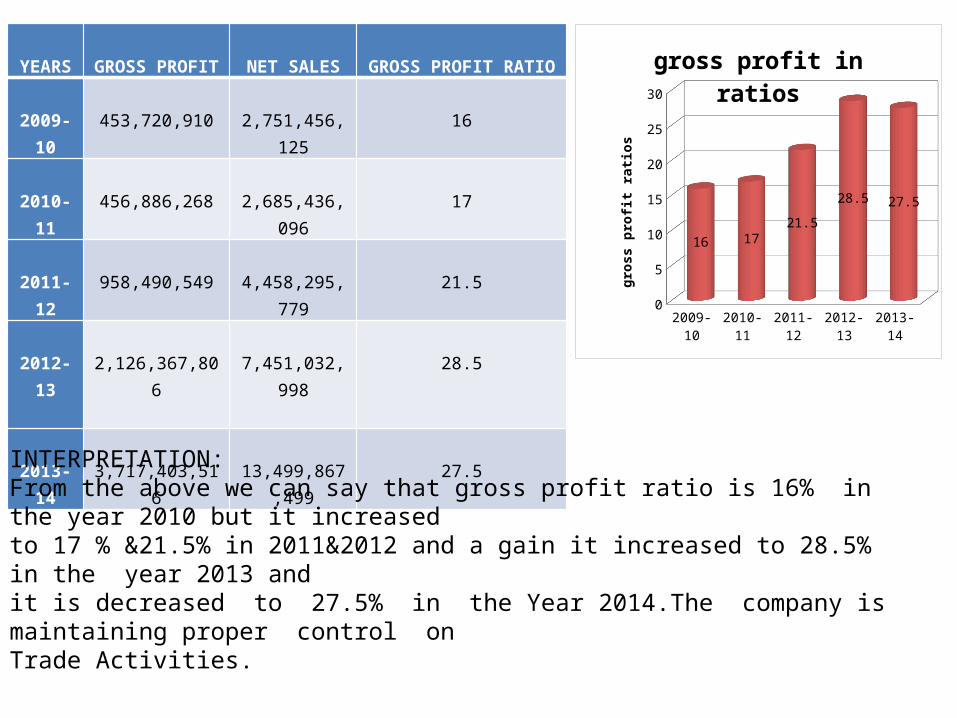
YEARS
GROSS PROFIT
NET SALES
GROSS PROFIT RATIO
2009-10
453,720,910
2,751,456,125
16
2010-11
456,886,268
2,685,436,096
17
2011-12
958,490,549
4,458,295,779
21.5
2012-13
2,126,367,806
7,451,032,998
28.5
2013-14
3,717,403,516
13,499,867,499
27.5
2009-10 2010-11 2011-12 2012-13 2013-14
gross profit in ra-tios
16 17 21.5 28.5 27.5
2.5
7.5
12.5
17.5
22.5
27.5
16 1721.5
28.5 27.5
gross profit in ratios
gro
ss p
rofi
t ra
tio
s
INTERPRETATION:From the above we can say that gross profit ratio is 16% in the year 2010 but it increasedto 17 % &21.5% in 2011&2012 and a gain it increased to 28.5% in the year 2013 andit is decreased to 27.5% in the Year 2014.The company is maintaining proper control onTrade Activities.
B. NET PROFIT RATIO
This ratio also indicates the firm's capacity to wit h stand adverse economic conditions. A firm with a high net margin ratio would be in an advantageous position to survive in the face falling selling prices, rising costs of production or declining demand for the product.
NET PROFIT NET PROFIT RATIO= -------------------------- NET SALES
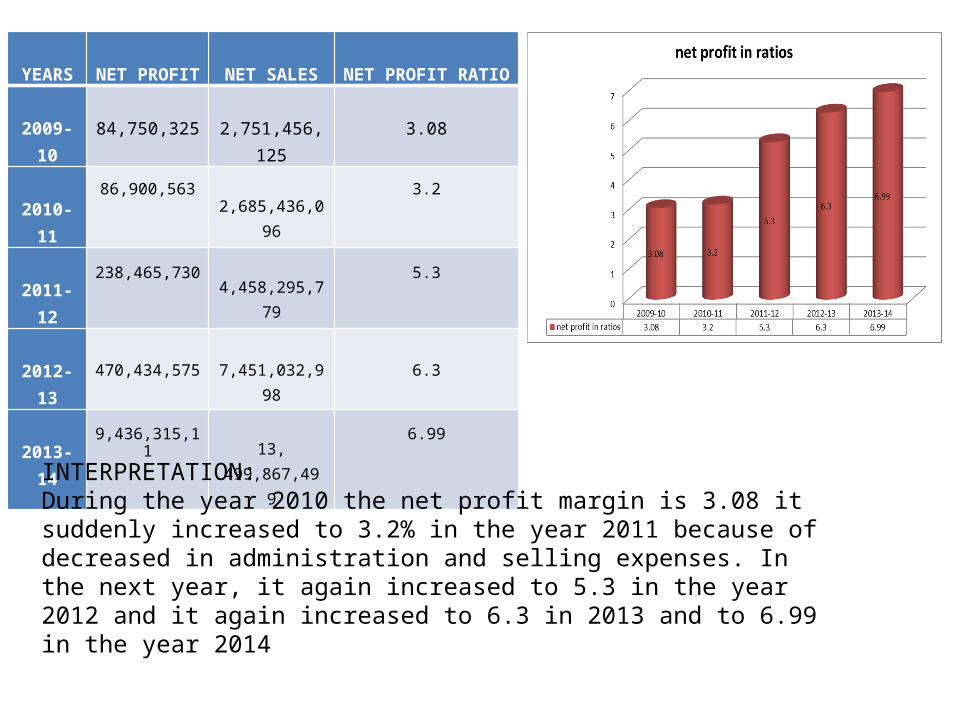
YEARS
NET PROFIT
NET SALES
NET PROFIT RATIO
2009-10
84,750,325
2,751,456,125
3.08
2010-11
86,900,563
2,685,436,096
3.2
2011-12
238,465,730
4,458,295,779
5.3
2012-13
470,434,575
7,451,032,998
6.3
2013-14
9,436,315,11
13, 499,867,49 9
6.99
INTERPRETATION:During the year 2010 the net profit margin is 3.08 it suddenly increased to 3.2% in the year 2011 because of decreased in administration and selling expenses. In the next year, it again increased to 5.3 in the year 2012 and it again increased to 6.3 in 2013 and to 6.99 in the year 2014
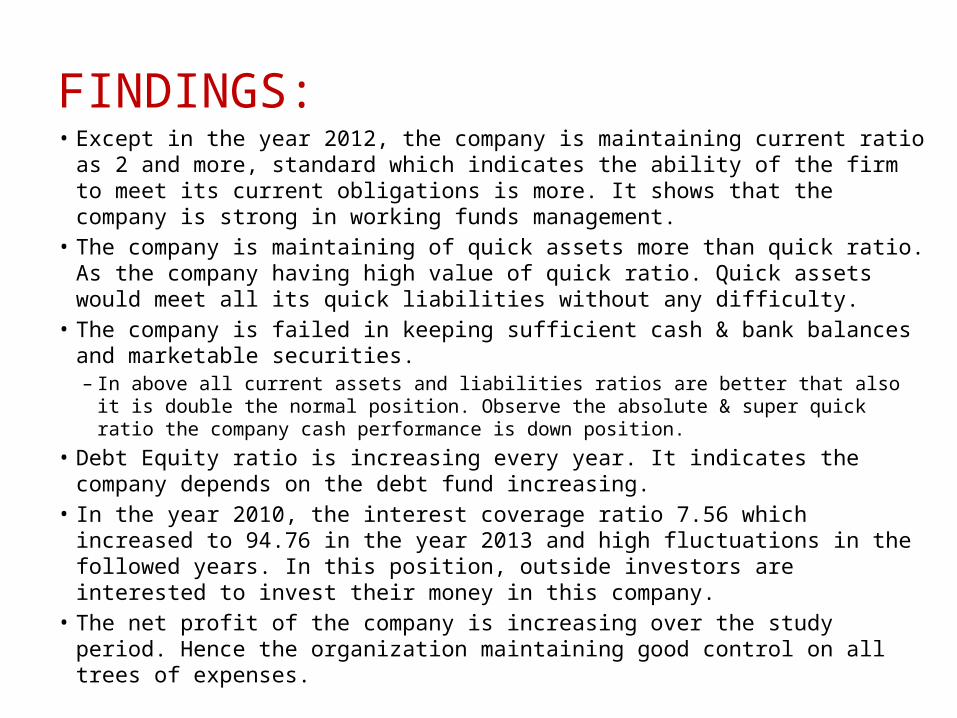
FINDINGS:• Except in the year 2012, the company is maintaining current ratio as 2 and more,
standard which indicates the ability of the firm to meet its current obligations is more. It shows that the company is strong in working funds management.
• The company is maintaining of quick assets more than quick ratio. As the company having high value of quick ratio. Quick assets would meet all its quick liabilities without any difficulty.
• The company is failed in keeping sufficient cash & bank balances and marketable securities.– In above all current assets and liabilities ratios are better that also it is double the normal
position. Observe the absolute & super quick ratio the company cash performance is down position.
• Debt Equity ratio is increasing every year. It indicates the company depends on the debt fund increasing.
• In the year 2010, the interest coverage ratio 7.56 which increased to 94.76 in the year 2013 and high fluctuations in the followed years. In this position, outside investors are interested to invest their money in this company.
• The net profit of the company is increasing over the study period. Hence the organization maintaining good control on all trees of expenses.
CONCLUSION:
From the above analysis of the company’s financial statements it’s concluded that the company’s financial position is good because the company’s leverage, activity and profitability positions are good and the company have to increase its liquidity position for better performance in future.

THANK YOU……