Embed Size (px)
Citation preview
Ratio Analysis
LO. Define & provide examples of the 5 main financial ratios.
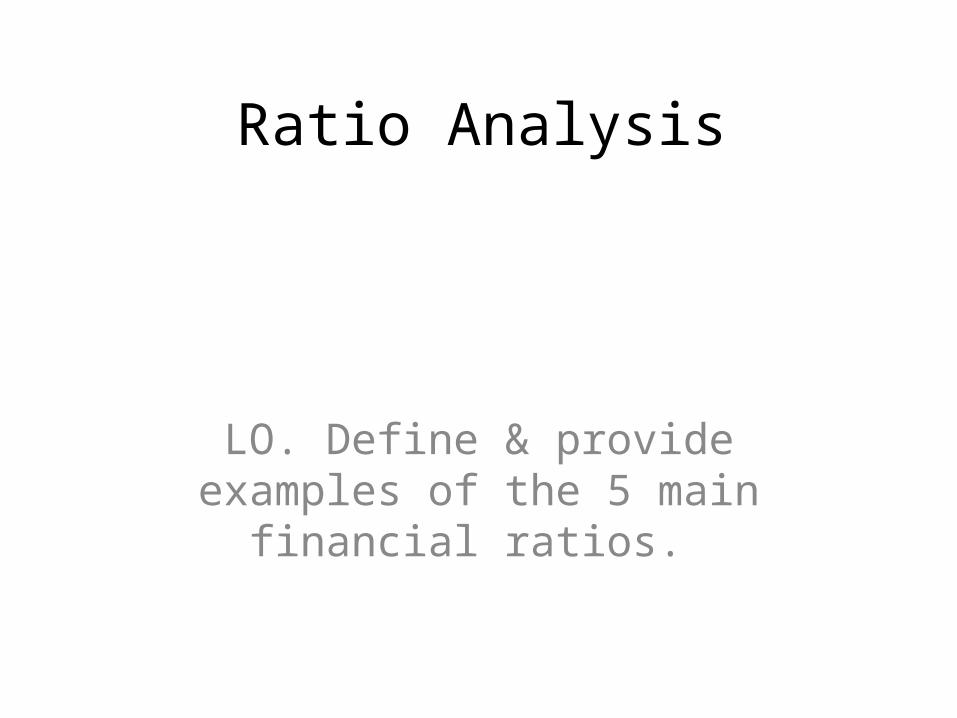
RatiosRatios are used to measure and compare performance and liquidity of a business.
Ratio analysis
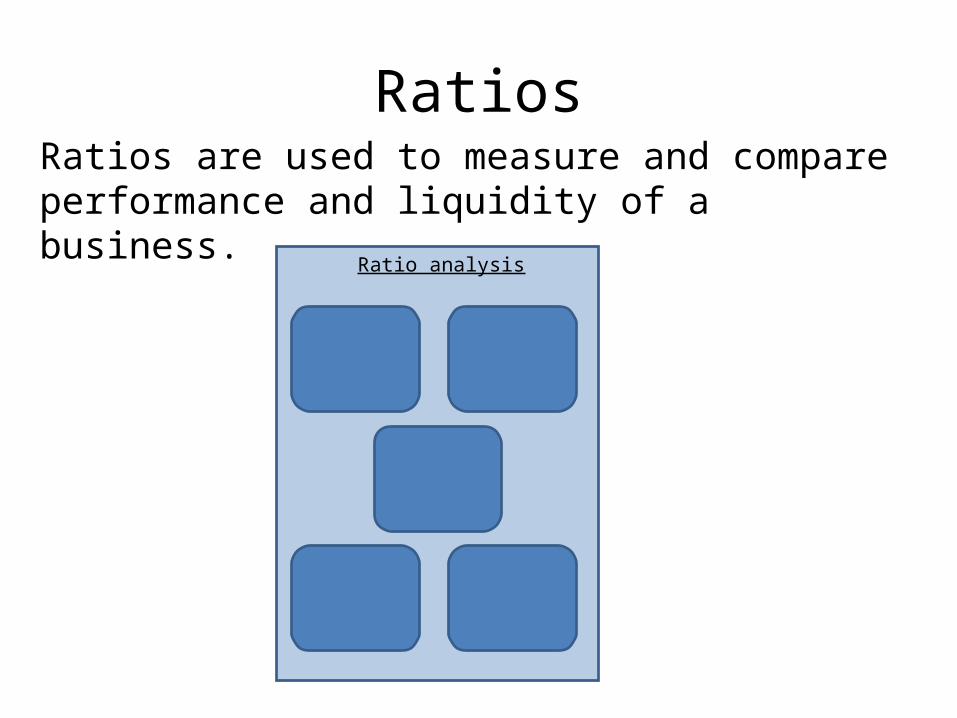
Performance ratiosReturn on capital employed
ROCE (%) = Operating profitCapital employed X 100
Shows how successful the managers are at earning a profit from capital used in the business.
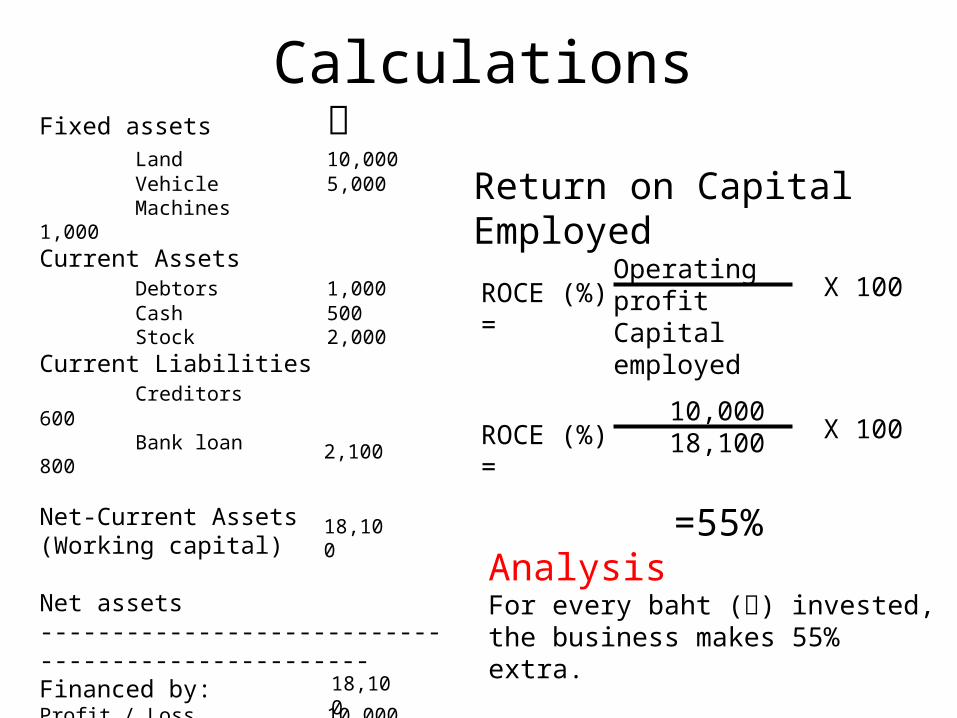
CalculationsFixed assets ฿
Land 10,000Vehicle 5,000Machines 1,000
Current AssetsDebtors 1,000Cash 500Stock 2,000
Current LiabilitiesCreditors 600Bank loan 800
Net-Current Assets(Working capital)
Net assets---------------------------------------------------Financed by:Profit / Loss 10,000Share capital 8,100
Capital employed
2,100
18,100
18,100
Return on Capital Employed
ROCE (%) = Operating profitCapital employed X 100
ROCE (%) = 10,00018,100 X 100
=55%Analysis For every baht (฿) invested, the business makes 55% extra.
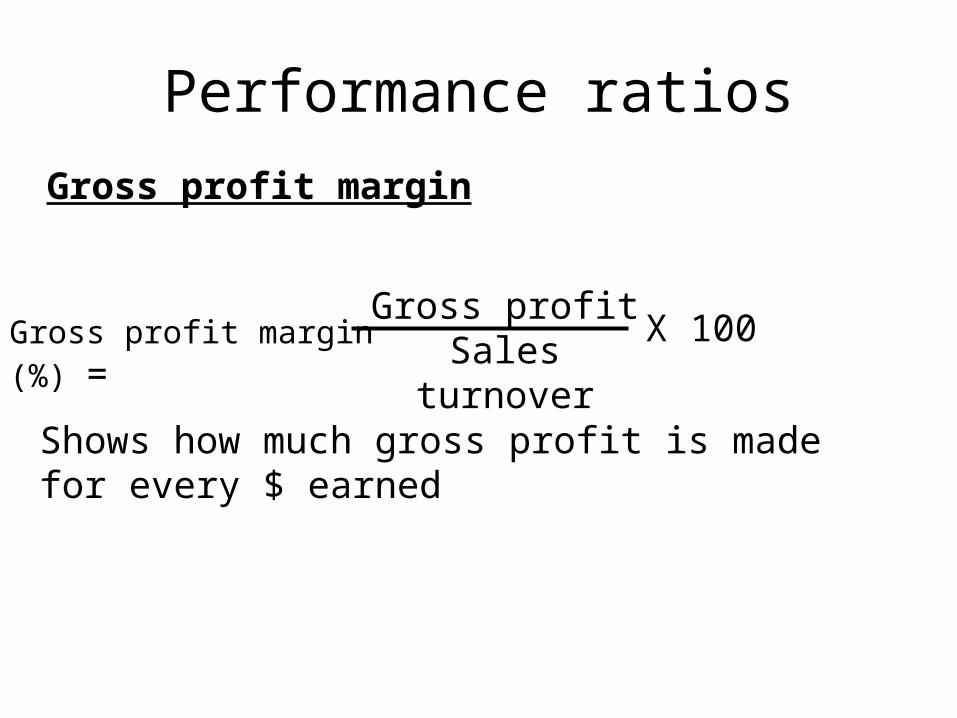
Performance ratiosGross profit margin
Gross profit margin (%) = Gross profit
Sales turnover X 100
Shows how much gross profit is made for every $ earned
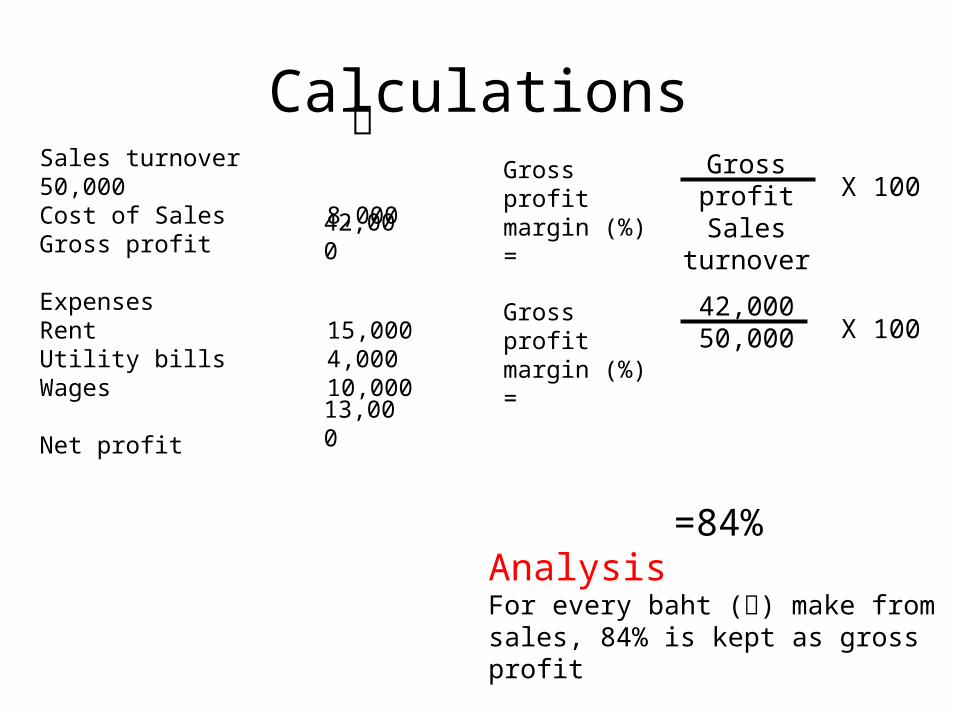
Calculations ฿Sales turnover 50,000Cost of Sales 8,000Gross profit
ExpensesRent 15,000Utility bills 4,000Wages 10,000
Net profit
42,000
13,000
Gross profit margin (%) =
Gross profitSales turnover X 100
Gross profit margin (%) =
42,00050,000 X 100
=84%Analysis For every baht (฿) make from sales, 84% is kept as gross profit
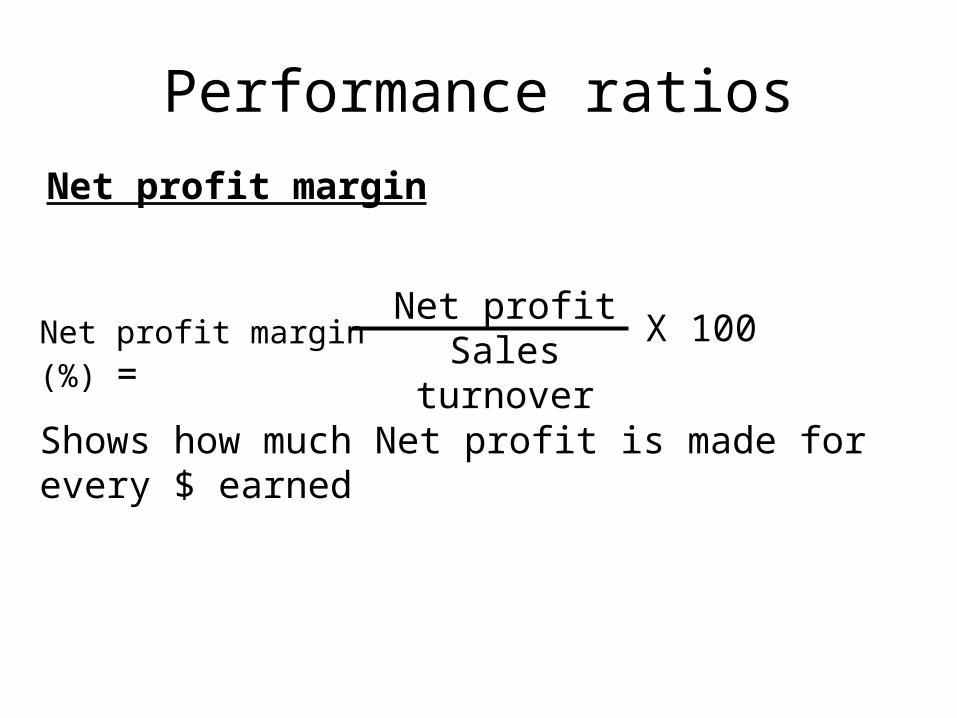
Performance ratiosNet profit margin
Net profit margin (%) = Net profit
Sales turnover X 100
Shows how much Net profit is made for every $ earned
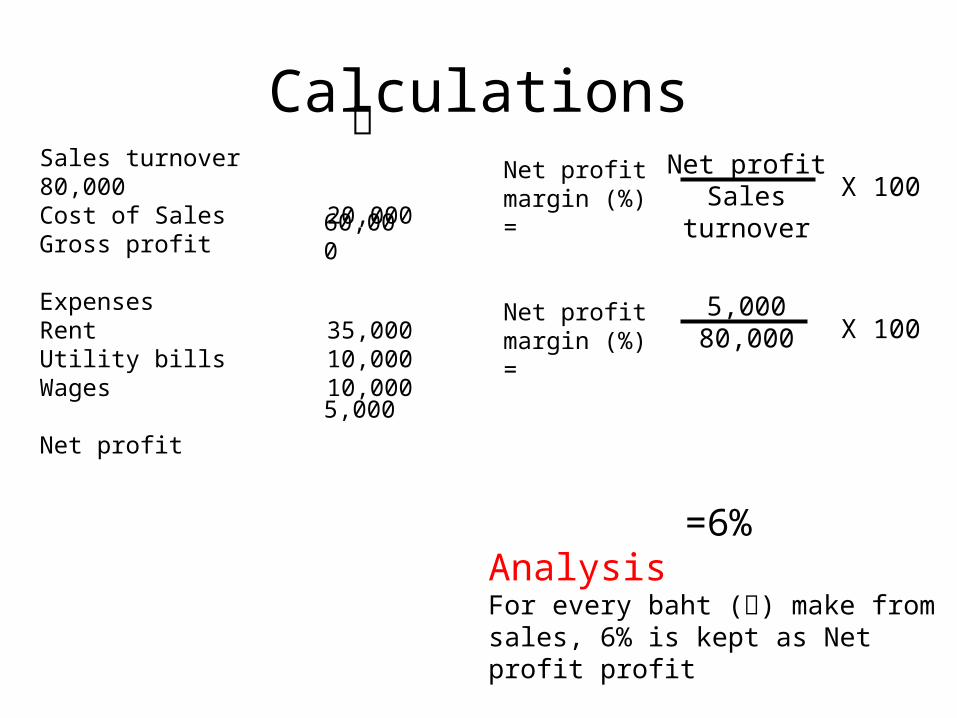
Calculations ฿Sales turnover 80,000Cost of Sales 20,000Gross profit
ExpensesRent 35,000Utility bills 10,000Wages 10,000
Net profit
60,000
5,000
Net profitmargin (%) =
Net profitSales turnover X 100
Net profitmargin (%) =
5,00080,000 X 100
=6%Analysis For every baht (฿) make from sales, 6% is kept as Net profit profit
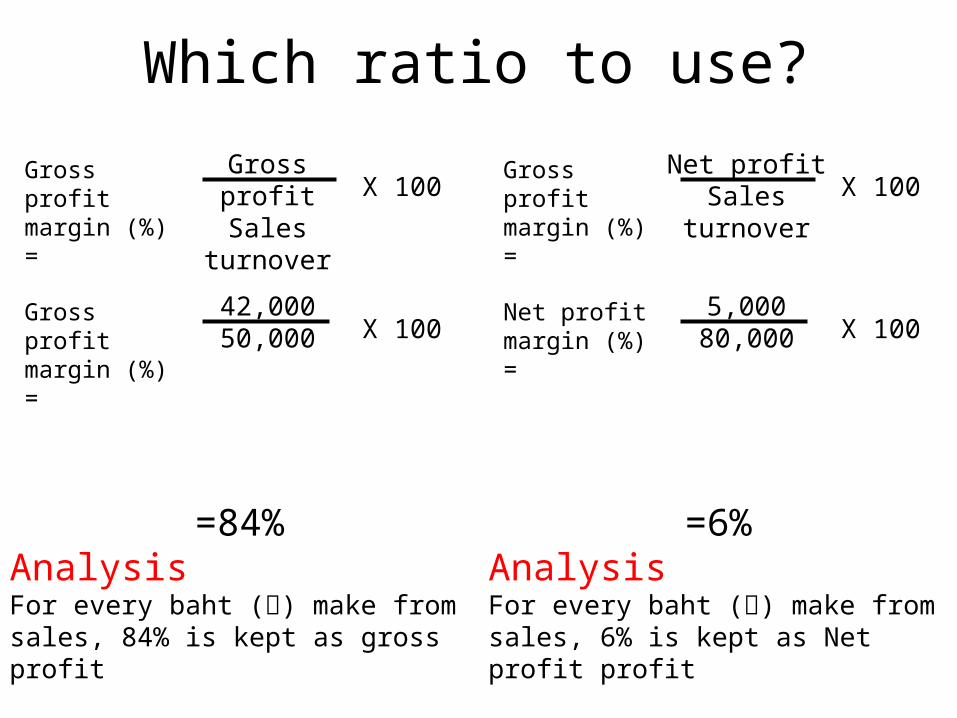
Which ratio to use?
Gross profit margin (%) =
Gross profitSales turnover X 100
Gross profit margin (%) =
42,00050,000 X 100
=84%Analysis For every baht (฿) make from sales, 84% is kept as gross profit
Gross profit margin (%) =
Net profitSales turnover X 100
Net profitmargin (%) =
5,00080,000 X 100
=6%Analysis For every baht (฿) make from sales, 6% is kept as Net profit profit
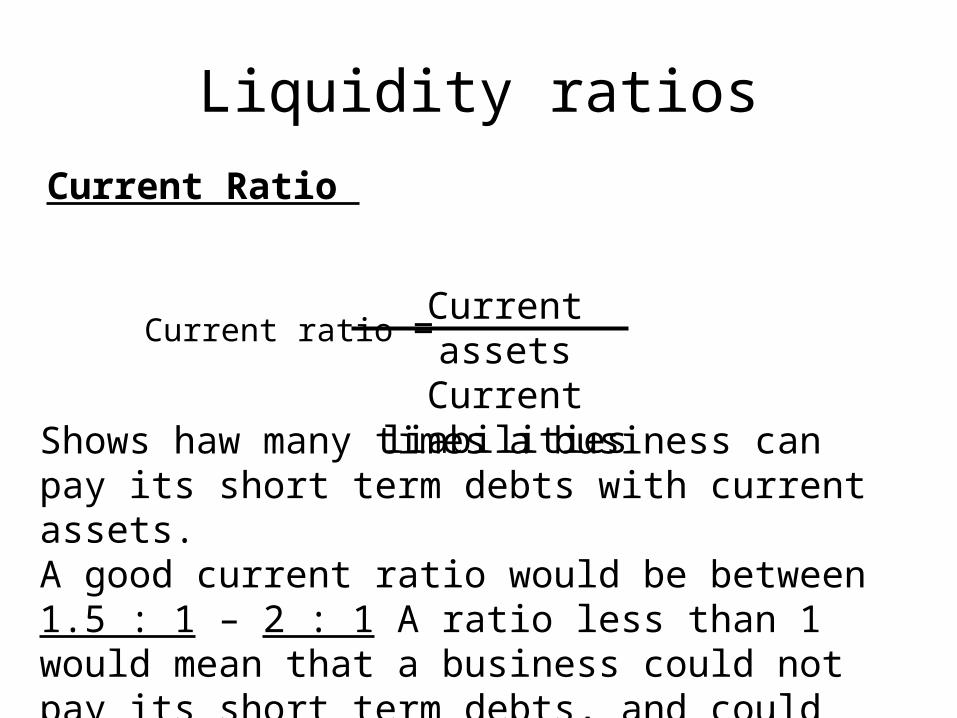
Liquidity ratiosCurrent Ratio
Current ratio = Current assetsCurrent liabilities
Shows haw many times a business can pay its short term debts with current assets.A good current ratio would be between 1.5 : 1 – 2 : 1 A ratio less than 1 would mean that a business could not pay its short term debts, and could be forced to cease trading. (It has no working capital)
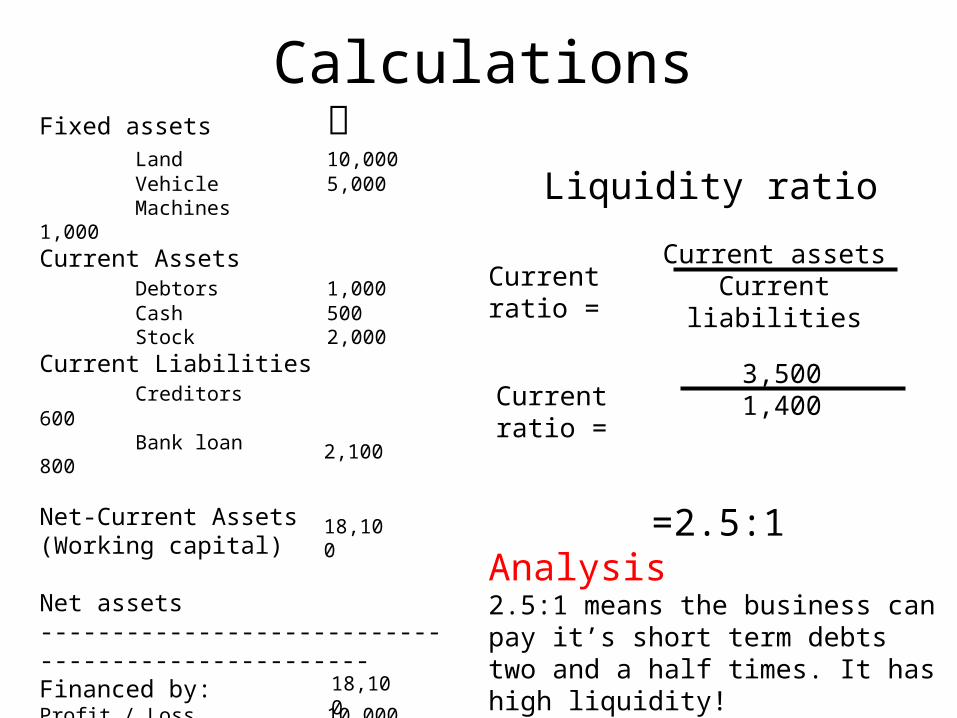
CalculationsFixed assets ฿
Land 10,000Vehicle 5,000Machines 1,000
Current AssetsDebtors 1,000Cash 500Stock 2,000
Current LiabilitiesCreditors 600Bank loan 800
Net-Current Assets(Working capital)
Net assets---------------------------------------------------Financed by:Profit / Loss 10,000Share capital 8,100
Capital employed
2,100
18,100
18,100
Liquidity ratio
=2.5:1Analysis 2.5:1 means the business can pay it’s short term debts two and a half times. It has high liquidity!
Current ratio = Current assets
Current liabilities
Current ratio = 3,5001,400
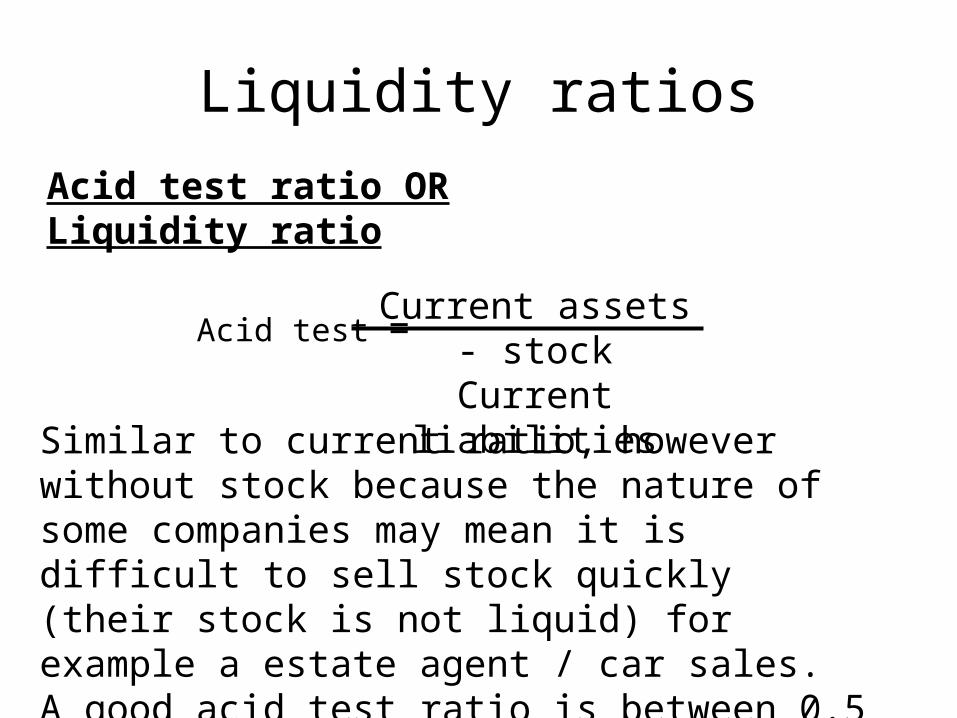
Liquidity ratiosAcid test ratio OR Liquidity ratio
Acid test = Current assets - stockCurrent liabilities
Similar to current ratio, however without stock because the nature of some companies may mean it is difficult to sell stock quickly (their stock is not liquid) for example a estate agent / car sales. A good acid test ratio is between 0.5 : 1 – 1 : 1
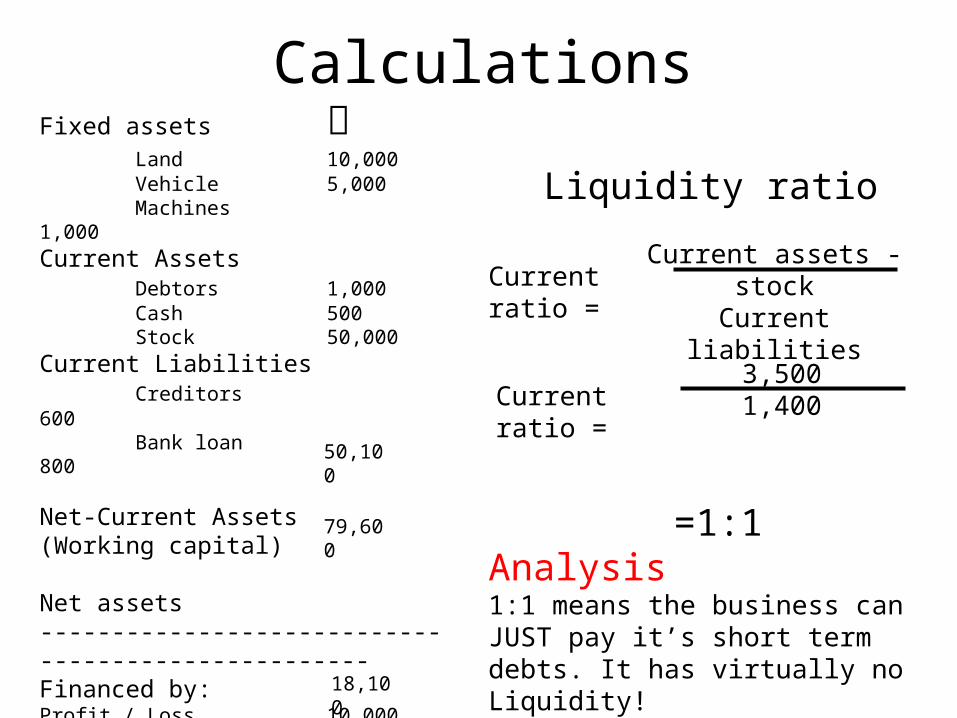
CalculationsFixed assets ฿
Land 10,000Vehicle 5,000Machines 1,000
Current AssetsDebtors 1,000Cash 500Stock 50,000
Current LiabilitiesCreditors 600Bank loan 800
Net-Current Assets(Working capital)
Net assets---------------------------------------------------Financed by:Profit / Loss 10,000Share capital 8,100
Capital employed
50,100
79,600
18,100
Liquidity ratio
=1:1Analysis 1:1 means the business can JUST pay it’s short term debts. It has virtually no Liquidity!
Current ratio = Current assets - stock
Current liabilities
Current ratio = 3,5001,400
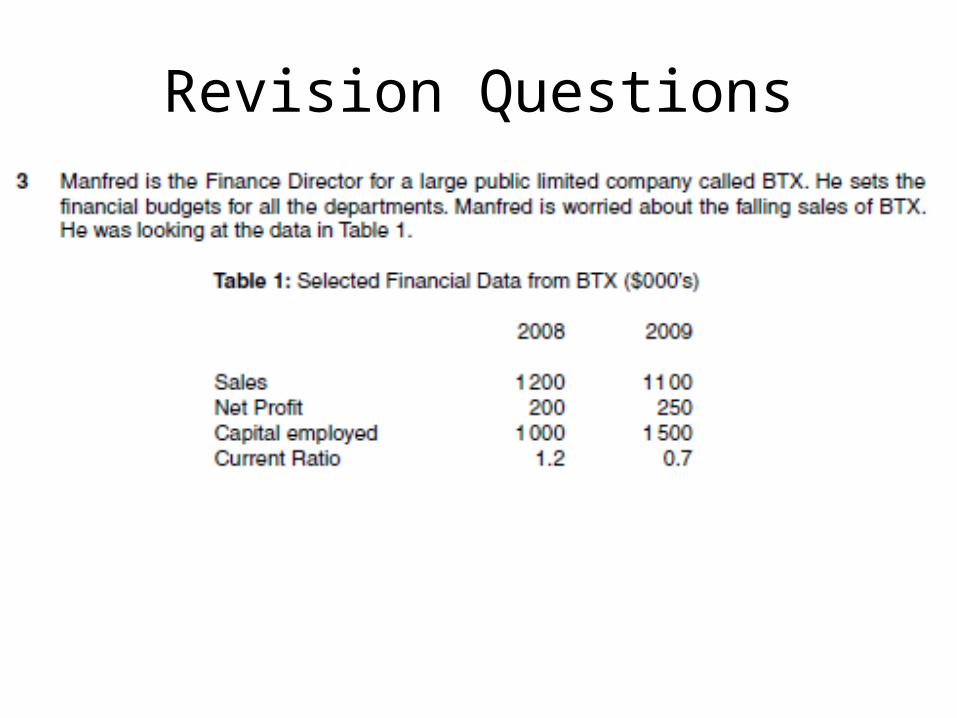
Revision Questions
What is meant by a financial budget? [2]
A financial budget is a numerical/quantitative plan showing future financial targets (goals orlimits) for a specific time period. [2]
Think, Pair, Share... Write your answer on your white board
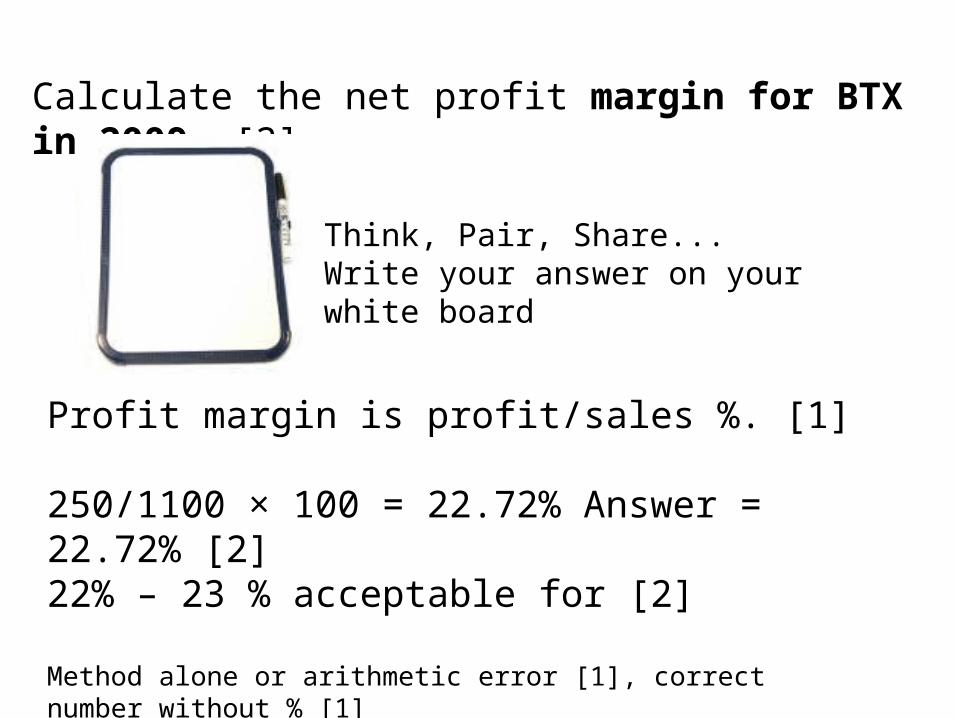
Calculate the net profit margin for BTX in 2009. [2]
Profit margin is profit/sales %. [1]
250/1100 × 100 = 22.72% Answer = 22.72% [2]22% – 23 % acceptable for [2]
Method alone or arithmetic error [1], correct number without % [1]If figures for 2008 are used (correctly) then 1 method mark could be available.
Think, Pair, Share... Write your answer on your white board
Explain what the current ratio tells Manfred about BTX’s financial position. [4]
Think, Pair, Share... Write your answer on your white board
Knowledge of current ratio can be shown by indicating what it is or how it is calculated [2]
An answer that simply says ‘shows current assets and current liabilities of a business’ [1]
Analysis of usefulness: analysis implies saying something about what the change means toBTX using the data [2]
So an answer that says ‘the figure has changed from 1.2 to 0.7’ is merely a description not an analysis and therefore would not be given a mark.
Current ratio is a measure of the relationship between
current assets and short-term debts. It is a liquidity test
designed to show the ease by which a company can pay
debts on demand. (How easily assets can be turned in to
cash). A fall in the ratio shows a decline in liquidity and
therefore is not seen as a good thing because it implies
that not all short-term debts can be met quickly.
Knowledge of current ratio [2]Analysis of usefulness [2]
Do you think that the management of BTX should be worried about the performance of the company in 2009? Justify your answer. [6]
Think, Pair, Share... Write your answer on your white board
• sales fall (8.3%) bad• net profit rise (25%) good• profit margin rise (16.6 % to 22.72%) good• return on capital (ROCE) down (20% to 16.6%) bad• current ratio down (below safe levels) bad
Identification of directional changes in relevant indicators of BTX’s success [2] (The sales have fallen by 8.3%, this suggests the management should be worried about the performance because…
Analysis of data [2] Interpretation of the information could be quantitative or qualitative (However, net profits have risen…)
Evaluative comment [2] This will involve a positive assertion supported by a justification comment based on the analysis. Therefore I think they should be worried because… ROCE OR I think they should not be worried because… PROFIT MARGIN