Embed Size (px)
Citation preview
RATING ISSUES OF CMBS STRUCTURES
by
Dmitry Dorokhov
B.Bus.Admin., The Tax Academy of Russian Federation, 2006
Sandeep Jadeja
B.Math, University of Waterloo, 2003
PROJECT SUBMITTED IN PARTIAL FULFILLMENT
OF THE REQUIREMENTS FOR THE DEGREE OF
MASTER OF ARTS
In the Faculty
of
Business Administration
Financial Risk Management Program
Dmitry Dorokhov and Sandeep Jadeja 2008
SIMON FRASER UNIVERSITY
Summer 2008
All rights reserved. This work may not be reproduced in whole or in part,
by photocopy or other means, without permission of the authors.

2
APPROVAL
Name: Dmitry Dorokhov and Sandeep Jadeja
Degree: Master of Arts
Title of Project: Rating Issues of CMBS Structures
Supervisory Committee:
__________________________________________
Andrey Pavlov
Senior Supervisor
Associate Professor of Finance
__________________________________________
Anton Theunissen
Second Reader
Professor of Finance
Date Approved: __________________________________________
3
Table of Contents
Executive Summary 3
Part I. Empirical Analysis 4
CMBS – Outline 4
The Role of Rating Agencies 5
Part II Models, Results and Conclusions 8
Data Specification and General Assumptions 8
Average Spreads Model Introduction 9
o Average Spreads Model Results 10
o Average Spreads Model Conclusions 10
Regression Models and Models Parameters Introduction 12
o Regression Results –Initial Regression Model 14
o Regression Results –Secondary Regression Model 16
o Conclusions on the Initial and Secondary Regression Models 17
Conclusion 19
Appendix 21
Bibliography 27

4
Executive Summary
Our paper examines the reliability of ratings assigned to Commercial Mortgage Backed
Securities (CMBS) by Credit Rating Agencies (CRA) and tries to define other factors, except ratings, that
can influence the spreads on CMBS.
The first part of the paper contains a general discussion about the CMBS market and about
rating issues that are related to CMBSs. General assumptions and empirical conclusions about the
reliability of ratings are drawn. A comparison between CMBS markets and residential mortgage backed
securities market is also provided.
The second part of the paper contains models, data description and numerical analysis, which is
created to prove empirical observations from our first part. Average spread model provides an insight
about the general dynamics of spreads for differently rated securities. This model tries to define other
general factors that can affect spreads. Regression models elaborate on the numerical results and try to
test whether some other factors that are closely related to the issuance or collateral can potentially
influence spreads. Conclusions for each of the models are provided in the end of the second part.
The last part of the paper contains general conclusions based on the performed analysis. We
also summarized all of the previous observations put together in a coherent inference.
5
Part 1: Empirical analysis
CMBS Outline
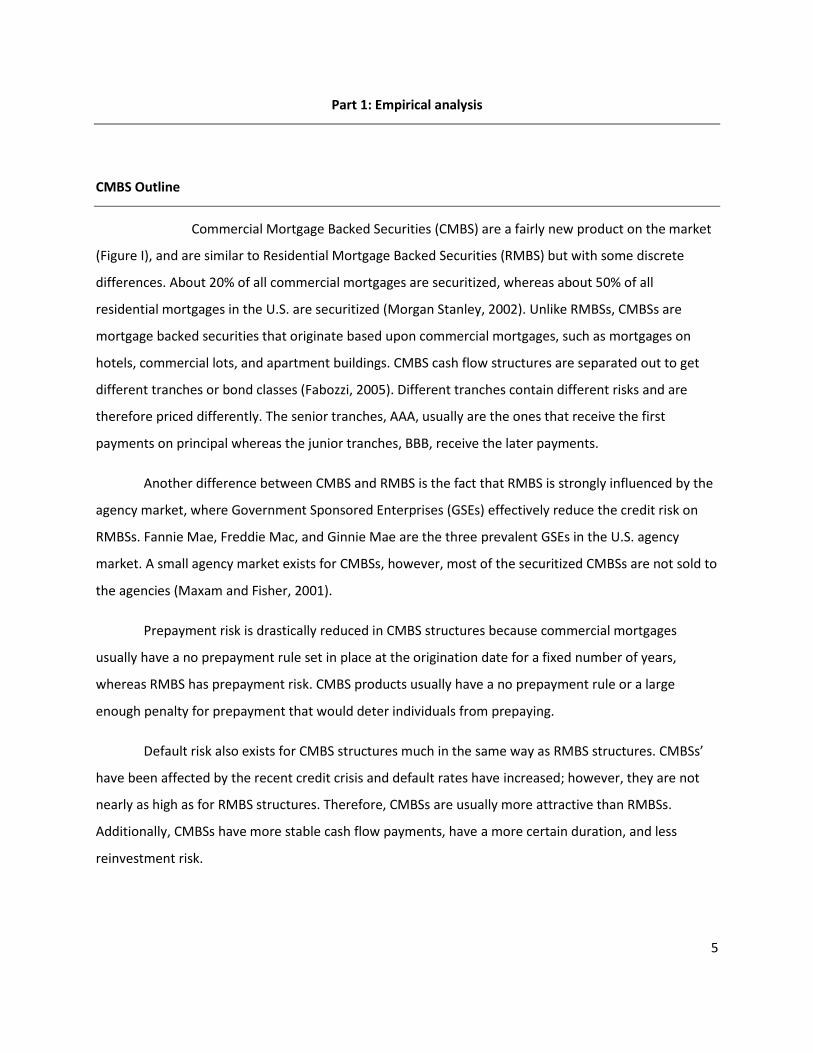
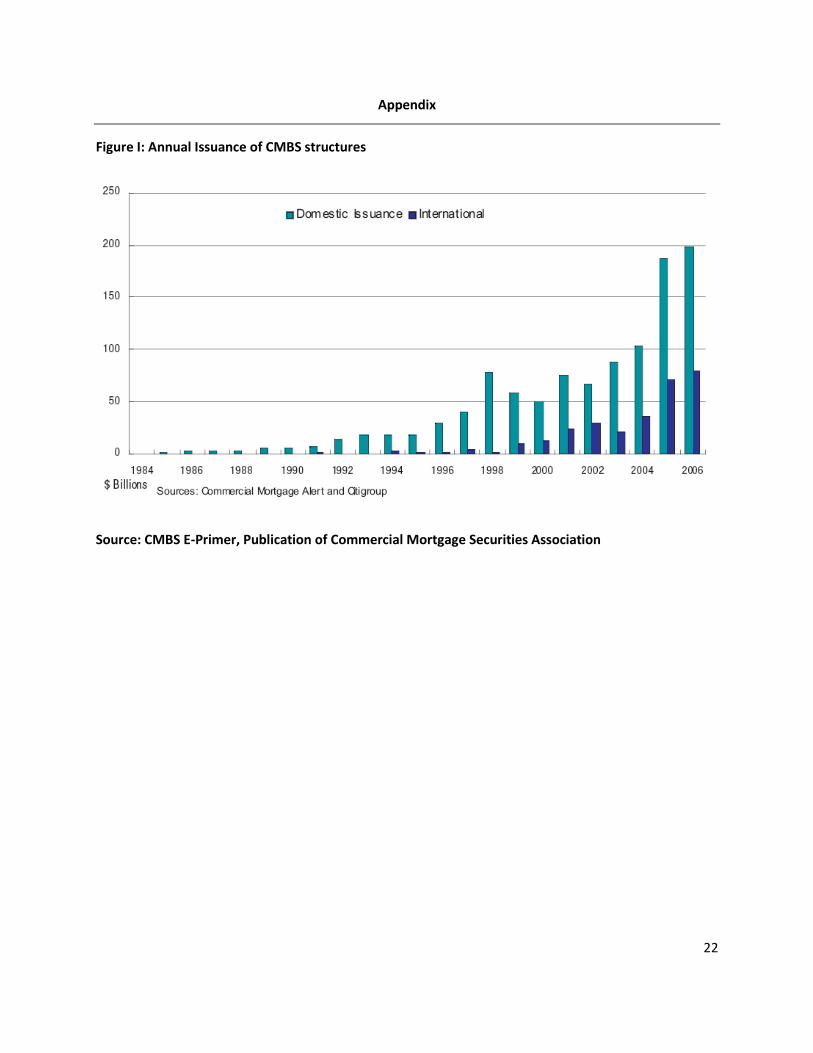
Commercial Mortgage Backed Securities (CMBS) are a fairly new product on the market
(Figure I), and are similar to Residential Mortgage Backed Securities (RMBS) but with some discrete
differences. About 20% of all commercial mortgages are securitized, whereas about 50% of all
residential mortgages in the U.S. are securitized (Morgan Stanley, 2002). Unlike RMBSs, CMBSs are
mortgage backed securities that originate based upon commercial mortgages, such as mortgages on
hotels, commercial lots, and apartment buildings. CMBS cash flow structures are separated out to get
different tranches or bond classes (Fabozzi, 2005). Different tranches contain different risks and are
therefore priced differently. The senior tranches, AAA, usually are the ones that receive the first
payments on principal whereas the junior tranches, BBB, receive the later payments.
Another difference between CMBS and RMBS is the fact that RMBS is strongly influenced by the
agency market, where Government Sponsored Enterprises (GSEs) effectively reduce the credit risk on
RMBSs. Fannie Mae, Freddie Mac, and Ginnie Mae are the three prevalent GSEs in the U.S. agency
market. A small agency market exists for CMBSs, however, most of the securitized CMBSs are not sold to
the agencies (Maxam and Fisher, 2001).
Prepayment risk is drastically reduced in CMBS structures because commercial mortgages
usually have a no prepayment rule set in place at the origination date for a fixed number of years,
whereas RMBS has prepayment risk. CMBS products usually have a no prepayment rule or a large
enough penalty for prepayment that would deter individuals from prepaying.
Default risk also exists for CMBS structures much in the same way as RMBS structures. CMBSs’
have been affected by the recent credit crisis and default rates have increased; however, they are not
nearly as high as for RMBS structures. Therefore, CMBSs are usually more attractive than RMBSs.
Additionally, CMBSs have more stable cash flow payments, have a more certain duration, and less
reinvestment risk.
6
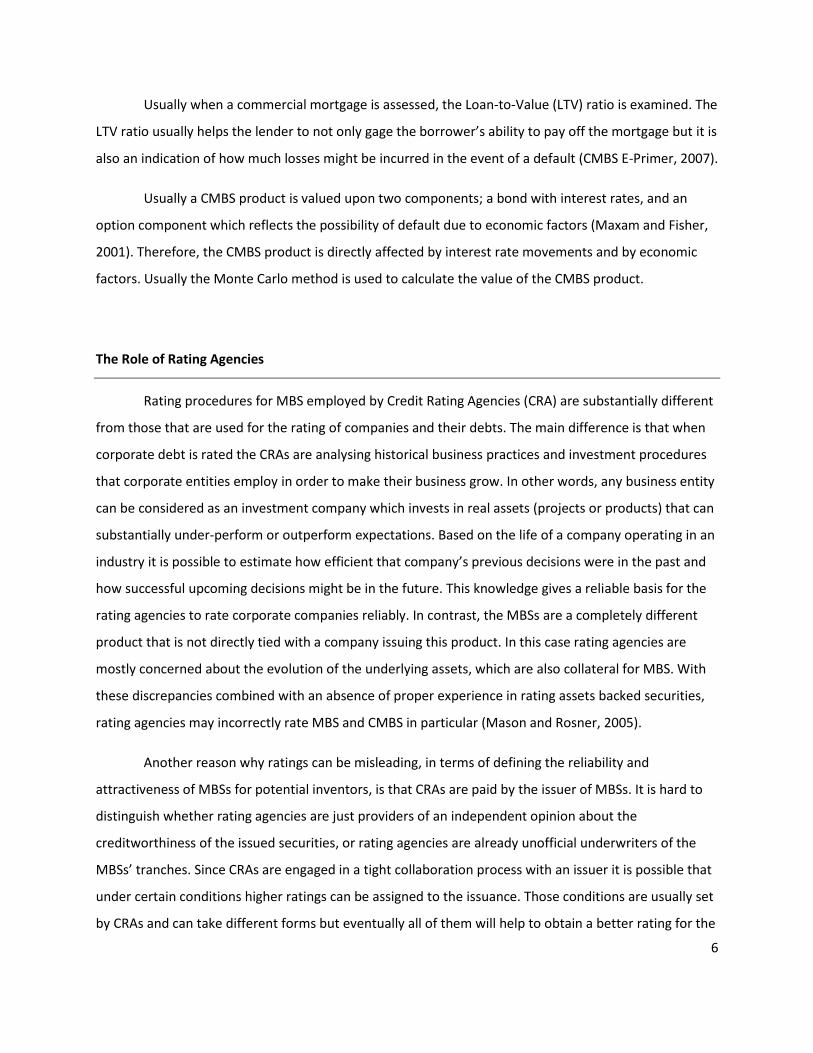
Usually when a commercial mortgage is assessed, the Loan-to-Value (LTV) ratio is examined. The
LTV ratio usually helps the lender to not only gage the borrower’s ability to pay off the mortgage but it is
also an indication of how much losses might be incurred in the event of a default (CMBS E-Primer, 2007).
Usually a CMBS product is valued upon two components; a bond with interest rates, and an
option component which reflects the possibility of default due to economic factors (Maxam and Fisher,
2001). Therefore, the CMBS product is directly affected by interest rate movements and by economic
factors. Usually the Monte Carlo method is used to calculate the value of the CMBS product.
The Role of Rating Agencies
Rating procedures for MBS employed by Credit Rating Agencies (CRA) are substantially different
from those that are used for the rating of companies and their debts. The main difference is that when
corporate debt is rated the CRAs are analysing historical business practices and investment procedures
that corporate entities employ in order to make their business grow. In other words, any business entity
can be considered as an investment company which invests in real assets (projects or products) that can
substantially under-perform or outperform expectations. Based on the life of a company operating in an
industry it is possible to estimate how efficient that company’s previous decisions were in the past and
how successful upcoming decisions might be in the future. This knowledge gives a reliable basis for the
rating agencies to rate corporate companies reliably. In contrast, the MBSs are a completely different
product that is not directly tied with a company issuing this product. In this case rating agencies are
mostly concerned about the evolution of the underlying assets, which are also collateral for MBS. With
these discrepancies combined with an absence of proper experience in rating assets backed securities,
rating agencies may incorrectly rate MBS and CMBS in particular (Mason and Rosner, 2005).
Another reason why ratings can be misleading, in terms of defining the reliability and
attractiveness of MBSs for potential inventors, is that CRAs are paid by the issuer of MBSs. It is hard to
distinguish whether rating agencies are just providers of an independent opinion about the
creditworthiness of the issued securities, or rating agencies are already unofficial underwriters of the
MBSs’ tranches. Since CRAs are engaged in a tight collaboration process with an issuer it is possible that
under certain conditions higher ratings can be assigned to the issuance. Those conditions are usually set
by CRAs and can take different forms but eventually all of them will help to obtain a better rating for the

7
MBSs. As an example, rating agencies are involved in the deal structuring process for structured finance
transactions such as MBS issuance. Tranche rating reflects a judgment about both the credit quality of
the underlying collateral and the extent of credit support that must be provided through the
transaction’s structure in order for the tranche to receive the rating targeted by the deal’s arrangers
(BIS, 2005). In other words, the issuer might change the structure of the deal based on the
recommendations of the rating agencies and therefore obtain substantially higher ratings.
The reason why rating agencies can side with potential underwriters in MBSs issuance deals is
that CRAs are paid by the issuers. Often MBS-based securities are comprised of lower-grade tranches
that require ratings in order to be sold. Senior tranches promising the lowest yields often account only
for a very small part of the entire issuance. Those tranches, even if they are rated in the highest possible
category, are not the most popular among potential investors who are always seeking for higher yields
with the same quality/risk for their investments. One of the important measures of risk for those
investors is the ratings given to MBSs by CRAs. Therefore, it seems that the role of rating agencies is a
necessary function of their sale and distribution (Mason & Rosner, 2007). Rating agency ‘approval’ still
appears to determine the marketability of a given structure to a wider market. It is possible that the
rating process may be considered ‘essential’ to the ability of an issuer to sell the desired assets. The
desired assets as it was discussed are usually the rest of the tranches which are worse than senior
tranches (Mason & Rosner, 2007). If the mutual collaboration of a rating agency and an issuer results in
higher ratings for the MBSs (which is the same as higher attractiveness of MBSs from the investors’
perspective) then the CRAs can be considered as underwriters. Therefore, rating agencies by being
affiliated to the issuance process of MBSs undermine their reputations of being reliable and, most
importantly, being independent providers of justified ratings for issued MBSs.
On the other hand, rating agencies even with all doubtful questions that undermine their
competency are still very useful. CRAs introduced new standards in the industry when there were only a
few before. With all criticism about the transparency of the structured finance investments, rating
agencies are still the source of the most comprehensive publicly available information on the market.
CRAs (when rating issuance) are granted extensive access to the information related to the issuance.
Investors are able to use their own methodologies and procedures to calculate the probability of default
for a corporate bond justifying their decisions on publicly available information about the company and
its business. The same procedure looks substantially more difficult when the probability of default for

8
MBS needs to be estimated. The absence of transparency about the borrower and most importantly
collateral makes justified decisions for investors difficult. Hence MBS downgrades, in general, result in
stronger impact on the price and attractiveness of the issuance than the same for corporate bonds
(Ammer and Clinton, 2004).
At the same time investors do not fully rely on the ratings provided by rating agencies. With
evidence from European banks, rating reliance depends on the level of sophistication of investment
practices that a bank has in place. In other words, the more sophisticated a bank’s investment practices
are, the less reliance this bank has on the given rating. Smaller banks tend to be more dependant on the
ratings provided by CRAs (BIS, 2005).
Conclusively, even with the reasonable assumptions that the CRAs are not independent and not
the best source of information they are still useful and necessary for the markets. The following models
will try to estimate how investor’s decisions are dependent on the ratings provided by the rating
agencies. In addition the models will also try to find whether the rating agencies were constantly pricing
CMBSs incorrectly and where the ratings diverged substantially from the logical economical reasoning of
what the ratings should be.
9
Part 2: Models, Results, and Conclusions
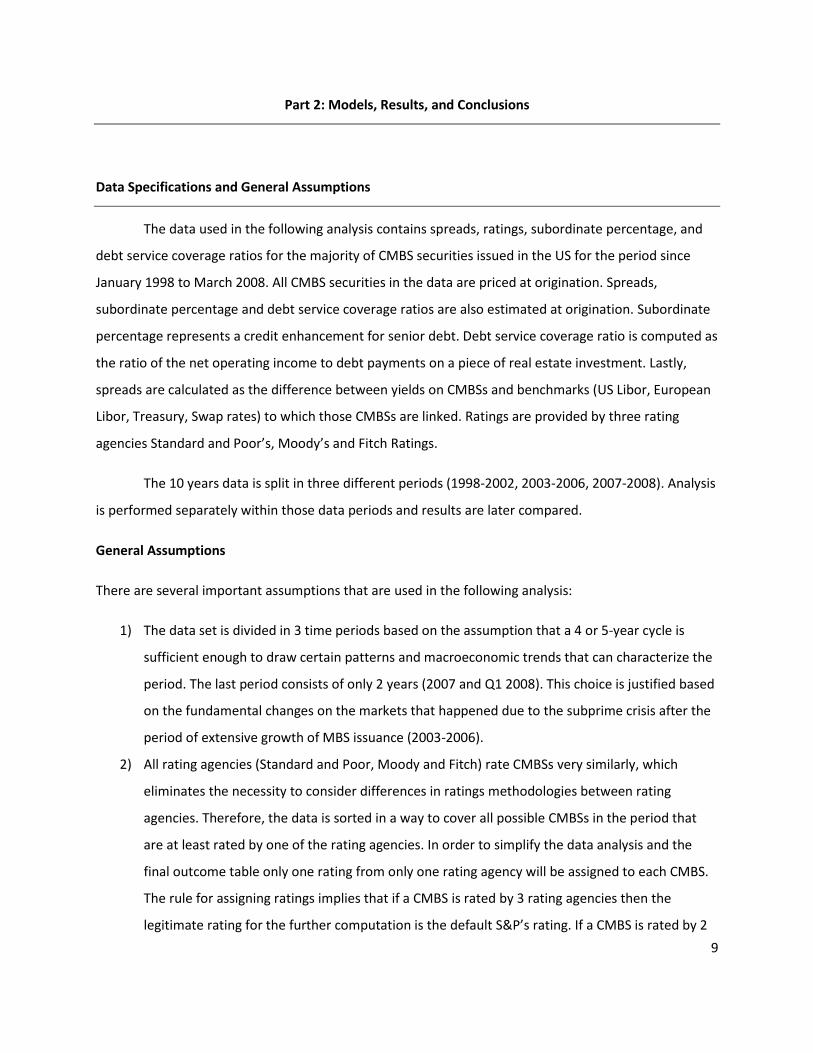
Data Specifications and General Assumptions
The data used in the following analysis contains spreads, ratings, subordinate percentage, and
debt service coverage ratios for the majority of CMBS securities issued in the US for the period since
January 1998 to March 2008. All CMBS securities in the data are priced at origination. Spreads,
subordinate percentage and debt service coverage ratios are also estimated at origination. Subordinate
percentage represents a credit enhancement for senior debt. Debt service coverage ratio is computed as
the ratio of the net operating income to debt payments on a piece of real estate investment. Lastly,
spreads are calculated as the difference between yields on CMBSs and benchmarks (US Libor, European
Libor, Treasury, Swap rates) to which those CMBSs are linked. Ratings are provided by three rating
agencies Standard and Poor’s, Moody’s and Fitch Ratings.
The 10 years data is split in three different periods (1998-2002, 2003-2006, 2007-2008). Analysis
is performed separately within those data periods and results are later compared.
General Assumptions
There are several important assumptions that are used in the following analysis:
1) The data set is divided in 3 time periods based on the assumption that a 4 or 5-year cycle is
sufficient enough to draw certain patterns and macroeconomic trends that can characterize the
period. The last period consists of only 2 years (2007 and Q1 2008). This choice is justified based
on the fundamental changes on the markets that happened due to the subprime crisis after the
period of extensive growth of MBS issuance (2003-2006).
2) All rating agencies (Standard and Poor, Moody and Fitch) rate CMBSs very similarly, which
eliminates the necessity to consider differences in ratings methodologies between rating
agencies. Therefore, the data is sorted in a way to cover all possible CMBSs in the period that
are at least rated by one of the rating agencies. In order to simplify the data analysis and the
final outcome table only one rating from only one rating agency will be assigned to each CMBS.
The rule for assigning ratings implies that if a CMBS is rated by 3 rating agencies then the
legitimate rating for the further computation is the default S&P’s rating. If a CMBS is rated by 2

10
rating agencies (Moody and Fitch) then the legitimate rating for the further computation is
Moody’s rating. If a CMBS was not rated by S&P nor by Moody’s then Fitch’s rating is used for
the analysis. The presented methodology of rating agencies hierarchy is based on the total
number of CMBS rated by each of the rating agencies. The largest number of rated CMBS
securities is rated by S&P then by Moody’s and then by Fitch.
3) All spreads mentioned in the Average Spread and Regression models are adjusted spreads that
are computed according to the following methodology. Yields for each of the issued CMBS are
calculated as the sum of the initial spreads and benchmarks to which these spreads are linked.
Since the majority of CMBS are referred to different benchmarks, only the most popular
benchmarks (In our case 1-month US Libor and 10-years Treasury rate) are used for the
calculation of CMBS yields. CMBS yields for the securities referring to benchmarks that are not
extensively represented in the initial data set are not computed. Adjusted spreads are obtained
as the difference between CMBS yields and 3-month Treasury rates.
4) Only CMBSs denominated in US dollars are used for the model analysis and all further
computations.
1. Average Spreads Model Introduction
The first model compares average spreads between differently rated securities in different time
periods. By comparing spreads of rated securities in different periods of time it will be possible to trace
the pattern of spread changes and connect these changes to the performance of the financial markets
and economies in general and for MBS markets in particular. Significant changes in the spreads should
define the periods of the crises and the periods of extensively growing markets. Another question that is
addressed in the following analysis is whether the highest ratings assigned to CMBSs tranches are a
guarantee of the narrow spread regardless of the external fundamental factors that affect the markets
at a certain period of time.
Description of the model
The data set is separated on 3 different periods. Each period contains a variety of differently
rated securities and their spreads. The average adjusted spreads across the different ratings assigned to
the CMBSs were calculated. The same procedure is repeated for all 3 time intervals.
11
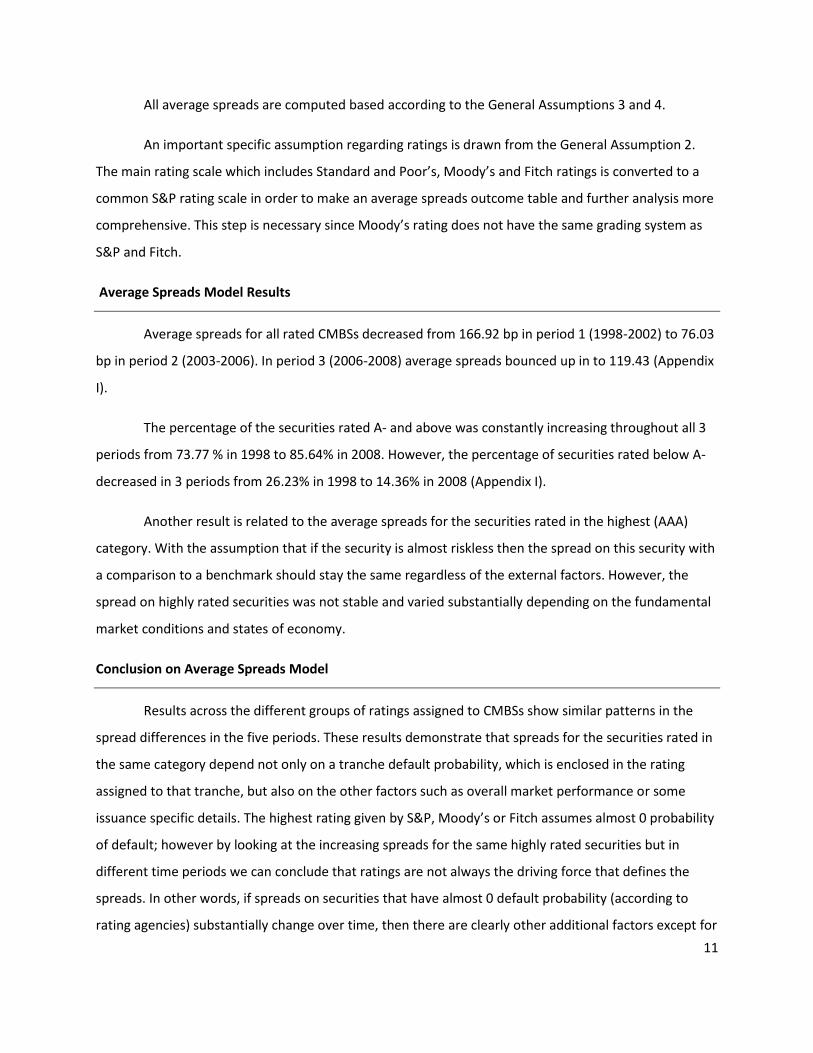
All average spreads are computed based according to the General Assumptions 3 and 4.
An important specific assumption regarding ratings is drawn from the General Assumption 2.
The main rating scale which includes Standard and Poor’s, Moody’s and Fitch ratings is converted to a
common S&P rating scale in order to make an average spreads outcome table and further analysis more
comprehensive. This step is necessary since Moody’s rating does not have the same grading system as
S&P and Fitch.
Average Spreads Model Results
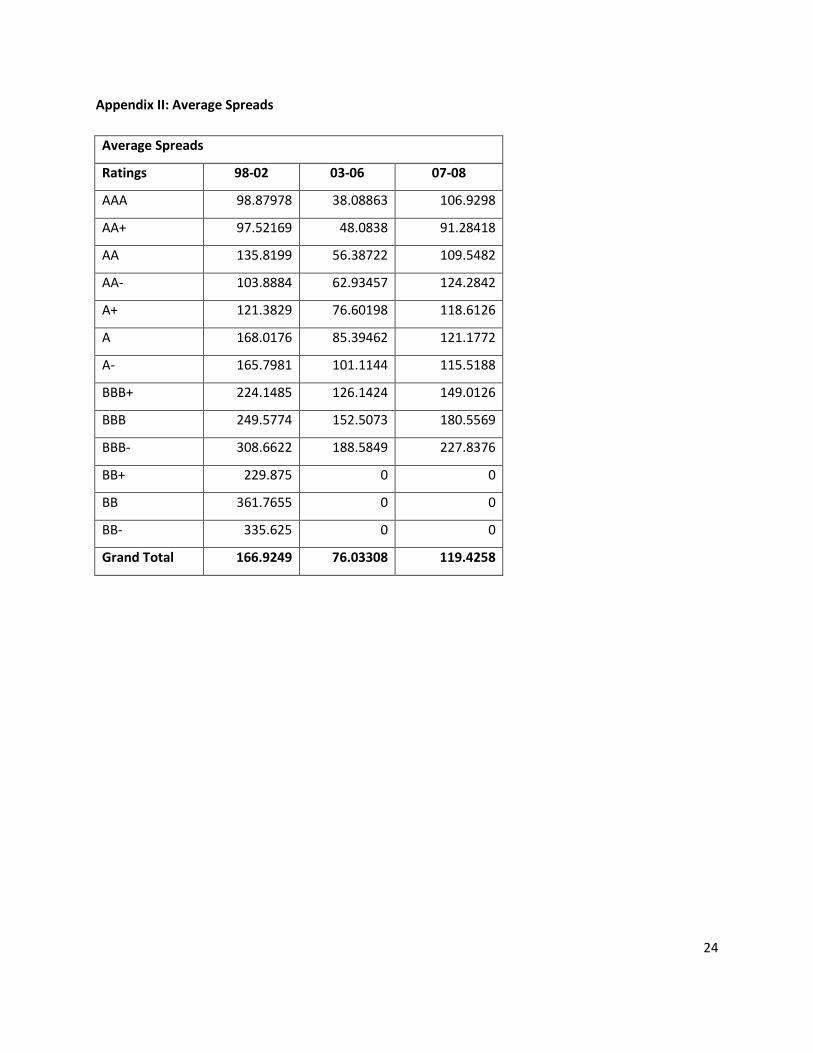
Average spreads for all rated CMBSs decreased from 166.92 bp in period 1 (1998-2002) to 76.03
bp in period 2 (2003-2006). In period 3 (2006-2008) average spreads bounced up in to 119.43 (Appendix
I).
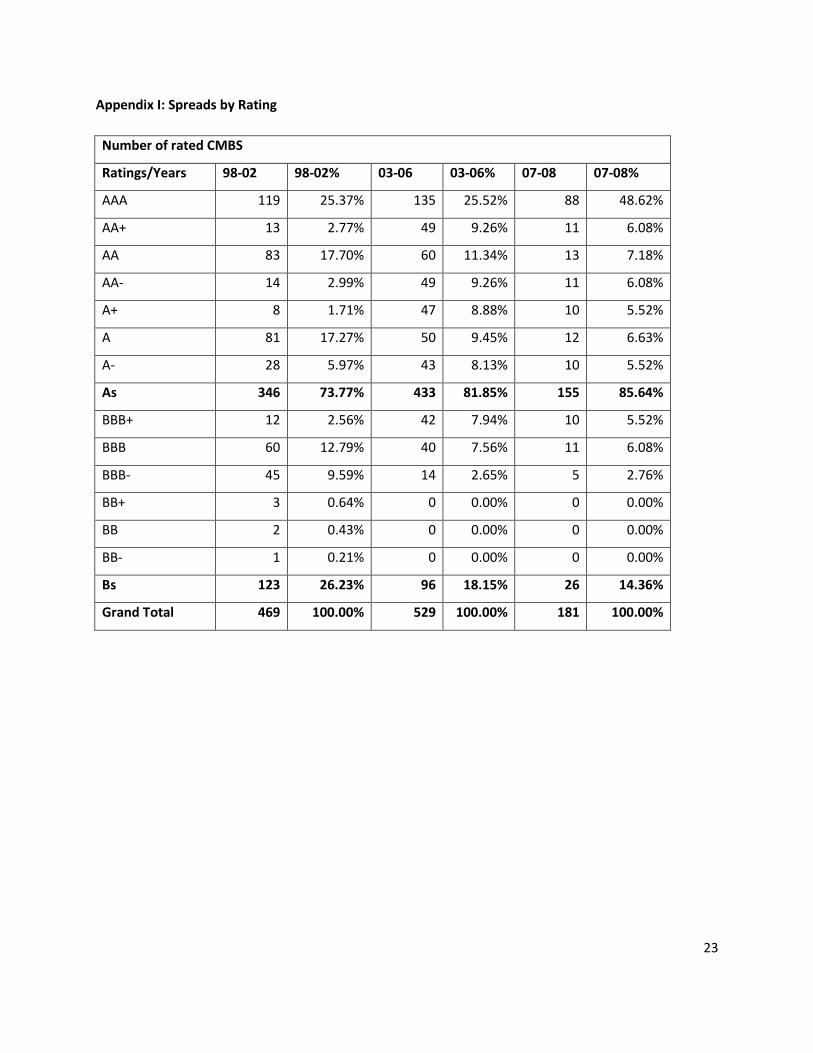
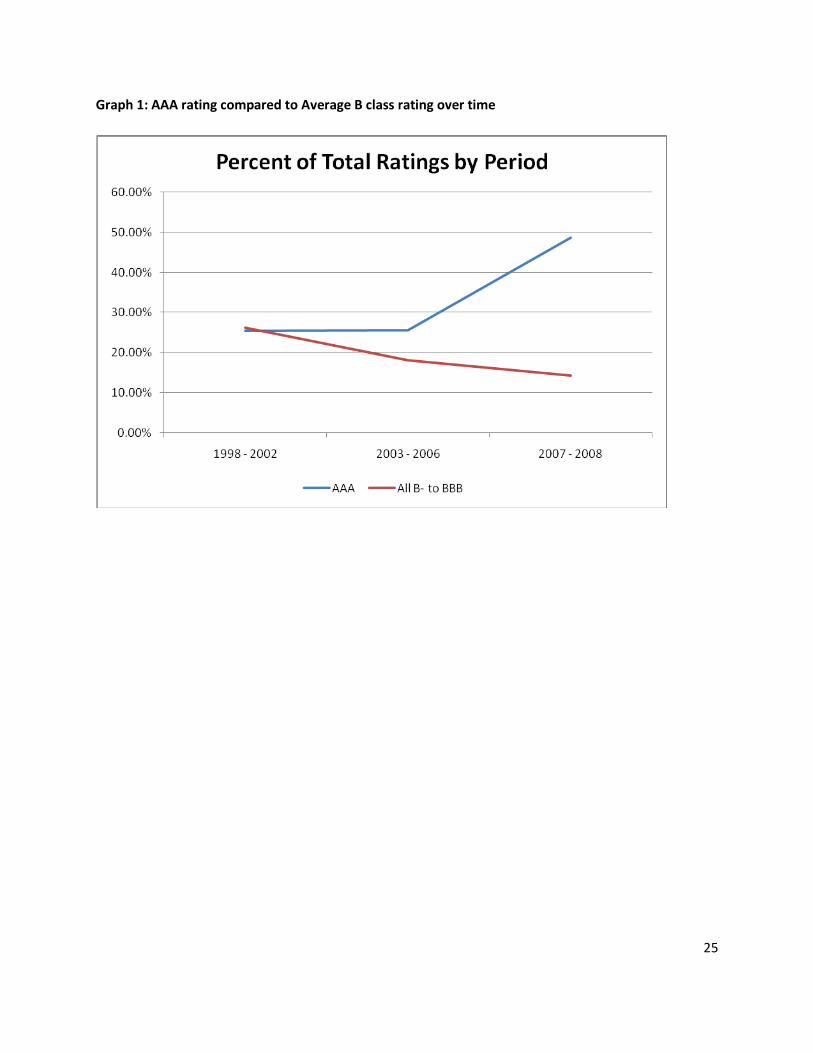
The percentage of the securities rated A- and above was constantly increasing throughout all 3
periods from 73.77 % in 1998 to 85.64% in 2008. However, the percentage of securities rated below A-
decreased in 3 periods from 26.23% in 1998 to 14.36% in 2008 (Appendix I).
Another result is related to the average spreads for the securities rated in the highest (AAA)
category. With the assumption that if the security is almost riskless then the spread on this security with
a comparison to a benchmark should stay the same regardless of the external factors. However, the
spread on highly rated securities was not stable and varied substantially depending on the fundamental
market conditions and states of economy.
Conclusion on Average Spreads Model
Results across the different groups of ratings assigned to CMBSs show similar patterns in the
spread differences in the five periods. These results demonstrate that spreads for the securities rated in
the same category depend not only on a tranche default probability, which is enclosed in the rating
assigned to that tranche, but also on the other factors such as overall market performance or some
issuance specific details. The highest rating given by S&P, Moody’s or Fitch assumes almost 0 probability
of default; however by looking at the increasing spreads for the same highly rated securities but in
different time periods we can conclude that ratings are not always the driving force that defines the
spreads. In other words, if spreads on securities that have almost 0 default probability (according to
rating agencies) substantially change over time, then there are clearly other additional factors except for

12
ratings that have significant influence on spreads. Some of those additional factors will be tested in the
later model.
The assumption related to the influence of the fundamental economic factors is that in the
periods when economy is rising investments in financial markets tend to increase. This implies that the
business entities which are willing to raise money can offer modest spreads on their bonds because of
the fact that a lot of money is available on the market. On the other hand, when the markets are in a
downfall investments in general shrink, which forces issuers to increase spreads in order to be able to
attract scarce capital. Therefore if the S&P 500 index or other economic indexes are growing,
representing high investor activity, then spreads on CMBSs tend to decrease. This is why we believed
that there should have been relations between S&P, fundamental economy state indicators and CMBS
spreads. Based on this implication further conclusions will be drawn.
In periods of market turbulence, such as after the Russian crisis and the dot-com bubble burst,
CMBSs spreads were high because they were affected by decreased market activity, which forced the
issuers of CMBSs to offer higher spreads on even highly rated securities in order to find investors. All
financial markets including the real estate market substantially bounced back in 2003-2006, which
helped spreads for CMBSs to narrow down. Real estate prices were growing along with mortgage
availability, which created a cycle where easy credit resulted in higher demand on real estates and,
therefore, real estate prices soared (Pavlov, 2008). During periods of crises such as 2007-2008, spreads
on CMBSs increased substantially (comparing to the previous period), though the distribution of ratings
across the rated securities did not change substantially. By contrast, the number of securities rated
above A- increased. This is quite a contradictory observation because when the economy is in a
recession or in a downfall the survivorship probability of any business or debt in general should
decrease, which would assume lower ratings for securities issued during periods of crises. This
assumption can be extrapolated on CMBSs and real estate market in general as well.
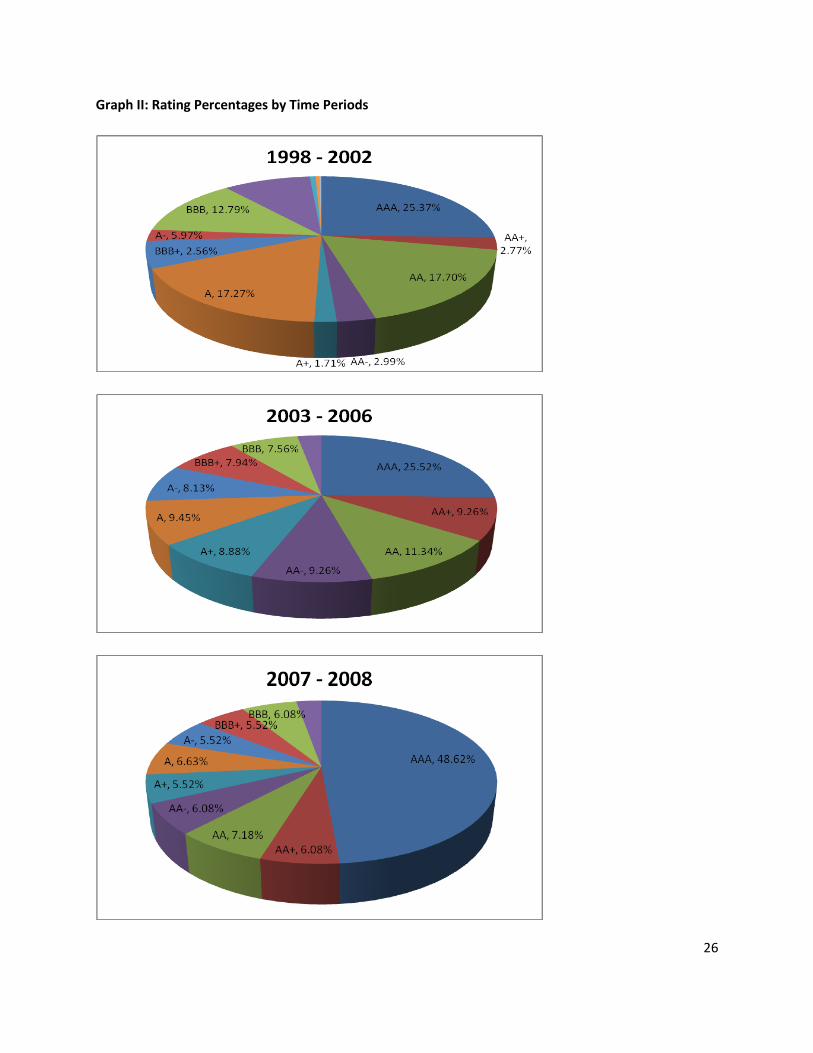
Elaborating on the details of the previous conclusion it was observed in the average spread
model that regardless of the period of crises or growth, the percentage of securities rated in the highest
category (AAA) was constantly increasing – Appendix II Graph I, Graph II. Therefore, the conclusion that
can be drawn from this result implies that rating agencies have been incorrectly rating CMBS on a
regular basis.
13
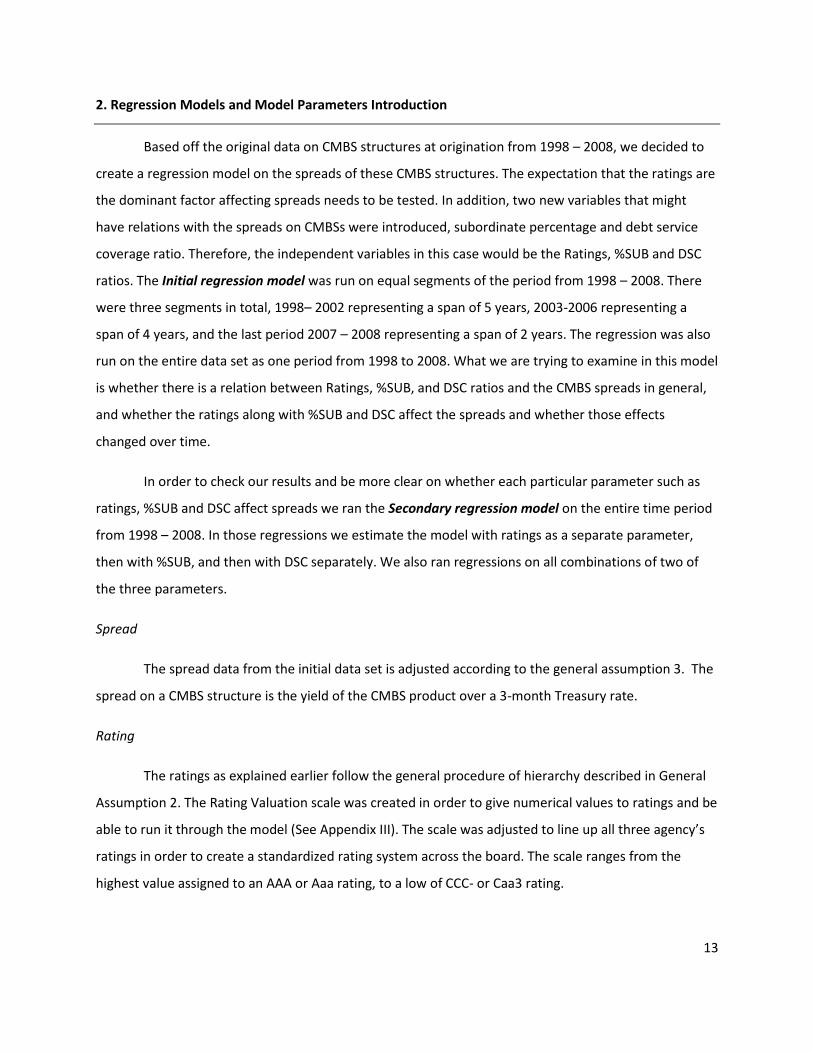
2. Regression Models and Model Parameters Introduction
Based off the original data on CMBS structures at origination from 1998 – 2008, we decided to
create a regression model on the spreads of these CMBS structures. The expectation that the ratings are
the dominant factor affecting spreads needs to be tested. In addition, two new variables that might
have relations with the spreads on CMBSs were introduced, subordinate percentage and debt service
coverage ratio. Therefore, the independent variables in this case would be the Ratings, %SUB and DSC
ratios. The Initial regression model was run on equal segments of the period from 1998 – 2008. There
were three segments in total, 1998– 2002 representing a span of 5 years, 2003-2006 representing a
span of 4 years, and the last period 2007 – 2008 representing a span of 2 years. The regression was also
run on the entire data set as one period from 1998 to 2008. What we are trying to examine in this model
is whether there is a relation between Ratings, %SUB, and DSC ratios and the CMBS spreads in general,
and whether the ratings along with %SUB and DSC affect the spreads and whether those effects
changed over time.
In order to check our results and be more clear on whether each particular parameter such as
ratings, %SUB and DSC affect spreads we ran the Secondary regression model on the entire time period
from 1998 – 2008. In those regressions we estimate the model with ratings as a separate parameter,
then with %SUB, and then with DSC separately. We also ran regressions on all combinations of two of
the three parameters.
Spread
The spread data from the initial data set is adjusted according to the general assumption 3. The
spread on a CMBS structure is the yield of the CMBS product over a 3-month Treasury rate.
Rating
The ratings as explained earlier follow the general procedure of hierarchy described in General
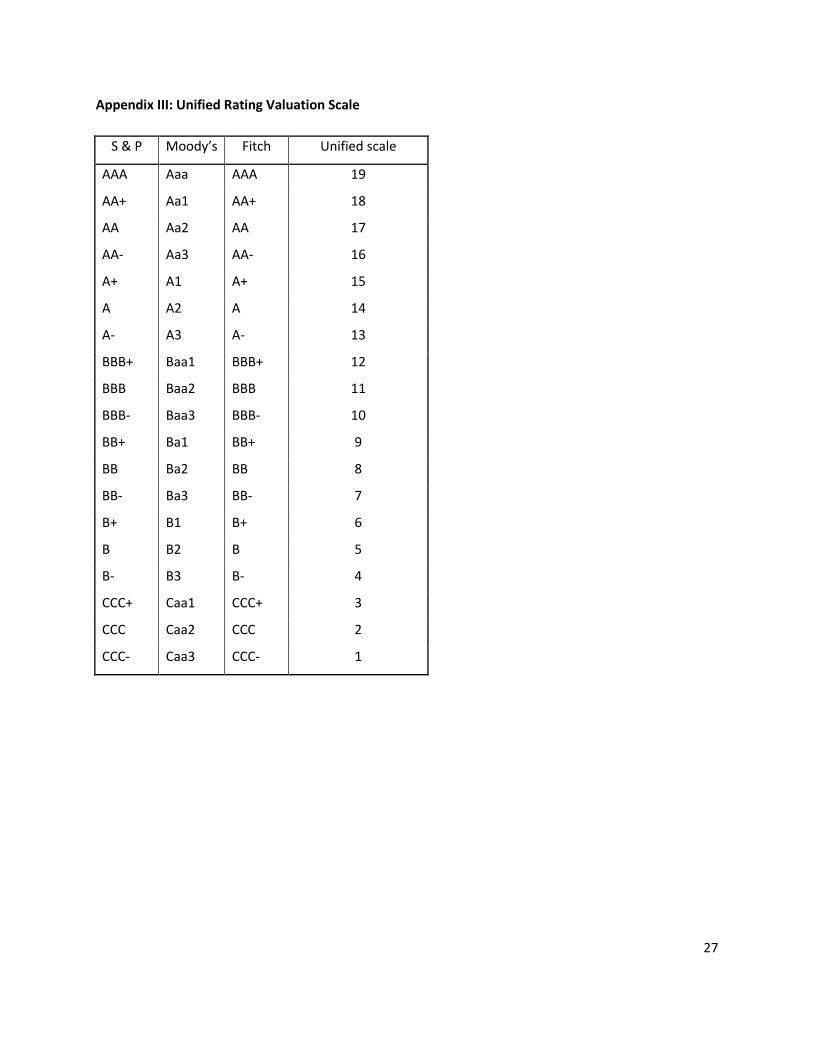
Assumption 2. The Rating Valuation scale was created in order to give numerical values to ratings and be
able to run it through the model (See Appendix III). The scale was adjusted to line up all three agency’s
ratings in order to create a standardized rating system across the board. The scale ranges from the
highest value assigned to an AAA or Aaa rating, to a low of CCC- or Caa3 rating.

14
Subordinate percentage and Debt service coverage ratio
Subordinate percentage and Debt service coverage ratio were included in the model to check
whether the spreads are dependent on the credit enhancements or on the current financial state of a
company (which is seeking a mortgage).
Initial regression model
Spr = α + β1Rt + β2SUB+ β3DSC
Spr = Spread on CMBS product
Rt = Rating valuation for CMBS product at origination
SUB = Subordinate percentage for CMBS product at origination
DSC = Debt service coverage ratio for CMBS product at origination
This model allows us to get a sense of how CMBS spreads are sensitive to its ratings and to the
SUB and DSC ratios at origination.
Secondary regression model
Spr = α + β1Rt
Spr = α + β1SUB
Spr = α + β1DSC
Spr = α + β1Rt + β2SUB
Spr = α + β1Rt + β2DSC
Spr = α + β1SUB + β2DSC
Spr = Spread on CMBS product
Rt = Rating valuation for CMBS product at origination
SUB = Subordinate percentage for CMBS product at origination
DSC = Debt service coverage ratio for CMBS product at origination
This model is devised to check the results of the Initial regression model. Additionally, we will
check to see to what extent the introduced parameters (Rt, SUB, DSC) have an influence on the model.
15
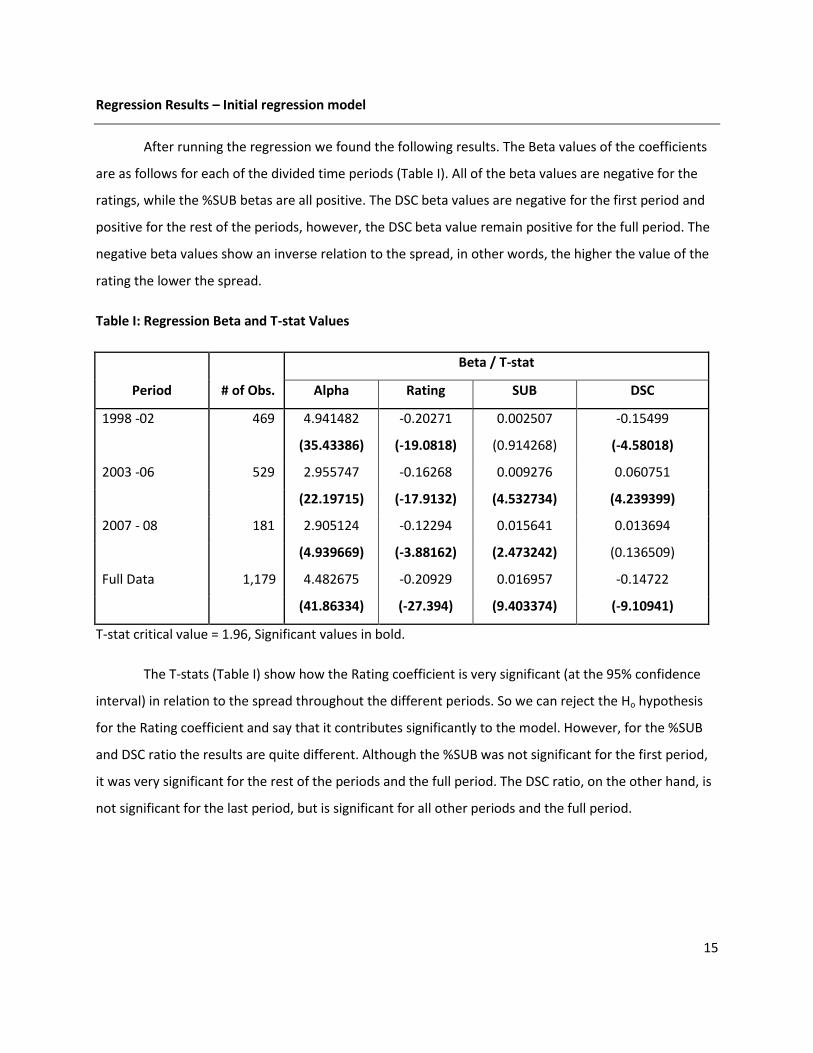
Regression Results – Initial regression model
After running the regression we found the following results. The Beta values of the coefficients
are as follows for each of the divided time periods (Table I). All of the beta values are negative for the
ratings, while the %SUB betas are all positive. The DSC beta values are negative for the first period and
positive for the rest of the periods, however, the DSC beta value remain positive for the full period. The
negative beta values show an inverse relation to the spread, in other words, the higher the value of the
rating the lower the spread.
Table I: Regression Beta and T-stat Values
Period # of Obs.
Beta / T-stat
Alpha Rating SUB DSC
1998 -02 469 4.941482 -0.20271 0.002507 -0.15499
(35.43386) (-19.0818) (0.914268) (-4.58018)
2003 -06 529 2.955747 -0.16268 0.009276 0.060751
(22.19715) (-17.9132) (4.532734) (4.239399)
2007 - 08 181 2.905124 -0.12294 0.015641 0.013694
(4.939669) (-3.88162) (2.473242) (0.136509)
Full Data 1,179 4.482675 -0.20929 0.016957 -0.14722
(41.86334) (-27.394) (9.403374) (-9.10941)
T-stat critical value = 1.96, Significant values in bold.
The T-stats (Table I) show how the Rating coefficient is very significant (at the 95% confidence
interval) in relation to the spread throughout the different periods. So we can reject the Ho hypothesis
for the Rating coefficient and say that it contributes significantly to the model. However, for the %SUB
and DSC ratio the results are quite different. Although the %SUB was not significant for the first period,
it was very significant for the rest of the periods and the full period. The DSC ratio, on the other hand, is
not significant for the last period, but is significant for all other periods and the full period.

16
Table II: Model Test Results
Period R2 F-Stat Critical F-test DW-test
1998-02 0.5593 196.6816 8.5323 0.7274
2003 -06 0.5127 184.1361 8.5317 0.7576
2007 - 08 0.0925 6.0138 8.5417 0.2461
Full Data 0.4562 328.5358 8.5288 0.4858
In examining the power of this model (Table II), we take a look at the R squared values. We see
that for the period 1998 – 2002 the R squared value is very high at 55.93% and also for 2003 – 2006 at
51.27%. Although the R squared has varied across the segments it is relatively high and shows that the
sensitivity of spreads to ratings, DSC, and %SUB ratios is apparent, more so in certain years but is
prominent nevertheless.
The F-stats in all periods are significantly greater than their respective critical values except for
the 2007 – 2008 period. The significant periods show that all of the model parameters (Ratings, %SUB,
and DSC) together are significant in affecting the CMBS spread. The 2007 – 2008 period F-stat is less
than the critical value and this may be related to the fact that the sample size of the period is too small
to be significant for a good model.
The Durban Watson test was also conducted in order to see how much serial correlation existed
in our model. The DW test has different results for different periods, but overall it is close to 0.5. A
value close to 2 shows that there is no serial correlation.
17
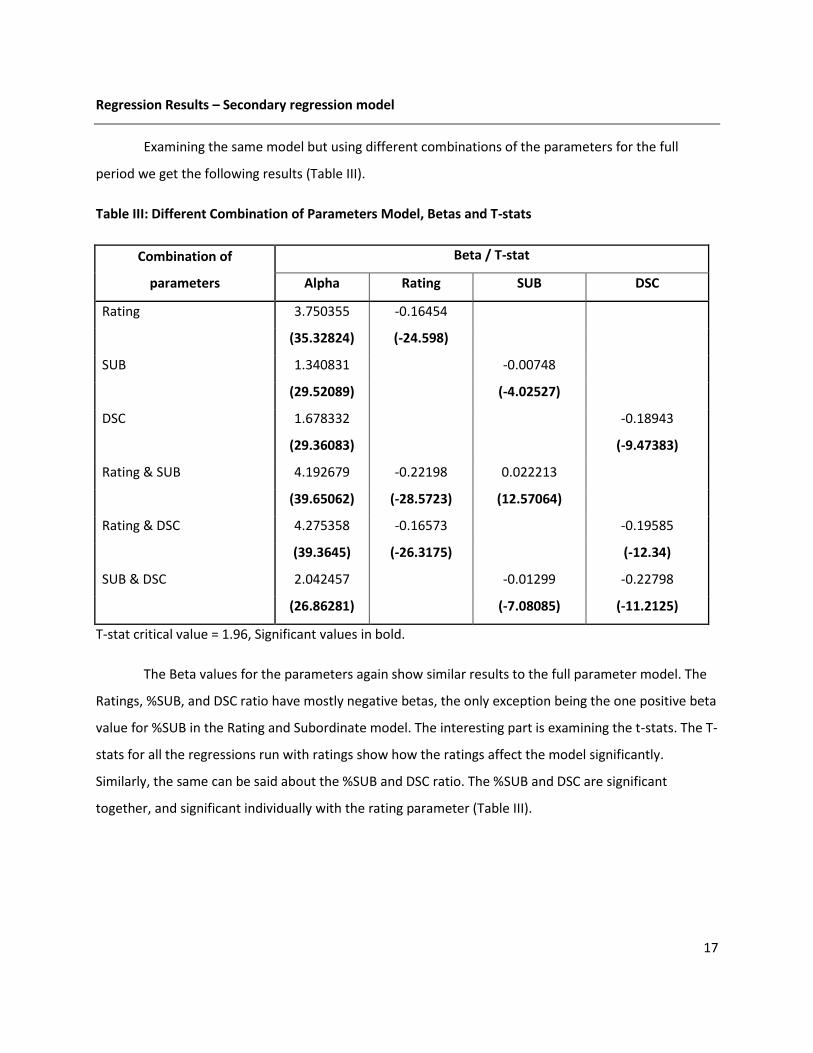
Regression Results – Secondary regression model
Examining the same model but using different combinations of the parameters for the full
period we get the following results (Table III).
Table III: Different Combination of Parameters Model, Betas and T-stats
Combination of
parameters
Beta / T-stat
Alpha Rating SUB DSC
Rating 3.750355 -0.16454
(35.32824) (-24.598)
SUB 1.340831 -0.00748
(29.52089) (-4.02527)
DSC 1.678332 -0.18943
(29.36083) (-9.47383)
Rating & SUB 4.192679 -0.22198 0.022213
(39.65062) (-28.5723) (12.57064)
Rating & DSC 4.275358 -0.16573 -0.19585
(39.3645) (-26.3175) (-12.34)
SUB & DSC 2.042457 -0.01299 -0.22798
(26.86281) (-7.08085) (-11.2125)
T-stat critical value = 1.96, Significant values in bold.
The Beta values for the parameters again show similar results to the full parameter model. The
Ratings, %SUB, and DSC ratio have mostly negative betas, the only exception being the one positive beta
value for %SUB in the Rating and Subordinate model. The interesting part is examining the t-stats. The T-
stats for all the regressions run with ratings show how the ratings affect the model significantly.
Similarly, the same can be said about the %SUB and DSC ratio. The %SUB and DSC are significant
together, and significant individually with the rating parameter (Table III).
18
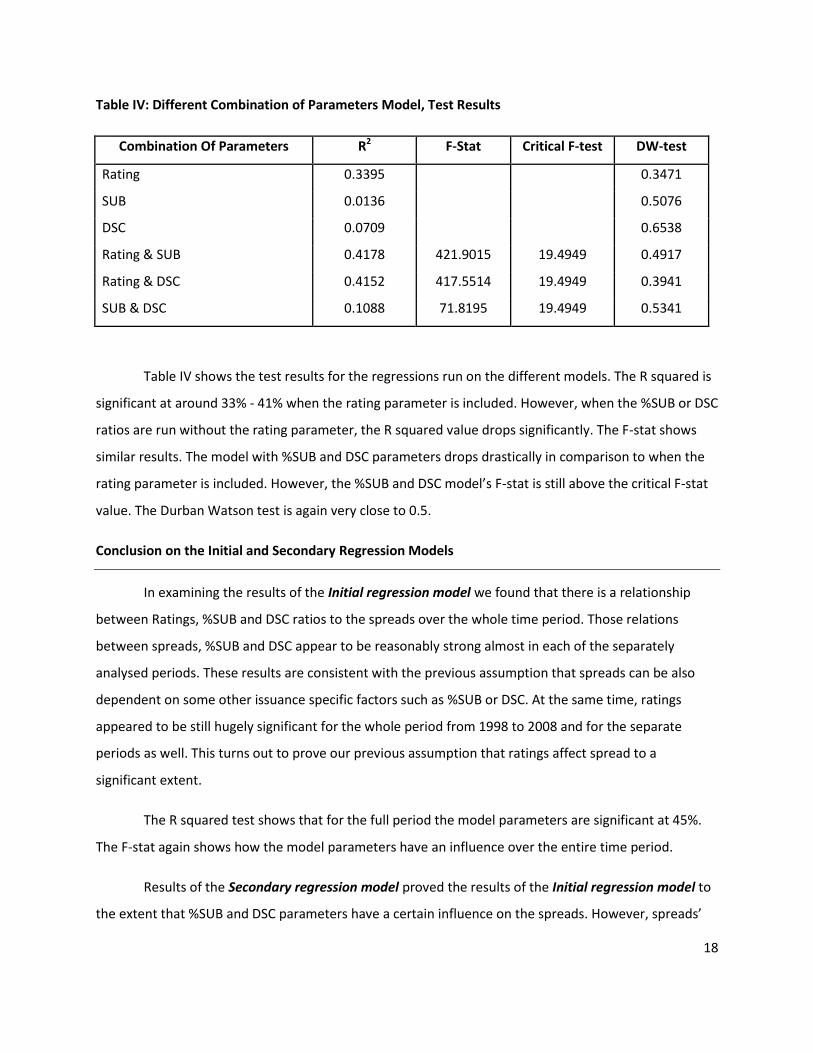
Table IV: Different Combination of Parameters Model, Test Results
Combination Of Parameters R2 F-Stat Critical F-test DW-test
Rating 0.3395 0.3471
SUB 0.0136 0.5076
DSC 0.0709 0.6538
Rating & SUB 0.4178 421.9015 19.4949 0.4917
Rating & DSC 0.4152 417.5514 19.4949 0.3941
SUB & DSC 0.1088 71.8195 19.4949 0.5341
Table IV shows the test results for the regressions run on the different models. The R squared is
significant at around 33% - 41% when the rating parameter is included. However, when the %SUB or DSC
ratios are run without the rating parameter, the R squared value drops significantly. The F-stat shows
similar results. The model with %SUB and DSC parameters drops drastically in comparison to when the
rating parameter is included. However, the %SUB and DSC model’s F-stat is still above the critical F-stat
value. The Durban Watson test is again very close to 0.5.
Conclusion on the Initial and Secondary Regression Models
In examining the results of the Initial regression model we found that there is a relationship
between Ratings, %SUB and DSC ratios to the spreads over the whole time period. Those relations
between spreads, %SUB and DSC appear to be reasonably strong almost in each of the separately
analysed periods. These results are consistent with the previous assumption that spreads can be also
dependent on some other issuance specific factors such as %SUB or DSC. At the same time, ratings
appeared to be still hugely significant for the whole period from 1998 to 2008 and for the separate
periods as well. This turns out to prove our previous assumption that ratings affect spread to a
significant extent.
The R squared test shows that for the full period the model parameters are significant at 45%.
The F-stat again shows how the model parameters have an influence over the entire time period.
Results of the Secondary regression model proved the results of the Initial regression model to
the extent that %SUB and DSC parameters have a certain influence on the spreads. However, spreads’

19
dependence on DSC is more significant than on %SUB. This conclusion was drawn from the R squared
values for the models when %SUB and DSC (each separately) were the only parameters in the
regression. R squared turned out to be 7% for DSC and 1.3% for %SUB, which showed that the
parameters even if significant, still lack explanatory power. At the same time, as soon as the ratings
were introduced to the regression as a second parameter to the previously tested %SUB or DSC, the R
squared value jumped up significantly to 41.5%. The assumption that ratings have a great influence were
proved in the Secondary regression model as well. T-stats for the ratings in all different combinations of
the model parameters happened to be significant. R squared values were around 34% when the ratings
were included in the regression parameters. Based on the performed analysis the ratings proved to have
the greatest influence on the spreads out of the 3 chosen parameters, which perfectly corresponds to
the results of our Initial regression model.
20
Conclusion
Considering the recent MBS crisis with huge write downs from the large US banks we decided to
test whether the credit rating agencies reliably rate MBS securities. We also tested the hypothesis that
the ratings are the dominant driving factor which explains the spreads for CMBS.
Results of the analysis showed that spreads are definitely one of the main factors determining
spreads between yields on the different tranches of CMBSs and benchmarks. However, the highest
ratings assigned to a tranche by CRA did not always result in the same spread for the CMBSs over
various time periods. This implies that spreads are also dependant on some other factors that investors
pay attention to. In the regression models we examined issuance specific details that can also explain
the spreads. The two additional parameters (except ratings) were subordinate percentage and debt
service coverage ratio, which were included in the analysis. Results of the regression, which were run
against all possible combinations of the three parameters (%SUB, DSC and ratings), showed noticeable
relations between %SUB, DSC and spreads. At the same time, ratings in all performed regressions
appeared to have significantly greater influence than the other two parameters.
Analysing average spreads model and average dynamics of ratings over the considered time
interval (1998-2008) we assumed that spreads are often dependent on the state of the economy that
the U.S. is in. Periods of market and economy growth tend to decrease spreads because of the available
funds. In periods of recession and downfall, funds are scarce and investors need to be attracted by
higher excess returns. At the same time investors’ perception of the riskless investments also turned out
to be market condition dependent. AAA ratings from the investors’ perspective should promise greater
returns in the periods of recession than in the periods of the growth. This comes from the company
related default risks, which increase in periods of recession (company’s counter-party risk). Those
specific volatile default risks, which originate from the markets performance, do not fall into the
adjustments of ratings assigned by CRAs. This fact makes the rating system in general less sensitive to
constantly changing fundamental factors.
Results of the Average spread model demonstrate that rating agencies have started losing their
credibility. The assumption that CRAs might be seriously involved in a CMBS deal structuring process and
paid by originators implies that rating agencies are interested in pulling up the rating for a tranche.
Initially, though, CRAs’ opinion is expected to be completely independent.

21
CRAs are currently surviving a difficult period, when the credibility is severely damaged and
when their methodologies are called into question. The system that worked perfectly before in growing
markets did not turn out to be that impressive in other times. CRAs now will be required to make a step
further in terms of the improvement of the valuation techniques related to MBS. This step might help
them to regain previously owned title of being one of the most reliable sources of justified independent
opinion.
22
Appendix
Figure I: Annual Issuance of CMBS structures
Source: CMBS E-Primer, Publication of Commercial Mortgage Securities Association
23
Appendix I: Spreads by Rating
Number of rated CMBS
Ratings/Years 98-02 98-02% 03-06 03-06% 07-08 07-08%
AAA 119 25.37% 135 25.52% 88 48.62%
AA+ 13 2.77% 49 9.26% 11 6.08%
AA 83 17.70% 60 11.34% 13 7.18%
AA- 14 2.99% 49 9.26% 11 6.08%
A+ 8 1.71% 47 8.88% 10 5.52%
A 81 17.27% 50 9.45% 12 6.63%
A- 28 5.97% 43 8.13% 10 5.52%
As 346 73.77% 433 81.85% 155 85.64%
BBB+ 12 2.56% 42 7.94% 10 5.52%
BBB 60 12.79% 40 7.56% 11 6.08%
BBB- 45 9.59% 14 2.65% 5 2.76%
BB+ 3 0.64% 0 0.00% 0 0.00%
BB 2 0.43% 0 0.00% 0 0.00%
BB- 1 0.21% 0 0.00% 0 0.00%
Bs 123 26.23% 96 18.15% 26 14.36%
Grand Total 469 100.00% 529 100.00% 181 100.00%
24
Appendix II: Average Spreads
Average Spreads
Ratings 98-02 03-06 07-08
AAA 98.87978 38.08863 106.9298
AA+ 97.52169 48.0838 91.28418
AA 135.8199 56.38722 109.5482
AA- 103.8884 62.93457 124.2842
A+ 121.3829 76.60198 118.6126
A 168.0176 85.39462 121.1772
A- 165.7981 101.1144 115.5188
BBB+ 224.1485 126.1424 149.0126
BBB 249.5774 152.5073 180.5569
BBB- 308.6622 188.5849 227.8376
BB+ 229.875 0 0
BB 361.7655 0 0
BB- 335.625 0 0
Grand Total 166.9249 76.03308 119.4258
25
Graph 1: AAA rating compared to Average B class rating over time
26
Graph II: Rating Percentages by Time Periods
27
Appendix III: Unified Rating Valuation Scale
S & P Moody’s Fitch Unified scale
AAA Aaa AAA 19
AA+ Aa1 AA+ 18
AA Aa2 AA 17
AA- Aa3 AA- 16
A+ A1 A+ 15
A A2 A 14
A- A3 A- 13
BBB+ Baa1 BBB+ 12
BBB Baa2 BBB 11
BBB- Baa3 BBB- 10
BB+ Ba1 BB+ 9
BB Ba2 BB 8
BB- Ba3 BB- 7
B+ B1 B+ 6
B B2 B 5
B- B3 B- 4
CCC+ Caa1 CCC+ 3
CCC Caa2 CCC 2
CCC- Caa3 CCC- 1

28
Bibliography
Where did the Risk go? How Misapplied Bond Ratings Cause Mortgage Backed Securities and
Collateralized Debt Obligation Market Disruptions, Joseph R. Mason and Joshua Rosner, May
2007.
Subprime Lending and Real Estate Markets – Working Paper, Prof. Andrey Pavlov, 2008.
CMBS E-Primer, A Publication of The Commercial Mortgage Securities Association, March 2007,
Annemarie DiCola Editor in Chief.
Transforming Real Estate Finance – A CMBS Primer, Morgan Stanley, Editors: Howard Esaki,
Marielle Jan De Beur, and Masumi Pearl, Second Edition Spring 2002.
Synthetic CMBS Primer, Nomura Fixed Income Research, September 2006.
The Sub-prime mortgage crisis: a synopsis, Karen Weaver – Deutsche Bank, Global Securitisation
and Structured Finance 2008.
What Drives the Return on Commercial Mortgage-Backed Securities? Xiaoqing Eleanor Xu Ph.D
CFA, The Real Estate Research Institute January 2007.
The Handbook of Mortgage Backed Securities, Frank Fabozzi, Sixth Edition, McGraw-Hill
Publishing, December 2005.
Commercial Mortgage- Backed Securities: Prepayment and Default, Brent W. Ambrose and
Anthony B. Sanders, Journal of Real Estate Finance and Economics, 2003.
Loss Characteristics of Commercial Mortgage Foreclosures, Brian A. Ciochetti, December 1998.
Pricing Commercial Mortgage Backed Securities, Clark Maxam and Jeffrey Fisher, Journal of
Property Investment and Finance, Vol. 19 No. 6, 2001.
Pricing Commerical Mortgages and Their Mortgage-Backed Securities, James Kau, Donald
Keenan, Walter Muller, and James Epperson, Journal of Real Estate Finance and Economics,
1990.

29
The Pricing of Multiclass Commercial Mortgage-Backed Securities, Paul D. Childs, Steven H. Ott,
and Timothy J. Riddiough, Journal of Financial and Quantitative Analysis, Vol. 31 No. 4,
December 1996.
The Relevance of Interest Rate Processes in Pricing Mortgage-backed Securities, Ren-Raw Chen
and T.L. Tyler Yang, Journal of Housing Research Vol. 6 Issue 2, Fannie Mae 1995.
The Role of Ratings in Structured Finance: Issues and Implications, Bank for International
Settlements, Committee on the Global Financial System, January 2005.
Good news is no news? The impact of credit rating changes on the pricing of asset-backed
securities, J M Ammer and N Clinton, International Finance Discussion Paper, no 809, Federal
Reserve Board, (www.federalreserve.gov/pubs/ifdp/2004/809/ifdp809.pdf), July 2004.