Embed Size (px)
Citation preview
The Disclosure section may be found on page 20 of this report.
TechnologyAshok Kumar, CFA
Initiating CoverageJune 4, 2015
Key Metrics
SLTD - NASDAQ $4.41
Pricing Date Jun 1 2015
Price Target $6.00
52-Week Range $8.88 - $1.53
Shares Outstanding (mm) 17.7
Market Capitalization ($mm) $78.1
3-Mo Average Daily Volume 100,000
Institutional Ownership 6%
Debt/Total Capital 6.0%
ROE (61.9) %
Book Value/Share $1.12
Price/Book 3.9x
Dividend Yield NM
LTM EBITDA Margin (17.80)%
EPS ($) FY: DecemberPrior Curr. Prior Curr.
2014A 2015E 2015E 2016E 2016E
1Q-Mar (0.43) -- (0.10)A -- --
2Q-Jun 0.00 -- 0.05E -- --
3Q-Sep (0.04) -- 0.08E -- --
4Q-Dec (0.63) -- 0.10E -- --
FY (2.15) -- 0.13E -- 0.45E
P/E NM 33.92x 9.80x
Revenue ($M)Prior Curr. Prior Curr.
2014A 2015E 2015E 2016E 2016E
1Q-Mar 1.1 -- 5.7A -- --
2Q-Jun 7.5 -- 10.0E -- --
3Q-Sep 6.4 -- 12.0E -- --
4Q-Dec 5.2 -- 13.0E -- --
FY 20.2 -- 40.7E -- 65.0E
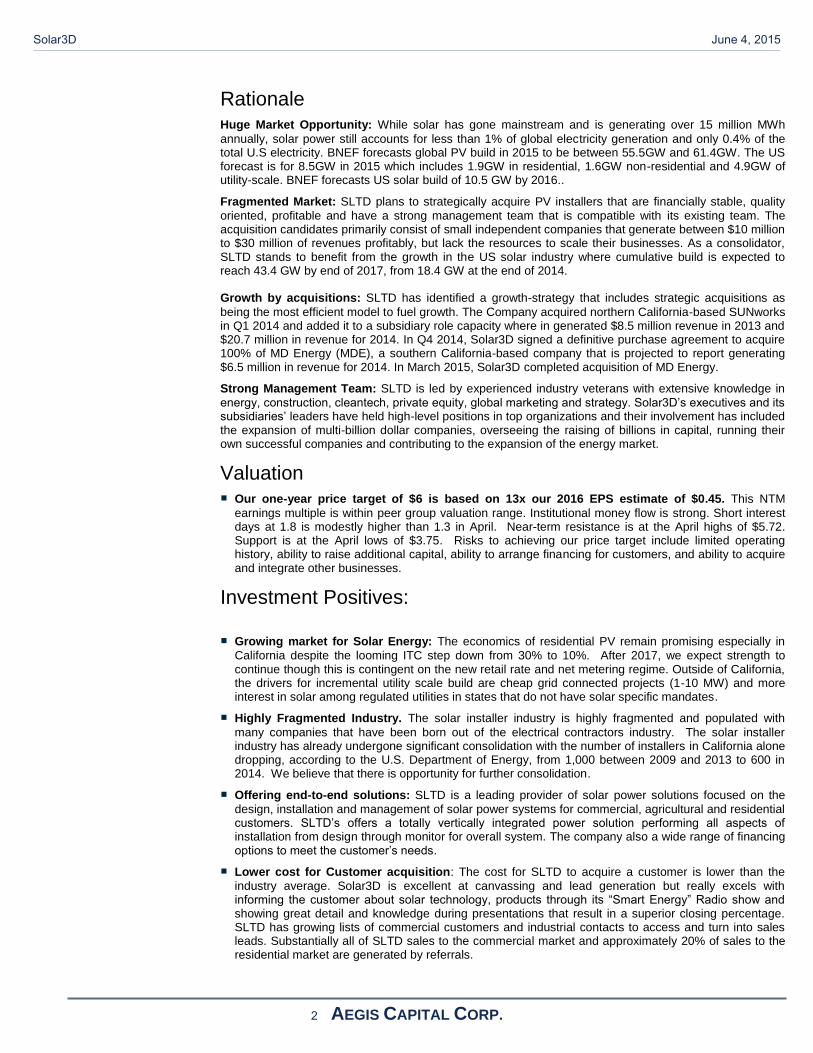
Company Description:Solar3D (SLTD) provides photo voltaic (PV) based power systemsfor the residential, commercial and agricultural markets in Californiaand Nevada. Through the two operating subsidiaries, SUNworks andMD Energy, SLTD designs, arranges financing, integrates, installs andmanages systems ranging in size from 2kW (kilowatt) for residentialloads to multi MW (megawatt) systems for larger commercial projects.
Solar3DRating: BuyAn Emerging Regional Player in US Solar
Investment Highlights:
Solar3D, Inc. (SLTD) designs, constructs, integrates, installs and maintainsresidential and commercial PV systems. The company is currently focused onthe large, fragmented California and Nevada installer markets. SLTD generatedrevenue of $16.5 million, operating loss of ($3.2) million and net loss of($3.3) million during the 12 months ended 3/31/15. SLTD reported cash andequivalents of $11.2 million at the end of 3/31/15.We are initiating coverage of SLTD with an Outperform rating and a one-year price target of $6 or about a 35% upside from current levels. SLTDis well positioned to benefit from growth in grid-connected projects in the 1-10MW range and a stronger residential market.Growing market for solar energy: The US solar market has a potentcombination of fresh opportunities and forward momentum. Bloomberg NewEnergy Finance (BNEF) estimates that 6.3 GW of solar PV was built in the USin 2014, versus 4.6 GW in2013. BNEF forecast US solar PV build of 8.5 GWin 2015 and 10.8 GW in 2016. The Investment Tax Credit (ITC) is scheduled tostep down from 30% to 10% at the end of 2016. Federal subsidies have been anecessary but not sufficient tool for solar growth. In such an environment, statesmust adjust subsidies to improve PV economics enough to make solar viable.Strong Regional Market : California continues to support a large share of thenew build in the PV market (52% in 2014). There are several other states withbig potential, such as Nevada, for utility-scale PV due to cheap land and highinsolation in the West. California and Nevada are SLTD focus markets. Whilethe solar installer industry has undergone significant consolidation, SLTD is wellpositioned to benefit from further consolidation.Offering end-to-end solutions: SLTD’s offers a totally vertically integratedpower solution performing all aspects of installation from design throughmonitor for overall system. The company also provides a wide range of financingoptions to meet the customer’s needs. A distinct advantage with SLTD is thatit has a superior management team, a focus on optimizing customer economics,and a reputation for doing quality work (continuous flow of repeat work).Also, the company’s regional focused acquisitions too, differentiates from thecompetitors in the spaceGrowth Strategy: Foremost, SLTD plans to continue to expand the reachand penetration of existing businesses. The company also plans to strategicallyacquire PV installers that are financially stable, profitable and have amanagement team that is compatible with SLTD existing team. The key to SLTDsuccessful roll-up strategy has been to buy the right company, with a goodtransaction structure, and with strong management in place.Positive Outlook: SLTD has provided 2015 guidance for revenue ranging from$40 million to $45 million compared to $20.2 million in 2014. Managementexpects to achieve sustainable positive EBITDA in 2015.
2 AEGIS CAPITAL CORP.
Rationale Huge Market Opportunity: While solar has gone mainstream and is generating over 15 million MWh
annually, solar power still accounts for less than 1% of global electricity generation and only 0.4% of the total U.S electricity. BNEF forecasts global PV build in 2015 to be between 55.5GW and 61.4GW. The US forecast is for 8.5GW in 2015 which includes 1.9GW in residential, 1.6GW non-residential and 4.9GW of utility-scale. BNEF forecasts US solar build of 10.5 GW by 2016..
Fragmented Market: SLTD plans to strategically acquire PV installers that are financially stable, quality
oriented, profitable and have a strong management team that is compatible with its existing team. The acquisition candidates primarily consist of small independent companies that generate between $10 million to $30 million of revenues profitably, but lack the resources to scale their businesses. As a consolidator, SLTD stands to benefit from the growth in the US solar industry where cumulative build is expected to reach 43.4 GW by end of 2017, from 18.4 GW at the end of 2014. Growth by acquisitions: SLTD has identified a growth-strategy that includes strategic acquisitions as
being the most efficient model to fuel growth. The Company acquired northern California-based SUNworks in Q1 2014 and added it to a subsidiary role capacity where in generated $8.5 million revenue in 2013 and $20.7 million in revenue for 2014. In Q4 2014, Solar3D signed a definitive purchase agreement to acquire 100% of MD Energy (MDE), a southern California-based company that is projected to report generating $6.5 million in revenue for 2014. In March 2015, Solar3D completed acquisition of MD Energy.
Strong Management Team: SLTD is led by experienced industry veterans with extensive knowledge in
energy, construction, cleantech, private equity, global marketing and strategy. Solar3D’s executives and its subsidiaries’ leaders have held high-level positions in top organizations and their involvement has included the expansion of multi-billion dollar companies, overseeing the raising of billions in capital, running their own successful companies and contributing to the expansion of the energy market.
Valuation Our one-year price target of $6 is based on 13x our 2016 EPS estimate of $0.45. This NTM
earnings multiple is within peer group valuation range. Institutional money flow is strong. Short interest days at 1.8 is modestly higher than 1.3 in April. Near-term resistance is at the April highs of $5.72. Support is at the April lows of $3.75. Risks to achieving our price target include limited operating history, ability to raise additional capital, ability to arrange financing for customers, and ability to acquire and integrate other businesses.
Investment Positives:
Growing market for Solar Energy: The economics of residential PV remain promising especially in
California despite the looming ITC step down from 30% to 10%. After 2017, we expect strength to continue though this is contingent on the new retail rate and net metering regime. Outside of California, the drivers for incremental utility scale build are cheap grid connected projects (1-10 MW) and more interest in solar among regulated utilities in states that do not have solar specific mandates.
Highly Fragmented Industry. The solar installer industry is highly fragmented and populated with
many companies that have been born out of the electrical contractors industry. The solar installer industry has already undergone significant consolidation with the number of installers in California alone dropping, according to the U.S. Department of Energy, from 1,000 between 2009 and 2013 to 600 in 2014. We believe that there is opportunity for further consolidation.
Offering end-to-end solutions: SLTD is a leading provider of solar power solutions focused on the
design, installation and management of solar power systems for commercial, agricultural and residential customers. SLTD’s offers a totally vertically integrated power solution performing all aspects of installation from design through monitor for overall system. The company also a wide range of financing options to meet the customer’s needs.
Lower cost for Customer acquisition: The cost for SLTD to acquire a customer is lower than the
industry average. Solar3D is excellent at canvassing and lead generation but really excels with informing the customer about solar technology, products through its “Smart Energy” Radio show and showing great detail and knowledge during presentations that result in a superior closing percentage. SLTD has growing lists of commercial customers and industrial contacts to access and turn into sales leads. Substantially all of SLTD sales to the commercial market and approximately 20% of sales to the residential market are generated by referrals.
Solar3D June 4, 2015
3 AEGIS CAPITAL CORP.
Investment Negatives: Losses since inception: SLTD has sustained net losses of $41 million and $16 million for 2014 and
2013, respectively. Since the company expects to incur additional expenditures in line with the sales growth of business, it may not achieve operating profits in the near future.
Limited operating history: Although SLTD was formed in Jan 2002; it did not begin selling solar
systems until the acquisition of SUNworks in January 2014. SLTD success will depend in large part on its ability to continue to successfully sell solar systems in California and Nevada against determined competition, to consummate synergistic acquisitions, and on the industry’s acceptance of its 3D solar cell technology as an alternative to traditional energy sources.
Dilution: SLTD acquired two companies back to back in Jan 2014 (SUNworks) and MD Energy in
March 2015. We see share dilution through additional acquisitions.
Industry is still evolving: Distributed residential solar energy has yet to achieve broad market
adoption as evidenced by the fact that distributed solar has penetrated less than 1% of its total addressable market in the U.S. residential sector. A reduction in utility electricity prices would make the purchase or the lease of its solar energy systems less economically attractive.
Government Incentives: US government bodies provide incentives to end users, distributors, system
integrators and manufacturers of solar energy systems to promote solar electricity. If these incentives might expire on a particular date, end when the allocated funding is exhausted, or be reduced or terminated as solar energy adoption rates increase. These reductions or terminations often occur without warning. The federal government currently offers a 30% investment tax credit under Section 48(a) of the Internal Revenue Code, or the Federal ITC, for the installation of certain solar power facilities until December 31, 2016. This credit is due to adjust to 10% in 2017.
Government Regulation: Federal, state and local government regulations and policies concerning the
electric utility industry, heavily influence the market for electricity generation products and services. These regulations and policies often relate to electricity pricing and the interconnection of customer-owned electricity generation. In the United States, governments and utilities continuously modify these regulations and policies.
Recent Financial Results
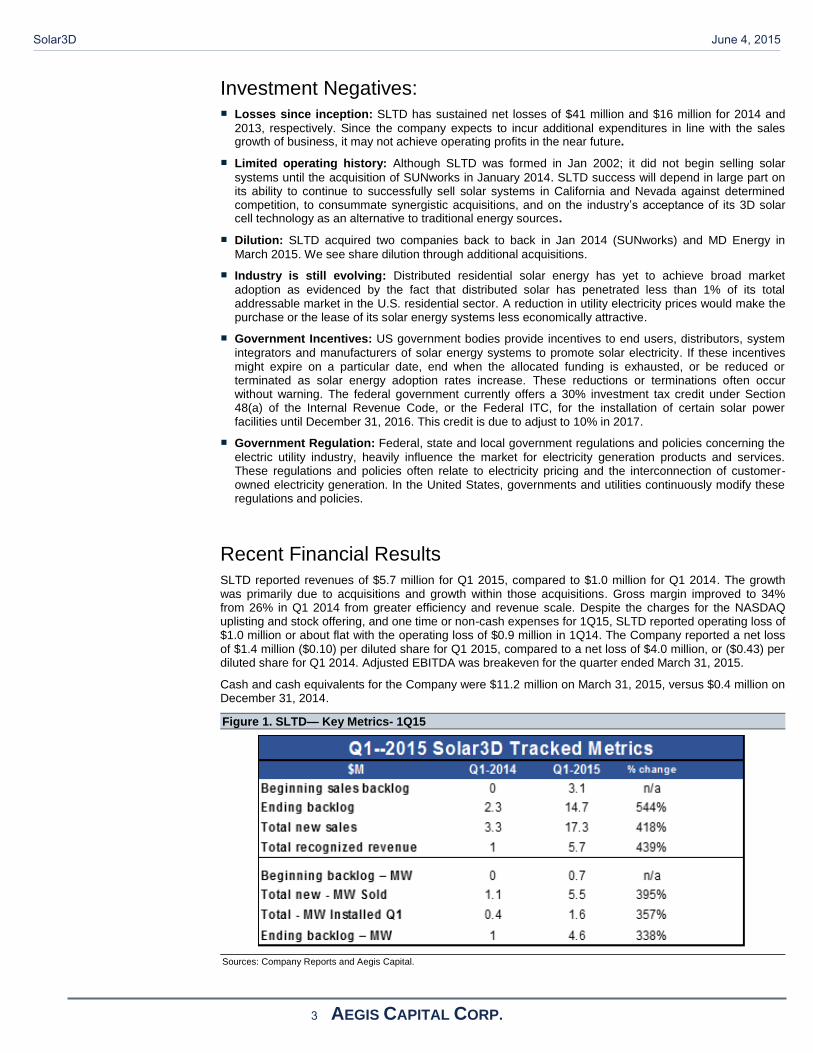
SLTD reported revenues of $5.7 million for Q1 2015, compared to $1.0 million for Q1 2014. The growth was primarily due to acquisitions and growth within those acquisitions. Gross margin improved to 34% from 26% in Q1 2014 from greater efficiency and revenue scale. Despite the charges for the NASDAQ uplisting and stock offering, and one time or non-cash expenses for 1Q15, SLTD reported operating loss of $1.0 million or about flat with the operating loss of $0.9 million in 1Q14. The Company reported a net loss of $1.4 million ($0.10) per diluted share for Q1 2015, compared to a net loss of $4.0 million, or ($0.43) per diluted share for Q1 2014. Adjusted EBITDA was breakeven for the quarter ended March 31, 2015.
Cash and cash equivalents for the Company were $11.2 million on March 31, 2015, versus $0.4 million on December 31, 2014.
Figure 1. SLTD— Key Metrics- 1Q15
Sources: Company Reports and Aegis Capital.
Solar3D June 4, 2015
4 AEGIS CAPITAL CORP.
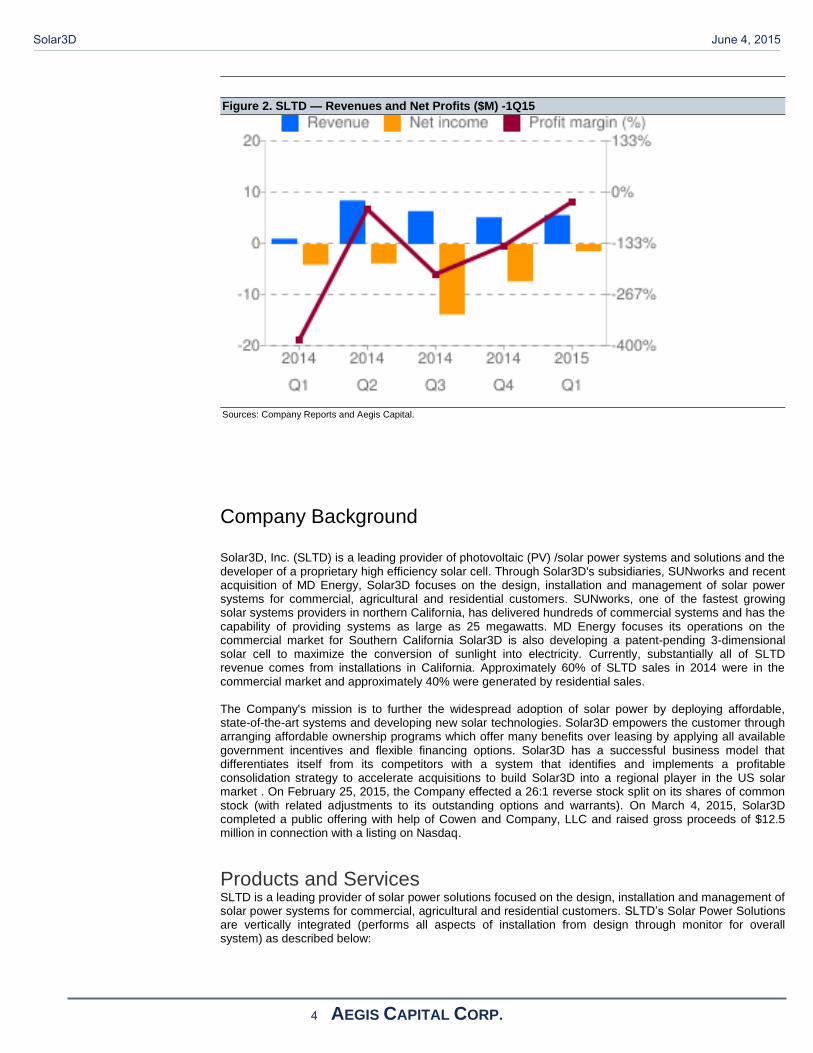
Figure 2. SLTD — Revenues and Net Profits ($M) -1Q15
Sources: Company Reports and Aegis Capital.
Company Background Solar3D, Inc. (SLTD) is a leading provider of photovoltaic (PV) /solar power systems and solutions and the developer of a proprietary high efficiency solar cell. Through Solar3D's subsidiaries, SUNworks and recent acquisition of MD Energy, Solar3D focuses on the design, installation and management of solar power systems for commercial, agricultural and residential customers. SUNworks, one of the fastest growing solar systems providers in northern California, has delivered hundreds of commercial systems and has the capability of providing systems as large as 25 megawatts. MD Energy focuses its operations on the commercial market for Southern California Solar3D is also developing a patent-pending 3-dimensional solar cell to maximize the conversion of sunlight into electricity. Currently, substantially all of SLTD revenue comes from installations in California. Approximately 60% of SLTD sales in 2014 were in the commercial market and approximately 40% were generated by residential sales. The Company's mission is to further the widespread adoption of solar power by deploying affordable, state-of-the-art systems and developing new solar technologies. Solar3D empowers the customer through arranging affordable ownership programs which offer many benefits over leasing by applying all available government incentives and flexible financing options. Solar3D has a successful business model that differentiates itself from its competitors with a system that identifies and implements a profitable consolidation strategy to accelerate acquisitions to build Solar3D into a regional player in the US solar market . On February 25, 2015, the Company effected a 26:1 reverse stock split on its shares of common stock (with related adjustments to its outstanding options and warrants). On March 4, 2015, Solar3D completed a public offering with help of Cowen and Company, LLC and raised gross proceeds of $12.5 million in connection with a listing on Nasdaq.
Products and Services SLTD is a leading provider of solar power solutions focused on the design, installation and management of solar power systems for commercial, agricultural and residential customers. SLTD’s Solar Power Solutions are vertically integrated (performs all aspects of installation from design through monitor for overall system) as described below:
Solar3D June 4, 2015

5 AEGIS CAPITAL CORP.
Figure 3. SLTD’s Power Solutions- Vertically Integrated Solar Solutions Model
Sources: Company and Aegis Capital
Roof-Mounted Systems - A roof mounted solar system can range from small 2KW systems to large
megawatt systems. The solar panels are lightweight and can be installed on any roof style. Roof mounted systems come with up to a 25 year production warranty Ground-Mounted Systems - A ground-mounted solar system is an alternative for owners who have roof
issues or open property. Ground-mounted systems are designed to make the most of the available space and sunlight while remaining easy to maintain. These systems are designed to withstand all wind up-lift zoning requirements and come with a 25 year production warranty. Post-Mounted Systems - Pole-mounted solar systems allow for homes, farms, or businesses to generate
electricity in highly visible and efficient locations without shading or directional issues. Pole-mount systems are placed on a fixed platform and positioned to capture optimal sunlight. Unlike roof-mounted systems, a pole-mount solar system does not involve any building attachment and is a highly beneficial, low cost option for owners with minimal roof or land space. Carport Systems - A carport or trellis solar system is a viable solution for the residential or commercial
business owner looking to take advantage of solar power without sacrificing valuable parking, or large portions of expensive real estate. New carport or trellis structures can be custom built or existing carports can be modified to provide shaded or covered parking. Custom-designed solar carport or trellis systems require virtually no maintenance and allow the panels to be positioned for optimal energy production. Tilted Single Axis Trackers - Tilted single axis trackers offer optimal efficiency and solar tracking
capabilities by tracking the sun throughout the day. The motors in the single axis trackers move with the earth's orbit allowing 20% more power to be captured than a fixed solar array. Duel Axis Trackers - A dual-axis tracker can produce 30% more electricity than stationary solar arrays.
This is achieved because the array follows the daily movement of the sun from east to west, as well as its change in altitude through the seasons. Although the initial cost of a dual axis tracking system can be higher than a stationary system, the dual axis tracker produces more electricity making it possible to use fewer panels to provide the same amount of electricity. Dual axis trackers can also be a viable solution for property owners that prefer not to cover large portions of their land with ground mounted solar arrays.
Solar3D June 4, 2015

6 AEGIS CAPITAL CORP.
Technology SLTD has developed a patent-pending 3-dimensional solar cell technology that has the potential to increase PV conversion efficiency thereby reducing the cost of the electricity generated.
Effficient Design: SLTD’s revolutionary 3-dimensional silicon solar cell is designed to maximize the
conversion of sunlight into electricity. SLTD has developed two breakthrough features in its single wafer silicon solar cell that will deliver benefits that have eluded the solar industry to date.
High Efficiency – The innovative solar cell technology utilizes a 3-dimensional design to
increase the conversion efficiency by trapping sunlight inside photovoltaic micro-structures where photons bounce around until they are converted into electrons.
Wide Angle Light Collection - Solar cell has a special wide angle feature on the surface to
capture more light in the morning and evening hours, as well as in the winter months when the sun is not directly overhead.
SLTD estimate that its patent-pending 3-dimensional cell has higher efficiency than conventional solar cells. This is expected tro reduce the investment payback period of solar panel systems. The graph below compares the company’s projected efficiency with a conventional solar cell across a range of incident sun angles.
Figure 4. A comparative study of SLTD solar cell versus a Standard cell
Sources: Company and Aegis Capital
Wide Angle Light Collection: Conventional solar cells become dramatically less efficient if the sun is not
shining within a narrow range of incident angles. Sunlight that hits the cell outside of this range will be reflected off, and the reduced light energy causes the cell's internal efficiency to drop. Because of a unique wide angle design, the company’s solar cell can maintain its high efficiency over a wider range of incident angles. It can capture more light in the morning and evening hours, as well as in the winter months when the sun is not directly overhead. The key to this breakthrough is a special design on the cell surface that collects sunlight over a wide range of angles. The collected light is then forced into 3-dimensional photovoltaic micro-structures beneath the cell surface that trap the light and convert it into electricity. As the sun moves across the sky, throughout the day or year, the Solar3D cell will be able to maintain its high conversion efficiency, as if the sun was directly above it.
Solar3D June 4, 2015
7 AEGIS CAPITAL CORP.
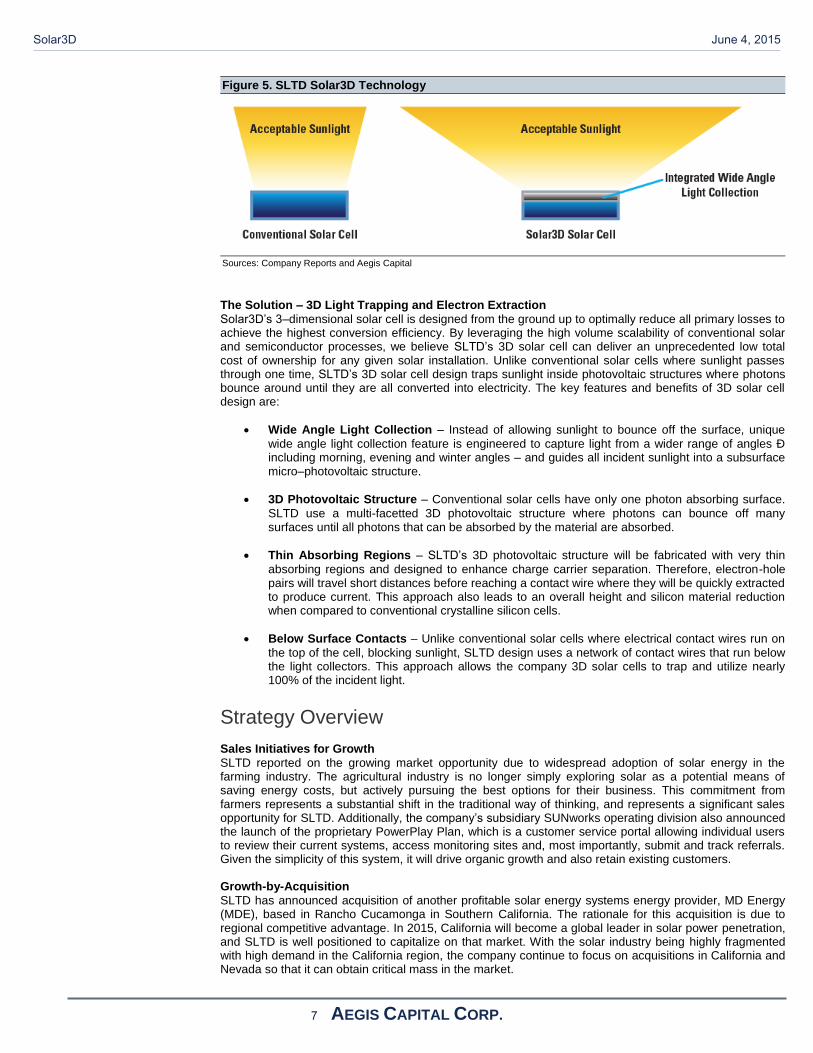
Figure 5. SLTD Solar3D Technology
Sources: Company Reports and Aegis Capital
The Solution – 3D Light Trapping and Electron Extraction
Solar3D’s 3–dimensional solar cell is designed from the ground up to optimally reduce all primary losses to achieve the highest conversion efficiency. By leveraging the high volume scalability of conventional solar and semiconductor processes, we believe SLTD’s 3D solar cell can deliver an unprecedented low total cost of ownership for any given solar installation. Unlike conventional solar cells where sunlight passes through one time, SLTD’s 3D solar cell design traps sunlight inside photovoltaic structures where photons bounce around until they are all converted into electricity. The key features and benefits of 3D solar cell design are:
Wide Angle Light Collection – Instead of allowing sunlight to bounce off the surface, unique
wide angle light collection feature is engineered to capture light from a wider range of angles Ð including morning, evening and winter angles – and guides all incident sunlight into a subsurface micro–photovoltaic structure.
3D Photovoltaic Structure – Conventional solar cells have only one photon absorbing surface.
SLTD use a multi-facetted 3D photovoltaic structure where photons can bounce off many surfaces until all photons that can be absorbed by the material are absorbed.
Thin Absorbing Regions – SLTD’s 3D photovoltaic structure will be fabricated with very thin
absorbing regions and designed to enhance charge carrier separation. Therefore, electron-hole pairs will travel short distances before reaching a contact wire where they will be quickly extracted to produce current. This approach also leads to an overall height and silicon material reduction when compared to conventional crystalline silicon cells.
Below Surface Contacts – Unlike conventional solar cells where electrical contact wires run on
the top of the cell, blocking sunlight, SLTD design uses a network of contact wires that run below the light collectors. This approach allows the company 3D solar cells to trap and utilize nearly 100% of the incident light.
Strategy Overview Sales Initiatives for Growth
SLTD reported on the growing market opportunity due to widespread adoption of solar energy in the farming industry. The agricultural industry is no longer simply exploring solar as a potential means of saving energy costs, but actively pursuing the best options for their business. This commitment from farmers represents a substantial shift in the traditional way of thinking, and represents a significant sales opportunity for SLTD. Additionally, the company’s subsidiary SUNworks operating division also announced the launch of the proprietary PowerPlay Plan, which is a customer service portal allowing individual users to review their current systems, access monitoring sites and, most importantly, submit and track referrals. Given the simplicity of this system, it will drive organic growth and also retain existing customers. Growth-by-Acquisition
SLTD has announced acquisition of another profitable solar energy systems energy provider, MD Energy (MDE), based in Rancho Cucamonga in Southern California. The rationale for this acquisition is due to regional competitive advantage. In 2015, California will become a global leader in solar power penetration, and SLTD is well positioned to capitalize on that market. With the solar industry being highly fragmented with high demand in the California region, the company continue to focus on acquisitions in California and Nevada so that it can obtain critical mass in the market.
Solar3D June 4, 2015
8 AEGIS CAPITAL CORP.
Customer acquisition: The cost for Solar3D to acquire a customer is lower than the industry average.
Solar3D is excellent at canvassing and lead generation but really excels with informing the customer about solar technology, products through its “Smart Energy” Radio show and showing great detail and knowledge during presentations that result in a superior closing percentage. Solar3D has growing lists of commercial customers and industrial contacts to access and turn into sales leads. Reputation: Solar3D and its subsidiaries have a sterling reputation in the industry for having high integrity,
great work ethic, and standing behind its work. Solar3D prides itself of delivering what it believes to be the highest quality installation at any price offering better quality and customer service by a substantial margin. Because of Solar3D’s customer-centric focus, its customers essentially sell for them with strong repeat clients and an active and loyal referral network. Affordability: Solar3D, through its subsidiaries, empowers the customer through ownership programs by
applying all available government incentives and flexible financing options. Owning as opposed to leasing offers many advantages as there are many leasing risks and challenges such as defaults, ownership change, renegotiations. The Company has been awarded contracts over even the largest competitors due to its subsidiary’s local presence and comparatively superior knowledge of complex and customized solar systems and financing options.
North American PV Market Outlook
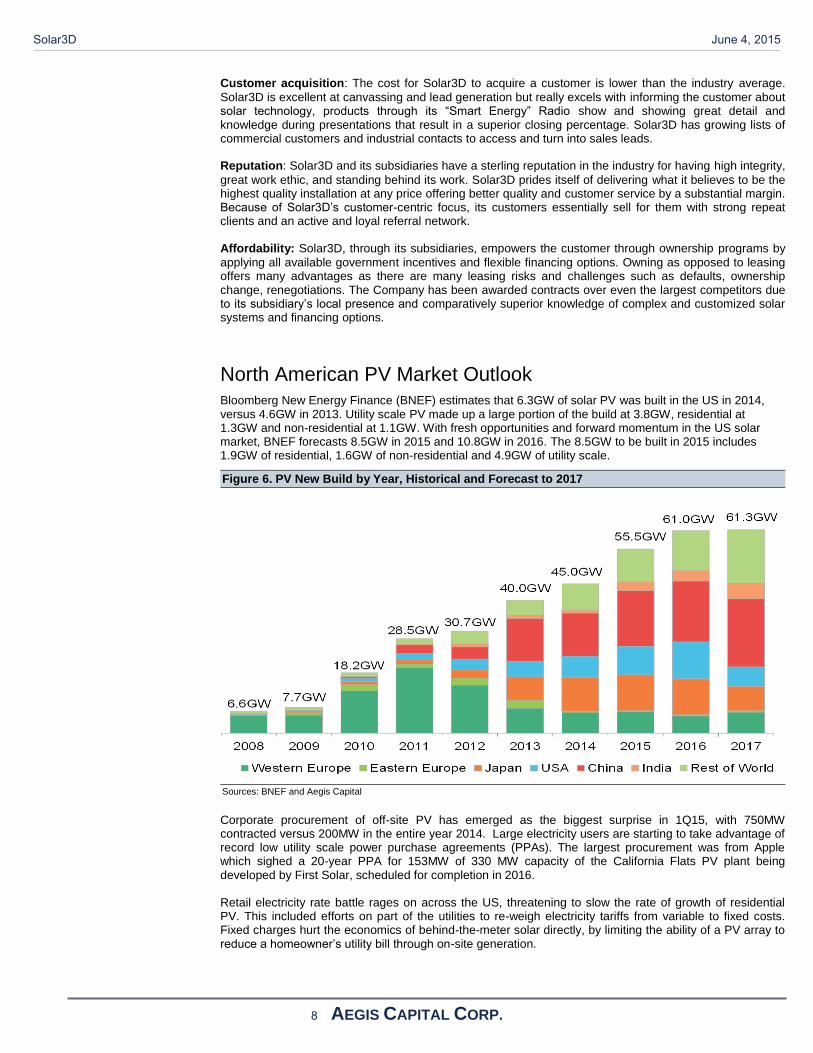
Bloomberg New Energy Finance (BNEF) estimates that 6.3GW of solar PV was built in the US in 2014, versus 4.6GW in 2013. Utility scale PV made up a large portion of the build at 3.8GW, residential at 1.3GW and non-residential at 1.1GW. With fresh opportunities and forward momentum in the US solar market, BNEF forecasts 8.5GW in 2015 and 10.8GW in 2016. The 8.5GW to be built in 2015 includes 1.9GW of residential, 1.6GW of non-residential and 4.9GW of utility scale.
Figure 6. PV New Build by Year, Historical and Forecast to 2017
Sources: BNEF and Aegis Capital
Corporate procurement of off-site PV has emerged as the biggest surprise in 1Q15, with 750MW contracted versus 200MW in the entire year 2014. Large electricity users are starting to take advantage of record low utility scale power purchase agreements (PPAs). The largest procurement was from Apple which sighed a 20-year PPA for 153MW of 330 MW capacity of the California Flats PV plant being developed by First Solar, scheduled for completion in 2016. Retail electricity rate battle rages on across the US, threatening to slow the rate of growth of residential PV. This included efforts on part of the utilities to re-weigh electricity tariffs from variable to fixed costs. Fixed charges hurt the economics of behind-the-meter solar directly, by limiting the ability of a PV array to reduce a homeowner’s utility bill through on-site generation.
Solar3D June 4, 2015
9 AEGIS CAPITAL CORP.
The US yieldco boom is showing few signs of letting up, after several new announcements. Most prominently, First Solar and SunPower will create a 50/50 joint venture yieldco called 8point3 Energy Partners. Other players rumored to have similar plans include Canadian Solar and Jinko. The Investment Tax Credit (ITC) is scheduled to step down from 30% to 10% at the end of 2016. Tax groups led by the Solar Energy Industries Association (SEIA) are pushing for an extension but a minority in the industry believe that solar can thrive in the US without the subsidies. With the state subsidy programs no longer needed in California and a handful of other states, the main policy debate is shifting to retail rate and net metering policy. Regulators in different states are exploring a variety of approaches, from fees (AZ) to fixed charges (CA) to specific tariffs based on custom valuations of solar electricity (MN). California continues to support a large share of the new build in the PV market, estimated at 52% in 2014 and declining to 43% by 2017. There is also large potential in Texas for utility scale PV due to cheap land and high insolation in the West. South Carolina also features cheap solar driven by low labor costs, with relatively high retail rates and favorable state policy. The US-China trade dispute made news through 2014. Most recently, the Department of Commerce has proposed to cut the tariffs from 29% to 15% for most solar products featuring Chinese cells. These proposals will not affect the tariffs until finalized in May.
Policy, Demand, and Market Dynamics
Behind-the-meter solar (solar projects producing power mainly for consumption by the owner or host) dominates most of the news in the US. However, utility scale solar continues to deliver more capacity to the market, with increasing geographic diversity.
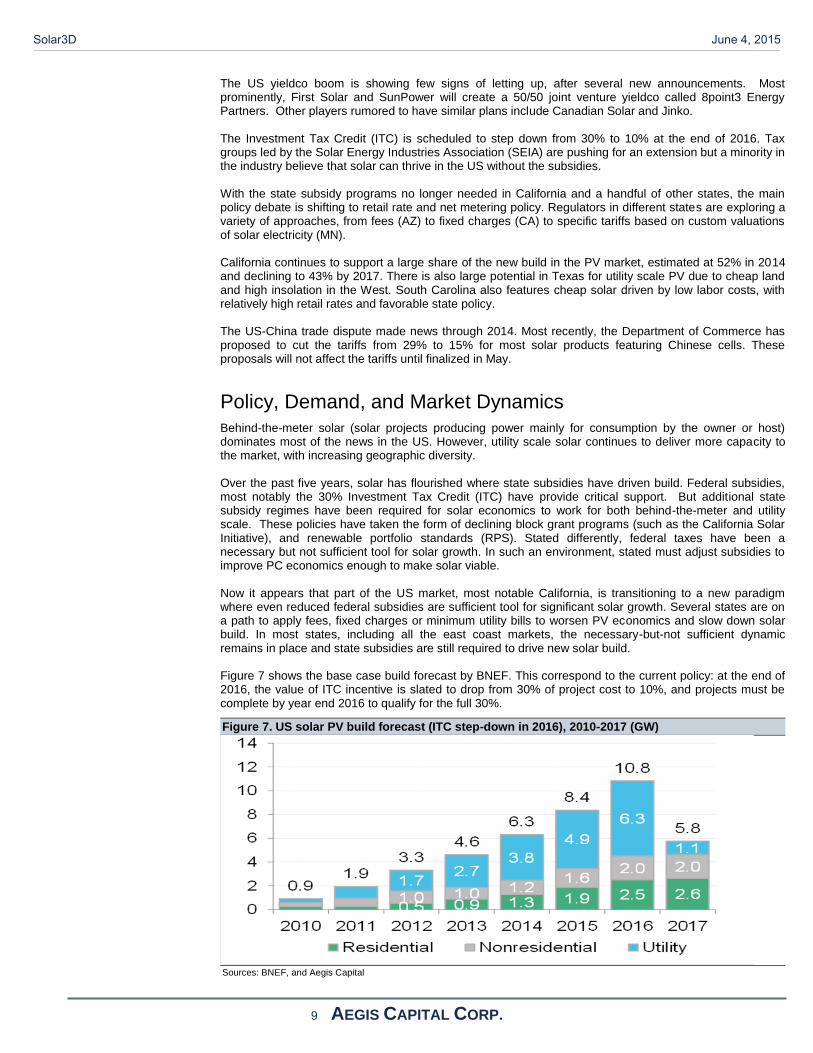
Over the past five years, solar has flourished where state subsidies have driven build. Federal subsidies, most notably the 30% Investment Tax Credit (ITC) have provide critical support. But additional state subsidy regimes have been required for solar economics to work for both behind-the-meter and utility scale. These policies have taken the form of declining block grant programs (such as the California Solar Initiative), and renewable portfolio standards (RPS). Stated differently, federal taxes have been a necessary but not sufficient tool for solar growth. In such an environment, stated must adjust subsidies to improve PC economics enough to make solar viable. Now it appears that part of the US market, most notable California, is transitioning to a new paradigm where even reduced federal subsidies are sufficient tool for significant solar growth. Several states are on a path to apply fees, fixed charges or minimum utility bills to worsen PV economics and slow down solar build. In most states, including all the east coast markets, the necessary-but-not sufficient dynamic remains in place and state subsidies are still required to drive new solar build. Figure 7 shows the base case build forecast by BNEF. This correspond to the current policy: at the end of 2016, the value of ITC incentive is slated to drop from 30% of project cost to 10%, and projects must be complete by year end 2016 to qualify for the full 30%.
Figure 7. US solar PV build forecast (ITC step-down in 2016), 2010-2017 (GW)
Sources: BNEF, and Aegis Capital
Solar3D June 4, 2015
10 AEGIS CAPITAL CORP.
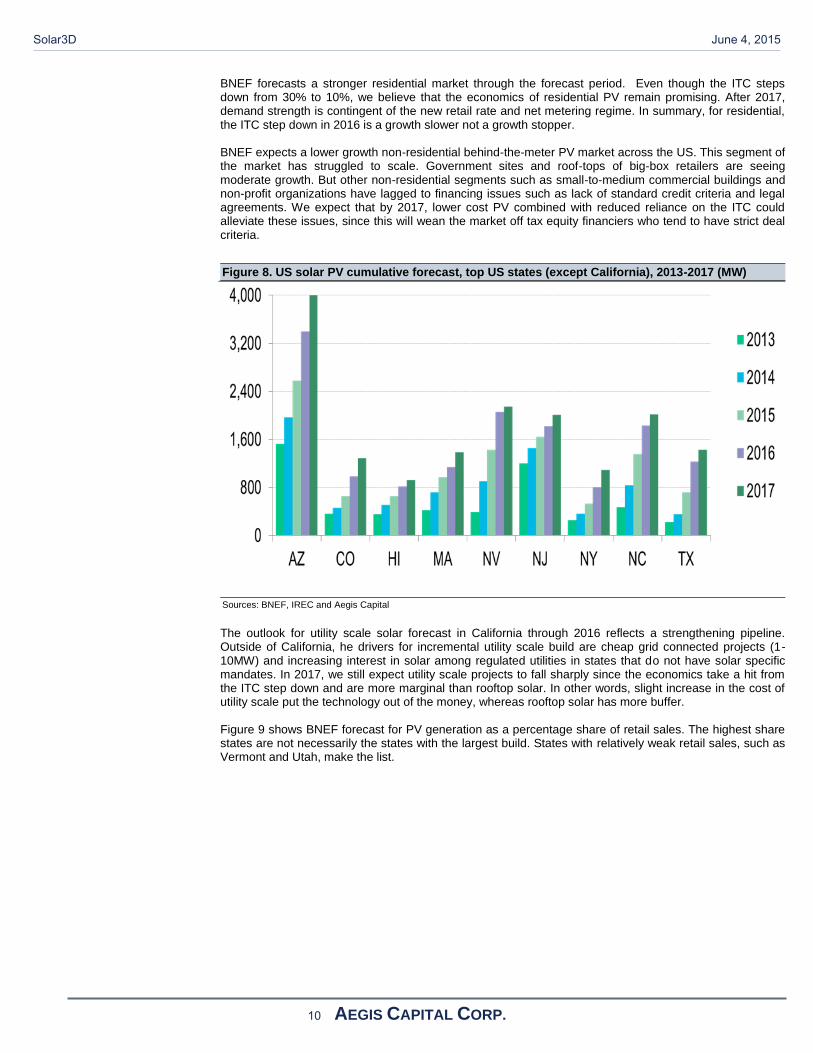
BNEF forecasts a stronger residential market through the forecast period. Even though the ITC steps down from 30% to 10%, we believe that the economics of residential PV remain promising. After 2017, demand strength is contingent of the new retail rate and net metering regime. In summary, for residential, the ITC step down in 2016 is a growth slower not a growth stopper. BNEF expects a lower growth non-residential behind-the-meter PV market across the US. This segment of the market has struggled to scale. Government sites and roof-tops of big-box retailers are seeing moderate growth. But other non-residential segments such as small-to-medium commercial buildings and non-profit organizations have lagged to financing issues such as lack of standard credit criteria and legal agreements. We expect that by 2017, lower cost PV combined with reduced reliance on the ITC could alleviate these issues, since this will wean the market off tax equity financiers who tend to have strict deal criteria.
Figure 8. US solar PV cumulative forecast, top US states (except California), 2013-2017 (MW)
Sources: BNEF, IREC and Aegis Capital
The outlook for utility scale solar forecast in California through 2016 reflects a strengthening pipeline. Outside of California, he drivers for incremental utility scale build are cheap grid connected projects (1-10MW) and increasing interest in solar among regulated utilities in states that do not have solar specific mandates. In 2017, we still expect utility scale projects to fall sharply since the economics take a hit from the ITC step down and are more marginal than rooftop solar. In other words, slight increase in the cost of utility scale put the technology out of the money, whereas rooftop solar has more buffer. Figure 9 shows BNEF forecast for PV generation as a percentage share of retail sales. The highest share states are not necessarily the states with the largest build. States with relatively weak retail sales, such as Vermont and Utah, make the list.
Solar3D June 4, 2015

11 AEGIS CAPITAL CORP.
Figure 9. US PV generation as a % share of retail sales, top US states, 2013-2017
Sources: BNEF, IREC, EIA and Aegis Capital
The ITC Extension
According to current law, the Business Energy Investment Tax Credit (ITC) for business owned solar falls from 30% to 10% at the end of 2016. The Residential Renewable Energy ITC for personally owned solar expires completely at the end of 2016. A PV array owned by a company such as SolarCity or Vivint Solar receives the business ITC, even if the array is hosted by a homeowner through a solar lease or PPA. System size or even host type is not important. What matters is whether an individual or business owns the system and pays the taxes. The solar industry is pushing for an extension of both ITCs. Industry groups led by SEIA seem to be optimistic about an extension. However, the industry is not speaking together with one voice. There is a vocal minority that believes that the federal tax credit causes market distortions, in that it encourages reliance on expensive tax equity providers. This group argues that the ITC should be left behind as soon as possible, since several US states are close to grid parity.
State Policy Trends
As the ITC begins to lose prominence, state and utility retail rate and net metering policies are collectively rising to the forefront. States have variety of goals in mind for these policies. These include fixed charges, minimum bill and valuating the solar tariff. State policy responses include efforts to assess fairness between solar and non-solar customers. Solar array hosts that pay nothing to their utility take advantage of the grid to power homes at night and to soak up excess PV generation by day. There are also initiatives to slow down solar build due to grid concerns. In some states, especially Hawaii and California, build has grown so fast that states need to slow it down while grid upgrades are made. Other state policies may attempt to approximate the actual benefits (and costs) of solar generation. This is explicit in the value of solar tariff, where avoided fuel costs, deferred transmission investments and environmental externalities are incorporated into a calculated rate.
Rise of Residential Loans
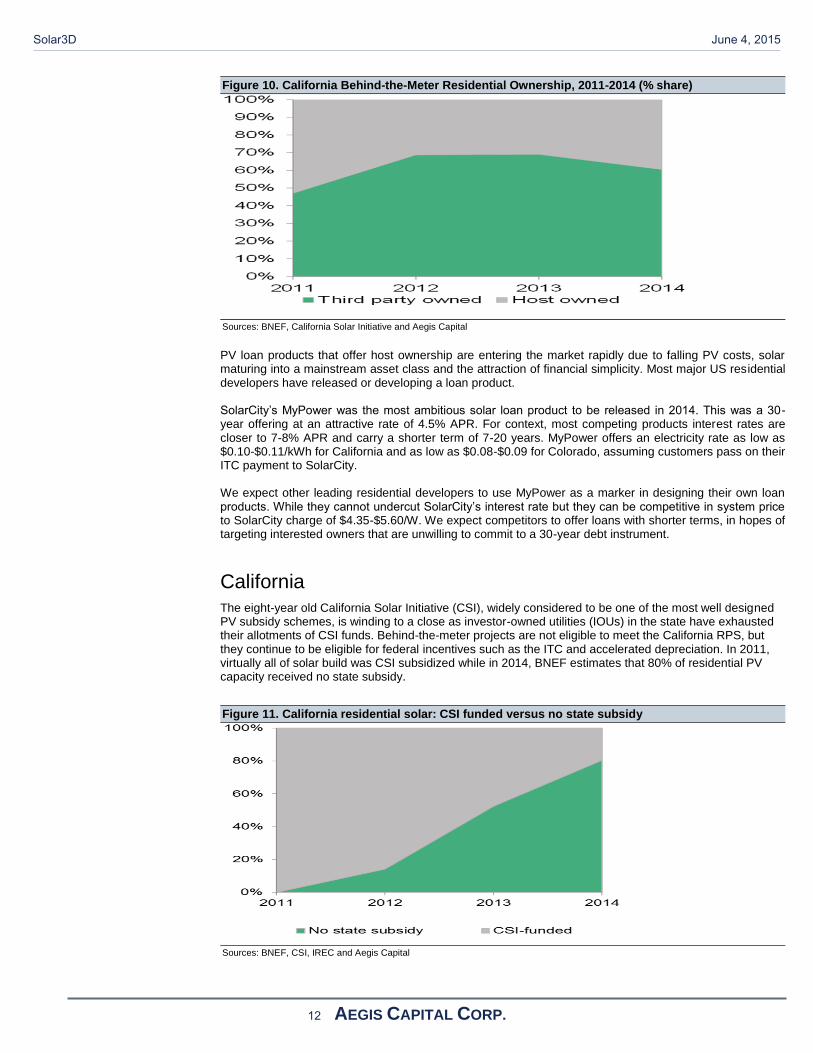
In the past years, third-party owned (TPO) solar developers were responsible for most new residential build, reaching a high of 68% in California 2013.
Solar3D June 4, 2015
12 AEGIS CAPITAL CORP.
Figure 10. California Behind-the-Meter Residential Ownership, 2011-2014 (% share)
Sources: BNEF, California Solar Initiative and Aegis Capital
PV loan products that offer host ownership are entering the market rapidly due to falling PV costs, solar maturing into a mainstream asset class and the attraction of financial simplicity. Most major US residential developers have released or developing a loan product. SolarCity’s MyPower was the most ambitious solar loan product to be released in 2014. This was a 30-year offering at an attractive rate of 4.5% APR. For context, most competing products interest rates are closer to 7-8% APR and carry a shorter term of 7-20 years. MyPower offers an electricity rate as low as $0.10-$0.11/kWh for California and as low as $0.08-$0.09 for Colorado, assuming customers pass on their ITC payment to SolarCity. We expect other leading residential developers to use MyPower as a marker in designing their own loan products. While they cannot undercut SolarCity’s interest rate but they can be competitive in system price to SolarCity charge of $4.35-$5.60/W. We expect competitors to offer loans with shorter terms, in hopes of targeting interested owners that are unwilling to commit to a 30-year debt instrument.
California
The eight-year old California Solar Initiative (CSI), widely considered to be one of the most well designed PV subsidy schemes, is winding to a close as investor-owned utilities (IOUs) in the state have exhausted their allotments of CSI funds. Behind-the-meter projects are not eligible to meet the California RPS, but they continue to be eligible for federal incentives such as the ITC and accelerated depreciation. In 2011, virtually all of solar build was CSI subsidized while in 2014, BNEF estimates that 80% of residential PV capacity received no state subsidy.
Figure 11. California residential solar: CSI funded versus no state subsidy
Sources: BNEF, CSI, IREC and Aegis Capital
Solar3D June 4, 2015
13 AEGIS CAPITAL CORP.
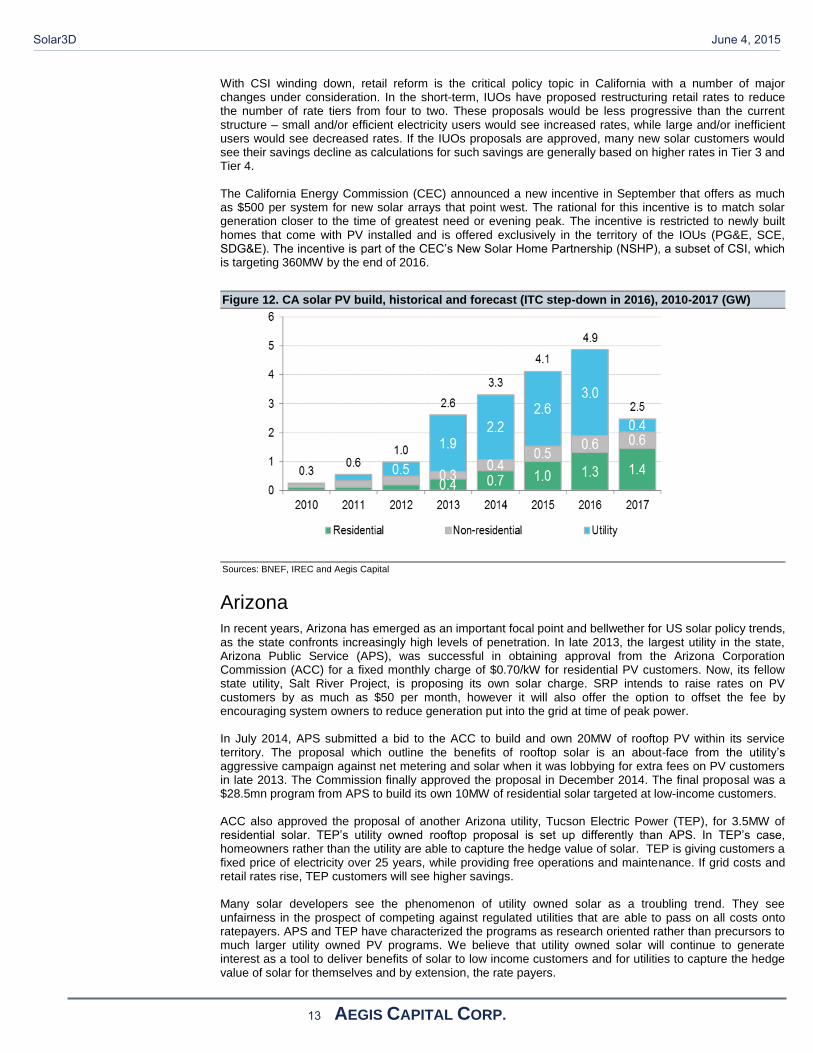
With CSI winding down, retail reform is the critical policy topic in California with a number of major changes under consideration. In the short-term, IUOs have proposed restructuring retail rates to reduce the number of rate tiers from four to two. These proposals would be less progressive than the current structure – small and/or efficient electricity users would see increased rates, while large and/or inefficient users would see decreased rates. If the IUOs proposals are approved, many new solar customers would see their savings decline as calculations for such savings are generally based on higher rates in Tier 3 and Tier 4. The California Energy Commission (CEC) announced a new incentive in September that offers as much as $500 per system for new solar arrays that point west. The rational for this incentive is to match solar generation closer to the time of greatest need or evening peak. The incentive is restricted to newly built homes that come with PV installed and is offered exclusively in the territory of the IOUs (PG&E, SCE, SDG&E). The incentive is part of the CEC’s New Solar Home Partnership (NSHP), a subset of CSI, which is targeting 360MW by the end of 2016.
Figure 12. CA solar PV build, historical and forecast (ITC step-down in 2016), 2010-2017 (GW)
Sources: BNEF, IREC and Aegis Capital
Arizona
In recent years, Arizona has emerged as an important focal point and bellwether for US solar policy trends, as the state confronts increasingly high levels of penetration. In late 2013, the largest utility in the state, Arizona Public Service (APS), was successful in obtaining approval from the Arizona Corporation Commission (ACC) for a fixed monthly charge of $0.70/kW for residential PV customers. Now, its fellow state utility, Salt River Project, is proposing its own solar charge. SRP intends to raise rates on PV customers by as much as $50 per month, however it will also offer the option to offset the fee by encouraging system owners to reduce generation put into the grid at time of peak power. In July 2014, APS submitted a bid to the ACC to build and own 20MW of rooftop PV within its service territory. The proposal which outline the benefits of rooftop solar is an about-face from the utility’s aggressive campaign against net metering and solar when it was lobbying for extra fees on PV customers in late 2013. The Commission finally approved the proposal in December 2014. The final proposal was a $28.5mn program from APS to build its own 10MW of residential solar targeted at low-income customers. ACC also approved the proposal of another Arizona utility, Tucson Electric Power (TEP), for 3.5MW of residential solar. TEP’s utility owned rooftop proposal is set up differently than APS. In TEP’s case, homeowners rather than the utility are able to capture the hedge value of solar. TEP is giving customers a fixed price of electricity over 25 years, while providing free operations and maintenance. If grid costs and retail rates rise, TEP customers will see higher savings. Many solar developers see the phenomenon of utility owned solar as a troubling trend. They see unfairness in the prospect of competing against regulated utilities that are able to pass on all costs onto ratepayers. APS and TEP have characterized the programs as research oriented rather than precursors to much larger utility owned PV programs. We believe that utility owned solar will continue to generate interest as a tool to deliver benefits of solar to low income customers and for utilities to capture the hedge value of solar for themselves and by extension, the rate payers.
Solar3D June 4, 2015

14 AEGIS CAPITAL CORP.
Capex Trends
The capex of solar in the US is as low as $1.68/W for utility scale in North Carolina and as high as $4.54/W for residential in Hawaii. Labor markets, regulatory burden, subsidy design and competition all drive a wide variance from state to state. The US residential segment shows the widest range of costs across states, which is mostly attributable to the cost of labor. EPC margins are a comparatively minor source of regional differentiation. The system prices for US residential solar appear to be much higher than more mature solar markets such as Germany and Italy. According to German Fraunhofer Institute, commercial systems can be built for $1.40/W and residential systems are below $2.00/W. The main reasons that US residential solar are more expensive than European offerings include more labor time, higher acquisition costs and higher fixed costs.
Figure 13. US Residential PV Cost Estimated, 5KW Rooftop, $/W
Sources: BNEF, Company Reports and Aegis Capital
Residentially arrays typically take one or two days to build. German and Italian arrays are reportedly built in about half a day. We believe this reflects more complex and less streamlined technical requirements for grid interconnection in the US versus Germany. This is due to the fragmentation of the US regulatory regime – federal, state, country and municipality.
Solar3D June 4, 2015
15 AEGIS CAPITAL CORP.
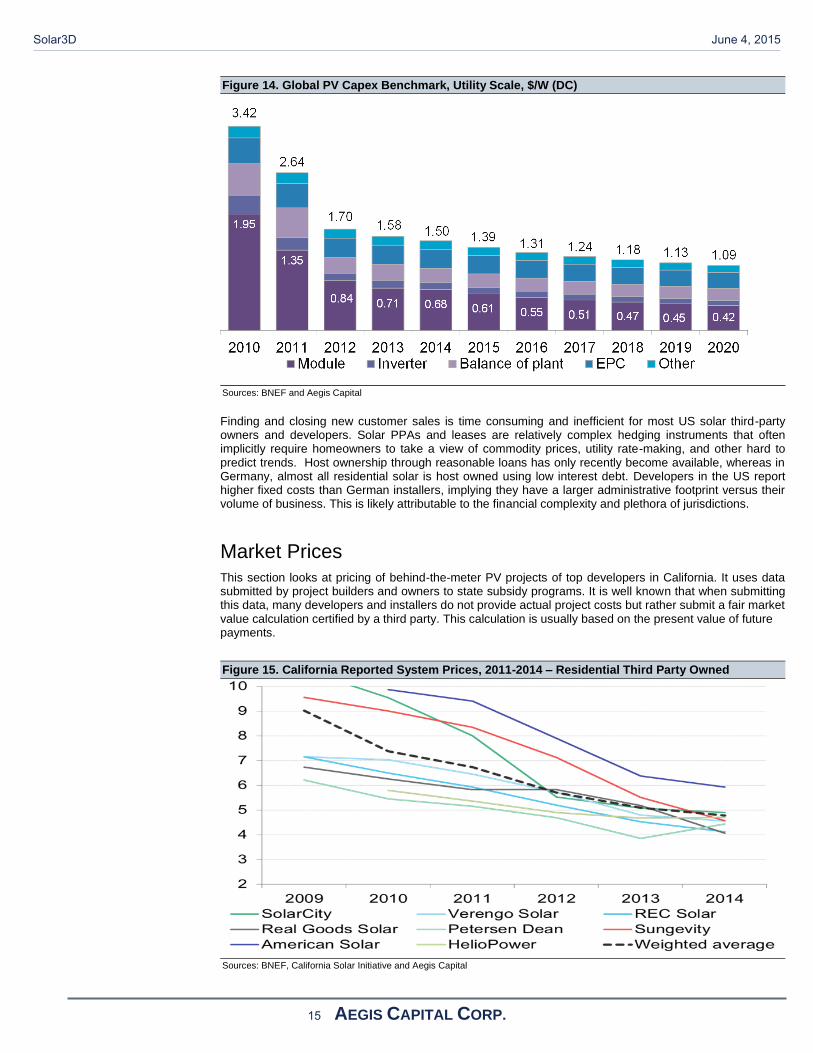
Figure 14. Global PV Capex Benchmark, Utility Scale, $/W (DC)
Sources: BNEF and Aegis Capital
Finding and closing new customer sales is time consuming and inefficient for most US solar third-party owners and developers. Solar PPAs and leases are relatively complex hedging instruments that often implicitly require homeowners to take a view of commodity prices, utility rate-making, and other hard to predict trends. Host ownership through reasonable loans has only recently become available, whereas in Germany, almost all residential solar is host owned using low interest debt. Developers in the US report higher fixed costs than German installers, implying they have a larger administrative footprint versus their volume of business. This is likely attributable to the financial complexity and plethora of jurisdictions.
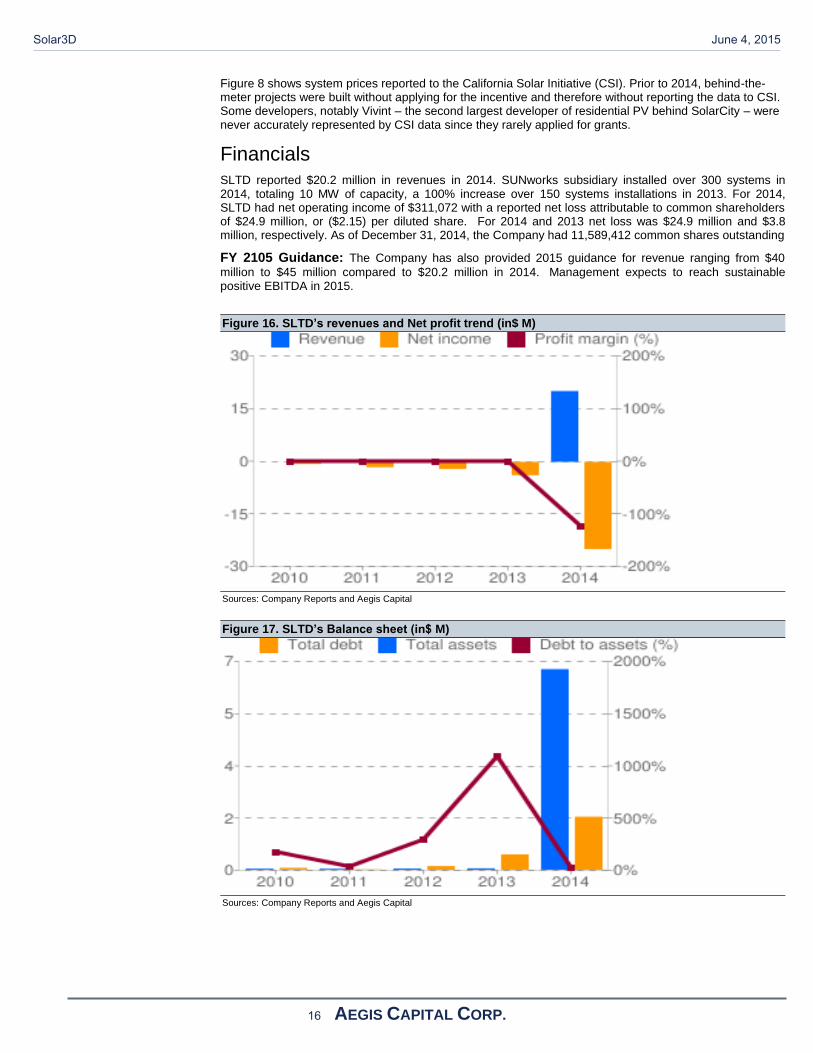
Market Prices
This section looks at pricing of behind-the-meter PV projects of top developers in California. It uses data submitted by project builders and owners to state subsidy programs. It is well known that when submitting this data, many developers and installers do not provide actual project costs but rather submit a fair market value calculation certified by a third party. This calculation is usually based on the present value of future payments.
Figure 15. California Reported System Prices, 2011-2014 – Residential Third Party Owned
Sources: BNEF, California Solar Initiative and Aegis Capital
Solar3D June 4, 2015
16 AEGIS CAPITAL CORP.
Figure 8 shows system prices reported to the California Solar Initiative (CSI). Prior to 2014, behind-the-meter projects were built without applying for the incentive and therefore without reporting the data to CSI. Some developers, notably Vivint – the second largest developer of residential PV behind SolarCity – were never accurately represented by CSI data since they rarely applied for grants.
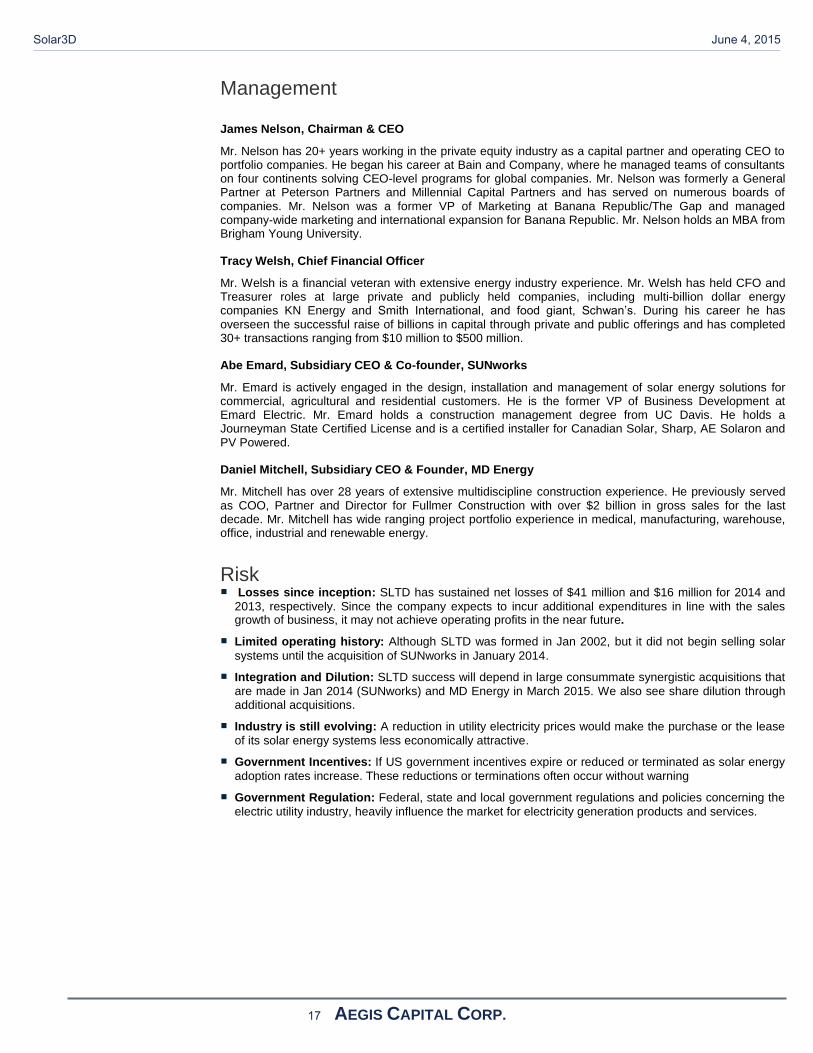
Financials
SLTD reported $20.2 million in revenues in 2014. SUNworks subsidiary installed over 300 systems in 2014, totaling 10 MW of capacity, a 100% increase over 150 systems installations in 2013. For 2014, SLTD had net operating income of $311,072 with a reported net loss attributable to common shareholders of $24.9 million, or ($2.15) per diluted share. For 2014 and 2013 net loss was $24.9 million and $3.8 million, respectively. As of December 31, 2014, the Company had 11,589,412 common shares outstanding
FY 2105 Guidance: The Company has also provided 2015 guidance for revenue ranging from $40
million to $45 million compared to $20.2 million in 2014. Management expects to reach sustainable positive EBITDA in 2015.
Figure 16. SLTD’s revenues and Net profit trend (in$ M)
Sources: Company Reports and Aegis Capital
Figure 17. SLTD’s Balance sheet (in$ M)
Sources: Company Reports and Aegis Capital
Solar3D June 4, 2015
17 AEGIS CAPITAL CORP.
Management James Nelson, Chairman & CEO
Mr. Nelson has 20+ years working in the private equity industry as a capital partner and operating CEO to portfolio companies. He began his career at Bain and Company, where he managed teams of consultants on four continents solving CEO-level programs for global companies. Mr. Nelson was formerly a General Partner at Peterson Partners and Millennial Capital Partners and has served on numerous boards of companies. Mr. Nelson was a former VP of Marketing at Banana Republic/The Gap and managed company-wide marketing and international expansion for Banana Republic. Mr. Nelson holds an MBA from Brigham Young University. Tracy Welsh, Chief Financial Officer
Mr. Welsh is a financial veteran with extensive energy industry experience. Mr. Welsh has held CFO and Treasurer roles at large private and publicly held companies, including multi-billion dollar energy companies KN Energy and Smith International, and food giant, Schwan’s. During his career he has overseen the successful raise of billions in capital through private and public offerings and has completed 30+ transactions ranging from $10 million to $500 million. Abe Emard, Subsidiary CEO & Co-founder, SUNworks
Mr. Emard is actively engaged in the design, installation and management of solar energy solutions for commercial, agricultural and residential customers. He is the former VP of Business Development at Emard Electric. Mr. Emard holds a construction management degree from UC Davis. He holds a Journeyman State Certified License and is a certified installer for Canadian Solar, Sharp, AE Solaron and PV Powered. Daniel Mitchell, Subsidiary CEO & Founder, MD Energy
Mr. Mitchell has over 28 years of extensive multidiscipline construction experience. He previously served as COO, Partner and Director for Fullmer Construction with over $2 billion in gross sales for the last decade. Mr. Mitchell has wide ranging project portfolio experience in medical, manufacturing, warehouse, office, industrial and renewable energy.
Risk Losses since inception: SLTD has sustained net losses of $41 million and $16 million for 2014 and
2013, respectively. Since the company expects to incur additional expenditures in line with the sales growth of business, it may not achieve operating profits in the near future.
Limited operating history: Although SLTD was formed in Jan 2002, but it did not begin selling solar
systems until the acquisition of SUNworks in January 2014.
Integration and Dilution: SLTD success will depend in large consummate synergistic acquisitions that
are made in Jan 2014 (SUNworks) and MD Energy in March 2015. We also see share dilution through additional acquisitions.
Industry is still evolving: A reduction in utility electricity prices would make the purchase or the lease
of its solar energy systems less economically attractive.
Government Incentives: If US government incentives expire or reduced or terminated as solar energy
adoption rates increase. These reductions or terminations often occur without warning
Government Regulation: Federal, state and local government regulations and policies concerning the
electric utility industry, heavily influence the market for electricity generation products and services.
Solar3D June 4, 2015
18 AEGIS CAPITAL CORP.
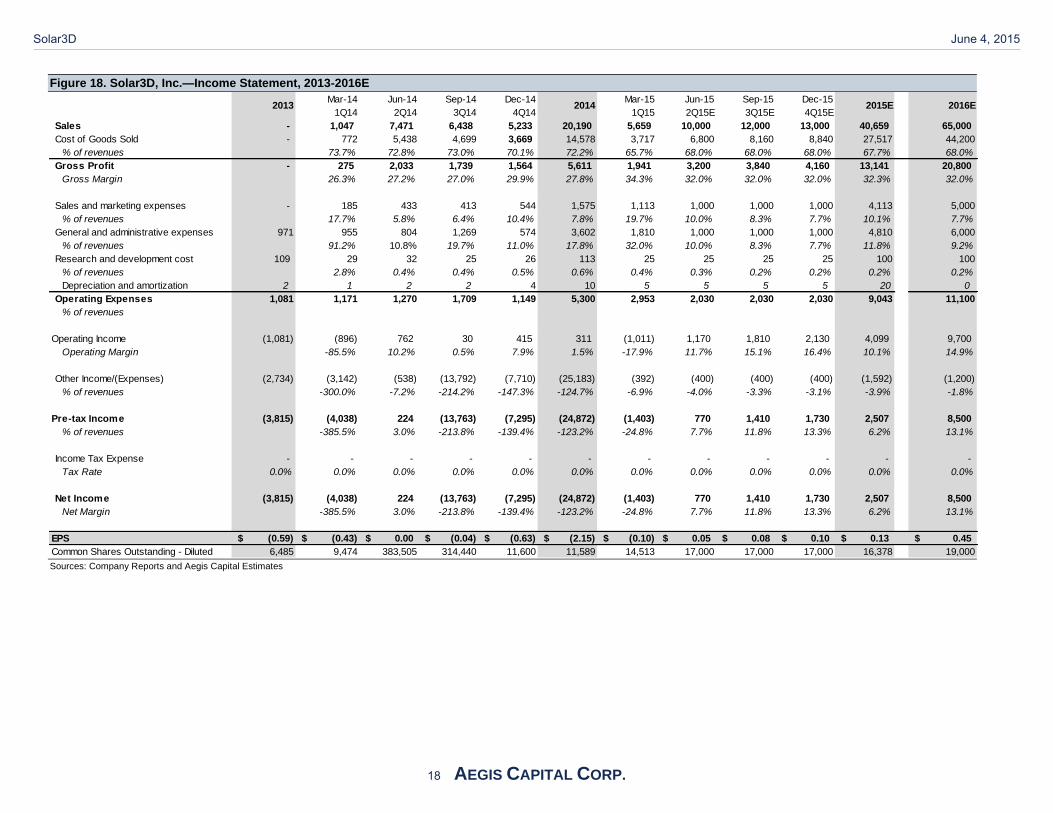
Figure 18. Solar3D, Inc.—Income Statement, 2013-2016E
Sources: Company Reports and Aegis Capital Estimates
Mar-14 Jun-14 Sep-14 Dec-14 Mar-15 Jun-15 Sep-15 Dec-15
1Q14 2Q14 3Q14 4Q14 1Q15 2Q15E 3Q15E 4Q15E
Sales - 1,047 7,471 6,438 5,233 20,190 5,659 10,000 12,000 13,000 40,659 65,000
Cost of Goods Sold - 772 5,438 4,699 3,669 14,578 3,717 6,800 8,160 8,840 27,517 44,200
% of revenues 73.7% 72.8% 73.0% 70.1% 72.2% 65.7% 68.0% 68.0% 68.0% 67.7% 68.0%
Gross Profit - 275 2,033 1,739 1,564 5,611 1,941 3,200 3,840 4,160 13,141 20,800
Gross Margin 26.3% 27.2% 27.0% 29.9% 27.8% 34.3% 32.0% 32.0% 32.0% 32.3% 32.0%
Sales and marketing expenses - 185 433 413 544 1,575 1,113 1,000 1,000 1,000 4,113 5,000
% of revenues 17.7% 5.8% 6.4% 10.4% 7.8% 19.7% 10.0% 8.3% 7.7% 10.1% 7.7%
General and administrative expenses 971 955 804 1,269 574 3,602 1,810 1,000 1,000 1,000 4,810 6,000
% of revenues 91.2% 10.8% 19.7% 11.0% 17.8% 32.0% 10.0% 8.3% 7.7% 11.8% 9.2%
Research and development cost 109 29 32 25 26 113 25 25 25 25 100 100
% of revenues 2.8% 0.4% 0.4% 0.5% 0.6% 0.4% 0.3% 0.2% 0.2% 0.2% 0.2%
Depreciation and amortization 2 1 2 2 4 10 5 5 5 5 20 0
Operating Expenses 1,081 1,171 1,270 1,709 1,149 5,300 2,953 2,030 2,030 2,030 9,043 11,100
% of revenues
Operating Income (1,081) (896) 762 30 415 311 (1,011) 1,170 1,810 2,130 4,099 9,700
Operating Margin -85.5% 10.2% 0.5% 7.9% 1.5% -17.9% 11.7% 15.1% 16.4% 10.1% 14.9%
Other Income/(Expenses) (2,734) (3,142) (538) (13,792) (7,710) (25,183) (392) (400) (400) (400) (1,592) (1,200)
% of revenues -300.0% -7.2% -214.2% -147.3% -124.7% -6.9% -4.0% -3.3% -3.1% -3.9% -1.8%
Pre-tax Income (3,815) (4,038) 224 (13,763) (7,295) (24,872) (1,403) 770 1,410 1,730 2,507 8,500
% of revenues -385.5% 3.0% -213.8% -139.4% -123.2% -24.8% 7.7% 11.8% 13.3% 6.2% 13.1%
Income Tax Expense - - - - - - - - - - - -
Tax Rate 0.0% 0.0% 0.0% 0.0% 0.0% 0.0% 0.0% 0.0% 0.0% 0.0% 0.0% 0.0%
Net Income (3,815) (4,038) 224 (13,763) (7,295) (24,872) (1,403) 770 1,410 1,730 2,507 8,500
Net Margin -385.5% 3.0% -213.8% -139.4% -123.2% -24.8% 7.7% 11.8% 13.3% 6.2% 13.1%
EPS (0.59)$ (0.43)$ 0.00$ (0.04)$ (0.63)$ (2.15)$ (0.10)$ 0.05$ 0.08$ 0.10$ 0.13$ 0.45$
Common Shares Outstanding - Diluted 6,485 9,474 383,505 314,440 11,600 11,589 14,513 17,000 17,000 17,000 16,378 19,000
2013 2014 2015E 2016E
Solar3D June 4, 2015

19 AEGIS CAPITAL CORP.
Figure 19. Solar3, Inc.—Valuation Comparables, Prices as of 5/31/15
Sources: S&P and Aegis Capital Estimates
Solar3D June 4, 2015
20 AEGIS CAPITAL CORP.
Required Disclosures
Price Target
Our 12-month price target is $6 per share.
Valuation Methodology
Our one-year price target of $6 is based on 13x our 2016 EPS estimate of $0.45. This NTM earnings multiple is within peer groupvaluation range.
Risk Factors
Losses since inception: SLTD has sustained net losses of $41 million and $16 million for 2014 and 2013, respectively. Since the companyexpects to incur additional expenditures in line with the sales growth of business, it may not achieve operating profits in the near future.Limited operating history: Although SLTD was formed in Jan 2002, it did not begin selling solar systems until the acquisition ofSUNworks in January 2014.Integration and Dilution: SLTD success will depend in large consummate synergistic acquisitions that are made in Jan 2014 (SUNworks)and MD Energy in March 2015. We also see share dilution through additional acquisitions.Government Incentives/Regulation: A material reduction in the retail price of traditional utility generated electricity or electricity fromother sources could negatively impact the results of operations and prospects.
For important disclosures go to www.aegiscap.com.
Research analyst compensation is dependent, in part, upon investment banking revenues received by Aegis Capital Corp.
Aegis Capital Corp. intends to seek or expects to receive compensation for investment banking services from the subject company withinthe next three months.
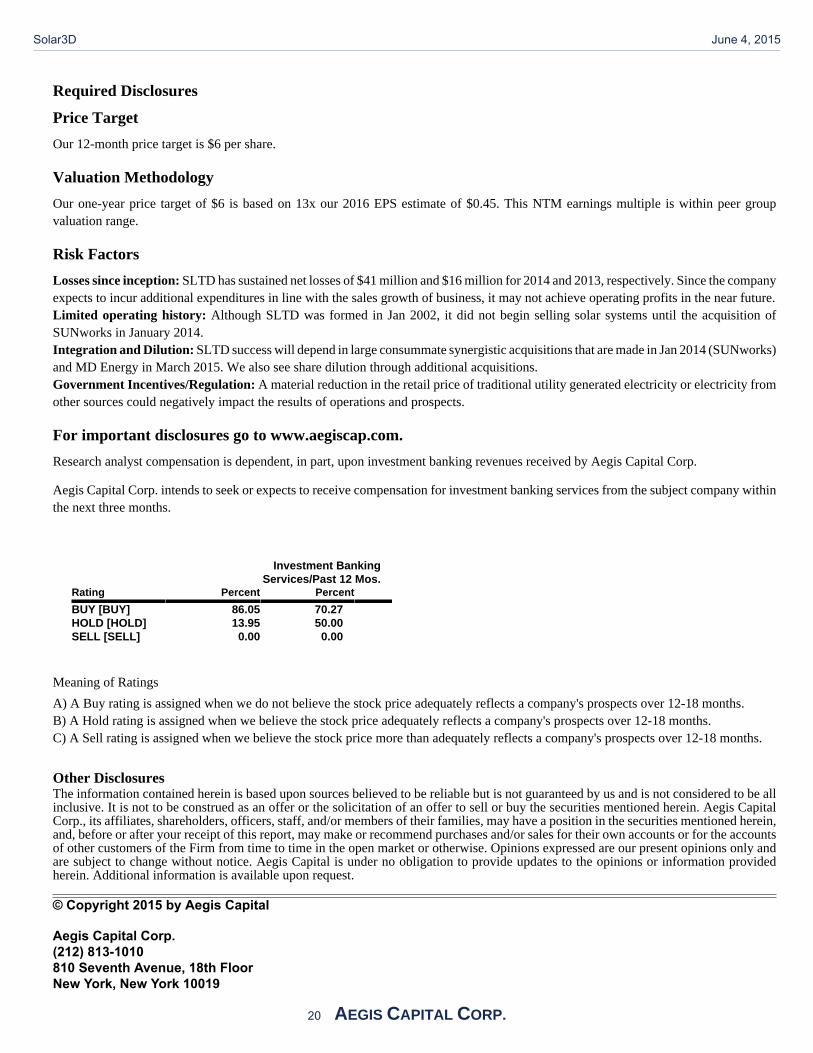
Investment BankingServices/Past 12 Mos.
Rating Percent Percent
BUY [BUY] 86.05 70.27 HOLD [HOLD] 13.95 50.00 SELL [SELL] 0.00 0.00
Meaning of Ratings
A) A Buy rating is assigned when we do not believe the stock price adequately reflects a company's prospects over 12-18 months.B) A Hold rating is assigned when we believe the stock price adequately reflects a company's prospects over 12-18 months.C) A Sell rating is assigned when we believe the stock price more than adequately reflects a company's prospects over 12-18 months.
Other DisclosuresThe information contained herein is based upon sources believed to be reliable but is not guaranteed by us and is not considered to be allinclusive. It is not to be construed as an offer or the solicitation of an offer to sell or buy the securities mentioned herein. Aegis CapitalCorp., its affiliates, shareholders, officers, staff, and/or members of their families, may have a position in the securities mentioned herein,and, before or after your receipt of this report, may make or recommend purchases and/or sales for their own accounts or for the accountsof other customers of the Firm from time to time in the open market or otherwise. Opinions expressed are our present opinions only andare subject to change without notice. Aegis Capital is under no obligation to provide updates to the opinions or information providedherein. Additional information is available upon request.
© Copyright 2015 by Aegis Capital
Aegis Capital Corp.(212) 813-1010810 Seventh Avenue, 18th FloorNew York, New York 10019
Solar3D June 4, 2015