Embed Size (px)
Citation preview
1 AND 5 YEAR SURVIVAL ESTIMATES FOR PEOPLE WITH CIRRHOSIS OF THE
LIVER IN ENGLAND, 1998-2009: A LARGE POPULATION STUDY
Sonia Ratib1, Kate M. Fleming 1, Colin J. Crooks1, Guruprasad P. Aithal2, Joe
West1
1Division of Epidemiology & Public Health, University of Nottingham, UK
2NIHR Biomedical Research Unit in Gastrointestinal and Liver Diseases, Nottingham University Hospitals NHS Trust and University of Nottingham, Nottingham, UK
Abbreviations: GPRD-General Practise Research Database; HES-Hospital Episode Statistics; ONS-Office of National Statistics; ICD10-International Classification of Disease 10th version, OPCS4-Office of Population Censuses and Surveys’ classification of interventions and procedures 4th version; UTS-Up to Standard.
Word count: 5556
Three tables and one figure
Conflict of interest: None
Financial support: University of Nottingham/National University Hospitals NHS Trust/National Institute for Health Research Senior Clinical Research Fellowship
Correspondence:
Sonia Ratib
Division of Epidemiology and Public Health
University of Nottingham
Nottingham NG5 1PB, UK
Tel: +44 (0)115 8231344
Fax: +44 (0)115 8231946
e-mail: [email protected]
ABSTRACT
Background & Aims: Large, population-based studies that have included the full
spectrum of cirrhosis estimating survival taking into account time-at-risk are lacking.
We aimed to report 1- and 5-year average survival rates for people with cirrhosis to
be used in a clinical and health care policy setting.
Methods: We used the General Practice Research Database and linked English
Hospital Episode Statistics to identify adult cases of cirrhosis from January 1998 to
December 2009. We estimated 1- and 5-year survival according to whether time-at-
risk was entirely ambulatory or followed an emergency hospital admission related to
liver disease, stratified by age, sex and aetiology to be used in a clinical setting. We
used a multivariate Cox-proportional hazards model with emergency hospital
admission as a time-varying variable adjusted for Baveno IV stage of cirrhosis at
diagnosis.
Results: We identified 5118 incident cases. Average survival probabilities at 1- and
5-years were 0.88 (95% CI 0.87-0.90) and 0.74 (95% CI 0.72-0.77) for the
ambulatory group and 0.56 (95% CI 0.54-0.58) and 0.30 (95% CI 0.29-0.32)
following hospitalisation, respectively. A hospital admission at diagnosis or
subsequently for liver disease substantially impaired prognosis independent of stage
of cirrhosis (HR=4.11, 95% CI 3.70, 4.58).
Conclusions: Emergency hospitalisation for liver disease heralds a downturn in a
patient’s outlook independent of their stage of cirrhosis. Our results provide
population-based clinically translatable estimates of prognosis for the purposes of
health care delivery and planning and communication to patients.

Word count: 238 . Key words: cirrhosis; survival; aetiology; population-based.
4
INTRODUCTION
The prognosis of liver cirrhosis is only well described amongst non-representative
groups of patients as previous studies were limited by geographical region [1-3],
disease severity [4, 5] or to a specific aetiology such as viral hepatitis B [6, 7]. These
studies are therefore of limited use in a clinical setting where patients with a range of
aetiologies often ask about their prognosis, and they might also be misleading if
used to advise how healthcare services should be tailored appropriately.
One common limitation of previous large epidemiological studies was a restriction to
either primary or secondary healthcare records [8, 9] preventing a truly non selective
population-based approach. Consequently they have either not taken into account
the large proportion of patients with cirrhosis who remain ambulatory with no
hospitalisation, or alternatively the studies have failed to identify cirrhosis diagnosed
during a fatal hospitalisation. Having an emergency hospital admission is not just
associated with a deterioration in cirrhosis, but can be associated with and
potentially the cause of a number of fatal complications such as pulmonary embolism
[10]. No previous study has quantified the difference in survival between patients
with cirrhosis who are managed without hospitalisations, and those who are
managed following a hospitalisation. Without a comprehensive and heterogeneous
population of people with cirrhosis that includes varying time-at-risk, it is impossible
to quantify survival estimates which can be used in a clinical setting and describe the
effect of hospitalisation for the full spectrum of disease.
5
The recent linkage of the General Practice Research Database with the Hospital
Episode Statistics database and data from the Office for National Statistics has
provided us with a novel opportunity to construct a study cohort that is representative
of the whole population of people with cirrhosis in England.
The aim of the study is to determine 1- and 5-year average survival of people with
cirrhosis and the independent effect of hospitalisation while taking account of their
age, sex, underlying aetiology and stage of disease.
6
METHODS
Primary care data
The General Practice Research Database (GPRD) is a longitudinal electronic
database consisting of anonymised primary care records of over 10 million patients
in the UK. Data are coded using the Read code system. Participating practices are
assigned an up to standard (UTS) date on completion of regular audits confirming
data quality and completeness. The GPRD has previously been shown to be
representative of the population of the UK [11].
Secondary care data
The Hospital Episodes Statistics (HES) database comprises statutory records of all
admissions (excluding out-patients) conducted in NHS trust hospitals and
independent treatment centres in England. For each period of time under the care of
a consultant, a patient is assigned a primary diagnosis and up to 19 secondary
diagnoses, coded using the ICD10 (International Classification of Diseases, tenth
revision), and/or up to 24 recorded procedures coded using the OPCS4 (Office of
Population, Censuses and Surveys’ classification of interventions and procedures,
fourth revision).
Death registry data
The Office for National Statistics (ONS) provides death registry data for GPRD
practices that are linked to the HES database. Date of death from GPRD records
was used where ONS date of death was unavailable.
7
Study population
We had access to data from all 244 GPRD practices in England linked to HES
between April 1997 and August 2010 and to the ONS between April 1998 and
December 2010. We defined cirrhosis in primary care if a person had a record
containing a Read code for cirrhosis, oesophageal varices and/or portal hypertension
in the GPRD. The Read code lists were adapted and updated from our previous
externally validated definition [12] (Appendix1). We developed codes lists for
cirrhosis diagnosis in secondary case from ICD10 (K70.3, K71.7, K72.1, K74.4,
K74.5, K74.6, K76.6, I85.0, I85.9, I86.4, I98.2) and OPCS4 (J06.1, J06.2, T46.1,
T46.2, G10.4, G10.8, G10.9, G14.4, G17.4, G43.7).
Observation period
The observation period commenced on the latest of (i) one year after the patient’s
current registration date or (ii) the practice’s UTS date. The one year cut-off was
used to avoid including potential prevalent cases, adapted from Lewis et al.’s
methodology [13]. The period terminated on the earliest of (i) date of death, (ii) date
the patient left the practice, or (iii) the practice’s last data collection date. We
identified incident cases between 1st January 1998 and 31st December 2009.
8
Validating case definition
For people with a cirrhosis diagnosis recorded in primary care we established how
many had a hospital admission related to liver disease (e.g. alcoholic liver disease)
(Appendix2). We identified whether the admissions were elective or emergency
defined as per the NHS Information Centre definition [14].
For patients identified with cirrhosis from secondary care records only, we searched
for evidence of liver disease in their healthcare records (Appendix3) and anywhere
on their death certificate (Appendix4). We excluded patients who had a record of
cancer and an isolated procedure relating to ascites and no other evidence or death
related to liver disease. For the remaining patients we examined their primary care
free text data for terms related to cirrhosis.
Diagnosis date
For each patient we assigned the date of diagnosis as the first date associated with
a Read or ICD10/OPCS4 code for cirrhosis within the observation period. Patients
younger than 18 years at diagnosis were excluded.
Exposure of interest: Patient setting at diagnosis and in subsequent follow up.
We categorised patients into three groups based on the patient setting:
(1) Ambulatory at first diagnosis. These were patients who had a first record of
cirrhosis in primary care or an elective admission in secondary care records.
(2) Ambulatory with subsequent emergency hospital admission for liver disease:
These were group (1) patients who had a subsequent emergency hospital admission
related to liver disease.
9
(3) Hospitalised at first diagnosis: These were patients whose first record of cirrhosis
occurred during an emergency hospital admission.
Aetiology
We searched the patient’s medical records for evidence of viral hepatitis,
autoimmune and metabolic diseases. We defined patients as having an underlying
alcoholic aetiology if there was mention in their records of alcoholism for example
alcohol abuse, addiction or dependence, ‘problem drinking’ or referral to alcohol
cessation services, or if their weekly alcohol consumption in their primary care
records exceeded the Chief Medical Officer’s recommended amount (14 units for
women, 21 units for men) [15]. Our Read code list for this was adapted from
previous work [12] and our ICD10 code list was adapted from Statistics on Alcohol,
England [16]. We also searched for evidence of viral hepatitis, autoimmune and
metabolic diseases. Aetiology was ascribed in a hierarchical fashion of viral hepatitis,
autoimmune or metabolic disease and alcoholic cirrhosis. If a patient had no
recorded aetiology they were ascribed a cryptogenic aetiology.
10
Stage of disease
We defined stages of disease as agreed at the Baveno IV consensus conference
[17]. Each of the four stages is defined by the presence or absence of certain clinical
symptoms. Stages 1 and 2 represent compensated cirrhosis and stages 3 and 4
decompensated cirrhosis.
Statistical analysis
We used death from any cause as the primary outcome in our study and excluded
patients whose diagnosis date was concurrent with date of death. We tested for
baseline differences between patient groups using chi-squared. Date of emergency
hospital admission for liver disease was a time-varying variable, with follow-up split
at this date to identify two groups based on time-at-risk:
(1) Patients in group 1 and group 2 (up to their emergency hospital admission date)
contributed time-at-risk to the ambulatory group.
(2) Patients in group 2 (followed-up from their emergency hospital admission date
onwards) and group 3 contributed time-at-risk to the subsequent to hospitalisation
group.
We plotted a Kaplan-Meier survival curve to show the difference in survival by time-
at-risk and estimated survival probabilities (and 95% confidence intervals (CI))
overall and at 1- and 5-years. In order to determine how survival differed between
the two time-at-risk groups we used Cox regression to estimate hazard ratios (HR)
adjusting for potential confounders of age, sex, aetiology and stage of disease in our
model. The proportional hazards assumption was checked using log-log plots.

11
Clinically relevant interactions were tested with likelihood ratio tests. Stata version 12
MP4 was used for all statistical analyses and a P-value<0.05 was taken as the cut-
off for statistical significance.
12
RESULTS
Incident cases
A total of 5247 people aged 18 and over were identified as incident cirrhosis cases
between January 1998 and December 2009, 2965 from primary care records and an
additional 2282 from secondary care. 129 (2.5%) patients whose date of diagnosis
was concurrent with death were excluded, establishing an incident study cohort of
5118 people diagnosed with cirrhosis during the observation period.
Validation of case definition
A total of 2975 cases were identified in primary care, 10 were excluded as they had
a cirrhosis-related hospitalisation before 1998, 2721 (91.5%) were hospitalised
during the observation period and 2230 (75%) had a diagnosis or procedure related
to liver disease. Out of the 2282 patients with a record of cirrhosis in secondary care
over 90.4% (n=2062) had either death or additional evidence related to liver disease
in their records, or a confirmation of a cirrhosis diagnosis in their free text.
Patient groups
2472 patients (48.3% of the incident cohort) were ambulatory at first diagnosis. Of
these, 1648 (66.6%) remained ambulatory throughout the study period (group (1))
and 825 (33.4%) had a subsequent emergency hospital admission for liver disease
(group (2)). 2646 patients had a first diagnosis during an emergency admission
(group (3), 51.7%).
13
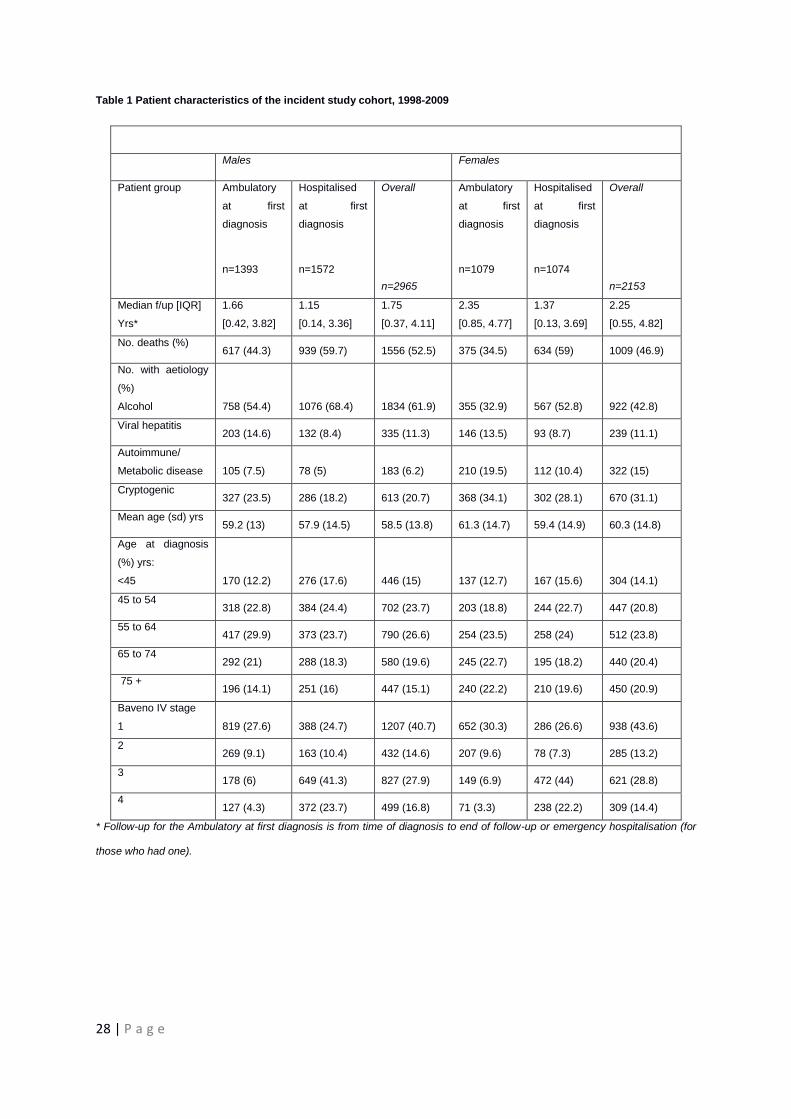
Patient characteristics
The cohort of 5118 patients had a mean age of 59.3 (sd=14.3) years and slightly
more men (57.9%) than women; just over half of the population had an aetiology of
alcoholic cirrhosis (53.9%) (see Table 1). A higher proportion of men than women
had alcoholic cirrhosis, 61.9% vs.42.8% respectively (2(3)
=235.7, P<0.001). Just
over half of the study population (55.9%) had compensated cirrhosis (Baveno IV
stages 1 or 2) at diagnosis.
The distribution of age, sex, stage of disease and aetiology varied between the
ambulatory and hospitalised at first diagnosis groups: the latter had a substantially
lower proportion of people with alcoholic cirrhosis, almost twice the proportion of
people with viral hepatitis (2(3)
=162.8, P<0.001), and a smaller proportion of men
(2(1) =4.9, P=0.03) compared to the former. The hospitalised at first diagnosis group
had a higher proportion of younger patients than the ambulatory at first diagnosis
group (2(4)
=33.5, P<0.001). A lower proportion of the ambulatory at first diagnosis
group had decompensated cirrhosis (21.2% vs. 65.4%, 2(3)
=1000, P<0.001) than
the hospitalised at first diagnosis group.
14 | P a g e
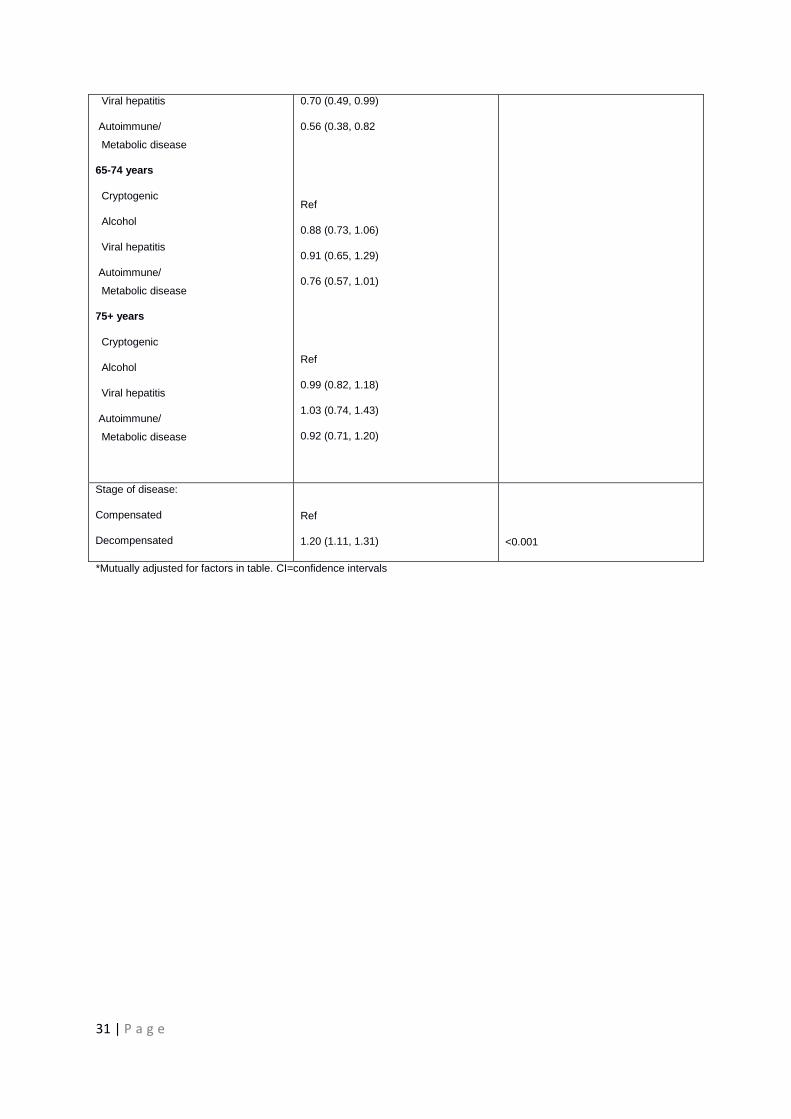
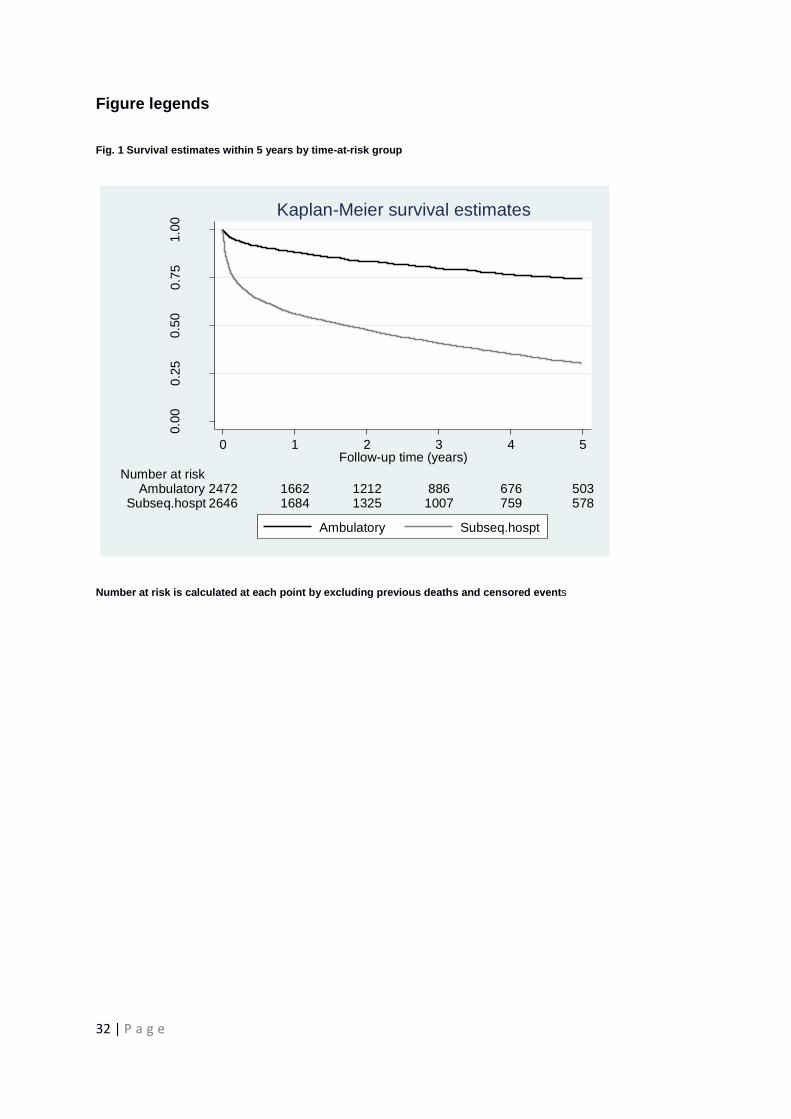
Survival
In a total of 14,743 person-years of follow-up (median length of follow-up 1.97 [IQR
0.42 to 4.39] years), there were 2565 (50.1%) deaths in our cohort. Overall the
survival probabilities were 0.70 (95%CI 0.69-0.72) at 1-year and 0.47 (95% CI 0.45-
0.49) at 5-years. For the ambulatory group survival probabilities at 1- and 5-years
were 0.88 (95% CI 0.87, 0.90) and 0.74 (95% CI 0.72, 0.77) respectively and 0.56
(95% CI 0.54, 0.58) and 0.30 (95% CI 0.29, 0.32) respectively for the subsequent to
hospitalisation group (see Figure 1).The Kaplan-Meier curve was truncated at 5
years given that there was little follow-up time there onwards.
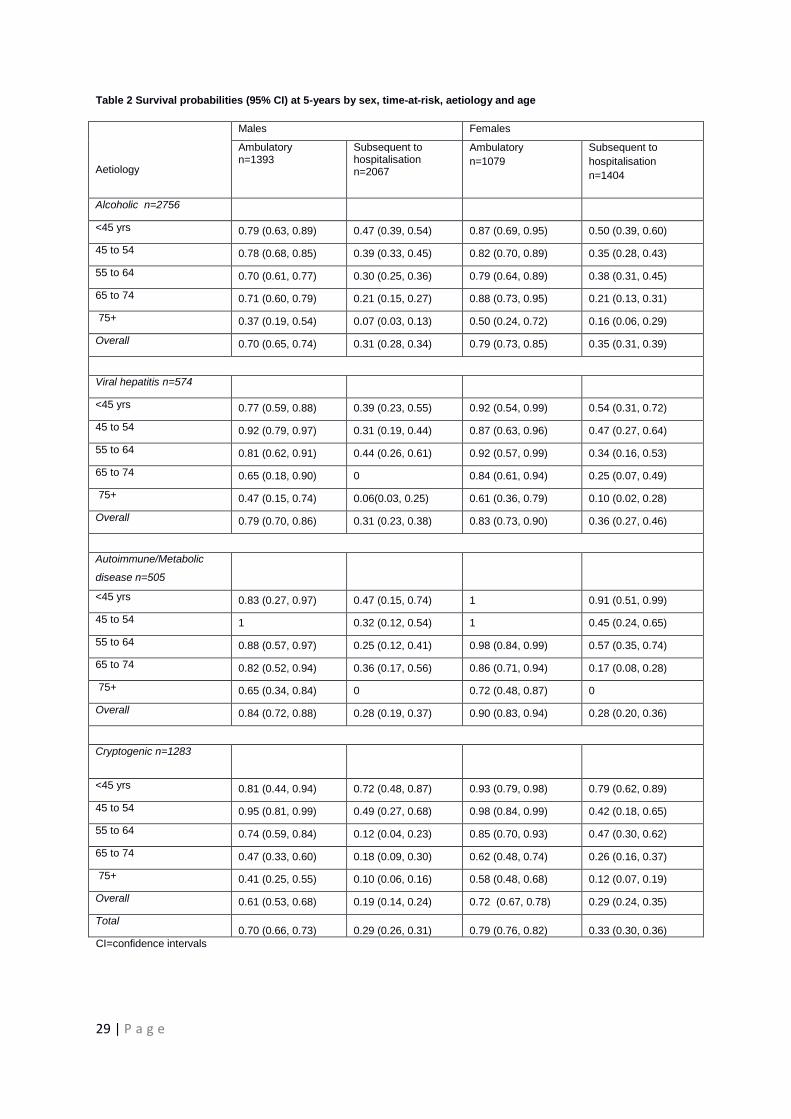
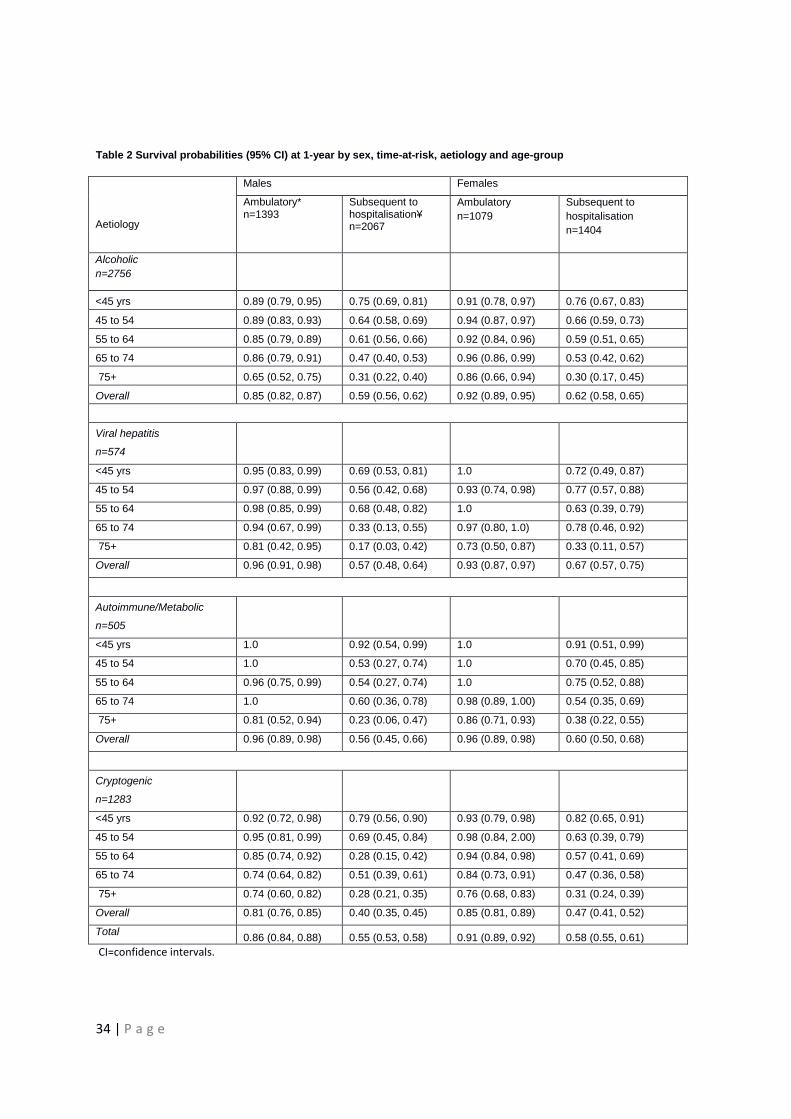
Table 2 shows the survival probabilities at 5-years stratified by sex, time-at-risk,
aetiology and age. They have been presented this way to provide prognostic
information that could be applied easily in a clinical setting. Supplementary Table 2
shows the equivalent 1-year survival probabilities. In general, survival decreased
with age, was better for women and overall did not differ substantially between the
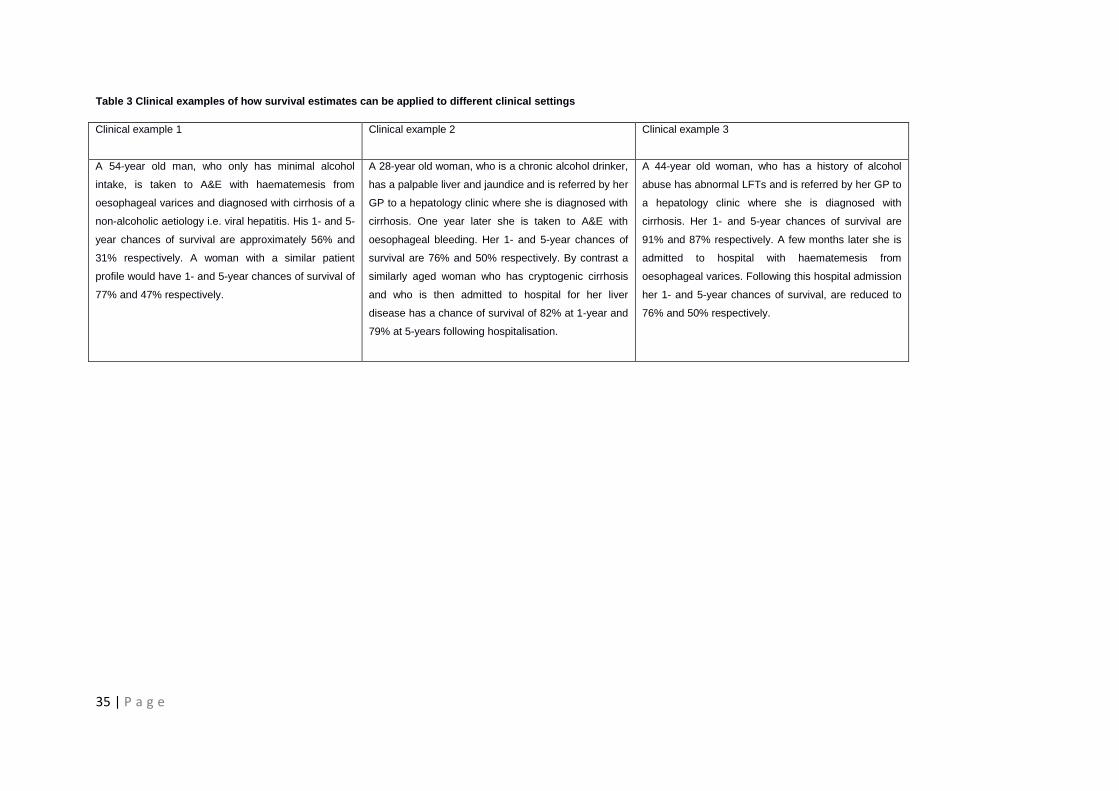
different aetiologies, apart from a few instances. Supplementary Table 3 provides
clinical examples that demonstrate how the survival estimates vary dependent on the
clinical setting.
15 | P a g e
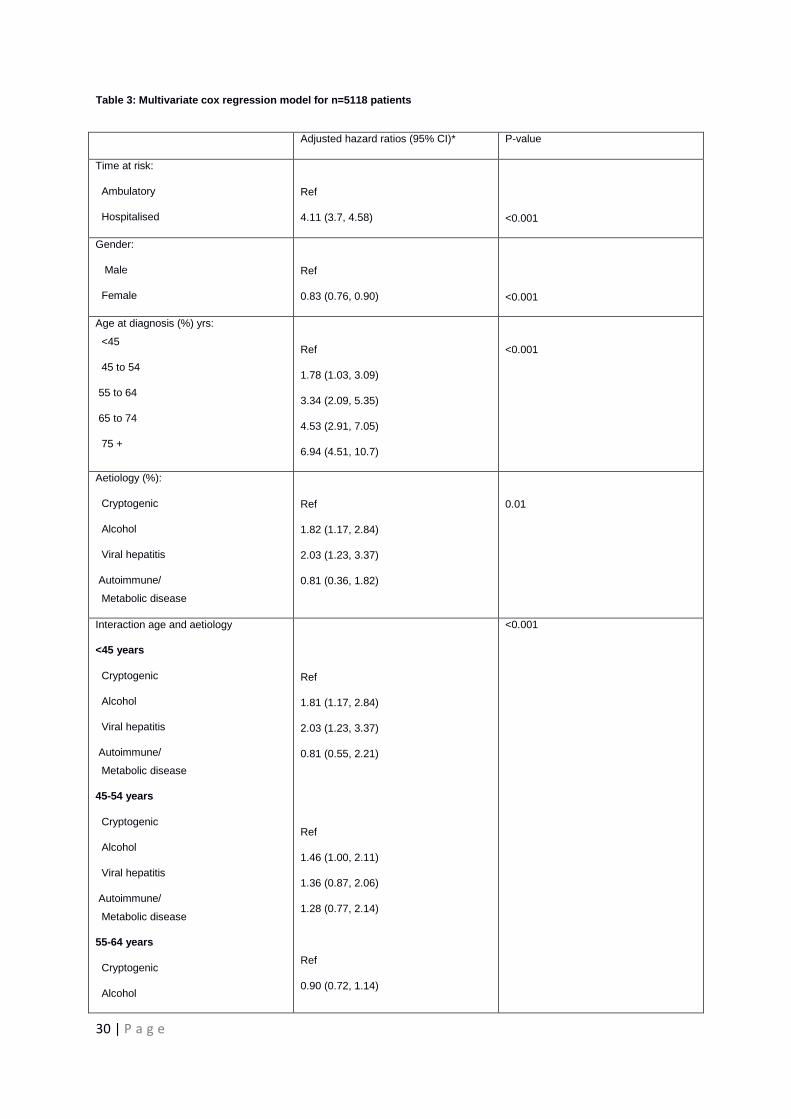
Multivariate analysis
Adjusting for age, sex, aetiology and disease stage the risk of death was
independently higher subsequent to hospitalisation compared to the ambulatory
group (HR=4.11, 95% CI 3.70, 4.58). The risk of death in those with decompensated
cirrhosis was only 1.2-fold that of patients with compensated cirrhosis (95% CI 1.11,
1.31) adjusting for confounders. The multivariate Cox regression model is shown in
Table 3. There was a statistically significant interaction between aetiology and age in
the Cox regression model (2
(12)=26.4, P<0.001), adjusting for sex, stage of disease
and time-at-risk group. Comparing the alcoholic with the cryptogenic patients there
was approximately a two-fold risk of death in those younger than 45 years but no
significant difference for patients older than 55 years. We report the adjusted hazard
for each age-group by aetiology in Table 3.
16 | P a g e
DISCUSSION
Main findings
Our study is the first to use both primary and secondary healthcare linked data to
establish a comprehensive cohort of people with incident cirrhosis in England and
consequently to take into account the transition from ambulatory to hospitalised time-
at-risk when calculating accurate survival estimates. Our findings show that patients
who remain entirely ambulatory have a 5-year survival of 74% which is comparable
to that seen for cancer of the bladder [18]. In contrast, once a patient is hospitalised
for an emergency their survival drops markedly. Indeed our findings suggest that
emergency hospitalisation for liver disease heralds a downturn in a patient’s outlook
independent of their stage of cirrhosis. This we believe is important both for policy
makers but also for clinical practice as we provide precise estimates of survival
derived from an unbiased population that represents the generality of patients with
cirrhosis. These estimates, stratified by age, sex and aetiology can help with health
care service provision planning but equally they can be used to communicate
prognosis to patients based on a clinical assessment of disease and the natural
history it undergoes. In addition, using emergency hospitalisation as a risk factor is a
pragmatic way of determining prognosis as it is objective and relatively easy to
define.
17 | P a g e
Strengths and limitations
The largest potential limitation with a study trying to determine incidence from
routinely collected data is confidence in case definition. Compared to previous
studies which have used broad ICD10 code lists including non cirrhotic codes of
K70.9 (alcoholic liver disease) and K74.3 (primary biliary cirrhosis) [19], our
definition of cirrhosis was much more restrictive. The linked data have confirmed our
case definitions by providing supporting evidence of liver disease among the various
healthcare records and death registry, analogous to a chart review. Our current
finding that a large proportion of patients diagnosed within the GPRD had a hospital
admission related to liver disease (75%) emphasises the reliability of our case
definition (given that we would not expect all cirrhotic patients to require a hospital
admission). The finding falls in line with our previous external validation of primary
care records where review of patients’ paper records confirmed cirrhosis in the
majority of patient records checked [12]. In two recent systematic reviews case
validity for most chronic conditions was described as good using the GPRD [20, 21].
In those presenting with cirrhosis in secondary care only, we found 90% had
additional evidence of liver disease or death related to liver disease, or a mention of
cirrhosis in their primary care written record. Kramer et al.[22] recently found ICD9
codes for cirrhosis had a 90% positive predictive value and 87% negative predictive
value. Unlike the GPRD, HES data cannot be validated against medical records
directly due to the annoymisation process used. A recent government audit found
91% median accuracy [23] and our findings confirm accurate coding in the HES.
18 | P a g e
Overall we believe our case definition is as robust as previously reported in bespoke
case studies of cirrhosis from secondary care. That our population was not drawn
from an individual tertiary referral centre is on its own a strength of the present study
as the population is more representative of the entire spectrum of disease and is
drawn from a population which is representative of the whole population of England
[11].
Our group and others [24, 25] have shown previously that survival differs by disease
stage i.e. compensated or decompensated cirrhosis. The majority of patients
classified as ambulatory were compensated at diagnosis (78.8%) whereas those
who were hospitalised at first diagnosis were more likely to be decompensated
(65.4%) as per the Baveno IV staging. Our stratification into ambulatory or
hospitalised onwards time-at-risk groups therefore perhaps reflects, to some extent,
the transition from a compensated to decompensated state of disease. By using the
date of emergency hospital admission as a time-varying variable to define our time-
at-risk we have been able to add to our previous work, showing how those who
initially present as ambulatory patients can have varied survival dependent on
subsequent hospitalisation. Our study also highlights that irrespective of whether the
patient had compensated or decompensated cirrhosis at first diagnosis, the key risk
factor is having an emergency hospitalisation for liver disease. We cannot tease out
from the data available what the exact cause of the hospital admission is and
therefore are not able to speculate as to whether it is the liver disease per se or an
event which occurs in hospital, which is affecting this difference in survival.
Several studies have used the Model for End-stage Liver Disease (MELD) or Child-
Turcotte-Pugh scores [26, 27] to prognosticate survival for patients with cirrhosis and
19 | P a g e
determine whether transplantation is necessary. Although we have not reported
these scores in our study, due to lack of laboratory data, the attraction of our method
is its simplicity and independence of laboratory measurements in determining long-
term prognostic information. For those whom we could determine a MELD score
(n=1415, 27.6%) Baveno IV stage of disease was shown to be highly correlated
(p<0.001). We therefore took the pragmatic approach of using Baveno IV stage of
disease to adjust our mortality estimates for disease severity as information on this
variable was available for the entirety of our study population.
We identified a record of alcohol use consistent with it being the underlying aetiology
of disease in just over 50% of the patients. This is almost identical to that found
previously in the UK and also in Scandinavia suggesting that if there is any
underreporting it is likely to have been slight [3, 12, 28].
Finally, although we have ascertained the date of diagnosis and excluded prevalent
individuals, the exact onset of a chronic disease process such as cirrhosis can’t be
ascertained without a population based screening programme. As there is no
screening for cirrhosis in the National Health Service in England it is generally only
diagnosed clinically when people first present to a healthcare provider. Our study
therefore is relevant to the pragmatic approach that is the reality in clinical practice.
20 | P a g e
Other literature
Our mortality analysis can be compared in detail with two large hospital-based
studies from England and Denmark. In 2005, Roberts et al. described the survival
experience of 8192 people admitted to hospital with either chronic liver disease or
cirrhosis in the Oxford region between 1968 and 1999. Our 1-year survival in the
subsequent to hospitalisation group (56%) was lower than theirs (66.4%) and lower
than that of the large Danish cohort study (65.5%) [3]. This is likely to be because
our subsequent to hospitalisation group consisted of solely emergency admissions
whereas the other two studies combined in- and out-patients. The recent Danish
study by Fialla et al.[2] separated in- and out-patients and reported 1-year survival
for their out-patients as 76% which was lower than that of our ambulatory group
(88%), most likely due to the fact that their out-patient group excluded ambulatory
patients, a limitation highlighted by the authors.
In comparison with our previous study [25], survival at 1-year in the ambulatory
group was almost identical to those who had compensated cirrhosis according to
their primary care records (87.3%) while survival at 1-year in the subsequent to
hospitalisation group was worse than the survival of those who had decompensated
cirrhosis (75%). This demonstrates how survival of severely ill patients is over
estimated if only primary care records are used.
21 | P a g e
Although some previous studies include patients with all aetiology types, their
geographical bias might lead to non-representative populations in terms of aetiology.
Our population-based approach has eliminated such bias, enabling our survival
estimates to be applied to the full heterogeneity of the cirrhotic population.
Most previous studies have found that those who had alcoholic cirrhosis had a worse
prognosis than those without [8, 9]. We were also able to report how relative
mortality between aetiology groups differs by age, information that has not previously
been available. We showed aetiology affected prognosis in young patients but less
so in older patients; comparing the alcoholic with the cryptogenic patients there was
approximately a two-fold risk of death in those younger than 45 years but no
significant difference for patients older than 55 years.
22 | P a g e
Conclusion
In summary we have established a comprehensive, contemporary cohort,
representing the whole spectrum of people with cirrhosis in terms of their mode of
presentation and aetiology of disease. We have determined survival estimates for
patients with different presentations of the disease and taken into account the
transition from being ambulatory to becoming hospitalised. We have shown that an
emergency hospitalisation predicts a poorer prognosis irrespective of disease stage,
and conversely that patients have a relatively good outcome whilst ambulatory. This
finding may influence the way doctors manage and monitor their patients in the
future as, in the UK and elsewhere, when patients are diagnosed with cirrhosis a
range of services are often implemented such as surveillance for hepatocellular
carcinoma and oesophageal varices [29-31]. Some of these health care interventions
may not be necessary or appropriate in certain patient groups, in particular those
with a very poor prognosis. Our results provide physicians as well as those planning
health services with precise and unbiased estimates of survival which should help to
allow optimisation of the allocation of limited resources. This may also allow
evaluation of effectiveness of potential interventions that aim to reduce emergency
admission among people with cirrhosis.
23 | P a g e
Acknowledgements: J.W. had the original idea for the study and all authors
contributed to its interpretation. S.R. was responsible for data management and
performed the data analysis. S.R. and J.W. initially drafted the paper. K.M.F., C.J.C.,
and G.P.A. revised the paper critically and all authors approved the final version. The
funders of this study had no role in the design, analysis or interpretation of the data.
S.R. is funded by the Fellowship awarded to J.W. Approval was given by the
Independent Scientific and Ethical Committee of the GPRD for this study
(09_065RA_3).
24 | P a g e
REFERENCES
[1] D'Amico G, Morabito A, Pagliaro L, Marubini E. Survival and prognostic indicators
in compensated and decompensated cirrhosis. Dig Dis Sci 1986; 31:468-75.
[2] Fialla AD, Schaffalitzky de Muckadell OB, Lassen AT. Incidence, etiology and
mortality of cirrhosis: a population-based cohort study. Scand J Gastroenterol 2012;
47:702-709.
[3] Jepsen P, Vilstrup H, Andersen PK, Lash TL, Sorensen HT. Comorbidity and
survival of Danish cirrhosis patients: a nationwide population-based cohort study.
Hepatology 2008; 48:214-220.
[4] Trevsani F, Magini G, Santi V, Morselli-Labate AM, Cantarini MC, Di Nolfo MA, et
al. Impact of etiology of cirrhosis on the survival of patients diagnosed with
hepatocellular carcinoma during surveillance. Am J Gastroenterology 2007;
102:1022-1031.
[5] Das K, Das K, Datta S, Pal S, Hembram JR, Dhali GK et al. Course of disease
and survival after onset of decompensation in hepatitis B virus-related. Liver
International 2010; 30:1033-1042.
[6] De Jongh FE, Janssen HL, de Man RA, Hop WC, Schalm SW, van Blankenstein
M. Survival & prognostic indicators in hepatitis B surface antigen-positive cirrhosis of
the liver. Gastroenterology 1992; 103:1630-1635.
[7] Hui AY, Chan HL, Leing NW, Hung LC, Chan FK, Sung JJ.Survival and
prognostic indicators in patients with hepatitis B virus-related cirrhosis after onset of
hepatic decompensation. J Clin Gastronenterol 2002; 34:569-572.
25 | P a g e
[8] Fleming KM, Aithal GP, Card TR, West J. All-cause mortality in people with
cirrhosis compared with the general population: a population-based cohort study.
Liver Int 2011; 32:79-84.
[9] Roberts SE, Goldacre MJ, Yeates D. Trends in mortality after hospital admission
for liver cirrhosis in an English population from 1968 to 1999. Gut 2005; 54:1615-
1621.
[10] Alikhan R, Peters F, Wilmott R, Cohen AT. Fatal pulmonary embolism in
hospitalised patients: a necropsy review. Clinical Pathology 2004; 57 (12): 1254-
1257.
[11] Walley T, Mantgani A. The UK General Practice Reserach Database. Lancet
1997; 350:1097-1099.
[12] Fleming KM, Aithal GP, Solaymani-Dodaran M, Card TR, West J. Incidence and
prevalence of cirrhosis in the United Kingdom, 1992-2001: A general population-
based study. J Hepatol 2008; 49:732-738.
[13] Lewis JD, Biker WB, Weinstein RB, Strom BL. The relationship between time
since registration and measured incidence rates in the General Practice Research
Database. Pharmacoepidemiol Drug Saf 2005; 14:443-451.
[14] NHS Information Centre [Intermet]. Available at http://www.ic.nhs.uk/ (last
accessed 15th February 2013).
[15] Chief Medical Officer [Internet]
http://www.dh.gov.uk/en/Publichealth/Alcoholmisuse/DH_125368 (last accessed
19th December 2012).
[16] Information Centre [Internet]. Available at http://www.ic.nhs.uk/pubs/alcohol12/
(last accessed 15th February 2013).
26 | P a g e
[17] De Franchis R. Evolving consensus in portal hypertension,. Report of the
Baveno IV consensus workshop on methodology of diagnosis and therapy in potal
hypertension. J Heptol 2005; 43(1):167-76.
[18] Cancer research UK [Internet]. Available at
http://info.cancerresearchuk.org/cancerstats/(last accessed 15th February 2013).
[19] Leon DA, McCambridge J. Liver cirrhosis mortality rates in Britain from 1950 to
2002: an analysis of routine data. Lancet 2006; 367(9504):52-56.
[20] Khan NF, Harrison SE, Rose PW. Validity of diagnostic coding within the
General Practice Research Database: a systematic review. British Journal of
General Practice 2010; 60:e128-e136(9).
[21] Herrett E, Thomas SL, Schoonen WM, Smeeth L, Hall AJ. Validation and
validity of diagnoses in the General Practice Research Database: a systematic
review. Br J Clin Pharmacol 2010. 69(1): 4-14.
[22] Kramer JR, Davila JA, Miller ED, Richardson P, Giordano TP, El-Seraq HB. The
validity of viral hepatitis and chronic liver disease diagnoses in Veterans Affairs
administrative databases. Aliment Pharmacol & Ther 2008; 27:274-282.
[23] Audit Commission. Improving data quality in the NHS Annual report on the PbR
assurance programme. Audit Commission Publishing Team 2010.
[24] Fleming KM, Aithal GP, Card TR West J. The rate of decompensation and
clinical progression of disease in people with cirrhosis: a cohort study. Aliment
Pharmacol Ther 2010; 32:1343-1350.
27 | P a g e
[25] Jepsen P, Ott P, Andersen PK, Sorensen HT, Vilstrup H. Clinical course of
alcoholic liver cirrhosis: A Danish population-based cohort study. Hepatology 2010;
51:675-682.
[26] Kamath PS, Wiesner RH, Malnichoc M, Kremers W, Therneau TM, Kosberg CL
et al. A model to predict survival in patients with end-stage liver disease. Hepatology
2001; 33:464-470.
[27] Christensen E, Schilting P, Fauerholdt L, Gluud C, Andersen PK, Juhl E et al.
Prognostic value of Child-Turcotte criteria in medically treated cirrhosis. American
assoc for the study of liver diseases 1984; 4:430-435.
[28] Saunders JB, Walters JR, Davies AP, Paton A. A 20-year prospective study of
cirrhosis. Br Med J (Clin Res Ed) 1981; 282:263-266.
[29] Guidelines for HCC surveillance [internet] Available at
http://www.bsg.org.uk/clinical-guidelines/liver/guidelines-for-the-diagnosis-and-treatment-of-
hepatocellular-carcinoma-hcc-in-adults.html (last accessed 9th May 2013).
[30] Jalan R, Hayes P. UK guidelines on the management of variceal haemorrhage
in cirrhotic patients. GUT 2000; 46(3): iii1-iii15.
[31] El-Serag HB, Davila JA. Surveillance for hepatocellular carcinoma: in whom and
how? Therap Adv Gastroenterol 2011; 4(1): 5-10.
28 | P a g e
Table 1 Patient characteristics of the incident study cohort, 1998-2009
Males Females
Patient group Ambulatory
at first
diagnosis
n=1393
Hospitalised
at first
diagnosis
n=1572
Overall
n=2965
Ambulatory
at first
diagnosis
n=1079
Hospitalised
at first
diagnosis
n=1074
Overall
n=2153
Median f/up [IQR] Yrs*
1.66 [0.42, 3.82]
1.15 [0.14, 3.36]
1.75 [0.37, 4.11]
2.35 [0.85, 4.77]
1.37 [0.13, 3.69]
2.25 [0.55, 4.82]
No. deaths (%) 617 (44.3) 939 (59.7) 1556 (52.5) 375 (34.5) 634 (59) 1009 (46.9)
No. with aetiology
(%) Alcohol 758 (54.4) 1076 (68.4) 1834 (61.9) 355 (32.9) 567 (52.8) 922 (42.8)
Viral hepatitis 203 (14.6) 132 (8.4) 335 (11.3) 146 (13.5) 93 (8.7) 239 (11.1)
Autoimmune/ Metabolic disease 105 (7.5) 78 (5) 183 (6.2) 210 (19.5) 112 (10.4) 322 (15)
Cryptogenic 327 (23.5) 286 (18.2) 613 (20.7) 368 (34.1) 302 (28.1) 670 (31.1)
Mean age (sd) yrs 59.2 (13) 57.9 (14.5) 58.5 (13.8) 61.3 (14.7) 59.4 (14.9) 60.3 (14.8)
Age at diagnosis
(%) yrs:
<45 170 (12.2) 276 (17.6) 446 (15) 137 (12.7) 167 (15.6) 304 (14.1)
45 to 54 318 (22.8) 384 (24.4) 702 (23.7) 203 (18.8) 244 (22.7) 447 (20.8)
55 to 64 417 (29.9) 373 (23.7) 790 (26.6) 254 (23.5) 258 (24) 512 (23.8)
65 to 74 292 (21) 288 (18.3) 580 (19.6) 245 (22.7) 195 (18.2) 440 (20.4)
75 + 196 (14.1) 251 (16) 447 (15.1) 240 (22.2) 210 (19.6) 450 (20.9)
Baveno IV stage 1 819 (27.6) 388 (24.7) 1207 (40.7) 652 (30.3) 286 (26.6) 938 (43.6)
2 269 (9.1) 163 (10.4) 432 (14.6) 207 (9.6) 78 (7.3) 285 (13.2)
3 178 (6) 649 (41.3) 827 (27.9) 149 (6.9) 472 (44) 621 (28.8)
4 127 (4.3) 372 (23.7) 499 (16.8) 71 (3.3) 238 (22.2) 309 (14.4)
* Follow-up for the Ambulatory at first diagnosis is from time of diagnosis to end of follow-up or emergency hospitalisation (for
those who had one).
29 | P a g e
Table 2 Survival probabilities (95% CI) at 5-years by sex, time-at-risk, aetiology and age
Aetiology
Males Females
Ambulatory n=1393
Subsequent to hospitalisation n=2067
Ambulatory n=1079
Subsequent to
hospitalisation n=1404
Alcoholic n=2756
N=
<45 yrs 0.79 (0.63, 0.89) 0.47 (0.39, 0.54) 0.87 (0.69, 0.95) 0.50 (0.39, 0.60)
45 to 54 0.78 (0.68, 0.85) 0.39 (0.33, 0.45) 0.82 (0.70, 0.89) 0.35 (0.28, 0.43)
55 to 64 0.70 (0.61, 0.77) 0.30 (0.25, 0.36) 0.79 (0.64, 0.89) 0.38 (0.31, 0.45)
65 to 74 0.71 (0.60, 0.79) 0.21 (0.15, 0.27) 0.88 (0.73, 0.95) 0.21 (0.13, 0.31)
75+ 0.37 (0.19, 0.54) 0.07 (0.03, 0.13) 0.50 (0.24, 0.72) 0.16 (0.06, 0.29)
Overall 0.70 (0.65, 0.74) 0.31 (0.28, 0.34) 0.79 (0.73, 0.85) 0.35 (0.31, 0.39)
Viral hepatitis n=574
<45 yrs 0.77 (0.59, 0.88) 0.39 (0.23, 0.55) 0.92 (0.54, 0.99) 0.54 (0.31, 0.72)
45 to 54 0.92 (0.79, 0.97) 0.31 (0.19, 0.44) 0.87 (0.63, 0.96) 0.47 (0.27, 0.64)
55 to 64 0.81 (0.62, 0.91) 0.44 (0.26, 0.61) 0.92 (0.57, 0.99) 0.34 (0.16, 0.53)
65 to 74 0.65 (0.18, 0.90) 0 0.84 (0.61, 0.94) 0.25 (0.07, 0.49)
75+ 0.47 (0.15, 0.74) 0.06(0.03, 0.25) 0.61 (0.36, 0.79) 0.10 (0.02, 0.28)
Overall 0.79 (0.70, 0.86) 0.31 (0.23, 0.38) 0.83 (0.73, 0.90) 0.36 (0.27, 0.46)
Autoimmune/Metabolic
disease n=505 <45 yrs 0.83 (0.27, 0.97) 0.47 (0.15, 0.74) 1 0.91 (0.51, 0.99)
45 to 54 1 0.32 (0.12, 0.54) 1 0.45 (0.24, 0.65)
55 to 64 0.88 (0.57, 0.97) 0.25 (0.12, 0.41) 0.98 (0.84, 0.99) 0.57 (0.35, 0.74)
65 to 74 0.82 (0.52, 0.94) 0.36 (0.17, 0.56) 0.86 (0.71, 0.94) 0.17 (0.08, 0.28)
75+ 0.65 (0.34, 0.84) 0 0.72 (0.48, 0.87) 0
Overall 0.84 (0.72, 0.88) 0.28 (0.19, 0.37) 0.90 (0.83, 0.94) 0.28 (0.20, 0.36)
Cryptogenic n=1283
<45 yrs 0.81 (0.44, 0.94) 0.72 (0.48, 0.87) 0.93 (0.79, 0.98) 0.79 (0.62, 0.89)
45 to 54 0.95 (0.81, 0.99) 0.49 (0.27, 0.68) 0.98 (0.84, 0.99) 0.42 (0.18, 0.65)
55 to 64 0.74 (0.59, 0.84) 0.12 (0.04, 0.23) 0.85 (0.70, 0.93) 0.47 (0.30, 0.62)
65 to 74 0.47 (0.33, 0.60) 0.18 (0.09, 0.30) 0.62 (0.48, 0.74) 0.26 (0.16, 0.37)
75+ 0.41 (0.25, 0.55) 0.10 (0.06, 0.16) 0.58 (0.48, 0.68) 0.12 (0.07, 0.19)
Overall 0.61 (0.53, 0.68) 0.19 (0.14, 0.24) 0.72 (0.67, 0.78) 0.29 (0.24, 0.35)
Total 0.70 (0.66, 0.73) 0.29 (0.26, 0.31) 0.79 (0.76, 0.82) 0.33 (0.30, 0.36)
CI=confidence intervals
30 | P a g e
Table 3: Multivariate cox regression model for n=5118 patients
Adjusted hazard ratios (95% CI)* P-value
Time at risk:
Ambulatory
Hospitalised
Ref
4.11 (3.7, 4.58)
<0.001
Gender:
Male
Female
Ref
0.83 (0.76, 0.90)
<0.001
Age at diagnosis (%) yrs:
<45
45 to 54
55 to 64
65 to 74
75 +
Ref
1.78 (1.03, 3.09)
3.34 (2.09, 5.35)
4.53 (2.91, 7.05)
6.94 (4.51, 10.7)
<0.001
Aetiology (%):
Cryptogenic
Alcohol
Viral hepatitis
Autoimmune/
Metabolic disease
Ref
1.82 (1.17, 2.84)
2.03 (1.23, 3.37)
0.81 (0.36, 1.82)
0.01
Interaction age and aetiology
<45 years
Cryptogenic
Alcohol
Viral hepatitis
Autoimmune/
Metabolic disease
45-54 years
Cryptogenic
Alcohol
Viral hepatitis
Autoimmune/
Metabolic disease
55-64 years
Cryptogenic
Alcohol
Ref
1.81 (1.17, 2.84)
2.03 (1.23, 3.37)
0.81 (0.55, 2.21)
Ref
1.46 (1.00, 2.11)
1.36 (0.87, 2.06)
1.28 (0.77, 2.14)
Ref
0.90 (0.72, 1.14)
<0.001
31 | P a g e
Viral hepatitis
Autoimmune/
Metabolic disease
65-74 years
Cryptogenic
Alcohol
Viral hepatitis
Autoimmune/
Metabolic disease
75+ years
Cryptogenic
Alcohol
Viral hepatitis
Autoimmune/
Metabolic disease
0.70 (0.49, 0.99)
0.56 (0.38, 0.82
Ref
0.88 (0.73, 1.06)
0.91 (0.65, 1.29)
0.76 (0.57, 1.01)
Ref
0.99 (0.82, 1.18)
1.03 (0.74, 1.43)
0.92 (0.71, 1.20)
Stage of disease:
Compensated
Decompensated
Ref
1.20 (1.11, 1.31)
<0.001
*Mutually adjusted for factors in table. CI=confidence intervals
32 | P a g e
Figure legends
Fig. 1 Survival estimates within 5 years by time-at-risk group
Number at risk is calculated at each point by excluding previous deaths and censored events
0.0
00.2
50.5
00.7
51.0
0
Surv
ival p
rob
ab
ility
2646 1684 1325 1007 759 578Subseq.hospt2472 1662 1212 886 676 503Ambulatory
Number at risk
0 1 2 3 4 5Follow-up time (years)
Ambulatory Subseq.hospt
Kaplan-Meier survival estimates
33 | P a g e
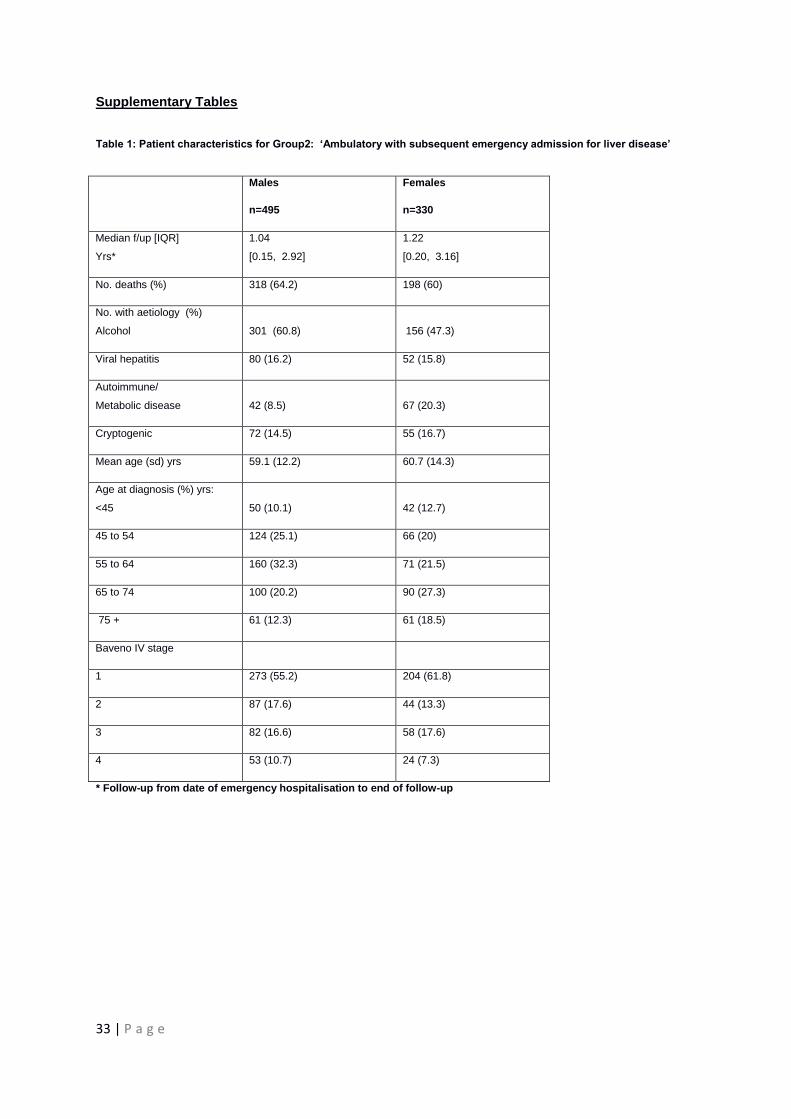
Supplementary Tables
Table 1: Patient characteristics for Group2: ‘Ambulatory with subsequent emergency admission for liver disease’
Males
n=495
Females
n=330
Median f/up [IQR]
Yrs*
1.04
[0.15, 2.92]
1.22
[0.20, 3.16]
No. deaths (%) 318 (64.2) 198 (60)
No. with aetiology (%)
Alcohol 301 (60.8) 156 (47.3)
Viral hepatitis 80 (16.2) 52 (15.8)
Autoimmune/
Metabolic disease 42 (8.5) 67 (20.3)
Cryptogenic 72 (14.5) 55 (16.7)
Mean age (sd) yrs 59.1 (12.2) 60.7 (14.3)
Age at diagnosis (%) yrs:
<45 50 (10.1) 42 (12.7)
45 to 54 124 (25.1) 66 (20)
55 to 64 160 (32.3) 71 (21.5)
65 to 74 100 (20.2) 90 (27.3)
75 + 61 (12.3) 61 (18.5)
Baveno IV stage
1 273 (55.2) 204 (61.8)
2 87 (17.6) 44 (13.3)
3 82 (16.6) 58 (17.6)
4 53 (10.7) 24 (7.3)
* Follow-up from date of emergency hospitalisation to end of follow-up
34 | P a g e
Table 2 Survival probabilities (95% CI) at 1-year by sex, time-at-risk, aetiology and age-group
Aetiology
Males Females
Ambulatory* n=1393
Subsequent to hospitalisation¥ n=2067
Ambulatory n=1079
Subsequent to
hospitalisation n=1404
Alcoholic n=2756
N=
<45 yrs 0.89 (0.79, 0.95) 0.75 (0.69, 0.81) 0.91 (0.78, 0.97) 0.76 (0.67, 0.83)
45 to 54 0.89 (0.83, 0.93) 0.64 (0.58, 0.69) 0.94 (0.87, 0.97) 0.66 (0.59, 0.73)
55 to 64 0.85 (0.79, 0.89) 0.61 (0.56, 0.66) 0.92 (0.84, 0.96) 0.59 (0.51, 0.65)
65 to 74 0.86 (0.79, 0.91) 0.47 (0.40, 0.53) 0.96 (0.86, 0.99) 0.53 (0.42, 0.62)
75+ 0.65 (0.52, 0.75) 0.31 (0.22, 0.40) 0.86 (0.66, 0.94) 0.30 (0.17, 0.45)
Overall 0.85 (0.82, 0.87) 0.59 (0.56, 0.62) 0.92 (0.89, 0.95) 0.62 (0.58, 0.65)
Viral hepatitis n=574 <45 yrs 0.95 (0.83, 0.99) 0.69 (0.53, 0.81) 1.0 0.72 (0.49, 0.87)
45 to 54 0.97 (0.88, 0.99) 0.56 (0.42, 0.68) 0.93 (0.74, 0.98) 0.77 (0.57, 0.88)
55 to 64 0.98 (0.85, 0.99) 0.68 (0.48, 0.82) 1.0 0.63 (0.39, 0.79)
65 to 74 0.94 (0.67, 0.99) 0.33 (0.13, 0.55) 0.97 (0.80, 1.0) 0.78 (0.46, 0.92)
75+ 0.81 (0.42, 0.95) 0.17 (0.03, 0.42) 0.73 (0.50, 0.87) 0.33 (0.11, 0.57)
Overall 0.96 (0.91, 0.98) 0.57 (0.48, 0.64) 0.93 (0.87, 0.97) 0.67 (0.57, 0.75)
Autoimmune/Metabolic
n=505 <45 yrs 1.0 0.92 (0.54, 0.99) 1.0 0.91 (0.51, 0.99)
45 to 54 1.0 0.53 (0.27, 0.74) 1.0 0.70 (0.45, 0.85)
55 to 64 0.96 (0.75, 0.99) 0.54 (0.27, 0.74) 1.0 0.75 (0.52, 0.88)
65 to 74 1.0 0.60 (0.36, 0.78) 0.98 (0.89, 1.00) 0.54 (0.35, 0.69)
75+ 0.81 (0.52, 0.94) 0.23 (0.06, 0.47) 0.86 (0.71, 0.93) 0.38 (0.22, 0.55)
Overall 0.96 (0.89, 0.98) 0.56 (0.45, 0.66) 0.96 (0.89, 0.98) 0.60 (0.50, 0.68)
Cryptogenic
n=1283
<45 yrs 0.92 (0.72, 0.98) 0.79 (0.56, 0.90) 0.93 (0.79, 0.98) 0.82 (0.65, 0.91)
45 to 54 0.95 (0.81, 0.99) 0.69 (0.45, 0.84) 0.98 (0.84, 2.00) 0.63 (0.39, 0.79)
55 to 64 0.85 (0.74, 0.92) 0.28 (0.15, 0.42) 0.94 (0.84, 0.98) 0.57 (0.41, 0.69)
65 to 74 0.74 (0.64, 0.82) 0.51 (0.39, 0.61) 0.84 (0.73, 0.91) 0.47 (0.36, 0.58)
75+ 0.74 (0.60, 0.82) 0.28 (0.21, 0.35) 0.76 (0.68, 0.83) 0.31 (0.24, 0.39)
Overall 0.81 (0.76, 0.85) 0.40 (0.35, 0.45) 0.85 (0.81, 0.89) 0.47 (0.41, 0.52)
Total 0.86 (0.84, 0.88) 0.55 (0.53, 0.58) 0.91 (0.89, 0.92) 0.58 (0.55, 0.61)
CI=confidence intervals.
35 | P a g e
Table 3 Clinical examples of how survival estimates can be applied to different clinical settings
Clinical example 1
Clinical example 2
Clinical example 3
A 54-year old man, who only has minimal alcohol
intake, is taken to A&E with haematemesis from
oesophageal varices and diagnosed with cirrhosis of a
non-alcoholic aetiology i.e. viral hepatitis. His 1- and 5-
year chances of survival are approximately 56% and
31% respectively. A woman with a similar patient
profile would have 1- and 5-year chances of survival of
77% and 47% respectively.
A 28-year old woman, who is a chronic alcohol drinker,
has a palpable liver and jaundice and is referred by her
GP to a hepatology clinic where she is diagnosed with
cirrhosis. One year later she is taken to A&E with
oesophageal bleeding. Her 1- and 5-year chances of
survival are 76% and 50% respectively. By contrast a
similarly aged woman who has cryptogenic cirrhosis
and who is then admitted to hospital for her liver
disease has a chance of survival of 82% at 1-year and
79% at 5-years following hospitalisation.
A 44-year old woman, who has a history of alcohol
abuse has abnormal LFTs and is referred by her GP to
a hepatology clinic where she is diagnosed with
cirrhosis. Her 1- and 5-year chances of survival are
91% and 87% respectively. A few months later she is
admitted to hospital with haematemesis from
oesophageal varices. Following this hospital admission
her 1- and 5-year chances of survival, are reduced to
76% and 50% respectively.


![Notes on the Dynamics of Disorder On the ... - Gavin E. Crooks · Jarzynski equality: Jarzynski (1997)[50]. Crooks fluc-tuation theorem: Crooks (1999)[75]. Hatano-Sasa fluctuation](https://img.pdfslide.us/doc/110x75/60770f743369d13f85533931/notes-on-the-dynamics-of-disorder-on-the-gavin-e-crooks-jarzynski-equality.jpg)


![[Slideshare] tafaqqahu-(2014)-#8 -epilogue-reflection-ratib-(20-december-2014)](https://img.pdfslide.us/doc/110x75/55a08d641a28ab8b228b478b/slideshare-tafaqqahu-2014-8-epilogue-reflection-ratib-20-december-2014.jpg)