Embed Size (px)
Citation preview

Rathcke, T., Stuart-Smith, J., Torsney, B., and Harrington, J. (2017) The
beauty in a beast: minimising the effects of diverse recording quality on
vowel formant measurements in sociophonetic real-time studies. Speech
Communication, 86, pp. 24-41. (doi:10.1016/j.specom.2016.11.001)
This is the author’s final accepted version.
There may be differences between this version and the published version.
You are advised to consult the publisher’s version if you wish to cite from
it.
http://eprints.gla.ac.uk/131087/
Deposited on: 07 November 2016
Enlighten – Research publications by members of the University of Glasgow
http://eprints.gla.ac.uk

1
The beauty in a beast: Minimising the effects of diverse recording quality on vowel formant measurements in sociophonetic real-time studies
Tamara Rathckea,*, Jane Stuart-Smithb, Bernard Torsneyc, Jonathan Harringtond
a English Language and Linguistics, University of Kent, UK
b English Language, University of Glasgow, UK
c School of Mathematics and Statistics, University of Glasgow, UK
d Institute of Phonetics and Speech Processing, University of Munich, Germany
*Corresponding author: [email protected]
ABSTRACT
Sociophonetic real-time studies of vowel variation and change rely on acoustic analyses of
sound recordings made at different times, often using different equipment and data
collection procedures. The circumstances of a recording are known to affect formant
tracking and may therefore compromise the validity of conclusions about sound changes
made on the basis of real-time data. In this paper, a traditional F1/F2-analysis using linear
predictive coding (LPC) was applied to the vowels /i u a/ extracted from spontaneous
speech corpora of Glaswegian vernacular, that were recorded in the 1970s and 2000s. We
assessed the technical quality of each recording, concentrating on the average levels of
noise and the properties of spectral balance, and showed that the corpus comprised of
mixed quality data. A series of acoustic vowel analyses subsequently unveiled that formant
measurements using LPC were sensitive to the technical specification of a recording, with
variable magnitudes of the effects for vowels of different qualities. We evaluated the
performance of three commonly used formant normalisation procedures (Lobanov,
Nearey and Watt-Fabricius) as well as normalisations by a distance ratio metric and
statistical estimation, and compared these results to raw Bark-scaled formant data,
showing that some of the approaches could ameliorate the impact of technical issues better
than the others. We discuss the implications of these results for sociophonetic research
that aims to minimise extraneous influences on recorded speech data while unveiling
gradual, potentially small-scale sound changes across decades.
Keywords: Real-time corpus; Formants; Formant normalisation; Noise; SNR; Spectral tilt; Sociophonetic ‘gold standard’
2
1. INTRODUCTION
1.1. On the issue of comparability in sociolinguistic data
Since its origins in the early 1960s, variationist sociolinguistics has been concerned with
the methodological rigour of its quantitative enquiry. In the foreground of the early
discussions were the issues primarily involving the data collection, such as the “Observer’s
Paradox”, style shifts and sampling strategies (Labov 1972, Cukor-Avila, 2000).
Subsequent studies have further unveiled the multitude of the potential sources of
influences in sociolinguistic data, which include (and are not limited to) familiarity
between the participant and the interviewer, presence of additional peers during the
interview, the experience and elicitation strategies of the interviewer as well as the
quantitative approaches to analysing the data (Labov 1972; Milroy 1987; Milroy and
Gordon 2008; Llamas et al 2006; Tagliamonte 2006; see Tillery and Bailey (2003) for a
critical overview). All of these factors may not only influence the observed results, thus
misleading generalisations about the patterns of variation and change, but also reduce
comparability of the results across different studies of the same sociolinguistic
phenomena, undermining the core principles of methodologically sound research,
reliability and intersubjectivity.
Ultimately, sociolinguistic research aims to combine natural (or at least naturalistic) data
which preserves the social identity (Scobbie and Stuart-Smith 2012) with a rigorous
amelioration of any extraneous influences that can influence the data patterns. In their
critical paper, Tillery and Bailey (2003) suggested that this standard can only be achieved
through a solid understanding of the sources and the magnitudes of possible extraneous
influences on sociolinguistic data patterns, and regretted the current lack of such
understanding, calling for more research in this methodologically highly relevant area.
The present study aims to contribute to this endeavour, and is concerned with the potential
influences of technical specifications of recordings on the vowel formant measurements
taken from them. Vowel formants are the core acoustic correlates of vowel quality typically
obtained in sociophonetics (but see Harrington, Kleber and Reubold (2013) for an
alternative set of acoustic measures), and have been scrutinised in many studies of sound
variation and change (e.g. Fought 1999; Harrington, Cox and Evans 1997; Labov 1994;
Labov, Ash and Boberg 2006; Maclagan et al. 2009; Mesthrie 2010). In an apparent-time
setting, much care has traditionally been taken to account for the formant differences
arising from speaker physiology, relating primarily to the age and the vocal tract size (e.g.
Linvillea and Rens 2001), and to distinguish these physiological influences from the
sociolinguistically relevant patterns produced by speakers of different ages and sexes (e.g.
Labov, Ash and Boberg 2006). Numerous techniques have been developed, tested and
compared in order to achieve the normalisation for speaker physiology while preserving
the social indexicality of their speech (e.g. Adank, Smith and van Hout 2004; Clopper 2009;
Watt and Fabricius 2002; see Flynn (2011) for an overview). We will discuss the most
commonly used approaches in Sect. 3.3 below.

3
In contrast to this long-standing methodological debate characteristic of apparent-time
studies, real-time studies of sound variation and change have rarely problematized
potential issues involved in formant measurements of vowels. Trend studies with real-time
data (recorded with different samples of individuals from the same community at different
points in time) are unanimously recognised as a particularly insightful and reliable
methodological setting for studying language change at a community level (e.g. Labov
1994; Sankoff and Blondeau 2007; Trudgill 1988), primarily because they eliminate effects
related to speaker age, such as age grading (Wagner 2012). However, real-time studies
frequently rely on acoustic analyses of recordings of speech made using different
equipment with variable technical specifications and following different recording
procedures. To date, still little is known about the sources, types and magnitudes of
technical influences on the formant data. In the next section, we will give an overview of
the currently established effects, and hypothesise how they might play out in a real-time
study of sound variation and change.
1.2. Technical influences on formant measurements
Not many studies have addressed the question of whether, and how, formant values
(extracted using the traditional method of LPC) might be influenced by the equipment and
set-up of a recording and its resulting technical specifications. A series of studies have been
conducted in the context of forensic speaker identification (e.g. Byrne and Foulkes 2004;
Künzel 2001); and only a few, mostly preliminary investigations have recently pointed out
that technical issues of a recording may obscure the patterns of variation and change in
sociophonetics, too (De Decker and Nycz 2011; De Decker 2016; Hansen and Pharao 2006;
in progress).
In terms of the recording equipment and set-up, several features have been identified to
leave an imprint in the vowel spectrum and to impact on the measured formant values.
First of all, the band-pass filtering due to the transmission by phone lines (both mobile and
landline) is known to interfere with the calculation of the formants (Byrne and Foulkes
2004; Künzel 2001). Harmonics that lie below the lower cut-off boundary (approximately
300 Hz) and above the upper boundary (approximately 3.2 kHz in mobile phones and 3.5
kHz in landline transmissions) are most affected, since their weighting in the calculation of
the formant frequencies is decreased. This usually leads to artificially high frequencies of
F1 (particularly in high vowels whose F1 is much stronger affected than the relatively high
F1 of low vowels). However, even F2 whose frequencies fall within the transmitted range
shows some technically introduced artefacts. In comparison to the values obtained from a
recording made simultaneously with a studio microphone, F2 of high vowels tends to
measure lower values in mobile recordings (Byrne and Foulkes 2004), though the effect
tends to be smaller and has not been consistently documented in other phone
transmissions (Künzel 2001). The exact magnitudes of these technically introduced effects
also seem to vary substantially across different studies and types of phone transmissions,
and range between 14 and as high as 60 percent of the original frequency (Byrne and
Foulkes 2004; Künzel 2001).

4
Similar to the effects of band-pass filtering for a cost-effective phone transmission,
compression algorithms used for a space-effective storage of video and digital audio
recordings (as e.g. available on the internet) have been shown to influence spectral
properties of speech recordings (De Decker and Nycz 2011; Rozborski 2007; van Son
2005). F1 seems to be affected across the board, measuring higher values after a
compression, while the impact on F2 is rather mediated by vowel quality, raising F2 in high
vowels but lowering it in low vowels (De Decker and Nycz 2011). Again, the magnitude of
these effects varies across studies and compression methods, ranging from negligible
(≤3%, van Son 2005) to quite substantial (De Decker and Nycz 2011), with higher
compression rates leading to a more significant distortion of the original recording
(Rozborski 2007). Although mobile devices admittedly introduce numerical artefacts in
the formant values during the transmission (cf. Byrne and Foulkes 2004), De Decker and
Nycz (2011:54) argue that recordings made with some portable devices of the same
manufacturer (here, Macbook Pro and iPhone) produce comparable measurements, and
maintain an overall shape and size of the vowel space in comparison to uncompressed
recordings (at least as far as F1 and F2 are concerned), thus lending themselves to a
sociolinguistic investigation better than others (e.g. Mino-derived formats commonly used
by YouTube).
Apart from the influence the format of a recording can have on its spectra and formant
measurements taken using LPC, somewhat less obvious factors, such as ambient noise,
room acoustics, microphone make and placement during the recording session, have also
been shown to leave their spectral imprints and interfere with formant measurements (De
Decker 2016; Hansen and Pharao 2006, in progress; Plichta 2004; Svec and Granqvist
2010). The quality of the recordings not controlled for such influencing factors will likely
vary with respect to at least two technical specifications (cf. Svec and Granqvist 2010): (1)
the levels of noise, typically measured by the signal-to-noise ratio, SNR (see 2.3) and (2)
spectral balance (or tilt), reflected in the distribution of the intensity across lower vs.
higher harmonics of the spectrum (see 2.3 for more detail).
It is well known that high levels of background noise reduce intelligibility of speech (e.g.
Pollack and Pickett 1958), but even recordings made in relatively quiet surroundings can
differ with respect to their SNR. For example, hiss (or low-level white noise) can originate
from analogue electronics, ground hum and buzz from improperly grounded systems: the
fundamental of 50 or 60 Hz and their harmonics will be distinguishable in the recording
spectrum (Corley 2010). An increased distance of the microphone from the sound sources
can also decrease SNR, making the room reverberation and noises more prominent in a
sound recording (Corley 2010:57). Omnidirectional microphones usually pick up more
background noise than directional ones, with the small-tip versions producing particularly
noisy recordings (Svec and Granqvist 2010). In such increased noise levels (reflected in
lower SNR, see 2.3), formants often appear very faint or have larger bandwidths and are
therefore less clearly defined (Plichta 2004); Plichta strongly advises against using such

5
recordings for speech research. De Decker (2016), however, shows that not all types of
background noise have an equally damaging effect on the accuracy of formant estimation.
High levels of white noise (i.e. a signal with an equal amplitude at all frequencies of its wide-
band spectrum) exerts a particularly strong impact on the formant estimation while a 60-
Hz hum and even speech babble only have a subtle effect, if any at all.
Moving the microphone closer to the sound source – i.e. speaker mouth – may solve the
problem of the background noise in some cases (cf. recommendation (3) in De Decker
2016:99), however, a too close placement is likely to cause the so-called proximity or bass
effect, referring to a strong boost of lower frequencies in a spectrum (Corley 2010; Svec
and Granqvist 2010). All directional microphones are known to boost low frequencies
when working close, while omnidirectional microphones are relatively free of the effect
(Corley 2010; Svec and Granqvist 2010). Moreover, each microphone has its individual
frequency response, i.e. the intensity levels of the recording over the operating range of the
frequencies. In some microphones, a flat frequency response cannot be guaranteed at
distances other than 30 cm away from the sound sources while others always amplify the
frequencies between 3 and 10 kHz regardless of the distance (Svec and Granqvist 2010).
Brixen (1996; 1998) shows that differences in the microphone placement result in
different power spectra, particularly affecting lavalier and headband microphones when
they are placed very close to the sound source. Such differences in power spectra have been
further documented to impact upon LPC-based formant measurements, and to result in
partly substantial discrepancies between formant values extracted from these recordings
(Brixen 2011; Hansen and Pharao 2006, in progress): once again, F1 seems to be more
affected than F2, and shows discrepancies of up to 5 semitones while F2 measurements
deviate from each other in the region of 2-3 semitones when taken from recordings with
different spectral specifications. Moreover, the differences in spectra that lead to deviating
formant values may result not only from the microphone placement, but also from a
specific frequency response each microphone has as part of its technical specification and
often depends on the microphone-to-sound distance (Svec and Granqvist 2010 for an
overview). Importantly, Hansen and Pharao (in progress) highlight that these differences
in the LPC-based formant measurements cannot be straightforwardly attributed to the
microphone placement alone, but interact in complex ways with several other external
factors, including the particular vowel quality being measured and the room acoustics
where the recording took place.
To summarise results of the previous research discussed in this section, there is sufficient
evidence to demonstrate that LPC-based formant measurements are sensitive to the
technical quality of recordings. Two main recording features seem to play a major role: (1)
the SNR levels which can vary depending on the presence of extraneous noise, the
microphone type and the exact distance between the microphone and the mouth of the
speaker, and (2) the distribution of spectral information across the frequency range of 0-5
kHz varies in the recordings which depends on a variety of factors related mainly to the
recording equipment and set-up. In the resulting measurements, the frequency of F1 is

6
known to be particularly affected by these issues, although F2 also shows some technically
induced artefacts, even if of a smaller magnitude.
The primary interest of the studies reviewed in this section is rather technical (with
implications for forensic or sociophonetic research, e.g. De Decker 2016; De Decker and
Nycz 2011; Rozborski 2007). Most of them compared recordings made simultaneously
with variable equipment, and estimated the resulting differences in formant frequencies
those recordings measured (Byrne and Foulkes 2004; De Decker and Nycz 2011; Hansen
and Pharao 2006, in progress; Künzel 2001; Plichta 2004; van Son 2005). While all of the
factors identified above may potentially play out in sociophonetic real-time corpora and
contribute to the corpus diversity in terms of technical quality, the ultimate goal of
sociolinguistic research is to unveil gradual, potentially small-scale sound variations and
changes across decades. For doing so, researchers need to be aware of the sources, the
magnitudes and directions of such technical influences and enabled to keep their imprint
on recorded speech data minimal (see 1.1). The present paper aims to tackle this challenge,
or at least evaluate different strategies to approaching this methodological issue. To our
knowledge, no previous study has identified and systematically investigated the
relationship between such properties of the spectrum as variable SNR levels and spectral
tilts on the one hand, and the LPC-based formant values on the other. These two features
of the spectrum may result from various sources over which sociophoneticians working
with real-time corpora may not have control, but the knowledge of the existence of these
two easily assessable (see 2.3) spectral properties may well enable them to apply some
post-hoc procedures that will eliminate the technically introduced artefacts in formant
values described above. We can test and evaluate such possible post-hoc procedures using
a phonetic case study where the presence of change and its direction have been
demonstrated by independent research - this will allow us to see if we can minimise the
potential effects of technical diversity in a real-time corpus, while still observing patterns
of variation and change that converge with the previous findings. A perfect candidate for
such a case study was deemed to be the variable /u/ in Scottish English.
1.3. /u/ in Scottish English
As a case study into sound change, the high back round vowel /u/ has recently attracted
an extensive experimental scrutiny in many varieties of English. A change in progress
towards a more fronted, near-central variant [u] has been demonstrated for many varieties
of English, including Standard Southern British English (e.g. Hawkins and Midgley 2005;
Harrington 2007; McDougall and Nolan 2007), American English spoken by mainstream as
well as minority speakers (Labov, Ash and Boberg 2006; Fought 1999), Australian, New
Zealand and South African varieties (e.g. Harrington, Cox and Evans 1997; Maclagan et al
2009; Mesthrie 2010). While this change appears to have been taking place in Anglo-
English over the last fifty years (e.g. Harrington et al 2011), the situation seems to be more
complex north of the border in Scotland. A fronted production of this vowel has been a

7
long-established diagnostic trait in Scottish varieties of English, most notably in the urban
Scots vernacular spoken in Glasgow (e.g. Wells 1982: 402; Stuart-Smith 2004: 58–59).1
Auditorily, Scottish English /u/ has been reported to be close to the central [u] for a long
time; vernacular Scots is reported to be even fronter in contrast to the backer [u] of
educated Scottish Standard English (McAllister 1938; Macaulay 1977; Johnston and Speitel
1983). Contemporary articulatory-phonetic analysis suggests that /u/ is not only front but
also low, and specifically that the tongue position is as front as that of front vowels /i ɪ e ɛ/,
and lower than /ɪ/ and /ɛ/ (Scobbie 2011; Scobbie, Lawson and Stuart-Smith 2012). These
findings may reflect a real-time process of fronting and lowering, i.e. we can expect to
detect a change in the acoustic realisation of this vowel in real-time over the past 40 years.
Recent real-time acoustic-phonetic data from Glasgow, comparing speakers from 1916
with those recorded in the 1970s to 2000s, of different ages, suggests that /u/ has lowered
over the 20th century (Stuart-Smith et al 2016). Taken together, these findings suggest a
real-time process of lowering, and possibly further fronting, i.e. we can expect to detect a
change in the acoustic realisation of this vowel in real-time over the past 40 years.
1.4. Goals of the present study
The main goal of the study was to examine whether or not differences in the technical
quality of recordings, which seemed likely to intersperse a sociolinguistic real-time corpus
(SNR, spectral balance), may have an impact on the values of F1 and/or F2 calculated using
a standard LPC-algorithm. We addressed this question using the example of a subset from
an electronic real-time corpus of Glaswegian vernacular speech which comprises of diverse
recordings made at different points in time, by different people and for different purposes
(including sociolinguistic and oral history interviews as well as free conversations, see 2.1;
Rathcke and Stuart-Smith 2015; Stuart-Smith et al. 2015).2 We chose /u/ as a case study
into disentangling the technical effects from the sound change, given there exists some
reliable external evidence for this vowel in both historical and modern-day Scottish English
data (McAllister 1938; Macaulay 1977; Johnston and Speitel 1983; Scobbie 2011; Scobbie,
Lawson and Stuart-Smith 2012; Stuart-Smith et al 2016).
If, as we may expect (see 1.2), a technical influence can indeed be attested in formant
measurements taken from sociolinguistic real-time recordings, we would further want to
know if different vowel qualities were affected in similar ways, and the extent to which
they were affected. For the purposes of this investigation, we chose the high front vowel
/i/ and the low central /a/ as reference vowels. Apart from being the corner vowels of the
Scottish system (Scobbie 2011; Scobbie, Lawson and Stuart-Smith 2012), neither /i/ nor
/a/ could have been expected to show sound changes in Scottish English (see 3.5 for
1 It should be noted that Glaswegian has a typical vowel systems of Scottish English characterised by a FOOT–GOOSE merger (e.g. Ferragne and Pellegrino 2010; Stuart-Smith 2004). 2 For more information on this real-time project, visit http://soundsofthecity.arts.gla.ac.uk/index.html

8
further discussion). In contrast, our target vowel – which we will henceforth refer to as the
high rounded central /u/ - may well be in focus of potential sound changes (see 1.3).
Finally, following from the above findings, we aimed at establishing a procedure to
minimise, or even eliminate, any effect of technical quality differences on F1/F2
measurements in order to allow for a methodologically sound inference of vowel changes
in valuable real-time corpora which are generally recognised to offer an insightful and
reliable tool for studying language change at a community level (e.g. Labov 1994; Sankoff
and Blondeau 2007; Trudgill 1988).
2. DATABASE
2.1. Real-time corpus of Glaswegian vernacular speech
The real-time data to be discussed in this paper span four decades of Glaswegian
vernacular speech, from early 1970s to late 2000s. They draw upon common types of
speech recordings which were deemed representative of the data available for
sociolinguistic real-time analyses at the present day (i.e. sociolinguistic or oral history
interviews, free conversations). Recordings of this type are typically held at national or
local libraries, sound archives or in private collections. This paper deals with data from 24
male speakers of the working class background. The sample consists of three age groups:
Young (12-17 y.o.), Middle-aged (40-55 y.o.) and Old (67-90 y.o.), with four speakers per
group. The speakers were recorded either in the 1970s or in the 2000s.
A large part of the 1970s-subcorpus consists of sociolinguistic interviews carried out by
Ronald Macaulay in 1973 (Macaulay 1977). Teenagers (70-Y, m1-m4) and middle-aged
speakers (70-M, m1-m3) were interviewed in quiet rooms using a lavalier microphone Uher
M822 which was placed somewhere on the speaker (usually on the lapel). These recordings
are held at the University of Edinburgh and were digitised at their Sound Archives. The
remaining speaker of the middle-aged sample (70-M, m4) was interviewed by William
Labov in the early 1970s. The interview took place at the interviewee’s home, in the East
End of Glasgow. Details of the recording equipment are not known. The digitised sound file
was kindly provided by the Linguistics Department of the University of Pennsylvania. For
the older speaker group, most of our recordings (70-O, m1-m3) were collected between
1970 and 1973 for the project entitled 'Family Life and Work Experience before 1918' as a
part of the first national oral history survey in the UK (Thompson 1975/1992). The master
tapes of these recordings are held at the British Library in London and were digitised by
their media services. They were supplemented by an interview about the history of the
cinema and film theatres in Glasgow, which was recorded in the early 1970s at the People’s
Palace by the curator of the museum Elspeth King. The cassette recording is held at the
Glasgow Museums Resource Centre and was digitised by the first author using Marantz CP
430 recorder.
The main resource for speech data from the 2000s was the Media Project Corpus recorded
in Glasgow in 2003, along with socio-economic and attitudinal data, to investigate the

9
impact of media on linguistic properties of the Glaswegian vernacular (Stuart-Smith 2006;
Stuart-Smith et al. 2013). Free conversations between self-selected pairs of interlocutors
included teenagers (00-Y, m1-m4), who were recorded in quiet rooms at schools, and adult
speakers (00-M, m1-m04), who talked to each other in Glasgow West-End pubs with
varying degrees of background noise interspersing the conversation. For these recordings,
a Sony ECM CS10 lavalier microphone was placed on the speaker’s chest. The data for the
older speaker group was taken from two series of oral history interviews, The M-74
collection (00-O, m1, recorded in 2008) and The Dock Workers collection (00-O, m4, m5, m6,
recorded in 2010), both conducted by an oral historian from the Scottish Oral History
Archives at the University of Strathclyde. Audio-technica PRO70 lapel microphones were
used and placed on the speaker’s upper chest. The interviews took place at interviewee’s
homes, in quiet surroundings. Digitised copies of the interviews were made available for
phonetic research by the Archives.
We note that the recordings of the corpus were digitised at varied sampling rates, using
diverse equipment. Little is known about how the digitisation of old reel-to-reel tapes (as
in Macaulay’s recordings) or cassettes (as in all other 1970s-recordings) may affect
acoustic properties of the spectrum. A discussion of such issues is beyond the scope of this
paper. For the purposes of the current investigation, all recordings were downsampled to
10 kHz for the formant analyses undertaken in Praat (see below for more detail).
The recordings might differ with respect to their stylistic setting due to the field method
employed for their collection (see Gregersen and Barner-Ramussen (2011) for an
overview). 2000s-dialogs of young and middle-aged men are quite possibly a closer
approximation of vernacular speech since they had the advantage of a familiar audience as
compared to the sociolinguistic and oral history interviews available for the 1970s and
older speakers (Bell 1984). To this end, 00-M and 00-Y data obtained from more casual
conversations can be expected to show more target undershoot, i.e. more centralised
realisations of all vowels (Moon and Lindbloom 1994; Picheny, Durlach and Braida 1986).
Also, a stylistic shift towards the local standard variety may occur in more formal interview
settings. In the context of this investigation, this would mean a slight retraction of the target
vowel /u/ (cf. Stuart-Smith 1999) and is more likely to occur in the sociolinguistic and oral
history interviews (all 70s and 00-O groups) than in the spontaneous conversations (00-Y
and 00-M groups). However, the situation of being recorded while speaking into a
microphone might have created comparable levels of awareness and attention drawn to
speech production and therefore resulted in negligible phonetic differences due to style
shifting (cf. Labov 1994: 157-158). In any case, even if we consider stylistic differences
across the dataset as being minimal, we are still left with conspicuous differences in
technical quality of the 1970s and 2000s-recordings, to be illustrated below (see 2.3).
2.2. Data preparation
All corpus recordings were first transcribed orthographically by native speakers of Scottish
English. Dysfluencies, overlaps, laughed or sung speech and other features worth

10
considering in subsequent analyses were captured at multiple layers in Transcriber
software (Barras et al. 2001).
For the chosen 24 speakers, we extracted all words containing lexically stressed and
phrasally prominent /i u a/ vowels (except those preceding a postvocalic /r/), totalling
N=3610. To insure consistency across the dataset, a protocol of segmentation and labelling
was developed to guide the data preparation by two fully trained phoneticians (one of them
the first author). EMU-software (Cassidy and Harrington 2001, Winkelmann 2015) was
used to create a hierarchically and sequentially organised speech database for acoustic
analyses. All acoustic measurements reflecting recording quality reported below were
taken based on the DFT-spectra created in EMU (Harrington 2010, see 2.3) while formant
values were calculated using Praat (Boersma and Weenink 2013, see 3.1). Subsequent data
processing was conducted in R (version 2.15.1). Statistical analyses were also run in R
(version 3.1.0).
2.3. Differences in recording quality across the selected dataset
To our knowledge, most of the recordings in our corpus were made using lavalier
omnidirectional microphones. However, they were of different makes, and we know
nothing about their frequency response. As far as we are aware, the microphone placement
was not controlled for, neither were sources of background noise or acoustic properties at
the respective places where recordings took place. To illustrate resulting differences in
sound quality, spectrograms of six recording samples showing the frequent word good
(chosen as it contains the target vowel /u/) are compared in Figure 1.
The two main issues related to the technical quality of recordings discussed in 1.2 can be
confirmed for these data: (1) the SNR levels are highly variable, potentially reflecting both
different levels of extraneous noise and varied distance between the microphone and the
mouth of the speaker, and (2) the distribution of the spectral information across the
frequency range of 0-5 kHz varies in the recordings, potentially reflecting differences in the
make and the placement of the microphones used and the acoustics of rooms where
recordings took place. Similar to the observations made in previous research (see 1.2), we
find that poor SNR can make formants appear very faint (cf. 00-O, m3) or have larger
bandwidths and therefore be less clearly defined (cf. 00-M, m1).
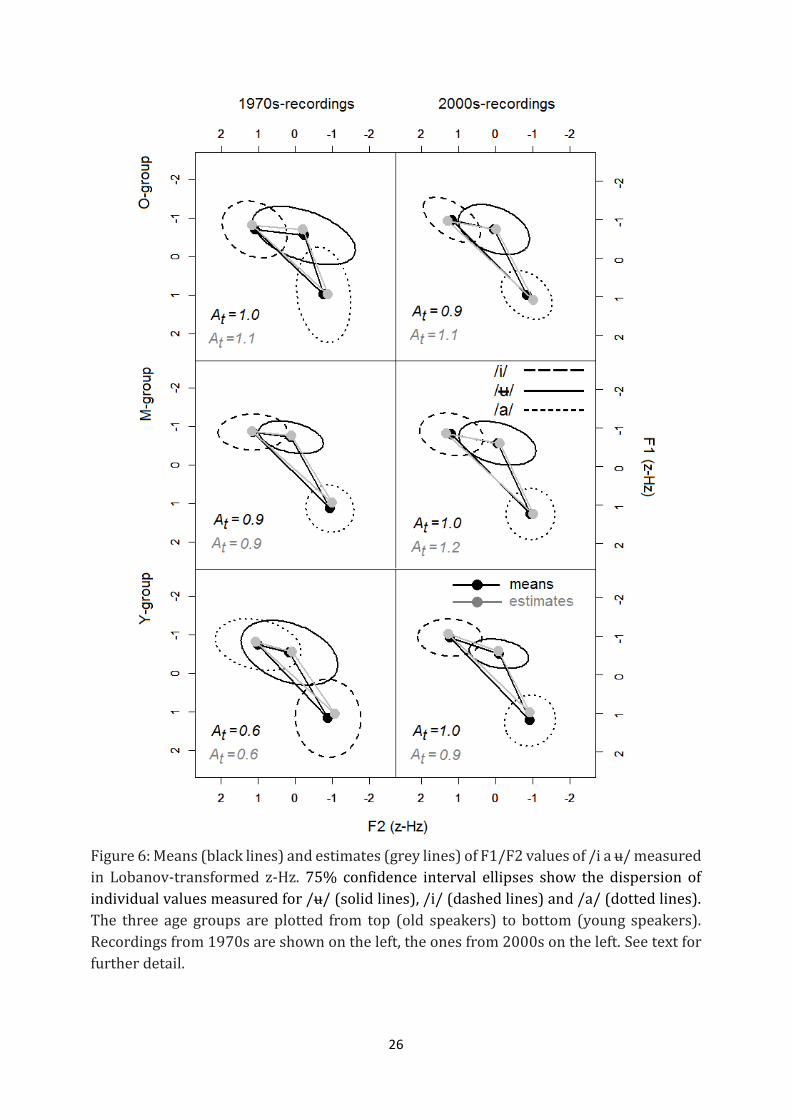
Weak acoustic information in the high frequency range (above 4 kHz in 70-O, m3 or even
above 2.5 Hz in 70-M, m4 and 70-Y, m2) accompanied by higher intensity of F1 seems to be
a particular feature of some 1970s-samples. The distribution of acoustic energy across the
vowel spectrum has a much steeper negative spectral slope as compared to a more
balanced spectrum as in e.g. the 00-Y sub-corpus, making F2 less well defined in the vowel
spectrum of the 70-Y speakers. This difference between recordings made in the 1970s and
the 2000s is illustrated in Figure 2. It seems unlikely that the proximity effect alone might
have caused this spectral imbalance (Svec and Granqvist 2010), given that the first spectral
peak is not substantially higher in the 70-Y, m2 than in the 00-Y, m3 example (Figure 2).
However, the second and the third peaks appear much lower in the earlier recording. We

11
considered the possibility of these slope differences being due to differences in the voice
quality (e.g. Hillenbrand, Cleveland and Erickson 1994), but our perceptual analyses of the
speakers’ voices did not confirm this potential explanation. We will return to this issue in
the discussion (see 5.4).
Figure 1: Waveforms and spectrograms of six samples to demonstrate differences in
spectral detail across the real-time corpus of Glaswegian, 1970s recordings (upper panel)
and 2000s-recordings (lower panel).
Figure 2: DFT-spectra of two [u]-tokens taken from the midpoint of the vowel in ‘good’ (left:
70-Y, m2; right: 00-Y, m3). Dashed lines indicate spectral slope calculated as best fit by least
squares regression. The spectra are based on an unsmoothed narrow-band spectrum
created with a frame shift of 5 ms and a 1024 point Blackman window and then converted
to a power spectrum in dB across the frequencies from 0 to 8 kHz (i.e. half the sampling
rate).

12
To illustrate the core technical issues of interest here, Figure 3 gives an overview of
spectral slope and SNR levels within the chosen set of recordings. Slope was calculated
from the spectral data extracted from vowel midpoints by linear regression models in R
and averaged across all vowel tokens. As indicated in Figure 2, the lower the resulting
value, the steeper the negative slope, the less balanced the spectrum. To gain an insight
into the levels of background noise which often do not remain constant throughout a
recording, ten pauses (with the mean duration of 450 ms) were taken from various time
points of each recording, mostly near the beginning, the middle and the end of each
conversation (cf. Svec and Granqvist 2010). Filled pauses like those containing breathing,
laughing, speech of the respective interlocutor and the like, were excluded. An average
Root Mean Square amplitude (RMS, in dB) was measured for each pause and each vowel
token (i.e. a RMS average was calculated across the whole duration of the respective
segment). The SNR was calculated as the power ratio between the speech signal (here,
vowel tokens) and the background noise (here, pauses):
(1)
noise
signal
noise
signal
A
A
P
PSNR 10log20
where P represents the average power and A the amplitude. This way of conceptualising
SNR defines identical levels of noise and signal (i.e. a difference of 0 dB) as equal to 1.
Accordingly, the higher the resulting SNR-value, the stronger the signal stands out against
the noise. The quality of each recording was then described through its mean SNR and a
mean slope value (see Figure 3).
Figure 3: Mean SNR and spectral slope values and their standard deviations measured in
recordings of six speaker groups (24 recordings in total, see text for more detail). The
decade of recording is indicated by the two shades of grey, age group is plotted along the
y-axis.
The bar graphs in Figure 3 display considerable differences in both technical aspects of the
corpus recordings. By and large, the SNR was the best in the 00-Y and the poorest in the 00-

13
M group. All recordings from the 1970s had a more negative spectral slope in comparison
to those from the 2000s. These recording-specific measurements were subjected to a series
of statistical tests. The assumption of equal variances could not be accepted for a large
subset of these data. Welch t-tests for two independent samples were thus performed. The
observed differences in the SNR and spectral balance were compared within same-age
group (real-time comparisons) and across same-decade recordings (apparent-time
comparisons). The alpha-level was adjusted to account for repeated comparisons, i.e. p was
set to 0.0056 (≈ 0.05/9) in order to be interpreted as significant.
With regard to SNR, real-time comparisons did not show significant effects at the set alpha-
level; though the middle-aged speaker recordings showed a trend toward significance (70-
M/00-M: t(4.0) = 3.7, p = 0.021), supporting the observation that recordings made with the
00-M group (in pubs) were noisier than those made with the 70-M group (in quiet
surroundings). Apparent-time comparisons showed that SNR was significantly better in
the young speakers from the 2000s in comparison to all other age groups (00-Y/00-M: t(5.0)
= 9.4, p < 0.001; 00-Y/00-O: t(4.1) = 8.1, p = 0.0012). Interestingly, there was no significant
difference between recordings of the 00-M and 00-O groups, although their relatively poor
SNR-levels result from two different sources: a strong background noise during the
recording in the former vs. a distant placement of the microphone in the latter.3 SNR did
not differ statistically across the recordings of different age groups made in the 1970s.
Neither microphone placement nor background noise levels seemed to have varied much
when the older recordings took place. All of them showed a relatively high SNR, i.e. speech
was relatively clear.
As far as the spectral balance is concerned, all recordings from the 1970s had a less
balanced spectrum than all recordings from 2000s (t(18.9) = 4.5, p < 0.001), which may be
primarily reflective of the type of equipment used. Further real-time comparisons showed
significant differences for young and middle-aged speakers (70-Y/00-Y: t(5.6) = 5.0, p =
0.003; 70-M/00-M: t(4.4) = 4.9, p = 0.006), but the difference in the older speakers’
recordings did not reach significance at the set alpha-level. These results support the above
observation that an imbalanced slope seemed to be primarily an important technical
specification of the recordings made by Ronald Macaulay in the 1970s (Macaulay 1977).
There was only one significant apparent-time comparison, for the groups whose data were
collected using different equipment (00-Y/00-O: t(3.3) = 7.2, p = 0.0039). Taken together,
the above findings corroborate the idea that spectral slope is related to specifications of
the recording equipment (different in the 1970s vs. 2000s recordings) while SNR reflects
the particulars of the recording environment (recordings made in pubs vs. quiet
surroundings).
By and large, these analyses showed that from a sociolinguistic viewpoint the most
relevant comparisons of the corpus (i.e. those in real-time and apparent-time as outlined
3 We also analysed the spectral properties of noise, looking for correlates of different types of noise (cf. De Decker 2016) but failed to demonstrate any significant differences in these data.

14
above) differed in terms of the recording quality. In the following, we will discuss potential
consequences of these technical differences for acoustic analyses of vowel quality using
formant analysis of the linear predictive coding (LPC).
3. ANALYSES
3.1. Obtaining formant measurements
Formants were measured at the midpoint of the vowel to reduce coarticulatory influences
due to abutting segments. Formant values were extracted using standard settings of the
LPC-algorithm Burg implemented in Praat (Anderson 1978; Boersma and Weenink 2013).
By default, acoustic signals are downsampled to 10 kHz, low-pass filtered at 5 kHz with an
LPC-order of 10 and a pre-emphasis of 50 Hz (i.e. starting at 50 Hz, higher frequencies are
amplified by 6 dB per octave). The standard analysis window length is 25 ms with 25%
window shift. Given the diverse quality recordings like those constituting the real-time
corpus of Glaswegian, the low sampling rate of 10 kHz seemed advantageous for several
reasons. First, it made the amount of spectral information processed by the LPC-algorithm
more comparable across the two decades, thereby minimising the effects of low levels of
high frequency energy in the 1970s recordings. Also, the downsampling highlights the
importance to the frequency maxima below 5 kHz – a frequency range which is known to
contain the most crucial information for the perception of vowel quality (Dang and Honda,
1997; Ladefoged 1962).
Our preliminary investigations showed that formants measured with these Praat default
settings produced the lowest number of error rates for F1/F2 as compared to those
produced by two alternative systems, EMU (Cassidy and Harrington 2001; Harrington
2010) and SFS (Huckvale 2000). The definition of error rates was roughly based on
formant values measured in previous investigations of Glaswegian read speech (Stuart-
Smith et al. 2013), and allowed for a generous amount of variation within 250 Hz for F1
and within 400 Hz for F2. Expected values of /i/ fell in the range of 200-450 Hz (F1) and
2000-2400 Hz (F2). F1-values outside the range of 400-650 Hz (for /u/) and 700-950 Hz
(for /a/) as well as F2-values outside the range of 1300-1700 Hz (for /u/) and 1200-1600
Hz (for /a/) were considered erroneous for the purpose of the algorithm comparison.
Whereas over 50% of F1/F2-values extracted from EMU and SFS were classified as
erroneous in this setting, the output from Praat contained a significantly smaller amount
of outliers.
3.2. Dealing with formant outliers
Praat produced a relatively high amount of reliable measures by default but its
performance could not be further improved by changing the default settings (e.g.
increasing the LPC-order or altering the sampling rate). As an alternative to the chosen
measurement at vowel mid-points, ‘dynamic’ means and medians were tested, i.e. a mean
or a median value of F1 and F2 was extracted from the formant track around the central
50% of the total vowel duration. While ‘dynamic’ means seemed to slightly increase the

15
influence of segmental context on formant values, ‘dynamic’ medians led to a higher spread
of the formant distributions, most considerably so for F2 (±400 Hz compared to the ‘static’
values) and slightly less so for F1 (±60 Hz compared to the ‘static’ values). Although taking
formants from vowel midpoints was found to be the best method of formant extraction, the
output of this ‘static’ measure still retained outlier values. Two ways of dealing with
outliers were piloted on a subset of the data: manual correction and automatic outlier
removal. For the manual correction of the outliers, the formant values were taken from the
DFT-spectrum (512 points) and compared to the formant tracks in Praat spectrograms.
Only plausible values derived from the DFT-spectrum were then included in the corrected
dataset. In addition to being an extremely time-consuming procedure, this method risked
introducing random variability into the sample since corrections of the same vowels by
two independent experts (the first and the second author) showed disagreements within
a range of ±60 Hz for F1 and ±450 Hz for F2. Accordingly, a more reliable procedure of data
trimming by removing defined outliers was adopted instead.
The values in Hz were first Bark-transformed to map them into an auditory scale
(Traunmüller 1990), then plotted and closely examined. Subsequently, F1-values above 5.5
Bark were treated as outliers for the two high vowels and those below 5.5 Bark as outliers
for the open vowel. F2-values lower than 11.5 Bark for /i/ and lower than 10 Bark for /u/
were excluded. Most outliers occurred in F2 of /a/, defined by the range of 9-12 Bark. Note
that this approach to outlier removal is superior to a statistical trimming of F1/F2
distributions because error variances are not normally distributed so that outliers do not
always fall into the upper or lower quartiles of the respective formant distribution. The
overall sample size was reduced by about 15% as a consequence of the outlier removal
(remaining n = 3296).
3.3. Normalising raw formant data
The Bark-scale does not serve as a means of minimising individual influences on formant
measurements, and was expected to be similar to raw data in Hz (Adank, Smith and van
Hout 2004). Additionally, we calculated speaker-based transformations of raw Hz values
following the procedures of Lobanov (z-Hz), Nearey (N-Hz) and Watt & Fabricius (WF-Hz).
The well-established Lobanov’s and Nearey’s procedures are known to lessen the influence
of speaker-specific attributes on formant values (e.g. Adank, Smith and van Hout 2004;
Fabricius, Watt and Johnson 2009; Watt and Fabricius 2002). Lobanov’s approach employs
z-score transformation as a means of formant normalisation (Lobanov 1971). Resulting
values are the distance between each given measurement and the formant mean in
numbers of standard deviations:
(2)n
nniLobanov
ns
FFF
where Fni is an individual formant value, Fn speaker’s mean frequency and sn their standard
deviation across all formant measurements.

16
In the most popular version of the Nearey’s method, log-transforms of formant values are
taken and the mean frequency is subtracted to derive for each measurement its distance
from the mean in log-frequency units (Nearey 1978):
(3) nni
Nearey
n FFF loglog
The method works at its best if (3) is applied to each formant individually (Adank, Smith
and van Hout 2004). Nearey and Lobanov normalisations usually involve more than one
vowel and are therefore frequently classified as ‘vowel-extrinsic’. In contrast to a wide-
spread belief, there is no imperative to sample all vowels of the system in order to achieve
a vowel normalisation, but a meaningful subset is necessary. Nearey (1978: 88) suggests
“at least two points of known phonetic quality from which a speaker’s formant ranges may be
estimated”. The mean-based linear transformation by Nearey could work well if at least the
corner vowels of the system are sampled; such procedure is likely to produce similar
normalised values in comparison to a whole-system sampling approach.4 In contrast, the
normalised output of the Lobanov’s transform very much depends on the number and the
spread of the vowel categories, as its scaling unit is the standard deviation. Crucially, the
same vowel categories ought to be sampled across speakers to achieve comparability in
scaling which is core to a successful normalisation.
A more recently developed normalisation procedure proposed by Watt and Fabricius
(2002) and subsequently refined by Fabricius, Watt and Johnson (2009), is becoming
increasingly popular. The method is based on the same three principles as above, i.e. it is
applied formant- and speaker-intrinsically but vowel-extrinsically. The procedure first
seeks to establish geometric centres of gravity (S1 and S2) in the speaker’s F1/F2 plane as
described by three corner vowels: a close-front /i/, an open-central /a/ and a
(hypothetical) close-back /u/. Each formant value is then divided by the individual
normalisation constant S1 or S2, as appropriate:
(4)3
)''()'()( unanin
n
FFFS
;
n
niFabriciusWatt
nS
FF &
Here, u’’ denotes that the F1 and F2 values for /u/ are not observed but constructed. More
specifically, they are set equal to the mean F1-frequency of the close front vowel /i/.
Similarly, only the actual F1-mean of a speaker’s realisations of the open vowel /a/ is used
to calculate the S1-constant (hence, a’). For S2, F2 of /a/ is interpreted as equidistant
between F2 of i and F2 of u’’ (i.e. it equals the F1/F2-mean of /i/). In sum, the method only
requires an input of the speaker’s mean frequencies for F1 and F2 of /i/ and F1 of /a/ in
order to provide a normalised value for any vowel.
Formant values resulting from (4) indicate how far each speaker’s vowel is from their
centre of gravity. In contrast to Lobanov’s and Nearey’s procedures, the primary
motivation behind the Watt-Fabricius approach was to create a means for visual
inspections of vowel spaces in speakers of different sexes, common in sociolinguistic
4 Cf. mean(1, 5) = mean(1,2,3,4,5)

17
research. According to previous research, the method helps to reduce a considerable
amount of data dispersion due to anatomical differences between speakers and has been
shown, along with the Lobanov approach, to outperform Nearey on at least this criterion
(Fabricius, Watt and Johnson 2009; Watt and Fabricius 2002).
3.4. Evaluating the performance of normalisation methods
To gain an appreciation of each method’s performance in the context of technically diverse
data, two measurements were obtained for each speaker’s recording: (1) a measure of the
overall vowel space size and (2) a measure of the dispersion within each vowel category.5
Using (1), we captured the potential consequences of artificially higher F1 and/or lower F2
reported in the literature (Byrne and Foulkes 2004; De Decker and Nycz 2011; Künzel
2001; Rozborski 2007; van Son 2005). Using (2), we could estimate how well a method
dealt with technically introduced dispersion of formant values (cf. Fabricius, Watt and
Johnson 2009).
The size of the F1/F2-vowel space, constituted by the corner vowels /i u a/, was calculated
as the area of a triangle, At, using Heron’s formula (Heath 1921, 321ff.):
(5) ))()()((4
1cbacbacbacbaAt
where a, b and c are Euclidean distances between [i]/[a], [i]/[u] and [a]/[u], respectively,
in the two-dimensional formant space. Mean values of each speaker’s F1 and F2
frequencies per vowel category were used to calculate their individual At.
Given that vowel quality distributions are usually conceptualised as 95% confidence
interval ellipses around F1/F2 means, we measured the dispersion as the area enclosed by
an ellipse, Ae, using:
(6) abAe
where a and b are 1/2 the ellipse's major and minor axes, respectively (cf. Disner 1980).
The R-package siar was used to calculate Ae. Figure 4 shows a schematic representation of
the two measurements, At and Ae.
5Previous studies sometimes utilized the squared coefficient of variation (calculated (SD/mean)2) as a measure of vowel dispersion (e.g. Fabricius, Watt and Johnson 2009:243). The coefficient is meant to evaluate the success of several vowel normalization methods in reducing the speaker-induced variability, and to make this evaluation independent of the scaling unit of each normalization method. A potential issue with this approach lies in the fact that the formula is inapplicable if the denominator (i.e. the mean) equals 0 which is theoretically possible in the case of Lobanov and Nearey transforms.

18
Figure 4: A schematic representation of the triangular F1/F2 vowel space as created by
the corner vowels /i a u/, At (in dark grey) and the dispersion ellipses of 95% confidence
intervals, Ae (in light grey).
The Ae metric could not be applied to /a/ of the speaker 70-Y, m01 as only 2 (out of 33
labelled) cases remained in his dataset after outlier removal. This problem resulted from
erroneous tracking of F1 in many /a/-tokens of this speaker, which mostly had values as
low as in speaker’s /i u/ tokens. Consequently, the discussion of Ae(a) below will be based
on the results of 23 speakers.
Subsequently, correlations between SNR and spectral slope values on the one hand and At,
Ae measurements of a recording on the other hand were run to uncover potential
relationships between the technical quality measurements and the properties of the
corresponding vowel spaces (in Bark, z-Hz, N-Hz, WF-Hz). A significant correlation would
indicate that there is a linear relationship between a measurement of technical quality and
a measurement of the vowel space.
3.5. Using an alternative normalisation by vowel distance ratios
There are further alternatives to the three normalisation procedures discussed above.
Speaker normalisation is implicit in a relative measure which conceptualises ratios instead
of scaled units of measurement. For investigations of sound changes affecting the fronting
of /u/ in the vowel space, du, the logarithmic Euclidean distance ratio defines the relative
positioning of the target vowel between two meaningfully chosen reference vowels as e.g.
the front /i/ and the back /ɑ/ in Southern British English (Harrington, Kleber and Reubold
2008):
(7) )log()log( // iuauu EEd
where Eu/a and Eu/i are Euclidian distances between the respective vowels. Accordingly,
mean acoustic values of each speaker’s corner vowels /i ɑ/ are treated as centroids of a
multi-dimensional vowel space. The relative distance of /u/ between the two centroids is
measured: when du is zero, the token is equidistant between the two centroids; positive du-

19
values indicate its proximity to /i/ (i.e. fronting of /u/) while negative du shows that /u/ is
closer to /ɑ/ than to /i/ (i.e. backing of /u/). Since these ratios are calculated separately
for each speaker (i.e. relative to speaker-specific centroids), then a certain degree of
speaker normalisation is implicit in the calculation.
Crucially, the choice of the reference vowels needs to be considered in the context of each
given variety and research question of the investigation. Southern British English back,
open vowel /ɑ/ is missing in the phonology of Standard Scottish English. Another back
vowel, /o/, is known to be unstable and potentially undergoing fronting itself (Watt and
Tillotson 2001). Since the potential sound change in question involves a lowering of
Scottish /u/ (which is already considerably front, see 1.3), the definition of two anchor
points in the vowel space - the lowest, central /a/ and the highest, front /i/ - was
considered the most suitable approach for the purposes of the present investigation.
However, the core premise of the method that the reference vowels are reliable anchors
may be still, at least partly, violated in our real-time corpus due to the technical issues. For
example, it is possible that the frequency of front vowels with a high second formant, like
our reference vowel /i/ here, is more strongly affected by the attenuation of spectral
energy in the upper frequency range attested in a large part of the 1970s-recordings (Sect.
2.3): if this is the case, we might find that F2 of /i/ is lowered in those recordings while F2
of /u/ or /a/ remains fairly unaffected. This constellation would lead to an inherent,
technically introduced bias towards a positive du-output (i.e. a larger proximity of /u/ to
/i/). If, in contrast, the issues arising from a recording-specific slope or SNR have a very
similar effect on formants of both high and low vowels, the du-metric may offer the best
approach to tackling both technical and speaker-related issues as the ratios are calculated
for each recording and speaker separately. An additional argument in favour of choosing
/a/ and /i/ as anchors lies in the fact that the space between the centroids of the lowest
and the highest vowel of the Scottish vowel system may be used to investigate a potential
lowering of /u/ (see 1.3).
Again, correlations between SNR, spectral slope and averaged du(F2), du(F1) measurements
of recordings will help to shed light on whether or not these measurements co-vary; du-
values can further be subjected to statistical analyses and serve as a dependent variable
(see 3.6).
3.6. Dealing with individual variation and technical issues by statistical means
Finally, another way of dealing with various influences on formant values is to use the
estimation procedure of linear mixed-effects modelling. A potential advantage of this
normalisation method lies in that the speaker (reflecting individual influences) and the
quality of a recording (reflecting technical issues) can be defined as random or fixed
factors, allowing for their individual impacts on the dataset to be estimated. Estimates are
preferable to raw means as they represent weighted means obtained in a situation when
all other sources of influence defined in the model are held constant. Estimation seems to
20
be particularly appealing in contexts of unbalanced datasets which are common in analyses
of spontaneous speech, mainly because multiple sources of influence can be accounted for
in a model (cf. Hay 2011:212f). Plotting estimates instead of raw means might therefore
allow substantially increased comparability of formant plots.
Linear mixed-effects models were fitted to F1 and F2 data separately using the lme4-
library in R. Overall, there were eight dependent variables (and models) since for both
formants, one model was fitted to each of the four Hz-derivatives (Bark, z-Hz, N-Hz and
WF-Hz). The best model fit was established through model comparisons using drop1()
function implemented in the R-library lmerTest. Each model contained a simplified
structure of fixed and random effects in order to maintain some comparability with the
three vowel transforms discussed above (e.g. potential effects of consonantal environment
or lexical items were not considered). The quality of each recording was specified in terms
of its SNR and spectral slope which were both converted to binary factors using median
split.6 In both cases, just over 50% of all measurements - 51% (SNR, median: 6.79) and
54% (slope, median: -0.0085) – were assigned to the “higher quality” category.
Speaker group, vowel category, SNR and spectral slope were fitted as the fixed factors, and
individual speaker and the recording source as random effects. We tested for all possible,
meaningful two-way interactions of the predictors.
4. RESULTS
4.1. Recording-based analyses
4.1.1. Correlations between technical quality and vowel space measurements
First, correlations were run to explore the potential interdependence between SNR or
spectral slope features of a recording on the one hand and its vowel space size At or vowel
dispersion Ae on the other. We did not find significant correlations between SNR and At (on
any of the Hz-transforms) suggesting that these phenomena are unrelated. However, there
was a significant positive correlation between the spectral balance and the vowel space
size showing that the more negative the spectral slope of a recording, the smaller its vowel
space in Bark (R = 0.45, t(22) =2.4, p=0.027), N-Hz (R = 0.44, t(22) =2.3, p=0.027) or WF-Hz (R
= 0.46, t(22) =2.4, p=0.024). This correlation was removed only if the vowel space was
created via the z-Hz scale (R2= 0.1, n.s.).
6 The decision to create binary factors was made since only two technical specifications (one for SNR and one for slope) were available for each recording (N=24) that measured many tokens (N = 3296). Hence the technical specifications could not be fitted as true covariates (which would require one technical specification per token with N = 3296), and little advantage was seen in including two 24-level predictors into each model (given the lack of a hypothesis related to the 24 levels, and also how difficult it is to interpret the meaning of statistical significance in a multilevel factor, see Baayen 2008:114).

21
With respect to the amount of dispersion Ae and the recording quality, absent correlations
between the Ae metric (for any of the vowels and scales) and spectral balance was
suggestive of the two factors being rather unrelated. No significant correlations were
obtained for SNR and Ae, either.
4.1.2. Correlations between technical quality measurements and distance metric du
Next, we ran correlations between SNR or spectral slope values and the speaker-specific
averages of the distance metrics du(F2) and du(F1), indicative of the degree of /u/-fronting
and -lowering, respectively. A marginal effect was found for SNR and du(F1), showing a
negative correlation: the lower SNR-levels (i.e. the noisier the recording), the higher the du
values, i.e. the closer /u/ tends to move to /i/ in the created vowel space (R = -0.37, t(22) = -
1.9, p=0.076). There were no further effects.
4.2. Token-based analyses
4.2.1. Linear mixed-effects statistic for F1
Linear mixed-effects models (see 3.6) were fitted to the measurements of F1 (in Bark, z-
Hz, n-Hz, WF-Hz). The outputs of the best fit model for each of the Hz-transforms are shown
in Table 1. Two core interactions were significant regardless of the scale, one potentially
indicative of a technical issue impacting on F1 (vowel*slope) and one related to the core
sociolinguistic interest behind formant analyses – a potential sound change (vowel*group).
Table 1. Output of linear mixed-effects models for F1-values through four different Hz-
derivatives (Bark, z-Hz, n-Hz, WF-Hz).
Hz-derivate Factor/interaction χ2 df p
Bark Vowel*SNR 13.9 2 <0.0001
Vowel*slope 144.9 2 <0.0001
Vowel*group 532.1 10 <0.0001
WF-Hz Vowel*slope 107.75 2 <0.0001
Vowel*group 699.45 10 <0.0001
z-Hz Vowel*slope 37.9 2 <0.0001
Vowel*group 74.5 10 <0.0001
n-Hz Vowel*slope 93.6 2 <0.0001
Vowel*group 626.7 10 <0.0001
With respect to the technical influences, vowel quality interacted with spectral slope. Post-
hoc t-tests of the best-fit models compared the impact of the slope imbalance on the F1-
values measured in /a/, /i/ and /u/ separately and showed noteworthy discrepancies
between the four scales. On the Bark scale, an effect of the slope imbalance was observed
exclusively in the open vowel /a/ whose F1 was raised by 0.57 Bark when the slope was
more negative (t(10) = 3.4, p<0.01); a significant effect was absent in the two high vowels /i
u/. The spectral balance effect on F1 of /a/ was merely trending toward significance after
the frequency transformation using the Nearey formula (t(17) = 1.8, p = 0.088) while F1 of

22
/i/ and /u/ remained unaffected by the slope changes. Interestingly, this effect on /a/
disappeared completely after the Lobanov-transform (still no effects were observed for /i/
or /u/). In contrast, the Watt-Fabricius transform uncovered a strong effect of /a/ having
a higher F1 when the spectral slope was less balanced (0.06 higher, t(19) = 4.2, p<0.001).
Additionally, the slope also had an impact on F1 measured for /i/ (0.07 units lower, t(19) =
3.0, p<0.01) and /u/ (0.06 units lower, t(19) = 2.6, p<0.05). This result for high vowels may
point to the central role of /a/ as a reference vowel in this transformation (see (4)). We
will return to the discussion of these findings in Sect. 5.3 below.
In addition to the effect of the spectral slope, models fitted to Bark-scaled F1-values also
showed a significant interaction of the vowel quality and SNR. Low SNR-levels (meaning
less clear recordings) raised F1 of all vowels, though the effect was the strongest for /a/
(0.57 Bark, t(18) = 4.0, p<0.001), slightly less distinct for /i/ (0.44 Bark, t(18) = 42.9, p<0.01)
and even weaker for /u/ (0.35 Bark, t(18) = 2.5, p<0.05). The interaction was not significant
for any other Hz-transforms.
Second, vowel quality also interacted with speaker group for all Hz-transforms (see Table
1). If the age-related differences were completely accounted for by the normalisation
procedures (see 3.3), this finding may be suggestive of a sound change (we will address
this question in 4.2.4-5).
4.2.2. Linear mixed-effects statistic for F2
Subsequently, another series of linear mixed-effects models was run for the F2-values (in
Bark, z-Hz, n-Hz, WF-Hz). The outputs of the models with the best fit are outlined in Table
2. All models showed an effect potentially related to sound change (vowel*group) which
will be addressed in 4.2.4-5. Models for Bark, Watt-Fabricius and Nearey scales further
showed two interactions indicative of an influence of the technical issues in the recordings
(i.e. vowel*SNR and vowel*slope). In contrast, Lobanov-transformed F2-values (z-Hz) did
not display the effect of the spectral balance, and only produced a comparably weak effect
of the different SNR-levels. Subsequent t-tests, however, failed to produce a significant
effect among the relevant contrasts between more vs. less noisy recordings for /i u/ or /a/.
Similarly, these contrasts were not significant in the t-tests run for n-Hz scale, meaning that
both Nearey and Lobanov transforms eliminate the impact of recording quality on F2-
measurements.7
On the Bark scale, t-tests produced evidence that F2 of /i/ was 0.4 Bark lower in noisy
recordings (t(20) = 2.5, p<0.05) and 0.5 Bark lower in recordings with a less balanced
spectral slope (t(18) = 2.8, p<0.05), but no evidence for such effects in /a/ or /u/. WF-
transform showed the most significant effects. Here, /a/ and /u/ (but not /i/) were both
affected by the two technical issues. More specifically, F2 of /a/ measured 0.09 WF-Hz
7 The significant interactions vowel*SNR or vowel*slope listed in Table 2 are related to other (in our case meaningless, yet routinely calculated by the linear mixed effects procedure) contrasts between the factor levels, e.g. F2 of a noisy /a/ vs. F2 of a quiet /i/.

23
higher values in poorer SNR (t(20) = 3.1, p<0.01) as well as in less balanced spectral slopes
(t(10) = 2.8, p<0.05). For /u/, F2 was 0.08 WF-Hz higher in noisy recordings (t(12) = 2.4,
p<0.05) and 0.06 WF-Hz higher in recordings with an unbalanced slope (t(21) = 1.9, p =
0.066). These findings are very likely to be related to the way the normalisation constant
S2 is calculated in (4), and will be discussed in Sect. 5.3 below.
Table 2. Output of linear mixed-effects models for F2-values measured on Bark, z-Hz, n-Hz,
WF-Hz scales.
Hz-derivate Factor/interaction χ2 df p
Bark Vowel*SNR 52.1 2 <0.0001
Vowel*slope 57.7 2 <0.0001
Vowel*group 157.2 10 <0.0001
WF-Hz Vowel*SNR 45.3 2 <0.0001
Vowel*slope 48.9 2 <0.0001
Vowel*group 131.8 10 <0.0001
z-Hz Vowel*SNR 8.4 2 <0.05
Vowel*group 72.9 10 <0.0001
n-Hz Vowel*SNR 52.5 2 <0.0001
Vowel*slope 59.7 2 <0.0001
Vowel*group 163.9 10 <0.0001
4.2.3. Linear mixed-effects statistic for du-metrics
As the next step, a mixed-effects model was fitted to the du(F1) and du(F2) metrics discussed
in 3.5, which measures the location of /u/ in the F1 or F2-space between the corner vowels
/i/ and /a/, potentially indicative of lowering and/or fronting of /u/. The new models
retained the same structure of random effects as the token-based models discussed above
(Sect. 4.2.1 and 4.2.2). The predictors were group, SNR and slope; only one interaction
(SNR*slope) was tested for. du(F1) and du(F2) served as the dependent variables in two
separate calculations.
The best-fit models for both du(F1) and du(F2) did not contain any effect for either factor
related to the technical issues under investigation. The factor group showed significance
for du(F1) (χ2(5) = 11.4 and p = 0.044), but only a trend for du(F2) (χ2(5) = 10.3 and p = 0.068).
4.2.4. Visual representations on F1/F2-plane and inference of change
Since exploratory formant plots are a common sociophonetic tool to discuss and ascertain
sound variation and to derive change (e.g. Labov, 1994; Labov, Ash and Boberg, 2006),8
this section is dedicated to exploring how the significant technical effects shown above
might interfere with the interpretation of the visual data, and focuses on two scales: Bark
and z-Hz, given that Bark-scaled values contain the information related to both the speaker
physiology and the technical set-up of the recording, while Lobanov-transformed z-Hz
8 Also the NORM suite facilitates this well: http://lingtools.uoregon.edu/norm/

24
values seem to retain the least influence from either factor (cf. also Adank, Smits and van
Hout, 2004).
Formant plots in Figure 5 and 6 display F1/F2 values with the 75%-dispersion and the
centroids of /i u a/. Additionally, the graphs compare the sizes (and shapes) of the vowel
spaces derived through the interpolation between the centroids of /i u a/. The centroids
were based either on raw-data averages (black lines) or on estimates of the best-fit linear
mixed-effects models (grey lines, see 3.6). The sizes of the resulting vowel spaces were
measured as an area of a triangle, At (see 3.4), and given for comparison.
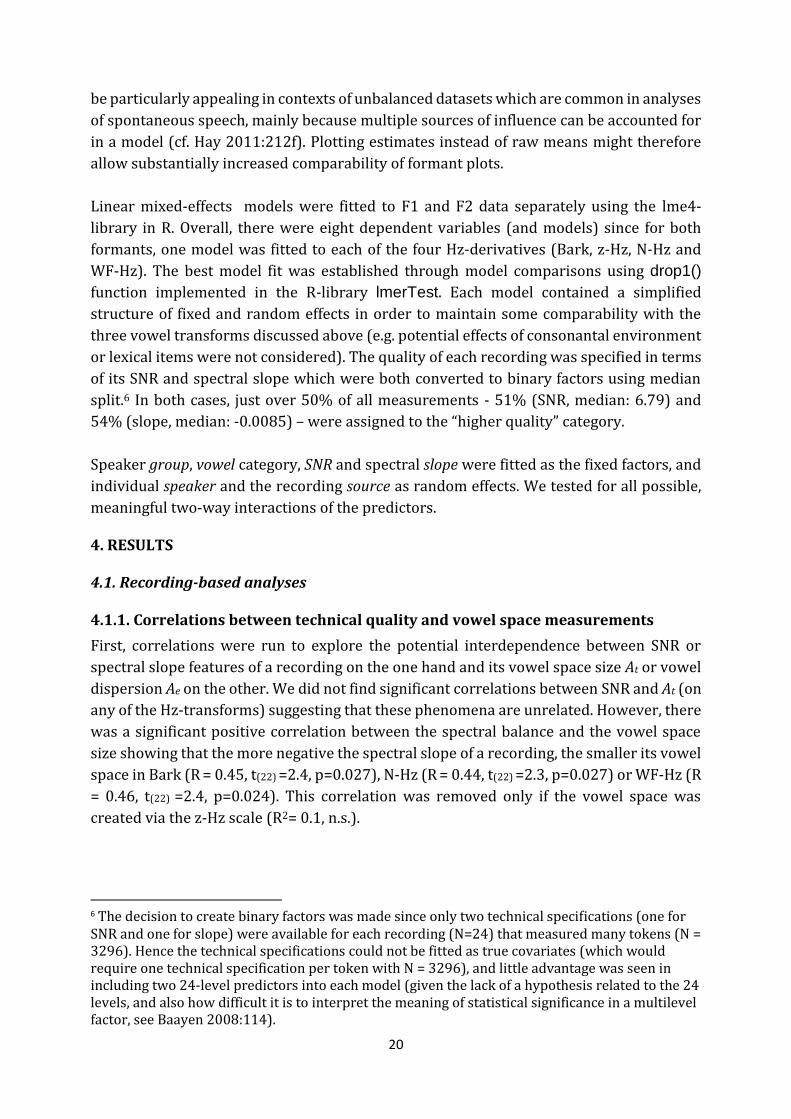
Patterns in Figures 5 and 6 suggest two core observations. First, the triangular vowel
spaces appear more unevenly sized across the six speaker groups when plotted on the Bark
scale than on the z-Hz scale. At value of the 70-Y group was partly less than half the value
of any other speaker group. In contrast, z-Hz scale created a more balanced representation
of the six vowel spaces in this sample. Even though the triangle between /i/, /u/ and /a/
remained the smallest in the 70-Y group under this transform, the magnitude of the
differences between the groups diminished (reflected in more comparable At
measurements across the sample). Second, the issue of the Bark-scaled vowel spaces being
of highly varied sizes across the sample could not be resolved using statistical means of
estimation implemented in linear mixed-effects modelling. Moreover, this method created
a number of F1-values substantially diverging from raw-data means, most notably for the
open vowel /a/ (i.e. the vowel whose F1 was particularly strongly affected by both
technical issues under investigation, see 4.2.1). Such substantial discrepancies between the
means and the estimates of formant values were absent after the Lobanov transform,
reinforcing the idea that technical issues can be effectively dealt with by applying a vowel
normalisation.
The relative size of the formant ellipses in Figures 5 and 6 seems to suggest an increase in
F1/F2-dispersion after the Lobanov transformation. However, this visual observation is
deceiving and results from differences in the units of scaling. In fact, the ellipse sizes
measured as Ae (see (6) in 3.4) were slightly but significantly larger on the Bark scale than
on the z-Hz scale, for /i/ (t(45.9) = 2.9, p=0.0065), /u/ (t(45.3) = 3.2, p=0.0024) as well as /a/
(t(43.6) = 2.5, p=0.018) while At values (see (5) in 3.4) did not differ significantly between
the two scales.
With respect to the inference of change, statistical results (see 4.2.1-2) were a little
inconclusive. Surprisingly, none of the planned group comparisons showed significance for
F1/F2 measured on the z-Hz scale. On the Bark scale, some apparent-time comparisons
were significant for F1 and F2; significant real-time comparisons were observed for F2
only.
As far as F1 was concerned, only 70-Y group entered significant apparent-time
comparisons. Compared to the middle-aged speakers, the young speakers recorded in
1970s had a 0.5-0.8 Bark higher F1 in high vowels (70-Y/70-M-comparisons for /i/: t(18) =

25
2.7, p<0.05; 70-Y/70-M-comparison for /u/: t(18) = 3.4, p<0.01) and a 0.4 Bark lower F1 in
low vowels (70-Y/70-M-comparison: t(18) = 2.6, p<0.05).
Figure 5: Means (black lines) and estimates (grey lines) of F1/F2 values of /i a u/ measured
in Bark. 75% confidence interval ellipses show the dispersion of individual values
measured for /u/ (solid lines), /i/ (dashed lines) and /a/ (dotted lines). The three age
groups are plotted from top (old speakers) to bottom (young speakers). Recordings from
1970s are shown on the left, the ones from 2000s on the left. See text for further detail.
26
Figure 6: Means (black lines) and estimates (grey lines) of F1/F2 values of /i a u/ measured
in Lobanov-transformed z-Hz. 75% confidence interval ellipses show the dispersion of
individual values measured for /u/ (solid lines), /i/ (dashed lines) and /a/ (dotted lines).
The three age groups are plotted from top (old speakers) to bottom (young speakers).
Recordings from 1970s are shown on the left, the ones from 2000s on the left. See text for
further detail.

27
Regarding F2 measurements, only high vowels of the 70-O group showed significant
comparisons in real-time (70-O/00-O-comparison for /i/: t(18) = 2.9, p = 0.01; 70-O/70-M-
comparison for /u/: t(19) = 2.9, p = 0.01) and in apparent-time (70-O/70-M-comparison for
/i/: t(19) = 3.2, p = 0.0047; 70-O/70-M-comparison for /u/: t(19) = 3.6, p = 0.0019), with 70-
O group measuring 0.6-0.7 Bark lower F2 of both high vowels.
While the results for F1 are rather suggestive of technically influenced patterns, the results
for F2 could be cautiously interpreted as indicative of change, signifying a /u/-fronting that
took place in Glasgow between 1890s and 1920s (70-O vs. 70-M/00-O speakers). However,
not only /u/ but also /i/ shows a similar rise of F2-frequency in more recent speaker
groups. Fronting of both /u/ and /i/ cannot be expected under the sound change view, and
prompts a question about technical issues or other recording-related factors influencing
the results.
4.2.5. Inference of change based on du-measure
As seen above (4.1.2; 4.2.3), the du-measure was largely unaffected by the technical issues
under investigation.9 In contrast, the factor group was relevant for explaining the variation
in these F1/F2 data. Figure 7 displays the group results. Despite a visible, continuous
(apparent- and real-time) tendency for F1 of /u/ to shift away from /i/ (i.e. to lower),
planned comparisons yielded no significant effects for du(F1) across the sample. In contrast,
du(F2) showed two real-time effects involving the young (00-Y/70-Y: t(17.3) = 2.6, p = 0.017)
and the old (00-O/70-O: t(15.1) = 2.1, p = 0.05) speakers (the comparison for middle-age
speakers was merely trending towards significance with t(21.7) = 1.9, p = 0.072).
In terms of an inferred change, the effects involving F2 point to two different directions: on
the one hand, an early /u/-fronting dating as far back as 1890s and 1920s (70-O vs. 00-O
groups, cf. also 4.2.4); on the other hand, a more recent /u/-backing – i.e. a reversal of the
previous change – which may have taken place between 1965 and 1985.
The patterns for F1 point subtly, yet somewhat consistently, in the direction of a potential
/u/-lowering over time, and cannot be explained by stylistic factors which in fact predict a
completely opposite pattern of more retracted vowels in sociolinguistic and oral history
interviews (all 70s and 00-O groups) than in the spontaneous conversations (00-Y and 00-
M groups, see 2.1). The fact that neither apparent-, nor real-time comparisons produced a
significant effect may be due to a relatively small sample of this study and a relatively small
magnitude of the change (see Stuart-Smith et al 2016). Consequently, an additional model
was fit to the du(F1) data, replacing the predictor group by two factors, year of recording (00
vs. 70) and age group of the speakers (O, M, Y). The best-fit model included both factors
(age: χ2(2) = 7.4, p = 0.025 and year: χ2(1) = 4.8 and p = 0.029). In contrast to the speakers
recorded in the 2000s, speakers from the 1970s had their du(F1) values 0.4 units closer to
/i/ than to /a/, suggesting some vowel lowering in real-time. F1 of young speakers’ /u/
was 0.5 units closer to /a/ in comparison to the middle-aged (t(21.5) = 2.2, p = 0.035) and to
9 The du for this investigation was calculated with Bark-scaled values (see 3.5). Noteworthy is a very strong correlation between du resulting from the different scales (R2=0.99, p<0.0001).

28
old speakers (t(19.2) = 2.4, p = 0.028), while the latter two age groups did not differ
significantly from each other. These age group results are difficult to reconcile with the
idea of age grading which would rather predict middle-aged speakers to deviate
significantly from the remaining speaker groups (Wagner 2012). We will return to this
discussion in 5.5 below.
Figure 7: Group means and standard deviations of the distance metric du for F1 (top
panel) and F2 (bottom panel).
5. DISCUSSION
5.1. Does technical quality influence acoustic measurements of vowel quality?
The primary goal of the study was to ascertain whether or not differences in recording
quality – in our case, varied levels of noise, measured as SNR, and variable amounts of
spectral energy available at lower and higher frequencies, measured as spectral tilt – would
affect F1/F2 formant measurements in a sociolinguistic real-time corpus comprising of
spontaneous speech. In this section, we will concentrate on the results obtained for the
“raw” F1/F2 measurements on the Bark scale which we took as the reference point of the
comparison with the normalised scales and the vowel ratio metric du (to be discussed
below in 5.3).
To address the primary question of this study, we first confirmed that there were indeed
some statistically significant technical differences among the recordings of the analysed
corpus. The two technical specifications, SNR and spectral slope, showed significant
differences between recording series relevant for the sociolinguistic comparisons in both
real-time (here, 1970s vs. 2000s) and apparent-time (here, old vs. middle-aged vs. young

29
speaker recordings; see 2.3). Subsequently, we conducted recording-based, correlational
analyses which unveiled the tendency for those recordings with a more negative average
spectral slope (i.e. recordings which had a reduced amount of energy above 4 kHz) to
produce a smaller vowel space (see 4.1.1): the more negative the slope, the smaller the
resulting vowel space. Interestingly, the SNR-levels did not co-vary with either the vowel
space size or the vowel dispersion – the two parameters that were measured as indicators
of technically introduced artefacts on the resulting F1/F2 vowel spaces (see 3.4).
Subsequently, we looked beyond a pure co-variation of the technical specifications and
vowel space measurements, and tested for causal influences of the technical quality of a
recording on F1/F2. “Better” recording quality was defined by higher SNR-levels and a less
tilted average spectral slope.
A significant effect of increased noise (i.e. in recordings with SNR below 6.8) in interaction
with the vowel quality was observed on both F1 and F2. Noisy recordings raised F1 of all
vowels, with the effect being strongest for the open vowel (amounting to an increase of
approximately 0.6 Bark) and slightly weaker for the two high vowels (amounting to an
increase of approximately 0.4 Bark). In contrast, only F2 of /i/ (but not F2 of /a/ or /u/)
was affected, and lowered by 0.4 Bark in noisier recordings. Interestingly, related forensic
investigations into the impact of phone transmissions brought to light quite comparable
patterns of F1-raising in all vowels across the board and a differential F2-lowering in
dependence upon vowel quality (Byrne and Foulkes 2004; Künzel 2001), although in
contrast to our results, the magnitude of the raising effect was usually found larger in low-
F1 vowels like /i/ and /u/ than in the in high-F1 vowel/a/ (whose frequency mostly lies
within the transmitted range).
Spectral imbalance (with negative slopes tilted beyond -0.009) again influenced both F1
and F2 values, and interacted with the vowel quality. But for F1, we found an effect
exclusively on the open vowel /a/ which measured 0.6 Bark higher values in recordings
with less balanced spectra. For F2, only /i/ showed an influence, and 0.5 Bark lower
formant values in recordings of poorer quality. By and large, these results are essentially
in line with some of the effects reported in the previous literature (see 1.2), particularly
with respect to complex interactions of technically determined factors with vowel quality
(Hansen and Pharao 2006; in progress; see 5.2).
The magnitudes of the technically introduced effects are somewhat difficult to compare
across the studies, given the variability in the preferred method of reporting the results –
as percentage of the original frequency (Byrne and Foulkes 2004; Künzel 2001), semitones
(Hansen and Pharao 2006; in progress) or raw Hz values (De Decker and Nycz 2011) – but
we note that in our study, we find rather comparable magnitudes for both changes in F1
and F2, unlike previous research that showed larger deviations for F1 than for F2 which
seems less affected, if at all (Byrne and Foulkes 2004; De Decker and Nycz 2011; Hansen
and Pharao 2006; in progress; Künzel 2001). Such discrepancies may have various

30
explanations, and include the calculations (mean values based on raw data in previous
studies vs. estimates from mixed-effects models in our case when random effects due to
the speaker and token are accounted for, see 3.6) as well as type of the speech data
(recordings of read speech in previous studies vs. spontaneous speech in our case).
Moreover, our study attempted to disentangle the effects of the two influencing properties
of the spectrum, SNR and spectral balance, while previous research seems likely to be
dealing with both spectral features simultaneously (see 1.2). When these technical effects
accumulate, their magnitude increases (see 5.2 below).
We note that the interaction of SNR and spectral slope was found significant neither for F1
nor for F2; SNR and spectral slope balance thus seem to be independent technical issues
with their independent (if present) effects on the formant tracking. This finding has
implications for the best-practice approaches to dealing with technically diverse
recordings which we will discuss in 5.4. In sum, our analyses revealed that both noise in
the recording and its spectral imbalance influence the traditional LPC-based F1/F2
formant measurements, and should therefore be not ignored in sociophonetic real-time
studies that involve formant measurements as indicators of sociolinguistic variations and
long-term changes in vowel quality.
5.2. Are different vowel qualities affected in similar ways?
If technical issues affected all vowel qualities in similar ways, we could have easily
estimated the direction of the influence and subsequently developed a unified way of
dealing with such an influence across a diverse vowel set. However, our results suggest
that such a simplistic approach to dealing with technical issues of diverse recordings will
remain impossible, given the persistent interaction of vowel quality with each technical
issue investigated in the present study. Künzel (2001:93) arrived at a similar conclusion,
faced with the vowel- and speaker-specific variability in his data.
As expected (see 1.2), corner vowels of the system were affected in particular. In this study,
the high, most front vowel /i/ and the most open vowel /a/ were highly susceptible to a
strong influence from both noise and spectral imbalance. More specifically, the highest F1
(in /a/) and the highest F2 (in /i/) seemed to be targeted: while F1 was strongly raised, F2
was lowered by both noise and spectral balance issues. Given the independency of both
technical effects and yet the same direction of their influence, their impact on formant
values accumulates (instead of e.g. cancelling each other out), raising or lowering the value
by a substantial amount of up to over 1 Bark.
Although we found that corner vowels were most affected by the technical issues, we
recommend real-time studies of central or mid-high peripheral vowels also run technical
quality checks before attempting meaningful vowel analyses – this seems crucial since
noise affected F1 of all vowels of this study, even if /u/ was affected to a lesser degree.
Apart from that, the advice to only investigate non-corner vowels in real-time studies of
variation and change seems neither appealing nor viable.

31
5.3. Can technical interference be effectively dealt with post-hoc?
As shown in 1.2, the technical set-up during a recording is bound to have an impact on the
resulting quality. The details and magnitudes of such technical effects are somewhat too
diverse to generalise, e.g. we know that F1 is often raised in technically compromised
recordings but the magnitudes of the frequency increase vary substantially across studies
and (at least partly) depends on the point of comparison, i.e. on the technical specification
of the recording that is considered free of such interferences. The best a researcher can do
in order to achieve a high level of comparability in the sense discussed in Gregersen and
Barner-Ramussen (2011) is to keep the recording equipment and surroundings exactly the
same across all sessions. It may be particularly helpful to take a photo of the recording set-
up if a session takes place outside of a recording studio (Christoph Draxler, personal
communication). Unfortunately, researchers often neither have control over the technical
set-up, nor have access to a detailed, photographic representation of the field situation
during the collection of data relevant for the compilation of real-time corpora. Moreover,
recording equipment is constantly evolving and being upgraded, making the exact
replacement of an old, defective gadget often impossible, if the time depth between
recording session is 10 or more years. Therefore, a post-hoc way of dealing with any
technical influence is, and will remain, crucial to any real-time studies into sound variation
and change.
In Sect. 3, we discussed an array of different, theoretically plausible approaches to dealing
with technical issues, which we aligned with presently well-understood and widely-
applied methods of neutralising the speaker-specific influences on F1/F2: these included
three frequently applied formant normalisation procedures – Nearey (1978), Lobanov
(1971), Watt-Fabricius (Watt and Fabricius 2002) – plus a distance ratio metric du
(Harrington, Kleber and Reubold 2008) and statistical means (cf. Hay 2011). We will
comment on how each of the above methods fared in comparison to the Bark-scaled F1/F2
data discussed above. The point of comparison in our case is the part of our corpus which
has better technical specifications in terms of SNR and spectral slope balance (see 2.3).
First of all, the co-variance of the spectral slope and the vowel space size were observable
for two out of the three normalised scales, namely Nearey and Watt-Fabricius. After these
transformations, the resulting vowel space remained smaller in recordings with a more
negative spectral slope. In contrast, the Lobanov-transformation removed this correlation.
While the SNR-levels did not seem to co-vary with either the vowel space size or the vowel
dispersion measured on any of the Hz-transforms, the du(F1) values showed a potential to
be affected by SNR, and a tendency to increase in noisier recordings (see 4.1.2), i.e. /u/
would appear less lowered in noisy recordings. This correlation is likely attributable to the
differential impact of low SNR on F1, raising that of /a/ more substantially than that of /i
u/, and may become more substantial in a larger corpus. In the case of our relatively small
database consisting of just 24 recordings in total, however, this linear relationship was
rather weak, and the correlation did not approach significance. Similarly though, the effect
of SNR was absent in the linear mixed-effects models fitted to du(F1). Overall, the distance

32
metric du seemed to provide a good way of removing the impact of technical issues from
the vowel quality data since none of the technical specifications showed a significant effect
on the tested du-values (apart from the marginally significant correlation above).
Overall, the impact of noise on F1 of /i a u/ was successfully removed by all normalisation
procedures, including du(F1). The impact of the spectral imbalance on F1 of /a/ was
successfully dealt with by both Nearey and Lobanov normalisations (though it is
noteworthy that Nearey-scaled data retained a marginal effect). In contrast, this effect was
rather boosted by the Watt-Fabricius normalisation; the transformation also led to a
significant impact of spectral imbalance on both high vowels, which was absent in Bark-
scaled data. These findings are very likely driven by the central role of /a/ in the calculation
of the S1-constant in the Watt-Fabricius normalisation (see (4)). If, as in our data, F1 of /a/
is the only vowel to be strongly affected by the technical issues (but not /i/, the other
anchor vowel of the S1-constant), there will be carry-over effects to the normalised F1 of
any other vowels. The absence of the impact of SNR on F1 under this transformation might
be due to the fact that F1 of both reference vowels, /a/ and /i/ was similarly affected by
noise, raising the frequency of the formant in comparable ways: 0.6 Bark for /a/ and 0.4
Bark for /i/; the difference of 0.2 Bark between the reference vowels seemed less likely to
have as strong an impact as the difference of 0.6 Bark above.
Similarly, the impact of noise and spectral balance on F2 of /i/ was successfully dealt with
by two normalisation methods, Nearey and Lobanov, while the Watt-Fabricius
transformation produced more significant effects than the Bark scale did. First of all, the
technical issues affected /a/ and /u/ (but not /i/ as in the Bark-scaled data). Instead of /i/
showing a lowering of F2 by 0.4-0.6 Bark under the influence of the technical issues, /a/
and /u/ had higher F2-values after the Watt-Fabricius transformation. These patterns
clearly differ from the ones ascertained for F1, and can be explained by the way the
calculation of the S2-constant works in (4): in contrast to S1, S2 relies exclusively on F1 and
F2 of /i/. There is again a carry-over effect on F2 of other vowels if F2 of /i/ is technically
affected, but it does not surface in the normalised values of /i/ itself (given that it serves as
an anchor).
And finally, the success of minimising technical interference purely by the statistical means
of estimation should be considered as rather mixed: the F1/F2 values estimated from non-
normalised data neither increased the comparability of formant plots across different
speaker groups nor did they help to eliminate the vowel space shrinkage in recordings with
a particularly poor spectral balance specification: the At values remained extremely similar
across raw and estimated formant data (see Figure 5). In contrast, these vowel space
characteristics were much less of an issue in Lobanov-transformed data where the
estimates also more closely reflected the means of F1 and F2 (see Figure 6).
33
5.4. Additional remarks on recording quality
Before moving on to making recommendations to future sociophonetic research involving
real-time data, some additional remarks need to address the origins of the spectral
imbalance in our data, preliminarily introduced in 2.3. Given previous research (see 1.2),
we expected to find some spectral variability in our data resulting mainly from an
occasional proximity effect. However, the distribution of spectral energy in our 1970s-
samples suggested that the proximity effect alone could not have contributed to the
reduced amount of energy available at higher frequencies. There was also some variation
among individual recordings of the Ronald Macaulay’s set where the exact same recording
equipment, set-up and procedure were used throughout the multiple recording sessions
(Ronald Macaulay, personal communication). We consulted with the School of Scottish
Studies Sound Archives (University of Edinburgh) who hold all of the Macaulay’s original
reel-to-reel tapes and digitised them for our project, and with a colleague from LANCHART
Centre in Copenhagen. A detailed inspection led to the conjecture that the above spectral
issues may have been caused by the digitisation procedure itself; the tapes may have been
slightly out of kilter (i.e. the tape and the tape head were misaligned) while the digitisation
took place (Gert Foget Hansen from LANCHART, personal communication). Additionally,
some dust on the playback head could have also led to the reduction of high frequencies.
Fixing this problem required a technician to adjust the azimuth of the tape head on the
playback machine to match the tape, and to clean the tape head.
Figure 8. DFT-spectra of two [u]-tokens taken from the midpoint of the vowel in ‘good’
produced by the speaker 70-Y, m2 (left: before the re-digitisation; right: after the re-
digitisation). Dashed lines demonstrate the spectral tilt (for more detail on these spectra
see Figure 2).
A re-digitisation of all affected tapes followed, with surprisingly impressive results. Figure
8 illustrates the difference in spectral tilts calculated for the same sound example (70-Y,
m2; taken from Figure 2), prior to the re-digitisation and afterwards; and compares the
1970s data with the more recent recording made in the 2000s (00-Y, m3; taken from Figure

34
2). The spectral tilt of the re-digitised recording now more or less equals the unaffected
recording, although the bass effect (higher energy in of F1 in comparison to F2 and F3) can
still be attested.
This example demonstrates that even more technical factors of potential influence need to
be taken into consideration when working with real-time data than initially hypothesised
(see 1.2). Fortunately, a competent set-up of a digitisation is one of the factors over which
sociophoneticians can exert more control, if aware of potential technical issues.
5.5. Is there a sound approach to the inference of change?
In this final section, we would like to offer some recommendations on how to approach
potentially challenging and technically diverse real-time data in sociophonetic
investigations, and to unveil the beauty in a beast.
First of all, sociophonetic research needs to show awareness of the technically introduced
issues affecting both F1 and F2, by assessing the technical quality of the data with respect
to at least SNR and spectral slope, before formants are measured (see 2.3). If only one of
the two issues is present, the irrelevant factor can be ignored since their effects are
independent of each other. If spectral imbalance is ascertained in the data, a potential
redigitisation of the original tapes might help alleviate, if not completely extinguish, the
problem. It is advisable to keep track of such technical information in a meta-data file for
each recording of a sociolinguistic corpus, along with the information about speakers,
interviewers and the recording situation.
Reliance on a single formant normalisation as a post-hoc method seems contraindicated.
In our data, the transformation after Nearey retained a minimal amount of information
about the poor SNR and the negative spectral balance of recordings in comparison to Bark,
while the Watt-Fabricius method created formant values most affected by the technical
issues. Following De Decker and Nycz (2010:54) who argue against using formant
normalisations which rely on F3-measurements if the data cannot be assumed technically
impeccable, we would like to also advise against applying the Watt-Fabricius
transformation in such cases. Given that this normalisation procedure relies heavily on
F1/F2 measurements of the corner vowels /i/ and /a/ whose values have been shown to
be particularly affected by the two technical issues studied here, many carry-over effects
are likely to obscure the patterns within a vowel system. The only transformation that we
could show to reliably remove the technical influences of recording quality was Lobanov.
However, it also removed sociolinguistically meaningful differences in the dataset: none of
the relevant group comparisons showed significant results (see also Adank et al. 2004,
Disner 1980).
In comparison to the above normalisation methods, the distance measure du showed little
influence by the technical issues, similar to the Lobanov transformation. The du-dataset
was, however, superior to the Lobanov-transformed data from the sociophonetic point of

35
view since only du clearly unveiled some meaningful effects involving /u/-lowering and
potential backing that we expected to find given existing evidence from independent
research (Scobbie 2011; Scobbie, Lawson and Stuart-Smith 2012). Despite its advantage in
context of a technically diverse corpus, a distance metric like the du measure comes with
its own limitations. First, a metric of this type is not appropriate for investigations with an
interest in the visualisation of the overall vowel space and dispersion. Stability of the
reference vowels might be the second issue that would obscure the patterns of variation of
change in the vowels in the centre of investigation. Moreover, direct comparisons of similar
sound changes across different accents of English can be conceivably difficult if the
reference vowels have different qualities.
Our general recommendation, then, is to combine the two approaches. Using Lobanov-
normalised data, formant plots can be created to visualise the vowel space, its dispersion
and the relationships between vowel categories. Notably, patterns of /u/-lowering and
retraction are somewhat visible in Figure 6, even though they did not reach significance
levels in statistical tests. Subsequently, distance metrics for the variable(s) in question may
help and narrow down the tendency of the change.
5.6. Summary and outlook
The present study set out to examine whether or not technical quality differences present
in a sociolinguistic real-time corpus might have an impact on the values of F1 and/or F2
measured by a standard LPC-algorithm implemented in Praat (Anderson 1978; Boersma
and Weenink 2013). Sufficient evidence supported the idea of some technically introduced
artefacts of F1/F2, which derived from noisy and spectrally compromised recordings.
Although the magnitude of the F1/F2 deviations seemed rather small in these data, the
technical effects could potentially accumulate, given the independence of SNR and spectral
balance. Moreover, we worked with a relatively small dataset comprising of 24 recordings;
a larger dataset (with more power) is likely to lend higher relevance to the effects that were
just trending towards significance in our data.
Based on the evidence provided in our study, we recommend that sociophonetic
investigations of real-time data consider some possible technical effects before a
meaningful analysis of the sociolinguistic variation is conducted. The researchers may not
always have control over the various factors influencing the technical quality of spoken
data during a recording session (and there always might be more, yet unknown, external
factors of influence that need to be taken into consideration, as the digitisation issues
showed us in the present study). However, we suggest that a preliminary acoustic analysis
of SNR and spectral balance properties of recordings should suffice to give the researchers
an appreciation of potential technical interferences and a post-hoc control over the arising
issues.
36
Acknowledgements
A large part of this work was supported by a research grant from the Leverhulme Trust
(RPG-142 grant to the second author), and would not have been possible without
thoughtful discussions with our colleagues around the globe: Christoph Draxler, Anne
Fabricius, Mark Huckvale, Tyler Kendall, Ulrich Reubold, Michel Scheffers, Jim Scobbie,
Dominic Watt. Our very special thanks go to Cerwyss O’Hare for leading transcription
work, Cordula Klein for labelling of old speakers’ data, Raphael Winkelmann for his support
with the data analyses in R during the (still ongoing) revamp of the EMU-system and two
anonymous reviewers for their valuable comments on earlier versions of this manuscript.
References
Adank, P., Smits, R., and van Hout, R. (2004). A comparison of vowel normalization
procedures for language variation research. Journal of the Acoustical Society of America
116: 3099-107.
Baayen, R. H. (2008). Analyzing linguistic data: A practical introduction to statistics.
Cambridge: Cambridge University Press.
Barras C., Geoffrois E., Wu Z., Liberman, M. (2001). Transcriber: Development and use of a
tool for assisting speech corpora production. Speech Communication 33, 5-22.
Boersma P., Weenink D. (2013). Praat: doing phonetics by computer [Computer
program]. Version 5.3.50, retrieved 21 May 2013 from http://www.praat.org/
Byrne, C., Foulkes, P. (2004). The 'Mobile Phone Effect' on vowel formants. International
Journal of Speech Language and the Law 11(1), 83-102.
Clopper, C. (2009). Computational Methods for Normalizing Acoustic Vowel Data for Talker
Differences. Language and Linguistics Compass 3(6), 1430–1442.
Corey, J. (2010). Audio production and critical listening: Technical ear training. Oxford:
Focal Press.
Cukor-Avila, P. (2000). Revisiting the observer's paradox. American Speech 75(3), 253-
254.
Dang, J., Honda, K. (1997). Acoustic characteristics of the piriform fossa in models and
humans. The Journal of the Acoustical Society of America 101, 456–465.
De Decker, P. (2016). An evaluation of noise on LPC-based vowel formant estimates:
Implications for sociolinguistic data collection. Linguistics Vanguard 2(1), 83–101.
De Decker, P., Nycz, J. (2011). For the record: which digital media can be used for
sociophonetic analysis? University of Pennsylvania Working Papers in Linguistics 17(2),
50-59.
Disner, S.F. (1980). Evaluation of vowel normalization procedures. Journal of Acoustical
Society of America 67(1): 253-261.
Flynn, N. (2011). Comparing vowel formant normalisation procedures. York Papers in
Linguistics Series 2(11), 1-28.

37
Gregersen, F., & Barner-Rasmussen, M. (2011). The Logic of comparability: On genres and
phonetic variation in a project on language change in real time. Corpus Linguistics and
Linguistic Theory 7(1), 7-36.
Gregersen, F., Maegaard, M., Pharao, N. (2009). The long and short of (ae)-variation in
Danish – a panel study of short (ae)-variants in Danish in real time. Acta Linguistica
Hafniensia 41, 64-82.
Hansen, G.F., Pharao, N. (2006). Microphones and measurements. In Ambrazaitis et al.
(eds). Proceedings of FONETIK 2006, Department of Linguistics Working Papers 52,
University of Lund: Sweden, 49–52.
Hansen, G.F., Pharao, N. (in progress). Differences in formant values caused by different
microphone setups. Unpublished manuscript, LANCHART, University of Copenhagen.
Harrington, J., Kleber, F., and Reubold, U. (2008). Compensation for coarticulation, /u/-
fronting, and sound change in Standard Southern British: an acoustic and perceptual
study. Journal of the Acoustical Society of America 123, 2825-2835.
Harrington, J., Kleber, F., Reubold, U. (2013). The effect of prosodic weakening on the
production and perception of trans-consonantal vowel coarticulation in German. Journal
of the Acoustical Society of America, 134, 551–561.
Hay, J. (2011) Statistical analysis. In M. Di Paolo and M. Yaeger-Dror (Ed.), Sociophonetics:
A Students' Guide. New York: Routledge, pp. 198-214.
Heath, T. L. (1921). A History of Greek Mathematics (Vol II). Oxford: Oxford University
Press.
Hillenbrand, J., Cleveland, R., Erickson, R. (1994). Acoustic correlates of breathy vocal
quality. Journal of Speech and Hearing Research 37, 769–778.
Huckvale, M. (2000). Speech Filing System: History of SFS.
https://www.phon.ucl.ac.uk/resource/sfs/help/history.htm
Fought C. 1999. A majority sound change in a minority community: /u/-fronting in Chicano English. Journal of Sociolingusitics 3 (1). 5-23.
Künzel, H. J. (2001). Beware of the ‘telephone effect’: The influence of telephone
transmission on the measurement of formants frequencies. Forensic Linguistics, 8(1), 80-
99.
Labov, W. (1972). Sociolinguistic Patterns. Oxford: Blackwell.
Labov, W. (1994). Principles of linguistic change. Vol. 1: Linguistic factors. Oxford:
Blackwell Publishing.
Labov, W., Ash, S., Boberg, C. (2006). The Atlas of North American English. Phonetics,
Phonology and Sound Change. Mouton de Gruyter.
Ladefoged, P. (1962). Elements of acoustic phonetics. Chicago: University of Chicago Press.
Linvillea, S.E., Rens, J., 2001. Vocal tract resonance analysis of aging voice using long-term
average spectra. Journal of Voice 15(3), pp. 323–330.
Llamas, C., Mullany, L., & Stockwell, P. (Eds.). (2006). The Routledge companion to
sociolinguistics. Routledge.

38
Lobanov, B.M. (1971). Classification of Russian Vowels Spoken by Different Speakers.
Journal of the Acoustical Society of America 49, 606–608.
McDougall, K., Nolan, F. (2007). Discrimination of speakers using the formant dynamics of
/u:/ in British English. In Proceedings of the 16th International Congress of Phonetic
Sciences, Saarbrücken, 1825-1828.
Milroy, L. (1987). Observing and analysing natural language: a critical account of
sociolinguistic method. Blackwell.
Milroy, L., Gordon, M. (2008). Sociolinguistics: Method and interpretation. John Wiley &
Sons.
Moon, S.-J., Lindblom, B. (1994). Interaction between duration, context and speaking style
in English stressed vowels. Journal of the Acoustical Society of America 96, 40–55.
Nearey, T. M. (1978). Phonetic feature systems for vowels. Indiana: Indiana University
Linguistics Club.
Picheny, M., Durlach, N., and Braida, L. (1986) Speaking clearly for the hard of hearing. II
Acoustic characteristics of clear and conversational speech. Journal of Speech and Hearing
Research 29, 434–445.
Plichta, B. (2004), Signal acquisition and acoustic analysis of speech. http://bartus.org
Pollack, I., Pickett, J.M. (1958). Masking of speech by noise at high sound levels. Journal of
Acoustical Society of America 39, 127–130.
Rathcke, T. and Stuart-Smith, J. (2015). On the Tail of the Scottish Vowel Length Rule in
Glasgow. Language and Speech, 1-27.
Sankoff, G., Blondeau, H. (2007). Language change across the lifespan: /r/ in Montreal
French. Language, 83, 560-88.
Scobbie, J., Stuart-Smith, J. (2012). Socially stratified sampling in laboratory-based
phonological experimentation. In A.C. Cohn, C. Fougeron, and M.K. Huffman (eds.) The
Oxford Handbook of Laboratory Phonology. Oxford: Oxford University Press, pp. 607-621.
Scobbie, J. M., Lawson, E., Stuart-Smith, J. (2012). Back to front: a socially-stratified
ultrasound tongue imaging study of Scottish English /u/. Rivista di Linguistica/Italian
Journal of Linguistics, Special Issue:" Articulatory techniques for sociophonetic research",
24(1), 103-148.
Stuart-Smith, J. (2004) Scottish English: phonology. In: Kortmann, B., Burridge, K.,
Schneider, E.W., Mesthrie, R. and Upton, C. (eds.) A Handbook of Varieties of English. 1:
Phonology. Mouton de Gruyter: Berlin, pp. 47-67.
Stuart-Smith, J., Pryce, G., Timmins, C., Gunter, B. (2013). Television can also be a factor in
language change: Evidence from an urban dialect. Language 89(3), 501-536.
Stuart-Smith, J., Jose, B., Rathcke, T., Macdonald, R., Lawson, E. (2016). Changing sounds in
a changing city: An acoustic phonetic investigation of real-time change across a century of
Glaswegian. In E. Moore and C. Montgomery (eds), A Sense of Place. Cambridge:
Cambridge University Press.

39
Stuart-Smith, J, Sonderegger, M., Rathcke, T., Macdonald, R. (2015). The private life of
stops: VOT in a real-time corpus of spontaneous Glaswegian. Laboratory Phonology 6(3-
4), 505–549.
Svec, J.G., Granqvist, S. (2010). Guidelines for selecting microphones for human voice
production research. American Journal of Speech-Language Pathology 19, 356-368.
Tagliamonte, S. A. (2006). Analysing sociolinguistic variation. Cambridge University Press.
Thompson, P. (1975/1992). The Edwardians: The Remaking of British Society, London:
Routledge.
Tillery, J., Bailey, G. (2003). Approaches to real time in dialectology and sociolinguistics.
World Englishes 22(4), 351-365.
Trudgill, P. (1988). Norwich revisited: Recent linguistic changes in an English urban
dialect. English World-Wide 9, 33-49.
Traumüller, H. 1990. Analytical expressions for the tonotopic sensory scale. . Journal of
Acoustal Society of America 88(1), 97-100.
Van Son, R.J.J.H. (2005). A study of pitch, formant, and spectral estimation errors
introduced by three lossy speech compression algorithms. Acta Acustica united with
Acustica 91(4), 771-778.
Wagner, S. E. (2012). Age grading in sociolinguistic theory. Language and Linguistics
Compass 6(6), 371-82.
Watt, D., Fabricius, A. (2002). Evaluation of a technique for improving the mapping of
multiple speakers' vowel spaces in the F1 ~ F2 plane. In D. Nelson (ed.) Leeds Working
Papers in Linguistics and Phonetics 9: 159-73.
Wells, J. (1982). Accents of English. Cambridge: Cambridge University Press.
Winkelmann, R. (2015). Managing Speech Databases with emuR and the EMU-webApp. In
Sixteenth Annual Conference of the International Speech Communication Association.


![[Dan Harrington, Bill Robertie] Harrington on Cash(BookZZ.org)](https://img.pdfslide.us/doc/110x75/55cf8546550346484b8c3513/dan-harrington-bill-robertie-harrington-on-cashbookzzorg.jpg)