Embed Size (px)
Citation preview

The use of computers to study rates of lipid metabolism
NOME BAKER Radioisotope Research, Veterans Administration Center, Los Angeles, California 90073, and Department of Biological Chemistry, University of California a t Los Angeles School of Medicine, Los Angeles, California 90024
ABSTRACT Many complex problems of lipid metabolism are especially suited for multicompartmental analysis with computers. Examples are presented. The use of a model as a means of communicating one’s working hypothesis and the model as it relates to experimental design are discussed. A number of principles relating to experimental design and to the interpretation and presentation of data are illustrated by 12 studies selected from the literature. These include evaluations of turnover and transport rates of liver and plasma triglycer- ides, triglyceride synthesis, phospholipid synthesis, and lipid oxidation to CO?.
A discussion of computer-oriented vs. noncomputer-oriented techniques is included. Some of the practical problems in- volved in computer analysis are also considered. Among these are the choice of computer, computer applications, stepwise vs. multicompartmental analysis, validity of single-injection type experiments, avoidance of multicompartmental analysis, nonsteady state systems, and nomenclature.
Abbreviations: FA, fatty acids; FFA, free fatty acids; TG, triglycerides ; TGFA, triglyceride fatty acids ; PL, phospholipids ; PLFA, phospholipid fatty acids ; VLDL-TG, very low density lipoprotein triglycerides; lecithin-P, the phosphorus or phosphate moiety of lecithins; Sp. A., specific activity; SAAM, systems analysis and modeling (a computer program).
Definitions. Curve peeling: separating a multiexponential curve into its component, simple exponential functions. Black box: A black box symbolizes one or more compartments containing sub- stances that have not been directly measured; into the compart- ment(s) there is an inflow and an outflow of material. The nature of the substances in the black box may not be known, but one can observe the kinetic behavior of the outflow from the black box. This behavior must differ from that of the inflow. The black box, then, is mathematically equivalent to an operator that acts upon a known input to give an observed output. The black box differs from other compartments only in that it is not defined chemically or physiologically; it is frequently more heterogeneous than the other compartments in a model.
SUPPLEMENTARY KEY WORDS models . multi- compartmental analysis . free fatty acids . triglycerides . phospholipids . carbon dioxide oxidation - turnover rates . transport . irreversible disposal
I. SCOPE OF PRESENT REVIEW
During the last few years only a handful of pertinent papers have appeared in which digital and analog com- puters have been used to study complex quantitative problems of lipid metabolism. Several explanations for the dearth of literature in this field are possible. Most biochemists and physiologists may not have learned how to use computers to deal with quantitative aspects of metabolism. Other scientists may feel that the amount of useful information gained by use of computer techniques is not worth the time and effort which they imagine is required to learn how to analyze a problem by com- puter technique. Moreover, they are probably aware that by clever experimental design they may reduce a complex system to a simpler one which may be evaluated easily without a computer. Some workers may feel tha t i t is impossible to obtain meaningful information from highly complex experimental situations, o r tha t useful in- formation may be obtained, bu t only by making large numbers of unwarranted assumptions. Still others may think that they have obtained useful information by computer techniques bu t have encountered reviewers who hold one or more of the above opinions and who, therefore, reject work that is based upon multicompart- mental analyses. These considerations have led me to write this paper in which I shall at tempt to discuss, in nonmathematical terms, how computers may be profit-
JOURNAL OF LIPID RESEARCH VOLUME 10, 1969 1
by guest, on June 26, 2018w
ww
.jlr.orgD
ownloaded from

ably used to study various aspects of lipid metabolism. My aim will be to acquaint the reader with several types of problems that have been explored by computer tech- niques, to offer suggestions with respect to experimental design and the interpretation and presentation of results, and to suggest criteria for critical evaluation of papers that are based upon complex multicompartmental analyses. No attempt will be made to present a compre- hensive review of the literature in the field since this seems premature a t the present time. For general back- ground, the reader may i-efer to references 1-3, which deal with relatively simple models. Differential equa- tions and elementary concepts of isotopic dilution and turnover rate will not be discussed here.
11. METABOLIC PROBLEMS ESPECIALLY SUITED FOR COMPUTER ANALYSIS
Computers are obviously designed to deal with quanti- tative aspects of problems. How rapidly is a substance formed? How much of it is derived from each of its immediate and distant precursors? What are the relative rates of conversion of a substance to each of several prod- ucts to which it may give rise? How fast does a particular reaction sequence occur in a particular tissue or type of cell? What are the effects of various physiological pro- cesses upon these rates?
Computers are not necessary in order to deal with all of these questions. For example, the rate at which FFA are mobilized (enter the circulation) in the fasted state has been estimated by several workers (4-8). Simple anal- ysis of the curves showing either Sp. A. or total radio- activity of plasma FFA as a function of time plus knowl- edge of the plasma FFA pool size allowed (or should have allowed) the authors to calculate the rate of forma- tion of plasma FFA. Although no computer is required for this type of mathematical treatment, computers have been used not only to resolve multicomponent exponential decay curves (9, lo), but to obtain least- square fits of simple functions and to carr)- out large numbers of relatively simple computations. Our dis- cussion will be restricted to extensions of the above calculations at levels of complexity that preclude or al- most preclude simple computation by hand. The ap- plication of computer techniques to relatively simple problems is generally understood, accepted, and in common use. On the other hand, the more advanced computer analyses are generally avoided even though their use may lead to a greater understanding of highly complex biochemical and physiological systems.
The experimenter encounters difficult problems that call for computer analysis as soon as he shows the slight- est sophistication with respect to the questions he poses. For example, instead of asking, “How fast are plasma
FFA replaced in fed animals?” he may ask “How fast is plasma oleic acid (18:l) being replaced in fed animals and to what extent do each of the major precursors of oleic acid participate in both the total and net’ re- placement of plasma oleic acid?” For the more general question one must take into account the heterogeneity of plasma FFA ; the various sources, endogenous and dietary, of plasma FFA; the processes of de novo syn- thesis, elongation, and desaturation of fatty acids; recycling and exchange reactions; and the relative quantitative significance of adipose tissue TG, hepatic TG, plasma TG, and other lipid esters as precursors of plasma FFA. Of course, many facets of this problem can be studied by considering only relatively simple aspects of it, and by accumulating information gradually. However, the investigator may prefer to integrate large amounts of data that have been obtained in a single experiment under constant experimental conditions. In that case, a computer would be of great help, if not indispensable.
Another complex question arises when one considers that there are a t least two routes by which plasma FFA may be recycled in fed animals : (a) plasma FFA + liver TG + plasma TG + plasma FFA (6) plasma FFA --c tissue esters -+ tissue FFA --+ plasma FFA. One of these pathways involves conversion to T G by the liver, secretion of the TG into plasma, and hydrolysis of the T G by a mechanism that leads to the appearance, after a short delay, of FFA derived from the TG in the circulation (7, 14-17) .2 Another pathway involves esterification, primarily in extrahepatic tissues, and intracellular hydrolysis followed by passage of fatty acid back into the circulation. What is the relative importance of each of these two pathways? The solution to this question will probably require a computer analysis of great complexity. Already three highly complex models dealing only with portions of these pathways have been presented (8, 18, 19).
Wise and Elwyn (20) have recently posed an intricate question concerning phospholipid metabolism. “What are the rates of synthesis in vivo of choline-, ethanol- amine-, and serine-containing phospholipids of rat liver and small intestine via all the known biochemical path-
The important distinction between total and net inflow and outflow transport r a t a (irreversible disposal) is clarified in a recent paper (8; see also 11-13). The total rate of FFA outflow transport may be much greater than its net rate of production (net inflow transport). For example, if FFA were to exchange with esterified FA, the total rate of FFA outflow transport, as estimated by the initial decline in FFA Yp. A, , would be greater than the rate at which FFA is leaving the system by irreversible pathways (e.g., oxidation to C O X ) . Net inflow transport rate equals the net out- flow transport rate in the steady state.
2 References include studies of chylomicron TGF.4 conversion to plasma FFA.
2 JOURNAL OF LIPID RESEARCH VOLUME 10, 1969
by guest, on June 26, 2018w
ww
.jlr.orgD
ownloaded from

ways?” In approaching this problem they have used computer analysis in a stepwise fashion that I shall dis- cuss later.
Another question that is of the utmost importance and which, with all of its ramifications, will surely require a computer for analysis, is the following: “How rapidly are T G secreted by the liver in fed animals and what frac- tion of the secreted TGFA is derived from FA newly synthesized in liver, from FA newly synthesized by adipose (and other) tissues, from hepatic phospholipid FA and from FA mobilized from stores of (u) adipose tissue T G and ( b ) hepatic tissue T G (fat droplets)?”
Metabolic complexity is obviously not limited to in vivo problems. A relatively complex model is required in order to study the following aspects of T G metabolism in iso- lated adipose tissue: (u) the extent to which VLDL-TG are hydrolyzed to FFA prior to incorporation of TGFA into isolated fat cells; ( b ) the rate at which newly formed TGFA in fat cells are hydrolyzed relative to the rates of TGFA deposition and hydrolysis in the fat droplets; (c) the relative contribution of FA newly synthesized from glucose to various pools of adipose tissue TGFA compared to the contribution made by FA derived from plasma FFA and TGFA (21, 22). I know of no publication in which these aspects of lipid metabolism have been studied by a careful mathematical analysis involving both model building and computer analysis. However, models have been put forward (23, 24); at present appropriate data are not available for a computer analysis that might give quantitative dimensions to these important questions of lipid metabolism.
The list of unanswered questions concerned with quantitative and descriptive aspects of lipid metabolism is large. I have touched on only a few of the myriad prob- lems which remain to be solved. Later I shall review the work of several investigators who have attempted to an- swer similar questions. Before proceeding, the reader may wish to examine the few questions that I have already presented. How would he go about attacking these prob- lems experimentally? After establishing that the ques- tions really remained unanswered, he would probably formulate a working hypothesis to serve as a basis for experimental design and for the analysis itself.
111. T H E MODEL: A WORKING HYPOTHESIS
A model is a representation of a hypothesis in which a formal structure for a system is proposed (25, 26). I t is usually a simplified representation of a physiological system. The model, like all hypotheses, is derived from experimental observations, previous knowledge, and a number of assumptions. Batschelet, citing Rashevsky, has pointed out that “models are of a transient nature” (25); therefore, some models are a better reflection of reality
than others. With this in mind, there is no need for the scientist who has used a model to apologize in any way for having presented a model which may not be correct. I t is incumbent upon the reader to recognize a model as an expression of someone’s working hypothesis. Testing and developing the hypothesis through experimentation generally results in revision of the model with respect to its qualitative and (or) quantitative properties (26, 27). For example, a model may be presented in which com- pound A is transformed directly to compound B in the body without first being converted to compound C. As the model is developed through experimentation, one may find that actually A appears to go to C before it is converted to B; moreover, approximate rates at which this conversion ( A + C + B ) occurs may be estimated. The newly developed model, with numbers indicating conversion rates, would then represent the revised model. However, it is appropriate, in my opinion, for the first, incorrect model to be presented during the early experi- mental stages.
One of the questions posed above appears in Fig. 1 along with a model which might serve as a working hy- pothesis. Actually many hypotheses are represented. The hypotheses would be communicated even more clearly, in the model shown in Fig. 1, if estimates of the rates were inserted along with the arrows. The hypothetical “vectors” would then have relative magnitude as well as order and direction.
IV. THE MODEL IN RELATION TO EXPERIMENTAL DESIGN
All readers are probably aware that a computer is unable to compensate for a poorly designed experiment. Com- puters solve problems only if given the appropriate data. However, since the experimentalist may not know what constitutes appropriate data, some discussion along these lines may be helpful. Three approaches are com- monly used in the design of experiments that are subse- quently analyzed by multicompartmental analysis.
(a) The authors do not initially intend to analyze their data in terms of rates. Therefore, no consideration is given to the number and spacing of data points neces- sary to define the experimental curves and to the mea- surement of pool sizes. However, the investigators may intuitively or fortuitously acquire sufficient data to per- mit a multicompartmental analysis provided they do a few additional experiments that should have been done in the first place. For example, if they realize that an early component of a curve has been missed, they might obtain this information in a subsequent experiment. They might then combine the early component with the rest of the curve that has been defined previously by normalizing one set of data to another. O r it may become
BAKER Computers and Rates qf Metabolism 3
by guest, on June 26, 2018w
ww
.jlr.orgD
ownloaded from

-I r-----------l r------- -- ---
K B?
GLUCOSE?
LIVER T G PALMITATE LIVER T G STEARATE (COMPLEX) (COMPLEX)
t
QUESTION: HOW FAST IS PLASMA OLEIC ACID BEING REPLACED I N FED
ANIMALS A N D TO WHAT EXTENT D O EACH OF THE MAJOR
PRECURSORS OF OLEIC ACID PARTICIPATE I N BOTH THE STE A N D N E T REPLACEMENT OF PLASMA OLEIC ACID?
FIG. 1. Example of a model as a working hypothesis. A complex question that deals with rates of lipid metabolism was first stated (bottom of the figure). Then the above model was constructed. Note that the model is highly oversimplified. For example, dietary lipid (“food”) is shown giving rise to plasma FFA directly, whereas most dietary, long-chain FA enters the circulation as chylomicron TGFA. The uptake of chylomicron TGFA is not shown. Each TGFA compartment is made up of classes of TGFA, which vary with respect to the FA moieties at each position of the glyceride. Moreover, both tissue and plasma TG are much more heterogeneous than illustrated. See text. KB, ketone bodies.
necessary to measure pool sizes in a different population of animals from that used in the tracer experiments. An analysis based upon experimental data acquired in such a piecemeal fashion may provide a great deal of valuable information ; however, it is usually an inefficient and rather crude experimental approach.
(6) A model is drawn before an experiment is carried out. The minimum amount of data is obtained to allow calculation of turnover rates and pool sizes for the model.
(c ) The same as (6) expect that more information is obtained than the minimum required to calculate rates and pool sizes. As a result the investigators are able not only to define their hypothetical model but also to rule out other hypothetical models and to add weight to their calculations. They may, of course, also find that their model is inconsistent with their data and that another model is required. Such insight is difficult to obtain when only a minimal amount of data is obtained.
The third approach is recommended. However, the investigator should be warned that, as he attempts to
verify or establish his model by obtaining “excess” data, his chances of discovering inconsistencies will increase, as will the difficulties in presenting data in publishable form.
Two points implied by the above discussion should be emphasized. First, after one has devised a model to describe a system, certain data are needed to define the model fully. Second, the more data containing new and pertinent information that one has, the smaller is the number of possible models that are consistent with the data. For any given body of data only certain models can be proposed.
V. CRITICAL REVIEW OF RECENT LITERATURE
LIVER AND PLASMA T G SYNTHESIS
Several papers have been published recently in which rates of lipid metabolism have been studied by multi-
4 JOURNAL OF LIPID RESEARCH VOLUME 10, 1969
by guest, on June 26, 2018w
ww
.jlr.orgD
ownloaded from
compartmental analysis. I shall discuss first a group of eight papers concerned with liver and plasma T G syn- thesis, and then several papers dealing with miscellaneous problems of lipid metabolism (PL synthesis and FFA esterification and oxidation).
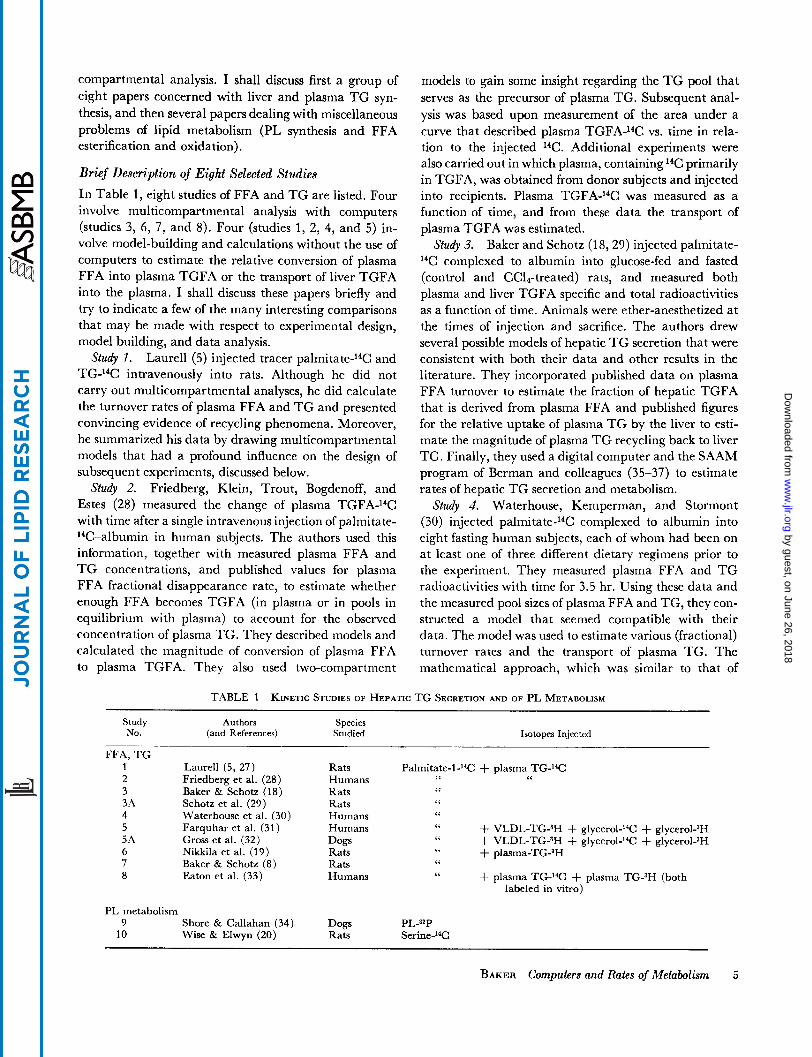
Brief Description of Eight Selected Studies In Table 1, eight studies of FFA and TG are listed. Four involve multicompartmental analysis with computers (studies 3, 6, 7, and 8). Four (studies 1, 2 , 4, and 5) in- volve model-building and calculations without the use of computers to estimate the relative conversion of plasma FFA into plasma TGFA or the transport of liver TGFA into the plasma. I shall discuss these papers briefly and try to indicate a few of the many interesting comparisons that may be made with respect to experimental design, model building, and data analysis.
Laurell (5) injected tracer palmitate-14C and TG-14C intravenously into rats. Although he did not carry out multicompartmental analyses, he did calculate the turnover rates of plasma FFA and TG and presented convincing evidence of recycling phenomena. Moreover, he summarized his data by drawing multicompartmental models that had a profound influence on the design of subsequent experiments, discussed below.
Friedberg, Klein, Trout, Bogdenoff, and Estes (28) measured the change of plasma TGFA-14C with time after a single intravenous injection of palmitate- "C-albumin in human subjects. The authors used this information, together with measured plasma FFA and T G concentrations, and published values for plasma FFA fractional disappearance rate, to estimate whether enough FFA becomes TGFA (in plasma or in pools in equilibrium with plasma) to account for the observed concentration of plasma TG. They described models and calculated the magnitude of conversion of plasma FFA to plasma TGFA. They also used two-compartment
Study 7.
Study 2.
models to gain some insight regarding the T G pool that serves as the precursor of plasma TG. Subsequent anal- ysis was based upon measurement of the area under a curve that described plasma TGFA-14C vs. time in rela- tion to the injected 14C. Additional experiments were also carried out in which plasma, containing 14C primarily in TGFA, was obtained from donor subjects and injected into recipients. Plasma TGFA-14C was measured as a function of time, and from these data the transport of plasma TGFA was estimated.
Baker and Schotz (18,29) injected palmitate- 14C complexed to albumin into glucose-fed and fasted (control and CC14-treated) rats, and measured both plasma and liver TGFA specific and total radioactivities as a function of time. Animals were ether-anesthetized at the times of injection and sacrifice. The authors drew several possible models of hepatic TG secretion that were consistent with both their data and other results in the literature. They incorporated published data on plasma FFA turnover to estimate the fraction of hepatic TGFA that is derived from plasma FFA and published figures for the relative uptake of plasma TG by the liver to esti- mate the magnitude of plasma TG recycling back to liver TG. Finally, they used a digital computer and the SAAM program of Berman and colleagues (35-37) to estimate rates of hepatic TG secretion and metabolism.
Study 4. Waterhouse, Kemperman, and Stormont (30) injected palmitate-14C complexed to albumin into eight fasting human subjects, each of whom had been on at least one of three different dietary regimens prior to the experiment. They measured plasma FFA and T G radioactivities with time for 3.5 hr. Using these data and the measured pool sizes of plasma FFA and TG, they con- structed a model that seemed compatible with their data. The model was used to estimate various (fractional) turnover rates and the transport of plasma TG. The mathematical approach, which was similar to that of
Study 3.
TABLE 1 KINETIC STUDIES OF HEPATIC TG SECRETION AND OF PL METABOLISM
Study Authors Species No. (and References) Studied Isotopes Injected
FFA, TG 1 2 3 3 A 4 5 5 A 6 7 8
Laurell (5, 27) Friedberg et al. (28) Baker & Schotz (18) Schotz et al. (29) Waterhouse et al. (30) Farquhar et al. (31) Gross et al. (32) Nikkila et al. (19) Baker & Schotz (8) Eaton et al. (33)
Rats Humans Rats Rats Humans Humans Dogs Rats Rats Humans
Palmitate-l-"C + plasma TG-"C " ' ' '
+ VLDL-TG-3H + gly~erol-'~C + gly~erol-~H + VLDL-TGJH + glycero1JC + gly~erol-~H + pla~ma-TG-~H
+ plasma TG-14C + plasma TG-3H (both ' '
labeled in vitro)
PL metabolism 9 Shore & Callahan (34) Dogs PL-32P
10 Wise & Elwyn (20) Rats Serine-"C
BAKER Computers and Rates of Metabolism 5
by guest, on June 26, 2018w
ww
.jlr.orgD
ownloaded from

Skinner, Clark, Baker, and Shipley (38), will be dis- cussed below.
Study 5. Farquhar, Gross, Wagner, and Reaven (31) injected either labeled glycerol, labeled palmitate, or VLDL (labeled primarily in the T G moiety) into fasting human subjects. They measured Sp. A. of plasma VLDL- T G and of T G in denser lipoprotein fractions at various times, and determined the Sp. A. of T G in a single liver biopsy specimen from each of four patients, the specimen being obtained at various times after the start of the experiment. They used these data to calculate the transport of plasma VLDL-TG and to derive information regarding the hepatic T G pool that serves as a precursor of VLDL-TG. The authors refined the experimental technique of earlier workers by subfractionating plasma lipoprotein fractions and by using labeled glycerol, procedures that reduced the number of variables they had to consider. No data describing plasma FFA or glycerol Sp. A. were obtained; no computer anal- ysis was used. Gross, Eigenbrodt, and Farquhar have carried out a similar study in anesthetized, postabsorp- tive dogs receiving glucose intravenously ( 3 2 ) . A larger number of liver biopsy specimens was obtained in this study than in the study with human subjects.
Nikkila, Kekki, and Ojala (19) have im- proved greatly upon the experimental design used by Baker and Schotz to study hepatic T G formation and secretion in rats. Unfortunately, Nikkila et al. do not present their data for radioactivity in liver T G and PL even though they used this information in their multi- compartmental kinetic analysis. Moreover, their data is preliminary in that only one animal was studied in each of three different dietary states. On the other hand, they obtained complete curves of plasma TGFA-3H and TGFA-14C after simultaneous injection of palrnitate-14C and of endogenously labeled plasma TG-palmitatdH in Nembutalized animals. They calculated the total and net transport of hepatic TGFA secretion and the per- centage of newly synthesized TGFA that was derived from plasma FFA and hepatic lipogenesis.
Baker and Schotz (8) have carried out a multiconipartmental analysis of FFA recycling, oxida- tion, and esterification in unanesthetized, fasted rats. Their data indicate that the model of hepatic T G me- tabolism which they presented earlier (study 3) must be superseded by a more complex one. The difficulties in- volved in calculating net rates of esterification are em- phasized.
Eaton, Berman, and Steinberg (33) have presented an extensive study of plasma FFA conversion to plasma TGFA in human subjects. No liver data were obtained. A multicompartmental analysis was used to construct a model that was consistent with the results of a variety of experiments including the conversion of
Study 6.
Study 7.
Study 8.
plasma TGFA to plasma FFA and the transport of plasma TGFA in relation to its formation from plasma FFA. In contrast to earlier experiments in human sub- jects, the delay in secretion of newly synthesized TGFA by the liver was taken into account. However, the kinetic treatment used to describe liver TGFA turnover was far less complex than indicated in study 5 in humans, study 5A in dogs, or in studies 3, 6, and 7 in rats.
Critical Discussion of Studies 2-8
Study 2 (Friedberg et al.; Humans). ( a ) Validity of a simple method for measuring (fractional) turnover rate of a product after injection of a labeledprecursor. The mathematical treatment3 employed in study 2 is deceptively simple. The authors state that “the amount of TGFA forrned per hour which enters plasma equals the fraction of FA label converted to plasma TGFA* [J4C 1 times the endogenous FFA turnover rate.” If the reader extends this logic to any problem, he would make some grave errors, for only in relatively rare, special cases does the amount of radioactivity in a n end product divided by the injected radioactivity equal the fraction of the substance which is converted to the end product.
( b ) Direct us. indirect pathways. In the case considered by Friedberg et al., their definition would include an in- direct pathway such as FFA + liver PLFA -+ liver TGFA + plasma TGFA. In the approach used in studies 3 (Baker and Schotz; rats), 6 (Nikkila et al.; rats), and 8 (Eaton et al. ; humans) an indirect route is either excluded by definition or treated separately.
(c) Major conclusions that did not require comblex, multi- compartmental analysis. Among the very interesting observa- tions made by Friedberg et al. in study 2 were these. (i) The intermediate precursor of plasma TGFA was turning over very rapidly compared to plasma TGFA; (ii) the “decay” curve for plasma TGFA-lqC after injec- tion of FFA-I4C is approximately the same as that for TGFA-14C after injection of endogenous TGFA-I4C [in contrast to Laurell’s observations in rats (study 1) where the decay of plasma TGFAJ4C after injection of FFA-14C was found to be niuch slower than the decay of TGFA- 14C after injection of endogenous TGFA-I4C] ; (iii) most of the plasma TGFA pool is derived from plasma FFA; (iv) the fractional turnover rate of plasma TGFA is very small in man compared to rats. These deductions were reached on the basis of direct experimental observation and calculations based upon a simple two pool model. The conclusions have received support from subsequent workers who have studied rates of TGFA-14C turnover in humans. In the later studies, the models were clearly shown and the quantitative treatment was extended.
There are several errors in sign in the mathematical treatment. 2 = x - y should read 2 = x + y. Similar corrections should be made throughout most of the subsequent steps.
6 JOURNAL OF LIPID RESEARCH VOLUME 10, 1969
by guest, on June 26, 2018w
ww
.jlr.orgD
ownloaded from

( d ) Additional information in data of Friedberg et al. that was not used and that would be used in a multicompartmental analysis. By comparing studies 8 (Eaton et al.; humans) and 3 (Baker and Schotz; rats) with study 2 (Friedberg et al.; humans) the reader may discover that the data obtained in study 2 contained unused information. How soon did the TGFA curve start rising? How fast did it rise? How high did it rise? When did it reach its maximum? Moreover, the authors could have obtained a more accurate estimation than they did of the contri- bution of plasma FFA to plasma TGFA by relating the kinetic behavior of their precursor FFA-14C to the level of plasma TGFAJ4C by niulticompartmental analysis, for much inforniation may be derived from a careful analysis of the complex plasma FFAJ4C curve in relation to the plasma TGFA-14C curve. These comments are not in- tended as criticisms of Friedberg et al.’s fine work, but rather to point out that more thorough data analysis is desirable and can be carried out with relative ease4 by inulticompartmeiital analyses and by curve-fitting com- puter techniques.
( a ) Interpreta- tion of slopes and intercepts: dependence upon the model. The experimental design of Waterhouse et al. is similar to that employed by several other investigators; however, their approach to data analysis, although conventional, differs in several ways from that used by other workers who have studied plasma FFA + plasma TGFA. First of all, the authors’ model shows plasma FFA being formed partly from the pool that is an intermediate be- tween plasma FFA and plasma TG. Suppose this inter- mediate pool represents liver TGFA. It is not unreason- able to assume that plasma FFA may exchange with liver TGFA (8, 39).5 However, the method of analysis used in study 4 may be greatly influenced by the magni- tude of this rate. If, in fact, the conversion of liver TGFA to plasma FFA is a relatively minor process, and if, for practical purposes, it could be ignored, then the authors would have been forced to change their model (shown here as Fig. 2, model A) to model B in order to account for the minimum of three components they observed in their plasma FFA-14C vs. time curve. In other words, the
Study 4 (Waterhouse et al.; Humans).
As an example of the “ease” of multicompartmental analysis, we have found that several hours is sufficient to review newly sum- marized data, to select a model, to punch cards, and to obtain excellent fits for 24 individual Sp. A.-time curves obtained from a total of 16 experiments. Four- or seven-compartment models were used in each case. The above time estimate excludes the delay between the time that the data were deposited at a computer facility and the time that the final solutions were printed out. The total computer time was 4 min. The time delays may be reduced to an even greater degree, as discussed by Berman (26).
6 Have1 has found neither net FFA release from nor exchange of plasma FFA with lipids in dog liver (personal communication).
three components of the plasma FFA curve are attributed to interchange of activity among compartments I, 2, and 3 in their model A, which has not been established and is, in fact, highly unlikely (8, 33). If model A were cor- rect, then the authors could derive information regarding the fractional rate constants of flow from the slopes and intercepts of the plasma FFA-14C vs. time curve (plus measurement of activity in plasma TGFA). This is, in fact, what these investigators attempted to do. How- ever, if model B is correct, then the relationships no longer hold.
(6) Dtjinition of slopes and intercepts by “curve-peeling” techniques: accuracy. In order to carry out their analysis on the basis of model B (Fig. 2), Waterhouse et al. would have to be able to define two additional slopes and inter- cepts from their plasma TGFA curve. However, despite suggestions to the contrary in study 6, it is not possible to define five slopes accurately (40) from their data or from most short-term tracer experiments in which varia- tion is at least *5yo. This means that some aspects of the five-compartment model may not be defined accu- rately unless additional data are obtained. For example, the turnover rates defining the last compartment, plasma TGFA, might be defined by an independent experiment -as was done in studies nos. 2, 5 , 5A, 6, and 8. How- ever, it is possible to calculate the rate of conversion of a precursor to a product accurately even if slopes and inter- cepts are erroneous, provided that the slopes and inter- cepts describe the actual curves within experimental ac- curacy. The reasons that this holds true are as follows. First, a wide range and combination of slopes and inter- cepts may fit a complex exponential curve within experi- mental accuracy (40). Second, any combination of slopes and intercepts that describes the curve within experimental accuracy also defines the area subtended by the curve. Third, the areas under the precursor and
1 2 3 (A)
MINIMAL MODEL OF
STUDY NO. 4
(B)
MORE LIKELY MINIMAL MODEL
-R 3 COMPARTMENT
MODEL
FIG. 2. The model of Waterhouse et al. (30) used in study 4 to describe the conversion of plasma FFA to plasma TGFA (model A). An alternative “minimal” model which seems more plausible is also shown (model B).
BAKER Computers and Rates of Metabolism 7
by guest, on June 26, 2018w
ww
.jlr.orgD
ownloaded from

product curves are related to the rates of conversion of the precursor to the product.
(c) Importance of obtaining data at early times. By not measuring plasma TGFA at early times, Waterhouse et al. failed to observe that a marked lag occurs between the time that TGFA is synthesized and the time it is secreted into plasma. This interesting kinetic behavior of plasma TGFA yields much information regarding the behavior of the liver TGFA compartment(s) (see refer- ence 18 for bibliography). I t is always advisable to get data as early as possible so that a complete curve may be defined. As will be discussed later, many incorrect conclusions that have been attributed to a limitation of the single-injection technique have really been due to the failure of authors either to obtain data a t early times or to interpret the data properly when they had it.
( d ) General solutions f o r three-compartment models. The authors spend a considerable portion of their paper presenting an extensive mathematical treatment which has already been developed by Skinner et al. (38) in the form of a general solution. From equations 3, 9-11, 14, and 1 5 of Skinner et al. one may calculate by simple algebra all (fractional) turnover rates, pool sizes, inflow, and outflow transport rates for model A of Fig. 2, which is the model used by Waterhouse et al. in study 4. We have found the general solution of Skinner et al. to be highly useful in the early stages of all of our multicom- partmental analyses. The general solution, however, can be used only if all the slopes and intercepts that describe the model can be ascertained from the data. As stated above, this cannot be done accurately with the data of Waterhouse et al. if model B (Fig. 2) is correct. Indeed, it is precisely because of the difficulty one has in defining components in the curves of metabolic intermediates and end products that most workers who deal with coin- plicated models tend to use curve-fitting computer tech- niques in which the individual component slopes within a complex curve need not be clearly defined. In the special simple cases in which the slopes and intercepts can be defined, and applied validly, then solutions are readily available in published form (38, 41) for any three com- partment model.
( e ) Completion of multicompartmental analyses at the ex- pense of additional assumptions. Finally, the presentation of data is especially noteworthy. After going through a multicompartmental analysis, including presentation of a model and extensive mathematical treatment, Water- house et al. give no estimate of the rate of conversion of plasma FFA to plasma TGFA. The authors recognized correctly that without making additional assumptions, they could not complete their mathematical analysis. I believe that when one is faced with a choice between presenting a clear, hypothetical solution to a problem, at the expense of making an additional assumption, and
presenting an incomplete, equivocal multicompartmen- tal analysis, which is itself based upon numerous assump- tions, that the only consistent decision is to make the additional assumption, to state it clearly, and to com- plete the analysis. Another alternative is to delete the multicompartmental analysis completely because it re- lies upon assumptions. In that case, little progress can be made towards obtaining quantitative information regarding rates of lipid metabolism.
Study 6 (Nikkila et al.; Rats) cf. Study 3 (Baker and Schotz; Rats). ( a ) Experimental design. Several ques- tions of experimental design arise when one compares studies 3 and 6. The authors of study 6 correctly empha- size that a much more accurate analysis may be obtained by using a single animal to obtain complete curves of labeled plasma TGFA after the simultaneous injection of FFA-14C and TGFA-3H than by using separate ani- mals for different times. We would extend this observa- tion to say that, ideally, one should also obtain a com- plete curve of liver TGFA and of plasma FFA from each animal. Neither of these curves were presented in study 6. However, I disagree strongly with the implication that an accurate analysis cannot be made by the use of large numbers of animals, one analysis of each compart- ment per animal being made at each time point to de- fine a function with the accuracy required to estimate rates by multicompartmental analysis and computer techniques. Moreover, if unanesthetized animals are being used, and if liver samples are required, several liver biopsies may be difficult to obtain, and the pro- cedure may introduce artifacts into the experiment due to shock, excitement, and blood loss. If the investigator desires to study T G secretion rather than the complexi- ties of liver T G turnover, then a much simpler experi- ment is required than that employed in either study 3 or 6. This point deserves emphasis, for frequently it is de- sirable and possible to avoid a computer analysis by altering one’s experimental design. Study 3 (Baker and Schotz ; rats) established that the relationship between liver TGFA and plasma TGFA in rats was more com- plicated than the authors were led to believe on the basis of study 1 (Laurell; rats). As a result they had to utilize a complicated model to analyze their data. Had they known of the complications, they would have prepared labeled VLDL-TGFA (or T G glycerol) from one set of rats and injected this tracer into other rats to study the transport of VLDL-TG. No complicated models need to be drawn to carry out the latter study. On the other hand, technical difficulties could arise, such as the de- naturation of lipoproteins during their isolation.
In man, as shown by studies 2 (Friedberg et al.) and 5 (Farquhar et al.), the transport of plasma TG may be estimated by injecting either FFA or glycerol into sub- jects and measuring the early fall of plasma T G radio-
8 JOURNAL OF LIPID RESEARCH VOLUME 10, 1969
by guest, on June 26, 2018w
ww
.jlr.orgD
ownloaded from
activity after it reaches its maximum. This estimation may be subject to serious error for several reasons. I t is not always easy, for example, to define accurately the terminal, declining slope of a substance after its t,,, is reached. The error may be reduced by allowing ade- quate time after the t,,, to define this part of the curve and by taking into account the complexities in the de- clining portion of the curve that could result from re- cycling processes. The VLDL-TG curves are defined much more precisely by the plasma T G data of studies 2 and 5 than by the data of studies 4 (Waterhouse et al.) and 8 (Eaton et al.) because of the shorter duration of study in the latter two cases. The investigator faces prac- tical difficulties, of course, especially when he is studying metabolism in human subjects. However, 3.5 or 4 hr hardly seems sufficient time to define the (fractional) turnover rate of plasma T G which, in subjects on a high carbohydrate diet (study 4), may reach a maximum only after 1 or 2 hr and then decline at a rate of 5% per hr or less.
( 6 ) Model building and data analysis. In study 6 (Nik- kila et al; rats), five compartments were first defined on the basis of the slopes which could be determined, with the aid of a digital computer to carry out a Fourier analy- sis (10) of the plasma TGFA-14C vs. time curve after intravenously injected palmitate-14C. These slopes (time constants) seem to have been used in order to assign fractional rate constants to various lipid pools in liver and plasma. The direct assignment of slopes to the turn- over of individual compartments is not valid in a com- plex model since each slope may be influenced by frac- tional turnover rates of many compartments (see, for example, reference 38). Moreover, no account was taken of the plasma FFA-14C vs. time curve, which has at least three components (8) all of which, theoretically, must be included in the plasma TGFAJ4C curve. (See pre- vious discussion of Waterhouse et al.’s study 4).
Ultimately, the authors used an analog computer to find a set of rate constants that would be consistent with all of their data. This leads one to conclude that the Fourier analysis only served to help formulate an ap- proximate model and that actual values derived from the Fourier analysis were not used to obtain the final solu- tion. Investigators who evaluate slopes and intercepts of their curves, either by “peeling” or by Fourier analy- sis, should be sure to indicate clearly whether these parameters were used in the final evaluation of (frac- tional) rate constants. Furthermore, they should not present a highly complex model, as did Nikkila et al., in which compartments are shown and assigned (frac- tional) rate constants equivalent to the slopes of an ex- perimental curve.
In study 6, newly formed T G is assurned not to ex- change with the large pool of preformed, slowly turning
over T G in liver. Such exchange is assumed to occur in study 3 (Baker and Schotz; rats). Neither study has data that bear on this point; the decision must rest, therefore, upon either published literature or imagination. Presen- tation of the models should stimulate experimentation to resolve the differences.
In study 6, T G is assumed to turn over in the liver only by conversion to PL or by secretion into plasma. No oxidation is considered possible. This conclusion has an experimental basis. Most of the liver T G turnover must go into plasma T G to account for the radioactivity that passes through the latter compartment. Similar results were reported in study 3. However, studies 3 and 6 were both carried out in fed or glucose-refed animals. Dif- ferent results were obtained by Schotz et al. (29) and by Gross et al. (32). They observed that in fasted rats and in fasted dogs receiving glucose intravenously, re- spectively, a large fraction of the hepatic T G turnover was directed to pathways (presumably oxidative) other than secretion. Therefore, the model shown in study 6 should not be considered generally applicable in this respect.
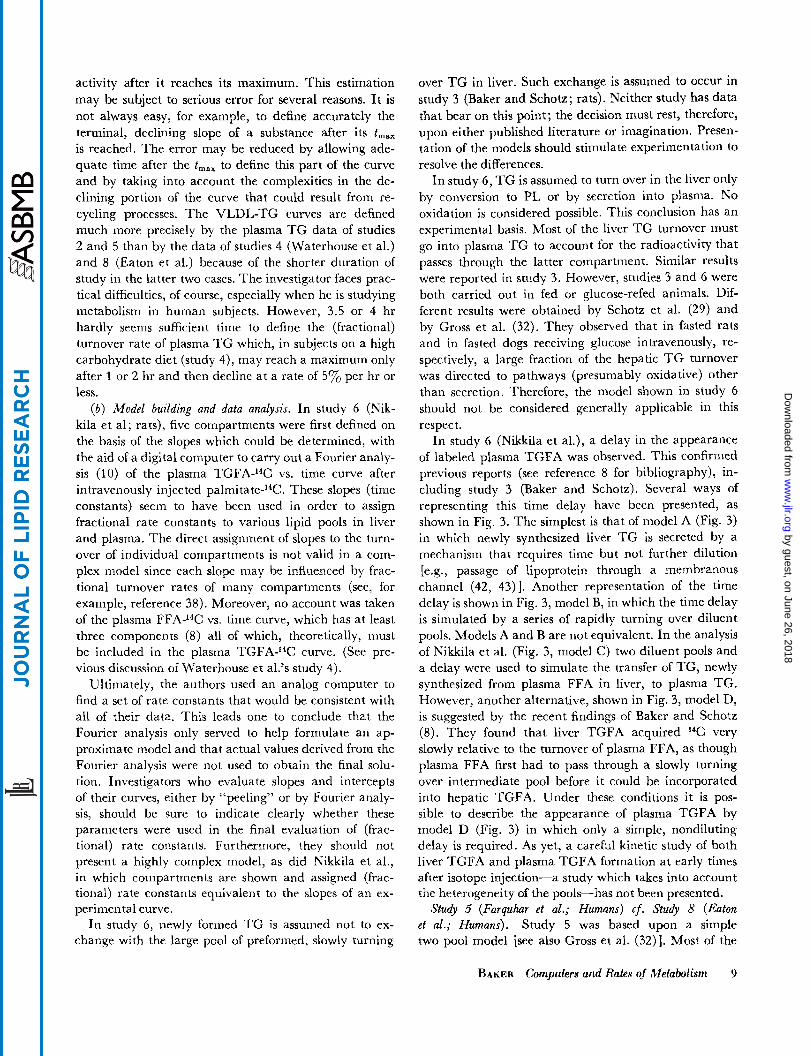
In study 6 (Nikkila et al.), a delay in the appearance of labeled plasma TGFA was observed. This confirmed previous reports (see reference 8 for bibliography), in- cluding study 3 (Baker and Schotz). Several ways of representing this time delay have been presented, as shown in Fig. 3. The simplest is that of model A (Fig. 3) in which newly synthesized liver T G is secreted by a mechanism that requires time but not further dilution [e.g., passage of lipoprotein through a membranous channel (42, 43) 1. Another representation of the time delay is shown in Fig. 3, model B, in which the time delay is simulated by a series of rapidly turning over diluent pools. Models A and B are not equivalent. In the analysis of Nikkila et al. (Fig. 3, model C) two diluent pools and a delay were used to simulate the transfer of TG, newly synthesized from plasma FFA in liver, to plasma TG. However, another alternative, shown in Fig. 3, model D, is suggested by the recent findings of Baker and Schotz (8). They found that liver TGFA acquired 14C very slowly relative to the turnover of plasma FFA, as though plasma FFA first had to pass through a slowly turning over intermediate pool before it could be incorporated into hepatic TGFA. Under these conditions it is pos- sible to describe the appearance of plasma TGFA by model D (Fig. 3) in which only a simple, nondiluting delay is required. As yet, a careful kinetic study of both liver TGFA and plasma TGFA formation a t early times after isotope injection-a study which takes into account the heterogeneity of the pools-has not been presented.
Study 5 (Farguhar et al.; Humans) cf. Study 8 (Eaton et al.; Humans). Study 5 was based upon a simple two pool model [see also Gross et al. (32)]. Most of the
BAKER Computers and Rates of Metabolism 9
by guest, on June 26, 2018w
ww
.jlr.orgD
ownloaded from
- REFERENCE: MODEL
+ PLASMA
B) FFA
Study N o . 3 A) p g i M A d T l [IO’ 1 = (Baker 8, Schotz)
DELAY
- - PLASM
+ - t
I 1 L - 1
IO’ DELAY 3
Study No. 6 (Nikkila et 0 1 .)
MINOR PATHWAY _ _ _ _ _ _ _ - - - - - - - r - - D, FFA + Study N o . 7
(Baker 8, Schatzj
FIG. 3. Various ways in which time delays in the secretion of plasma TG have been simulated. The com- partment shown with an “X” is that portion of liver TG which is formed from plasma FFA and which serves as a precursor for plasma VLDL-TG. Interrelations between compartment X and other liver TG compartments are not shown.
data were obtained from only one compartment, plasma VLDL-TG. Limited liver biopsy data were also used. No computer was used to analyze the data (see “Avoid- ance of multicompartmental analysis”). However, the logic that the authors used is illustrative of the thinking processes usually involved in the initial stages of model building and in the formulation of initial estimates prior to a multicompartmental analysis. The paper is also pertinent to a subsequent study (Eaton et al., study 8) of TG synthesis and secretion in human subjects in which a computer was required in order to interpret the data.
(a) Humans us. rats: requirement f o r dgerent models of plasma TG turnover. In study 5, Farquhar et al. present data in support of the conclusion reached by Friedberg et al. (study 2) that the turnover rate of plasma TG in human subjects is extremely low compared to the values previously reported for other species such as the rat. As noted below, Farquhar et al. (31) took advantage of this special kinetic behavior. First, they recognized that not only was the turnover rate of plasma T G low in human subjects, but that it was much lower than the turnover rate of the hepatic pool of precursors for TG. Second, they realized that in this special case, the turnover rate of plasma TGFA could be calculated in a much simpler fashion than was the case in the rat (see “Avoidance of multicompartmental analysis”). A similar point had been made by Friedberg et al. in study 2; however, in
the latter study, liver TGFA was treated as part of the plasma TGFA pool rather than as a separate precursor Compartment. An accurate description of TG turnover in the liver of human subjects is extremely difficult because of the limitations to the number of biopsy speci- mens that can be obtained. The only attempt to define liver T G turnover in humans has been the study of Farquhar et al. (31). Single liver biopsies were obtained from each of several subjects in study 5. The liver TG Sp. A. of each liver sample was compared with that of VLDL-TG. The relationships were consistent with a model of TG metabolism in humans that differs very markedly from that used to describe TG secretion in rats (study 8). The very important difference between the models for experimental animals (e.g., study 3) and for humans (study 5) is that the liver TG precursor pool apparently turned over very rapidly in the subjects of study 5 and only a small fraction of the pool that turned over was secreted into the circulation as VLDL-TG. However, in a subsequent study in human subjects (study 8), the investigators assumed that no outlet from the hepatic TG precursor compartment exists other than secretion of TG into plasma.
( b ) Recycling of TGFA. When plasma TGFA-I4C is formed from FFA-’*C, the declining curve is multi- exponential (18, 28). Farquhar et al. have reported similar results for VLDL-TGFA (31) ; however, they
10 JOURNAL OF LIPID RESEARCH VOLUME 10, 1969
by guest, on June 26, 2018w
ww
.jlr.orgD
ownloaded from

have shown that this complicated kinetic behavior is not observed if labeled glycerol is used as the precursor of VLDL-TG. In the latter case, the declining portion of the curve is more nearly monoexponential. The au- thors interpret this to mean that the glycerol moiety is not recycled appreciably into hepatic T G when the latter is hydrolyzed, but that the FA moiety is recycled. They point out that labeled glycerol is a better precursor for studying plasma T G formation and utilization be- cause complications due to recycling may be largely eliminated. As yet, no one has taken advantage of this interesting observation by carrying out a simultaneous multicompartmental analysis of T G turnover in liver and plasma with both FFA and glycerol as tracers so that the extent of FA recycling from and into hepatic T G may be quantified. Such a study should include care- ful measurement of the labeled precursor (FFA and glycerol) in plasma throughout the experiment since the kinetic properties of the precursor contribute to the complexities of the declining portion of the plasma T G curve and must be taken into account. The only practi- cal way of carrying out the above study is by means of a computer analysis.
(c) Heterogeneity of the plasma TG compartments. Al- though several authors have treated plasma TGFA as though i t were a single, homogeneous compartment (studies 1-4, 6-8), this introduces an error in estimates of turnover rates. As shown by Havel, Felts, and Van Duyne (14), the T G that are associated with different claeses of lipoproteins are replaced at different rates. The study of Farquhar et al. (31) takes this observation into account by separating VLDL-TG from other classes of lipoproteins prior to measurement of pool sizes and turnover rates.
Complexitiy of Jfodels Study 8 (Eaton et al.) is an especially interesting ex- ample of model building and computer analysis with curve-fitting techniques. The authors contend that the model they present is the simplest model that is con- sistent with their data. One of the tacit rules of multi- compartmental analysis is that the simplest model that is consistent with the data and with other published in- formation should serve as the basis of the computations. In seeking a “simplest model” the authors must have faced several problems, for there are several “simplest models” they could have drawn. For instance, they show VLDL-TG giving rise to plasma FFA by way of two small intermediate compartments neither of which has any other exits. If one imagines that the latter two compartments are involved not only in TGFA recycling, but in the hydrolysis of TGFA to FA prior to the uptake of TGFA into extrahepatic tissues, then at least one
additional arrow should be shown going out of one of the intermediary pools (instead, perhaps, of going out of the plasma VLDL-TG compartment). Moreover, the authors have had to ignore a large amount of data indicating that the liver TGFA pool is probably more complex than they have shown. However, this does not detract from their analysis. The number of compart- ments that may be analyzed in detail in human sub- jects is limited, and the authors are restricted to an analysis in which the number of compartments, rate constants, and “cold” (nonradioactive) influxes intro- duced is the minimum required for compatibility with the data.
In Fig. 4, I have drawn models that were either used in or suggested by studies 2-8. In those studies in which a series of compartments have been inserted simply to simulate a delay, the word “delay” has been substituted to avoid misunderstandings. The models are arranged in order of increasing complexity. Most of the com- plexity of the model used in study 6 (Nikkila et al; rats), as noted previously, is not indicated by the data. This may also be said with respect to several of the arrows introduced in studies 3 and 7 (Baker and Schotz; rats). The data in these latter studies did not allow one to de- cide whether or not the rapidly and slowly turning over pools of TG actually exchanged with each other, whether TGFA could exit from both liver T G pools as shown (for instance by hydrolysis), and whether newly synthe- sized TGFA entered both liver T G compartments. How- ever, the authors chose to introduce the extra arrows and to deviate from “the simplest model” principle in order to call attention to their lack of knowledge about these interrelationships. Moreover, they wished to indicate that there must be a pathway for the mobilization of slowly turning-over fat droplets, that T G is probably synthesized not in fat droplets but in other sites and then incorporated into fat droplets, and that the incorporation of FFA into PL and T G and the transfer of PLFA into TGFA most probably involve some rapidly turning- over intermediate esters such as lysolecithin and di- glycerides. Perhaps the last model shown in Fig. 4 (studies 3 and 7, Baker and Schotz) should be simplified by eliminating one cold inflow and one outflow from liver T G pool B and by deleting the small liver “inter- mediate ester pool.” As a result, five arrows representing transport would be removed from the model. The as- sumptions and simplifications could be discussed and at the same time a simpler model could serve as a basis for the actual computations. Obviously, there is con- siderable room for subjective modifications of such com- plex models. This is not a serious problem as long as one bears in mind that this model is intended as a working hypothesis. Usually some degree of consistency may be reached by striving towards the simplest model that is
BAKER Computers and Rates of Metabolism 11
by guest, on June 26, 2018w
ww
.jlr.orgD
ownloaded from

SPECIES
HUMANS
HUMANS
HUMANS
HUMANS
RATS
RATS
STUDY MODEL
N O . 4 PLASMA /-+[ F F A t LIVER TG I* +-PLASMA TG t
SLOW YT GLYCEROL LIVER TG t PLASMA TG t
(SMALL UNLABELED LIVER TG POOL ALSO EXISTS .)
Y f X
SYSTEM
COLD INFLUX
\ \ f r l N O . 3 PLASMA F F A t
f
f COLD INFLUX
SPECIES STUDY MODEL
RATS NOS. 3 a 7 7
/ LIVER NON-TG ESTERS
ESTERS (SMALL POOL)
PLASMA FFA
EXTRAVASCULAR FFAA LIVER TG
J INFLUX PLASMA
TG t
FIG. 4. (Nos. 2-8) are shown in Table 1 and discussed in the text.
Models that have been utilized to study rates of plasma TGFA formation in various species. References to the various studies
* Not shown in this form by the authors; the model is inferred from statements made in the text of study 2. + Not evaluated in the analysis. 3 The integrated model, which was derived by combining studies 3 and 7, has not been used for a multicompartmental analysis.
compatible not only with the data but also with other published observations.
General Comment Regarding Reliability and Val id i ty of Data A crucial aspect of rnulticompartrnental analysis must be consideration of the reliability and validity of the data presented. Since human subjects were used in study 5 (Farquhar et al.), only one liver biopsy could be ob- tained safely from each patient. Nevertheless, the liver biopsy data seem to be in rather good agreement with predictions based upon models that were constructed in the absence of liver biopsy data. However, the inter- pretation of these data attaches a great deal of weight to just a single, measured value of liver T G Sp. A. at the t,,, of plasma VLDL-TG. In study 1 a similar relation- ship, in which liver T G Sp. A. a t t,,, of plasma VLDL- T G Sp. A. equaled the latter, was suggested. However, in other studies (14, 18, 32, 44) in which complete liver T G Sp. A.-time curves were obtained, this relationship was not observed. In rats and dogs the liver T G Sp. A.
is much lower than the plasma T G Sp. A. a t its maxi- mum.
Little attention has been given to another possible error in all of the above studies in which liver TG radio- activity was measured. Most authors have assumed that liver TGFA-14C is present within the parenchymal cells. However, considerable evidence indicates that plasma TGFA that are taken up by the liver may be located extracellularly, perhaps adsorbed to the parenchymal cells (45, 46). Corrections for extracellularly located hepatic T G (as distinct from corrections for trapped blood) may be made by isotopic experiments such as those presented by Schotz, Arnesjo, and Olivecrona (17) and by Olivecrona and Belfrage (47). Multiconipart- mental analyses based upon such corrected data have not been reported.
Similarly, concern with the validity of data in un- anesthetized and anesthetized rats is in order, since the effects of both excitement and of anesthetic agents may introduce serious artifacts (e.g., 48, 49). Other possible artifacts have been listed in study 7.
12 JOURNAL OF LIPID RESEARCH VOLUME IO, 1969
by guest, on June 26, 2018w
ww
.jlr.orgD
ownloaded from
PHOSPHOLIPID METABOLISM I have been unable to find any published studies of rates of PL metabolism in which multicompartmental analyses by computer techniques have been carried out. I have selected for discussion two studies (studies 9 and 10) because they illustrate two interesting aspects of computer analysis. Neither approach was used in any of the eight studies discussed in the previous section. Although computers were used in both studies, in each case the authors have approached their problem by re- ducing their analysis to two-compartment models. In one case (study 9) a four-compartment model is treated in a way that might preclude any possible attempt to measure some of the most important physiological parame ters.
Study 9 Shore and Callahan (34) have carried out an interesting study of lecithin-P synthesis and breakdown in normal dogs. They injected native 32-P-labeled PL and measured l e ~ i t h i n - ~ ~ P Sp. A. vs. time in plasma, liver, and several extrahepatic tissues. They observed a biexponential curve of plasma lecithin Sp. A. vs. time. They show, with a hydrodynamic analog computer, that a four-compart- ment model in which plasma is interconnected with three tissue compartments may behave like a two-compartment model (plasma plus all tissues lumped). However, as the authors point out, this is true only for certain very special cases. Using one such special case, they argue that the rates of tissue lecithin synthesis and breakdown may be calculated simply by using a two-compartment model and the plasma lecithin Sp. A. and pool size data. They then carry out these calculations to conclude that, con- trary to the view of some earlier workers, extrahepatic tissues play an important role in the metabolism of plasma lecithin. In addition to this experimental kinetic study, the authors present a systematic theoretical study of the effect of varying each parameter in a hypothetical two-pool, plasma lecithin-tissue lecithin model. Sp. A.-time curves for each of the two compartments were calculated by equations which were programmed for an IBM 1620 digital Computer.
Several features of this analysis deserve special com- ment. First of all, the study illustrates clearly how useful computers may be in predicting curves in various com- partments and how these curves are affected by changes in rates and pool sizes. Although Shore and Callahan used a hydrodynamic analog computer, electrical analog and digital computers are much faster and easier to use for this purpose. Other examples are given in studies which are discussed below (20, 50). Second,the authors made a serious error in their theoretical study of the effect of varying the plasma lecithin pool size upon the plasma lecithin Sp. A. As they enlarge the size of the
plasma pool, other parameters remaining constant, they observe that the plasma curve shifts from a biexponential function to a monoexponential function. They interpret this to mean that little recycling occurs when the first pool is enlarged. This is incorrect. Recycling has not been varied. The difficulty is that the (fractional) turn- over rate of the plasma pool has been reduced to such a low level that the time scale chosen for study is no longer appropriate if one wishes to see the recycling compo- nent, which would only appear much later. I emphasize this because one of the best uses of computers is to pre- dict curves before doing an experiment so that the chances of obtaining data at appropriate times are in- creased. Third, it would have been most interesting for the authors to have used their four-compartment, hydro- dynamic analog computer to show that it would be pos- sible to simulate their tissue lecithin Sp. A. data as well as the plasma lecithin Sp. A.-time curve without having to assume, as they did, that there is no net transport of lecithin either from liver to plasma or from plasma to extrahepatic tissues. Fourth, the latter assumption should be avoided whenever possible. By assuming that net transport was nil, the authors immediately excluded any possibility of determining what the flux might be. At present, one of the most difficult problems of lipid me- tabolism is the differentiation between exchange and net transport. This problem has been discussed with respect to cholesterol (51, 52), FFA (4, 8, 15), TG (8, 15), and PL metabolism (34, 53). Fifth, the authors did not use their tissue data in order to carry out their calculations. Much valuable information is contained in these data. Because they lumped their complicated data into a sim- ple model, the authors were not able to deal with many aspects of lecithin transport and exchange that should have been taken into account. Finally, if one decides to estimate the net transport rate [irreversible disposal rate (11-13)] of a substance in plasma such as lecithin, it is not necessary to go through the complicated ap- proach of study 9, using hydrodynamic models to prove that this can be done for a particular case, In a single in- jection experiment the net transport rate of a substance in plasma, regardless of the number of pools or the com- plexity of the interconnections between compartments, is always a function of the area under the curve defining radioactivity of the substance in plasma vs. time and its pool size. In some cases, e.g. lecithin metabolism, it may also be necessary to know the ratio of the plasma lecithin pool size to the lecithin pool size in those tissues that synthesize lecithin.
Study No. 10
Wise and Elwyn (20) have carried out an extensive study of PL synthesis from 14C-labeled serine in the rat. After injection of serineJ4C they measured the Sp. A. of each of
BAKER Computers and Rates of Metabolism 13
by guest, on June 26, 2018w
ww
.jlr.orgD
ownloaded from
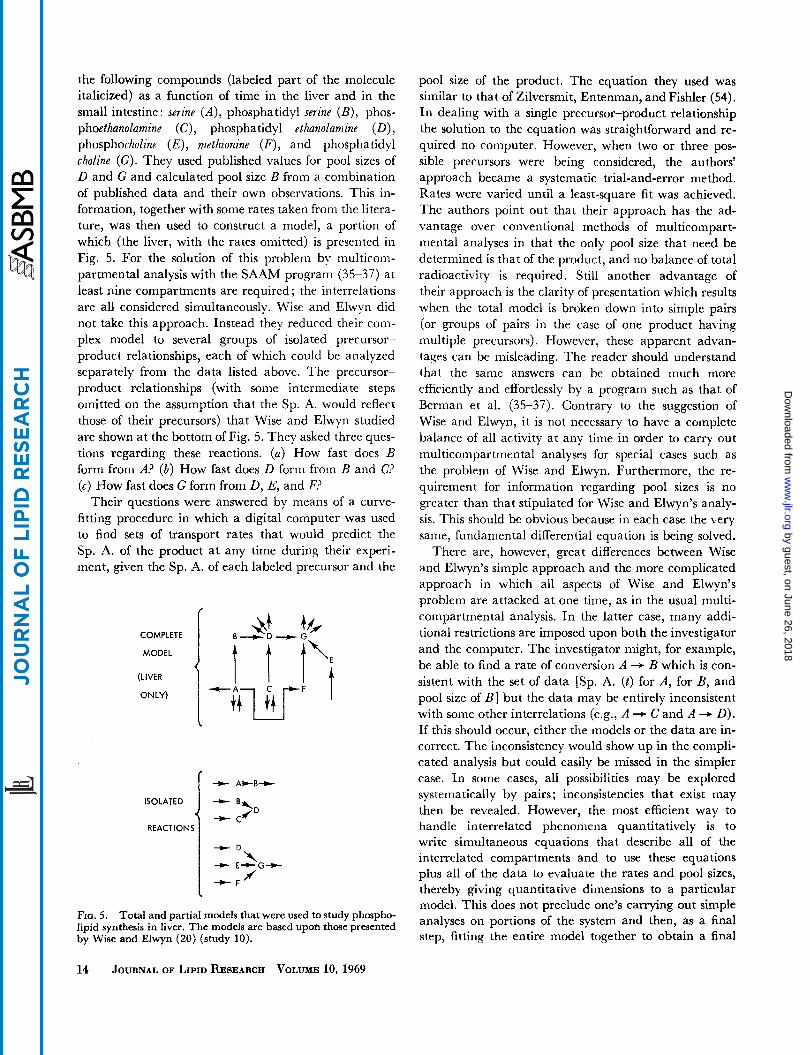
the following compounds (labeled part of the molecule italicized) as a function of time in the liver and in the small intestine : Jerine ( A ) , phosphatidyl serine (B) , phos- phoethanolamine (C), phosphatidyl ethanolamine (D), phosphocholine (E) , methionine ( F ) , and phosphatidyl choline (G). They used published values for pool sizes of D and G and calculated pool size B from a combination of published data and their own observations. This in- formation, together with some rates taken from the litera- ture, was then used to construct a model, a portion of which (the liver, with the rates omitted) is presented in Fig. 5 . For the solution of this problem by niulticom- partmental analysis with the SAAM program (35-37) at least nine compartments are required ; the interrelations are all considered simultaneously. Wise and Elwyn did not take this approach. Instead they reduced their com- plex model to several groups of isolated precursor- product relationships, each of which could be analyzed separately from the data listed above. The precursor- product relationships (with some intermediate steps omitted on the assumption that the Sp. A. would reflect those of their precursors) that Wise and Elwyn studied are shown a t the bottom of Fig. 5. They asked three ques- tions regarding these reactions. (a) How fast does B form from A? ( b ) How fast does D form from B and C? (c) How fast does G form from D, E, and F?
Their questions were answered by means of a curve- fitting procedure in which a digital computer was used to find sets of transport rates that would predict the Sp. A. of the product a t any time during their experi- ment, given the Sp. A. of each labeled precursor and the
MODEL
(LIVER
t A + B t
+ C REACTIONS
FIG. 5. Total and partial models that were used to study phospho- lipid synthesis in liver. The models are based upon those presented by Wise and Elwyn (20) (study 10).
pool size of the product. The equation they used was similar to that of Zilversmit, Entenman, and Fishler (54). In dealing with a single precursor-product relationship the solution to the equation was straightforward and re- quired no computer. However, when two or three pos- sible precursors were being considered, the authors’ approach became a systematic trial-and-error method. Rates were varied until a least-square fit was achieved. The authors point out that their approach has the ad- vantage over conventional methods of multicompart- mental analyses in that the only pool size that need be determined is that of the product, and no balance of total radioactivity is required. Still another advantage of their approach is the clarity of presentation which results when the total model is broken down into simple pairs (or groups of pairs in the case of one product having multiple precursors). However, these apparent advan- tages can be misleading. The reader should understand that the same answers can be obtained much more efficiently and effortlessly by a program such as that of Berman et al. (35-37). Contrary to the suggestion of Wise and Elwyn, it is not necessary to have a complete balance of all activity at any time in order to carry out rnulticompartmental analyses for special cases such as the problem of Wise and Elwyn. Furthermore, the re- quirement for information regarding pool sizes is no greater than that stipulated for Wise and Elwyn’s analy- sis. This should be obvious because in each case the very same, fundamental differential equation is being solved.
There are, however, great differences between Wise and Elwyn’s simple approach and the more complicated approach in which all aspects of Wise and Elwyn’s problem are attacked at one time, as in the usual multi- compartmental analysis. In the latter case, many addi- tional restrictions are imposed upon both the investigator and the computer. The investigator might, for example, be able to find a rate of conversion A + B which is con- sistent with the set of data [Sp. A. ( t ) for A , for B, and pool size of B ] but the data may be entirely inconsistent with some other interrelations (e.g., A -P C and A + 0). If this should occur, either the models or the data are in- correct. The inconsistency would show up in the compli- cated analysis but could easily be missed in the simpler case. In some cases, all possibilities may be explored systematically by pairs ; inconsistencies that exist may then be revealed. However, the most efficient way to handle interrelated phenomena quantitatively is to write simultaneous equations that describe all of the interrelated compartments and to use these equations plus all of the data to evaluate the rates and pool sizes, thereby giving quantitative dimensions to a particular model. This does not preclude one’s carrying out simple analyses on portions of the system and then, as a final step, fitting the entire model together to obtain a final
14 JOURNAL OF LIPID RESEARCH VOLUME 10. 1969
by guest, on June 26, 2018w
ww
.jlr.orgD
ownloaded from

solution that is compatible with all of the data. In fact, analyzing two- and three-compartment models, prior to the analysis of a larger system in which they are to be included, is extremely useful when the investigator is studying highly complicated systems with which he has had little previous experience.
OXIDATION OF LIPIDS
Many studies of the oxidation to COZ of various lipids have appeared in the literature ; however, relatively few studies have relied upon computers to calculate oxidation rates. Among these, I shall discuss the papers of Eaton (55), Waterhouse and Kemperman (56), Havel, Ekelund, and Holmgren (50), and Baker and Schotz (8), who have used various models and approaches to estimate the rates of FFA oxidation in humans and in experimental animals.
Estimation of the rate of COZ formation from FFA requires knowledge of the FFA pool size and (fractional) turnover rate, plus measurement of radioactive COz after injection of FFA. In addition, most workers have mea- sured total rate of COZ expiration. This additional experi- mental information allows one to calculate the fraction of the total COS output which is derived from FFA oxida- tion. Several investigators have also estimated the kinetic behavior of the plasma or body bicarbonate pool by injecting tracer bicarbonate and measuring 14C02 in breath as a function of time. This measurement, when coupled with the other observations, permits one to gain some additional insight with respect to the turnover of intermediate pools between plasma FFA and plasma bicarbonate. Moreover, if the model is more complicated than several authors have assumed, measurement of plasma bicarbonate turnover may be necessary in order to estimate the rate of FFA oxidation to COT. The reader should consult the recent paper by Shipley, Chudzik, Gibbons, Jongedyk, and Brummond (13) in which the rate of glucose oxidation to COZ in rats was calculated by a method that did not require information about the bicarbonate pool. Moreover, the authors suggest a way of calculating the total rate of COz excretion-isotopic and nonisotopic-without actually measuring COZ expiration rate experimentally. The equation they pre- sent is incorrectly stated and should be modified as follows :
moles C 0 2 expired/min = (yo of injected 14C expired in
time, t ) / Sp. A.C02 (t)dt s,’ Sp. A.coz (t) = (% of injected 14C/(mole C 0 2 at any
time, t )
where t = min after injection of tracer.
Eaton has estimated the fraction of FFA turnover that is directed towards COZ formation in human subjects
(55). He analyzed the data of Fredrickson (FFA turn- over in plasma and l4COZ formation from injected FFA) and of Segal (bicarbonate turnover) with a digital com- puter and the SAAM program (35-37). Eaton’s pre- sentation is enlightening for several reasons. First of all, the emphasis is upon the multicompartmental analysis rather than upon experimental details. I t may serve, therefore, as an introduction to those who are unfamiliar with multicompartmental analysis and with the SAAM program. Secondly, the presentation of the bicarbonate pool kinetics is unusual and warrants additional discus- sion, for a reader who is unacquainted with the SAAM program will probably find Eaton’s presentation of the bicarbonate pools (Fig. 5 of reference 55) baffling.6
The theoretical approach used by Eaton has had an interesting historical development, summarized in Table 2. The body bicarbonate pools were first ignored, then treated simply and probably incorrectly. Later, the bicarbonate pools were treated in a complex manner or considered so hopelessly complex that rates of oxida- tion in vivo could never be calculated from experiments using the single-injection technique. However, the realization that COZ that has formed intracellularly probably does not mix with intracellular bicarbonate before entering the plasma bicarbonate pool simplified the problem once again, for the bicarbonate pools could now be treated as simple mathematical functions. In order to avoid confusion between compartments that have a physiological counterpart and those that are purely function generators, several authors have used a special symbolism. Eaton (55) has incorporated into his physiological model two nonphysiological compart- ments,6 which simulate the mathematical functions that describe the kinetic behavior of the bicarbonate pools. The inclusion of function generators in this way should be extremely helpful, provided the authors use symbols to distinguish compartments that correspond to physio- logical entities from those that do not. Baker and Schotz (8) replaced the mathematical function describing the complex kinetics of plasma bicarbonate by a bracket inserted into the physiological model. They also noted separately the assumption that COz formed from oxida- tion of metabolic fuels entered the plasma bicarbonate pool before being expired as breath COz and before mixing with intracellular bicarbonate. Most authors,
6 Part of the problem stems from the incorrect labeling of Eaton’s Fig. 5, in which pool F is identified as the total radioactivity ex- pired and pools D and E as “the bicarbonate pool.” .4ctually com- partments D and E are mathematical representations which are used to simulate the plasma bicarbonate kinetic behavior. Neither D nor E represents a physiological compartment. Pool F is a “summer” compartment (note the use of lines instead of arrows and a triangle instead of a circle) and represents the sum of the radioactivity in compartments D and E at any time. Therefore, pool F represents the plasma bicarbonate pool (a physiological compartment).
BAKER Computers and Rates of Metabolism 15
by guest, on June 26, 2018w
ww
.jlr.orgD
ownloaded from

TABLE 2 CHANGING CONCEPTS OF THE BODY BICARBONATE POOLS IN MODELS USED TO CALCULATE OXIDATION RATES OF
METABOLIC FUELS IN VIVO (SINGLE-INJECTION TECHNIQUE)
Author (and References) Concept
Zilvrrsmit et al. (57); Feller et al. (58)
Baker et al. (59)
Kornberg et al.* Steele* Robinson and Coxon* Drury et al.* Baker et al. (60), Shipley,
et al. (61)
5. Segal et al. (62)
6.
7.
Eaton (55) Baker 8r Schotz (8) Stephenson (63) Berkowitz et al. (64)
Shipley et al. (13)
Bicarbonate pool ignored.
Plasma-body bicarbonate as one
Bicarbonate pool complex. well-mixed pool.
I4CO2 formed from a labeled meta- bolic fuel intracellularly is as- sumed to enter plasma bicarbon- ate before it mixes with intra- cellular bicarbonate. Further- more, any inflow from a meta- bolic fuel into plasma bicarbon- ate is assumed to behave kinet- ically as tracer bicarbonate would be if injected intraven-
Same treatment as Baker et al. (60), but deemphasis of the bicarbon- ate pool except as a mathemati- cal function. Interconnecting compartments not identified, ex- cept for the compartment which includes plasma bicarbonate.
Further deemphasis of the bicar- bonate pools by means of special symbols. No interconnections of pools shown. Compartments rep- resent mathematical functions only (55) or compartments are not shown at all in the multi- compartmental model (8).
Bicarbonate pool kinetics need not be determined (special case).
ously.
~~~~
* See Shipley et al. (61) for references.
recently, have tended to accept the assumption that newly formed C02 will be mixed and expired in the same way as tracer bicarbonate injected into plasma (Table 2).
Another aspect of Eaton’s analysis which deserves coniment is the inclusion of an intermediate pool (“tissue dilution”) between plasma FFA and the body bicarbon- ate compartments.
Plasma FA - X S F F A -f Tissue +
s. dilution Body Breath bicarbonate + CO, compartments (via plasma bicarbonate)
The presence of this intermediate compartment is estab- lished indirectly for there is no way to obtain a breath I4CO2 curve such as that observed after injection of FFAJ4C, given the kinetic behavior of the plasma FFA-
14C curve and of the plasma bi~arbonate-’~C curve (after injection of tracer bicarbonate), unless an intermediate pool is included. However, the representation of this pool may take various forms: it may recycle FFA back to plasma; it may have an outlet; it may be subdivided into smaller compartments. The influence of the intermediate compartment and how it is depicted upon the rates of FFA oxidation to COZ will be discussed below. However, Eaton’s model represents the simplest model that is con- sistent with the data.
Waterhouse and Kemperman have studied the effect of ingested glucose upon the rate of oxidation of FFA to CO, in human subjects (56). Their paper is worth careful study by those who intend to evaluate the oxidation rate of a metabolic fuel. Most of the pertinent pool sizes, radioactivity after injection of FFA-14C and bicarbonate- 14C, and rates of COZ expiration were measured. How- ever, the reader should note the following.
(u) The model drawn does not indicate that recycling of FFA was taken into account. (In fact, it was; personal communication.)
( b ) The ordinates of the breath 14C02 curves are incorrectly labeled. They should all read “yo of injected dose per hour” instead of “yo injected dose.”
(c) The early component of the bicarbonate pool turnover was not taken into consideration. This need not influence the estimated rates of FFA oxidation if one uses the particular model employed by the authors. Their model includes an intermediate “black box” with no outlets other than oxidation to COZ. The (fractional) turnover rate that was assigned to the “black box” can be varied to compensate for errors in the (fractional) turnover rate of the bicarbonate pool(s).
(d) The authors imply that it is necessary to define the kinetic behavior of the bicarbonate pool after injection of bicarbonate in order to calculate the rate of oxidation of labeled FFA to COZ. If one accepts their model, this is not the case, as evidenced by the fact that the authors were able to present values for the (fractional) turnover rate of plasma bicarbonate, which they derived from experiments in which only tracer FFA was injected.
( e ) No data are presented for the individual subjects (except one sample case) or for the average of the sub- jects. Therefore, reevaluation of the data is difficult, if not impossible. In order to simplify a presentation or to keep the length of a publication within conventional limits, editors often encourage authors to delete important data or the results of multicompartmental analyses. Both authors and editors should be careful to include data on individual subjects if calculations based upon these data are to be presented.
Another example of the use of computers to study FFA oxidation is that of Have1 et al. (50). Here an analog computer was used to evaluate the fractional rate con-
16 JOURNAL OF LIPID RESEARCH VOLUME 10, 1969
by guest, on June 26, 2018w
ww
.jlr.orgD
ownloaded from

stants describing the flow of 14C from plasma FFA to expired COz in exercising human subjects. Two aspects of their presentation deserve special emphasis. First, their model could be misleading since it shows all plasma FFA being oxidized by way of pools that turn over very rapidly or moderately fast. Although this may be true during exercise, in the resting state another exit should be shown to indicate conversion of FFA to very slowly turning over pools. It might have been preferable for the authors to have indicated that they considered the possibility of an “irreversible” exit, other than to COZ, and that its (fractional) turnover rate was calculated to be approxi- mately zero during exercise. Recycling of FFA might also have been depicted in their model; the authors discussed the recycling process in the test. Second, the authors presented a figure in which they showed the effect of varying the number of compartments and some of the (fractional) rate constants upon the “goodness of fit.” This can be done very readily by analog computer [e.g., see (20)] and frequently editors ask that this type of evaluation be included in a multicompartmental analysis. However, the evaluation may be extremely misleading, for increasing one (fractional) rate constant by 10% may alter the fit (calculated vs. observed ), but simultaneous alteration of one or more other rate constants may permit a fit again. I t is almost impossible for an analog computer to be used to evaluate the effects of various combinations of rate constants upon the “goodness of fit” in a complex model. I t is even more difficult to communicate a careful, meaningful evaluation, even if one were to be carried out, More publication space would be required than for the main body of the paper, and the reader would be dis- tracted from the physiological problem which an author has studied. The SAAM program may be used to obtain (u) a correlation matrix which may be used to evaluate how each (fractional) rate constant is influenced by varia- tion of another rate constant, and ( b ) standard deviations for each rate constant. The calculated standard devia- tions are a far more valid index of the accuracy of the estimated rate constants than are the simple relationships that can be conveniently evaluated by analog (or digital) compu ter .
Baker and Schotz have presented a complex analysis of FFA metabolism and oxidation in fasted rats (8). They used the SAAM program (35-37). Emphasis was placed upon verification of the model by direct tissue analysis. They were also concerned with the uncertainties in the model and with the manner in which complexities of recycling, exchange, and outflows form intermediary pools may influence various rates. Their model is the most complex that has been employed to calculate rates of FFA oxidation in vivo. Nevertheless, their model is still highly oversimplified, and their approach must be considered very primitive.
Measurement of respiratory l4COZ, coupled with other analyses, may also be used to evaluate the relative signifi- cance of alternative oxidative pathways. Stephenson (63) has suggested, for example, how a digital computer niay be employed to calculate the proportion of chylomicron TGFA oxidized to COS by way of plasma FFA. His mathematical approach involves a process called “con- volution” (27). It differs from the procedures used in most multicompartmental analyses in that integral equations are used to describe the system being studied. One aspect of the treatment is to minimize concern for intermediate steps and details such as reversible fluxes. In this respect the treatment is similar to “black-box” (see Definitions) approaches.
Berkowitz, Sherman, and Hart have applied this technique to study, in humans, one step in cholesterol synthesis, the decarboxylation of mevalonic acid (64). In their analysis, the biochemical measurement which one would most like to determine, the amount of meva- lonic acid decarboxylated per unit of time was not attempted. Instead, the emphasis was placed upon the tracer rather than upon the substance being traced. Interpretation of their results relied upon the calculated fraction of the injected 14C that was oxidized to l4COZ during a given time interval. Data presented in this form rarely have any meaning except in experiments in vitro, where dilution factors can be controlled or evaluated. A more meaningful interpretation could have beenobtained if the experiment had been incorporated into a larger study which related 14C02 formation to the turnover and dilution of mevalonic acid itself. Without such informa- tion, it is difficult to see how the authors reached some of their conclusions. For example, they concluded that “certain steps in the biosynthesis of cholesterol, specifi- cally the conversion of MVA (mevalonic acid) to squalene are occurring at a more rapid rate in the intact human than prior studies, using labeled precursors, could clearly indicate.” This is most probably the result of differential dilution and (or) selectivity of tissue uptake of tracer.
Hart has cited other examples of the use of integral equations and has suggested that a combination of in- tegral and differential equations may be employed to study complex models (65). This technique, which re- quires extensive experimental data, may provide a maxi- mum of information about intermediate and side reac- tions in a complex system and yet avoid some of the as- sumptions which are associated with the conventional multicompartmental analysis.
COMPUTER-ORIENTED Vs. NONCOMPUTER TECHNIQUES FOR MEASURING RATES OF OXIDATION
OF METABOLIC FUELS
Constant-infusion type experiments, such as those carried out by Searle, Strisower, and Chaikoff (66 ) ,
BAKER Computers and Rates of Metabolism 17
by guest, on June 26, 2018w
ww
.jlr.orgD
ownloaded from

Armstrong et al. (67), and others are not discussed here since, in its usual form, this approach is intended to simplify mathematical analysis and does not require the use of computers. The information one obtains by the constant-infusion method is basically the same as that obtained by the single-injection technique. In its simplest form, the constant-infusion technique relates asymptotic (steady state) Sp. A. to rates of tracer infusion or to other asymptotic Sp. A. This simple approach usually does not provide information regarding mixing, recycling, and time delays, which may be studied more readily by the single-injection technique or by combined single- injection and constant-infusion of tracer.
Many fine studies of metabolic fuels and their oxida- tion to COZ have been published. Most of these have not involved computers, and most of our present-day con- cepts have developed without the aid of computers. Even complicated multicompartmental analyses of glucose oxidation to CO2 in which no computer was employed have been published (60). The reader may wonder, then, what insight and new information has been or can be gained by the use of computers.
One advantage of the computer, of course, is speed. Complete multicompartmental analyses of data obtained from individual animals can be carried out in one day whereas computations carried out by hand may take weeks. Moreover, some problems may be attacked which could not be handled by noncomputer techniques be- cause of the difficulties in and time required for computa- tion. Despite the obvious and important advantage of speed, few striking contributions in the field of lipid metabolism have been made thus far which can be at- tributed to the availability and application of computer technology. But there is a less obvious advantage of com- puter analysis, which can be expected to be of great significance in the future. Many complex biochemical problems have been dealt with superficially and often incorrectly. As one attempts to attack complex problems by multicompartmental analysis one’s assumptions and areas of ignorance are given special prominence. The investigator is almost forced to consider problems of dilution which so often were ignored in early radioisotopic studies. Even now, papers are frequently published in which the percentage of injected tracer recovered as 14C02 in breath is presented without any consideration of pool sizes and without any attempt to relate the radio- activity in breath l4CO2 to the turnover of the substance being traced. Investigators who employ multicompart- mental models are less likely to lose sight of their problem because they have been forced to formalize their assump- tions. Moreover, they are less likely to draw invalid conclusions such as those resulting from failure to con- sider, e.g., dilution effects (pool sizes) and exchange pro- cesses. Or, if they do err, the error is more readily obvious
because a model and the assumptions are usually pre- sented in detail. Little is known about the rates of oxida- tion of metabolic fuels in individual tissues of living ani- mals. A gigantic experimental task lies ahead. The speed, efficiency, and logic associated with computer analyses may be expected to help physiologists and bio- chemists derive vast amounts of valid information with respect to metabolic rates in complicated systems.
Although this review is obviously biased in that i t is intended to emphasize how computers may be used ad- vantageously to study complex biological systems, I ani aware that most of the great advances in biology have resulted and will surely continue to derive from ap- proaches that are totally dependent upon the simplifica- tion of complex systems. I am also aware of the fact that computers may be used erroneously, that overly complex and unwarranted models may be drawn when simpler models would suffice, that totally invalid assumptions may be made, and that control of variables may be less than adequate when one studies complex metabolic sys- tems. Furthermore, there is great danger that an in- 1,estigator will become more involved with the computer than with the metabolic problem which he set out to solve initially, or that he may spend EO much time learn- ing how to use the computer that his productivity is actually reduced. However, all of these shortcomings may be overcome and must be overcome if investigators wish to use complicated physiological systems to test the validity of conclusions derived from experiments based upon simplified systems. Furthermore, I believe that recent advances in computer technology, language, pro- gramming, and consultation facilities have reduced the time required to learn how to use a computer to weeks or, at most, a few months.
VI. COMPUTER ANALYSIS: PRACTICAL CONSIDERATIONS AND GENERAL COMMENTS
CHOICE OF COMPUTER
There are three main classes of computers: digital, analog, and hybrid combinations of the two. An analog computer is extremely useful for obtaining initial esti- mates of various parameters, and for communicating quickly and graphically the relative influence of each model parameter upon the amount of radioactivity that would be present in each pool at any time (20, 50). In a sense, it is far easier to modify a program for an analog than for a digital computer (68). However, this advantage may not be serious, since general programs for digital computers are readily available. Another advantage of the analog computer is that of convenience. It may be kept in one’s laboratory and be available at all times. This advantage is becoming less important since tele-
18 JOURNAL OF LIPID RESEARCH VOLUME 10, 1969
by guest, on June 26, 2018w
ww
.jlr.orgD
ownloaded from

phone lines are now being used to connect isolated labo- ratories directly to large digital computers. Recently Hazelrig, Owen, and Ackerman (69) compared the relative merits of an analog computer with those of a digital computer. They prefer the analog computer. However, several workers who have had extensive ex- perience with both digital and analog computers have indicated that the digital computer (and an appropriate program) will yield a solution to a complex model much faster and less tediously than will an analog computer.’ Moreover, the accuracy of the digital computer is far superior to that of the analog computer. Hybrid com- puters, which have the advantages of each type of com- puter, will probably eventually prove to be the most versatile and useful systems. At present, most readily available hybrid computers are geared to deal with rela- tively simple models.
There are several types of electrical analog computer (see references 2, 3, 68 for bibliography). Most com- mercial analog computers are composed of circuits set up so that each term of a differential equation may be simulated by electrical circuits and the differential equa- tions solved (3). Another type also solves differential equations; however, there is no direct, simple analogy between terms of the differential equations and the elec- trical circuit. Gregg has designed such a circuit to solve a general three-compartment model (70). A third type of electrical analog computer is called a “direct analog computer” (68). Although the operator does not have to write differential equations, the computer actually con- sists largely of electrical circuits to simulate and solve such equations. According to Higinbotham, Sugarman, Potter, and Robertson (68) the direct analog computer is more useful than the usual, commercial analog com- puter when one attempts to define a model from the data and no other information. However, I have emphasized earlier that a tentative hypothetical model, which may be described by differential equations, should be con- structed even before an experiment is carried out. Therefore, an investigator may need to modify his model, but he should not have to d&ne it entirely from his data alone. For this purpose, I can see no advantage of a direct analog computer over most commercial analog computers. Higinbotham et al. (68) imply that one ad- vantage of a direct analog computer (one not solving differential equations) is that many investigators are more at ease with flow-type models (pools and arrows) than they are with the corresponding differential equa- tions. This is unfortunate and should be remedied. Differential equations are usually extremely simple state-
7 Personal communications from Doctors Mones Berman and James Robertson.
ments which no scientist should have difficulty formulat- ing.
COMPUTER APPLICATIONS
I have commented upon several applications of computer analysis to the study of rates of lipid metabolism. Among these have been : (a) data analysis to obtain rates by: solving simultaneous differential equations based upon slopes, intercepts, and pool sizes (e.g., studies 4, 5, and 5A) ; using differential and (or) integral equations without solving them so that relationships are obtained between (fractional) turnover rates and slopes, areas, and pool sizes (e.g., study 2); curve fitting =IZ iteration with numerical solutions to simultaneous differential equations (e.g., studies 3, 3A, 7, and 8) ; curve fitting using analog computers (e.g., studies 6, 9, and 10) ( b ) prediction of curves prior to experimentation so that appropriate data are collected (see comments on study
(6) verification of hypothetical models (d) estimation of relative importance of alternate meta- bolic pathways.
Another extremely valuable function of computers, which has not been commonly employed, is the checking or reevaluation of calculations that investigators publish or submit for publication. I t is an extremely simple task, for example, to submit the computations of Wise and Elwyn in study 10 to a multicompartmental analysis by the SAAM program (35, 37). By doing this, one could determine whether the estimated rates, which were based upon isolated reaction sequences, are actually compatible with all of the data considered simultaneously. In a few years, a multicompartmental reevaluation of this sort may involve simply a brief telephone call from any laboratory or editorial office to a computer facility. One future task of biochemistry will be the integration of isolated observations into extremely complex metabolic maps in which pathways are assigned rates and standard deviations under various physiological conditions in liv- ing animals. I t is quite probable, a t our present level of ignorance, that measurement of an isolated reaction rate in vivo will be in error for the following reasons : because heterogeneities of compartments in tissues, cells, and cellular organelles may be recognized but not taken into account; because data are often incomplete or taken from the literature ; because intermediate pools are ignored ; and because all possible precursors and products may not yet be known. The chances of detecting the error are increased greatly if the observations with respect to isolated reactions are integrated into a larger scheme of metabolism. Computers now make it possible for the reader to reevaluate sets of published data from various laboratories quickly by multicompartmental analysis.
9 )
BAKER Computers and Rates of Metabolism 19
by guest, on June 26, 2018w
ww
.jlr.orgD
ownloaded from

STEPWISE Vs. MULTICOMPARTMENTAL ANALYSIS
This consideration leads us to another important practical aspect of multicompartmental analysis. If in a complex integrated multicompartmental analysis consideration is given to all of the rates that are studied in the segmented approach, is there any reason to carry out and publish a stepwise analysis such as that of Wise and Elwyn (study lo)? If one compares the approach of these authors with that of Baker and Schotz (study 3), he will find that Wise and Elwyn’s presentation is much clearer. In study 10 the simple, isolated reactions are considered separately, in great detail, and the entire model is shown only after the reader has digested each of the relatively uncom- plicated relationships. This was not done in the multi- compartmental analysis of study 3. As a result the reader must face complexity almost immediately. This is not necessary when one uses the Berman program, e.g., see Eaton et al. (study 8), where the multicompartmental analysis is presented clearly and in stepwise fashion. In fact, the usual procedure in complex multicompart- mental analysis is to treat, as a first step only, portions of the model in much the same fashion as described by Wise and Elwyn. This ran be done by the extremely versatile SAAM program (35-37) ; the reader should understand that the procedure of Wise and Elwyn is simply a special case that is fully covered by the more general SAAM program.
However, as we begin to study integrated rates, i t will become increasingly difficult to present, in publishable form, a multicompartmental analysis in a simple, lucid, stepwise fashion. There will be no room for figures show- ing the effect of varying each rate upon each product Sp. A-time curve. If metabolic complexity is to be dealt with in a quantitative fashion, the presentation of data must also become more complex. Critical evaluation of this type of literature may require, then, that the reader be able to analyze a multicompartrnental model, pre- sented along with a vast array of data, by breaking i t down into its component parts (see Fig. 5 ) rather than having the author synthesize the larger model for the reader. The readers may have to learn to check calcula- tions by independent computer analysis (see previous paragraph), or to make new computations based upon different information and assumptions. Authors will need to develop new forms of presentation and editors may need to revise some of their policies so that the major advances, which I believe are yet to be made in the study of integrated aspects of metabolic rates, can be com- municated.
VALIDITY OF SINGLE-INJECTION EXPERIMENTS
Since this review is concerned with studies that require computers for data analysis, I have limited my discussion almost exclusively to single-injection type experiments.
However, the following question has been raised by nu- merous workers : can the single-injection technique beused atall to calculate the rate at which a precursor iscoiiverted to some distant product? Several workers habe shifted from single-injection to constant-infusion experiments to avoid some of the complications associated with rnulti- compartmental analyses. Unfortunately, a great deal of misunderstanding arose from the fact that single-injection experinients frequently gave rise to obviously incorrect conclusions and that more nearly valid experiiiients could be performed by constant-infusion techniques.
This discrepancy only reflects the fact that many workers either have not conducted and interpreted their single-injection type experiments properly, or have as- sumed an incorrect model. Theoretically, if correctly analyzed, the single-injection technique and constant- infusion method are both valid. Moreover, the two techniques should be used to complement cach other whenever possible. As an exercise in understanding that the discrepancies, when observed, between single- injection techniques and constant-infusion methods are usually the result of faulty theoretical analysis, the reader should refer to the paper by Forbath, Kenshale, and Hetenyi (71). These authors show that the transport rate of lactic acid in rats cannot be accurately estimated from the “terminal” slope of a single-injection experi- ment. This observation had been well documented 15 yr earlier in a study of glucose metabolism in rats (12). The latter study showed that in order to calculate trans- port rates by the single-injection technique, analysis of the entire curve zncludzng the early slopes and intercept$ must be taken into account. I t would have been much more appropriate for Forbath et al. to haw analyzed their data according to the method of Baker et al. (12) if they wished to determine whether the single-injection technique gave the same results, within experimental error, as the constant-infusion technique. Although the calculation of the fraction of a product that is derived from a distant precursor is greatly simplified by the con- stant-infusion technique, in which the intermediary pools are brought to a relatively constant Sp. A., this does not mean that one cannot use the single-injection tech- nique. In fact, the latter may provide valuable insights with respect to the size and turnover of the intermediate pools and to recycling, especially if studied by multi- compartmental models and computer analysis. A4s noted by Shipley et al. (13), rates of glucose oxidation as cal- culated by the single-injection technique do not differ markedly from the values obtained by constant-infusion type experiments.
AVOIDANCE OF MULTICOMPARTMENTAL ANALYSIS Among the various methods of data analysis that have been used to interpret single-injection type experiments,
20 JOURNAL OF LIPID RESEARCH VOLUME 10, 1969
by guest, on June 26, 2018w
ww
.jlr.orgD
ownloaded from

the four most common approaches are: a multicompart- mental analysis in which all compartments are identified; a similar analysis in which unidentified or poorly defined black boxes are inserted, with emphasis placed upon initial precursor and final products; an analysis that is free from explicit presentation of a compartmental model ; and complete circumvention of the complex problem by experimental design. Each approach has its own merits. However, the presentation of models and assumptions by successive groups of workers has served to develop com- plex concepts of hepatic TG metabolism and secretion in experimental animals and in human subjects that will un- doubtedly serve as the basis of further detailed investiga- tion of hepatic TG synthesis, degradation, and secretion. All deductions with respect to hepatic TG turnover in man are based upon indirect measurements in which the liver T G pools have been treated as “black boxes” (see list of definitions). The only exception is the study of Farquhar et al., but liver data seem too sparse (one biopsy per subject) to define the kinetic behavior of hepatic TG. The use of black boxes may be highly mis- leading and relatively uninformative unless multicompart- mental analyses are carried out in which precursor and product slopes, intercepts, maxima, relative activities, and time delays are all taken into account. Available computer programs allow this approach and have been utilized in this way.
Frequently, the choice between use of a complex experimental design which may require computer anal- ysis and a simpler approach rests upon considerations such as the availability of an appropriate isotopic tracer that could be used for the less complicated study, and the narrowness with which the investigator views his prob- lem. For example, if one is interested only in the turn- over rate of plasma TG, injection of labeled TG followed by measurements of radioactivity and pool size in plasma TG should be the most accurate, the least equiv- ocal, and the simplest to interpret. However, this ap- proach requires the preparation of labeled VLDL-TG. I t is easier to obtain labeled FFA or glycerol than labeled VLDL-TG. Furthermore, it is difficult to establish that the VLDL-TG has not been altered during its isolation and still behaves as a representative tracer. According to Farquhar et al. (31, see also 28), the kinetic behavior of plasma T G in human subjects allows plasma TG to be labeled by either FFA or glycerol in a manner that per- mits (fractional) turnover rate of plasma T G to be esti- mated simply by measurement of the declining slope of the curve. This approach would not be valid in experi- mental animals that have been studied thus far (rats, rabbits, dogs), for the (fractional) turnover rate of a product can be calculated from its declining slope after injection of a labeled precursor only if the precursor pool turns over more rapidly than does the product (31). In
the rat, the initial declining slope of the plasma TGFA- 14C curve after injection of FFA-14C is more closely related to the (fractional) turnover rate of the precursor liver TGFA pool than to that of the plasma TGFA pool (18). There are two points which may be made in regard to the above findings. First of all, if there is a choice to be made between two methods of measuring rates, and if one of these manages to circumvent treatment of a black box (such as liver lipids), that is the method which will probably give the most direct answer to a specific ques- tion. However, by using the approach which gives the least equivocal answer, one is surely going to miss the experimental observations that provide information regarding the black box. The less direct approach is fre- quently the one that leads to the formulation of new and fruitful hypotheses.
An extremely simple method for avoiding multi- compartmental analysis of complex data has been pre- sented by Shipley et al., who studied the conversion of glucose to lipids (and to other substances) in rats (13). The technique involves, first, calculation of the rate of net outward transport (irreversible disposal) of the precursor. This rate frequently may be calculated simply from the slopes and intercepts of the precursor Sp. A.- time curve (11,12). The next step involves isolating all of the major end products, finding the fraction of the in- jected 14C that has accumulated in each and in all end products at any time, and then multiplying the ratio (radioactivity in an end product a t t)/(radioactivity in all end products at t ) for each substance times the rate of irreversible disposal. This technique cannot be used unless all “end products” can be isolated. But what constitutes an end product? If this approach is used when should an experiment be terminated? This is a crucial considera- tion since the fraction of the injected radioactivity in the major end product, COZ, varies throughout most experi- ments. The critical reader should recognize another po- tential difficulty that may arise when one avoids multi- compartmental analyses. The technique suggested by Shipley et al. (13) serves an as excellent example of a crucial error which might well have been avoided had the authors constructed a model. These authors have assumed that the radioacitivity in an end product is proportional to the net outward transport of the precursor into the product. This is incorrect as noted by Baker and Schotz (8), and, more clearly, by Steele, Winkler, Rathgeb, Bjerknes, and Altszuler (72). The net transport from a precursor to an “end product” (1 3) requires knowledge of whether the end product is in a steady state or is in- creasing or decreasing in concentration. Much more attention must be paid to this facet of experimental design and data analysis. The data one requires are usually not difficult to acquire. Future studies may be expected to take into account the fact that some “end products”
BAKER Computers and Rates of Metabolism 21
by guest, on June 26, 2018w
ww
.jlr.orgD
ownloaded from

(such as fat droplets in liver) are actually building up during a prolonged fast while others (fat droplets in adi- pose tissue) are decreasing.
Two other points should be considered when one weighs the advantages and disadvantages of undertaking a multicompartmental analysis to interpret sets of com- plicated data describing the rise and fall of radioactivity within various compartments. First, one must recognize that a vast amount of meaningful information that is contained in slopes, intercepts, radioactivity-time rela- tionships, and pool sizes is frequently ignored in most noncompartmental approaches. Second, by hesitating to speculate with respect to the arrangement of pre- cursors, intermediates, and final products in terms of a multicompartmental model, the investigator may de- prive other workers of a presentation which could lead to new hypotheses, new experiments and new knowledge.
Another example of a problem in lipid metabolism that has been approached in two ways, one by a multi- compartmental analysis with a computer and the second by a logical process that leads around the more complex approach, is the following. One may attempt to deter- mine the fraction of liver or plasma TGFA that is derived from plasma FFA in fasted animals by using a rom- plicated computer analysis (1 8, 19, 29). However, simple logic based upon well-established experimental observa- tions can lead one to conclude that all hepatic TGFA must be derived ultimately from plasma FFA in fasted animals (73, p. 168). If one goes through the latter logic first, then he is unlikely to attempt to evaluate by a com- plex experiment how much newly formed TGFA is derived from plasma FFA. On the other hand, the coin- plex experiment provided interesting information, which should lead to a reexamination of the pathways by which FFA are incorporated into hepatic TGFA. This illus- trates that the experimental testing of fundamental con- cepts of metabolism is likely to provide new dimensions to our concepts, especially if multicompartmental models and computer techniques are employed. Conversely, avoiding complex analyses may cause unusual pathways, obscure exchange reactions, and interesting quantitative aspects of a biological system to remain hidden.
NONSTEADY-STATE SYSTEMS In most of the papers reviewed here, the isotopic data were treated mathematically by linear differential equations. Berman has pointed out that in steady-state systems, even though control mechanisms and biochemical reac- tions may obey nonlinear mathematical functions, the kinetic behavior of the tracer is linear. That is, if the pool size of a substance remains constant, the rate of loss of a tracer from the compartment is proportional to the amount of tracer that is in the compartment at any time (26). However, the most interesting physiological control
mechanisms are usually operative in nonsteady states, as during the time that TG mobilization is being inhibited shortly after feeding fasted rats a glucose load (74) or carbon tetrachloride (29, 73). Some of the difficulties associated with the analysis of data in nonsteady states have been discussed by Hart (see reference 65 for bibliography). Despite the difficulties, some relatively simple experimental approaches may be used to explore many interesting nonsteady state systems (26). More at- tention should be given to problems of metabolic control in which nonsteady-state systems are explored by tracer techniques. Multicornpartniental analysis with coin- puters should greatly facilitate progress in this area of research.
NOMENCLATURE
There has been much confusion with respect to the syin- bolisni used in multicompartmental analyses. I t is to be hoped that investigators will adopt the standard nomen- clature for tracer kinetics that has been published re- cently (27). Particular attention should be given to the definition of “turnover rate”: “the fraction of the tracer that leaves a compartment or a system per unit time,” which is the same as the reciprocal of “turnover time.” Most studies in the literature have used the term turnover rate to mean the pool size divided by the turnover time. The latter value should now be called the “inflow or out- flow transport” (27). In the present review I have modi- fied the term “turnover rate” to (fractional) turnover rate for clarity. I have also included the term “irreversible disposal” (1 1-13) because it represents a net transport rate which is not adequately covered, in my opinion, by the definitions that were published (27). In some cases, e.g., in referring to the rate of esterification, I found it difficult to speak of “transport rate.” Therefore, I have deviated somewhat from the recommendation. Further refinements in standard nomenclature will undoubtedly be forthcoming.
VII. SUMMARY
I have tried to illustrate the kinds of problems that are suited for or require computer analysis. The questions which may be answered by this approach are funda- mental to our understanding of lipid metabolism. A num- ber of papers were selected for critical review. Using these studies, I have tried to illustrate several different theo- retical approaches that have been employed to measure rates of lipid metabolism. One series of investigations, which dealt with triglyceride synthesis and secretion, was used to show how model building and multicom- partmental analysis with computers may be used to explore dynamic aspects of the formation of endogenous triglycerides in plasma lipoproteins. Although the study
22 JOURNAL OF LIPID RESEARCH VOLUME 10, 1969
by guest, on June 26, 2018w
ww
.jlr.orgD
ownloaded from

of rates of lipid metabolism is still in its infancy and full of theoretical pitfalls, the reader will, I hope, have recognized that, given appropriate data, present-day com- puter programs are capable of helping the investigator tackle problems that could not be solved without the aid of a computer. I have discussed problems of com- municating the results of complex analyses, as well as problems associated with lack of data. Some of the meth- ods that investigators have explored in order to obtain information about compartments that are not easy to sample directly were also discussed briefly. I have re- viewed a number of philosophical and semantic prob- lems which arise in multicompartmental, computer analysis and have suggested that adjustments on the parts of investigators, readers, and editors will be required in order to pave the way for rapid progress in the study of highly complex problems of lipid metabolism.
This study was supported in part by PHS research Grant Nos. AM 4705 and AM 4706 (Dr. M. C. Schotz) from the National Institutes of Health, V.S. Public Health Service.
Manuscript received 3 June 7968.
1. 2. 3.
4.
5. 6. 7.
8. 9.
10. 11. 12.
13.
14.
15.
16. 17.
REFERENCES Zilversmit, D. B. 1960. Amer. J . Med. 29: 832. Robertson, J. S. 1957. Physiol Rev. 37: 133. Sheppard, C. W. 1962. Basic Principles of the Tracer Method. John Wiley & Sons Inc., New York. Fredrickson, D. S.. and R. S. Gordon, Jr. 1958. J . Clin. Invest. 37: 1504. Laurell, S. 1959. Acta Physiol. Scand. 47: 218. Olivecrona, T. 1962. Acta Physiol. Scand. 55: 291. Havel, R. J., and D. S. Fredrickson. 1956. J . Clin. Invest. 35: 1025. Baker, N., and M. C. Schotz. 1967. J . Lipid Res. 8: 646. Berman, M. 1963. Ann. N.Y. Acad. Sci. 108: 182. Gardner, D. G. 1963. Ann. N.Y. Acad. Sci. 108: 195. Baker, N., and H. Rostami. 1969. J . Lipid Res. 10: 83. Baker, N., R. A. Shipley, R. E. Clark, and G. E. Incefy. 1959. Amer. J . Physiol. 196: 245. Shipley, R. .4., E. B. Chudzik, A. P. Gibbons, K. Jongedyk, and D. 0. Brummond. 1967. Amer. J . Physiol. 213: 1149. Havel, R. J., J. M. Felts, and C. M. Van Duyne. 1962. J . Lipid Res. 3: 297. Olivecrona, T. 1962. Kinetics of Fatty Acid Transport. Thesis. Lund. Sweden. Havel, R. J., and A. Goldfien. 1961. J . Lipid Res. 2: 389. Schotz, M. C., B. Arnesio, and T. Olivecrona. 1966. Bio- chem. Biophys. Acta. 125: i 85 .
18. Baker, N. and M. C. Schotz. 1964. J . Lipid Res. 5 : 188. 19. Nikkila, E. A., M. Kekki, and K. Ojala. 1966. Ann. Med.
20. Wise, E. M., Jr., and D. Elwyn. 1965. J . Biol. Chem. 240:
21. Hollenberg, C. H. 1966. J . Clin. Invest. 45: 205. 22. Hollenberg, C. H. 1967. J . Lipid Res. 8: 328. 23. Vaughan, M. 1961. J . Lipid Res. 2: 293. 24. Carlson, L. A. and P. R. Bally. 1965. In Handbook of
Physiology, Section on Adipose Tissue. A. E. Renold and
Exp. Biol. Fenn. 44: 348.
1537.
25. 26, 27.
28.
29.
30.
31.
32.
33.
34.
35.
36.
37.
38.
39.
40.
41.
42. 43.
44.
45.
46.
47,
48.
49.
50.
51. 52.
53. 54.
55.
56.
G. F. Cahill, Jr., editors. American Physiological Society, Washington, D.C. 557-574. Batschelet, E. 1966. Bioscience. 16: 22. Berman, M. 1968. Ann. Intern. Med. 68: 423. Brownell, G. L., M. Berman, and J. S. Robertson. 1968. Int. J . Appl. Radiat. Isotope. 19: 249. Friedberg, S. J., R. F. Klein, D. L. Trout, M. D. Bog- donoff, and E. H. Estes, Jr. 1960. J . Clin. Invest. 40: 1846. Schotz, M. C., N. Baker, and M. N. Chavez. 1964. J . Lipid Res. 5: 569. Waterhouse, C., J. H. Kemperman, and J. M. Stormont. 1964. J . Lab. Clin. Med. 63: 605. Farquhar, J. W., R. C. Gross, R. M. Wagner, and G. M. Reaven. 1965. J . Lipid Res. 6: 119. Gross, R. C., E. H. Eigenbrodt, and J. W. Farquhar. 1967. J . Lipid Res. 8: 114. Eaton, R. P., A. Frank, S. Quarfordt, M. Berman, and D. Steinberg. 1968. Proc. 7968 Deuel Conf. Lipids, Carmel, Calif. U S . Dept. of Health, Education and Welfare. In press. Shore, M. L., and R. Callahan. 1963. Ann. N.Y . Acad. Sci. 108: 147. Berman, M., M. F. Weiss, and E. Shahn. 1962. Biophys. J . 2: 289. Berman, M. 1965. In Computers in Biomedical Research. Stacey, R.. and B. Waxman, editors. Academic Press, Inc.,
Berman, M., and M. F. Weiss. 1967. SAAM Manual. U S . Public Health Service Publication No. 1703. U.S. Government Printing Office, Washington, D.C. Skinner, S. M., R . E. Clark, N. Baker, and R. A. Shipley. 1959. Amer. J . Physiol. 196: 238. Hamosh, M., and B. Shapiro. 1961. Amer. J . Physiol. 201: 1030. Lanczos, C. 1956. Applied Analysis. Prentice-Hall, Inc., New York. 275-280. Lewallen, C. G., M. Berman, and J. E. Rall. 1959. J . Clin. Invest. 38: 66. Baglio, C. M., and E. Farber. 1965. J . Cell. Biol. 27: 591. Jones, A. L., N. B. Ruderman, and M. G. Herrera. 1967. J . Lipid Res. 8: 429, Maling, H. M., A. Frank, and M. G. Horning. 1962. Biochim. Biophys. Acta. 64: 540. Felts, J. M., and P. A. Mayes. 1965. Nature (London). 206: 195. Green, C. and J. A. Webb. 1964. Biochim. Biophys. Acta. 84: 404. Olivecrona, T., and P. Belfrage. 1965. Biochim. Biophys. Acta. 98: 81. Schotz, M. C., and T. Olivecrona. 1966. Biochim. Biophys. Acta. 125: 174. Carlson, L. A., and E. R. Nye. 1966. Acta Med. Scand. 179: 453. Havel, R. J., L.-G. Ekelund, and A. Holmgren. 1967. J . Lipid Res. 8: 366. Dayton, S., and S. Hashimoto. 1966. Circ. Res. 19: 1041. Newman, H. A. I., and D. B. Zilversmit. 1966. Circ. Res. 18: 293. Hahn, L., and G Hevesy. 1939. Nature (London). 144: 204. Zilversmit, D. B., C. Entenman, and M. C. Fishler. 1943. J . Gen. Physiol. 26: 325. Eaton, R. P. 1964. Proceedings of the Symposium on Respiratory Pattern Analysis in Intermediary Metab- olism. Applied Physics Corp.-Baird Atomic Corp. 11. Waterhouse, C., and J. H. Kemperman. 1966. J . Lab. Clin. Med. 68: 250.
N.Y. 2: 173-201.
BAKER Computers and Rates of Metabolism 23
by guest, on June 26, 2018w
ww
.jlr.orgD
ownloaded from
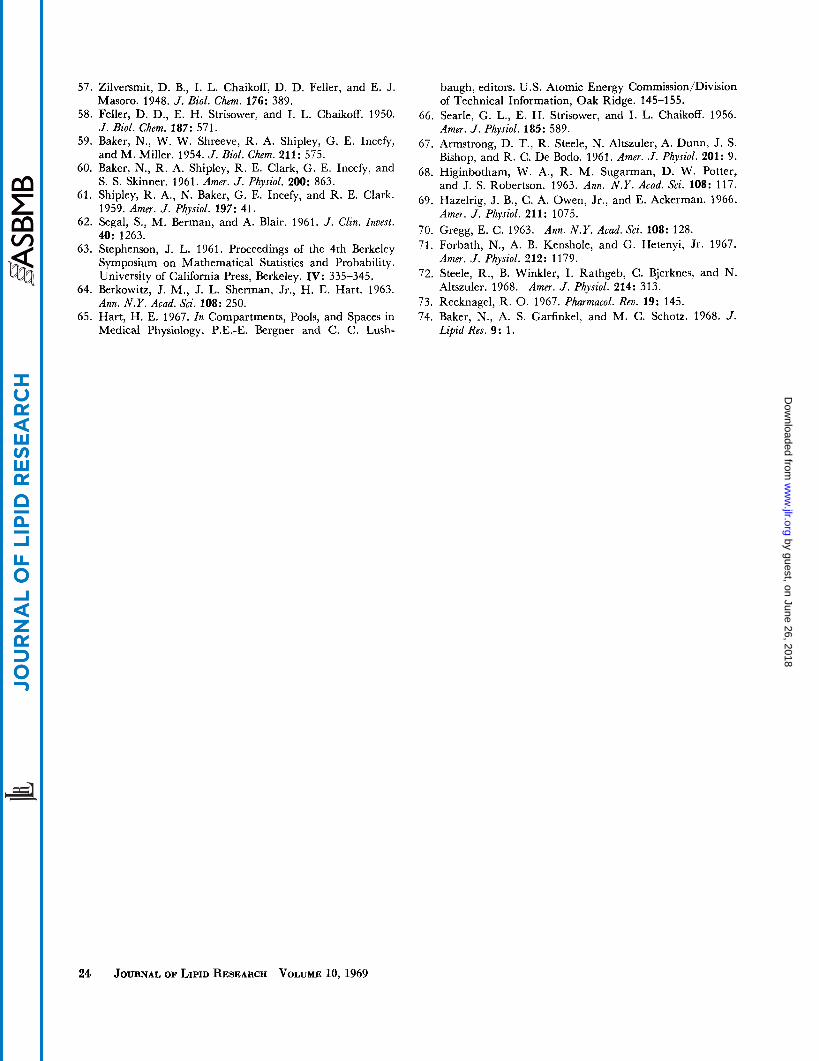
57. Zilversmit, D. B., I. L. Chaikoff, D. D. Feller, and E. J. Masoro. 1948. J . Biol. Chem. 176: 389.
58. Feller, D. D., E. H. Strisower, and I. L. Chaikoff. 1950. J . Biol. Chem. 187: 571.
59. Baker, N., W. W. Shreeve, R. A. Shipley, G. E. Incefy, and M. Miller. 1954. J . Biol. Chem. 211: 575.
60. Baker, N., R. A. Shipley, R. E. Clark, G. E. Incefy, and S. S. Skinner. 1961. Amer. J . Physiol. 200: 863.
61. Shipley, R. A., N. Baker, G. E. Incefy, and R. E. Clark. 1959. Amer. J . Physiol. 197: 41.
62. Segal, S., M. Berman, and A. Blair. 1961. J . Clin. Invest. 40: 1263.
63. Stephenson, J. L. 1961. Proceedings of the 4th Berkeley Symposium on Mathematical Statistics and Probability. University of California Press, Berkeley. IV: 335-345.
64. Berkowitz, J. M., J. L. Sherman, Jr., H. E. Hart. 1963. Ann. N.Y. Acad. Sci. 108: 250.
65. Hart, H. E. 1967. In Compartments, Pools, and Spaces in Medical Physiology. P.E.-E. Bergner and C. C. Lush-
baugh, editors. U.S. Atomic Energy Commission/Division of Technical Information, Oak Ridge. 145-155.
66. Searle, G. L., E. H. Strisower, and I. L. Chaikoff. 1956. Amer. J . Physiol. 185: 589.
67. Armstrong, D. T., R. Steele, N. Altszuler, A. Dunn, J. S. Bishop, and R. C. De Bodo. 1961. Amer. J . Physiol. 201: 9.
68. Higinbotham, W. A., R. M. Sugarman, D. W. Potter, and J. S. Robertson. 1963. Ann. N.Y. Acad. Sci. 108: 117.
69. Hazelrig, J. B., C. A. Owen, Jr., and E. Ackerman. 1966. Amer. J . Physiol. 211: 1075.
70. Gregg, E. C. 1963. Ann. N.Y. Acad. Sci. 108: 128. 71. Forbath, N., A. B. Kenshole, and G. Hetenyi, Jr. 1967.
72. Steele, R., B. Winkler, I. Rathgeb, C. Bjerknes, and N.
73. Recknagel, R. 0. 1967. Pharmacol. Rev. 19: 145. 74. Baker, N., A. S. Garfinkel, and M. C. Schotz. 1968. J .
Amer. J . Physiol. 212: 1179.
Altszuler. 1968. Amer. J . Physiol. 214: 313.
Lipid Res. 9: 1.
24 JOURNAL OF LIPID RESEARCH VOLUME 10, 1969
by guest, on June 26, 2018w
ww
.jlr.orgD
ownloaded from