Embed Size (px)
Citation preview

RATES, IMPORTANCE, AND CONTROLS OF NITROGEN FIXATION IN
OLIGOTROPHIC ARCTIC LAKES, TOOLIK, ALASKA
A Dissertation
Presented to the Faculty of the Graduate
School of Cornell University
in Partial Fulfillment of the Requirements for the Degree of
Doctor of Philosophy
by
Gretchen Maria Gettel
August 2006

© 2006 Gretchen Maria Gettel

RATES, IMPORTANCE, AND CONTROLS OF NITROGEN FIXATION IN
OLIGOTROPHIC ARCTIC LAKES, TOOLIK, ALASKA
Gretchen Maria Gettel, Ph. D.
Cornell University 2006
Biological nitrogen (N) fixation of atmospheric N2 by free-living cyanobacteria
in aquatic environments is common, and in many ecosystems, it can account for a
significant portion of the biologically available N inputs. Although N fixation can
compensate for N limitation, N limitation is maintained over relatively long time
scales in many oligotrophic lake ecosystems. This dissertation examines the
importance of benthic and pelagic N fixation in the N economies of oligotrophic lakes
in arctic Alaska (Chapter 1) and examines nutrient, light, and grazer controls on
benthic N fixation (Chapters 2 and 3). Both benthic and pelagic N fixation are
prevalent in many lakes across the Alaskan arctic landscape, ranging from 0.12 – 1.5
mg N m-2 day-1 and 0 – 2.56 mg N m-2 day-1 respectively. Pelagic N fixation is much
higher than has been reported elsewhere for oligotrophic lakes, and is more important
than previously thought, comprising ~ 75% of N inputs to one lake. Benthic N
fixation is lower than has been reported for other oligotrophic systems, and is roughly
equivalent to N inputs from atmospheric deposition on an areal basis (~25 mg N m-2
year-1). On the landscape scale, N fixation in lakes roughly equal that in terrestrial
ecosystems in this Arctic region. Benthic N fixation generally appears to have a
saturating response to light availability within individual lakes, but light does not
explain variation in benthic N fixation across lakes or years. Whole-lake fertilization

and laboratory experiments indicate that P input stimulates benthic N fixation while N
input suppresses N fixation when N is added either alone or in conjunction with P in
Redfield proportion. Snails at ambient density cause a small decline in benthic N
fixation (0.85 – 1.8% reduction over the summer). These patterns are corroborated in
the landscape: lakes on younger surfaces have higher P, more snails, and higher rates
of N-fixation than lakes on older surfaces.

iii
BIOGRAPHICAL SKETCH
Gretchen Maria Gettel grew up in Vermont where beautiful surroundings,
interested family members, and inspired teachers fostered her native interest in
science. One of the many activities that Gretchen’s father, Courtland D. Gettel, had
her do was to sit down in a meadow with a magnifying glass and a sketch book with
the instructions to draw what she saw. Gretchen’s grandmother, Mary Dickinson
“Dickie” Gettel, sent her hunting for geodes with a rock hammer from Dickie’s own
undergraduate career in geology. Gretchen’s grandfather, William Dabney Gettel,
showed Gretchen how he recorded daily temperature and precipitation, calculated
monthly averages, and graphed the data by hand. Gretchen’s mother, Karen Tryon
Bell, responded to Gretchen’s first proclamation of, “I want to be a marine biologist”
in the 3rd grade, with the encouragement: “You can be whatever you want.”
Gretchen graduated from Mill River Union High School in North Clarendon,
Vermont in 1989. Along the way, she encountered some remarkable women. Mrs.
Carolyn Raiford taught 8th, 10th, and 11th grade life science though AP biology.
Through years of creative science projects, well-designed laboratory assignments and
a broad curriculum, she instilled the fundamentals of the scientific method and the
discipline, skills, and joy associated with independent learning. A family friend, Ms.
Elizabeth Ryder, gave Gretchen a microscope and an idea for a science project
examining the effect of Vitamin C on lymphocytes. That project won a silver medal at
the Vermont State Science Fair, and then she continued to gravitate towards the
natural sciences. Mrs. Margie McCouch met Gretchen when she was 84 years old and
retired as a biological oceanographer from the Woods Hole Oceanographic Institution.
For the next ten years, Margie shared a correspondence which comprised gifts of
books (including one that she herself wrote), photographs, and ocean-floor maps.

iv
Although she had lost her sight, Margie continued to provide Gretchen with
illustrations of science as an academic profession through Gretchen’s early college
years.
Gretchen attended college at Boston University where she majored in Biology
with specialization in Marine Science. When she was a sophomore, she met Dr. Kate
Lajtha in general ecology class. Kate taught Gretchen about the role of chemistry in
understanding how natural systems work and opened the possibilities of a career in
ecology when she sent Gretchen to Woods Hole to work in Dr. Ivan Valiela’s
laboratory. There, Gretchen learned about the role of nutrients in causing
eutrophication in Waquoit Bay on Cape Cod, and Dr. Ken Foreman taught her how to
do nutrient analyses (and how to drive a stick shift). It was the following summer in
1992 that Gretchen was hired by the Ecosystems Center in Woods Hole to go to the
Arctic to search for nutrients in oligotrophic waters of northern Alaska. After
completing a senior thesis project on the age and growth of arctic grayling with Dr.
Linda Deegan, Gretchen graduated from Boston University in 1993.
Gretchen worked for two years at the International Pacific Halibut
Commission in Seattle before starting a Masters of Science in the Water Resources
Program at University of Minnesota with Dr. Anne Hershey in 1995. Her Master’s
thesis research was also conducted in the Arctic at Toolik Field Station. Her work
examined patterns in fish distribution and food web structure in lakes in three river
valleys on the North Slope. Anne and one committee member in particular, Dr. John
Pastor, taught Gretchen to think about how processes operating at large spatial and
temporal scales can affect patterns in ecosystem structure and function at very small
scales. As part of the work she did with Anne, she organized 8 – 10 member survey
trips to 80+ lakes on the North Slope, riding in (and getting sick in) a helicopter for the
first time. The more she saw, the more Gretchen really fell in love with the arctic

v
landscape. Continuing to work in the Arctic was a very easy thing for her to decision
to make; imposing marine biological interests in the form of SCUBA diving in the
Arctic was not so easy.
Gretchen completed her Master’s work in 1998 and started graduate school
with Dr. Robert Howarth at Cornell University that fall. As a member of the
Biogeochemistry Program, she was able to merge her interests in biogeochemistry,
ecology, and landscape processes by combining survey work with field experiments to
examine the controls of nitrogen fixation on the bottom of lakes. This work entailed
more helicopters and lots of time spent at 4oC in dry suits. After 120+ dives, Gretchen
likes to say that diving in the Arctic is cool to say you did and stupid to keep doing –
and so she decided to finish her dissertation, available here in just over a page per
dive, if you’re curious.
Gretchen continues to work in biogeochemistry, and she is currently pursuing
research ideas strongly influenced by work in the Howarth laboratory, discussions
among students in the Biogeochemistry Program, and by researchers at Toolik Field
Station and Ecosystems Center in Woods Hole. She is very happy in a post-doctoral
position with a new mentor, Dr. William (Bill) McDowell, at the University of New
Hampshire, where she is learning about how carbon quality affects nitrogen cycling at
the watershed scales in southeastern New Hampshire. And she loves being back in the
beautiful surroundings of New England.

vi
DEDICATION
I dedicate this work to my grandparents, Mary Tryon Gortner, Clayton Gortner, Mary
Dickinson Gettel, and William Dabney Gettel, who encouraged me to follow my own
path and to keep on going once I was on it.

vii
ACKNOWLEDGMENTS
There are so many people to thank. My committee chair, Dr. Robert Howarth,
strongly influenced my world view on nitrogen cycling in ways that will steer the rest
of my scientific career. Bob has an ability to distill a scientific problem and give great
advice in about 10 minutes. Dr. Anne Giblin’s commitment to me and this project
went above and beyond. Anne helped design sediment chambers, and she was an
extraordinary dive buddy, mentor in the lab, and a voice of reason (to which I should
have listened more often). Anne and her husband, Dr. Ken Foreman, and their two
kids, Mike and Nick, housed, fed, and encouraged me for 3 months while I wrote my
dissertation in Woods Hole. Most importantly, Anne helped me see the value of this
work in a broad scientific context. Dr. Alex Flecker was generous with ideas and
resources at his field site in Rio Las Marias, VZ for a side project to my dissertation,
and he gave outstanding feedback on my writing. Dr. Nelson Hairston’s critical
approach to science greatly improved the quality of my work and thought.
The students I was fortunate to mentor — Marissa Weiss, Corey Lawerence,
Lyndon Valicenti — all worked long hours into the Arctic white nights, not only for
their own projects, but for mine. Lyndon Valicenti was particularly instrumental to
this work; she collected water column data and counted algae cells, and maintained a
positive outlook especially when the going got tough. Dan Steinburg was not only my
dive buddy and laboratory assistant, but also an engaged, interested student capable of
helping me make decisions in the lab and in the field, all while maintaining a laid-back
demeanor and sense of humor. Marissa Weiss lapped me by publishing her nitrogen
fixation work before I even completed my dissertation, and I remember fondly her
help, humor, and conversations over long stretches of shooting samples into the GC. I
hope they learned as much from me as I did from them.

viii
Marcus Gay, Sam Kelsey, and Ian Washbourne were also dependable dive
buddies, and their help in the laboratory was critical to the completion of this project.
Drs. Roxanne Marino and Dennis Swaney helped think through laboratory methods
and sediment diffusion corrections. Dr. Sandy Tartowski not only taught me
everything she knew about running a gas chromatograph, but also shaped my
intellectual and professional development early in graduate school. Other members of
the Howarth Lab including Drs. Francis Chan, Brian Roberts, and Beth Boyer helped
through numerous conversations about this work. Drs. Francoise Vermeylen and
Andrew Cooper cheerfully assisted me with statistical analysis, even though I required
multiple explanations with the same datasets and the same code. All the scientists at
the Ecosystems Center in Woods Hole and associated with the Arctic LTER supported
and helped me with this work in ways too numerous to list here.
The Institute of Arctic Biology and VECO Polar Resources provided logistical
support without which this work would not have been possible. In particular, Naomi
Whitty organized helicopter logistics and was the model of professionalism in
balancing our work needs with safety. Pilots Ed, Butch, and Landis allowed soaking-
wet, muddy divers into their helicopters and sometimes made fast flights in
questionable weather to make sure we weren’t stranded in the snow after diving in 4oC
water. Jay Burnside from VECO Polar Resources worked closely with Neil Bettez
and me on the construction of the Incubation Facility at Toolik Field Station, which
was the single most important facility that allowed me to conduct this research.
The social and professional opportunities provided by the Biogeochemistry
Program were by far my favorite part of being a graduate student at Cornell
University. The interactions at seminars were outstanding, and the graduate students
became my best friends, colleagues, and mentors. I would particularly like to thank
those in my cohort: Karin Rebel, Kathy Bailey, Peter Weishampel, Rich Phillips, and

ix
Noel Gurwick. I really want to list everyone else, but I’m afraid I’m going to forget
someone, and it would make for an awfully long acknowledgement section – I trust
that you know who you are! My officemates, Bryon Daley, Becky Doyle, Jeanne
Robertson, Robert Harris, and Pete McIntyre were often the best reasons to show up in
Corson each day. To those who considered staying at 107 Miller Street a pre-requisite
for graduation, isn’t it nice to know that it finally worked for me? Thank you all for
all the good food and libation, and above all – the stimulating, fun, and supportive
conversations.
My family never wavered in their support of this endeavor, never stopped
having faith in me, and never asked that dreaded question, “When are you going to
finish?” My brother, Gregory Gettel, was and still is unconditionally proud of me
even through late -night phone calls and pep talks, for which I am deeply grateful.
Lastly, Neil Bettez applied his outstanding talents in doing science to my work in
ways too many to list, and was my very best friend and biggest fan throughout. (I
wouldn’t have made it without you). Thank you.
This project was supported by NSF-OPP 9732281, NSF-LTER 9810222, and
by a Doctoral Dissertation Improvement Grant NSF-DEB 0206173. Additional
funding was provided by the Small Grants Program through the IGERT Program in
Biogeochemistry and Environmental Change at Cornell University.
x
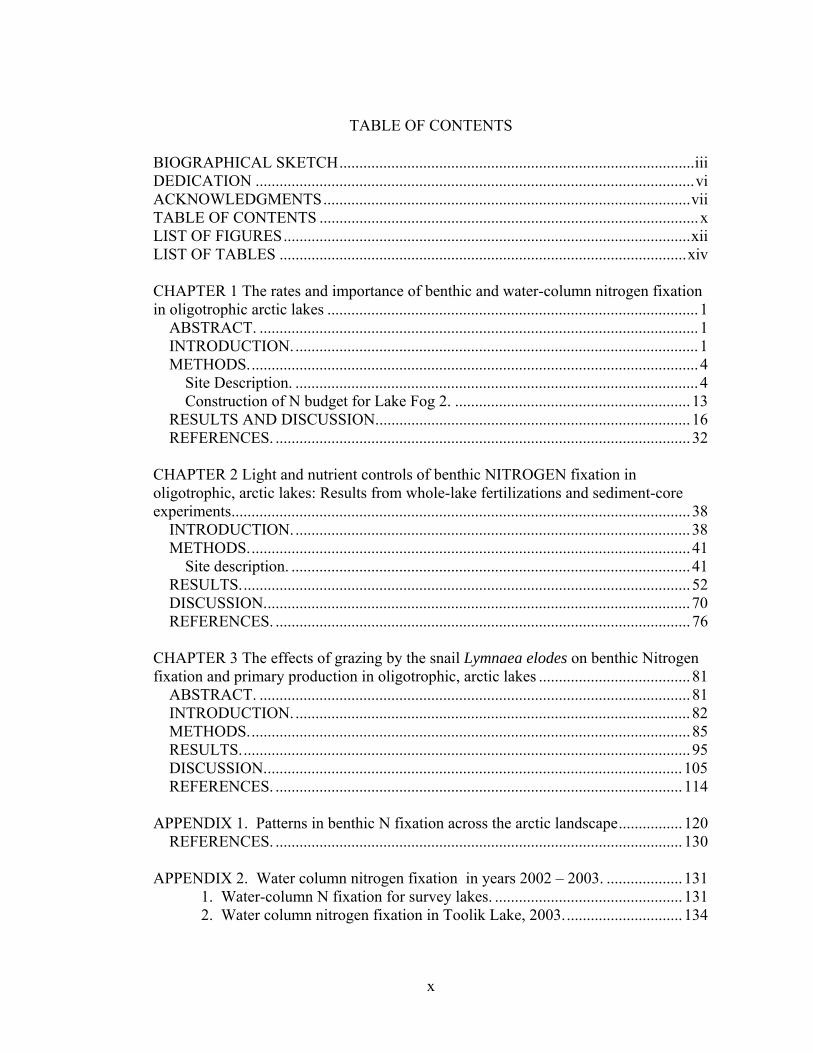
TABLE OF CONTENTS
BIOGRAPHICAL SKETCH.........................................................................................iii DEDICATION ..............................................................................................................vi ACKNOWLEDGMENTS............................................................................................vii TABLE OF CONTENTS ...............................................................................................x LIST OF FIGURES......................................................................................................xii LIST OF TABLES ......................................................................................................xiv CHAPTER 1 The rates and importance of benthic and water-column nitrogen fixation in oligotrophic arctic lakes .............................................................................................1
ABSTRACT. ..............................................................................................................1 INTRODUCTION......................................................................................................1 METHODS.................................................................................................................4
Site Description. .....................................................................................................4 Construction of N budget for Lake Fog 2. ...........................................................13
RESULTS AND DISCUSSION...............................................................................16 REFERENCES. ........................................................................................................32
CHAPTER 2 Light and nutrient controls of benthic NITROGEN fixation in oligotrophic, arctic lakes: Results from whole-lake fertilizations and sediment-core experiments...................................................................................................................38
INTRODUCTION....................................................................................................38 METHODS...............................................................................................................41
Site description. ....................................................................................................41 RESULTS.................................................................................................................52 DISCUSSION...........................................................................................................70 REFERENCES. ........................................................................................................76
CHAPTER 3 The effects of grazing by the snail Lymnaea elodes on benthic Nitrogen fixation and primary production in oligotrophic, arctic lakes ......................................81
ABSTRACT. ............................................................................................................81 INTRODUCTION....................................................................................................82 METHODS...............................................................................................................85 RESULTS.................................................................................................................95 DISCUSSION.........................................................................................................105 REFERENCES. ......................................................................................................114
APPENDIX 1. Patterns in benthic N fixation across the arctic landscape................120
REFERENCES. ......................................................................................................130 APPENDIX 2. Water column nitrogen fixation in years 2002 – 2003. ...................131
1. Water-column N fixation for survey lakes........................................................131 2. Water column nitrogen fixation in Toolik Lake, 2003. ....................................134

xi
3. Temperature and light relationships for water-column N fixation in Toolik Lake, 2003........................................................................................................................136 4. Water-column data for lakes E-5, E-6, Fog 2, and Fog 2 in years 2002 – 2003.................................................................................................................................138
APPENDIX 3. Algal composition data for snail grazing experiment.......................141
REFERENCES. ......................................................................................................147

xii
LIST OF FIGURES
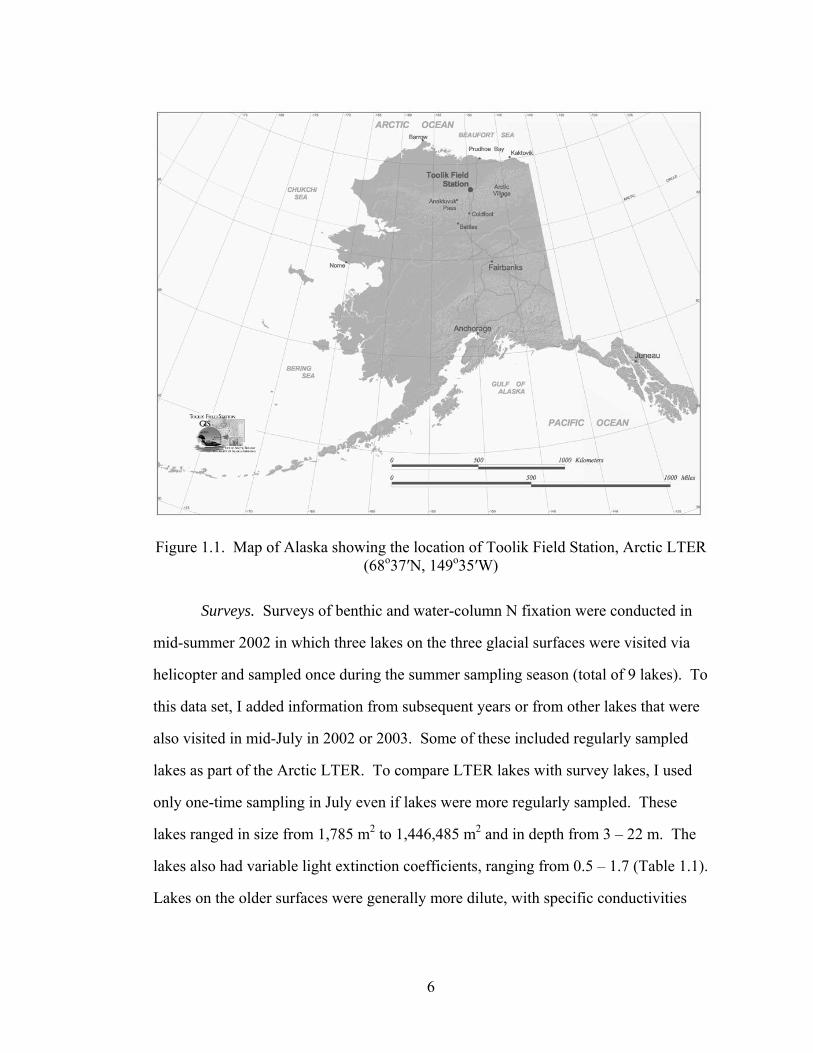
Figure 1.1. Map of Alaska showing the location of Toolik Field Station, Arctic LTER (68o37′N, 149o35′W) ..........................................................................................6
Figure 1.2. Benthic N fixation (black bars) and water-column N fixation (stippled bars) in survey lakes conducted in the vicinity of Toolik Field Station, Alaska...........................................................................................................................17
Figure 1.3. Inputs to Fog 2 (mg N m-2year-1). .............................................................27
Figure 2.1. Map showing the location of fertilization lakes (E – 5, and E – 6) and reference lakes (Fog 2 and Fog 4) relative to ...................................................42
Figure 2.2 Seasonal benthic N2 fixation in the fertilized (E-5 and E-6) and reference (Fog 2 and Fog 4) lakes. ...................................................................................55
Figure 2.3 Graph showing benthic N2 fixation in the fertilization lakes (top panel) and the reference lakes (bottom panel). ..................................................................56
Figure 2.4. GPP and CR in the fertilized (top panel) and reference (bottom panel) lakes. .................................................................................................................60
Figure 2.5. Annual averages of proportion of benthic chlorophyll a at the shallow stations in the fertilization lakes (E-5 and E-6; top panel) and the two reference lakes (Fog 2 and Fog 4; bottom panel). ............................................................61
Figure 2.6. Light extinction coefficient, k (lines), and average ambient PAR (bars) for each year at shallow stations in fertilization and shallow reference lakes. ......63
Figure 2.7. Light response curves for benthic N2 fixation in the deep fertilization lake (E-5), the deep reference lake (Fog 2), the shallow fertilization lake (E-6), and the shallow reference lake (Fog 4). ..................................................................66
Figure 2.8. Results from a nutrient-addition experiment to intact sediment cores......69
Figure 2.9. Relationship between N2 fixation and N:P ratio in nutrient addition cores...........................................................................................................................70
Figure 3.1. Map showing location of lakes Fog 2 (labeled F2) and S6 relative to Toolik Field Station on the North Slope of Alaska, 68o37′N, 149o35′W. ........86
Figure 3.2. Results from randomized-coefficeint analysis relating snail density to measured of N2 fixation....................................................................................98
Figure 3.3. Snail density in lake Fog 2 and S-6 for each year of the experiment. ......99

xiii
Figure 3.4. Variation in measures of metabolism and benthic chlorophyll biomass in Fog 2 and S-6 for years 2000 – 2003. ............................................................102
Figure 3.5. Molar N:P excretion ratio of Lymnaea elodes as N-NH4 and P-PO4. ...105
Figure A1.1. Relationship of geologic surface and Ca and PO4 concentrations in lakes in the vicinity of Toolik Field Station. ...........................................................121
Figure A1.2. Compilation of benthic primary production measurements from LTER lakes (A. Giblin and G. Kipphut, unpublished data). .....................................122
Figure A1.3. Map showing the locations of survey lakes in 2000 and 2003. ...........124
Figure A1.4. Relationship between benthic N fixation from 2002 survey and benthic GPP (panel A); benthic chlorophyll a (panel B); and light as photosynthetically active radiation (PAR; panel C). ....................................................................127
Figure A1.5. Results from 9-lake survey from year 2002, arranged from young surface lakes with clear bars, intermediate surface lakes in diagonal stripes, and old surface lakes are solid dark bars...............................................................128
Figure A1.6. Benthic N fixation from a 15-lake survey from year 2000 along the chronosequence. .............................................................................................129
Figure A2.1. Depth profiles of water-column N fixation for lakes used in the benthic-water column comparison in Chapter 1..........................................................131
Figure A2.2. Relationship between water-column N fixation and light (panel A), temperature (panel B), and total chlorophyll (panel C)..................................133
Figure A2.3. Depth profiles showing seasonal water-column N fixation in Toolik Lake in 2003. ..................................................................................................134
Figure A2.4. Relationship of water-column N fixation and temperature (panel A) and light (panel B) in Toolik Lake for all data in 2003.........................................136
xiv
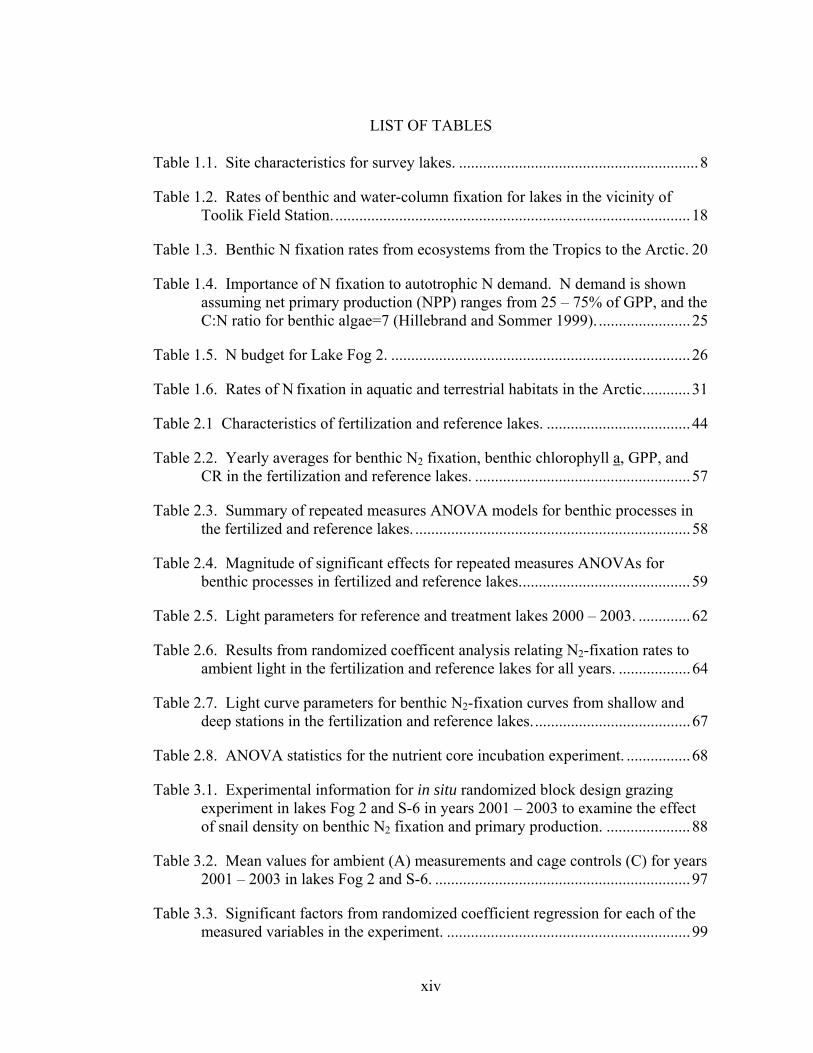
LIST OF TABLES
Table 1.1. Site characteristics for survey lakes. ............................................................8
Table 1.2. Rates of benthic and water-column fixation for lakes in the vicinity of Toolik Field Station..........................................................................................18
Table 1.3. Benthic N fixation rates from ecosystems from the Tropics to the Arctic. 20
Table 1.4. Importance of N fixation to autotrophic N demand. N demand is shown assuming net primary production (NPP) ranges from 25 – 75% of GPP, and the C:N ratio for benthic algae=7 (Hillebrand and Sommer 1999). .......................25
Table 1.5. N budget for Lake Fog 2. ...........................................................................26
Table 1.6. Rates of N fixation in aquatic and terrestrial habitats in the Arctic............31
Table 2.1 Characteristics of fertilization and reference lakes. ....................................44
Table 2.2. Yearly averages for benthic N2 fixation, benthic chlorophyll a, GPP, and CR in the fertilization and reference lakes. ......................................................57
Table 2.3. Summary of repeated measures ANOVA models for benthic processes in the fertilized and reference lakes. .....................................................................58
Table 2.4. Magnitude of significant effects for repeated measures ANOVAs for benthic processes in fertilized and reference lakes...........................................59
Table 2.5. Light parameters for reference and treatment lakes 2000 – 2003. .............62
Table 2.6. Results from randomized coefficent analysis relating N2-fixation rates to ambient light in the fertilization and reference lakes for all years. ..................64
Table 2.7. Light curve parameters for benthic N2-fixation curves from shallow and deep stations in the fertilization and reference lakes........................................67
Table 2.8. ANOVA statistics for the nutrient core incubation experiment. ................68
Table 3.1. Experimental information for in situ randomized block design grazing experiment in lakes Fog 2 and S-6 in years 2001 – 2003 to examine the effect of snail density on benthic N2 fixation and primary production. .....................88
Table 3.2. Mean values for ambient (A) measurements and cage controls (C) for years 2001 – 2003 in lakes Fog 2 and S-6. ................................................................97
Table 3.3. Significant factors from randomized coefficient regression for each of the measured variables in the experiment. .............................................................99
xv
Table 3.4. Linear regression parameters and standard errors relating snail density to N2 fixation. .....................................................................................................101
Table 3.5. LS Means estimate of Net Primary Production, Gross Primary Production, Community Respiration, and Total Chlorophyll for Lake Fog 2 and S-6 for years 2001 – 2003..........................................................................................104
Table 3.6. Comparison of results from benthic grazing studies that enumerated the response of N-fixing cyanobacteria or measured N2 fixation.........................108
Table A1.1. Lakes characteristics sampled in the 2000 survey.................................123
Table A2.1. Water-column N fixation data used in the benthic-water column comparison in Chapter 1 and for Figure A2.1. ...............................................132
Table A2.2 Summary of water-column N fixation in Toolik Lake, 2003. ................135
Table A2.3. Water-column N fixation for lake E-5...................................................137
Table A2.4. Water-column N fixation for lake E-6...................................................138
Table A2.5. Water-column N fixation for lake Fog 2. ..............................................139
Table A2.6. Water-column N fixation for lake Fog 4. ..............................................140
Table A2.7. Water-column N fixation for Toolik Lake. N fixation was measured along the same depth profile but not detected on 26 Jun 2002. .....................140
Table A3.1. Algal counts for grazing experiments described in Chapter 3. .............142
Table A3.2. Average length of filamentous cyanobacterial colonies (microns) in snail grazing experiment described in Chapter 3. ...................................................145
Table A3.3. Results from a random coefficients model to test the relationship between snail density and the total number of filamentous cyanobacterial colonies in grazing experiments conducted in lakes Fog 2 and S-6 in years 2001 – 2003.........................................................................................................................147
Table A3.4. Results from a random coefficeints model to test the relationship between snail density and the length of filamentous cyanobacterial colonies in lakes Fog 2 and S-6 in grazing experiments in years 2001 – 2003.................................147

1
CHAPTER 1
THE RATES AND IMPORTANCE OF BENTHIC AND WATER-COLUMN
NITROGEN FIXATION IN OLIGOTROPHIC ARCTIC LAKES
ABSTRACT.
N fixation in the water-column and benthic environments is prevalent across
many lakes and landscape types in arctic Alaska. Benthic N fixation rates are low
(0.12—1.5 mg N m-2day-1) relative to other measured rates in oligotrophic systems,
but areal rates of water-column N fixation are much higher (up to 2.56 mg N m-2day-1)
than rates reported in most other oligotrophic lakes and are similar to rates measured
in oligotrophic oceanic systems. Benthic and water-column N fixation in these lakes
accounts for up to 0.6—7% of autotrophic N demand; however, N fixation represents
a new input that supports new production and supplies N that is then available for
recycling many times. Benthic N fixation accounts for up to 30% of the recycled N
flux from sediments to the water column and is equal to or greater than the nitrogen
input from precipitation. Benthic N fixation comprises a significant portion (6 –
100%) of depth-integrated water-column N fixation in the epilimnion; however, water-
column N fixation comprised a significant portion (75%) of N inputs to Lake Fog 2.
This result indicates that water-column N fixation is more important to the N economy
of these oligotrophic lakes than was previously thought. Finally, N fixation in lake
ecosystems appears to equal or exceed that of terrestrial ecosystems; thus, N fixation
in lake ecosystems is important to N inputs across the arctic landscape.
INTRODUCTION.
In the Arctic, net primary production in terrestrial and aquatic habitats is
commonly limited by nitrogen (N) (Shaver et al. 1986; Levine and Whalen 2001).

2
Nitrogen deposition rates are low (Galloway et al. 2004), and primary producers in
both terrestrial and aquatic ecosystems depend on a high degree of N recycling to
satisfy their N demand (Galloway et al. 2004; Chapin and Bledsoe 1992). Biological
N fixation may be an important source of new N that can support new production,
contribute to the N pool available for short-term cycling, or make up for losses
(Alexander 1974; Barsdate and Alexander 1975; Alexander et al. 1978; Chapin and
Bledsoe 1992).
Though N fixation has been known to be important to the N budgets of
terrestrial ecosystems in the Arctic (Alexander 1974; Barsdate and Alexander 1975;
Alexander et al. 1978; Chapin and Bledsoe 1992; Weiss et al. 2005; Hobara et al. In
press), much less is known about the role of N fixation in aquatic ecosystems.
However, lakes in the Arctic are commonly N-limited, either alone or in conjunction
with phosphorus (Levine and Whalen 2001), and N limitation may be in part
maintained by slow rates of N fixation (Howarth et al. 1988).
In oligotrophic lakes, benthic processes are often important. Because water-
column production is low, light penetration is deep; as a result, littoral zones can
comprise a significant portion of lake area (Ramlal et al. 1994). Benthic algae can
contribute significantly to whole-lake productivity (Wetzel 1964; Vadeboncoeur et al.
2001), and N-fixing filamentous cyanobacteria are common on sediment surfaces
(Moeller and Roskoski 1978; Loeb and Reuter 1981). Thus, inputs of new N through
benthic autotrophic N fixation may be important to whole-lake N budgets. For
example, Bergman and Welsch (1990) found that benthic N fixation could account for
16% of the N inputs to an oligotrophic, arctic pond in the Northwest Territories,
Canada. In Lake Tahoe, benthic N fixation accounts for up to 32% of total N input to
the lake (fixation data from Reuter et al. 1986; loading data from Rast and Lee 1978,
as reported in Howarth et al. 1988), and benthic N fixation contributes up to 30 – 93%

3
of inorganic N uptake by the periphyton community (Reuter et al. 1986). Higgins et
al. (2001) found that epilithic N fixation in Lake Malawi accounted for 36% of total N
inputs, nearly equaling inputs from atmospheric and riverine sources; furthermore,
epilithic N fixation exceeded N input from water-column N fixation.
In contrast with benthic environments, studies in water-column environments
in oligotrophic lakes have generally indicated that N-fixation rates are rather low and
comprise a small portion of total N inputs (Howarth et al. 1988). However, water-
column measurements of N fixation in oligotrophic lakes are rare, and several lines of
evidence suggest that N fixation may be more prevalent than was previously thought.
For example, MacGregor et al. (2001) showed that 15N was close to the atmospheric
signature, indicating inputs from N fixation at 15 m depth in Lake Michigan; and they
also demonstrated that the nifH gene, which encodes the Fe protein component for the
nitrogen-fixing enzyme, nitrogenase, is prevalent through the water column. Although
presence of the nifH gene is not conclusive evidence for N fixation, Zani et al. (2000)
showed using reverse-transcriptase polymerase chain reaction (RT-PCR) that the
expression of the nifH gene was prevalent in Lake George, a mesotrophic lake in
upstate New York. In oligotrophic oceans, isotopic 15N signatures in nitrate and
particulate N pools indicate significant inputs of depleted 15N, presumably from N
fixation (e.g., Montoya et al. 2004), and unicellular cyanobacteria have also been
shown to contribute significantly to oceanic N budgets (Montoya et al. 2004; Zehr et
al. 2001), even though they were previously thought to be unimportant. Despite these
insights, however, measured rates of N fixation in oligotrophic lakes remain sparse.
The conclusions reached in these studies contrast with previous work in
oligotrophic lakes in the Alaskan Arctic, which indicated that N-fixation rates were
too low to be important to lake N budgets. Alexander et al. (1989) concluded that in
situ N fixation is a minor source of nitrogen to the thaw ponds near Barrow, Alaska,

4
when compared with the role of N fixation in terrestrial budgets. Alexander et al.
(1989) further hypothesized that neither benthic nor water-column N fixation was
important to the N budget of Toolik Lake, an oligotrophic lake in Arctic Alaska
(Arctic Long Term Ecological Research Site). It appears that N fixation is potentially
important in other oligotrophic systems, but contradictory conclusions resulting from
very few studies in northern latitudes indicate that more work is needed.
Here I present the results of survey work in which rates of benthic and water-
column N fixation were compared in lakes across a variety of landscape types present
in the vicinity of Toolik Field Station (Arctic LTER database
http://ecosystems.mbl.edu/arc/default.htm), North Slope Alaska. I also evaluate the
importance of N fixation in the context of other N inputs and outputs by constructing
an N budget for one lake. This budget uses values published from the literature in
conjunction with seasonal measurements of benthic and water-column N fixation
during one field season. Finally, I compare my measured N fixation rates with other
rates from terrestrial and aquatic ecosystems in the Arctic.
METHODS.
Site Description.
Toolik Field Station is located in the northern foothills of the Brooks Mountain
Range in arctic Alaska (68o37′N, 149o35′W) about 150 miles north of the Arctic Circle
(Figure 1.1). The area is underlain by continuous permafrost, and lakes in the region
are generally shallow (3 – 15 m) glacial kettles. Maximum epilimnetic temperatures
range from 13 – 18 °C, and summertime depth to thermocline is about 5 m. Lakes are
typically dimictic, and ice-free season occurs mid-June to mid-September (Artic
LTER database Miller et al. 1986). The most important feature of lakes in this
landscape is that they are ultra-oligotrophic (Miller et al. 1986), and water-column
5
concentrations of ammonium, nitrate, and phosphate are near detection limit, with
concentrations below 0.1 μM (Artic LTER database). Water-column 14C-primary
production is low, ranging from 12 – 16 g C m-2year-1 (Miller et al. 1986). Because
water column production is low, bottom O2 concentrations remain high throughout the
summer (7 – 8 mg l-1). Secchi depth ranges 6 – 10 m in the summer, and the 1% light
level occurs as deep as 16 m in some lakes (Arctic LTER database).
In the vicinity of Toolik Field Station, Pleistocene valley glaciations have
occurred for periods of time between 12,000 to 800,000 years before the present
(Hamilton 2003). Three dominant advances and retreats occurred in nearby drainages,
exposing landscapes at different times. The oldest landscape, the Sagavanirktok, was
exposed 250,000 – 800,000 years ago; the intermediate landscape resulted from
Itkillik II glaciation and was exposed 25,000 – 50,000 years ago; and the youngest
landscape resulted from the Itkillik I glaciation and was exposed 10,000 – 12,000
years ago.
I conducted a survey across these different landscapes to measure benthic and
water-column N fixation and benthic productivity. I also performed more extensive
sampling of a lake on a younger surface in 2003 in order to assess the importance of N
fixation to primary production and overall N budget in more detail. The locations of
these lakes are shown in Figure A1.1.

6
Figure 1.1. Map of Alaska showing the location of Toolik Field Station, Arctic LTER (68o37′N, 149o35′W)
Surveys. Surveys of benthic and water-column N fixation were conducted in
mid-summer 2002 in which three lakes on the three glacial surfaces were visited via
helicopter and sampled once during the summer sampling season (total of 9 lakes). To
this data set, I added information from subsequent years or from other lakes that were
also visited in mid-July in 2002 or 2003. Some of these included regularly sampled
lakes as part of the Arctic LTER. To compare LTER lakes with survey lakes, I used
only one-time sampling in July even if lakes were more regularly sampled. These
lakes ranged in size from 1,785 m2 to 1,446,485 m2 and in depth from 3 – 22 m. The
lakes also had variable light extinction coefficients, ranging from 0.5 – 1.7 (Table 1.1).
Lakes on the older surfaces were generally more dilute, with specific conductivities
7
ranging from 6 – 7 μS cm-1 oC, whereas lakes on the younger surfaces ranged from
133 – 333 μS cm-1 oC (Table 1.1).
Five replicate sediment cores that had an intact mud–water interface were
collected using SCUBA at 3 m in each lake for benthic N fixation and production
measurements (described below). In addition to sediment cores, five replicate water-
column samples were collected from a raft at the epilimnion (1 m depth), the
metalimnion (at the thermocline; typically 3 – 5 m) and the hypolimnion (1 m from the
bottom of the lake). Other water-column parameters, including chlorophyll a, NH4+,
NO3- and soluble reactive phosphorus (SRP), were characterized according to methods
described in the Artic LTER lake protocols.

8
Table. 1.1. Site characteristics for survey lakes.
Lake Surface Lake Area (m2)
Watershed Area (m2) Depth (m) Conductivity
(μS cm-1 oC)
Vertical light extinction coefficient
NE-12 Itkillik I 69980 1167776 14 145.0 0.9 Fog 2 Itkillik I 60151 456764 16 135.3 0.5 Fog 4 Itkillik I 20624 260987 3 175.0 1.3 S-6 Itkillik I 6673 60717 7 168.3 0.7 NE-9B Itkillik I 1785 138255 7 335.0 1.5 GTH 33 Itkillik II 26880 716257 11 19.7 1.5 GTH 61 Itkillik II 127065 870131 4 63.4 0.7 GTH 74 Itkillik II 50557 1067605 6 25.3 1.2 GTH 83 Sagavanirktok 13060 219331 6 16.7 1.2 GTH 85 Sagavanirktok 37359 3606810 7 8.7 1.4 GTH 86 Sagavanirktok 31260 1436577 9 7.0 1.7 Toolik Itkillik 1 and II 1446485 5584768 22 40.0 1.0

9
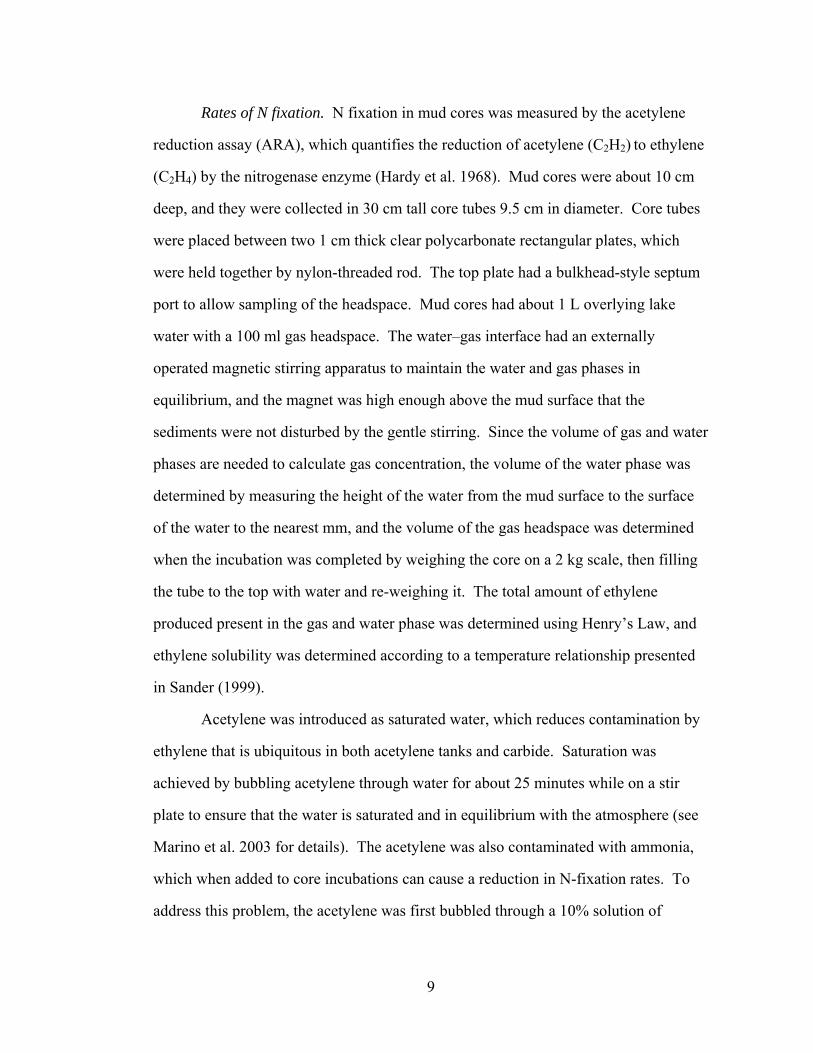
Rates of N fixation. N fixation in mud cores was measured by the acetylene
reduction assay (ARA), which quantifies the reduction of acetylene (C2H2) to ethylene
(C2H4) by the nitrogenase enzyme (Hardy et al. 1968). Mud cores were about 10 cm
deep, and they were collected in 30 cm tall core tubes 9.5 cm in diameter. Core tubes
were placed between two 1 cm thick clear polycarbonate rectangular plates, which
were held together by nylon-threaded rod. The top plate had a bulkhead-style septum
port to allow sampling of the headspace. Mud cores had about 1 L overlying lake
water with a 100 ml gas headspace. The water–gas interface had an externally
operated magnetic stirring apparatus to maintain the water and gas phases in
equilibrium, and the magnet was high enough above the mud surface that the
sediments were not disturbed by the gentle stirring. Since the volume of gas and water
phases are needed to calculate gas concentration, the volume of the water phase was
determined by measuring the height of the water from the mud surface to the surface
of the water to the nearest mm, and the volume of the gas headspace was determined
when the incubation was completed by weighing the core on a 2 kg scale, then filling
the tube to the top with water and re-weighing it. The total amount of ethylene
produced present in the gas and water phase was determined using Henry’s Law, and
ethylene solubility was determined according to a temperature relationship presented
in Sander (1999).
Acetylene was introduced as saturated water, which reduces contamination by
ethylene that is ubiquitous in both acetylene tanks and carbide. Saturation was
achieved by bubbling acetylene through water for about 25 minutes while on a stir
plate to ensure that the water is saturated and in equilibrium with the atmosphere (see
Marino et al. 2003 for details). The acetylene was also contaminated with ammonia,
which when added to core incubations can cause a reduction in N-fixation rates. To
address this problem, the acetylene was first bubbled through a 10% solution of
10
sulfuric acid to trap ammonium in solution, resulting in ammonium concentrations that
were similar to lake-water concentrations near detection. Incubations lasted 4 – 6
hours, over which ethylene production was linear. Ethylene samples were analyzed on
a Shimadzu GC 8-A Flame Ion Detector (FID) using a Porapak N column, mesh size
80/100.
Soils and sediments can contain heterotrophic bacteria known to consume
ethylene (Elsgaard and Andersen 1998; Jackel et al. 2004), whereas diatoms and
higher plants can produce ethylene (Abeles et al. 1992; Lee and Baker 1992), so I
collected cores to apply corrections for ethylene production and consumption.
Ethylene was rarely produced without the presence of acetylene, but ethylene
consumption was linear and ranged from 5 – 15 % over the course of the incubations.
Corrections were minor and did not change qualitative results.
Moles of ethylene produced were converted to moles of N2 fixed by assuming
a 3:1 conversion factor. Although the relationship between moles of ethylene
produced and moles of N2 fixed is not always fixed at the assumed 3:1 value (Graham
et al. 1980; Seitzinger and Garber 1987), other measured conversion factors for
cyanobacteria from benthic environments are reasonably constrained, ranging from 1.9
to 5.4 (Howarth et al. 1988). Using a 3:1 conversion ratio also allows us to compare
with the vast majority of other studies that also use this ratio to report and compare
among measurements (e.g., Howarth et al. 1988; Alexander et al. 1989; Grimm and
Petrone 1997; Higgins et al. 2001).
N fixation in water samples was measured according to methods described in
Marino et al. (2003). Briefly, water samples were collected and filtered through fine
mesh zooplankton net (335 micron) to remove large grazers. Ninety ml of sample
were poured into 110 ml glass serum bottles, and 10 ml of acetylene-saturated water
were added. Bottles were immediately capped and placed in the incubation tank.

11
Ethylene consumption and production blanks were also included, but no ethylene
production was ever measured, and ethylene consumption was likely a result of
analytical error rather than consumption processes. After 4 – 6 hr, samples were
equilibrated by shaking for 2 minutes according to Flett et al. (1976), and samples
were withdrawn and analyzed using a gas chromatograph as above. Although
conversion factors for water-column production are more variable than for benthic
environments (Howarth et al. 1998), ethylene production was also converted to
nitrogen fixation rates using the same 3:1 conversion factor for moles of ethylene
produced to moles of N2 fixed.
Gross Primary Production. Measures of benthic metabolism were made using
a chamber design similar to the ARA. Core tubes were again placed between two 1
cm thick clear polycarbonate rectangular plates, which were held together by four
nylon-threaded rods. The top plate had a water-filled port to allow the insertion of a
data-logging WTW Oxi 340i O2 probe while preventing the chamber from
experiencing air exchange with the atmosphere. Changes in oxygen consumption and
production were recorded every 15 minutes over periods of dark and ambient lake
light levels, each lasting approximately 12 hours. The probe was approximately 15 cm
above the surface of the sediment and had a magnetic stirrer attached to its tip that
kept the membrane from consuming oxygen. This stirrer and the floating stirrer were
operated by the external magnetic stirrer as described above. Incubations were done at
ambient lake light and temperature. Gross Primary Production (GPP) was calculated
as the rate of O2 production during the light period of the incubation and multiplied by
24 hours (there are 24 hours of daylight during summer months in the Arctic) and
summed with estimates of respiration, which was calculated as the rate of O2
consumption during the dark period and multiplied over 24 hours. This method
assumes that respiration that occurs in the daylight is equal to nighttime respiration
12
(Wetzel and Likens 1991; Strickland and Parsons 1972). However, recent work has
shown that daytime respiration is likely higher than dark respiration due to
mitochondrial respiration, photorespiration, and the Mehler Reaction (Roberts 2004).
Therefore, this method likely underestimates GPP, although it is commonly used
(Howarth and Michaels 2000).
In order to assess the proportion of autotrophic N demand met by N fixation in
benthic habitats, I assumed that the algal C:N molar ratio is 7 based on an analysis by
Hillebrand and Sommer (1999) for benthic algae. NPP was calculated as the
proportion of GPP ranging from 25 – 75% because determining actual NPP from GPP
is not possible (Falkowski and Raven 1997). To compare the importance of water-
column N fixation to primary production, I used 14C-production measurements
published in Miller et al. (1986), assuming that 14C production was an approximate
measure of NPP and that phytoplankton have a molecular C:N ratio = 106:16
(Redfield 1958).
Site description and intensive sampling, Lake Fog 2. Fog 2 is a headwater lake
on the youngest surface (12,000 years old). It has no inlet stream, and inputs of water
are a result of sheet flow. Inputs of cations and anions are probably high as Fog 2 has
a relatively high conductivity (150 μS cm-1). Water-column chlorophyll a is 1.8 μg
L-1, and water-column nutrients are near the analytical detection limit. Fog 2 has a
surface area of 5.6 ha, a maximum depth of 20 m, and an average depth of 7.8 m, and
the watershed-to-lake area ratio is high at 7.6. Incubation experiments of water-
column production show strongest responses to N addition followed by N & P
addition, indicating primary N limitation and secondary P limitation (Gross et al.
unpublished data). Fog 2 has relatively high rates of benthic production (up to 300 mg
C m-2 day-1).

13
Benthic and water-column N fixation were measured 3 times throughout the
summer of 2003 to evaluate the importance of N fixation to other sources of N inputs.
Benthic N fixation was measured at 3 – 5 m and 5 – 8 m depths in a similar manner as
described for survey lakes above. Water-column fixation measurements were also
made 3 times throughout the season at depth intervals including 0, 1, 3, 5, 8, 12, and
15 m.
Construction of N budget for Lake Fog 2.
Rates of N fixation. Previous work indicates that there is no clear seasonal
pattern in benthic or water-column N fixation rates throughout the summer (Chapter 2;
Appendix 2), so estimates of N fixation were averaged to obtain an average daily N-
fixation rate and multiplied by the length of the growing season, considered to be 60
days from 15 June – 15 August. Biological activity is assumed to be low or
nonexistent in winter months, so estimates of growing-season rates are taken to be
representative of annual rates. This is probably an underestimate of the annual rates
because significant microbial activity has been shown to occur under the ice and
during spring runoff events (O’Brien et al. 1997; Crump et al. 2003); in addition, I did
not sample through ice-up, which typically occurs in early- to mid-September (Arctic
LTER database.) However, this assumption allowed a comparison of this work with
previous work conducted at the Toolik Lake field site (e.g., Whalen and Cornwell
1985; Alexander et al. 1978).
The annual estimate of N fixation between 3 – 5 and 5 – 8 meters was achieved
by multiplying the seasonal estimate by the area of the lake bottom between 3 – 5 and
5 – 8 m depth profiles. The estimate below 8 m in Fog 2 was based on extrapolations
of a N fixation–Irradiance (NI) curve generated for Fog 2 from 7 m (Gettel, Chapter
2). The curve was used to extend measurements down to the 2% light level in Fog 2,

14
which is on average at 12 m. Since this NI curve was developed on an areal basis
rather than a biomass basis, using this curve may overestimate N fixation if
cyanobacteria are less abundant at deeper depths; however, NI curves showed a
similar alpha (initial response to light) at 3 and 7 m, indicating that this assumption
may be reasonable (Chapter 2).
Runoff. Lake Fog 2 does not have an incoming stream, so inputs to the
watershed are a result of sheet flow. Because inputs due to sheet flow are difficult to
measure, a range of estimates were determined from other published studies conducted
in nearby watersheds. Areal estimates of runoff from the Kuparuk River watershed
(100 mg N m-2 year-1; Peterson et al. 1992) and the Toolik Lake watershed (3,966 mg
N m-2 lake area-1 year-1; Whalen and Cornwell 1985) were scaled to the area of the Fog
2 watershed and the area of the lake (units of input from runoff are in mg N m-2 of the
lake). For the third estimate, I used estimates of N losses from various vegetation
types from the Imnaviat watershed from Shaver et al. (1990). The dominant vegetation
type in the Fog 2 watershed is dry acidic heath and moist acidic tundra (Walker et al.
1994), and in the Shaver et al. (1990) study, N losses from dry acidic heath and moist
acidic tundra were 7 mg N m-2year-1 and 18.6 mg N m-2year-1, respectively. These
losses were calculated from empirical measurements of N concentrations in soil water
and estimates of water loss from the entire watershed, which was based on the
difference between measured precipitation inputs and evapotranspiration (75 L m-2
year-1). I considered this estimate of N inputs to Fog 2 via runoff to be the “best
guess” since estimates from the Kuparuk River and Toolik Lake watersheds integrate
losses over landscapes of different geologic surfaces and vegetation types that do not
exist in the Fog 2 watershed (Walker et al. 1994; Hamilton 2003). Toolik and
Kuparuk watersheds also have lake chains in their headwaters, which could affect

15
nutrient output (Kling et al. 2000). The value calculated from this best guess is
represented in parentheses in the budget table.
N return from sediments and losses of N by burial. Loss of N in Fog 2 due to
burial was estimated from Toolik Lake measurements, which was estimated as 294 mg
N m-2year-1 using estimates developed by Whalen and Cornell (1985). Sediment
budgets were constructed in which inputs were calculated from data from sediment
traps that were deployed for summer months and extrapolated year-round and
compared with sedimentation rates determined using 210Pb sediment profiles and
aluminum : nutrient ratios (Whalen and Cornwell 1985). Measurements of N
accumulation under the ice during the winter and from depth-sediment profiles were
used to estimate net N mineralization as 154 – 308 mg N m-2 year-1 (Whalen and
Cornwell 1985; Alexander et al. 1989). Because data on annual N flux or
sedimentation from Fog 2 are not available, these Toolik Lake estimates were used.
Lake Fog 2 and Toolik Lakes are similar in some important respects; both are deep
oligotrophic lakes; much of the watershed in Toolik is also on the young (12,000 year)
surface; both lakes have similar water-column chlorophyll a concentrations (~1.5 μg
L-1 ), particulate carbon concentrations (25 – 30 μM), and sediment organic content of
12 – 18%.
Losses due to denitrification and stream outflow. Gaseous losses due to
denitrification are difficult to assess in oligotrophic systems because measurements are
sparse and extremely variable. There is one study available for Toolik Lake
(Klingensmith and Alexander 1983), but this study probably reports underestimates of
denitrification because the acetylene block method, which inhibits nitrification and
therefore the supply of nitrate, was used. Therefore, I also considered two other
studies from oligotrophic lakes: central Ontario lakes (Molot and Dillon 1993), and
Lake Otrasket in northern Sweden (Jonsson and Jansson 1997) which reported ranges

16
in losses from 1 – 1268 mg N m-2year-1, both using sediment-budget techniques. I
used this range to calculate gaseous losses, but because Fog 2 and Toolik Lake are
more similar to one another than are the lakes in these studies, I considered the Toolik
measurement (318 mg N m-2year-1) to be the best-guess estimate.
Losses from one outlet stream required information on discharge and N
concentration. Since stream-discharge information is not available, I used estimates of
runoff and evapotranspiration from Shaver et al. (1990) and assumed that lake volume
remains constant on a yearly time scale. Shaver et al. (1990) estimated runoff to be 75
L m-2 year-1 (34,257 m3 of runoff for Fog 2) and evapotranspiration to be 76 L m-2
year-1 (4298 m-3 year-1 from the surface of Fog 2). The balance of runoff and
evaporation leaves 29,998 m3 of water per year exiting the lake through stream flow.
Since the small outlet stream is frozen solid over the winter, I assume that most of the
discharge occurs in the summer. The output of N from stream flow was estimated by
using depth-profile measurements of summertime TDN and particulate N (PN) from
Lake Fog 2 as described above (Arctic LTER database). Because concentrations did
not vary with depth, the summertime average was calculated by averaging the depth
profile information over three dates in 2003.
RESULTS AND DISCUSSION.
Prevalence of N fixation across the landscape. Benthic N fixation was
detected in all survey lakes and ranged from 0.2 – 1.5 mg N m-2 day-1 and averaged
0.53 mg N m-2 day-1 (Figure 1.2, Table 1.2). Water-column N fixation was detected in
all but one survey (lake S-6) and ranged from 0.37 – 1.62 μg L-1 (See Appendix 2 for
depth-profile information). On an areal basis, water-column fixation integrated over 3
m ranged from 0 – 2.56 mg N m-2day-1 and averaged 1.6 mg N m-2 day-1 (Figure 1.2,
Table 1.2). Integrated over 3 m depth, total N fixation ranged from 21 to 276 mg N

17
m-2 year-1. The portion that benthic N fixation contributed to the total integrated rate
(benthic + water column) at 3 m was variable from lake to lake, ranging from 6 to
100%, and averaged 28%. In one case (lake S-6), no water-column fixation was
detected, and benthic N fixation accounted for 100% of the integrated areal rate. In
some lakes, benthic N fixation was nearly equal to water-column rates (GTH 85, GTH
74). In most other lakes, benthic N fixation was 10 – 20% of the total integrated rate
at 3m.
0
0.5
1
1.5
2
2.5
3
NE-12Fog
2Fog
4 S-6
NE-9B
GTH 33
GTH 61
GTH 74
GTH 83
GTH 85
GTH 86Too
lik
mg
N m
-2 d
ay-1
@ 3
m
Water ColumnBenthic
Figure 1.2. Benthic N fixation (black bars) and water-column N fixation (stippled bars) in survey lakes conducted in the vicinity of Toolik Field Station, Alaska.

18
Table 1.2. Rates of benthic and water-column fixation for lakes in the vicinity of Toolik Field Station. The annual rate assumes a 60-day growing season (see text).
Lake Benthic N
fixation at 3m (mg N m-2 day-1)
Water-column N fixation integrated
over 3m (mg N m-2 day-1)
Total annual N fixation at 3m
(mg N m-2 year-1)
% Benthic N fixation of total integrated at 3m
Water-column N fixation integrated over
entire water column (mg N m-2 day-1)
NE-12 0.38 2.5 173 13 7.62 Fog 2 0.4 1.39 107 23 6.69 Fog 4 0.14 2.15 137 6 2.15 S-6 0.36 0 22 100 0 NE-9B 0.54 1.83 142 23 3.22 GTH 33 0.12 0.88 60 12 2.72 GTH 61 0.55 1.91 148 22 2.54 GTH 74 1.5 2.29 227 40 3.62 GTH 83 0.18 1.16 80 14 3.14 GTH 85 0.86 0.94 108 48 1.91 GTH 86 0.76 2.56 199 23 4.27 Toolik 0.29 1.69 119 15 10.44

19
The results from the survey show that both benthic and water-column N
fixation are present in lakes across many different landscape types in arctic Alaska.
Benthic N fixation comprised a significant portion of the integrated areal rates of N
fixation; however, water-column N fixation was surprisingly important, contributing
more to the areal rates of N fixation than has been documented for oligotrophic lakes
elsewhere (e.g., Howarth et al. 1988 review). The contribution of water-column N
fixation to the total integrated areal rate is underestimated because data from the
survey lakes integrated only in the epilimnion up to 3 m. When water-column N
fixation rates are integrated over the depth of the entire lake (depths listed in Table
1.1; data in Table 1.2), the areal rates are up to as much as 6 times higher. These
results indicate that N input via fixation in both the benthos and water column is a
significant N input in lakes across the arctic landscape.
Rates of benthic N fixation measured in this study are generally lower than, but
of the same magnitude as, rates reported for other oligotrophic lakes sediments in high
altitudes, (0.2 – 1.5 mg N m-2day-1 in this study vs. 2 – 11 mg N m-2 day-1 in others
[Table 1.3]). Compared to benthic N fixation in oligotrophic systems in lower
latitudes, however, arctic rates are generally lower by two orders of magnitude (e.g., 1
– 180 mg N m-2day-1 in lower latitudes) except in a few instances where tropical salt-
water systems are also very low, exhibiting fixation rates similar to those found in this
study. The difference in these rates may be due to a number of environmental factors,
including low light and temperature regimes, but more research is needed to
understand why benthic rates in the Arctic appear to be generally lower than those in
other oligotrophic systems.

20
Table 1.3. Benthic N fixation rates from ecosystems from the Tropics to the Arctic.
Habitat Original
reported Units mg N m-2 day-1 Reference Notes
Algal Mats and Periphyton, Tropical and Subtropical Marine algal turf - Caribbean coral reef (Tague Bay, St. Croix) nmol C2H4 cm-2 hr-1 8 Williams and Carpenter 1997 a algal turf - (Britomart Reef, Great Barrier Reef, Australia) nmol C2H4 cm-2 hr-1 81 Wilkinson and Sammarco 1983 a algal turf (Eneewetak Atoll, Marshall Islands) nmole N cm-2 hr-1 180 Wiebe et al. 1975 a coral reef - (Great Barrier Reef, Australia) nmol C2H4 cm-2 hr-1 3 Wilkinson et al. 1984 b cyanobacterial mat - high saline coastal lagoon (Storr's Lake,
Bahamas) μmol C2H4 m-2 hr-1 0.0 Pinckney et al. 1995 a
cyanobacterial mat - low saline coastal lagoon (Pigeon Creek Lake, Bahamas)
μmol C2H4 m-2 hr-1 1 Pinckney et al. 1995 a
Freshwater
mixed cyanobacterial mat - desert stream (Sycamore Creek, Arizona)
mg N m-2 day-1 83 Grimm and Petrone 1997 c
Anabeana - desert stream (Sycamore Creek, Arizona) mg N m-2 day-1 144 Grimm and Petrone 1997 c epilithic algae - desert stream (Sycamore Creek, Arizona) mg N m-2 day-1 42 Grimm and Petrone 1997 c periphyton - Amazonian floodplain lake (Lake Calado,
Brazil) mmol N m-2 day-1 32 Doyle and Fisher 1994 d
periphyton - Amazonian floodplain lake (Lake Batata, Brazil)periphyton- tropical lake (Lake Malawi)
nmol N dm-2 hr-1
mg N m-2 day-1
0.5
13
Enrich-Prast and Esteves 1998 Higgins et al. 2001
e
f Notes: aDaytime hourly rate X 12 hours (tropics); baverage of outer reef, inner reef, and middle-shelf reefs, used daytime hourly rate X12 hours (tropics); cdaytime incubation, chamber with flow incubation; dcalibrated with 15N, periphyton growing on macrophytes, number is integrated over year-round sampling and light and dark incubations, estimate is the mean between 1989 and 1990 N-fixation rates; eone-day experiment during July flood phase, periphyton associated with culms of a macrophyte, Oryza glumaepatula Steud; fhourly rate from averaged mean rates form 2 m depth at 5 sites, conversion factor is 4:1; gno activity was observed late autumn through spring, so assumed 175 days of activity in late spring through mid autumn; hintegrated over whole year, so converted to daily units by dividing by 365 and converted to areal units by dividing by surface area of pond; calibrated with 15N; iAcetylene Reduction (using 3:1) conversion factor, unvegetated sand and mud is a mean of those habitats (n=3), periphyton community is also mean (N=3). Assumed 10 hours for per day; jmaximum rate kmaximum hourly rate X 20 hours, daylight (arctic, August); lcited from Bergman and Welch (1990), maximum hourly rate x 10 hours daylight (Aug – Sept.)

21
Table 1.3. (Continued).
Habitat Original
reported Units mg N m-2 day-1 Reference Notes
Algal Mats and Periphyton, Temperate and mid latitudes Freshwater Moss and wood substrate - Coniferous forest stream (A.J.
Andrews Experimental Forest, Oregon) g N m-2 yr-1 4 Triska et al. 1984 g
Nostoc - oligotrophic pond sediment (Mare's Egg Spring, Oregon)
Unvegetated sand and mud – (Mirror Lake, NH) Periphyton, including Nostoc and Anabeana colonies (Mirror
Lake, NH)
moles N yr-1
μgm N m-2 hr-1
μgm N m-2 hr-1
11
0.2
3
Dodds and Castenholz 1987 Moeller and Roskoski 1977 Moeller and Roskoski 1978
h
i
i Algal Mats and Periphyton, Alpine and Arctic
Freshwater
Nostoc sp.- seasonal mountain stream (Rocky Creek, California)
mg N m-2 yr-1 11 Horne and Carmiggelt 1975 j
periphyton - arctic lake (Spring Lake, NWT, Canada) mg N m-2 hr-1 11 Bergmann and Welch 1990 k periphyton - mountain lake (Crater Lake, CA) mg N m-2hr-1 2 Loeb and Reuter 1981 l periphyton - mountain lake (Lake Tahoe, CA) mg N m-2hr-1 3 Loeb and Rueter 1981 l periphyton - mountain lake (Fallen Leaf, CA) mg N m-2hr-1 1 Loeb and Rueter 1981 l periphyton - mountain lake (Donner, CA) mg N m-2hr-1 2 Loeb and Rueter 1981 l periphyton - mountain lake (Castle, CA)
mg N m-2hr-1 2 Loeb and Rueter 1981 l

22
The water-column rates presented here show very different results from the
benthic N fixation data when compared with measured rates in other oligotrophic
systems. Water-column N fixation rates are 2 – 3 orders of magnitude higher than
water-column N fixation rates in oligotrophic lakes in Ontario and the Great Lakes,
which range from 0 – 0.3 mg N m-2 year-1 as reported by Howarth et al. (1988). In
fact, the maximum water-column rate in our study approaches the minimum reported
rates for eutrophic lakes in the Howarth et al. (1988) review, which ranged from 200 –
9,200 mg N m-2 year-1. The rates in these lakes are the same order of magnitude as
many studies reporting areal rates of N fixation in oligotrophic oceanic regions, which
range from 0.03 – 55.37 mg N m-2day-1 from the North Pacific, Arabian Sea, North
Atlantic, and Caribbean as summarized in Capone et al. (2005) and Montoya et al.
(2004). The results in this study add to the growing body of evidence in both
freshwater and oceanic systems that N fixation in oligotrophic systems may be more
prevalent than was previously thought.
In one of the only other studies that has published data on N fixation in Toolik-
area lakes, Alexander et al. (1989) used the same analytical technique (acetylene
reduction assay), to measure water-column and benthic N fixation in Toolik Lake in
1976, 1979, and 1980. They detected nitrogenase activity in every sample during
1976 and found that water-column rates were similar to data presented here (2.2 – 11.6
mg N m-2 day-1). They also presented benthic N-fixation rates that when multiplied
over a 5 cm depth to calculate an areal rate show 0.14 mg N m-2 day-1, also well within
the range of the estimates shown in this study. Although Alexander et al. (1989)
found similar rates in their 1976 survey, they did not detect the same spatial and
temporal extent of nitrogenase in subsequent surveys in 1979 and 1980 in Toolik
Lake. I also found that water-column N fixation was not always detectable (as in Lake
S-6 and early in the season in some lakes; Appendix 2). However, water-column N

23
fixation was detected throughout the season in Lake Fog 2, and in most other lakes
most of the time. Water-column N fixation dominated areal rates of total integrated N
fixation in most of the lakes sampled for this study. More work is needed to document
the seasonal dynamics of water-column N fixation to evaluate its contribution over
time.
Importance of N fixation to primary production and N return from sediments.
Little is known about how much N fixation contributes to primary production, though
it is thought to be rather small even in productive ecosystems because most of the
demand is met by recycling (Howarth et al. 1988). Using estimates from Miller et al.
(1986) for water-column production in Toolik Lake, water-column N fixation accounts
for, on average, 3 – 7% of N demand by primary production. Howarth et al. (1988)
also show that N fixation for planktonic systems is generally low (0.3 – 8.9%), even in
eutrophic systems when N fixation rates are high. This contribution is also similar to
results from benthic habitats where the average contribution of N fixation to NPP in
the survey lakes varied from 0.21% – 4.02%. Most of this variation is due to variation
in rates of N fixation, and not to the variation in the range of NPP to GPP I assume
(25% to 75%; Table 1.4).
Although the contribution of N fixation to primary production is small for both
benthic and water-column habitats, N fixation contributes to the recycled pool of
available N, which can fuel primary production many times. For example, the N
return from the sediments of Toolik Lake is 154 – 308 mg N m-2 year-1 (Whalen and
Cornwell 1985; Alexander et al. 1989) and assumed to be similar for Fog 2 (Table
1.5). Given a 60-day growing season, benthic N fixation at 3m in Toolik Lake is 17.3
mg N m-2 year-1 and accounts for 5.5 – 11% of this N-flux. Using the more detailed
depth-integrated measurement of N fixation from Lake Fog 2, benthic N fixation
contributes a similar amount, 8 – 16 % of the flux. Water-column N fixation exceeds

24
this return from the sediments by a factor of about 2, but water-column N fixation may
not be important to this flux if recycling occurs predominately in the water column.
These results indicate that N fixation is important to the inorganic N pool in lake
sediments and comprises a significant portion of the N flux from sediments on an
annual basis. Because N fixation contributes to the pool of N available for recycling,
it is also useful to evaluate the importance of N fixation relative to other inputs.
Fog 2 budget and importance of N fixation relative to other N inputs.
Although the uncertainty in estimates for inputs and outputs for nitrogen is wide, best-
guess estimates show that the budget is nearly balanced, with outputs exceeding inputs
by about 2145 g N year-1 (37 mg N m-2 lake area-1 year-1), or about 5.7% of the total
input (Table 1.5). Using best-guess estimates, the largest losses of N in Fog 2 appear
to be burial and denitrification (42 and 45%, respectively), while losses due to stream
outflow are low (about 12.5% of total output). N return from sediments in Fog 2 is
about 23 – 50% of inputs, indicating that recycling is probably important to the N
economy of this lake.
Benthic N fixation was the smallest source of N to the lake at about 1% of the
total inputs at 6 mg N m-2 year-1 (Figure 1.3; Table 1.5). The next largest source was
precipitation at 25 mg N m-2 year-1, or 3% of total inputs. Watershed inputs were the
second largest source of N to the lake at 141 mg N m-2 year-1 (21% of total). Water-
column N fixation dominated the N inputs to Lake Fog 2, contributing 491 mg N m-2
year-1, or 74% of the N inputs to Lake Fog 2 (Figure 1.3; Table 1.5).

25
Table 1.4. Importance of N fixation to autotrophic N demand. N demand is shown assuming net primary production (NPP) ranges from 25 – 75% of GPP, and the C:N ratio for benthic algae=7 (Hillebrand and Sommer 1999).
Lake GPP N Demand
(mg N m-2 day-1) % N demand met by
N fixation Fog 2 227 ± 42 10.03 - 20.08 1.34 - 4.02 NE-12 388 ± 24 17.11 - 51.33 0.74 - 2.22 S-6 812 ± 25 35.83 - 107.49 0.58 - 1.75 GTH 33 174 ± 14 7.69 - 23.07 0.81 - 1.61 GTH 61 473 ± 28 20.86 - 62.57 0.88 - 2.63 GTH 74 520 ± 21 22.94 - 68.82 2.18 - 6.54 GTH 83 677 ± 82 29.85 - 89.56 0.21 - 0.62 GTH 85 724 ± 65 31.94 - 95.83 0.90 - 2.70 GTH 86 145 ± 51 6.41 - 19.22 0.40 - 1.2

26
Table 1.5. N budget for Lake Fog 2. The column labeled “Total N” is the amount of N per year entering, leaving, or being recycled in the entire lake. The column labeled Fog 2 is the Total N scaled to areal rates for Fog 2. These numbers were computed
by using the data presented in the “measurement” and the “scaling factor” columns. The estimates in parentheses are the best estimates for the budget based on considerations and assumptions explained in the text.
Measurement
(mg N m-2year-1) Scaling Factor Total N
(grams N year-1) Fog 2
(mg N m-2 year-1) Source
Input:s
Precipitation 25
Area of Lake = 56,562 m2 1,414 25 Arctic LTER database
N fixation, benthic Depth integrated to 12 m
(Total area of Lake = 56,562 m2) 362 6
N fixation, water column, Volume integrated over 16m (Total Volume = 498,440 m3) 27,750 491 This Study
Run-off
Sagavanirktok Toposequence 6.9 - 18.6* Area of Fog 2 watershed =
456,764 m2 3,152 - 8,496 (7,993) (141) Shaver et al. 1990 Total Inputs 32,678 -38,022 (37,474) 578 – 1,330 (663)
Recycling:
Nitrogen release from sediments 154-308 Area of Lake = 56,562 m2 8,711 - 17,421 154 – 308 Alexander et al. 1989,
Whalen and Cornwell 1985 Output:s Burial 294 Area of Lake = 56,562 m2 16,629 294 Whalen and Cornwell 1985 Denitrification
Toolik 318 Area of Lake = 56,562 m2 17,987 318 Klingensmith and Alexander 1983
Stream outflow 5,003 88 Total Outputs Area of Lake = 56,562 m2 39,619 700
*Expressed on a per m2 of watershed

27
Precipitation
Benthic N fixation
Water-column N fixation
Runoff491
14125 6
Figure 1.3. Inputs to Fog 2 (mg N m-2year-1).
Surprisingly, water-column N fixation contributes more than 75% of the N
input lake, while benthic N fixation is responsible the smallest portion of N inputs. It
is surprising that water-column N fixation contributed so much to the total N budget of
Lake Fog 2, because it contributed only ~0.02% of N in other oligotrophic lakes
(summarized in Howarth et al. 1988). In fact, the results for Fog 2 are more similar to
what has been reported for eutrophic lakes with water-column N fixation which
comprises a much larger portion of total N inputs (5 – 82% ; Howarth et al. 1988). In
a notable exception, water-column N fixation contributed 82% to the N inputs for an
oligotrophic salt lake (Pyramid Lake), which was considered an outlier by the
Howarth et al. (1988) review; perhaps water-column N fixation is more important than
was previously thought, especially given the sparse number of measurements made to
date.
The Fog 2 budget corroborates the results from the survey work and indicates
that N fixation is important to the N economy of this lake. Extrapolating the one-time

28
measurements of survey work to annual rates assuming a 60-day growing season,
benthic N fixation from the survey ranges from 7 – 89 mg N m-2 year-1, and water-
column N fixation ranges from 0 – 452 mg N m-2year-1. Data from the Arctic LTER
database show that bulk N deposition is 14 mg N m-2 in the summer, and nearly
doubles during the winter, for a total of 25 mg N m-2 year-1. Thus, benthic N fixation
is about equal to or exceeds atmospheric inputs on an areal basis.
The relatively low contribution of benthic N fixation to the whole-lake N
budget is also surprising given that benthic processes are considered important in
oligotrophic systems. I may underestimate the importance of benthic N fixation
because it was not measured cobble substrate, which is common at the ice-scour depth
up to 3 m in depth. This is an important omission to consider because 20% of the area
of the bottom in Lake Fog 2 is from 0 – 3 m, and other researchers have found that
epilithic algae in oligotrophic lakes supply as much as a third of N inputs (e.g., Lake
Malawi – Higgins et al. 2001; Lake Tahoe as reported by Howarth et al. 1988).
Studies that have examined algal taxonomy on cobble substrates in Toolik Lake
suggest that heterocystic cyanobacteria aren’t common (Cuker 1983); however, little is
known about the epilithic algal communities in other lakes in the vicinity of Toolik.
The geomorphology of Lake Fog 2 also affects the relative contribution of
water-column and benthic N fixation. Fog 2 is deep relative to most other lakes in the
vicinity of Toolik (Burkart et al. In prep.) and has a small watershed : lake area ratio
(7.6), indicating that N inputs from the watershed are more likely to be relatively small
compared with inputs from in situ N fixation. Other headwater lakes in the region also
have small watersheds and are relatively deep (Arctic LTER database); thus Fog 2 is
probably representative of other headwater lakes but is not typical of many other lakes
in the area, which are shallower and have larger watersheds. In those lakes, benthic N

29
fixation is probably more important than in Fog 2, and in situ N fixation is likely less
important than inputs from the watershed.
Lake Fog 2 is on a young surface and may receive enough phosphorus input
from weathering sources to favor N fixation either by reducing the N:P ratio below
Redfield ratio or by alleviating P limitation of N fixers (Appendix 1; Chapter 2;
Vitousek and Howarth 1991; Vitousek et al. 2002). Losses of N appear to exceed
inputs in Fog 2, which may also maintain low N:P ratio favorable for N fixation and
may be the reason why Fog 2 appears to remain N-limited despite high inputs from
fixation.
Comparison of aquatic and terrestrial N fixation rates in the Arctic. Rates of
N fixation in aquatic ecosystems in the Arctic vary from 0.14 – 672 mg N m-2 year-1 as
reported in this and other studies (Table 1.6). The lowest measured rates in Arctic
aquatic ecosystems occurred in the Kuparuk River (0.14—0.36 mg N m-2year-1);
intermediate rates of N fixation occurred in Barrow-area ponds (12—28 mg N-2year-1);
and the highest rates of N fixation occurred in lakes in the vicinity of Toolik Field
Station (22—227 mg N m-2year-1). The variation in these habitats may be a result of
nutrient limitation status; for example, the Kuparuk River is phosphorus, not N-limited
(Peterson et al. 1993), which could explain the low rates of N fixation. Barrow-area
ponds may exhibit lower areal rates of N fixation because they are shallower and have
smaller depth-integrated rates; it may also be a result of higher latitude, colder
temperatures, and shorter growing season. The rates reported for Toolik-area lakes in
this study are within the range that has previously been reported (Alexander 1989), but
these data suggest that N inputs via fixation is an important input that was previously
overlooked.
N fixation in the Toolik-area lakes was also the same order of magnitude as
rates of terrestrial N fixation, which ranged from 19—255 mg N m-2year-1 for

30
measurements on tundra ecosystems; Table 1.6). The maximum rate of aquatic N
fixation exceeds that the maximum terrestrial rate by a factor of ~2.5 (672 mg N m-2
year-1). The exception to this generality is a model by Cleveland et al. (1999) that
predicts higher (280—940 mg N m-2year-1) rates of terrestrial N fixation rates than
have been reported from measurements. These patterns suggest that lakes are as
important as terrestrial ecosystems as sources of N input to the landscape, and may in
some instances be ‘hot-spots’ for N fixation.
In summary, N fixation in lake ecosystems in the Arctic was previously
considered to be unimportant because rates are low relative to other ecosystems.
However, N fixation in lake ecosystems is prevalent across the landscape and appears
to contribute significantly to their N economies. Inputs of N from benthic
environments is equal to or greater than inputs from precipitation on an areal basis;
water-column N fixation is much higher than was previously found for other
oligotrophic systems, contributing as much 75 % of the total N inputs to one lake. N
fixation represents a source of new N that can support new production, and it
contributes significantly to the pool of available for recycling. Comparison of aquatic
rates of N fixation with those of terrestrial ecosystems shows that N input from
benthic and water-column N fixation is also an important pathway of N input across
the arctic landscape.

31
Table 1.6. Rates of N fixation in aquatic and terrestrial habitats in the Arctic.
Habitat Original Reported
Units mg N m-2 year-1 Method Conversion
Factor Calibrated with 15N? Source
Aquatic Lake Fog 2, water column+benthic mg N m-2year-1 497 AR 3 No This study Toolik Lake Water Column (0-5m) mmol m-2 day-1 118 – 672 AR 3 No Alexander et al. 1989 Toolik Inlet Stream, Epilithon mmol m-2 day-1 168 AR 3 No Alexander et al. 1989 Kuparuk River
Reference (Unfertilized) mg N m-2 day-1 0.14 AR 3 No Lawerence et al. unpubl. Fertilized (P) mg N m-2 day-1 0.36 AR 3 No Lawerence et al. unpubl.
Tundra Pond Sediment (Barrow) mmol m-2 day-1 1.2 AR 3 No Alexander et al. 1989 Tundra Pond Sediment (Barrow) mg Ν m-2year-1 28 AR 3 Yes Prentki et al. 1980 Water column+ benthic integrated 3m
11 lakes in the vicinity of Toolik Lake mg N m-2 day-1 22 – 227 AR 3 No This study Water-column integrated to depth 11 lakes in the vicinity of Toolik Lake mg N m-2 day 0 – 626 This study Terrestrial Tundra (Barrow Region) mg N m-2year-1 100 – 143 AR 1.5 Yes Alexander et al. 1978 Tundra 69.3 Barsdate and Alexander 1975 Immnaviat Watershed (acidic tundra) mg N m-2year-1 109 – 133 AR 3 No Hobara et al. in press Acidic tundra - lichens Peltigera aphthosa and Peltigera polydactyla kg ha-1 year-1 10 – 25 AR 3.2 Yes Weiss et al. 2005 Non-acidic tundra - lichens Peltigera aphthosa and Peltigera polydactyla kg ha-1 year-1 1.5 – 3.5 AR 3.2 Yes Weiss et al. 2005 Tundra (Alaska, Scandanavia, Canada) mg N m-2year-1 19 – 255 Lit. Review Chapin and Bledsoe 1992 Arctic tundra kg ha-1 year-1 280 – 940 Model - - Cleveland et al. 1999

32
REFERENCES. Abeles, F. B., P. W. Morgan, and M. E. J. Saltveit. 1992. Ethylene in plant biology.
Academic Press.
Alexander, V. 1974. A synthesis of the IBP tundra biome circumpolar study of nitrogen fixation, p. 109-121. In A. J. Holding, O. W. Heal, S. F. Maclean and P. W. Flanagan [eds.], Soil organisms and decomposition in tundra. Tundra Biome Steering Committee.
Alexander, V., M. Billington, and D. M. Schell. 1978. Nitrogen fixation in arctic and alpine tundra, p. 539-558. In L. L. Tieszen [ed.], Vegetation and production ecology of an Alaskan arctic tundra. Ecological studies series. Springer-Verlag.
Alexander, V., S. C. Whalen, and K. M. Klingensmith. 1989. Nitrogen cycling in arctic lakes and ponds. Hydrobiologia 172: 165-172.
Barsdate, R. J., and V. Alexander. 1975. Nitrogen-balance of arctic tundra: Pathways, rates, and environmental implications. J. Environ. Qual. 4: 111-117.
Bergmann, M. A., and H. E. Welch. 1990. Nitrogen fixation by epilithic periphyton in small arctic lakes in response to experimental nitrogen and phosphorus fertilization. Can. J. Fish. Aquat. Sci. 47: 1545-1550.
Burkart, G., C. Luecke, and L. Lael. In prep. Effects of landscape age on fish presence and zooplankton in arctic lakes.
Capone, D. G. and others 2005. Nitrogen fixation by Trichodesmium spp.: An important source of new nitrogen to the tropical and subtropical North Atlantic Ocean. Glob. Biogeochem. Cycle 19.
Chapin, F. S., III, and L. J. Bledsoe. 1992. Physiological ecology of nitrogen fixation in the arctic and effects of climate change, p. 301-319. In F. S. Chapin, III, R. Jeffries, R. Reynolds, G. R. Shaver and J. Svoboda [eds.], Arctic ecosystems in a changing climate: An ecophysiological perspective. Academic Press.
Cleveland, C. C. and others 1999. Global patterns of terrestrial biological nitrogen (N2) fixation in natural ecosystems. Glob. Biogeochem. Cycle 13: 623-645.
Crump, B. C., G. W. Kling, M. Bahr, and J. E. Hobbie. 2003. Bacterioplankton community shifts in an arctic lake correlate with seasonal changes in organic matter source. Appl. Environ. Microbiol. 69: 2253-2268.

33
Cuker, B. E. 1983. Grazing and nutrient interactions in controlling the activity and composition of the epilithic algal community of an arctic lake. Limnol. Oceanog. 28: 133-141.
Dodds, W. K., and R. W. Castenholz. 1987. The nitrogen budget of an oligotrophic cold water pond. Arch. Hydrobiol. Suppl. 79: 343-362.
Doyle, R. D., and T. R. Fisher. 1994. Nitrogen fixation by periphyton and plankton on the Amazon floodplain at Lake Calado. Biogeochemistry 26: 41-66.
Elsgaard, L., and L. Andersen. 1998. Microbial ethylene consumption in peat-soil during ethylene exposure of Begonia elatior. Plant Soil 202: 231-239.
Enrich-Prast, A., and F. A. Esteves. 1998. Diurnal variation of rates of denitrification and nitrogen fixation of periphyton associated with Oryza glumaepatula Steud in an Amazonian lake. Hydrobiologia 368: 189-192.
Falkowski, P. G., and J. A. Raven. 1997. Aquatic photosynthesis. Blackwell Science.
Flett, R. J., R. D. Hamilton, and N. E. R. Campbell. 1976. Aquatic acetylene reduction techniques: Solutions to several problems. Can. J. Microbiol. 22: 43-51.
Galloway, J. N. and others 2004. Nitrogen cycles: Past, present, and future. Biogeochemistry 70: 153-226.
Graham, B. M., R. D. Hamilton, and N. E. R. Campbell. 1980. Comparison of the 15N uptake and acetylene reduction methods for estimating the rates of nitrogen fixation by freshwater blue-green algae. Can. J. Fish. Aquat. Sci. 37: 488-493.
Grimm, N. B., and K. C. Petrone. 1997. Nitrogen fixation in a desert stream ecosystem. Biogeochemistry 37: 33-61.
Hamilton, T. D. 2003. Glacial geology of the Toolik lake and upper Kuparuk River region. In D. A. Walker [ed.], Biological Papers of the University of Alaska. University of Alaska Fairbanks, Institute of Arctic Biology.
Higgins, S. N., R. E. Hecky, and W. D. Taylor. 2001. Epilithic nitrogen fixation in the rocky littoral zones of Lake Malawi, Africa. Limnol. Oceanog. 46: 976-982.
Hillebrand, H., and U. Sommer. 1999. The nutrient stoichiometry of benthic microalgal growth: Redfield proportions are optimal. Limnol. Oceanog. 44: 440-446.
Hobara, S., C. Mccalley, K. Koba, A. Giblin, E., and G. R. Shaver. In press. Nitrogen fixation in an arctic tundra watershed: A key atmospheric N source. Arct. Antarct. Alp. Res.

34
Horne, A. J., and C. J. W. Carmiggelt. 1975. Algal nitrogen fixation in Californian streams: Seasonal cycles. Freshwater Biology 5: 461-&.
Howarth, R. W., R. Marino, J. Lane, and J. J. Cole. 1988. Nitrogen fixation in fresh-water, estuarine, and marine ecosystems .1. Rates and importance. Limnol. Oceanog. 33: 669-687.
Howarth, R. W., and A. F. Michaels. 2000. The measurement of primary production in aquatic systems, p. 72-85. In O. E. Sala, R. B. Jackson, H. A. Mooney and R. W. Howarth [eds.], Methods in ecosystem science. Springer- Verlag.
Jackel, U., S. Schnell, and R. Conrad. 2004. Microbial ethylene production and inhibition of methanotrophic activity in a deciduous forest soil. Soil Biol. Biochem. 36: 835-840.
Jonsson, A., and M. Jansson. 1997. Sedimentation and mineralisation of organic carbon, nitrogen and phosphorus in a large humic lake, northern Sweden. Arch. Hydrobiol. 141: 45-65.
Kling, G. W., G. W. Kipphut, M. M. Miller, and W. J. O'Brien. 2000. Integration of lakes and streams in a landscape perspective: The importance of material processing on spatial patterns and temporal coherence. Freshwater Biology 43: 477-497.
Klingensmith, K. M., and V. Alexander. 1983. Sediment nitrification, denitrification and nitrous oxide production in a deep arctic lake. Appl. Environ. Microbiol. 46: 1084-1092.
Lee, R. F., and J. Baker. 1992. Ethylene and ethane production in an estuarine river: Formation from the decomposition of polyunsaturated fatty acids. Mar. Chem. 38: 25-36.
Levine, M. A., and S. C. Whalen. 2001. Nutrient limitation of phytoplankton production in Alaskan arctic foothill lakes. Hydrobiologia 455: 189-201.
Loeb, S. L., and J. E. Reuter. 1981. The epilithic periphyton community: A five-lake comparative study of community productivity, nitrogen metabolism and depth-distribution of standing crop. Verh. Internat. Verein 21: 346-352.
MacGregor, B. J. and others 2001. Microbiological, molecular biological and stable isotopic evidence for nitrogen fixation in the open waters of Lake Michigan. Environ. Microbiol. 3: 205-219.
Marino, R., R. W. Howarth, F. Chan, J. J. Cole, and G. E. Likens. 2003. Sulfate inhibition of molybdenum-dependent nitrogen fixation by planktonic cyanobacteria under seawater conditions: A non-reversible effect. Hydrobiologia 500: 277-293.

35
Miller, M. C., G. R. Hater, P. Spatt, P. Westlake, and D. P. P. Yeakel. 1986. Primary production and its control in Toolik Lake, Alaska. Arch. Hydrobiol. Suppl. 74(1): 97-131.
Moeller, R. E., and J. P. Roskoski. 1978. Nitrogen fixation in littoral benthos of an oligotrophic lake. Hydrobiologia 60: 13-16.
Molot, L. A., and P. J. Dillon. 1993. Nitrogen mass balances and denitrification rates in central Ontario lakes. Biogeochemistry 20: 195-212.
Montoya, J. P., C. M. Holl, J. P. Zehr, A. Hansen, T. A. Villareal, and D. G. Capone. 2004. High rates of N2 fixation by unicellular diazotrophs in the oligotrophic Pacific Ocean. Nature 430: 1027-1031.
O’Brien, W. J. and others 1997. The limnology of Toolik lake, p. 61–106. In A. M. Milner and M. W. Oswood [eds.], Freshwaters of Alaska. Springer-Verlag.
Peterson, B. J., T. L. Corliss, K. Kriet, and J. E. Hobbie. 1992. Nitrogen and phosphorus concentration and export for the upper Kuparuk River on the North Slope of Alaska in 1980. Hydrobiologia 240: 61-69.
Pinckney, J., H. W. Paerl, R. P. Reid, and B. Bebout. 1995. Ecophysiology of stromatolitic microbial mats, Stocking Island, Exuma Cays, Bahamas. Microb. Ecol. 29: 19-37.
Prentki, R. T., M. C. Miller, R. J. Barsdate, V. Alexander, J. Kelley, and P. Coyne. 1980. Chemistry, p. 76-178. In J. E. Hobbie [ed.], Limnology of tundra ponds. US/IBP synthesis series. Stroudsburg.
Ramlal, P. S., R. H. Hesslein, R. E. Hecky, E. J. Fee, J. W. M. Rudd, and S. J. Guildford. 1994. The organic carbon budget of a shallow arctic tundra lake on the Tuktoyaktuk Peninsula, NWT, Canada - arctic lake carbon budget. Biogeochemistry 24: 145-172.
Rast, W., and G. F. Lee. 1978. Summary analysis of North American (U.S. Portion) OECD eutrophication project: Nutrient loading-lake response relationships and trophic state indices. U.S. EPA.
Redfield, A. C. 1958. The biological control of chemical factors in the environment. Am. Sci. 46: 205-221.
Reuter, J. E., S. L. Loeb, and C. R. Goldman. 1986. Inorganic nitrogen uptake by epilithic periphyton in a N-deficient lake. Limnol. Oceanog. 31: 149-160.
Roberts, B., Joseph. 2004. Assessing diel respiration in pelagic ecosystems using oxygen stable isotopes : When do the highest rates occur and who is respiring
36
under different light and nutrient regimes?, p. 228, Ecology and Evolutionary Biology. Cornell University.
Sander, R. 1999. Compilation of Henry's Law constants for inorganic and organic species of potential importance in environmental chemistry (version 3).
Seitzinger, S. P., and J. H. Garber. 1987. Nitrogen fixation and 15N2 calibration of the acetylene-reduction assay in coastal marine sediments. Mar. Ecol.-Prog. Ser. 37: 65-73.
Shaver, G. R., F. S. Chapin, III, and B. L. Gartner. 1986. Factors limiting seasonal growth and peak biomass accumulation in eriophorum vaginatum in Alaskan tussock tundra. Journal of Ecology [J. ECOL.] 74: 257-278.
Shaver, G. R., K. J. Nadelhoffer, and A. E. Giblin. 1990. Biogeochemical diversity and element transport in a heterogeneous landscape, the North Slope of Alaska., p. 105-126. In M. G. Turner and R. H. Gardner [eds.], Quantitative methods in landscape ecology. Springer-Verlag.
Strickland, J. D. H., and T. R. Parsons. 1972. A practical handbook of seawater analysis, 2nd ed. Fish. Res. Bd. Canada.
Triska, F. J., J. R. Sedell, K. Cromack, S. V. Gregory, and F. M. McCorison. 1984. Nitrogen budget for a small coniferous forest stream. Ecol. Monogr. 54: 119-140.
Vadeboncoeur, Y., D. M. Lodge, and S. R. Carpenter. 2001. Whole-lake fertilization effects on distribution of primary production between benthic and pelagic habitats. Ecology 82: 1065-1077.
Vitousek, P. M. and others 2002. Towards an ecological understanding of biological nitrogen fixation. Biogeochemistry 57: 1-45.
Vitousek, P. M., and R. W. Howarth. 1991. Nitrogen limitation on land and in the sea: How can it occur? Biogeochemistry 13: 87-115.
Walker, M. D., D. A. Walker, and N. A. Auerbach. 1994. Plant-communities of a tussock tundra landscape in the Brooks Range foothills, Alaska. J. Veg. Sci. 5: 843-866.
Weiss, M., S. E. Hobbie, and G. M. Gettel. 2005. Contrasting responses of nitrogen fixation in arctic lichens to experimental and ambient nitrogen and phosphorus availability. Arct. Antarct. Alp. Res. 37: 396-401.
Wetzel, R. G. 1964. A comparative-study of the primary productivity of higher aquatic plants, periphyton, and phytoplankton in a large, shallow lake. Internationale Revue der gesamten Hydrobiologie 49: 1.

37
Wetzel, R. G., and G. E. Likens. 1991. Limnological analysis, Second ed. Springer.
Whalen, S. C., and J. C. Cornwell. 1985. Nitrogen, phosphorus, and organic-carbon cycling in an arctic lake. Can. J. Fish. Aquat. Sci. 42: 797-808.
Wiebe, W. J., R. E. Johannes, and K. L. Webb. 1975. Nitrogen-fixation in a coral-reef community. Science 188: 257-259.
Wilkinson, C. R., and P. W. Sammarco. 1983. Effects of fish grazing and damselfish territoriality on coral-reef algae .2. Nitrogen fixation. Mar. Ecol.-Prog. Ser. 13: 15-19.
Wilkinson, C. R., D. M. Williams, P. W. Sammarco, R. W. Hogg, and L. A. Trott. 1984. Rates of nitrogen-fixation on coral reefs across the continental-shelf of the central Great Barrier Reef. Mar. Bio. 80: 255-262.
Williams, S. L., and R. C. Carpenter. 1997. Grazing effects on nitrogen fixation in coral reef algal turfs. Mar. Bio. 130: 223-231.
Zani, S., M. T. Mellon, J. L. Collier, and J. P. Zehr. 2000. Expression of nifh genes in natural microbial assemblages in Lake George, New York, detected by reverse transcriptase pcr. Appl. Environ. Microbiol. 66: 3119-3124.
Zehr, J. P. and others 2001. Unicellular cyanobacteria fix N2 in the subtropical North Pacific Ocean. Nature 412: 635-638.

38
CHAPTER 2
LIGHT AND NUTRIENT CONTROLS OF BENTHIC NITROGEN FIXATION
IN OLIGOTROPHIC, ARCTIC LAKES: RESULTS FROM WHOLE-LAKE
FERTILIZATIONS AND SEDIMENT-CORE EXPERIMENTS
INTRODUCTION.
Currently, most lakes in arctic Alaska are oligotrophic but are expected to
increase in productivity because of higher inputs of nitrogen (N) and phosphorus (P)
from human activity and climate warming (Hobbie et al. 1999; Hinzman et al. 2005).
In lakes undergoing eutrophication in the temperate zone, excess inputs of P are often
considered to be the primary cause because N2-fixing cyanobacteria compensate for N
limitation, and P limitation of net primary production is maintained (Schindler 1977,
Flett et al. 1980, Hendzel et al. 1994, Findlay et al. 1994). However, this paradigm
doesn’t apply for many oligotrophic lakes because cyanobacteria generally do not
form blooms, and N limitation is prevalent (Howarth et al. 1988b). Excess N inputs
from N deposition and other forms of human development have caused increases in
lake productivity and changes in algal community structure in oligotrophic lakes in the
Western United States (Goldman 1988, Baron et al. 2000, Nydick et al. 2003), and the
role of N in the eutrophication of lakes in the Northern Hemisphere is becoming
increasingly appreciated (Bergstrom and Jansson 2006).
Even though oligotrophic lakes are often N-limited, little is known about what
prevents N2 fixation from alleviating N limitation in these environments (Vitousek et
al. 2002; Howarth et al. 1988a). N2 fixation itself may be limited by P availability
because N2 fixers have a higher P requirement than many other autotrophs (Vitousek
and Howarth 1991; Vitousek et al. 2002). As N and P inputs to arctic lakes gradually
increase, productivity will likely increase (Hobbie et al. 1999; O'Brien et al. 2005), but

39
the role of N2 fixation in this process is unknown. Will increases in nutrients stimulate
N2 fixation and cause lakes to be P-limited? Or, will increased nutrient inputs cause a
compensatory decline in N2 fixation and maintain them in N-limited status?
In contrast with their more productive counterparts, oligotrophic systems have
low water-column algal biomass, their light penetration is high, and lake bottoms are
often productive (Ramlal et al. 1994; Vadeboncoeur et al. 2003). N2-fixing
cyanobacteria are common in oligotrophic lake sediments, and some researchers have
hypothesized that benthic N2 fixation in oligotrophic systems may be important to
their N budgets and to their benthic primary producers (Moeller and Roskoski 1978;
Reuter et al. 1986; Bergmann and Welch 1990; Higgins et al. 2001). Understanding
how benthic N2 fixation and primary production are controlled by nutrients is
important to understanding how oligotrophic lakes respond to environmental changes
that result in increased nutrient inputs.
There are very few studies that examine the response of benthic N2 fixation to
N and P supply and eutrophication (but see Bergman and Welsh 1990 for an
exception). Sediment-based processes, however, may change the relative availability
of these nutrients differently from expected in the water column (Howarth et al.
1988a). For example, sediments tend to be low-oxygen environments, so P
availability may be increased as a result of the chemical reduction and solubility of
Fe–P binding complexes (Wetzel 2001). In addition, mineralization in the sediments
may increase N availability relative to the water column, which may suppress N2
fixation (Capone 1988). In arctic, oligotrophic lakes, sediments tend to be less
reducing than their more productive temperate counterparts, and iron and manganese
oxides are abundant (Cornwell and Kipphut 1992), which may in turn reduce the
bioavailability of P (O'Brien et al. 2005). In addition, mineralization rates in

40
oligotrophic lake systems are low, while N demand by primary producers is high
(Alexander et al. 1989), which may maintain low levels of N availability in sediments.
Light may also control N2 fixation in benthic environments, especially in
oligotrophic systems where benthic N2 fixers are predominately autotrophic.
Autotrophs fix N2 using energy captured by photosynthesis, but oxygen created during
photosynthesis can damage the nitrogenase enzyme (Paerl 1990). N2 fixers have
different strategies to deal with this constraint. They may rely on stored carbon to fix
N2 during periods of low light; or, they may rely on recently synthesized carbon at
high light levels to fuel N2 fixation in heterocysts that protect the nitrogenase enzyme
from oxygen. The responses of N2 fixation to increasing light levels in different
environments are variable, ranging from saturating, linear, and inhibitory (Higgins et
al. 2001, Grimm and Petrone 1997, Lewis and Levine 1984). Light may be an
important factor affecting N2 fixation in arctic lake sediments because summertime
daylight occurs 24 hours a day, and water clarity is high.
The purpose of this study is to examine nutrient and light effects on benthic N2
fixation and primary production in oligotrophic, arctic lakes. I compare the responses
to low-level fertilization of a deep and shallow lake with two reference lakes and
examine the mechanisms behind these responses in intact mud core incubations in
which nutrients and light are manipulated in controlled laboratory conditions. Low-
level fertilization is designed to reflect gradual increases in nutrient inputs that will
likely occur as a result of warming climate and increased human activity in arctic
regions, and specifically to examine the role of the benthos in whole-lake responses to
increased nutrient inputs as lakes undergo eutrophication.

41
METHODS.
Site description.
Toolik Field Station is located in arctic Alaska (68o37′N, 149o35′W), about 240
km above the Arctic Circle in the northern foothills of the Brooks Mountain Range
(Figure 2.1). The landscape is rolling tundra terrain underlain by continuous
permafrost, and lakes in this region are dimictic and commonly shallow (3 – 15 m)
glacial kettles. The arctic summer growing season is defined by the period when lake
surfaces are ice-free and lasts from mid-June to mid-September, and maximum
epilimnetic temperatures range from 13 – 18 °C during summer months. Lakes in the
region are considered ultra-oligotrophic (Miller et al. 1986), and water-column
concentrations of ammonium, nitrate, and phosphate are near detection limit, with
concentrations below 0.1 μM (Arctic LTER database
(http://ecosystems.mbl.edu/arc/default.htm).
Water-column 14C-primary production measurements range from 12 – 16 g C
m-2 year-1 (Miller et al. 1986). Secchi depth ranges 6 – 10 m in the summer, and areal
rates of benthic production equal that of water-column production in sediments above
the thermocline, which is about 5 m in the summer (Artic LTER database). Lake
bottoms are generally composed of extremely fine-grained, unconsolidated sediment.
The N2-fixing cyanobacteria Nostoc sp. forms colonies as large as 2 cm in diameter
and is visibly prevalent on sediment surfaces in many lakes, including the lakes in this
study (personal observation).
Overall experimental design. To examine nutrient and light controls on
benthic N2 fixation and primary production, I evaluate results from on-going whole-
lake fertilizations of a deep and shallow lake and compare these results to pre-
fertilization conditions and to unfertilized reference lakes. Treatment and reference
lakes were sampled before the start of fertilization in 2000, and treatment lakes were

42
fertilized with N and P in the summer growing seasons in starting in 2001. This paper
presents data from 2000 – 2003. Data from the whole-lake fertilization experiment
were analyzed using repeated measures ANOVA in Proc Mixed in SAS v. 9.1 (2002).
Figure 2.1. Map showing the location of fertilization lakes (E – 5, and E – 6) and reference lakes (Fog 2 and Fog 4) relative to Toolik Field Station on the North Slope of Alaska, 68o37′N, 149o35′W. Refer to Figure 1.1 in Chapter 1 for map of Alaska showing the location of Toolik Field Station.
In order to examine the mechanisms causing observed patterns in the whole-
lake fertilization experiment, I also present data from two separate controlled
laboratory experiments. The first experiment (“light response curve”) examined the
response of N2 fixation to various light levels using intact sediment cores collected
from shallow and deep stations from both fertilization and both reference lakes. N2-
fixation–Irradiance curves (“NI Curves”) were fit to data in a manner analogous to
Photosynthesis–Irradiance curves (Webb et al. 1974). The second experiment (“core
nutrient addition experiment”) was a one-way ANOVA design in which N and P were
added alone and together in Redfield proportion to intact sediment cores collected
from the deep reference lake. The details of each experiment are described below.
Whole-lake fertilization. A relatively deep lake (E-5) and a shallow lake (Lake
E-6) were fertilized with N and P and were paired with deep (Fog 2) and shallow (Fog
4) reference lakes that were not fertilized. Lakes E-5 and E-6 are both on the oldest

43
glacial surface in the vicinity of Toolik originating from the Sagavanirktok River
glaciation (250,000 – 800,000 ybp). The larger lake, E-5, is 1.3 ha in size and has a
maximum depth of 12 m; E-6 is 0.2 ha and has a maximum depth of 3 m. Both
fertilization lakes have a low conductivity of 7 – 12 μS sec-1 and relatively low rates of
benthic primary production (60 – 110 mg C m-2 day-1). Both lakes have one outlet
stream; E-6 had no inlet stream, and E-5 has two permanent inlet streams. Lake E-6
comprises two shallow basins divided by a shallow, rocky shoal. Maximum depth in
the smallest basin is 1.5 m, and maximum depth in the larger basin is 3 m. Lakes Fog
2 and Fog 4 are on a different geologic surface resulting from the advance of the
Itkillik Phase II glaciation (12,000 – 25,000 ybp; Hamilton 2003)). Lake Fog 4 is
similar in size to lake E-6 (0.19 ha) but has a simple basin with a similar maximum
depth of 3 meters. Fog 4 has a much higher conductivity than E-6 (90 – 120 μS sec-1)
and has one inlet stream connecting it to two upstream lakes and one outlet stream.
Fog 2 is larger and deeper than E-5 with a surface area of 5.6 ha and a maximum depth
of 20 m. Fog 2 also has a relatively high conductivity (150 μS cm-1), indicating that
watershed inputs of cations and anions from weathering are high. Fog 2 has no inlet
stream and one outlet stream. These lake characteristics are summarized in Table 2.1.
In years 2001 – 2003, Lakes E-5 and E-6 were fertilized with N and P in
Redfield proportion (16:1) at 4 μmol N m-3 year-1 and 0.25 μmol P m-3 year-1, or
approximately 4 times the ambient N loading to Toolik Lake (Whalen and Cornwell
1985). In lake E-5, the fertilization was applied on the basis of the volume of the
epilimnion, which is considered to be the volume of water above 4 m and equal to
about 75% of total lake volume. Lake E-6 is too shallow to stratify, so fertilization
was applied on the basis of its total volume. Nitrogen as NH4NO3 and P was added as
H3PO4 to the surface using a solar-powered peristaltic pump which pumped fertilizer
from a reservoir in a continuous drip from a raft anchored in the center of each lake.
44
Rhodamine dye studies confirmed that mixing occurred before the fertilizer was
washed out through outlet streams (George Kling pers. comm.) The fertilizer was
added for 42 days from early July to mid August each summer from 2001 – 2003.
Table 2.1 Characteristics of fertilization and reference lakes. Fertilization Lakes Reference Lakes E5
(deep) E6
(shallow) Fog 2 (deep)
Fog 4 (shallow)
Maximum Depth (m) 12 3 20 3
Surface area (ha) 1.3 0.2 5.6 0.19
Conductivity (μS sec-1) 7-12 7-12 150 90-120
Benthic parameters including N2 fixation, primary production, respiration, and
chlorophyll were measured three times per season in all lakes except the pre-
fertilization year (2000), in which benthic processes were characterized once in mid-
July. Measurements were made at 3 m in lakes E-5 and Fog 2 because the substrate is
large rock cobble from 0 – 3 m due to ice-scour. In lakes E-6 and Fog 4,
measurements were made at 1.5 m and 2.5 m, respectively, because these lakes had
mud bottoms similar in texture to E-5 and Fog 2 and peat substrate at shallower
depths. In years 2002 and 2003, “deep” stations in E-5, E-6, and Fog 2 were also
sampled to assess how within-lake light variation affects N2 fixation. In E-5 and Fog
2, deep stations were 6 – 7 m and in E-6, the deep station was at 2.5 m. No “deep”
station was added in Lake Fog 4 because the geomorphology of the lake basin is
simple, and the maximum depth in that lake was already being sampled. The deep
stations were not included in statistical analyses to test for treatment effects because
there were no data for the pre-treatment year.
Water-column profiles of inorganic nutrients, light, chlorophyll and primary
production were measured weekly at 1 m intervals in the fertilization lakes. In the

45
reference lakes, water-column sampling was conducted three times per season because
previous sampling showed that the seasonal variability in these lakes was very low
(Arctic LTER database). Light profiles were conducted using a LI-COR LI-192
underwater quantum sensor, which was corrected for ambient light using a LI-COR
LI-190 quantum deck sensor. Light extinction coefficient in the fertilized and
reference lakes was calculated for each sampling date and used to determine the
seasonal average according to the following equation:
Iz = Ioe-kz
where Iz is the light in μE m-2 sec-1 at depth, z; Io is the light at the surface, and k is the
extinction coefficient (Wetzel and Likens 1991). Average photosynthetically active
radiation (PAR) reaching the sediments in each summer was calculated by using
average daily measurements from the weather station on Toolik Lake over the course
of the sampling period in each year. PAR was measured every 10 minutes and
averaged every hour using Li-Cor, Model LI-190SB and a Campbell 21x datalogger.
These results were related to N2-fixation rates by a random coefficient regression
analysis (described below).
Rates of N2 fixation: Three intact mud cores for N2-fixation measurements
were taken at each station on each sampling date in each lake and were incubated in
the Toolik Field Station incubation facility at ambient lake temperature and light
conditions, which ranged from 6 to 13 oC and from 2 – 150 μE m-2sec-1, respectively.
N2-fixation measurements were performed using the acetylene reduction assay (ARA),
which quantifies the reduction of acetylene (C2H2) to ethylene (C2H4) by the
nitrogenase enzyme (Hardy et al. 1968). Details of N2-fixation measurements are
given elsewhere (Chapter 3). Briefly, SCUBA was used to collect intact mud cores
approximately 10 cm in length that had an undisturbed sediment-water interface.
Cores tubes were 30 cm tall and 9.75 cm in diameter, resulting in 72 cm2 of sediment

46
with about 1 L overlying water in the headspace. Cores were transported via
helicopter in dark coolers with lake water in the bottom that both prevented cores from
sloshing in transport and kept them at ambient temperature. Core tubes containing the
mud and the overlying water were placed between 1 cm-thick clear polycarbonate
rectangular plates held together by nylon-threaded rod that had a groove and O-ring to
prevent leaking. The top plate had a bulkhead-style septum port to allow sampling of
a gas headspace overlying the water. Acetylene was introduced to the core as
saturated water, which reduces contamination by ethylene common in many acetylene
tanks (see Marino et al. 2003 for details). In addition to ethylene contamination, the
acetylene was also contaminated with ammonia, which when added to core
incubations may cause a reduction in N2-fixation rates. To address this problem, the
acetylene was first bubbled through a 10% solution of sulfuric acid to trap ammonium
in solution. This procedure resulted in ammonium concentrations in the acetylene
water that were similar to lake-water concentrations near the analytical detection limit.
The gas headspace was about 100 ml, resulting in an optimal 10:1 liquid:gas phase
volume ratio for acetylene reduction assays (Flett et al. 1976). The water–gas
interface in the core tubes had an externally operated magnetic stirring apparatus to
maintain the water and gas phases in equilibrium throughout the incubation period.
The magnet was about 15 cm above the mud surface, which prevented the sediments
from being disturbed by the gentle stirring. Measurements of N2 fixation in the
overlying water proved negligible.
Because sediments can contain heterotrophic bacteria known to consume
ethylene (Jackel et al. 2004; Elsgaard and Andersen 1998), and diatoms can produce
ethylene (Lee and Baker 1992; Abeles et al. 1992), two additional cores were collected
in order to apply corrections for ethylene production and consumption. Ethylene was
rarely produced without the presence of acetylene, but ethylene consumption ranged

47
from 5 – 15 % over the course of the incubations. Ethylene loss rate was linear over
the course of the incubations, and the correction for each treatment was applied
accordingly. Corrections were minor and did not change qualitative results.
The total amount of ethylene present in the gas and water phase was
determined using Henry’s Law (Flett et al. 1976), and ethylene solubility was
determined according a temperature–solubility relationship presented in Sander
(1999). Ethylene samples were analyzed on a Shimadzu GC 8-A Flame Ion Detector
(FID) using a Porapak N column, mesh size 80/100. Ethylene produced was
converted to moles N2 fixed assuming a 3:1 conversion ratio, which is reasonably
constrained for sediments (Howarth et al. 1988b)
In situ determination of benthic primary production. Benthic primary
production and respiration was estimated in situ by documenting the rate of oxygen
consumption and production in opaque and transparent benthic chambers over 3 – 5
days. Measurements were made in each fertilization lake three times per season at the
same depths as the N2-fixation measurements, but only once per season in the
reference lakes. Data for benthic primary production and respiration from the “deep”
stations are not presented in this paper. Benthic chambers were cube-shaped and
made of Lexan®, and had a volume of approximately 40 L. When deployed, they sank
into the mud bottom and enclosed 0.15 m2 of sediment. Tygon tubes connected
chambers to the surface of the lake and allowed the water overlying the sediment to be
sampled for oxygen as well as nutrients and gasses. Oxygen samples were collected in
BOD bottles according to Arctic LTER protocols. Briefly, the bottle was overfilled by
twice its volume by carefully inserting a piece of tygon tubing from the sample
syringe and slowly expelling the water so as not to introduce atmospheric O2. The
bottles were fixed in the field by adding MnCl2 and NaI, stoppered, wrapped in
Parafilm, and transported to the lab in a container that kept them upright and safe from

48
jostling. O2 concentration was measured using Winkler titration according to Arctic
LTER protocols.
Community respiration (CR) was calculated as the rate of O2 consumption in
the dark chamber over the 3 – 5 day deployment and expressed as a daily rate. Gross
primary production (GPP) was also expressed as a daily rate and calculated as the rate
of O2 production in the clear chamber + the rate of O2 consumption in the dark
chamber over the course of the 3 – 5 day deployment. This method assumes that
respiration that occurs in the daylight is equal to night-time respiration (Wetzel and
Likens 1991; Strickland and Parsons 1972). Recent work has shown that daytime
respiration is likely higher than dark respiration as a result of mitrochondrial
respiration, photorespiration, and the Mehler Reaction (Roberts 2004). Therefore, this
method likely underestimates GPP, although it is commonly used (Howarth and
Michaels 2000).
Chlorophyll a and phaeophytin analysis. Three cores 2.7 cm in diameter were
collected for chlorophyll a and phaeophytin analysis each time cores were collected
for N2 fixation (three times per season), and additional chlorophyll cores were
collected occasionally when the in situ primary production chambers were deployed if
SCUBA was used and if there was access to the sediment (maximum of three
additional times per season). According to Arctic LTER protocol, the top 2 cm of
each core were sectioned and the mud was collected in a whirl-pack bag and
homogenized. Of this sample, 5 ml were subsampled for chlorophyll a analysis.
Samples were frozen at -80oC and transported back to The Ecosystems Center, Woods
Hole, for analysis the following fall. Samples were analyzed using acetone extraction
and a Shimadzu UV-1601 spectrophotometer with a syringe (piston) sipper and a 1 cm
Hellma cell according to the Arctic LTER protocols, which were adapted from
Lorenzen (1967). Because chlorophyll degrades rapidly in the sediments (Bianchi et

49
al. 1991), chlorophyll a was expressed as a proportion of total chlorophyll, which was
estimated as the sum of chlorophyll a and phaeophytin.
Data analysis for whole-lake fertilization experiment. Benthic N2 fixation,
primary production, and total chlorophyll were analyzed using a repeated measures
ANOVA in Proc Mixed in SAS version 9.1 (2002). Proc Mixed accounts for
unbalanced sampling design and allows for random effects as well as repeated
measures. Lake was treated as a random effect and treatment, lake depth (shallow,
deep), year, and interactions among these variables were treated as fixed effects. We
tested whether modeling covariance structure among repeated measures increased the
overall model fit by performing the maximum likelihood test. In all cases, fit was
substantially improved by using a compound symmetrical covariance structure that
was specific for each lake. Modeling covariance among repeated measures is more
conservative than assuming independence among measurements that occur closely in
time. The most parsimonious model was developed by eliminating non-significant
fixed effects one-by-one until the best model fit was determined by examining the AIC
value. Data and model fit were checked for the assumption of normality, and because
chlorophyll a/total chlorophyll is proportional, these data were arcsin-square-root
transformed. No other variables required transformation.
In order to determine whether seasonal measurements of N2 fixation were
related to ambient lake light, a randomized coefficient analysis was also performed
using Proc Mixed in SAS version 9.1 (2002). This analysis used the entire data set,
including measurements of ambient N2 fixation and the light level at which they were
incubated, which was always based on measurements made on the day in which they
were collected. Light was transformed by natural log because the response of N2
fixation to light levels is not linear (see below). Lake was treated as a random effect,

50
and covariance structure among repeated measures was accounted for as described
above.
N2 fixation-light response curves. In addition to relating seasonal
measurements of N2 fixation to in situ light conditions as described above, we also
performed a laboratory experiment to compute N2-fixation–Irradiance (NI) curves in
2003. Three cores for N2 fixation and one core each for ethylene production and
consumption were collected from 3m and 6m depths in Fog 2 and E-5, and from 1 and
3m depths in E-6, and from 2.5 m in Fog 4. After determining that N2-fixation rates
were linear over long incubation times, cores were first incubated in the dark for 4
hours, and then at increasing light levels for a total of 5 levels up to 250 – 350 μE m-2
sec-1, which is up to 5 – 6 times greater than ambient lake light levels. Incubations
were conducted under Hydrofarm Radient System lamps and AgroSun Metal Halide
and Sodium 1000W bulbs. Cores were incubated at ambient lake temperature
conditions, which was 12 oC.
The model used to fit the light response curves was according to Stal and
Walsby (2000), who used the Photosynthesis–Irradiance model based on Webb et al.
(1974) to fit NI curves. The equation is:
Nfix = Nmax*(1-e-αI/Nmax)+Nd
Where Nmax is the maximum N2-fixation rate achieved at saturation; α is the initial
slope; Nd is the intercept, or N2 fixation in the dark, and I is light (PAR) in μE m-2
sec-1. This model had a better fit (R2) and less-biased residuals than the rectangular
hyperbola model recommended for fitting N2-fixation–Irradiance curves by Staal et al.
(2002). Proc NLIN in SAS version 9.1 (2002) was used to estimate the parameters
Nmax, α, and Nd to using N2-fixation and irradiance data. Once the parameters were
estimated, the half saturation constant (Km) was calculated using the following
equation:

51
Km = Ln(2)*Nmax/α
Core nutrient addition experiment. In 2003, four cores were collected from 5
different locations in Fog 2 for a total of twenty cores. One core from each location
was designated as Control, +N, +P or +N+P treatment. The target loading rates for N
and P were in Redfield proportion (16:1). N was added as NH4SO4 at a rate of 1
μmole L-1 day-1 and P was added as KPO4 at a rate of 0.0625 μmole L-1 day-1.
Because the cores were incubated for only 9 days to avoid possible core artifacts, the
loading rate was higher than that of E-5 and E-6 by a factor of 14 times to increase the
possibility of documenting a response. At the end of 9 days, two cores from each
treatment were measured for production. Following the production measurement, the
cores were used to measure N2 fixation. The two cores on which production was
measured were used for ethylene consumption and production blanks in the N2-
fixation assays, resulting in 3 replicates of N2 fixation per treatment and two replicates
for production. Following the experiment, one chlorophyll a sample per core was
taken by sectioning the top two centimeters, homogenizing the sediment, and
removing a 10 ml subsample. The sample was frozen at -80 oC and analyzed using an
acetone extraction according to the procedure described above.
Gross Primary Production and Respiration in nutrient-addition cores. In a
manner similar to the ARA chambers, measures of production were made using a
chamber design that allowed the core tubes to fit a specially designed lid. The
chambers were filled completely, with no gas headspace, and the lid had a water-filled
port into which a data-logging O2 probe (WTW Oxi 340i) was placed. This prevented
the chamber from experiencing air exchange with the atmosphere while measurements
were conducted. Changes in oxygen consumption and production were recorded
every 15 minutes over periods of dark and ambient light levels, each lasting
approximately 12 hours. Incubations were done at ambient lake temperature (12oC).

52
Community Respiration (CR) was measured as the rate of O2 consumption during the
dark period of the incubation and multiplied over 24 hours. Gross Primary Production
(GPP) was calculated as the rate of O2 production during the light period of the
incubation and multiplied by 24 hours (there are 24 hours of light in an arctic
summer), and summed with CR. This method of measuring production is similar to
the in situ method described above and is subject to all the same assumptions and
caveats.
Data from the laboratory nutrient addition experiment were analyzed by one-
way ANOVA and simple regression using Proc GLM in SAS version 9.1 (2002).
Tukey’s post-hoc tests were performed to determine significant interactions to correct
for Type I error.
RESULTS.
Response of benthic processes to whole-lake fertilization. Benthic N2 fixation
showed no obvious seasonal patterns in either the fertilization lakes or reference lakes
(Figure 2.2), so we compared annual means to compare treatment effects (Figure 2.3;
Table 2.2). Benthic N2 fixation was depressed in both the shallow and deep
fertilization lakes relative to reference lakes (significant treatment effect p=0.039;
Table 2.3; Figure 2.3). Benthic N2 fixation declined from the pre-fertilization year
(2000) and in each subsequent year in both the shallow and deep fertilization lakes
(Table 2.2; Figure 2.3). The largest decrease in N2 fixation occurred in the first year
of fertilization in both lakes, and declined less in subsequent years of the experiment.
This result is supported by the fact that 2000 was significantly different from years
2001 – 2003 (p>0.0008;Table 2.4). By the last year of measurement (2003), N2
fixation had declined by about 75% compared with 2000.

53
These results are in contrast with the reference lakes Fog 2 and Fog 4, in which
no clear pattern in N2 fixation is shown between years, and 2000 is within the range of
variability of measurements made in the following years (Figure 2.2). N2 fixation
increased from year to year in the deep reference lake, Fog 2, and therefore showed
the opposite trend to the deep fertilized lake, E-5. Patterns in N2 fixation also differed
between the shallow lakes; in Fog 4, N2 fixation declined 2000 – 2001 and increased
in 2002 – 2003 in contrast with the consistent decline in N2-fixation rates observed in
E-6 throughout each year of the experiment (Figure 2.3).
Benthic gross primary production, respiration, and chlorophyll a also showed
no seasonal pattern in the fertilized and reference lakes (Giblin et al. unpublished
data), so data were averaged to provide an estimate of each benthic process for each
year of the experiment (Figure 2.4). In contrast to N2 fixation, fertilization did not
affect benthic gross primary production (GPP) and respiration (CR) (non-significant
treatment effect, p>0.05; Table 2.3). Furthermore, GPP and CR were not different
between the pre-fertilization and post-fertilization years (non-significant year effect,
p>0.05; Table 2.3; Figure 2.4). In year 2003, GPP increased in lake E-6 by about
50%, likely because CR also increased (Figure 2.4; Table 2.2); however, this effect is
not statistically significant. GPP in E-5 and Fog 2 was significantly lower than in E-6
and Fog 4 by about 60% regardless of treatment or year (significant lake depth effect;
p<0.0001; Table 2.3). Shallow lakes exhibited higher (i.e., more negative) respiration
rate than deep lakes by about 40% regardless of treatment or year (p=0.001; Table
2.3).
There was also a significant treatment effect for the proportion of benthic
chlorophyll a (p<0.0001; Table 2.3). In the treatment lakes, chlorophyll a was more
than twice as high in 2003 as it was in 2000 (Figure 2.5). Benthic chlorophyll a
increased each year following fertilization in E-6, but did not increase in E-5 until year

54
2003, leading to a significant year effect (p<0.0001; Table 2.3; Figure 2.5). In
contrast, benthic chlorophyll a was variable from year to year in Fog 2 and showed no
consistent yearly trend (Figure 2.5; Table 2.2). Chlorophyll a levels in the shallow
reference lake, Fog 4, started with higher levels of chlorophyll a than E-6, and also
increased throughout the experiment, ending with twice the amount of chlorophyll a
that it had in year 2000 (Figure 2.5; Table 2.2). This is likely as a result of increasing
thermokarst (melting permafrost and top soil slumping) activity along the shore of
Lake Fog 4, which appeared to increase the sediment — and likely P — load to the
lake. Other lake-wide changes (increased water-column chlorophyll and reduced
light) were also documented in water-column data for Fog 4 (Arctic LTER database;
and as shown below). Although patterns in N2 fixation are confounded by the
thermokarst activity in Fog 4, the significant treatment effect is maintained if the
statistical analysis is repeated without data from Fog 4.

55
E-6, 1.5 m
-0.2
0
0.2
0.4
0.6
0.8
1
170 180 190 200 210 220
mg
N m
-2 d
ay-1
2000
Fog 2, 3 m
-0.2
0
0.2
0.4
0.6
0.8
1
170 180 190 200 210 220
mg
N m
-2 d
ay-1
2000
Fog 4, 2.5 m
-0.2
0
0.2
0.4
0.6
0.8
1
170 180 190 200 210 220
Julian Day
mg
N m
-2 d
ay-1
2000
Fog 2, 6 m
-0.2
0
0.2
0.4
0.6
0.8
1
170 180 190 200 210 220Julian Day
mg
N m
-2 d
ay-1
E-6, 2.5 m
-0.2
0
0.2
0.4
0.6
0.8
1
170 180 190 200 210 220m
g N
m-2
day
-1
E-5, 6 m
-0.2
0
0.2
0.4
0.6
0.8
1
170 180 190 200 210 220
mg
N m
-2 d
ay-1
20022003
E-5, 3 m
-0.2
0
0.2
0.4
0.6
0.8
1
170 180 190 200 210 220
mg
N m
-2 d
ay-1
200120022003
2000
Figure 2.2 Seasonal benthic N2 fixation in the fertilized (E-5 and E-6) and reference (Fog 2 and Fog 4) lakes.

56
0
0.1
0.2
0.3
0.4
0.5
0.6
2000 2001 2002 2003
mg
N m
-2 d
ay-1
E-5E-6
.
0
0.1
0.2
0.3
0.4
0.5
0.6
2000 2001 2002 2003
mg
N m
-2 d
ay-1
Fog 2Fog 4
Figure 2.3 Graph showing benthic N2 fixation in the fertilization lakes (top panel) and the reference lakes (bottom panel).

57
Table 2.2. Yearly averages for benthic N2 fixation, benthic chlorophyll a, GPP, and CR in the fertilization and reference lakes.
Benthic N2 fixation (mg N m-2 day-1) E-5, 3m E-5, 6m Fog 2, 3m Fog 2, 6m E-6, 1.5m E-6, 3m Fog 4, 2.5m 2000 0.39 ± 0.01 - 0.08 ± 0.01 - 0.33 ± 0.01 - 0.31 ± 0.01 2001 0.12 ± 0.03 - 0.25 ± 0.10 - 0.38 ± 0.23 - 0.05 ± 0.01 2002 0.11 ± 0.08 0.31±0.12 0.46 ± 0.15 0.25±0.01 0.14 ± 0.08 0.07± 0.05 0.09 ± 0.01 2003 0.09 ± 0.02 0.06±0.13 0.46 ± 0.11 0.22±0.03 0.07 ± 0.02 0.11± 0.02 0.38 ± 0.32
Benthic Chlorophyll a (mg m-2) E-5, 3m Fog 2, 3m E-6, 1.5m Fog 4, 2.5m 2000 132 ± 4 100 ±3 118 ± 11 303 ± 6 2001 144 ± 39 438 ± 62 217 ± 37 382 ± 81 2002 142 ± 8 125 ± 12 303 ± 32 545 ± 28 2003 281 ± 22 254 ± 49 320 ± 29 694 ± 34
Benthic GPP (mg C m-2 day-1) E-5, 3m Fog 2, 3m E-6, 1.5m Fog 4, 2.5m 2000 60 ± NA 110 ± NA 115 ± NA 132± NA 2001 65 ± 52 NA 158 ± 23 NA 2002 53 ± 15 149 ± NA 104 ± 15 66 ± NA 2003 30 ± 7 92± NA 203 ± 34 101± NA
Benthic Community Respiration (mg C m-2day-1) E-5, 3m Fog 2, 3m E-6, 1.5m Fog 4, 2.5m 2000 -106 ± NA -142 ± NA -152 ± NA -168 ± NA 2001 -106 ± 59 NA -202 ± 14 NA 2002 -80 ± 11 -121± NA -110 ± NA -201± NA 2003 -83 ± 8 -133± NA -197 ± 26 -144± NA

58
Table 2.3. Summary of repeated measures ANOVA models for benthic processes in the fertilized and reference lakes. The most parsimonious model was determined by using the maximum likelihood test and resulted in models that included only significant
predictors of the Y variable.
Numerator
DF Denominator
DF F-Value p-valueN2 Fixation (mg N2 fixed m2 day-1)
Treatment 1 41 3.05 0.039 Year 3 41 16.91 0.0002
Gross Primary Production (mg C m-2 day-1) Lake Depth 1 23 39.19 <0.0001
Community Respiration (mg C m-2 year-1) Lake Depth 1 23 11.51 0.003
Proportion Chlorophyll a Treatment 1 33 42.25 <0.0001 Year 3 33 22.81 <0.0001 Lake Depth 1 33 8.92 0.005

59
Table 2.4. Magnitude of significant effects for repeated measures ANOVAs for benthic processes in fertilized and reference lakes. Dummy variables are denoted by a period and are used to determine which variables are significantly different from one
another by the corresponding p-value.
EstimateStandard
Error DF T-
Value p-valueN2 Fixation (mg N2 fixed m2 day-1) Treatment Fertilized 0.083 0.020 41 4.11 . Reference 0.317 0.057 41 4.11 0.0002 Year 2000 0.222 0.079 41 2.81 0.008 2001 0.048 0.036 41 1.36 0.182 2002 0.007 0.032 41 0.22 0.830 2003 0.083 0.020 41 4.11 . GPP (mg C m-2 day-1) Lake Depth Deep 49.040 11.190 23 -6.26 <0.0001 Shallow 119.090 8.330 23 14.30 . CR (mg C m-2 year-1) Lake Depth Deep -92.700 15.877 23 3.39 0.001 Shallow -146.560 9.433 23 3.39 . Proportion Chl a
Treatment Fertilized 0.683 0.026 33 26.16 . Reference 0.857 0.027 33 6.50 <0.0001 Year 2000 0.373 0.044 33 -7.02 <0.0001 2001 0.515 0.028 33 -6.01 <0.0001 2002 0.567 0.031 33 -3.72 0.0007 2003 0.683 0.026 33 26.16 . Lake Depth Deep 0.613 0.023 33 -2.99 0.005 Shallow 0.683 0.026 33 26.16 .

60
-300
-200
-100
0
100
200
300
mg
C m
-2 y
ear-1
E-5E-6
-300
-200
-100
0
100
200
300
2000 2001 2002 2003
mg
C m
-2 y
ear-1
Fog 2Fog 4
Figure 2.4. GPP and CR in the fertilized (top panel) and reference (bottom panel) lakes. No data are available from year 2001 from the reference lakes.

61
0
0.08
0.16
0.24
0.32
0.4
0.48
0.56
Chl
a/T
otal
chl
E-6E-5
0
0.08
0.16
0.24
0.32
0.4
0.48
0.56
2000 2001 2002 2003
Chl
a/T
otal
chl
Fog 4Fog 2
Figure 2.5. Annual averages of proportion of benthic chlorophyll a at the shallow stations in the fertilization lakes (E-5 and E-6; top panel) and the two reference lakes (Fog 2 and Fog 4; bottom panel).
Response of N2 fixation to ambient light in fertilization and reference lakes.
The light extinction coefficients (k) generally increased in the fertilization lakes from
the pre-fertilization year (2000) to year 2003 (Table 2.5; Figure 2.6). The light
extinction coefficient increased by 0.5 in Lake E-6 at 1.5 m and in Lake E-5 at 3 m by
0.12. The light extinction coefficient also increased dramatically in Fog 4 by 0.71,
while it was more variable from year to year in Fog 2 (Table 2.5; Figure 2.6). The

62
increase in k in Fog 4 was likely due to the thermokarst activity as described above.
As light extinction coefficients increased in the fertilization lakes, ambient PAR at
depth also decreased (Figure 2.6); however, in 2003, ambient PAR at depth was
similar to the pre-fertilization year because 2003 was a sunnier year than the previous
years of the experiment (Table 2.5).
Table 2.5. Light parameters for reference and treatment lakes 2000 – 2003. A. Ambient photosynthetically active radiation (PAR) for growing season (21 June – 10
Aug). B. Vertical extinction coefficient at depth for each lake for each year. The vertical extinction coefficient is the average of the extinction coefficients at each
sampled depth in the reference and fertilization lakes. C. Average PAR at depth is given for each year in each lake.
A. Average growing season PAR (μE m2 sec-1) ± SE
2000 371.92 ± 9.71 2001 372.98 ± 9.34 2002 323.16 ± 8.68 2003 495.04 ± 9.01
B. Average seasonal vertical extinction coefficient at depth E-5, 3m Fog 2, 3m E-6, 1m Fog 4, 2.5m
2000 1.08 0.64 1.82 1.02 2001 0.97 0.43 1.61 1.18 2002 1.33 0.45 2.22 1.27 2003 1.20 0.80 2.32 1.73
C. Average summer PAR at depth (μE m-2 sec-1) Lake E-5 Lake Fog 2 Lake E-6 Fog 4 3m 6m 3m 6m 1m 3m 2.5m
2000 16.10 . 56.33 . 68.24 . 66.82 2001 21.44 . 102.29 . 80.73 . 39.22 2002 6.56 4.32 86.95 17.29 42.75 5.42 26.80 2003 16.39 1.67 46.53 24.65 50.17 7.67 17.90
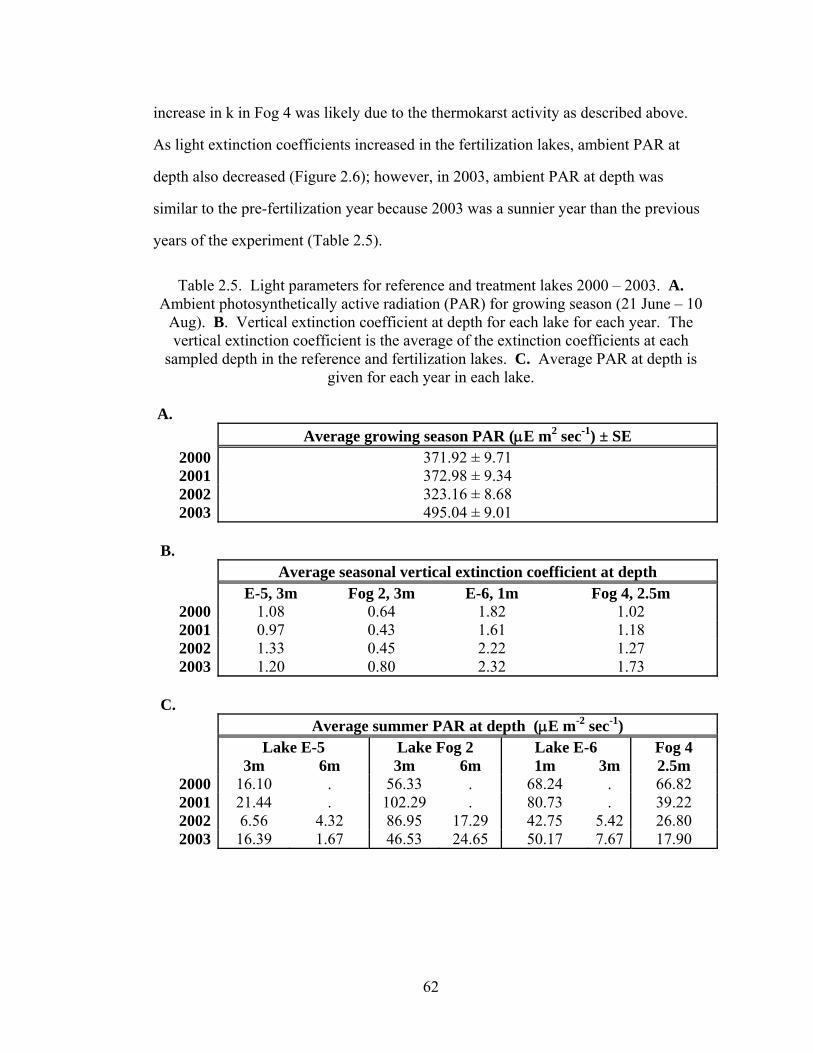
63
Lake E-6, 1m
0153045607590
105
2000 2001 2002 2003
PAR
( μE
m-2
sec-1
)
0
0.5
1
1.5
2
2.5
k
Lake E-5, 3m
0153045607590
105
2000 2001 2002 2003
PAR
( μE
m-2
sec-1
)
0
0.5
1
1.5
2
2.5
k
Lake Fog 4, 2.5 m
0153045607590
105
2000 2001 2002 2003
Year
PAR
( μE
m-2
sec-1
)
0
0.5
1
1.5
2
2.5
k
Lake Fog 2, 3 m
0153045607590
105
2000 2001 2002 2003
Year
PAR
( μE
m-2
sec-1
)
0
0.5
1
1.5
2
2.5
k
Figure 2.6. Light extinction coefficient, k (lines), and average ambient PAR (bars) for each year at shallow stations in fertilization and shallow reference lakes.
A random coefficient analysis using ambient light and measured N2-fixation
rates in the fertilization and reference lakes in all years showed that N2 fixation was
not related to ambient light in E-5, E-6, or Fog 4 (p<0.05; Table 2.6). (NI curves
showed that N2 fixation was related to light in some lakes at some depths in the
laboratory; these results are discussed below.) N2 fixation was related to ambient lake
light only in Fog 2 (p=0.006; Table 2.6), which was responsible for the overall effect
of light in the randomized coefficient analysis (p=0.006; Table 2.6).

64
Table 2.6. Results from randomized coefficent analysis relating N2-fixation rates to ambient light in the fertilization and reference lakes for all years.
N2 Fixation (mg N2 fixed m2 day-1) Estimate
Standard Error DF
T-Value p-value
Intercept -0.073 0.07 156 -1.04 0.300
Log Light (μE m-2 sec-1) 0.057 0.021 156 2.74 0.007
Slope
Standard Error DF
T-Value p-value
E5 0.0004 0.0005 156 0.81 0.420
E6 -0.0003 0.0003 156 -0.90 0.370
Fog 2 0.0010 0.0004 156 2.79 0.006
Fog 4 0.0001 0.0006 156 0.16 0.870
In addition to the lack of a response of N2 fixation to light in the fertilization
lakes as demonstrated by the random coefficient analysis, several other patterns also
indicate that N2 fixation was not strongly related to ambient light throughout the
course of this experiment. For example, in year 2000, N2 fixation was about 4 times
higher in E-5 than in Fog 2 despite the fact that ambient lake light was lower in E-5
than Fog 2 (16 vs. 56 μE m-2 sec-1 respectively; Table 2.6). Similarly, benthic N2
fixation was higher in E-6 than in Fog 4, even though their light levels were similar
(~66 – 68 μE m-2 sec-1; Table 2.5). Finally, shallow stations at Lakes E-5 and E-6
behaved similarly in response to fertilization even though the shallow station in E-6
was at 1 m and had higher light availability than the shallow station at 3 m in E-5.
Therefore, differences in light do not appear to explain inter-annual variation in N2-
fixation rates or the differences between lakes.
While light does not appear to explain between-lake differences in N2-fixation
rates, it may be important in explaining within-lake differences. Deep stations, which
had lower light levels than shallow stations (Table 2.6), also had lower N2-fixation
rates (Table 2.2), but this was not always a statistically robust difference. In lake E-5,

65
the deep-station average for N2 fixation was 0.05 ± 0.01, while the shallow-station
average was 0.13 ± 0.03 (t-value = -1.85; p=0.08). N2-fixation rates at deep and
shallow stations were not significantly different from one another in lakes E-6 and Fog
2, although the means were higher at the shallow station in each lake (0.21 vs. 0.09 mg
N m-2 day-1 for lake E-6 and 0.39 vs. 0.23 mg N m-2 day-1 for Fog 2). The difference
in benthic N2 fixation between shallow and deep stations was greatest in the
fertilization lakes, which also had the greatest difference in light availability between
stations (Table 2.2).
N2 fixation–Irradiance curves. In the controlled laboratory experiment in
which N2 fixation was measured in response to increasing light levels, all of the
shallow stations except in E-6 showed a positive, saturating response (Figure 2.7;
Table 2.8). None of the deep stations except Lake Fog 2 showed a significant
relationship with light, but the N2-fixation rates were also very low. While both the
shallow stations in E-5 and Fog 2 showed a similar response to light at low light levels
(alpha = 0.007), Fog 2 had a higher Nmax than E-5 (0.77 vs 0.51 mg N m-2 day-1
respectively). In addition, the half saturation constant for Fog 2 was nearly twice that
for E-5 (76 μE m-2 sec-1 vs. 44 μE m-2 sec-1 respectively.) The deep station in Lake
Fog 2 was similar to the response at the shallow station in Lake Fog 2, although it had
a slightly smaller alpha (0.005) and a higher Nmax resulting in a higher half saturation
constant at 120 μE m-2 sec-1 (Table 2.8). Fog 4 also showed a positive relationship of
benthic N2 fixation with light, achieving Nmax at 0.36 mg N m-2 day-1 and a half
saturation constant of 120 μE m-2 sec-1, while its fertilized counterpart, E-6, showed no
relationship light.

66
0
0.2
0.4
0.6
0.8
1
0 100 200 300 400
mg
N m
-2 d
ay-1
Fog 2, 3m
E-5, 3m
0
0.2
0.4
0.6
0.8
1
0 100 200 300 400
Light (μE m-2 day-1)
mg
N m
-2 d
ay-1
E-5, 6m
Fog 2, 6m
0
0.2
0.4
0.6
0.8
1
0 100 200 300 400
Light (μE m-2 day-1)
mg
N m
-2 d
ay-1
Fog 4, 2m
E-6, 1.5m
Figure 2.7. Light response curves for benthic N2 fixation in the deep fertilization lake (E-5), the deep reference lake (Fog 2), the shallow fertilization lake (E-6), and the shallow reference lake (Fog 4). Benthic N2 fixation in E-6 at 1.5 m and in E-5 at 6 m was not related to light level.
N2-fixation response to nutrient addition to cores, Lake Fog 2. In the nutrient-
addition laboratory experiment, benthic N2-fixation rate significantly increased due to
the addition of P by 0.13 mg N m-2 day-1, or 38% relative to the control (p=0.03; Figure
2.8; Table 2.9). The +P treatment was also higher than the +N treatment by 0.15 mg
N m-2 day-1, or 46% (p=0.08; Figure 2.8; Table 2.8). There was no significant
response of GPP or chlorophyll a to added nutrients, but there is a slight indication
that GPP responded most to the +N treatments and chlorophyll responded most to the
+N+P treatment (Figure 2.8). The molar N:P ratio in the ammonium and phosphorus
concentrations measured at the end of the experiment was significantly higher than
controls in the +N treatments (Figure 2.9; Table 2.8), and a simple linear regression
analysis indicates that N2 fixation was negatively related to N:P ratio (p=0.01 R2 =
0.56).

67
Table 2.7. Light curve parameters for benthic N2-fixation curves from shallow and deep stations in the fertilization and reference lakes. “NA” indicates that there was no significant relationship between light and benthic N2 fixation.
Lake Depth
(m) Treatment Nmax alpha Nd I1/2 R2 p-value E-5 3 Fertilized 0.51 ± 0.04 0.008 ± 0.002 -0.012 ± 0.08 44.01 0.91 <0.0001 Fog 2 3 Reference 0.77 ± 0.09 0.007 ± 0.002 0.067 ± 0.06 76.08 0.86 <0.0001 E-6 2 Fertilized NA NA NA NA NA NA Fog 4 2.5 Reference 0.36 ± 0.081 0.009 ± 0.006 -0.04 ± 0.07 27.76 0.53 0.001 E-5 6 Fertilized NA NA NA NA NA NA Fog 2 6 Reference 0.87 ± 0.22 0.005 ± 0.002 0.05 ± 0.09 120.08 0.79 0.0008

68
Table 2.8. ANOVA statistics for the nutrient core incubation experiment. There was a significant treatment effect for benthic N2 fixation and for the ending N:P ratio molar
concentrations. Treatment was not significant for chlorophyll a, gross primary production, or respiration.
DF
Mean Square Error
F-Value p-value
Benthic N2-fixation Treatment 3 0.015 4.29 0.04Error 8 0.003 Total 11 Chlorophyll a Treatment 3 1273 0.61 0.62Error 16 2079 Total 19 Gross Primary Production Treatment 3 7313 0.44 0.74Error 4 16754 Total 7 Respiration Treatment 3 1804 1.159 0.43Error 4 1556 Total 7 N:P Ratio Treatment 3 537 3.58 0.04Error 16 150 Total 19

69
00.10.20.30.40.50.6
Control +N +N+P +PN-F
ixat
ion
(mg
N m-2
day
-1)
-300
-100
100
300
500
700
Control +N +N+P +P
GPP
(mg
C m
-2 d
ay-1
)
050
100150200250300
Control +N +N+P +P
Chl
orop
hyll
a (m
g m-2
)
a aa,b
b
Figure 2.8. Results from a nutrient-addition experiment to intact sediment cores. N2 fixation in the +P treatment was significantly higher than the control and the +N treatment (Tukey; α < 0.08). Chlorophyll, GPP, and Respiration were not significantly different among treatments.

70
R2 = 0.56; p=0.01
0.2
0.25
0.3
0.35
0.4
0.45
0.5
0.55
0 5 10 15 20 25 30 35 40 45
N:P Molar Ratio
mg
N m
-2 d
ay-1
05
1015202530354045
Control +N +N+P +P
N:P
mol
ar ra
tio
a
a,b
b
a,b
Figure 2.9. Relationship between N2 fixation and N:P ratio in nutrient addition cores. A. The N:P molar ratio as measured by ammonium and phosphorus concentration was significantly higher in the +N treatment, and was approximately Redfield in the +N+P treatment. B. N2-fixation rate was significantly related N:P ratio such that the lowest N:P ratio yielded the highest N2-fixation rate.
DISCUSSION.
The study shows that benthic N2 fixation declined by about 4-fold in both the
shallow and deep lake in response to fertilization. There are few other studies that
examine the effect of whole-lake fertilization on benthic N2 fixation, but these results
A.
B.

71
are consistent with one; Bergman and Welsh (1990) found that in an N and P fertilized
lake (N:P=14.6:1), epilithic N2 fixation was suppressed by about 50% relative to their
non-fertilized reference lake. Benthic N2 fixation may have declined in fertilization
lakes for one of several reasons: 1). Benthic primary production and/or biomass
declined, causing a decline in the demand for N; 2). Light reaching the benthos
declined, and autotrophic N2 fixation became light-limited; or 3). Increased N
availability by fertilization reduced the favorability and competitive advantage of N2
fixation. The in situ patterns in GPP, CR, and chlorophyll a in conjunction with the
laboratory experiments provide insight into which mechanism may be causing this
observed pattern.
Chlorophyll a proportion increased by year 2003 in both fertilization lakes.
These results are in contrast with those of Nydick et al. (2004b), who showed that
epipelic chlorophyll a biomass did not respond to added nutrients over the course of a
summer of fertilization to encloses in two oligotrophic lakes in Wyoming. However,
response times for benthic chlorophyll may be long, especially in the Arctic, where
turnover time is nearly an entire summer (Chapter 3), and it may take several years to
be able observe a treatment effect (e.g., O’Brien et al. 2005). This lag time is shown
in the deep fertilization lake, E-5, which did not respond to treatment until 2003.
Benthic algae may also adapt to low light levels by increasing chlorophyll a content
(Wetzel 2001), and this response in our data may account for the fact that the increase
in chlorophyll a proportion is not accompanied by increases in GPP or CR.
Benthic GPP remained relatively constant in the fertilization lakes, indicating
that autotrophic N demand probably did not change. The results of this whole-lake
fertilization experiment contrast those of an experiment in Peter Lake, Michigan,
which showed that epipelic production declined in response to fertilization as a result
of reduced light availability (Vadeboncoeur et al. 2001). However, the fertilization

72
rate in that experiment was an order of magnitude greater per day than that of this
study per year (i.e., 31 μM P m-3 day-1 in their study vs. 0.25 μM P m-3 year-1 in this
study). As a result, light to the sediment bottom was not drastically reduced in
response to fertilization (i.e., light was penetration reduced by about 75% in the
Vadaboncouer et al. study whereas this study showed a decline of 15 – 20%; Table
2.5). The fact that GPP and CR have not increased indicate that N demand by primary
producers has not declined as a result of fertilization, but has likely stayed the same.
Thus, benthic N2 fixation probably has not declined as a result of decreased N demand
by primary producers in the sediments.
Ambient lake light at depth declined throughout the treatment period because
the light extinction coefficients increased (Figure 2.6); however, the summer season in
2003 had about 140 μE m-2 sec-1 more light than the average of the previous 3 years
(Table 2.5), and the decline in light availability was not very dramatic (15 – 20%;
Table 2.5). Surprisingly, N2 fixation was related to ambient light availability over the
years of the experiment only in the deep reference lake, Fog 2, and not in the
fertilization lakes. Although light declined most dramatically (nearly 4-fold) in the
shallow reference lake due to termokarst activity, N2 fixation was not related to light
in that lake, either. These results suggest that differences in ambient light did not
explain inter-annual variation in N2 fixation, nor could they explain the differences in
N2 fixation between reference and fertilization lakes over the course of the experiment.
These results seem to contrast with results from the NI curves, which showed
that N2 fixation was significantly related to light availability in the laboratory for lakes
Fog 2, E-5, and Fog 4. This discrepancy could be due to the fact that the range over
which we conducted the light-response incubations (0-250 μE m-2 sec-1) far exceeded
the change in light availability in the experimental lakes as a result of fertilization (6 –
80 μE m-2 sec-1; Table 2.5). N2-fixation rates predicted by the NI curves are similar to
73
actual N2 fixation at the seasonal light levels shown in Table 2.5; however, the N2-
fixation rates may be within the variability predicted by the NI model, which would
prevent us from determining a significant relationship between ambient light and
benthic N2 fixation. The short duration of the laboratory experiment also means that
N2-fixing community may not have had time to adapt to low light levels, as they
would over the course of several years.
Although light cannot explain the decline of N2 fixation in the fertilization
lakes, light availability may explain within-lake variation in N2 fixation as a function
of depth. For example, N2 fixation rates at the deep station are generally lower than
they are at the shallow stations (Table 2.2). The deep station in Fog 2 showed a higher
½ saturation constant than the shallow station, indicating more light limitation at
depth. In E-5, the deep cores had no significant relationship with light, which may be
due to a low N2-fixing biomass at the depth. Since we express the NI curves on an
areal basis rather than on a biomass basis, low biomass may reduce our ability to
detect a light response. Finally, ½ saturation constants for each lake were higher than
average seasonal ambient PAR (Table 2.7; Table 2.5), suggesting that the other lakes
may also be light limited. As such, these results indicate that light is an important
factor controlling N2 fixation, and these curves could be used to model N2 fixation
over depths over a season and applied to estimate seasonal rates of N2 fixation (e.g.
Higgins et al. 2001; Bergmann and Welch 1990, Grimm and Petrone 1997); however,
they cannot be used to predict differences between lakes or responses due to
fertilization. Another mechanism besides light acts to control N2 fixation in the
fertilization lakes.
The third hypothesis to explain the reduction of N2 fixation to fertilization is
that increased N availability from fertilization reduced the favorability of N2 fixation.
Results from the core incubation indicate that nutrient addition may be responsible,

74
but the exact mechanism is unclear. N2 fixation was significantly negatively related to
the N:P ratio in the treatments such that N2 fixation was lowest in the +N treatment
and highest in the +P treatment (R2=0.56; p=0.01; Figure 2.9). This result is
consistent with water-column studies that indicate that N2 fixers gain a competitive
advantage when N supply is low relative to P and can compensate for N limitation
(Schindler 1977, Findlay et al. 1994; Hendzel et al. 1994; Flett et al. 1980), and
suggests that benthic N2 fixation has similar responses to nutrient controls as water-
column N2 fixation. When N2 fixation is compared among treatments, however, there
was no effect of added N either alone or together with P (Tukey p<0.05; Figure 2.8;
Table 2.8). These results are inconsistent with the results of the whole-lake
fertilization experiment in which N2 fixation declined with the addition of N and P,
and also those of Bergman and Welsh (1990) in which N2 fixation declined in an N-
and P- fertilized lake in the NWT, Canada.
Other researchers have shown that high concentrations of inorganic N suppress
the synthesis of nitrogenase, but not necessarily the activity of nitrogenase that has
already been produced (Pearl et al. 1981; Horne et al. 1979). This response may not
be detected if N2-fixer turnover is long relative to the length of the experiment. N2
fixers are known to be slower-growing than many algal species (Chan et al. 2004), and
benthic algal turnover in these systems is about two months (Chapter 3). It possible
that high ammonium concentrations in the core experiment suppressed the production
of new nitrogenase, but the experiment was not long enough to detect that kind of
change.
It is unlikely that increased inorganic N concentration in the whole-lake
experiments caused the observed decline in N2 fixation, because added nutrients
appeared to be taken up quickly, and water-column N concentrations remained very
low throughout the course of the experiment (Arctic LTER Database). There is little

75
evidence for increased N concentration in the sediments as a result of fertilization,
although ammonium flux in the dark chambers (used to measure benthic respiration)
was detected in Lake E-6 in 2004, indicating that mineralization of organic matter may
be starting to exceed heterotrophic N demand (Giblin unpublished data). If this N is
available for uptake by the autotrophic community, the advantage of fixing N2 may be
reduced.
Benthic communities have a significant capacity for N uptake, and it has been
shown to exceed that of phytoplankton communities in other oligotrophic systems.
For example, Axler and Reuter (1996) showed that more than 50% of an added 15N-
NO3 tracer was taken up by sediments and periphyton in Castle Lake, while less than
9% of it was recovered in the water column. In a series of mesocosm experiments in
oligotrophic mountain lakes in which 15N-NO3 tracer was added in conjunction with
fertilizer, Nydick et al. (2004a) also showed that a significant portion was taken up by
sediments and periphyton. Increased N availability in the sediments — either by
mineralization of organic matter or by direct uptake of N from added fertilizer —
could alleviate N limitation or reduce the competitive advantage of N2 fixers. It is
likely that N2 fixation was suppressed in the whole-lake fertilization experiment
because increased N input from fertilization satisfied some of the N demand by
autotrophs in the benthos.
The results from the whole-lake fertilization experiment and the core
incubation experiment show that N2 fixation was more sensitive to added nutrients
than chlorophyll or production, indicating that changes in nutrient status can
significantly alter the pathway of new N input through N2 fixation to lakes before
changes in other benthic processes are evident. Thus, low-level nutrient additions of
N and P may suppress N2 fixation and maintain these systems at N-limitation status
through the early stages of eutrophication.

76
REFERENCES. Abeles, F. B., P. W. Morgan, and M. E. J. Saltveit. 1992. Ethylene in plant biology.
Academic Press.
Alexander, V., S. C. Whalen, and K. M. Klingensmith. 1989. Nitrogen cycling in arctic lakes and ponds. Hydrobiologia 172: 165-172.
Axler, R. P., and J. E. Reuter. 1996. Nitrate uptake by phytoplankton and periphyton: Whole-lake enrichments and mesocosm N15 experiments in an oligotrophic lake. Limnol. Oceanog. 41: 659-671.
Baron, J. S. and others 2000. Ecosystem responses to nitrogen deposition in the Colorado front range. Ecosystems 3: 352-368.
Bergmann, M. A., and H. E. Welch. 1990. Nitrogen fixation by epilithic periphyton in small arctic lakes in response to experimental nitrogen and phosphorus fertilization. Can. J. Fish. Aquat. Sci. 47: 1545-1550.
Bergstrom, A. K., and M. Jansson. 2006. Atmospheric nitrogen deposition has caused nitrogen enrichment and eutrophication of lakes in the northern hemisphere. Glob. Change Biol. 12: 635-643.
Bianchi, T. S., S. Findlay, and D. Fontvieille. 1991. Experimental degradation of plant materials in Hudson River sediments. 1. Heterotrophic transformations of plant pigments. Biogeochemistry 12: 171-187.
Capone, D. G. 1988. Benthic nitrogen fixation: Microbiology, physiology and ecology, p. 85-103, Nitrogen Cycling in coastal marine environments, Proc SCOPE Symposium 33.
Chan, F., M. L. Pace, R. W. Howarth, and R. M. Marino. 2004. Bloom formation in heterocystic nitrogen-fixing cyanobacteria: The dependence on colony size and zooplankton grazing. Limnol. Oceanog. 49: 2171-2178.
Cornwell, J. C., and G. W. Kipphut. 1992. Biogeochemistry of manganese- and iron-rich sediments in Toolik lake, Alaska. Hydrobiologia 240: 45-59.
Elsgaard, L., and L. Andersen. 1998. Microbial ethylene consumption in peat-soil during ethylene exposure of Begonia elatior. Plant Soil 202: 231-239.
Findlay, D. L., R. E. Hecky, L. L. Hendzel, M. P. Stainton, and G. W. Regehr. 1994. Relationship between N2 fixation and heterocyst abundance and its relevance to the nitrogen budget of Lake 227. Can. J. Fish. Aquat. Sci. 51: 2254-2266.
Flett, R. J., R. D. Hamilton, and N. E. R. Campbell. 1976. Aquatic acetylene reduction techniques: Solutions to several problems. Can. J. Microbiol. 22: 43-51.
77
Flett, R. J., D. W. Schindler, R. D. Hamilton, and N. E. R. Campbell. 1980. Nitrogen fixation in Canadian Precambrian shield lakes. Can. J. Fish. Aquat. Sci. 37: 494-505.
Goldman, C. R. 1988. Primary productivity, nutrients, and transparency during the early onset of eutrophication in ultra-oligotrophic Lake Tahoe, California Nevada. Limnol. Oceanog. 33: 1321-1333.
Grimm, N. B., and K. C. Petrone. 1997. Nitrogen fixation in a desert stream ecosystem. Biogeochemistry 37: 33-61.
Hamilton, T. D. 2003. Glacial geology of the Toolik lake and upper Kuparuk River region. In D. A. Walker [ed.], Biological Papers of the University of Alaska. University of Alaska Fairbanks, Institute of Arctic Biology.
Hendzel, L. L., R. E. Hecky, and D. L. Findlay. 1994. Recent changes of N2 fixation in Lake 227 in response to reduction of the N:P loading ratio. Can. J. Fish. Aquat. Sci. 51: 2247-2253.
Higgins, S. N., R. E. Hecky, and W. D. Taylor. 2001. Epilithic nitrogen fixation in the rocky littoral zones of Lake Malawi, Africa. Limnol. Oceanog. 46: 976-982.
Hinzman, L. D. and others 2005. Evidence and implications of recent climate change in northern Alaska and other arctic regions. Clim. Change. 72: 251-298.
Hobbie, J. E. and others 1999. Impact of global change on the biogeochemistry and ecology of an arctic freshwater system. Polar Res. 18: 207-214.
Horne, A. J., J. C. Sandusky, and C. J. W. Carmiggelt. 1979. Nitrogen fixation in Clear Lake, California .3. Repetitive synoptic sampling of the spring Aphanizomenon blooms. Limnol. Oceanog. 24: 316-328.
Howarth, R. W., R. Marino, and J. J. Cole. 1988a. Nitrogen fixation in fresh-water, estuarine, and marine ecosystems .2. Biogeochemical controls. Limnol. Oceanog. 33: 688-701.
Howarth, R. W., R. Marino, J. Lane, and J. J. Cole. 1988b. Nitrogen fixation in fresh-water, estuarine, and marine ecosystems .1. Rates and importance. Limnol. Oceanog. 33: 669-687.
Howarth, R. W., and A. F. Michaels. 2000. The measurement of primary production in aquatic systems, p. 72-85. In O. E. Sala, R. B. Jackson, H. A. Mooney and R. W. Howarth [eds.], Methods in ecosystem science. Springer- Verlag.
Jackel, U., S. Schnell, and R. Conrad. 2004. Microbial ethylene production and inhibition of methanotrophic activity in a deciduous forest soil. Soil Biol. Biochem. 36: 835-840.

78
Lee, R. F., and J. Baker. 1992. Ethylene and ethane production in an estuarine river: Formation from the decomposition of polyunsaturated fatty acids. Mar. Chem. 38: 25-36.
Lewis, W. M., and S. N. Levine. 1984. The light response of nitrogen fixation in Lake Valencia, Venezuela. Limnol. Oceanog. 29: 894-900.
Lorenzen, C. J. 1967. Determination of chlorophyll and pheopigments: Spectrophotometric equations. Limnol. Oceanog. 12: 343-&.
Marino, R., R. W. Howarth, F. Chan, J. J. Cole, and G. E. Likens. 2003. Sulfate inhibition of molybdenum-dependent nitrogen fixation by planktonic cyanobacteria under seawater conditions: A non-reversible effect. Hydrobiologia 500: 277-293.
Miller, M. C., G. R. Hater, P. Spatt, P. Westlake, and D. P. P. Yeakel. 1986. Primary production and its control in Toolik lake, Alaska. Arch. Hydrobiol. Suppl. 74(1): 97-131.
Moeller, R. E., and J. P. Roskoski. 1978. Nitrogen fixation in littoral benthos of an oligotrophic lake. Hydrobiologia 60: 13-16.
Nydick, K. R., B. M. Lafrancois, and J. S. Baron. 2004a. NO3 uptake in shallow, oligotrophic, mountain lakes: The influence of elevated NO3 concentrations. J. N. Am. Benthol. Soc. 23: 397-415.
Nydick, K. R., B. M. Lafrancois, J. S. Baron, and B. M. Johnson. 2003. Lake-specific responses to elevated atmospheric nitrogen deposition in the Colorado rocky mountains, USA. Hydrobiologia 510: 103-114.
---. 2004b. Nitrogen regulation of algal biomass, productivity, and composition in shallow mountain lakes, snowy range, Wyoming, USA. Can. J. Fish. Aquat. Sci. 61: 1256-1268.
O'Brien, W. J. and others 2005. Long-term response and recovery to nutrient addition of a partitioned arctic lake. Freshwater Biology 50: 731-741.
Paerl, H. W. 1990. Physiological ecology and regulation of N2 fixation in natural waters. Adv. Microb. Ecol. 11: 305-344.
Pearl, H. W., K. L. Webb, J. Baker, and W. J. Wiebe. 1981. Nitrogen fixation in waters, p. 193-240. In W. J. Broughton [ed.], Nitrogen fixation. Clarendon Press.
Ramlal, P. S., R. H. Hesslein, R. E. Hecky, E. J. Fee, J. W. M. Rudd, and S. J. Guildford. 1994. The organic carbon budget of a shallow arctic tundra lake on

79
the Tuktoyaktuk Peninsula, NWT, Canada - arctic lake carbon budget. Biogeochemistry 24: 145-172.
Reuter, J. E., S. L. Loeb, and C. R. Goldman. 1986. Inorganic nitrogen uptake by epilithic periphyton in a N-deficient lake. Limnol. Oceanog. 31: 149-160.
Roberts, B., Joseph. 2004. Assessing diel respiration in pelagic ecosystems using oxygen stable isotopes : When do the highest rates occur and who is respiring under different light and nutrient regimes?, p. 228, Ecology and Evolutionary Biology. Cornell University.
Sander, R. 1999. Compilation of Henry's Law constants for inorganic and organic species of potential importance in environmental chemistry (version 3).
SAS. 2002. [SAS/stat] software, version [9.1] of the SAS system for [unix]. Copyright © 2002-2004, SAS institute Inc.
Schindler, D. W. 1977. Evolution of phosphorus limitation in lakes. Science 195: 260-262.
Staal, M., S. T. L. Hekkert, P. Herman, and L. J. Stal. 2002. Comparison of models describing light dependence of N2 fixation in heterocystous cyanobacteria. Appl. Environ. Microbiol. 68: 4679-4683.
Stal, L. J., and A. E. Walsby. 2000. Photosynthesis and nitrogen fixation in a cyanobacterial bloom in the Baltic Sea. Eur. J. Phycol. 35: 97-108.
Strickland, J. D. H., and T. R. Parsons. 1972. A practical handbook of seawater analysis, 2nd ed. Fish. Res. Bd. Canada.
Vadeboncoeur, Y., E. Jeppesen, M. J. Vander Zanden, H. H. Schierup, K. Christoffersen, and D. M. Lodge. 2003. From Greenland to green lakes: Cultural eutrophication and the loss of benthic pathways in lakes. Limnol. Oceanog. 48: 1408-1418.
Vadeboncoeur, Y., D. M. Lodge, and S. R. Carpenter. 2001. Whole-lake fertilization effects on distribution of primary production between benthic and pelagic habitats. Ecology 82: 1065-1077.
Vitousek, P. M. and others 2002. Towards an ecological understanding of biological nitrogen fixation. Biogeochemistry 57: 1-45.
Vitousek, P. M., and R. W. Howarth. 1991. Nitrogen limitation on land and in the sea: How can it occur? Biogeochemistry 13: 87-115.
Webb, W. L., M. Newton, and D. Starr. 1974. Carbon dioxide exchange of alnus rubra: A mathematical model. Oecologia 17: 281-291.

80
Wetzel, R. G. 2001. Limnology, Third ed. Harcourt Brace College Publishers.
Wetzel, R. G., and G. E. Likens. 1991. Limnological analysis, Second ed. Springer.
Whalen, S. C., and J. C. Cornwell. 1985. Nitrogen, phosphorus, and organic-carbon cycling in an arctic lake. Can. J. Fish. Aquat. Sci. 42: 797-808.

81
CHAPTER 3
THE EFFECTS OF GRAZING BY THE SNAIL LYMNAEA ELODES ON
BENTHIC NITROGEN FIXATION AND PRIMARY PRODUCTION IN
OLIGOTROPHIC, ARCTIC LAKES
ABSTRACT.
This study assessed whether grazing by the snail Lymnaea elodes limits the rate of
benthic N2 fixation and primary production in N-limited oligotrophic lakes near Toolik
Field Station, Arctic Long Term Ecological Research (LTER). I also tested whether
snail excretion increased N supply and the N:P supply ratio, which could indirectly
affect the rate of N2 fixation. We performed an in situ randomized block experiment
in two lakes over 3 years in which snail density was manipulated and compared to
open cage controls. Randomized coefficient regression analysis showed that snails
significantly decreased areal rates of N2 fixation in both lakes in all years. Snails did
not, however, significantly affect measures of benthic production, including gross
primary production, respiration, net ecosystem production, or chlorophyll biomass.
The molar N-NH4+:P-PO4
+ excretion ratio was 4.8, which is well below that of benthic
algae, indicating that snails likely exacerbated N limitation rather than reduced it.
Furthermore, the excretion rate of N-NH4+ was very low relative to other sources of N
from decomposition and N2 fixation. Thus, snail excretion was probably not an
important factor in reducing N2 fixation. While the mechanism by which Lymnaea
elodes caused a decline in N2 fixation is unknown, the treatment effect was small,
accounting for a reduction of N inputs of only 0.12 mg N m-2 summer-1 or by 0.85 –
1.8%. Because N fixation is a new N input able to support new production, however,
this effect may be important over long time scales. Comparisons with the literature
indicate that snails may be unique grazers, and more work is needed in order to

82
determine how snails affect N2 fixation, N supply via excretion, and production in a
variety of environments.
INTRODUCTION.
Biological nitrogen (N) fixation of atmospheric N2 by free-living cyanobacteria
in aquatic environments is common, and in many ecosystems, it can account for a
significant portion of the biologically available N inputs. In lakes of moderate to high
productivity, N input from N2 fixation is generally sufficient to alleviate N limitation
of net primary production, so that phosphorus is considered the ultimate limiting
nutrient (Schindler 1977). In many oligotrophic, freshwater systems and estuaries,
however, N2 fixation by cyanobacteria does not compensate for N limitation, and N
limitation is maintained over relatively long time scales (Howarth et al. 1988a;
Vitousek et al. 2002).
Grazing of free-living cyanobacteria is increasingly recognized as a possible
controlling factor of N2 fixation in N-limited aquatic systems. Recent research has
shown that grazing can limit the filament size, heterocyst production, and growth rate
of filamentous cyanobacteria in some freshwater environments (Schaffner et al. 1984;
Chan et al. 2004). In estuarine environments, grazing plays a significant role in
maintaining N limitation (Howarth et al. 1999; Marino et al. 2002; Chan et al. 2004;
Marino et al. 2006). Despite the fact that grazing is demonstrably important to
understanding the dynamics of N2 fixation, N limitation, and primary production of
whole ecosystems, only a handful of published studies have examined the effect of
grazing on N fixation in oligotrophic systems. Most were conducted in tropical
marine ecosystems (Wilkinson and Sammarco 1983; Williams and Carpenter 1997),
and none to our knowledge has been done in oligotrophic lake ecosystems.
83
N limitation is prevalent in many oligotrophic lakes - e.g., East African Rift
Lakes (Bootsma and Hecky 2003); Lake Tahoe (Goldman 1988); Castle Lake (Axler
and Reuter 1996); and many other high-latitude and high-altitude lakes (Morris and
Lewis 1988; Levine and Whalen 2001). In these environments, benthic processes
often drive whole-lake production and nutrient dynamics because water column
production is low, light penetration is high, and littoral zones are large (Ramlal et al.
1994; Vadeboncoeur et al. 2003). Benthic algae comprise a significant portion of
whole-lake productivity (Wetzel 1964; Vadeboncoeur et al. 2001), and they are an
important component of lake food webs (Hecky and Hesslein 1995; Sierszen et al.
2003). N2-fixing filamentous cyanobacteria are common on the sediment in
oligotrophic lakes (Moeller and Roskoski 1978; Loeb and Reuter 1981), and because
other inputs are low, inputs of new N through autotrophic N2 fixation may be
important to their N budgets (Moeller and Roskoski 1978; Reuter et al. 1986;
Bergmann and Welch 1990; Higgins et al. 2001). Understanding the role of grazers in
controlling benthic N2 fixation and production in oligotrophic lakes is essential to
understanding how these lakes store carbon, cycle nutrients, and fuel their food webs.
In the benthic environment, grazing may be one of the most important factors
controlling cyanobacterial growth, biomass, and fixation rate because underlying
reducing conditions could help alleviate phosphorus and trace metal limitation
(Howarth et al. 1988a). However, the effects of grazing on benthic cyanobacteria and
N2 fixation are unclear, and they have been shown to exhibit both positive and
negative effects. For example, direct consumption by snail grazers has caused the
reduction of cyanobacterial biomass in some freshwater benthic environments
(McCollum et al. 1988; Tuchman and Stevenson 1991). On the other hand, selective
grazing of non-cyanobacterial algal species could supply cyanobacteria with a
competitive advantage such that they are able to increase in biomass (Cattaneo and
84
Kalff 1986; Rosemond et al. 1993). Grazing can also stimulate N2 fixation by
maintaining algal community in early successional stages, which is often dominated
by N2 fixers (Wilkinson and Sammarco 1983); or, grazers may increase light
availability to N2 fixers by canopy or epiphyte clipping and/or sediment removal
(Dodds and Castenholz 1987; Power et al. 1988; Flecker 1996; Williams and
Carpenter 1997).
Grazing may also affect N2-fixation rates indirectly by exacerbating or
alleviating N limitation through excretion of inorganic nutrients. Grazers can supply a
significant portion of inorganic nutrient (N and P) demand by primary producers
(Grimm 1988; Hall et al. 2003), and the excretion rate as well as the N:P excretion
ratio can affect the degree of nutrient limitation and the identity of the limiting nutrient
(Elser et al. 2000; Vanni 2002). If excretion drives the primary producer community
toward N limitation, N2-fixing cyanobacteria may have a greater competitive
advantage, and N2-fixation rates may increase; conversely, if excretion increases N
supply, N2 fixation may be suppressed. In a laboratory experiment, Hillebrand et al.
2004) showed that the presence of snail grazers in an N-limited mesocosm increased N
availability and consequently the N content of the periphyton community, suggesting
that snail excretion was an important supply of the limiting nutrient. A conceptual
model by Elser 1999) proposes that cyanobacteria blooms may be suppressed when
Daphnia sp. are present because their high N:P excretion ratio alleviates N limitation.
To our knowledge, no one has tested the effects of grazer excretion on N2 fixation
itself, and few experiments have shown that the excretion ratio of dominant grazers
affects N limitation in situ.
Here I report the results of in situ grazing experiments in N-limited,
oligotrophic lakes on the North Slope of Alaska in the vicinity of Toolik Field Station
(Arctic Long Term Ecological Research Site). I examine the effects of benthic

85
grazing by the snail Lymnaea elodes on benthic primary production and N2 fixation. I
also measured the snail excretion rate of nitrogen and phosphorus to assess how much
N snails could supply to primary producers relative to N2-fixation rates. Lymnaea
elodes is the dominant benthic grazer in oligotrophic arctic lakes in the vicinity of
Toolik Lake (Cuker 1983; Hershey 1990) and is a principle prey item of the top fish
predators, Lake Trout and Arctic Char (Merrick et al. 1992; Hershey et al. 1999), but
little is known about how they affect community structure of benthic algae, benthic
production, or nutrient dynamics on soft sediment in these arctic lakes.
METHODS.
Site Description. Toolik Field Station is located off the Trans-Alaskan
Pipeline haul road (Dalton Highway) in the northern foothills of the Brooks Mountain
Range in arctic Alaska (68o37′N, 149o35′W), about midway (150 miles) between the
Arctic Circle and Prudhoe Bay (Figure 3.1). The area is underlain by continuous
permafrost, and the landscape is rolling tundra terrain. The lakes in this region are
generally shallow (3 – 15 m) glacial kettles. Ice-free season is mid-June to mid-
September, and maximum epilimnetic temperatures range from 13 – 18 °C. Lakes in
this region are dimictic and ultra oligotrophic (Miller et al. 1986), and water column
concentrations of ammonium, nitrate, and phosphate are near detection limit, with
concentrations below 0.1 μmol L-1 for these major nutrients. Water column 14C-
primary production ranges from 12 – 16 g C m-2 year-1 (Miller et al. 1986). Light
penetration is high, and secchi depth ranges 6 – 10 m in the summer. Summer
thermocline depth is about 5 m, and bottom O2 concentrations in most lakes remain
high throughout the summer (7 – 8 mg L-1). Because water column production is low
and bottom oxygen concentrations are near saturation, many lakes contain oxidized
layers of Mn and Fe at the sediment–water interface (Cornwell and Kipphut 1992). In

86
general, lake bottoms comprise extremely fine-grained, unconsolidated sediment. The
N-fixing cyanobacteria Nostoc sp. form balls as large as 2 cm in diameter and are
visibly prevalent on sediment surfaces in many lakes, including the lakes in this study
(personal observation). Sediments also contain Anabaena sp. and other genera of
filamentous cyanobacteria (personal observation).
Figure 3.1. Map showing location of lakes Fog 2 (labeled F2) and S6 relative to Toolik Field Station on the North Slope of Alaska, 68o37′N, 149o35′W. Refer to Figure 1.1 in Chapter 1 for map of Alaska showing the location of Toolik Field Station.
Experiments were carried out in two lakes. Fog 2 is a headwater lake on
young glaciated surface originating from the young advance of the Itkillik Phase II
glaciation 12,000 – 25,000 ybp (Hamilton 2003). Lake Fog 2 has a surface area of 5.6
ha, maximum depth of 20 m, and an average depth of 7.8 m. Incubation experiments
of water column production show strongest responses to N addition followed by N&P
addition, indicating primary N limitation and secondary P limitation (Gross
unpublished data). Fog 2 has relatively high rates of benthic production (up to 300 mg
C m-2 day-1; Chapter 2). Lake Fog 2 contains Arctic Char, which prey upon Lymnaea
elodes, and likely control its size, distribution, and density by top-down control
(Hershey et al. 1999).

87
Lake S-6 is also on glaciated surface originating from the Itkillik Phase II
glaciation, but is smaller than Lake Fog 2. It is 1.1 ha and has a maximum depth of
8.5. The average depth is not known, but it is estimated to be about 4 – 5m based on a
depth profile performed along transects using sonar from a rubber raft. Lake S-6 has
higher benthic production than Fog 2 (up to 750 mg C m-2 day-1, Chapter 2) and a
higher conductivity (215 μS cm-1). Lake S-6 does not contain fish species that prey
upon Lymnaea elodes.
Experimental Design. I used a randomized block design in which snail density
was manipulated in each treatment. The experiment was performed in situ, and cages
were deployed using SCUBA at 3 – 4.5 m depth. Because of the heterogeneity in
benthic environments, the experiment was conducted in lake Fog 2 in years 2001,
2002, 2003 and in S-6 in year 2002 (Table 3.1). There were 2 – 3 blocks depending
on the year, and each block had three treatments: Snail exclusion (zero snails), low
density, and high density. Low- and high-density treatments varied from year to year
(Table 3.1). In year 2001, the low-density treatment had 12 snails m-2 and the high-
density treatment had 48 snails m-2. In year 2002, the low-density treatment had 24
snails m-2, and the high-density treatment had 60 snails m-2. In year 2003, the low-
density treatment had 36 snails m-2, and the high-density treatment had 72 snails m-2.
In year 2003, each block had a two replicates for each treatment. In years 2001 and
2002, there was one cage per treatment. To minimize variation in biomass, snails
between 19.5 and 22 mm were used. These snails weighed 0.8 – 1.07 grams by
length–weight regression (ln (g) = ln (mm) x 2.79 – 8.53; R2=0.76; p<0.001; n=30).
Snail cages were constructed by cutting the bottoms off 5-gallon buckets 0.25
m2 in area and covering the tops with plastic mesh screen with holes 4 mm in diameter
to enclose or exclude snails. In years 2001 and 2003, windows were cut in the sides of
the buckets to allow water exchange through the cage and to prevent shading. Each

88
window was covered with the plastic mesh, which reduced light by about 25%. To
control for cage effects which included reduced light, an open control was used whose
open sides allowed free access to the sediment by snails. In year 2002, I used a similar
bucket design but without the windows to reduce the buoyancy of the cages.
However, I was concerned that this bucket design exhibited greater cage effects (see
results below), so windows were used again in 2003.
Table 3.1. Experimental information for in situ randomized block design grazing experiment in lakes Fog 2 and S-6 in years 2001 – 2003 to examine the effect of snail
density on benthic N2 fixation and primary production. Experimental Design
Year 2001 2002 2003 Lake Fog 2 Fog 2 S-6 Fog 2 Number of Blocks 3 3 2 2 Replicates/Treatment 1 1 1 2
Snail Density Treatments (# m-2)
Year 2001 2002 2003 Lake Fog 2 Fog 2 S-6 Fog 2 Zero Snails 0 0 0 0 Low Density 12 24 24 36 High Density 36 60 60 72
Ambient Conditions
Year 2001 2002 2003 Lake Fog 2 Fog 2 S-6 Fog 2 Temperature (oC) 10 13 13 12 Light (μmol m-2 sec-1) 268 180 180 201
The experiments were conducted in the mid summer season (July) and
completed by early August. Once the experiment was deployed, snails were allowed
to graze for approximately three weeks. At the end of the experiment, SCUBA was
used to collect intact sediment cores from within each bucket with an undisturbed
sediment–water interface. Any snails present in the intact cores were removed, and
these cores were then used to make measurements of primary production, N2 fixation,
chlorophyll biomass, and algal composition. One core 2.7 cm in diameter was

89
collected from each cage for chlorophyll and algal composition analysis. Two cores
9.5 cm in diameter and 30 cm tall were collected for N2 fixation and primary
production assays. The larger core used for N2 fixation and primary production assays
was inserted into the sediment up to about 10 cm, which left about 20 cm of water
headspace. The mud cores were transported from the field to Toolik Field Station via
helicopter in a water-filled, dark cooler. Incubations were performed in an incubation
facility at ambient temperature and light conditions for production and N2-fixation
measurements.
Ambient snail densities were determined by laying a 10 m transect line
between 3 – 5 m depth and swimming (with SCUBA) along the transect line and
counting the number of snails 1 m to one side of the line. Three transects were
conducted at the start, midpoint, and end of the experiment and averaged for the
purposes of data analysis.
Chlorophyll a and phaeophytin analysis. Chlorophyll a and phaeophytin
samples were sectioned from the top 2 cm of each core. Of the top two centimeters of
sediment, five mls were subsampled each for chlorophyll and algal composition.
Chlorophyll samples were frozen at –80oC and transported back to The Ecosystems
Center, Woods Hole, for analysis the following fall. Samples were analyzed using
acetone extraction and a Shimadzu UV-1601 spectrophotometer with a syringe
(piston) sipper and a 1 cm Hellma cell according to the Arctic LTER protocols, which
were adapted from Lorenzen 1967). Chlorophyll a and phaeophytin measurements
were summed to estimate total chlorophyll biomass, and total chlorophyll was used in
the statistical analysis. Total chlorophyll is often considered a better proxy for algal
biomass because the degradation of chlorophyll a to phaeophytin pigments can be
rapid, especially in sediments (Bianchi et al. 1991).

90
Rates of N2 fixation: N2 fixation in mud cores was measured by the acetylene
reduction assay (ARA), which quantifies the reduction of acetylene (C2H2) to ethylene
(C2H4) by the nitrogenase enzyme (Hardy et al. 1968). Core tubes were 9.5 cm in
diameter (70.9 cm2 in area) and 30 cm tall. They became ARA incubation chambers
when they were placed between two 1 cm thick clear polycarbonate rectangular plates,
which were held together by nylon-threaded rods. The rectangular plates had a groove
and O-ring fitting, which prevented leaking. Mud cores had about 1 L overlying lake
water and 100 ml gas headspace. The top plate had a bulkhead-style septum port to
allow sampling of the headspace, and the water–gas interface had an externally
operated magnetic stirring apparatus to maintain the water and gas phases in
equilibrium. The magnet was ~15 cm above the mud surface so that the sediments
were not disturbed by the gentle stirring. Measurements of N2 fixation in the
overlying water proved negligible.
The volume of the water phase was determined by measuring the height of the
water from the mud surface to the surface of the water to the nearest mm. Because the
area of the core tube is known, volume can be calculated. Volume of the gas
headspace was determined when the incubation was completed by weighing the core
on a 2 kg scale, then filling the tube to the top with water and re-weighing it. The
volume of the headspace was determined by subtracting the initial core weight from
the final weight. The total amount of ethylene produced present in the gas and water
phase was determined using Henry’s Law. The difference in ethylene solubility due to
temperature was accounted for according a temperature relationship presented in
Sander 1999).
In addition to the ARA, ethylene consumption and production control blanks
were included for each treatment to apply corrections if necessary. Soils and
sediments can contain heterotrophic bacteria known to consume ethylene (Elsgaard

91
and Andersen 1998; Jackel et al. 2004) whereas diatoms and higher plants can produce
ethylene (Abeles et al. 1992; Lee and Baker 1992). I did not sample areas that
contained macrophytes, but these sediments contain a significant diatom community.
For ethylene consumption controls, a known amount of ethylene was added in the
range of expected ethylene production from N2 fixation (usually ~1.5 μL ethylene),
and no acetylene was added. For the production control cores, no ethylene or
acetylene was added. Ethylene was rarely produced without the presence of acetylene,
but ethylene consumption ranged from 5 – 15 % over the course of the 4-hour
incubations. Independent ethylene consumption experiments confirmed that the
ethylene loss rate was also linear for the duration of the incubation, and I applied the
correction for each treatment assuming a linear consumption rate. Corrections were
minor and did not change qualitative results.
Acetylene was introduced as saturated water, which reduces contamination by
ethylene common in many acetylene tanks (Marino et al. 2003). Saturation was
achieved by bubbling acetylene through water for about 25 minutes while on a stir
plate to ensure that the water is saturated and in equilibrium with the atmosphere (see
Marino et al. 2003 for details). Because some acetylene tanks can contain substantial
amounts of ammonia which may affect N2-fixation rates, acetylene was first bubbled
through a 10% sulfuric acid solution to trap any ammonium present before bubbling it
through the lake water. This procedure resulted in ammonium concentrations in the
acetylene water that were similar to lake water concentrations near detection.
Incubations lasted 4 – 6 hours over which ethylene production was linear. Ethylene
samples were analyzed on a Shimadzu GC 8-A Flame Ion Detector (FID) using a
Porapak N column, mesh size 80/100.
It is desirable to calibrate the ARA by measuring the incorporation of 15N2 in
N-fixing organisms because the relationship between moles of ethylene produced and
92
moles of N fixed is not always fixed at the assumed 3:1 theoretical value and may in
fact be closer to 4:1 (Graham et al. 1980; Howarth et al. 1988b). For anaerobic
sediments from the Narragansett Bay where N2 fixation is most likely heterotrophic,
Seitzinger and Garber 1987), determined that conversion factors could vary from 10:1
– 100:1 over an incubation period lasting 26 days. Because these sediments are over-
lain by oxygenated water, and most of the N2 fixation is likely autotrophic, this study
system is not comparable. In addition, N2-fixation rates are low in the Arctic (0.2 – 3
μg m-2 day-1), and a pilot study in 2001 indicated that an isotope calibration method
using 15N2 gas is suspect because it requires long incubations (+1 week) in order to
measure incorporated 15N levels against sediment background N. Overly long
incubations introduce a strong potential for core artifacts and make it difficult to
calibrate to ARA incubations, which are much shorter (4 – 6 hours). Other measured
conversion factors for cyanobacteria from benthic environments are reasonably
constrained, ranging from 1.9 to 5.4 (Howarth et al. 1988b). Thus, a theoretical 3:1
conversion factor is a reasonable assumption, and it allows us to compare with the vast
majority of other studies that also use this ratio to report and compare measurements
(e.g., Howarth et al. 1988b; Alexander et al. 1989; Grimm and Petrone 1997; Higgins
et al. 2001).
Gross Primary Production, Net Ecosystem Production, and Respiration. In a
manner similar to the ARA chambers, measures of production were made using a
chamber design that allowed the core tubes to fit a specially designed lid. The
chambers were filled completely with no gas headspace, and the lid had a water-filled
port into which a data-logging WTW O2 probe was placed. This prevented the
chamber from experiencing air exchange with the atmosphere while measurements
were taking place. Changes in oxygen consumption and production were recorded
every 15 minutes over periods of dark and ambient light levels, each lasting

93
approximately 12 hours in length at ambient temperature (Table 3.1). Net Ecosystem
Production (NEP) was calculated as the rate of O2 production during the light period
of the incubation and multiplied by 24 hours because there are 24 hours of light in an
arctic summer. Community Respiration (CR) was measured as the rate of O2
consumption during the dark period of the incubation and multiplied over 24 hours.
Gross Primary Production (GPP) was calculated as the sum of NEP and Respiration
over a 24 hour period because the Arctic has 24 hours of daylight during the summer
months.
Snail excretion. I measured ammonium excretion by snails by collecting snails
from the sediments of Fog 2 and immediately enclosing them in acid-washed,
individual bottles containing 0.2 μ filtered lake water. The lake water was filtered to
remove phytoplankton and bacteria to minimize the possibility of N uptake and
microbial N transformations during the course of incubations. Bottles with snails were
stored in the incubation facility at ambient light and temperature conditions (180 μmol
m-2sec-1 and 12oC). Excretion rate was calculated by measuring ammonium and
phosphorus concentration before and after the snail incubation and expressed as
μmoles time-1 snail biomass-1. In order to ensure that I could document changes in
ammonium concentration, the incubation time was 10 hours long. However, the lack
of food resources available to the snail during the long incubation period may cause
underestimation of the excretion rate. To account for this possible source of error, I
calculated a range for the excretion rate. For the upper estimate, I assumed that all of
the N and P was excreted in the first hour, and for the lower estimate I assumed that
the N and P was excreted over 10 hours.
Data Analysis. At the end of the in situ experiment, an effort was made to
recover the snails that were added to the buckets at the beginning of the experiment,
but because diver visibility is reduced while working in soft-sediment, recovery rates

94
varied from year to year. In year 2001, 67% of the snails were recovered at the end of
the experiment; in year 2002 71% were recovered; and in year 2003, 47% were
recovered. In total, only 3 dead snails were found over 3 years and two lakes. Thus,
the snail density in the analysis is based on the number of added snails rather than the
number recovered.
Because snail density in the low and high treatments varied in each year, data
were analyzed using a randomized coefficient linear regression model with snail
density as a continuous variable rather than using a Randomized Block ANOVA,
which requires each treatment to be categorical. I controlled for block variability
using Proc Mixed in SAS 1999) in which Block and Block x Year x Lake were treated
as random effects, and snail density, lake, and year were treated as fixed effects. The
model generated regression equations with estimates of intercept and slope (as related
to snail density) that also generated estimates of standard error. When terms were not
significant, they were eliminated so as to increase the power of the analysis for the
remaining significant factors. Two of the N2-fixation variables (biomass-specific N
fixation and N-fixed as a proportion of N demand) were natural log transformed to
improve their distribution under the assumption of normality and to stabilize variance.
Some data were eliminated for logistical and weather related reasons. In year
2002, Block 2 in S-6 required that the cores be extruded into different core-tubes
because the cores sank too deep in the soft sediment and there was not an adequate
headspace; further, some of the cores in Block 2 were sloshed in transport, which
caused significant sediment disturbance. Thus, Block 2 in S-6 was not included in the
analysis. In year 2003, Block 3 in Fog 2 was left in the lake 9 days longer than Blocks
1 and 2 because weather prevented us from accessing the lake by helicopter. By then,
there were several hours of darkness each night, and the water temperature was 2 – 3 oC colder according to our dive computers. No snails were recovered, possibly

95
because they bury themselves in the sediment over the winter (Eisenberg 1966), and
significant cage effects were shown. I therefore eliminated Block 3 in Fog 2 in year
2003 from the analysis. Even though logistical difficulties meant that retrieving the
experiment was problematic, similar patterns are shown in different lakes in different
years. Thus, our results are robust. In addition, the statistical analysis in Proc Mixed
accounts for missing data and does not assume equal variance in its analysis of
randomized block designs (SAS 1999).
RESULTS.
Cage effects. T-tests between ambient and control cages did not show
significant differences for N2 fixation, production, or biomass variables in years 2001
and 2003 (p>0.05 for all variables; Table 3.2). However, in year 2002, controls in Fog
2 showed significantly lower values than ambient cores for areal rates of N2 fixation
and respiration (p<0.05; Table 3.2). Also in year 2002, NEP was lower in control
cages than ambient cages in S-6, but this difference was marginally significant
(p=0.07; Table 3.2). As noted above, differences between ambient and control cages
in 2002 were probably due to the design of the cage. However, the inclusion of year
2002 data in the randomized coefficient analysis did not change the statistical
outcomes or the relationship between snail density and response variables, so 2002
data were included in the analysis.
The effect of grazing. Snail density was not a significant factor controlling
benthic chlorophyll biomass in Fog 2 or S-6 in any year (p>0.05; Table 3.3). This is
consistent with the fact that snail density did not affect measures of benthic
metabolism including GPP, NEP, or CR (p>0.05; Table 3.3). In contrast, areal-
specific and biomass-specific N2 fixation as well as the proportion of N demand met

96
by N2 fixation declined significantly with increasing snail density in both Fog 2 and S-
6 and across years (p<0.05; Table 3.3; Figure 3.2).
When N2 fixation was expressed as an areal rate, there was no significant year-
to-year variation in Fog 2 (Table 3.4; Figure 3.2A). When the yearly data were pooled
for Lake Fog 2 and compared to S-6, snail density reduced areal rates of N2 fixation in
a statistically similar manner, and the relationship between snail density and areal-
specific N2 fixation resulted in parallel slopes between the two lakes (Table 3.4;
Figure 3.2A). Although the slopes relating snail density to areal rates of N2 fixation
were similar between Fog 2 and S-6, the intercept was significantly higher in S-6 than
in Fog 2 (Table 3.4; Figure 3.2A). This indicates that S-6 has naturally higher rates of
N2 fixation even though it has a two-fold higher ambient snail density (Figure 3.3).
This is likely due to the fact that lake S-6 is more productive than Lake Fog 2, and
may have stronger positive bottom-up (nutrient) influences on N2 fixation.
Biomass-specific N2 fixation was also negatively related to snail density.
However, neither lake nor year were significant factors (Table 3.3; Figure 3.2B). As a
result, one regression line was generated from data pooled for S-6 and Fog 2 and
across years 2001-2003 (Table 3.4, Figure 3.2B). This relationship is due to the fact
that chlorophyll a biomass did not vary significantly between lakes or years and that
chlorophyll was not drastically different between lakes Fog 2 and S-6 (Table 3.3,
Figure 3.4).

97
Table 3.2. Mean values for ambient (A) measurements and cage controls (C) for years 2001 – 2003 in lakes Fog 2 and S-6. Standard error is in parentheses. The only significant differences by T-Test between ambient and cage controls occurred in year
2002 when cages had a different design (see text).
N2 Fixation (mg N m-2 day-1) GPP (mg C m-2 day-1) NEP (mg C m-2 day-1) A C df t p A C df t p A C df t p
2001
Fog 2 0.097 (0.01)
0.24 (0.07) 5 -2 0.1 142 (14) 126 (10) 5 0.86 0.4 29 (3) 33 (1) 5 -1.14 0.3
2002
Fog 2 0.88
(0.04) 0.39
(0.12) 5 3.88 0.02 375 (30) 367 (50) 5 0.16 0.9 105 (34) 163 (37) 5 -1.15 0.3
S-6 0.36 (0.1) 0.35 (0.1) 5 0.99 0.93 713 (20) 647 (47) 5 1.46 0.2 409 (20) 263 (72) 5 2.26 0.07
2003
Fog 2 0.27
(0.06) 0.24
(0.03) 14 0.38 0.71 405 (31) 412 (10) 14 -0.2 0.9 243 (17) 265 (20) 14 -7.59 0.46
Resp (mg C m-2 day-1) Total Chlorophyll (μg m-2 day-1) A C df t p A C df t p
2001 Fog 2 -113 (17) -93 (11) 5 -0.9 0.4 NA NA NA NA NA 2002
Fog 2 -270 (6) -204 (17) 5 -4.1 0.01 310 (54) 350 (47) 5 3.23 0.9 S-6 -304 (12) -384 (31) 5 2.75 0.4 708 (83) 671 (109) 5 0.27 0.8
2003 Fog 2 -161 (31) -147 (12) 14 -0.3 0.75 426 (25) 459 (39) 12 -0.8 0.5

98
-8
-7
-6
-5
-4
0 10 20 30 40 50 60 70 80LN N
-fixa
tion/
chlo
roph
yll
Fog 20
0.10.20.30.40.50.6
0 10 20 30 40 50 60 70 80m
g N
Fix
ed/m
2/da
y
S-6
-8
-7
-6
-5
-4
-3
0 10 20 30 40 50 60 70 80
snail density (# m-2)
LN P
ortio
n N
Dem
and
2002, 2003
2001
Figure 3.2. Results from randomized-coefficient analysis relating snail density to measured of N2 fixation. The statistical analysis takes into account block, lake, and year variability, and the points depicted are data points from all blocks and all years. A. N2 fixation on an areal basis declines with increasing snail density. Lake S-6 has a similar relationship as Fog 2, but has a significantly higher intercept. B. N2 fixation per chlorophyll a biomass declines with increasing snail density. There was no significant difference between years or between lakes. C. The proportion N demand met by N2 fixation declines with increasing snail density. This relationship was not different between lakes, but was significantly different in 2001 compared to 2002 and 2003.
A.
B.
C.

99
Table 3.3. Significant factors from randomized coefficient regression for each of the measured variables in the experiment.
Model Info Numerator
DF Denominator
DF F-Value p-value N2 Fixation (mg N m-2 day-1) Grazer Density 1 9 11.47 0.008 Lake 1 8 17.15 0.003 GPP (mg C m-2 day-1) Lake 1 6 29.37 0.002 Year 2 6 18.34 0.003
NEP (mg C m-2 day-1) Lake 1 6 11.11 0.016 Year 2 6 22.26 0.002
Community Respiration (mg C m-2 day-1) Lake 1 6 51.59 <0.001 Year 2 6 12.68 0.007
Portion N Demand met by N2 fixation Grazer Density 1 6 15.41 0.004
Total Chl (mg m-2) Lake 1 5 5.31 0.069 N2 fixation per Chlorophyll Biomass Grazer Density 1 8 5.74 0.044
0
1
2
3
4
5
6
7
8
2001 2002 2003 2002
snai
ls m
- 2
Fog 2 S-6
Figure 3.3. Snail density in lake Fog 2 and S-6 for each year of the experiment. Snail density was determined by counting snails 1 m from a 10 m transect line (see text). Snail density was significantly higher in Lake S-6 than in Lake Fog 2. Snail density was lower in 2001 in lake Fog 2 than in subsequent years.

100
I also expressed N2-fixation rate as a proportion of N demand by primary
production. Since we are not able to measure net primary production (NPP) using the
oxygen production and consumption methods described above, I assumed that NPP
was 75% of measured GPP. This assumption is simply a linear scaling factor and
therefore does not affect our ability to compare among treatments. Other benthic
ecologists have made similar assumptions (e.g., Anderson et al. 2003; Sundback et al.
2004). Based on a C:N molar ratio for benthic algae of 17:1 (Hillebrand and Sommer
1999), I calculated that N2 fixation provided between 0.2 – 2.5 % of N demand by
primary production across snail density treatments and that the portion of N demand
that is met by N2 fixation significantly declined with increasing snail density (Table 4,
Figure 2C). This relationship was similar between Fog 2 and S-6. However, GPP
(and hence NPP) was lower than in 2001 in Fog 2 than in subsequent years. This
resulted in a higher proportion of N demand that was met by N2 fixation, and a higher
intercept in Figure 2C.

101
Table 3.4. Linear regression parameters and standard errors relating snail density to N2 fixation. Significant factors (lake or year) are shown depending on which were significant in the regression model. For areal rates of N2 fixation, S-6 served as a dummy
variable and for the variable describing the portion N demand met by N2 fixation, year 2003 served as a dummy variable. For per-biomass N2 fixation, there was no significant lake or year effect. As a result, lake and year were pooled to generate one regression
model relating snail density to per biomass N2-fixation rates.
Estimate Standard
Error DF T-
Value p-
value Meaning of the p-Value
N2 fixation (mg N fixed m-2 day-1) Lake S-6 Intercept 0.235 0.033 8 11.22 <.0001 a
Snail Density (slope) -0.002 0.001 9 -3.39 0.008 b Lake Fog 2 Intercept 0.106 0.031 8 -4.14 0.003 c
Snail Density (slope) -0.002 0.001 9 -3.39 0.008 b
Portion N Demand met by N2 fixation 2001 Intercept -4.036 0.241 7 4.08 0.005 d
Snail Density (slope) -0.011 0.003 9 -3.92 0.004 b 2002 Intercept -5.001 0.216 7 0.09 0.933 e
Snail Density (slope) -0.011 0.003 9 -3.92 0.004 b 2003 Intercept -5.020 0.156 7 -32.18 <0.001 a
Snail Density (slope) -0.011 0.003 9 -3.92 0.004 b
N2 fixation per Chlorophyll Biomass (mg N2 Fixed/mg Chl m-2 day-1)
Both Lakes, All Years Intercept -6.385 0.203 8 -31.41 <0.001 a
Snail Density (slope) -0.008 0.003 8 -2.40 0.044 b aIntercept is significantly different than zero; bSlope is significantly different than zero; cIntercept is significantly different than Lake S-6; dIntercept is significantly different than year 2003; eIntercept is similar to year 2003

102
-800
-600
-400
-200
0
200
400
600
800
mg
C m
-2 d
ay-1
GPP NEP CR
0
100
200
300
400
500
600
700
800
2001 2002 2003 2002
mg
m-2
Phaeophytin
Chlorophyll a
Fog 2 S-6
Figure 3.4. Variation in measures of metabolism and benthic chlorophyll biomass in Fog 2 and S-6 for years 2000 – 2003. A. Gross Primary Production, Net Ecosystem Production, and Community Respiration. B. Total chlorophyll biomass..
Lake and year comparisons. Because snail density did not affect chlorophyll
biomass or measures of ecosystem metabolism, data were pooled across snail density
treatments to compare these parameters among lakes and years (Table 3.5, Figure 3.4).
A
B

103
Lake S-6 had a significantly higher benthic gross production and respiration as well as
slightly higher total benthic chlorophyll levels than Lake Fog 2 (Table 3.5, Figure 3.4).
In year 2001, GPP, NEP, and CR were all significantly lower in lake Fog 2 than in
years 2002 and 2003 (Table 3.5, Figure 3.4). Snail density was lower in Lake Fog 2 in
year 2001 than in 2002.
Snail excretion. For an average snail of 20 mm, our range of estimated
excretion rates for phosphorus ranged from 2.76x10⁻⁴ to 3.1x10⁻³ mg P-PO4 day-1
(n=16). Our estimate for ammonium excretion was 4.4x10⁻⁴ to 5.2x10⁻³ mg N-NH4
day-1 (n=16). Assuming that net primary production is about 75% of ambient gross
primary production (or about 300 mg C m-2 day-1) and that benthic algae have a C:N
ratio of 6 by weight (Hillebrand and Sommer 1999), one snail supplies 0.001 –
0.017% of the N demand per day, supporting 0.003 – 0.03 mg C m-2 day-1 of net
primary production. Even in the highest density treatment (72 snails m-2), this supply
rate is small, 0.03 – 0.37 mg N m-2 day-1 or 0.1 - 1.23% of the N demand by primary
producers. Over the duration of the experiment (approximately three weeks), snails in
the high-density treatment could support 4.8 – 55.7 mg C m-2. The molar N-NH4:P-
PO4 ratio excretion ratio was very low relative to algal N:P ratio, averaging 4.8 ± 1.42
(SE) (Figure 3.5).

104
Table 3.5. LS Means estimate of Net Primary Production, Gross Primary Production, Community Respiration, and Total Chlorophyll for Lake Fog 2 and S-6 for years
2001 – 2003.
Estimate Standard Error
GPP (mg C fixed m-2 day-1) Lake Fog 2
2001 131 35 2002 360 34 2003 426 40
Lake S-6 2002 652 42
NEP (mg C fixed m-2 day-1) Lake Fog 2
2001 38 23 2002 157 23 2003 262 24
Lake S-6 2002 277 28
Community Respiration (mg C fixed m-2 day-1)
Lake Fog 2 2001 -92 15 2002 -203 15 2003 -163 18
Lake S-6 2002 -376 19
Total Chlorophyll
(mg chlorophyll a + Phaeophytin m-2) Lake Fog 2
2001 335 103 2002 398 83 2003 478 99
Lake S-6 2002 575 102

105
0
2
4
6
8
10
12
14
16
18
1
Ave
rage
N:P
Rat
io
Figure 3.5. Molar N:P excretion ratio of Lymnaea elodes as N-NH4 and P-PO4. The line denotes the optimum N:P ratio for benthic algae as determined by Hillebrand and Sommer (1999).
DISCUSSION.
Grazing by the snail Lymnaea elodes caused a decline in areal and per-biomass
rates of N2 fixation. However, grazing did not cause declines in measures of
ecosystem metabolism (net ecosystem production, gross primary production, or
respiration); nor did snails cause a decline in total chlorophyll biomass. These results
suggest that snails can reduce N inputs to N-limited arctic lakes without altering
production in the benthic littoral environments. These results are robust over time
(years) and in multiple lakes.
How can snails cause changes in N inputs through the reduction of N2-fixation
rates without causing changes in primary production or algal biomass? One possibility
is that cyanobacteria are more sensitive to direct grazing pressure and recover more
slowly from a grazing disturbance than other species of algae. Even though many

106
cyanobacteria are protected by cyanotoxins and can have morphological adaptations
that reduce their susceptibility to certain species of grazers (Reynolds 1987, Dodds
and Castenholz 1987), they have been shown to be sensitive to direct grazing pressure
in pelagic environments (Schaffner et al. 1984; Chan et al. 2004; Chan et al. 2006).
Fewer studies exist in benthic environments, but a number of other studies (Table 3.6)
indicate that snails can have negative effects on cyanobacterial biomass. Of 6 grazing
studies examining the effect of snails on periphyton community structure, five of them
documented a decline in cyanobacterial biomass (Lowe and Hunter 1988; McCollum
et al. 1988; Tuchman and Stevenson 1991; Armitage and Fong 2004; Evans-White and
Lamberti 2005), and only two of them documented an increase (Catteneo and Kalff
1986; Rosemond et al. 1993). To examine whether snail grazers were reducing
cyanobacterial abundance, I also enumerated algal community composition of the
epipelon for all treatments in Fog 2 in year 2001 and for all treatments in both Fog 2
and S-6 in year 2003. The number of filamentous cyanobacteria colonies was not
reduced in the high snail density treatments, either in absolute counts or proportionally
(Appendix 3). Of the studies listed in Table 3.6, this study is the only one that
documented no change in cyanobacterial abundance.
Another way in which grazing could reduce N2 fixation is by reducing the size
of cyanobacterial filaments (Schaffner et al. 1984; Chan et al. 2004; Chan et al. 2006).
Because filamentous cyanobacteria often fix N in heterocysts, which are energetically
expensive to maintain, the ratio of photosynthetic cells to heterocyst number may
affect growth rates. Similar patterns have been shown in both a freshwater
environment (Schaffner et al. 1984; Chan et al. 2004) and estuaries (Howarth et al.
1999; Chan et al. 2006; Marino et al. 2006,) such that grazed colonies were shorter in
length and had slower growth rates than longer chains. In the samples that were
enumerated for algal community composition, I did not see evidence from
107
measurements of cyanobacterial filaments that the length was reduced in the high
density treatments relative to controls (Appendix 3.).
These results showing a reduction of N2 fixation with increased grazer density
are in contrast with a number other studies that have shown a positive response of
benthic N2 fixation and/or cyanobacterial biomass to grazing. These studies tend to
include fish species as part of the grazing community (Table 3.6). Of these, authors
hypothesize that grazing maintains algal community structure in early successional
stages, which are dominated by cyanobacteria (Wilkinson and Sammarco 1983;
Flecker 1996); or that grazers clear epiphytes from slower-growing cyanobacterial
mats (Power et al. 1988). In one exception, Dodds and Castenholz (1987) found that a
snail cleared epiphytes from Nostoc puniforme colonies, which increased their growth
rates; however, they did not examine the effect of snail grazing on algal benthic
community structure as a whole. Williams and Carpenter (1997) also documented that
a sea urchin caused an increase in N2 fixation, but did not find changes in community
structure that supported that observation and acknowledged that more work was
needed to determine whether an increase in N2 fixation was due to community
composition shifts.

108
Table 3.6. Comparison of results from benthic grazing studies that enumerated the response of N-fixing cyanobacteria or measured N2 fixation.
Study Benthic Grazer Ecosystem type Cyanobacteria response N2 fixation
This Study Snail (Lymnaea elodes) In situ,oligotrophic lakes near Toolik Lake, Alaska
No change in cyanobacterial colony number or length with increasing snail density
N2 fixation reduced by snails
Armitage and Fong 1994 Snail (Cerithidea californica) In situ, Tidal-flats, Mugo Lagoon,
Southern California Cyanobacterial pigment zeaxanthin declined when snails were present N2 fixation not measured
Cattaneo and Kalff 1986
Snail (Annicola sp.) and meiofauna assemblage including chironomids, oligochaetes, and cladocerans
In situ, Lake Memphremagog, Quebec
Filamentous cyanobacteria increased when snails were present, especially Gloeotrichia pisum N2 fixation not measured
Dodds and Castenholz 1987 Snail (Vorticifex effusa) In situ, Mare's Egg Spring, Oregon Epiphytes were removed from Nostoc puniforme
colonies, increasing growth rate N2 fixation not measured
Evans-White and Lamberti 2005 Snail (Lymnaea livescens) Recirculating stream, northern
Midwest
Percent cyanobacterial biovolume was reduced by ~27% in the snail treatments relative to no-grazer controls
N2 fixation not measured
Lowe and Hunter 1988 Snail (Physa integra) In situ, Spring Lake, northern Michigan
Filamentous cyanobacteria Schizothrix sp. and other genera of cyanobacteria reduced in high density treatment
N2 fixation not measured
McCollum et al. 1998 Snail (Physella heterostropha) Aquaria (Water and snails collected from freshwater ponds in North Carolina)
Cyanobacterial cell biovolume and cell number were reduced when snails were present N2 fixation not measured
Tuchman and Stevenson 1991 Snail (Elimia livescens)
Flow-through mesocosms near Douglas Lake, MI and Kentucky Lake, Kentucky
Filamentous cyanobacteria Schizothrix calcicola and Phormidium tenue was reduced when snails were present
N2 fixation not measured
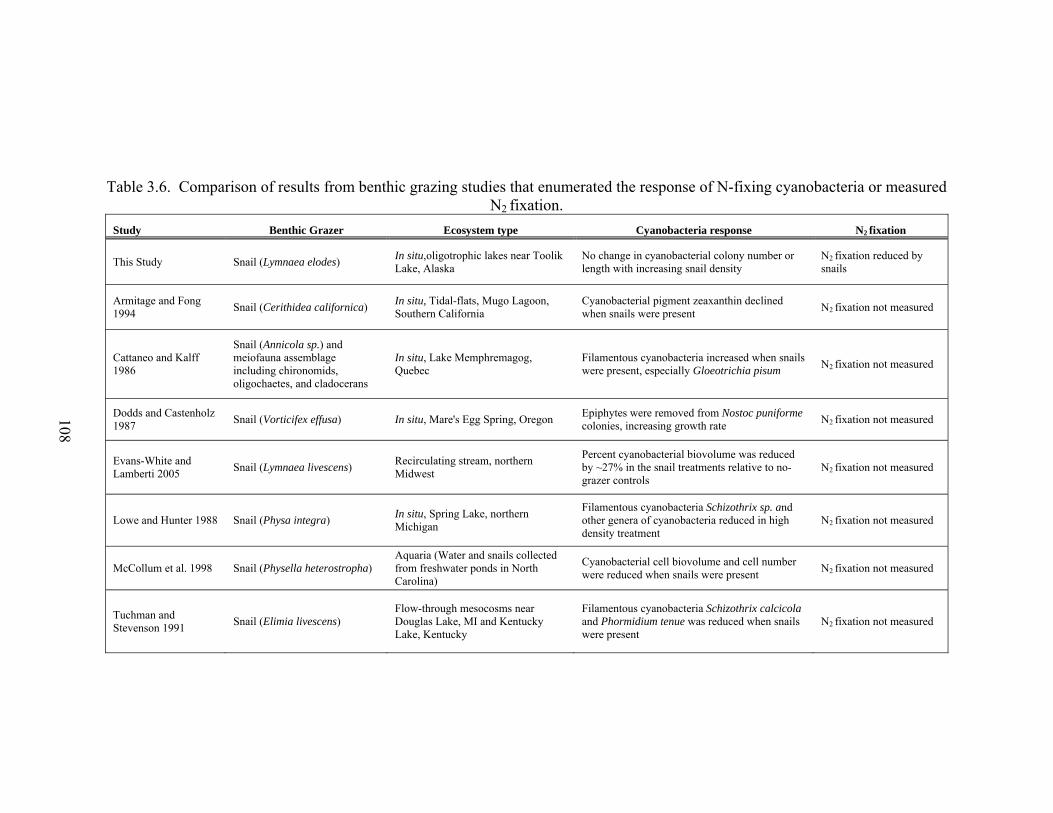
109
Table 3.6. (Continued).
Study Benthic Grazer Ecosystem type Cyanobacteria response N2 fixation
Rosemond et al. 1993 Snail (Elimia clavaeformis) Flow-through channels and enclosures, woodland stream (Walker Branch, North Carolina)
Cyanobacteria with prostrate morphologies increased when snails were present N2 fixation not measured
Flecker et al. 1996 Detrivirous fish (Prochilodus mariae)
In situ,Tropical stream (Rio Las Marias, Venezuela)
Number of Calothrix sp.filaments was higher on rock substrates exposed to grazing. N2 fixation not measured
Gettel and Flecker unpub.
Armored catfish (Ancistrus triradiatus)
In situ,Tropical stream (Rio Las Marias, Venezuela) Community composition not enumerated N2 fixation increased
Power et al. 1988
Native grazing assemblage including Catfish (Campostomoa anomalum), minnows, and snails
In situ, stream in Ozark Mountains
Filamentous cyanobacterial felts comprised of Calothrix sp. developed on grazed substrate and were overgrown by epiphytic diatoms on ungrazed substrate
N2 fixation not measured
Williams and Carpenter 1997
Sea urchin (Diadema antillarum)
In situ, Coral reef, Tague Bay, St. Croix, Virgin Islands
Shift in algal community composition was probably not responsible for decline in N2 fixation
N2 fixation increased when grazers were present
Wilkinson and Sammarco 1983
Damselfish (Hemiglyphidodon plagiometopon) and native grazing fish
In situ, Britomart Reef, Great Barrier Reef
Percentage substrate containing cyanobacteria was higher on grazed substrate
N2 fixation increased when grazers were present

110
It could be that large, scraping invertebrate grazers such as snails affect
cyanobacterial communities differently than fish grazers. Snails may be less selective
than fish species, and the susceptibility of algal and cyanobacterial species to snail
grazing may be based on morphology rather than food quality (Cattaneo and Kalff
1986; Lowe and Hunter 1988). Of all the studies documented in Table 3.6, only two
showed an increase in cyanobacteria in response to snail grazing (Cattaneo and Kalff
1986; Rosemond et al. 1993). In the Cattaneo and Kalff (1986) study, slower-growing
filamentous cyanobacteria became dominant when snails were present, perhaps as a
result of the lower grazer turnover rate associated with large snails compared to
smaller sized chironomids, cladocerans, and oligochaetes present in other treatments.
The increase in cyanobacteria in the Rosemond et al. (1993) study was in prostate
forms of cyanobacteria, leading them to suggest that morphological resistance to
grazing was an important component in structuring the periphyton community. Other
studies also support this idea. McCollum et al. (1988) tested the hypothesis that
colonial cyanobacteria would comprise a greater proportion of the periphyton
community in the presence of snail grazing because cyanobacteria are considered
unpalatable to snails (Cattaneo and Kalff 1986; Bronmark 1989; Porter 1977).
Instead, they found that filamentous cyanobacteria were significantly reduced in the
snail treatments, and suggested that snails dislodged or inhibited them from growing
by the mechanical act of grazing. Hillebrand et al. 2000) also found that grazing
resistance of periphyton communities was related to algal growth form in which large,
erect species were more susceptible to grazing and smaller, more prostate forms were
more resistant. While these patterns are well documented, the link between grazer
species, subsequent effects on algal community structure, and N2 fixation has not yet
clearly been made.
111
Under some circumstances, grazers may alter nutrient regimes by increasing
the supply rate of inorganic nutrients or the supply ratio of limiting nutrients such as N
and P (Vanni 2002; Hillebrand et al. 2004; Evans-White and Lamberti 2005). In turn,
excretion may affect nutrient limitation status and the relative competitive advantage
of N-fixing cyanobacteria (Elser 1999; Elser and Urabe 1999). In this study, snails
excrete a surprisingly low N:P molar ratio (~4.8; Figure 3.5), which is well below the
17: 1 molar ratio for benthic algae determined by Hillebrand and Sommer (1999).
Little data exist for excretion for both N and P for other snails, but Evans-White and
Lamberti (2005) showed that the snail Elimia livescens excretes a higher N:P molar
ratio than Lymnaea elodes, ranging from 7 – 50. Their study indicated that the
epilithon may have become less N-limited in the presence of snails, but our study
indicates that the low N:P excretion ratio likely exacerbated N limitation rather than
alleviated it.
If grazers increase the supply rate of inorganic N, N2 fixation may be
suppressed regardless of the N:P supply ratio (Howarth et al. 1988a). However, N-
NH4+ excretion rate appears to be low relative to other sources of N. These sources
include relatively high concentrations of ammonium in the underlying interstitial
water (e.g., 0.18 – 0.38 mg N l-1 in Toolik Lake; Alexander et al. 1989) and
decomposition, which based on estimates of heterotrophic respiration and the
assumption that the sediment C:N molar ratio (including detritus) is ~12 (Giblin et al.
unpublished data), supplies 7 – 17 mg N m-2 day-1 or 13 – 60% of autotrophic N
demand. In our system, N excreted by Lymnaea elodes meets almost none of the N
demand by primary production (<<1%). These results are consistent with a previous
experiment in which Cuker (1983) showed that excretion by Lymnaea elodes from
Toolik Lake did not increase algal production of periphyton communities on rocks,
and Evans-White and Lamberti (2005) also showed that chlorophyll a biomass did not

112
decrease in snail grazing treatments relative to non-grazer controls. In our study, N-
supply by snail excretion is low relative to the demand by primary producers, and it is
also small relative to other sources of N.
Cuker (1983) also found that snails egest viable cells that photosynthesize at
80% the rate of ungrazed substrates on a per-biomass basis and hypothesized that
these viable cells may take up inorganic N within the snail gut. This could account for
the very small measured N-excretion rate as well as the lack of change in production
and chlorophyll biomass that I detected in this experiment. This also suggests that the
observed decline in N2 fixation could be a result of lowered N demand from recycled
N within the snail gut.
Although the mechanism by which snails reduce N2 fixation in the benthos is
unknown, both the supply of N by snail excretion and the reduction of N2 fixation by
snails at ambient densities is small. At ambient snail density of ~4 snails m-2, N-
supply by snail excretion is orders of magnitude lower than N2 fixation (0.002 – 0.02
mg N m-2 day-1 vs. 0.1 – 0.4 mg N m-2 day-1; Table 3.2). N2 fixation was reduced by
each snail by 0.002 mg N m-2 day-1, or over the course of a 60-day growing season,
0.12 mg N m-2 summer-1. This reduction is only 0.85 – 1.8% of the N2-fixation rate in
the zero snail treatments in S-6 and Fog 2. Although the reduction in N fixation is
small, N fixation represents a new input of N which can support new production,
whereas N excretion represents recycled N. Thus, the reduction of N2 fixation by
Lymnaea elodes may be important to lake productivity over long time scales. In
addition, Lymnaea elodes densities are quite high in some lakes and reservoirs in the
temperate latitudes and can reach 100’s per square meter (Eisenberg 1966). These
results indicate that Lymnaea elodes may be important factors affecting N2 fixation, N
supply and production where natural densities are higher.

113
Our results are unusual in that snails caused no change in production and
chlorophyll biomass. Most grazing studies show a decrease in algal biomass with
increasing grazer density (Steinman 1996; Liess and Hillebrand 2004). However, in a
review of grazing effects in freshwater benthic environments, Steinman (1996) noted
that whenever areal specific primary production either increased or did not change in
response to grazers, snails were the herbivore involved. He hypothesized that some
snails may exhibit relatively low grazing pressure because of their slower movements,
lower consumption rates, and low mobility.
This observation and our results are in contrast with those of Cuker (1983),
who showed that on rock substrates in Toolik Lake, Lymnaea elodes reduced
chlorophyll a biomass, primary production. However, epilithic production is two
orders of magnitude smaller (0.4 g m-2 year-1; Yeakel 1978) than epipelic production
(18 g C m-2 year-1; our data) assuming a 60-day growing season. Thus, production on
sediment may be less sensitive to grazing disturbance than on rock substrates.
Calculations of algal turnover rate (our data) and estimates of grazing rate from Cuker
(1983) further support that epipelic production may be sufficiently high to compensate
for grazing by Lymnaea elodes.
Our data show that grazing by the snail Lymnaea elodes does not exert an
important control on benthic primary production or algal composition in these arctic
lakes. Although snail grazing can reduce N2 fixation, this effect is relatively small at
ambient densities. These results support other studies that indicate snails may be
fundamentally different from other grazers in how they affect benthic production and
N cycling. However, to date, only a few studies have directly measured the response
of N2 fixation to benthic grazing, and all the other studies were done in the tropics.
More work will be needed to determine how different grazers impact nitrogen fixation
in a variety of environments.
114
REFERENCES. Abeles, F. B., P. W. Morgan, and M. E. J. Saltveit. 1992. Ethylene in plant biology.
Academic Press.
Alexander, V., S. C. Whalen, and K. M. Klingensmith. 1989. Nitrogen cycling in arctic lakes and ponds. Hydrobiologia 172: 165-172.
Anderson, I. C., K. J. McGlathery, and A. C. Tyler. 2003. Microbial mediation of 'reactive' nitrogen transformations in a temperate lagoon. Mar. Ecol.-Prog. Ser. 246: 73-84.
Armitage, A. R., and P. Fong. 2004. Upward cascading effects of nutrients: Shifts in a benthic microalgal community and a negative herbivore response. Oecologia 139: 560-567.
Axler, R. P., and J. E. Reuter. 1996. Nitrate uptake by phytoplankton and periphyton: Whole-lake enrichments and mesocosm N15 experiments in an oligotrophic lake. Limnol. Oceanog. 41: 659-671.
Bergmann, M. A., and H. E. Welch. 1990. Nitrogen fixation by epilithic periphyton in small arctic lakes in response to experimental nitrogen and phosphorus fertilization. Can. J. Fish. Aquat. Sci. 47: 1545-1550.
Bianchi, T. S., S. Findlay, and D. Fontvieille. 1991. Experimental degradation of plant materials in Hudson River sediments. 1. Heterotrophic transformations of plant pigments. Biogeochemistry 12: 171-187.
Bootsma, H. A., and R. E. Hecky. 2003. A comparative introduction to the biology and limnology of the African Great Lakes. J. Gt. Lakes Res. 29: 3-18.
Bronmark, C. 1989. Interactions between epiphytes, macrophytes and fresh-water snails: A review. J. Molluscan Stud. 55: 299-311.
Cattaneo, A., and J. Kalff. 1986. The effect of grazer size manipulation on periphyton communities. Oecologia 69: 612-617.
Chan, F., R. L. Marino, R. W. Howarth, and M. L. Pace. 2006. Ecological constraints on planktonic nitrogen fixation in saline estuaries. II. Grazing controls on cyanobacterial population dynamics. Mar. Ecol.-Prog. Ser. 309: 41-53.
Chan, F., M. L. Pace, R. W. Howarth, and R. M. Marino. 2004. Bloom formation in heterocystic nitrogen-fixing cyanobacteria: The dependence on colony size and zooplankton grazing. Limnol. Oceanog. 49: 2171-2178.
Cornwell, J. C., and G. W. Kipphut. 1992. Biogeochemistry of manganese- and iron-rich sediments in Toolik lake, Alaska. Hydrobiologia 240: 45-59.

115
Cuker, B. E. 1983. Grazing and nutrient interactions in controlling the activity and composition of the epilithic algal community of an arctic lake. Limnol. Oceanog. 28: 133-141.
Dodds, W. K., and R. W. Castenholz. 1987. The nitrogen budget of an oligotrophic cold water pond. Arch. Hydrobiol. Suppl. 79: 343-362.
Eisenberg, R., M. 1966. The regulation of density in a natural population of the pond snail, Lymnaea elodes. Ecology 47: 889-906.
Elser, J. J. 1999. The pathway to noxious cyanobacteria blooms in lakes: The food web as the final turn. Freshwater Biology 42: 537-543.
Elser, J. J., W. J. O'Brien, D. R. Dobberfuhl, and T. E. Dowling. 2000. The evolution of ecosystem processes: Growth rate and elemental stoichiometry of a key herbivore in temperate and arctic habitats. J. Evolutionary Biology 13: 845-853.
Elser, J. J., and J. Urabe. 1999. The stoichiometry of consumer-driven nutrient recycling: Theory, observations, and consequences. Ecology 80: 735-751.
Elsgaard, L., and L. Andersen. 1998. Microbial ethylene consumption in peat-soil during ethylene exposure of Begonia elatior. Plant Soil 202: 231-239.
Evans-White, M. A., and G. A. Lamberti. 2005. Grazer species effects on epilithon nutrient composition. Freshwater Biology 50: 1853-1863.
Flecker, A. S. 1996. Ecosystem engineering by a dominant detritivore in a diverse tropical stream. Ecology 77: 1845-1854.
Goldman, C. R. 1988. Primary productivity, nutrients, and transparency during the early onset of eutrophication in ultra-oligotrophic Lake Tahoe, California Nevada. Limnol. Oceanog. 33: 1321-1333.
Graham, B. M., R. D. Hamilton, and N. E. R. Campbell. 1980. Comparison of the 15N uptake and acetylene reduction methods for estimating the rates of nitrogen fixation by freshwater blue-green algae. Can. J. Fish. Aquat. Sci. 37: 488-493.
Grimm, N. B. 1988. Role of macroinvertebrates in nitrogen dynamics of a desert stream. Ecology 69: 1884-1893.
Grimm, N. B., and K. C. Petrone. 1997. Nitrogen fixation in a desert stream ecosystem. Biogeochemistry 37: 33-61.
Hall, R., J. L. Tank, and M. F. Dybdahl. 2003. Exotic snails dominate nitrogen and carbon cycling in a highly productive stream. Front. Ecol. Environ. 1: 407-411.

116
Hamilton, T. D. 2003. Glacial geology of the Toolik lake and upper Kuparuk River region. In D. A. Walker [ed.], Biological Papers of the University of Alaska. University of Alaska Fairbanks, Institute of Arctic Biology.
Hardy, R. W. F., R. D. Holsten, E. K. Jackson, and R. C. Burns. 1968. Acetylene-ethylene assay for N2 fixation - laboratory and field evaluation. Plant Physiol. 43: 1185-&.
Hecky, R. E., and R. H. Hesslein. 1995. Contributions of benthic algae to lake food webs as revealed by stable isotope analysis. J. N. Am. Benthol. Soc. 14: 631-653.
Hershey, A. E. 1990. Snail populations in arctic lakes: Competition mediated by predation? Oecologia 82: 26-32.
Hershey, A. E. and others 1999. A geomorphic-trophic model for landscape control of arctic lake food webs. Bioscience 49: 887-897.
Higgins, S. N., R. E. Hecky, and W. D. Taylor. 2001. Epilithic nitrogen fixation in the rocky littoral zones of Lake Malawi, Africa. Limnol. Oceanog. 46: 976-982.
Hillebrand, H., G. De Montpellier, and A. Liess. 2004. Effects of macrograzers and light on periphyton stoichiometry. Oikos 106: 93-104.
Hillebrand, H., and U. Sommer. 1999. The nutrient stoichiometry of benthic microalgal growth: Redfield proportions are optimal. Limnol. Oceanog. 44: 440-446.
Hillebrand, H., B. Worm, and H. K. Lotze. 2000. Marine microbenthic community structure regulated by nitrogen loading and grazing pressure. Mar. Ecol.-Prog. Ser. 204: 27-38.
Howarth, R. W., F. Chan, and R. Marino. 1999. Do top-down and bottom-up controls interact to exclude nitrogen-fixing cyanobacteria from the plankton of estuaries? An exploration with a simulation model. Biogeochemistry 46: 203-231.
Howarth, R. W., R. Marino, and J. J. Cole. 1988a. Nitrogen fixation in fresh-water, estuarine, and marine ecosystems .2. Biogeochemical controls. Limnol. Oceanog. 33: 688-701.
Howarth, R. W., R. Marino, J. Lane, and J. J. Cole. 1988b. Nitrogen fixation in fresh-water, estuarine, and marine ecosystems .1. Rates and importance. Limnol. Oceanog. 33: 669-687.

117
Jackel, U., S. Schnell, and R. Conrad. 2004. Microbial ethylene production and inhibition of methanotrophic activity in a deciduous forest soil. Soil Biol. Biochem. 36: 835-840.
Lee, R. F., and J. Baker. 1992. Ethylene and ethane production in an estuarine river: Formation from the decomposition of polyunsaturated fatty acids. Mar. Chem. 38: 25-36.
Levine, M. A., and S. C. Whalen. 2001. Nutrient limitation of phytoplankton production in Alaskan arctic foothill lakes. Hydrobiologia 455: 189-201.
Liess, A., and H. Hillebrand. 2004. Invited review: Direct and indirect effects in herbivore periphyton interactions. Arch. Hydrobiol. 159: 433-453.
Loeb, S. L., and J. E. Reuter. 1981. The epilithic periphyton community: A five-lake comparative study of community productivity, nitrogen metabolism and depth-distribution of standing crop. Verh. Internat. Verein 21: 346-352.
Lorenzen, C. J. 1967. Determination of chlorophyll and pheopigments: Spectrophotometric equations. Limnol. Oceanog. 12: 343-&.
Lowe, R. L., and R. D. Hunter. 1988. The effect of grazing by Physa integra on periphyton community structure. J. N. Am. Benthol. Soc. 7: 29-36.
Marino, R., F. Chan, R. W. Howarth, M. L. Pace, and G. E. Likens. 2006. Ecological constraints on planktonic nitrogen fixation in saline estuaries. I. Nutrient and trophic controls. MEPS 309: 25-39.
Marino, R., C. Francis, R. W. Howarth, M. Pace, and G. E. Likens. 2002. Ecological and biogeochemical interactions constrain planktonic nitrogen fixation in estuaries. Ecosystems 5: 719-725.
Marino, R., R. W. Howarth, F. Chan, J. J. Cole, and G. E. Likens. 2003. Sulfate inhibition of molybdenum-dependent nitrogen fixation by planktonic cyanobacteria under seawater conditions: A non-reversible effect. Hydrobiologia 500: 277-293.
McCollum, E., W., L. Crowder, B., and A. McCollum. 1988. Complex interactions if fish, snails, and littoral zone periphyton. Ecology 79: 1980-1994.
Merrick, G. W., A. E. Hershey, and M. E. Mcdonald. 1992. Salmonid diet and the size, distribution, and density of benthic invertebrates in an arctic lake. Hydrobiologia 240: 225-234.
Miller, M. C., G. R. Hater, P. Spatt, P. Westlake, and D. P. P. Yeakel. 1986. Primary production and its control in Toolik lake, Alaska. Arch. Hydrobiol. Suppl. 74(1): 97-131.
118
Moeller, R. E., and J. P. Roskoski. 1978. Nitrogen fixation in littoral benthos of an oligotrophic lake. Hydrobiologia 60: 13-16.
Morris, D. P., and W. M. Lewis. 1988. Phytoplankton nutrient limitation in Colorado mountain lakes. Freshwater Biology 20: 315-327.
Porter, K. G. 1977. Plant-animal interface in freshwater ecosystems. Am. Sci. 65: 159-170.
Power, M. E., A. J. Stewart, and W. J. Matthews. 1988. Grazer control of algae in an ozark mountain stream: Effects of short-term exclusion. Ecology 69: 1894-1898.
Ramlal, P. S., R. H. Hesslein, R. E. Hecky, E. J. Fee, J. W. M. Rudd, and S. J. Guildford. 1994. The organic carbon budget of a shallow arctic tundra lake on the Tuktoyaktuk Peninsula, NWT, Canada - arctic lake carbon budget. Biogeochemistry 24: 145-172.
Reuter, J. E., S. L. Loeb, and C. R. Goldman. 1986. Inorganic nitrogen uptake by epilithic periphyton in a N-deficient lake. Limnol. Oceanog. 31: 149-160.
Reynolds, C., S. 1987. Cyanobacterial water blooms, p. 143, Advances in botanical research. Academic Press.
Rosemond, A. D., P. J. Mulholland, and J. W. Elwood. 1993. Top-down and bottom-up control of stream periphyton: Effects of nutrients and herbivores. Ecology 74: 1264-1280.
Sander, R. 1999. Compilation of Henry's Law constants for inorganic and organic species of potential importance in environmental chemistry (version 3).
SAS. 1999. [SAS/stat] software, version [8] of the SAS system for [unix]. Copyright © 1999, SAS institute Inc.,.
Schaffner, W., R, N. Hairston, G, and R. Howarth, W. 1984. Feeding rates and filament clipping by crustacean zooplankton consuming cyanobacteria. Verh . Internat. Verein. Limnol 25: 2375–2381.
Schindler, D. W. 1977. Evolution of phosphorus limitation in lakes. Science 195: 260-262.
Seitzinger, S. P., and J. H. Garber. 1987. Nitrogen fixation and 15N2 calibration of the acetylene-reduction assay in coastal marine sediments. Mar. Ecol.-Prog. Ser. 37: 65-73.
Sierszen, M. E., M. E. Mcdonald, and D. A. Jensen. 2003. Benthos as the basis for arctic lake food webs. Aquatic Ecology 37: 437-445.

119
Steinman, A. D. 1996. Effects of grazers on freshwater benthic algae., p. 341–373. In R. J. Stevenson, M. L. Bothwell and R. L. Lowe [eds.], Algal ecology. Freshwater benthic ecosystems. Academic Press.
Sundback, K., F. Linares, F. Larson, A. Wulff, and A. Engelsen. 2004. Benthic nitrogen fluxes along a depth gradient in a microtidal fjord: The role of denitrification and microphytobenthos. Limnol. Oceanog. 49: 1095-1107.
Tuchman, N. C., and R. J. Stevenson. 1991. Effects of selective grazing by snails on benthic algal succession. J. N. Am. Benthol. Soc. 10: 430-443.
Vadeboncoeur, Y., E. Jeppesen, M. J. Vander Zanden, H. H. Schierup, K. Christoffersen, and D. M. Lodge. 2003. From Greenland to green lakes: Cultural eutrophication and the loss of benthic pathways in lakes. Limnol. Oceanog. 48: 1408-1418.
Vadeboncoeur, Y., D. M. Lodge, and S. R. Carpenter. 2001. Whole-lake fertilization effects on distribution of primary production between benthic and pelagic habitats. Ecology 82: 1065-1077.
Vanni, M. J. 2002. Nutrient cycling by animals in freshwater ecosystems. Annu. Rev. Ecol. Syst. 33: 341-370.
Vitousek, P. M. and others 2002. Towards an ecological understanding of biological nitrogen fixation. Biogeochemistry 57: 1-45.
Wetzel, R. G. 1964. A comparative-study of the primary productivity of higher aquatic plants, periphyton, and phytoplankton in a large, shallow lake. Internationale Revue der gesamten Hydrobiologie 49: 1.
Wilkinson, C. R., and P. W. Sammarco. 1983. Effects of fish grazing and damselfish territoriality on coral-reef algae .2. Nitrogen fixation. Mar. Ecol.-Prog. Ser. 13: 15-19.
Williams, S. L., and R. C. Carpenter. 1997. Grazing effects on nitrogen fixation in coral reef algal turfs. Mar. Bio. 130: 223-231.
Yeakel, D. 1978. Primary production of epilithic periphyton in a deep arctic lake. University of Cincinnati.
120
APPENDIX 1. PATTERNS IN BENTHIC N FIXATION ACROSS THE
ARCTIC LANDSCAPE
Introduction. In the vicinity of Toolik Field Station in Northern Alaska
(Figure 1.1), Pleistocene valley glaciations have occurred for periods of time between
12,000 to 800,000 years before the present (Hamilton 2003). Three dominant
advances and retreats occurred in nearby drainages, exposing landscapes at different
times. The oldest landscape, the Sagavanirktok, was exposed 250,000 – 800,000 years
ago; the intermediate glaciation, the Itkillik I, was exposed 25,000 – 50,000 years ago,
and the youngest Itkillik II glaciation was exposed 10,000 – 12,000 years ago.
Because of weathering, older surfaces have low phosphorus (P) and calcium (Ca)
availability when compared with younger surfaces (Hobbie et al. 2002, Hobbie and
Gough 2002). Lake chemistry follows these general patterns in Ca and P chemistry
(Kling et al. 1992; Figure A1.1; data from Arctic LTER database), and lakes on
younger surfaces generally have higher rates of benthic primary production (Figure
A1.2; unpublished data from A. Giblin and G. Kipphut).
N fixation has been shown to increase with increased P inputs (e.g., Schindler
1977; Chapter 2) and to decline in response to snail grazing (Chapter 3). Snail grazers
are more prevalent on young surfaces and absent in lakes on old surfaces, presumably
because of a decline in Ca availability or other biogeographical constraints (Hershey,
pers. com.) Therefore, landscape age may confound patterns in N fixation across the
age gradient by directly influencing P availability or the N:P ratio (e.g., Chapter 2) or
by indirectly influencing the presence of snail grazers (Chapter 3). In order to
determine whether landscape age is related to N-fixation rates in benthic
environments, I conducted two lake surveys across the chronosequence for benthic N
fixation in year 2002 (described in Chapter 1) and in year 2000 (described below). I

121
also examined whether N fixation was related to other variables such as gross primary
production (GPP), benthic chl a, and light (as photosynthetically active radiation, or
PAR).
A. B.
Figure A1.1. Relationship of geologic surface and Ca and PO4 concentrations in lakes in the vicinity of Toolik Field Station. A. Average PO4 concentrations for lakes on Iktillik I (12,000 years old), Itkillik II (20,000 years old), and Sagavanirtok (500,000-800,000 years old) surfaces. B. Average Ca for Itkillik Phase II and Sagavanirktok surfaces. No data were available for Itkillik Phase I from the Arctic LTER database for Ca.
0
0.05
0.1
0.15
0.2
0.25
0.3
0.35
Itkillik Phase II Itkillik Phase I Sag Drift II
Glacial Advance
SRP
- μM
PO
4
0
50
100
150
200
250
20,000 Years Old 750,000 Years Old
Geologic Surface Age
μM C
a

122
0
50
100
150
200
250
300
11,500 - 25,000 50,000 - 120,000 125,000 - 780,000
Landscape Age (years)
mg
C m
-2 d
ay-1
n=11
n=1 n=2
Figure A1.2. Compilation of benthic primary production measurements from LTER lakes (A. Giblin and G. Kipphut, unpublished data).
Method. In year 2002, measurements for benthic GPP, chlorophyll a, and N
fixation were performed onver periods of light and dark, and N fixation was
determined using acetylene red 3 intact sediment cores from 3 m depth in 3 lakes on
each surface for a total of 9 lakes (See Chapter 1 for descriptions of these lakes). Rate
measurements were performed in the incubation facility at Toolik Field station at
ambient lake temperature and light conditions for each lake, which was 13oC for all
lakes but ranged between 20 – 180 μE m-2sec-1 for PAR. GPP was measured by
documenting changes in oxygen o uction assay (ARA). Further details concerning
methods for performing these measurements on intact sediment cores are described in
Chapter 1.
In 2000, only N fixation was measured on sediment slurry samples from a total
of 15 lakes (Table A1.1). Three slurry samples were collected at 1 m depth using a

123
specially adapted plastic 60 ml syringe (Polypropylene, Becton-Dickson) in which the
tip was cut off at the zero mark to form a “mini-core.” Mini-cores were collected by
inserting the syringe into the sediment up to the 10 cc mark to collect a consistent
volume of a known area of sediment from each lake. These samples were analyzed
using acetylene reduction, and N fixation was expressed on an areal basis. The lakes
included in this survey were not evenly distributed across the different aged surfaces,
in part because lakes on older surfaces are less common (Gettel personal observation;
Burkart 2006). Another important difference between the 2002 and 2000 datasets is
that all of the 2000 survey samples were incubated at the same temperature and light
conditions at 1 m depth in Toolik Lake at about 200 μE m-2sec-1 and 18oC. The
locations of these survey lakes and the 2002 survey lakes are shown in Figure A1.3.
Table A1.1. Lakes characteristics sampled in the 2000 survey.
Lake Surface Lake Area (m2) Watershed Area (m2) Depth (m) Conductivity
(μS cm-1)
Fog 2 Itkillik II 60,151 456,764 16 135.3 Fog 4 Itkillik II 20,624 260,987 3 75.0 S-6 Itkillik II 6,673 60,717 7 168.3 NE-9B Itkillik II 1,785 138,255 7 335.0 N-1 Itkillik II 37,662 373,966 12 129.0 S-3 Itkillik II 36,018 187,793 1.5 NA S-4 Itkillik II 3,885 81,236 1.5 NA S-5 Itkillik II 4,254 185,563 1.5 NA S-7 Itkillik II 6,443 102,322 4 205.5 GTH 11 Itkillik II 14,805 299,304 8 191.1
GTH 14 Itkillik II 2,860 171,137 2 129.0 Green Cabin Itkillik I 208,561 2,433,455 14 38.7 E-5 Sagavanirktok 111,000 NA 12 11.5 E-6 Sagavanirktok 19,987 NA 3 11.5
GTH 86 Sagavanirktok 31,260 1,436,577 9 7.0

124
Figure A1.3. Map showing the locations of survey lakes in 2000 and 2003.
Results and Discussion. Benthic N fixation was detected in all lakes in 2000
and 2002. Results from the 2002 survey show that there is a suggested trend for
higher rates of fixation in sediments with higher rates of benthic GPP (Figure A1.4A).
With one outlier point removed (circled), there is a significant relationship between
benthic N fixation and GPP (y=0.0007x + 0.08; R2=0.46; p=0.06). Although there is
no statistically significant relationship with benthic chlorophyll a (p<0.05; Figure
A1.4B), this result is consistent with other studies in pelagic environments where
higher rates of N fixation generally occur in more productive lakes (Howarth et al.
1988).
Benthic N fixation was not significantly predicted by PAR by linear regression
(Figure A1.4C; p>0.05; statistics not shown). This result is consistent with results

125
shown in Chapter 2 in which light did not predict benthic N-fixation rates across lakes,
even though it was a significant factor controlling N fixation within a given lake. N-
fixation–light relationships may be difficult to discern when comparing across lakes
because the relationship is non-linear and specific for each lake (Chapter 2). The light
levels at which the 2002 surveys were incubated are probably on the linear part of the
N-fixation–Irradiance response curve, which was 0 – 150 μE m—2sec-1 for four other
Toolik-area lakes (Chapter 2), further complicating the ability to compare N-fixation
rates among lakes when assays were performed at different light levels.
In the 2002 survey, benthic N fixation was not related to landscape age (Figure
A1.4). However, the slurry samples in the 2000 survey show that N-fixation rates are
higher on young surfaces than on older surfaces by >80%. (Figure A1.5). There may
be several reasons for this disparity. First, I sampled more lakes on the young surface
in 2000 than in 2002, which may increase the chances of measuring high rates of N
fixation. Particularly high rates of fixation were measured in 2000 in small,
productive lakes <2 m deep on the young surface (e.g., S-3, S-4, GTH 11), which are
very uncommon (if not non-existent) on the old surface where lakes tend to be less
abundant and more similar in their geomorphology (Gettel, personal observation;
Burkart et al. In prep.). The sampling regime in 2000, therefore, captured the diversity
of lake-types on the young surface better than the 2002 survey. Second, the slurry
samples in 2000 were incubated at the same light level (200 μE m-2sec-1) rather than
ambient lake light levels as they were in 2002. In four lakes in the vicinity of Toolik,
N-fixation-Irradiance curves showed that 200 μE m-2sec-1 was at the asymptotic part
of the response curve. Thus, the 2000 survey may have removed an important source
of variability due to light that otherwise may confound the relationship between
geologic surface and N fixation. These results indicate that some factors such as light

126
and geomorphology may be acting on individual lakes that swamp the landscape-scale
pattern at small sample sizes as shown in the 2002 survey.
While the mechanism responsible for the landscape scale pattern of higher N
fixation on younger surfaces remains unknown, experimental results from nutrient
addition (Chapter 2) and grazing experiments (Chapter 3) corroborate these results. N
fixation declined with increasing snail density by about 0.8 – 1.8% (Chapter 3), which
suggests that N fixation should be lower if snails are more common on younger
surfaces. However, a P addition to intact sediment cores from lake Fog 2 showed that
N fixation was stimulated in response to increased P inputs by a much larger amount
(38%; Chapter 2). Thus, nutrients may be a stronger control on landscape-scale
patterns of N fixation than grazing. These patterns may be confounded by other
factors such as lake geomorphology and light, and more work is needed to understand
patterns in N fixation across the landscape.

127
A. B. C.
Figure A1.4. Relationship between benthic N fixation from 2002 survey and benthic GPP (panel A); benthic chlorophyll a (panel B); and light as photosynthetically active radiation (PAR; panel C). There was no statistically significant relationship among any of these variables except with the outlier point was removed in panel A. See text for details.
0
0.4
0.8
1.2
1.6
0 200 400 600 800 1000
GPP (mg C m-2day-1)
mg
N m
-2 d
ay-1
0
0.4
0.8
1.2
1.6
0 5 10 15 20
mg chl m-2
mg
N m
-2 da
y-1
0
0.4
0.8
1.2
1.6
0 50 100 150 200
PAR μE m-2 sec-1
mg
N m
-2 da
y-1

128
0
0.2
0.4
0.6
0.8
1
1.2
1.4
1.6
1.8
Fog 2 NE-12 S-6 GTH 33 GTH 61 GTH 74 GTH 83 GTH 85 GTH 86
mg
N m
-2 da
y-1
Figure A1.5. Results from 9-lake survey from year 2002, arranged from young surface lakes with clear bars, intermediate surface lakes in diagonal stripes, and old surface lakes are solid dark bars.

129
0
0.2
0.4
0.6
0.8
1
1.2
11,500 - 25,000 50,000 - 120,000 125,000 - 780,000
Landscape Age
mg
N m
-2da
y-1
N=11
N=1
N=3
Figure A1.6. Benthic N fixation from a 15-lake survey from year 2000 along the chronosequence.

130
REFERENCES. Burkart, G., C. Luecke, and L. Lael. In prep. Effects of landscape age on fish presence
and zooplankton in arctic lakes.
Hamilton, T. D. 2003. Glacial geology of the Toolik lake and upper Kuparuk River region. In D. A. Walker [ed.], Biological Papers of the University of Alaska. University of Alaska Fairbanks, Institute of Arctic Biology.
Hobbie, S. E., and L. Gough. 2002. Foliar and soil nutrients in tundra on glacial landscapes of contrasting ages in northern Alaska. Oecologia 131: 453-462.
Hobbie, S. E., T. A. Miley, and M. S. Weiss. 2002. Carbon and nitrogen cycling in soils from acidic and nonacidic tundra with different glacial histories in northern Alaska. Ecosystems 5: 761-774.
Howarth, R. W., R. Marino, J. Lane, and J. J. Cole. 1988. Nitrogen fixation in fresh-water, estuarine, and marine ecosystems .1. Rates and importance. Limnology and Oceanography 33: 669-687.
Kling, G. W., W. J. O'Brien, M. C. Miller, and A. E. Hershey. 1992. The biogeochemistry and zoogeography of lakes and rivers in arctic Alaska. Hydrobiologia 240: 1-14.
Schindler, D. W. 1977. Evolution of phosphorus limitation in lakes. Science 195: 260-262.

131
APPENDIX 2. WATER COLUMN NITROGEN FIXATION
IN YEARS 2002 – 2003.
1. Water-column N fixation for survey lakes.
0
2
4
6
8
10
12
14
16
18
20
0.15 0.25 0.35 0.45 0.55 0.65 0.75 0.85
μg N L-1 day-1
Dep
th (m
)
Ne-9BNE-12Fog 2GTH 33GTH 74GTH 61GTH 83GTH 85GTH 86Toolik
Figure A2.1. Depth profiles of water-column N fixation for lakes used in the benthic-water column comparison in Chapter 1.
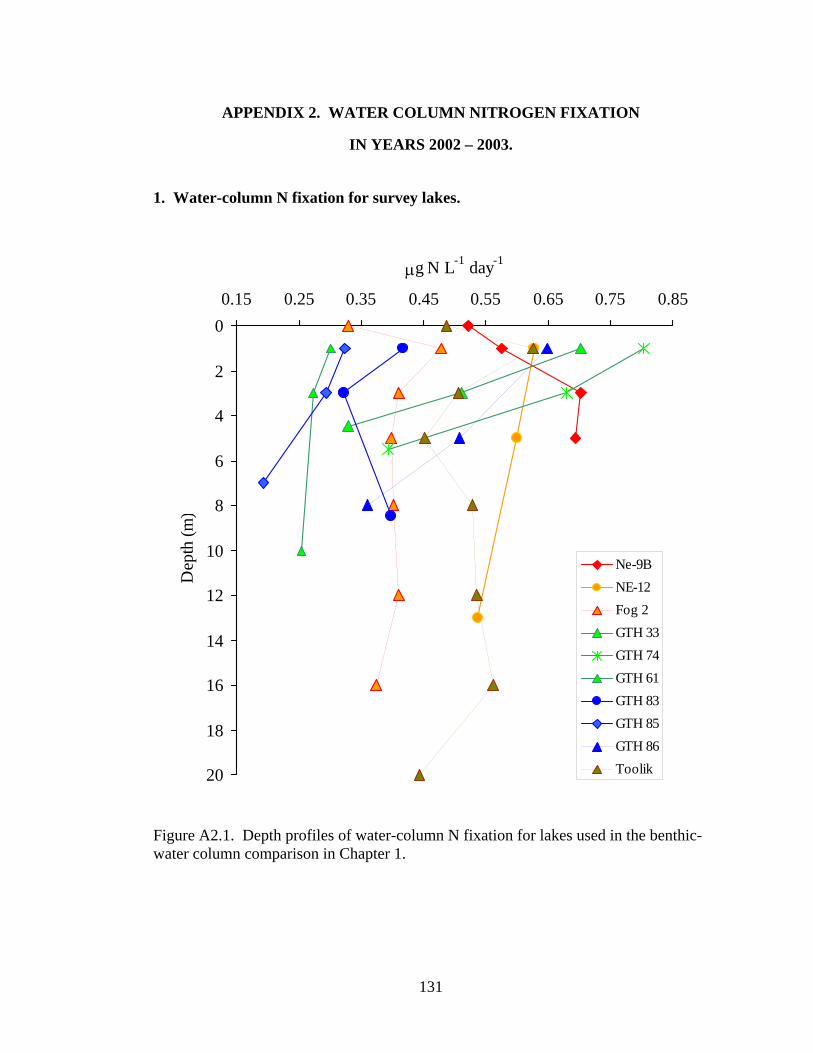
132
Table A2.1. Water-column N fixation data used in the benthic-water column comparison in Chapter 1 and for Figure A2.1. ND signifies that N fixation was not
detected. SE is standard error of the mean.
Lake Date Depth
(m) Light
(μE sec m-2)
Water Temp.
(oC) Chlorophyll
μg L-1 NN fixation (μgN
L-1 day-1) SE
Ne-9B 1-Jul-03 0 750 16 1.77 3 0.521 0.168 Ne-9B 1-Jul-03 1 237 13 1.67 3 0.576 0.210 Ne-9B 1-Jul-03 3 108 8 2.56 3 0.703 0.134 Ne-9B 1-Jul-03 5 103 6 6.33 3 0.693 0.108 NE-12 26-Jul-02 1 300 13 0.97 3 0.627 0.045 NE-12 26-Jul-02 5 70 11 1.10 3 0.599 0.044 NE-12 26-Jul-02 13 20 8 2.21 3 0.537 0.075 GTH 33 27-Jul-02 1 75 13 1.94 3 0.302 0.003 GTH 33 27-Jul-02 3 20 11 1.94 3 0.274 0.034 GTH 33 27-Jul-02 10 10 8 0.76 3 0.254 0.032 GTH 74 26-Jul-02 1 300 13 1.15 3 0.803 0.010 GTH 74 26-Jul-02 3 180 11 1.08 3 0.679 0.070 GTH 74 26-Jul-02 5.5 20 8 2.65 3 0.392 0.056 GTH 61 26-Jul-02 1 300 13 2.29 3 0.702 0.029 GTH 61 26-Jul-02 3 180 13 2.09 3 0.511 0.021 GTH 61 26-Jul-02 4.5 20 8 2.27 3 0.328 0.165 GTH 83 27-Jul-02 1 180 13 3.00 3 0.418 0.049 GTH 83 27-Jul-02 3 20 11 2.98 2 0.323 0.003 GTH 83 27-Jul-02 8.5 10 8 2.22 3 0.399 0.092 GTH 85 27-Jul-02 1 180 13 1.24 3 0.323 0.033 GTH 85 27-Jul-02 3 20 11 1.28 3 0.294 0.008 GTH 85 27-Jul-02 7 10 8 0.78 2 0.194 0.274 GTH 86 26-Jul-02 1 180 13 2.68 3 0.649 0.140 GTH 86 26-Jul-02 5 20 8 2.47 3 0.508 0.049 GTH 86 26-Jul-02 8 20 8 0.75 3 0.360 0.080 Fog 2 31-Jul-02 0 1000 13 0.49 3 0.329 0.016 Fog 2 31-Jul-02 1 350 13 0.48 3 0.479 0.083 Fog 2 31-Jul-02 3 350 13 0.47 3 0.410 0.020 Fog 2 31-Jul-02 5 100 10 0.51 3 0.398 0.070 Fog 2 31-Jul-02 8 100 10 0.71 3 0.402 0.024 Fog 2 31-Jul-02 12 10 7 1.09 3 0.410 0.051 Fog 2 31-Jul-02 16 10 7 0.78 3 0.374 0.004 S-6 24-Jul-02 1 370 13 0.60 3 ND - S-6 24-Jul-02 3 250 11 1.39 3 ND - S-6 24-Jul-02 5 59 8 3.08 3 ND - Toolik 27-Jun-03 0 886 6 2.25 3 0.487 0.045 Toolik 27-Jun-03 1 298 5 1.45 3 0.626 0.188 Toolik 27-Jun-03 3 46 5 1.43 3 0.506 0.059 Toolik 27-Jun-03 5 13 5 1.52 3 0.452 0.082 Toolik 27-Jun-03 8 2 4 1.23 3 0.528 0.018 Toolik 27-Jun-03 12 1 4 0.76 3 0.535 0.029 Toolik 27-Jun-03 16 1 4 0.76 3 0.561 0.189 Toolik 27-Jun-03 20 1 4 - 3 0.444 0.068

133
Figure A2.2. Relationship between water-column N fixation and light (panel A), temperature (panel B), and total chlorophyll (panel C). There was no statistically significant relationship among any of these variables and water-column N fixation.
A.
B.
C.
0.00
0.20
0.40
0.60
0.80
1.00
0 200 400 600 800 1000
Light (μE m-2 sec-1)
N fi
xatio
n ( μ
g N
L-1
day
-1)
0.00
0.20
0.40
0.60
0.80
1.00
0 4 8 12 16 20
Temperature (oC)
N fi
xatio
n ( μ
g N
L-1
day
-1)
0.00
0.20
0.40
0.60
0.80
1.00
0 1 2 3 4 5 6 7
Total chlorophyll (μg L-1)
N fi
xatio
n ( μ
g N
L-1
day
-1)

134
2. Water column nitrogen fixation in Toolik Lake, 2003.
0
2
4
6
8
10
12
14
16
18
20
0.0 0.3 0.5 0.8 1.0 1.3 1.5
μg N L-1 day-1D
epth
(m)
27-Jun-034-Jul-0311-Jul-031-Aug-038-Aug-03
Figure A2.3. Depth profiles showing seasonal water-column N fixation in Toolik Lake in 2003.

135
Table A2.2 Summary of water-column N fixation in Toolik Lake, 2003.
Date Depth
(m) Light
(μE m-2sec-1) Temp.
(oC) N N fixation
(μg N L-1 day-1) SE 27-Jun-03 0 886 5.55 3 0.49 0.05 27-Jun-03 1 298 4.72 3 0.63 0.19 27-Jun-03 3 46 4.54 3 0.51 0.06 27-Jun-03 5 13 4.52 3 0.45 0.08 27-Jun-03 8 2 4.45 3 0.53 0.02 27-Jun-03 12 1 4.38 3 0.54 0.03 27-Jun-03 16 1 4.25 3 0.56 0.19 27-Jun-03 20 1 3.95 3 0.44 0.07 4-Jul-03 0 596 8.88 3 0.35 0.12 4-Jul-03 1 118 8.71 3 0.37 0.02 4-Jul-03 3 39 8.5 3 0.36 0.05 4-Jul-03 5 8 8.14 3 0.50 0.07 4-Jul-03 8 1 7.94 3 0.39 0.00 4-Jul-03 12 1 6.5 3 0.53 0.17 4-Jul-03 16 1 5.46 3 0.33 0.10 4-Jul-03 20 1 5.2 3 0.42 0.02 11-Jul-03 1 36 12.86 2 0.83 0.10 11-Jul-03 3 17 12.31 2 1.18 0.17 11-Jul-03 5 4 10.59 2 0.98 0.24 11-Jul-03 8 1 7.8 2 0.68 0.03 18-Jul-03 3 12.31 3 0.60 0.00 18-Jul-03 5 10.59 4 0.52 0.04 25-Jul-03 3 13 11.73 3 0.91 0.01 25-Jul-03 5 4 10.88 4 0.96 0.10 1-Aug-03 1 82 8.9 2 0.72 0.05 1-Aug-03 3 33 8.88 2 0.88 0.17 1-Aug-03 5 4 10.59 2 0.48 0.28 1-Aug-03 8 1 7.8 2 0.76 0.02 8-Aug-03 0 764 8.29 2 0.74 0.06 8-Aug-03 1 236 8.27 3 0.82 0.01 8-Aug-03 3 46 8.24 3 0.86 0.10 8-Aug-03 5 11 8.23 3 0.81 0.05 8-Aug-03 8 2 8.22 3 0.87 0.07 8-Aug-03 12 1 8.2 3 1.01 0.07 8-Aug-03 16 1 7.59 3 1.01 0.09 8-Aug-03 20 1 6.49 3 0.88 0.08

136
3. Temperature and light relationships for water-column N fixation in Toolik Lake, 2003.
A.
B.
Figure A2.4. Relationship of water-column N fixation and temperature (panel A) and light (panel B) in Toolik Lake for all data in 2003. There was a significant relationship between temperature and water-column N fixation (statistics shown), but not between light and N fixation.
y = 0.04x + 0.32R2 = 0.23; p=0.003
0.00
0.20
0.40
0.60
0.80
1.00
1.20
1.40
0 3 6 9 12 15Temperature oC
N F
ixat
ion
( μg
L-1 d
ay-1
)
0.00
0.20
0.40
0.60
0.80
1.00
1.20
1.40
0 200 400 600 800 1000Light μE m-2 sec-1
N F
ixat
ion
( μg
L-1 d
ay-1
)

137
Table A2.3. Water-column N fixation for lake E-5. ND indicates that N fixation was not detected.
Date Depth
(m) Light
(μE sec m-2)
Water Temp.
(oC) N N fixation
(μgN L-1 day-1) SE
15-Jul-02 1 100 10 3 ND - 15-Jul-02 2 100 10 3 ND - 15-Jul-02 5 30 10 3 ND - 15-Jul-02 8 30 10 3 ND - 5-Aug-02 0 456 13 3 0.268 0.036 5-Aug-02 1 60 13 3 0.205 0.021 5-Aug-02 3 2 8 2 0.185 0.080
5-Aug-02 5 2 8 3 0.315 0.111 5-Aug-02 8 2 8 3 0.204 0.022 5-Aug-02 10 2 8 3 0.109 0.053
20-Jun-03 1 300 6 2 0.088 0.023 20-Jun-03 3 42 6 3 0.051 0.016 20-Jun-03 5 11 6 3 0.061 0.006 21-Jul-03 0 968 12 3 0.078 0.006 21-Jul-03 1 78 12 3 0.089 0.012 21-Jul-03 3 42 12 3 0.073 0.013 21-Jul-03 5 26 11 3 0.093 0.012 21-Jul-03 8 12 7 3 0.084 0.007
21-Jul-03 10 2 5 3 0.099 0.012

138
4. Water-column data for lakes E-5, E-6, Fog 2, and Fog 2 in years 2002 – 2003.
Table A2.4. Water-column N fixation for lake E-6. ND indicates that N fixation was not detected.
Date Depth
(m) Light
(μE sec m-2)
Water Temp.
(oC) N N fixation
(μgN L-1 day-1) SE
15-Jul-02 1 30 10 3 ND - 15-Jul-02 2 30 10 3 ND - 5-Aug-02 0 456 13 3 0.289 0.072 5-Aug-02 1 60 13 3 0.206 0.009 5-Aug-02 2 30 13 3 0.262 0.102 20-Jun-03 0 1000 11 3 0.065 0.009 20-Jun-03 1 500 8 3 0.056 0.012
20-Jun-03 2 72 8 3 0.063 0.002 21-Jul-03 0 968 12 3 0.082 0.003 21-Jul-03 1 12 12 3 0.069 0.001
21-Jul-03 2 12 12 3 0.081 0.003

139
Table A2.5. Water-column N fixation for lake Fog 2.
Date Depth
(m) Light
(μE sec m-2)
Water Temp.
(oC) N N fixation
(μgN L-1 day-1) SE
11-Jul-02 1 220 11 3 0.044 0.027 11-Jul-02 3 220 11 3 0.028 0.027 11-Jul-02 5 220 11 3 0.039 0.029 11-Jul-02 8 66 11 3 0.062 0.041 11-Jul-02 12 66 11 3 0.275 0.169 31-Jul-02 0 1000 13 3 0.329 0.016 31-Jul-02 1 350 13 3 0.479 0.083
31-Jul-02 3 350 13 3 0.410 0.020 31-Jul-02 5 100 10 3 0.398 0.070 31-Jul-02 8 100 10 3 0.402 0.024
31-Jul-02 12 10 7 3 0.410 0.051 31-Jul-02 16 10 7 3 0.374 0.004 26-Jun-03 1 283 11 2 0.592 0.216 26-Jun-03 3 130 7 3 0.425 0.333 26-Jun-03 5 130 7 3 0.391 0.211 26-Jun-03 8 20 4 3 0.640 0.462 12-Jul-03 0 695 11 2 0.107 0.017 12-Jul-03 1 400 11 3 0.103 0.004
12-Jul-03 3 200 11 3 0.079 0.003 12-Jul-03 5 130 11 3 0.076 0.009 12-Jul-03 8 60 6 3 0.080 0.036 12-Jul-03 12 10 6 3 0.101 0.018 12-Jul-03 16 10 6 3 0.104 0.018 31-Jul-03 0 564 9 3 0.856 0.018 31-Jul-03 1 82 9 3 0.745 0.097 31-Jul-03 3 33 9 3 0.867 0.025 31-Jul-03 5 8 9 3 1.050 0.121 31-Jul-03 8 2 9 3 1.005 0.226 31-Jul-03 12 1 8 3 0.897 0.010
31-Jul-03 16 1 7 3 0.938 0.055

140
Table A2.6. Water-column N fixation for lake Fog 4.
Date Depth
(m) Light
(μE sec m-2)
Water Temp.
(oC) N N fixation
(μgN L-1 day-1) SE
10-Jul-02 1 66 11 3 0.397 0.206 10-Jul-02 2 66 11 3 0.226 0.178 31-Jul-02 0 1000 13 3 0.547 0.049 31-Jul-02 1 350 13 3 0.473 0.090 31-Jul-02 2 100 10 3 0.411 0.006 31-Jul-03 0 525 8 3 0.570 0.016 31-Jul-03 1 525 8 3 0.703 0.214
31-Jul-03 2 9.8 8 3 0.562 0.036
Table A2.7. Water-column N fixation for Toolik Lake. N fixation was measured along the same depth profile but not detected on 26 Jun 2002.
Date Depth
(m) Light
(μE sec m-2)
Water Temp.
(oC) N N fixation
(μgN L-1 day-1) SE
2-Aug-02 0 820 15 3 0.435 0.053 2-Aug-02 1 350 14 3 0.376 0.049 2-Aug-02 3 90 13 3 0.395 0.045 2-Aug-02 5 10 12 3 0.211 0.130 2-Aug-02 6.5 10 12 3 0.328 0.019 2-Aug-02 8 3.5 7 3 0.445 0.018 2-Aug-02 12 3.5 7 3 0.381 0.102
2-Aug-02 16 3.5 7 3 0.341 0.052
2-Aug-02 22 3.5 7 3 0.335 0.038

141
APPENDIX 3. ALGAL COMPOSITION DATA FOR SNAIL GRAZING
EXPERIMENT.
Algal community composition was enumerated in sediment samples collected
from control and snail enclosures as described in Chapter 3. In a manner similar to
samples collected for chlorophyll a analysis, one core 2.5 cm in diameter was
collected from each enclosure, and the top 5 cm were removed and homogenized. A 5
ml sub-sample was removed and stored in 10 ml of lake water and preserved with 1
μL of gluteraldehyde. Permanent slides were made using Tafts Syrup Medium
according to protocol described in Stevenson and Bahls (1999) Three slides were
made for each enclosure, and a total of 8 fields were counted on each slide after
plotting taxonomic diversity against the number of fields and determining that 7 fields
reached the asymptotic part of the relationship. Algal cells and colonies were counted
and measured at 100X and 400X on a Wild M-40 inverted microscope.
A random-coefficients model was used to analyze the relationship between
snail density and the number and size (length) of filamentous cyanobacterial colonies
present. Details of the statistical analysis are identical to the random-coefficients
model described in Chapter 3. Similar analyses were performed on the genera Nostoc
sp., which are known to fix nitrogen, and the identical conclusions were reached
(statistics not shown). This appendix shows data tables for algal diversity in all
counted samples as well as the average length and standard deviation for filamentous
cyanobacterial groups present.

142
Table A3.1. Algal counts for grazing experiments described in Chapter 3. Counts are in #/ml of sediment.
Lak
e
Yea
r
Blo
ck
Rep
licat
e
Snai
l Tre
atm
ent
Snai
l Den
sity
(#/m
2 )
Ara
phid
Bir
aphi
d
Cen
tric
Dia
tom
Coc
coid
Cya
noba
cter
ia o
r G
reen
al
gae
Col
onia
l Cya
noba
cter
ia
Cra
ticul
a
Cyc
lote
lla C
hain
Cyc
lote
lla (s
ingl
e ce
ll)
Des
mid
Fila
men
tous
Cya
noba
cter
ia
Fila
men
tous
Cya
noba
cter
ia o
r G
reen
alg
ae
Fila
men
tous
Gre
en
Frag
ilari
a
Mer
ism
oped
ia
Mon
orap
hid
Nos
toc
Osc
illat
oria
Pedi
astr
um
Penn
ales
Dia
tom
Scen
edes
mus
Snow
ella
Spir
ulin
a
Stau
rode
smus
Stas
trum
Xan
thid
ium
Fog 2 2001 A1 1 Zero 0 0 10 1 1 16 0 27 1 0 11 0 28 3 0 0 8 0 0 61 1 0 0 1 0 0 Fog 2 2001 A1 1 Control 1.3 0 7 1 1 13 0 25 1 0 8 0 37 4 0 0 5 1 1 62 1 0 0 0 0 1 Fog 2 2001 A1 1 Low 12 0 9 1 1 10 0 26 1 0 8 0 30 3 0 0 5 1 1 95 1 0 0 1 0 0 Fog 2 2001 A1 1 High 60 0 5 1 1 8 0 45 1 1 10 0 16 2 0 0 15 0 1 82 1 0 0 0 0 0 Fog 2 2001 A1 2 Zero 0 0 6 1 1 16 0 50 1 0 8 0 36 3 0 0 4 0 0 69 1 0 0 0 0 0 Fog 2 2001 A1 2 Control 1.3 0 12 1 1 8 0 20 1 0 9 0 28 2 0 0 6 0 0 52 1 0 0 0 0 0 Fog 2 2001 A1 2 Low 12 0 7 1 1 25 0 27 1 1 13 0 15 0 0 0 2 0 1 61 1 0 0 0 0 0 Fog 2 2001 B2 1 Zero 0 0 10 2 2 12 0 40 2 1 25 0 43 3 0 0 8 0 1 111 2 0 0 0 0 1 Fog 2 2001 B2 1 Low 12 0 7 1 1 10 0 28 1 0 22 0 13 4 0 0 7 1 1 56 1 0 0 0 1 0 Fog 2 2001 B2 1 High 36 36 16 1 1 47 0 18 1 1 10 4 32 2 0 0 22 0 0 57 1 2 0 0 0 0 Fog 2 2001 B2 2 Zero 0 0 13 1 1 14 0 43 1 1 8 0 29 3 0 0 10 2 1 86 1 0 0 0 0 0 Fog 2 2001 B2 2 Control 1.3 0 3 1 1 23 0 32 1 1 8 0 20 4 0 1 13 0 0 86 1 0 0 0 0 0 Fog 2 2001 B2 2 Low 12 0 13 1 1 9 0 26 1 0 6 0 31 1 0 0 7 1 0 76 1 0 0 0 1 0 Fog 2 2001 B2 2 High 36 0 4 1 1 12 0 17 1 0 10 0 14 1 0 1 4 2 0 69 1 0 0 0 0 0 Fog 2 2001 C3 1 Zero 0 0 0 1 1 9 0 11 1 1 9 0 13 0 0 0 6 1 0 49 1 0 0 0 0 0 Fog 2 2001 C3 1 Control 1.3 0 3 1 1 9 0 22 1 1 9 0 29 3 0 0 3 1 1 68 1 0 0 0 0 0 Fog 2 2001 C3 1 Low 12 0 7 1 1 11 0 12 1 0 4 0 30 0 0 0 7 1 0 60 1 0 0 0 0 0 Fog 2 2001 C3 1 High 36 0 3 1 1 11 0 15 1 0 7 0 31 3 0 0 6 2 1 64 1 0 0 0 0 0
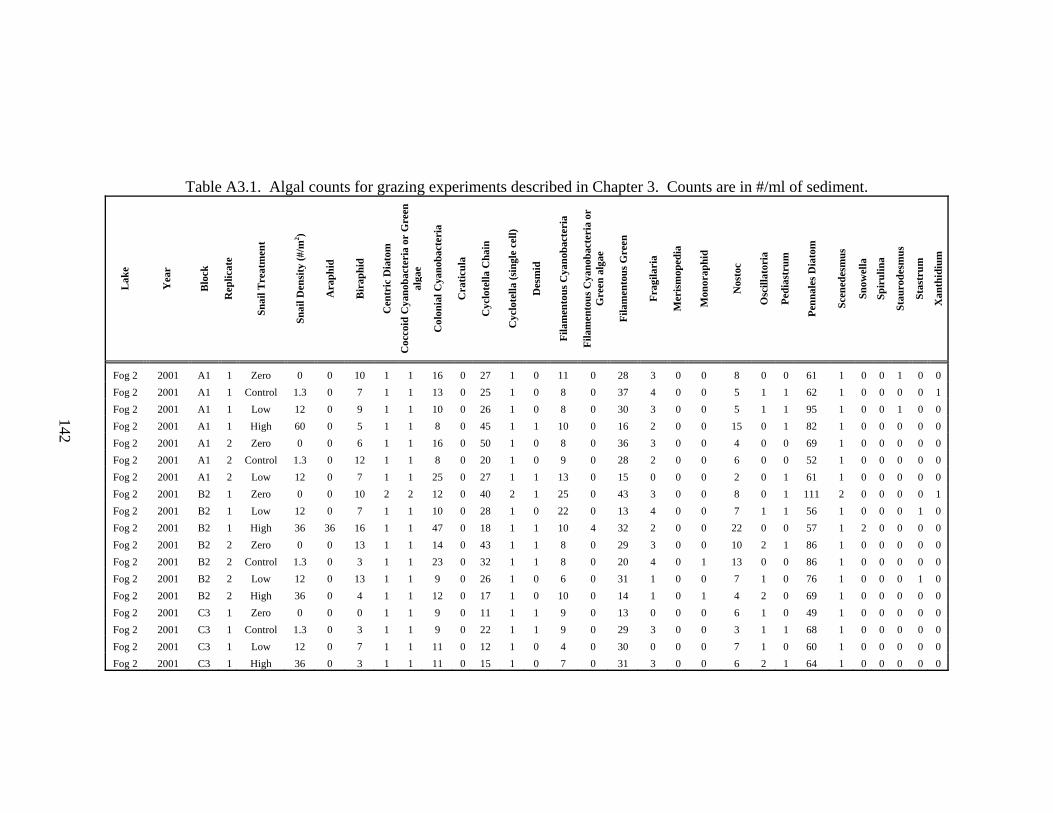
143
Table A3.1. (Continued).
Lak
e
Yea
r
Blo
ck
Rep
licat
e
Snai
l Tre
atm
ent
Snai
l Den
sity
(#/m
2 )
Ara
phid
Bir
aphi
d
Cen
tric
Dia
tom
C
occo
id C
yano
bact
eria
or
Gre
en
alga
e
Col
onia
l Cya
noba
cter
ia
Cra
ticul
a
Cyc
lote
lla C
hain
Cyc
lote
lla (s
ingl
e ce
ll)
Des
mid
Fila
men
tous
Cya
noba
cter
ia
Fila
men
tous
Cya
noba
cter
ia o
r G
reen
alg
ae
Fila
men
tous
Gre
en
Frag
ilari
a
Mer
ism
oped
ia
Mon
orap
hid
Nos
toc
Osc
illat
oria
Pedi
astr
um
Penn
ales
Dia
tom
Scen
edes
mus
Snow
ella
Spir
ulin
a
Stau
rode
smus
Stas
trum
Xan
thid
ium
Fog 2 2003 A1 1 Zero 0 0 10 1 1 4 0 80 1 0 2 0 31 1 0 0 4 0 0 70 1 0 0 0 0 0 Fog 2 2003 A1 1 Control 2.6 22 7 1 1 19 1 35 1 1 16 45 5 1 1 12 9 0 1 84 1 1 0 0 0 0 Fog 2 2003 A1 1 Low 36 0 13 1 1 23 0 35 1 1 17 0 12 2 0 0 8 0 0 106 1 0 0 0 0 0 Fog 2 2003 A1 1 High 72 0 9 1 1 22 0 42 1 1 11 0 25 2 0 0 1 4 0 77 1 0 0 0 0 0 Fog 2 2003 A1 2 Zero 0 0 7 1 1 19 0 38 1 0 10 0 22 4 0 0 6 4 0 72 1 1 0 0 0 0 Fog 2 2003 A1 2 Control 2.6 0 4 1 1 17 0 38 1 0 5 0 10 4 0 0 7 0 1 65 1 0 0 0 0 0 Fog 2 2003 A1 2 Low 36 0 11 1 1 12 0 41 1 1 10 0 22 5 0 0 2 0 0 101 1 0 0 0 0 0 Fog 2 2003 A1 2 High 72 0 11 1 2 30 0 40 1 0 14 0 38 4 0 0 6 1 0 101 2 0 0 0 0 0 Fog 2 2003 B2 1 Zero 0 0 1 1 1 6 0 31 1 0 10 0 18 1 0 0 3 0 1 43 1 0 0 0 0 0 Fog 2 2003 B2 1 Control 2.6 0 4 1 1 6 0 37 1 1 15 0 30 1 0 1 2 0 0 64 1 0 0 0 0 0 Fog 2 2003 B2 1 Low 36 0 7 1 1 7 0 48 1 1 5 0 44 4 0 0 9 2 0 98 1 0 0 0 0 0 Fog 2 2003 B2 1 High 72 0 6 1 1 6 0 43 1 0 5 0 21 4 0 0 4 1 0 81 1 0 0 0 0 0 Fog 2 2003 B2 2 Zero 0 0 11 1 1 12 0 58 1 1 8 0 36 5 0 0 7 3 0 129 1 0 0 0 0 0 Fog 2 2003 B2 2 Control 2.6 0 5 1 1 7 0 36 1 1 10 0 35 1 0 0 3 0 0 51 1 0 0 0 0 0 Fog 2 2003 B2 2 Low 36 0 11 1 1 12 0 50 1 0 16 0 30 3 0 0 8 0 1 98 1 0 0 0 0 0 Fog 2 2003 B2 2 High 72 0 5 1 1 11 0 49 1 0 9 0 26 2 0 0 4 0 0 102 1 0 0 0 0 0

144
Table A3.1. (Continued).
Lak
e
Yea
r
Blo
ck
Rep
licat
e
Snai
l Tre
atm
ent
Snai
l Den
sity
(#/m
2 )
Ara
phid
Bir
aphi
d
Cen
tric
Dia
tom
Coc
coid
Cya
noba
cter
ia o
r G
reen
al
gae
Col
onia
l Cya
noba
cter
ia
Cra
ticul
a
Cyc
lote
lla C
hain
Cyc
lote
lla (s
ingl
e ce
ll)
Des
mid
Fila
men
tous
Cya
noba
cter
ia
Fila
men
tous
Cya
noba
cter
ia o
r G
reen
al g
ae
Fila
men
tous
Gre
en
Frag
ilari
a
Mer
ism
oped
ia
Mon
orap
hid
Nos
toc
Osc
illat
oria
Pedi
astr
um
Penn
ales
Dia
tom
Scen
edes
mus
Snow
ella
Spir
ulin
a
Stau
rode
smus
Stas
trum
Xan
thid
ium
S-6 2002 A1 1 Zero 0 0 10 1 1 33 0 16 1 0 33 0 25 1 0 0 21 8 1 74 1 0 0 0 0 1 S-6 2002 A1 1 Control 5.6 2 8 1 1 22 0 12 1 1 21 0 29 1 0 0 20 11 1 89 1 0 0 0 0 1 S-6 2002 A1 1 Low 24 13 12 1 1 53 1 16 1 0 61 0 24 0 0 2 27 0 0 58 0 0 0 1 0 0 S-6 2002 A1 1 High 60 3 6 1 1 18 0 12 1 1 21 0 22 3 0 0 13 4 0 59 0 0 0 0 0 0 S-6 2002 C3 1 Zero 0 10 4 1 1 32 0 4 1 0 58 0 9 10 0 0 44 5 1 87 1 0 0 0 0 0 S-6 2002 C3 1 Control 5.6 12 11 1 1 16 0 6 1 0 27 0 7 8 0 1 26 8 0 70 1 1 1 0 0 0 S-6 2002 C3 1 Low 24 3 3 1 1 8 0 4 1 0 41 1 12 7 0 1 30 4 0 64 0 0 0 0 0 0
S-6 2002 C3 1 High 60 10 13 1 0 0 0 8 1 1 55 0 6 1 0 1 41 0 0 128 0 0 0 0 0 0

145
Table A3.2. Average length of filamentous cyanobacterial colonies (microns) in snail grazing experiment described in Chapter 3.
Lake Year Block Replicate Snail Density
Average Length (mm)
Standard Deviation
Fog 2 2001 A1 1 0 10.84 5.19 Fog 2 2001 A1 1 1.3 20.07 24.80 Fog 2 2001 A1 1 12 15.57 11.69 Fog 2 2001 A1 1 60 15.64 12.10 Fog 2 2001 A1 2 0 19.17 30.32 Fog 2 2001 A1 2 1.3 21.27 16.92 Fog 2 2001 A1 2 12 16.07 7.59 Fog 2 2001 B2 1 0 19.85 10.21 Fog 2 2001 B2 1 12 17.00 12.52 Fog 2 2001 B2 1 36 17.72 24.88 Fog 2 2001 B2 2 0 11.25 9.16 Fog 2 2001 B2 2 1.3 15.19 13.78 Fog 2 2001 B2 2 12 29.79 29.58 Fog 2 2001 B2 2 36 29.00 34.26 Fog 2 2001 C3 1 0 18.56 14.15 Fog 2 2001 C3 1 1.3 33.77 44.39 Fog 2 2001 C3 1 12 15.75 8.28 Fog 2 2001 C3 1 36 23.53 16.70 Fog 2 2003 A1 1 0 8.17 3.06 Fog 2 2003 A1 1 2.6 55.84 52.64 Fog 2 2003 A1 1 36 25.60 27.57 Fog 2 2003 A1 1 72 48.13 82.35 Fog 2 2003 A1 2 0 27.40 44.67 Fog 2 2003 A1 2 2.6 12.33 9.37 Fog 2 2003 A1 2 36 13.83 8.57 Fog 2 2003 A1 2 72 28.14 30.75 Fog 2 2003 B2 1 0 28.08 38.99 Fog 2 2003 B2 1 2.6 17.65 11.79 Fog 2 2003 B2 1 36 13.13 11.93 Fog 2 2003 B2 1 72 19.00 16.97 Fog 2 2003 B2 2 0 19.83 17.69 Fog 2 2003 B2 2 2.6 31.15 28.62 Fog 2 2003 B2 2 36 18.75 25.68 Fog 2 2003 B2 2 72 15.69 10.46 S-6 2002 A1 1 0 45.31 40.20 S-6 2002 A1 1 5.6 41.06 38.78 S-6 2002 A1 1 24 36.85 31.39 S-6 2002 A1 1 60 56.84 100.68 S-6 2002 C3 1 0 42.92 80.17 S-6 2002 C3 1 5.6 53.89 61.48 S-6 2002 C3 1 24 49.11 44.00 S-6 2002 C3 1 60 50.71 96.74

146
Table A3.3. Results from a random coefficients model to test the relationship between snail density and the total number of filamentous cyanobacterial colonies in grazing experiments conducted in lakes Fog 2 and S-6 in years 2001 – 2003. Snail density
was not significant.
Effect Numerator DF
Denominator DF F-Value p-value
Snail Density 1 32 0.00 0.97 Year 2 4 23.26 0.01 Snail Density*Year 2 32 0.35 0.71
Table A3.4. Results from a random coefficeints model to test the relationship between snail density and the length of filamentous cyanobacterial colonies in lakes Fog 2 and S-6 in grazing experiments in years 2001 – 2003. Snail density was not significant.
Effect Numerator DF
Denominator DF F-Value p-value
Snail Density 1 32 0.82 0.37 Year 2 4 10.39 0.03 Snail Density*Year 2 32 0.26 0.78

147
REFERENCES. Stevenson, R. J., and L. L. Bahls. 1999. Periphyton protocols, p. 6-1 - 6-23. In M. T.
Barbour, J. Gerritsen, B. D. Snyder and J. B. Stribling [eds.], Rapid Bioassessment Protocols for Use in Streams and Wadeable Rivers: Periphyton, Benthic Macroinvertebrates and Fish, Second Edition. U.S. Environmental Protection Agency, Office of Water; Washington, D.C.

![The Genetics of Symbiotic Nitrogen Fixation: … › id › eprint › 7978 › ...nitrogen fixation as an alternative to nitrogen fertilizers is forecast to increase [1]. Symbiotic](https://img.pdfslide.us/doc/110x75/5f28b87fa2f7bf549f1d9235/the-genetics-of-symbiotic-nitrogen-fixation-a-id-a-eprint-a-7978-a-.jpg)