Embed Size (px)
Citation preview
Rate and Revenue Considerations When Starting an Energy Efficiency Program
APPA’s National ConferenceJune 13th, 2009Salt Lake City, Utah
Mark Beauchamp, CPA, CMA, MBAPresidentUtility Financial SolutionsPhone: 616-393-9722
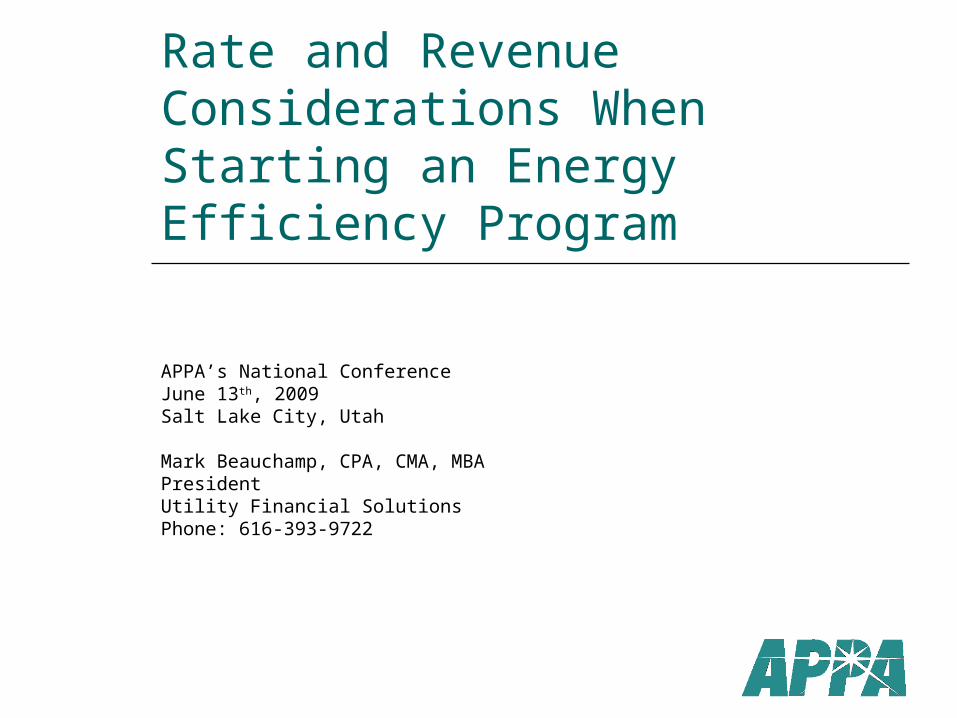
Objectives
How will rates be impacted if an energy efficiency program is implemented
How is industry responding to the changes What impacts on contributions to City What types of cost structures place the
utility most at Risk How rates may need to change What rate structures should be considered
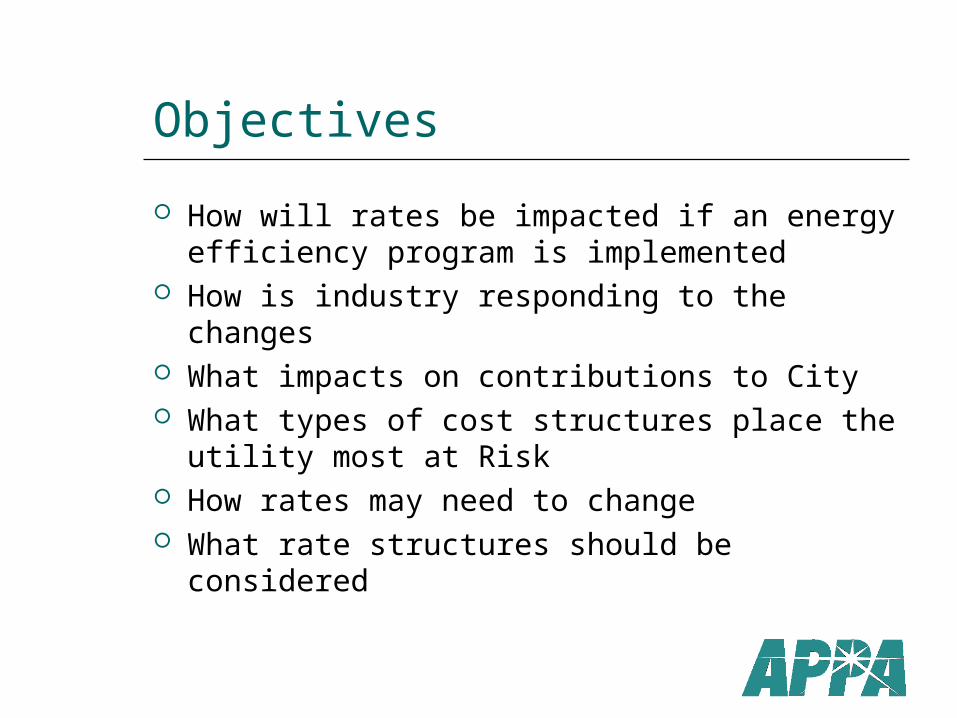
Utilities Incentive is to grow
Improved profitability for IOU’s If sales were above projected amount between rate
cases- Profitability improved Increasing return to shareholders
IOU’s had incentive to construct new power plants New investment increased the rate of return (in
dollars) More investment the greater the allowable rate of
return in dollars Public Power Systems
Growth helped to keep rates low Added to reserve levels Funded capital programs to improve reliability
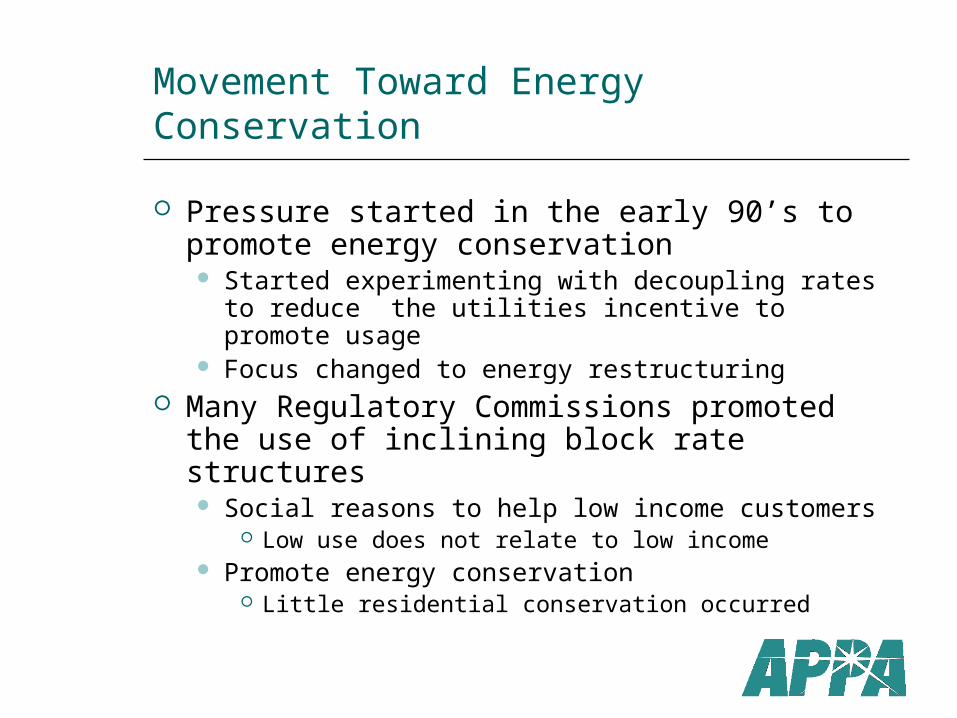
Movement Toward Energy Conservation
Pressure started in the early 90’s to promote energy conservation Started experimenting with decoupling rates to
reduce the utilities incentive to promote usage Focus changed to energy restructuring
Many Regulatory Commissions promoted the use of inclining block rate structures Social reasons to help low income customers
Low use does not relate to low income Promote energy conservation
Little residential conservation occurred
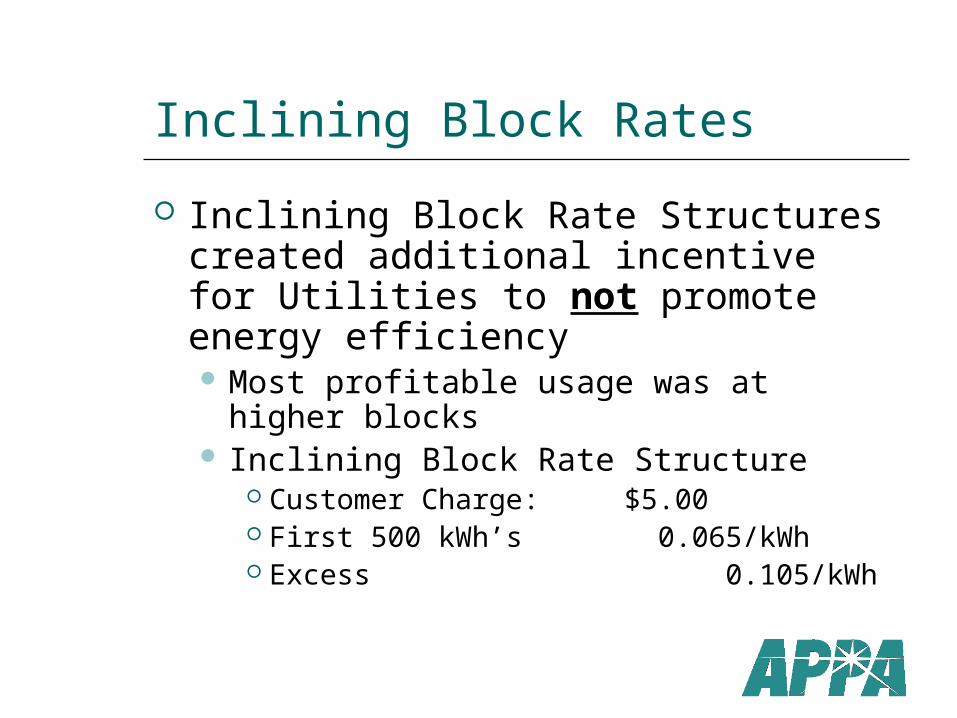
Inclining Block Rates
Inclining Block Rate Structures created additional incentive for Utilities to not promote energy efficiency Most profitable usage was at higher
blocks Inclining Block Rate Structure
Customer Charge: $5.00 First 500 kWh’s 0.065/kWh Excess 0.105/kWh
Assessment of Risk of Under Recovery
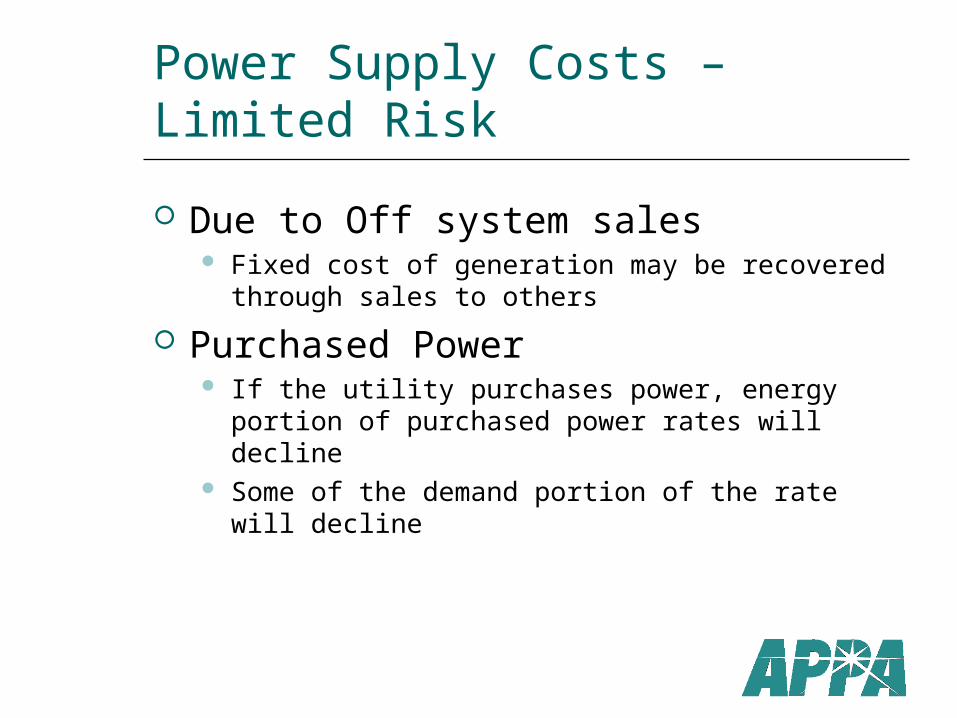
Power Supply Costs – Limited Risk
Due to Off system sales Fixed cost of generation may be recovered
through sales to others
Purchased Power If the utility purchases power, energy portion of
purchased power rates will decline Some of the demand portion of the rate will
decline
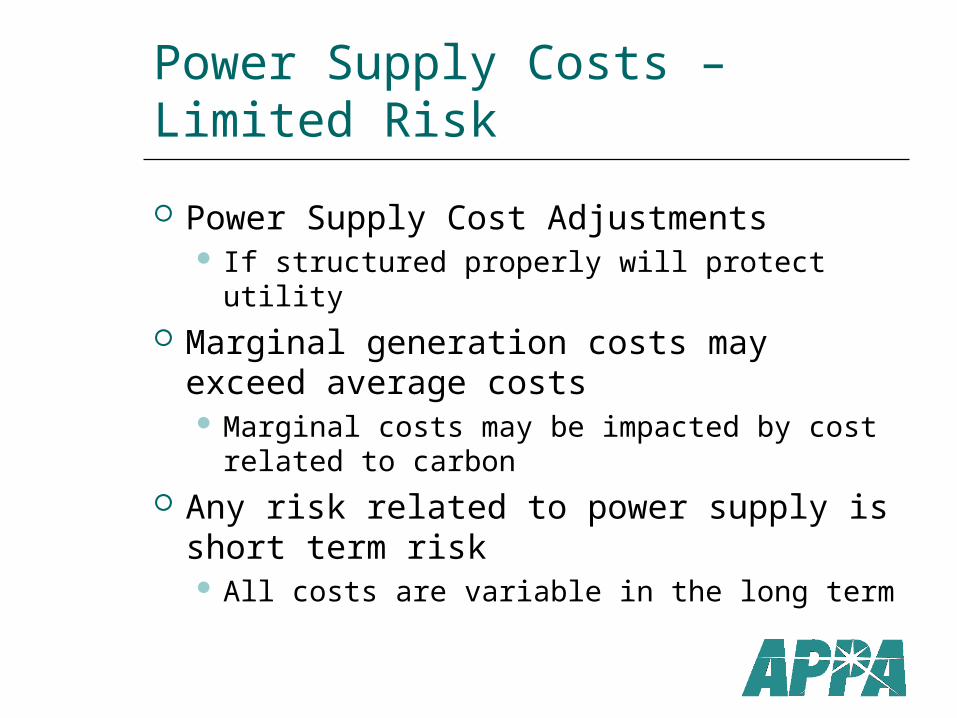
Power Supply Costs – Limited Risk
Power Supply Cost Adjustments If structured properly will protect utility
Marginal generation costs may exceed average costs Marginal costs may be impacted by cost
related to carbon Any risk related to power supply is
short term risk All costs are variable in the long term
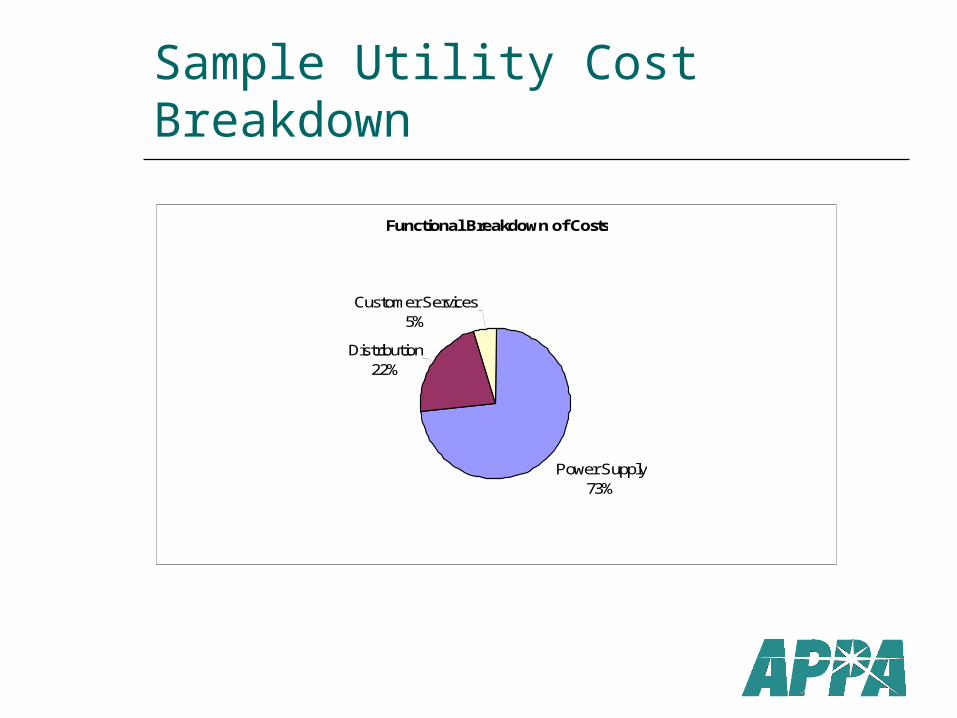
Sample Utility Cost Breakdown
Functional Breakdown of Costs
Power Supply73%
Distribution22%
Customer Services5%
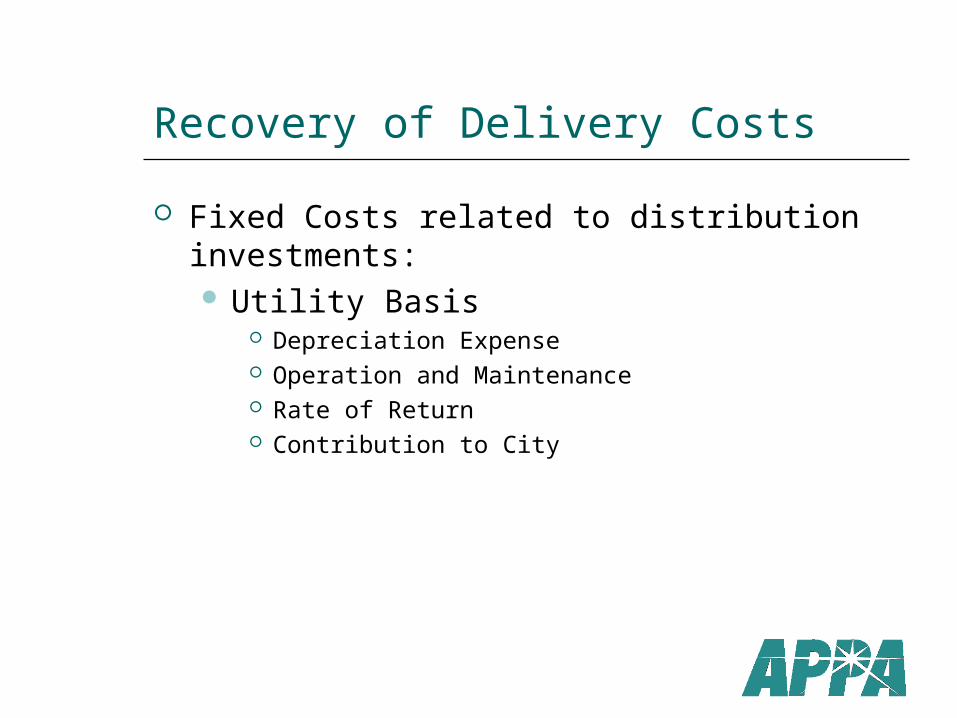
Recovery of Delivery Costs
Fixed Costs related to distribution investments: Utility Basis
Depreciation Expense Operation and Maintenance Rate of Return Contribution to City
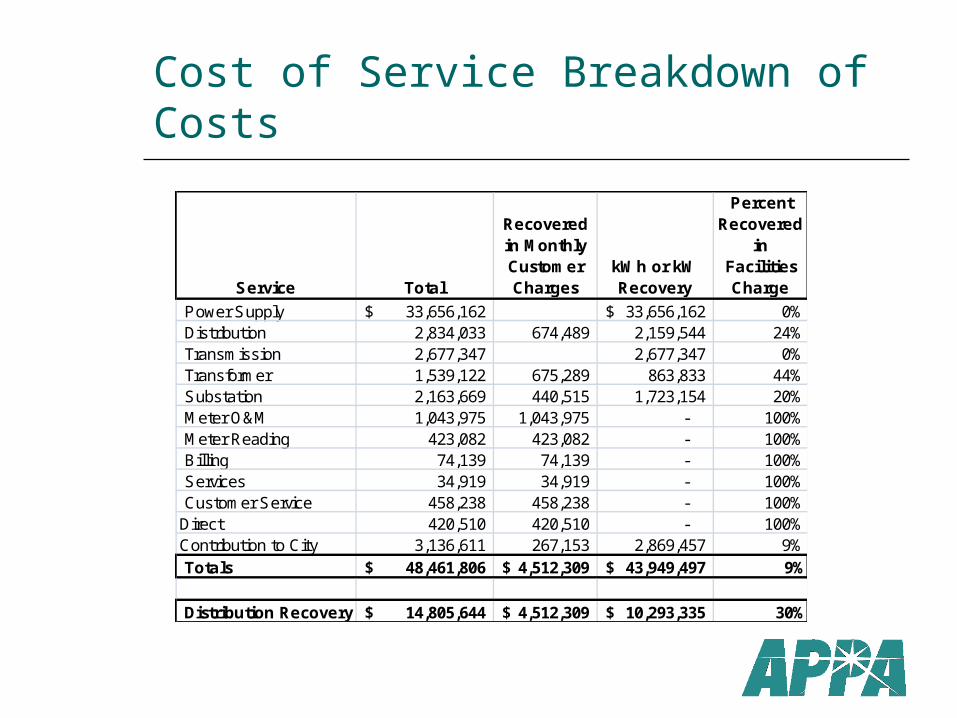
Cost of Service Breakdown of Costs
Service Total
Recovered in Monthly Customer Charges
kWh or kW Recovery
Percent Recovered
in Facilities Charge
Power Supply 33,656,162$ 33,656,162$ 0%Distribution 2,834,033 674,489 2,159,544 24%Transmission 2,677,347 2,677,347 0%Transformer 1,539,122 675,289 863,833 44%Substation 2,163,669 440,515 1,723,154 20%Meter O&M 1,043,975 1,043,975 - 100%Meter Reading 423,082 423,082 - 100%Billing 74,139 74,139 - 100%Services 34,919 34,919 - 100%Customer Service 458,238 458,238 - 100%
Direct 420,510 420,510 - 100%Contribution to City 3,136,611 267,153 2,869,457 9%Totals 48,461,806$ 4,512,309$ 43,949,497$ 9%
Distribution Recovery 14,805,644$ 4,512,309$ 10,293,335$ 30%
Customer Charges
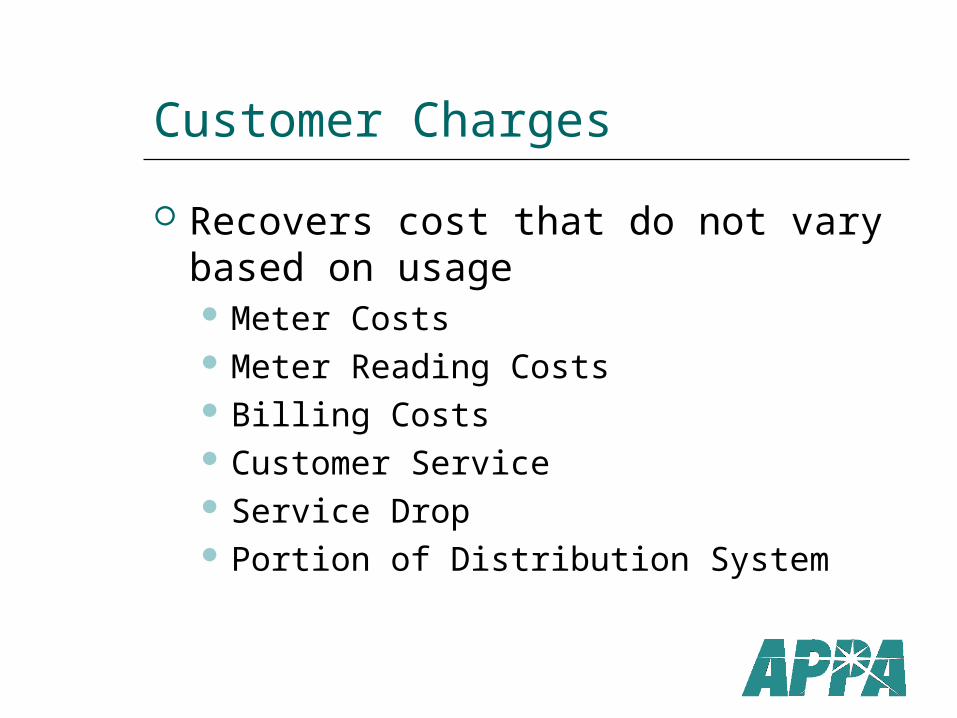
Recovers cost that do not vary based on usage Meter Costs Meter Reading Costs Billing Costs Customer Service Service Drop Portion of Distribution System
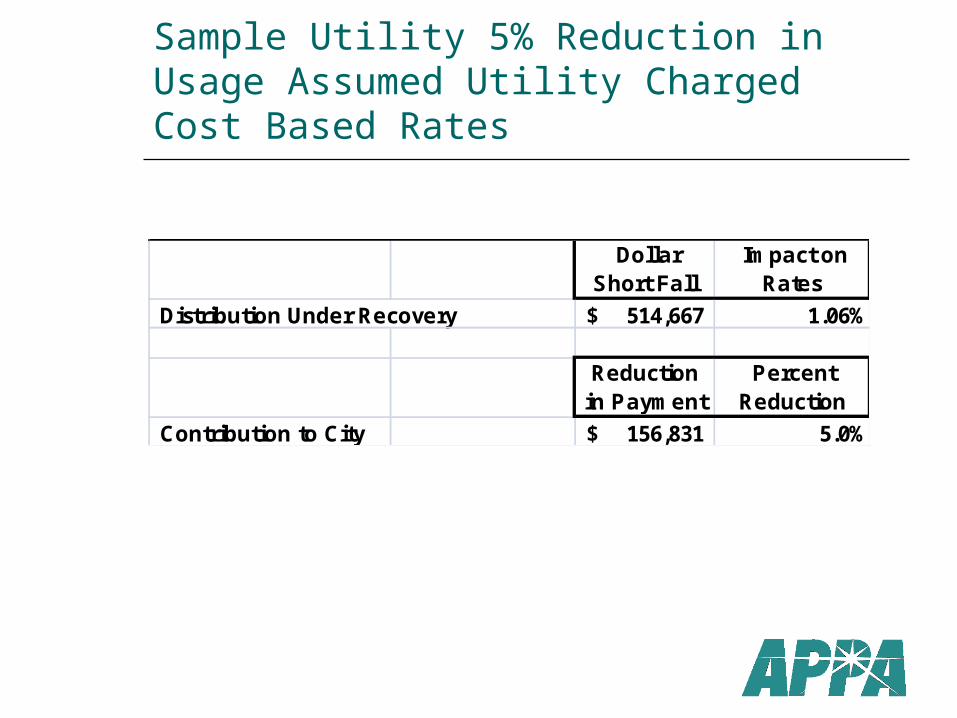
Sample Utility 5% Reduction in Usage Assumed Utility Charged Cost Based Rates
Dollar Short Fall
Impact on Rates
Distribution Under Recovery 514,667$ 1.06%
Reduction in Payment
Percent Reduction
Contribution to City 156,831$ 5.0%
Rate Structures that Place Utilities Most At Risk
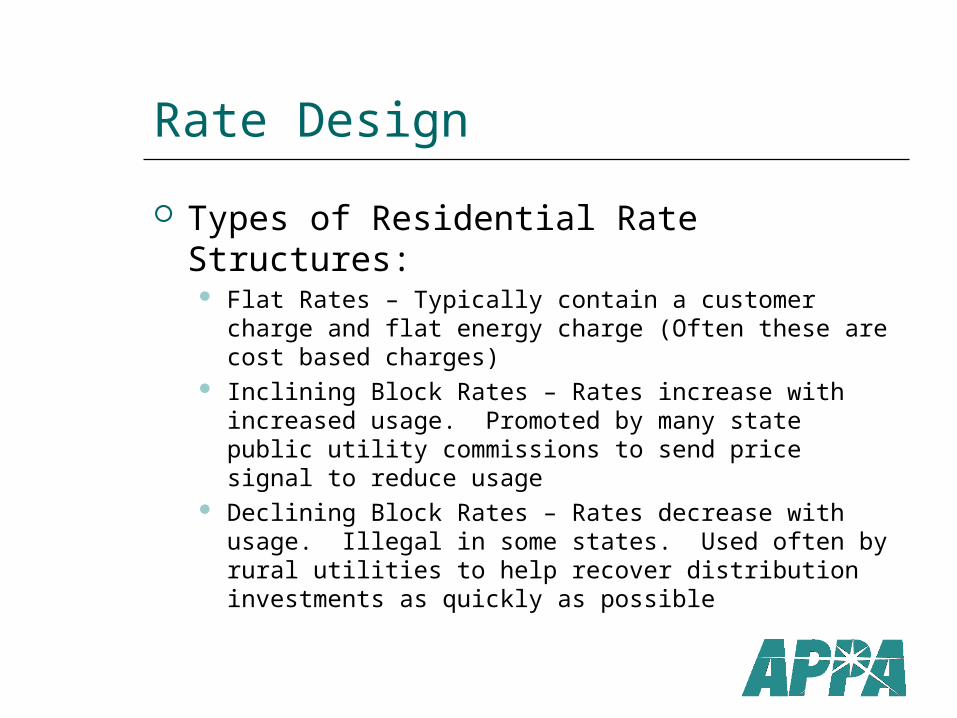
Rate Design
Types of Residential Rate Structures: Flat Rates – Typically contain a customer charge
and flat energy charge (Often these are cost based charges)
Inclining Block Rates – Rates increase with increased usage. Promoted by many state public utility commissions to send price signal to reduce usage
Declining Block Rates – Rates decrease with usage. Illegal in some states. Used often by rural utilities to help recover distribution investments as quickly as possible
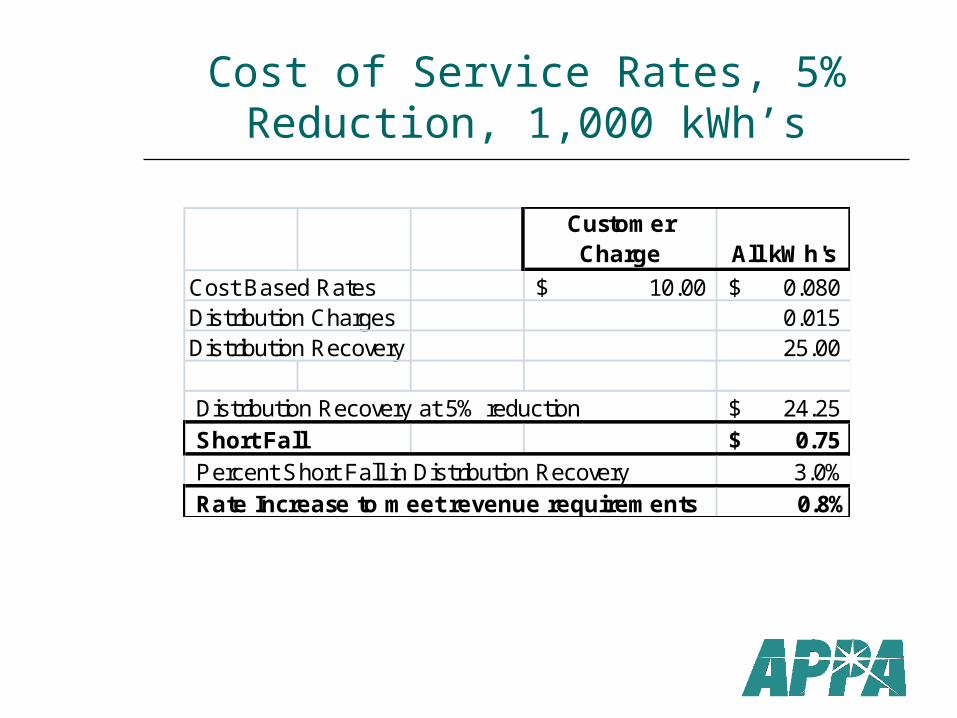
Cost of Service Rates, 5% Reduction, 1,000 kWh’s
Customer Charge All kWh's
Cost Based Rates 10.00$ 0.080$ Distribution Charges 0.015 Distribution Recovery 25.00
Distribution Recovery at 5% reduction 24.25$ Short Fall 0.75$ Percent Short Fall in Distribution Recovery 3.0%Rate Increase to meet revenue requirements 0.8%
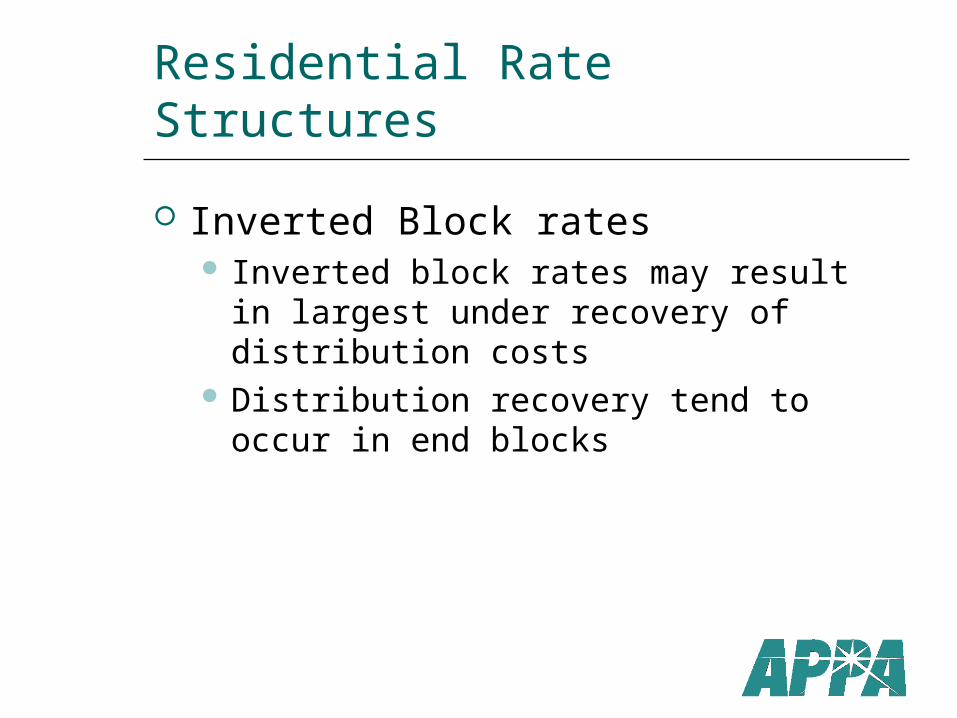
Residential Rate Structures
Inverted Block rates Inverted block rates may result in
largest under recovery of distribution costs
Distribution recovery tend to occur in end blocks
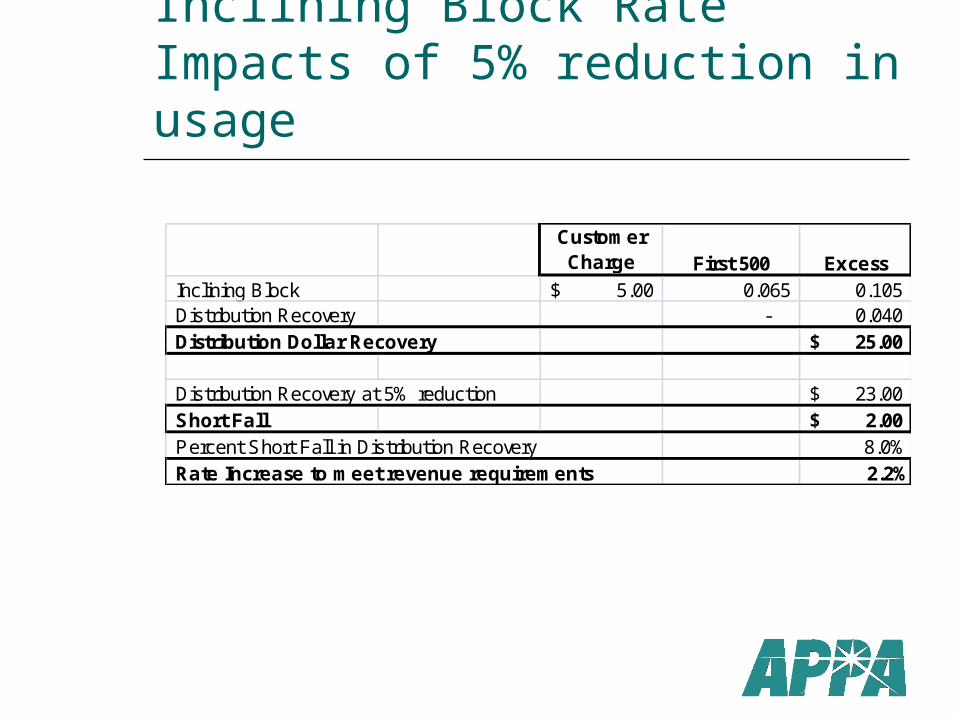
Inclining Block Rate Impacts of 5% reduction in usage
Customer Charge First 500 Excess
Inclining Block 5.00$ 0.065 0.105 Distribution Recovery - 0.040 Distribution Dollar Recovery 25.00$
Distribution Recovery at 5% reduction 23.00$ Short Fall 2.00$ Percent Short Fall in Distribution Recovery 8.0%Rate Increase to meet revenue requirements 2.2%
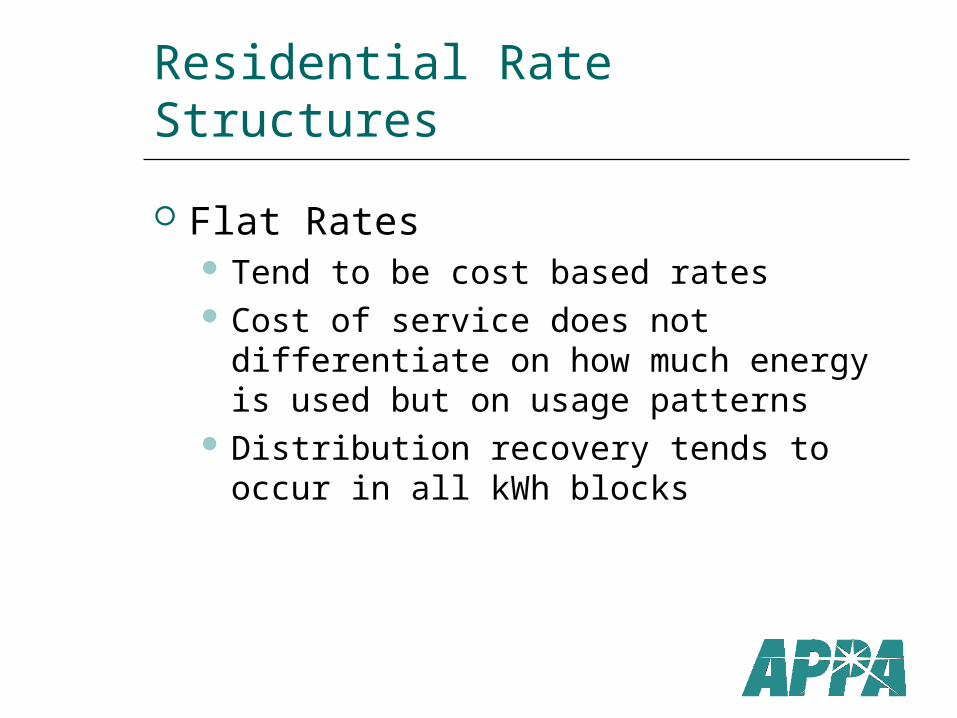
Residential Rate Structures
Flat Rates Tend to be cost based rates Cost of service does not differentiate on
how much energy is used but on usage patterns
Distribution recovery tends to occur in all kWh blocks
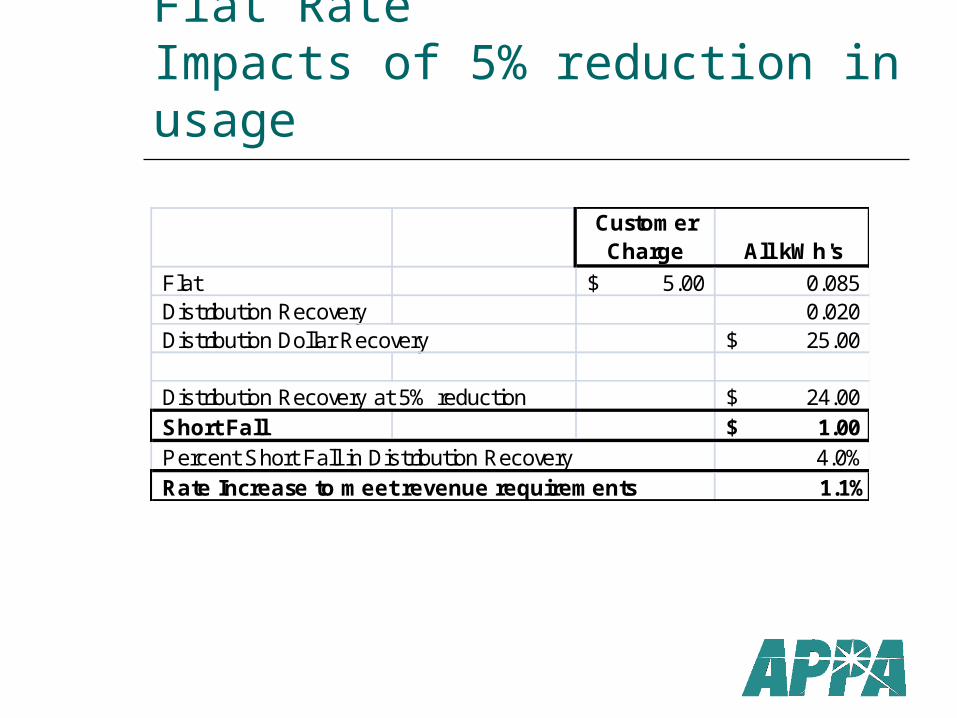
Flat Rate Impacts of 5% reduction in usage
Customer Charge All kWh's
Flat 5.00$ 0.085 Distribution Recovery 0.020 Distribution Dollar Recovery 25.00$
Distribution Recovery at 5% reduction 24.00$ Short Fall 1.00$ Percent Short Fall in Distribution Recovery 4.0%Rate Increase to meet revenue requirements 1.1%
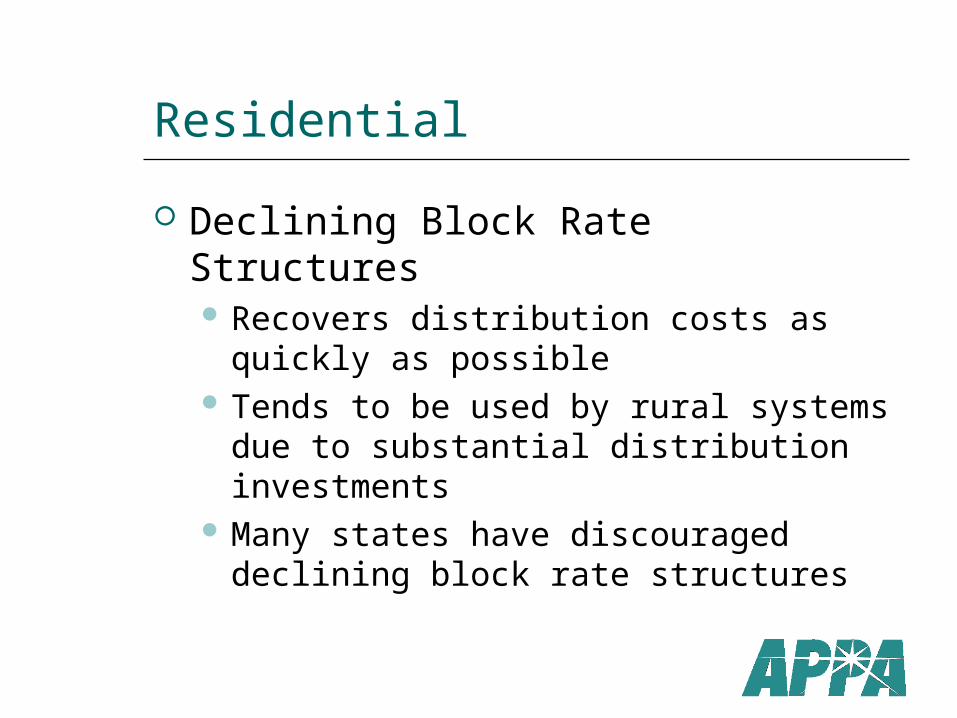
Residential
Declining Block Rate Structures Recovers distribution costs as quickly
as possible Tends to be used by rural systems due
to substantial distribution investments Many states have discouraged declining
block rate structures
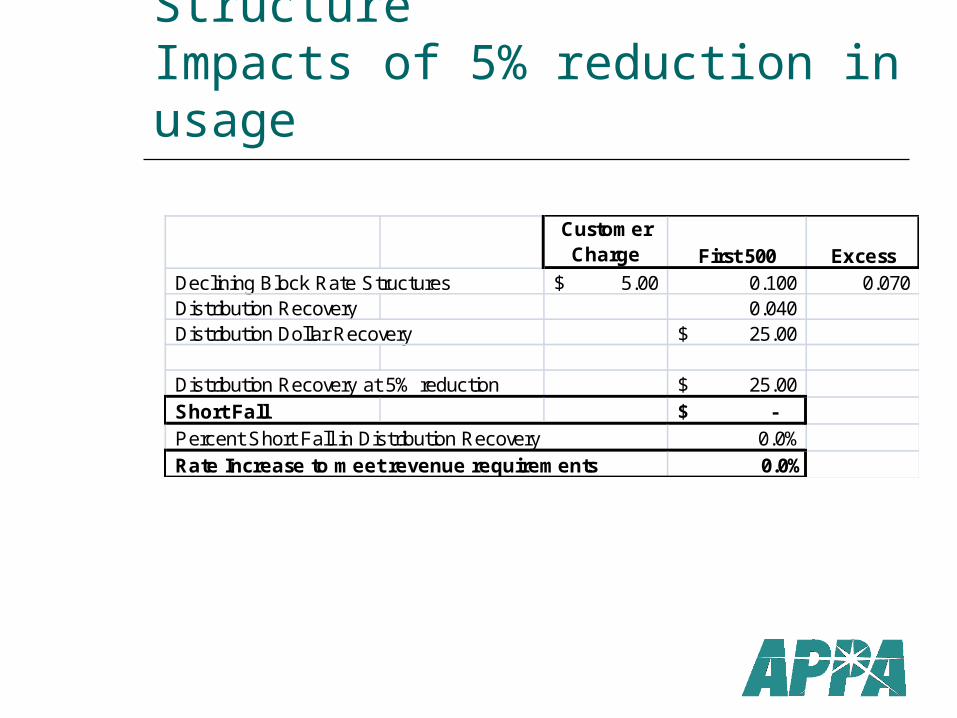
Declining Block Rate StructureImpacts of 5% reduction in usage
Customer Charge First 500 Excess
Declining Block Rate Structures 5.00$ 0.100 0.070 Distribution Recovery 0.040 Distribution Dollar Recovery 25.00$
Distribution Recovery at 5% reduction 25.00$ Short Fall -$ Percent Short Fall in Distribution Recovery 0.0%Rate Increase to meet revenue requirements 0.0%
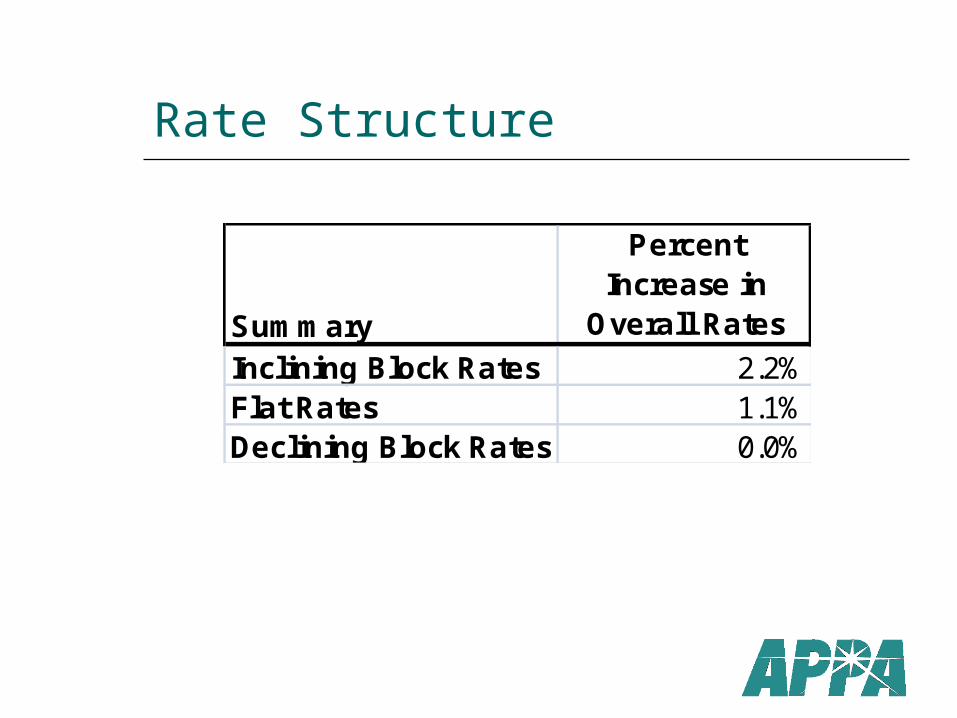
Rate Structure
Summary
Percent Increase in
Overall Rates
Inclining Block Rates 2.2%Flat Rates 1.1%Declining Block Rates 0.0%
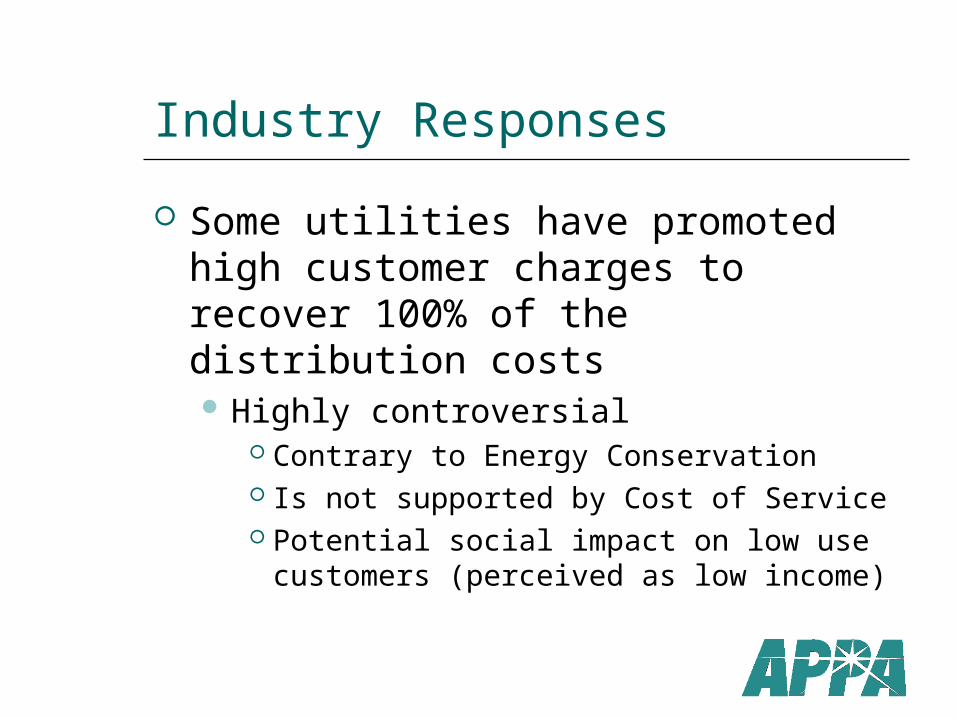
Industry Responses
Some utilities have promoted high customer charges to recover 100% of the distribution costs Highly controversial
Contrary to Energy Conservation Is not supported by Cost of Service Potential social impact on low use
customers (perceived as low income)
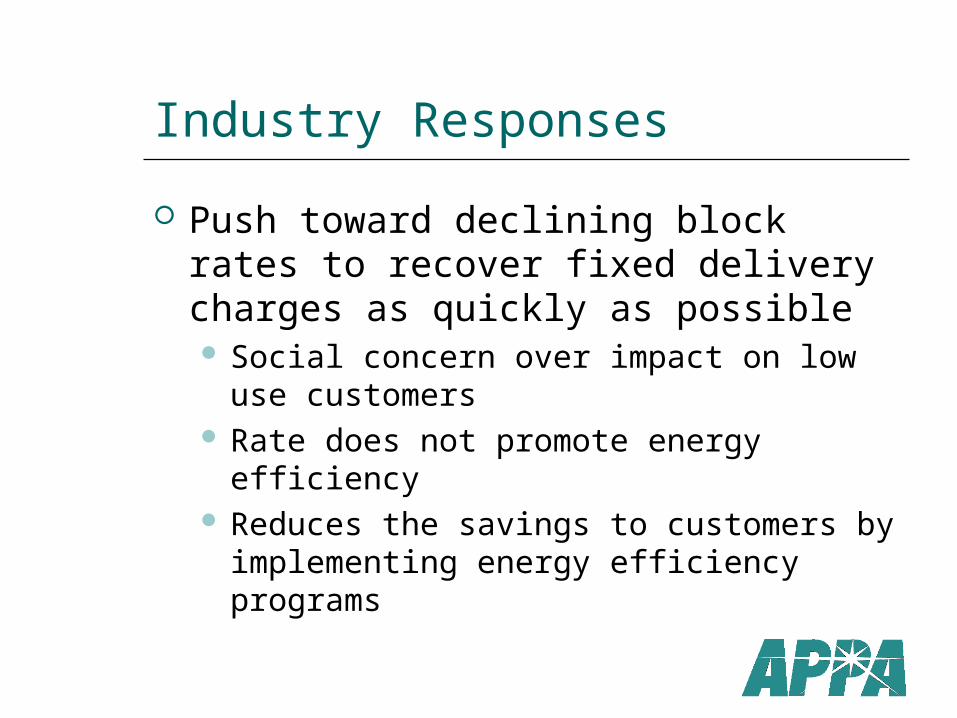
Industry Responses
Push toward declining block rates to recover fixed delivery charges as quickly as possible Social concern over impact on low use
customers Rate does not promote energy efficiency Reduces the savings to customers by
implementing energy efficiency programs
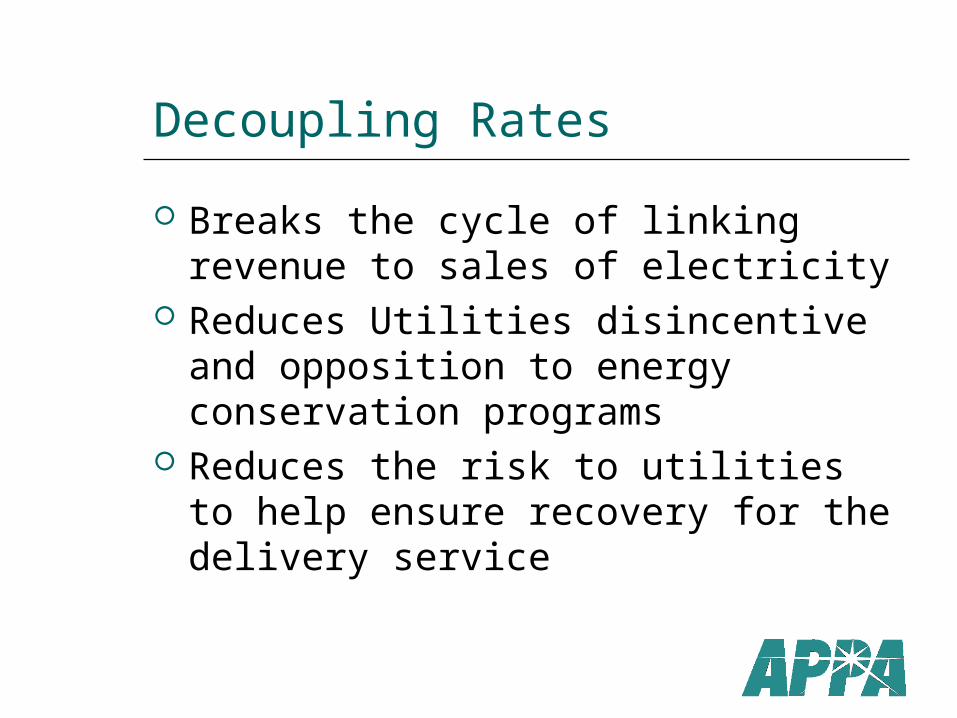
Decoupling Rates
Breaks the cycle of linking revenue to sales of electricity
Reduces Utilities disincentive and opposition to energy conservation programs
Reduces the risk to utilities to help ensure recovery for the delivery service
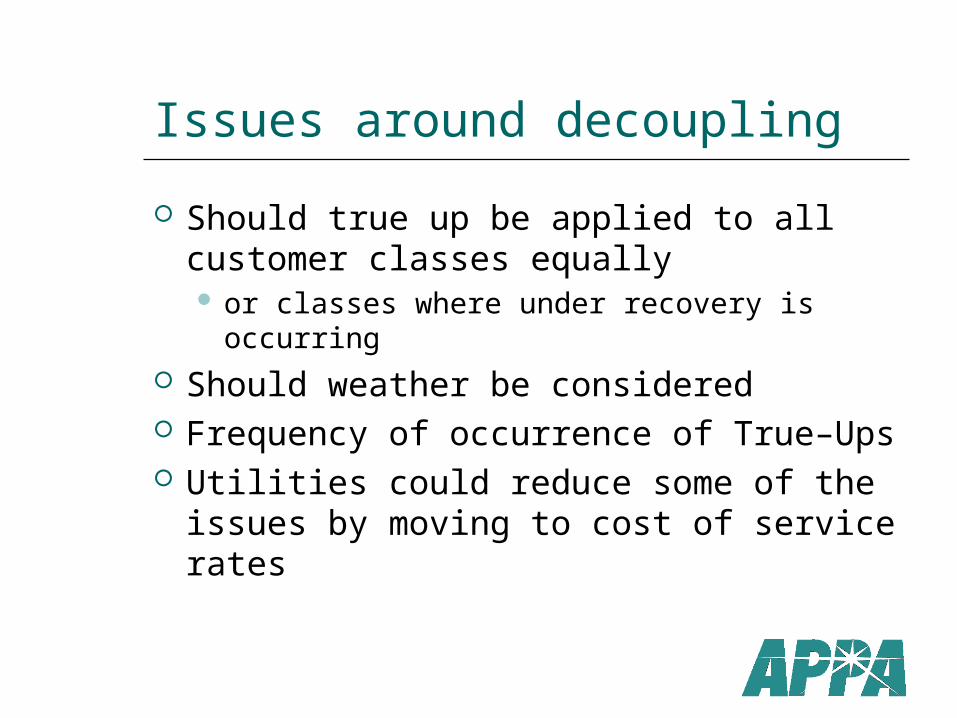
Issues around decoupling
Should true up be applied to all customer classes equally or classes where under recovery is
occurring Should weather be considered Frequency of occurrence of True–Ups Utilities could reduce some of the
issues by moving to cost of service rates
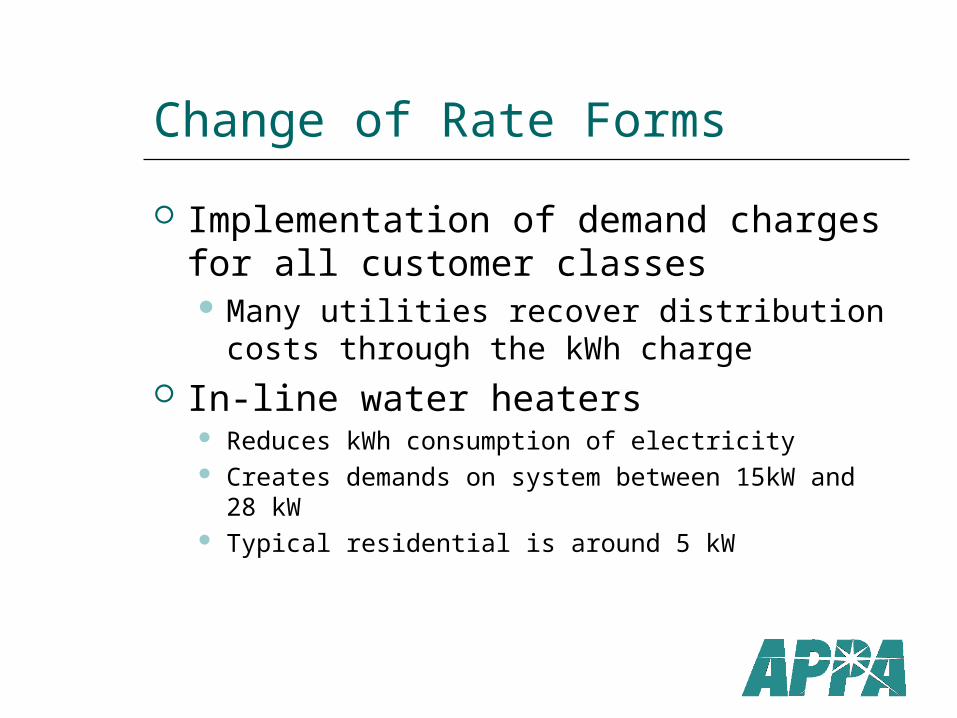
Change of Rate Forms
Implementation of demand charges for all customer classes Many utilities recover distribution costs
through the kWh charge In-line water heaters
Reduces kWh consumption of electricity Creates demands on system between 15kW and
28 kW Typical residential is around 5 kW
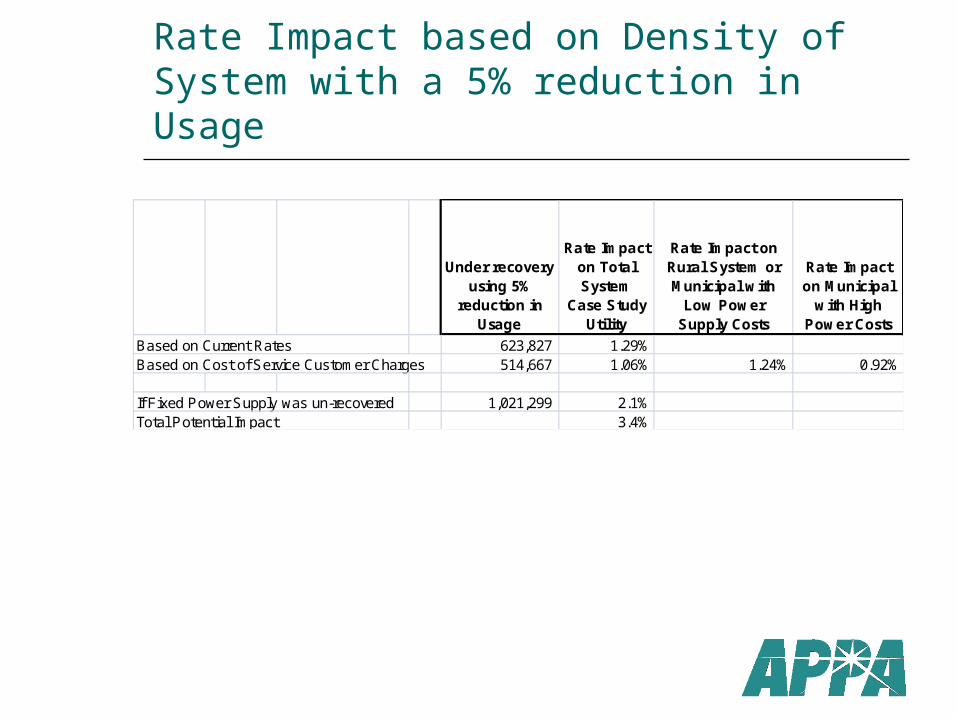
Rate Impact based on Density of System with a 5% reduction in Usage
Under recovery using 5%
reduction in Usage
Rate Impact on Total System
Case Study Utility
Rate Impact on Rural System or Municipal with
Low Power Supply Costs
Rate Impact on Municipal
with High Power Costs
Based on Current Rates 623,827 1.29%Based on Cost of Service Customer Charges 514,667 1.06% 1.24% 0.92%
If Fixed Power Supply was un-recovered 1,021,299 2.1%Total Potential Impact 3.4%
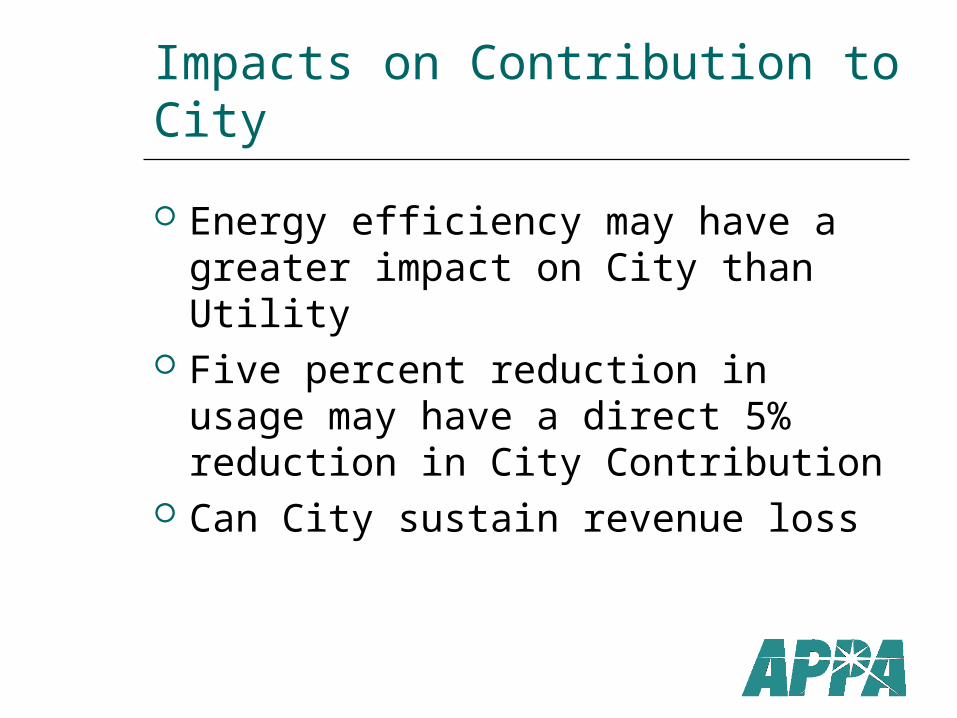
Impacts on Contribution to City
Energy efficiency may have a greater impact on City than Utility
Five percent reduction in usage may have a direct 5% reduction in City Contribution
Can City sustain revenue loss
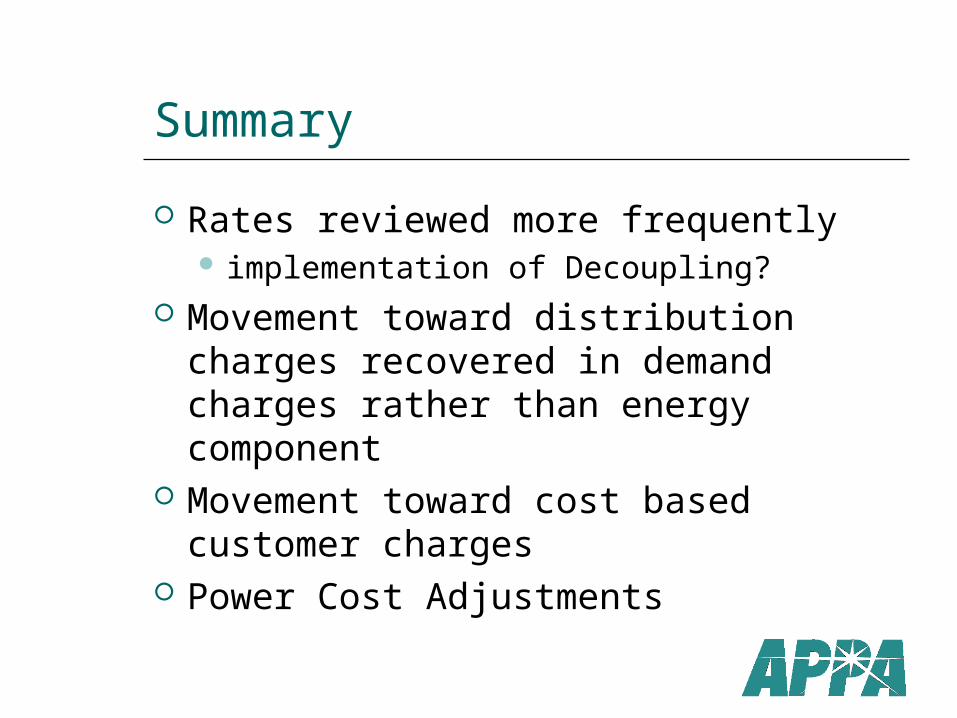
Summary
Rates reviewed more frequently implementation of Decoupling?
Movement toward distribution charges recovered in demand charges rather than energy component
Movement toward cost based customer charges
Power Cost Adjustments


![INDEX 0269 [globalgenealogy.com]globalgenealogy.com/countries/canada/ontario/eastern-ontario/... · BEAUCHAMP, Yvon Gerard 0216 BERTRAND, Rose Delima 0093 BEAUCHAMP, Yvonne 0084A](https://img.pdfslide.us/doc/110x75/5b9b79ef09d3f2d06f8cf723/index-0269-beauchamp-yvon-gerard-0216-bertrand-rose-delima-0093-beauchamp.jpg)