Embed Size (px)
Citation preview

Rare EarthsRare EarthsWE TOUCH THEM EVERYDAY
Investor Presentation
May 2011May 2011
For
per
sona
l use
onl
y
DisclaimerDisclaimer
This Presentation has been prepared by Lynas Corporation Limited (ABN 27 009 066 648) (Lynas or the Company). This Presentation contains summary information about Lynas and its subsidiaries (Lynas Group) and their activities current as at the date of this Presentation The information in this Presentation is of general background and does not purport to be complete or to comprise all the information that a shareholder or potential investoractivities current as at the date of this Presentation. The information in this Presentation is of general background and does not purport to be complete or to comprise all the information that a shareholder or potential investor in Lynas may require in order to determine whether to deal in Lynas shares. It should be read in conjunction with Lynas Group’s other periodic and continuous disclosure announcements lodged with the Australian Securities Exchange (ASX), which are available at www.asx.com.au. This document is not a prospectus or a product disclosure statement under the Corporations Act (Cth) 2001 (Corporations Act) and has not been lodged with the Australian Securities and Investments Commission (ASIC).Not investment or financial product adviceThis Presentation is for information purposes only and is not financial product or investment advice or a recommendation to acquire Lynas shares and has been prepared without taking into account the objectives, financial situation or needs of individuals. Before making an investment decision, prospective investors should consider the appropriateness of the information having regard to their own objectives, financial situation and needs and seek financial, legal and taxation advice appropriate to their jurisdiction. Lynas is not licensed to provide financial product advice in respect of Lynas shares. Cooling off rights do not apply to the acquisition of Lynas shares.Financial dataAll dollar values are in Australian dollars (A$) unless stated otherwise and financial data is presented within the financial year end of 30 June 2010 unless stated otherwise. Any pro forma historical financial information included in this Presentation does not purport to be in compliance with Article 11 of Regulation S-X of the rules and regulations of the US Securities and Exchange Commission.Past performancePast performance information given in this Presentation is given for illustrative purposes only and should not be relied upon as (and is not) an indication of future performance.Future performanceThis Presentation contains certain “forward-looking statements”. The words “expect”, “should”, “could”, “may”, “will, “predict”, “plan”, “scenario”, “forecasts”, “anticipates” and other similar expressions are intended to identify forward-looking statements. Indications of, and guidance on, future earnings and financial position and performance are also forward-looking statements. Forward-looking statements, opinions and estimates provided in this Presentation are based on assumptions and contingencies which are subject to change without notice, as are statements about market and industry trends, which are based on interpretations of current market conditions. Such forward-looking statements including projections, guidance on future earnings and estimates are provided as a general guide only and should not be relied upon as an indication or guarantee of future performance. There can be no assurance that actual outcomes will not differ materially from these forward-looking statements.Investment Risk and other risksAn investment in Lynas shares is subject to investment and other known and unknown risks, some of which are beyond the control of Lynas Group, including risk factors associated with the industry in which Lynas Group operates, such as: nature of mineral exploration and production; mineral and ore reserves; construction risks; progressing risks; project developments; market price and demand risk; credit and market risks; regulatory, political and environmental risks; tax and other risks generally relating to equity investment.political and environmental risks; tax and other risks generally relating to equity investment.Not an offerThis Presentation does not constitute an offer to sell, or the solicitation of an offer to buy, any securities in the United States. The securities to be offered and sold in the equity raising mentioned herein have not been, and will not be, registered under the U.S. Securities Act of 1933 or the securities laws of any state or other jurisdiction of the United States, and may not be offered or sold in the United States unless the securities are registered under the Securities Act or pursuant to an exemption from, or in a transaction not subject to, registration.
2
For
per
sona
l use
onl
y
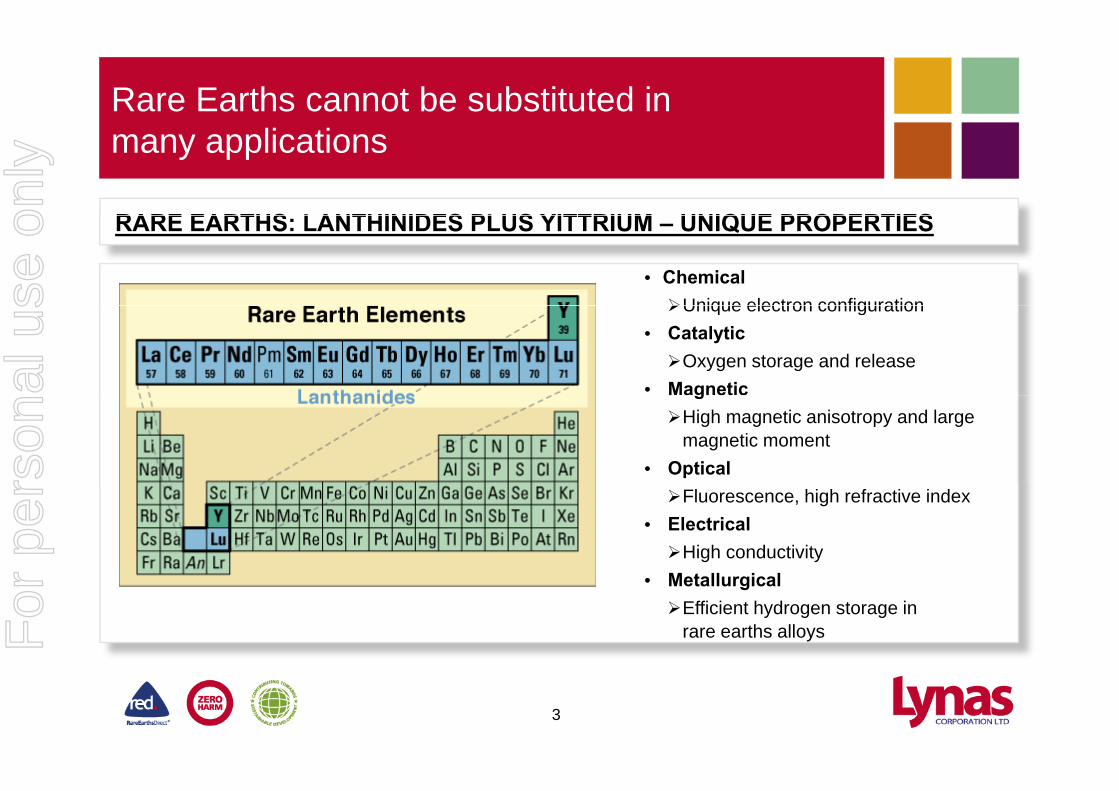
Rare Earths cannot be substituted in many applications
RARE EARTHS LANTHINIDES PLUS YITTRIUM UNIQUE PROPERTIES
• ChemicalUnique electron configuration
RARE EARTHS: LANTHINIDES PLUS YITTRIUM – UNIQUE PROPERTIES
Unique electron configuration• CatalyticOxygen storage and release
• MagneticgHigh magnetic anisotropy and large
magnetic moment• OpticalFluorescence, high refractive index
• ElectricalHigh conductivityM t ll i l• MetallurgicalEfficient hydrogen storage in
rare earths alloys
3
For
per
sona
l use
onl
y

Rare Earths underpin new materials technology required to sustain the needs of today’s society
Energy efficiency through Smaller yet more powerfulEnvironmental protectionEnergy efficiency through lower consumption
Smaller yet more powerful digital technology
Environmental protection through lower emissions
• Wind turbine• Compact Fluorescent Lights • Flat panel displaysWind turbine • Auto catalytic converter• Diesel additives
Compact Fluorescent Lights• Hybrid vehicle• Weight reduction in cars
• Disk drives• Digital cameras
4
For
per
sona
l use
onl
y
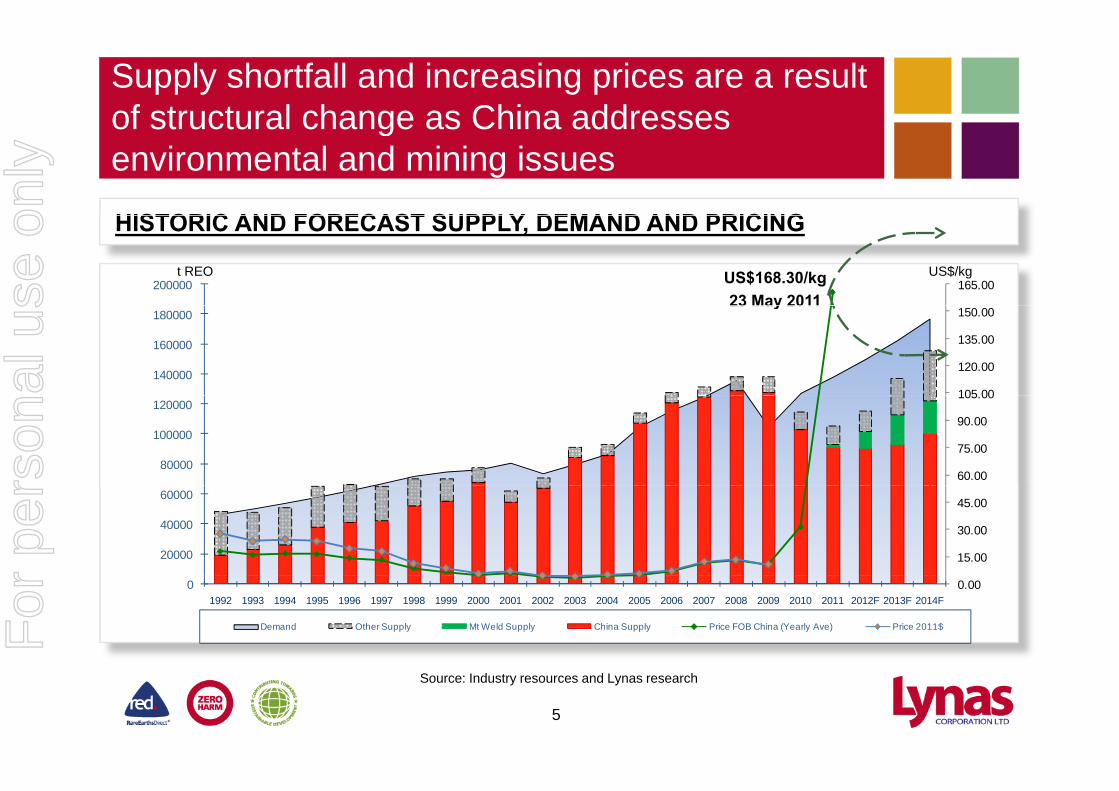
Supply shortfall and increasing prices are a result of structural change as China addressesof structural change as China addresses environmental and mining issues
HISTORIC AND FORECAST SUPPLY DEMAND AND PRICING
165.00200000
HISTORIC AND FORECAST SUPPLY, DEMAND AND PRICING
US$168.30/kg23 May 2011
t REO US$/kg
105 00
120.00
135.00
150.00
140000
160000
18000023 May 2011
60.00
75.00
90.00
105.00
80000
100000
120000
15.00
30.00
45.00
20000
40000
60000
0.0001992 1993 1994 1995 1996 1997 1998 1999 2000 2001 2002 2003 2004 2005 2006 2007 2008 2009 2010 2011 2012F 2013F 2014F
Demand Other Supply Mt Weld Supply China Supply Price FOB China (Yearly Ave) Price 2011$
5
Source: Industry resources and Lynas research
For
per
sona
l use
onl
y
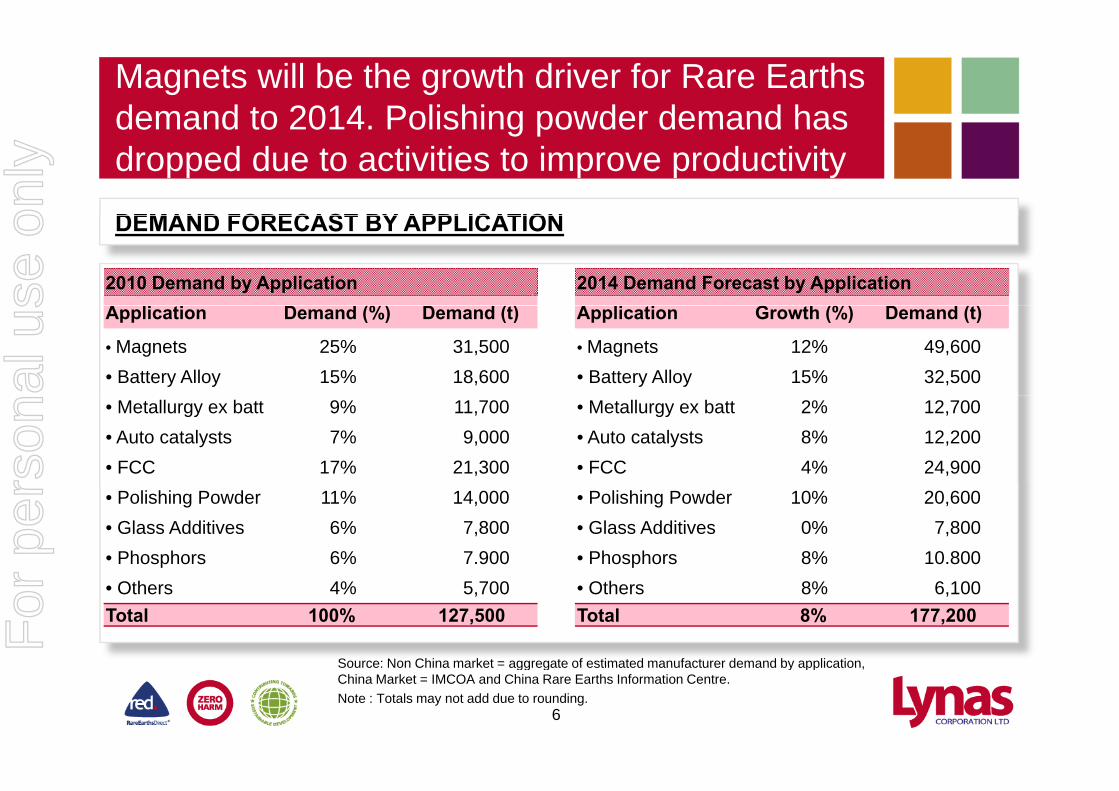
Magnets will be the growth driver for Rare Earths demand to 2014. Polishing powder demand hasdemand to 2014. Polishing powder demand has dropped due to activities to improve productivity
DEMAND FORECAST BY APPLICATIONDEMAND FORECAST BY APPLICATION
2010 Demand by ApplicationA li i D d (%) D d ( )
2014 Demand Forecast by ApplicationA li i G h (%) D d ( )Application Demand (%) Demand (t)
• Magnets 25% 31,500• Battery Alloy 15% 18,600
Application Growth (%) Demand (t)
• Magnets 12% 49,600• Battery Alloy 15% 32,500
• Metallurgy ex batt 9% 11,700 • Auto catalysts 7% 9,000• FCC 17% 21,300
• Metallurgy ex batt 2% 12,700 • Auto catalysts 8% 12,200• FCC 4% 24,900
• Polishing Powder 11% 14,000• Glass Additives 6% 7,800• Phosphors 6% 7.900
• Polishing Powder 10% 20,600• Glass Additives 0% 7,800• Phosphors 8% 10.800
Source: Non China market = aggregate of estimated manufacturer demand by application
• Others 4% 5,700Total 100% 127,500
• Others 8% 6,100Total 8% 177,200
6
Source: Non China market = aggregate of estimated manufacturer demand by application, China Market = IMCOA and China Rare Earths Information Centre. Note : Totals may not add due to rounding.
For
per
sona
l use
onl
y

The market outside of China is growing strongly. Japan with an auto and high-tech manufacturingJapan with an auto and high tech manufacturing industry is the largest non-China market
DEMAND FORECAST, NON-CHINA REGIONS
• Japan with an automotive and high-tech f t i i d t i th l t k t
USA Demand Europe Japan & SE Asiamanufacturing industry is the largest market for Rare Earths outside of China
• Europe imports significant quantities for 70 000
80,000
90,000
100,000
p p g qautomotive catalytic converters and FCC production
• The majority of the USA demand is within40,000
50,000
60,000
70,000
• The majority of the USA demand is within the FCC industry
• The USA and EU consume significant ‐
10,000
20,000
30,000
additional amounts of Rare Earths within finished products manufactured in China and Japan Source: Lynas research
‐
2010 2011 2012 2013 2014 2015
7
For
per
sona
l use
onl
y

China is a strong growth market, driven by clean-h d hi h h i d i hi Chitech and high-tech industry within China
CHINA DEMAND 1990 to 2009 CHINA FORECAST DEMAND 2010 - 2015CHINA DEMAND 1990 to 2009(t REO)
CHINA FORECAST DEMAND 2010 - 2015(t REO)
120,000
80,000
100,000
40,000
60,000
‐
20,000
2010 2011 2012 2013 2014 2015
Source: CSRE, Critical Metals Investment Summit, Vancouver, Canada Jan 21, 2011
Source: IMCOA and China Rare Earths Information Centre
8
For
per
sona
l use
onl
y
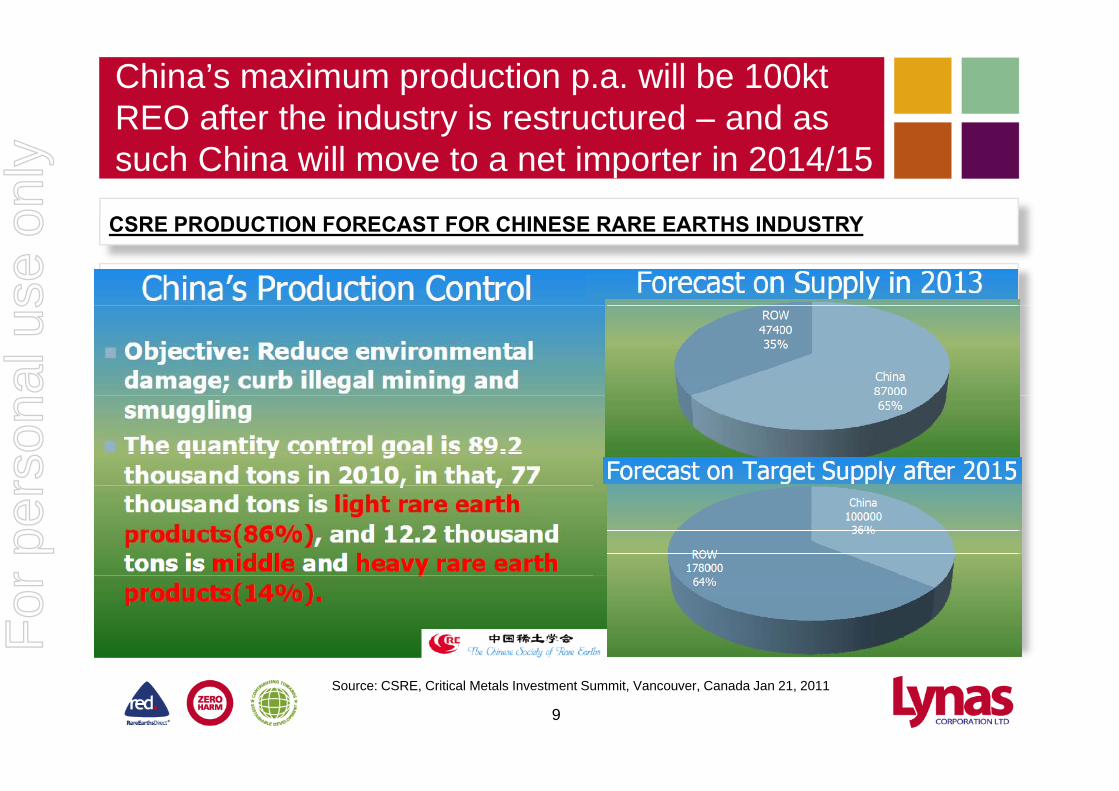
China’s maximum production p.a. will be 100kt REO after the industry is restructured – and asREO after the industry is restructured and as such China will move to a net importer in 2014/15
CSRE PRODUCTION FORECAST FOR CHINESE RARE EARTHS INDUSTRY
9
Source: CSRE, Critical Metals Investment Summit, Vancouver, Canada Jan 21, 2011
For
per
sona
l use
onl
y

China aims to improve “return on resources” as ll ti l t R t f W ld lwell as stimulate Rest of World supply
CHINESE POLICY FOR THE RARE EARTHS INDUSTRYCHINESE POLICY FOR THE RARE EARTHS INDUSTRY
100000
Ionic Clays
Production Quota (Tonnes REO contained within concentrate) • 1H 2011 Export Quota 14,446t
0
20000
40000
60000
80000
2004 2005 2006 2007 2008 2009 2010
Ionic Clays
Sichuan
Baotou
• Chinese Government Rare Earths new policy paper expected soon
20 000
40,000
60,000
80,000Foreign JVs
Domestic Co
Export Quota (Tonnes of Rare Earths bearing commodity product)• No prospecting or mining licences
for Rare Earths until July 2011.
0
20,000
2004 2005 2006 2007 2008 2009 2010
Export Taxes (applied to product, VAT and Quota costs)40%
Heavies
• Recognition by government of grey exports without quota drive for industrial consolidation in
‐20%
0%
20%
2004 2005 2006 2007 2008 2009 2010
Lights
All
Vat rebate
China.
10
Source: Asian Metal, Metal Pages, Lynas research.
For
per
sona
l use
onl
y

In 2010 Rare Earths supply (115kt REO), was t t i d b d d (128kt REO)outstripped by demand (128kt REO)
NON CHINESE SUPPLY SOURCESCHINESE SUPPLY SOURCES
India 3,000t Subsidiary of Indian AEA
Baotou 55,000t By product of iron ore mine
NON CHINESE SUPPLY SOURCES(2010 CAPACITY, REO)
CHINESE SUPPLY SOURCES (2010 CAPACITY, REO)
Subsidiary of Indian AEA Toyota Tsusho bought trading
firm with Japanese distributionRussia 4,000t
Limited expansion capacity
y p Moving to higher grade iron, with
lower impurities and Rare Earths Tailing facilities near capacity
Sichuan 10,000t Limited expansion capacity By product of Mg production
Recycling 1,500t Magnet swarf
, Jiangxi Copper to invest ¥1.2Bn Target to increase value added Capacity expected to increase
Ionic clay regions 35,000t Batteries – future potential
USA – Mountain Pass 3,000t Reprocessing stockpiles
y g , Reportedly 14 yrs of resource Large amount of illegal mining Government action taking effect
Recycling 3,300t
Total 11,500t
y g ,
Total 103,300t
11
Source: Industry resources and Lynas research
For
per
sona
l use
onl
y
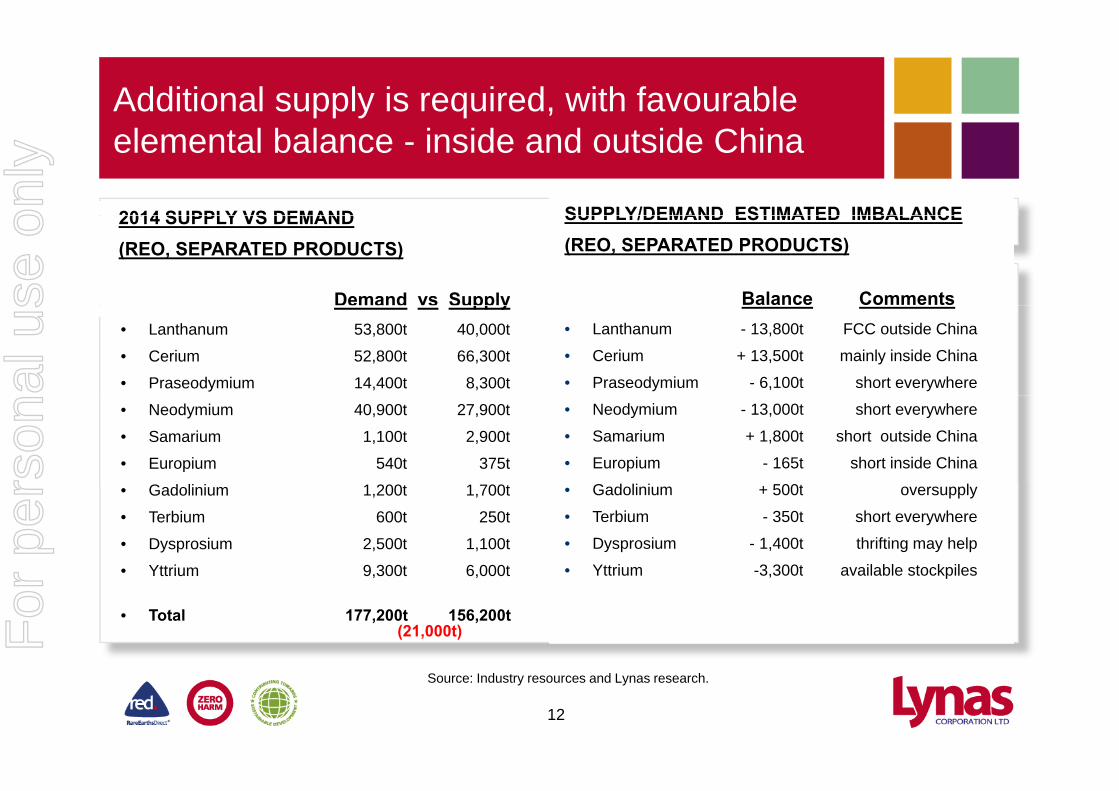
Additional supply is required, with favourableelemental balance - inside and outside China
SUPPLY/DEMAND ESTIMATED IMBALANCESUPPLY/DEMAND ESTIMATED IMBALANCE2014 SUPPLY VS DEMAND SUPPLY/DEMAND ESTIMATED IMBALANCE (REO, SEPARATED PRODUCTS)SUPPLY/DEMAND ESTIMATED IMBALANCE (REO, SEPARATED PRODUCTS)
2014 SUPPLY VS DEMAND(REO, SEPARATED PRODUCTS)
Demand vs Supply Balance Comments• Lanthanum - 13,800t FCC outside China
• Cerium + 13,500t mainly inside China
• Praseodymium - 6,100t short everywhere
• Lanthanum - 13,800t FCC outside China
• Cerium + 13,500t mainly inside China
• Praseodymium - 6,100t short everywhere
e a d s Supp y• Lanthanum 53,800t 40,000t
• Cerium 52,800t 66,300t
• Praseodymium 14,400t 8,300t• Neodymium - 13,000t short everywhere
• Samarium + 1,800t short outside China
• Europium - 165t short inside China
G d li i 500t l
• Neodymium - 13,000t short everywhere
• Samarium + 1,800t short outside China
• Europium - 165t short inside China
G d li i 500t l
• Neodymium 40,900t 27,900t
• Samarium 1,100t 2,900t
• Europium 540t 375t
G d li i 1 200t 1 700t • Gadolinium + 500t oversupply
• Terbium - 350t short everywhere
• Dysprosium - 1,400t thrifting may help
• Yttrium -3,300t available stockpiles
• Gadolinium + 500t oversupply
• Terbium - 350t short everywhere
• Dysprosium - 1,400t thrifting may help
• Yttrium -3,300t available stockpiles
• Gadolinium 1,200t 1,700t
• Terbium 600t 250t
• Dysprosium 2,500t 1,100t
• Yttrium 9,300t 6,000t Yttrium 3,300t available stockpilesYttrium 3,300t available stockpilesYttrium 9,300t 6,000t
• Total 177,200t 156,200t(21,000t)
12
Source: Industry resources and Lynas research.
For
per
sona
l use
onl
y

Lynas will offer the first new source of supply of R E th t id f Chi Q3 2011Rare Earths outside of China - Q3 2011
LYNAS VITALS AT A GLANCE
VISION: Be the leader in Rare Earths for a
LYNAS VITALS AT A GLANCE
sustainable future.
EXCHANGE: ASX Top 100; code LYC Mount Weld
SHARES: 1,701m on issue
OPTIONS: 85m strike range 11c - $2.36g
MARKET CAP: A$3.7bn as at 17 May 2011
CASH: A$205m as at 31 Mar 2011
Concentration Plant
CASH: A$205m as at 31 Mar 2011
DEBT: Nil Lynas Advanced Materials Plant
13
For
per
sona
l use
onl
y

The mine is within the Central Lanthanide Deposit (CLD) a Resource of 9 9 million tonnes at 10 7%(CLD), a Resource of 9.9 million tonnes at 10.7% for 1.1 million tonnes of contained REO
CENTRAL LANTHANIDE DEPOSIT AND DUNCAN DEPOSIT RESOURCES
Central Lanthanide Deposit &Duncan Deposit at Mount Weld Tenements
CLD & Duncan Mineral Resource (2 5% REO cut-off)
CENTRAL LANTHANIDE DEPOSIT AND DUNCAN DEPOSIT RESOURCES
p
Category Tonnes Mt
Grade %REO
Tonnes (kt) REO
(2.5% REO cut-off)
CLD 9.88 10.7 1,057
Duncan 7.62 4.8 366
Total 17.49 8.1 1,416
Current mine plan (within Central Zone Pit)
– 4.47 Mt @ 13.6% REO for 608kt REO
Low Thorium content, 44ppm ThO2/1% REO
14
For
per
sona
l use
onl
y

Mount Weld Rare Earths initial mining campaign l t l ti i j f b d tcomplete, loss-time-injury-free, on budget
MOUNT WELD STOCKPILES WITH RARE EARTH OXIDE PERCENTAGES
DUNCAN
MOUNT WELD STOCKPILES WITH RARE EARTH OXIDE PERCENTAGES
DUNCAN DEPOSIT (DD) Offices
773,000t on
8%13%
17%
stockpiles
DD CLD 26%
15%13%
20%21% Conc
DEPOSIT
20% Conc.Plant1.5km
DD
15
For
per
sona
l use
onl
y

Schematic - Concentration Plant process at Mount W ld hi h h b f ll il t l t t t dWeld, which has been fully pilot plant tested
16
For
per
sona
l use
onl
y

The Concentration Plant commenced feed of ore S t d 14 M 2011on Saturday 14 May 2011
OVERHEAD VIEW OF THE CONCENTRATION PLANT
17
For
per
sona
l use
onl
y

Views of the various sections of the plantViews of the various sections of the plant
CONCENTRATION PLANT
Ball mill and Classification Circuit View along top of Flotation Circuit
18
For
per
sona
l use
onl
y

Containers of Rare Earths concentrate will be t k d t F tl f hi i t M l itrucked to Fremantle for shipping to Malaysia
• Mount Weld to Fremantle = 1000kmMount Weld to Fremantle 1000km
19
For
per
sona
l use
onl
y

Gebeng, Malaysia, has exceptional infrastructure i d f R E th ti f ilitrequired for a Rare Earths separation facility
PROCESSING HUB WITH EXCEPTIONAL INFRASTRUCTUREPROCESSING HUB WITH EXCEPTIONAL INFRASTRUCTURE
Gebeng
INDUSTRIAL INFRASTRUCTURE Energy, chemicals, water, industrial land
GebengIndustrial Estate, East Coast
KNOWLEDGE INFRASTRUCTURE Engineering, trade skills and services
Malaysia
GOVERNMENT INFRASTRUCTURE Including FDI incentives (12 years tax exemption for pioneer status)(12 years tax exemption for pioneer status)
20
For
per
sona
l use
onl
y

Schematic - Lynas Advanced Materials Plant core hi h t i d t t h lprocess, which uses mature industry technology
21
For
per
sona
l use
onl
y
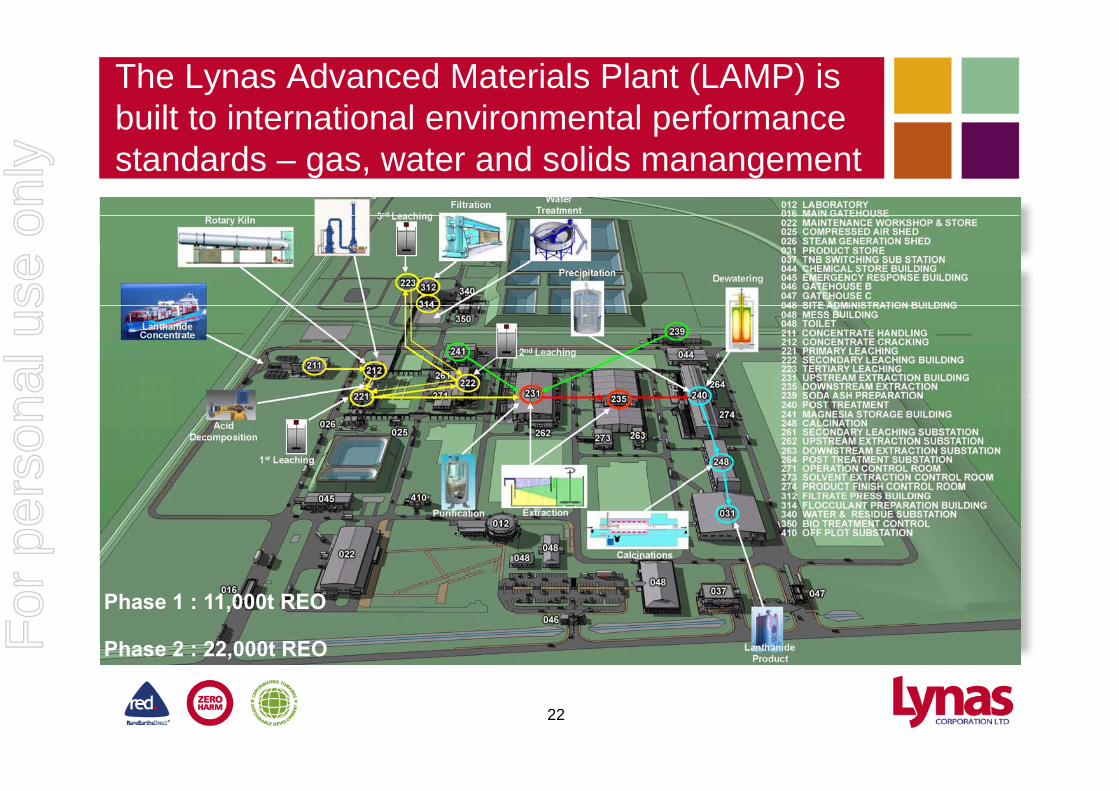
The Lynas Advanced Materials Plant (LAMP) is built to international environmental performancebuilt to international environmental performance standards – gas, water and solids manangement
Phase 1 : 11,000t REO
Phase 2 : 22,000t REO
22
For
per
sona
l use
onl
y

The Lynas Advanced Materials Plant (LAMP) is 0 8k id (N S) d 1 4 k l (E W)0.8km wide (N-S) and 1.4 km long (E-W)
COLLAGE OVERVIEW OF LYNAS ADVANCED MATERIAL PLANT SITE FEB ‘11COLLAGE OVERVIEW OF LYNAS ADVANCED MATERIAL PLANT SITE – FEB ‘11
Post Treatment
23
For
per
sona
l use
onl
y

Piping and electrical installation has commenced d i t ll ti f i t i iand installation of equipment is ongoing
C ki (R t Kil ) Gas TreatmentCracking (Rotary Kiln) Gas Treatment
Secondary LeachingSecondary LeachingPrimary Leaching
24
For
per
sona
l use
onl
y

The Lynas Advanced Materials Plant (LAMP) is h d l d t b l t i S t b 2011scheduled to be complete in September 2011
Upstream and Downstream Extractionp
Post Treatment Tunnel Furnaces
25
For
per
sona
l use
onl
y
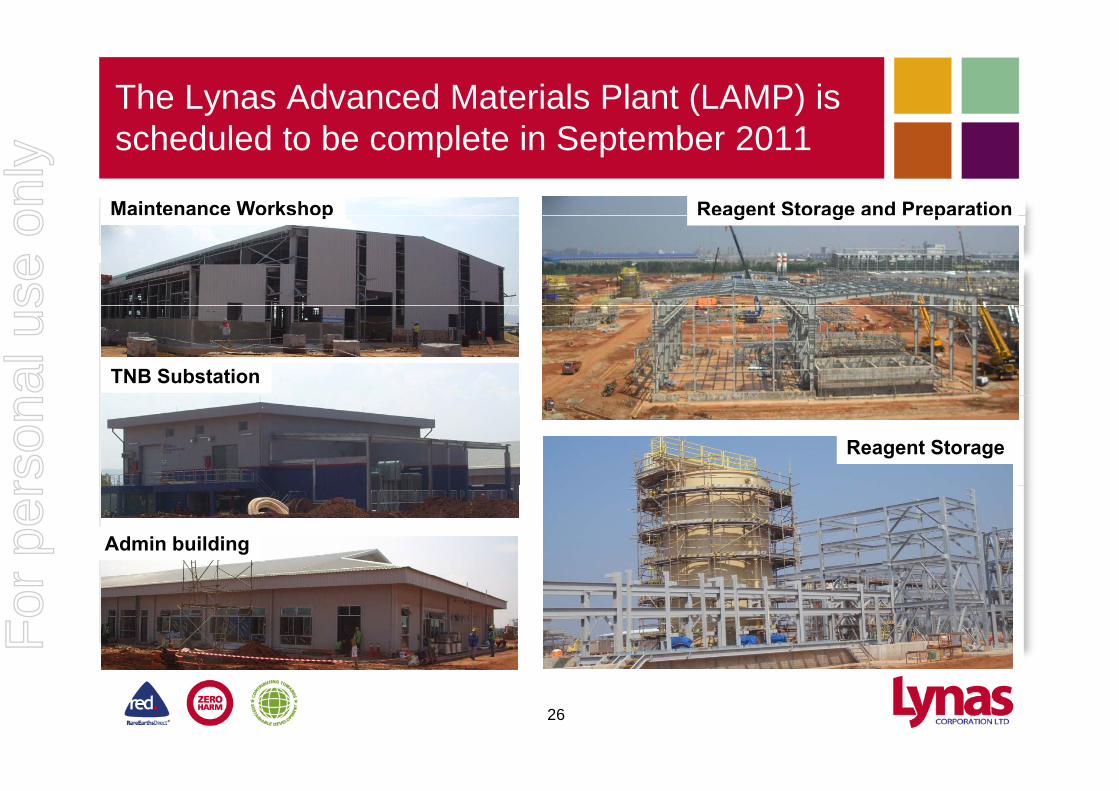
The Lynas Advanced Materials Plant (LAMP) is h d l d t b l t i S t b 2011scheduled to be complete in September 2011
Maintenance Workshop Reagent Storage and Preparationp g S g p
TNB Substation
Reagent Storage
Admin building
26
For
per
sona
l use
onl
y
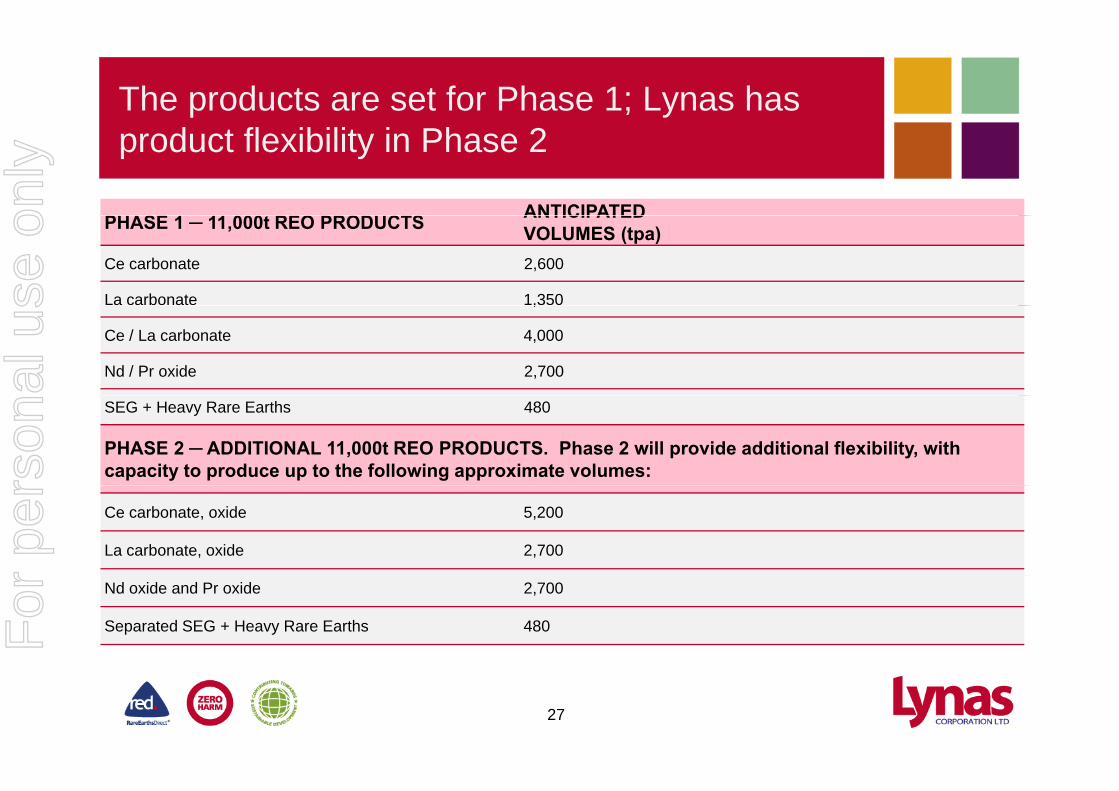
The products are set for Phase 1; Lynas has product flexibility in Phase 2
PHASE 1 11 000t REO PRODUCTS ANTICIPATEDPHASE 1 ─ 11,000t REO PRODUCTS ANTICIPATEDVOLUMES (tpa)
Ce carbonate 2,600
La carbonate 1,350 ,
Ce / La carbonate 4,000
Nd / Pr oxide 2,700
SEG + Heavy Rare Earths 480
PHASE 2 ─ ADDITIONAL 11,000t REO PRODUCTS. Phase 2 will provide additional flexibility, with capacity to produce up to the following approximate volumes:
Ce carbonate, oxide 5,200
La carbonate, oxide 2,700
Nd oxide and Pr oxide 2,700
Separated SEG + Heavy Rare Earths 480
27
For
per
sona
l use
onl
y

Approval for on-site storage received, however applications for synthetic mineral products areapplications for synthetic mineral products are identified and development work is underway.
SYNTHETIC MINERAL PRODUCTSSYNTHETIC MINERAL PRODUCTS
Target Application* Development StatusPl t b d
SourceD lf i ti M l i i h t
SYNTHETIC GYPSUM
•Plasterboard•Gypsum fibreboard•Cement additive
•Desulfurisationof the flue gases
•Malaysia is short gypsum•Synthetic gypsum imported•LOIs under negotiation
MAGNESIUM-RICHSYNTHETIC
GYPSUM
•Magnesium GypsumFertilizer Booster(MGFB)
•Water treatment plant, water neutralisation
•Field trials complete•Results very positive•Commercialisation LOIGYPSUM
IRON PHOSPHO
•Concrete formulations•Road sub-base phospho-
•Leaching stages of LAMP, non-
Commercialisation LOI under discussion
•Successfully tested in concretePHOSPHO-
GYPSUM•Road sub-base, phospho-gypsum used in US,Europe, Middle East, Africa
of LAMP, nonrare earths remain as solids
concrete •Road sub-base development program underway
28
* All applications will require approval from the DoE and AELB in Malaysia upon LAMP producing Synthetic Mineral Products
For
per
sona
l use
onl
y
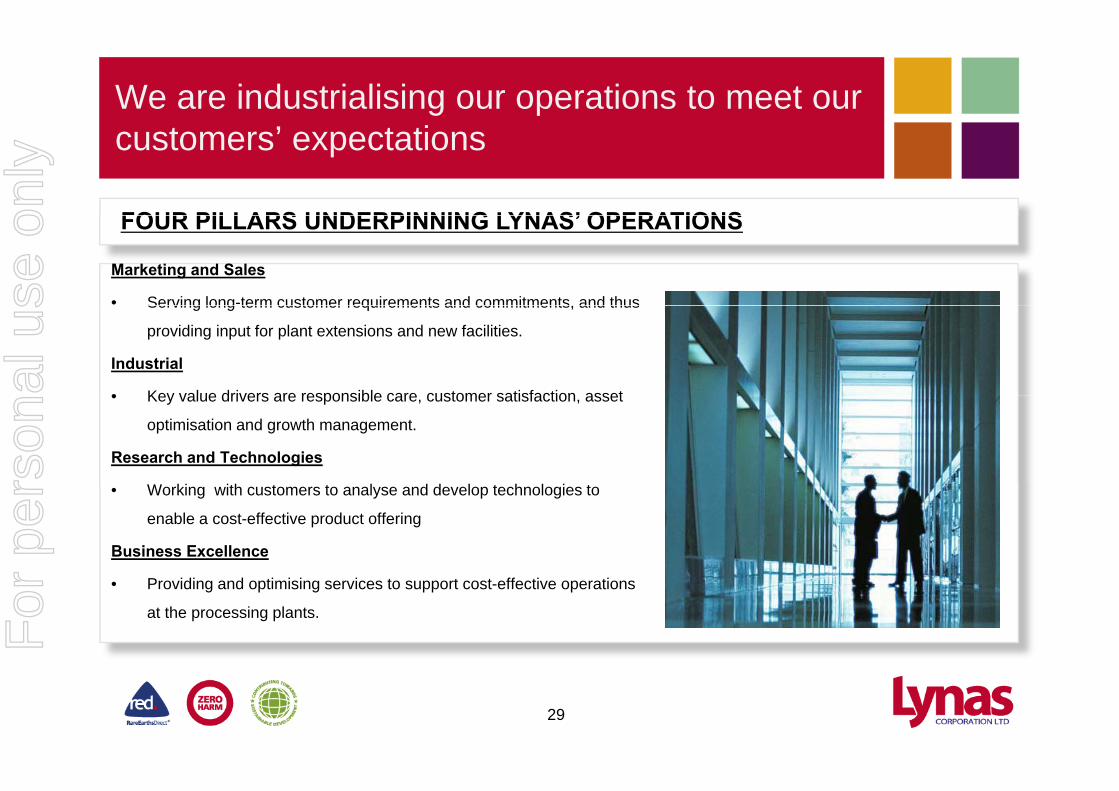
We are industrialising our operations to meet our t ’ t ticustomers’ expectations
FOUR PILLARS UNDERPINNING LYNAS’ OPERATIONS
Marketing and Sales
• Serving long-term customer requirements and commitments and thus
FOUR PILLARS UNDERPINNING LYNAS’ OPERATIONS
Serving long term customer requirements and commitments, and thus
providing input for plant extensions and new facilities.
Industrial
• Key value drivers are responsible care customer satisfaction asset• Key value drivers are responsible care, customer satisfaction, asset
optimisation and growth management.
Research and Technologies
W ki ith t t l d d l t h l i t• Working with customers to analyse and develop technologies to
enable a cost-effective product offering
Business Excellence
• Providing and optimising services to support cost-effective operations
at the processing plants.
29
For
per
sona
l use
onl
y

Budgeted Phase 1 construction costs are fully funded
CONSTRUCTION AND OTHER CAPITAL COSTS TOTALA$mm
TO 31/1/11A$mm
FUTURE SPENDA$mmA$mm A$mm A$mm
Mount Weld Concentration Plant 70.86 56.36 14.50
Lynas Advanced Materials Plant, Malaysia 237.32 91.39 145.93
Engineering and Project Management Costs 137.81 107.81 30.50
Other Capex including Land in Malaysia 65.24 48.95 16.29
Contingency 28.60 - 28.60
Total Capital Costs1 $539.33 $304.51 $235.82
SPEND TO FIRST PRODUCTIONPRODUCTION RAMP-UP COSTS
SPEND TO FIRST PRODUCTION
A$mm
Mount Weld Concentration Plant 14.71
Lynas Advanced Materials Plant, Malaysia 20.32y , y
Finance, Admin, Marketing, Technical and Corporate Overheads 11.24
Total Operating Costs1 $46.27
TOTAL BUDGETED CASH REQUIREMENTS TO START OF PRODUCTION1 $282.09
Cash on Hand 31 January 2011 264.42
OCBC Working Capital Facility 21.30
TOTAL CASH PLUS WORKING CAPITAL FACILITY $285.72
HEADROOM INCLUDING CONTINGENCY $32 23
30
HEADROOM INCLUDING CONTINGENCY $32.231 Totals may not add up to sum of individual line items due to rounding
For
per
sona
l use
onl
y

The Strategic Alliance with Sojitz shall provide a stable and long term source of supply for thea stable and long term source of supply for the Japanese market
LYNAS, SOJITZ AND JOGMEC HAVE EXECUTED DEFINITIVE AGREEMENTS
Sojitz – LynasStrategic AllianceStrategic Alliance
Financing Agreement
Availability Agreement
Distribution & Agency Agreement
• Funding for Phase 2 expansion to 22,000t• US$225M loan from JOGMEC and Sojitz• 6 year loan at LIBOR plus 2.75%, principal
g
• Minimum 8,500t (+/-500t) per annum
• Allocated to Japanese
• Joint marketing by Sojitz and Lynas
• Customer commitment y p , p prepay-ments begin in year 4
• US$25M subscription for new fully paid ordinary shares in Lynas at a price of A$2.12 per share
Customers• 10 year allocation
will determine Phase 2 products suite
• Professional organisation, speed, understanding of per share
• Conditions to be satisfied during May 2011
p , grequirements, transparent communications
31
For
per
sona
l use
onl
y

Lynas simultaneously completed an institutional placement and announced a Share Purchaseplacement and announced a Share Purchase Plan for Lynas shareholders
ADDITIONAL EQUITY RAISING
• $55M Institutional Placement Fully underwritten institutional placement raising approximately A$55 million at an issue price of A$2.07 per share.
ADDITIONAL EQUITY RAISING
The issue price represented a discount of 2.2% to the 5-day VWAP• $20M Share Purchase Plan (SPP)
A$20 million SPP at $2.05 per share.
New Proceeds (A$mm)
Proceeds from Loan Facility
Proceeds from JOGMEG/Sojitz share subscription
Proceeds from Institutional Placement
Proceeds from Share Purchase Plan
$225.01
$25.02
$55.0
$20.0
$Total $325.0
1 & 2 This amount is calculated by reference to an exchange rate of US$1 = A$1. The exchange rate as at the date of settlement may be a different rate and as such the A$ amount of funds may change
32
For
per
sona
l use
onl
y

Summary of estimated capital and operating
Construction & other capital costs Total (A$mm) Capex spent to Future capex
costs to fund Phase 2 of the project
p ( $ ) p pdate (A$mm)
p(A$mm)
Phase 2 plant & equipment for the Concentration Plant
Phase 2 plant & equipment for the LAMP
Ph 2 i i d j
$28.0
$148.0
$34 0
-
-
$28.0
$148.0
$34 0Phase 2 engineering and project management costs
Contingency
Other capital expenditure
Total
$34.0
$25.0
$28.4
$263.4
-
-
-
-
$34.0
$25.0
$28.4
$263.4Total $263.4 $263.4
Operational costs for Phase 1, and Phase 2 working capital & production ramp-up costs from start of Phase 1 through to start of Phase 2
Future spend (A$mm)
Concentration plant $33.4p
LAMP
HO costs, operations, finance, IT, etc
Total
$63.9
$21.0
$118.3
Total expenditure (before cash receipts from Phase 1 sales) $381.7
Note: The equipment and procurement capital costs for Phase 2 are based on the assumption of equivalent expenditures from Phase 1
33
For
per
sona
l use
onl
y

Eight customer agreements have been signed; Strategic Alliance with Sojitz to provide stableStrategic Alliance with Sojitz to provide stable supply to Japanese customers
8th Customer Agreement – Supply ContractRhodia Customer Agreement -S l C t t • Long term contract
• Product from Phase I & II
7th Customer Agreement – Supply Contract
Strategic Alliance with Sojitz Minimum of 8,500t (+/-500t)
of product distributed into Japan market
Supply Contract• >US$200M¹• Long term 10 year contract,
Phase I• Cerium Europium Terbium &
2nd Customer Agreement -Supply Contract
US$200M¹6th Customer Agreement - Supply Contract
• Multi - year contract• Product from Phase I
• Cerium, Europium, Terbium & Lanthanum
• ~US$200M¹• Long term 5 year
contract, Phase 1• Neodymium &
Praseodymium5th Customer Agreement – Letter of Intent• ~US$80M¹
- Supply Contract• Long term multiple year contract• Product from Phase I & Phase II
Praseodymium
3rd Customer Agreement - Supply Contract
• ~US$20M¹
• ~US$80M• Long term multiple year contract• Product from Phase I & Phase II
4th Customer Agreement – Supply Contract• Long term multiple year contract• Product from Phase I & Phase II
• Long term multiple year contract• Product from Phase I & Phase II
SEVEN SUPPLY CONTRACTS AND ONE LETTER OF INTENT SIGNED
34
1 Values reflect market prices at signing of contract
For
per
sona
l use
onl
y

Lynas has completed the acquisition of additional R E th i M l i Af iRare Earths resources in Malawi, Africa
K i t f K k d (KGK)
Fully permitted for operations
Key points for Kangankunde (KGK)
Inferred Resource of 107,000 tonnes REO at an average grade of 4.24% REO, with a 3.5% cut-off grade.
At a 3% REO cut off grade the resource At a 3% REO cut-off grade the resource increases to 180,000 tonnes REO and remains open at depth
Extremely low thorium levels for a Rare Earths ydeposit, 11ppm ThO2 / 1% REO
Pilot plant completed for gravity concentration process
KGK
Unassembled gravity separation concentration equipment included in sale
35
For
per
sona
l use
onl
y

Lynas now has two JORC compliant deposits, k ill f th ith K k dwork will commence forthwith on Kangankunde
Initiate an environmental management plan
The Kangankunde Carbonatite Next steps for the Kangankunde RE deposit
Undertake drilling program to provide drill core and test resource extension
Validate the concentrate production flow sheet Cracking and separation test work shall
commence on the concentrate Concentrate may be processed in Africa to
d i d th d t hi h illproduce a mixed rare earths product which will then be shipped to Malaysia for separation, or may be full processed at the Malaysian processing facility
36
For
per
sona
l use
onl
y

Lynas – online in 2011, delivering R E th l b llRare Earths globally
• Our vision is to be the leader in Rare Earths for a sustainable futurefor a sustainable future.
• We are close to realising this vision.
• Lynas will be online in 2011, delivering Rare Earths globally. This is the first new production outside of China.
• The LAMP is scheduled to come online in Q3 2011, and the production capacity of Phase 1 will be 11,000tpa REO.
• Work for Phase 2 is underway for an additional 11,000tpa REO.
37
For
per
sona
l use
onl
y
NOTENOTE
The information in this report that relates to Exploration Results, Mineral p p ,Resources or Ore Reserves is based on information compiled by Brendan Shand, who is a member of The Australasian Institute of Mining and Metallurgy. Brendan Shand is an employee of Lynas Corporation Limited. Brendan Shand has sufficient experience which is relevant to the style of mineralisation and type of deposit under consideration and to the activity which he is undertaking to qualify as a Competent Person as defined in the 2004 Edition of the ‘Australasian Code for Reporting of Exploration Results, Mineral Resources and Ore Reserves’. Brendan Shand consents to the inclusion in the report of the matters based on his information in the form and context in which it appears.
38
For
per
sona
l use
onl
y