Embed Size (px)
Citation preview
Rare-earth doped fluorides for silicon solar Rare-earth doped fluorides for silicon solar cell efficiency enhancementcell efficiency enhancement
Diana Serrano Garcia
A.Braud, P.Camy, J-L.Doualan, A.Benayad, V.Menard, R.Moncorge
CIMAP, University of Caen, France
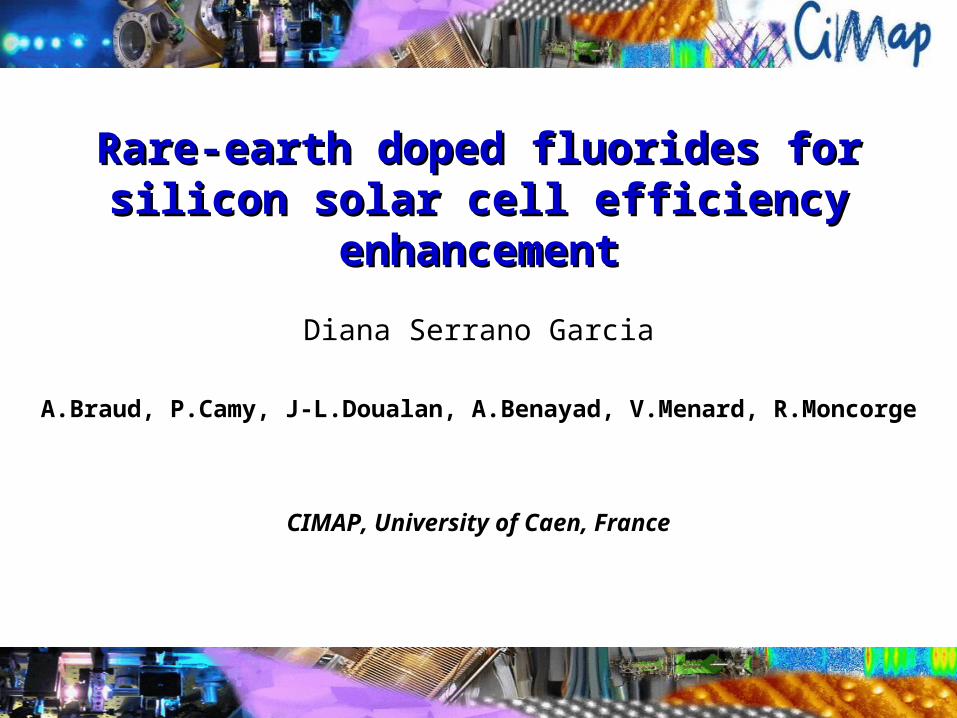
Summary
• Limitations of solar energy conversion
• Downconversion: Quantum cutting
• Experimental results and models
• Conclusion
• Quantum cutting with Rare-earth doped fluorides

Photovoltaics (PV)
- Conversion of solar energy into electricity
Silicon as the most famous semiconductor for solar cell development*
Si doped n
Si doped p+²
-
- Electron-hole pairs creation
*R. Singh; Journal of Nanophotonics, 3 (2009)

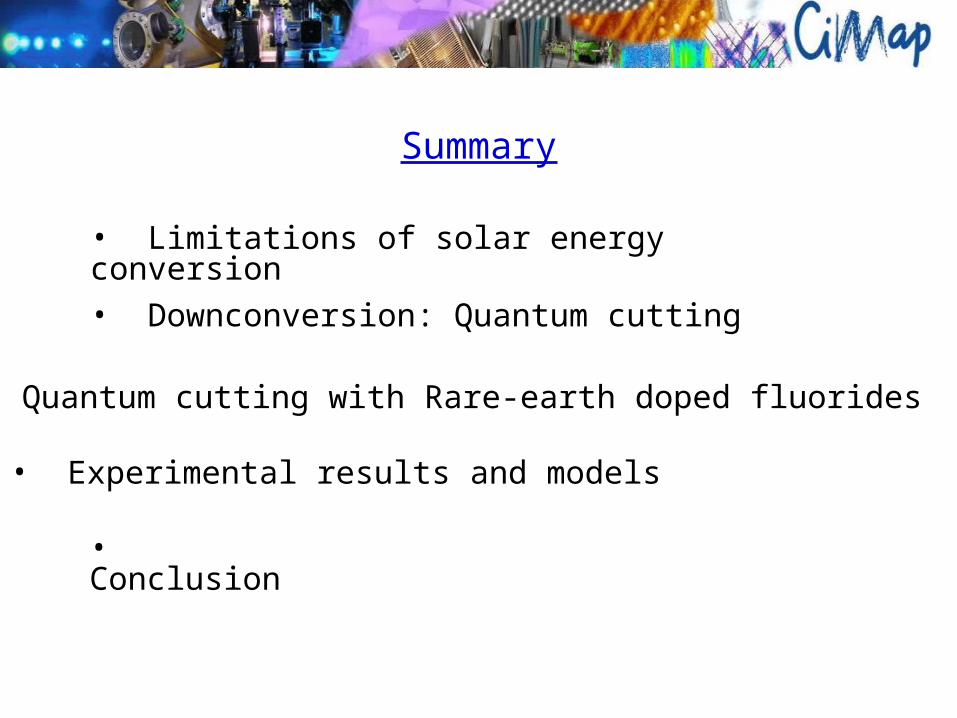
I) Silicon limitations for solar spectrum conversion
Short wavelenghts
BC
BV
Si Gap =1,12eV
E
- Energy loss due to
carrier thermalization
- Absorption of photons
h>1,12 eV
Energy lost
CB
VB
1,12eV
E
- Silicon transparent for
h<1,12 eV .
Low efficiency for Silicon solar cells (a-Si 9%,c-Si 25%*)
Silicon limitations for solar spectrum conversion
Long wavelenghts
*M.Green, Progress in Photovoltaics : Research and Applications 17, 320 (2009)
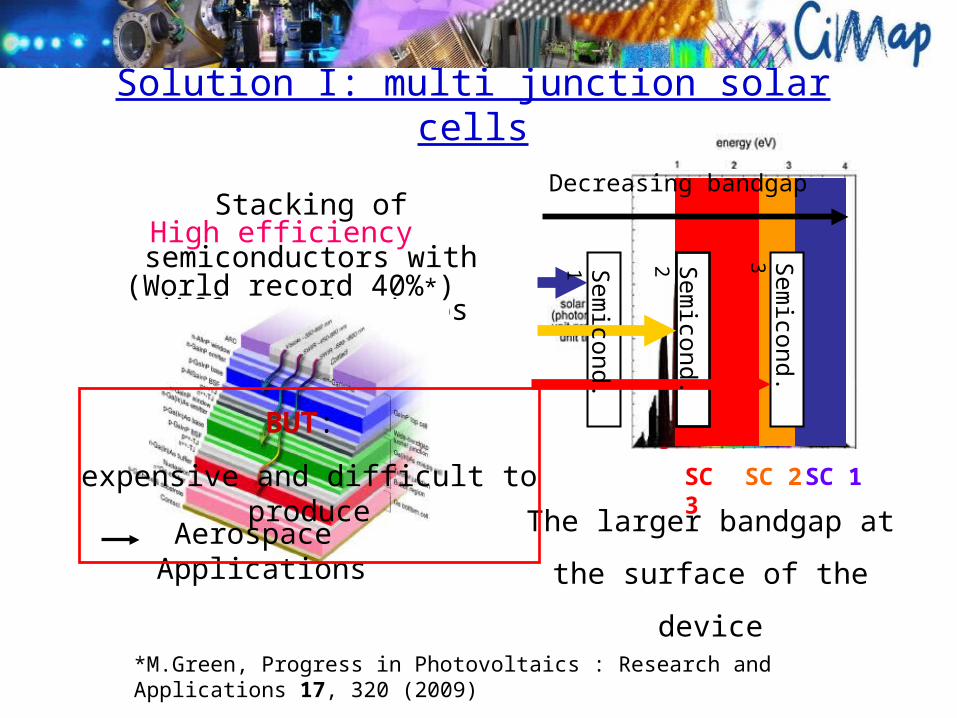
Stacking of semiconductors with
different bandgaps
SC 2 SC 1SC 3
Decreasing bandgap
Sem
icond. 1
Sem
icond. 2
Sem
icond. 3
Solution I: multi junction solar cells
The larger bandgap at the
surface of the device
BUT:
expensive and difficult to produce
Aerospace Applications
High efficiency
(World record 40%*)
*M.Green, Progress in Photovoltaics : Research and Applications 17, 320 (2009)
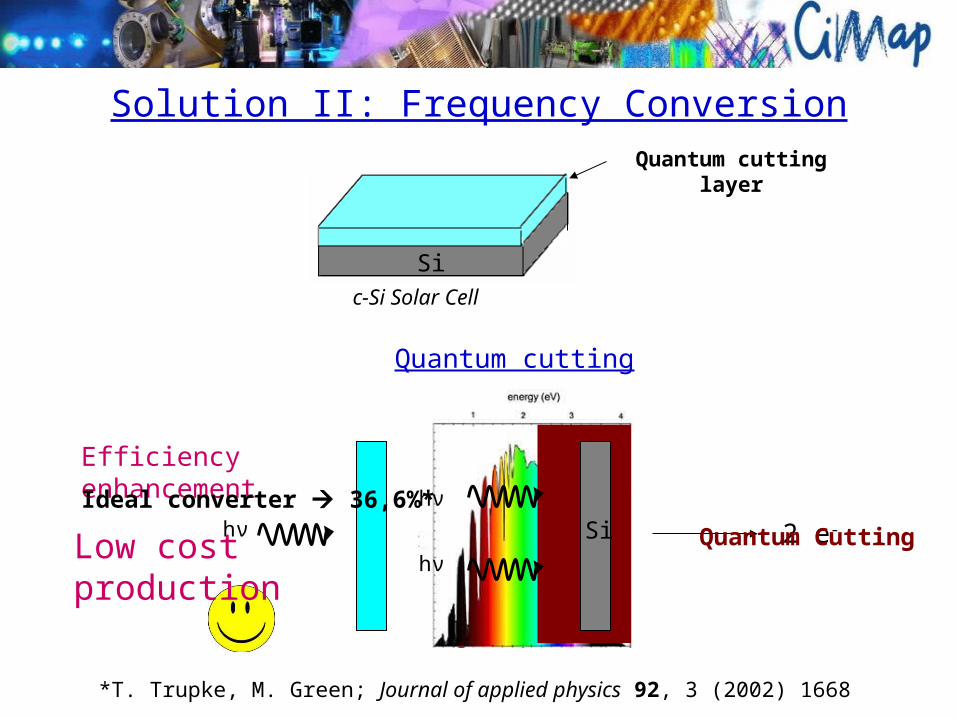
Si 2 e-
Quantum cutting
Solution II: Frequency Conversion
hν
hν
hν
Efficiency enhancement
Quantum CuttingLow cost production
*T. Trupke, M. Green; Journal of applied physics 92, 3 (2002) 1668
Ideal converter 36,6%*
c-Si Solar Cell
Si Si
Quantum cutting layer

Downconversion: Quantum cutting by energy transfer
Donor Acceptor
E
D0 A0
D1
D2
A1
Acceptor
A0
A1
D2D1 and A0A1D1D0 and A0A1
Donor excitationD0D2
Acceptor relaxationA1A0
2 photons emission
Energy transfer 1 Energy transfer 2
hv/2 hv/2
hv
Getting 2 photons from 1 photon?
1
2
From 1 photon we get 2 photons

Quantum cutting with rare-earth doped fluorides:
►Why Yb?
E~10000 cm-1
~1,2eV ~ Si Gap
Yb3+
53 H
43 F
43 H
Pr3+
23 F
63 H
33 F
41G
03 P
21 D
1
272 F
252 F
23 P
61 I
Yb3+
272 F
252 F
Donor Acceptor
Pr3+/Yb3+ system
E(3P0 – 1G4)~E(2F5/2 – 2F7/2)
E(1G4 – 3H4)~E(2F5/2 – 2F7/2)Acceptor
E
►Why Pr ?
Resonant Energy Transfer
1
2

Host matrix: Fluorides
- Low phonon energy
•High fluorescence quantum yield
- Large transparency range
Differences: RE3+ doping
Short distance between ions
Very efficient energy transfer
KY3F10 Uniform distribution of dopants
CaF2 Formation of complexes (clusters)

0,0 0,5 1,0 1,5 2,0 2,5 3,0 3,5 4,0 4,5 5,0-0,25
0,00
0,25
0,50
0,75
1,00
1,25
1,50
1,75
2,00
I Pr/I
Yb
%Yb
IPr/IYb
CaF2:Pr/Yb First energy transfer Pr Yb
Intensity ratio as a function of Yb concentration Yb
03
Pr
I
PI
Pr excitation
Increase of first transfer Pr (3P0)Yb (2F5/2) with Yb concentration
03
Pr PI
YbI53 H
43 F
43 H
Pr3+
23 F
63 H
33 F
41G
03 P
21 D
1
272 F
252 F
23 P
61 I
DonorYb3+
Acceptor
Transfer
Ytterbium emission under Pr (3P0) excitation
• Energy transfer from Pr to Yb
(%Pr constant at 0.5%)
Experimental Results
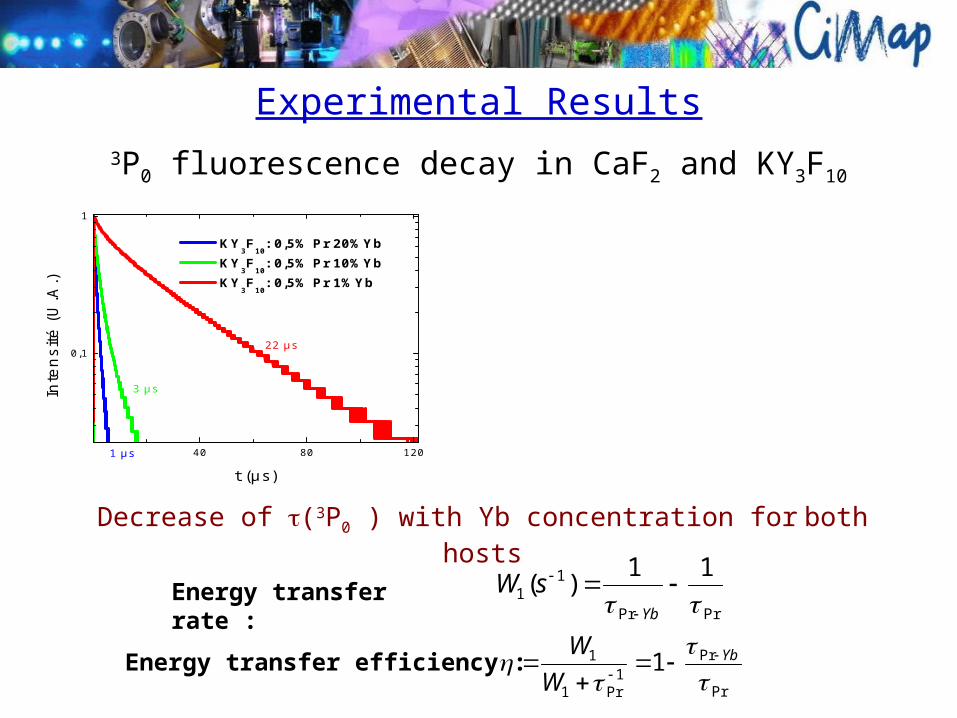
0 80 160
0,1
1
3 µs
17 µs
45 µs
82 µs
CaF2: 0,5% Pr_4% Yb
CaF2: 0,5% Pr_2% Yb
CaF2: 0,5% Pr_1% Yb
CaF2: 0,5% Pr_0,5% Yb
Inte
nsi
té (
U.A
.)
t(µs)
3P0 fluorescence decay in CaF2 and KY3F10
Decrease of (3P0 ) with Yb concentration for both hosts
Experimental Results
PrPr
11
11)(
Yb
sW
Pr
Pr1
Pr1
1 1
Yb
W
W
Energy transfer rate :
Energy transfer efficiency :
40 80 120
0,1
1
1 µs
22 µs
3 µs
Inte
nsi
té (
U.A
.)
t (µs)
KY3F
10: 0,5% Pr 20%Yb
KY3F
10: 0,5% Pr 10%Yb
KY3F
10: 0,5% Pr 1%Yb
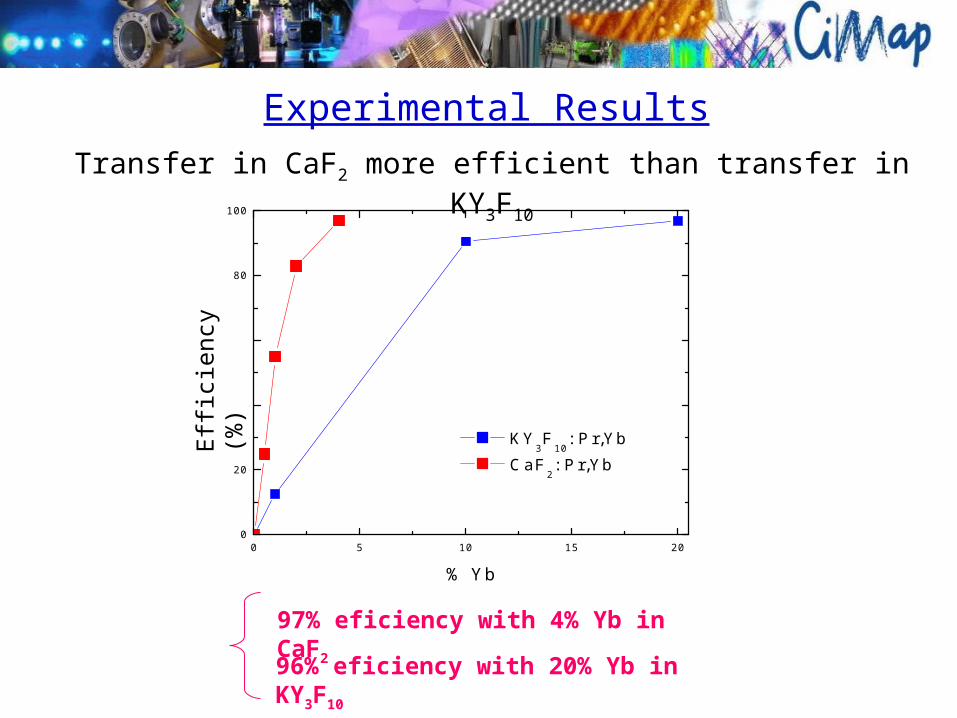
0 5 10 15 200
20
40
60
80
100
R
ende
men
t (%
)
% Yb
KY3F
10: Pr,Yb
CaF2: Pr,Yb
Experimental Results
97% eficiency with 4% Yb in CaF2
96% eficiency with 20% Yb in KY3F10
Transfer in CaF2 more efficient than transfer in KY3F10
Eff
icie
ncy
(%)
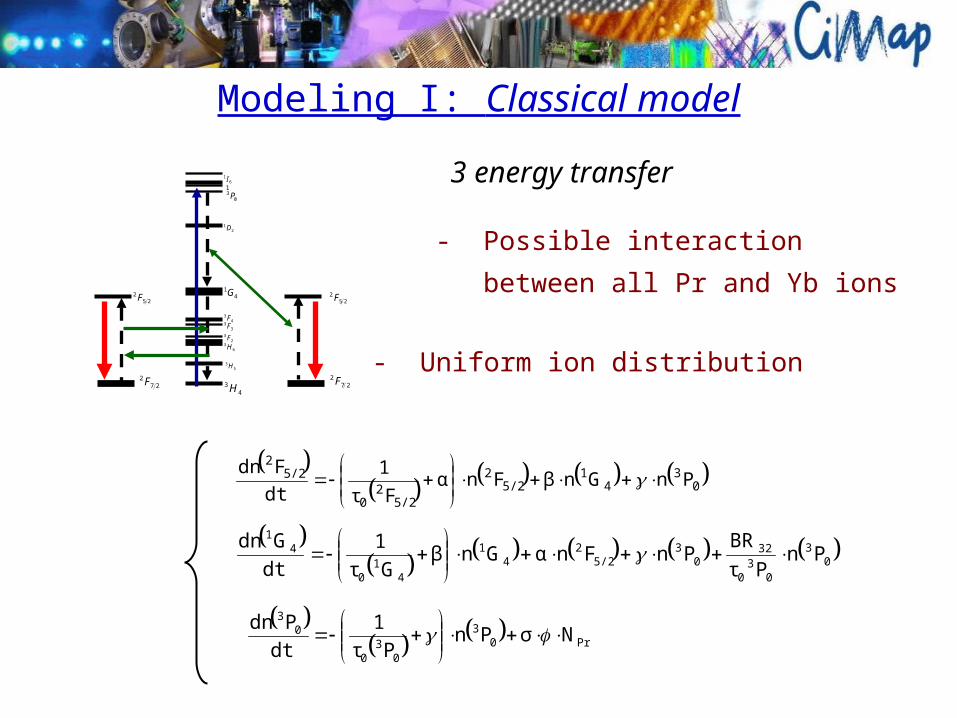
Modeling I: Classical model
3 energy transfer
0
34
15/2
2
5/22
0
5/22
PnGnβFnαFτ
1
dt
Fdn
0
3
03
0
320
35/2
24
1
41
0
41
PnPτ
BRPnFnαGnβ
Gτ
1
dt
Gdn
Pr0
3
03
0
03
NσPnPτ
1
dt
Pdn
- Possible interaction
between all Pr and Yb ions
- Uniform ion distribution53 H
43 F
43 H
23 F
63 H
33 F
41G
03 P
21 D
1
272 F
252 F
61 I
272 F
252 F
41
0
4
03
0
63132
5/22
0
22
2
Gτ
P
Pτ
PBRPβPα
Fτ
PPwp
dt
dP
03
0
531
41
0
3
5/22
0
21
1
Pτ
PBR
Gτ
P
Fτ
PPwp
dt
dP
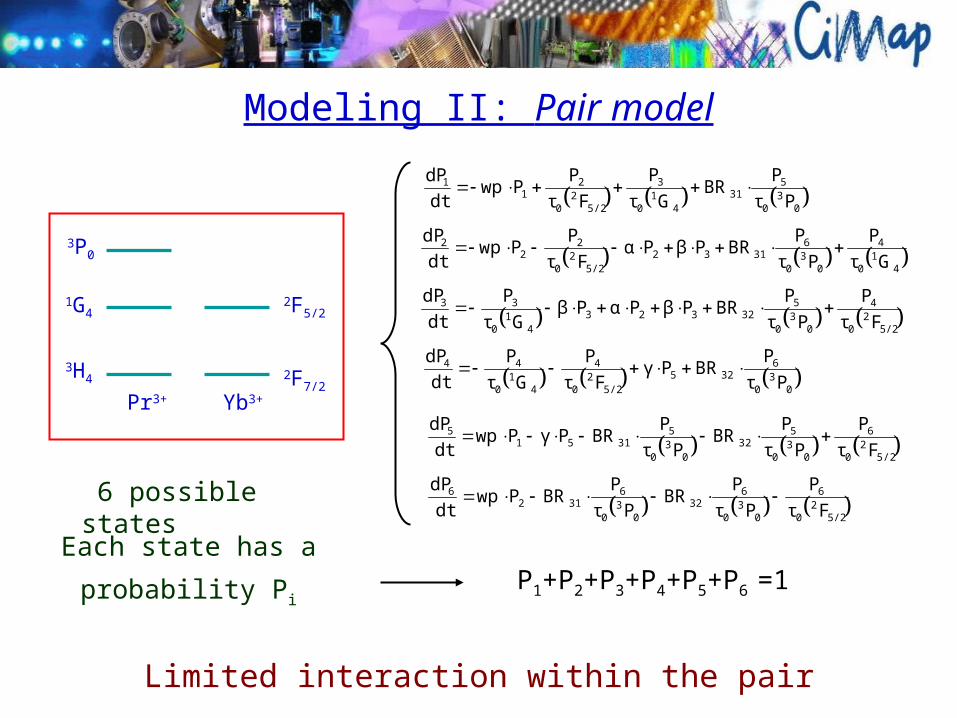
6 possible states
3H4
2F5/2
3P0
1G4
2F7/2
Pr3+ Yb3+
5/22
0
4
03
0
532323
41
0
33
Fτ
P
Pτ
PBRPβPαPβ
Gτ
P
dt
dP
03
0
6325
5/22
0
4
41
0
44
Pτ
PBRPγ
Fτ
P
Gτ
P
dt
dP
5/22
0
6
03
0
532
03
0
53151
5
Fτ
P
Pτ
PBR
Pτ
PBRPγPwp
dt
dP
5/22
0
6
03
0
632
03
0
6312
6
Fτ
P
Pτ
PBR
Pτ
PBRPwp
dt
dP
Limited interaction within the pair
P1+P2+P3+P4+P5+P6 =1
Each state has a
probability Pi
Modeling II: Pair model
Conclusion
• Possible QC with CaF2:Pr/Yb and KY3F10: Pr/Yb
• Transfer in CaF2 more efficient!
Implementation in Si solar cells
• Very efficient Pr Yb first transfer (97%)
Conclusions
New models (Three or more ions model??)

THANK YOU
for your attention!!