Embed Size (px)
Citation preview

A
p(dccf(R1boauIg©
K
1
RaDtRsafo
0d
Journal of Alloys and Compounds 455 (2008) 121–129
Rare-earth cuprates for ceramic colouring application—An investigation
Jitendra Kumar Kar a,∗, Ron Stevens b, Christopher R. Bowen b
a Carborundum Universal Limited, Industrial Ceramics Division, 47 Sipcot Industrial Complex, Hosur 635126, Tamil Nadu, Indiab Materials Research Centre, Department of Mechanical Engineering, University of Bath, Bath BA2 7AY, UK
Received 23 August 2006; received in revised form 22 January 2007; accepted 23 January 2007Available online 28 January 2007
bstract
The possible use of rare-earth cuprates R2BaCuO5 and R2Cu2O5 (R = rare earth) type compounds for high temperature (above 1000 ◦C) ceramicigment application is presented in this paper. The traditional ceramic powder mixing method was adopted for the manufacture of various samplespigment powders) used in this study. Yellow-green coloured powders with a variation in the intensity were obtained with R2BaCuO5 (R = Sm) atifferent calcination temperatures (950–1050 ◦C) and soaking time up to 12 h. These powders were then optimized in terms of colour by altering thealcinations temperature. The products with the most attractive colour were obtained with the sample calcined at 1050 ◦C. The same yellow-greenolour powders were observed when Sm was replaced by other rare earth oxides such as Ho, Yb, Er and calcined at the same temperature, exceptor Y. In the case of the Y addition, a dark green coloured powder was observed. The X-ray diffraction pattern of the samples indicated R2BaCuO5
R = rare earth) to be the major phase present in each case, although traces of CuO and the respective rare earth oxides were still present. For2Cu2O5 (R = Dy), a bluish-green coloured pigment powders with a variation in their intensity were observed when calcined between (950 and050 ◦C) with a 2 h soaking time. The best result (as far as intense colour is concerned) was noticed with the sample calcined at 950 ◦C. The sameluish-green colour powders were observed when Dy was replaced by other rare earths such as Yb, Ho, Er and Y. SEM micrographs of both typesf compounds (R2BaCuO5 and R2Cu2O5) obtained at various calcination temperatures revealed the presence of agglomerates in the samples, withn average grain size in the range 1–3 �m. All the pigment powders of the type R2BaCuO5 with the exception of the Sm-doped materials were
nstable at 1070 ◦C and produced a bubble rich surface (yttrium being the worst) when introduced into an unleaded commercial transparent glaze.n the case of Sm the yellow-green coloured powder turned to a light green. Similarly all the bluish-green coloured powders were unstable in thelaze except R = Dy and Y. In the case of Dy, a raindrop effect was observed on the surface of the ceramic tiles.2007 Elsevier B.V. All rights reserved.
e
aa6pdTlcp
eywords: Colour; Pigment; Rare earth cuprate; Ceramic pigment; Green; Blu
. Introduction
Rare-earth cuprates and nickelates from the families2Cu2O5 (the so-called blue phases where R = Tb–Lu, Y, Sc)nd R2BaCuO5 (the so-called green phases where R = Sm–Gd,y–Lu and Y) first attracted attention in connection with
he development of the high-Tc superconductors [1–3]. The2Cu2O5 type of compound crystallizes in the orthorhombic
pace group Pna21 [4–6]. In this case Cu–O pyramids (CuO5)
re joined by the common edges Cu (1) Cu (2) O8 dimers. Theseorm zigzag chains along the x-axis. These chains are linked byxygen atoms forming xy planes, where the Cu–Cu distance∗ Corresponding author.E-mail address: jiten [email protected] (J.K. Kar).
NigpRci
925-8388/$ – see front matter © 2007 Elsevier B.V. All rights reserved.oi:10.1016/j.jallcom.2007.01.124
long the y-axis (∼=3.5 A) is close to the largest one in a chainlong the x-axis (∼=3.2 A). The distances between the planes are.5 A. There are two non-equivalents four-fold low symmetryositions for the R3+ ions in a unit cell. R (1) O6 and R (2) O6istorted octahedra are united in a three-dimensional network.he R2BaCuO5 type of compound (except R = Nd) crystal-
izes in the orthorhombic space group Pbnm [1,2]. Nd2BaCuO5rystallizes in the tetragonal space group P4/mbm. The greenhases R2BaCuO5 (R = Sm–Gd, Dy–Lu and Y) and brown phased2BaCuO5 of R2BaCuO5 super conducting ceramics contain
solated Cu2+ ions interconnected by direct bonds through oxy-en. Various Cu–O–O–Cu or Cu–O–R–O–Cu super exchange
aths dominate in these compounds depending on the particular3+ ion. It has been proposed that a possible application for theseompounds is as new ceramic pigments in lead containing glazesn order to obtain various shades of blues and green [7–9]. The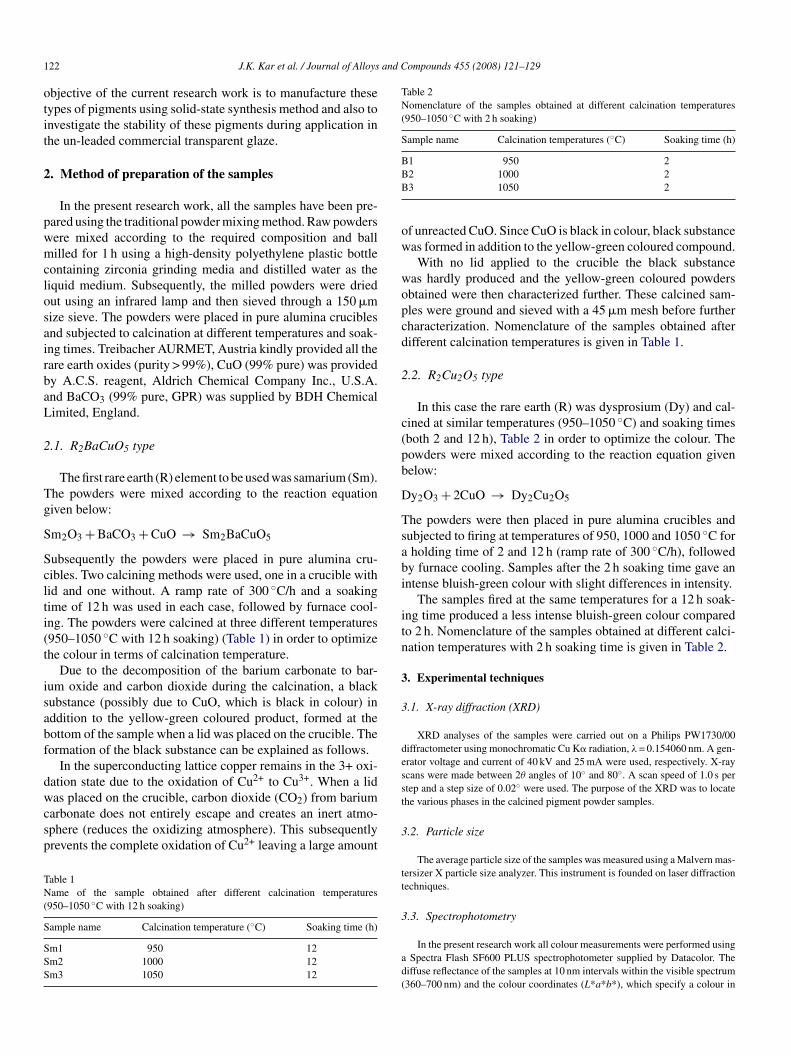
1 and Compounds 455 (2008) 121–129
otit
2
pwmclosairbaL
2
Tg
S
Sclti(t
isabf
dwcsp
TN(
S
SSS
Table 2Nomenclature of the samples obtained at different calcination temperatures(950–1050 ◦C with 2 h soaking)
Sample name Calcination temperatures (◦C) Soaking time (h)
B1 950 2BB
ow
wopcd
2
c(pb
D
Tsabi
itn
3
3
dess
22 J.K. Kar et al. / Journal of Alloys
bjective of the current research work is to manufacture theseypes of pigments using solid-state synthesis method and also tonvestigate the stability of these pigments during application inhe un-leaded commercial transparent glaze.
. Method of preparation of the samples
In the present research work, all the samples have been pre-ared using the traditional powder mixing method. Raw powdersere mixed according to the required composition and ballilled for 1 h using a high-density polyethylene plastic bottle
ontaining zirconia grinding media and distilled water as theiquid medium. Subsequently, the milled powders were driedut using an infrared lamp and then sieved through a 150 �mize sieve. The powders were placed in pure alumina cruciblesnd subjected to calcination at different temperatures and soak-ng times. Treibacher AURMET, Austria kindly provided all theare earth oxides (purity > 99%), CuO (99% pure) was providedy A.C.S. reagent, Aldrich Chemical Company Inc., U.S.A.nd BaCO3 (99% pure, GPR) was supplied by BDH Chemicalimited, England.
.1. R2BaCuO5 type
The first rare earth (R) element to be used was samarium (Sm).he powders were mixed according to the reaction equationiven below:
m2O3 + BaCO3 + CuO → Sm2BaCuO5
ubsequently the powders were placed in pure alumina cru-ibles. Two calcining methods were used, one in a crucible withid and one without. A ramp rate of 300 ◦C/h and a soakingime of 12 h was used in each case, followed by furnace cool-ng. The powders were calcined at three different temperatures950–1050 ◦C with 12 h soaking) (Table 1) in order to optimizehe colour in terms of calcination temperature.
Due to the decomposition of the barium carbonate to bar-um oxide and carbon dioxide during the calcination, a blackubstance (possibly due to CuO, which is black in colour) inddition to the yellow-green coloured product, formed at theottom of the sample when a lid was placed on the crucible. Theormation of the black substance can be explained as follows.
In the superconducting lattice copper remains in the 3+ oxi-ation state due to the oxidation of Cu2+ to Cu3+. When a lid
as placed on the crucible, carbon dioxide (CO2) from bariumarbonate does not entirely escape and creates an inert atmo-phere (reduces the oxidizing atmosphere). This subsequentlyrevents the complete oxidation of Cu2+ leaving a large amount
able 1ame of the sample obtained after different calcination temperatures
950–1050 ◦C with 12 h soaking)
ample name Calcination temperature (◦C) Soaking time (h)
m1 950 12m2 1000 12m3 1050 12
t
3
tt
3
ad(
2 1000 23 1050 2
f unreacted CuO. Since CuO is black in colour, black substanceas formed in addition to the yellow-green coloured compound.With no lid applied to the crucible the black substance
as hardly produced and the yellow-green coloured powdersbtained were then characterized further. These calcined sam-les were ground and sieved with a 45 �m mesh before furtherharacterization. Nomenclature of the samples obtained afterifferent calcination temperatures is given in Table 1.
.2. R2Cu2O5 type
In this case the rare earth (R) was dysprosium (Dy) and cal-ined at similar temperatures (950–1050 ◦C) and soaking timesboth 2 and 12 h), Table 2 in order to optimize the colour. Theowders were mixed according to the reaction equation givenelow:
y2O3 + 2CuO → Dy2Cu2O5
he powders were then placed in pure alumina crucibles andubjected to firing at temperatures of 950, 1000 and 1050 ◦C forholding time of 2 and 12 h (ramp rate of 300 ◦C/h), followedy furnace cooling. Samples after the 2 h soaking time gave anntense bluish-green colour with slight differences in intensity.
The samples fired at the same temperatures for a 12 h soak-ng time produced a less intense bluish-green colour comparedo 2 h. Nomenclature of the samples obtained at different calci-ation temperatures with 2 h soaking time is given in Table 2.
. Experimental techniques
.1. X-ray diffraction (XRD)
XRD analyses of the samples were carried out on a Philips PW1730/00iffractometer using monochromatic Cu K� radiation, λ = 0.154060 nm. A gen-rator voltage and current of 40 kV and 25 mA were used, respectively. X-raycans were made between 2θ angles of 10◦ and 80◦. A scan speed of 1.0 s pertep and a step size of 0.02◦ were used. The purpose of the XRD was to locatehe various phases in the calcined pigment powder samples.
.2. Particle size
The average particle size of the samples was measured using a Malvern mas-ersizer X particle size analyzer. This instrument is founded on laser diffractionechniques.
.3. Spectrophotometry
In the present research work all colour measurements were performed usingSpectra Flash SF600 PLUS spectrophotometer supplied by Datacolor. The
iffuse reflectance of the samples at 10 nm intervals within the visible spectrum360–700 nm) and the colour coordinates (L*a*b*), which specify a colour in
and Compounds 455 (2008) 121–129 123
uuc
•••
3
ebg
3
loTm
Amuasw
t
••••
4
4
4
soTc
piso
TC(
S
SSS
Fc
Epb
YEYpttpv(
4
poR
J.K. Kar et al. / Journal of Alloys
niform colour space can be measured with this instrument. Each colour in theniform colour space can be denoted by three parameters L*a*b* in rectangularoordinates where
L*: lightness axis, for white L* = 100 and 0 for black;a*: red-green axis, positive means red and negative means green;b*: yellow-blue axis, positive means yellow and negative means blue.
.4. Scanning electron microscopy (SEM)
The SEM used in this study was a JEOL JSM-6310 analytical scanninglectron microscope fitted with a 10/85-link microanalysis system manufacturedy Oxford Instrument. The SEM was used to detect the surface morphology andrain size of the calcined pigment powders.
.5. Application of the pigment powders to the glaze
Stability of the pigment powders was tested in commercial transparent lead-ess glaze. The glaze was kindly provided by the Ferro Corporation, Stoken Trent, England (Product No-V7470/A, Lxt 711 frit 900, China clay 100).he precise composition of this glaze could not be obtained for reasons ofanufacturing confidentiality of the company.
Glazes were coloured by introducing 8 wt.% of the pigments to the glaze.homogeneous mixture of the pigment and glaze was achieved by milling theaterials constituting the slip for half an hour in a high-density plastic container
sing zirconia grinding media. The ground mixtures were then sieved through100 �m mesh and subsequently stained ceramic glazes were sprayed onto the
tandard test tiles using a spray gun. The mass of the glaze deposited in each tileas between 0.15 and 0.2 g/cm2.
Firings of the glazed samples were carried out in a Carbolite furnace usinghe conditions given below:
Step 1: 100 ◦C/h to 120 ◦C, soaking time 2 h;Step 2: 100 ◦C/h to 600 ◦C, soaking time 1 h;Step 3: 100 ◦C/h to 1070 ◦C, soaking time 2 h;Step 4: furnace cooling.
. Results and discussion
.1. R2BaCuO5 type
.1.1. Colour measurementColour measurement was carried out on the pigment powder
ample (rare earth containing Sm) using a spectrophotometer inrder to optimize the colour in terms of calcination temperature.he CIE values L*a*b* are given in Table 3 and the reflectanceurves in Fig. 1.
From the reflectance curve and CIE values of the pigment
owders (Fig. 1 and Table 3), it could be concluded that thentensity of the colour was a maximum at 1050 ◦C. It was alsoeen that increasing the temperature, there is a gradual increasef the absolute value in both b* and a* values (Table 3).able 3IE values of Sm2BaCuO5 pigment powders at various calcination temperatures
950–1050 ◦C)
ymbol Pigment powders
L* a* b*
m1 45.14 −4.09 5.56m2 46.03 −4.80 6.47m3 48.53 −6.47 10.59
Cort
TL
S
SHYN
ig. 1. Diffuse reflectance curves of Sm2BaCuO5 pigment powders at variousalcinations temperatures (950–1050 ◦C) with 12 h soaking.
Subsequently, Sm was replaced by other rare earths (Ho, Yb,r, Y, and Nd) and was calcined at 1050 ◦C only for 12 h. Theowders were mixed according to the reaction equation givenelow:
Ho2O3 + BaCO3 + CuO → Ho2BaCuO5,
Yb2O3 + BaCO3 + CuO → Yb2BaCuO5,
Er2O3 + BaCO3 + CuO → Er2BaCuO5,
Y2O3 + BaCO3 + CuO → Y2BaCuO5,
Nd2O3 + BaCO3 + CuO → Nd2BaCuO5
ellow-green colour powders were obtained with Ho, Yb andr. Dark green and brown colours were observed for rare earthsand Nd, respectively. The colour coordinates for these com-
ounds are shown in Table 4. From Table 4, it can be seen thathere is an increase in the absolute values of a* (in negative direc-ion indicating more green) in the glaze compared to the pigmentowders. The b* values indicate the yellow content (positivealues of b*) in the pigment powders and shifts towards bluenegative values of b*) when put in the glaze.
.1.2. X-ray diffractionIn order to detect the different phases present in the calcined
igment powder samples, powder X-ray diffraction was carriedut. From the XRD traces, the major phases were found to be2BaCuO5 (where R = Ho, Sm, Y and Nd) although traces of
uO were still present. It was also observed that the XRD tracesf R2BaCuO5 type compounds were similar irrespective of theare earth content. Typical example of XRD traces of R2BaCuO5ype compounds where R = Sm, Nd are given in Figs. 2 and 3.able 4*a*b* parameters of the pigment powders and pigments in glaze
ymbol Pigment powders Pigments in glaze
L* a* b* L* a* b*
m2BaCuO5 48.53 −6.47 10.59 67.42 −19.03 −0.61o2BaCuO5 53.63 −15.43 14.32 53.45 −24.78 −6.47
2BaCuO5 51.64 −16.12 10.06d2BaCuO5 51.84 5.51 6.91 60.31 −17.63 −7.63

124 J.K. Kar et al. / Journal of Alloys and Compounds 455 (2008) 121–129
Fig. 2. X-ray diffraction pattern of the Sm2BaCuO5 pigment powder (1050 ◦C for 12 h).
BaCu
4
iFic
4
R
TPR
S
SHYN
Fd6
0
Fig. 3. X-ray diffraction pattern of Nd2
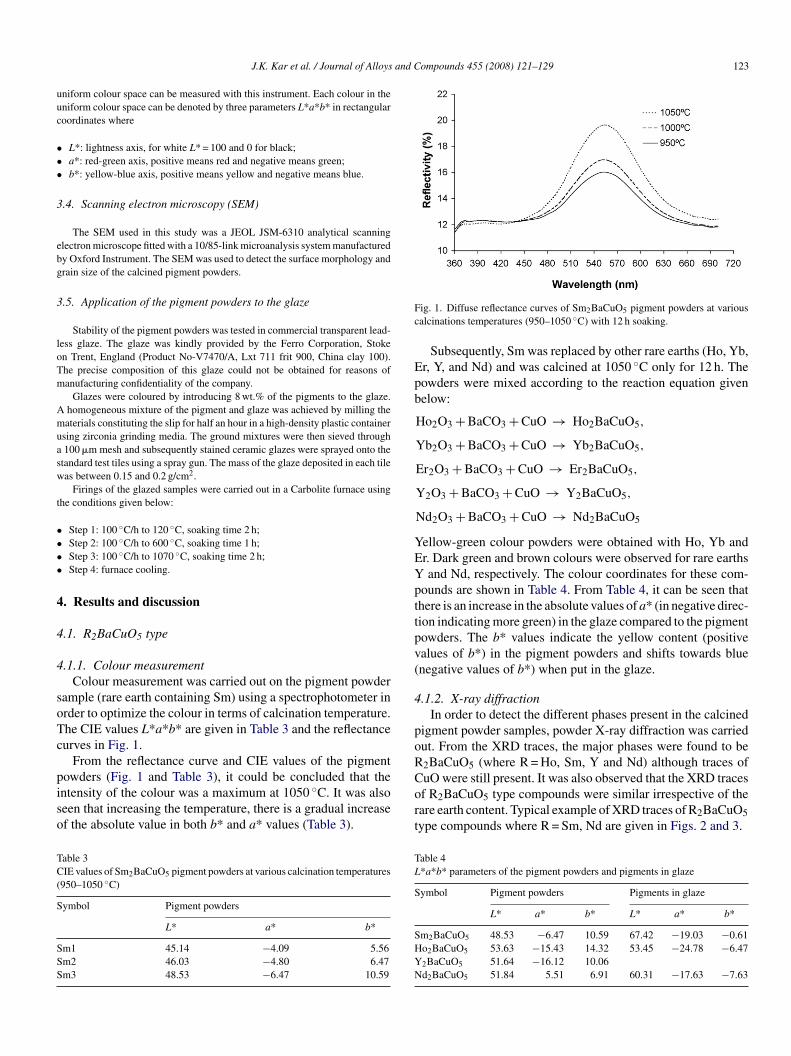
.1.3. Scanning electron microscopy (SEM)SEM was carried out on the calcined pigment powder samples
n order to find out the surface morphology and the grain size.rom the scanning electron microscopy micrographs, Fig. 4,
t was evident that the sample contained agglomerates, eachomposed of small round particles with a grain size of 1–2 �m.
.1.4. Particle sizeParticle sizes of the pigment powder samples (R2BaCuO5,
= Ho, Sm, and Y) after grinding for 1 h are given in Table 5.
able 5article sizes of all the rare earth cuprate pigment powder samples (R2BaCuO5,= Sm, Ho, and Y) after grinding for 1 h and Nd2BaCuO5 (after 2 h grinding)
ample name Particle sizes (�m)
d (0.5) d (0.1) d (0.9)
m2BaCuO5 11.17 4.38 29.74o2BaCuO5 10.47 4.28 26.82
2BaCuO5 12.83 5.55 30.97d2BaCuO5 4.03 0.28 11.82
4
mbpgabmtcgipO
O5 pigment powder (1050 ◦C for 12 h).
rom Table 5, it is seen that, d50 varies between 10 and 13 �m,90 varies between 26 and 30 �m and d10 varies between 4 and�m.
For Nd2BaCuO5 (after 2 h grinding) the particles lie between.28 and 11.82 �m with an average particle size of 4 �m.
.1.5. Application of the pigment powders onto the glazeThe stability of the yellow-green pigments and brown pig-
ent was tested in an unleaded commercial transparent glazey addition of 8 wt% of pigment at 1070 ◦C. The green colouredigment powders in the case of Sm and Ho turned into lightreen. The brown coloured pigment powder in the case of Ndlso turned into light green in the glaze. Y2BaCuO5 gave a bub-led surface in the glaze. It was not possible to carry out coloureasurement on Y containing compound after application in
he glaze because of the bubbled surface whereas compound-ontaining Nd completely altered the colour when put in the
laze The explanation for the presence of bubbles is describedn the general discussion. The L*, a* and b* parameters of theigment powders and pigments in the glaze are given in Table 4.n examination of the values of L*, a* and b* in powder form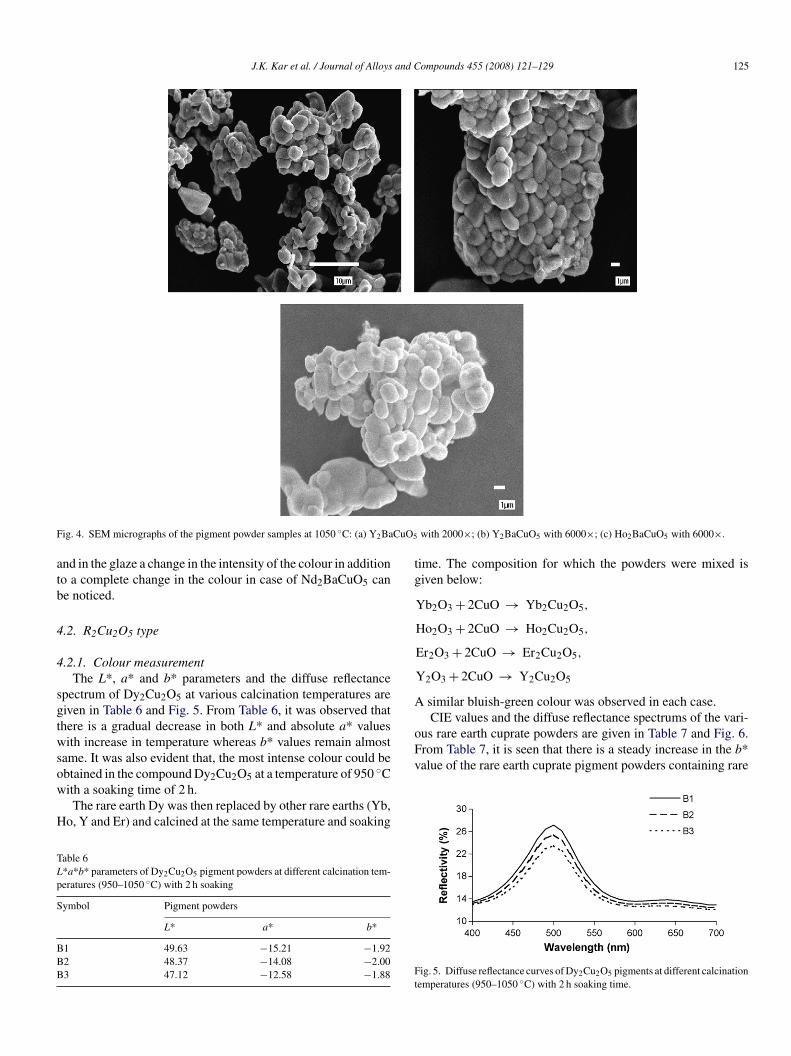
J.K. Kar et al. / Journal of Alloys and Compounds 455 (2008) 121–129 125
F CuO5
atb
4
4
sgtwsow
H
TLp
S
BBB
tg
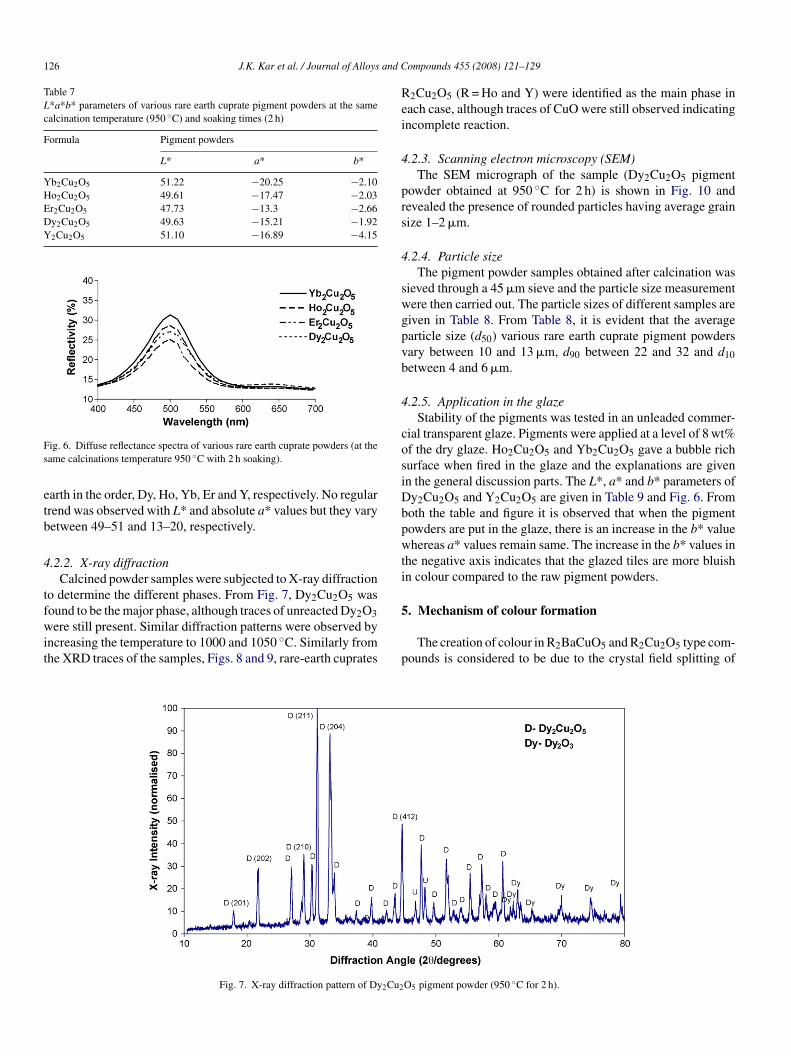
ACIE values and the diffuse reflectance spectrums of the vari-
ous rare earth cuprate powders are given in Table 7 and Fig. 6.From Table 7, it is seen that there is a steady increase in the b*value of the rare earth cuprate pigment powders containing rare
ig. 4. SEM micrographs of the pigment powder samples at 1050 ◦C: (a) Y2Ba
nd in the glaze a change in the intensity of the colour in additiono a complete change in the colour in case of Nd2BaCuO5 cane noticed.
.2. R2Cu2O5 type
.2.1. Colour measurementThe L*, a* and b* parameters and the diffuse reflectance
pectrum of Dy2Cu2O5 at various calcination temperatures areiven in Table 6 and Fig. 5. From Table 6, it was observed thathere is a gradual decrease in both L* and absolute a* valuesith increase in temperature whereas b* values remain almost
ame. It was also evident that, the most intense colour could be
btained in the compound Dy2Cu2O5 at a temperature of 950 ◦Cith a soaking time of 2 h.The rare earth Dy was then replaced by other rare earths (Yb,o, Y and Er) and calcined at the same temperature and soaking
able 6*a*b* parameters of Dy2Cu2O5 pigment powders at different calcination tem-eratures (950–1050 ◦C) with 2 h soaking
ymbol Pigment powders
L* a* b*
1 49.63 −15.21 −1.922 48.37 −14.08 −2.003 47.12 −12.58 −1.88 F
t
with 2000×; (b) Y2BaCuO5 with 6000×; (c) Ho2BaCuO5 with 6000×.
ime. The composition for which the powders were mixed isiven below:
Yb2O3 + 2CuO → Yb2Cu2O5,
Ho2O3 + 2CuO → Ho2Cu2O5,
Er2O3 + 2CuO → Er2Cu2O5,
Y2O3 + 2CuO → Y2Cu2O5
similar bluish-green colour was observed in each case.
ig. 5. Diffuse reflectance curves of Dy2Cu2O5 pigments at different calcinationemperatures (950–1050 ◦C) with 2 h soaking time.
126 J.K. Kar et al. / Journal of Alloys and C
Table 7L*a*b* parameters of various rare earth cuprate pigment powders at the samecalcination temperature (950 ◦C) and soaking times (2 h)
Formula Pigment powders
L* a* b*
Yb2Cu2O5 51.22 −20.25 −2.10Ho2Cu2O5 49.61 −17.47 −2.03Er2Cu2O5 47.73 −13.3 −2.66Dy2Cu2O5 49.63 −15.21 −1.92Y2Cu2O5 51.10 −16.89 −4.15
Fs
etb
4
tfwit
Rei
4
prs
4
swgpvb
4
cosiDbpwti
ig. 6. Diffuse reflectance spectra of various rare earth cuprate powders (at theame calcinations temperature 950 ◦C with 2 h soaking).
arth in the order, Dy, Ho, Yb, Er and Y, respectively. No regularrend was observed with L* and absolute a* values but they varyetween 49–51 and 13–20, respectively.
.2.2. X-ray diffractionCalcined powder samples were subjected to X-ray diffraction
o determine the different phases. From Fig. 7, Dy2Cu2O5 was
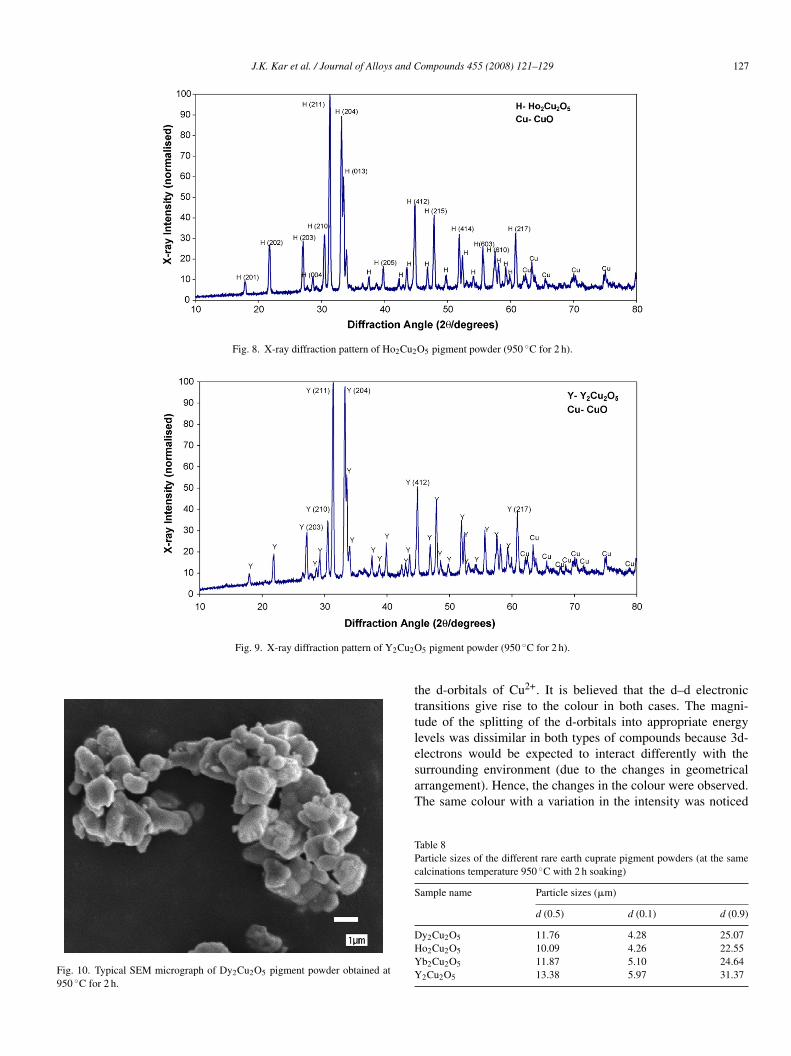
ound to be the major phase, although traces of unreacted Dy2O3ere still present. Similar diffraction patterns were observed byncreasing the temperature to 1000 and 1050 ◦C. Similarly fromhe XRD traces of the samples, Figs. 8 and 9, rare-earth cuprates
5
p
Fig. 7. X-ray diffraction pattern of Dy2Cu2
ompounds 455 (2008) 121–129
2Cu2O5 (R = Ho and Y) were identified as the main phase inach case, although traces of CuO were still observed indicatingncomplete reaction.
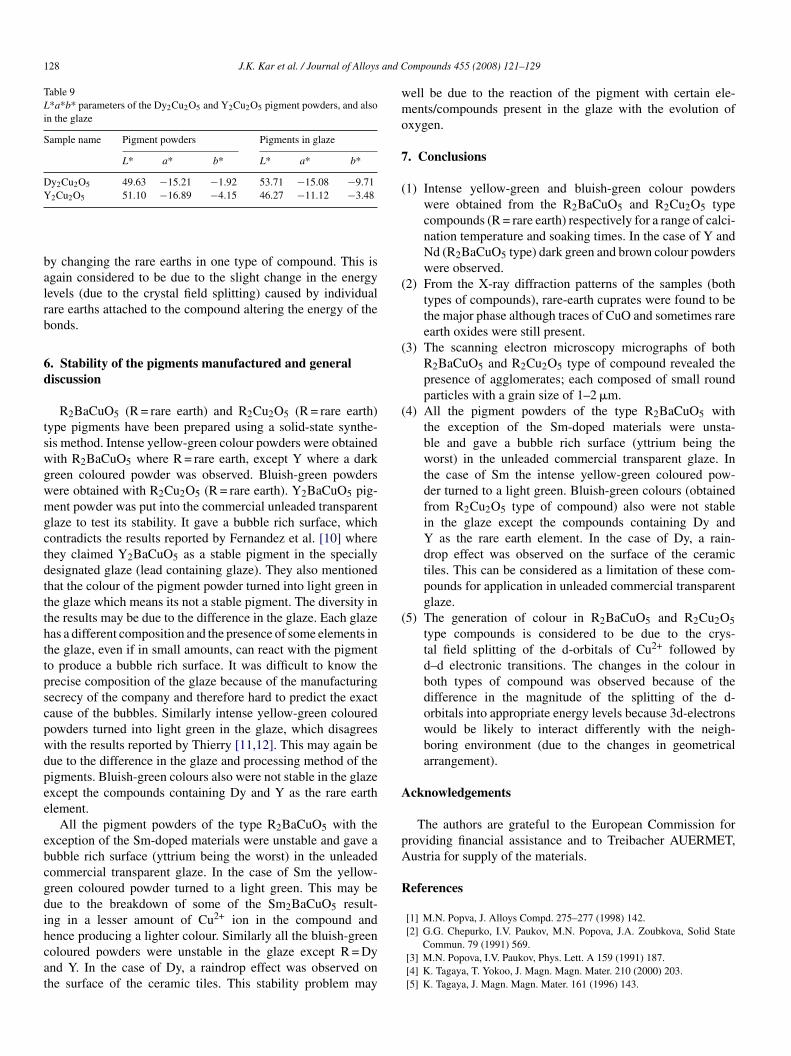
.2.3. Scanning electron microscopy (SEM)The SEM micrograph of the sample (Dy2Cu2O5 pigment
owder obtained at 950 ◦C for 2 h) is shown in Fig. 10 andevealed the presence of rounded particles having average grainize 1–2 �m.
.2.4. Particle sizeThe pigment powder samples obtained after calcination was
ieved through a 45 �m sieve and the particle size measurementere then carried out. The particle sizes of different samples areiven in Table 8. From Table 8, it is evident that the averagearticle size (d50) various rare earth cuprate pigment powdersary between 10 and 13 �m, d90 between 22 and 32 and d10etween 4 and 6 �m.
.2.5. Application in the glazeStability of the pigments was tested in an unleaded commer-
ial transparent glaze. Pigments were applied at a level of 8 wt%f the dry glaze. Ho2Cu2O5 and Yb2Cu2O5 gave a bubble richurface when fired in the glaze and the explanations are givenn the general discussion parts. The L*, a* and b* parameters ofy2Cu2O5 and Y2Cu2O5 are given in Table 9 and Fig. 6. Fromoth the table and figure it is observed that when the pigmentowders are put in the glaze, there is an increase in the b* valuehereas a* values remain same. The increase in the b* values in
he negative axis indicates that the glazed tiles are more bluishn colour compared to the raw pigment powders.
. Mechanism of colour formation
The creation of colour in R2BaCuO5 and R2Cu2O5 type com-ounds is considered to be due to the crystal field splitting of
O5 pigment powder (950 ◦C for 2 h).
J.K. Kar et al. / Journal of Alloys and Compounds 455 (2008) 121–129 127
Fig. 8. X-ray diffraction pattern of Ho2Cu2O5 pigment powder (950 ◦C for 2 h).
Fig. 9. X-ray diffraction pattern of Y2Cu2O
Fig. 10. Typical SEM micrograph of Dy2Cu2O5 pigment powder obtained at950 ◦C for 2 h.
tttlesaT
TPc
S
DHYY
5 pigment powder (950 ◦C for 2 h).
he d-orbitals of Cu2+. It is believed that the d–d electronicransitions give rise to the colour in both cases. The magni-ude of the splitting of the d-orbitals into appropriate energyevels was dissimilar in both types of compounds because 3d-
lectrons would be expected to interact differently with theurrounding environment (due to the changes in geometricalrrangement). Hence, the changes in the colour were observed.he same colour with a variation in the intensity was noticedable 8article sizes of the different rare earth cuprate pigment powders (at the samealcinations temperature 950 ◦C with 2 h soaking)
ample name Particle sizes (�m)
d (0.5) d (0.1) d (0.9)
y2Cu2O5 11.76 4.28 25.07o2Cu2O5 10.09 4.26 22.55b2Cu2O5 11.87 5.10 24.64
2Cu2O5 13.38 5.97 31.37
128 J.K. Kar et al. / Journal of Alloys and C
Table 9L*a*b* parameters of the Dy2Cu2O5 and Y2Cu2O5 pigment powders, and alsoin the glaze
Sample name Pigment powders Pigments in glaze
L* a* b* L* a* b*
Dy2Cu2O5 49.63 −15.21 −1.92 53.71 −15.08 −9.71Y
balrb
6d
tswgwmgctdttthttpscpwdpee
ebcgdihcat
wmo
7
(
(
(
(
(
A
pA
R
[2] G.G. Chepurko, I.V. Paukov, M.N. Popova, J.A. Zoubkova, Solid State
2Cu2O5 51.10 −16.89 −4.15 46.27 −11.12 −3.48
y changing the rare earths in one type of compound. This isgain considered to be due to the slight change in the energyevels (due to the crystal field splitting) caused by individualare earths attached to the compound altering the energy of theonds.
. Stability of the pigments manufactured and generaliscussion
R2BaCuO5 (R = rare earth) and R2Cu2O5 (R = rare earth)ype pigments have been prepared using a solid-state synthe-is method. Intense yellow-green colour powders were obtainedith R2BaCuO5 where R = rare earth, except Y where a darkreen coloured powder was observed. Bluish-green powdersere obtained with R2Cu2O5 (R = rare earth). Y2BaCuO5 pig-ent powder was put into the commercial unleaded transparent
laze to test its stability. It gave a bubble rich surface, whichontradicts the results reported by Fernandez et al. [10] wherehey claimed Y2BaCuO5 as a stable pigment in the speciallyesignated glaze (lead containing glaze). They also mentionedhat the colour of the pigment powder turned into light green inhe glaze which means its not a stable pigment. The diversity inhe results may be due to the difference in the glaze. Each glazeas a different composition and the presence of some elements inhe glaze, even if in small amounts, can react with the pigmento produce a bubble rich surface. It was difficult to know therecise composition of the glaze because of the manufacturingecrecy of the company and therefore hard to predict the exactause of the bubbles. Similarly intense yellow-green colouredowders turned into light green in the glaze, which disagreesith the results reported by Thierry [11,12]. This may again beue to the difference in the glaze and processing method of theigments. Bluish-green colours also were not stable in the glazexcept the compounds containing Dy and Y as the rare earthlement.
All the pigment powders of the type R2BaCuO5 with thexception of the Sm-doped materials were unstable and gave aubble rich surface (yttrium being the worst) in the unleadedommercial transparent glaze. In the case of Sm the yellow-reen coloured powder turned to a light green. This may beue to the breakdown of some of the Sm2BaCuO5 result-ng in a lesser amount of Cu2+ ion in the compound and
ence producing a lighter colour. Similarly all the bluish-greenoloured powders were unstable in the glaze except R = Dynd Y. In the case of Dy, a raindrop effect was observed onhe surface of the ceramic tiles. This stability problem mayompounds 455 (2008) 121–129
ell be due to the reaction of the pigment with certain ele-ents/compounds present in the glaze with the evolution of
xygen.
. Conclusions
1) Intense yellow-green and bluish-green colour powderswere obtained from the R2BaCuO5 and R2Cu2O5 typecompounds (R = rare earth) respectively for a range of calci-nation temperature and soaking times. In the case of Y andNd (R2BaCuO5 type) dark green and brown colour powderswere observed.
2) From the X-ray diffraction patterns of the samples (bothtypes of compounds), rare-earth cuprates were found to bethe major phase although traces of CuO and sometimes rareearth oxides were still present.
3) The scanning electron microscopy micrographs of bothR2BaCuO5 and R2Cu2O5 type of compound revealed thepresence of agglomerates; each composed of small roundparticles with a grain size of 1–2 �m.
4) All the pigment powders of the type R2BaCuO5 withthe exception of the Sm-doped materials were unsta-ble and gave a bubble rich surface (yttrium being theworst) in the unleaded commercial transparent glaze. Inthe case of Sm the intense yellow-green coloured pow-der turned to a light green. Bluish-green colours (obtainedfrom R2Cu2O5 type of compound) also were not stablein the glaze except the compounds containing Dy andY as the rare earth element. In the case of Dy, a rain-drop effect was observed on the surface of the ceramictiles. This can be considered as a limitation of these com-pounds for application in unleaded commercial transparentglaze.
5) The generation of colour in R2BaCuO5 and R2Cu2O5type compounds is considered to be due to the crys-tal field splitting of the d-orbitals of Cu2+ followed byd–d electronic transitions. The changes in the colour inboth types of compound was observed because of thedifference in the magnitude of the splitting of the d-orbitals into appropriate energy levels because 3d-electronswould be likely to interact differently with the neigh-boring environment (due to the changes in geometricalarrangement).
cknowledgements
The authors are grateful to the European Commission forroviding financial assistance and to Treibacher AUERMET,ustria for supply of the materials.
eferences
[1] M.N. Popva, J. Alloys Compd. 275–277 (1998) 142.
Commun. 79 (1991) 569.[3] M.N. Popova, I.V. Paukov, Phys. Lett. A 159 (1991) 187.[4] K. Tagaya, T. Yokoo, J. Magn. Magn. Mater. 210 (2000) 203.[5] K. Tagaya, J. Magn. Magn. Mater. 161 (1996) 143.

and C
[9] Macaudiere, FR Patent 9,401,560 (1994).[10] F. Fernandez, C. Colon, A. Duran, J. Alloys Compd. 275–277 (1998)
J.K. Kar et al. / Journal of Alloys
[6] Z.A. Kazei, N.P. Kolmakova, R.Z. Levitin, B.V. Mill, V.V. Moshchalkov,V.N. Orlov, V.V. Snegivev, J.A. Zoubkova, J. Magn. Magn. Mater. 96 (1990)
124.[7] A. Salinas Sanchez, J.L. Garcia, J. Rodriguez-Carvajal, R. Saezpuche, J.L.Martinez, J. Solid State Chem. 100 (1992) 443.
[8] A. Salinas Sanchez, R. Saezpuche, M.A. Alario-Franco, J. Solid StateChem. 89 (1990) 361.
[[
ompounds 455 (2008) 121–129 129
750.11] C. Thierry, US Patent 5,888,291 (1996).12] C. Thierry, EP Patent 0613930B1 (1998).