Embed Size (px)
Citation preview

‘Caring Dairy’
Ben & Jerry’s Sustainable Dairy Farming Initiative in Europe
This report is public and every participant can has the free disposal of the end report
K.J. van Calker, Wageningen University and Research centre A.C.G. Beldman, Wageningen University and Research centre A.M. Mauser, Ben & Jerry’s


Preface
The Caring Dairy project has been an inspiring journey for all participants: Ben Jerry’s, Hoogwegt Milk BV, the participating farmers, and the Animal Science Group (ASG) and Agricultural Economics Research Institute (LEI) of Wageningen University and Research centre. With the support of Agri Chain Competence Center (AKK), we have managed to enhance the level of ambition of the Caring Dairy project in its first phase, of which the results are laid d own in this report. We like to thank AKK and Wageningen Univeristy and Research centre (co-financing) for making this possible. We have now started the second stage of the Caring Dairy project of which the end result will be Guidelines for Sustainable Dairy Farming Practices. Via Ben & Jerry’s web site, www.benjerry.nl, Caring Dairy can be further followed. We like to thank Sietske Boschma of AKK for her commitment and constructive input. We also like to thank Jan Willem van der Schans (LEI), Co Daatselaar (LEI), Gerben Doornewaard (LEI), Gidi Smolders (ASG), Durk Durksz (ASG), Harm Wemmenhove (ASG), Bert Philipsen (ASG), Jelle Zijlstra (ASG), Gerjan Hilhorst (ASG) and Cees Jan Hollander (ASG) for their expert knowledge contribution to Caring Dairy. Special thanks finally, to Jan Willem van der Schans (LEI) for his contribution to Chapter 2 of this report.
Caring Dairy participants:
Anniek Mauser Ben & Jerry's Social Mission and Environmental Sustainability Manager Europe & project leader Caring Dairy Postbus 160 3000 AD Rotterdam +31(0)10 4395694 [email protected]
Klaas Jan van Calker Project manager Agricultural Sustainability Agricultural Economics Research Institute (LEI) Wageningen University and Research centre Postbus 29703 2502 LS The Hague +31 (0)70 3358325 [email protected]
Bert Bams Ben & Jerry’s ambassador at production plant Hellendoorn Reggeweg 15 7447 AN Hellendoorn +31 (0)548 659659 [email protected]
Alfons Beldman Project manager Strategic Management Agricultural Economics Research Institute (LEI) Wageningen University and Research centre Postbus 29703 2502 LS The Hague +31 (0)320293540 [email protected]
Johannes Pieter Keestra Hoogwegt BV Groningensingel 1 6835 EA Arnhem +31 (0)6 22937273 [email protected]
Rudi Hooch Antink Caring dairy farmer and member project team Panjerdweg 3 7958 PT Koekange +31 (00)522 451880 [email protected]
Brord Sloot Caring dairy farmer and member project team Ossenwaard 9 6914 KB Herwen +31 (0) 316542572 [email protected]


Content
Summary 1
1. Introduction 3
2. Participants in “Caring Dairy” and their mutual relations 6
2.1 Participating supply chain partners and stakeholders 6
2.2 Relation between participating supply chain partners 9
3. Development of Sustainable Dairy Farming Guidelines: 19 the “Caring Dairy” approach
3.1 Introduction 19
3.2 Definition of sustainable dairy farming (step 1) 19
3.3 Principles: general statements of purpose and intent (step 2) 20
3.4 Sustainability Indicators: specific areas on which to focus work (step 3) 20
3.5 Parameters: data points that quantify sustainability (step 4) 22
3.6 Sustainable Dairy Farming Guidelines: practices that lead to 24
measurable improvements (step 5)
4. Results of participating dairy farms 27
4.1 Development of strategic improvement plans by using 27
Interactive Strategic Management
4.2 Results and improvement plans per indicator 33
5. Communication 51
6. Experiences, outlook and conclusion 56
6.1 Experiences 56
6.2 Outlook and conclusion 57
References 58

1
Summary
Interest in the concept of sustainability in dairy farming has grown as a result of the
continuous pressure on farm incomes, occurrence of animal diseases with a major impact on
the image of dairy farming, concerns about animal welfare, and environmental problems
caused by agriculture. There are, however, still many gaps in the knowledge regarding
sustainable dairy farming. Respecting the earth and the environment and ‘giving back to
community’ is a fully integrated part of the Mission Statement of ice cream maker Ben &
Jerry’s. Following this mission, Ben & Jerry’s have initiated a sustainable dairy farming
project, ‘Caring Dairy’, for the European production based in the Netherlands. The aim of
Caring Dairy is to support dairy farmers to produce milk in a more sustainable way and to lay
down these learnings in guidelines for Sustainable Dairy Farming Practices (SDFP). The
approach of Caring Dairy is based on Unilever’s sustainable agriculture approach and is
supported among others by Interactive Strategic Management and the Farm Sustainability
Index. An iterative process of implementation of the improvement plans, measurement,
analysis and re-adjusting the plans will lead ultimately to the guidelines for Sustainable Dairy
Farming Practices. At this moment 11 dairy farmers participate in Caring Dairy and a baseline
measurement for all 11 indicators (soil fertility and health, soil loss, nutrients, pest
management, biodiversity, energy, water, farm economics, social human capital, local
economy and animal welfare) has been done from where improvement plans, both on a
strategic and indicator specific level, have been developed tailored to the specific situation
and priorities of the individual farmers. Results of the first cycle of improvement are
presented in this report. Furthermore the structure of the supply chain, the participating supply
chain partners, the mutual relationship of the supply chain partners and the role of
communication in this process is discussed. Caring Dairy shows the innovation power of
supply chains by the bottom-up development of sustainable dairy farming practices in co-
operation with all relevant supply chain partners, which goes beyond existing initiatives
related to sustainability in the dairy sector.
Various articles have been published on the Caring Dairy project of which the PdF files can be downloaded from www.benjerry.nl under “B&J visie op” “melkveehouderij”:
� Blije koe, blije boer, blije aarde – Nieuwe Oogst – zaterdag 10 december 2005 � Geen hogere melkprijs maar veel meer vakkennis - Nieuwe Oogst - zaterdag 6 augustus 2005 � Meer kennis geeft duurzamer bedrijf (p1) – Boerderij / Veehouderij - dinsdag 21 juni 2005 � Meer kennis geeft duurzamer bedrijf (p2) – Boerderij / Veehouderij - dinsdag 21 juni 2005 � Smile-melk is vooral investering – Agrarisch Dagblad – woensdag 23 maart 2005 � Mijn melk zit in dat ijsje – Veeteelt – maandag 1 november 2004 � Ben & Jerry’s maakt keten sluitend – ZuivelZicht – woensdag 3 november 2004 Also a conference paper for the 2005 IFMA conference in Brazil was written and presented by one of the Caring Dairy farmers. The paper can be downloaded from: http://www.ifmaonline.org/pages/con_full_articles.php?abstract=270.

2
Key words: Sustainability, Dairy farming, Strategic management, Bottom-up approach, Chain partners, Continuous improvement

3
1. Introduction
The interest in the concept of “sustainable” farming systems has grown more and more in the
last decade. Alternative farming systems, which include integrated farming, bio-dynamic
farming, and organic farming, are often equated with sustainable agriculture (Hansen, 1996;
Rigby and Caceres, 2001). Others, however, see sustainable farming as encompassing a wider
range of systems. It is nevertheless difficult to determine the extent to which certain
agricultural practices can be considered sustainable or not (Rigby and Caceres, 2001). To
characterise agricultural systems as sustainable, the concept of sustainability has to be made
operational (Heinen, 1994). Sustainability should be assessed on the basis of three aspects:
economic, social, and ecological sustainability (Shearman, 1990; Heinen, 1994; Hansen and
Jones, 1996).
Criticism on the sustainability of the Dutch dairy sector was increasing, although the
quality standards are high and care for the environment is increasing. Conventional Dutch
dairy farming is highly productive through a high level of farm management (e.g. high milk
and crop production) and high intensity, i.e. kg milk per hectare. Side-effects of the
intensification of dairy farming became evident from the end of the 1970s and beginning of
the 1980s onwards (Henkens and van Keulen, 2001). The ecological quality of many surface
waters is poor and nitrate concentration of groundwater is exceeding 50 mg of nitrate per litre
of groundwater in several areas. This is mainly due to relatively high discharges of nitrogen
and phosphate from agriculture (Oenema et al., 2005). Moreover dairy farming contributes to
global warming (emissions of methane, nitrous oxide and carbon dioxide; Oenema et al.,
2001b) and acidification (emission of ammonia; Bussink and Oenema, 1998).
Besides ecological sustainability, social sustainability of Dutch dairy farming is also
under pressure. Food safety, animal welfare and animal health, for example, have become
more important issues for consumers over the last decade (Noordhuizen and Metz, 2005).
Non-grazing of dairy cows and/or young stock affects the image of dairy farming and is
related to lower animal welfare (Van den Pol-van Dasselaar et al., 2002). Currently, still 85%
of all dairy cows are allowed to graze. This number decreased the last few years as a result of
a more strict environmental legislation (MINAS; Ondersteijn et al., 2002) and an increase in
the size of dairy farms (Luesink et al., 2005). This trend negatively affects social
sustainability of Dutch dairy farming.
Last but not least, economic sustainability of Dutch dairy farms is under pressure mainly
due to decreasing milk prices and increasing production costs. Milk prices are expected to
drop further resulting from changes in the Common Agricultural Policy (CAP). The CAP
aims to shift monetary support away from product support towards direct income support and
towards payments targeted at realising environmental and other objectives (Burrell, 2004).

4
The total CAP budget, however, is expected to decrease while at the same time production
costs are likely to increase. These changes will lead to restructuring of the dairy sector in the
next few years and marginal dairy farms will disappear (Burrell, 2004).
According to policy makers, agricultural organisations, societal organisations and
scientists sustainability can be a basis to address future developments for dairy farming. The
transition towards more sustainable farming systems is a central element of the Dutch agenda
for the reconstruction of the livestock production sector (Wijffels, 2001; VROM, 2003). The
transition towards more sustainable dairy farming systems is characterised by a better balance
between economic, social, and ecological performance (Elzen and Wieczorek, 2005).
For Dutch dairy farmers there are insufficient incentives to produce their products in a
more sustainable way. Moreover, there are still many gaps in the knowledge regarding
sustainable dairy farming. For these reasons, Ben & Jerry’s have initiated a sustainable dairy
farming project, “Caring Dairy”, for the European ice cream production based in the
Netherlands. Ice cream maker Ben & Jerry’s has a Mission Statement in which respecting the
earth and the environment and ‘giving back to community’ is fully integrated. Initiating and
supporting “Caring Dairy” perfectly fits this social mission. The aim of Ben & Jerry’s is to
support dairy farmers to produce milk in a more sustainable way and to lay down this
learnings in guidelines for Sustainable Dairy Farming Practices (SDFP), which can be used by
the whole dairy sector.
“Caring Dairy” is focusing on conventional dairy farms. The choice to work with
conventional dairy farms has two main reasons: (1) conventional dairy farming accounts for
over 95% of the Dutch dairy farms and, therefore, the impact of sustaining the conventional
dairy production has a bigger impact, (2) organic dairy farming is a measure based approach
(i.e. no use of fertiliser and compulsory grazing) whereas the sustainability concept is a
performance based approach (i.e. reducing nitrate leaching and greenhouse gas emissions).
The main objectives of “Caring Dairy” are: (1) making sustainability operational for
commercial dairy farms, (2) improving the sustainability performance for the participating
commercial farms, and (3) to develop guidelines for Sustainable Dairy Farming Practices
(SDFP) and allowing the full dairy sector to learn from the achieved insights. “Caring Dairy”
is based on Unilever’s sustainable agriculture approach and is supported among others by
Interactive Strategic Management (Smit et al., 2002) and the Farm Sustainability Index (Van
Calker et al., 2005a; Van Calker et al., 2005b), a method to asses sustainability in Dutch dairy
farming.
This report is structured as follows. First the participating supply chain partners and
stakeholders and their role in “Caring Dairy” are presented (Chapter 2). Second, the Caring
Dairy approach to develop the Sustainable Dairy Farming Guidelines is presented (Chapter
3). In Chapter 4 the first results of the participating dairy farms are presented. In Chapter 5,

5
the importance and the effect of communication is briefly reflected upon. Finally, experiences
are reported, conclusions are drawn and an outlook is given for future developments of the
project (Chapter 6).

6
2. Participants in “Caring Dairy” and their mutual relations 2.1 Participating supply chain partners and stakeholders All supply chain partners are involved in “Caring Dairy” (see Figure 1): the dairy farmers as
primary producers, the buyer of milk as trader, the Hellendoorn ice cream factory as
producers of Ben & Jerry’s ice cream, the Ben & Jerry’s marketing organisation and scoop
shops responsible for the communication towards the consumers, and the consumers as final
users who are educated on the origin of the product they consume.
DairyFarmers
Consumers
Retailers&
Scoop shoops
Food companies
Trading company
Dairy supply chain
Input providers
Serviceproviders
KnowledgeInstitutes NGO IGO Policy
makersFinancialinstitutes Medias
Other stakeholders
Figure 1 Chain partners and other stakeholders within the “Caring Dairy”-project
Dairy farmers
Eleven dairy farmers participate in the project. These dairy farmers supply the amount of
dairy used for the production of Ben & Jerry’s ice-cream in Europe. The eleven dairy farmers
have been selected based on: (1) their willingness to participate, (2) their willingness to
convert towards more sustainable dairy farm practices, (3) the application of grazing for dairy

7
cows and/or young stock, and (4) the location of their farm with respect to the tanker
collection. Main reason for dairy farmers to participate is increasing their understanding of
their own business enabling them to work more efficient, which also helps them to anticipate
on changing EU legislation from volume based income support to sustainability based income
support. Moreover, ‘Caring Dairy’ will help to positively expose and improve the image of
dairy farming. When necessary, also suppliers of the dairy farmers (e.g. feed producers and
veterinary services) have been involved in the project.
Trading Company
Hoogwegt Milk BV is a trading company in dairy-products. Hoogwegt was founded in the
1960’s as a trading company in dairy products. Core-business is trading dairy commodities:
mainly butter, milk powders, whey powder and butter oils. The company has offices on all
continents. The trade in liquid dairy products is mainly within Europe; trade in solid products
is world-wide. Hoogwegt was owner of a dairy factory in Meppel (“de Kievit”), this factory
was sold in 1999 to Royal Friesland Foods. Because of an intervention of the Netherlands
Anti-Trust Authority (NMA) the supplying dairy-farmers where not allowed to switch to
Royal Friesland Foods. So the current situation is that approximately 250 dairy farmers
produce about 140 million kg milk for Hoogwegt Milk BV. Hoogwegt does not have any
processing facilities, and sells raw milk directly to other processors like Royal Friesland
Foods, DOC and Ola (the ice cream factory in Hellendoorn). This trade is mainly based on
long term contracts.
The dairy farmers supply their milk on a year-contract base to the trading company
(Hoogwegt Milk BV) which supplies the ice cream factory. High quality standards,
continuous improvement and care for the environment are integrated in Hoogwegt’s way of
working. Moreover, they have the vision that being prosperous in the long term requires being
sustainable. Hoogwegt’s role was to select and to enthuse farmers for Caring Dairy
participation and being the first point of contact for the participating farmers.
Food companies
Ben & Jerry’s Homemade Inc., an ice cream producer from Vermont, USA, was
founded in 1978 by two friends; Ben Cohen and Jerry Greenfield. Ben & Jerry’s ice cream
company is based on an effective sustainable corporate concept and strive to a sustainable
production of their products, laid down in a 3-part mission statement. In 2000 Ben & Jerry’s
was acquired by Unilever under the condition of keeping the unique philosophy and way of
working. In 2002 Ben & Jerry’s decided to move part of the ice-cream production to Europe.
This was done partly for logistical and sustainability (i.e. resulting form Life Cycle
Assessment analysis) reasons. Several European locations for ice cream production were
8
visited. The factory in Hellendoorn was chosen because it was situated in a rural area, most
similar to the situation in Vermont (ice-cream factory in the US). Another reason to choose
this factory was the size: a medium size factory providing enough capacity and enough
flexibility. Starting ice-cream production in Hellendoorn gave the possibility to translate Ben
& Jerry’s 3-part mission statement to the European context. “Caring Dairy” is one of the main
projects in this respect. The 3-part mission of Ben & Jerry’s consists of three interrelated parts
(Heard, 2003):
1. Economic
To operate the company on a sustainable financial basis, increasing value for the
stakeholders and expanding opportunities for development and career growth for the
employees.
2. Product
To make, distribute and sell the best quality of natural ice cream and new products with
use of natural ingredients and promoting business practices that respect the earth and the
environment.
3. Societal
To operate the company in a way that actively recognises the central role Ben & Jerry’s
plays in society by developing new ways to improve the quality of life locally, nationally
and internationally.
Central to the mission of Ben & Jerry’s is the belief that all three parts must be equally
represented with deep respect for individuals in and outside the company and to support the
communities of which they are part (Heard, 2003).
Securing a sustainable supply of dairy and helping farmers to do this is a natural way of
working for Ben & Jerry’s logically follows from this 3-part sustainable mission. The role of
Ben & Jerry’s in the project is being the initiator, main stakeholder and promoter. Also the
technical implications of the project, such as reformulating recipes, are a responsibility of Ben
& Jerry’s. The “Caring Dairy” project fits within the broader mission of Unilever (Ben &
Jerry’s mother company)-: to add vitality to life in meeting every day needs for nutrition,
hygiene and personal care with brands that help people to feel good, look good and get more
out of life.
Marketing via scoop shops and retail
Via among others scoops shops and retail outlets, Ben & Jerry’s is able to communicate on
projects such as ‘Caring Dairy’. By the combination of its sustainable mission and the fun and
lightheartedness of the brand, Ben & Jerry’s is able to make important serious issues tangible
and accessible for consumers. In this way, Ben & Jerry’s is able to improve the reputation of
the dairy farming sector.

9
Consumers
For consumers, the story around sustainable dairy matches their growing interest in: the origin
of the food they are consuming, animal welfare, caring for the environment and taking social
responsibility. As the project is brand driven, Ben & Jerry’s marketing and communications
functions are directly involved in steering and advising the project, constantly making the
direct translation of decisions made to the impact on communication towards consumers.
Other stakeholders
Besides all supply chain partners, the Animal Sciences Group (ASG) and the Agricultural
Economics Research Institute (LEI) of Wageningen University and Research Centre
participate in the project as content partners. Societal organisations (NGO’s like the
Worldwide Fund for Nature [WWF] and the Netherlands Society for Nature and Environment
[N&M]) and other stakeholders are involved as external advisors (see Figure 1).
2.2 Chain aspects and mutual relation between participating supply chain partners This section describes in short the development of the ‘Caring Dairy’ initiative and the role of
the supply chain partners in ‘Caring Dairy’. The content is based on interviews with a
representative of Ben & Jerry’s and Hoogwegt milk BV and on a workshop with the
participating dairy farmers. Decisions with respect to the organisation of the supply chain had
already been taken before the start of the project. Caring Dairy itself focussed mainly on
selecting enthusiastic dairy farmers and making dairy farming more sustainable. Still, it is
interesting to study supply chain aspects more explicitly, as the experience (obtained in other
co-innovation projects funded by AKK) shows that supply chain aspects are an important
factor in explaining the successful development and adoption of more sustainable agro-food
practices.
Theoretical framework
In order to analyse the chain aspects of the Caring Dairy initiative, the strategic cooperation is
structured along three dimensions: content, process and context. These aspects are generally
distinguished in strategic decision making (see e.g. de Wit and Meijer, 2004). For the content
dimension of strategic cooperation, it is important to establish in which activities supply chain
partners want to cooperate. For ‘Caring Dairy’ this is: sustainable ice cream production.
Furthermore, it is relevant: (1) to establish which parties are included for the cooperation and
(2) to analyse what unique contribution each chain partner can make to the strategic
cooperation: which competences are required, and who can provide these competences to the
cooperation?

10
For the process dimension of strategic cooperation, it is important to analyse how
supply chain relations develop, and also which mechanisms are affecting the dynamics of
supply chain cooperation. Trust had been identified as an important aspect of supply chain
cooperation (Goddijn and De Vlieger 2004). Apart from that, it is relevant that parties develop
a shared interpretation of what they understand by sustainable agro food production (Cramer
et al., 2004).
For the context dimension it is crucial to analyse the external environment in which
sustainable food production takes place. This is related to, for example, possible competitors
and the institutional structure of the cooperation. With respect to ‘Caring Dairy’ one can think
of other approaches to make ice cream production more sustainable, such as organic milk
production. Apart from that, it may be useful to pay attention to the institutional structure
prevailing in dairy production, processing and marketing in the Netherlands. Dutch dairy
processing companies, for example, have been diversifying very actively towards end
consumer markets (i.e. innovative dairy products), but the processing companies have been
reluctant so far to diversify towards raw milk production at farm level. This implies that fresh
raw milk is still treated as a commodity and that there is very little differentiation between
groups of farmers.
Even though the content, process and context dimensions can be distinguished
analytically, in practice they are often intertwined. Moreover, it should be kept in mind that it
was not possible within the ‘Caring Dairy’ project to elaborate on each dimension introduced
above extensively or systematically. Main observations will be made to illustrate the supply
chain aspects of the Caring Dairy project.
Development of the ‘Caring Dairy’ supply chain
Selection of supply chain partners
Ben & Jerry’s selected the OLA ice-cream factory in Hellendoorn for ice-cream production in
Europe. Hoogwegt Milk BV was the obvious partner for the milk supply as Hoogwegt Milk
BV already supplied the ice-cream factory in Hellendoorn. Hoogtwegt Milk BV decided to
participate from the start in ‘Caring Dairy’, even though it was not clear what this cooperation
would mean for Hoogwegt Milk BV or the supplying farmers. The main reasons for
Hoogwegt Milk BV to participate were:
- ‘Caring Dairy’ focuses on added value. Hoogwegt Milk BV is trading commodities; it
is difficult to secure your margins in such a market. Therefore, Hoogwegt Milk BV
took the opportunity to participate in the development of an added value chain.
- The content of Caring Dairy matches with the high quality standards Hoogwegt Milk
BV is aiming for.

11
- Ben & Jerry’s is one of the customers. If you can serve your customer you should do
so.
The volume is quite small (i.e. 11 dairy farmers) and the company has to put in effort to make
it work. This implies that ‘Caring Dairy’ does not actually contribute to the company profit.
Ben & Jerry’s mission statement also did not influence Hoogwegt’s decision. Hoogwegt does
not have an explicit social or environmental mission statement. At a more general level, the
project seems to fit in Hoogwegt’s profile to be increasingly involved in innovations meeting
the wishes and demands of their sellers and buyers.
Hoogwegt Milk BV was responsible for selecting dairy farmers. Hoogwegt Milk BV,
nevertheless, does not want to distinguish the eleven participating farmers from its other
supplying dairy-farmers. This implies there will not be a difference in milk price for the
participating dairy farmers. The other Hoogwegt dairy farmers were informed about the
project through the normal communication channels of the company, the most important
being the regular meetings of the association of milk-suppliers. The communication is limited
to general project information and to the guidelines for Sustainable Dairy Farming Practices
at the end of the project.
From cow to cone
Ben & Jerry’s ice-cream is made of condensed milk. The condensed milk is supplied by
Hoogwegt. The aim for the future is to produce ice cream with fresh milk. This fresh milk
should be fully supplied by the dairy-farmers that participate in the ‘Caring Dairy’ project.
The eleven participating farmers produce enough milk for the current ice cream production
including an estimated growth in production.
The principle of ‘green electricity’ (as it has been developed in the Dutch power
industry) has been considered as an option. This means that an equivalent of the amount of
milk that is used for the ice-cream production would be produced in a more sustainable way.
It is not necessarily, nevertheless, that this milk actually will be used in the ice cream. This
approach could work because there is no product claim (e.g. that the milk itself is better or
healthier) as the project is about improving the process of milk production. This option is not
selected as: (1) there is a big the difference between ice cream (food) and electricity, (2) food
is more closely connected with human emotions, (3) a direct relationship with the end product
is important for the participating farmers.
The current situation is that there is no one-to-one link between the milk of the
participating farmers of the ‘Caring Dairy’ project and Ben & Jerry’s ice-cream. To
accomplish this link two major changes are planned to be implemented:
1. The ice cream has to be produced from fresh milk; this means a change in recipes.

12
2. Logistics of Hoogwegt has to change: the milk of the ‘Caring Dairy’ farmers must be
collected separately and transported to Hellendoorn.
For the first change, a pilot has started in the ice-cream factory in Hellendoorn in 2005.
For the second change first calculations of extra costs are being made in early 2006. The
results of these calculations are not yet available, but one can expect that costs for collecting
milk for 11 farmers separately will be higher.
Caring Dairy approach
One of the main aspects of Ben & Jerry’s social mission statement is the Values Lead
Sourcing principle: the Ben & Jerry’s company aims to buy ingredients from companies that
share the same values. Because dairy is the most important ingredient of ice cream, and
because dairy farmers are under economic pressure, the choice was made to support the
supplying dairy farmers to make their production more sustainable.
The next question to be answered was how to support the farmers in making their
production more sustainable. This approach is described in Chapter 3 and is funded by Ben &
Jerry’s and the AKK co-innovation program, in which public and private parties cooperate to
develop and implement more sustainable agro food production and processing practices
(AKK Programma, Duurzame Agrofood ketens, Agri Chain Competence Centre Sustainable
Agro Food Chains program).
The used bottom-up approach offered the dairy farmers the possibility to take the lead in
making their milk production more sustainable. The identification and knowledge of
important indicators and parameters with respect to sustainable dairy production was provided
by the researchers from Wageningen University and Research centre and by the developed
knowledge and experience from Unilever’s sustainable agriculture programme and Ben &
Jerry’s Vermont based sustainable dairy farming project. The actual annual sustainability
improvement targets, however, are left to the dairy farmers in interaction with the researchers
and chain partners participating in the project. This bottom-up approach is selected because it
is very difficult to determine unambiguously an absolute standard for each sustainability
indicator. Moreover, sustainability issues interact with each other and the relative level of
sustainability that can be realised also depends on the individual farm situation. This approach
matches with the Ben & Jerry’s company philosophy of own responsibility (‘ownership’ or
internalisation of sustainability goals is considered more important than regulation, externally
imposed on dairy farmers).
Current position of dairy farmers in ‘Caring Dairy’
In November 2005 a workshop was organised with the dairy farmers on supply chain aspects.
Participating dairy farmers were asked to fill out a questionnaire to prepare the workshop. The

13
questionnaire resulted in scores for the view of the entrepreneur on his own competencies, his
own company (structure and results) and his view on external factors. This questionnaire was
used as a ‘quick scan strategy’ to help in the discussion on the position of the dairy farmers in
‘Caring Dairy’. Figure 2 shows the average score of the participating dairy farmers for nine
external factors. The scores for the price of production factors and the price of products were
quite low. This means that these external factors are considered as threats: the farmers expect
that land and milk quota will be expensive in the near future. The high score for growth
potential of location indicates they have the opportunity to develop their farms at the current
location. Furthermore, the participating dairy farmers see opportunities to work with their
colleagues and indicate that they judge social corporate sustainability and supply chain
aspects as relevant for their individual farm.
Figure 2 Average score of participating dairy farmers for nine external factors
Figure 3 presents the score for five different strategies: (1) cost-price, (2) supply chain
integration, (3) added value, (4) diversification, and (5) wait and see.
Figure 3 Average score of participating dairy farms for 5 different strategies

14
The cost-price, added value and wait en see strategy have the highest score. A low cost-price
is considered to be necessary to survive. Added value is one of the reasons to participate in
‘Caring Dairy’; some farmers hope that this supply chain will result in added value in the long
run. Wait and see also has a high score because of major policy changes at this moment of
time (e.g. manure policy, CAP reform).
The above mentioned scores were used to discuss their individual position in the supply
chain. The following points were discussed: (1) What is your relation with Ben & Jerry’s (do
you consider yourself an ambassador), (2) What can you offer Ben & Jerry’s (distinguishing
characteristics), and (3) What offers Caring Dairy\Ben & Jerry’s to you. The results of the
workshop are presented in a content, process and context perspective.
Content
Innovative projects often start with people that are enthusiastic and willing to participate.
Gradually it becomes clearer what the content is of the cooperation and also whether this
cooperation actually fits with the strategic orientation and competences of the supply chain
partners participating initially (Van der Schans, 2004). This implied that ‘Caring Dairy’ was
more about developing a practically viable concept of sustainable ice cream production rather
than just implementing a predetermined plan. As the project unfolded, supply chain partners
learned from each other, and they started to become more aware of their respective strategic
position in the supply chain. The end result is not a unanimously agreed conception of
strategic cooperation for sustainable agro food production, but rather a more collectively
shared and better understanding of each partner’s individual position in the supply chain, and
an unique contribution to sustainable dairy production. As a result, dairy farmers discussed if
their dairy production at farm level was already distinctive from other dairy farms. As ‘Caring
Dairy’ has started only recently, no tangible and distinctive results are obtained yet. The
project has focussed up till now on the process of mutual learning with respect to improving
sustainability of milk production (explicitly by developing improvement plans) and with
respect to strategic cooperation (more implicitly).
Most dairy farmers interpreted the cooperation between Hoogwegt Milk BV and Ben &
Jerry’s as a strong combination of certainty (Hoogwegt has diversified its trade to include
many different products made from milk, hence there will always a market for the milk
supplied by the farmers), and added value (Ben & Jerry’s is solely focuses on ice cream
production, the Ben & Jerry’s brand is positioned at the higher end of the consumer market).
This illustrates the point that cooperation in a (sustainable food production) chain is all the
more successful when participating parties have complementary rather than competing
competences (Zuurbier et al 1996). It is also interesting to note that successful supply chain
cooperation does not seem to require parties to have exactly the same strategic orientation

15
towards sustainability. It seems quite possible that one party is focussed on value added
production, whereas other parties in the supply chain remain focussed in differentiation or low
cost production. This point is often overlooked in Dutch policy documents recommending a
value added strategy for the entire agro food chain (e.g. LNV 2000), which takes for granted
that a value added strategy at processing or retail level automatically allows for a value added
strategy at farm level.
In practice, however, local farmers supplying to a value added chain concept may still
be required to pursuit a low cost strategy, as the supply of milk is increasingly considered a
competitive international market (see also RLG, 2003). A low cost strategy, nevertheless, can
also be beneficial for other sustainability indicators (e.g. decreasing the purchase of
concentrates can be beneficial for both economic as well as ecological sustainability). As long
as there is no exclusiveness of Ben & Jerry’s production requirements at farm level, it may be
rational for supplying farmers to stick to a low cost strategy, which allows them –if the need
arises- to switch to other dairy chains (including the bulk market for fresh milk).
The more exclusive the relation between farmers and processors becomes in the future,
the more it may be possible for parties supplying the milk to engage in a value added strategy
(e.g. farmers supplying milk to Cooperative Dairy Factory Rouveen obtain a surplus of 0.005
euro per kilo for applying grazing; Zuivelzicht 9 nov. 2005, p. 18). The surplus value of
improved farm management is the motive for the dairy farmers to participate in ‘Caring
Dairy’, rather than a surplus price (interview with dairy farmer Rudi Hooch Antink Agrarisch
Dagblad, April 2005). This was confirmed in the discussion in the workshop were all
participating farmers stated that the most important result of the project so far was
‘knowledge’ and this is also what they expected for the next phase.
Process
From the discussion at the workshop it became clear that the start of ‘Caring Dairy’ was based
mainly on trust of farmers in Hoogwegt. This trust already existed before the project started.
The relation with Ben & Jerry’s is built up during the first year of the project. As the project
developed throughout the year farmers also became more familiar with the Ben & Jerry’s
company, and they increasingly identified with Ben & Jerry’s as a premium ice cream brand
in the consumer market. The activities within the project are organised in such a way that it is
very entertaining to participate, this fits with the image of the final product (i.e. Ben & Jerry’s
ice cream is fun). Trust in Ben & Jerry’s has been built up during the first year of the project,
but at the workshop most farmers’ reported that their relation with Hoogwegt was still more
important to them than their relation with Ben & Jerry’s. Some of the dairy farmers really feel
like being an ambassador for Ben & Jerry’s.

16
The project is indeed very much a mutual learning process: what is sustainable milk
production, what can be role of farmers in the Ben & Jerry’s chain? The final goal of the
learning process was not (yet) to define a standard of sustainable milk production (as is
usually done for example in a process where a certificate is developed). Rather the focus was
on exploring possibilities to improve the performance of dairy farms with respect to a given
set of sustainability indicators. Due to the fact that the sustainability approach within Caring
Dairy is based on finding the right balance between the economic, social, environmental and
animal welfare aspects - and accepting in that, that the most sustainable solution can vary for
each individual farmer - farmers were able to develop trust in other chain partners and they
became more confident that they could improve sustainability without additional costs. By
using this approach, improving the sustainability performance of dairy farming is not seen as
a threat but as an opportunity.
The whole learning process has also benefited from input of external expertise helping
farmers to translate abstract dilemmas into concrete actions at their own farm. The interaction
with the Wageningen University and Research centre researchers was besides information
exchange, strongly focussed at strengthening the strategic insight of the farmers (create
possibilities for manoeuvre, regain control over own farm, increase internal locus of control).
Despite the fact that participating dairy farmers and chain partners developed mutually
shared interpretations of strategic cooperation for sustainable dairy production, it appeared to
be difficult to explain the ‘Caring Dairy’ approach. Farmers indicated that they had
difficulties to explain why Ben & Jerry’s started the project and what makes the project
distinctive. Ben & Jerry’s agreed to make an information leaflet to explain the particularities
of the project in common language.
Context
The societal image of Dutch dairy farming is relatively good. There is a trend, however, in
dairy farming to keep cows in the barns year round. This zero-grazing strategy has attracted a
lot of attention in Dutch society and media, also during the course of the ‘Caring Dairy’
project.
If we talk about more sustainable dairy farming, it seems obvious to compare the
‘Caring Dairy’ chain with the organic milk production chain. If, however, participating dairy
farmers would have shifted to organic dairy production, their cost price would have been
increased and they would have become dependent of Ben & Jerry’s. In the current ‘Caring
Dairy’ approach dairy farmers will not become dependent on the Ben & Jerry’s ice cream
production chain (there are no high transaction specific investments). This is one of the
reasons Ben & Jerry’s explicitly chose not to organise the dairy supply organically. They do
not want to make the farmer dependent. More importantly even, Ben & Jerry’s believes in the

17
strength of a holistic or integrated sustainability approach where it’s not only looked at
environmental aspects, but always in balance with the economic, social and animal welfare
aspects. Such an integrated approach is eventually applicable and of added value for
mainstream dairy farming. However, Caring Dairy wants to learn from the valuable
knowledge and experience of the organic approach to the extent that it fits in the objectives of
Caring Dairy. Therefore, an organic dairy farmer is participating in the Caring Dairy project
and is part of the project team to actively advise and reflect in all stages. Another reason not
to choose for organic is that it is the easy way, you choose for organic including the
drawbacks and you’re done. The choice is made to have an active role in making the
production more sustainable in a realistic way that works for everyday practice at the farm. A
consequence of this is that the focus of the project is on the improvement process that will be
laid down in guidelines and not on certain fixed standards like using no fertiliser. Even though
this is probably more difficult to communicate with consumers, it fits in more with the Ben &
Jerry’s philosophy of working closely with their suppliers to make sustainable, meaning also
long-term, improvements and lead with that by example. ‘Caring Dairy’ is different compared
to most other Dutch dairy chains as it establishes a link between a branded consumer product
and a distinctive group of farmers. In most dairy production chains in the Netherlands there is
no direct link at all between end product and farmer. The dairy sector in the Netherlands is
known for its market orientation and product development. Dairy companies compete with
each other in terms of differentiation between products and target markets after the processing
stage (from factory to retail to end consumer). Prior to the processing stage however, Dutch
dairy companies do not differentiate at farm level between different streams of raw milk. Raw
milk is still considered a commodity, there are quality enhancement programs but these are
sector wide.
There is very little experience with market concepts that distinguish between production
aspects at farm level. This may be due to the predominant collective organisation of dairy
processing. Farmers argue that all milk is of good quality, promoting milk of a distinct
(better) quality originating from a distinct group of farmers may negatively affect the
consumer perception of all other milk produced by Dutch farmers. Besides, there is the
logistics aspect; if dairy processors would start to distinguish between milk streams they
would also have to collect and process these streams separately, this would increase the cost
of collecting and processing. Only recently, Dutch dairy processors are experimenting with
identity preserved or dedicated supply chains (which one might call the emergence of a new
production paradigm: the ‘differentiation at farm level’ production philosophy; Van der
Schans 2005). The Cooperative Dairy Factory in Rouveen, already mentioned earlier, has
developed the ‘differentiation at farm level’ production philosophy as its core competence,
and is able for example to separately collect milk produced according to Jewish or Muslim

18
standards, and also to process this milk separately by using the same tanker collection and
dairy factories (Zuivelzicht 9 nov. 2005). The Caring Dairy project is one of the few concrete
examples (together with the Cooperative Dairy Factory in Rouveen and CONO) of how this
type of differentiated production philosophy may work out.

19
3. Development of Sustainable Dairy Farming Guidelines: the “Caring Dairy” approach
3.1 Introduction The ‘Caring Dairy’ project is based on Unilever’s sustainable agriculture initiative (Unilever,
2005) and is supported among others by Interactive Strategic Management (Smit et al., 2002)
and the Farm Sustainability Index (Van Calker et al., 2005a; Van Calker et al., 2005b), a
method to asses sustainability in Dutch dairy farming. Unilever’s sustainable agriculture
approach is build upon 7 years’ experience of developing sustainable agriculture practices for
specific crops such as tea, palm oil, spinach, peas and tomatoes (Unilever, 2003a; Unilever,
2003b; Unilever, 2004; Unilever, 2005).
‘Caring Dairy’ is based on a triple bottom line approach in which the right balance
between economic growth, environmental protection, social progress and animal welfare as a
part of it, is searched for. To develop sustainable agricultural guidelines a five step procedure,
which is in accordance with literature (Bell and Morse, 1999; De Boer and Cornelissen,
2002), is followed. This five step procedure consists of:
1. Define sustainable dairy farming;
2. Define principles which will be followed during the transition towards more sustainable
dairy farming;
3. Define indicators to work on;
4. Select parameters that measure the sustainability of the selected indicators;
5. Assessment of guidelines for sustainable dairy farming practices.
The individual steps will be presented below.
3.2 Definition of sustainable dairy farming (step 1) Much of the debate about the nature and potential of sustainable agriculture focuses on
definitions (Francis and Youngberg, 1990). Two popular and widely used definitions of
sustainable development are given in Our Common Future (Brundtland, 1987) and in Caring
for the Earth (Munro and Holdgate, 1991). These are, respectively, “development that meets
the needs of the present without compromising the ability of future generations to meet their
own needs” and “development that improves the quality of human life while living within the
carrying capacity of supporting ecosystems.” Such broad definitions are likely to give rise to
various different interpretations (Callens and Tyteca, 1999). The result is that at least 70 more
definitions have been constructed, each different in subtle ways, each emphasising different
values, priorities, and goals (Pretty, 1995). Still, it is important to agree on a definition of
sustainable dairy farming as this definition contains the joint objective of the project.

20
Together with all participating supply chain members and key stakeholders the following
definition of Sustainable Dairy Farming was agreed upon:
Sustainable dairy farming is protecting and improving the natural environment,
animal welfare, and conditions of the local communities, while at the same time
being productive and efficient.
3.3 Principles: general statements of purpose and intent (step 2) Besides the definition for sustainable dairy farming also principles for sustainable dairy
farming were defined. These principles are used to guide the project and to deepen the
definition of sustainable dairy farming. In our approach for sustainable development of dairy
farming we support the following principles:
• Producing milk with a high nutritional quality to meet existing and future needs, while
keeping resource inputs as low as possible.
• Ensuring that any adverse effects on soil fertility, water and air quality, landscape and
biodiversity from dairy farming activities are minimised and positive contributions are
made where possible.
• Optimising the use of renewable resources while minimising the use of non-renewable
resources.
• Sustainable dairy farming should enable local communities to protect and improve
their well-being and environments.
• Sustainable dairy farming should ensure an optimal well-being of the animals (cows).
To be able to successfully support these principles, a set of indicators and parameters have
been developed to measure and subsequently improve the sustainability performance.
3.4 Sustainability Indicators: specific areas on which to focus work (step 3) In this research we made a gap-analysis of existing standards/initiatives1 regarding sustainable
(dairy) farming to secure full coverage of the three sustainability aspects (i.e. economic, social
and ecological sustainability), resulting in eleven indicators: soil fertility/health, soil loss,
nutrients, pest management, biodiversity, farm economics, energy, water, social/human
capital, local economy, and animal welfare. The gap analysis resulted in the same set of 10
indicators of Unilever’s sustainable agriculture programme – which proves the generic value
of it – plus animal welfare. Attention for animal welfare is a prerequisite in relation to
1 For the gap-analysis, existing standards and systems were analyzed. For example: Dutch quality system KKM (representing the Dutch current approach), Organic, the standards the University of Michigan developed for the Ben & Jerry’s Vermont based sustainable dairy farming approach, Cows and Opportunities and the Dutch Farm Sustainability Index (Van Calker, 2005)

21
sustainable dairy farming, both for producers and consumers (Van Calker et al., 2005b).
These eleven indicators perfectly fit in a framework that was developed to assess
sustainability of Dutch dairy farming (Van Calker, 2005) and encompass the triple-p
dimensions (i.e. people, planet and profit). The definition and content of all selected
Sustainability Indicators is presented in Table 1.
Table 1 Definition and content of Sustainability Indicators
Indicator Soil fertility/health Soil is fundamental to agricultural systems, and a rich soil ecosystem contributes to
crop and livestock performance. Sustainable practices can improve beneficial components of the soil’s ecosystem.
Soil loss Soil eroded by water and wind can lose both structure and organic matter, diminishing the assets of an agricultural system. Sustainable practices can reduce soil erosion.
Nutrients Crops and livestock need a balance of nutrients. Some of these can be created locally (e.g., nitrogen), and some must be imported. Nutrients are lost through cropping, erosion and emissions to the air. Sustainable practices can enhance locally produced nutrients and reduce losses.
Pest management When pesticides are applied to crops, a small but significant proportion can escape to water and air or accumulate in foods, affecting ecosystems and human health. Sustainable practices can substitute natural controls for some pesticides, reducing dependence on synthetic substances.
Biodiversity Agriculture has shaped most ecosystems in the world, and biodiversity can be improved or reduced by agricultural practices. Some biodiversity is highly beneficial for agriculture. Sustainable practices can improve biodiversity - by ‘greening the edge’ of the fields.
Farm economics/ value chain
Farm economics is a measure of the desired economic output of an agricultural system. Sustainable practices should be able to maintain or improve farm’s economic situation. Value chain is the term for the sum total of all value-adding activities which lead to putting a product on the market. For ice cream, farm economics is an integral part of the value chain.
Energy Although the energy of sunlight is a fundamental input to agriculture, the energy balance of agricultural systems depends on the additional energy supplied from non-renewable sources to power machinery. Sustainable practices can improve the energy balance and ensure that it remains positive - there is more energy coming out than going in.
Water Some agricultural systems make use of water for irrigation, some pollute or contaminate ground or surface water with pesticides, nutrients or soil. Sustainable practices can make targeted use of inputs, and reduce losses.
Social/human capital The challenge of using natural resources sustainable is fundamentally a social one. It requires collective action, the sharing of new knowledge and continuous innovation. Sustainable agriculture practices can improve both social and human capital in order to ensure normal outputs. The prime responsibility for this should remain with the local community, leading to realistic and actionable targets.
Local economy Agricultural inputs (goods, labour, services) can be sourced from many places, but when they come from the local economy, the expenditure helps to sustain local businesses and livelihoods. Sustainable agriculture practices can help to make the best use of local and available resources in order to increase efficiency.
Animal welfare Animal husbandry systems are becoming ever more specialised and therefore further removed from the wild habitat where farm animal ancestors evolved. Treatment of animals in contemporary artificial environments is a major ethical concern. Care must be taken that the animals can live in harmony with their environment.

22
3.5 Parameters: data points that quantify sustainability (step 4) Defining parameters for measuring the sustainability of the selected indicators is a two-step
process (De Boer and Cornelissen, 2002). The first step identifies all possible sustainability
parameters. The second step selects relevant sustainability parameters based on 5 criteria:
1. Relevant to the indicator of concern and comprehensible to all stakeholders
2. Objectively quantifiable and possible to influence at farm level (i.e. sensitive)
3. Proven validity
4. A (individual) target value can be determined for the parameter
5. Simplicity and technical and financial feasibility to measure the parameter
The parameters were selected based on a wide variety of sources: studies (Van Calker et al.,
2004; Van Calker et al., 2005c) that selected parameters for measuring the sustainability of
Dutch dairy farming systems, insights from other crops in Unilever’s sustainable agriculture
programme (Unilever, 2003/2004), knowledge from other sustainable dairy projects (e.g.
Oenema et al., 2001a; e.g. Bylin et al., 2004), and further literature research. The most
important included parameters that are used to measure the eleven Sustainability Indicators
are presented in Table 2.

23
Table 2 Selected parameters data quantify sustainability for “Caring dairy”
Indicator Parameter Unit/measure/requirement Soil fertility/health Organic dry matter % organic dry matter Nutrient content soil % of nutrients and minerals Clover % clover in grassland Crop rotation scheme description History of fields description
Soil loss Soil cover index % time is covered with crops No grazing zones measure
Nutrients Farm surpluses (N and P2O5) kg N per ha; kg P2O5 per ha Farm Surplus (heavy metals) kg (Cd, Cu and Zn) per ha Eutrophication Potential kg NO3 per ha Acidification Potential kg NH3 per ha Intensity kg milk per ha Concentrate use kg concentrate per 100 kg milk
Pesticides Pesticide use kg active matter per ha Eco-toxicity potential 1,4 DCB eq. per ha
Biodiversity Nature and landscape value Agricultural Nature Norm Analysis Meadow birds voluntary inventory
Farm economics Net farm income € per entrepreneur Cost price of milk € per 100 kg milk Animal health status disease prevalence per farm Quality program meet requirements
Energy Direct electricity use kwh per 100 kg milk Gas use m3 per 100 kg milk Fuel use m3 per 100 kg milk Indirect energy use mj per 100 kg milk Global Warming Potential kg CO2 per 100 kg milk Use of green energy measure
Water Use of tap water m3 per 100 kg milk Use of ground water measures related to irrigation Salinity measures
Social human capital Work load hours work per week Holidays days per year Courses number per year Guided tours number per year
Local economy External land use % of external hectares Cooperation with local
farmers description
Animal welfare Condition score score from 1 to 5 Locomotion score score from 1 to 5 Skin score score from 1 to 5 Possibilities for grazing measure Age dairy cows years Housing conditions checklist score

24

25
3.6 Sustainable Dairy Farming Guidelines: practices that lead to measurable improvements (step 5)
The Guidelines for Sustainable Dairy Farming Practices will be the result of the process of
continuous improvement (see Figure 4). This process itself is the main part of the project and
is based on a bottom-up approach, i.e. tailored to the specific situation and priorities of the
individual farmer. The most sustainable solution is dependent on the context an individual
farmer works in, - e.g. soil type, farm type, weather conditions, and land division -which
implies sometimes a trade-off between the various sustainability indicators. This means that
each participating farmer selects his own path to sustainability. A consequence can be that
one dairy farmer focuses on farm economics, nutrients, water and biodiversity while another
dairy farmer focuses on farm income, animal welfare and social human capital. Still the
process of continuous improvement will be done for all eleven indicators.
Improvementplans
Implementation:change practices
Measuring Evaluation
2007
SustainableDairy Farming
PractiseGuidelinesImprovement
plansImplementation:change practices
Measuring Evaluation
2004 .........
Figure 4 Process of continuous improvement leading to Guidelines for Sustainable
Dairy Farming Practices
The process of continues improvement consists of four consecutive steps: measuring,
evaluation, development of improvement plans and implementation of these improvement
plans (change of practices). The first phase started with a base-line measurement on the
participating dairy farms. The dairy farms were visited and general and historical data of the
farm, the farmer and his family was collected. Furthermore, most data for measuring the
parameters per indicator was collected. Subsequently the collected data was analysed and
evaluated, both internally (i.e. with farmers) and externally (i.e. with experts), forming the
base of the improvement plans. Indicator specific sessions were organised to evaluate the
collected data and to develop individual improvement plans per indicator. Before starting with
organising the specific indicator session, a strategic improvement plan was developed by all
dairy farmers individually. The strategic improvement plans focus on strategic management
and forms the outline of the project, whereas the indicator specific improvement plans focus
on operational and tactical management.
26
Strategic improvement plans
Strategic improvement plans have been developed using Interactive Strategic Management
(Smit et al., 2002), which is based on the principle that the farmer has a central role in
developing his own strategy that matches his own farm-situation and personal ambitions and
competences. The strategy development starts from long-term goals to insure the
incorporation of the sustainability indicators. For the application in this project Interactive
Strategic Management consists of two parts (Ondersteijn et al., 2002, Beldman et al., 2002):
(1) Strategic Management Report (SMR), and (2) Game Simulation Dairy. For the SMR the
farmer was asked for his vision on his environment, his farm and on his role as craftsman and
entrepreneur. Subsequently, the farmer was asked to make a SWOT (Strengths, Weaknesses,
Opportunities, and Threats; Strengths and Weaknesses are internal factors and Weaknesses
and Threats are external factors) analysis. Finally, the farmer was asked to formulate the goals
for the sustainable development of his dairy farm. These goals are used as input for the Game
Simulation Dairy (Hennen, 1995). This model, based upon linear regression, calculates the
effects of changed management on technical, economic, and ecological results. In several
iterations the farmer was able to adjust his strategic and tactical farm management to achieve
his goals, which resulted in a strategic improvement plan.
Indicator specific improvement plans
The indicator specific improvement plans have been developed during indicator specific
sessions. The focus of a particular indicator session was determined in deliberation with the
dairy farmers. In general, the indicator specific sessions consisted of three parts: (1)
presentation of the results of the base line measurements of the specific indicator in the
context of the complete group of participating farmers, (2) an expert presentation on the latest
developments and management measures to improve the performance of the specific
indicator, (3) development of individual improvement plans for the specific indicator based
on a SWOT analysis, including an assessment of the possible impact of the plans on other
indicators. These sessions were organised on the farms of the participating farmers. In this
way, trust and a relationship between the farmers was build, an important part of the learning
objectives of the whole process. All sessions were evaluated and learnings were used to
improve new indicator specific sessions. The focus and the order of the indicator specific
sessions were determined by the participating dairy farmers. This emphasises the bottom-up
approach of the ‘Caring Dairy’ project.
Yearly an ‘overall’ improvement plan was and will be developed by each farmer for his
individual farm. Such an ‘overall’ improvement plan is a full integration of the strategic
improvement plan and all indicator specific improvement plans. Each farmer presented his
plan to the group, which supported the mutual learning process.. Furthermore, the

27
development and presentation of the ‘overall’ improvement plans can be seen as an additional
push to actual implement the improvement plans. After implementation of the improvement
plans the cycle of measuring, evaluation, development of improvement plans and
implementation of improvement plans starts over again. Together with literature research this
process of continuous improvement leads to management measures that have a proven
contribution to sustainable development. These management measures are the basis of the
Sustainable Dairy Farming Practices guidelines. These guidelines will be finished at the end
of 2008 and subsequently handed over to the dairy sector. At this moment, i.e. beginning of
2006, the first cycle of measuring, evaluation, development and implementation of
improvement plans is finished. The first results are presented in Chapter 4.

28
4. Results of participating dairy farms In this chapter some of the main results of the participating dairy farms on the selected
parameters are presented. Furthermore, examples of the strategic improvement plans and the
indicator specific improvement plans are presented.
4.1 Development of strategic improvement plans by using Interactive Strategic Management
A lot has changed around dairy-farming in the last decades of the 20th century. For dairy
farmers these changes resulted in a shift from craftsmanship towards entrepreneurship. First,
the developments of Dutch dairy farming are presented. Subsequently, the Interactive
Strategic Management methodology and the results for ‘Caring Dairy” are presented.
Developments Dutch dairy farming
Table 3 shows the development of the number of dairy farms in the Netherlands from 1960
until 2000. The table shows a large decrease of the number of farms. Until the eighties, the
number of dairy cows increased. Introduction of the quota-system, however, led to a decrease
of the number of dairy cows and at this moment of time the dairy-herd is smaller compared to
1960.
Table 3 Development of dairy farming in the Netherlands
1960 1980 1990 2000
Farms with dairy cows (*1000) 185 67 47 29
Total number of dairy cows (*1000) 1625 2350 1900 1504
Number of cows per farm 9 35 40 51
Number of hectares per farm 14 20 26 32
The change of dairy-farm structure can be explained from different developments. Three
major periods can be distinguished in this period.
First period 1960 -1985: specialisation and growth
The first period is characterised by specialisation and growth. New technology was
introduced, starting with tractors and milking machines. New housing systems (cubicle house)
and refrigerated tanks followed. The mixed farms (i.e. pigs, arable crops and dairy)
specialised towards one branch and could grow. The government had a supportive role in this
development mainly through a big research- and extension organisation. For the farmer the
direction to go was quite clear.

29
Second period 1985-2000: limits to growth
The growth in (European) milk production, combined with the EU-policy (i.e. production
supporting) caused major financial problems within the European Union. This resulted in the
introduction of the quota-system within the European Union. Farmers focused more on
reducing costs. In the same period negative side-effects of the growth and intensivation of the
dairy-production became clear. This resulted in the introduction of new laws trying to control
the production and use of manure and nutrients. This means the role of the government
changed from a stimulating role to a controlling role. In the same period the extension
organisation was privatised. The farmer focused more on craftsmanship and on quality of
production.
Third period 2000 - now: entrepreneurship
The role of the government is changing even more: the protection of dairy will gradually
disappear because of the reform of the EU-policy (i.e. Common Agricultural Policy). The role
of the government is changing more towards a facilitating role. Agriculture including dairy
farming is considered to be a ‘normal’ economic activity. This means that the role of the
farmer also has to change. Good craftsmanship is not enough to survive. The farmer has to
develop his own strategy.
Methodology Interactive Strategic Management
These changes are leading to a change in questions of the farmers: new ways of planning are
required. Experiences in several projects with farmers in different sectors have lead to a new
method to support farmers in their strategic decisions. This method is called: Interactive
Strategic Management. The main characteristics of this method are:
- The entrepreneur as pivot of the process (advisor in facilitating role);
- Strategy is leading (tactical and operational decisions based on strategy);
- Sustainability incorporated (balance between people, planet, profit);
- In interaction with surroundings (partners within farm, partners within chain,
neighbours, citizens etc.).
These main principles match closely with the bottom-up approach of Ben & Jerry’s and the
‘Caring Dairy’ project. By using Interactive Strategic Management the individual outlines
within the ‘Caring Dairy’ project is determined for all dairy farmers. This outline will also be
used as guiding principle in the assessment of the individual improvement plans. The
following activities were organised within the ‘Caring Dairy’ project to assess the strategic
improvement plans within the framework of Interactive Strategic Management

30
1. First session with the group started with the explanation of the used approach. The
farmers had to formulate their own mission and strategy. So we started with their
personal ambitions and goals, asking questions like: ‘Why are you a dairy-farmer’.
2. We gave the farmers a home assignment to prepare the next session: ‘Analyse the
strong and weak points of your farm and think about the strategic options you would
like to explore in the second session’.
3. In the second session farmers worked with the Game Simulation Dairy (GSD). This
program is operated by the farmer and works with the farmers’ own data. The model
calculates effects of strategic and tactical measures. New developments were included
in the Game Simulation Dairy. Most important was the incorporation of the new
policy related to the use of manure and fertiliser. In a short time-span (i.e. 2-3 hours) a
farmer can explore the effect of several packages of strategic and tactical decisions.
Dairy farmers working with Game Simulation Dairy
For each farmer these steps resulted in a personal report with his own personal mission and
goals translated to a quantified strategy based on the game simulation session. This personal
document, called Strategic Management Report, is the strategic framework for the other
indicator sessions. For farmers the sustainability indicators are no goal itself, but if it is
possible to realise improvements on these indicators within the own strategy a lot can be
achieved. If improvement of a certain indicator does not match with the own strategy this will
become clear from the start and choices can be made (i.e. to adjust the strategy or to accept a
lower score on this indicator).

31
Results Interactive Strategic Management
Results mission and strategy
Each farmer made his own Strategic Management Report, with personal goals and also a
quantified strategy. The main reasons to be a dairy-farmer according to the Caring-Dairy
farmers were:
- to be independent (i.e. make your own decisions);
- to work in and with nature (i.e. animals);
- return on investment is not a major drive, continuity of the (family) farm is.
The strategy of most farmers focuses on growth of the farm, in total milk production (buying
milk quota) and in farm surface (hectares). Most farmers also focus on optimizing technical
and economical results. Some farmers mention improvement of the image of dairy-farming in
the Netherlands.
Results workshop Game Simulation Dairy
The farmers quantified their strategy with the GSD-model. This model is developed to
explore technical and economical effects of different measures. Effects are shown on
technical results (e.g. fodder production, milk yield per cow, number of cows, concentrates
per cow), economic results (e.g. gross margin, fixed costs on indicative base) and on use of
nutrients (e.g. nutrient balance sheet for nitrogen and phosphorus, use of manure and N and P
compared with the standards of the new manure legislation). The farmers were asked to make
the plan for the year 2009. Each farmer could explore several options during the workshop. At
the end of the workshop the dairy farmers had to choose their own ‘best’ plan. The ‘best’ plan
had to fit in their personal goals and mission and the ‘best’ plan should be feasible to
implement. Below results are presented for the planned milk quota and area expansion.

32
0
100
200
300
400
500
A B C D E F G H I J K µ
Participating dairy farms
Milk
quo
ta (*
100
0 kg
)
Figure 3 Planned milk quota expansion (*1000 kg) of the participating dairy farms in
2009
-10
0
10
20
30
40
50
60
A B C D E F G H I J K µ
Participating dairy farms
Lan
d (h
a)
Figure 4 Planned area expansion (ha) of the participating dairy farmers in 2009
Given the Dutch situation of a changing EU subsidy regime and decreasing milk prices, most
improvement plans developed by the participating dairy farmers are based upon growth in
milk quota and land area. This shows that all dairy farmers have the ambition to continue their
farming business.
Farmers also indicated to change fertilisation schemes on grassland (see Figure 5) and to
change feeding and grassland management (Figure 6). This is mainly caused by the new
policy on use of manure and fertiliser and probably will improve the environmental quality.

33
0
2
4
6
8
10
12
Lowering N-fertilizing level
grassland
Improvementof use ofmanure
Lowering Partificialfertilizer
Num
ber o
f fa
rms
No changeChange
Figure 5 Planned change of fertiliser management of participating dairy farms
0
2
4
6
8
10
12
Improvementgrass-quality
Improvementyield grassland
Improvementutilization ofconcentrates
Num
ber o
f far
ms
No changeChange
Figure 6 Planned change of feeding and grassland management of participating dairy
farms

34
Each farmer received a printed report of his ‘best’ strategic improvement plan. This plan is
not yet a very detailed plan: it is the strategic and tactical framework (i.e. outline) for the
assessment of the indicator improvement plans.
4.2 Results and improvement plans per indicator
Soil fertility/soil health
We have defined soil health/fertility as ‘the capacity of a specific kind of soil to function,
within natural or managed ecosystem boundaries, to sustain plant and animal productivity,
maintain or enhance water and air quality, and support human health and habitation’. Soil
fertility and soil health is based on a variety of characteristics, including organic matter,
available nutrients, structure, pH, and water holding capacity (see Table 2). Healthy soils are
not only important to farm production, but also to overall environmental health. Soil that is
compacted, for example, cannot absorb as much water, which increases the amount of runoff
of nutrients and pesticides. In the ‘Caring Dairy’ project direct and indirect measurements are
done. Direct observations (i.e. soil samples) are related to soil characteristics like organic
matter content and available nutrients. These direct soil samples are obliged for all parcels
every four years since the introduction of a new manure policy in 2006. Based on these soil
samples fertilisation schemes can be assessed. The indirect measurements are related to soil
characteristics like soil fauna species (e.g. earthworms) and soil structure and the quality and
depth of roots of grasses. Earthworms are important in maintaining the soil structure, aeration,
nutrient cycling, drainage and in breaking down organic matter for incorporation into the soil
profile. Earthworms also stimulate microbial activity, mix and aggregate soil, increase
infiltration rates and water-holding capacities. The quality and depth of the roots indicates the
possibilities for grasses to use water from deeper soil layers. The indirect measurements are
done by digging several holes in different parcels and to measures the number of earthworms
and to estimate the soil structure and quality and depth of the roots of grasses.
Dairy farmers digging holes to assess the soil fertility and health
On the basis of the direct and indirect measurements and the provided information by the soil
fertility expert improvement plans for soil fertility were determined. Examples of
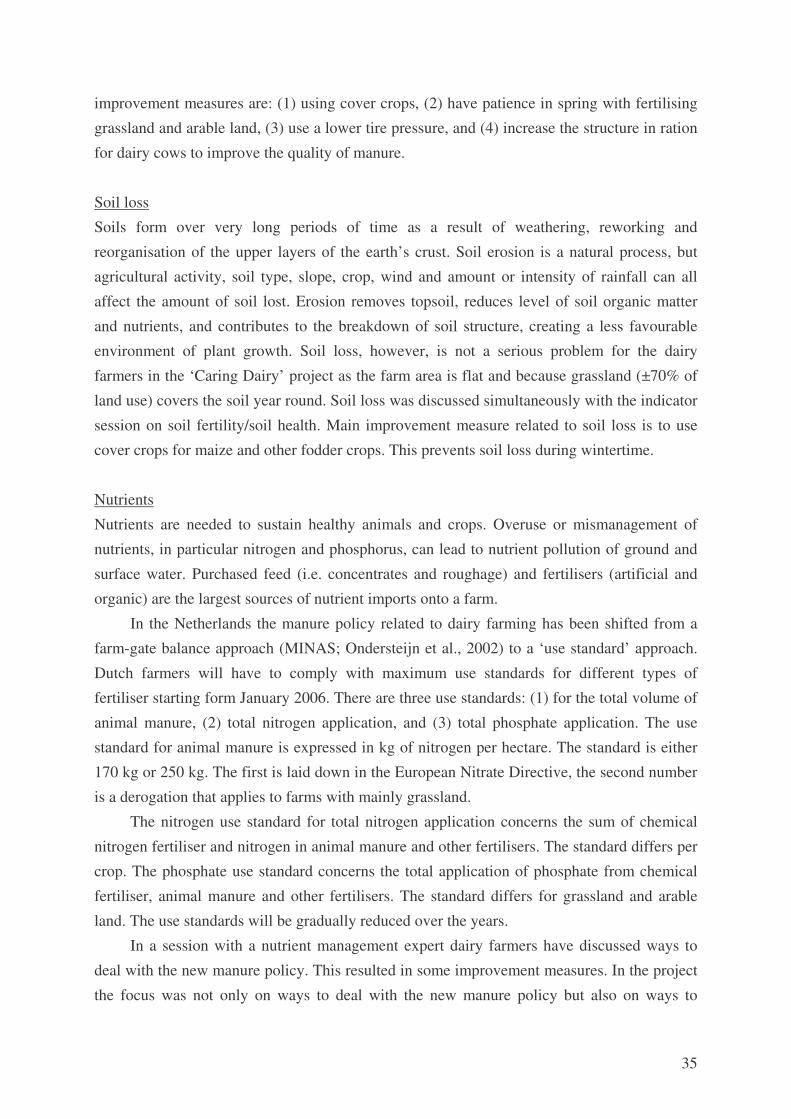
35
improvement measures are: (1) using cover crops, (2) have patience in spring with fertilising
grassland and arable land, (3) use a lower tire pressure, and (4) increase the structure in ration
for dairy cows to improve the quality of manure.
Soil loss
Soils form over very long periods of time as a result of weathering, reworking and
reorganisation of the upper layers of the earth’s crust. Soil erosion is a natural process, but
agricultural activity, soil type, slope, crop, wind and amount or intensity of rainfall can all
affect the amount of soil lost. Erosion removes topsoil, reduces level of soil organic matter
and nutrients, and contributes to the breakdown of soil structure, creating a less favourable
environment of plant growth. Soil loss, however, is not a serious problem for the dairy
farmers in the ‘Caring Dairy’ project as the farm area is flat and because grassland (±70% of
land use) covers the soil year round. Soil loss was discussed simultaneously with the indicator
session on soil fertility/soil health. Main improvement measure related to soil loss is to use
cover crops for maize and other fodder crops. This prevents soil loss during wintertime.
Nutrients
Nutrients are needed to sustain healthy animals and crops. Overuse or mismanagement of
nutrients, in particular nitrogen and phosphorus, can lead to nutrient pollution of ground and
surface water. Purchased feed (i.e. concentrates and roughage) and fertilisers (artificial and
organic) are the largest sources of nutrient imports onto a farm.
In the Netherlands the manure policy related to dairy farming has been shifted from a
farm-gate balance approach (MINAS; Ondersteijn et al., 2002) to a ‘use standard’ approach.
Dutch farmers will have to comply with maximum use standards for different types of
fertiliser starting form January 2006. There are three use standards: (1) for the total volume of
animal manure, (2) total nitrogen application, and (3) total phosphate application. The use
standard for animal manure is expressed in kg of nitrogen per hectare. The standard is either
170 kg or 250 kg. The first is laid down in the European Nitrate Directive, the second number
is a derogation that applies to farms with mainly grassland.
The nitrogen use standard for total nitrogen application concerns the sum of chemical
nitrogen fertiliser and nitrogen in animal manure and other fertilisers. The standard differs per
crop. The phosphate use standard concerns the total application of phosphate from chemical
fertiliser, animal manure and other fertilisers. The standard differs for grassland and arable
land. The use standards will be gradually reduced over the years.
In a session with a nutrient management expert dairy farmers have discussed ways to
deal with the new manure policy. This resulted in some improvement measures. In the project
the focus was not only on ways to deal with the new manure policy but also on ways to

36
improve the environmental quality as much as possible. This is done by calculating nutrients
surpluses (i.e. MINAS related surplus) and by calculating the eutrophication and acidification
potential.
The eutrophication potential (EP) per hectare is used as indicator for nutrient enrichment
in surface water. In this study EP per hectare is expressed in NO3− equivalents. Different
NO3−-equivalent factors are used: 1 for nitrate (NO3
−), 1.35 for nitrogen oxides (NOx), 3.64
for ammonia (NH3) and 10.45 for phosphates (PO4−) (Weidema et al., 1996). Figure 7 shows
the eutrophication (expressed in eutrophication potential with unit kg NO3-equivalents/kg
FPCM) of the participating dairy farms.
0
0,05
0,1
0,15
0,2
A B C D E F G H I J µ
Partcipating dairy farms
kg N
O3-
equi
vale
nts/
kg F
PCM
Off farmOn farm
Figure 7 Eutrophication Potential (kg NO3
-equivalents/kg FPCM) of the participating dairy
farms
The average EP is 0.14 kg NO3− equivalents/kg FPCM. The EP is for 67% determined on-
farm and for 33% determined off-farm. Off-farm eutrophication is caused by the use of inputs
like concentrates and roughage. NO3− released to water contributes most to the EP with 47%.
Secondly, PO4 to water contributes 40% to the EP. The variation between farms offers
possibilities for improvement.
The acidification potential (AP) per hectare is used to indicate the emission of
acidification gases. Different SO2 equivalents are used to compute AP per hectare of milk
production systems: 1 for sulphur dioxide (SO2), 0.7 for NOx, and 1.88 for NH3 (Audsley et
al., 1997). Figure 8 shows acidification (expressed in acidification potential with unit kg SO2-
equivalents/kg FPCM) of the participating dairy farms.

37
0,0000,0020,0040,0060,0080,0100,0120,014
A B C D E F G H I J µ
Participating dairy farms
kg S
O2-
equi
vale
nts/
kg F
PCM
Off farmOn farm
Figure 8 Acidification Potential (kg SO2-equivalents/kg FPCM) of the participating dairy
farms
The AP is for 64% determined on-farm and for 36% determined off-farm (i.e. inputs like
concentrates, roughage, and artificial fertiliser). This shows that acidification happens mainly
on on-farm hectares. NH3 explains 79% of the AP, whereas NOx (12%) and SO2 (9%)
contribute less.
Based on the result for the Eutrophication Potential, Acidification Potential, Nitrogen
and Phosphate surpluses and possibilities for dealing with the new manure policy
improvement measures have been assessed. Some of the improvement measures are: (1)
decrease number of animals by increasing the milk production per cow or lower the
replacement rate, (2) Disposal of manure by arranging contracts with arable farmers or by
arranging manure for maize contracts, and (3) improve nutrient efficiency by harvesting
concentrates on the farm and reducing the use of fertilisers, (4) decrease use of artificial
fertiliser.
Pesticides
When pesticides are applied to crops or livestock, a small but significant proportion can
escape to water and air, or accumulate in foods, affecting ecosystems and human health.
Pesticide use in dairy farming is rather small in the Netherlands. In grassland the average use
is 0.12 kg active matter per hectare and for maize (i.e. the main fodder crop) the average use
is 0.8 kg active matter per hectare. It appeared to be difficult to recover pesticide use of past
years. Therefore estimations were made based upon the costs for pesticides (see Figure 9).
Figure 9 confirms the low pesticide use of the ‘Caring Dairy’ participants.
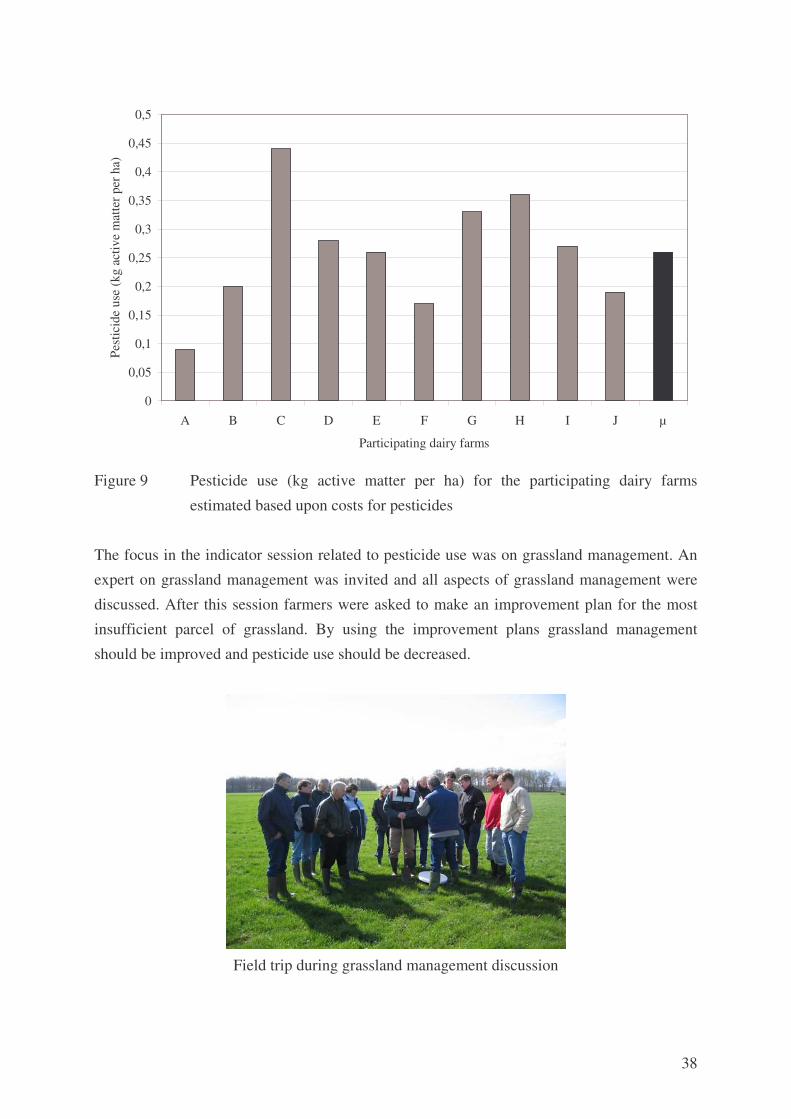
38
0
0,05
0,1
0,15
0,2
0,25
0,3
0,35
0,4
0,45
0,5
A B C D E F G H I J µ
Participating dairy farms
Pest
icid
e us
e (k
g ac
tive
mat
ter p
er h
a)
Figure 9 Pesticide use (kg active matter per ha) for the participating dairy farms
estimated based upon costs for pesticides
The focus in the indicator session related to pesticide use was on grassland management. An
expert on grassland management was invited and all aspects of grassland management were
discussed. After this session farmers were asked to make an improvement plan for the most
insufficient parcel of grassland. By using the improvement plans grassland management
should be improved and pesticide use should be decreased.
Field trip during grassland management discussion

39
Biodiversity
Biodiversity refers to all plants, animals and micro-organisms existing and interacting within
an ecosystem (Vandermeer and Perfecto, 1995). Agriculture alters the biodiversity in a
landscape through the development of pastureland, crop fields and new structures. In this
research the Agricultural Nature Norm Analysis (ANNA) is used to monitor the efforts of
dairy farmers with respect to the preservation of biodiversity and the improvement of
landscape quality. Whenever possible ANNA is supported with direct measurements (e.g.
number of meadow birds). ANNA is developed to list management measures with respect to
biodiversity and landscape quality (Guijt, 2002). Within ANNA management measures with
respect to three types of nature, i.e. wet nature, herbaceous nature, and woody nature, and
some additional management measures are distinguished (Guijt, 2002). Points are achieved,
when these management measures are applied. For a more detailed description of ANNA see
Guijt (2002). If less than 15 points are achieved then improvement of landscape quality and
biodiversity is needed. Landscape quality on farms with scores above 25 points is considered
well (Guijt, 2002). The results of the participating dairy farmers are presented in Figure 10.
0
5
10
15
20
25
30
35
A B C D E F G H J K L
Participating dairy farmers
AN
NA
sco
re
Figure 10 Results of participating dairy farmers on Agricultural Nature Norm Analysis
(ANNA)-score
On 5 of the 11 participating dairy farms improvements are needed with respect to biodiversity
and landscape quality. Some of the improvement measures for biodiversity that have been
taken on dairy farms are: (1) introduce nests for birds, (2) protect meadow birds by

40
cooperating with voluntary bird protecting agencies, (3) develop or maintain wooded banks,
(4) cleaning ditches (i.e. improves water quality and biodiversity), (5) develop a pool for
frogs.
Farm economics
Economic sustainability is defined as the ability of the dairy farmer to continue his farming
business (i.e., economic viability). The indicator session on farm economics consisted of
several subjects: (1) benchmarking individual farm economic results with so-called mirror
groups, (2) calculate effects of EU reform policy, and (3) calculate price that can be paid for
milk quota based on cash-flow and individual gross-margins.
Benchmarking
To benchmark individual farm-results the tool Face-It is used (Beldman et al., 2005). With
this tool for each farm a so-called ‘mirror group’ is created. This ‘mirror group’ is a group of
approximately 20 farms that is selected on certain criteria. These criteria can be selected by
the user of the tool. For this session, data of 2003 were used and the ‘mirror group’ was
selected according to the following criteria:
- size of the farm (total milk production kg);
- milk production per hectare fodder crops;
- soil type
This results in a comparison of the farm results with the results of a group of farms with a
similar farm structure. Differences in farm results between the farm of concern and the
corresponding ‘mirror group’ are due, therefore, to differences in farm management (i.e.
tactical and operational) and not by farm structure. The differences are presented in a report
with red (i.e. unfavourable difference) and green (i.e. favourable difference) bars. An example
is shown in Figure 11.
Figure 11 Example of economic comparison of a specific farm and the corresponding
‘mirror group’

41
Table 4 shows that there are no major differences between the farm structure of the Caring
Dairy farms and the average of the ‘mirror groups’. This implies that a good match was
achieved between the Caring Dairy farms and the mirror groups and that the ‘mirror groups’
are a good reference for the ‘Caring Dairy’ farms.
Table 4 Average result of ‘Caring Dairy’ farms and ‘mirror groups’
Caring Dairy-farms Average result ‘Caring dairy’
Average difference ‘mirror group’
Total farm milk production 641421 -7620 Milk production per hectare 14068 -381 Land (ha) 46.6 -0.1
Milk production per cow (kg) 8000 +90 Fat milk (%) 4.41 +0.02 Protein milk (%) 3.44 -0.02
Gross margin (€ per 100 kg milk) 25.60 -0.78 Total fixed costs (€ per 100 kg milk) 39.03 -0.63 Return for own labour (€ per 100 kg milk) 3.05 +0.60
The gross margin of the Caring Dairy farms is €0.78 per 100 kg lower in comparison with the
‘mirror group’. This is mainly due to a lower milk price and lower yield from cattle sales. The
total fixed costs are lower in comparison with the ‘mirror group’ and the return for own
labour is higher.
Each farmer received a personal mirror group report with the red and green bars for
about 40 different indicators in the week before the session. We asked the farmers to study the
report and to prepare a short presentation of their findings for the workshop. The purpose was
that each farmer presented his own strong and weak points and the other farmers reflected on
this presentation and on the figures. This worked quite well, although some improvements
were suggested:
- The discussion focused sometimes too much on small details, it is important to first
look at the outlines and if necessary to zoom in at details. The mirror group report was
adjusted for this purpose;
- There was not a very strong discussion between the farmers, partly because of the
focus on details. Another reason could be that there was not yet enough trust within
the group to be critical about the economic results of colleagues;
- Reflection of an expert in farm economics was later added to the report, to compensate
for the lack of strong interaction within the group.

42
Effect of reform EU-policy
In the strategic session of the dairy-farmers with the Game Simulation Dairy only the new
policy concerning manure (EU-nitrate directive) was included (see section 4.1). The reform of
the EU-policy from a product based support to an income based support was not included. In
the indicator-session on farm economics the effects of the EU-reform were presented and
discussed with the dairy-farmers. In short the reform means that:
- The milk quota of the farmers will be increased with in total 1.5% (0.5% in 2005,
2006, and 2007);
- The intervention prices for butter en skimmed milk powder will be lowered, this will
probably result in a 15% lower milk price compared to 2002.
- The farmers will get a single farm payment from the EU, first coupled to milk
production, but will be decoupled in 2007. These single farm payments will be linked
to the respect of environmental, food safety and animal welfare standards. This link
was not discussed in the workshop.
The general idea of the dairy-farmers in the discussion was that there are not much
opportunities to adjust their strategy or management to the reform of the EU-policy. The
farmers do not expect that the allowance will last for a 100% in the long run.
Calculating individual prices that can be paid for milk quota.
Milk quota is a limiting factor in expanding dairy farms in the Netherlands. In the Netherlands
a high price is paid to buy milk quota (in 2005 about €1,80 per kg milk). In an interactive
session with the dairy-farmers a ‘maximum’ price to be paid for milk quota based on gross
margin was calculated. A few steps were done to calculate the ‘maximum’ price for milk
quota: (1) which milk price do you expect for the following years (i.e. effects CAP –reform),
(2) what will be the level of feeding costs of the extra kg of milk (i.e. together with step 1 this
results in the expected gross margin for the extra kg of milk), (3) what will be the level of the
interest rate, and (4) in how many years you want to depreciate your investment in milk quota.
The discussion after the calculation of the ‘maximum’ price for milk quota showed
clearly that:
- there is a big difference between the price the ‘Caring Dairy’ farmers can pay for milk
quota based on their current gross margins and the actual price for milk quota
- the number of years for depreciation is also very important: some dairy farmers
assume that the quota system will last after 2014 and calculate with longer time for
depreciation this implies that they can pay more for milk quota.
- a high gross margin is a condition to compete on the quota-market. Only farmers with
high gross margins can actually pay the current prices that are being paid for milk
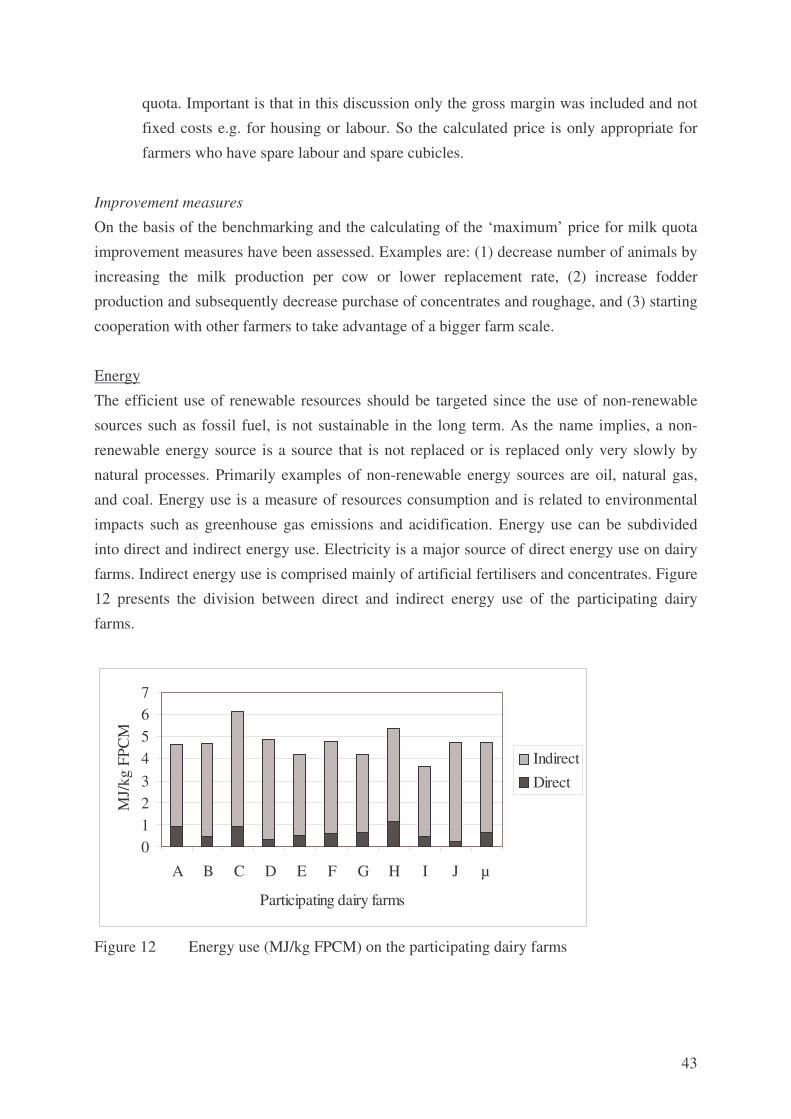
43
quota. Important is that in this discussion only the gross margin was included and not
fixed costs e.g. for housing or labour. So the calculated price is only appropriate for
farmers who have spare labour and spare cubicles.
Improvement measures
On the basis of the benchmarking and the calculating of the ‘maximum’ price for milk quota
improvement measures have been assessed. Examples are: (1) decrease number of animals by
increasing the milk production per cow or lower replacement rate, (2) increase fodder
production and subsequently decrease purchase of concentrates and roughage, and (3) starting
cooperation with other farmers to take advantage of a bigger farm scale.
Energy
The efficient use of renewable resources should be targeted since the use of non-renewable
sources such as fossil fuel, is not sustainable in the long term. As the name implies, a non-
renewable energy source is a source that is not replaced or is replaced only very slowly by
natural processes. Primarily examples of non-renewable energy sources are oil, natural gas,
and coal. Energy use is a measure of resources consumption and is related to environmental
impacts such as greenhouse gas emissions and acidification. Energy use can be subdivided
into direct and indirect energy use. Electricity is a major source of direct energy use on dairy
farms. Indirect energy use is comprised mainly of artificial fertilisers and concentrates. Figure
12 presents the division between direct and indirect energy use of the participating dairy
farms.
01234567
A B C D E F G H I J µ
Participating dairy farms
MJ/
kg F
PCM
IndirectDirect
Figure 12 Energy use (MJ/kg FPCM) on the participating dairy farms

44
The average use of direct and indirect energy is 4.7 MJ/kg FPCM (Fat and Protein Corrected
Milk). All direct energy use of on farm production, such as electricity, diesel and gas are
grouped together as fossil energy and contributes 13% to the total energy use. Within this
group diesel use is a strong contributor with 5% to the total energy use. On five dairy farms
renewable electricity is used which decreases their environmental impact. Indirect energy use
contributes 87% to the total energy use. Indirect energy from concentrate production
contributes most to the total energy use with 74%. These results were discussed with an
expert on energy use on dairy farms. Based on these discussions improvement plans have
been implemented on the participating dairy farms. Examples of these improvement measures
for energy that have been taken on dairy farms are: (1) adaptations to milking equipment like
pre-cooling and regaining heath from cooling process, (2) improve the efficiency of manure
(e.g. by more precise application) to reduce the input of fertiliser, and (3) increase fodder
production and subsequently decrease purchase of concentrates and roughage.
Water
The availability of clean, high quality water is essential to life. All aspects of water
management are important in that water itself is a critical renewable resource for all
agricultural production. Although the Netherlands does not a have shortage of water, the
availability of potable water is increasingly becoming a concern. Water is used as drinking
water for livestock, during milking and for crop production. Direct water use on the farm is
registered by collecting data of the water company. Water use by crops is depending on the
type of crop, soil type, yield and irrigation and therefore more difficult to measure. The
quantity of water used for irrigation is a useful direct measure to assess water consumption of
crops. Only two farms owned irrigation equipment and both farmers indicated to use the
irrigation equipment rarely. For this reason use of tap water is the only way to collect data on
water use. In Figure 13 tap water use is presented for the participating dairy farms

45
0.00
1.00
2.00
3.00
4.00
5.00
6.00
A B C D E F G H J K µ
Participating dairy farms
Wat
er u
se (m
3/10
00 k
g FP
CM
)
Figure 13 Tap water use (M3/1000 kg FPCM) on the participating dairy farms
The spread in tap water use between the participating dairy farms is enormous. This is mainly
due to the fact that some of the participating dairy farms also use their own well or surface
water for feeding the dairy cows. Farm numbers B, C, and J use solely tap water for feeding
their dairy cows. This makes the above results difficult to compare between dairy farms. For
internal use these figures, however, offer possibilities to improve the performance related to
water use. The participating dairy farmers developed improvement measures in cooperation
with an expert on water use. Examples of these improvement measures for water use that have
been taken on dairy farms are: (1) use own well, (2) cleaning of milking equipment more
efficiently by using latest technologies, (3) re-use water of cleaning the milking equipment.
Social Human Capital
All participating dairy farms are family farms with no or marginal external labour. Therefore,
working conditions and enjoyment of the dairy farmers and their families is a central element
for social human capital. Enjoyment is a concept which is hard to define, but all dairy farmers
indicated they liked being dairy farmer as a way of live. Insufficient working conditions are
related to disability. Main causes for disability in Dutch agriculture are related to musculo-
skeletal disorders (back, neck/upper extremity and lower extremity) and to musculo-skeletal
injuries (Hartman et al., 2003). In general risk factors for disability, due to injuries and
disorders, can be subdivided into farm characteristics, psychosocial variables and personal
characteristics of the farmer (Hartman, 2004). The length of a working week is one of the

46
variables related to insufficient working conditions. The length of working week is included
as this parameter is also informative for dairy farmers (i.e. for planning purposes). Dairy
farmers were asked to register the length of their working week for three different weeks. In
the registration several tasks were distinguished (e.g. milking, feeding, cleaning, harvesting
etc.). The results are presented in Figure 14 and 15.
0
20
40
60
80
100
120
140
160
A B C D E F G H I J µ
Hou
rs p
er w
eek
Figure 14 Hours of work per week per farm

47
0,00
2,00
4,00
6,00
8,00
10,00
12,00
14,00
16,00
18,00
A B C D E F G H I J µ
Participating dairy farms
Hou
rs p
er 1
00.0
00 k
g m
ilk p
er w
eek
Figure 15 Hours of work per 100.000 kg of milk per week
Figure 14 presents the total number of hours work per week. Farm number A is by far the
most labour intensive farm. At this moment of time, however, this is not a big issue as father
and son are still working on the farm. The labour efficiency should increase as the father will
retire in 8 years from now. Figure 15 represent the labour efficiency of the participating dairy
farms expressed in hours per 100.000 kg of milk per week. On farm B and G the milking is
done by an Automatic Milking System. This improved their labour efficiency and flexibility
as milking is the most labour consuming activity on dairy farms. After discussing these results
with an expert in the field of working conditions improvement measures were assessed: (1)
specialisation by using more contract work and assigning contracts for young stock rearing,
(2) cooperation with other (dairy) farmers by for example assigning manure for maize
contracts, (3) computerise the farm by replace the current (depreciated) milking barn with an
Automatic Milking System or by purchasing an automatic artificial milk dispenser for calves.
Local economy
Local economy is related to community health, which is defined as the strength in which a
farmer operates. Strong community relations and respect for agriculture can lead to a better
quality of life for farmers. Agricultural rural employment plays an important role in the
importance of viable populations and communities. Dairy farms can give a positive impulse to
rural employment by cultivating a considerable amount of the concentrates and the roughage
for the dairy cows in the farm region. Furthermore, cultivating the concentrates and roughage

48
in the farm region helps to close the nutrient cycles. In this research land use is included as
one of the parameters for local economy. Besides the number of hectares owned by the farmer
(i.e. on-farm land use), the production of several different inputs, like fossil energy and
purchased animal feed also incorporates land use (i.e. off-farm land use) and will therefore be
accounted as farmland too. Figure 16 shows the land use divided into direct- and indirect farm
impact of the farms studied. The average total amount of land needed per farm is 88 hectares.
Subsequently for the production of 1 kg FPCM of these farms 1.20m² is needed. Total land
use is for 54% determined by direct use and for 46% determined by indirect use.
00,20,40,60,8
11,21,41,6
1 2 3 4 5 6 7 8 9 10 µ
Participating dairy farms
Lan
d us
e (m
2/kg
FPC
M)
Off farmOn farm
Figure 16 Land use (m2/kg FPCM) of the participating dairy farms
Improvement measures for local economy are in line with measures that reduce the
environmental impact. The improvement measures focus on higher grassland and fodder crop
yields and on cropping concentrates on the farm.
Animal welfare
Animal welfare is an often used, but also much debated concept. During the last 25 years,
scientists have engaged in defining animal welfare, but no consensus has been reached (Fraser
et al., 1997; Lund and Rocklinsberg, 2001). While the complexities of defining animal
welfare and the limitations of any definition are recognised, the ‘five freedoms’ (Webster,
1995) are considered an adequate and appropriate working basis for measuring animal welfare
(Winter et al., 1998). The five freedoms (Webster, 1995) are: (1) freedom from thirst, hunger
and malnutrition, (2) freedom from discomfort, (3) freedom from pain, injury and disease, (4)
freedom to express normal behaviour, and (5) freedom from fear and distress.
In this research an animal welfare expert visited all participating dairy farms in spring
and autumn to measure the condition score, the skin score, and the locomotion score of the

49
dairy cows. Furthermore, management practices were collected to analyse differences in
performances of animal welfare. The body condition scores represent a subjective visual or
tactile (or both) evaluation of the amount of subcutaneous fat on a cow. Body condition score
(BCS) has proved to be useful as a management tool for assessing the nutritional status of
dairy cows (Hady et al., 1994). Cows are usually scored on a 5-point scale: from 1, indicating
thin, to 5, indicating fat (Edmonson et al., 1989). The optimal score for the Body Condition
Score is 3 (pers. comm. Smolders). A locomotion score is a qualitative index of a cow’s
ability to walk normally (Sprecher et al., 1997). Visually scored on a scale of 1 to 5, where a
score of 1 reflects a cow that walks normally and a score of 5 reflects a cow that is three-
legged lame. A locomotion score is made in a few seconds per cow. The skin condition score
indicates lesions of the dairy cow skin due to insufficient housing systems. The effect of
grazing on animal welfare can be analysed by measuring the condition score, locomotion
score and skin condition score in spring and autumn. The results are presented in the figures
below. The results of ‘Caring Dairy’ were comparable with Bioveem (i.e. organic dairy farm)
and Cows and Opportunities (i.e. environmental friendly dairy farms) projects.
1
1,5
2
2,5
3
3,5
4
A B C D E F G H I J K µ
Participating dairy farms
Bod
y C
ondi
tion
Scor
e
AutumnSpring
Figure 17 Average Body Condition Score of the cows on the participating dairy farms

50
0
5
10
15
20
25
30
35
40
45
50
A B C D E F G H I J K µ
Locomotion score >2.5
Perc
enta
ge o
f dai
ry c
ows
SpringAutumn
Figure 18 Percentage of dairy cows with a Locomotion Score > 2.5 on the participating dairy
farms
0
10
20
30
40
50
60
70
80
90
A B C D E F G H I J K µ
Participating dairy farms
Perc
enta
ge d
airy
cow
s w
ithou
t ski
n le
sion
s
SpringAutumn
Figure 19 Percentage of dairy cows without considerable skin lesions
Figure 17 indicates that the dairy cows of the participating dairy farmers are relatively close
to the optimal score of 3. Still, individual dairy cows can have a more significant deviation

51
from the optimal score. The average Body Condition Score is higher in spring than in autumn
as the ration is less constant in summer (i.e. fresh grass intake is difficult to predict). The
percentage of dairy cows with insufficient locomotion scores is presented in Figure 18. The
variation for the locomotion score is higher between dairy farms. Higher locomotion scores
(i.e. decreased animal welfare) are caused by insufficient possibilities for walking and
insufficient floor conditions. Insufficient floor conditions are due mainly to: (1) old floors that
have become worn-out and slippery and (2) a small layer of dry manure that causes
slipperiness of the floor. The variation between dairy farms indicates that improvements can
be made. In Figure 19 the percentage of dairy cows without considerable skin lesions is
presented. Skins lesions are results of insufficient housing systems (e.g. small cubicles). For
this reason the percentage of skin lesions is lower in autumn (i.e. after the grazing period).
After discussing these results with an expert in the field of animal welfare improvement
measures were assessed: (1) adaptations to the housing system (e.g. enlarge cubicles and
heighten the feed fence), (2) roughen the floors, and (3) increase the amount of sawdust in
cubicles (i.e. for increased lying comfort of the cows).

52
5. Communication Communication is the key-factor in the success of a project such as ‘Caring Dairy’ and
focuses on communication between the supply chain partners, communication with and
between the farmers, communication with the key stakeholders, communication in the sector
and finally communication to the consumers. From the start, ‘Caring Dairy’ has focused
actively on effective communication. Moreover, ‘Caring Dairy’ has managed to be distinctive
and therefore has attracted the interest from the sector, government, Non Governmental
Organisations and media.
Supply chain partners and key stakeholders
One of the strengths of ‘Caring Dairy’ is the supply chain approach; an active involvement of
all supply chain partners in the daily running of the project by representation in the ‘Caring
Dairy’ project team. Two dairy farmers, a rep. of Hoogwegt milk BV, a rep. of Ben & Jerry’s,
a rep. of the ice-cream factory and two researchers of Wageningen UR are part of the ‘Caring
Dairy’ project team. This ensures the protection of all involved interests and enables a
bottom-up approach of the project. Building a relationship based on mutual trust between all
parties was one of the additional goals of the project team meetings. Monthly project teem
meetings and clear communication on tasks and responsibilities were crucial in the early stage
to build this relationship.
The main internal and external stakeholders are involved in ‘Caring Dairy’ by means of
an Advisory Group, who meets twice a year to discuss and reflect on the progress made and to
advice on the directions to go and choices to be made. From the involved supply chain parties,
all relevant departments were involved, e.g. Unilever’s sustainable agriculture programme
rep., Hellendoorn factory rep., buying departments rep., Ben & Jerry’s Vermont based
sustainable dairy farming project leader, Hoogwegt Milk’s sales rep. Externally, key societal
organisations and experts in the field were invited to become an advisor of ‘Caring Dairy’: the
Worldwide Fund for Nature (WWF), the Dutch Society for Nature and Environment
(Stichting Natuur en Milieu), the Dutch Institute for Dairy Research (NIZO), animal welfare
expert and retired director of Artis zoo in Amsterdam Prof. Maarten Frankenhuis, Marketing
expert and member of Ben & Jerry’s Board of Commissioners Hans Eenhoorn, a rep. of
Animal Sciences Group and a rep. of subsidy provider AKK. The fruitful discussions and
advises within the project team and advisory meetings enabled ‘Caring Dairy’ to stay fully
aligned with developments in the sector and society.
‘Caring Dairy’ Farmers
The farmers are actively involved in the overall process by 2 farmers representing the whole
group in the ‘Caring Dairy project’ team and in the advisory meetings. Regular indicator

53
sessions and careful listening to the needs and wishes of the farmers created ownership of the
project and a mutual relationship based on trust with and between the farmers. Each session
with the dairy farmers was evaluated (by questionnaire) and recommendations of the dairy
farmers were used to improve the quality of the sessions. Furthermore, the farmers were asked
to rank the eleven indicators on the relevance for their individual farm. Based on these results
the sequence, the extent and the content of the indicator specific sessions was assessed. The
enthusiasm, time and efforts of the participating farmers have been key to the success of
‘Caring Dairy’.
The mutual learning and easy communication has been facilitated by the development and use
of a password protected ‘Caring Dairy’ web site (Windows Sharepoint Services) on which is
actively communicated on a weekly base by all farmers. Windows SharePoint Services
technology makes it simple to implement and manage a team collaboration infrastructure and
deliver immediate benefits to the users. The figures below give an impression of this web site
for internal communication.
Opening page of the internal ‘Caring Dairy’ website
54
Information (presentations and pictures) on the ‘Caring Dairy’ sessions
Pictures of a ‘Caring Dairy’ indicator session on ‘Nutrients’

55
The web site evolved to a low-access lively communication platform on everything
regarding ‘Caring Dairy’: news items, planning, preparing and evaluating the indicator
sessions, the latest pictures made during the sessions, questions to colleague ‘Caring Dairy’
farmers, presentations, background articles, documents, reports and pregnancy
announcements. As all presentations of the sessions, results of the base line measurements
and improvement plans are listed, the web site also serves as an archive of the “Caring Dairy’
project.
Besides the professional sessions with experts on different fields, also success was
celebrated involving the whole dairy farmer families. In the summertime, a big festive BBQ
was organised including a long requested storytelling of the Ben & Jerry’s history, the usual
farm tour and a playground for the children. Such success celebration supports the team
building, mutual trust and fun of being involved in the Caring Dairy project.
All ‘Caring Dairy’ participants and their families
Media and sector
Without active initiation of ‘Caring Dairy’, the agro- and dairy farming sector media was
attracted to ‘Caring Dairy’ at an early stage. This resulted in numerous articles in sector
magazines and newspapers (see Appendix A) and became a self-reinforcing process of
positive communication in the sector on ‘Caring Dairy’. The result was even more interview
requests, many requests for presentations on ‘Caring Dairy’ and farm tours at the ‘Caring
Dairy’ farms. This media- and sector attention proves the added value of the ‘Caring Dairy’
approach, which can be characterised by: involving the whole a supply chain, being integrated
(triple bottom line), bottom-up, brand driven, and fun.

56
In the SAI platform (Sustainable Agriculture Initiative of the Foods Industry) working group
on dairy, the ‘Caring Dairy’ approach, learnings and experiences are actively communicated
to the main European dairy companies and co-operatives.
Consumers
Ultimately, effective consumer communication is also important for the success of ‘Caring
Dairy’. However, consumer communication falls outside the scope of phase one of ‘Caring
Dairy’, but is Ben & Jerry’s next big challenge. Some information on ‘Caring Dairy’ already
can be found on the Ben & Jerry’s web site:

57
6. Experiences, conclusion and outlook 6.1 Experiences ‘Caring Dairy’ has three main factors that makes the project distinctive from other sustainable
dairy related projects: the participation of the full supply chain, the integration of the broad
scope of the various sustainability aspects (the 11 indicators), and the bottom-up approach.
By the participation of the whole supply chain in ‘Caring Dairy’, it is closely listened to
and anticipated on societal trends and consumer wishes. This enables ‘Caring Dairy’ to
become appealing and interesting for consumers, to rectify common misperceptions about
dairy farming or ingredients and positively influence the image of dairy farming
The triple bottom line approach in which the optimal balance between the various
economic, environmental and social sustainability indicators is sought for, and in which a
trade off between the indicators is allowed, represents a holistic and therefore realistic
approach of sustainable development, directly related and with the third factor, together
explaining the added value for the participating farmers.
The bottom-up approach is based on listening to the dairy farmers’ problems, priorities,
insights and letting them guide the project. Moreover, 2 farmers are actively involved in the
shaping and steering of the project by their project team membership. This bottom-up
approach has proven to be successful; the participating farmers where quite expectantly and
cynical at the start though open minded enough to participate, and became full supporters of
the project along the way. ‘Caring Dairy’ really helps them to better understand their own
business and work more efficiently, and learn a lot from each other. The consulted experts
provided the farmers with information (i.e. expert knowledge in specific field) and facilitated
the mutual learning process. In this way and by evaluating the baseline measurement the
farmers succeeded to get more insight in their farming business.

58
6.2 Outlook and conclusions End 2005, the first phase – the AKK financed phase - of the project has been finished. Base
line measurements have been done and first improvement plans at all participating farms have
been implemented. After implementation of the improvement plans the whole cycle of
measuring, evaluating and adjusting improvement plans and actual implementation starts over
again. This iterative process of implementation, measuring, evaluating, and re-adjusting has to
lead (2008) to guidelines for Sustainable Dairy Farming Practices. Finally, participating dairy
farmers have implemented a substantial number of management measures tailored to their
specific situation and priorities by which they sustain the milk production on their farms.
Communication on the learnings (content) and experiences (process) are an important part of
the project. This transparency in the supply chain will help to bring consumers closer to the
dairy chain. Eventually, it is aimed to hand over the SDFP guidelines to the dairy sector, on
which is already anticipated by active membership in the SAI platform (Sustainable Dairy
Initiative platform, a foods industry platform on sustainable agriculture) dairy working group.
‘Caring Dairy’ shows the innovation power of supply chains of Sustainable Dairy
Farming Practices in co-operation with all relevant supply chain partners and stakeholders,
going beyond existing initiatives related to sustainability in the dairy sector by the holistic,
bottom-up approach. This system of cooperation and mutual learning between supply chain
partners is unique in the European dairy sector. In addition, ‘Caring Dairy’ uses new
principles by given farm strategy and profitability a fully integrated position and by allowing
the farmers individual flexibility in their search for an optimal sustainability performance.
Furthermore, ‘Caring Dairy’ makes the source of the main ingredient of ice cream (i.e. milk)
personal and tangible, which is an emotional added value for both consumers and farmers and
in the longer term an economic added value for the farmers.

59
References Beldman, A.C.G., C.H.G. Daatselaar, 2002. De ondernemer centraal, toepassing spelsimulatie
mineralenmanagement in project Praktijkcijfers. In “Virtual Value”: De toepassing
van modellen, simulaties en spelen in de landbouw, voeding en groene ruimte. Bundel
VIAS-symposium. Agro-informaticareeks nr 13 (oktober 2002).
Beldman, Alfons, Wil Hennen, Gerben Doornewaard, 2005. The use of a benchmark-tool
based on FADN for farm management of organic dairy farmers. In: Towards a
European framework for organic market information. Proceedings of the 2nd EISFOM
European seminar, Brussels 10&11 november 2005
Bell, S., Morse, S., 1999. Sustainability indicators: measuring the immeasurable? Earthscan,
UK: London.
Brundtland, G.H., 1987. Our common future. Oxford University Press, UK: Oxford.
Burrell, A., 2004. The 2003 CAP reform - Implications for the EU dairy sector. Outlook On
Agriculture 33, 15-25.
Bussink, D.W., Oenema, O., 1998. Ammonia volatilization from dairy farming systems in
temperate areas: a review. Nutr. Cycl. Agroecosyst. 51, 19-33.
Bylin, C., Misra, R., Murch, M., Rigterink, W., 2004. Sustainable Agriculture: Development
of an On-Farm Assessment Tool. In: Center for Sustainable Systems. The University
of Michigan, Michigan, pp. 180.
Callens, I., Tyteca, D., 1999. Towards indicators of sustainable development for firms. A
productive efficiency perspective. Ecological Economics 28, 41-53.
Cramer, J., Van der Heijden, A., Jonker, J., 2004. Corporate Social Responsibility: Balancing
between thinking and acting. ICCSR Research Paper Series. International Centre for
Corporate Social Responsibility, Nottingham University Business School, nr. 24, pp1-
35.
De Boer, I.J.M., Cornelissen, A.M.G., 2002. A method using Sustainability indicators to
compare conventional and animal-friendly egg production systems. Poult. Sci. 81,
173-181.
De Wit, B. and Meijer, R., 2004. 'Strategy - Process, Content, Context: an International
Perspective', Thomson Business Press
Edmonson, A.J., Lean, I.J., Weaver, L.D., Farver, T., Webster, G., 1989. A Body Condition
Scoring Chart for Holstein Dairy-Cows. J. Dairy Sci. 72, 68-78.
Elzen, B., Wieczorek, A., 2005. Transitions towards sustainability through system innovation.
Technological Forecasting and Social Change 72, 651.
Francis, C.A., Youngberg, G., 1990. Sustainable agriculture - an overview. In: Francis, C.A.,
Flora, C.B., King, L.D. (Eds.), Sustainable agriculture in temperate zones. John Wiley
& Sons, US: New York, pp. 1-23.

60
Fraser, D., Weary, D.M., Pajor, E.A., Milligan, B.N., 1997. A scientific conception of animal
welfare that reflects ethical concerns. Anim. Welf. 6, 187-205.
Goddijn, S.T. and De Vlieger, J.J., 2004. MVO in ketens: een MVO-
ketensamenwerkinsgmodel een een voorstel tot ontwikkeling van een GRI-
jaarrrapport voor de foodsector. LEI-rapport 5.04.09, 91p.
Hady, P.J., Domecq, J.J., Kaneene, J.B., 1994. Frequency and precision of body condition
scoring in dairy cattle. J. Dairy Sci. 77, 1543.
Hansen, J.W., 1996. Is agricultural sustainability a useful concept? Agric. Syst. 50, 117-143.
Hansen, J.W., Jones, J.W., 1996. A systems framework for characterizing farm sustainability.
Agric. Syst. 51, 185-201.
Hartman, E., 2004. Risk analysis of sick leave among Dutch farmers. s.n.], [S.l.
Hartman, E., Vrielink, H., Huirne, R.B.M., Metz, J.H.M., 2003. Sick leave analysis among
self-employed Dutch farmers. Occupational Medicine-Oxford 53, 461-468.
Heard. J.E., 2003. Ben & Jerry’s Social & Environmental Assessment 2003, South
Burlington, USA.
Heinen, J.T., 1994. Emerging, diverging and converging paradigms on sustainable
development. Int. J. Sustain. Dev. World Ecol. 1, 22-33.
Henkens, P., van Keulen, H., 2001. Mineral policy in the Netherlands and nitrate policy
within the European Community. Neth. J. Agric. Sci. 49, 117-134.
Hennen, W., 1995. Detector: knowledge-based systems for dairy farm management support
and policy analysis: methods and applications.
Luesink, H.H., Van Everdingen, W., De Haan, M.H.A., 2005. Nieuw mestbeleid: Koe kan in
de wei blijven. Agri-monitor maart 2005, 1-2.
Lund, V., Rocklinsberg, H., 2001. Outlining a conception of animal welfare for organic
farming systems. J. Agric. Environ. Ethics 14, 391-424.
Ministerie LNV, 2000. 'Voedsel en Groen': kabinetsvisie agro-food sector tot 2010 Den Haag
Munro, D.A., Holdgate, M.W., 1991. Caring for the earth: a strategy for sustainable living.
IUCN, Gland.
Noordhuizen, J.P.T.M., Metz, J.H.M., 2005. Quality control on dairy farms with emphasis on
public health, food safety, animal health and welfare. Livest. Prod. Sci. 94, 51.
Oenema, J., Koskamp, G.J., Galama, P.J., 2001a. Guiding commercial pilot farms to bridge
the gap between experimental and commercial dairy farms; the project 'Cows &
Opportunities'. Neth. J. Agric. Sci. 49, 277-296.
Oenema, O., Velthof, G., Kuikman, P., 2001b. Technical and policy aspects of strategies to
decrease greenhouse gas emissions from agriculture. Nutr. Cycl. Agroecosyst. 60,
301-315.

61
Oenema, O., van Liere, L., Schoumans, O., 2005. Effects of lowering nitrogen and
phosphorus surpluses in agriculture on the quality of groundwater and surface water in
the Netherlands. J. Hydrol. 304, 289.
Ondersteijn, C.J.M., Harsh, S.B.,Giesen, G.W.J.,Beldman, A.C.G., & Huirne, R.B.M. (2002).
Management strategies on Dutch dairy farms to meet environmental regulations; a
multi-case study Netherlands Journal of Agricultural Science, 50(1), 47-65.
Ondersteijn, C.J.M., Beldman, A.C.G., Daatselaar, C.H.G., Giesen, G.W.J., Huirne, R.B.M.,
2002. The Dutch mineral accounting system and the European nitrate directive:
implications for N and P management and farm performance. Agric. Ecosyst. Environ.
92, 283-296.
Pretty, J.N., 1995. Regenerating agriculture: policies and practice for sustainability and self-
reliance. Earthscan, UK: London.
Raad voor het Landelijk Gebied, 2003. De boer in de keten: boeienkoning of teamspeler?
Advies over de positie van primaire producenten in agroketens Publicatie RLG 03/6,
september 2003
Rigby, D., Caceres, D., 2001. Organic farming and the sustainability of agricultural systems.
Agric. Syst. 68, 21-40.
Shearman, R., 1990. The Meaning and Ethics of Sustainability. Environ. Manage. 14, 1-8.
Smit, C.T., Beldman, A.C.G., De Hoop, W.D., Prins, A.M., 2002. Entrepreneur as the pivot in
the transition to sustainable livestock production systems: result of the project within
the framework of the MLNV-programme "Future livestock production systems".
Landbouw Economisch Instituut, The Hague.
Sprecher, D.J., Hostetler, D.E., Kaneene, J.B., 1997. A lameness scoring system that uses
posture and gait to predict dairy cattle reproductive performance. Theriogenology 47,
1179.
Unilever, 2003. Growing for the future II, Unilever and Sustainable Agriculture, Second
edition.
Unilever, 2005. Growing for the future, Unilever and Sustainable Agriculture, Third edition.
Van Calker, K.J., 2005. Sustainability of Dutch dairy farming systems: a modelling approach.
In: Business Economics. Wageningen University, Wageningen, pp. 208.
Van Calker, K.J., Berentsen, P.B.M., Giesen, G.W.J., Huirne, R.B.M., 2005a. Identifying and
ranking attributes that determine sustainability in Dutch dairy farming. Agriculture
and Human Values 22, 53-63.
Van Calker, K.J., Berentsen, P.B.M., De Boer, I.M.J., Giesen, G.W.J., Huirne, R.B.M., 2004.
An LP-model to analyse economic and ecological sustainability on Dutch dairy farms:
model presentation and application for experimental farm "de Marke". Agric. Syst. 82,
139-160.

62
Van Calker, K.J., Berentsen, P.B.M., Romero, C., Giesen, G., Huirne, R.B.M., 2005b.
Development and application of a multi-attribute sustainability function for Dutch
dairy farming systems. Ecological Economics in press.
Van Calker, K.J., Berentsen, P.B.M., De Boer, I.J.M., Giesen, G.W.J., Huirne, R.B.M.,
2005c. Modelling social sustainability at farm level: an application to conventional
and organic dairy farming. Submitted to Agricultural Systems.
Van den Pol-van Dasselaar, A., Corré, W.J., Hopster, H., Van Laarhoven, G.C.P.M.,
Rougoor, C.W., 2002. Belang van weidegang. In: PraktijkRapport Rundvee.
Praktijkonderzoek Veehouderij, The Netherlands: Lelystad, pp. 82 p.
Van der Schans, J.W., 2004, Milieukeur varkensvlees de keten door, Rapport 1.04.02, LEI,
Den Haag
Van der Schans, J.W., 2005. Presentatie ten behoeve van bijeenkomst ‘Dialoog: Koe in de
Wei’ Stichting Natuur en Milieu, Utrecht, 27 april 2005, Utrecht
Van der Schans, J.W., Vogelzang, T.A., De Vlieger, J.J., 2002. Maatschappelijk Verantwoord
Ondernemen in de agrofoodketen: in het bijzonder in de zuivelsector. LEI-rapport
2.02.15, 73p.
VROM, 2003. Duurzame daadkracht. Actieprogramma duurzame ontwikkelingen. Nationale
deel. Ministry of Housing, Spatial Planning, and the Environment, The Netherlands:
The Hague.
Webster, J., 1995. Animal welfare: a cool eye towards Eden: a constructive approach to the
problem of man's dominion over the animals. Blackwell Science, Oxford.
Weidema, B.P., Mortenson, B., Nielsen, P., Hauschild, M., 1996. Elements of an impact
assessment of wheat production. In: Technical University of Denmark, Denmark.
Wijffels, H.H.F., 2001. Toekomst voor de veehouderij: agenda voor een herontwerp van de
sector. Ministry of Agriculture, Nature and Food Quality, The Netherlands: The
Hague.
Winter, M., Fry, C., Carruthers, S.P., 1998. European agricultural policy and farm animal
welfare. Food Policy 23, 305-323.
Zuurbier, P.J.P., J.H. Trienekens and G.W. Ziggers, 1996. Verticale samenwerking,
Stappenplan voor ketenvorming in food en agribusiness. Kluwer Bedrijfsinformatie
Deventer.