Embed Size (px)
Citation preview
INFRA FOCH
Société par Actions Simplifiée
4, Place de la Pyramide – Immeuble Ile de France- Bat A
92800 PUTEAUX La Défense
Statutory Auditors’ Report
on the consolidated financial statements
For the 6 month period from July 1st, 2014 to December
31, 2014
PROXIMA
16ter, avenue du Dr Faugeroux
Le Parc du Perreux
94170 Le Perreux-sur-Marne
DELOITTE & ASSOCIES
185, avenue Charles de Gaulle
92524 Neuilly-sur-Seine Cedex
INFRA FOCH
Société par Actions Simplifiée
4, Place de la Pyramide – Immeuble Ile de France- Bat A
92800 PUTEAUX La Défense
Statutory Auditors’ Report
on the consolidated financial statements
For the 6 month period from July 1st, 2014 to December 31, 2014
This is a free translation into English of the statutory auditors’ report on the consolidated financial statements issued in the
French language and is provided solely for the convenience of English speaking users.
The statutory auditors’ report includes information specifically required by French law in such reports, whether modified or
not. This information is presented below the opinion on the consolidated financial statements and includes explanatory
paragraphs discussing the auditors’ assessments of certain significant accounting and auditing matters. These assessments
were made for the purpose of issuing an audit opinion on the consolidated financial statements taken as a whole and not to
provide separate assurance on individual account captions or on information taken outside of the consolidated financial
statements.
This report also includes information relating to the specific verification of information given in the management report.
This report should be read in conjunction with, and is construed in accordance with, French law and professional auditing
standards applicable in France.
To the Shareholder,
In accordance with our appointment by you as statutory auditors, we hereby report to you for
the 6 month period from July 1st, 2014 to December 31, 2014 on:
· the audit of the accompanying consolidated financial statements of INFRA FOCH,
· the justification of our assessments,
· the specific procedure required by law.
INFRA FOCH 3 / 4
These consolidated financial statements have been approved by the President. Our role is to
express an opinion on these financial statements, based on our audit.
I. Opinion on the consolidated financial statements
We conducted our audit in accordance with professional standards applicable in France. Those
standards require that we plan and perform the audit to obtain reasonable assurance about
whether the consolidated financial statements are free of material misstatement. An audit
involves performing procedures, using sampling techniques or other methods of selection, to
obtain audit evidence about the amounts and disclosures in the consolidated financial
statements. An audit also includes evaluating the appropriateness of accounting policies used
and the reasonableness of accounting estimates made, as well as the overall presentation of the
consolidated financial statements. We believe that the audit evidence we have obtained is
sufficient and appropriate to provide a basis for our audit opinion.
In our opinion, the consolidated financial statements give a true and fair view of the assets and
liabilities and of the financial position of the Group as at December 31, 2014 and of the results
of its operations for the period then ended in accordance with the International Financial
Reporting Standards as adopted by the European Union.
II. Justification of assessments
Pursuant to the provisions of Article L.823-9 of the French Commercial Code (Code de
Commerce) governing the justification of our assessments, we draw your attention to the
following:
As disclosed in Note C.3.1 to the consolidated financial statements, the INFRA FOCH Group
uses estimates that are based on the information available at the time its consolidated financial
statements are prepared, in the midst of an ongoing economic crisis in Europe, whose
consequences on economic growth make it difficult to assess the mid-term outlook for
companies. As disclosed in Note C.2.5 to the consolidated financial statements, these
estimates primarily concern the fair value measurement of assets acquired as part of a business
combination. As disclosed in Note D.1 to the consolidated financial statements, the Company
performed a supplementary review of asset and liability values provisionally recognized on
the acquisition of VINCI Park group on June 4, 2014. We reviewed the additional value
adjustments recognized as of December 31, 2014 and, in particular, the method by which they
were determined, as well as the cash flow forecasts and assumptions used by the Company.
Such assessments were performed as part of our audit approach for the consolidated financial
statements taken as a whole and contributed to the expression of our opinion in the first part
of this report.
INFRA FOCH 4 / 4
III. Specific procedure
As required by law, we have also verified in accordance with professional standards
applicable in France the information concerning the Group presented in the management
report.
We have no matters to report regarding its fair presentation and consistency with the
consolidated financial statements.
Le Perreux-sur-Marne and Neuilly-sur-Seine, March 31, 2015
The Statutory Auditors
PROXIMA DELOITTE & ASSOCIES
Nicholas L.E. Rolt
Marc de Villartay
French simplified limited liability company (Société par Actions Simplifiée) withshare capital of 160,044,282
CONSOLIDATED FINANCIAL STATEMENTS
FOR THE PERIOD ENDED 31 DECEMBER 2014
INFRA FOCH
Registered office: 4, Place de la Pyramide – Immeuble Ile de France – Bât A –92800 Puteaux La Défense
Registration number 800 348 146 RCS Nanterre
Page 2
SOMMAIRE DES COMPTES CONSOLIDES
Consolidated income statement .......................................................................................................4
Consolidated comprehensive income statement.................................................................................5
Consolidated balance sheet...................................................................................................................6
Consolidated cash flow statement........................................................................................................8
Consolidated statement of changes in equity......................................................................................9
NOTES TO THE CONSOLIDATED FINANCIAL STATEMENTS
A. PRESENTATION OF THE GROUP AND THE BACKGROUND FOR PREPARING THE FINANCIALSTATEMENTS ....................................................................................................................................11
1. Presentation of the Group .....................................................................................................................11
2. Background for preparing the Group's consolidated financial statements.........................................11
3. Change of accounts closing date...........................................................................................................11
B. HIGHLIGHTS IN THE PERIOD ENDED 31 DECEMBER 2014 ...........................................................13
C. ACCOUNTING POLICIES AND MEASUREMENT METHODS .............................................................14
1. General principles ..................................................................................................................................14
2. Consolidation methods ..........................................................................................................................14
3. Measurement rules and methods.........................................................................................................18
D. BUSINESS COMBINATIONS ........................................................................................................32
1. Acquisitions in the previous period.......................................................................................................32
2. Acquisitions in the period......................................................................................................................33
E. INFORMATION BY OPERATING SEGMENT...................................................................................34
1. Revenue..................................................................................................................................................35
2. Segment information by geographical area.........................................................................................36
3. Reconciliation between capital employed and the financial statements...........................................39
F. NOTES TO THE INCOME STATEMENT...........................................................................................40
1. Operating income ..................................................................................................................................40
2. Financial income and expense..............................................................................................................42
3. Income tax expense...............................................................................................................................43
4. Earnings per share .................................................................................................................................44
G. NOTES TO THE BALANCE SHEET..................................................................................................45
1. Concession intangible assets.................................................................................................................45
2. Goodwill..................................................................................................................................................46
3. Other intangible assets..........................................................................................................................47
4. Property, plant and equipment.............................................................................................................48
Page 3
5. Impairment tests on goodwill and other non-current assets..............................................................49
6. Investments in equity-accounted companies.......................................................................................49
7. Related parties .......................................................................................................................................53
8. Non-current financial assets..................................................................................................................54
9. Cash management financial assets and cash.......................................................................................56
10. Equity ..................................................................................................................................................57
11. Retirement and other employee-benefit obligations......................................................................59
12. Other provisions .................................................................................................................................63
13. Working capital requirement.............................................................................................................64
14. Net financial debt ..............................................................................................................................66
15. Financial risk management ...............................................................................................................71
H. MAIN FEATURES OF CONCESSION CONTRACTS ...........................................................................77
1. Concession contracts – intangible asset model ....................................................................................77
2. Concession contracts – Financial asset model ......................................................................................78
I. OTHER NOTES............................................................................................................................79
1. Contractual obligations and other commitments made and received................................................79
2. Number of employees...........................................................................................................................81
J. STATUTORY AUDITOR FEES ........................................................................................................82
K. POST-BALANCE SHEETS EVENTS .................................................................................................82
L. LIST OF CONSOLIDATED COMPANIES AT 31 DECEMBER 2014.....................................................83
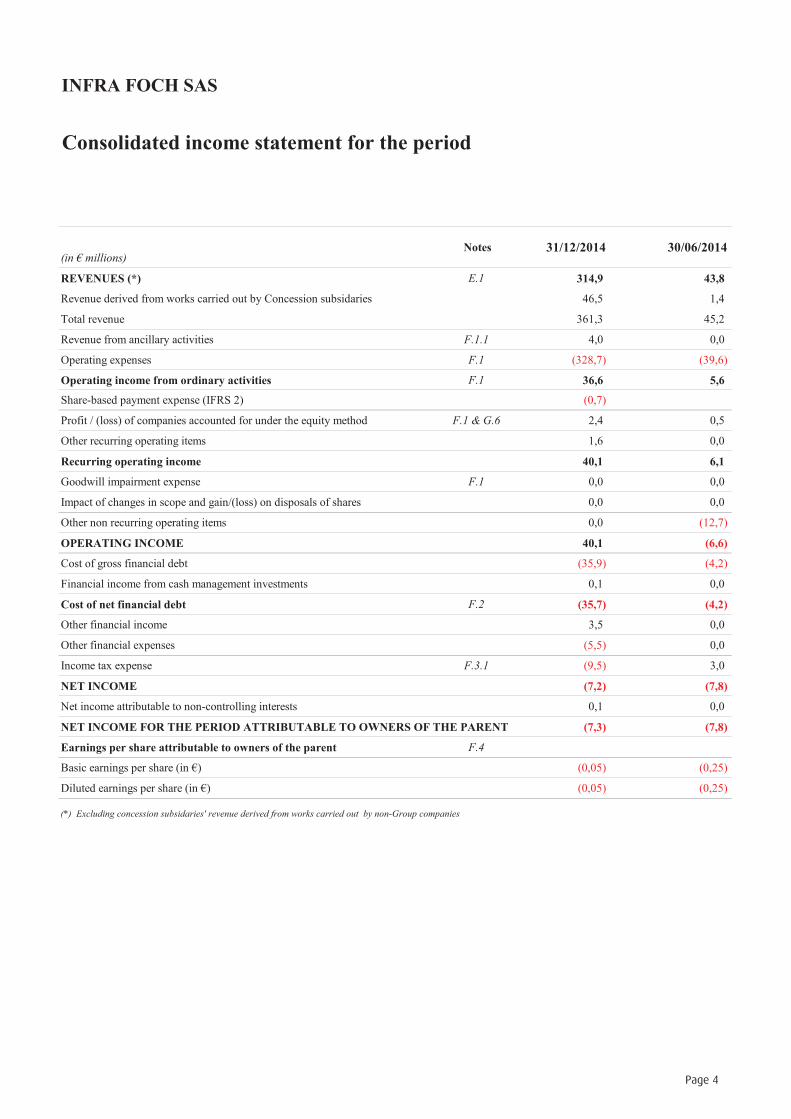
INFRA FOCH SAS
Consolidated income statement for the period
(in millions)
REVENUES (*) E.1 314,9 43,8
Revenue derived from works carried out by Concession subsidaries 46,5 1,4
Total revenue 361,3 45,2
Revenue from ancillary activities F.1.1 4,0 0,0
Operating expenses F.1 (328,7) (39,6)
Operating income from ordinary activities F.1 36,6 5,6
Share-based payment expense (IFRS 2) (0,7)
Profit / (loss) of companies accounted for under the equity method F.1 & G.6 2,4 0,5
Other recurring operating items 1,6 0,0
Recurring operating income 40,1 6,1
Goodwill impairment expense F.1 0,0 0,0
Impact of changes in scope and gain/(loss) on disposals of shares 0,0 0,0
Other non recurring operating items 0,0 (12,7)
OPERATING INCOME 40,1 (6,6)
Cost of gross financial debt (35,9) (4,2)
Financial income from cash management investments 0,1 0,0
Cost of net financial debt F.2 (35,7) (4,2)
Other financial income 3,5 0,0
Other financial expenses (5,5) 0,0
Income tax expense F.3.1 (9,5) 3,0
NET INCOME (7,2) (7,8)
Net income attributable to non-controlling interests 0,1 0,0
NET INCOME FOR THE PERIOD ATTRIBUTABLE TO OWNERS OF THE PARENT (7,3) (7,8)
Earnings per share attributable to owners of the parent F.4
Basic earnings per share (in ) (0,05) (0,25)
Diluted earnings per share (in ) (0,05) (0,25)
(*) Excluding concession subsidaries' revenue derived from works carried out by non-Group companies
31/12/2014Notes 30/06/2014
Page 4
INFRA FOCH SAS
Attributable to
owners of the parent
Attributable to
non-controlling
interests
Total
Attributable to
owners of the
parent
Attributable to non-
controlling
interests
Total
(in millions)
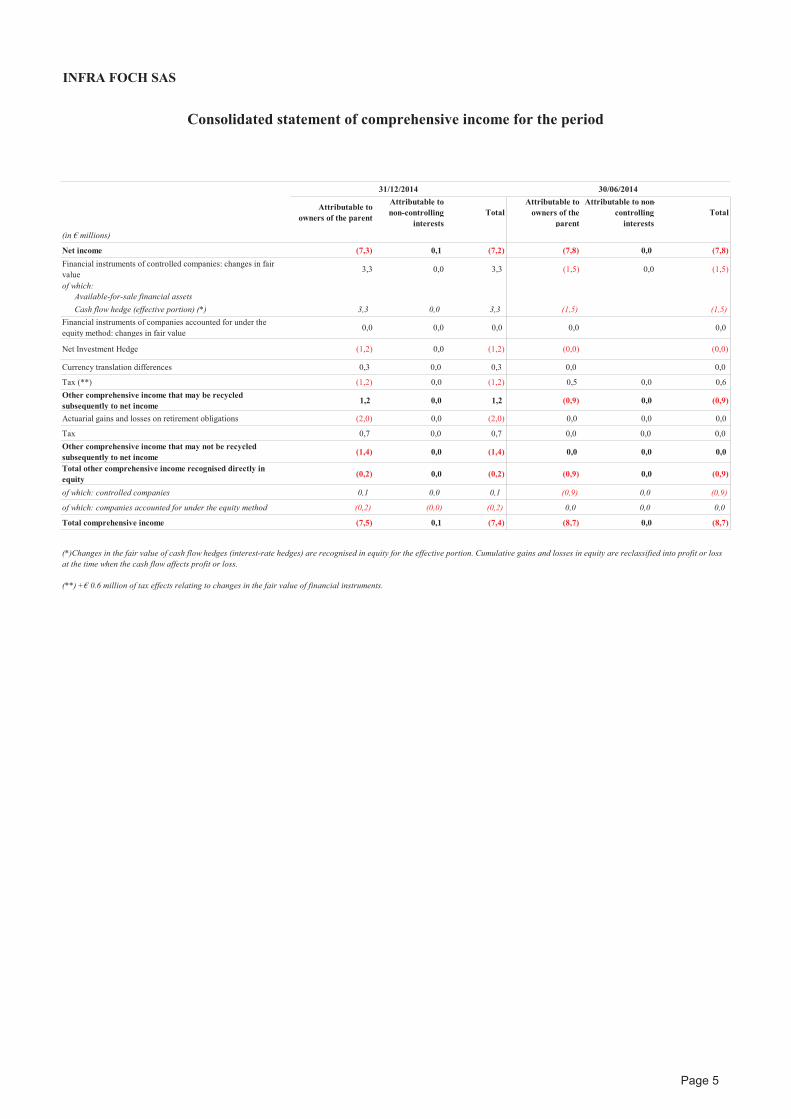
Net income (7,3) 0,1 (7,2) (7,8) 0,0 (7,8)
Financial instruments of controlled companies: changes in fair
value3,3 0,0 3,3 (1,5) 0,0 (1,5)
of which:
Available-for-sale financial assets
Cash flow hedge (effective portion) (*) 3,3 0,0 3,3 (1,5) (1,5)
Financial instruments of companies accounted for under the
equity method: changes in fair value0,0 0,0 0,0 0,0 0,0
Net Investment Hedge (1,2) 0,0 (1,2) (0,0) (0,0)
Currency translation differences 0,3 0,0 0,3 0,0 0,0
Tax (**) (1,2) 0,0 (1,2) 0,5 0,0 0,6
Other comprehensive income that may be recycled
subsequently to net income1,2 0,0 1,2 (0,9) 0,0 (0,9)
Actuarial gains and losses on retirement obligations (2,0) 0,0 (2,0) 0,0 0,0 0,0
Tax 0,7 0,0 0,7 0,0 0,0 0,0
Other comprehensive income that may not be recycled
subsequently to net income(1,4) 0,0 (1,4) 0,0 0,0 0,0
Total other comprehensive income recognised directly in
equity(0,2) 0,0 (0,2) (0,9) 0,0 (0,9)
of which: controlled companies 0,1 0,0 0,1 (0,9) 0,0 (0,9)
of which: companies accounted for under the equity method (0,2) (0,0) (0,2) 0,0 0,0 0,0
Total comprehensive income (7,5) 0,1 (7,4) (8,7) 0,0 (8,7)
Consolidated statement of comprehensive income for the period
(**) + 0.6 million of tax effects relating to changes in the fair value of financial instruments.
31/12/2014 30/06/2014
(*)Changes in the fair value of cash flow hedges (interest-rate hedges) are recognised in equity for the effective portion. Cumulative gains and losses in equity are reclassified into profit or loss
at the time when the cash flow affects profit or loss.
Page 5
INFRA FOCH SAS
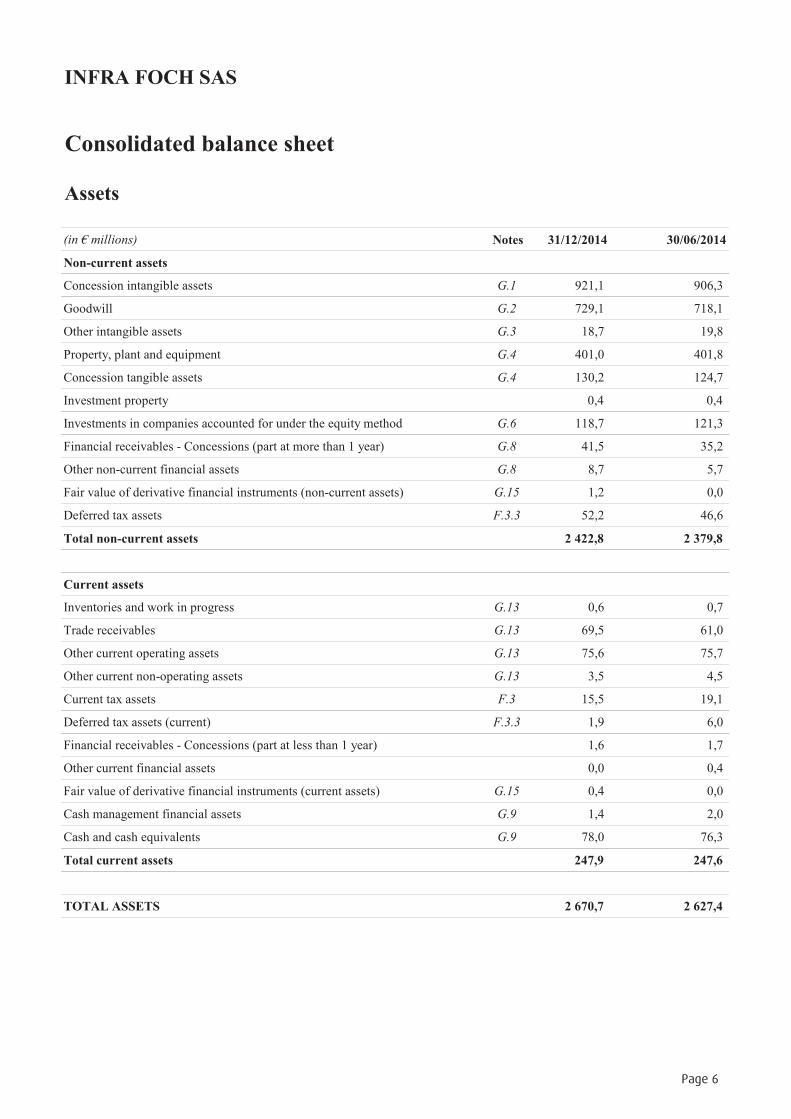
Consolidated balance sheet
Assets
(in millions) Notes 31/12/2014 30/06/2014
Non-current assets
Concession intangible assets G.1 921,1 906,3
Goodwill G.2 729,1 718,1
Other intangible assets G.3 18,7 19,8
Property, plant and equipment G.4 401,0 401,8
Concession tangible assets G.4 130,2 124,7
Investment property 0,4 0,4
Investments in companies accounted for under the equity method G.6 118,7 121,3
Financial receivables - Concessions (part at more than 1 year) G.8 41,5 35,2
Other non-current financial assets G.8 8,7 5,7
Fair value of derivative financial instruments (non-current assets) G.15 1,2 0,0
Deferred tax assets F.3.3 52,2 46,6
Total non-current assets 2 422,8 2 379,8
Current assets
Inventories and work in progress G.13 0,6 0,7
Trade receivables G.13 69,5 61,0
Other current operating assets G.13 75,6 75,7
Other current non-operating assets G.13 3,5 4,5
Current tax assets F.3 15,5 19,1
Deferred tax assets (current) F.3.3 1,9 6,0
Financial receivables - Concessions (part at less than 1 year) 1,6 1,7
Other current financial assets 0,0 0,4
Fair value of derivative financial instruments (current assets) G.15 0,4 0,0
Cash management financial assets G.9 1,4 2,0
Cash and cash equivalents G.9 78,0 76,3
Total current assets 247,9 247,6
TOTAL ASSETS 2 670,7 2 627,4
Page 6
INFRA FOCH SAS
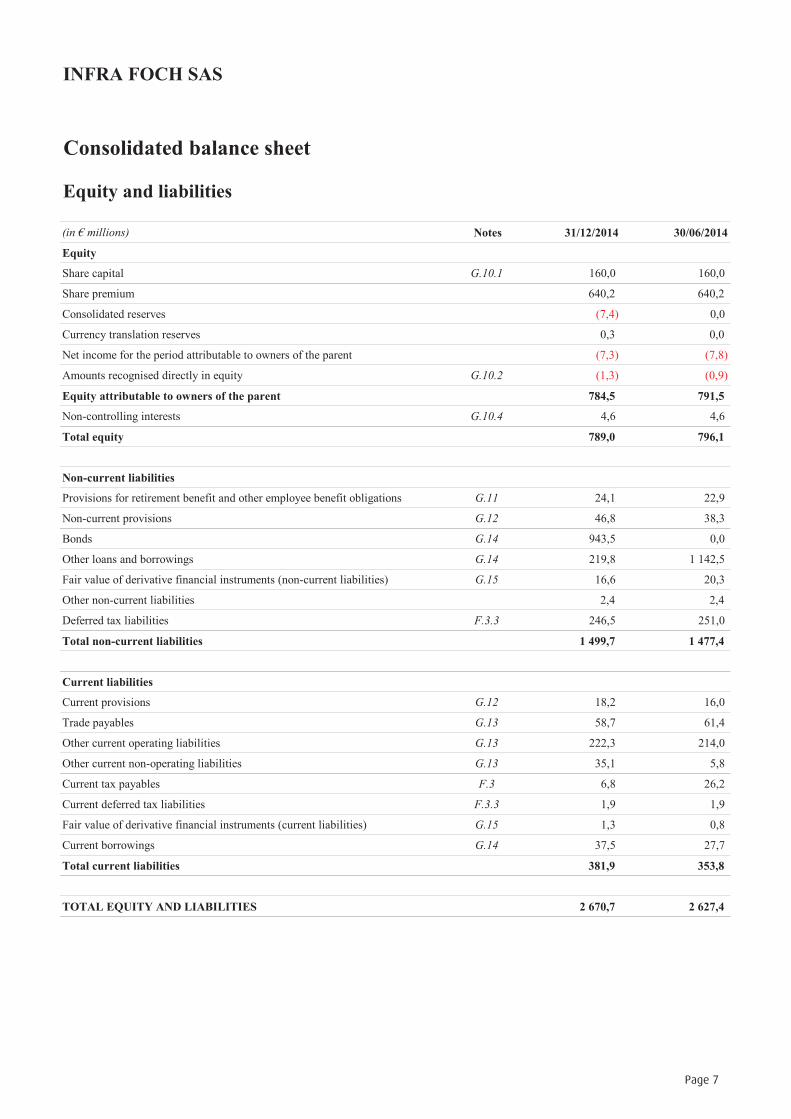
Consolidated balance sheet
Equity and liabilities
(in millions) Notes 31/12/2014 30/06/2014
Equity
Share capital G.10.1 160,0 160,0
Share premium 640,2 640,2
Consolidated reserves (7,4) 0,0
Currency translation reserves 0,3 0,0
Net income for the period attributable to owners of the parent (7,3) (7,8)
Amounts recognised directly in equity G.10.2 (1,3) (0,9)
Equity attributable to owners of the parent 784,5 791,5
Non-controlling interests G.10.4 4,6 4,6
Total equity 789,0 796,1
Non-current liabilities
Provisions for retirement benefit and other employee benefit obligations G.11 24,1 22,9
Non-current provisions G.12 46,8 38,3
Bonds G.14 943,5 0,0
Other loans and borrowings G.14 219,8 1 142,5
Fair value of derivative financial instruments (non-current liabilities) G.15 16,6 20,3
Other non-current liabilities 2,4 2,4
Deferred tax liabilities F.3.3 246,5 251,0
Total non-current liabilities 1 499,7 1 477,4
Current liabilities
Current provisions G.12 18,2 16,0
Trade payables G.13 58,7 61,4
Other current operating liabilities G.13 222,3 214,0
Other current non-operating liabilities G.13 35,1 5,8
Current tax payables F.3 6,8 26,2
Current deferred tax liabilities F.3.3 1,9 1,9
Fair value of derivative financial instruments (current liabilities) G.15 1,3 0,8
Current borrowings G.14 37,5 27,7
Total current liabilities 381,9 353,8
TOTAL EQUITY AND LIABILITIES 2 670,7 2 627,4
Page 7
INFRA FOCH SAS
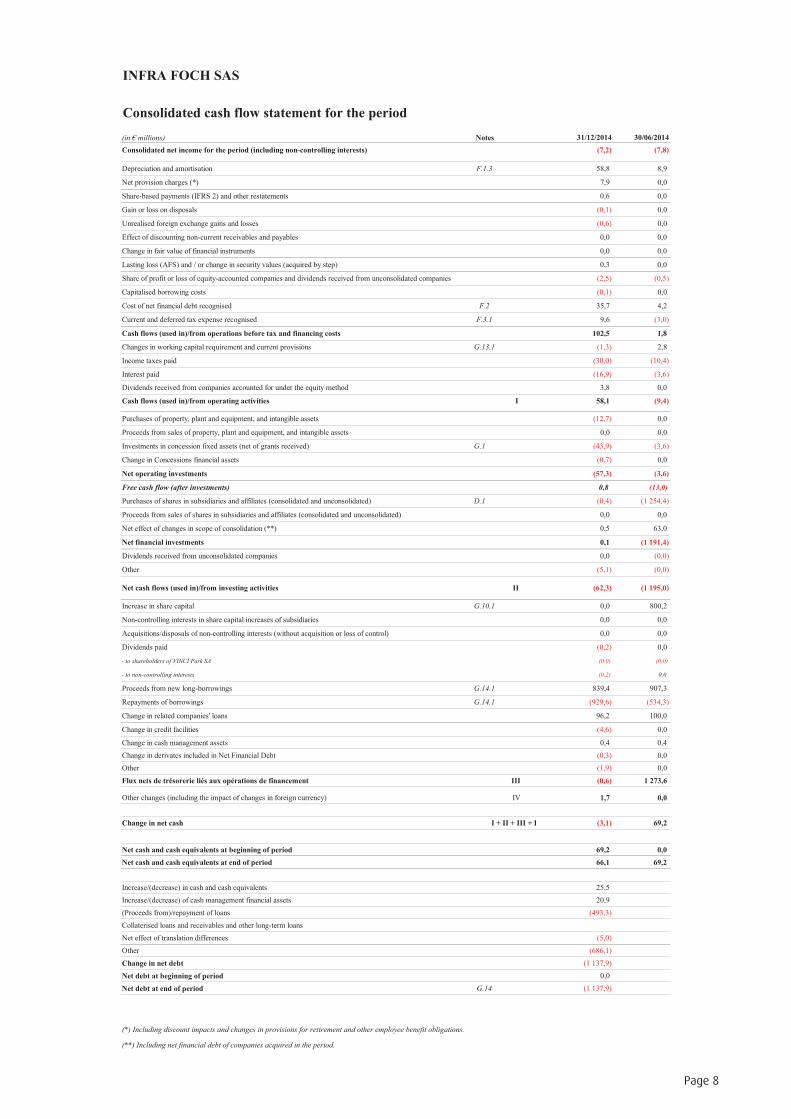
Consolidated cash flow statement for the period
(in millions) Notes 31/12/2014 30/06/2014
Consolidated net income for the period (including non-controlling interests) (7,2) (7,8)
Depreciation and amortisation F.1.3 58,8 8,9
Net provision charges (*) 7,9 0,0
Share-based payments (IFRS 2) and other restatements 0,6 0,0
Gain or loss on disposals (0,1) 0,0
Unrealised foreign exchange gains and losses (0,6) 0,0
Effect of discounting non-current receivables and payables 0,0 0,0
Change in fair value of financial instruments 0,0 0,0
Lasting loss (AFS) and / or change in security values (acquired by step) 0,3 0,0
Share of profit or loss of equity-accounted companies and dividends received from unconsolidated companies (2,5) (0,5)
Capitalised borrowing costs (0,1) 0,0
Cost of net financial debt recognised F.2 35,7 4,2
Current and deferred tax expense recognised F.3.1 9,6 (3,0)
Cash flows (used in)/from operations before tax and financing costs 102,5 1,8
Changes in working capital requirement and current provisions G.13.1 (1,3) 2,8
Income taxes paid (30,0) (10,4)
Interest paid (16,9) (3,6)
Dividends received from companies accounted for under the equity method 3,8 0,0
Cash flows (used in)/from operating activities I 58,1 (9,4)
Purchases of property, plant and equipment, and intangible assets (12,7) 0,0
Proceeds from sales of property, plant and equipment, and intangible assets 0,0 0,0
Investments in concession fixed assets (net of grants received) G.1 (43,9) (3,6)
Change in Concessions financial assets (0,7) 0,0
Net operating investments (57,3) (3,6)
Free cash flow (after investments) 0,8 (13,0)
Purchases of shares in subsidiaries and affiliates (consolidated and unconsolidated) D.1 (0,4) (1 254,4)
Proceeds from sales of shares in subsidiaries and affiliates (consolidated and unconsolidated) 0,0 0,0
Net effect of changes in scope of consolidation (**) 0,5 63,0
Net financial investments 0,1 (1 191,4)
Dividends received from unconsolidated companies 0,0 (0,0)
Other (5,1) (0,0)
Net cash flows (used in)/from investing activities II (62,3) (1 195,0)
Increase in share capital G.10.1 0,0 800,2
Non-controlling interests in share capital increases of subsidiaries 0,0 0,0
Acquisitions/disposals of non-controlling interests (without acquisition or loss of control) 0,0 0,0
Dividends paid (0,2) 0,0
- to shareholders of VINCI Park SA (0,0) (0,0)
- to non-controlling interests (0,2) 0,0
Proceeds from new long-borrowings G.14.1 839,4 907,3
Repayments of borrowings G.14.1 (929,6) (534,3)
Change in related companies' loans 96,2 100,0
Change in credit facilities (4,6) 0,0
Change in cash management assets 0,4 0,4
Change in derivates included in Net Financial Debt (0,3) 0,0
Other (1,9) 0,0
Flux nets de trésorerie liés aux opérations de financement III (0,6) 1 273,6
Other changes (including the impact of changes in foreign currency) IV 1,7 0,0
Change in net cash I + II + III + IV (3,1) 69,2
Net cash and cash equivalents at beginning of period 69,2 0,0
Net cash and cash equivalents at end of period 66,1 69,2
Increase/(decrease) in cash and cash equivalents 25,5
Increase/(decrease) of cash management financial assets 20,9
(Proceeds from)/repayment of loans (493,3)
Collaterised loans and receivables and other long-term loans
Net effect of translation differences (5,0)
Other (686,1)
Change in net debt (1 137,9)
Net debt at beginning of period 0,0
Net debt at end of period G.14 (1 137,9)
(*) Including discount impacts and changes in provisions for retirement and other employee benefit obligations.
(**) Including net financial debt of companies acquired in the period.
Page 8
INFRA FOCH SAS
(in millions)
NotesShare capital
Share
premium
Treasury
shares
Consolidated
reserves Net income
Currency
translation
reserves
Amounts
recognised
directly in
equity
Total
attributable to
owners of the
parent
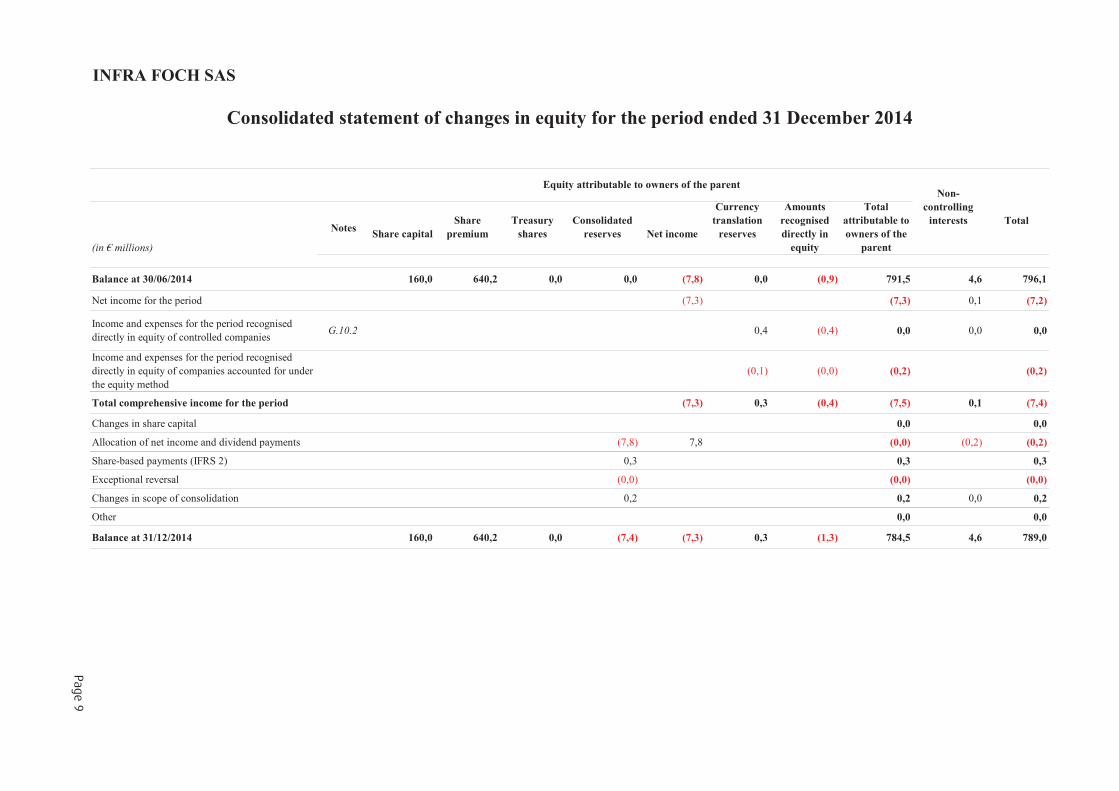
Balance at 30/06/2014 160,0 640,2 0,0 0,0 (7,8) 0,0 (0,9) 791,5 4,6 796,1
Net income for the period (7,3) (7,3) 0,1 (7,2)
Income and expenses for the period recognised
directly in equity of controlled companiesG.10.2 0,4 (0,4) 0,0 0,0 0,0
Income and expenses for the period recognised
directly in equity of companies accounted for under
the equity method
(0,1) (0,0) (0,2) (0,2)
Total comprehensive income for the period (7,3) 0,3 (0,4) (7,5) 0,1 (7,4)
Changes in share capital 0,0 0,0
Allocation of net income and dividend payments (7,8) 7,8 (0,0) (0,2) (0,2)
Share-based payments (IFRS 2) 0,3 0,3 0,3
Exceptional reversal (0,0) (0,0) (0,0)
Changes in scope of consolidation 0,2 0,2 0,0 0,2
Other 0,0 0,0
Balance at 31/12/2014 160,0 640,2 0,0 (7,4) (7,3) 0,3 (1,3) 784,5 4,6 789,0
Consolidated statement of changes in equity for the period ended 31 December 2014
Equity attributable to owners of the parentNon-
controlling
interests Total
Page9
INFRA FOCH SAS
(in millions)
NotesShare capital
Share
premium
Treasury
shares
Consolidated
reserves Net income
Currency
translation
reserves
Amounts
recognised
directly in
equity
Total
attributable to
owners of the
parent
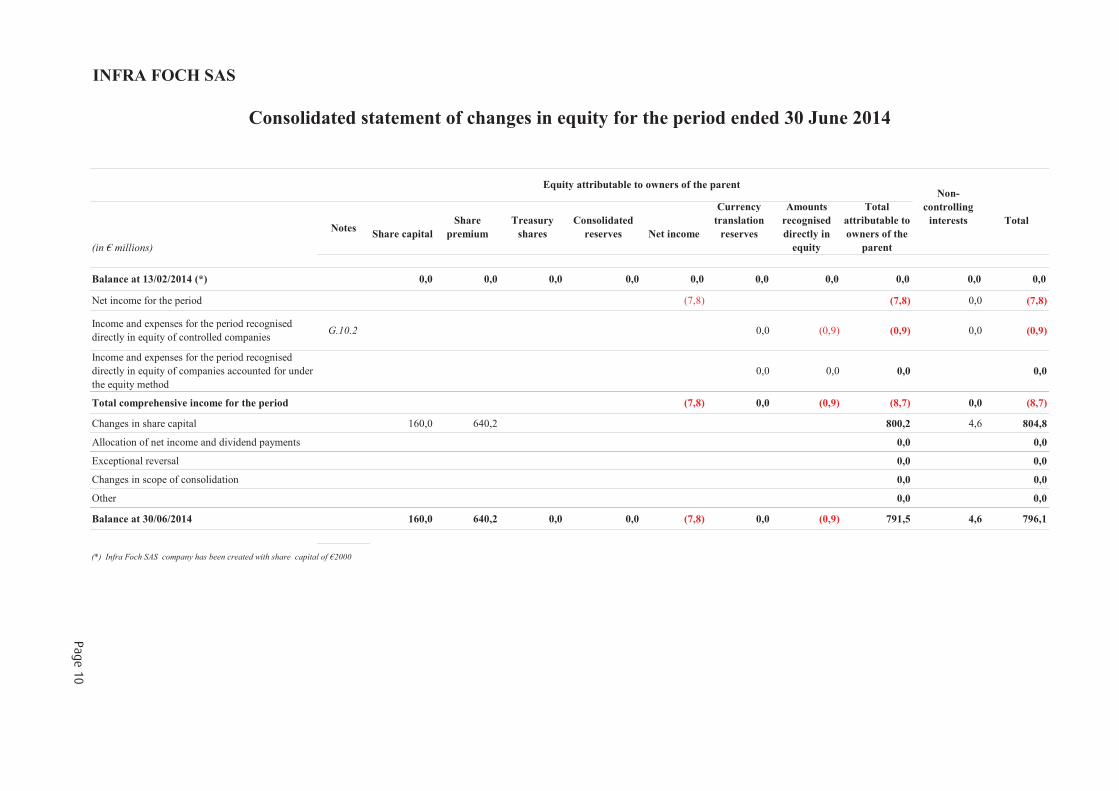
Balance at 13/02/2014 (*) 0,0 0,0 0,0 0,0 0,0 0,0 0,0 0,0 0,0 0,0
Net income for the period (7,8) (7,8) 0,0 (7,8)
Income and expenses for the period recognised
directly in equity of controlled companiesG.10.2 0,0 (0,9) (0,9) 0,0 (0,9)
Income and expenses for the period recognised
directly in equity of companies accounted for under
the equity method
0,0 0,0 0,0 0,0
Total comprehensive income for the period (7,8) 0,0 (0,9) (8,7) 0,0 (8,7)
Changes in share capital 160,0 640,2 800,2 4,6 804,8
Allocation of net income and dividend payments 0,0 0,0
Exceptional reversal 0,0 0,0
Changes in scope of consolidation 0,0 0,0
Other 0,0 0,0
Balance at 30/06/2014 160,0 640,2 0,0 0,0 (7,8) 0,0 (0,9) 791,5 4,6 796,1
Consolidated statement of changes in equity for the period ended 30 June 2014
Equity attributable to owners of the parentNon-
controlling
interests Total
(*) Infra Foch SAS company has been created with share capital of 2000
Page10
Page 11
NOTES TO THE CONSOLIDATED FINANCIAL STATEMENTS
A. PRESENTATION OF THE GROUP AND THE BACKGROUND FOR PREPARING THE FINANCIALSTATEMENTS
1. Presentation of the Group
INFRA FOCH (the "Company") is a simplified limited liability company (société par actions simplifiée)incorporated under French law. Its head office is at 4, Place de la Pyramide – Immeuble Ile de France– Bât A – 92800 Puteaux La Défense. It is registered at the Nanterre Trade and Companies Registryunder number 800 348 146.
Its parent company is INFRA FOCH TOPCO, which is owned at 31 December 2014 by Ardian (36.92%),Crédit Agricole Assurances (36.92%), VINCI Concessions (24.61%) and management (1.55%). Governancearrangements give Ardian, Credit Agricole Assurances and VINCI significant influence over INFRA FOCH.
On 4 June 2014, the Company acquired all shares in VINCI Park from VINCI Concessions.
The group consisting of INFRA FOCH and its subsidiaries (hereinafter "INFRA FOCH" or the "Group") is aglobal player in parking and urban mobility, operating in 14 countries.
The Group works with various public- and private-sector entities (local authorities, hospitals, stations,airports, shopping centres, stadiums, leisure facilities, tourist facilities, residences, companies,universities, government agencies etc.) to design, build, finance and operate on-street and off-streetparking solutions based on concession, owner-occupied and service-provider models.
2. Background for preparing the Group's consolidated financial statements
The Company's first accounting period started on the date the Company was registered, i.e. 13 February2014, and ended on 30 June 2014, the Company's annual accounts closing date.
The financial statements for the period ended 30 June 2014 were the Group's first set of consolidatedfinancial statements and covered a period of four and half months. In preparing these consolidatedfinancial statements, VINCI Park was included as a fully consolidated company from 4 June 2014.
The financial statements for the four and half months ended 30 June 2014 were also the first financialstatements prepared in accordance with IFRSs, and they complied with IFRS 1 "First-time adoption ofIFRSs". The Group's date of transition to IFRSs was the first day of the Company's first accounting period.As a result, the transition to IFRSs had no impact.
These consolidated financial statements were prepared as part of the 31 December 2014 annual accountsclosing process. They were finalised by the Chairman, Serge Clémente, and will be submitted to the soleshareholder for approval on 13 April 2015.
3. Change of accounts closing date
The extraordinary shareholder general meeting of 3 October 2014, pursuant to a proposal by thePresident, approved the change in INFRA FOCH's accounts closing date from 30 June to 31 December.
The decision was intended to bring the financial year into line with the calendar year.
The change in the accounts closing date is effective from the current financial year and results in a six-month accounting period ended 31 December 2014. As a result, the financial statements for the six-month period ended 31 December 2014 are not genuinely comparable with the Group's previousfinancial statements for the period ended 30 June 2014.
Page 12
In accordance with IAS 1 "Presentation of financial statements", the consolidated financial statements forthe period ended 31 December 2014 include the following:
– The consolidated balance sheet at 31 December 2014 and a statement comparing balance sheetinformation with the end of the previous period (30 June 2014);
– The consolidated income statement and the consolidated comprehensive income statement forthe period ended 31 December 2014 and a statement of comparison with the previous period(from 13 February 2014 to 30 June 2014);
– The statement of changes in equity since the start of the period (i.e. from 1 July 2014 to31 December 2014) and in the previous period (i.e. the period ended 30 June 2014);
– The cash flow statement since the start of the period (i.e. from 1 July 2014 to 31 December 2014)and for the previous period (i.e. from 13 February 2014 to 30 June 2014).
Page 13
B. HIGHLIGHTS OF THE PERIOD ENDED 31 DECEMBER 2014
9 OCTOBER 2014 BOND ISSUE
On 9 October 2014, 950 million of bonds issued by INFRA FOCH ( 500 million of bonds with a 6-yearmaturity and 450m of bonds with a 10.5-year maturity) were subscribed by a syndicate of Europeaninvestors. The issue enabled the Company to refinance its 920 million syndicated loan, and bothtranches were repaid on 16 October 2014. Concomitantly, drawn facilities were renegotiated into a single300 million facility carrying no particular guarantees.
The highlights of the previous period (ended 30 June 2014) are set out below.
SYNDICATED LOAN
On 27 May 2014, the Company entered into a 1,220 million syndicated loan with a banking syndicate,effective from 4 June 2014. This loan financed part of the acquisition of VINCI Park shares, and allowedthe Company to restructure VINCI Park's debt.
LOAN FROM THE PARENT COMPANY
On 4 June 2014, INFRA FOCH TOPCO granted a bullet loan of 100 million to INFRA FOCH, due to matureon 31 December 2045.
INCREASE IN SHARE CAPITAL
In accordance with decisions taken by the sole shareholder (INFRA FOCH TOPCO) on 3 June 2014, theCompany carried out a capital increase. It issued 160,044,280 ordinary shares with par value of 1 eachfor a subscription price, paid in cash, of 5 per share, taking the capital from 2 to 160,044,282. INFRAFOCH TOPCO subscribed all shares in that capital increase, in a total amount of 800.2 million. At 30 June2014, the Company's shares were fully paid up.
ACQUISITION OF VINCI PARK
On 4 June 2014, after receiving authorisation from the relevant competition authorities, VINCI Concessionscompleted the transaction to attract new investors in VINCI Park.
The deal was aimed at enabling VINCI Park to continue its international development in high-growthmarkets in regions like North America, Latin America and Asia, and to strengthen its leading position inFrance and Europe.
The transaction involved the Company acquiring all shares in VINCI Park from VINCI Concessions (a whollyowned subsidiary of the VINCI group) for a price of 1,254.4 million (see section D. “BUSINESSCOMBINATIONS”).
Page 14
C. ACCOUNTING POLICIES AND MEASUREMENT METHODS
1. General principles
These Group’s consolidated financial statements for the period ended 31 December 2014 were preparedin accordance with International Financial Reporting Standards (IFRSs) as published by the IASB andadopted by the European Union at 31 December 2014.
The Group's consolidated financial statements are presented in millions of euros, rounded to the firstdecimal place. This may in certain circumstances lead to non-material differences between the sum ofthe figures and the sub-totals that appear in the tables. A value of 0 is indicated in the accounting format.
1.1 New standards and interpretations applicable from 1 July 2014
Interpretation IFRIC 21 “Levies”, mandatorily applicable from 1 July 2014 has no material impact on theGroup’s consolidated financial statements at 31 December 2014.
1.2 Standards and Interpretations adopted by the IASB but not yet applicable at 31 December 2014
The Group has not applied early the following Standards and Interpretations of which application was notmandatory at 1 July 2014:
IFRS 9 "Financial Instruments";IFRS 15 "Revenue from Contracts with Customers";Amendments to IAS 19 "Defined Benefit Plans: Employee Contributions";Amendments to IFRS 11 "Accounting for Acquisitions of Interests in Joint Operations";Amendments to IAS 16 and IAS 38 "Clarification of Acceptable Methods of Depreciation andAmortisation";Annual improvements 2010-2012;Annual improvements 2011-2013.
The Group plans to analyse the impacts and practical consequences of applying these texts.
1.3 Basis of preparation
The consolidated financial statements were prepared using the historical cost method, except as regardscertain financial instruments, which were measured at fair value at the end of each financial reportingperiod, as explained in the accounting policies set out below.
Historical cost is generally based on the fair value of the consideration given in exchange for goods andservices.
Fair value is defined as the price that would be received from selling an asset or paid to transfer a liabilityin a normal transaction between market participants at the measurement date, whether that price isdirectly observable or estimated using another measurement technique (see C.3.1 "Use of estimates" formore details).
2. Consolidation methods
2.1 Consolidation scope
The notion of control over an entity is defined on the basis of three criteria:power over the entity, i.e. the ability direct the activities that have the greatest impact on itsprofitability;exposure to variable returns from the entity, which may be positive in the form of dividends orany other financial benefit, or negative;
Page 15
and the connection between power and these returns, i.e. the ability to exert power over theentity in order to influence the returns obtained.
In practice, companies in which the Group holds, whether directly or indirectly, the majority of votingrights in shareholders' general meetings, in the Boards of Directors or in the equivalent managementbodies, giving it the power to direct their operational and financial policies, are generally deemed to becontrolled and are fully consolidated. To assess control, the Group carries out an in-depth analysis of theestablished governance arrangements and of the rights held by other shareholders, to see whether theyare purely protective. Where necessary, an analysis is performed in relation to instruments held by theGroup or third parties (potential voting rights, dilutive instruments, convertible instruments etc.) that, ifexercised, could alter the type of influence exerted by each party.
An analysis is also performed if a specific event takes place that may affect the level of control exertedby the Group, such as a change in an entity's ownership structure or governance, or the exercise of adilutive financial instrument.
Joint control is established where decisions relating to the entity's main activities require the unanimousconsent of the parties sharing control. Joint arrangements now fall into two categories (joint ventures andjoint operations) depending on the nature of the rights and obligations held by each party. Thatclassification is generally determined by the legal form of the project vehicle.
A joint venture is an arrangement where the parties exerting joint control over the entity (jointventurers) have rights to the entity's net assets. Joint ventures are accounted for under the equitymethod.A joint operation is a joint arrangement in which the parties (joint operators) have direct rightsover the assets and direct obligations with respect to the entity's liabilities. Each joint operatormust account for the portion of assets, liabilities, income and expenses that corresponds to itsinterest in the joint operation.
Associates are entities in which the Group exerts significant influence. Significant influence is presumedwhere the Group's stake is more than or equal to 20%. However, it may arise where the ownershipinterest is lower, particularly where the Group is represented on the Board of Directors or any equivalentgovernance body, and therefore takes part in determining the entity's operational and financial policiesand strategy.
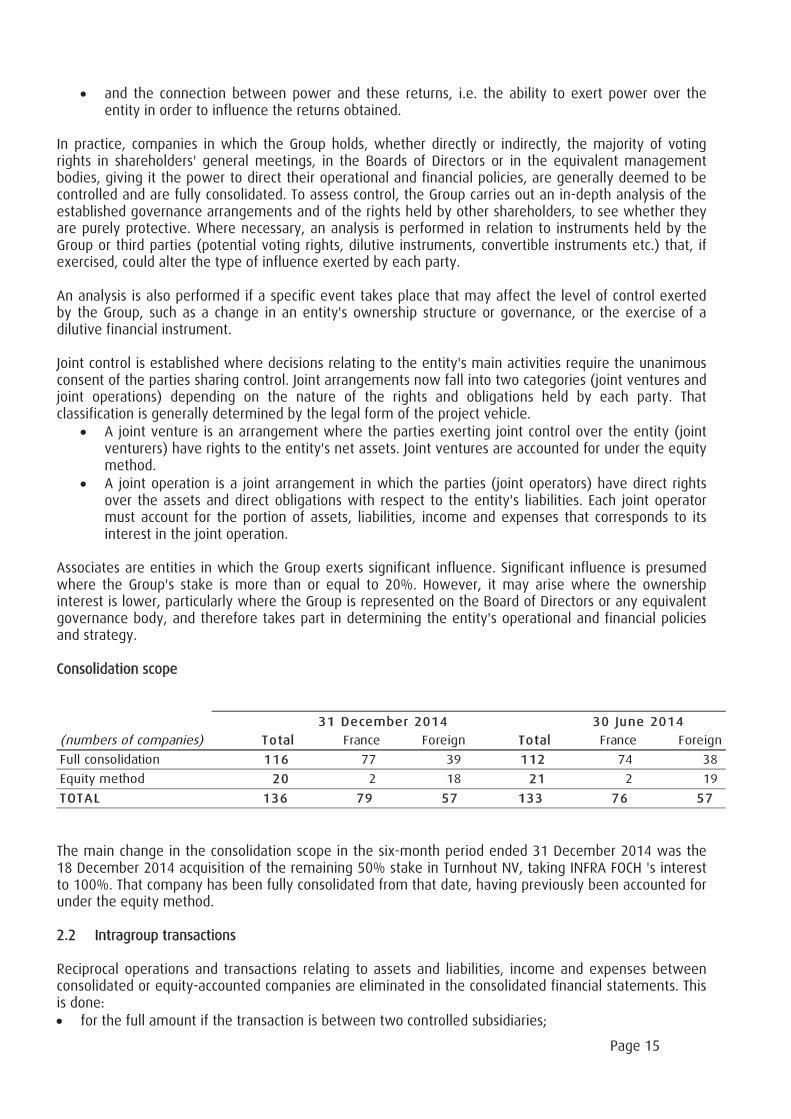
Consolidation scope
(numbers of companies) Total France Foreign Total France Foreign
Full consolidation 116 77 39 112 74 38
Equity method 20 2 18 21 2 19
TOTAL 136 79 57 133 76 57
31 December 2014 30 June 2014
The main change in the consolidation scope in the six-month period ended 31 December 2014 was the18 December 2014 acquisition of the remaining 50% stake in Turnhout NV, taking INFRA FOCH 's interestto 100%. That company has been fully consolidated from that date, having previously been accounted forunder the equity method.
2.2 Intragroup transactions
Reciprocal operations and transactions relating to assets and liabilities, income and expenses betweenconsolidated or equity-accounted companies are eliminated in the consolidated financial statements. Thisis done:
for the full amount if the transaction is between two controlled subsidiaries;
Page 16
applying the percentage owned of an equity-accounted entity in the case of internal profits or lossesrealised between a fully consolidated entity and an entity accounted for under the equity method.
2.3 Translation of the financial statements of foreign companies and establishments
In most cases, the functional currency of foreign companies and establishments is their local currency.
The financial statements of foreign companies whose functional currency is different from that used inpreparing the Group’s consolidated financial statements are translated at the closing rate for balancesheet items and at the average rate for the period for income statement items. Any resulting translationdifferences are recognised under other comprehensive income. Goodwill relating to foreign entities isconsidered as comprising part of the assets and liabilities acquired and is therefore translated at theexchange rate in force at the balance sheet date.
2.4 Foreign currency transactions
Transactions in foreign currency are translated into euros at the exchange rate on the transaction date.Monetary assets and liabilities denominated in foreign currencies are translated at the closing rate.Resulting exchange gains and losses are recognised under foreign exchange gains and losses and areshown under other financial income and expenses in the income statement.
Foreign exchange gains and losses arising on loans denominated in foreign currency or on foreigncurrency derivative instruments qualifying as hedges of net investments in foreign subsidiaries, arerecorded under currency translation differences in equity.
2.5 Business combinations
The Group recognises the identifiable assets acquired and liabilities assumed at their fair value at thedates when control was acquired. The cost of a business combination is the fair value, at the date ofexchange, of the assets given, liabilities assumed, and/or equity instruments issued by the acquirer inexchange for control of the acquiree. Contingent price adjustments are measured at fair value at eachbalance-sheet date. From the acquisition date, any subsequent changes to this fair value resulting fromevents taking place after control was acquired are recognised in profit or loss.
Expenses that are directly attributable to the acquisition, such as professional fees for due diligence andother related fees, are expensed as they are incurred.
Non-controlling interests in the acquiree are measured either at their share of the acquiree’s netidentifiable assets, or at their fair value. This option is applied on a case-by-case basis for eachacquisition.
The cost of acquisition is allocated by recognising the acquiree’s identifiable assets and liabilities assumedat their fair value at that date, except for assets or asset groups classified as held for sale under IFRS 5,which are recognised at their fair value less costs to sell. The positive difference between the cost ofacquisition, as defined above, and the fair value of the identifiable assets and liabilities acquiredconstitutes goodwill. Where applicable, goodwill can include a portion of the fair value of non-controllinginterests if the full goodwill method has been selected.
The Group has 12 months from the date of acquisition to finalise the accounting for businesscombinations.
In the case of a business combination achieved in stages, previously acquired shareholdings in theacquiree are measured at fair value at the date on which control is acquired. Any resulting gain or loss isrecognised in profit or loss.
Page 17
2.6 Transactions between shareholders, acquisitions and disposals of non-controlling interests afteracquisition of control
Acquisitions or disposals of non-controlling interests, with no impact on control, are considered astransactions with the Group’s shareholders. Under this approach, the difference between theconsideration paid to increase the percentage shareholding in an already-controlled entity and thesupplementary share of equity thus acquired is recorded under consolidated equity. Similarly, a decreasein the Group’s percentage interest in an entity that continues to be controlled is booked in the accountsas a transaction between shareholders, with no impact on profit or loss.
2.7 Discontinued operations (halted or sold) and assets held for sale
Assets held for saleNon-current assets of which the sale has been decided during the period are shown on a separateline of the balance sheet whenever the sale is regarded as highly probable and expected to becompleted within 12 months. Such assets are measured at the lower of their carrying amount andfair value, which corresponds to the estimated selling price less costs to sell.
Income statement and cash flow items relating to assets held for sale are shown on separatelines (for all periods presented) if they also meet the criteria for classification as discontinuedoperations.
Discontinued operationsWhenever discontinued operations (halted or sold) or operations classified as held for sale are:
a business line or a geographical area of business that is material for the Group and thatforms part of a single disposal plan; ora subsidiary acquired exclusively with a view to resale;
they are shown on a separate line of the consolidated income statement and the consolidatedcash flow statement for all periods presented.
Assets connected with discontinued operations, if held for sale, are measured at the lower of theircarrying amount and fair value less costs to sell.
Page 18
3. Measurement rules and methods
3.1 Use of estimates
The preparation of financial statements under IFRSs requires estimates to be used and assumptions to bemade that affect the amounts shown in those financial statements.
These estimates are made on a going concern basis and are based on information available at the timethey are made. Estimates may be revised if the circumstances on which they were based alter or if newinformation becomes available. Actual results may be different from these estimates.
The consequences of the ongoing economic crisis in Europe, particularly on economic growth, make itdifficult to assess the outlook for business in the medium term. As a result, the consolidated financialstatements have been prepared with reference to the immediate environment, in particular as regardsthe estimates given below.
Values used for provisionsThe Group identifies and regularly analyses the risks it may face in its business activities,particularly in relation to litigation and loss-making contracts.Where applicable, the Group measures provisions based on the best estimate at the balancesheet date of the expected outflow of resources required to settle the relevant obligation. Thoseestimates take into account available information and the range of possible results.
Measurement of retirement benefit obligationsThe Group is involved in defined contribution and defined benefit retirement plans. Its obligationsin connection with these defined benefit plans are measured actuarially, based on assumptionssuch as the discount rate, future increases in wages and salaries, employee turnover, mortalityrates and the rate of increase of health expenses.
Most of these assumptions are updated annually. Details of the assumptions used and how theyare determined are given in Note G.11 “Retirement and other employee-benefit obligations”.
The Group considers that the actuarial assumptions used are appropriate and justified in thecurrent conditions. Obligations may, however, change if assumptions change.
Measurement of fair valueThe Group mainly uses fair value in measuring, on a consistent basis, the derivative instruments,available-for-sale financial assets, cash management financial assets and identifiable assets andliabilities acquired in business combinations on its balance sheet.
Fair value is the price that would be received from selling an asset or paid to transfer a liability ina normal transaction. It is recognised on the basis of the asset or liability’s main market (or themost advantageous market if there is no main market), i.e. the one that offers the highestvolume and activity levels.To determine these fair values, the Group uses the following measurement methods:
o market-based approaches, based on observable market prices or transactions;o revenue-based approaches, which convert future cash flows into a single present
value;o cost-based approaches, which take into account the asset's physical, technological
and economic obsolescence.
The following three-level hierarchy of fair values is used:o Level 1: price quoted on an active market. Marketable securities, some available-for-sale
financial assets and listed bond issues are measured in this way.o Level 2: internal model using internal measurement techniques with observable factors:
these techniques are based on usual mathematical computation methods, which
Page 19
incorporate observable market data (forward prices, yield curves, etc.). The calculation ofthe fair value of most derivative financial instruments (swaps, caps, floors, etc.) tradedover the counter is based on internal models commonly used by market participants toprice such financial instruments.Every quarter, the internally calculated values of derivative instruments are checked forconsistency with those sent by the counterparties.
o Level 3: internal model using non-observable factors. This model applies to customerrelationships and contracts acquired through business combinations, as well as to holdingsof unlisted shares, which, in the absence of an active market, are measured at their costof acquisition plus transaction costs.
3.2 Revenue
The Group's consolidated revenue is recognised in accordance with IAS 18 "Revenue" and IAS 11"Construction contracts". The method for recognising revenue under concession contracts is explained inNote C.3.4 ”Concession contracts”. Revenue comprises:
revenue from car parks (under concession, owner-occupied or through the provision of services)and ancillary income such as fees for the use of commercial installations and rental advertisingspace; and
revenue in respect of the construction of new concession infrastructure, for which thecorresponding entry in the Group's balance sheet appears under concession intangible assets orfinancial receivables.
3.3 Revenue from ancillary activities
Revenue from ancillary activities mainly comprises rental income, study work and fees other than thosegenerated by concession operators.
3.4 Concession contracts
Under the terms of IFRIC 12 Service Concession Arrangements, a concession operator has a twofoldactivity:
a construction activity in respect of its obligations to design, build and finance a new asset that itmakes available to the grantor: revenue is recognised on a percentage-of-completion basis inaccordance with IAS 11;an operating and maintenance activity in respect of concession assets: revenue is recognised inaccordance with IAS 18.
In return for its activities, the operator receives remuneration from either:Users: the intangible asset model applies. The operator has a right to receive tolls (or otherpayments) from users in consideration for the financing and construction of the infrastructure. Theintangible asset model also applies whenever the concession grantor remunerates the concessionoperator on the basis of how much users use the infrastructure, but with no guarantees as to theamounts that will be paid to the operator (under a simple pass-through or shadow-tollagreement).Under this model, the right to receive toll payments (or other remuneration) is recognised in theconcession operator's balance sheet under "Concession intangible assets". This right correspondsto the fair value of the concession asset plus borrowing costs capitalised during the constructionphase. It is amortised over the term of the arrangement in a manner that reflects the pattern inwhich the asset’s economic benefits are consumed by the entity, starting from the asset's entryinto service.This model applies to most of the car parks managed under concession by VINCI Park.The grantor: the financial asset model applies. The operator has an unconditional contractual rightto receive payments from the grantor, irrespective of how much the infrastructure is used.
Page 20
Under this model, the operator recognises a financial asset, attracting interest, in its balancesheet, in consideration for the services it provides (designing, building, operation ormaintenance). Such financial assets are recognised in the balance sheet under “Financialreceivables - Concessions”, for the amount of the fair value of the infrastructure on firstrecognition and subsequently at amortised cost. The receivable is settled by means of thegrantor’s payments received. The financial income calculated on the basis of the effective interestrate, equivalent to the project’s internal rate of return, is recognised under operating income.This model applies to some of VINCI Park's contracts.
In the case of mixed models, the operator is remunerated by both users and the grantor. The part of theinvestment that is covered by an unconditional right to receive payments from the grantor (grants andrent) is recognised as a financial receivable up to the amount guaranteed. The unguaranteed balance, ofwhich the amount is dependent on the use of the infrastructure, is recognised as concession intangibleassets. This model applies to some of VINCI Park's contracts.
3.5 Operating income from ordinary activities, recurring operating income and EBITDA
To assist understanding of its financial performance, the Group considers it appropriate to present thefollowing intermediate balances comprising "income from operating activities" in its income statement:
Operating income from ordinary activities measures the operating performance of Groupsubsidiaries before taking account of expenses related to share-based payments (IFRS 2), theshare of the income or loss of equity-accounted companies, and other recurring and non-recurringoperating items.
Recurring operating income is intended to present the Group's recurring operational performanceexcluding the impact of non-recurring transactions and events during the period. It is calculatedby adding impacts associated with share-based payments (IFRS 2) and income from companiesaccounted for under the equity method to operating income from ordinary activities.
Operating income is therefore calculated by taking recurring operating income and adding income andexpense classified as non-recurring, material and unusual, such as:
goodwill impairment losses,gains or losses on share sales and the impact of remeasuring equity interests at fair valuefollowing changes in the type of control exerted over the investee,income and expense classified as non-recurring where it is deemed material.
For performance measurement purposes, the Group also uses a third indicator, i.e. earnings before tax,interest, depreciation and amortisation (EBITDA).
The reconciliation between this indicator and operating income from ordinary activities is presented innote E.2 "Segment information by geographical area". It consists of operating income before taking intoaccount goodwill impairment losses, income from equity-accounted companies, the non-disbursedportion of share-based payments (IFRS 2), net depreciation, amortisation and additions to provisions forthe impairment of non-current assets, net additions to non-current provisions, capital gains or losses ondisposals of non-current assets and other recurring and non-recurring operating items.
3.6 Cost of net financial debt
The cost of net financial debt includes:
the cost of gross financial debt, which includes the interest expense calculated at the effectiveinterest rate, gains and losses on hedges of gross debt, and net changes in the fair value ofderivatives not designated as hedges;
Page 21
the line item “financial income from cash management investments”, comprising the return oninvestments of cash and cash equivalents (interest income, dividends from UCITS, disposal gainsand losses, etc.), the impact of interest-rate hedges associated with these investments andchanges in their fair value. Investments of cash and cash equivalents are measured at fair valuethrough profit or loss.
Net financial debt is defined and detailed in note G.14 "Net financial debt".
3.7 Other financial income and expense
Other financial income and expense comprises mainly foreign exchange gains and losses, the effects ofdiscounting to present value, dividends received from unconsolidated entities, capitalised borrowingcosts, and changes in the value of derivatives not allocated to managing interest rate risk.
Borrowing costs borne during the construction of assets are included in the cost of those assets. They aredetermined as follows:
to the extent that funds are borrowed specifically for the purpose of constructing an asset, theborrowing costs eligible for capitalisation on that asset are the actual borrowing costs incurredduring the period less any investment income arising from the temporary investment of thoseborrowings;when borrowing is not intended to finance a specific project, the interest eligible for capitalisationon an asset is determined by applying a capitalisation rate to the expenditure on that asset. Thiscapitalisation rate is equal to the weighted average of the costs of borrowing funds, other thanthose specifically intended for the construction of given assets.
This does not relate to the construction of concession infrastructure accounted for using the financial assetmodel (see Note C.3.22.1 “Financial assets”).
3.8 Income tax
Income tax is computed in accordance with the tax legislation in force in the countries where the incomeis taxable.
In accordance with IAS 12, deferred tax is recognised on temporary differences between the carryingamount and the tax base of assets and liabilities. It is calculated using the latest tax rates enacted orsubstantively enacted at the accounts closing date and applied according to the schedule for the reversalof temporary differences. The effects of a change in the tax rate from one period to another arerecognised in the income statement in the period in which the change occurs.
Where applicable, deferred tax relating to share-based payments (IFRS 2) is taken to income to theextent that the deductible amount does not exceed the fair value of plans established according toIFRS 2.
Whenever subsidiaries have distributable reserves, a deferred tax liability is recognised in respect of theprobable distributions that will be made in the foreseeable future.
Moreover, shareholdings in equity-accounted companies give rise to recognition of a deferred tax liabilityin respect of all differences between the carrying amount and the tax base of the shares.
Net deferred tax is determined on the basis of the tax position of each entity or group of entities includedin the tax group under consideration and is shown under assets or liabilities for its net amount pertaxable entity.
Page 22
Deferred tax is reviewed at each balance-sheet date to take account in particular of the impact ofchanges in tax law and the prospect of recovery. Deferred tax assets are only recognised if their recoveryis probable.
Deferred tax assets and liabilities are not discounted.
3.9 Earnings per share
Basic earnings per share is the net income for the period after non-controlling interests, divided by theweighted average number of shares outstanding during the period.In calculating diluted earnings per share, the average number of shares outstanding is adjusted for thedilutive effect of equity instruments issued by the Company.
3.10 Concession intangible assets
Concession intangible assets correspond to the concession operator’s right to operate the asset inconsideration for the investment expenditures incurred for the design and construction of the asset. Thisoperator’s right corresponds to the fair value of the construction of the asset under concession plus theborrowing costs capitalised during the construction phase. It is amortised over the term of thearrangement in a manner that reflects the pattern in which the asset’s economic benefits are consumedby the entity, starting from the date when the right to operate starts to be used.
3.11 Goodwill
Goodwill is the excess of the cost of a business combination over the Group’s interest in the net fair valueof the acquiree’s identifiable assets, liabilities and contingent liabilities at the date(s) of acquisition,recognised on first consolidation.
Goodwill in fully consolidated companies is recognised under goodwill in consolidated assets. Goodwillrelating to companies accounted for under the equity method is included in the line-item “Investments incompanies accounted for under the equity method”.
Goodwill is not amortised but is tested for impairment at least annually and whenever there is anindication that it may be impaired. Whenever goodwill is impaired, the difference between the carryingamount and recoverable amount is recognised as an operating expense in the period and is notreversible.
Negative goodwill is recognised directly in profit or loss in the year of acquisition.
3.12 Other intangible assets
These are mainly operating rights and software. Other purchased intangible assets are measured at costless any amortisation or cumulative impairment losses. They are amortised on a straight-line basis overtheir useful lives.
3.13 Grants related to assets
Grants related to assets are presented in the balance sheet as a reduction of the amount of the asset forwhich they were received.
3.14 Tangible assets and concession tangible assets
These assets are recorded at their acquisition or production cost less cumulative depreciation and anyimpairment losses. They are not revalued. They include in particular concession operating assets that arenot controlled by the grantor but that are necessary for operation of the concession such as buildings
Page 23
intended for use in the operation, equipment for toll collection, signage, data transmission and video-surveillance, and vehicles and equipment.
Depreciation is generally calculated on a straight-line basis over the period of use of the asset.Accelerated depreciation may however be used when it appears more appropriate to the conditionsunder which the asset is used. For certain complex assets comprising various components, in particularbuildings and constructions, each component of the asset is depreciated over its own period of use.
The main periods of use of the various categories of items of property, plant and equipment are asfollows:
Constructions Between 30 and 50 years
Fixtures and fittings Between 7 and 30 years
Office furniture and equipement Between 3 and 10 years
Depreciation commences on the date when the asset enters service.
Land is not depreciated.
Estimated useful lives, residual values and the depreciation method are revised at the end of each annualaccounts closing, and the impact of any change in estimates is recognised prospectively.
3.15 Finance leases
Assets acquired under finance leases are recognised as non-current assets, whenever the effect of thelease is to transfer to the Group substantially all the risks and rewards incidental to ownership of theseassets, with recognition of a corresponding financial liability. Assets held under finance leases aredepreciated over their period of use.
3.16 Investment property
Investment property is property held in order to generate rent or for capital appreciation. Such property isshown on a separate line in the balance sheet.Investment property is recorded at its acquisition cost less cumulative depreciation and any impairmentlosses, in the same way as items of property, plant and equipment.
3.17 Impairment of non-financial non-current assets
Under certain circumstances, impairment tests must be performed on intangible and tangible non-currentassets. For intangible assets with an indefinite useful life and goodwill, a test is performed at leastannually and whenever there is an indication of a loss of value. For other non-current assets, a test isperformed only when there is an indication of a loss of value.In accordance with IAS 36, the criteria used to assess indications of a loss of value may be external (e.g.significant change in market date) or internal (e.g. significant decrease in revenue).
Assets to be tested for impairment are grouped within cash-generating units that correspond tohomogeneous groups of assets that generate identifiable cash inflows from their use. In France, a CGUcorresponds to a group of contracts from a single ordering customer. In other countries, a CGUcorresponds to a set of car parks in a single city or consistent geographical area. Whenever therecoverable value of a cash-generating unit is less than its carrying amount, an impairment loss isrecognised in operating income. The recoverable amount of a cash-generating unit is the higher of its fairvalue less costs to sell and its value in use.
Page 24
Value in use is the present value of the future cash flows expected to be derived from an asset or cash-generating unit. The discount rate is determined for each cash-generating unit, taking account of itsgeographical location and the risk profile of its business.
3.18 Investments in companies accounted for under the equity method
Investments accounted for under the equity method are initially recognised at the cost of acquisition,including any goodwill arising. Their carrying amount is then increased or decreased to recognise theGroup’s share of the entity’s profits or losses after the date of acquisition. Whenever losses are greaterthan the value of the Group’s net investment in the equity-accounted company, these losses are notrecognised unless the Group has entered into a commitment to recapitalise that company or has madepayments on its behalf.If there is an indication that an investment may be impaired, its recoverable value is tested as describedin Note C.3.17 “Impairment of non-financial non-current assets”. Impairment losses shown by theseimpairment tests are recognised as a deduction from the carrying amount of the correspondinginvestments.
In order to present business lines’ operational performance in the best way possible, the income or lossof companies accounted for under the equity method is reported on a specific line, between the"operating income from ordinary activities" and "recurring operating income" lines.
These shareholdings are in companies in which the Group has significant influence and in jointlycontrolled entities.
3.19 Inventories and work in progress
Inventories and work in progress are recognised at their cost of acquisition or of production by the entity.At each balance-sheet date, they are measured at the lower of cost and net realisable value.
3.20 Retirement and other employee benefit obligations
Defined-benefit retirement obligations
Provisions are taken in the balance sheet for obligations connected with defined-benefitretirement plans, for both current and former employees (people with deferred rights or whohave retired). These provisions are determined using the projected unit credit method on thebasis of actuarial assessments made at each annual balance-sheet date. The actuarialassumptions used to determine the obligations vary depending on the economic conditions of thecountry where the plan is operated. Each plan’s obligations are recognised separately.
For defined benefit plans financed under external management arrangements (i.e. pension fundsor insurance policies), the surplus or shortfall of the fair value of the assets compared with thepresent value of the obligations is recognised as an asset or liability in the balance sheet.
All post-employment benefits granted to Group employees are recognised in the consolidatedbalance sheet.
Interest income from pension plan assets is calculated using the discount rate used to calculateobligations with respect to defined-benefit plans;
Impacts of remeasurements are recognised in other comprehensive income:Actuarial gains and losses on obligations corresponding to the difference between actuarialassumptions adopted and that which has actually occurred and resulting from the effects ofchanges in actuarial assumptions and from experience adjustments,
Page 25
Plan asset outperformance/underperformance (i.e. the difference between the effectivereturn on plan assets and the return calculated using the discount rate applied to the actuarialliability) and changes in the asset ceiling effect.
For defined benefit plans, the expense recognised under operating income or loss comprises thecurrent service cost and the effects of any change, reduction or winding up of the plan. Theaccretion impact on actuarial debt and interest income on plan assets are recognised under otherfinancial income and expenses.
Defined-contribution pension plan obligations
Contributions made to defined-contribution pension plans are recognised as an expense whereemployees have given service entitling them to contributions.
Provisions for other employee benefit obligations
Provisions for other employee benefit obligations are taken in the balance sheet and theseobligations are measured in accordance with IAS 19. They comprise commitments for long-servicebonuses and coverage of medical expenses in some subsidiaries. This provision is assessed usingthe projected unit credit method.
The portion of provisions for retirement and employee-benefit obligations that matures withinless than one year is shown under current liabilities.
3.21 Provisions
A provision is a liability of uncertain timing or amount.Provisions are recognised whenever the Group has a legal or constructive present obligation towards non-Group companies arising from a past event, whenever it is probable that an outflow of resourcesembodying economic benefits will be required to settle this obligation and whenever a reliable estimatecan be made of the amount of the obligation. The amount of a provision is the best estimate of theoutflow required to settle the present obligation at the balance-sheet date. It is discounted whenever theeffect is material and the maturity is after one year.
Non-current provisions
Non-current provisions are provisions that are not directly linked with the operating cycle and ofwhich the maturity is generally after one year. They also include provisions for loss-makingcontracts.
Present obligations resulting from loss-making contracts are recognised and measured asprovisions. A contract is regarded as loss-making where the inevitable costs required to meet thecontractual obligations are higher than the expected economic benefits from the contract.
The portion of non-current provisions that matures within less than one year is shown undercurrent provisions.
Current provisions
Current provisions are provisions directly linked to each business line’s own operating cycle,whatever the expected time of settlement of the obligation.
Provisions for disputes connected with operations mainly relate to disputes with customers,subcontractors, joint contractors or suppliers.
Page 26
Provisions for restructuring costs, incorporating the cost of redundancy plans and measures towhich a commitment has been made, are recognised whenever the Group has a detailed formalplan of which the parties affected have been informed or that has been announced before thebalance-sheet date.
Provisions for other current liabilities mainly comprise provisions for individual dismissals and forother risks related to operations.
3.22 Financial instruments
Financial assets and liabilities are recognised where a Group entity becomes a party to contractualprovisions relating to financial instruments.
Financial assets and liabilities are initially measured at fair value. Transaction costs directly attributable tothe acquisition or issuance of financial assets and liabilities (other than financial assets and liabilitiesmeasured at fair value through profit or loss) are, as applicable, added to or deducted from the fair valueof financial assets and liabilities at initial recognition. Transaction costs directly attributable to theacquisition of financial assets and liabilities measured at fair value through profit or loss are immediatelyrecognised in profit or loss.
3.22.1 Financial assets
3.22.1.1 Classification and measurement of financial assets
Financial assets are classified in the following categories: financial assets at fair value through profit orloss, held-to-maturity investments, available-for-sale financial assets and loans and receivables. Theclassification depends on the nature and purpose of the financial assets, and is determined at initialrecognition.The Group does not use the "held-to-maturity investments" category.
Other non-current financial assets comprise available-for-sale securities, the part at more than one yearof loans and receivables measured at amortised cost, the part at more than one year of financialreceivables under public-private partnership contracts (PPPs) and the fair value of derivative financialinstruments designated as hedges maturing after one year (see Note C.3.22.8 “Derivative financialinstruments”).
Available-for-sale securities
Available-for-sale securities comprise the Group’s shareholdings in unconsolidated entities.
At the balance-sheet date, available-for-sale securities are measured at their fair value. The fairvalue of shares in listed companies is determined on the basis of the stock market price at thatbalance sheet date.
For unlisted securities, if their fair value cannot be determined reliably, the securities continue to bemeasured at their original cost, i.e. their cost of acquisition plus transaction costs.
Changes in fair value are recognised directly in equity.Dividends on available-for-sale equity instruments are recognised in income where the Group'sright to receive those dividends is established.
Whenever there is an objective indication that this asset is impaired, the corresponding loss isrecognised in profit or loss and may not be reversed.
o For securities quoted on an active market, a long-lasting or material decline in fair valuebelow their cost is an objective indication of their impairment. The factors considered by
Page 27
the Group in assessing the long-lasting or material nature of a decline in fair value aregenerally the following:
the impairment is long-lasting whenever the closing stock market price has beenlower than the cost of the security for more than 18 months;the impairment is material whenever, at the balance-sheet date, there has been a30% fall in the current market price compared with the cost of the financial asset.
o For unlisted securities, the factors considered are the decrease in value of the share ofequity held and the absence of prospects for generating profits.
Loans and receivables
Loans and receivables are non-derivative financial assets with fixed or determinable payments thatare not quoted in an active market.
“Loans and receivables” mainly comprise receivables connected with shareholdings, currentaccount advances to equity-accounted companies or unconsolidated entities, guarantee deposits,collateralised loans and receivables and other loans and financial receivables. They also includefinancial receivables relating to concession contracts and public-private partnerships whenever theconcession operator has an unconditional right to receive remuneration (generally in the form ofrevenue guarantees or operating subsidies) from the grantor.
When first recognised, these loans and receivables are recognised at their fair value less thedirectly attributable transaction costs. At each balance-sheet date, these assets are measured attheir amortised cost using the effective interest method, less any impairment loss.
The effective interest-rate method is a way to calculate the amortised cost of a debt instrumentand to allocate interest income during the period concerned. The effective interest rate is the ratethat exactly discounts future cash payments (including all fees and points paid or received that arean integral part of the effective interest rate, transaction costs and other premiums or discounts)over the expected life of the debt instrument or, where appropriate, a shorter period to the netcarrying amount at the time of first recognition.
Interest income is recognised by applying the effective interest rate, except as regards short-termreceivables, for which the impact of discounting is negligible.
In the particular case of receivables coming under the scope of IFRIC 12, the effective interest rateused corresponds to the project’s internal rate of return.
If there is an objective indication of impairment of these loans and receivables, an impairment lossis recognised at the balance sheet date. The impairment loss, corresponding to the differencebetween the carrying amount and the recoverable amount (i.e. the present value of the expectedcash flows discounted using the original effective interest rate), is recognised in profit or loss. Thisloss may be reversed if the recoverable value increases subsequently and if this positive changecan objectively be linked to an event arising after recognition of the impairment loss.
Financial assets at fair value through profit and lossFinancial assets are classified as financial assets at fair value through profit or loss where they areheld for trading or designated as at fair value through profit or loss. A financial asset is classified asheld for trading where:- it was acquired mainly with a view to selling it in the short term;- at initial recognition, it is part of a portfolio of specific financial instruments that are managedtogether by the Group and show a recent profile of short-term profit-taking;- it is a derivative that is not a designated and effective hedging instrument.
Money-market mutual funds acquired for cash management purposes are classified in thiscategory, along with certain non-hedging derivative instruments.
Page 28
3.22.1.2 Derecognition of financial assets
The Group derecognises a financial asset if the contractual rights to cash flows related to the asset expire,or if it transfers to another party the financial asset and substantially all the risks and rewards ofownership of that asset. If the Group does not transfer or retain substantially all the risks and rewards ofownership and continues to control the divested asset, it recognises its retained share of the asset and acorresponding liability for the amounts it is required to pay. If the Group retains substantially all the risksand rewards of ownership of a divested financial asset, it continues to recognise the financial asset, aswell as recognising the consideration received as a guaranteed loan.
When a financial asset is fully derecognised, the difference between the asset's carrying amount on theone hand, and the sum of the consideration received or to be received and the cumulative profit or lossrecognised under other comprehensive income and accumulated in equity on the other, is taken toincome.
3.22.2 Trade receivables and other current operating assets
“Trade receivables” and “other current operating assets” are current financial assets classified in the"loans and receivables" category.An estimate of the likelihood of non-recovery is made at each balance-sheet date and an impairment lossis recognised if necessary. The likelihood of non-recovery is assessed in the light of payment delays andguarantees obtained.
3.22.3 Other current financial assets
This category mainly relates to the portion at less than one year of loans and receivables reported underother non-current financial assets.
3.22.4 Cash management financial assets
“Cash management financial assets” may include investments in money market securities andbonds, and units in UCITS, made with a short-term management objective, that do not satisfy the IAS 7criteria for recognition as cash (see Note C.3.22.5 “Cash and cash equivalents”). As the Group adopts fairvalue as being the best reflection of the performance of these assets, they are measured and recognisedat their fair value, and changes in fair value are recognised through profit or loss.Purchases and sales of cash management financial assets are recognised at their transaction date.Their fair value is determined using commonly used valuation models or, for non-listed cashmanagement assets, at the present value of future cash flows. In assessing the fair value of listedinstruments, the Group uses the market price at the balance sheet date or the net asset value of UCITS.
3.22.5 Cash and cash equivalents
This item comprises current accounts at banks and cash equivalents corresponding to short-term, liquidinvestments subject to negligible risks of fluctuations of value. Cash equivalents may include, as the casemay be, monetary UCITS and certificates of deposit with maturities not exceeding three months at theorigin. Bank overdrafts are not included in cash and are reported under current financial liabilities.
The Group has adopted the fair value method to assess the return on its financial instruments. Changes infair value are recognised directly in profit or loss.
Their fair value is determined using commonly used valuation models or, for non-listed cashmanagement assets, at the present value of future cash flows. In assessing the fair value of listedinstruments, the Group uses the market price at the balance sheet date or the net asset value of UCITS.
Page 29
3.22.6 Financial liabilities and equity instruments
Debt and equity instruments issued by a Group entity are classified as financial liabilities or equity,depending on the substance of the contractual relationships and the definitions of a financial liability andan equity instrument.
An equity instrument is any contract that shows a residual interest in an entity's assets after thededuction of all its liabilities. Equity instruments issued by a Group entity are recognised at the amount ofthe consideration received minus direct issuance costs.
3.22.7 Financial liabilities (current and non-current)
Financial liabilities are recognised at amortised cost using the effective interest method, and do notinclude embedded derivatives that are not closely linked (particularly with respect to early redemptionoptions). The effective interest rate is determined after taking account of redemption premiums andissuance expenses. Under this method, the interest expense is measured actuarially and reported underthe cost of gross financial debt.
The benefit of a loan at a significantly below-market rate of interest, which is in particular the case forproject finance granted by public-sector organisations, is treated as a government grant and recognisedas a reduction of the related investments, in accordance with IAS 20.
The amount of the grant corresponds to the difference between the amounts received under theborrowing and the fair value of the borrowing based on market interest rates currently in force.
The part at less than one year of borrowings is included in "current financial liabilities".
The Group derecognises financial liabilities if and only if the Group's obligations are settled, cancelled orexpire. The difference between the carrying amount of the derecognised financial liability and theconsideration paid and due is taken to income.
3.22.8 Derivative financial instruments
Derivatives are initially recognised at fair value on the date at which a derivative contract is entered intoand are subsequently measured at their fair value at the end of each financial reporting period. Theresulting profit or loss is immediately taken to income unless the derivative is a designated and effectivehedging instrument. In that case, the time at which it is taken to income depends on the type of hedgingrelationship.
Derivatives embedded in non-derivative host contracts are treated as separate derivatives if they meetthe definition of a derivative, if their risks and characteristics are not closely related to the risks andcharacteristics of the host contracts and if the contracts are not measured at fair value through profit andloss.
The Group uses derivative financial instruments to hedge its exposure to market risks (mainly interestrates and foreign currency exchange rates). Most interest rate and foreign currency exchange ratederivatives used by VINCI Park are designated as hedging instruments. Hedge accounting is applicable ifthe conditions provided for in IAS 39 are satisfied:
- at the time of setting up the hedge, there must be a formal designation and documentation ofthe hedging relationship;- the effectiveness of the hedging relationship must be demonstrated from the outset and at each
balance sheet date, prospectively and retrospectively.
The fair value of derivative financial instruments designated as hedges of which the maturity is greaterthan one year is reported in the balance sheet under "Other non-current financial assets" or "Other loans
Page 30
and borrowings (non-current)". The fair value of other derivative instruments not designated as hedgesand the part at less than one year of instruments designated as non-current hedges are reported under"Other current financial assets" or "Current financial liabilities".
Financial instruments designated as hedging instruments
Derivative financial instruments designated as hedging instruments are systematically recognised inthe balance sheet at fair value (see Note C.3.1 “Use of estimates”). Nevertheless, recognition of thevariation in their fair value from one period to another varies depending on whether they aredesignated as:
- a fair value hedge of an asset or a liability or of an unrecognised firm commitment to buy orsell an asset;
- a cash flow hedge; or- a hedge of a net investment in a foreign entity.
Fair value hedge
A fair value hedge enables the exposure to the risk of a change in the fair value of an asset orliability such as fixed-rate loans and borrowings, assets and liabilities denominated in foreigncurrency or an unrecognised firm commitment, to be hedged.
Changes in the fair value of the hedging instrument are recognised in profit or loss for the period.The change in value of the hedged item attributable to the hedged risk is recognised symmetricallyin profit or loss for the period (and adjusted to the carrying amount of the hedged item). Except forthe ineffective part of the hedge, these two revaluations offset each other within the same lineitems in the income statement.
Cash-flow hedge
A cash flow hedge allows exposure to variability in future cash flows associated with an existingasset or liability, or a highly probable forecast transaction, to be hedged.Changes in the fair value of the derivative financial instrument are recognised net of tax in othercomprehensive income, under equity for the effective part and in profit or loss for the period forthe ineffective part. Cumulative gains or losses in equity must be reclassified to profit or loss underthe same line item as the hedged item – i.e. under operating income and expenses for cash flowsfrom operations and under financial income and expense otherwise – when the hedged cash flowaffects profit or loss.If the hedging relationship is interrupted, in particular because it is no longer considered effective,the cumulative gains or losses in respect of the derivative instrument are retained in equity andrecognised symmetrically with the cash flows hedged. If the future cash flow is no longer highlyprobable, the gains and losses previously recognised in equity are immediately taken to profit orloss.
Hedge of a net investment in a foreign entity
A hedge of a net investment denominated in a foreign currency hedges the exchange-rate riskrelating to the net investment in a consolidated foreign subsidiary. In a similar way as for cash-flowhedges, the effective portion of the changes in the value of the derivative instrument is recorded inequity under currency translation reserves and the portion considered as ineffective is recognised inprofit or loss. The change in the value of the derivative instrument recognised in "translationdifferences" must be reversed through profit or loss when the foreign entity in which the initialinvestment was made is disposed of.
Page 31
Hedging instrument profits and losses related to the effective portion of the hedge that areaccumulated in reserves with respect to translation differences are taken to income when a foreignentity is sold.
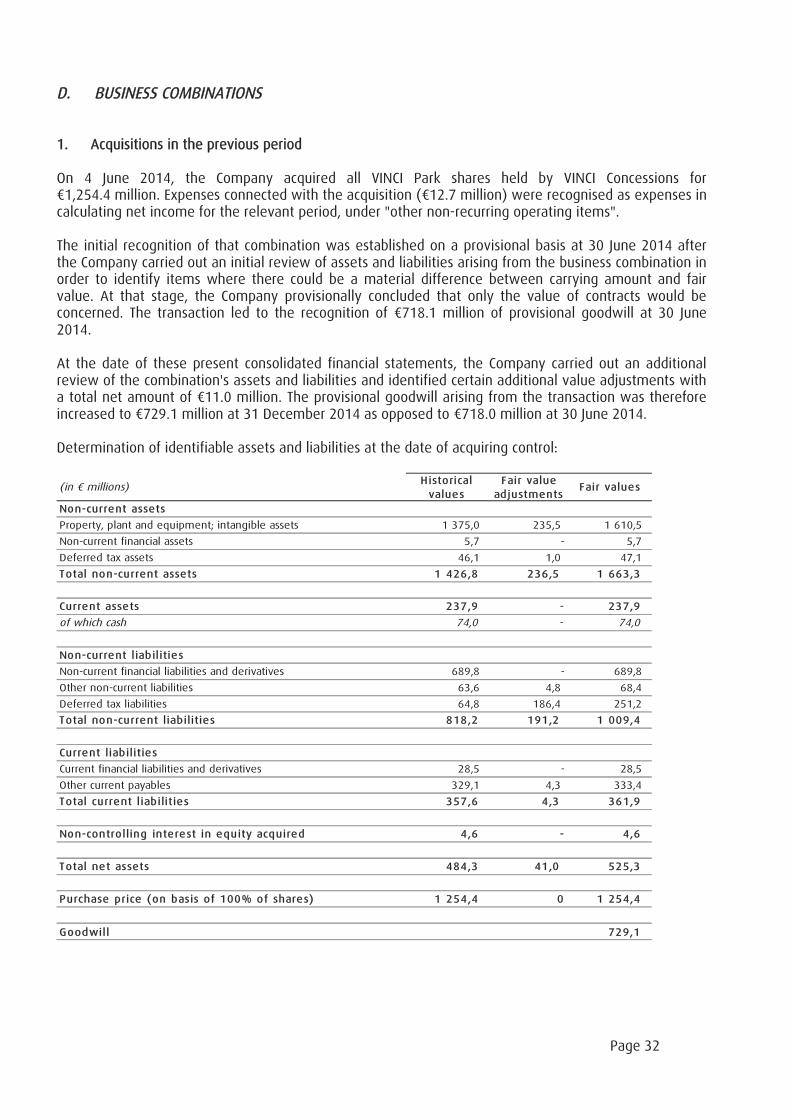
Page 32
D. BUSINESS COMBINATIONS
1. Acquisitions in the previous period
On 4 June 2014, the Company acquired all VINCI Park shares held by VINCI Concessions for1,254.4 million. Expenses connected with the acquisition ( 12.7 million) were recognised as expenses in
calculating net income for the relevant period, under "other non-recurring operating items".
The initial recognition of that combination was established on a provisional basis at 30 June 2014 afterthe Company carried out an initial review of assets and liabilities arising from the business combination inorder to identify items where there could be a material difference between carrying amount and fairvalue. At that stage, the Company provisionally concluded that only the value of contracts would beconcerned. The transaction led to the recognition of 718.1 million of provisional goodwill at 30 June2014.
At the date of these present consolidated financial statements, the Company carried out an additionalreview of the combination's assets and liabilities and identified certain additional value adjustments witha total net amount of 11.0 million. The provisional goodwill arising from the transaction was thereforeincreased to 729.1 million at 31 December 2014 as opposed to 718.0 million at 30 June 2014.
Determination of identifiable assets and liabilities at the date of acquiring control:
(in millions)Historical
values
Fair value
adjustmentsFair values
Non-current assets
Property, plant and equipment; intangible assets 1 375,0 235,5 1 610,5
Non-current financial assets 5,7 - 5,7
Deferred tax assets 46,1 1,0 47,1
Total non-current assets 1 426,8 236,5 1 663,3
Current assets 237,9 - 237,9
of which cash 74,0 - 74,0
Non-current liabilities
Non-current financial liabilities and derivatives 689,8 - 689,8
Other non-current liabilities 63,6 4,8 68,4
Deferred tax liabilities 64,8 186,4 251,2
Total non-current liabilities 818,2 191,2 1 009,4
Current liabilities
Current financial liabilities and derivatives 28,5 - 28,5
Other current payables 329,1 4,3 333,4
Total current liabilities 357,6 4,3 361,9
Non-controlling interest in equity acquired 4,6 - 4,6
Total net assets 484,3 41,0 525,3
Purchase price (on basis of 100% of shares) 1 254,4 0 1 254,4
Goodwill 729,1
Page 33
2. Acquisitions in the period
On 18 December 2014, VINCI Park Belgium acquired an additional 50% in Turnhout from CFE. Thatacquisition led to a change in the way Turnhout is accounted for, from the equity method to fullconsolidation.
Page 34
E. INFORMATION BY OPERATING SEGMENT
Based on the Group’s internal organisation and internal reporting, segment information is presented bygeographical segment.
The segments presented are as follows: France, UK, Germany, Belgium, Spain, Central and Eastern Europe,Other European countries, USA, Canada, Brazil and Qatar. For the Group, each country is an operatingsegment. The Group has combined certain countries to form the "Central and Eastern Europe" and "OtherEuropean countries" segments.
The segment information as presented is consistent with that presented to the Group's ExecutiveManagement, the main operational decision-making body, to help it make decisions concerning theallocation of resources and the assessment of each segment's performance. It is prepared using the sameaccounting policies as those used for the Group's consolidated financial statements.
Each segment's revenue corresponds to revenue from car parks and related activities such as fees for theuse of commercial installations.
None of the Group's external client accounts for more than 10% of the Group's consolidated revenue. Thesegment revenue in the tables below represents revenue from external clients.
The breakdown of revenue by geographical zone is based on the countries in which services are provided.
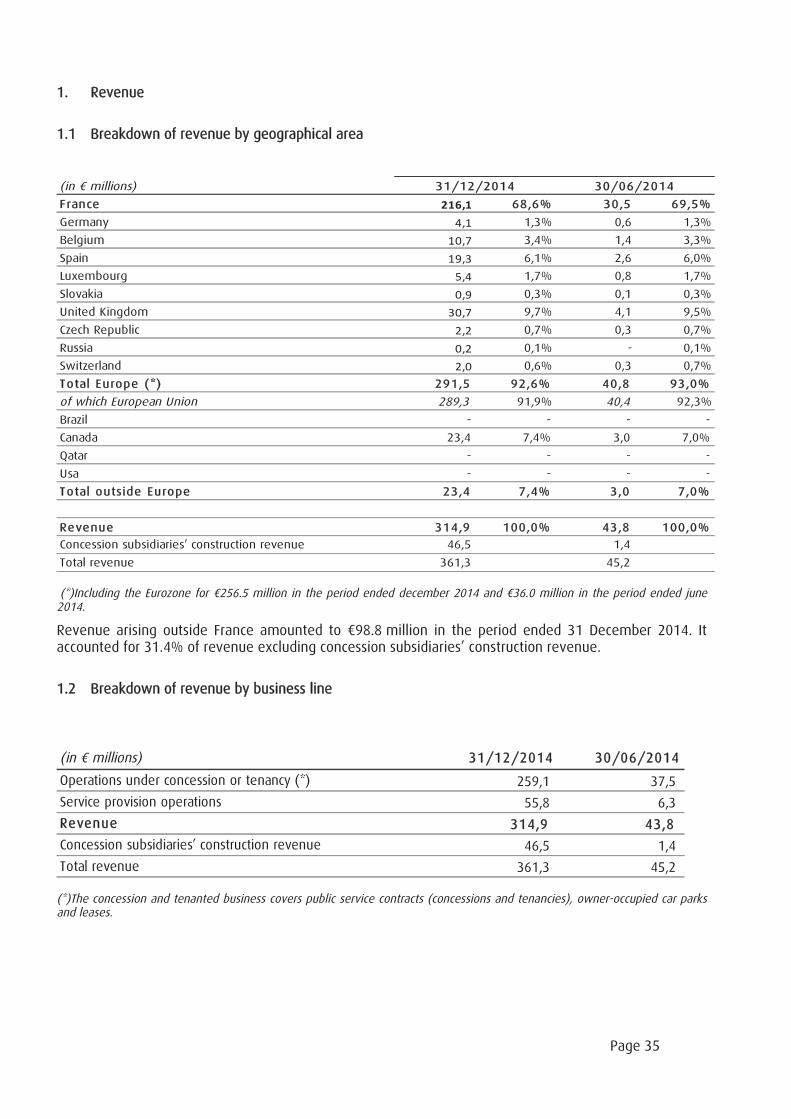
Page 35
1. Revenue
1.1 Breakdown of revenue by geographical area
(in millions)
France 216,1 68,6% 30,5 69,5%
Germany 4,1 1,3% 0,6 1,3%
Belgium 10,7 3,4% 1,4 3,3%
Spain 19,3 6,1% 2,6 6,0%
Luxembourg 5,4 1,7% 0,8 1,7%
Slovakia 0,9 0,3% 0,1 0,3%
United Kingdom 30,7 9,7% 4,1 9,5%
Czech Republic 2,2 0,7% 0,3 0,7%
Russia 0,2 0,1% - 0,1%
Switzerland 2,0 0,6% 0,3 0,7%
Total Europe (*) 291,5 92,6% 40,8 93,0%
of which European Union 289,3 91,9% 40,4 92,3%
Brazil - - - -
Canada 23,4 7,4% 3,0 7,0%
Qatar - - - -
Usa - - - -
Total outside Europe 23,4 7,4% 3,0 7,0%
Revenue 314,9 100,0% 43,8 100,0%
Concession subsidiaries’ construction revenue 46,5 1,4
Total revenue 361,3 45,2
30/06/201431/12/2014
(*)Including the Eurozone for 256.5 million in the period ended december 2014 and 36.0 million in the period ended june2014.
Revenue arising outside France amounted to 98.8 million in the period ended 31 December 2014. Itaccounted for 31.4% of revenue excluding concession subsidiaries’ construction revenue.
1.2 Breakdown of revenue by business line
(in millions) 31/12/2014 30/06/2014
Operations under concession or tenancy (*) 259,1 37,5
Service provision operations 55,8 6,3
Revenue 314,9 43,8
Concession subsidiaries’ construction revenue 46,5 1,4
Total revenue 361,3 45,2
(*)The concession and tenanted business covers public service contracts (concessions and tenancies), owner-occupied car parksand leases.
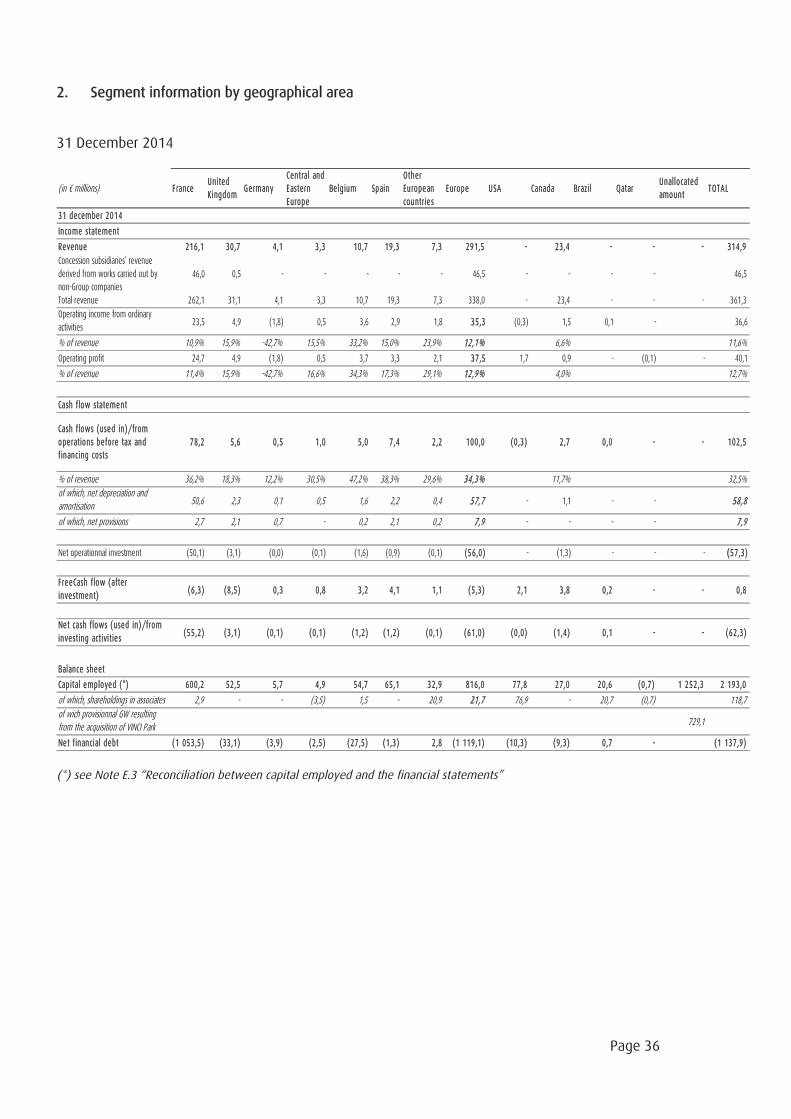
Page 36
2. Segment information by geographical area
31 December 2014
(in millions) F ranceUnited
KingdomGermany
Central and
Eastern
Europe
Belgium Spain
Other
European
countries
Europe USA Canada Brazil QatarUnallocated
amountTOTAL
31 december 2014
Income statement
Revenue 216,1 30,7 4,1 3,3 10,7 19,3 7,3 291,5 - 23,4 - - - 314,9
Concession subsidiaries’ revenue
derived from works carried out by
non-Group companies
46,0 0,5 - - - - - 46,5 - - - - 46,5
Total revenue 262,1 31,1 4,1 3,3 10,7 19,3 7,3 338,0 - 23,4 - - - 361,3
Operating income from ordinary
activities23,5 4,9 (1,8) 0,5 3,6 2,9 1,8 35,3 (0,3) 1,5 0,1 - 36,6
% of revenue 10,9% 15,9% -42,7% 15,5% 33,2% 15,0% 23,9% 12,1% 6,6% 11,6%
Operating profit 24,7 4,9 (1,8) 0,5 3,7 3,3 2,1 37,5 1,7 0,9 - (0,1) - 40,1
% of revenue 11,4% 15,9% -42,7% 16,6% 34,3% 17,3% 29,1% 12,9% 4,0% 12,7%
Cash flow statement
Cash flows (used in)/from
operations before tax and
financing costs
78,2 5,6 0,5 1,0 5,0 7,4 2,2 100,0 (0,3) 2,7 0,0 - - 102,5
% of revenue 36,2% 18,3% 12,2% 30,5% 47,2% 38,3% 29,6% 34,3% 11,7% 32,5%
of which, net depreciation andamortisation
50,6 2,3 0,1 0,5 1,6 2,2 0,4 57,7 - 1,1 - - 58,8
of which, net provisions 2,7 2,1 0,7 - 0,2 2,1 0,2 7,9 - - - - 7,9
Net operationnal investment (50,1) (3,1) (0,0) (0,1) (1,6) (0,9) (0,1) (56,0) - (1,3) - - - (57,3)
FreeCash flow (after
investment)(6,3) (8,5) 0,3 0,8 3,2 4,1 1,1 (5,3) 2,1 3,8 0,2 - - 0,8
Net cash flows (used in)/from
investing activities(55,2) (3,1) (0,1) (0,1) (1,2) (1,2) (0,1) (61,0) (0,0) (1,4) 0,1 - - (62,3)
Balance sheet
Capital employed (*) 600,2 52,5 5,7 4,9 54,7 65,1 32,9 816,0 77,8 27,0 20,6 (0,7) 1 252,3 2 193,0
of which, shareholdings in associates 2,9 - - (3,5) 1,5 - 20,9 21,7 76,9 - 20,7 (0,7) 118,7
of wich provisionnal GW resultingfrom the acquisition of VINCI Park
729,1
Net financial debt (1 053,5) (33,1) (3,9) (2,5) (27,5) (1,3) 2,8 (1 119,1) (10,3) (9,3) 0,7 - (1 137,9)
(*) see Note E.3 “Reconciliation between capital employed and the financial statements”
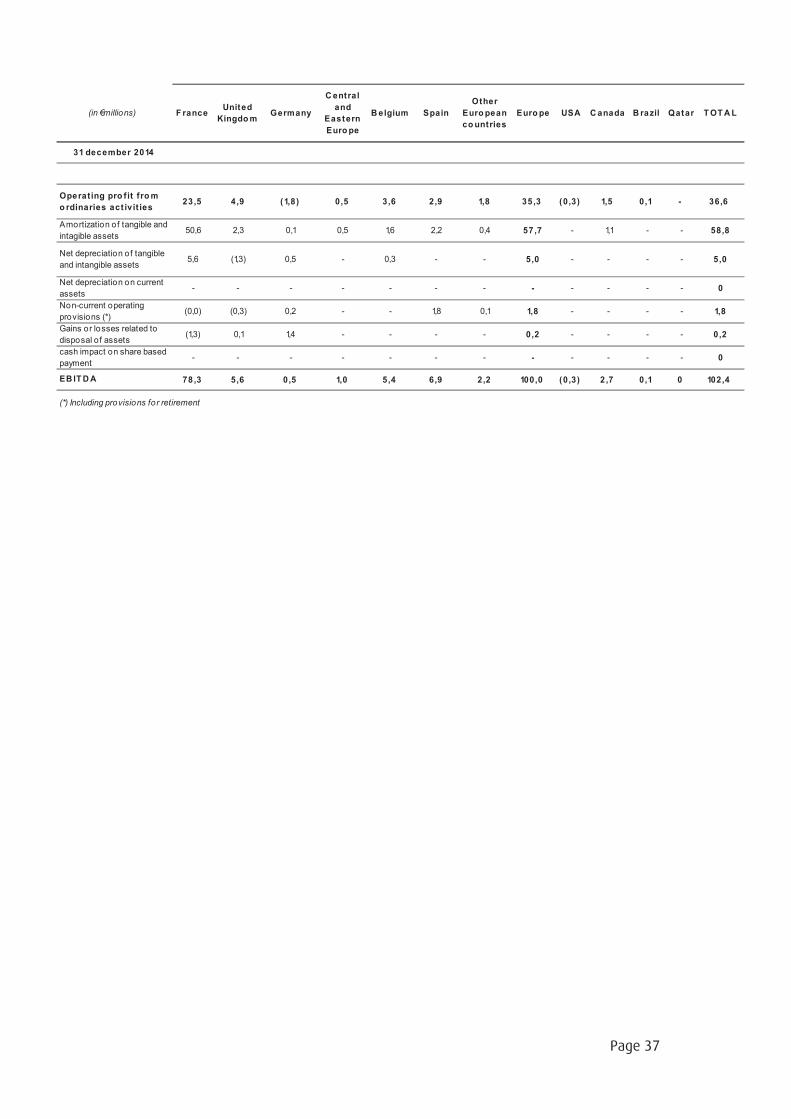
Page 37
(in millions) F ranceUnited
KingdomGermany
Central
and
Eastern
Europe
Belgium Spain
Other
European
countries
Europe USA Canada B razil Qatar TOTAL
31 december 2014
Operating pro fit from
o rdinaries act ivit ies23 ,5 4,9 (1,8) 0,5 3,6 2,9 1,8 35 ,3 (0,3) 1,5 0,1 - 36,6
Amortization of tangible and
intagible assets50,6 2,3 0,1 0,5 1,6 2,2 0,4 57 ,7 - 1,1 - - 58,8
Net depreciation of tangible
and intangible assets5,6 (1,3) 0,5 - 0,3 - - 5,0 - - - - 5,0
Net depreciation on current
assets- - - - - - - - - - - - 0
Non-current operating
provisions (*)(0,0) (0,3) 0,2 - - 1,8 0,1 1,8 - - - - 1,8
Gains or losses related to
disposal of assets(1,3) 0,1 1,4 - - - - 0,2 - - - - 0,2
cash impact on share based
payment- - - - - - - - - - - - 0
EB ITDA 78,3 5,6 0,5 1,0 5,4 6,9 2,2 100,0 (0,3) 2 ,7 0,1 0 102,4
(*) Including provisions for retirement
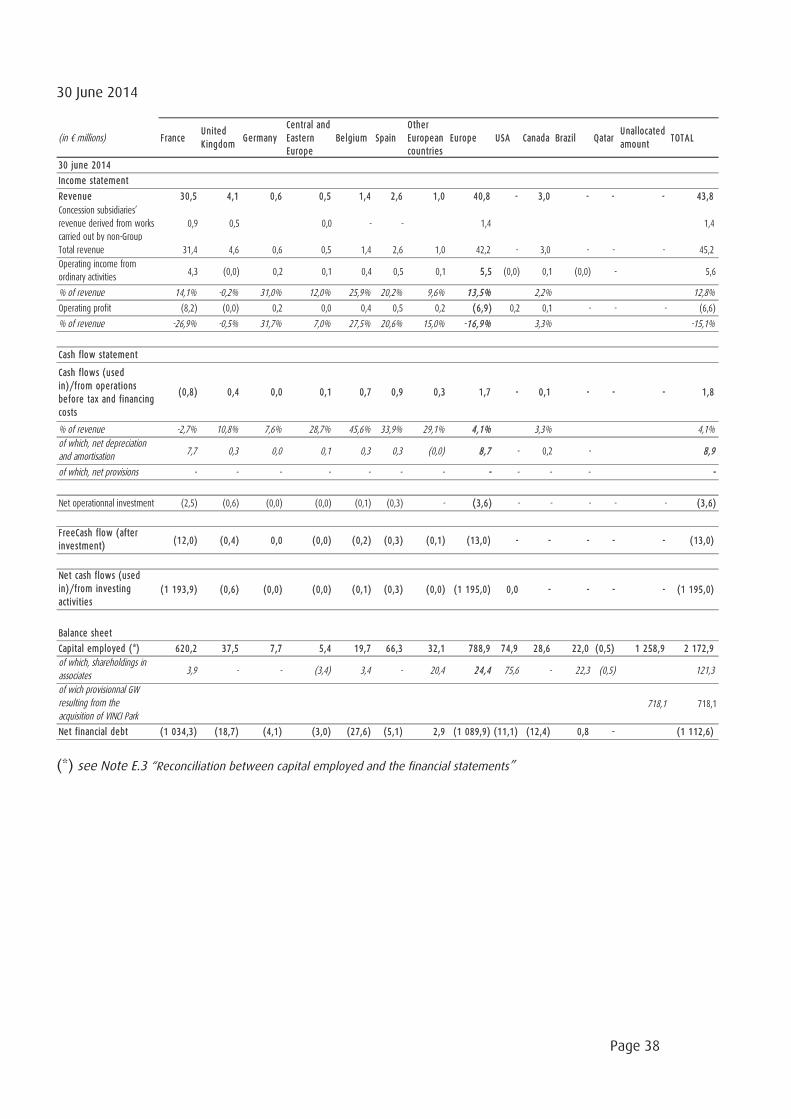
Page 38
30 June 2014
(in millions) FranceUnited
KingdomGermany
Central and
Eastern
Europe
Belgium Spain
Other
European
countries
Europe USA Canada Brazil QatarUnallocated
amountTOTAL
30 june 2014
Income statement
Revenue 30,5 4,1 0,6 0,5 1,4 2,6 1,0 40,8 - 3,0 - - - 43,8
Concession subsidiaries’
revenue derived from works
carried out by non-Group
0,9 0,5 0,0 - - 1,4 1,4
Total revenue 31,4 4,6 0,6 0,5 1,4 2,6 1,0 42,2 - 3,0 - - - 45,2
Operating income from
ordinary activities4,3 (0,0) 0,2 0,1 0,4 0,5 0,1 5,5 (0,0) 0,1 (0,0) - 5,6
% of revenue 14,1% -0,2% 31,0% 12,0% 25,9% 20,2% 9,6% 13,5% 2,2% 12,8%
Operating profit (8,2) (0,0) 0,2 0,0 0,4 0,5 0,2 (6,9) 0,2 0,1 - - - (6,6)
% of revenue -26,9% -0,5% 31,7% 7,0% 27,5% 20,6% 15,0% -16,9% 3,3% -15,1%
Cash flow statement
Cash flows (used
in)/from operations
before tax and financing
costs
(0,8) 0,4 0,0 0,1 0,7 0,9 0,3 1,7 - 0,1 - - - 1,8
% of revenue -2,7% 10,8% 7,6% 28,7% 45,6% 33,9% 29,1% 4,1% 3,3% 4,1%
of which, net depreciationand amortisation
7,7 0,3 0,0 0,1 0,3 0,3 (0,0) 8,7 - 0,2 - 8,9
of which, net provisions - - - - - - - - - - - -
Net operationnal investment (2,5) (0,6) (0,0) (0,0) (0,1) (0,3) - (3,6) - - - - - (3,6)
FreeCash flow (after
investment)(12,0) (0,4) 0,0 (0,0) (0,2) (0,3) (0,1) (13,0) - - - - - (13,0)
Net cash flows (used
in)/from investing
activities(1 193,9) (0,6) (0,0) (0,0) (0,1) (0,3) (0,0) (1 195,0) 0,0 - - - - (1 195,0)
Balance sheet
Capital employed (*) 620,2 37,5 7,7 5,4 19,7 66,3 32,1 788,9 74,9 28,6 22,0 (0,5) 1 258,9 2 172,9
of which, shareholdings inassociates
3,9 - - (3,4) 3,4 - 20,4 24,4 75,6 - 22,3 (0,5) 121,3
of wich provisionnal GWresulting from theacquisition of VINCI Park
718,1 718,1
Net financial debt (1 034,3) (18,7) (4,1) (3,0) (27,6) (5,1) 2,9 (1 089,9) (11,1) (12,4) 0,8 - (1 112,6)
(*) see Note E.3 “Reconciliation between capital employed and the financial statements”
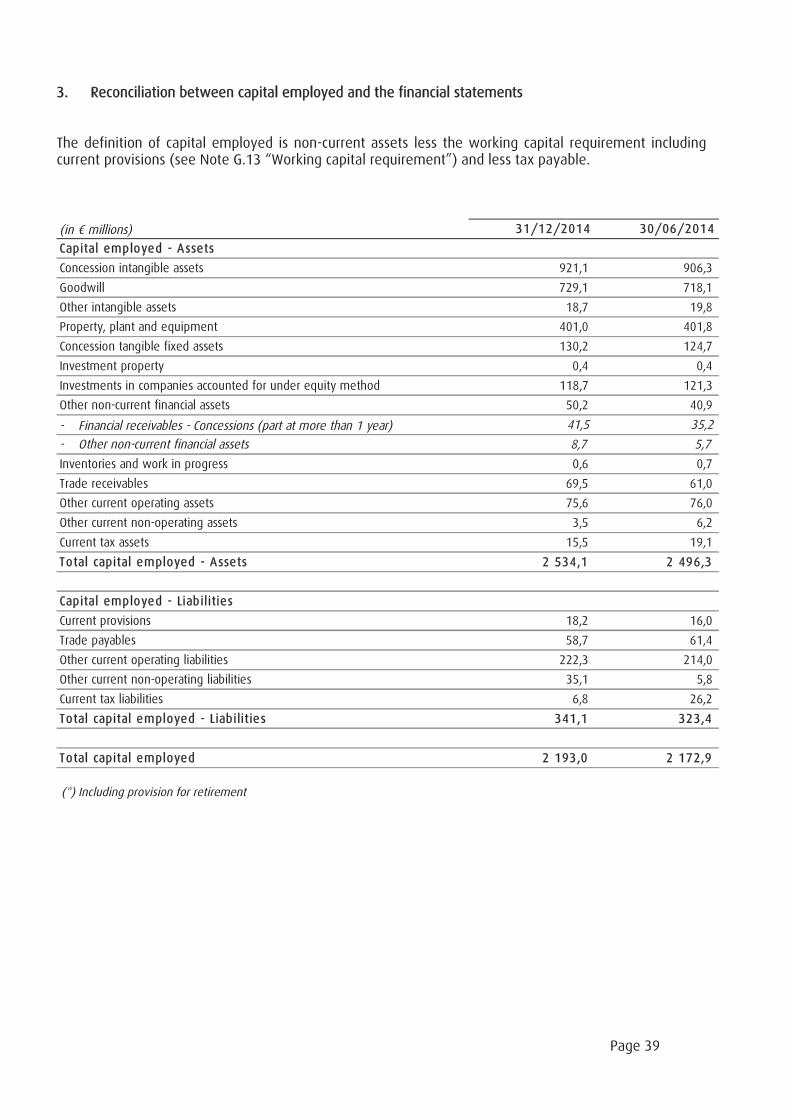
Page 39
3. Reconciliation between capital employed and the financial statements
The definition of capital employed is non-current assets less the working capital requirement includingcurrent provisions (see Note G.13 “Working capital requirement”) and less tax payable.
(in millions) 31/12/2014 30/06/2014
Capital employed - Assets
Concession intangible assets 921,1 906,3
Goodwill 729,1 718,1
Other intangible assets 18,7 19,8
Property, plant and equipment 401,0 401,8
Concession tangible fixed assets 130,2 124,7
Investment property 0,4 0,4
Investments in companies accounted for under equity method 118,7 121,3
Other non-current financial assets 50,2 40,9
- Financial receivables - Concessions (part at more than 1 year) 41,5 35,2
- Other non-current financial assets 8,7 5,7
Inventories and work in progress 0,6 0,7
Trade receivables 69,5 61,0
Other current operating assets 75,6 76,0
Other current non-operating assets 3,5 6,2
Current tax assets 15,5 19,1
Total capital employed - Assets 2 534,1 2 496,3
Capital employed - Liabilities
Current provisions 18,2 16,0
Trade payables 58,7 61,4
Other current operating liabilities 222,3 214,0
Other current non-operating liabilities 35,1 5,8
Current tax liabilities 6,8 26,2
Total capital employed - Liabilities 341,1 323,4
Total capital employed 2 193,0 2 172,9
(*) Including provision for retirement
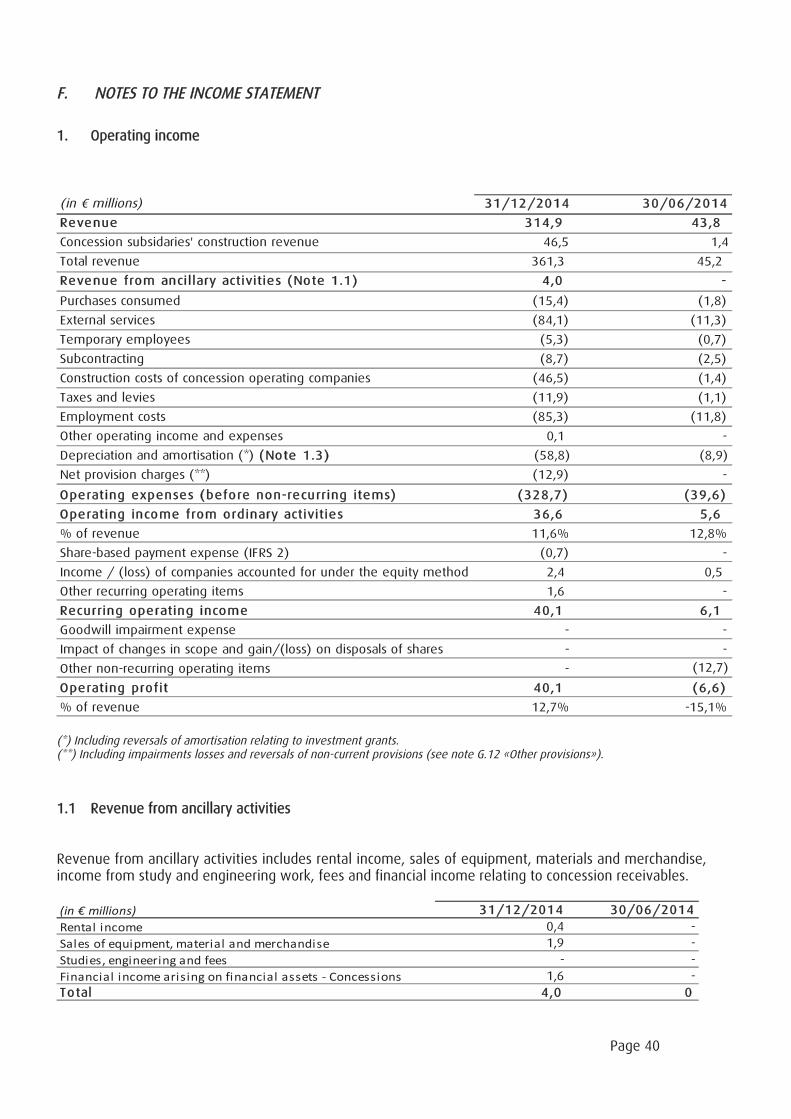
Page 40
F. NOTES TO THE INCOME STATEMENT
1. Operating income
(in millions) 31/12/2014 30/06/2014
Revenue 314,9 43,8
Concession subsidaries' construction revenue 46,5 1,4
Total revenue 361,3 45,2
Revenue from ancillary activities (Note 1.1) 4,0 -
Purchases consumed (15,4) (1,8)
External services (84,1) (11,3)
Temporary employees (5,3) (0,7)
Subcontracting (8,7) (2,5)
Construction costs of concession operating companies (46,5) (1,4)
Taxes and levies (11,9) (1,1)
Employment costs (85,3) (11,8)
Other operating income and expenses 0,1 -
Depreciation and amortisation (*) (Note 1.3) (58,8) (8,9)
Net provision charges (**) (12,9) -
Operating expenses (before non-recurring items) (328,7) (39,6)
Operating income from ordinary activities 36,6 5,6
% of revenue 11,6% 12,8%
Share-based payment expense (IFRS 2) (0,7) -
Income / (loss) of companies accounted for under the equity method 2,4 0,5
Other recurring operating items 1,6 -
Recurring operating income 40,1 6,1
Goodwill impairment expense - -
Impact of changes in scope and gain/(loss) on disposals of shares - -
Other non-recurring operating items - (12,7)
Operating profit 40,1 (6,6)
% of revenue 12,7% -15,1%
(*) Including reversals of amortisation relating to investment grants.(**) Including impairments losses and reversals of non-current provisions (see note G.12 «Other provisions»).
1.1 Revenue from ancillary activities
Revenue from ancillary activities includes rental income, sales of equipment, materials and merchandise,income from study and engineering work, fees and financial income relating to concession receivables.
(in millions) 31/12/2014 30/06/2014
Rental income 0,4 -
Sales of equipment, material and merchandise 1,9 -
Studies, engineering and fees - -
Financial income arising on financial assets - Concessions 1,6 -
Total 4,0 0
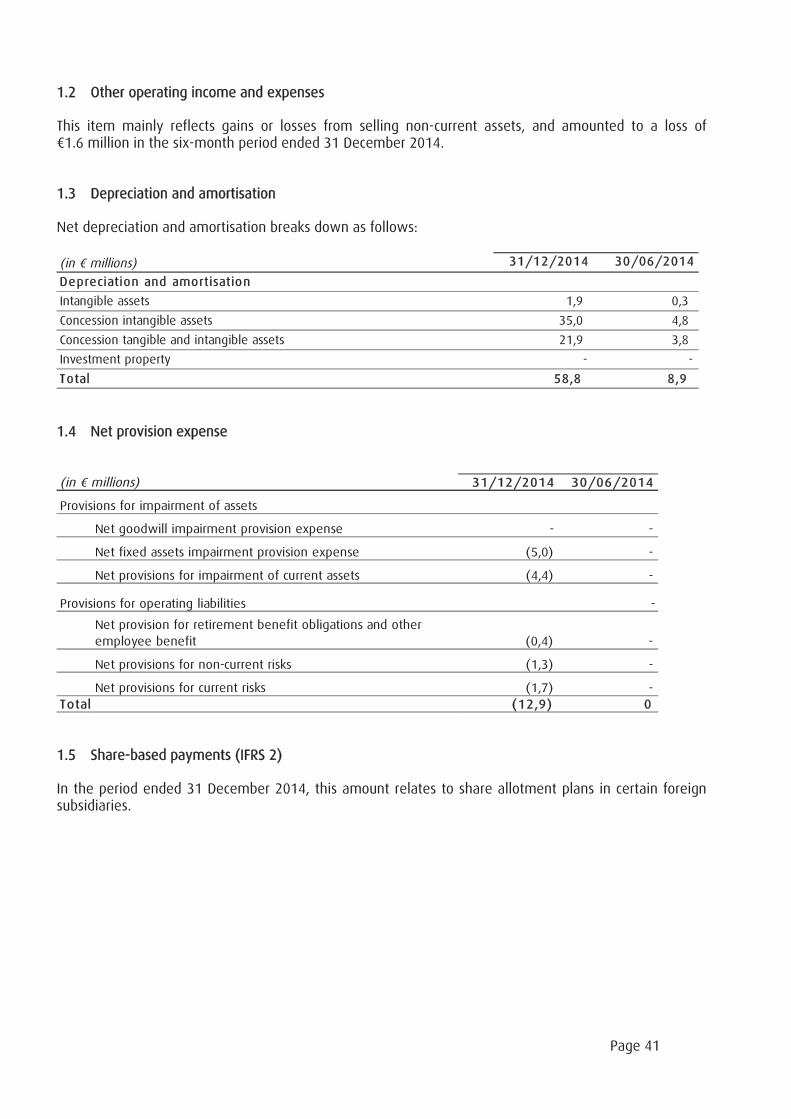
Page 41
1.2 Other operating income and expenses
This item mainly reflects gains or losses from selling non-current assets, and amounted to a loss of1.6 million in the six-month period ended 31 December 2014.
1.3 Depreciation and amortisation
Net depreciation and amortisation breaks down as follows:
(in millions) 31/12/2014 30/06/2014
Depreciation and amortisation
Intangible assets 1,9 0,3
Concession intangible assets 35,0 4,8
Concession tangible and intangible assets 21,9 3,8
Investment property - -
Total 58,8 8,9
1.4 Net provision expense
(in millions) 31/12/2014 30/06/2014
Provisions for impairment of assets
Net goodwill impairment provision expense - -
Net fixed assets impairment provision expense (5,0) -
Net provisions for impairment of current assets (4,4) -
-
Net provision for retirement benefit obligations and other
employee benefit (0,4) -
Net provisions for non-current risks (1,3) -
Net provisions for current risks (1,7) -
Total (12,9) 0
Provisions for operating liabilities
1.5 Share-based payments (IFRS 2)
In the period ended 31 December 2014, this amount relates to share allotment plans in certain foreignsubsidiaries.
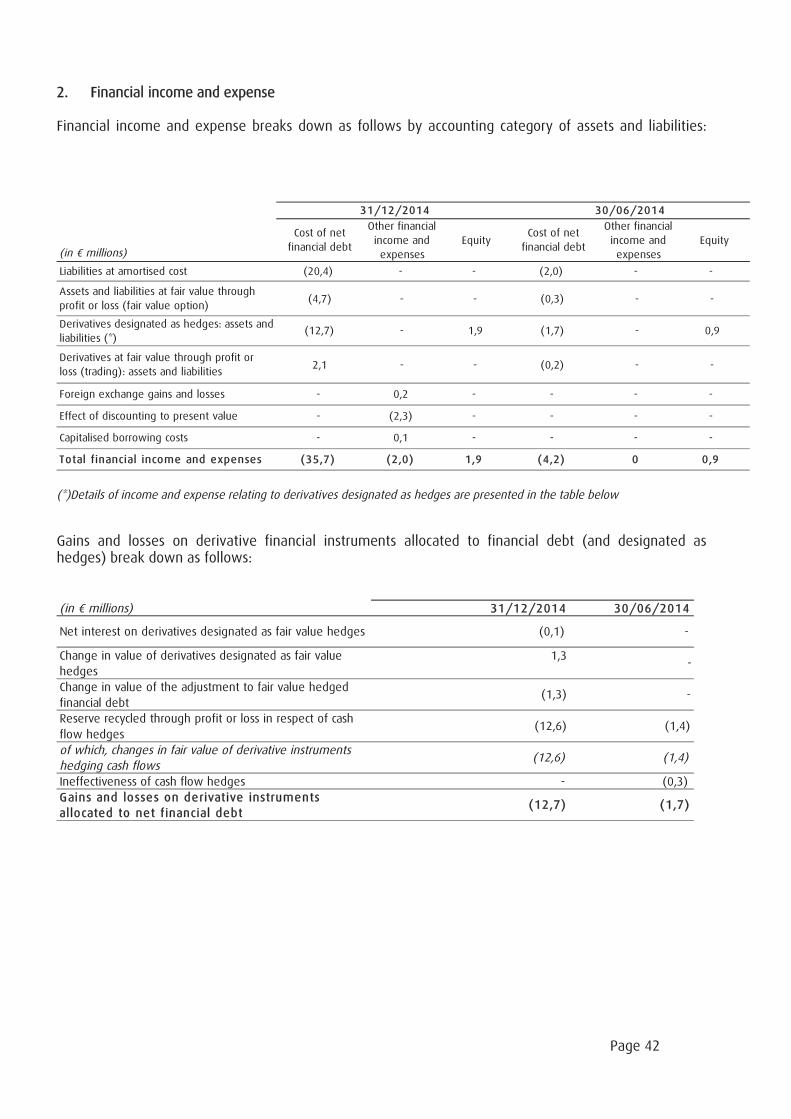
Page 42
2. Financial income and expense
Financial income and expense breaks down as follows by accounting category of assets and liabilities:
(in millions)
Cost of net
financial debt
Other financial
income and
expenses
EquityCost of net
financial debt
Other financial
income and
expenses
Equity
Liabilities at amortised cost (20,4) - - (2,0) - -
Assets and liabilities at fair value through
profit or loss (fair value option)(4,7) - - (0,3) - -
Derivatives designated as hedges: assets and
liabilities (*)(12,7) - 1,9 (1,7) - 0,9
Derivatives at fair value through profit or
loss (trading): assets and liabilities2,1 - - (0,2) - -
Foreign exchange gains and losses - 0,2 - - - -
Effect of discounting to present value - (2,3) - - - -
Capitalised borrowing costs - 0,1 - - - -
Total financial income and expenses (35,7) (2,0) 1,9 (4,2) 0 0,9
30/06/201431/12/2014
(*)Details of income and expense relating to derivatives designated as hedges are presented in the table below
Gains and losses on derivative financial instruments allocated to financial debt (and designated ashedges) break down as follows:
(in millions) 31/12/2014 30/06/2014
Net interest on derivatives designated as fair value hedges (0,1) -
Change in value of derivatives designated as fair value
hedges
1,3-
Change in value of the adjustment to fair value hedged
financial debt(1,3) -
Reserve recycled through profit or loss in respect of cash
flow hedges(12,6) (1,4)
of which, changes in fair value of derivative instrumentshedging cash flows
(12,6) (1,4)
Ineffectiveness of cash flow hedges - (0,3)
Gains and losses on derivative instruments
allocated to net financial debt(12,7) (1,7)
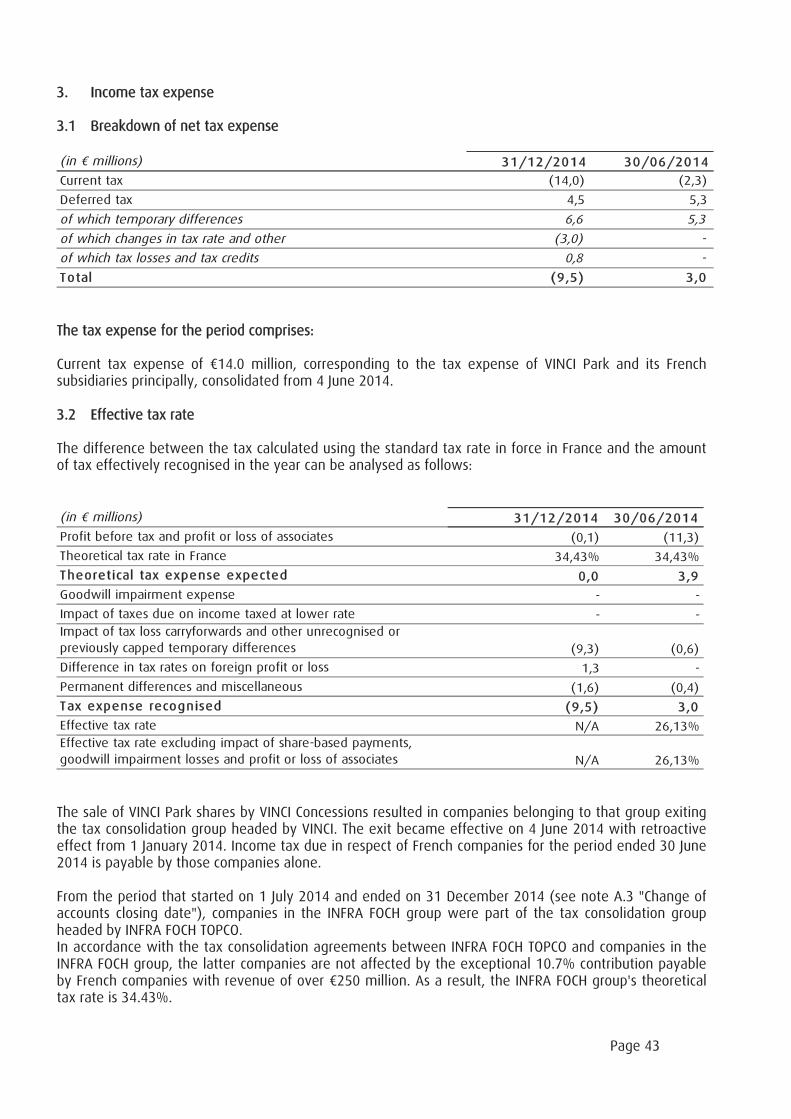
Page 43
3. Income tax expense
3.1 Breakdown of net tax expense
(in millions) 31/12/2014 30/06/2014
Current tax (14,0) (2,3)
Deferred tax 4,5 5,3
of which temporary differences 6,6 5,3
of which changes in tax rate and other (3,0) -
of which tax losses and tax credits 0,8 -
Total (9,5) 3,0
The tax expense for the period comprises:
Current tax expense of 14.0 million, corresponding to the tax expense of VINCI Park and its Frenchsubsidiaries principally, consolidated from 4 June 2014.
3.2 Effective tax rate
The difference between the tax calculated using the standard tax rate in force in France and the amountof tax effectively recognised in the year can be analysed as follows:
(in millions) 31/12/2014 30/06/2014
Profit before tax and profit or loss of associates (0,1) (11,3)
Theoretical tax rate in France 34,43% 34,43%
Theoretical tax expense expected 0,0 3,9
Goodwill impairment expense - -
Impact of taxes due on income taxed at lower rate - -
Impact of tax loss carryforwards and other unrecognised or
previously capped temporary differences (9,3) (0,6)
Difference in tax rates on foreign profit or loss 1,3 -
Permanent differences and miscellaneous (1,6) (0,4)
Tax expense recognised (9,5) 3,0
Effective tax rate N/A 26,13%
Effective tax rate excluding impact of share-based payments,
goodwill impairment losses and profit or loss of associates N/A 26,13%
The sale of VINCI Park shares by VINCI Concessions resulted in companies belonging to that group exitingthe tax consolidation group headed by VINCI. The exit became effective on 4 June 2014 with retroactiveeffect from 1 January 2014. Income tax due in respect of French companies for the period ended 30 June2014 is payable by those companies alone.
From the period that started on 1 July 2014 and ended on 31 December 2014 (see note A.3 "Change ofaccounts closing date"), companies in the INFRA FOCH group were part of the tax consolidation groupheaded by INFRA FOCH TOPCO.In accordance with the tax consolidation agreements between INFRA FOCH TOPCO and companies in theINFRA FOCH group, the latter companies are not affected by the exceptional 10.7% contribution payableby French companies with revenue of over 250 million. As a result, the INFRA FOCH group's theoreticaltax rate is 34.43%.
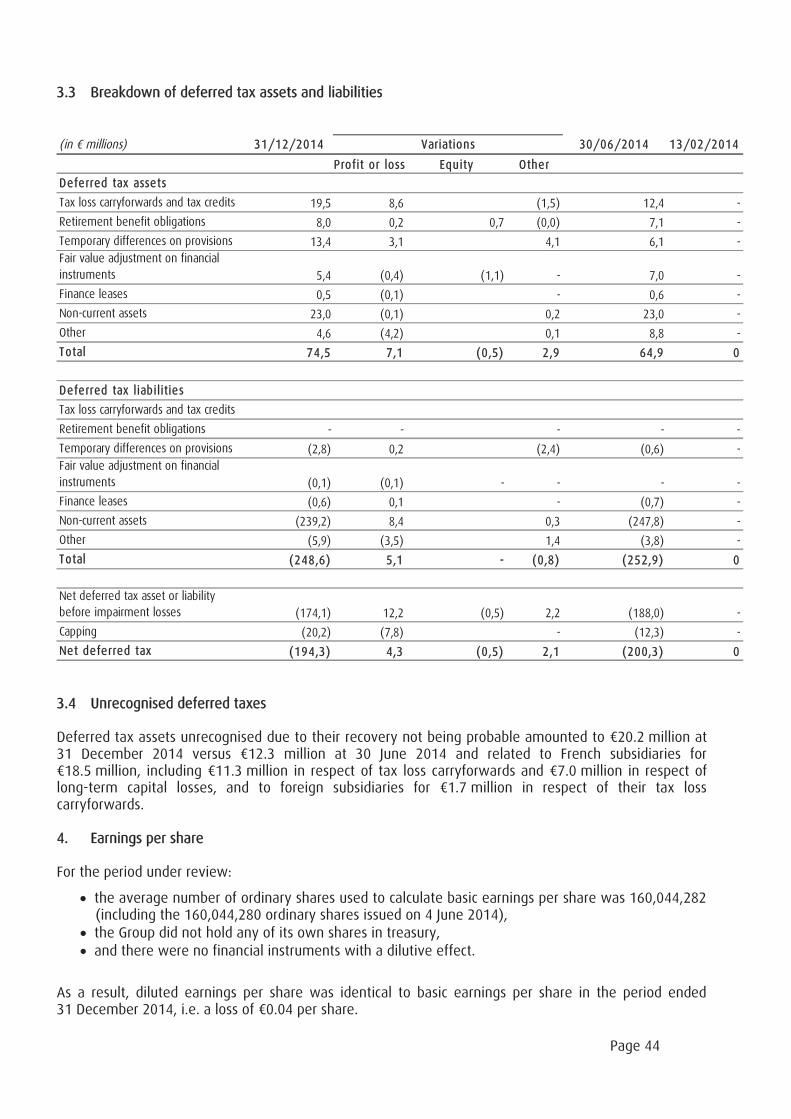
Page 44
3.3 Breakdown of deferred tax assets and liabilities
(in millions) 31/12/2014 30/06/2014 13/02/2014
Profit or loss Equity Other
Deferred tax assets
Tax loss carryforwards and tax credits 19,5 8,6 (1,5) 12,4 -
Retirement benefit obligations 8,0 0,2 0,7 (0,0) 7,1 -
Temporary differences on provisions 13,4 3,1 4,1 6,1 -
Fair value adjustment on financial
instruments 5,4 (0,4) (1,1) - 7,0 -
Finance leases 0,5 (0,1) - 0,6 -
Non-current assets 23,0 (0,1) 0,2 23,0 -
Other 4,6 (4,2) 0,1 8,8 -
Total 74,5 7,1 (0,5) 2,9 64,9 0
Deferred tax liabilities
Tax loss carryforwards and tax credits
Retirement benefit obligations - - - - -
Temporary differences on provisions (2,8) 0,2 (2,4) (0,6) -
Fair value adjustment on financial
instruments (0,1) (0,1) - - - -
Finance leases (0,6) 0,1 - (0,7) -
Non-current assets (239,2) 8,4 0,3 (247,8) -
Other (5,9) (3,5) 1,4 (3,8) -
Total (248,6) 5,1 - (0,8) (252,9) 0
Net deferred tax asset or liability
before impairment losses (174,1) 12,2 (0,5) 2,2 (188,0) -
Capping (20,2) (7,8) - (12,3) -
Net deferred tax (194,3) 4,3 (0,5) 2,1 (200,3) 0
Variations
3.4 Unrecognised deferred taxes
Deferred tax assets unrecognised due to their recovery not being probable amounted to 20.2 million at31 December 2014 versus 12.3 million at 30 June 2014 and related to French subsidiaries for18.5 million, including 11.3 million in respect of tax loss carryforwards and 7.0 million in respect of
long-term capital losses, and to foreign subsidiaries for 1.7 million in respect of their tax losscarryforwards.
4. Earnings per share
For the period under review:
the average number of ordinary shares used to calculate basic earnings per share was 160,044,282(including the 160,044,280 ordinary shares issued on 4 June 2014),the Group did not hold any of its own shares in treasury,and there were no financial instruments with a dilutive effect.
As a result, diluted earnings per share was identical to basic earnings per share in the period ended31 December 2014, i.e. a loss of 0.04 per share.
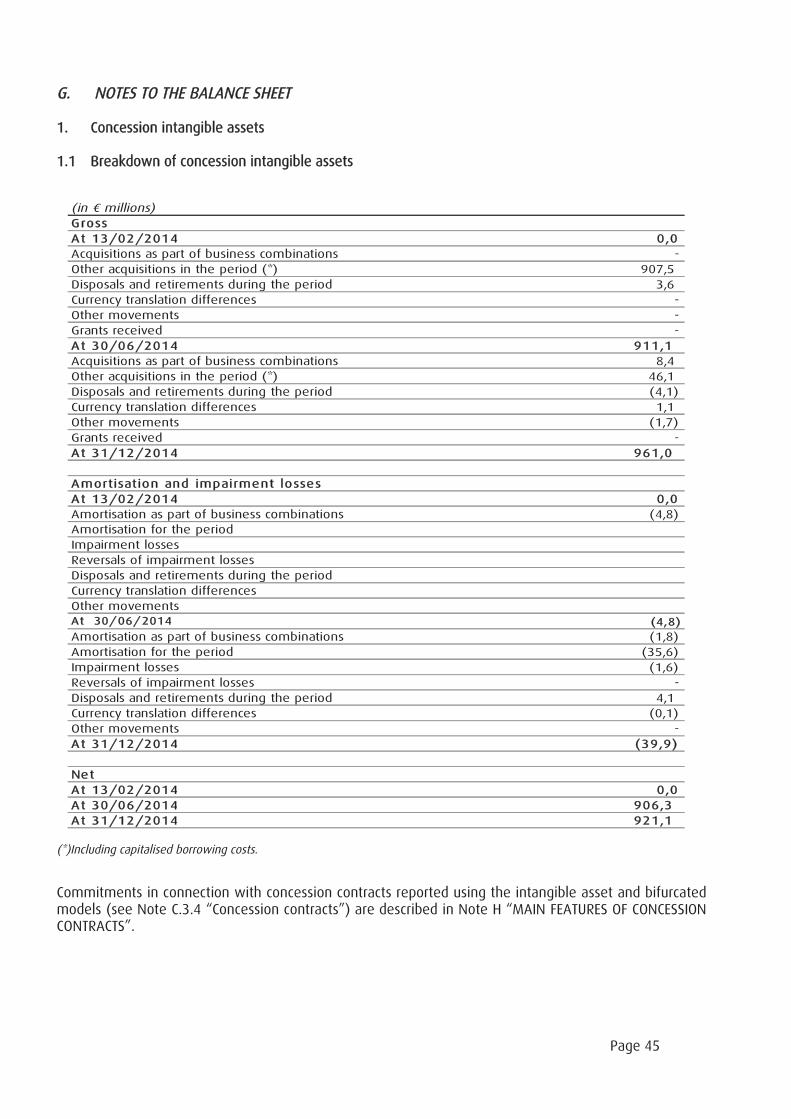
Page 45
G. NOTES TO THE BALANCE SHEET
1. Concession intangible assets
1.1 Breakdown of concession intangible assets
(*)Including capitalised borrowing costs.
Commitments in connection with concession contracts reported using the intangible asset and bifurcatedmodels (see Note C.3.4 “Concession contracts”) are described in Note H “MAIN FEATURES OF CONCESSIONCONTRACTS”.
(in millions)Gross
At 13/02/2014 0,0
Acquisitions as part of business combinations -
Other acquisitions in the period (*) 907,5
Disposals and retirements during the period 3,6
Currency translation differences -
Other movements -
Grants received -
At 30/06/2014 911,1
Acquisitions as part of business combinations 8,4
Other acquisitions in the period (*) 46,1
Disposals and retirements during the period (4,1)
Currency translation differences 1,1
Other movements (1,7)
Grants received -
At 31/12/2014 961,0
Amortisation and impairment losses
At 13/02/2014 0,0
Amortisation as part of business combinations (4,8)
Amortisation for the period
Impairment losses
Reversals of impairment losses
Disposals and retirements during the period
Currency translation differences
Other movementsAt 30/06/2014 (4,8)
Amortisation as part of business combinations (1,8)
Amortisation for the period (35,6)
Impairment losses (1,6)
Reversals of impairment losses -
Disposals and retirements during the period 4,1
Currency translation differences (0,1)
Other movements -
At 31/12/2014 (39,9)
Net
At 13/02/2014 0,0
At 30/06/2014 906,3
At 31/12/2014 921,1
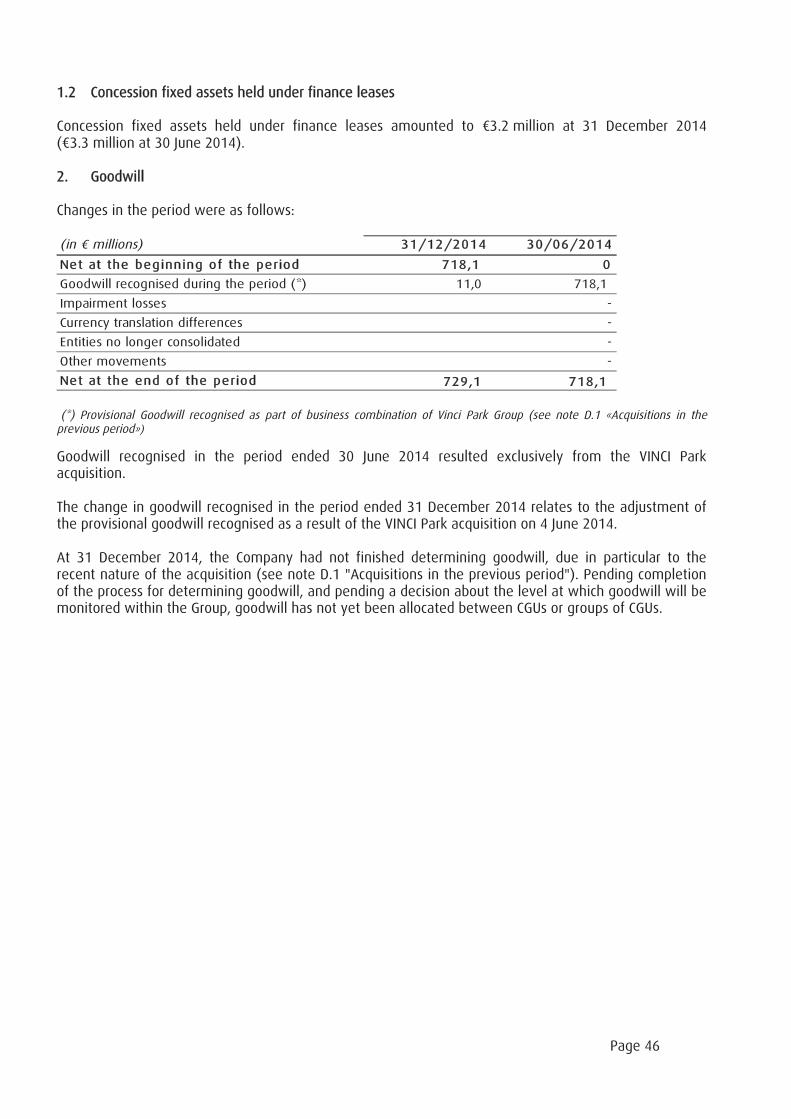
Page 46
1.2 Concession fixed assets held under finance leases
Concession fixed assets held under finance leases amounted to 3.2 million at 31 December 2014( 3.3 million at 30 June 2014).
2. Goodwill
Changes in the period were as follows:
(in millions) 31/12/2014 30/06/2014
Net at the beginning of the period 718,1 0
Goodwill recognised during the period (*) 11,0 718,1
Impairment losses -
Currency translation differences -
Entities no longer consolidated -
Other movements -
Net at the end of the period 729,1 718,1
(*) Provisional Goodwill recognised as part of business combination of Vinci Park Group (see note D.1 «Acquisitions in theprevious period»)
Goodwill recognised in the period ended 30 June 2014 resulted exclusively from the VINCI Parkacquisition.
The change in goodwill recognised in the period ended 31 December 2014 relates to the adjustment ofthe provisional goodwill recognised as a result of the VINCI Park acquisition on 4 June 2014.
At 31 December 2014, the Company had not finished determining goodwill, due in particular to therecent nature of the acquisition (see note D.1 "Acquisitions in the previous period"). Pending completionof the process for determining goodwill, and pending a decision about the level at which goodwill will bemonitored within the Group, goodwill has not yet been allocated between CGUs or groups of CGUs.
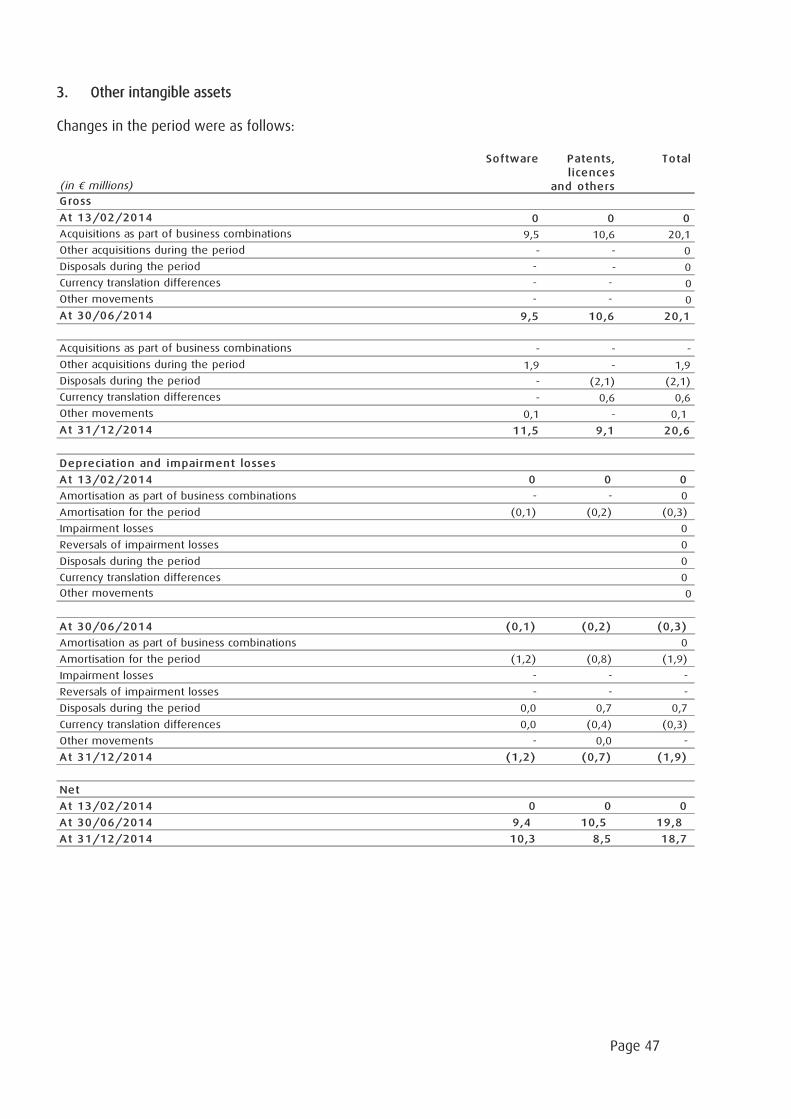
Page 47
3. Other intangible assets
Changes in the period were as follows:
(in millions)
Software Patents,
licences
and others
Total
Gross
At 13/02/2014 0 0 0
Acquisitions as part of business combinations 9,5 10,6 20,1
Other acquisitions during the period - - 0
Disposals during the period - - 0
Currency translation differences - - 0
Other movements - - 0
At 30/06/2014 9,5 10,6 20,1
Acquisitions as part of business combinations - - -
Other acquisitions during the period 1,9 - 1,9
Disposals during the period - (2,1) (2,1)
Currency translation differences - 0,6 0,6
Other movements 0,1 - 0,1
At 31/12/2014 11,5 9,1 20,6
Depreciation and impairment losses
At 13/02/2014 0 0 0
Amortisation as part of business combinations - - 0
Amortisation for the period (0,1) (0,2) (0,3)
Impairment losses 0
Reversals of impairment losses 0
Disposals during the period 0
Currency translation differences 0
Other movements 0
At 30/06/2014 (0,1) (0,2) (0,3)
Amortisation as part of business combinations 0
Amortisation for the period (1,2) (0,8) (1,9)
Impairment losses - - -
Reversals of impairment losses - - -
Disposals during the period 0,0 0,7 0,7
Currency translation differences 0,0 (0,4) (0,3)
Other movements - 0,0 -
At 31/12/2014 (1,2) (0,7) (1,9)
Net
At 13/02/2014 0 0 0
At 30/06/2014 9,4 10,5 19,8
At 31/12/2014 10,3 8,5 18,7
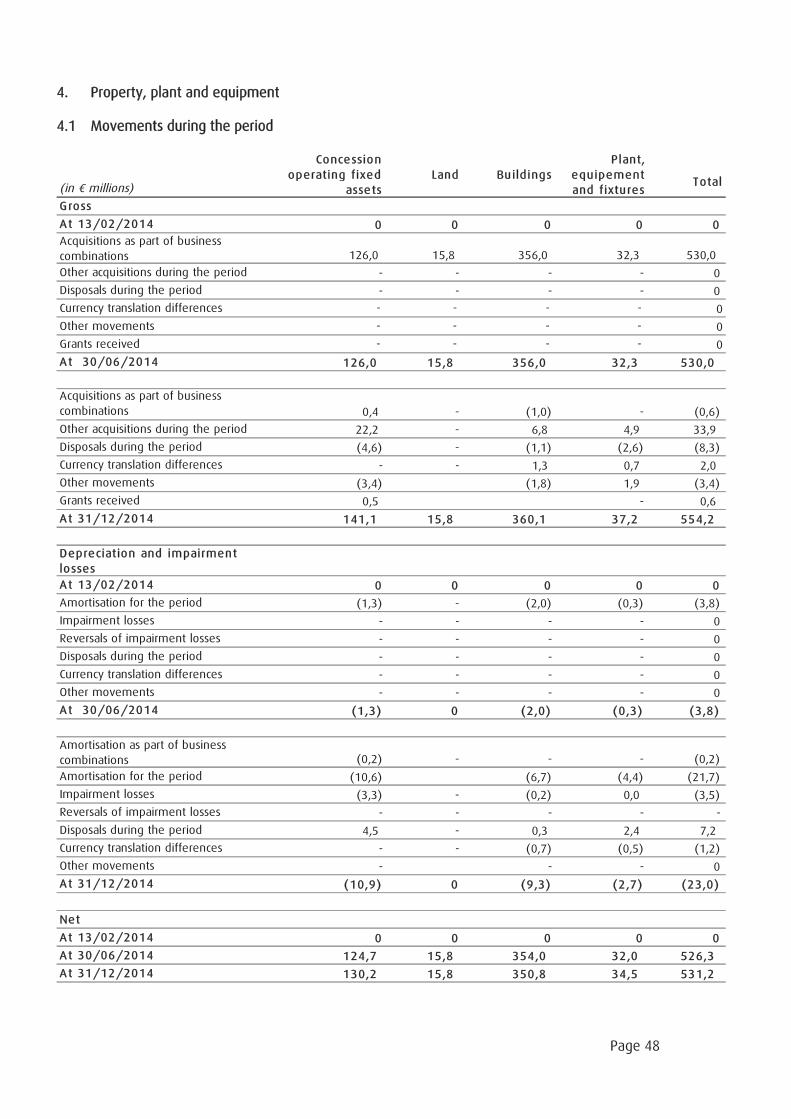
Page 48
4. Property, plant and equipment
4.1 Movements during the period
(in millions)
Concession
operating fixed
assets
Land Buildings
Plant,
equipement
and fixturesTotal
Gross
At 13/02/2014 0 0 0 0 0
Acquisitions as part of business
combinations 126,0 15,8 356,0 32,3 530,0
Other acquisitions during the period - - - - 0
Disposals during the period - - - - 0
Currency translation differences - - - - 0
Other movements - - - - 0
Grants received - - - - 0
At 30/06/2014 126,0 15,8 356,0 32,3 530,0
Acquisitions as part of business
combinations 0,4 - (1,0) - (0,6)
Other acquisitions during the period 22,2 - 6,8 4,9 33,9
Disposals during the period (4,6) - (1,1) (2,6) (8,3)
Currency translation differences - - 1,3 0,7 2,0
Other movements (3,4) (1,8) 1,9 (3,4)
Grants received 0,5 - 0,6
At 31/12/2014 141,1 15,8 360,1 37,2 554,2
Depreciation and impairment
losses
At 13/02/2014 0 0 0 0 0
Amortisation for the period (1,3) - (2,0) (0,3) (3,8)
Impairment losses - - - - 0
Reversals of impairment losses - - - - 0
Disposals during the period - - - - 0
Currency translation differences - - - - 0
Other movements - - - - 0
At 30/06/2014 (1,3) 0 (2,0) (0,3) (3,8)
Amortisation as part of business
combinations (0,2) - - - (0,2)
Amortisation for the period (10,6) (6,7) (4,4) (21,7)
Impairment losses (3,3) - (0,2) 0,0 (3,5)
Reversals of impairment losses - - - - -
Disposals during the period 4,5 - 0,3 2,4 7,2
Currency translation differences - - (0,7) (0,5) (1,2)
Other movements - - - 0
At 31/12/2014 (10,9) 0 (9,3) (2,7) (23,0)
Net
At 13/02/2014 0 0 0 0 0
At 30/06/2014 124,7 15,8 354,0 32,0 526,3
At 31/12/2014 130,2 15,8 350,8 34,5 531,2
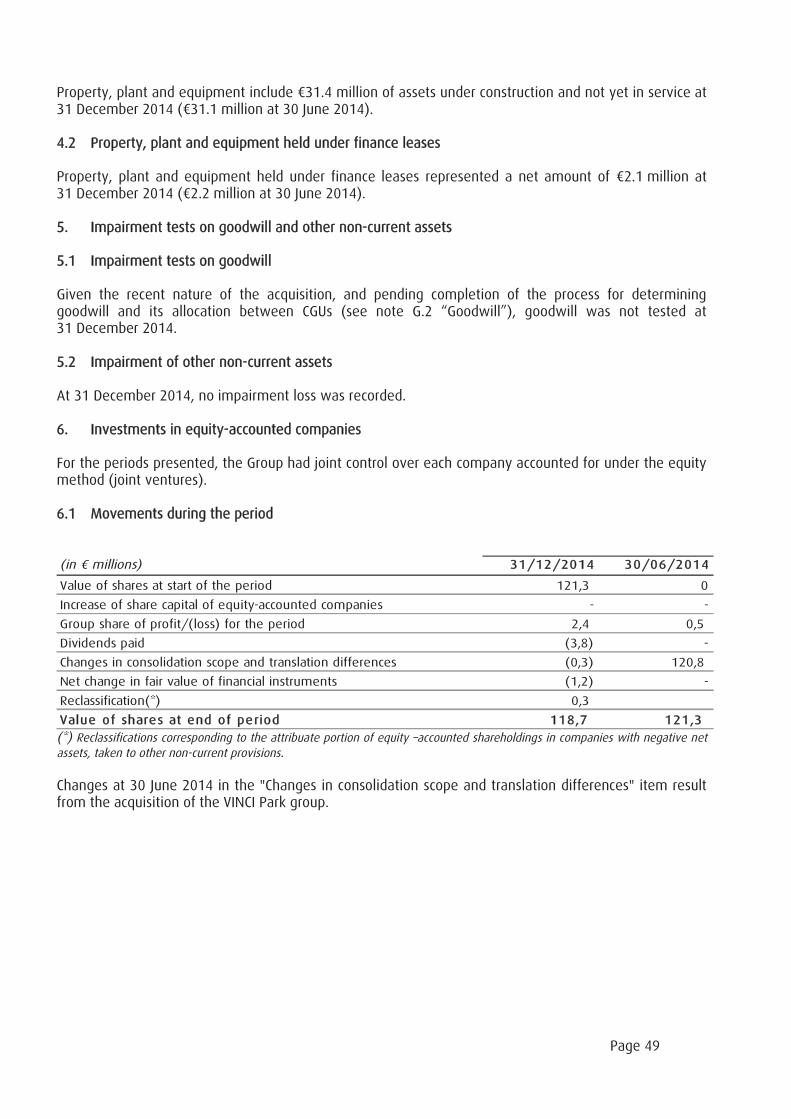
Page 49
Property, plant and equipment include 31.4 million of assets under construction and not yet in service at31 December 2014 ( 31.1 million at 30 June 2014).
4.2 Property, plant and equipment held under finance leases
Property, plant and equipment held under finance leases represented a net amount of 2.1 million at31 December 2014 ( 2.2 million at 30 June 2014).
5. Impairment tests on goodwill and other non-current assets
5.1 Impairment tests on goodwill
Given the recent nature of the acquisition, and pending completion of the process for determininggoodwill and its allocation between CGUs (see note G.2 “Goodwill”), goodwill was not tested at31 December 2014.
5.2 Impairment of other non-current assets
At 31 December 2014, no impairment loss was recorded.
6. Investments in equity-accounted companies
For the periods presented, the Group had joint control over each company accounted for under the equitymethod (joint ventures).
6.1 Movements during the period
(in millions) 31/12/2014 30/06/2014
Value of shares at start of the period 121,3 0
Increase of share capital of equity-accounted companies - -
Group share of profit/(loss) for the period 2,4 0,5
Dividends paid (3,8) -
Changes in consolidation scope and translation differences (0,3) 120,8
Net change in fair value of financial instruments (1,2) -
Reclassification(*) 0,3
Value of shares at end of period 118,7 121,3
(*) Reclassifications corresponding to the attribuate portion of equity –accounted shareholdings in companies with negative netassets, taken to other non-current provisions.
Changes at 30 June 2014 in the "Changes in consolidation scope and translation differences" item resultfrom the acquisition of the VINCI Park group.
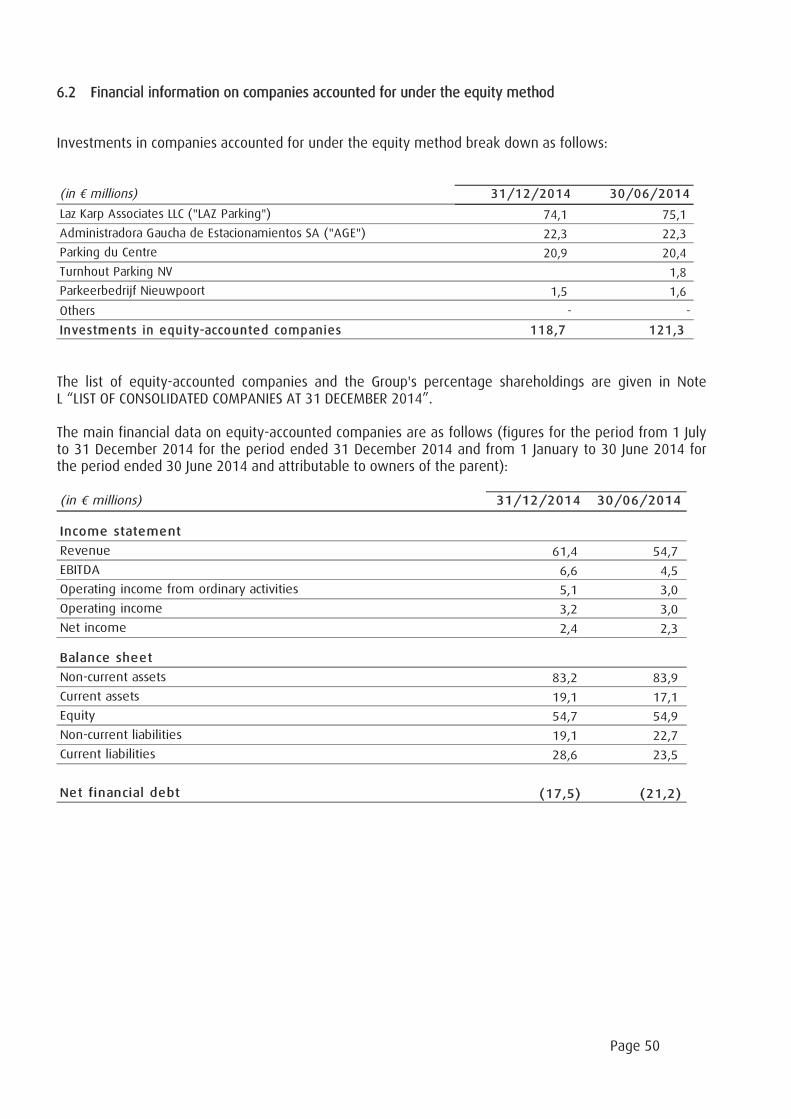
Page 50
6.2 Financial information on companies accounted for under the equity method
Investments in companies accounted for under the equity method break down as follows:
(in millions) 31/12/2014 30/06/2014
Laz Karp Associates LLC ("LAZ Parking") 74,1 75,1
Administradora Gaucha de Estacionamientos SA ("AGE") 22,3 22,3
Parking du Centre 20,9 20,4
Turnhout Parking NV 1,8
Parkeerbedrijf Nieuwpoort 1,5 1,6
Others - -
Investments in equity-accounted companies 118,7 121,3
The list of equity-accounted companies and the Group's percentage shareholdings are given in NoteL “LIST OF CONSOLIDATED COMPANIES AT 31 DECEMBER 2014”.
The main financial data on equity-accounted companies are as follows (figures for the period from 1 Julyto 31 December 2014 for the period ended 31 December 2014 and from 1 January to 30 June 2014 forthe period ended 30 June 2014 and attributable to owners of the parent):
(in millions) 31/12/2014 30/06/2014
Income statement
Revenue 61,4 54,7
EBITDA 6,6 4,5
Operating income from ordinary activities 5,1 3,0
Operating income 3,2 3,0
Net income 2,4 2,3
Balance sheet
Non-current assets 83,2 83,9
Current assets 19,1 17,1
Equity 54,7 54,9
Non-current liabilities 19,1 22,7
Current liabilities 28,6 23,5
Net financial debt (17,5) (21,2)
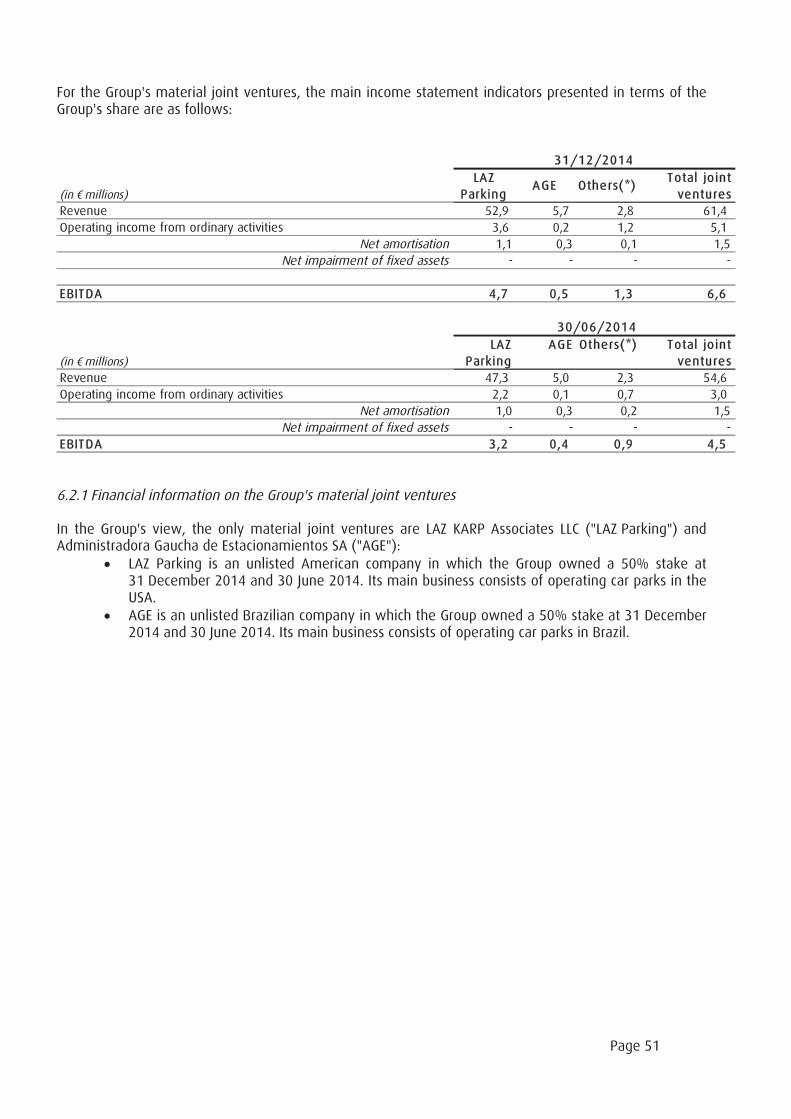
Page 51
For the Group's material joint ventures, the main income statement indicators presented in terms of theGroup's share are as follows:
(in millions)
LAZ
ParkingAGE Others(*)
Total joint
ventures
Revenue 52,9 5,7 2,8 61,4
Operating income from ordinary activities 3,6 0,2 1,2 5,1
Net amortisation 1,1 0,3 0,1 1,5
Net impairment of fixed assets - - - -
EBITDA 4,7 0,5 1,3 6,6
(in millions)
LAZ
Parking
AGE Others(*) Total joint
ventures
Revenue 47,3 5,0 2,3 54,6
Operating income from ordinary activities 2,2 0,1 0,7 3,0
Net amortisation 1,0 0,3 0,2 1,5
Net impairment of fixed assets - - - -
EBITDA 3,2 0,4 0,9 4,5
31/12/2014
30/06/2014
6.2.1 Financial information on the Group's material joint ventures
In the Group's view, the only material joint ventures are LAZ KARP Associates LLC ("LAZ Parking") andAdministradora Gaucha de Estacionamientos SA ("AGE"):
LAZ Parking is an unlisted American company in which the Group owned a 50% stake at31 December 2014 and 30 June 2014. Its main business consists of operating car parks in theUSA.AGE is an unlisted Brazilian company in which the Group owned a 50% stake at 31 December2014 and 30 June 2014. Its main business consists of operating car parks in Brazil.
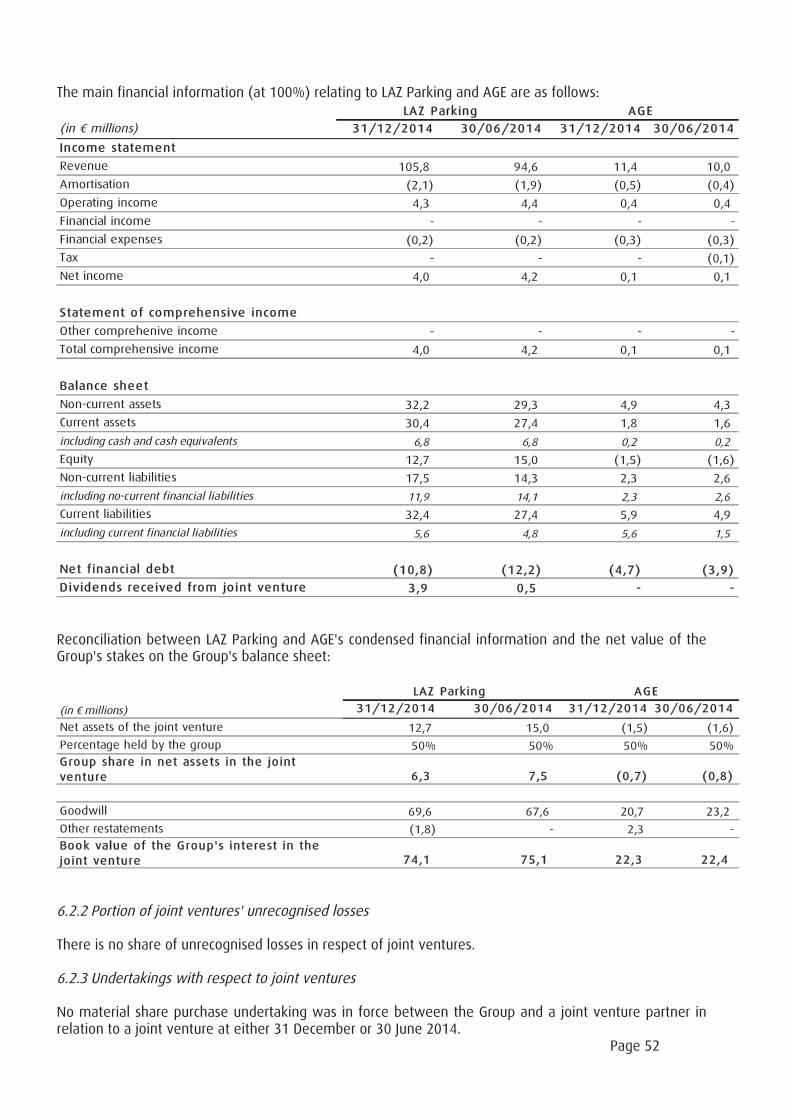
Page 52
The main financial information (at 100%) relating to LAZ Parking and AGE are as follows:
(in millions) 31/12/2014 30/06/2014 31/12/2014 30/06/2014
Income statement
Revenue 105,8 94,6 11,4 10,0
Amortisation (2,1) (1,9) (0,5) (0,4)
Operating income 4,3 4,4 0,4 0,4
Financial income - - - -
Financial expenses (0,2) (0,2) (0,3) (0,3)
Tax - - - (0,1)
Net income 4,0 4,2 0,1 0,1
Statement of comprehensive income
Other comprehenive income - - - -
Total comprehensive income 4,0 4,2 0,1 0,1
Balance sheet
Non-current assets 32,2 29,3 4,9 4,3
Current assets 30,4 27,4 1,8 1,6
including cash and cash equivalents 6,8 6,8 0,2 0,2
Equity 12,7 15,0 (1,5) (1,6)
Non-current liabilities 17,5 14,3 2,3 2,6
including no-current financial liabilities 11,9 14,1 2,3 2,6
Current liabilities 32,4 27,4 5,9 4,9
including current financial liabilities 5,6 4,8 5,6 1,5
Net financial debt (10,8) (12,2) (4,7) (3,9)
Dividends received from joint venture 3,9 0,5 - -
LAZ Parking AGE
Reconciliation between LAZ Parking and AGE's condensed financial information and the net value of theGroup's stakes on the Group's balance sheet:
(in millions) 31/12/2014 30/06/2014 31/12/2014 30/06/2014
Net assets of the joint venture 12,7 15,0 (1,5) (1,6)
Percentage held by the group 50% 50% 50% 50%
Group share in net assets in the joint
venture 6,3 7,5 (0,7) (0,8)
Goodwill 69,6 67,6 20,7 23,2
Other restatements (1,8) - 2,3 -
Book value of the Group's interest in the
joint venture 74,1 75,1 22,3 22,4
LAZ Parking AGE
6.2.2 Portion of joint ventures' unrecognised losses
There is no share of unrecognised losses in respect of joint ventures.
6.2.3 Undertakings with respect to joint ventures
No material share purchase undertaking was in force between the Group and a joint venture partner inrelation to a joint venture at either 31 December or 30 June 2014.
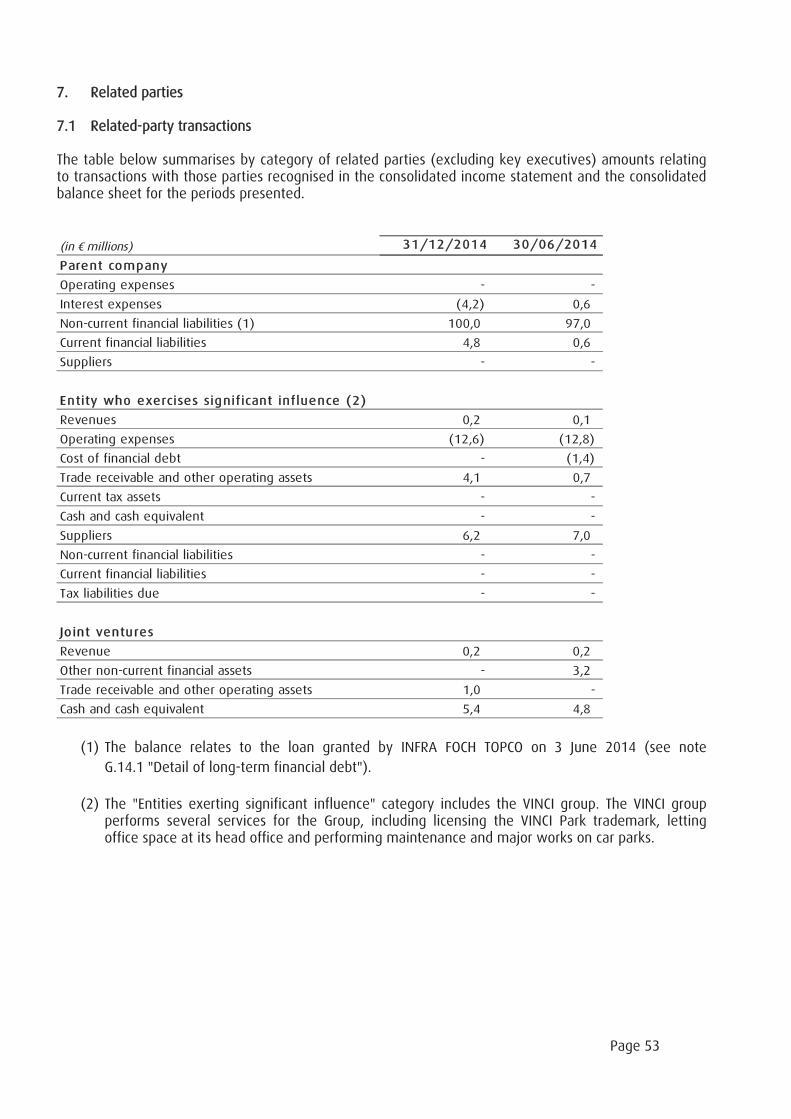
Page 53
7. Related parties
7.1 Related-party transactions
The table below summarises by category of related parties (excluding key executives) amounts relatingto transactions with those parties recognised in the consolidated income statement and the consolidatedbalance sheet for the periods presented.
(in millions) 31/12/2014 30/06/2014
Parent company
Operating expenses - -
Interest expenses (4,2) 0,6
Non-current financial liabilities (1) 100,0 97,0
Current financial liabilities 4,8 0,6
Suppliers - -
Entity who exercises significant influence (2)
Revenues 0,2 0,1
Operating expenses (12,6) (12,8)
Cost of financial debt - (1,4)
Trade receivable and other operating assets 4,1 0,7
Current tax assets - -
Cash and cash equivalent - -
Suppliers 6,2 7,0
Non-current financial liabilities - -
Current financial liabilities - -
Tax liabilities due - -
Jo int ventures
Revenue 0,2 0,2
Other non-current financial assets - 3,2
Trade receivable and other operating assets 1,0 -
Cash and cash equivalent 5,4 4,8
(1) The balance relates to the loan granted by INFRA FOCH TOPCO on 3 June 2014 (see note
G.14.1 "Detail of long-term financial debt").
(2) The "Entities exerting significant influence" category includes the VINCI group. The VINCI groupperforms several services for the Group, including licensing the VINCI Park trademark, lettingoffice space at its head office and performing maintenance and major works on car parks.
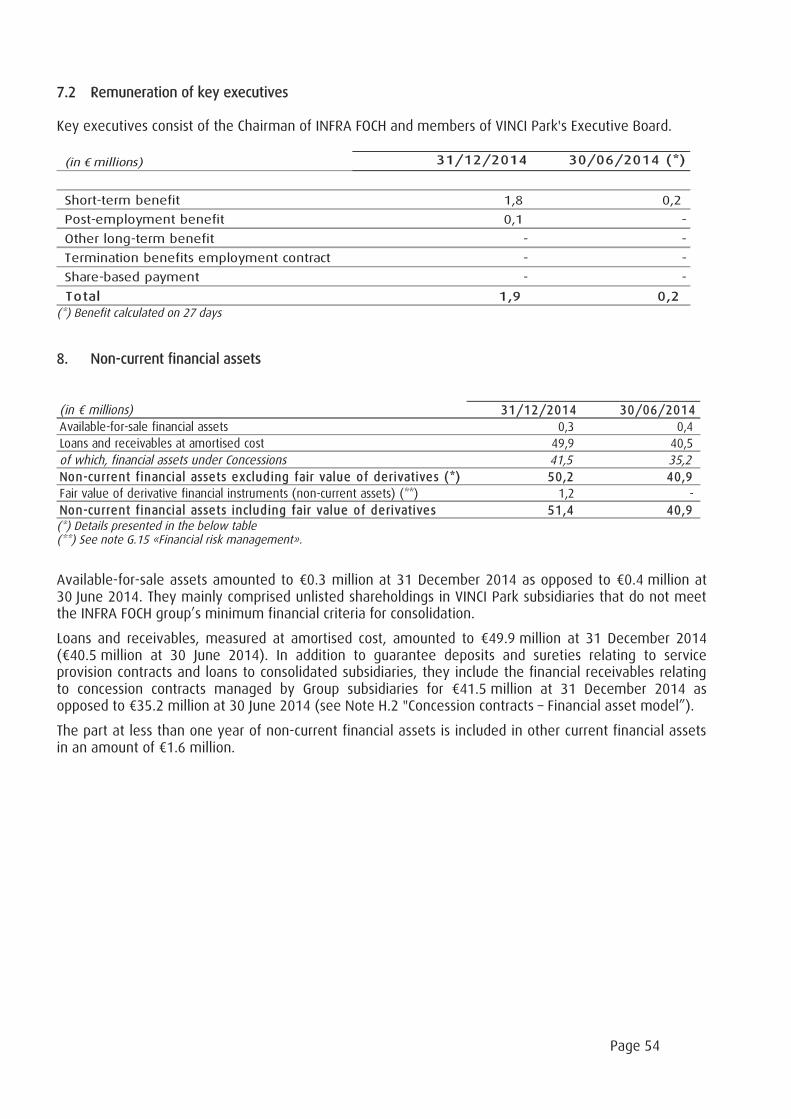
Page 54
7.2 Remuneration of key executives
Key executives consist of the Chairman of INFRA FOCH and members of VINCI Park's Executive Board.
(in millions) 31/12/2014 30/06/2014 (*)
Short-term benefit 1,8 0,2
Post-employment benefit 0,1 -
Other long-term benefit - -
Termination benefits employment contract - -
Share-based payment - -
Total 1,9 0,2
(*) Benefit calculated on 27 days
8. Non-current financial assets
(in millions) 31/12/2014 30/06/2014
Available-for-sale financial assets 0,3 0,4
Loans and receivables at amortised cost 49,9 40,5
of which, financial assets under Concessions 41,5 35,2Non-current financial assets excluding fair value of derivatives (*) 50,2 40,9
Fair value of derivative financial instruments (non-current assets) (**) 1,2 -
Non-current financial assets including fair value of derivatives 51,4 40,9(*) Details presented in the below table(**) See note G.15 «Financial risk management».
Available-for-sale assets amounted to 0.3 million at 31 December 2014 as opposed to 0.4 million at30 June 2014. They mainly comprised unlisted shareholdings in VINCI Park subsidiaries that do not meetthe INFRA FOCH group’s minimum financial criteria for consolidation.
Loans and receivables, measured at amortised cost, amounted to 49.9 million at 31 December 2014( 40.5 million at 30 June 2014). In addition to guarantee deposits and sureties relating to serviceprovision contracts and loans to consolidated subsidiaries, they include the financial receivables relatingto concession contracts managed by Group subsidiaries for 41.5 million at 31 December 2014 asopposed to 35.2 million at 30 June 2014 (see Note H.2 "Concession contracts – Financial asset model”).
The part at less than one year of non-current financial assets is included in other current financial assetsin an amount of 1.6 million.
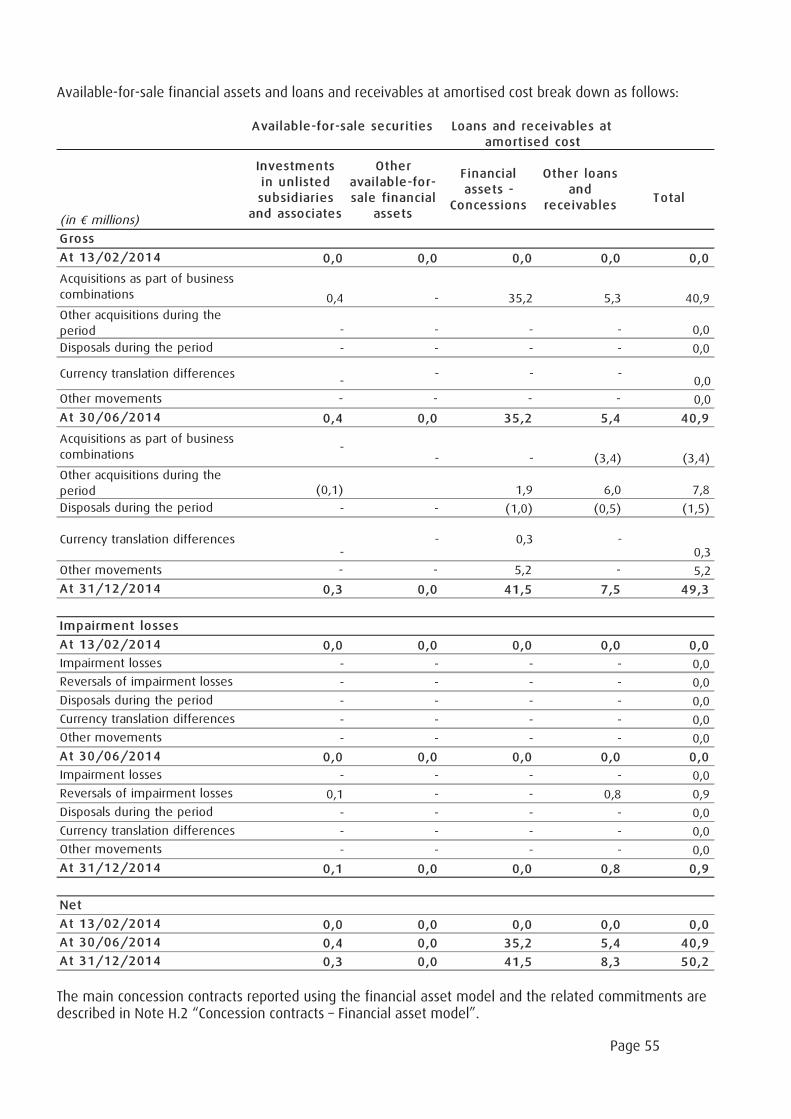
Page 55
Available-for-sale financial assets and loans and receivables at amortised cost break down as follows:
(in millions)
Investments
in unlisted
subsidiaries
and associates
Other
available-for-
sale financial
assets
F inancial
assets -
Concessions
Other loans
and
receivablesTotal
Gross
At 13/02/2014 0,0 0,0 0,0 0,0 0,0
Acquisitions as part of business
combinations 0,4 - 35,2 5,3 40,9
Other acquisitions during the
period - - - - 0,0
Disposals during the period - - - - 0,0
Currency translation differences-
- - -0,0
Other movements - - - - 0,0
At 30/06/2014 0,4 0,0 35,2 5,4 40,9
Acquisitions as part of business
combinations-
- - (3,4) (3,4)
Other acquisitions during the
period (0,1) 1,9 6,0 7,8
Disposals during the period - - (1,0) (0,5) (1,5)
Currency translation differences-
- 0,3 -0,3
Other movements - - 5,2 - 5,2
At 31/12/2014 0,3 0,0 41,5 7,5 49,3
Impairment losses
At 13/02/2014 0,0 0,0 0,0 0,0 0,0
Impairment losses - - - - 0,0
Reversals of impairment losses - - - - 0,0
Disposals during the period - - - - 0,0
Currency translation differences - - - - 0,0
Other movements - - - - 0,0
At 30/06/2014 0,0 0,0 0,0 0,0 0,0
Impairment losses - - - - 0,0
Reversals of impairment losses 0,1 - - 0,8 0,9
Disposals during the period - - - - 0,0
Currency translation differences - - - - 0,0
Other movements - - - - 0,0
At 31/12/2014 0,1 0,0 0,0 0,8 0,9
Net
At 13/02/2014 0,0 0,0 0,0 0,0 0,0
At 30/06/2014 0,4 0,0 35,2 5,4 40,9
At 31/12/2014 0,3 0,0 41,5 8,3 50,2
Available-for-sale securities Loans and receivables at
amortised cost
The main concession contracts reported using the financial asset model and the related commitments aredescribed in Note H.2 “Concession contracts – Financial asset model”.
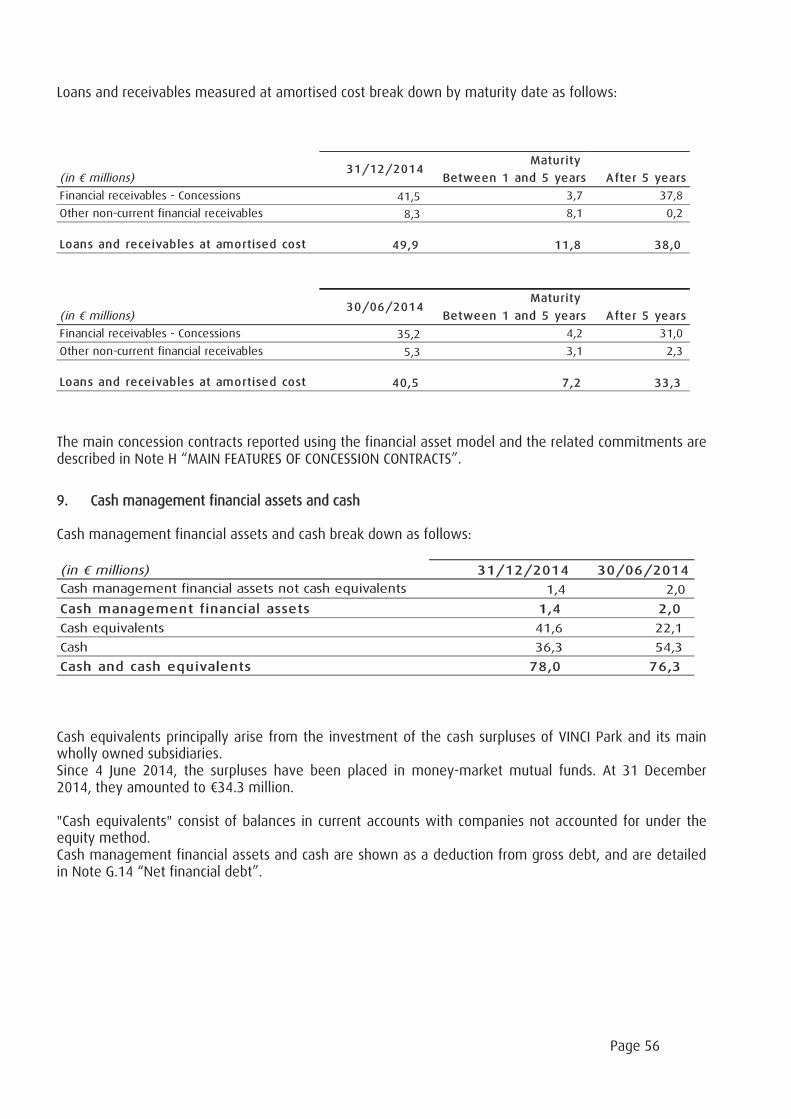
Page 56
Loans and receivables measured at amortised cost break down by maturity date as follows:
(in millions) Between 1 and 5 years After 5 years
Financial receivables - Concessions 41,5 3,7 37,8
Other non-current financial receivables 8,3 8,1 0,2
Loans and receivables at amortised cost 49,9 11,8 38,0
(in millions) Between 1 and 5 years After 5 years
Financial receivables - Concessions 35,2 4,2 31,0
Other non-current financial receivables 5,3 3,1 2,3
Loans and receivables at amortised cost 40,5 7,2 33,3
Maturity
31/12/2014
30/06/2014
Maturity
The main concession contracts reported using the financial asset model and the related commitments aredescribed in Note H “MAIN FEATURES OF CONCESSION CONTRACTS”.
9. Cash management financial assets and cash
Cash management financial assets and cash break down as follows:
(in millions) 31/12/2014 30/06/2014
Cash management financial assets not cash equivalents 1,4 2,0
Cash management financial assets 1,4 2,0
Cash equivalents 41,6 22,1
Cash 36,3 54,3
Cash and cash equivalents 78,0 76,3
Cash equivalents principally arise from the investment of the cash surpluses of VINCI Park and its mainwholly owned subsidiaries.Since 4 June 2014, the surpluses have been placed in money-market mutual funds. At 31 December2014, they amounted to 34.3 million.
"Cash equivalents" consist of balances in current accounts with companies not accounted for under theequity method.Cash management financial assets and cash are shown as a deduction from gross debt, and are detailedin Note G.14 “Net financial debt”.
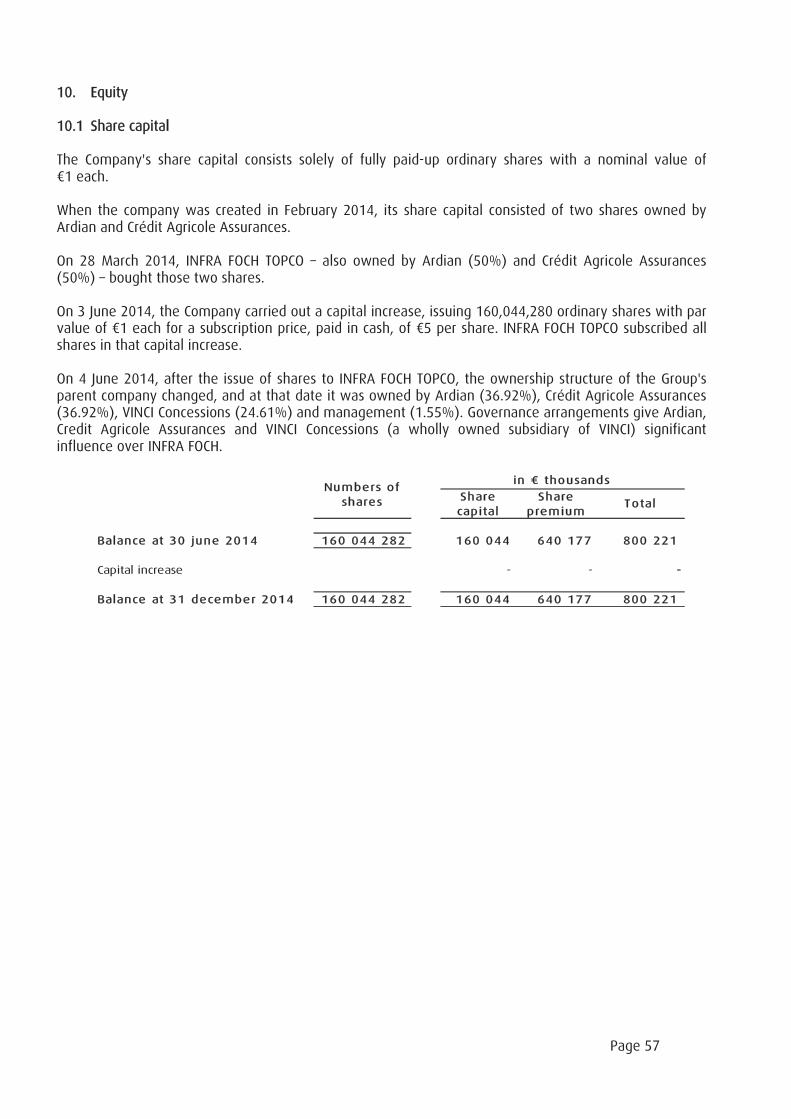
Page 57
10. Equity
10.1 Share capital
The Company's share capital consists solely of fully paid-up ordinary shares with a nominal value of1 each.
When the company was created in February 2014, its share capital consisted of two shares owned byArdian and Crédit Agricole Assurances.
On 28 March 2014, INFRA FOCH TOPCO – also owned by Ardian (50%) and Crédit Agricole Assurances(50%) – bought those two shares.
On 3 June 2014, the Company carried out a capital increase, issuing 160,044,280 ordinary shares with parvalue of 1 each for a subscription price, paid in cash, of 5 per share. INFRA FOCH TOPCO subscribed allshares in that capital increase.
On 4 June 2014, after the issue of shares to INFRA FOCH TOPCO, the ownership structure of the Group'sparent company changed, and at that date it was owned by Ardian (36.92%), Crédit Agricole Assurances(36.92%), VINCI Concessions (24.61%) and management (1.55%). Governance arrangements give Ardian,Credit Agricole Assurances and VINCI Concessions (a wholly owned subsidiary of VINCI) significantinfluence over INFRA FOCH.
Share
capital
Share
premiumTotal
Balance at 30 june 2014 160 044 282 160 044 640 177 800 221
Capital increase - - -
Balance at 31 december 2014 160 044 282 160 044 640 177 800 221
Numbers of
shares
in thousands
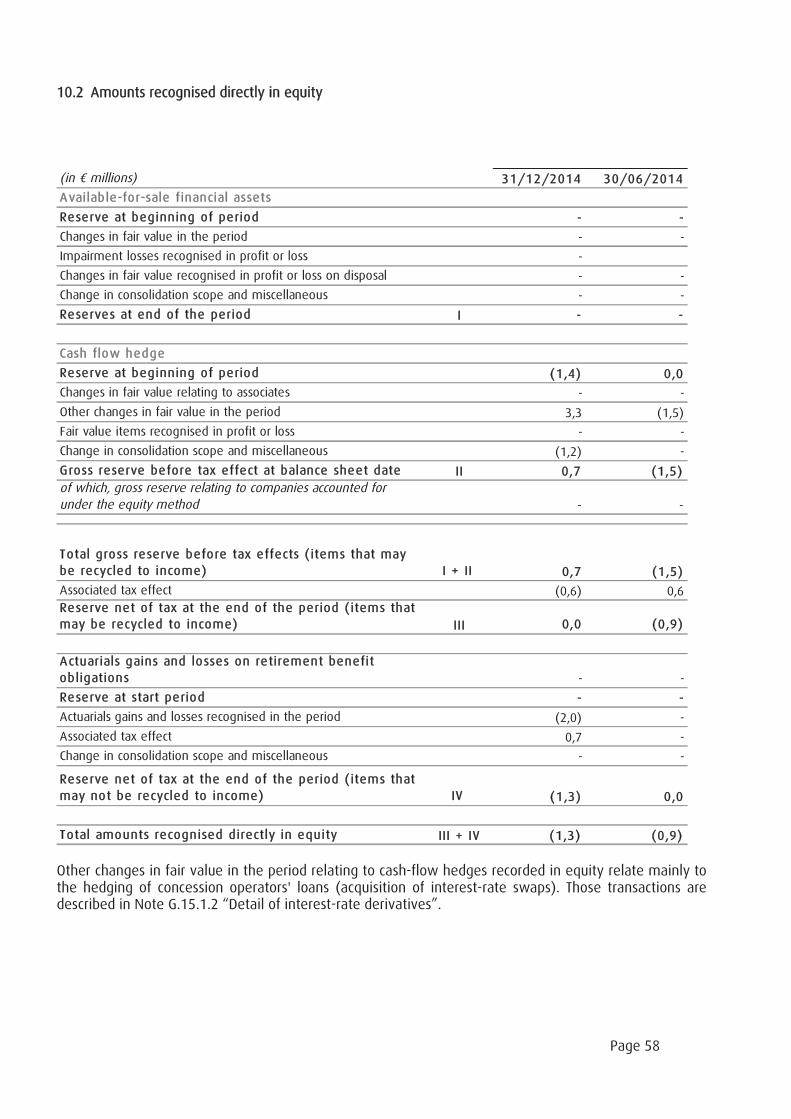
Page 58
10.2 Amounts recognised directly in equity
(in millions) 31/12/2014 30/06/2014
Available-for-sale financial assets
Reserve at beginning of period - -
Changes in fair value in the period - -
Impairment losses recognised in profit or loss -
Changes in fair value recognised in profit or loss on disposal - -
Change in consolidation scope and miscellaneous - -
Reserves at end of the period I - -
Cash flow hedge
Reserve at beginning of period (1,4) 0,0
Changes in fair value relating to associates - -
Other changes in fair value in the period 3,3 (1,5)
Fair value items recognised in profit or loss - -
Change in consolidation scope and miscellaneous (1,2) -
Gross reserve before tax effect at balance sheet date II 0,7 (1,5)
of which, gross reserve relating to companies accounted forunder the equity method - -
Total gross reserve before tax effects ( items that may
be recycled to income) I + II 0,7 (1,5)
Associated tax effect (0,6) 0,6
Reserve net of tax at the end of the period ( items that
may be recycled to income) III 0,0 (0,9)
Actuarials gains and losses on retirement benefit
obligations - -
Reserve at start period - -
Actuarials gains and losses recognised in the period (2,0) -
Associated tax effect 0,7 -
Change in consolidation scope and miscellaneous - -
Reserve net of tax at the end of the period ( items that
may not be recycled to income) IV (1,3) 0,0
Total amounts recognised directly in equity III + IV (1,3) (0,9)
Other changes in fair value in the period relating to cash-flow hedges recorded in equity relate mainly tothe hedging of concession operators' loans (acquisition of interest-rate swaps). Those transactions aredescribed in Note G.15.1.2 “Detail of interest-rate derivatives”.
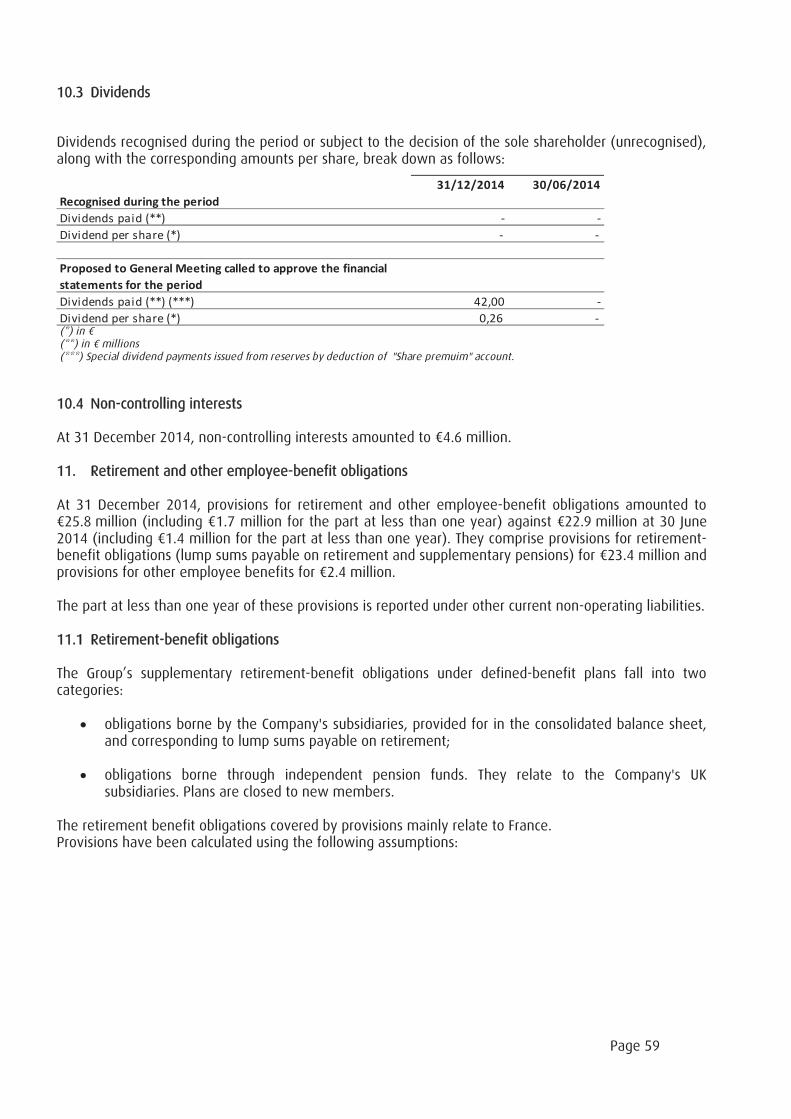
Page 59
10.3 Dividends
Dividends recognised during the period or subject to the decision of the sole shareholder (unrecognised),along with the corresponding amounts per share, break down as follows:
31/12/2014 30/06/2014
Recognised during the period
Dividends paid (**) - -
Dividend per share (*) - -
Proposed to General Meeting called to approve the financial
statements for the period
Dividends paid (**) (***) 42,00 -
Dividend per share (*) 0,26 -(*) in(**) in millions(***) Special dividend payments issued from reserves by deduction of "Share premuim" account.
10.4 Non-controlling interests
At 31 December 2014, non-controlling interests amounted to 4.6 million.
11. Retirement and other employee-benefit obligations
At 31 December 2014, provisions for retirement and other employee-benefit obligations amounted to25.8 million (including 1.7 million for the part at less than one year) against 22.9 million at 30 June
2014 (including 1.4 million for the part at less than one year). They comprise provisions for retirement-benefit obligations (lump sums payable on retirement and supplementary pensions) for 23.4 million andprovisions for other employee benefits for 2.4 million.
The part at less than one year of these provisions is reported under other current non-operating liabilities.
11.1 Retirement-benefit obligations
The Group’s supplementary retirement-benefit obligations under defined-benefit plans fall into twocategories:
obligations borne by the Company's subsidiaries, provided for in the consolidated balance sheet,and corresponding to lump sums payable on retirement;
obligations borne through independent pension funds. They relate to the Company's UKsubsidiaries. Plans are closed to new members.
The retirement benefit obligations covered by provisions mainly relate to France.Provisions have been calculated using the following assumptions:
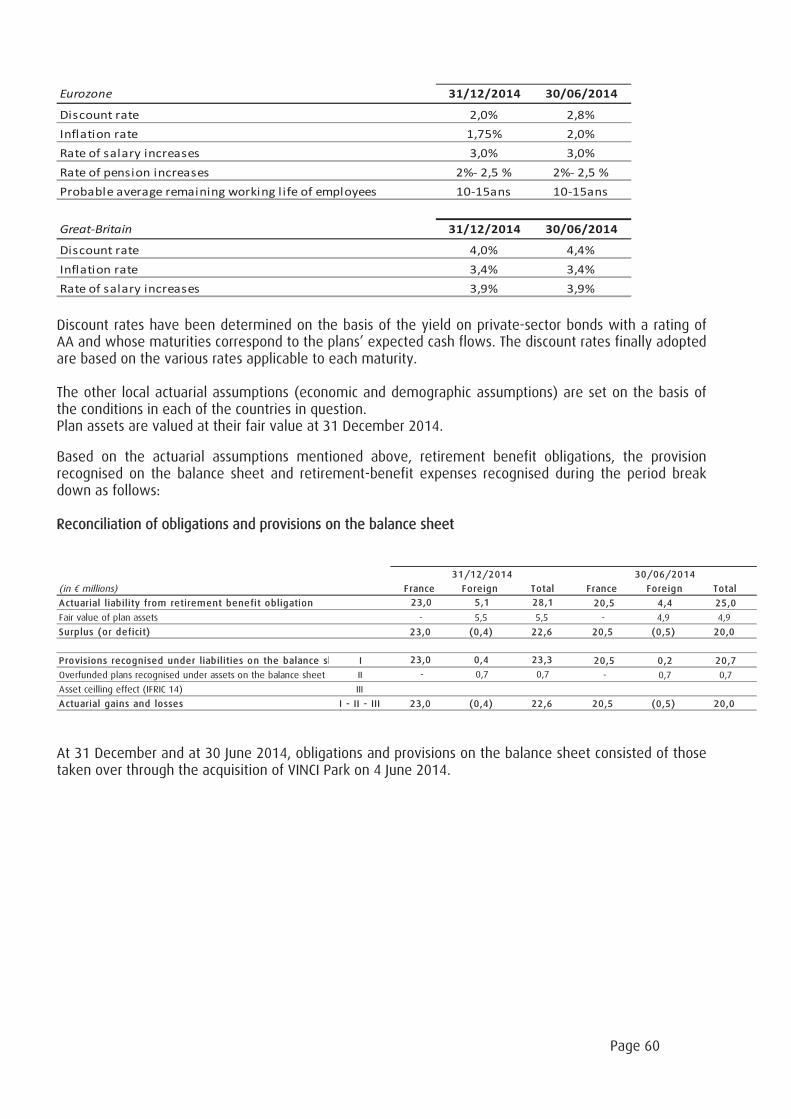
Page 60
Eurozone 31/12/2014 30/06/2014
Discount rate 2,0% 2,8%
Inflation rate 1,75% 2,0%
Rate of salary increases 3,0% 3,0%
Rate of pension increases 2%- 2,5 % 2%- 2,5 %
Probable average remaining working life of employees 10-15ans 10-15ans
Great-Britain 31/12/2014 30/06/2014
Discount rate 4,0% 4,4%
Inflation rate 3,4% 3,4%
Rate of salary increases 3,9% 3,9%
Discount rates have been determined on the basis of the yield on private-sector bonds with a rating ofAA and whose maturities correspond to the plans’ expected cash flows. The discount rates finally adoptedare based on the various rates applicable to each maturity.
The other local actuarial assumptions (economic and demographic assumptions) are set on the basis ofthe conditions in each of the countries in question.Plan assets are valued at their fair value at 31 December 2014.
Based on the actuarial assumptions mentioned above, retirement benefit obligations, the provisionrecognised on the balance sheet and retirement-benefit expenses recognised during the period breakdown as follows:
Reconciliation of obligations and provisions on the balance sheet
France Foreign Total F rance Foreign Total
Actuarial liability from retirement benefit obligation 23,0 5,1 28,1 20,5 4,4 25,0
Fair value of plan assets - 5,5 5,5 - 4,9 4,9
Surplus (or deficit) 23,0 (0,4) 22,6 20,5 (0,5) 20,0
Provisions recognised under liabilities on the balance sh I 23,0 0,4 23,3 20,5 0,2 20,7
Overfunded plans recognised under assets on the balance sheet II - 0,7 0,7 - 0,7 0,7
Asset ceilling effect (IFRIC 14) III
Actuarial gains and losses I - II - III 23,0 (0,4) 22,6 20,5 (0,5) 20,0
30/06/2014
(in millions)
31/12/2014
At 31 December and at 30 June 2014, obligations and provisions on the balance sheet consisted of thosetaken over through the acquisition of VINCI Park on 4 June 2014.
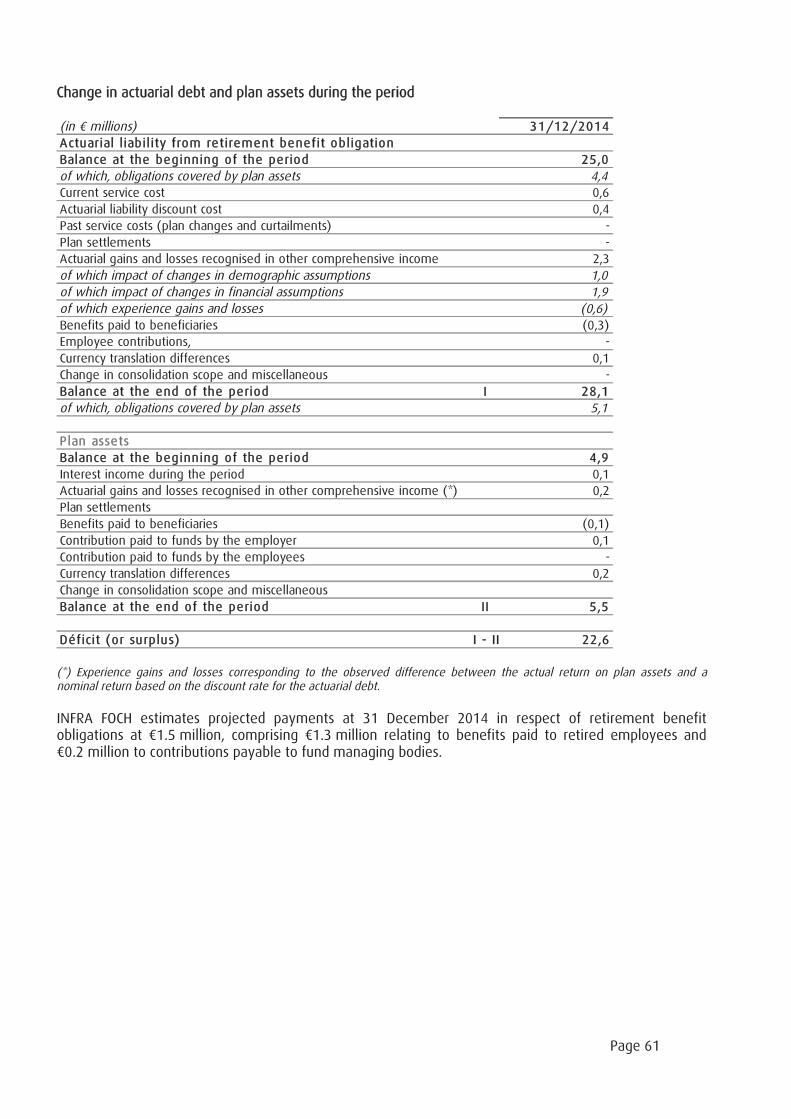
Page 61
Change in actuarial debt and plan assets during the period
(in millions) 31/12/2014
Actuarial liability from retirement benefit obligation
Balance at the beginning of the period 25,0
of which, obligations covered by plan assets 4,4Current service cost 0,6
Actuarial liability discount cost 0,4
Past service costs (plan changes and curtailments) -
Plan settlements -
Actuarial gains and losses recognised in other comprehensive income 2,3
of which impact of changes in demographic assumptions 1,0of which impact of changes in financial assumptions 1,9of which experience gains and losses (0,6)Benefits paid to beneficiaries (0,3)
Employee contributions, -
Currency translation differences 0,1
Change in consolidation scope and miscellaneous -
Balance at the end of the period I 28,1
of which, obligations covered by plan assets 5,1
Plan assets
Balance at the beginning of the period 4,9
Interest income during the period 0,1
Actuarial gains and losses recognised in other comprehensive income (*) 0,2
Plan settlements
Benefits paid to beneficiaries (0,1)
Contribution paid to funds by the employer 0,1
Contribution paid to funds by the employees -
Currency translation differences 0,2
Change in consolidation scope and miscellaneous
Balance at the end of the period II 5,5
Déficit (or surplus) I - II 22,6
(*) Experience gains and losses corresponding to the observed difference between the actual return on plan assets and anominal return based on the discount rate for the actuarial debt.
INFRA FOCH estimates projected payments at 31 December 2014 in respect of retirement benefitobligations at 1.5 million, comprising 1.3 million relating to benefits paid to retired employees and0.2 million to contributions payable to fund managing bodies.
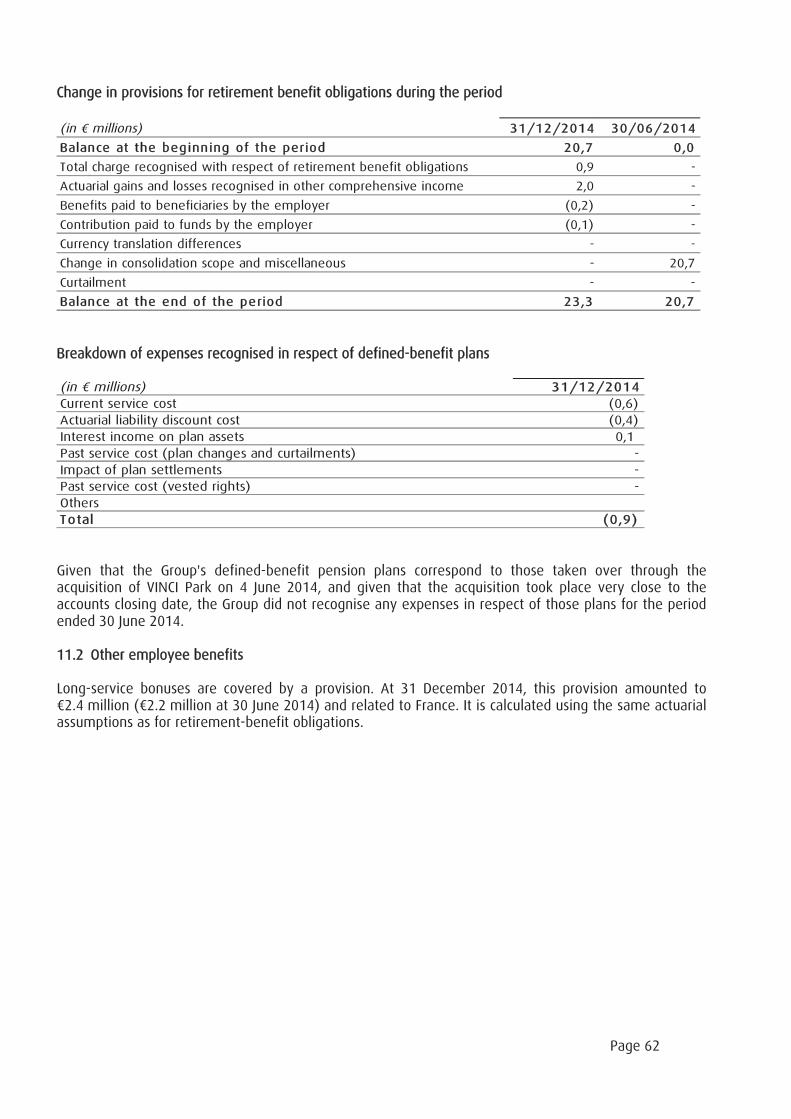
Page 62
Change in provisions for retirement benefit obligations during the period
(in millions) 31/12/2014 30/06/2014
Balance at the beginning of the period 20,7 0,0
Total charge recognised with respect of retirement benefit obligations 0,9 -
Actuarial gains and losses recognised in other comprehensive income 2,0 -
Benefits paid to beneficiaries by the employer (0,2) -
Contribution paid to funds by the employer (0,1) -
Currency translation differences - -
Change in consolidation scope and miscellaneous - 20,7
Curtailment - -
Balance at the end of the period 23,3 20,7
Breakdown of expenses recognised in respect of defined-benefit plans
(in millions) 31/12/2014
Current service cost (0,6)
Actuarial liability discount cost (0,4)
Interest income on plan assets 0,1
Past service cost (plan changes and curtailments) -
Impact of plan settlements -
Past service cost (vested rights) -
Others
Total (0,9)
Given that the Group's defined-benefit pension plans correspond to those taken over through theacquisition of VINCI Park on 4 June 2014, and given that the acquisition took place very close to theaccounts closing date, the Group did not recognise any expenses in respect of those plans for the periodended 30 June 2014.
11.2 Other employee benefits
Long-service bonuses are covered by a provision. At 31 December 2014, this provision amounted to2.4 million ( 2.2 million at 30 June 2014) and related to France. It is calculated using the same actuarial
assumptions as for retirement-benefit obligations.
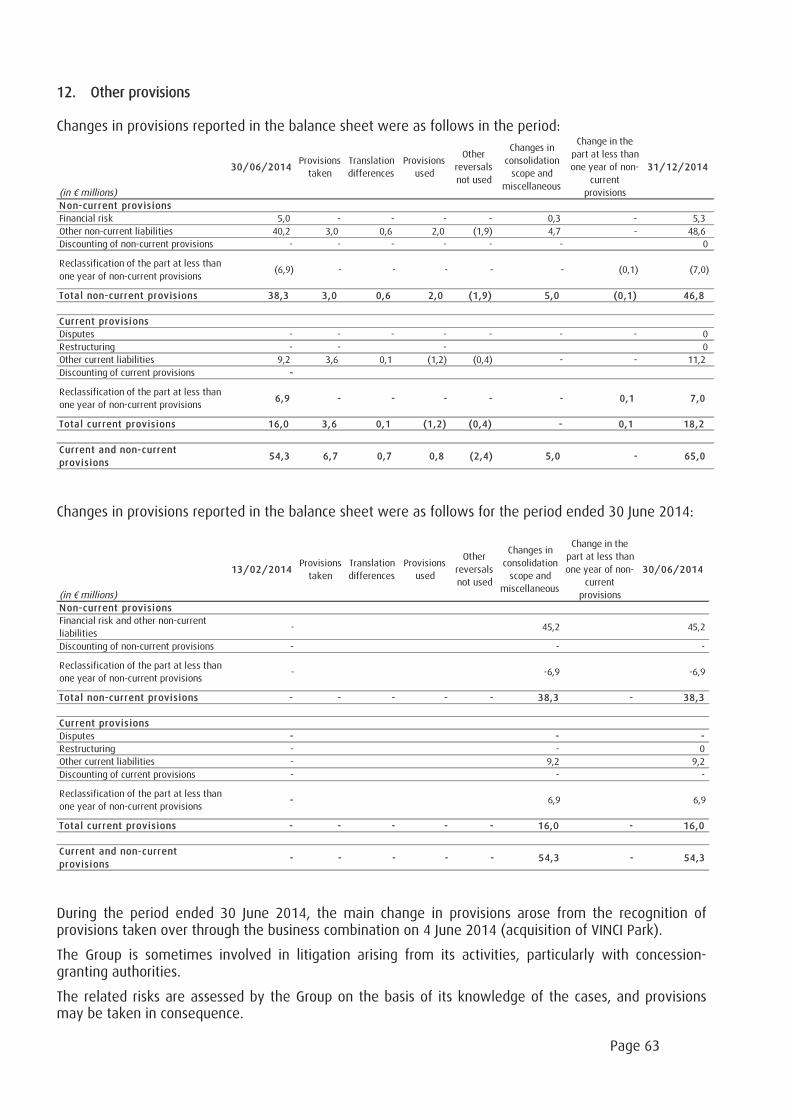
Page 63
12. Other provisions
Changes in provisions reported in the balance sheet were as follows in the period:
(in millions)
30/06/2014Provisions
taken
Translation
differences
Provisions
used
Other
reversals
not used
Changes in
consolidation
scope and
miscellaneous
Change in the
part at less than
one year of non-
current
provisions
31/12/2014
Non-current prov is ions
Financial risk 5,0 - - - - 0,3 - 5,3
Other non-current liabilities 40,2 3,0 0,6 2,0 (1,9) 4,7 - 48,6
Discounting of non-current provisions - - - - - - 0
Reclassification of the part at less than
one year of non-current provisions(6,9) - - - - - (0,1) (7,0)
Total non-current provis ions 38,3 3,0 0,6 2,0 (1,9) 5,0 (0,1) 46,8
Current provis ions
Disputes - - - - - - - 0
Restructuring - - - 0
Other current liabilities 9,2 3,6 0,1 (1,2) (0,4) - - 11,2
Discounting of current provisions -
Reclassification of the part at less than
one year of non-current provisions6,9 - - - - - 0,1 7,0
Total current provis ions 16,0 3,6 0,1 (1,2) (0,4) - 0,1 18,2
Current and non-current
provis ions54,3 6,7 0,7 0,8 (2,4) 5,0 - 65,0
Changes in provisions reported in the balance sheet were as follows for the period ended 30 June 2014:
(in millions)
13/02/2014Provisions
taken
Translation
differences
Provisions
used
Other
reversals
not used
Changes in
consolidation
scope and
miscellaneous
Change in the
part at less than
one year of non-
current
provisions
30/06/2014
Non-current provisions
Financial risk and other non-current
liabilities- 45,2 45,2
Discounting of non-current provisions - - -
Reclassification of the part at less than
one year of non-current provisions- -6,9 -6,9
Total non-current provis ions - - - - - 38,3 - 38,3
Current provis ions
Disputes - - -
Restructuring - - 0
Other current liabilities - 9,2 9,2
Discounting of current provisions - - -
Reclassification of the part at less than
one year of non-current provisions- 6,9 6,9
Total current provis ions - - - - - 16,0 - 16,0
Current and non-current
provis ions- - - - - 54,3 - 54,3
During the period ended 30 June 2014, the main change in provisions arose from the recognition ofprovisions taken over through the business combination on 4 June 2014 (acquisition of VINCI Park).
The Group is sometimes involved in litigation arising from its activities, particularly with concession-granting authorities.
The related risks are assessed by the Group on the basis of its knowledge of the cases, and provisionsmay be taken in consequence.
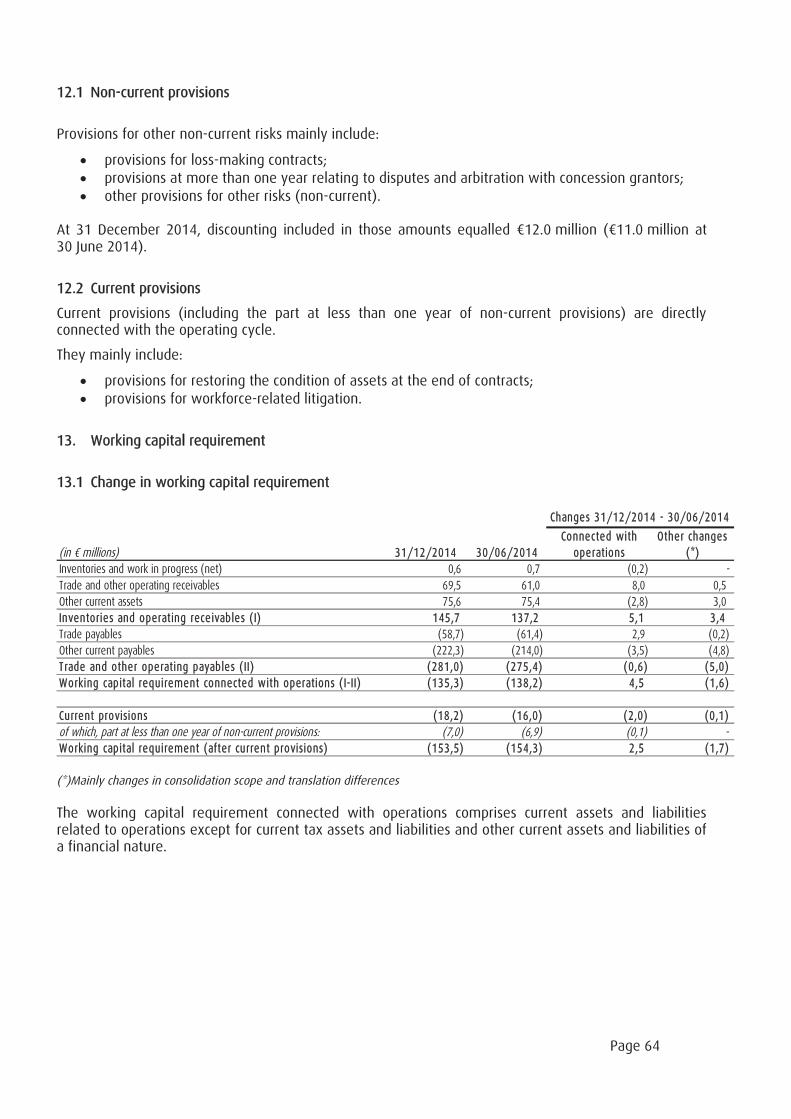
Page 64
12.1 Non-current provisions
Provisions for other non-current risks mainly include:
provisions for loss-making contracts;provisions at more than one year relating to disputes and arbitration with concession grantors;other provisions for other risks (non-current).
At 31 December 2014, discounting included in those amounts equalled 12.0 million ( 11.0 million at30 June 2014).
12.2 Current provisions
Current provisions (including the part at less than one year of non-current provisions) are directlyconnected with the operating cycle.
They mainly include:
provisions for restoring the condition of assets at the end of contracts;provisions for workforce-related litigation.
13. Working capital requirement
13.1 Change in working capital requirement
(in millions) 31/12/2014 30/06/2014
Connected with
operations
Other changes
(*)
Inventories and work in progress (net) 0,6 0,7 (0,2) -
Trade and other operating receivables 69,5 61,0 8,0 0,5
Other current assets 75,6 75,4 (2,8) 3,0
Inventories and operating receivables (I) 145,7 137,2 5,1 3,4
Trade payables (58,7) (61,4) 2,9 (0,2)
Other current payables (222,3) (214,0) (3,5) (4,8)
Trade and other operating payables (II) (281,0) (275,4) (0,6) (5,0)
Working capital requirement connected with operations (I-II) (135,3) (138,2) 4,5 (1,6)
Current provisions (18,2) (16,0) (2,0) (0,1)
of which, part at less than one year of non-current provisions: (7,0) (6,9) (0,1) -Working capital requirement (after current provisions) (153,5) (154,3) 2,5 (1,7)
Changes 31/12/2014 - 30/06/2014
(*)Mainly changes in consolidation scope and translation differences
The working capital requirement connected with operations comprises current assets and liabilitiesrelated to operations except for current tax assets and liabilities and other current assets and liabilities ofa financial nature.
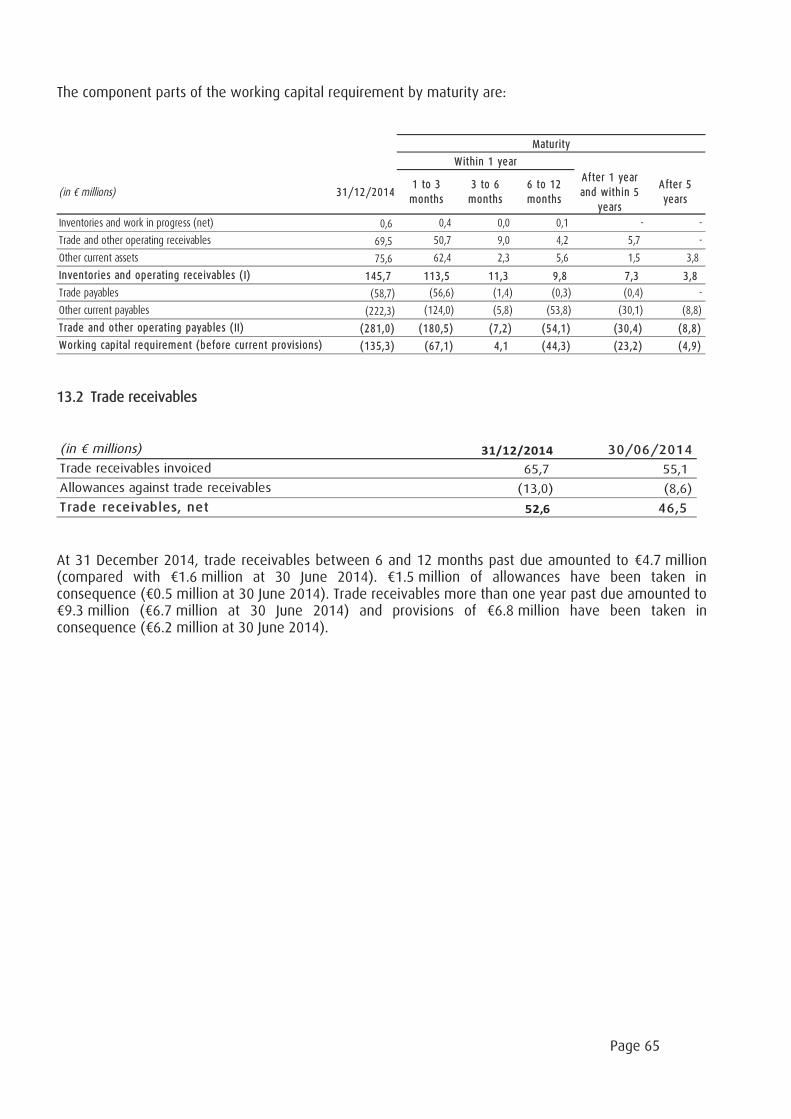
Page 65
The component parts of the working capital requirement by maturity are:
(in millions) 31/12/20141 to 3
months
3 to 6
months
6 to 12
months
After 1 year
and within 5
years
After 5
years
Inventories and work in progress (net) 0,6 0,4 0,0 0,1 - -
Trade and other operating receivables 69,5 50,7 9,0 4,2 5,7 -
Other current assets 75,6 62,4 2,3 5,6 1,5 3,8
Inventories and operating receivables ( I) 145,7 113,5 11,3 9,8 7,3 3,8
Trade payables (58,7) (56,6) (1,4) (0,3) (0,4) -
Other current payables (222,3) (124,0) (5,8) (53,8) (30,1) (8,8)
Trade and other operating payables ( II) (281,0) (180,5) (7,2) (54,1) (30,4) (8,8)
Working capital requirement (before current provisions) ( (135,3) (67,1) 4,1 (44,3) (23,2) (4,9)
Maturity
Within 1 year
13.2 Trade receivables
(in millions) 31/12/2014 30/06/2014
Trade receivables invoiced 65,7 55,1
Allowances against trade receivables (13,0) (8,6)
T rade receivables, net 52,6 46,5
At 31 December 2014, trade receivables between 6 and 12 months past due amounted to 4.7 million(compared with 1.6 million at 30 June 2014). 1.5 million of allowances have been taken inconsequence ( 0.5 million at 30 June 2014). Trade receivables more than one year past due amounted to9.3 million ( 6.7 million at 30 June 2014) and provisions of 6.8 million have been taken in
consequence ( 6.2 million at 30 June 2014).
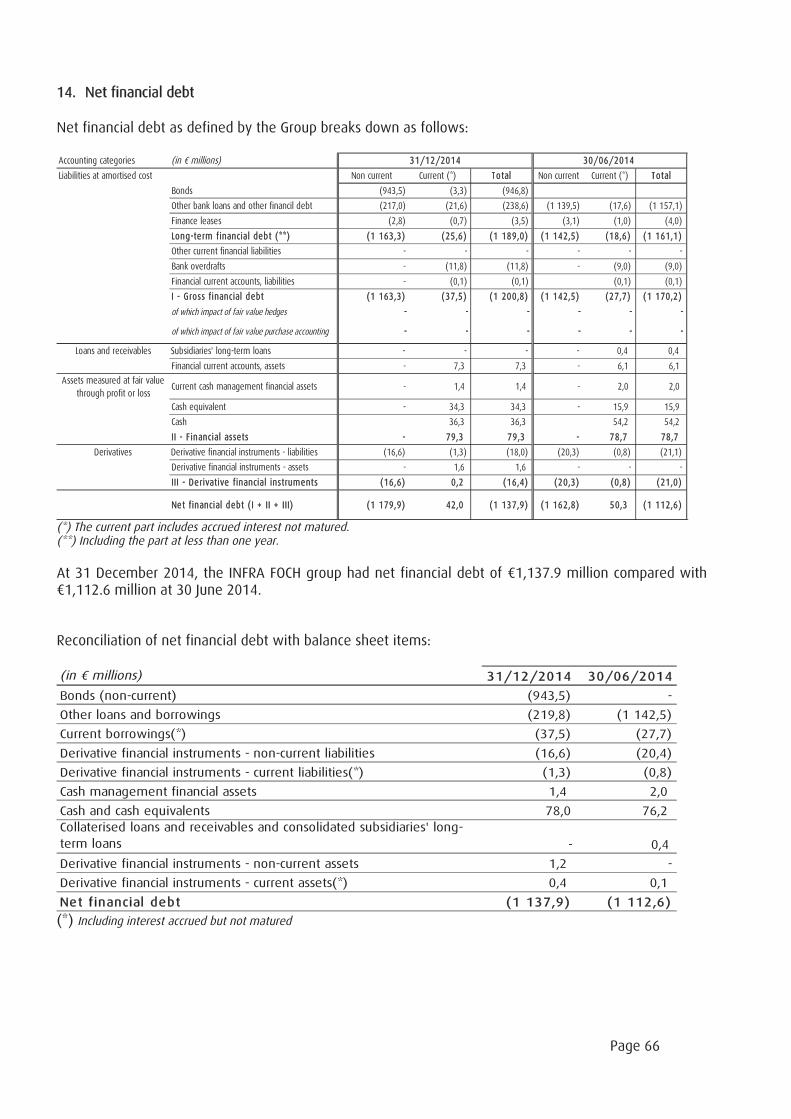
Page 66
14. Net financial debt
Net financial debt as defined by the Group breaks down as follows:
Accounting categories (in millions)
Liabilities at amortised cost Non current Current (*) Total Non current Current (*) Total
Bonds (943,5) (3,3) (946,8)
Other bank loans and other financil debt (217,0) (21,6) (238,6) (1 139,5) (17,6) (1 157,1)
Finance leases (2,8) (0,7) (3,5) (3,1) (1,0) (4,0)
Long-term financial debt (**) (1 163,3) (25,6) (1 189,0) (1 142,5) (18,6) (1 161,1)
Other current financial liabilities - - - - - -
Bank overdrafts - (11,8) (11,8) - (9,0) (9,0)
Financial current accounts, liabilities - (0,1) (0,1) (0,1) (0,1)
I - Gross financial debt (1 163,3) (37,5) (1 200,8) (1 142,5) (27,7) (1 170,2)
of which impact of fair value hedges - - - - - -
of which impact of fair value purchase accounting - - - - - -
Loans and receivables Subsidiaries' long-term loans - - - - 0,4 0,4
Financial current accounts, assets - 7,3 7,3 - 6,1 6,1
Assets measured at fair value
through profit or lossCurrent cash management financial assets - 1,4 1,4 - 2,0 2,0
Cash equivalent - 34,3 34,3 - 15,9 15,9
Cash 36,3 36,3 54,2 54,2
II - F inancial assets - 79,3 79,3 - 78,7 78,7
Derivatives Derivative financial instruments - liabilities (16,6) (1,3) (18,0) (20,3) (0,8) (21,1)
Derivative financial instruments - assets - 1,6 1,6 - - -
III - Derivative financial instruments (16,6) 0,2 (16,4) (20,3) (0,8) (21,0)
Net financial debt (I + II + III) (1 179,9) 42,0 (1 137,9) (1 162,8) 50,3 (1 112,6)
31/12/2014 30/06/2014
(*) The current part includes accrued interest not matured.(**) Including the part at less than one year.
At 31 December 2014, the INFRA FOCH group had net financial debt of 1,137.9 million compared with1,112.6 million at 30 June 2014.
Reconciliation of net financial debt with balance sheet items:
(in millions) 31/12/2014 30/06/2014
Bonds (non-current) (943,5) -
Other loans and borrowings (219,8) (1 142,5)
Current borrowings(*) (37,5) (27,7)
Derivative financial instruments - non-current liabilities (16,6) (20,4)
Derivative financial instruments - current liabilities(*) (1,3) (0,8)
Cash management financial assets 1,4 2,0
Cash and cash equivalents 78,0 76,2
Collaterised loans and receivables and consolidated subsidiaries' long-
term loans - 0,4
Derivative financial instruments - non-current assets 1,2 -
Derivative financial instruments - current assets(*) 0,4 0,1
Net financial debt (1 137,9) (1 112,6)
(*) Including interest accrued but not matured
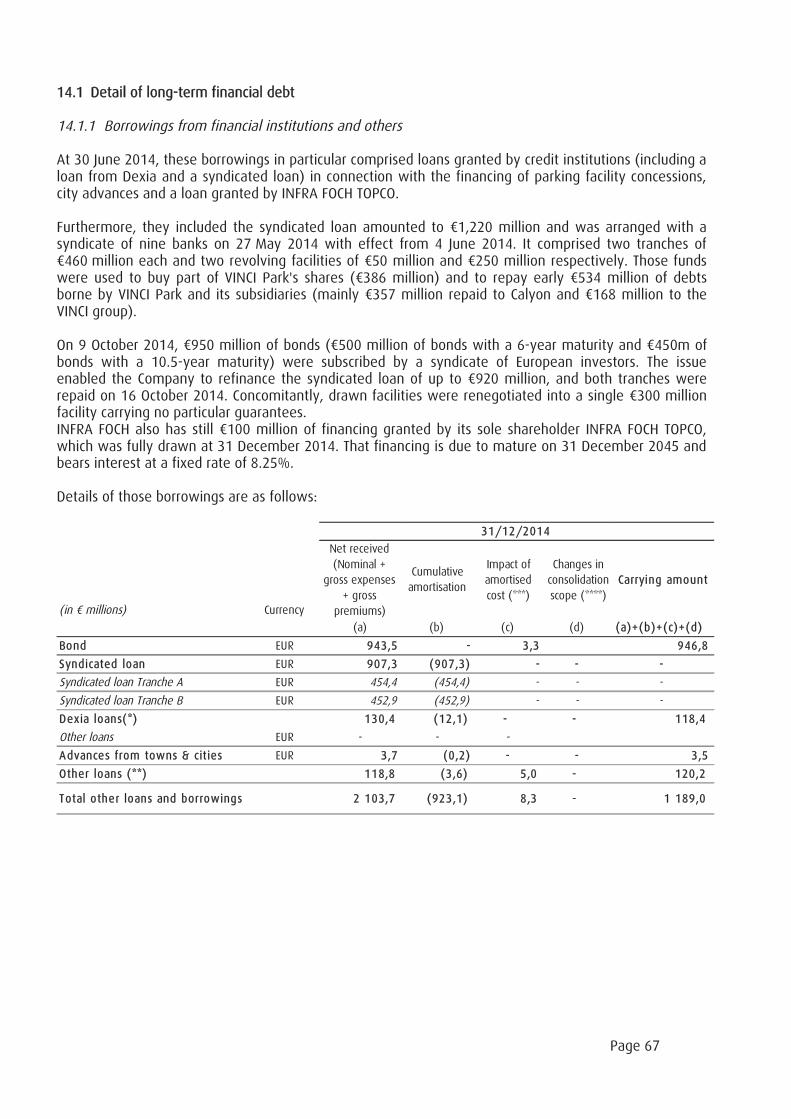
Page 67
14.1 Detail of long-term financial debt
14.1.1 Borrowings from financial institutions and others
At 30 June 2014, these borrowings in particular comprised loans granted by credit institutions (including aloan from Dexia and a syndicated loan) in connection with the financing of parking facility concessions,city advances and a loan granted by INFRA FOCH TOPCO.
Furthermore, they included the syndicated loan amounted to 1,220 million and was arranged with asyndicate of nine banks on 27 May 2014 with effect from 4 June 2014. It comprised two tranches of460 million each and two revolving facilities of 50 million and 250 million respectively. Those funds
were used to buy part of VINCI Park's shares ( 386 million) and to repay early 534 million of debtsborne by VINCI Park and its subsidiaries (mainly 357 million repaid to Calyon and 168 million to theVINCI group).
On 9 October 2014, 950 million of bonds ( 500 million of bonds with a 6-year maturity and 450m ofbonds with a 10.5-year maturity) were subscribed by a syndicate of European investors. The issueenabled the Company to refinance the syndicated loan of up to 920 million, and both tranches wererepaid on 16 October 2014. Concomitantly, drawn facilities were renegotiated into a single 300 millionfacility carrying no particular guarantees.INFRA FOCH also has still 100 million of financing granted by its sole shareholder INFRA FOCH TOPCO,which was fully drawn at 31 December 2014. That financing is due to mature on 31 December 2045 andbears interest at a fixed rate of 8.25%.
Details of those borrowings are as follows:
Net received
(Nominal +
gross expenses
+ gross
premiums)
Cumulative
amortisation
Impact of
amortised
cost (***)
Changes in
consolidation
scope (****)
Carrying amount
(a) (b) (c) (d) (a)+(b)+(c)+(d)
Bond EUR 943,5 - 3,3 946,8
Syndicated loan EUR 907,3 (907,3) - - -
Syndicated loan Tranche A EUR 454,4 (454,4) - - -
Syndicated loan Tranche B EUR 452,9 (452,9) - - -
Dexia loans(*) 130,4 (12,1) - - 118,4
Other loans EUR - - -
Advances from towns & cities EUR 3,7 (0,2) - - 3,5
Other loans (**) 118,8 (3,6) 5,0 - 120,2
Total other loans and borrowings 2 103,7 (923,1) 8,3 - 1 189,0
(in millions) Currency
31/12/2014
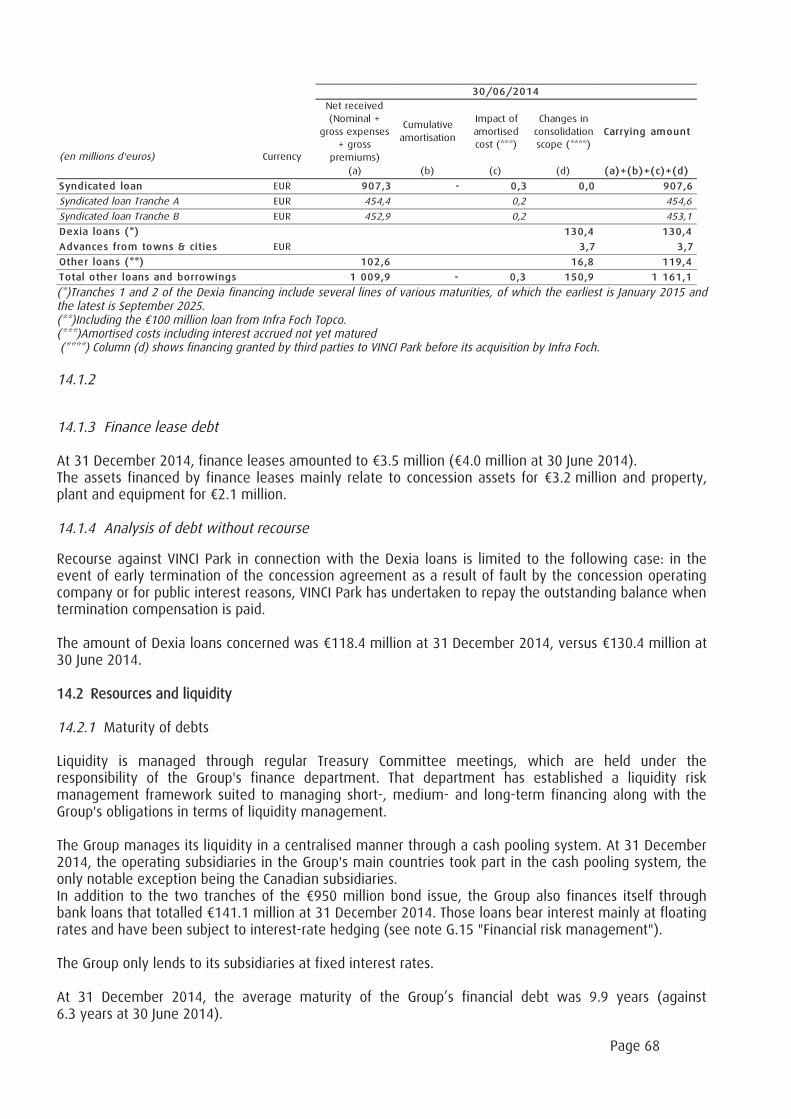
Page 68
Net received
(Nominal +
gross expenses
+ gross
premiums)
Cumulative
amortisation
Impact of
amortised
cost (***)
Changes in
consolidation
scope (****)
Carrying amount
(a) (b) (c) (d) (a)+(b)+(c)+(d)
Syndicated loan EUR 907,3 - 0,3 0,0 907,6
Syndicated loan Tranche A EUR 454,4 0,2 454,6
Syndicated loan Tranche B EUR 452,9 0,2 453,1
Dexia loans (*) 130,4 130,4
Advances from towns & cities EUR 3,7 3,7
Other loans (**) 102,6 16,8 119,4
Total other loans and borrowings 1 009,9 - 0,3 150,9 1 161,1
(en millions d'euros) Currency
30/06/2014
(*)Tranches 1 and 2 of the Dexia financing include several lines of various maturities, of which the earliest is January 2015 andthe latest is September 2025.(**)Including the 100 million loan from Infra Foch Topco.(***)Amortised costs including interest accrued not yet matured(****) Column (d) shows financing granted by third parties to VINCI Park before its acquisition by Infra Foch.
14.1.2
14.1.3 Finance lease debt
At 31 December 2014, finance leases amounted to 3.5 million ( 4.0 million at 30 June 2014).The assets financed by finance leases mainly relate to concession assets for 3.2 million and property,plant and equipment for 2.1 million.
14.1.4 Analysis of debt without recourse
Recourse against VINCI Park in connection with the Dexia loans is limited to the following case: in theevent of early termination of the concession agreement as a result of fault by the concession operatingcompany or for public interest reasons, VINCI Park has undertaken to repay the outstanding balance whentermination compensation is paid.
The amount of Dexia loans concerned was 118.4 million at 31 December 2014, versus 130.4 million at30 June 2014.
14.2 Resources and liquidity
14.2.1 Maturity of debts
Liquidity is managed through regular Treasury Committee meetings, which are held under theresponsibility of the Group's finance department. That department has established a liquidity riskmanagement framework suited to managing short-, medium- and long-term financing along with theGroup's obligations in terms of liquidity management.
The Group manages its liquidity in a centralised manner through a cash pooling system. At 31 December2014, the operating subsidiaries in the Group's main countries took part in the cash pooling system, theonly notable exception being the Canadian subsidiaries.In addition to the two tranches of the 950 million bond issue, the Group also finances itself throughbank loans that totalled 141.1 million at 31 December 2014. Those loans bear interest mainly at floatingrates and have been subject to interest-rate hedging (see note G.15 "Financial risk management").
The Group only lends to its subsidiaries at fixed interest rates.
At 31 December 2014, the average maturity of the Group’s financial debt was 9.9 years (against6.3 years at 30 June 2014).
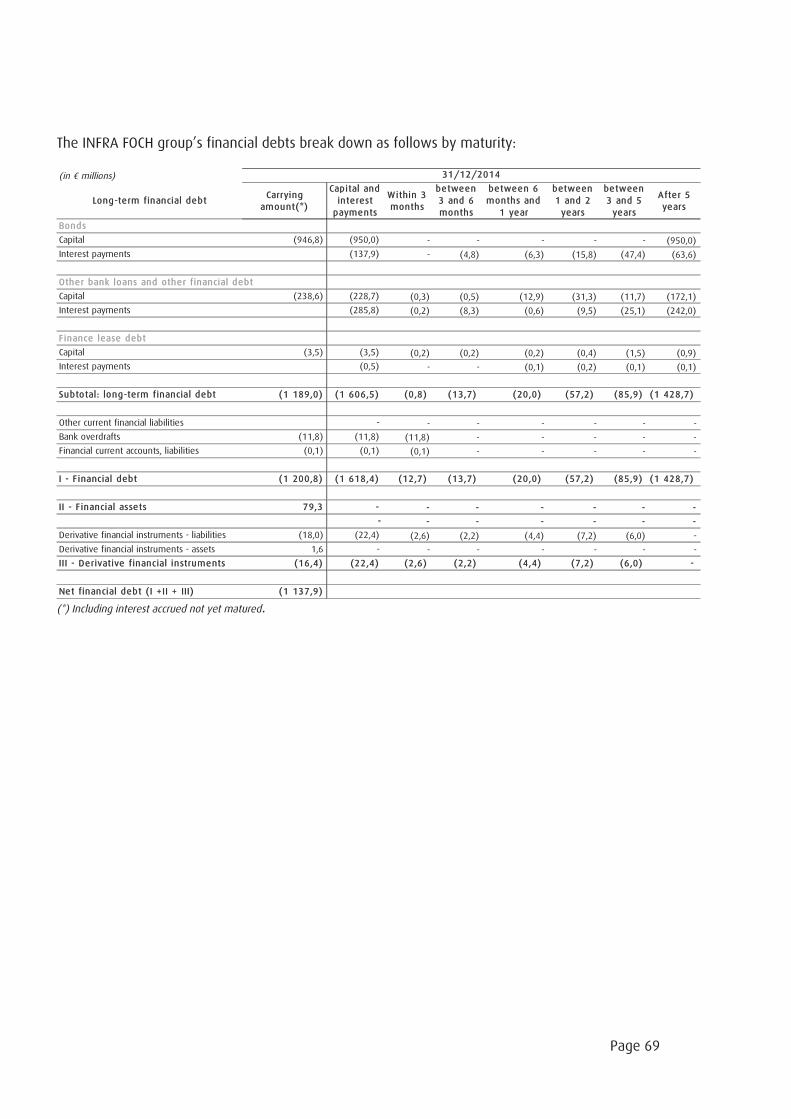
Page 69
The INFRA FOCH group’s financial debts break down as follows by maturity:
(in millions)
Long-term financial debtCarrying
amount(*)
Capital and
interest
payments
Within 3
months
between
3 and 6
months
between 6
months and
1 year
between
1 and 2
years
between
3 and 5
years
After 5
years
Bonds
Capital (946,8) (950,0) - - - - - (950,0)
Interest payments (137,9) - (4,8) (6,3) (15,8) (47,4) (63,6)
Other bank loans and other financial debt
Capital (238,6) (228,7) (0,3) (0,5) (12,9) (31,3) (11,7) (172,1)
Interest payments (285,8) (0,2) (8,3) (0,6) (9,5) (25,1) (242,0)
F inance lease debt
Capital (3,5) (3,5) (0,2) (0,2) (0,2) (0,4) (1,5) (0,9)
Interest payments (0,5) - - (0,1) (0,2) (0,1) (0,1)
Subtotal: long-term financial debt (1 189,0) (1 606,5) (0,8) (13,7) (20,0) (57,2) (85,9) (1 428,7)
Other current financial liabilities - - - - - - -
Bank overdrafts (11,8) (11,8) (11,8) - - - - -
Financial current accounts, liabilities (0,1) (0,1) (0,1) - - - - -
I - F inancial debt (1 200,8) (1 618,4) (12,7) (13,7) (20,0) (57,2) (85,9) (1 428,7)
II - F inancial assets 79,3 - - - - - - -
- - - - - - -
Derivative financial instruments - liabilities (18,0) (22,4) (2,6) (2,2) (4,4) (7,2) (6,0) -
Derivative financial instruments - assets 1,6 - - - - - - -
III - Derivative financial instruments (16,4) (22,4) (2,6) (2,2) (4,4) (7,2) (6,0) -
Net financial debt (I +II + III) (1 137,9)
31/12/2014
(*) Including interest accrued not yet matured.
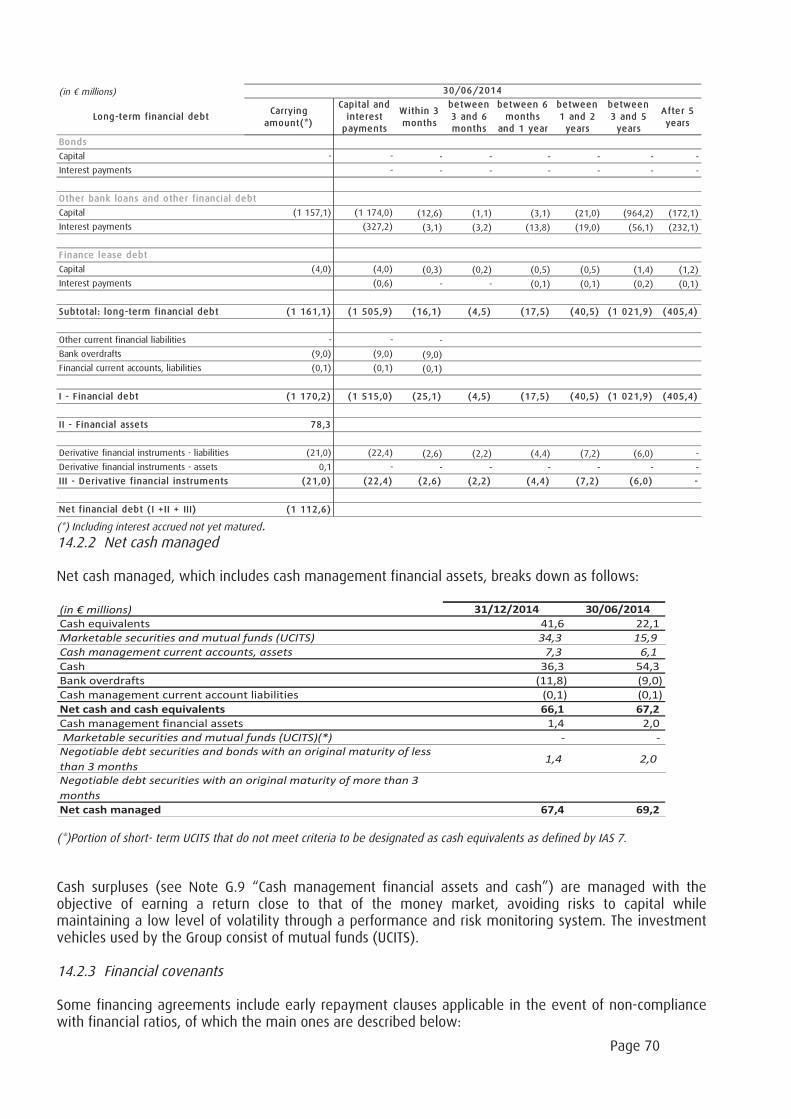
Page 70
(in millions)
Long-term financial debtCarrying
amount(*)
Capital and
interest
payments
Within 3
months
between
3 and 6
months
between 6
months
and 1 year
between
1 and 2
years
between
3 and 5
years
After 5
years
Bonds
Capital - - - - - - - -
Interest payments - - - - - - -
Other bank loans and other financial debt
Capital (1 157,1) (1 174,0) (12,6) (1,1) (3,1) (21,0) (964,2) (172,1)
Interest payments (327,2) (3,1) (3,2) (13,8) (19,0) (56,1) (232,1)
F inance lease debt
Capital (4,0) (4,0) (0,3) (0,2) (0,5) (0,5) (1,4) (1,2)
Interest payments (0,6) - - (0,1) (0,1) (0,2) (0,1)
Subtotal: long-term financial debt (1 161,1) (1 505,9) (16,1) (4,5) (17,5) (40,5) (1 021,9) (405,4)
Other current financial liabilities - - -
Bank overdrafts (9,0) (9,0) (9,0)
Financial current accounts, liabilities (0,1) (0,1) (0,1)
I - F inancial debt (1 170,2) (1 515,0) (25,1) (4,5) (17,5) (40,5) (1 021,9) (405,4)
II - F inancial assets 78,3
Derivative financial instruments - liabilities (21,0) (22,4) (2,6) (2,2) (4,4) (7,2) (6,0) -
Derivative financial instruments - assets 0,1 - - - - - - -
III - Derivative financial instruments (21,0) (22,4) (2,6) (2,2) (4,4) (7,2) (6,0) -
Net financial debt ( I +II + III) (1 112,6)
30/06/2014
(*) Including interest accrued not yet matured.14.2.2 Net cash managed
Net cash managed, which includes cash management financial assets, breaks down as follows:
(in millions) 31/12/2014 30/06/2014
Cash equivalents 41,6 22,1
Marketable securities and mutual funds (UCITS) 34,3 15,9
Cash management current accounts, assets 7,3 6,1
Cash 36,3 54,3
Bank overdrafts (11,8) (9,0)
Cash management current account liabilities (0,1) (0,1)
Net cash and cash equivalents 66,1 67,2
Cash management financial assets 1,4 2,0
Marketable securities and mutual funds (UCITS)(*) - -
Negotiable debt securities and bonds with an original maturity of less
than 3 months1,4 2,0
Negotiable debt securities with an original maturity of more than 3
months
Net cash managed 67,4 69,2
(*)Portion of short- term UCITS that do not meet criteria to be designated as cash equivalents as defined by IAS 7.
Cash surpluses (see Note G.9 “Cash management financial assets and cash”) are managed with theobjective of earning a return close to that of the money market, avoiding risks to capital whilemaintaining a low level of volatility through a performance and risk monitoring system. The investmentvehicles used by the Group consist of mutual funds (UCITS).
14.2.3 Financial covenants
Some financing agreements include early repayment clauses applicable in the event of non-compliancewith financial ratios, of which the main ones are described below:
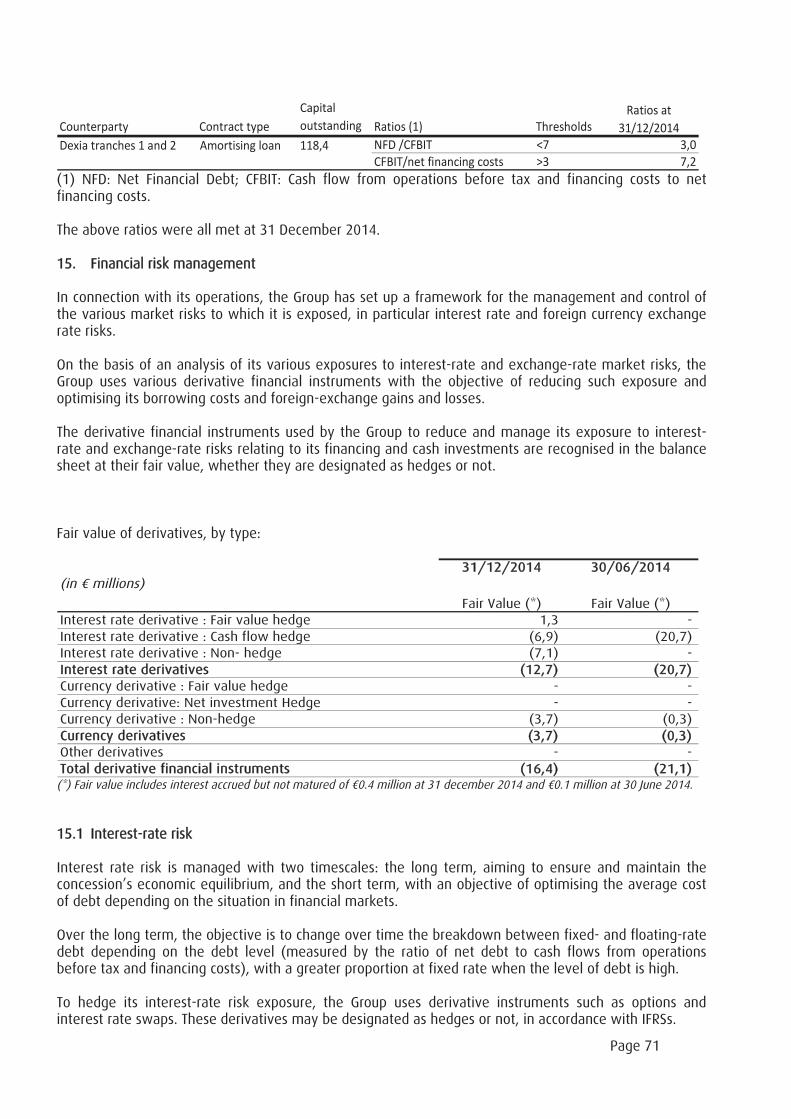
Page 71
Counterparty Contract type
Capital
outstanding Ratios (1) Thresholds
Ratios at
31/12/2014
Dexia tranches 1 and 2 Amortising loan NFD /CFBIT <7 3,0
CFBIT/net financing costs >3 7,2
118,4
(1) NFD: Net Financial Debt; CFBIT: Cash flow from operations before tax and financing costs to netfinancing costs.
The above ratios were all met at 31 December 2014.
15. Financial risk management
In connection with its operations, the Group has set up a framework for the management and control ofthe various market risks to which it is exposed, in particular interest rate and foreign currency exchangerate risks.
On the basis of an analysis of its various exposures to interest-rate and exchange-rate market risks, theGroup uses various derivative financial instruments with the objective of reducing such exposure andoptimising its borrowing costs and foreign-exchange gains and losses.
The derivative financial instruments used by the Group to reduce and manage its exposure to interest-rate and exchange-rate risks relating to its financing and cash investments are recognised in the balancesheet at their fair value, whether they are designated as hedges or not.
Fair value of derivatives, by type:
31/12/2014 30/06/2014(in millions)
Fair Value (*) Fair Value (*)Interest rate derivative : Fair value hedge 1,3 -Interest rate derivative : Cash flow hedge (6,9) (20,7)Interest rate derivative : Non- hedge (7,1) -Interest rate derivatives (12,7) (20,7)Currency derivative : Fair value hedge - -Currency derivative: Net investment Hedge - -Currency derivative : Non-hedge (3,7) (0,3)Currency derivatives (3,7) (0,3)Other derivatives - -Total derivative financial instruments (16,4) (21,1)(*) Fair value includes interest accrued but not matured of 0.4 million at 31 december 2014 and 0.1 million at 30 June 2014.
15.1 Interest-rate risk
Interest rate risk is managed with two timescales: the long term, aiming to ensure and maintain theconcession’s economic equilibrium, and the short term, with an objective of optimising the average costof debt depending on the situation in financial markets.
Over the long term, the objective is to change over time the breakdown between fixed- and floating-ratedebt depending on the debt level (measured by the ratio of net debt to cash flows from operationsbefore tax and financing costs), with a greater proportion at fixed rate when the level of debt is high.
To hedge its interest-rate risk exposure, the Group uses derivative instruments such as options andinterest rate swaps. These derivatives may be designated as hedges or not, in accordance with IFRSs.
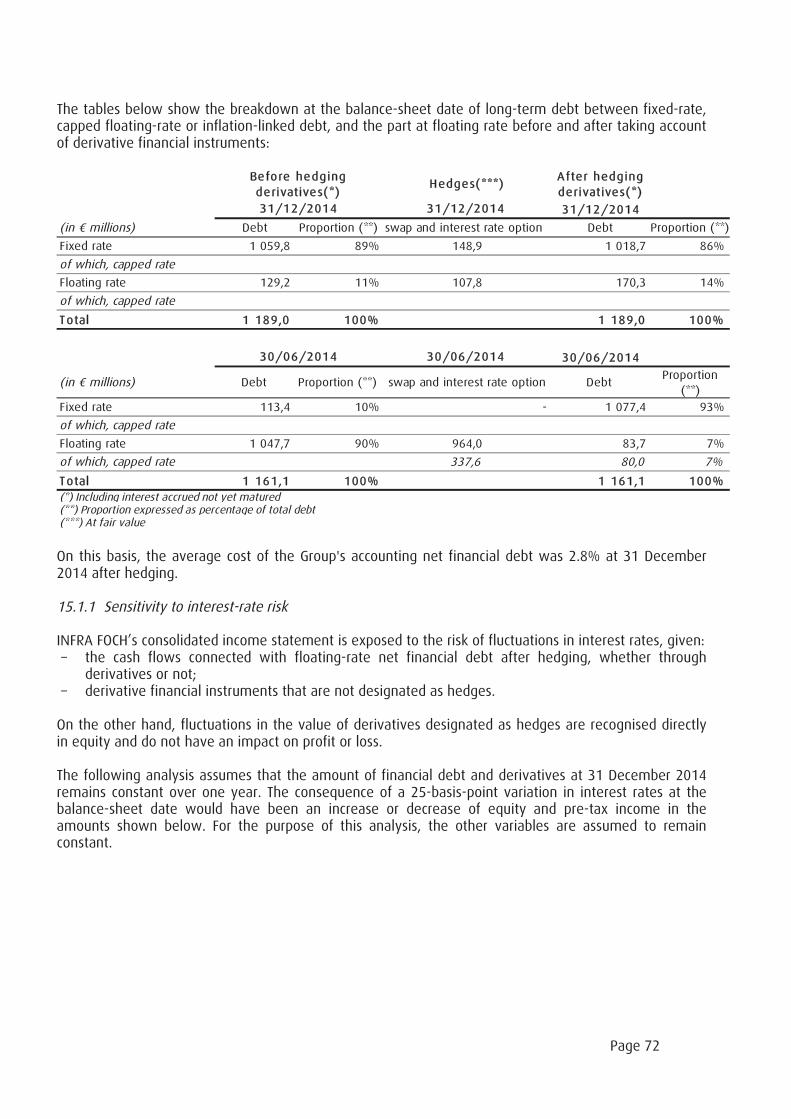
Page 72
The tables below show the breakdown at the balance-sheet date of long-term debt between fixed-rate,capped floating-rate or inflation-linked debt, and the part at floating rate before and after taking accountof derivative financial instruments:
After hedging
derivatives(*)
31/12/2014
(in millions) Debt Proportion (**) swap and interest rate option Debt Proportion (**)
Fixed rate 1 059,8 89% 1 018,7 86%
of which, capped rate
Floating rate 129,2 11% 170,3 14%
of which, capped rate
Total 1 189,0 100% 1 189,0 100%
30/06/2014
(in millions) Debt Proportion (**) DebtProportion
(**)
Fixed rate 113,4 10% - 1 077,4 93%
of which, capped rate
Floating rate 1 047,7 90% 83,7 7%
of which, capped rate 80,0 7%
Total 1 161,1 100% 1 161,1 100%
(*) Including interest accrued not yet matured(**) Proportion expressed as percentage of total debt(***) At fair value
964,0
337,6
swap and interest rate option
Before hedging
derivatives(*)
30/06/2014 30/06/2014
Hedges(***)
31/12/2014 31/12/2014
148,9
107,8
On this basis, the average cost of the Group's accounting net financial debt was 2.8% at 31 December2014 after hedging.
15.1.1 Sensitivity to interest-rate risk
INFRA FOCH’s consolidated income statement is exposed to the risk of fluctuations in interest rates, given:– the cash flows connected with floating-rate net financial debt after hedging, whether through
derivatives or not;– derivative financial instruments that are not designated as hedges.
On the other hand, fluctuations in the value of derivatives designated as hedges are recognised directlyin equity and do not have an impact on profit or loss.
The following analysis assumes that the amount of financial debt and derivatives at 31 December 2014remains constant over one year. The consequence of a 25-basis-point variation in interest rates at thebalance-sheet date would have been an increase or decrease of equity and pre-tax income in theamounts shown below. For the purpose of this analysis, the other variables are assumed to remainconstant.
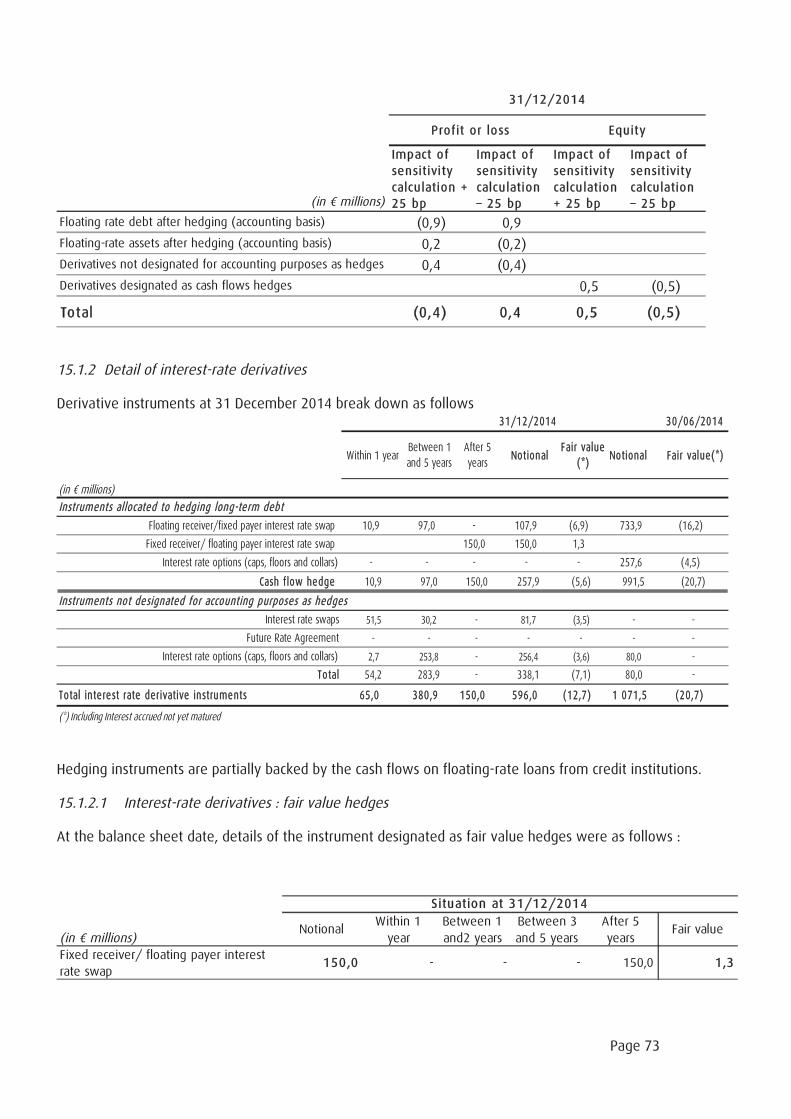
Page 73
Impact of
sensitivity
calculation +
25 bp
Impact of
sensitivity
calculation
– 25 bp
Impact of
sensitivity
calculation
+ 25 bp
Impact of
sensitivity
calculation
– 25 bp
Floating rate debt after hedging (accounting basis) (0,9) 0,9
Floating-rate assets after hedging (accounting basis) 0,2 (0,2)
Derivatives not designated for accounting purposes as hedges 0,4 (0,4)
Derivatives designated as cash flows hedges 0,5 (0,5)
Total (0,4) 0,4 0,5 (0,5)
Profit or loss Equity
(in millions)
31/12/2014
15.1.2 Detail of interest-rate derivatives
Derivative instruments at 31 December 2014 break down as follows
Within 1 yearBetween 1
and 5 years
After 5
yearsNotional
Fair value
(*)Notional Fair value(*)
Instruments allocated to hedging long-term debt
Floating receiver/fixed payer interest rate swap 10,9 97,0 - 107,9 (6,9) 733,9 (16,2)
Fixed receiver/ floating payer interest rate swap 150,0 150,0 1,3
Interest rate options (caps, floors and collars) - - - - - 257,6 (4,5)
Cash flow hedge 10,9 97,0 150,0 257,9 (5,6) 991,5 (20,7)
Instruments not designated for accounting purposes as hedges
Interest rate swaps 51,5 30,2 - 81,7 (3,5) - -
Future Rate Agreement - - - - - - -
Interest rate options (caps, floors and collars) 2,7 253,8 - 256,4 (3,6) 80,0 -
Total 54,2 283,9 - 338,1 (7,1) 80,0 -
Total interest rate derivative instruments 65,0 380,9 150,0 596,0 (12,7) 1 071,5 (20,7)
(*) Including Interest accrued not yet matured
31/12/2014 30/06/2014
(in millions)
Hedging instruments are partially backed by the cash flows on floating-rate loans from credit institutions.
15.1.2.1 Interest-rate derivatives : fair value hedges
At the balance sheet date, details of the instrument designated as fair value hedges were as follows :
(in millions)Notional
Within 1
year
Between 1
and2 years
Between 3
and 5 years
After 5
yearsFair value
Fixed receiver/ floating payer interest
rate swap150,0 - - - 150,0 1,3
Situation at 31/12/2014
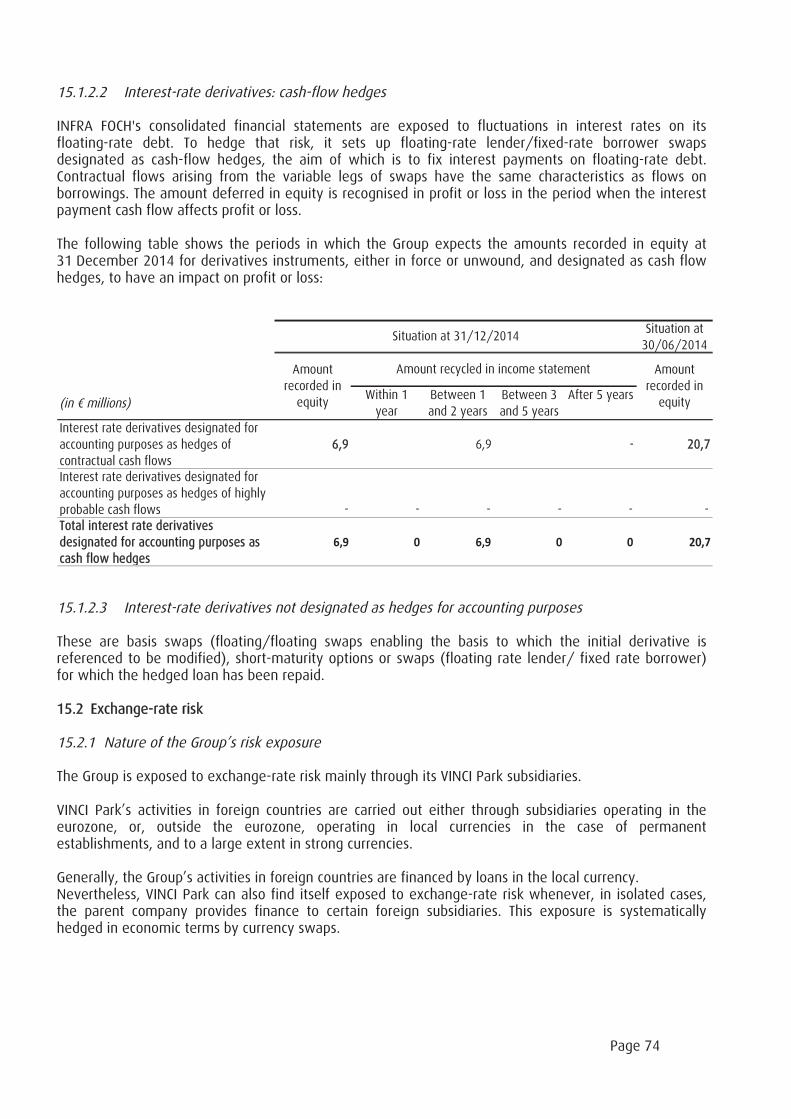
Page 74
15.1.2.2 Interest-rate derivatives: cash-flow hedges
INFRA FOCH's consolidated financial statements are exposed to fluctuations in interest rates on itsfloating-rate debt. To hedge that risk, it sets up floating-rate lender/fixed-rate borrower swapsdesignated as cash-flow hedges, the aim of which is to fix interest payments on floating-rate debt.Contractual flows arising from the variable legs of swaps have the same characteristics as flows onborrowings. The amount deferred in equity is recognised in profit or loss in the period when the interestpayment cash flow affects profit or loss.
The following table shows the periods in which the Group expects the amounts recorded in equity at31 December 2014 for derivatives instruments, either in force or unwound, and designated as cash flowhedges, to have an impact on profit or loss:
Situation at30/06/2014
(in millions)Within 1
yearBetween 1and 2 years
Between 3and 5 years
After 5 years
Interest rate derivatives designated foraccounting purposes as hedges ofcontractual cash flows
6,9 6,9 - 20,7
Interest rate derivatives designated foraccounting purposes as hedges of highlyprobable cash flows - - - - - -Total interest rate derivativesdesignated for accounting purposes ascash flow hedges
6,9 0 6,9 0 0 20,7
Situation at 31/12/2014
Amountrecorded in
equity
Amount recycled in income statementAmountrecorded in
equity
15.1.2.3 Interest-rate derivatives not designated as hedges for accounting purposes
These are basis swaps (floating/floating swaps enabling the basis to which the initial derivative isreferenced to be modified), short-maturity options or swaps (floating rate lender/ fixed rate borrower)for which the hedged loan has been repaid.
15.2 Exchange-rate risk
15.2.1 Nature of the Group’s risk exposure
The Group is exposed to exchange-rate risk mainly through its VINCI Park subsidiaries.
VINCI Park’s activities in foreign countries are carried out either through subsidiaries operating in theeurozone, or, outside the eurozone, operating in local currencies in the case of permanentestablishments, and to a large extent in strong currencies.
Generally, the Group’s activities in foreign countries are financed by loans in the local currency.Nevertheless, VINCI Park can also find itself exposed to exchange-rate risk whenever, in isolated cases,the parent company provides finance to certain foreign subsidiaries. This exposure is systematicallyhedged in economic terms by currency swaps.
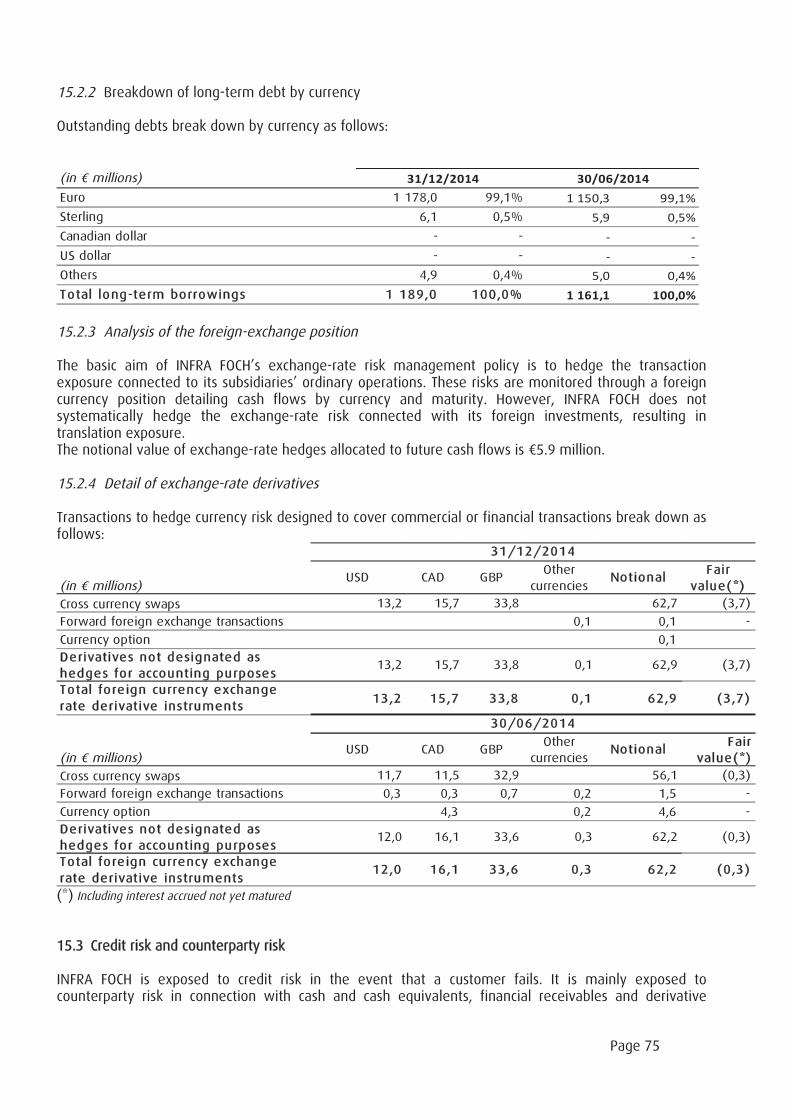
Page 75
15.2.2 Breakdown of long-term debt by currency
Outstanding debts break down by currency as follows:
(in millions)
Euro 1 178,0 99,1% 1 150,3 99,1%
Sterling 6,1 0,5% 5,9 0,5%
Canadian dollar - - - -
US dollar - - - -
Others 4,9 0,4% 5,0 0,4%
Total long-term borrowings 1 189,0 100,0% 1 161,1 100,0%
30/06/201431/12/2014
15.2.3 Analysis of the foreign-exchange position
The basic aim of INFRA FOCH’s exchange-rate risk management policy is to hedge the transactionexposure connected to its subsidiaries’ ordinary operations. These risks are monitored through a foreigncurrency position detailing cash flows by currency and maturity. However, INFRA FOCH does notsystematically hedge the exchange-rate risk connected with its foreign investments, resulting intranslation exposure.The notional value of exchange-rate hedges allocated to future cash flows is 5.9 million.
15.2.4 Detail of exchange-rate derivatives
Transactions to hedge currency risk designed to cover commercial or financial transactions break down asfollows:
USD CAD GBPOther
currenciesNotional
Fair
value(*)
Cross currency swaps 13,2 15,7 33,8 62,7 (3,7)
Forward foreign exchange transactions 0,1 0,1 -
Currency option 0,1
Derivatives not designated as
hedges for accounting purposes13,2 15,7 33,8 0,1 62,9 (3,7)
Total foreign currency exchange
rate derivative instruments13,2 15,7 33,8 0,1 62,9 (3,7)
USD CAD GBPOther
currenciesNotional
Fair
value(*)
Cross currency swaps 11,7 11,5 32,9 56,1 (0,3)
Forward foreign exchange transactions 0,3 0,3 0,7 0,2 1,5 -
Currency option 4,3 0,2 4,6 -
Derivatives not designated as
hedges for accounting purposes12,0 16,1 33,6 0,3 62,2 (0,3)
Total foreign currency exchange
rate derivative instruments12,0 16,1 33,6 0,3 62,2 (0,3)
30/06/2014
31/12/2014
(in millions)
(in millions)
(*) Including interest accrued not yet matured
15.3 Credit risk and counterparty risk
INFRA FOCH is exposed to credit risk in the event that a customer fails. It is mainly exposed tocounterparty risk in connection with cash and cash equivalents, financial receivables and derivative
Page 76
instruments. The notional amounts and market values are given in Note F.15.1.2 “Detail of interest-ratederivatives”.
INFRA FOCH considers that the credit risk connected with trade receivables is very limited because of thelarge number of customers, their diversity and the large proportion that are public-sector customers.Trade receivables are broken down in Note F.13.2 "Breakdown of trade receivables”.
Financial instruments are set up with financial institutions that meet the Group's credit rating criteria.
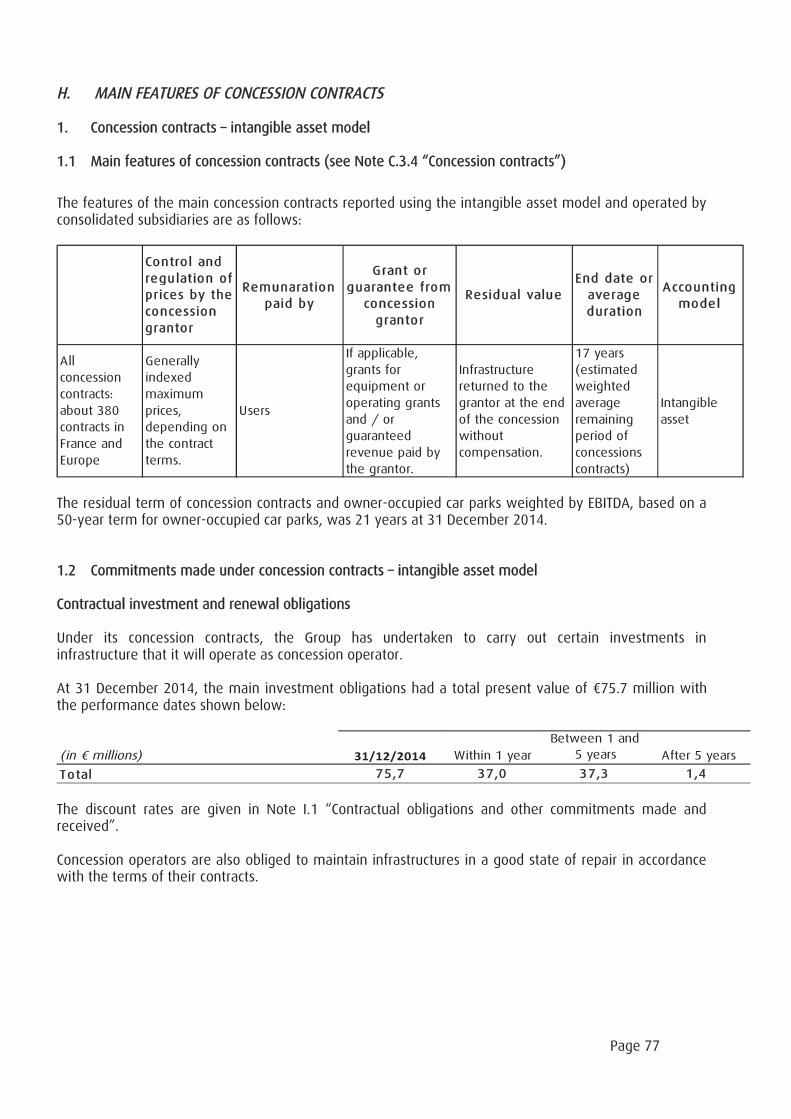
Page 77
H. MAIN FEATURES OF CONCESSION CONTRACTS
1. Concession contracts – intangible asset model
1.1 Main features of concession contracts (see Note C.3.4 “Concession contracts”)
The features of the main concession contracts reported using the intangible asset model and operated byconsolidated subsidiaries are as follows:
Control and
regulation of
prices by the
concession
grantor
Remunaration
paid by
Grant or
guarantee from
concession
grantor
Residual value
End date or
average
duration
Accounting
model
All
concession
contracts:
about 380
contracts in
France and
Europe
Generally
indexed
maximum
prices,
depending on
the contract
terms.
Users
If applicable,
grants for
equipment or
operating grants
and / or
guaranteed
revenue paid by
the grantor.
Infrastructure
returned to the
grantor at the end
of the concession
without
compensation.
17 years
(estimated
weighted
average
remaining
period of
concessions
contracts)
Intangible
asset
The residual term of concession contracts and owner-occupied car parks weighted by EBITDA, based on a50-year term for owner-occupied car parks, was 21 years at 31 December 2014.
1.2 Commitments made under concession contracts – intangible asset model
Contractual investment and renewal obligations
Under its concession contracts, the Group has undertaken to carry out certain investments ininfrastructure that it will operate as concession operator.
At 31 December 2014, the main investment obligations had a total present value of 75.7 million withthe performance dates shown below:
(in millions) 31/12/2014 Within 1 year
Between 1 and
5 years After 5 years
Total 75,7 37,0 37,3 1,4
The discount rates are given in Note I.1 “Contractual obligations and other commitments made andreceived”.
Concession operators are also obliged to maintain infrastructures in a good state of repair in accordancewith the terms of their contracts.
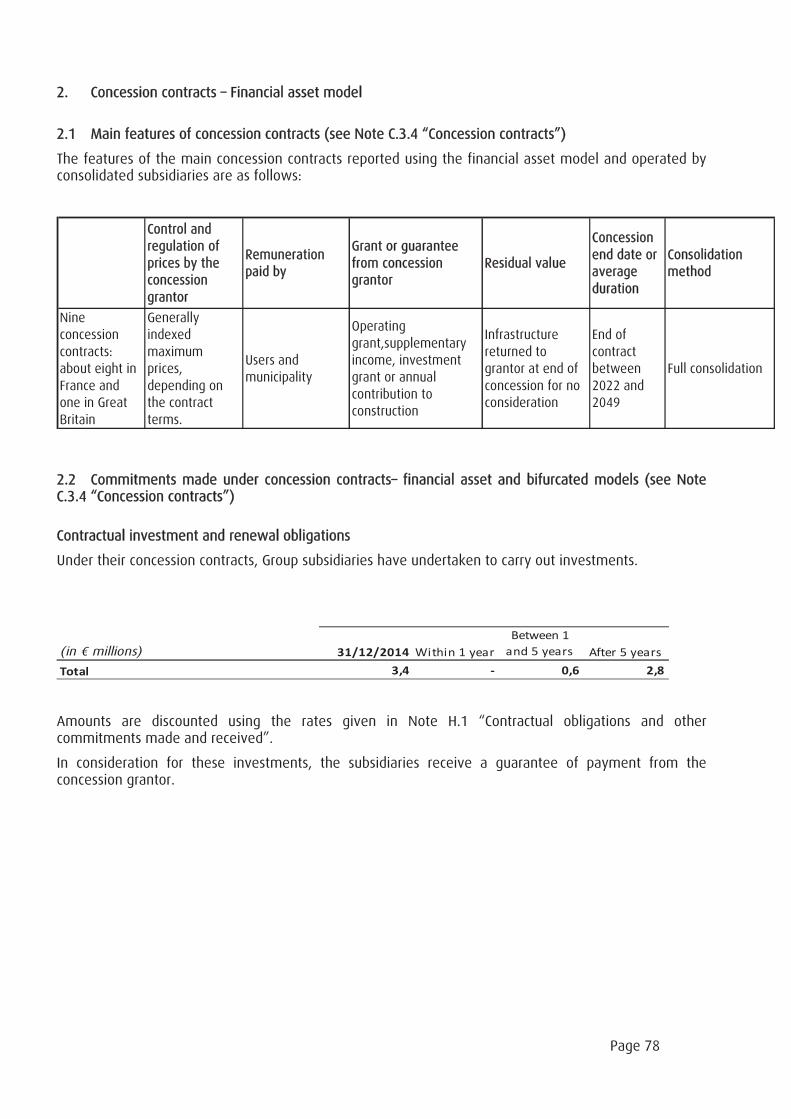
Page 78
2. Concession contracts – Financial asset model
2.1 Main features of concession contracts (see Note C.3.4 “Concession contracts”)
The features of the main concession contracts reported using the financial asset model and operated byconsolidated subsidiaries are as follows:
Control andregulation ofprices by theconcessiongrantor
Remunerationpaid by
Grant or guaranteefrom concessiongrantor
Residual value
Concessionend date oraverageduration
Consolidationmethod
Nineconcessioncontracts:about eight inFrance andone in GreatBritain
Generallyindexedmaximumprices,depending onthe contractterms.
Users andmunicipality
Operatinggrant,supplementaryincome, investmentgrant or annualcontribution toconstruction
Infrastructurereturned tograntor at end ofconcession for noconsideration
End ofcontractbetween2022 and2049
Full consolidation
2.2 Commitments made under concession contracts– financial asset and bifurcated models (see NoteC.3.4 “Concession contracts”)
Contractual investment and renewal obligations
Under their concession contracts, Group subsidiaries have undertaken to carry out investments.
(in millions) 31/12/2014 Within 1 year
Between 1
and 5 years After 5 years
Total 3,4 - 0,6 2,8
Amounts are discounted using the rates given in Note H.1 “Contractual obligations and othercommitments made and received”.
In consideration for these investments, the subsidiaries receive a guarantee of payment from theconcession grantor.
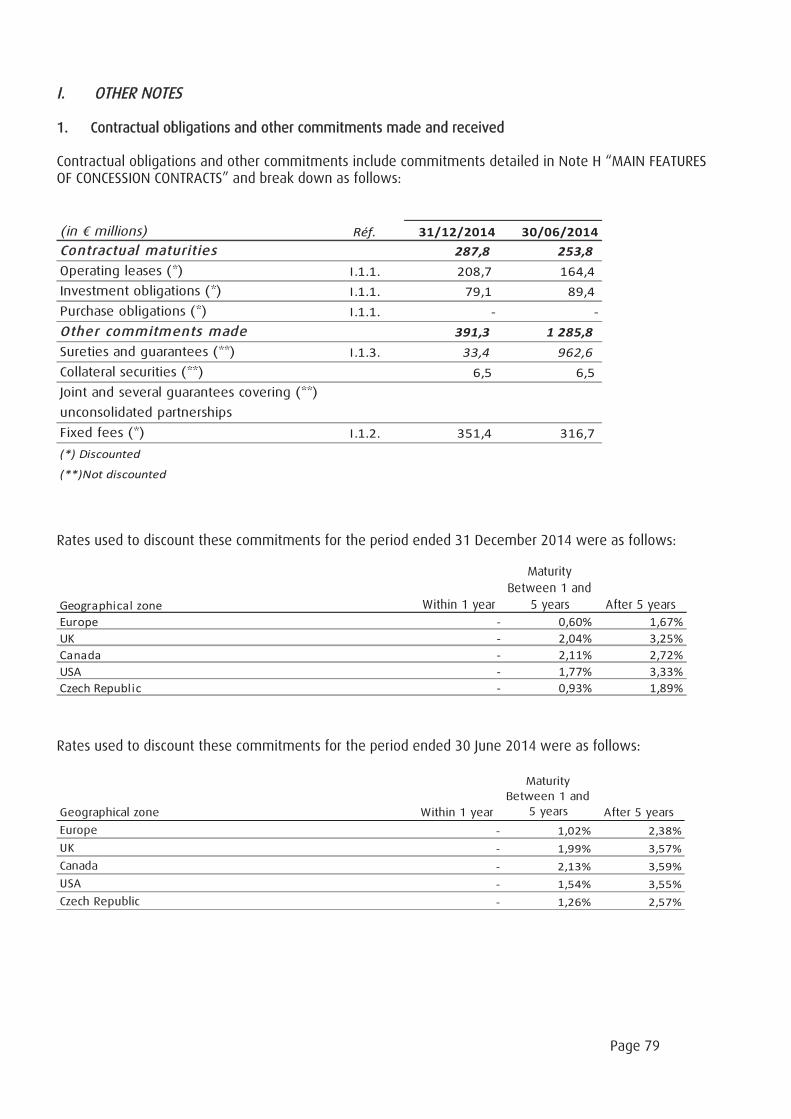
Page 79
I. OTHER NOTES
1. Contractual obligations and other commitments made and received
Contractual obligations and other commitments include commitments detailed in Note H “MAIN FEATURESOF CONCESSION CONTRACTS” and break down as follows:
Rates used to discount these commitments for the period ended 31 December 2014 were as follows:
Geographical zone Within 1 year
Between 1 and
5 years After 5 years
Europe - 0,60% 1,67%
UK - 2,04% 3,25%
Canada - 2,11% 2,72%
USA - 1,77% 3,33%
Czech Republic - 0,93% 1,89%
Maturity
Rates used to discount these commitments for the period ended 30 June 2014 were as follows:
Geographical zone Within 1 year
Between 1 and
5 years After 5 years
Europe - 1,02% 2,38%
UK - 1,99% 3,57%
Canada - 2,13% 3,59%
USA - 1,54% 3,55%
Czech Republic - 1,26% 2,57%
Maturity
(in millions) Réf. 31/12/2014 30/06/2014
Contractual maturities 287,8 253,8
Operating leases (*) I.1.1. 208,7 164,4
Investment obligations (*) I.1.1. 79,1 89,4
Purchase obligations (*) I.1.1. - -
Other commitments made 391,3 1 285,8
Sureties and guarantees (**) I.1.3. 33,4 962,6
Collateral securities (**) 6,5 6,5
Joint and several guarantees covering (**)
unconsolidated partnerships
Fixed fees (*) I.1.2. 351,4 316,7
(*) Discounted
(**)Not discounted
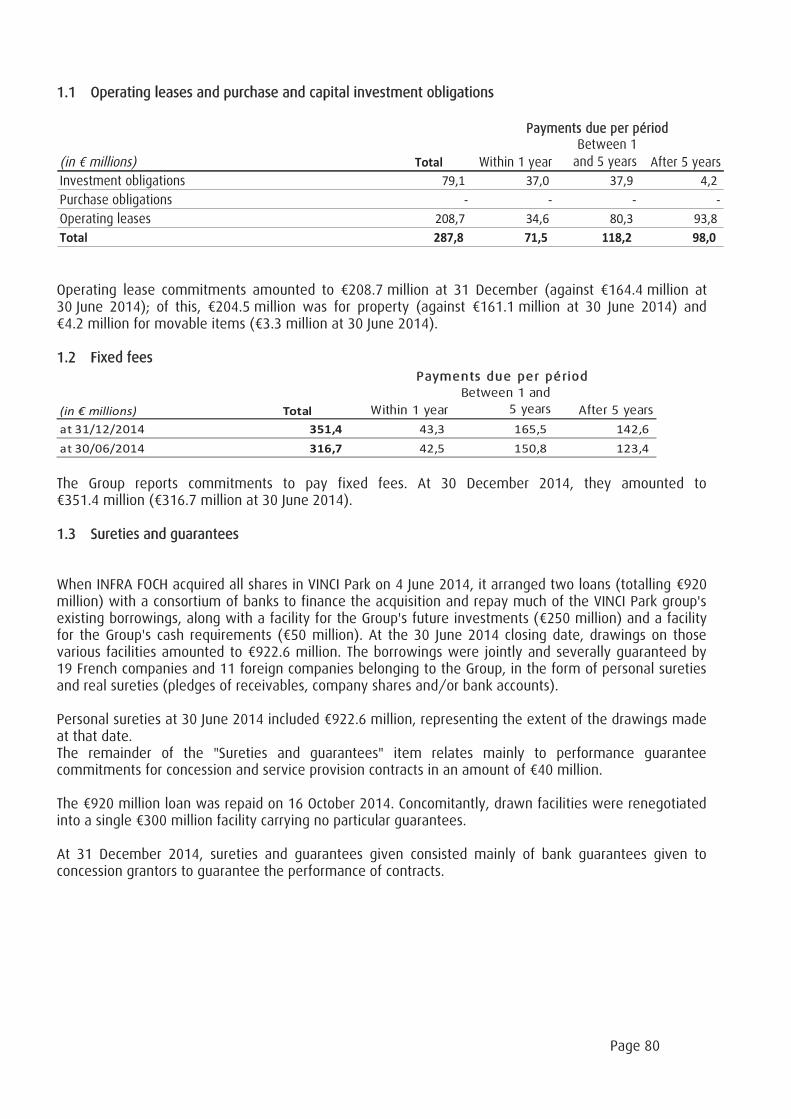
Page 80
1.1 Operating leases and purchase and capital investment obligations
(in millions) Total Within 1 yearBetween 1and 5 years After 5 years
Investment obligations 79,1 37,0 37,9 4,2
Purchase obligations - - - -
Operating leases 208,7 34,6 80,3 93,8
Total 287,8 71,5 118,2 98,0
Payments due per périod
Operating lease commitments amounted to 208.7 million at 31 December (against 164.4 million at30 June 2014); of this, 204.5 million was for property (against 161.1 million at 30 June 2014) and4.2 million for movable items ( 3.3 million at 30 June 2014).
1.2 Fixed fees
(in millions) Total Within 1 year
Between 1 and
5 years After 5 years
at 31/12/2014 351,4 43,3 165,5 142,6
at 30/06/2014 316,7 42,5 150,8 123,4
Payments due per périod
The Group reports commitments to pay fixed fees. At 30 December 2014, they amounted to351.4 million ( 316.7 million at 30 June 2014).
1.3 Sureties and guarantees
When INFRA FOCH acquired all shares in VINCI Park on 4 June 2014, it arranged two loans (totalling 920million) with a consortium of banks to finance the acquisition and repay much of the VINCI Park group'sexisting borrowings, along with a facility for the Group's future investments ( 250 million) and a facilityfor the Group's cash requirements ( 50 million). At the 30 June 2014 closing date, drawings on thosevarious facilities amounted to 922.6 million. The borrowings were jointly and severally guaranteed by19 French companies and 11 foreign companies belonging to the Group, in the form of personal suretiesand real sureties (pledges of receivables, company shares and/or bank accounts).
Personal sureties at 30 June 2014 included 922.6 million, representing the extent of the drawings madeat that date.The remainder of the "Sureties and guarantees" item relates mainly to performance guaranteecommitments for concession and service provision contracts in an amount of 40 million.
The 920 million loan was repaid on 16 October 2014. Concomitantly, drawn facilities were renegotiatedinto a single 300 million facility carrying no particular guarantees.
At 31 December 2014, sureties and guarantees given consisted mainly of bank guarantees given toconcession grantors to guarantee the performance of contracts.
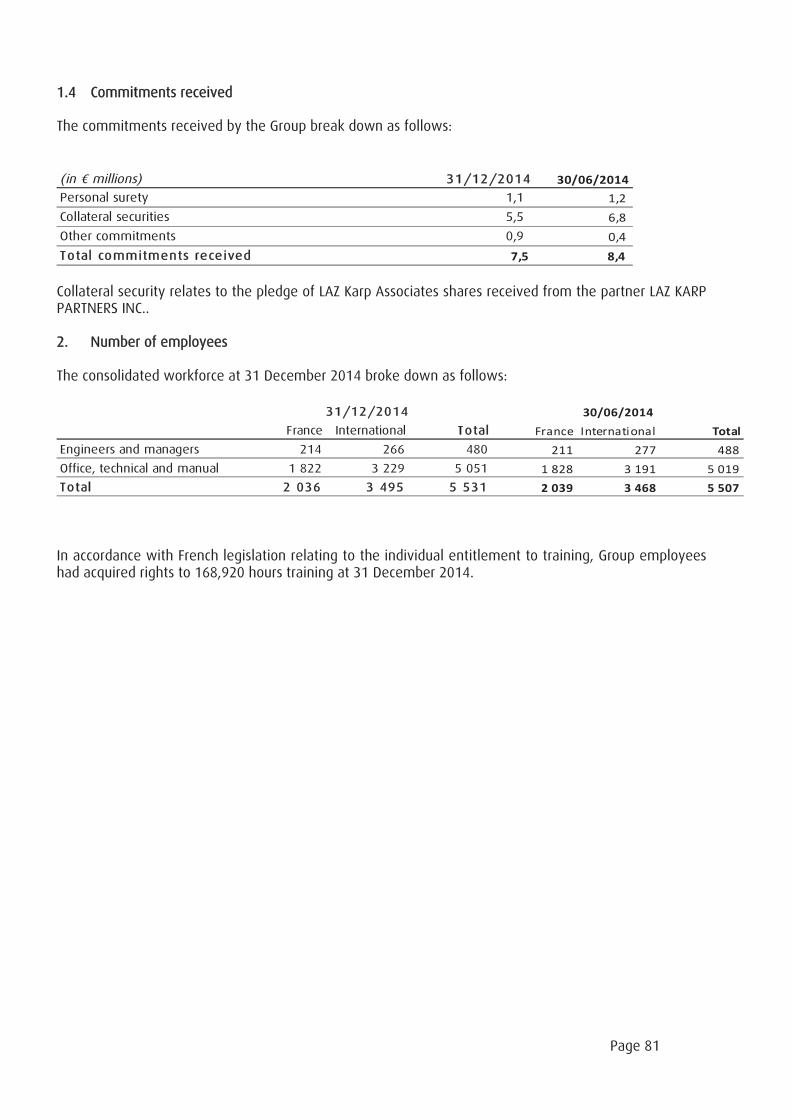
Page 81
1.4 Commitments received
The commitments received by the Group break down as follows:
(in millions) 31/12/2014 30/06/2014
Personal surety 1,1 1,2
Collateral securities 5,5 6,8
Other commitments 0,9 0,4
Total commitments received 7,5 8,4
Collateral security relates to the pledge of LAZ Karp Associates shares received from the partner LAZ KARPPARTNERS INC..
2. Number of employees
The consolidated workforce at 31 December 2014 broke down as follows:
France International Total France International Total
Engineers and managers 214 266 480 211 277 488
Office, technical and manual 1 822 3 229 5 051 1 828 3 191 5 019
Total 2 036 3 495 5 531 2 039 3 468 5 507
30/06/201431/12/2014
In accordance with French legislation relating to the individual entitlement to training, Group employeeshad acquired rights to 168,920 hours training at 31 December 2014.
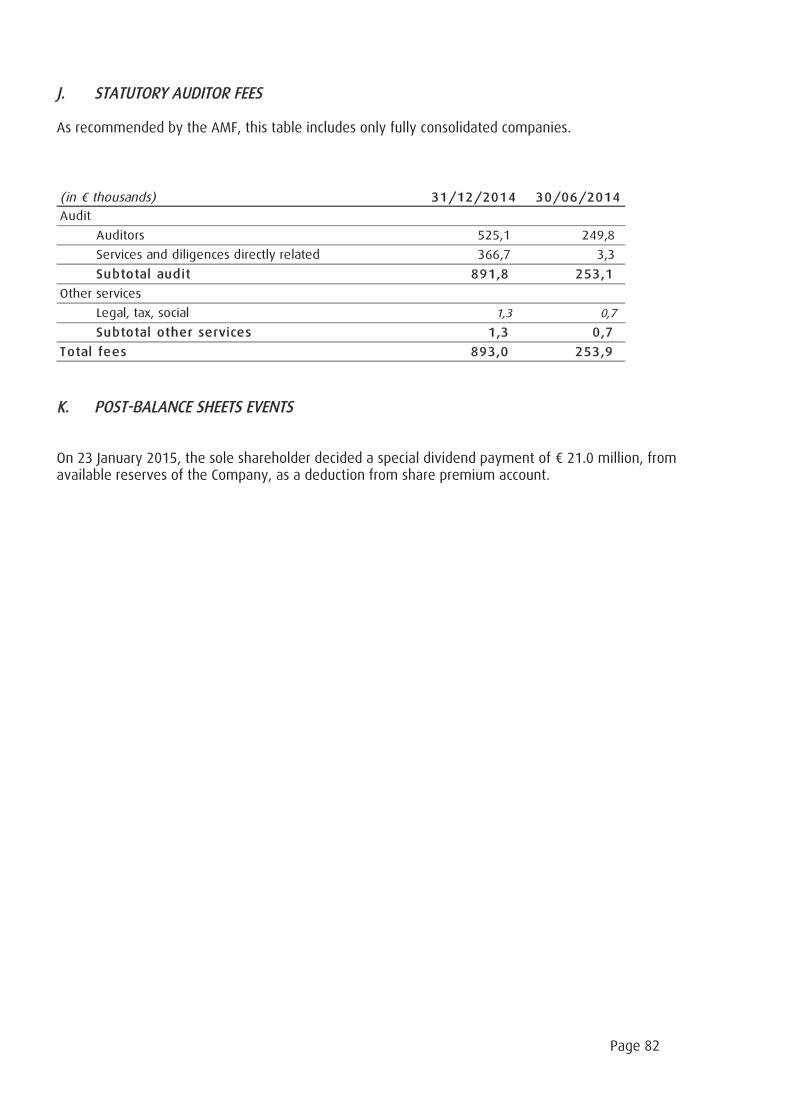
Page 82
J. STATUTORY AUDITOR FEES
As recommended by the AMF, this table includes only fully consolidated companies.
(in thousands) 31/12/2014 30/06/2014
Audit
Auditors 525,1 249,8
Services and diligences directly related 366,7 3,3
Subtotal audit 891,8 253,1
Other services
Legal, tax, social 1,3 0,7
Subtotal other services 1,3 0,7
Total fees 893,0 253,9
K. POST-BALANCE SHEETS EVENTS
On 23 January 2015, the sole shareholder decided a special dividend payment of 21.0 million, fromavailable reserves of the Company, as a deduction from share premium account.
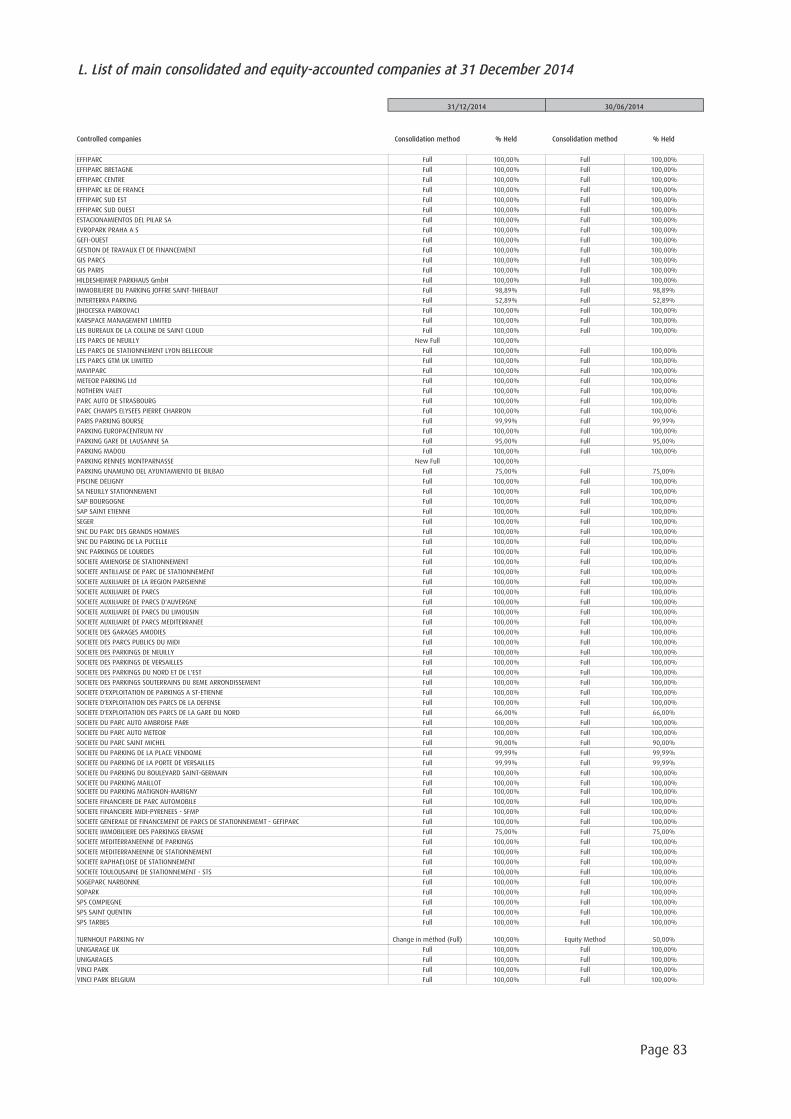
L. List of main consolidated and equity-accounted companies at 31 December 2014
Controlled companies Consolidation method % Held Consolidation method % Held
EFFIPARC Full 100,00% Full 100,00%
EFFIPARC BRETAGNE Full 100,00% Full 100,00%
EFFIPARC CENTRE Full 100,00% Full 100,00%
EFFIPARC ILE DE FRANCE Full 100,00% Full 100,00%
EFFIPARC SUD EST Full 100,00% Full 100,00%
EFFIPARC SUD OUEST Full 100,00% Full 100,00%
ESTACIONAMIENTOS DEL PILAR SA Full 100,00% Full 100,00%
EVROPARK PRAHA A S Full 100,00% Full 100,00%
GEFI-OUEST Full 100,00% Full 100,00%
GESTION DE TRAVAUX ET DE FINANCEMENT Full 100,00% Full 100,00%
GIS PARCS Full 100,00% Full 100,00%
GIS PARIS Full 100,00% Full 100,00%
HILDESHEIMER PARKHAUS GmbH Full 100,00% Full 100,00%
IMMOBILIERE DU PARKING JOFFRE SAINT-THIEBAUT Full 98,89% Full 98,89%
INTERTERRA PARKING Full 52,89% Full 52,89%
JIHOCESKA PARKOVACI Full 100,00% Full 100,00%
KARSPACE MANAGEMENT LIMITED Full 100,00% Full 100,00%
LES BUREAUX DE LA COLLINE DE SAINT CLOUD Full 100,00% Full 100,00%
LES PARCS DE NEUILLY New Full 100,00%
LES PARCS DE STATIONNEMENT LYON BELLECOUR Full 100,00% Full 100,00%
LES PARCS GTM UK LIMITED Full 100,00% Full 100,00%
MAVIPARC Full 100,00% Full 100,00%
METEOR PARKING Ltd Full 100,00% Full 100,00%
NOTHERN VALET Full 100,00% Full 100,00%
PARC AUTO DE STRASBOURG Full 100,00% Full 100,00%
PARC CHAMPS ELYSEES PIERRE CHARRON Full 100,00% Full 100,00%
PARIS PARKING BOURSE Full 99,99% Full 99,99%
PARKING EUROPACENTRUM NV Full 100,00% Full 100,00%
PARKING GARE DE LAUSANNE SA Full 95,00% Full 95,00%
PARKING MADOU Full 100,00% Full 100,00%
PARKING RENNES MONTPARNASSE New Full 100,00%
PARKING UNAMUNO DEL AYUNTAMIENTO DE BILBAO Full 75,00% Full 75,00%
PISCINE DELIGNY Full 100,00% Full 100,00%
SA NEUILLY STATIONNEMENT Full 100,00% Full 100,00%
SAP BOURGOGNE Full 100,00% Full 100,00%
SAP SAINT ETIENNE Full 100,00% Full 100,00%
SEGER Full 100,00% Full 100,00%
SNC DU PARC DES GRANDS HOMMES Full 100,00% Full 100,00%
SNC DU PARKING DE LA PUCELLE Full 100,00% Full 100,00%
SNC PARKINGS DE LOURDES Full 100,00% Full 100,00%
SOCIETE AMIENOISE DE STATIONNEMENT Full 100,00% Full 100,00%
SOCIETE ANTILLAISE DE PARC DE STATIONNEMENT Full 100,00% Full 100,00%
SOCIETE AUXILIAIRE DE LA REGION PARISIENNE Full 100,00% Full 100,00%
SOCIETE AUXILIAIRE DE PARCS Full 100,00% Full 100,00%
SOCIETE AUXILIAIRE DE PARCS D'AUVERGNE Full 100,00% Full 100,00%
SOCIETE AUXILIAIRE DE PARCS DU LIMOUSIN Full 100,00% Full 100,00%
SOCIETE AUXILIAIRE DE PARCS MEDITERRANEE Full 100,00% Full 100,00%
SOCIETE DES GARAGES AMODIES Full 100,00% Full 100,00%
SOCIETE DES PARCS PUBLICS DU MIDI Full 100,00% Full 100,00%
SOCIETE DES PARKINGS DE NEUILLY Full 100,00% Full 100,00%
SOCIETE DES PARKINGS DE VERSAILLES Full 100,00% Full 100,00%
SOCIETE DES PARKINGS DU NORD ET DE L'EST Full 100,00% Full 100,00%
SOCIETE DES PARKINGS SOUTERRAINS DU 8EME ARRONDISSEMENT Full 100,00% Full 100,00%
SOCIETE D'EXPLOITATION DE PARKINGS A ST-ETIENNE Full 100,00% Full 100,00%
SOCIETE D'EXPLOITATION DES PARCS DE LA DEFENSE Full 100,00% Full 100,00%
SOCIETE D'EXPLOITATION DES PARCS DE LA GARE DU NORD Full 66,00% Full 66,00%
SOCIETE DU PARC AUTO AMBROISE PARE Full 100,00% Full 100,00%
SOCIETE DU PARC AUTO METEOR Full 100,00% Full 100,00%
SOCIETE DU PARC SAINT MICHEL Full 90,00% Full 90,00%
SOCIETE DU PARKING DE LA PLACE VENDOME Full 99,99% Full 99,99%
SOCIETE DU PARKING DE LA PORTE DE VERSAILLES Full 99,99% Full 99,99%
SOCIETE DU PARKING DU BOULEVARD SAINT-GERMAIN Full 100,00% Full 100,00%
SOCIETE DU PARKING MAILLOT Full 100,00% Full 100,00%SOCIETE DU PARKING MATIGNON-MARIGNY Full 100,00% Full 100,00%
SOCIETE FINANCIERE DE PARC AUTOMOBILE Full 100,00% Full 100,00%
SOCIETE FINANCIERE MIDI-PYRENEES - SFMP Full 100,00% Full 100,00%
SOCIETE GENERALE DE FINANCEMENT DE PARCS DE STATIONNEMEMT - GEFIPARC Full 100,00% Full 100,00%
SOCIETE IMMOBILIERE DES PARKINGS ERASME Full 75,00% Full 75,00%
SOCIETE MEDITERRANEENNE DE PARKINGS Full 100,00% Full 100,00%
SOCIETE MEDITERRANEENNE DE STATIONNEMENT Full 100,00% Full 100,00%
SOCIETE RAPHAELOISE DE STATIONNEMENT Full 100,00% Full 100,00%
SOCIETE TOULOUSAINE DE STATIONNEMENT - STS Full 100,00% Full 100,00%
SOGEPARC NARBONNE Full 100,00% Full 100,00%
SOPARK Full 100,00% Full 100,00%
SPS COMPIEGNE Full 100,00% Full 100,00%
SPS SAINT QUENTIN Full 100,00% Full 100,00%
SPS TARBES Full 100,00% Full 100,00%
TURNHOUT PARKING NV Change in méthod (Full) 100,00% Equity Method 50,00%
UNIGARAGE UK Full 100,00% Full 100,00%
UNIGARAGES Full 100,00% Full 100,00%
VINCI PARK Full 100,00% Full 100,00%
VINCI PARK BELGIUM Full 100,00% Full 100,00%
Page 83
31/12/2014 30/06/2014
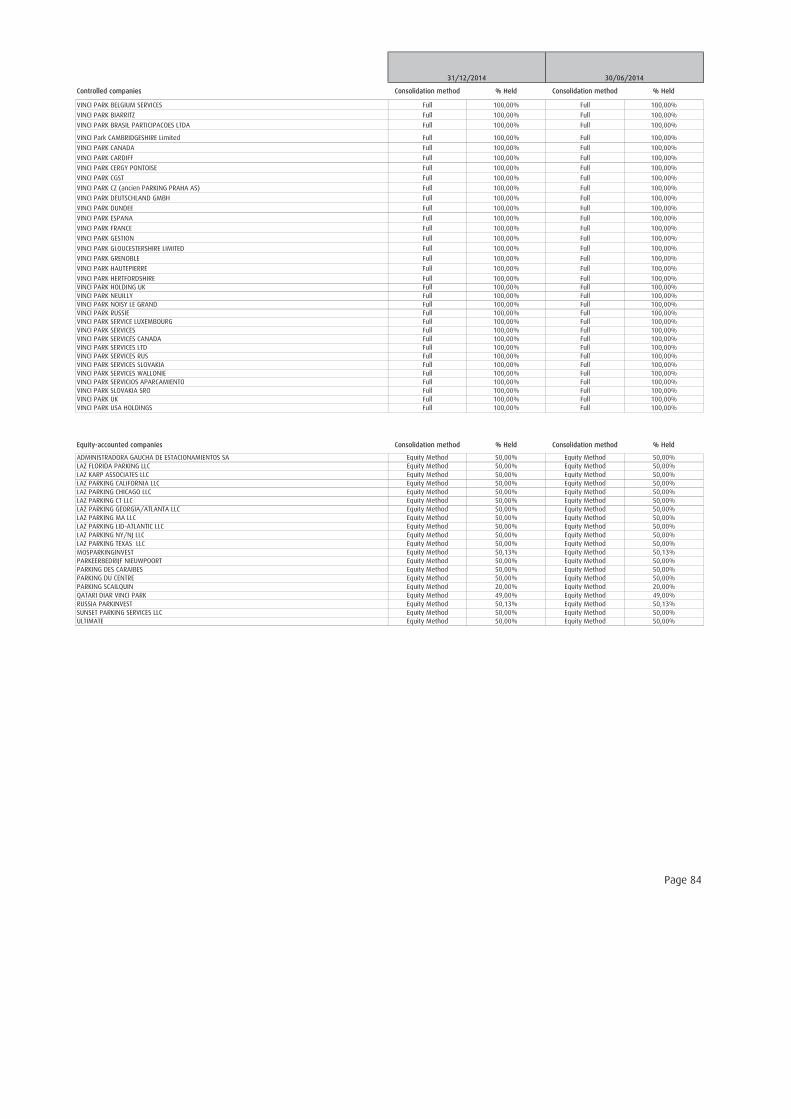
Controlled companies Consolidation method % Held Consolidation method % Held
VINCI PARK BELGIUM SERVICES Full 100,00% Full 100,00%
VINCI PARK BIARRITZ Full 100,00% Full 100,00%
VINCI PARK BRASIL PARTICIPACOES LTDA Full 100,00% Full 100,00%
VINCI Park CAMBRIDGESHIRE Limited Full 100,00% Full 100,00%
VINCI PARK CANADA Full 100,00% Full 100,00%
VINCI PARK CARDIFF Full 100,00% Full 100,00%
VINCI PARK CERGY PONTOISE Full 100,00% Full 100,00%
VINCI PARK CGST Full 100,00% Full 100,00%
VINCI PARK CZ (ancien PARKING PRAHA AS) Full 100,00% Full 100,00%
VINCI PARK DEUTSCHLAND GMBH Full 100,00% Full 100,00%
VINCI PARK DUNDEE Full 100,00% Full 100,00%
VINCI PARK ESPANA Full 100,00% Full 100,00%
VINCI PARK FRANCE Full 100,00% Full 100,00%
VINCI PARK GESTION Full 100,00% Full 100,00%
VINCI PARK GLOUCESTERSHIRE LIMITED Full 100,00% Full 100,00%
VINCI PARK GRENOBLE Full 100,00% Full 100,00%
VINCI PARK HAUTEPIERRE Full 100,00% Full 100,00%
VINCI PARK HERTFORDSHIRE Full 100,00% Full 100,00%VINCI PARK HOLDING UK Full 100,00% Full 100,00%VINCI PARK NEUILLY Full 100,00% Full 100,00%VINCI PARK NOISY LE GRAND Full 100,00% Full 100,00%VINCI PARK RUSSIE Full 100,00% Full 100,00%VINCI PARK SERVICE LUXEMBOURG Full 100,00% Full 100,00%VINCI PARK SERVICES Full 100,00% Full 100,00%VINCI PARK SERVICES CANADA Full 100,00% Full 100,00%VINCI PARK SERVICES LTD Full 100,00% Full 100,00%VINCI PARK SERVICES RUS Full 100,00% Full 100,00%VINCI PARK SERVICES SLOVAKIA Full 100,00% Full 100,00%VINCI PARK SERVICES WALLONIE Full 100,00% Full 100,00%VINCI PARK SERVICIOS APARCAMIENTO Full 100,00% Full 100,00%VINCI PARK SLOVAKIA SRO Full 100,00% Full 100,00%VINCI PARK UK Full 100,00% Full 100,00%VINCI PARK USA HOLDINGS Full 100,00% Full 100,00%
Equity-accounted companies Consolidation method % Held Consolidation method % Held
ADMINISTRADORA GAUCHA DE ESTACIONAMIENTOS SA Equity Method 50,00% Equity Method 50,00%LAZ FLORIDA PARKING LLC Equity Method 50,00% Equity Method 50,00%LAZ KARP ASSOCIATES LLC Equity Method 50,00% Equity Method 50,00%LAZ PARKING CALIFORNIA LLC Equity Method 50,00% Equity Method 50,00%LAZ PARKING CHICAGO LLC Equity Method 50,00% Equity Method 50,00%LAZ PARKING CT LLC Equity Method 50,00% Equity Method 50,00%LAZ PARKING GEORGIA/ATLANTA LLC Equity Method 50,00% Equity Method 50,00%LAZ PARKING MA LLC Equity Method 50,00% Equity Method 50,00%LAZ PARKING LID-ATLANTIC LLC Equity Method 50,00% Equity Method 50,00%LAZ PARKING NY/NJ LLC Equity Method 50,00% Equity Method 50,00%LAZ PARKING TEXAS LLC Equity Method 50,00% Equity Method 50,00%MOSPARKINGINVEST Equity Method 50,13% Equity Method 50,13%PARKEERBEDRIJF NIEUWPOORT Equity Method 50,00% Equity Method 50,00%PARKING DES CARAIBES Equity Method 50,00% Equity Method 50,00%PARKING DU CENTRE Equity Method 50,00% Equity Method 50,00%PARKING SCAILQUIN Equity Method 20,00% Equity Method 20,00%QATARI DIAR VINCI PARK Equity Method 49,00% Equity Method 49,00%RUSSIA PARKINVEST Equity Method 50,13% Equity Method 50,13%SUNSET PARKING SERVICES LLC Equity Method 50,00% Equity Method 50,00%ULTIMATE Equity Method 50,00% Equity Method 50,00%
31/12/2014 30/06/2014
Page 84


![Infra [ initiatives ]](https://img.pdfslide.us/doc/110x75/589ecd381a28ab47138b61d3/infra-initiatives-.jpg)