Embed Size (px)
Citation preview
LETTERSPUBLISHED ONLINE: 14 FEBRUARY 2010 | DOI: 10.1038/NGEO765
Rapid submarine melting of the calving faces ofWest Greenland glaciersEric Rignot1,2*, Michele Koppes3 and Isabella Velicogna1,2
Widespread glacier acceleration has been observed inGreenland in the past few years1–4 associated with the thinningof the lower reaches of the glaciers as they terminate inthe ocean5–7. These glaciers thin both at the surface, fromwarm air temperatures, and along their submerged facesin contact with warm ocean waters8. Little is known aboutthe rates of submarine melting9–11 and how they may affectglacier dynamics. Here we present measurements of oceancurrents, temperature and salinity near the calving fronts ofthe Eqip Sermia, Kangilerngata Sermia, Sermeq Kujatdleq andSermeq Avangnardleq glaciers in central West Greenland, aswell as ice-front bathymetry and geographical positions. Wecalculate water-mass and heat budgets that reveal summersubmarine melt rates ranging from 0.7±0.2 to 3.9±0.8 m d−1.These rates of submarine melting are two orders of magnitudelarger than surface melt rates, but comparable to rates oficeberg discharge. We conclude that ocean waters melt aconsiderable, but highly variable, fraction of the calving frontsof glaciers before they disintegrate into icebergs, and suggestthat submarine melting must have a profound influence ongrounding-line stability and ice-flow dynamics.
In the past decade, surface melt around Greenland has markedlyincreased in magnitude and spatial extent, whereas snowfall hasincreased only slightly12–14. As a result, the ice-sheet mass deficittripled in the period 1996–2007 (ref. 15). Critically, 50–60% ofthat loss was caused by an acceleration of the outlet glaciers;the remainder resulting from an increase in surface melt. Hence,glacier acceleration is a significant, if not dominant, response toclimate warming.
The widespread two- to threefold acceleration of the glacierscannot be explained solely by enhanced lubrication of the bed fromsurface meltwater16, for seasonal variations in glacier velocity donot exceed 8–10%, independent of latitude1. Glacier accelerationis instead probably caused by the ungrounding of ice fronts fromthe bed, which reduces buttressing of inland ice and entrains fasterrates of ice flow to the ocean5. To unground glaciers from the bed,they must melt and thin. Warmer air temperatures thin the glaciersfrom the surface and allow the ice flotation margin to migrateinland. Such surface melting is well documented in Greenland12–14.However, melting can also occur along the submarine termini ofthe glaciers. A warmer ocean will erode submerged grounded iceand cause the grounding line to retreat. In contrast, we know verylittle about rates of submarine melting along calving fronts. Theonly measurements of submarine glacier melting so far have beenconducted in Alaska9,10.
In August 2008, we deployed two InterOcean S4 conductivity,temperature and depth (CTD)/current meters, a Seabird SBE-19conductivity and temperature density profiler, and a Lowrance 18Csonar depth sounderwith a global positioning system in the fjords of
1University of California, Earth System Science, Irvine, California 92617, USA, 2Jet Propulsion Laboratory, Pasadena, California 91109, USA, 3University ofBritish Columbia, Department of Geography, Vancouver, British Columbia, V6T 1Z2, Canada. *e-mail: [email protected].
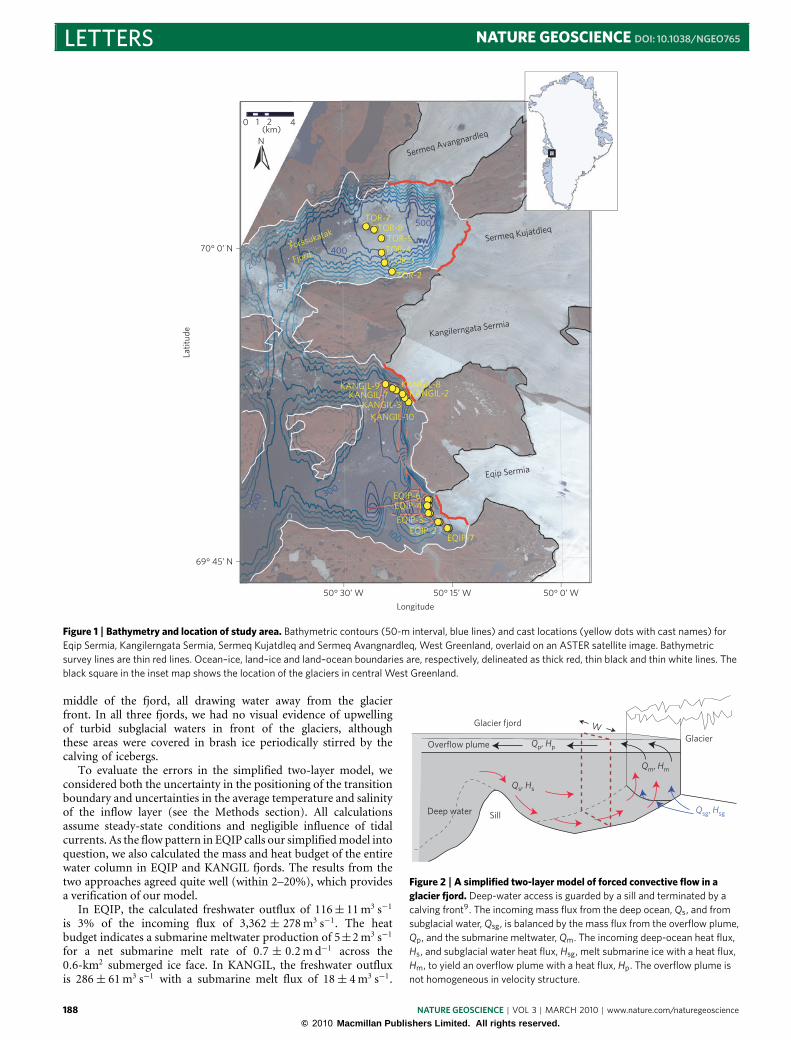
Eqip Sermia (EQIP), Kangilerngata Sermia (KANGIL) and SermeqKujatdleq and Avangnardleq (TOR), 100 km north of Ilulissat(Fig. 1). Seven to ten casts were taken at 500–1,000m intervals ineach fjord, between 200 and 1,000m (EQIP and KANGIL) and4 km (TOR) from the ice fronts. We sampled the water columnfrom 1m below the surface to a depth of 80m at EQIP, 150mat KANGIL and 200m at TOR, which is not the entire watercolumn. Water velocity, temperature and salinity were measuredcontinuously, as well as averaged, at 1.5-m depth intervals in the top50m and at 15-m intervals below 50m, because most of the velocitystructure was observed in the upper layers9,11. Fjord bathymetrywas also mapped, except in TOR where the fjord depth exceededour instrument capability.We complemented our bathymetric datawith a global bathymetric data set17, which agreed towithin 10–15mat the fjord centres with our measurements, but differed by upto 80m along the fjord edges because of poor definition of theland–ocean boundary in the global data set. During the survey, weexperienced mildly warm weather (5–15 ◦C), calm wind conditionsand no remnant seasonal sea-ice.
To model the forced convective flow into the fjord and deriveits mass and heat budgets, we modified the method of Motyka andcolleagues9. In this two-layer approach, subglacial water dischargedrives ocean convection, drawing deep, warm saline waters towardsthe near-vertical terminal ice face, where the two componentsturbulently mix and rise along the face to reach the surface andflow away from the terminus in an overflow plume (Fig. 2). Theascending waters melt ice along the calving face, and contribute tothe overflow plume. Subglacial meltwater typically rises to the watersurface within a kilometre of the ice front11. The overflow plume isnot necessarily homogeneous, because subglacial water is ejected atdiscrete locations across the glacier front. Greenland’s fjords are alsofronted by shallow sills that limit the exchange of warm, saline waterbetween the ocean and the fjord. EQIP andKANGIL have sill depthsof 200m. TOR is 450m deep near the ice front, with a sill depth of300m at the fjord entrance17.
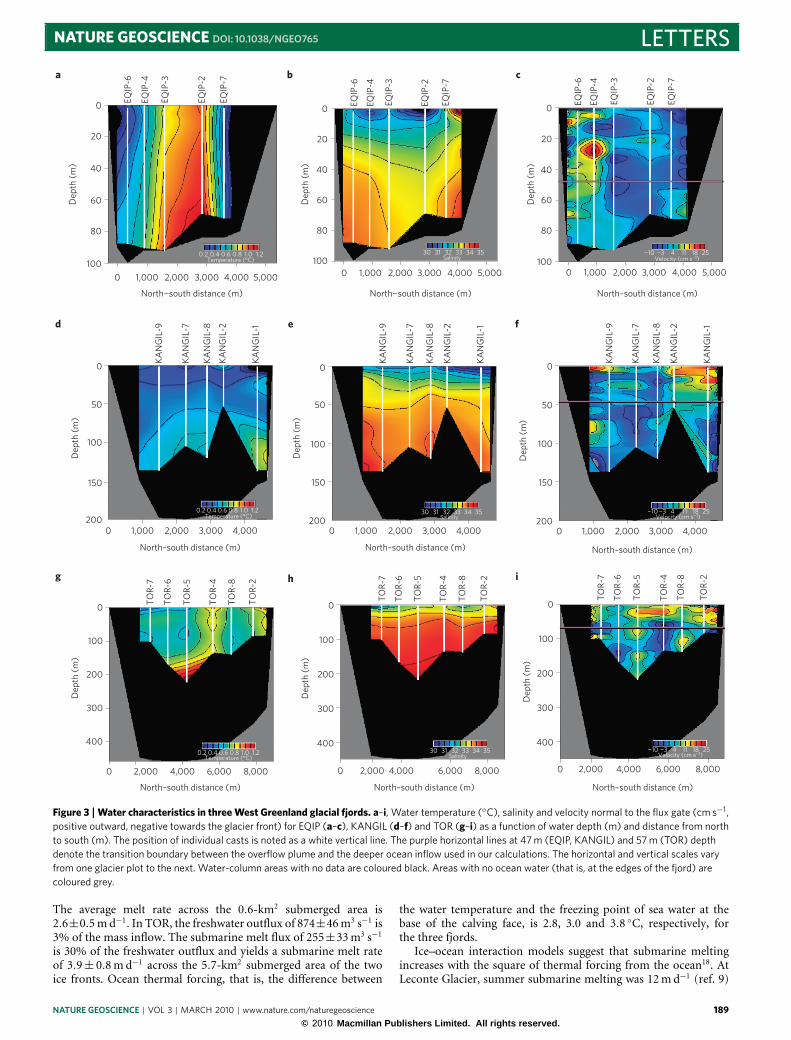
The casts revealed the presence of small jets in the upper 40–60mof the water column (Fig. 3). Salinity and temperature increasewith depth, except at EQIP where the unstratified temperaturedata suggest an inflow of warm water to the glacier centre andan outflow of colder water along the fjord sides. In EQIP, jetsat 10 and 30m depth flow at 30–35 cm s−1 away from the iceto the northwest, along the deepest trough (Figs 1 and 3). Withinflow coming from the south to the glacier centre, this circulationpattern is contrary to that observed in the other fjords andto our simplified model. Below 50m depth, however, currentspeeds drop to a few centimetres per second, agreeing with atwo-layer structure. In KANGIL, high outflow is observed above40m depth along the western and eastern edges of the fjord. InTOR, similar jets are found in the top 60m to the north and
NATURE GEOSCIENCE | VOL 3 | MARCH 2010 | www.nature.com/naturegeoscience 187© 2010 Macmillan Publishers Limited. All rights reserved.
LETTERS NATURE GEOSCIENCE DOI: 10.1038/NGEO765
0
0
0
Sermeq Avangnardleq
Sermeq Kujatdleq
Kangilerngata Sermia
Torssukatak
Fjord
Eqip Sermia
TOR-8
TOR-3TOR-4TOR-5
TOR-7
TOR-2
KANGIL-9KANGIL-7
KANGIL-3KANGIL-10
EQIP-2
EQIP-6300
300
200
200
500
400
100 EQIP-7
KANGIL-8KANGIL-2
EQIP-3
EQIP-4
0 421
N
50° 0’ W50° 15’ W50° 30’ W
Longitude
Latit
ude
70° 0’ N
69° 45’ N
(km)
0
0
Figure 1 | Bathymetry and location of study area. Bathymetric contours (50-m interval, blue lines) and cast locations (yellow dots with cast names) forEqip Sermia, Kangilerngata Sermia, Sermeq Kujatdleq and Sermeq Avangnardleq, West Greenland, overlaid on an ASTER satellite image. Bathymetricsurvey lines are thin red lines. Ocean–ice, land–ice and land–ocean boundaries are, respectively, delineated as thick red, thin black and thin white lines. Theblack square in the inset map shows the location of the glaciers in central West Greenland.
middle of the fjord, all drawing water away from the glacierfront. In all three fjords, we had no visual evidence of upwellingof turbid subglacial waters in front of the glaciers, althoughthese areas were covered in brash ice periodically stirred by thecalving of icebergs.
To evaluate the errors in the simplified two-layer model, weconsidered both the uncertainty in the positioning of the transitionboundary and uncertainties in the average temperature and salinityof the inflow layer (see the Methods section). All calculationsassume steady-state conditions and negligible influence of tidalcurrents. As the flow pattern in EQIP calls our simplifiedmodel intoquestion, we also calculated the mass and heat budget of the entirewater column in EQIP and KANGIL fjords. The results from thetwo approaches agreed quite well (within 2–20%), which providesa verification of our model.
In EQIP, the calculated freshwater outflux of 116± 11m3 s−1is 3% of the incoming flux of 3,362 ± 278m3 s−1. The heatbudget indicates a submarine meltwater production of 5±2m3 s−1for a net submarine melt rate of 0.7 ± 0.2md−1 across the0.6-km2 submerged ice face. In KANGIL, the freshwater outfluxis 286± 61m3 s−1 with a submarine melt flux of 18± 4m3 s−1.
Qp, Hp
Qs, Hs
Deep water Sill
W
Overflow plume
Glacier fjord
Glacier
Qm, Hm
Qsg, Hsg
Figure 2 |A simplified two-layer model of forced convective flow in aglacier fjord. Deep-water access is guarded by a sill and terminated by acalving front9. The incoming mass flux from the deep ocean, Qs, and fromsubglacial water, Qsg, is balanced by the mass flux from the overflow plume,Qp, and the submarine meltwater, Qm. The incoming deep-ocean heat flux,Hs, and subglacial water heat flux, Hsg, melt submarine ice with a heat flux,Hm, to yield an overflow plume with a heat flux, Hp. The overflow plume isnot homogeneous in velocity structure.
188 NATURE GEOSCIENCE | VOL 3 | MARCH 2010 | www.nature.com/naturegeoscience
© 2010 Macmillan Publishers Limited. All rights reserved.
NATURE GEOSCIENCE DOI: 10.1038/NGEO765 LETTERS
0 EQIP
-6
KA
NG
IL-9
TO
R-7
TO
R-6
TO
R-5
TO
R-4
TO
R-8
TO
R-2
TO
R-7
TO
R-6
TO
R-5
TO
R-4
TO
R-8
TO
R-2
TO
R-7
TO
R-6
TO
R-5
TO
R-4
TO
R-8
TO
R-2
KA
NG
IL-7
KA
NG
IL-8
KA
NG
IL-2
KA
NG
IL-1
KA
NG
IL-9
KA
NG
IL-7
KA
NG
IL-8
KA
NG
IL-2
KA
NG
IL-1
KA
NG
IL-9
KA
NG
IL-7
KA
NG
IL-8
KA
NG
IL-2
KA
NG
IL-1
EQIP
-4
EQIP
-3
EQIP
-2
EQIP
-7
EQIP
-6
EQIP
-4
EQIP
-3
EQIP
-2
EQIP
-7
EQIP
-6
EQIP
-4
EQIP
-3
EQIP
-2
EQIP
-7
20
40
60
80
100
1,000 2,000
North¬south distance (m)
North–south distance (m) North–south distance (m) North–south distance (m)
North–south distance (m)
Dep
th (
m)
Dep
th (
m)
Dep
th (
m)
Dep
th (
m)
Dep
th (
m)
Dep
th (
m)
Dep
th (
m)
Dep
th (
m)
Dep
th (
m)
North–south distance (m) North–south distance (m)
North¬south distance (m) North–south distance (m)
3,000 4,000 5,0000
0
20
40
60
80
1001,000 2,000 3,000 4,000 5,0000 1,000 2,000 3,000 4,000 5,0000
0
200
150
100
50
0
200
150
100
50
0
20
40
60
80
100
1,000 2,000 3,000 4,0000 1,000 2,000 3,000 4,0000
400
300
200
100
0
0 2,000 4,000 6,000 8,000 0 2,000 4,000 6,000 8,000 0 2,000 4,000 6,000 8,000
400
300
200
100
0
400
300
200
100
0
a
d
g
e
h
f
i
b c
0.2 0.4 0.6 0.8Temperature (°C)
1.0 1.2 30 ¬10 ¬3 4 11Velocity (cm s¬1)
18 25
¬10 ¬3 4 11 18 25
31 32Salinity
33 34 35
Temperature (°C) Salinity350.2 0.4 0.6 0.8 1.0 1.2
Temperature (°C)0.2 0.4 0.6 0.8 1.0 1.2 ¬10 ¬3 4 11 18 25
30 31 32 33 34
Salinity30 31 32 33 34 35
Velocity (cm s¬1)
Velocity (cm s¬1)
0
200
150
100
50
1,000 2,000 3,000 4,0000
Figure 3 |Water characteristics in three West Greenland glacial fjords. a–i, Water temperature (◦C), salinity and velocity normal to the flux gate (cm s−1,positive outward, negative towards the glacier front) for EQIP (a–c), KANGIL (d–f) and TOR (g–i) as a function of water depth (m) and distance from northto south (m). The position of individual casts is noted as a white vertical line. The purple horizontal lines at 47 m (EQIP, KANGIL) and 57 m (TOR) depthdenote the transition boundary between the overflow plume and the deeper ocean inflow used in our calculations. The horizontal and vertical scales varyfrom one glacier plot to the next. Water-column areas with no data are coloured black. Areas with no ocean water (that is, at the edges of the fjord) arecoloured grey.
The average melt rate across the 0.6-km2 submerged area is2.6±0.5md−1. In TOR, the freshwater outflux of 874±46m3 s−1 is3% of the mass inflow. The submarine melt flux of 255±33m3 s−1is 30% of the freshwater outflux and yields a submarine melt rateof 3.9± 0.8md−1 across the 5.7-km2 submerged area of the twoice fronts. Ocean thermal forcing, that is, the difference between
the water temperature and the freezing point of sea water at thebase of the calving face, is 2.8, 3.0 and 3.8 ◦C, respectively, forthe three fjords.
Ice–ocean interaction models suggest that submarine meltingincreases with the square of thermal forcing from the ocean18. AtLeconte Glacier, summer submarine melting was 12md−1 (ref. 9)
NATURE GEOSCIENCE | VOL 3 | MARCH 2010 | www.nature.com/naturegeoscience 189© 2010 Macmillan Publishers Limited. All rights reserved.
LETTERS NATURE GEOSCIENCE DOI: 10.1038/NGEO765
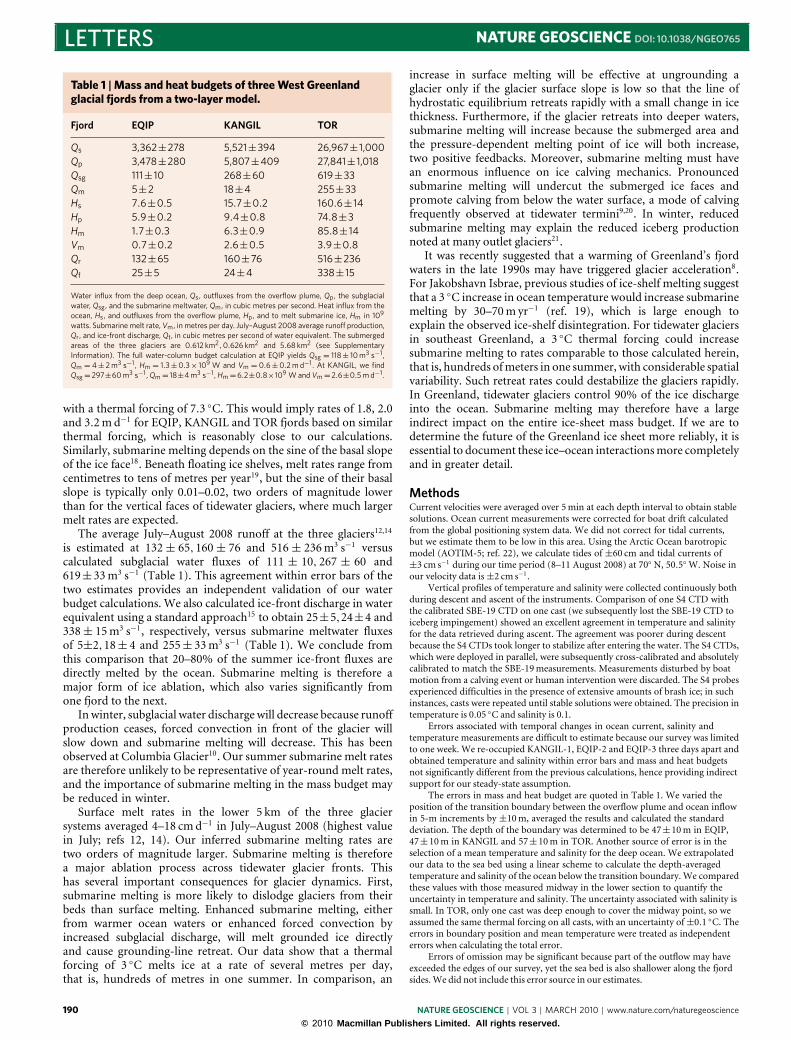
Table 1 |Mass and heat budgets of three West Greenlandglacial fjords from a two-layer model.
Fjord EQIP KANGIL TOR
Qs 3,362±278 5,521±394 26,967± 1,000Qp 3,478±280 5,807±409 27,841± 1,018Qsg 111± 10 268±60 619±33Qm 5±2 18±4 255±33Hs 7.6±0.5 15.7±0.2 160.6± 14Hp 5.9±0.2 9.4±0.8 74.8±3Hm 1.7±0.3 6.3±0.9 85.8± 14Vm 0.7±0.2 2.6±0.5 3.9±0.8Qr 132±65 160±76 516±236Qf 25±5 24±4 338± 15
Water influx from the deep ocean, Qs , outfluxes from the overflow plume, Qp , the subglacialwater, Qsg , and the submarine meltwater, Qm , in cubic metres per second. Heat influx from theocean, Hs , and outfluxes from the overflow plume, Hp , and to melt submarine ice, Hm in 109
watts. Submarine melt rate, Vm , in metres per day. July–August 2008 average runoff production,Qr , and ice-front discharge, Qf , in cubic metres per second of water equivalent. The submergedareas of the three glaciers are 0.612 km2,0.626 km2 and 5.68 km2 (see SupplementaryInformation). The full water-column budget calculation at EQIP yields Qsg = 118± 10 m3 s−1 ,Qm = 4± 2 m3 s−1 , Hm = 1.3±0.3× 10⁹ W and Vm = 0.6±0.2 m d−1 . At KANGIL, we findQsg=297±60 m3 s−1 , Qm= 18±4 m3 s−1 , Hm=6.2±0.8×10⁹ W and Vm=2.6±0.5 m d−1 .
with a thermal forcing of 7.3 ◦C. This would imply rates of 1.8, 2.0and 3.2md−1 for EQIP, KANGIL and TOR fjords based on similarthermal forcing, which is reasonably close to our calculations.Similarly, submarine melting depends on the sine of the basal slopeof the ice face18. Beneath floating ice shelves, melt rates range fromcentimetres to tens of metres per year19, but the sine of their basalslope is typically only 0.01–0.02, two orders of magnitude lowerthan for the vertical faces of tidewater glaciers, where much largermelt rates are expected.
The average July–August 2008 runoff at the three glaciers12,14is estimated at 132± 65,160± 76 and 516± 236m3 s−1 versuscalculated subglacial water fluxes of 111 ± 10, 267 ± 60 and619±33m3 s−1 (Table 1). This agreement within error bars of thetwo estimates provides an independent validation of our waterbudget calculations. We also calculated ice-front discharge in waterequivalent using a standard approach15 to obtain 25±5,24±4 and338± 15m3 s−1, respectively, versus submarine meltwater fluxesof 5±2,18± 4 and 255± 33m3 s−1 (Table 1). We conclude fromthis comparison that 20–80% of the summer ice-front fluxes aredirectly melted by the ocean. Submarine melting is therefore amajor form of ice ablation, which also varies significantly fromone fjord to the next.
In winter, subglacial water discharge will decrease because runoffproduction ceases, forced convection in front of the glacier willslow down and submarine melting will decrease. This has beenobserved at Columbia Glacier10. Our summer submarine melt ratesare therefore unlikely to be representative of year-round melt rates,and the importance of submarine melting in the mass budget maybe reduced in winter.
Surface melt rates in the lower 5 km of the three glaciersystems averaged 4–18 cmd−1 in July–August 2008 (highest valuein July; refs 12, 14). Our inferred submarine melting rates aretwo orders of magnitude larger. Submarine melting is thereforea major ablation process across tidewater glacier fronts. Thishas several important consequences for glacier dynamics. First,submarine melting is more likely to dislodge glaciers from theirbeds than surface melting. Enhanced submarine melting, eitherfrom warmer ocean waters or enhanced forced convection byincreased subglacial discharge, will melt grounded ice directlyand cause grounding-line retreat. Our data show that a thermalforcing of 3 ◦C melts ice at a rate of several metres per day,that is, hundreds of metres in one summer. In comparison, an
increase in surface melting will be effective at ungrounding aglacier only if the glacier surface slope is low so that the line ofhydrostatic equilibrium retreats rapidly with a small change in icethickness. Furthermore, if the glacier retreats into deeper waters,submarine melting will increase because the submerged area andthe pressure-dependent melting point of ice will both increase,two positive feedbacks. Moreover, submarine melting must havean enormous influence on ice calving mechanics. Pronouncedsubmarine melting will undercut the submerged ice faces andpromote calving from below the water surface, a mode of calvingfrequently observed at tidewater termini9,20. In winter, reducedsubmarine melting may explain the reduced iceberg productionnoted at many outlet glaciers21.
It was recently suggested that a warming of Greenland’s fjordwaters in the late 1990s may have triggered glacier acceleration8.For Jakobshavn Isbrae, previous studies of ice-shelf melting suggestthat a 3 ◦C increase in ocean temperature would increase submarinemelting by 30–70m yr−1 (ref. 19), which is large enough toexplain the observed ice-shelf disintegration. For tidewater glaciersin southeast Greenland, a 3 ◦C thermal forcing could increasesubmarine melting to rates comparable to those calculated herein,that is, hundreds ofmeters in one summer, with considerable spatialvariability. Such retreat rates could destabilize the glaciers rapidly.In Greenland, tidewater glaciers control 90% of the ice dischargeinto the ocean. Submarine melting may therefore have a largeindirect impact on the entire ice-sheet mass budget. If we are todetermine the future of the Greenland ice sheet more reliably, it isessential to document these ice–ocean interactionsmore completelyand in greater detail.
MethodsCurrent velocities were averaged over 5min at each depth interval to obtain stablesolutions. Ocean current measurements were corrected for boat drift calculatedfrom the global positioning system data. We did not correct for tidal currents,but we estimate them to be low in this area. Using the Arctic Ocean barotropicmodel (AOTIM-5; ref. 22), we calculate tides of ±60 cm and tidal currents of±3 cm s−1 during our time period (8–11 August 2008) at 70◦ N, 50.5◦W. Noise inour velocity data is±2 cm s−1.
Vertical profiles of temperature and salinity were collected continuously bothduring descent and ascent of the instruments. Comparison of one S4 CTD withthe calibrated SBE-19 CTD on one cast (we subsequently lost the SBE-19 CTD toiceberg impingement) showed an excellent agreement in temperature and salinityfor the data retrieved during ascent. The agreement was poorer during descentbecause the S4 CTDs took longer to stabilize after entering the water. The S4 CTDs,which were deployed in parallel, were subsequently cross-calibrated and absolutelycalibrated to match the SBE-19measurements. Measurements disturbed by boatmotion from a calving event or human intervention were discarded. The S4 probesexperienced difficulties in the presence of extensive amounts of brash ice; in suchinstances, casts were repeated until stable solutions were obtained. The precision intemperature is 0.05 ◦C and salinity is 0.1.
Errors associated with temporal changes in ocean current, salinity andtemperature measurements are difficult to estimate because our survey was limitedto one week. We re-occupied KANGIL-1, EQIP-2 and EQIP-3 three days apart andobtained temperature and salinity within error bars and mass and heat budgetsnot significantly different from the previous calculations, hence providing indirectsupport for our steady-state assumption.
The errors in mass and heat budget are quoted in Table 1. We varied theposition of the transition boundary between the overflow plume and ocean inflowin 5-m increments by ±10m, averaged the results and calculated the standarddeviation. The depth of the boundary was determined to be 47±10m in EQIP,47±10m in KANGIL and 57±10m in TOR. Another source of error is in theselection of a mean temperature and salinity for the deep ocean. We extrapolatedour data to the sea bed using a linear scheme to calculate the depth-averagedtemperature and salinity of the ocean below the transition boundary. We comparedthese values with those measured midway in the lower section to quantify theuncertainty in temperature and salinity. The uncertainty associated with salinity issmall. In TOR, only one cast was deep enough to cover the midway point, so weassumed the same thermal forcing on all casts, with an uncertainty of±0.1 ◦C. Theerrors in boundary position and mean temperature were treated as independenterrors when calculating the total error.
Errors of omission may be significant because part of the outflow may haveexceeded the edges of our survey, yet the sea bed is also shallower along the fjordsides.We did not include this error source in our estimates.
190 NATURE GEOSCIENCE | VOL 3 | MARCH 2010 | www.nature.com/naturegeoscience
© 2010 Macmillan Publishers Limited. All rights reserved.
NATURE GEOSCIENCE DOI: 10.1038/NGEO765 LETTERSReceived 10 September 2009; accepted 5 January 2010;published online 14 February 2010
References1. Rignot, E. & Kanagaratnam, P. Changes in the velocity structure of the
Greenland Ice Sheet. Science 311, 986–990 (2006).2. Howat, I., Joughin, I. & Scambos, T. Rapid changes in ice discharge from
Greenland outlet glaciers. Science 315, 1559–1561 (2007).3. Luckman, A., Murray, T., de Lange, R. & Hanna, E. Rapid and synchronous
ice-dynamic changes in East Greenland. Geophys. Res. Lett. 33, L03503 (2006).4. Joughin, I., Abdalati, W. & Fahnestock, M. Large fluctuations in speed on
Greenland’s Jakobshavn Isbrae glacier. Nature 432, 608–610 (2004).5. Thomas, R. H. Force-perturbation analysis of recent thinning and acceleration
of Jakobshavn Isbrae. Greenland J. Glaciol. 50, 57–66 (2004).6. Thomas, R. H., Rignot, E., Kanagaratnam, P., Krabill, W. & Casassa, G.
Force-perturbation analysis of Pine Island Glacier, Antarctica, suggests causefor recent acceleration. Ann. Glaciol. 39, 133–138 (2004).
7. Howat, I., Joughin, I., Tulaczyk, S. &Gogineni, S. Rapid retreat and accelerationof Helheim Glacier, East Greenland. Geophys. Res. Lett. 32, L22502 (2005).
8. Holland, D., Thomas, R. H., de Young, B. & Ribergaard, M. H. Acceleration ofJakobshavn Isbrae triggered by warm subsurface ocean waters. Nature Geosci.1, 659–664 (2008).
9. Motyka, R., Hunter, L., Echelmeyer, K. & Connor, C. Submarine melting atthe terminus of a temperate tidewater glacier, Leconte Glacier, Alaska, USA.Ann. Glaciol. 36, 57–65 (2003).
10. Walters, R., Josberger, E. G. & Driedger, C. L. Columbia Bay, Alaska: An upsidedown estuary. Estuarine, Coastal and Shelf. Science 26, 607–617 (1988).
11. Horne, E. P. Ice-induced vertical circulation in an Arctic fjord. J. Geophys. Res.90, 1078–1086 (1985).
12. Box, J. et al. Greenland Ice Sheet surface mass balance variability (1988–2004)from calibrated polar MM5 output. J. Clim. 19, 2783–2800 (2006).
13. Hanna, E. et al. Increased runoff from melt from the Greenland Ice Sheet: Aresponse to global warming. J. Clim. 21, 331–341 (2008).
14. Ettema, J. et al. Higher surface mass balance of the Greenland ice sheetrevealed by high-resolution climate modelling. Geophys. Res. Lett. 36,L12501 (2009).
15. Rignot, E., Box, J. E., Burgess, E. & Hanna, E. Mass balance of the GreenlandIce Sheet from 1958 to 2007. Geophys. Res. Lett. 35, L20502 (2008).
16. Joughin, I. et al. Seasonal speedup along the western flank of the Greenland IceSheet. Science 320, 781–783 (2008).
17. Smith, W. H. F. & Sandwell, D. Global seafloor topography from satellitealtimetry and ship depth soundings. Science 277, 1957–1962 (1997).
18. Holland, P., Jenkins, A. & Holland, D. The response of ice shelf basal meltingto variations in ocean temperature. J. Clim. 21, 2558–2572 (2008).
19. Rignot, E. & Jacobs, S. S. Rapid bottom melting widespread near Antarctic IceSheet grounding lines. Science 296, 2020–2023 (2002).
20. Warren, C. R. Terminal environment, topographic control and fluctuations ofWest Greenland glaciers. Boreas 20, 1–15 (1991).
21. Sohn, H. G., Jezek, K. & van der Veen, C. Jakobshavn Glacier, West Greenland:30 years of spaceborne observations. Geophys. Res. Lett. 25, 2699–2702 (1998).
22. Padman, L. & Erofeeva, S. A barotopic inverse tidal model for the Arctic Ocean.Geophys. Res. Lett. 31, L02303 (2004).
AcknowledgementsThis work was carried out at the Earth System Science Department of Physical Sciences,University of California, Irvine and at the California Institute of Technology’s JetPropulsion Laboratory under a contract with the National Aeronautics and SpaceAdministration’s Cryospheric Science Program. We thank B. Hallet, K. Steffen,E. Domack and S. Tulacyk for their generous loan of oceanographic equipment used, andJ. Box and J. Ettema for providing estimates of summer 2008 runoff.
Author contributionsAll authors discussed the results and commented on the manuscript. E.R. led theanalysis, development of the paper and integration of the results with other data.M.K. analysed the ocean data and the ice-front bathymetry. I.V. helped collect andanalyse the ocean data.
Additional informationThe authors declare no competing financial interests. Supplementary informationaccompanies this paper on www.nature.com/naturegeoscience. Reprints and permissionsinformation is available online at http://npg.nature.com/reprintsandpermissions.Correspondence and requests formaterials should be addressed to E.R.
NATURE GEOSCIENCE | VOL 3 | MARCH 2010 | www.nature.com/naturegeoscience 191© 2010 Macmillan Publishers Limited. All rights reserved.