Embed Size (px)
Citation preview
AFRL-RX-TY-TR-2010-0094
RAPID SET MATERIALS FOR ADVANCED SPALL REPAIR
Michael I. Hammons Airbase Technologies Division Air Force Research Laboratory 139 Barnes Drive, Suite 2 Tyndall Air Force Base, FL 32403-5323 Jeffrey C. Petermann and Athar Saeed Applied Research Associates, Inc. P.O. Box 40128 Tyndall Air Force Base, FL 32403-5323 Contract No. FA4819-09-C-0028 August 2010
AIR FORCE RESEARCH LABORATORY MATERIALS AND MANUFACTURING DIRECTORATE
Air Force Materiel Command
United States Air Force Tyndall Air Force Base, FL 32403-5323
DISTRIBUTION A: Approved for public release; distribution unlimited. 88ABW-2012-6515, 17 December 2012
DISCLAIMER
Reference herein to any specific commercial product, process, or service by trade name,
trademark, manufacturer, or otherwise does not constitute or imply its endorsement,
recommendation, or approval by the United States Air Force. The views and opinions of
authors expressed herein do not necessarily state or reflect those of the United States Air
Force.
This report was prepared as an account of work sponsored by the United States Air Force.
Neither the United States Air Force, nor any of its employees, makes any warranty,
expressed or implied, or assumes any legal liability or responsibility for the accuracy,
completeness, or usefulness of any information, apparatus, product, or process disclosed, or
represents that its use would not infringe privately owned rights.
Standard Form 298 (Rev. 8/98)
REPORT DOCUMENTATION PAGE
Prescribed by ANSI Std. Z39.18
Form Approved OMB No. 0704-0188
The public reporting burden for this collection of information is estimated to average 1 hour per response, including the time for reviewing instructions, searching existing data sources, gathering and maintaining the data needed, and completing and reviewing the collection of information. Send comments regarding this burden estimate or any other aspect of this collection of information, including suggestions for reducing the burden, to Department of Defense, Washington Headquarters Services, Directorate for Information Operations and Reports (0704-0188), 1215 Jefferson Davis Highway, Suite 1204, Arlington, VA 22202-4302. Respondents should be aware that notwithstanding any other provision of law, no person shall be subject to any penalty for failing to comply with a collection of information if it does not display a currently valid OMB control number. PLEASE DO NOT RETURN YOUR FORM TO THE ABOVE ADDRESS. 1. REPORT DATE (DD-MM-YYYY) 2. REPORT TYPE 3. DATES COVERED (From - To)
4. TITLE AND SUBTITLE 5a. CONTRACT NUMBER
5b. GRANT NUMBER
5c. PROGRAM ELEMENT NUMBER
5d. PROJECT NUMBER
5e. TASK NUMBER
5f. WORK UNIT NUMBER
6. AUTHOR(S)
7. PERFORMING ORGANIZATION NAME(S) AND ADDRESS(ES) 8. PERFORMING ORGANIZATION REPORT NUMBER
9. SPONSORING/MONITORING AGENCY NAME(S) AND ADDRESS(ES) 10. SPONSOR/MONITOR'S ACRONYM(S)
11. SPONSOR/MONITOR'S REPORT NUMBER(S)
12. DISTRIBUTION/AVAILABILITY STATEMENT
13. SUPPLEMENTARY NOTES
14. ABSTRACT
15. SUBJECT TERMS
16. SECURITY CLASSIFICATION OF: a. REPORT b. ABSTRACT c. THIS PAGE
17. LIMITATION OF ABSTRACT
18. NUMBER OF PAGES
19a. NAME OF RESPONSIBLE PERSON
19b. TELEPHONE NUMBER (Include area code)
31-AUG-2010 Final Technical Report 01-OCT-2007 -- 31-JUL-2010
Rapid Set Materials for Advanced Spall Repair FA4819-09-C-0028
0602102F
4915
D1
4915D14B
**Hammons, Michael I.; *Petermann, Jeffrey C.; *Saeed, Athar
*Applied Research Associates, P.O. Box 40128, Tyndall Air Force Base, FL 32403 **Air Force Research Laboratory, Materials and Manufacturing Directorate, Airbase Technologies Division, 139 Barnes Drive, Suite 2, Tyndall Air Force Base, FL 32403-5323
Headquarters, Air Force Civil Engineer Support Agency 139 Barnes Drive, Suite 1 Tyndall Air Force Base, FL 32403-5319
HQ AFCESA, AFRL/RXQEM
AFRL-RX-TY-TR-2010-0094
Distribution A: Approved for public release; distribution unlimited.
Ref Public Affairs Case # 88ABW-2012-6515, 17 December 2012. Document contains color images.
The objective of this research was to evaluate rapid-set materials for use in deep spall repair. The evaluation process considered the following thermal and mechanical properties: elasticity, modulus of elasticity, creep, bond strength, compressive strength, tensile strength, modulus of rupture, and the coefficient of thermal expansion.
pavement, spall repair, airfield damage repair, cementitious materials
U U U UU 50
Angelica Cubillos
Reset
i Distribution A: Approved for public release; distribution unlimited. 88ABW-2012-6515, 17 December 2012
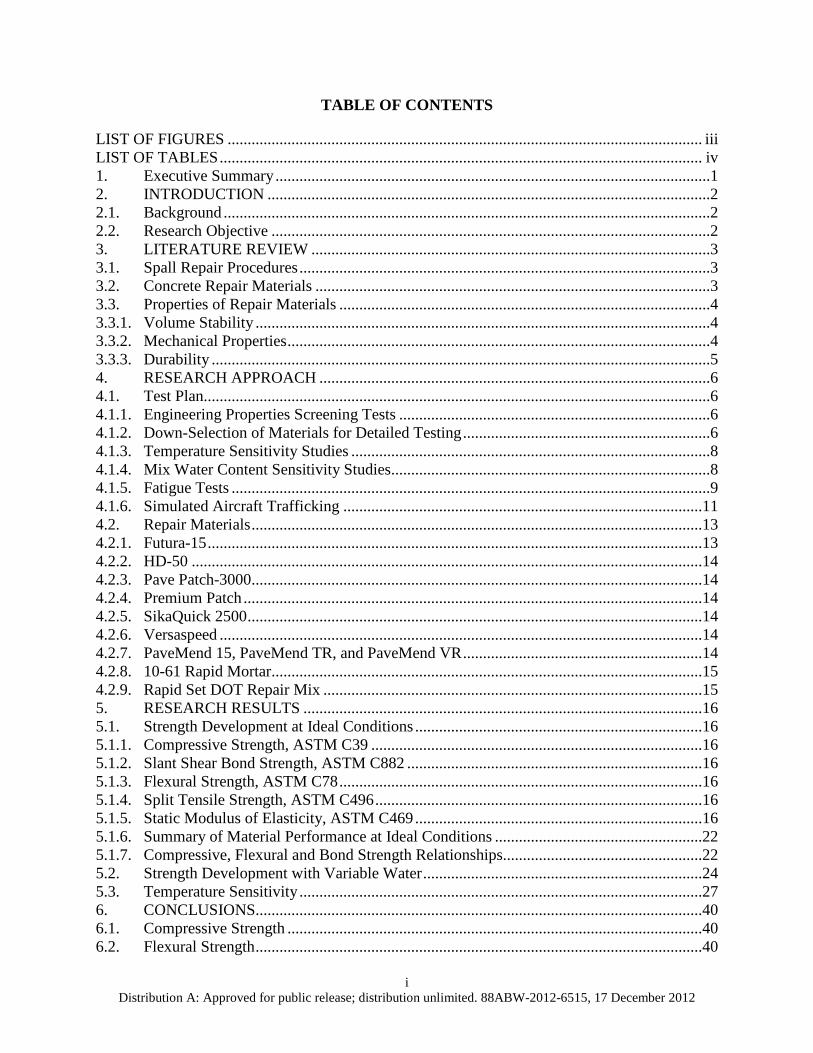
TABLE OF CONTENTS
LIST OF FIGURES ....................................................................................................................... iii LIST OF TABLES ......................................................................................................................... iv 1. Executive Summary .............................................................................................................1 2. INTRODUCTION ...............................................................................................................2 2.1. Background ..........................................................................................................................2 2.2. Research Objective ..............................................................................................................2 3. LITERATURE REVIEW ....................................................................................................3 3.1. Spall Repair Procedures .......................................................................................................3 3.2. Concrete Repair Materials ...................................................................................................3 3.3. Properties of Repair Materials .............................................................................................4 3.3.1. Volume Stability ..................................................................................................................4 3.3.2. Mechanical Properties ..........................................................................................................4 3.3.3. Durability .............................................................................................................................5 4. RESEARCH APPROACH ..................................................................................................6 4.1. Test Plan...............................................................................................................................6 4.1.1. Engineering Properties Screening Tests ..............................................................................6 4.1.2. Down-Selection of Materials for Detailed Testing ..............................................................6 4.1.3. Temperature Sensitivity Studies ..........................................................................................8 4.1.4. Mix Water Content Sensitivity Studies................................................................................8 4.1.5. Fatigue Tests ........................................................................................................................9 4.1.6. Simulated Aircraft Trafficking ..........................................................................................11 4.2. Repair Materials .................................................................................................................13 4.2.1. Futura-15 ............................................................................................................................13 4.2.2. HD-50 ................................................................................................................................14 4.2.3. Pave Patch-3000.................................................................................................................14 4.2.4. Premium Patch ...................................................................................................................14 4.2.5. SikaQuick 2500 ..................................................................................................................14 4.2.6. Versaspeed .........................................................................................................................14 4.2.7. PaveMend 15, PaveMend TR, and PaveMend VR ............................................................14 4.2.8. 10-61 Rapid Mortar............................................................................................................15 4.2.9. Rapid Set DOT Repair Mix ...............................................................................................15 5. RESEARCH RESULTS ....................................................................................................16 5.1. Strength Development at Ideal Conditions ........................................................................16 5.1.1. Compressive Strength, ASTM C39 ...................................................................................16 5.1.2. Slant Shear Bond Strength, ASTM C882 ..........................................................................16 5.1.3. Flexural Strength, ASTM C78 ...........................................................................................16 5.1.4. Split Tensile Strength, ASTM C496 ..................................................................................16 5.1.5. Static Modulus of Elasticity, ASTM C469 ........................................................................16 5.1.6. Summary of Material Performance at Ideal Conditions ....................................................22 5.1.7. Compressive, Flexural and Bond Strength Relationships..................................................22 5.2. Strength Development with Variable Water ......................................................................24 5.3. Temperature Sensitivity .....................................................................................................27 6. CONCLUSIONS................................................................................................................40 6.1. Compressive Strength ........................................................................................................40 6.2. Flexural Strength ................................................................................................................40
ii Distribution A: Approved for public release; distribution unlimited. 88ABW-2012-6515, 17 December 2012
6.3. Slant Shear Bond Strength .................................................................................................40 6.4. Split Tensile Strength .........................................................................................................40 6.5. Additional Testing Regimes ..............................................................................................40 6.5.1. Temperature Sensitivity .....................................................................................................40 6.5.2. Effects of Variable Water ..................................................................................................41 6.5.3. Field Loading .....................................................................................................................41 7. RECOMMENDATIONS ...................................................................................................42 8. REFERENCES ..................................................................................................................43 LIST OF SYMBOLS, ABBREVIATIONS, AND ACRONYMS ................................................45
iii Distribution A: Approved for public release; distribution unlimited. 88ABW-2012-6515, 17 December 2012
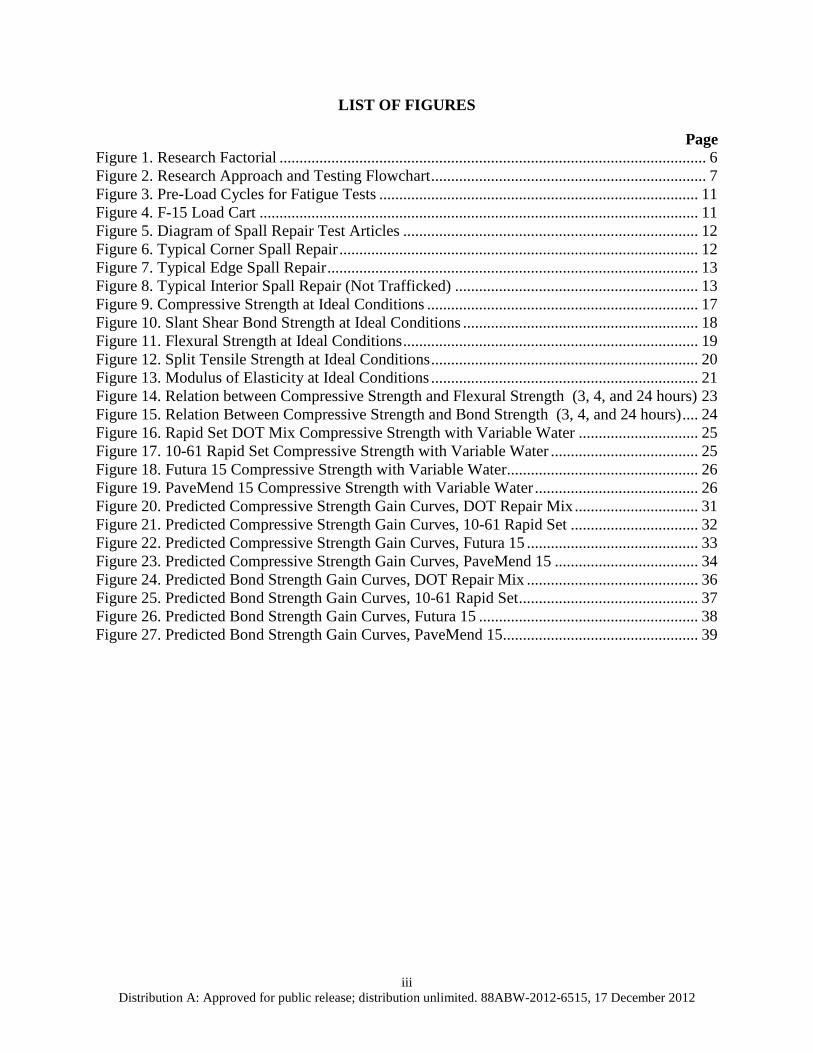
LIST OF FIGURES
Page Figure 1. Research Factorial ........................................................................................................... 6 Figure 2. Research Approach and Testing Flowchart ..................................................................... 7 Figure 3. Pre-Load Cycles for Fatigue Tests ................................................................................ 11 Figure 4. F-15 Load Cart .............................................................................................................. 11 Figure 5. Diagram of Spall Repair Test Articles .......................................................................... 12 Figure 6. Typical Corner Spall Repair .......................................................................................... 12 Figure 7. Typical Edge Spall Repair ............................................................................................. 13 Figure 8. Typical Interior Spall Repair (Not Trafficked) ............................................................. 13 Figure 9. Compressive Strength at Ideal Conditions .................................................................... 17 Figure 10. Slant Shear Bond Strength at Ideal Conditions ........................................................... 18 Figure 11. Flexural Strength at Ideal Conditions .......................................................................... 19 Figure 12. Split Tensile Strength at Ideal Conditions ................................................................... 20 Figure 13. Modulus of Elasticity at Ideal Conditions ................................................................... 21 Figure 14. Relation between Compressive Strength and Flexural Strength (3, 4, and 24 hours) 23 Figure 15. Relation Between Compressive Strength and Bond Strength (3, 4, and 24 hours) .... 24 Figure 16. Rapid Set DOT Mix Compressive Strength with Variable Water .............................. 25 Figure 17. 10-61 Rapid Set Compressive Strength with Variable Water ..................................... 25 Figure 18. Futura 15 Compressive Strength with Variable Water................................................ 26 Figure 19. PaveMend 15 Compressive Strength with Variable Water ......................................... 26 Figure 20. Predicted Compressive Strength Gain Curves, DOT Repair Mix ............................... 31 Figure 21. Predicted Compressive Strength Gain Curves, 10-61 Rapid Set ................................ 32 Figure 22. Predicted Compressive Strength Gain Curves, Futura 15 ........................................... 33 Figure 23. Predicted Compressive Strength Gain Curves, PaveMend 15 .................................... 34 Figure 24. Predicted Bond Strength Gain Curves, DOT Repair Mix ........................................... 36 Figure 25. Predicted Bond Strength Gain Curves, 10-61 Rapid Set ............................................. 37 Figure 26. Predicted Bond Strength Gain Curves, Futura 15 ....................................................... 38 Figure 27. Predicted Bond Strength Gain Curves, PaveMend 15................................................. 39
iv Distribution A: Approved for public release; distribution unlimited. 88ABW-2012-6515, 17 December 2012
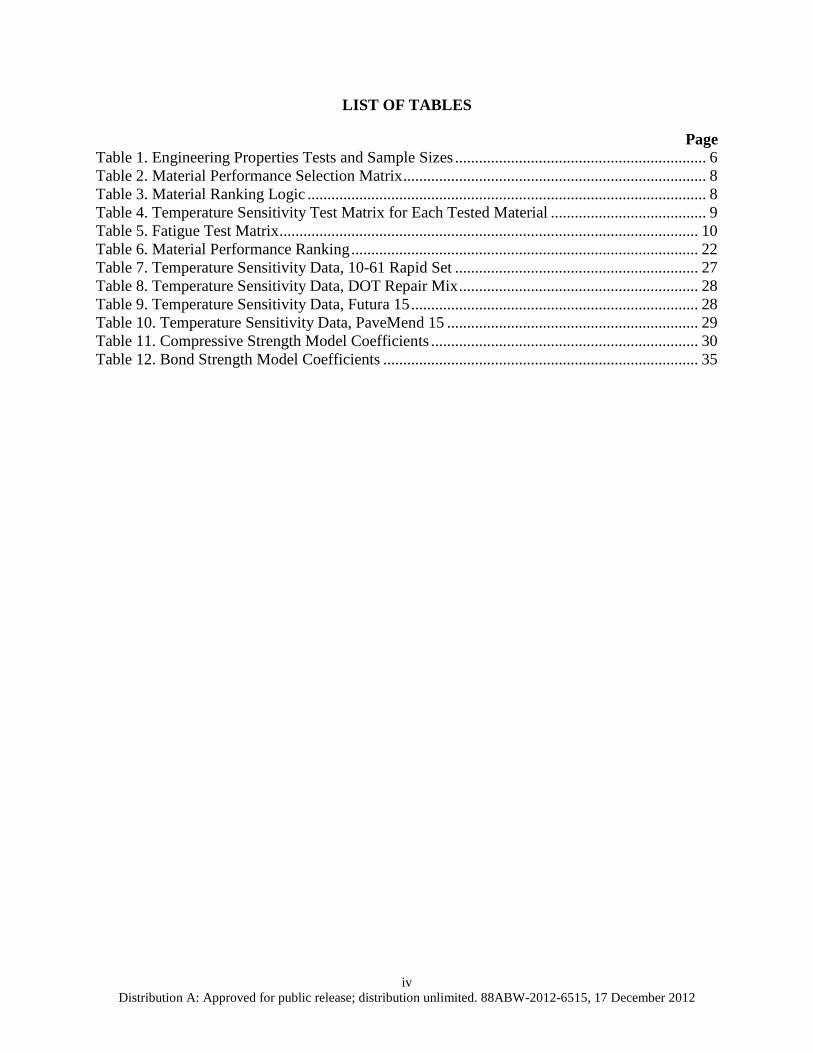
LIST OF TABLES
Page Table 1. Engineering Properties Tests and Sample Sizes ............................................................... 6 Table 2. Material Performance Selection Matrix ............................................................................ 8 Table 3. Material Ranking Logic .................................................................................................... 8 Table 4. Temperature Sensitivity Test Matrix for Each Tested Material ....................................... 9 Table 5. Fatigue Test Matrix ......................................................................................................... 10 Table 6. Material Performance Ranking ....................................................................................... 22 Table 7. Temperature Sensitivity Data, 10-61 Rapid Set ............................................................. 27 Table 8. Temperature Sensitivity Data, DOT Repair Mix ............................................................ 28 Table 9. Temperature Sensitivity Data, Futura 15 ........................................................................ 28 Table 10. Temperature Sensitivity Data, PaveMend 15 ............................................................... 29 Table 11. Compressive Strength Model Coefficients ................................................................... 30 Table 12. Bond Strength Model Coefficients ............................................................................... 35
1 Distribution A: Approved for public release; distribution unlimited. 88ABW-2012-6515, 17 December 2012
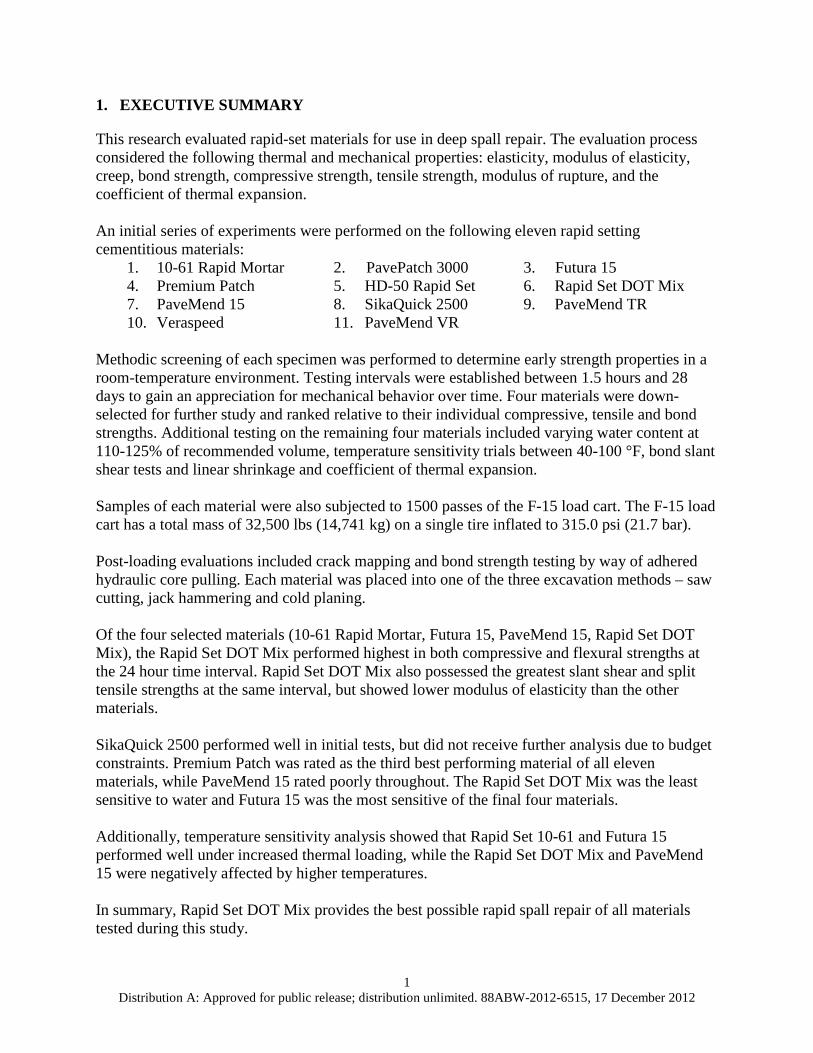
1. EXECUTIVE SUMMARY
This research evaluated rapid-set materials for use in deep spall repair. The evaluation process considered the following thermal and mechanical properties: elasticity, modulus of elasticity, creep, bond strength, compressive strength, tensile strength, modulus of rupture, and the coefficient of thermal expansion. An initial series of experiments were performed on the following eleven rapid setting cementitious materials:
1. 10-61 Rapid Mortar 2. PavePatch 3000 3. Futura 15 4. Premium Patch 5. HD-50 Rapid Set 6. Rapid Set DOT Mix 7. PaveMend 15 8. SikaQuick 2500 9. PaveMend TR 10. Veraspeed 11. PaveMend VR
Methodic screening of each specimen was performed to determine early strength properties in a room-temperature environment. Testing intervals were established between 1.5 hours and 28 days to gain an appreciation for mechanical behavior over time. Four materials were down-selected for further study and ranked relative to their individual compressive, tensile and bond strengths. Additional testing on the remaining four materials included varying water content at 110-125% of recommended volume, temperature sensitivity trials between 40-100 °F, bond slant shear tests and linear shrinkage and coefficient of thermal expansion. Samples of each material were also subjected to 1500 passes of the F-15 load cart. The F-15 load cart has a total mass of 32,500 lbs (14,741 kg) on a single tire inflated to 315.0 psi (21.7 bar). Post-loading evaluations included crack mapping and bond strength testing by way of adhered hydraulic core pulling. Each material was placed into one of the three excavation methods – saw cutting, jack hammering and cold planing. Of the four selected materials (10-61 Rapid Mortar, Futura 15, PaveMend 15, Rapid Set DOT Mix), the Rapid Set DOT Mix performed highest in both compressive and flexural strengths at the 24 hour time interval. Rapid Set DOT Mix also possessed the greatest slant shear and split tensile strengths at the same interval, but showed lower modulus of elasticity than the other materials. SikaQuick 2500 performed well in initial tests, but did not receive further analysis due to budget constraints. Premium Patch was rated as the third best performing material of all eleven materials, while PaveMend 15 rated poorly throughout. The Rapid Set DOT Mix was the least sensitive to water and Futura 15 was the most sensitive of the final four materials. Additionally, temperature sensitivity analysis showed that Rapid Set 10-61 and Futura 15 performed well under increased thermal loading, while the Rapid Set DOT Mix and PaveMend 15 were negatively affected by higher temperatures. In summary, Rapid Set DOT Mix provides the best possible rapid spall repair of all materials tested during this study.
2 Distribution A: Approved for public release; distribution unlimited. 88ABW-2012-6515, 17 December 2012
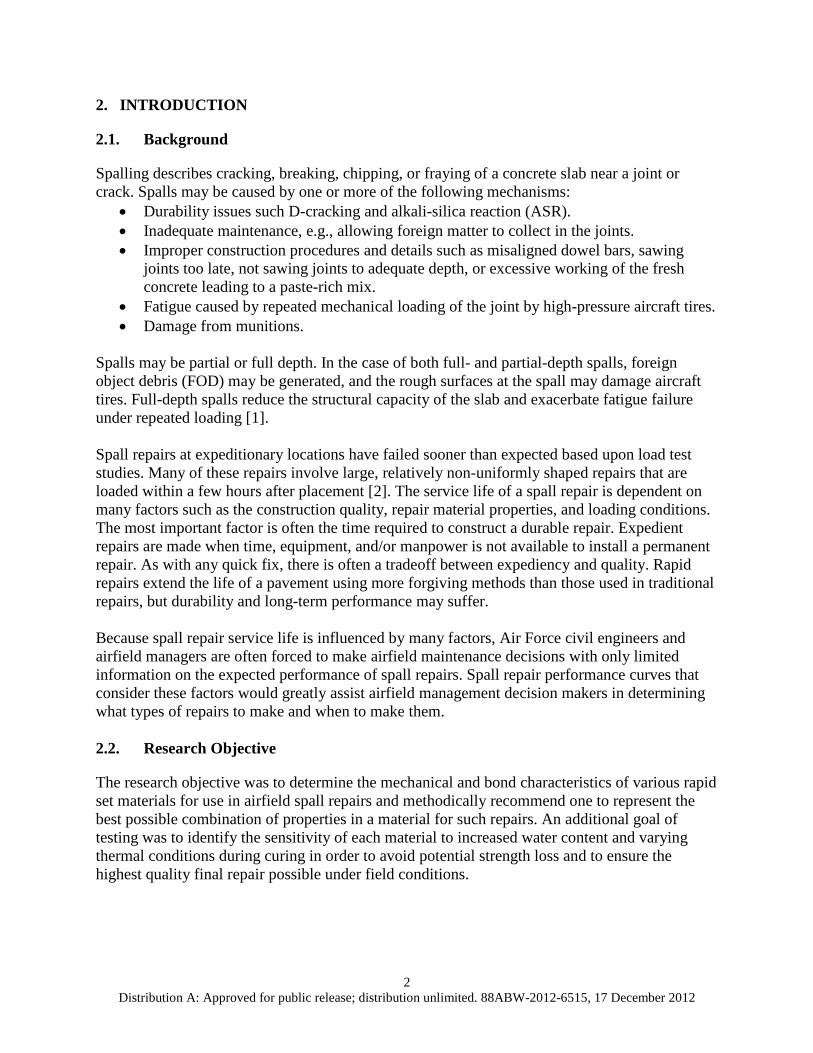
2. INTRODUCTION
2.1. Background
Spalling describes cracking, breaking, chipping, or fraying of a concrete slab near a joint or crack. Spalls may be caused by one or more of the following mechanisms:
• Durability issues such D-cracking and alkali-silica reaction (ASR). • Inadequate maintenance, e.g., allowing foreign matter to collect in the joints. • Improper construction procedures and details such as misaligned dowel bars, sawing
joints too late, not sawing joints to adequate depth, or excessive working of the fresh concrete leading to a paste-rich mix.
• Fatigue caused by repeated mechanical loading of the joint by high-pressure aircraft tires. • Damage from munitions.
Spalls may be partial or full depth. In the case of both full- and partial-depth spalls, foreign object debris (FOD) may be generated, and the rough surfaces at the spall may damage aircraft tires. Full-depth spalls reduce the structural capacity of the slab and exacerbate fatigue failure under repeated loading [1]. Spall repairs at expeditionary locations have failed sooner than expected based upon load test studies. Many of these repairs involve large, relatively non-uniformly shaped repairs that are loaded within a few hours after placement [2]. The service life of a spall repair is dependent on many factors such as the construction quality, repair material properties, and loading conditions. The most important factor is often the time required to construct a durable repair. Expedient repairs are made when time, equipment, and/or manpower is not available to install a permanent repair. As with any quick fix, there is often a tradeoff between expediency and quality. Rapid repairs extend the life of a pavement using more forgiving methods than those used in traditional repairs, but durability and long-term performance may suffer. Because spall repair service life is influenced by many factors, Air Force civil engineers and airfield managers are often forced to make airfield maintenance decisions with only limited information on the expected performance of spall repairs. Spall repair performance curves that consider these factors would greatly assist airfield management decision makers in determining what types of repairs to make and when to make them. 2.2. Research Objective
The research objective was to determine the mechanical and bond characteristics of various rapid set materials for use in airfield spall repairs and methodically recommend one to represent the best possible combination of properties in a material for such repairs. An additional goal of testing was to identify the sensitivity of each material to increased water content and varying thermal conditions during curing in order to avoid potential strength loss and to ensure the highest quality final repair possible under field conditions.
3 Distribution A: Approved for public release; distribution unlimited. 88ABW-2012-6515, 17 December 2012
3. LITERATURE REVIEW
3.1. Spall Repair Procedures
The normal procedure for repairing a spall is outlined in Engineering Technical Letter (ETL) 07-8 as follows [2]:
• Remove loose debris from the damaged area. • Mark the outer edge of the repair (2 to 3 in beyond the damaged area).
o The shape should be a rectangle or pentagon. o The aspect ratio should be less than two. o The largest dimension should be 8 ft (2.4 m) or less.
• Saw the edges of the repair to a depth of at least 2 in (50 mm). • Do not feather the repair. • Make additional cuts within the bounds of the repair edges using a concrete saw. • Make transverse cuts on each end at 1.5 in (38 mm) from the ends of the repair. • Remove the remaining material using a small jack hammer (30 pounds or less). • Remove loose debris from the repair area. • Wash the repair area with a high-pressure washer or use water and a scrub brush. • Remove any loose material or lodged debris from the joint or crack. • Place a small bead of caulk over the joint or crack. • If using a cement-based repair material, soak the repair and leave saturated surface dry
(SSD). • Place a compressible insert material over any joint or crack in the repair area. • Mix the materials in accordance with manufacturers’ recommendations. • A temperature gun (thermometer) should be used to check the temperature of the water
and material before mixing, as well as the temperature of the material during mixing. • Pour/place the material in the repair. • Clean mixing and placement equipment immediately after use. • When using cement repair materials, either wet cure or apply curing compound. • Remove the compressible spacer insert after the repair has cured. • Reseal the joint.
3.2. Concrete Repair Materials
In recent years, new repair materials have been introduced into the marketplace. The American Concrete Institute (ACI) 546.3R document lists the following broad categories of concrete repair materials [2]:
• Portland or blended cement-based mortar and concrete • Portland or blended cement-based silica fume mortar and concrete • Portland or blended cement-based polymer-cement mortar and concrete • Magnesium-ammonium-phosphate-cement mortar and concrete • Polymer-based mortar and concrete
Within each of these broad categories of repair materials, it is possible to find a wide variation in engineering properties. Manufacturers of these materials may change the formulations so that by
4 Distribution A: Approved for public release; distribution unlimited. 88ABW-2012-6515, 17 December 2012
the time research studies have been completed, the results of the study do not reflect the properties of the new product [4]. The performance of a repair depends to a large extent on the behavior and compatibility of the repair material and the existing substrate as a composite system [4]. It is often difficult to find the engineering data needed to evaluate a product [2]. In some cases, engineering data for the product may not be provided by the manufacturer. In other cases, data are presented in terms of non-standard or modified test protocols making direct comparison of products problematic. 3.3. Properties of Repair Materials
The engineering properties of repair materials vary widely with each material. Speer [1] stated that finding an ideal material is difficult, because one material may excel in certain respects, it may be deficient in others. ACI 546.3R presents a discussion of properties that should be considered, and these are summarized in the following paragraphs: 3.3.1. Volume Stability Volume stability refers to changes in the linear dimensions of the repair material. Most cementitious materials undergo volume change due to external and autogenous shrinkage in the first few hours and days after mixing. Differential volume change between the repair and substrate leads to shear stresses at the interface, and if these stresses exceed the bond strength, debonding can occur. If the bond remains intact, the restraint provided by the substrate may exceed the tensile strain capacity of the repair material resulting in relief cracking. Also, excessive expansion of the repair material can lead to “blow up” of the material within the repair. 3.3.2. Mechanical Properties Mechanical properties reveal a material’s elastic and inelastic behavior when a load is applied. It is usually unnecessary for the repair material to have mechanical properties in excess of the substrate. However, if some of the mechanical properties are vastly different than those of the substrate, problems may ensue. For example, large differences in stiffness between the repair material and substrate may lead to stress concentrations which break the bond at the interface between the repair and substrate materials. Important mechanical properties include the following:
• Post Loading Elasticity – The ability of a material to regain its size and shape after removal of a load.
• Modulus of Elasticity – The stiffness of a material measured as the ratio of the normal stress to normal strain in the elastic regime.
• Creep – Time-dependent deformation due to sustained load. • Bond Strength – The resistance to separation between the repair material and the
substrate. • Compressive Strength – The resistance of a material to compressive load. • Tensile Strength – The resistance of a material to tensile load. • Modulus of Rupture (Flexural Strength) – The resistance of a material to bending;
estimates to tensile strength. • Coefficient of Thermal Expansion – The change in linear dimension per unit linear
dimension of a material with a unit change in temperature.

5 Distribution A: Approved for public release; distribution unlimited. 88ABW-2012-6515, 17 December 2012
3.3.3. Durability Durability is the resistance to weathering action, chemical attack, abrasion, and alkali-aggregate reactions, and other degradation mechanisms. Because this research is primarily concerned with short-term performance of the repair in dry, non-freeze/thaw environments, the material durability is not directly addressed.
6 Distribution A: Approved for public release; distribution unlimited. 88ABW-2012-6515, 17 December 2012
4. RESEARCH APPROACH
4.1. Test Plan
This study chose and evaluated eleven commercially-available rapid-setting repair materials. Early strength development was determined for all eleven materials at room temperature following the manufacturer’s recommendations for mixing. 4.1.1. Engineering Properties Screening Tests Table 1 summarizes the strength tests and sample sizes. From the start mixing, three samples were tested at 1.5 hours, 2 hours, 3 hours, 4 hours, 24 hours and 28 days intervals.
Table 1. Engineering Properties Tests and Sample Sizes Strength Parameter and
Testing Protocol Sample Size
Compressive strength ASTM C39 3-in diameter × 6-in long cylinder
Flexural strength ASTM C78 3-in wide × 16-in long beam × 4-in thick beam
Splitting tensile strength ASTM C496 3-in diameter × 6-in long cylinder
Slant shear bond strength ASTM C882 3-in diameter × 6-in long cylinder
Modulus of elasticity ASTM C469 3-in diameter × 6-in long cylinder
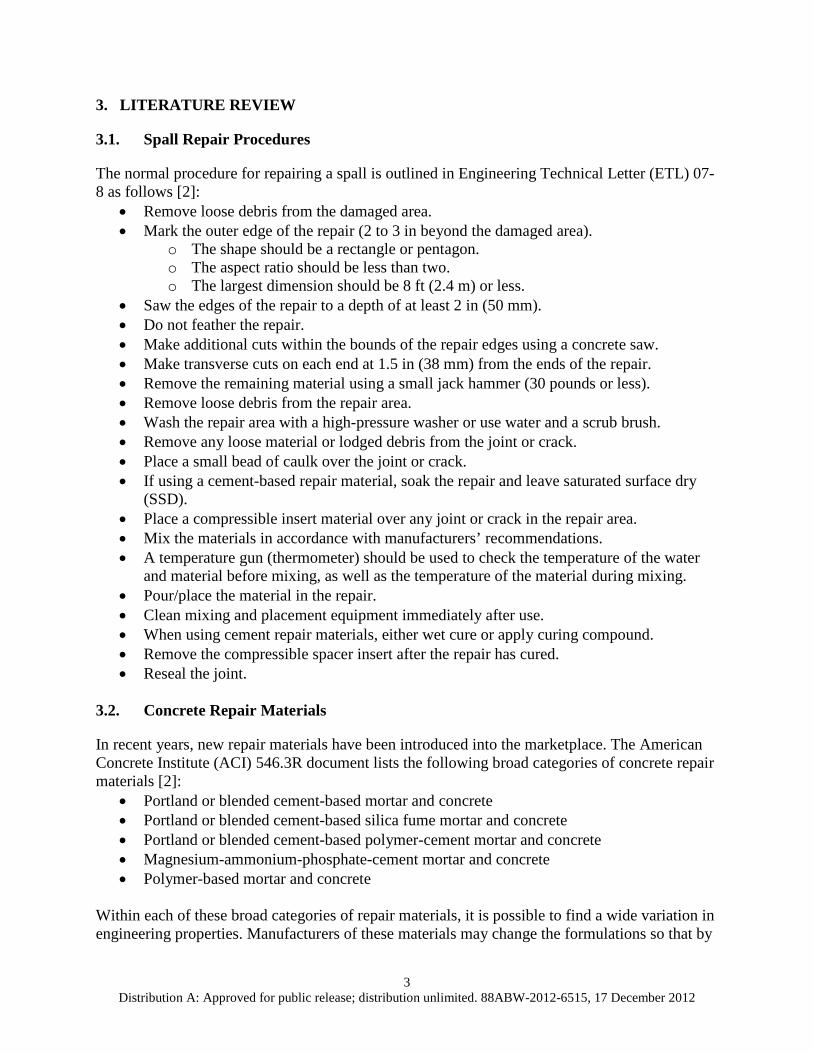
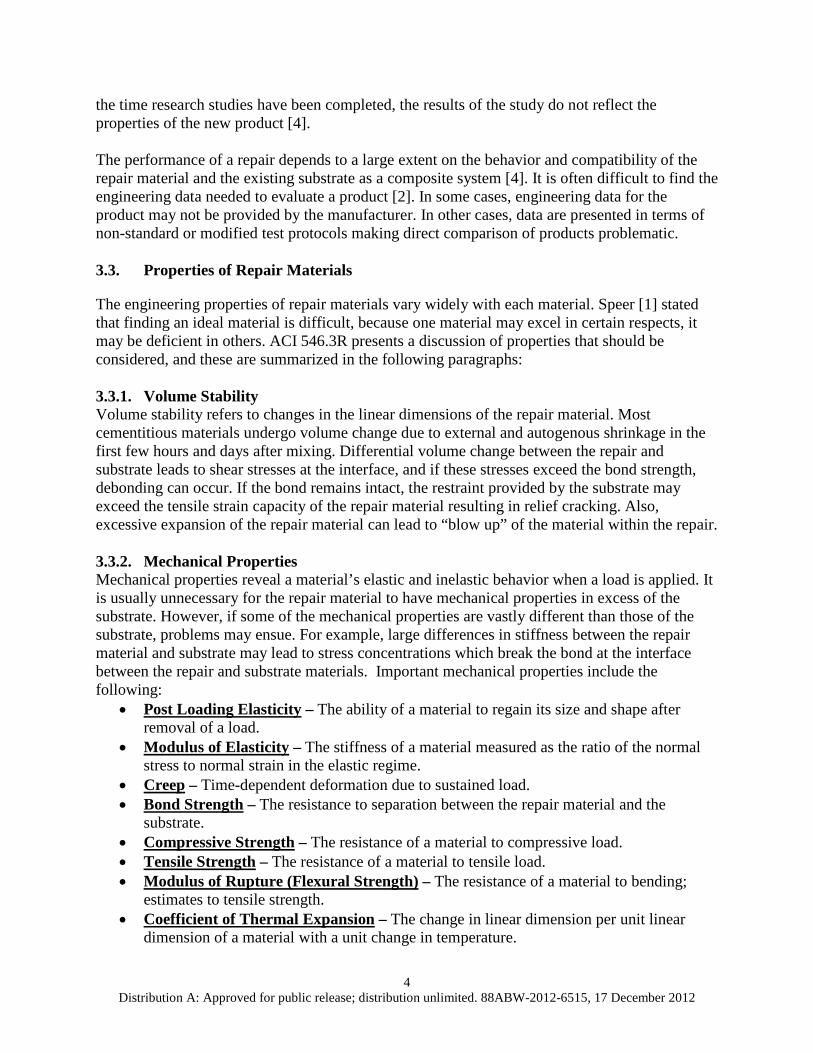
*American Society for Testing and Materials (ASTM) 4.1.2. Down-Selection of Materials for Detailed Testing Based upon the given budget and the final results of initial testing, four materials that represented a wide range of performance were down-selected for further study. Materials were ranked according to relative compressive strength, slant shear bond strength and flexural strength as shown in Figure 1. The flowchart shown in Figure 2 outlines the selection criterion and experimental approach. Materials were grouped into high, moderate, and low categories for compressive strength, flexural strength, and slant shear bond strength. Table 2 and Table 3 provide the material performance matrix details and ranking logic for all materials tested.
Figure 1. Research Factorial
7 Distribution A: Approved for public release; distribution unlimited. 88ABW-2012-6515, 17 December 2012
Eleven Commercial Rapid-Setting Repair Products
• 10-61 Rapid Mortar• Futura 15• HD-50 Rapid Set• Pavemend 15• Pavemend TR• Pavemend VR• PavePatch 3000• Premium Patch• Rapid Set DOT Mix• SikaQuick 2500• VersaSpeed
Compressive Strength
(ASTM C 39)
Flexural Strength
(ASTM C 78)
Splitting Tensile Strength
(ASTM C 496)
Slant Shear Bond Strength(ASTM C 882)
Static Modulus of Elasticity
(ASTM C 469)
Select Four Products
• 10-61 Rapid Mortar• Futura 15• Pavemend 15• Rapid Set DOT Mix
Excess Mix Water Temperature Variations
Bond Fatigue in Slant Shear
Compressive Strength
(ASTM C 39)
Compressive Strength
(ASTM C 39)
StrengthProduct Comp Bond Flex A High High High B Med High Med C Med Low Med D Low Low Low
110% of Recommended
125% of Recommended
Ideal(77 deg F)
Cool(40 deg F)
Warm(100 deg F)
Linear Shrinkage and Coefficient of
Thermal Expansion
(ASTM C 531)
Slant Shear Bond Strength(ASTM C 882)
Figure 2. Research Approach and Testing Flowchart
8 Distribution A: Approved for public release; distribution unlimited. 88ABW-2012-6515, 17 December 2012
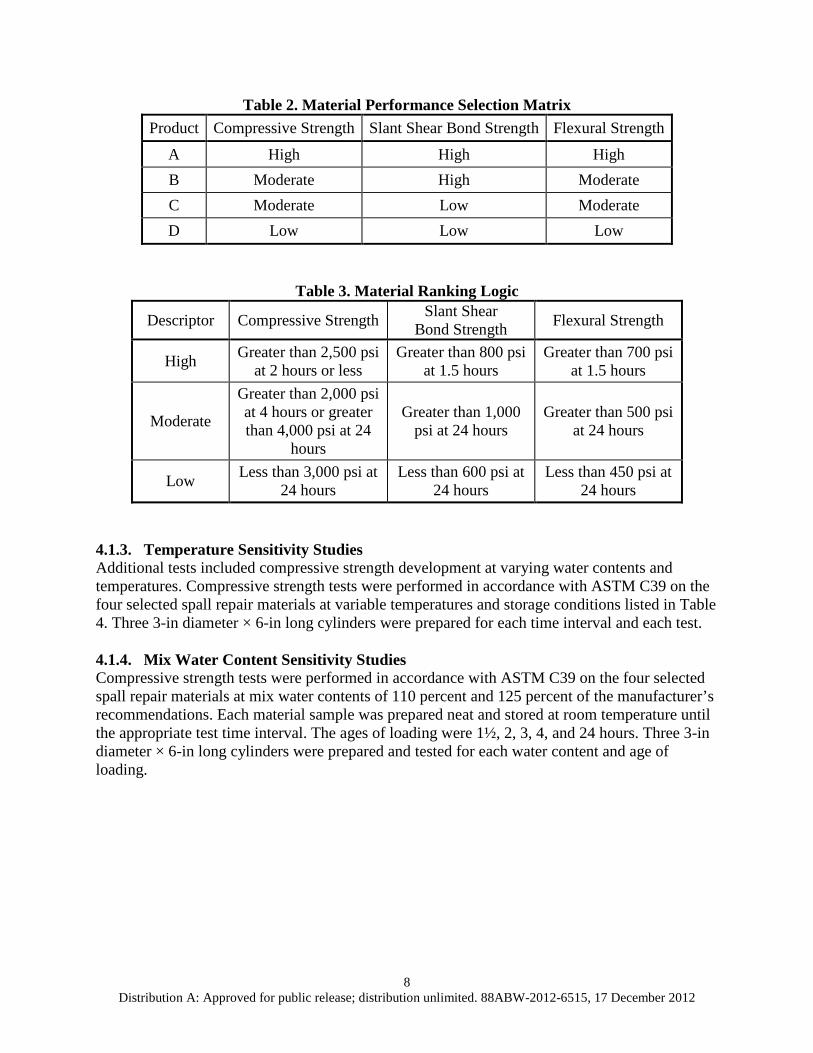
Table 2. Material Performance Selection Matrix Product Compressive Strength Slant Shear Bond Strength Flexural Strength
A High High High B Moderate High Moderate C Moderate Low Moderate D Low Low Low
Table 3. Material Ranking Logic
Descriptor Compressive Strength Slant Shear Bond Strength Flexural Strength
High Greater than 2,500 psi at 2 hours or less
Greater than 800 psi at 1.5 hours
Greater than 700 psi at 1.5 hours
Moderate
Greater than 2,000 psi at 4 hours or greater than 4,000 psi at 24
hours
Greater than 1,000 psi at 24 hours
Greater than 500 psi at 24 hours
Low Less than 3,000 psi at 24 hours
Less than 600 psi at 24 hours
Less than 450 psi at 24 hours
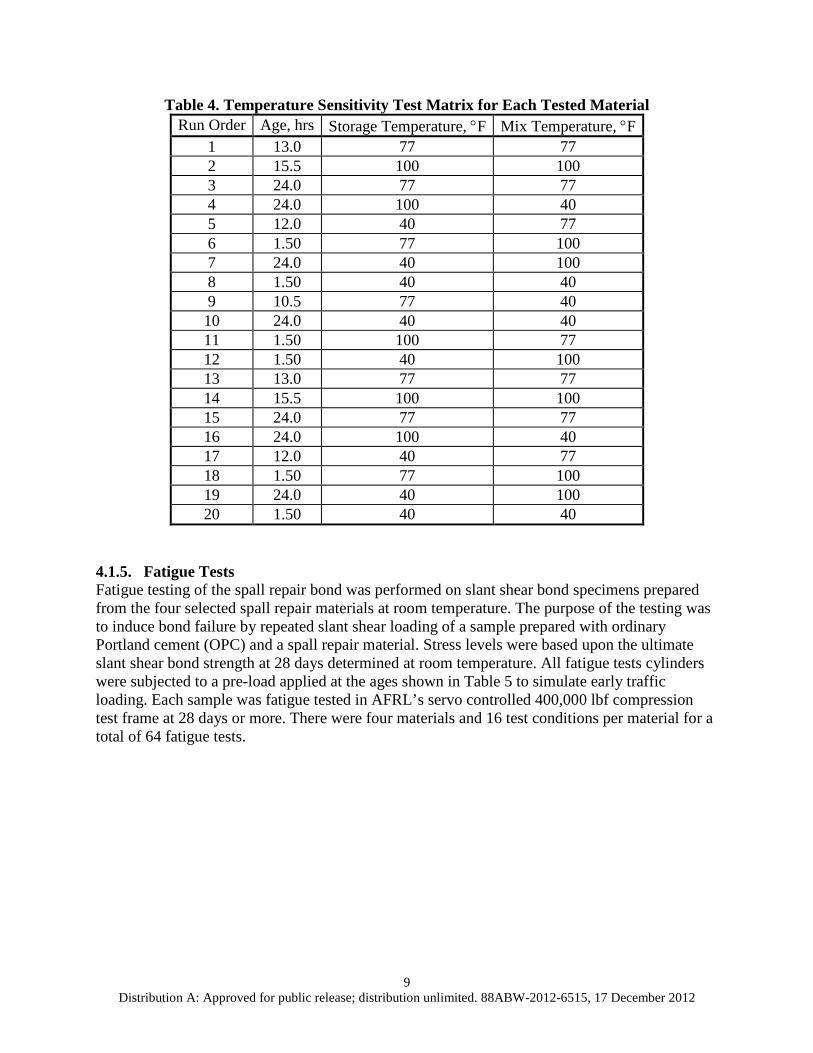
4.1.3. Temperature Sensitivity Studies Additional tests included compressive strength development at varying water contents and temperatures. Compressive strength tests were performed in accordance with ASTM C39 on the four selected spall repair materials at variable temperatures and storage conditions listed in Table 4. Three 3-in diameter × 6-in long cylinders were prepared for each time interval and each test. 4.1.4. Mix Water Content Sensitivity Studies Compressive strength tests were performed in accordance with ASTM C39 on the four selected spall repair materials at mix water contents of 110 percent and 125 percent of the manufacturer’s recommendations. Each material sample was prepared neat and stored at room temperature until the appropriate test time interval. The ages of loading were 1½, 2, 3, 4, and 24 hours. Three 3-in diameter × 6-in long cylinders were prepared and tested for each water content and age of loading.
9 Distribution A: Approved for public release; distribution unlimited. 88ABW-2012-6515, 17 December 2012
Table 4. Temperature Sensitivity Test Matrix for Each Tested Material Run Order Age, hrs Storage Temperature, °F Mix Temperature, °F
1 13.0 77 77 2 15.5 100 100 3 24.0 77 77 4 24.0 100 40 5 12.0 40 77 6 1.50 77 100 7 24.0 40 100 8 1.50 40 40 9 10.5 77 40 10 24.0 40 40 11 1.50 100 77 12 1.50 40 100 13 13.0 77 77 14 15.5 100 100 15 24.0 77 77 16 24.0 100 40 17 12.0 40 77 18 1.50 77 100 19 24.0 40 100 20 1.50 40 40
4.1.5. Fatigue Tests Fatigue testing of the spall repair bond was performed on slant shear bond specimens prepared from the four selected spall repair materials at room temperature. The purpose of the testing was to induce bond failure by repeated slant shear loading of a sample prepared with ordinary Portland cement (OPC) and a spall repair material. Stress levels were based upon the ultimate slant shear bond strength at 28 days determined at room temperature. All fatigue tests cylinders were subjected to a pre-load applied at the ages shown in Table 5 to simulate early traffic loading. Each sample was fatigue tested in AFRL’s servo controlled 400,000 lbf compression test frame at 28 days or more. There were four materials and 16 test conditions per material for a total of 64 fatigue tests.
10 Distribution A: Approved for public release; distribution unlimited. 88ABW-2012-6515, 17 December 2012
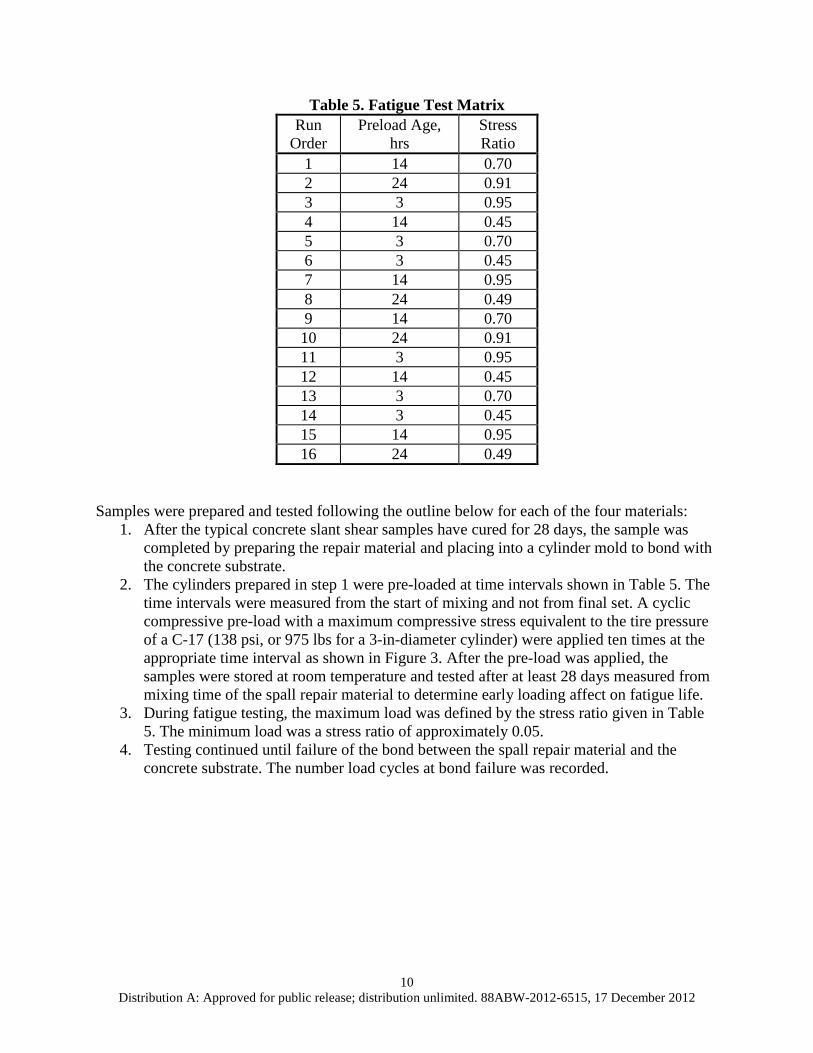
Table 5. Fatigue Test Matrix Run
Order Preload Age,
hrs Stress Ratio
1 14 0.70 2 24 0.91 3 3 0.95 4 14 0.45 5 3 0.70 6 3 0.45 7 14 0.95 8 24 0.49 9 14 0.70 10 24 0.91 11 3 0.95 12 14 0.45 13 3 0.70 14 3 0.45 15 14 0.95 16 24 0.49
Samples were prepared and tested following the outline below for each of the four materials:
1. After the typical concrete slant shear samples have cured for 28 days, the sample was completed by preparing the repair material and placing into a cylinder mold to bond with the concrete substrate.
2. The cylinders prepared in step 1 were pre-loaded at time intervals shown in Table 5. The time intervals were measured from the start of mixing and not from final set. A cyclic compressive pre-load with a maximum compressive stress equivalent to the tire pressure of a C-17 (138 psi, or 975 lbs for a 3-in-diameter cylinder) were applied ten times at the appropriate time interval as shown in Figure 3. After the pre-load was applied, the samples were stored at room temperature and tested after at least 28 days measured from mixing time of the spall repair material to determine early loading affect on fatigue life.
3. During fatigue testing, the maximum load was defined by the stress ratio given in Table 5. The minimum load was a stress ratio of approximately 0.05.
4. Testing continued until failure of the bond between the spall repair material and the concrete substrate. The number load cycles at bond failure was recorded.
11 Distribution A: Approved for public release; distribution unlimited. 88ABW-2012-6515, 17 December 2012
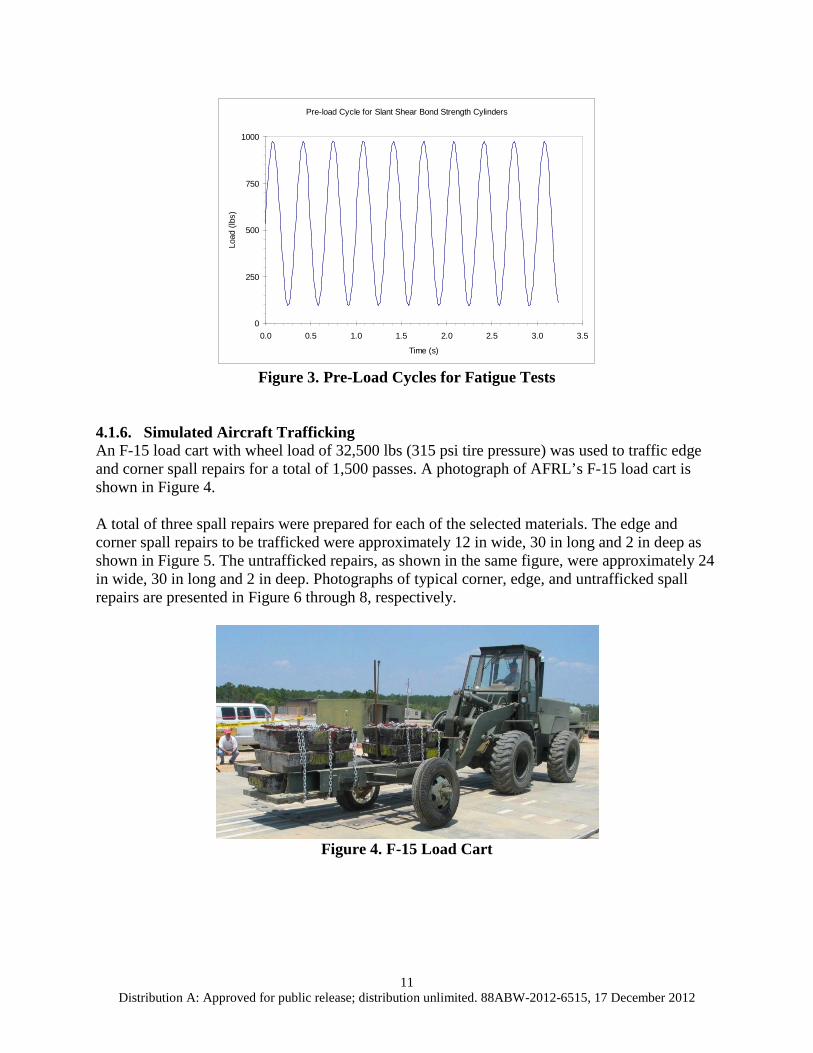
Figure 3. Pre-Load Cycles for Fatigue Tests
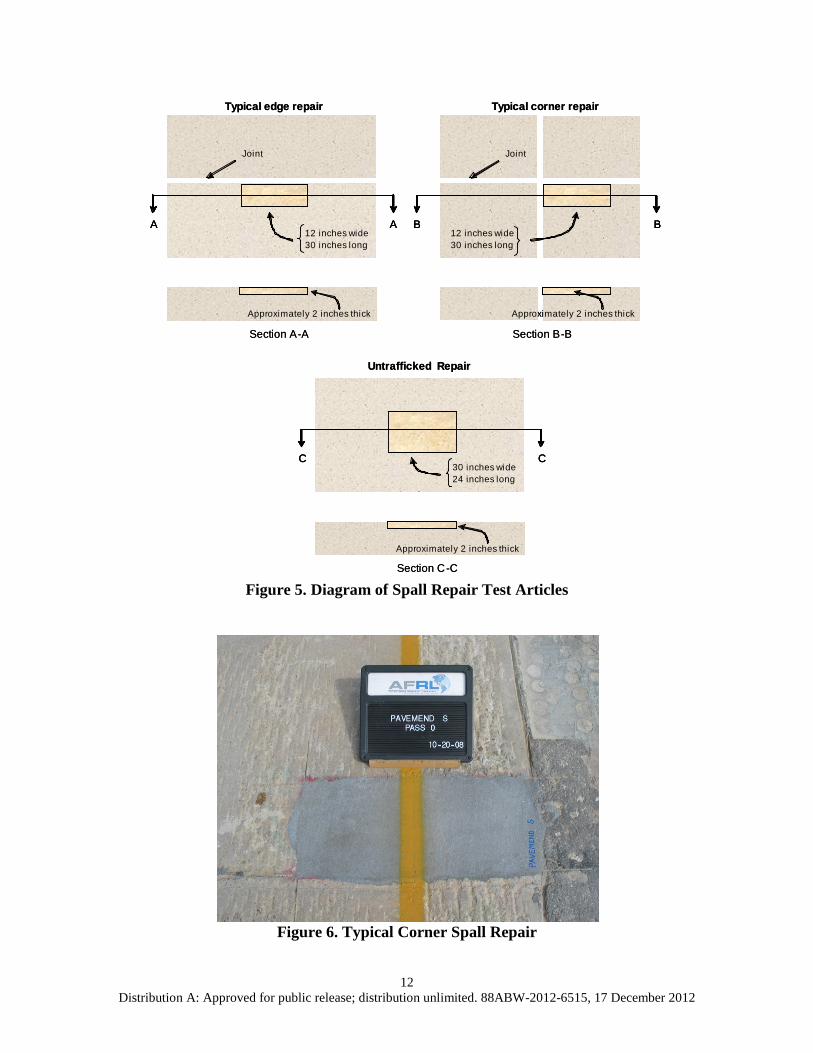
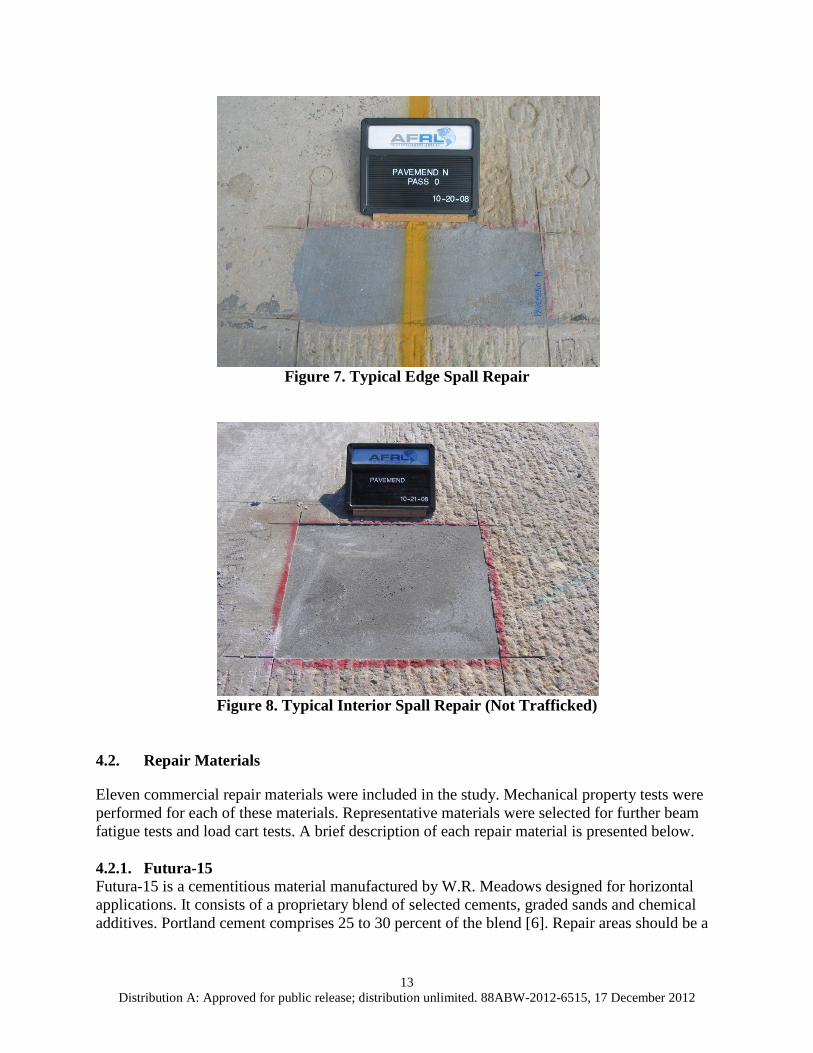
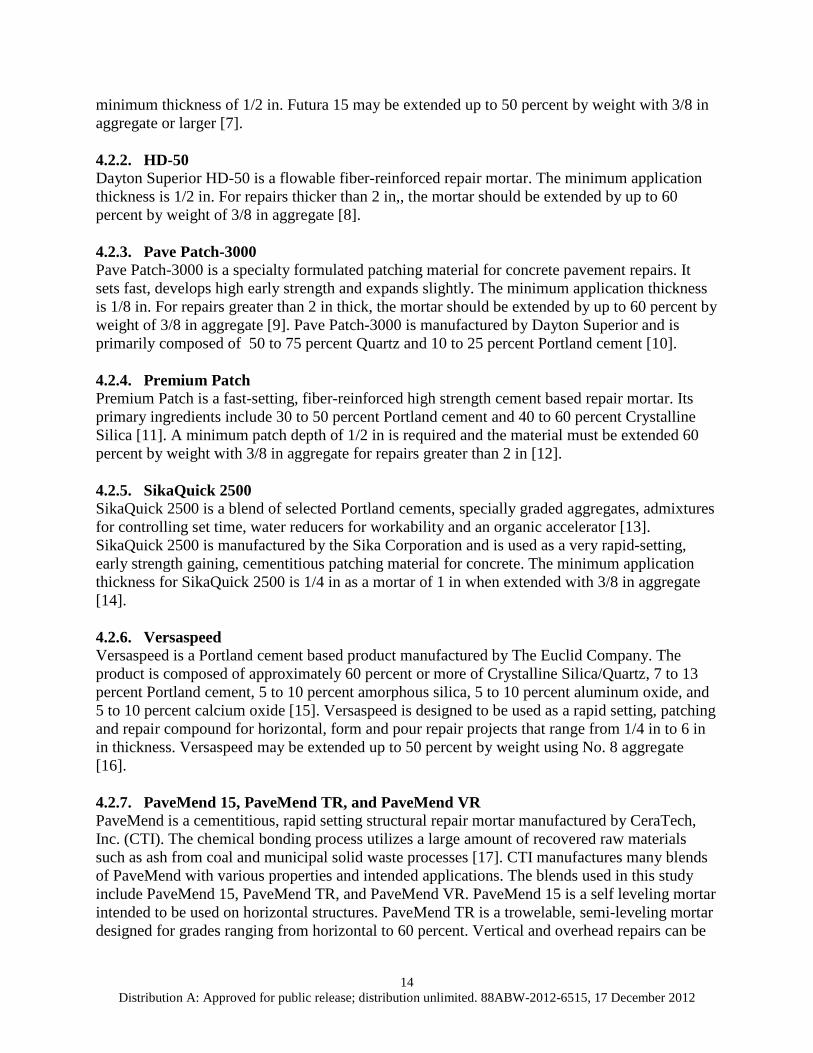
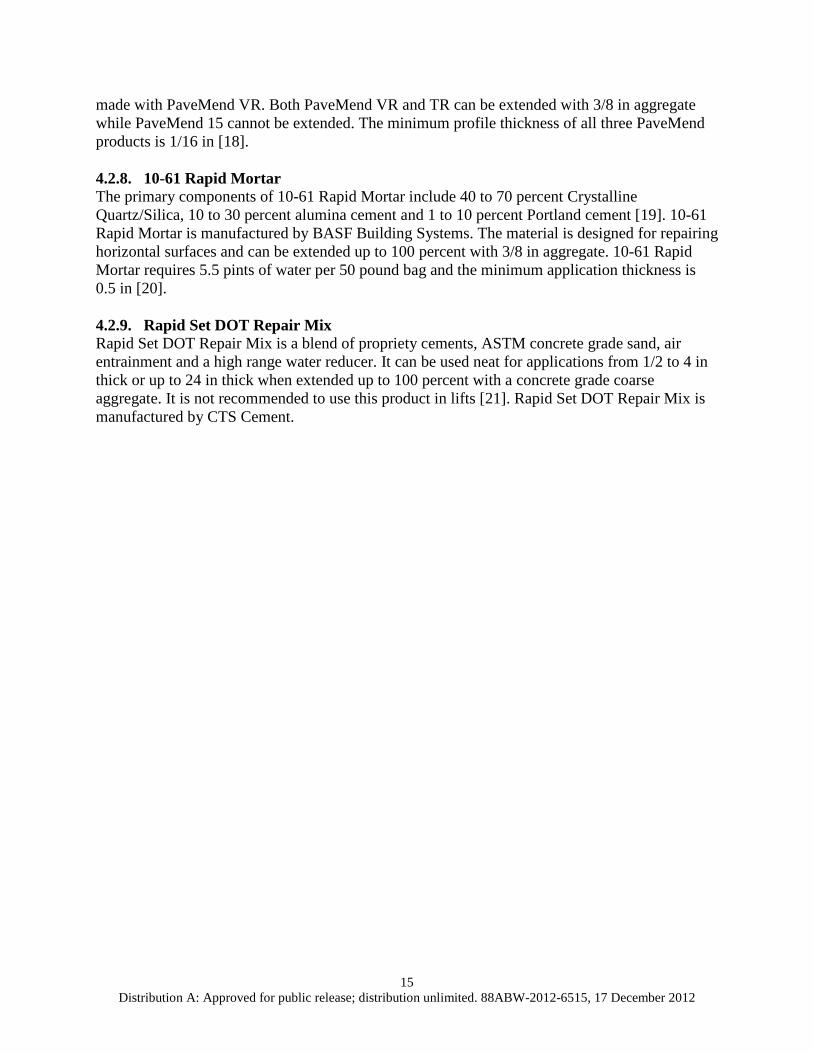
4.1.6. Simulated Aircraft Trafficking An F-15 load cart with wheel load of 32,500 lbs (315 psi tire pressure) was used to traffic edge and corner spall repairs for a total of 1,500 passes. A photograph of AFRL’s F-15 load cart is shown in Figure 4. A total of three spall repairs were prepared for each of the selected materials. The edge and corner spall repairs to be trafficked were approximately 12 in wide, 30 in long and 2 in deep as shown in Figure 5. The untrafficked repairs, as shown in the same figure, were approximately 24 in wide, 30 in long and 2 in deep. Photographs of typical corner, edge, and untrafficked spall repairs are presented in Figure 6 through 8, respectively.
Figure 4. F-15 Load Cart
Pre-load Cycle for Slant Shear Bond Strength Cylinders
0
250
500
750
1000
0.0 0.5 1.0 1.5 2.0 2.5 3.0 3.5
Time (s)
Load
(lbs
)
12 Distribution A: Approved for public release; distribution unlimited. 88ABW-2012-6515, 17 December 2012
Figure 5. Diagram of Spall Repair Test Articles
Figure 6. Typical Corner Spall Repair
Section C-C
Approximately 2 inches thick
Section A-A
Typical edge repair
A A
Joint
Approximately 2 inches thick
Section B-B
Typical corner repair
B B
Joint
12 inches wide30 inches long
12 inches wide30 inches long
Approximately 2 inches thick
Untrafficked Repair
C C30 inches wide24 inches long
Section C-C
Approximately 2 inches thick
Section A-A
Typical edge repair
A AA A
Joint
Approximately 2 inches thick
Section B-B
Typical corner repair
B BB B
Joint
12 inches wide30 inches long
12 inches wide30 inches long
Approximately 2 inches thick
Untrafficked Repair
C CC C30 inches wide24 inches long
13 Distribution A: Approved for public release; distribution unlimited. 88ABW-2012-6515, 17 December 2012
Figure 7. Typical Edge Spall Repair
Figure 8. Typical Interior Spall Repair (Not Trafficked)
4.2. Repair Materials
Eleven commercial repair materials were included in the study. Mechanical property tests were performed for each of these materials. Representative materials were selected for further beam fatigue tests and load cart tests. A brief description of each repair material is presented below. 4.2.1. Futura-15 Futura-15 is a cementitious material manufactured by W.R. Meadows designed for horizontal applications. It consists of a proprietary blend of selected cements, graded sands and chemical additives. Portland cement comprises 25 to 30 percent of the blend [6]. Repair areas should be a
14 Distribution A: Approved for public release; distribution unlimited. 88ABW-2012-6515, 17 December 2012
minimum thickness of 1/2 in. Futura 15 may be extended up to 50 percent by weight with 3/8 in aggregate or larger [7]. 4.2.2. HD-50 Dayton Superior HD-50 is a flowable fiber-reinforced repair mortar. The minimum application thickness is 1/2 in. For repairs thicker than 2 in,, the mortar should be extended by up to 60 percent by weight of 3/8 in aggregate [8]. 4.2.3. Pave Patch-3000 Pave Patch-3000 is a specialty formulated patching material for concrete pavement repairs. It sets fast, develops high early strength and expands slightly. The minimum application thickness is 1/8 in. For repairs greater than 2 in thick, the mortar should be extended by up to 60 percent by weight of 3/8 in aggregate [9]. Pave Patch-3000 is manufactured by Dayton Superior and is primarily composed of 50 to 75 percent Quartz and 10 to 25 percent Portland cement [10]. 4.2.4. Premium Patch Premium Patch is a fast-setting, fiber-reinforced high strength cement based repair mortar. Its primary ingredients include 30 to 50 percent Portland cement and 40 to 60 percent Crystalline Silica [11]. A minimum patch depth of 1/2 in is required and the material must be extended 60 percent by weight with 3/8 in aggregate for repairs greater than 2 in [12]. 4.2.5. SikaQuick 2500 SikaQuick 2500 is a blend of selected Portland cements, specially graded aggregates, admixtures for controlling set time, water reducers for workability and an organic accelerator [13]. SikaQuick 2500 is manufactured by the Sika Corporation and is used as a very rapid-setting, early strength gaining, cementitious patching material for concrete. The minimum application thickness for SikaQuick 2500 is 1/4 in as a mortar of 1 in when extended with 3/8 in aggregate [14]. 4.2.6. Versaspeed Versaspeed is a Portland cement based product manufactured by The Euclid Company. The product is composed of approximately 60 percent or more of Crystalline Silica/Quartz, 7 to 13 percent Portland cement, 5 to 10 percent amorphous silica, 5 to 10 percent aluminum oxide, and 5 to 10 percent calcium oxide [15]. Versaspeed is designed to be used as a rapid setting, patching and repair compound for horizontal, form and pour repair projects that range from 1/4 in to 6 in in thickness. Versaspeed may be extended up to 50 percent by weight using No. 8 aggregate [16]. 4.2.7. PaveMend 15, PaveMend TR, and PaveMend VR PaveMend is a cementitious, rapid setting structural repair mortar manufactured by CeraTech, Inc. (CTI). The chemical bonding process utilizes a large amount of recovered raw materials such as ash from coal and municipal solid waste processes [17]. CTI manufactures many blends of PaveMend with various properties and intended applications. The blends used in this study include PaveMend 15, PaveMend TR, and PaveMend VR. PaveMend 15 is a self leveling mortar intended to be used on horizontal structures. PaveMend TR is a trowelable, semi-leveling mortar designed for grades ranging from horizontal to 60 percent. Vertical and overhead repairs can be
15 Distribution A: Approved for public release; distribution unlimited. 88ABW-2012-6515, 17 December 2012
made with PaveMend VR. Both PaveMend VR and TR can be extended with 3/8 in aggregate while PaveMend 15 cannot be extended. The minimum profile thickness of all three PaveMend products is 1/16 in [18]. 4.2.8. 10-61 Rapid Mortar The primary components of 10-61 Rapid Mortar include 40 to 70 percent Crystalline Quartz/Silica, 10 to 30 percent alumina cement and 1 to 10 percent Portland cement [19]. 10-61 Rapid Mortar is manufactured by BASF Building Systems. The material is designed for repairing horizontal surfaces and can be extended up to 100 percent with 3/8 in aggregate. 10-61 Rapid Mortar requires 5.5 pints of water per 50 pound bag and the minimum application thickness is 0.5 in [20]. 4.2.9. Rapid Set DOT Repair Mix Rapid Set DOT Repair Mix is a blend of propriety cements, ASTM concrete grade sand, air entrainment and a high range water reducer. It can be used neat for applications from 1/2 to 4 in thick or up to 24 in thick when extended up to 100 percent with a concrete grade coarse aggregate. It is not recommended to use this product in lifts [21]. Rapid Set DOT Repair Mix is manufactured by CTS Cement.
16 Distribution A: Approved for public release; distribution unlimited. 88ABW-2012-6515, 17 December 2012
5. RESEARCH RESULTS
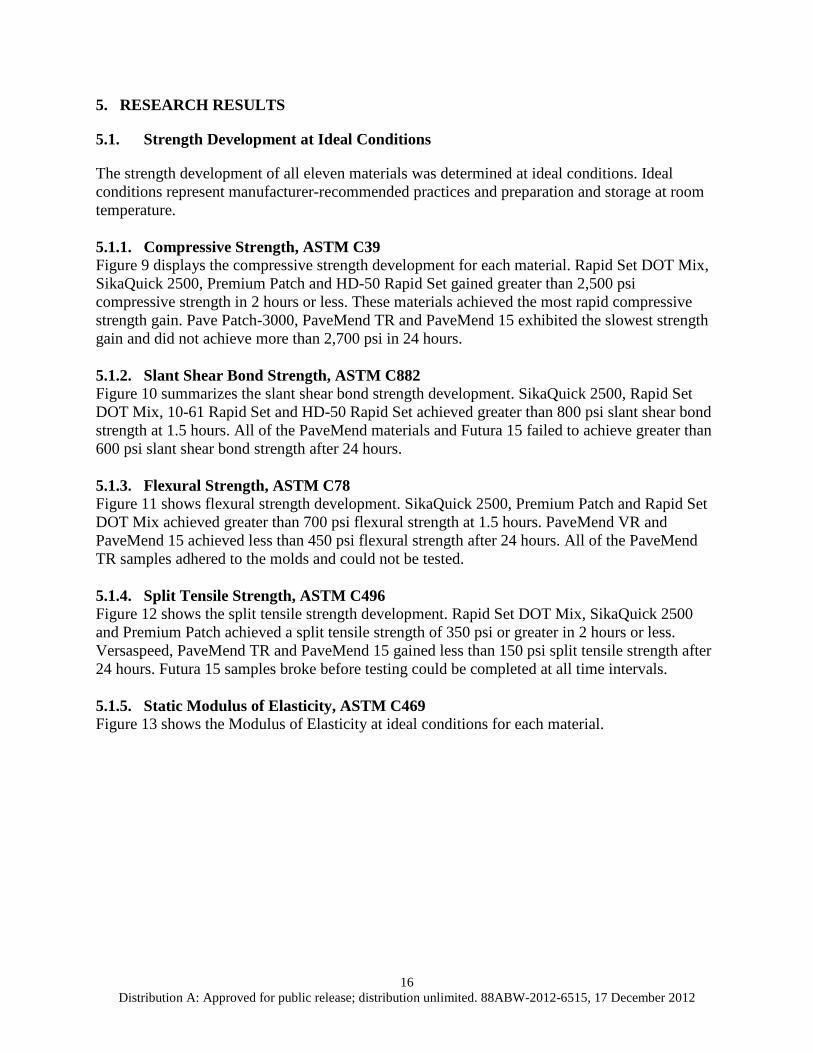
5.1. Strength Development at Ideal Conditions
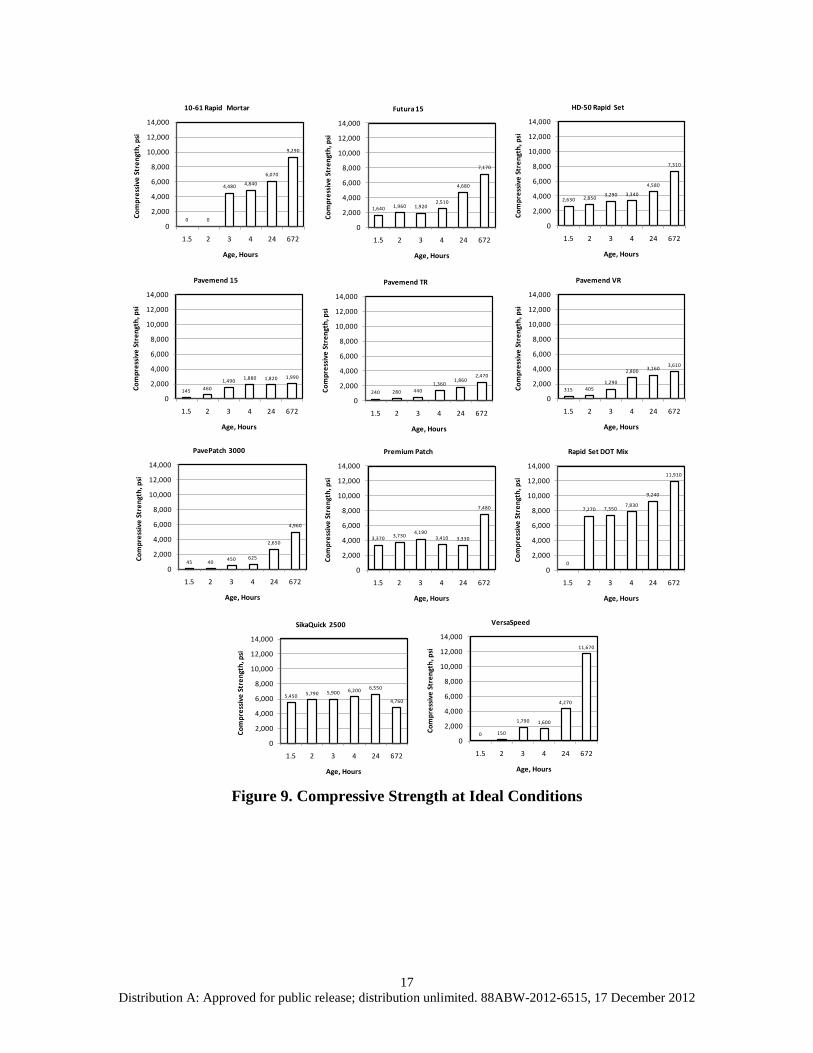
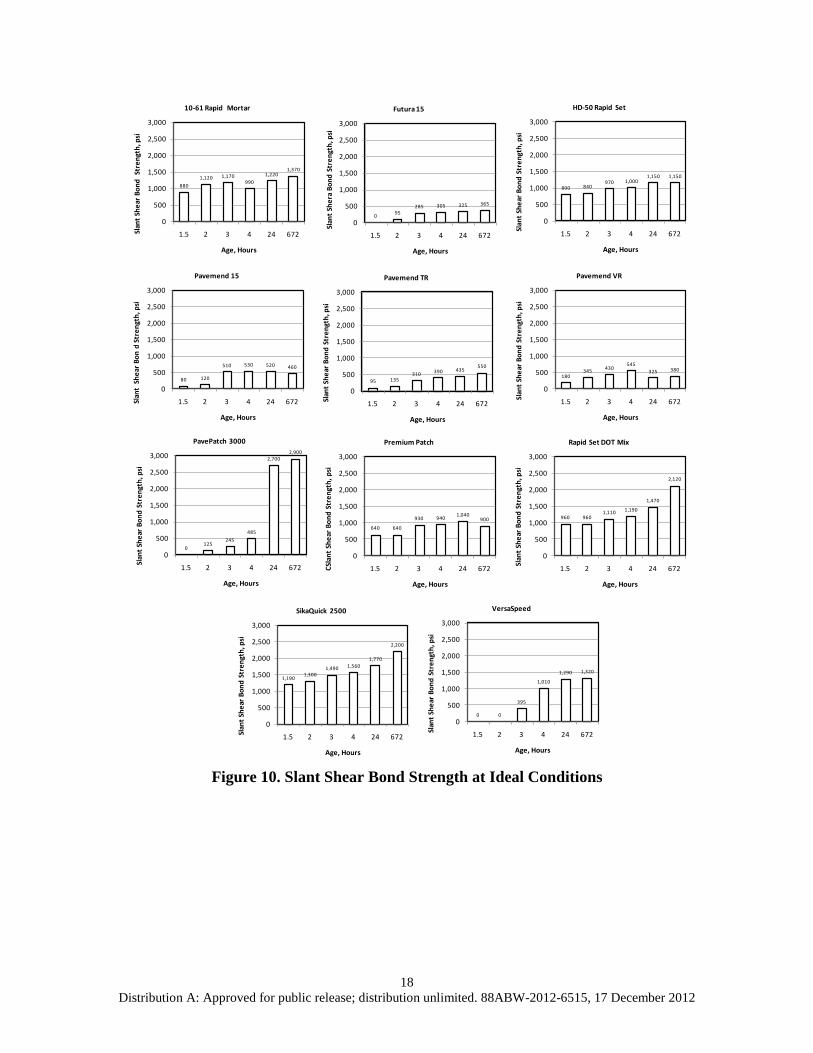
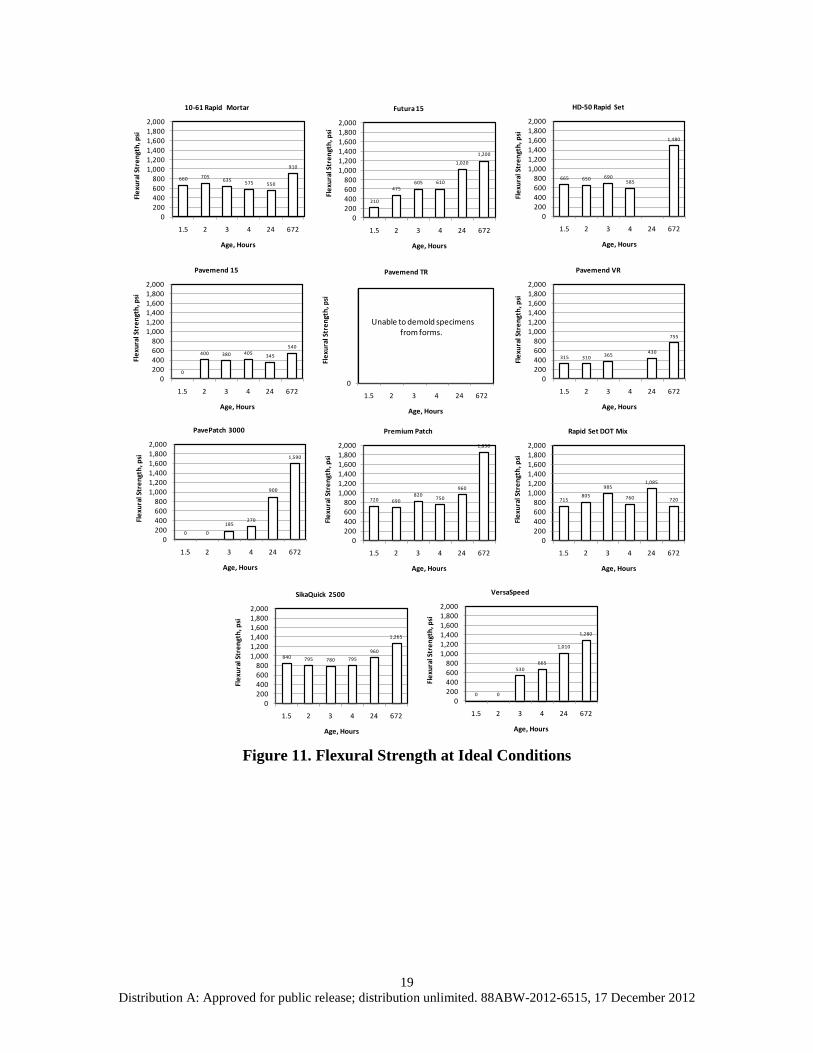
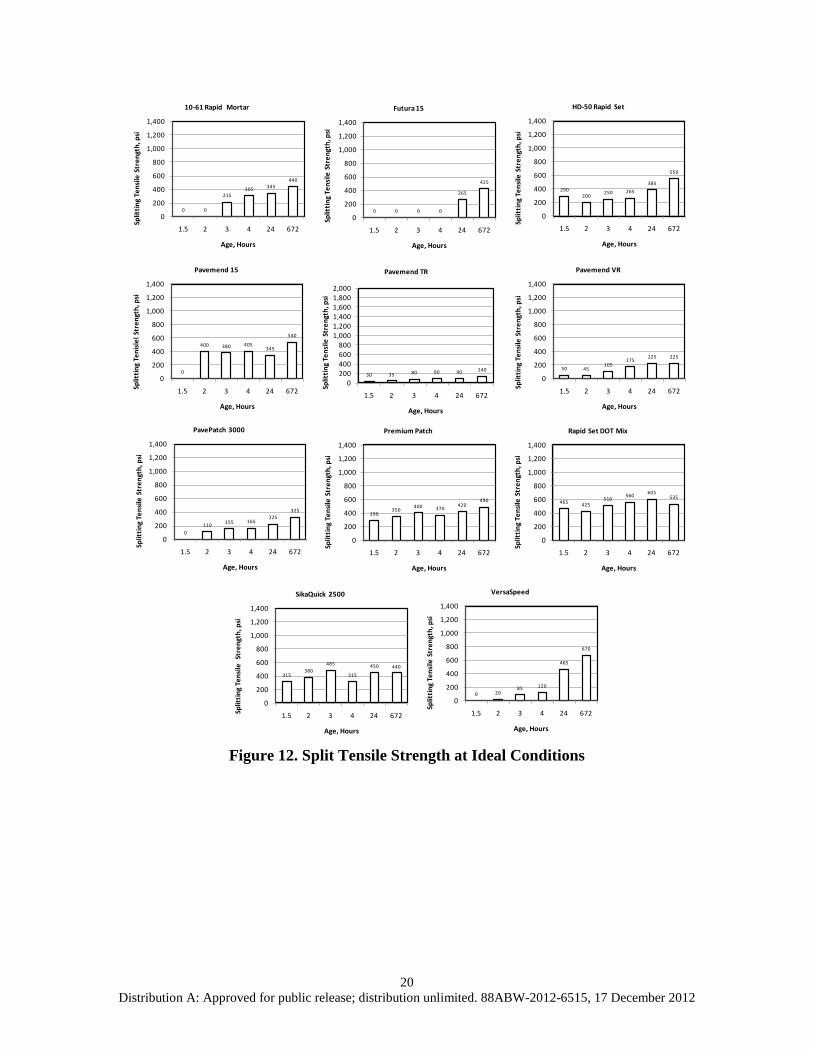
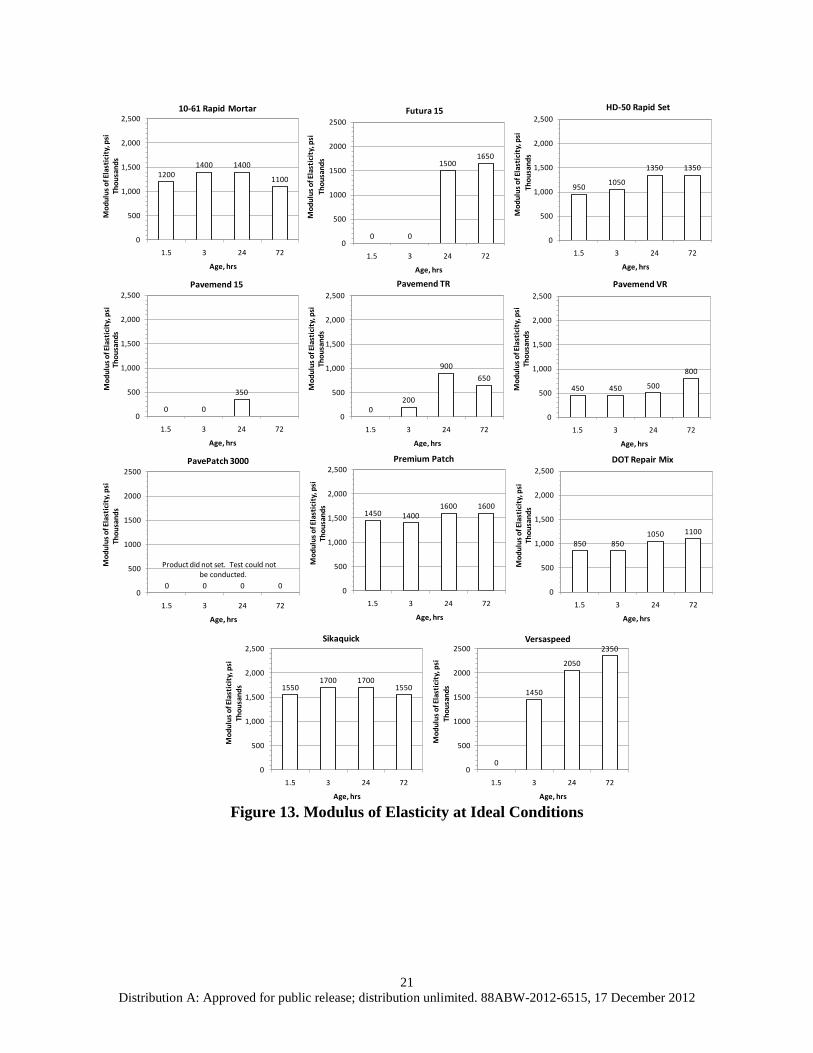
The strength development of all eleven materials was determined at ideal conditions. Ideal conditions represent manufacturer-recommended practices and preparation and storage at room temperature. 5.1.1. Compressive Strength, ASTM C39 Figure 9 displays the compressive strength development for each material. Rapid Set DOT Mix, SikaQuick 2500, Premium Patch and HD-50 Rapid Set gained greater than 2,500 psi compressive strength in 2 hours or less. These materials achieved the most rapid compressive strength gain. Pave Patch-3000, PaveMend TR and PaveMend 15 exhibited the slowest strength gain and did not achieve more than 2,700 psi in 24 hours. 5.1.2. Slant Shear Bond Strength, ASTM C882 Figure 10 summarizes the slant shear bond strength development. SikaQuick 2500, Rapid Set DOT Mix, 10-61 Rapid Set and HD-50 Rapid Set achieved greater than 800 psi slant shear bond strength at 1.5 hours. All of the PaveMend materials and Futura 15 failed to achieve greater than 600 psi slant shear bond strength after 24 hours. 5.1.3. Flexural Strength, ASTM C78 Figure 11 shows flexural strength development. SikaQuick 2500, Premium Patch and Rapid Set DOT Mix achieved greater than 700 psi flexural strength at 1.5 hours. PaveMend VR and PaveMend 15 achieved less than 450 psi flexural strength after 24 hours. All of the PaveMend TR samples adhered to the molds and could not be tested. 5.1.4. Split Tensile Strength, ASTM C496 Figure 12 shows the split tensile strength development. Rapid Set DOT Mix, SikaQuick 2500 and Premium Patch achieved a split tensile strength of 350 psi or greater in 2 hours or less. Versaspeed, PaveMend TR and PaveMend 15 gained less than 150 psi split tensile strength after 24 hours. Futura 15 samples broke before testing could be completed at all time intervals. 5.1.5. Static Modulus of Elasticity, ASTM C469 Figure 13 shows the Modulus of Elasticity at ideal conditions for each material.
17 Distribution A: Approved for public release; distribution unlimited. 88ABW-2012-6515, 17 December 2012
Figure 9. Compressive Strength at Ideal Conditions
0 0
4,480 4,840
6,070
9,290
0
2,000
4,000
6,000
8,000
10,000
12,000
14,000
1.5 2 3 4 24 672
Com
pres
sive
Stre
ngth
, psi
Age, Hours
10-61 Rapid Mortar
1,640 1,960 1,9202,510
4,680
7,170
0
2,000
4,000
6,000
8,000
10,000
12,000
14,000
1.5 2 3 4 24 672
Com
pres
sive
Stre
ngth
, psi
Age, Hours
Futura 15
2,630 2,850 3,290 3,340
4,580
7,310
0
2,000
4,000
6,000
8,000
10,000
12,000
14,000
1.5 2 3 4 24 672
Com
pres
sive
Stre
ngth
, psi
Age, Hours
HD-50 Rapid Set
145 4601,490 1,880 1,820 1,990
0
2,000
4,000
6,000
8,000
10,000
12,000
14,000
1.5 2 3 4 24 672
Com
pres
sive
Stre
ngth
, psi
Age, Hours
Pavemend 15
240 280 4401,360
1,8602,470
0
2,000
4,000
6,000
8,000
10,000
12,000
14,000
1.5 2 3 4 24 672
Com
pres
sive
Stre
ngth
, psi
Age, Hours
Pavemend TR
315 4051,290
2,800 3,160 3,610
0
2,000
4,000
6,000
8,000
10,000
12,000
14,000
1.5 2 3 4 24 672
Com
pres
sive
Stre
ngth
, psi
Age, Hours
Pavemend VR
45 40 450 625
2,650
4,960
0
2,000
4,000
6,000
8,000
10,000
12,000
14,000
1.5 2 3 4 24 672
Com
pres
sive
Stre
ngth
, psi
Age, Hours
PavePatch 3000
3,370 3,7304,190
3,410 3,330
7,480
0
2,000
4,000
6,000
8,000
10,000
12,000
14,000
1.5 2 3 4 24 672
Com
pres
sive
Stre
ngth
, psi
Age, Hours
Premium Patch
0
7,270 7,3507,830
9,240
11,910
0
2,000
4,000
6,000
8,000
10,000
12,000
14,000
1.5 2 3 4 24 672
Com
pres
sive
Stre
ngth
, psi
Age, Hours
Rapid Set DOT Mix
5,450 5,790 5,900 6,200 6,550
4,760
0
2,000
4,000
6,000
8,000
10,000
12,000
14,000
1.5 2 3 4 24 672
Com
pres
sive
Stre
ngth
, psi
Age, Hours
SikaQuick 2500
0 150
1,790 1,600
4,270
11,670
0
2,000
4,000
6,000
8,000
10,000
12,000
14,000
1.5 2 3 4 24 672
Com
pres
sive
Stre
ngth
, psi
Age, Hours
VersaSpeed
18 Distribution A: Approved for public release; distribution unlimited. 88ABW-2012-6515, 17 December 2012
Figure 10. Slant Shear Bond Strength at Ideal Conditions
8801,120 1,170
9901,220
1,370
0
500
1,000
1,500
2,000
2,500
3,000
1.5 2 3 4 24 672Slan
t She
ar B
ond
Str
engt
h, p
si
Age, Hours
10-61 Rapid Mortar
0 95285 305 325 365
0
500
1,000
1,500
2,000
2,500
3,000
1.5 2 3 4 24 672
Slan
t She
ra B
ond
Stre
ngth
, psi
Age, Hours
Futura 15
800 840970 1,000
1,150 1,150
0
500
1,000
1,500
2,000
2,500
3,000
1.5 2 3 4 24 672Slan
t She
ar B
ond
Stre
ngth
, psi
Age, Hours
HD-50 Rapid Set
80 120
510 530 520 460
0
500
1,000
1,500
2,000
2,500
3,000
1.5 2 3 4 24 672Slan
t Sh
ear B
on d
Str
engt
h, p
si
Age, Hours
Pavemend 15
95 135310 390 435
550
0
500
1,000
1,500
2,000
2,500
3,000
1.5 2 3 4 24 672Slan
t She
ar B
ond
Stre
ngth
, psi
Age, Hours
Pavemend TR
180345 430
545325 380
0
500
1,000
1,500
2,000
2,500
3,000
1.5 2 3 4 24 672Slan
t She
ar B
ond
Stre
ngth
, psi
Age, Hours
Pavemend VR
0125
245485
2,7002,900
0
500
1,000
1,500
2,000
2,500
3,000
1.5 2 3 4 24 672Slan
t She
ar B
ond
Stre
ngth
, psi
Age, Hours
PavePatch 3000
640 640
930 940 1,040900
0
500
1,000
1,500
2,000
2,500
3,000
1.5 2 3 4 24 672CSla
nt S
hear
Bon
d St
reng
th, p
si
Age, Hours
Premium Patch
960 9601,110 1,190
1,470
2,120
0
500
1,000
1,500
2,000
2,500
3,000
1.5 2 3 4 24 672Slan
t She
ar B
ond
Stre
ngth
, psi
Age, Hours
Rapid Set DOT Mix
1,1901,300
1,490 1,5601,770
2,200
0
500
1,000
1,500
2,000
2,500
3,000
1.5 2 3 4 24 672Slan
t She
ar B
ond
Stre
ngth
, psi
Age, Hours
SikaQuick 2500
0 0
395
1,010
1,290 1,320
0
500
1,000
1,500
2,000
2,500
3,000
1.5 2 3 4 24 672Slan
t She
ar B
ond
Stre
ngth
, psi
Age, Hours
VersaSpeed
19 Distribution A: Approved for public release; distribution unlimited. 88ABW-2012-6515, 17 December 2012
Figure 11. Flexural Strength at Ideal Conditions
660 705 635 575 550
910
0200400600800
1,0001,2001,4001,6001,8002,000
1.5 2 3 4 24 672
Flex
ural
Str
engt
h, p
si
Age, Hours
10-61 Rapid Mortar
210
475605 610
1,020
1,200
0200400600800
1,0001,2001,4001,6001,8002,000
1.5 2 3 4 24 672
Flex
ural
Str
engt
h, p
si
Age, Hours
Futura 15
665 650 690585
1,480
0200400600800
1,0001,2001,4001,6001,8002,000
1.5 2 3 4 24 672
Flex
ural
Str
engt
h, p
si
Age, Hours
HD-50 Rapid Set
0
400 380 405 345
540
0200400600800
1,0001,2001,4001,6001,8002,000
1.5 2 3 4 24 672
Flex
ural
Str
engt
h, p
si
Age, Hours
Pavemend 15
0
1.5 2 3 4 24 672
Flex
ural
Str
engt
h, p
si
Age, Hours
Pavemend TR
Unable to demold specimensfrom forms.
315 310 365 430
755
0200400600800
1,0001,2001,4001,6001,8002,000
1.5 2 3 4 24 672
Flex
ural
Str
engt
h, p
si
Age, Hours
Pavemend VR
0 0
185270
900
1,590
0200400600800
1,0001,2001,4001,6001,8002,000
1.5 2 3 4 24 672
Flex
ural
Str
engt
h, p
si
Age, Hours
PavePatch 3000
720 690820 750
960
1,850
0200400600800
1,0001,2001,4001,6001,8002,000
1.5 2 3 4 24 672
Flex
ural
Str
engt
h, p
si
Age, Hours
Premium Patch
715805
985
760
1,085
720
0200400600800
1,0001,2001,4001,6001,8002,000
1.5 2 3 4 24 672
Flex
ural
Str
engt
h, p
si
Age, Hours
Rapid Set DOT Mix
840 795 780 795960
1,265
0200400600800
1,0001,2001,4001,6001,8002,000
1.5 2 3 4 24 672
Flex
ural
Str
engt
h, p
si
Age, Hours
SikaQuick 2500
0 0
530665
1,010
1,280
0200400600800
1,0001,2001,4001,6001,8002,000
1.5 2 3 4 24 672
Flex
ural
Str
engt
h, p
si
Age, Hours
VersaSpeed
20 Distribution A: Approved for public release; distribution unlimited. 88ABW-2012-6515, 17 December 2012
Figure 12. Split Tensile Strength at Ideal Conditions
0 0
215305 345
440
0
200
400
600
800
1,000
1,200
1,400
1.5 2 3 4 24 672
Split
ting
Tens
ile S
tren
gth,
psi
Age, Hours
10-61 Rapid Mortar
0 0 0 0
265
425
0
200
400
600
800
1,000
1,200
1,400
1.5 2 3 4 24 672
Split
ting
Tens
ile S
tren
gth,
psi
Age, Hours
Futura 15
290200
250 265385
550
0
200
400
600
800
1,000
1,200
1,400
1.5 2 3 4 24 672
Split
ting
Tens
ile S
tren
gth,
psi
Age, Hours
HD-50 Rapid Set
0
400 380 405345
540
0
200
400
600
800
1,000
1,200
1,400
1.5 2 3 4 24 672Split
ting
Teni
slel S
tren
gth,
psi
Age, Hours
Pavemend 15
30 35 80 90 90 140
0200400600800
1,0001,2001,4001,6001,8002,000
1.5 2 3 4 24 672
Split
ting
Tens
ile S
tren
gth,
psi
Age, Hours
Pavemend TR
50 45105
175225 225
0
200
400
600
800
1,000
1,200
1,400
1.5 2 3 4 24 672Split
ting
Tens
ile S
tren
gth,
psi
Age, Hours
Pavemend VR
0110 155 165
225325
0
200
400
600
800
1,000
1,200
1,400
1.5 2 3 4 24 672
Split
ting
Tens
ile S
tren
gth,
psi
Age, Hours
PavePatch 3000
290350
400 370420
490
0
200
400
600
800
1,000
1,200
1,400
1.5 2 3 4 24 672
Split
ting
Tens
ile S
tren
gth,
psi
Age, Hours
Premium Patch
465 425510
560 605535
0
200
400
600
800
1,000
1,200
1,400
1.5 2 3 4 24 672
Split
ting
Tens
ile S
tren
gth,
psi
Age, Hours
Rapid Set DOT Mix
315380
485
315
450 440
0
200
400
600
800
1,000
1,200
1,400
1.5 2 3 4 24 672Split
ting
Tens
ile S
tren
gth,
psi
Age, Hours
SikaQuick 2500
0 2085 120
465
670
0
200
400
600
800
1,000
1,200
1,400
1.5 2 3 4 24 672
Split
ting
Tens
ile S
tren
gth,
psi
Age, Hours
VersaSpeed
21 Distribution A: Approved for public release; distribution unlimited. 88ABW-2012-6515, 17 December 2012
Figure 13. Modulus of Elasticity at Ideal Conditions
12001400 1400
1100
0
500
1,000
1,500
2,000
2,500
1.5 3 24 72
Mod
ulus
of E
last
icity
, psi
Thou
sand
s
Age, hrs
10-61 Rapid Mortar
950 1050
1350 1350
0
500
1,000
1,500
2,000
2,500
1.5 3 24 72
Mod
ulus
of E
last
icity
, psi
Thou
sand
s
Age, hrs
HD-50 Rapid Set
0 0
350
0
500
1,000
1,500
2,000
2,500
1.5 3 24 72
Mod
ulus
of E
last
icity
, psi
Thou
sand
s
Age, hrs
Pavemend 15
0200
900650
0
500
1,000
1,500
2,000
2,500
1.5 3 24 72
Mod
ulus
of E
last
icity
, psi
Thou
sand
s
Age, hrs
Pavemend TR
450 450 500
800
0
500
1,000
1,500
2,000
2,500
1.5 3 24 72
Mod
ulus
of E
last
icity
, psi
Thou
sand
s
Age, hrs
Pavemend VR
1450 14001600 1600
0
500
1,000
1,500
2,000
2,500
1.5 3 24 72
Mod
ulus
of E
last
icity
, psi
Thou
sand
s
Age, hrs
Premium Patch
850 8501050 1100
0
500
1,000
1,500
2,000
2,500
1.5 3 24 72
Mod
ulus
of E
last
icity
, psi
Thou
sand
s
Age, hrs
DOT Repair Mix
15501700 1700
1550
0
500
1,000
1,500
2,000
2,500
1.5 3 24 72
Mod
ulus
of E
last
icity
, psi
Thou
sand
s
Age, hrs
Sikaquick
0
1450
2050
2350
0
500
1000
1500
2000
2500
1.5 3 24 72
Mod
ulus
of E
last
icity
, psi
Thou
sand
s
Age, hrs
Versaspeed
0 0
15001650
0
500
1000
1500
2000
2500
1.5 3 24 72
Mod
ulus
of E
last
icity
, psi
Thou
sand
s
Age, hrs
Futura 15
0 0 0 00
500
1000
1500
2000
2500
1.5 3 24 72
Mod
ulus
of E
last
icity
, psi
Thou
sand
s
Age, hrs
PavePatch 3000
Product did not set. Test could notbe conducted.
22 Distribution A: Approved for public release; distribution unlimited. 88ABW-2012-6515, 17 December 2012
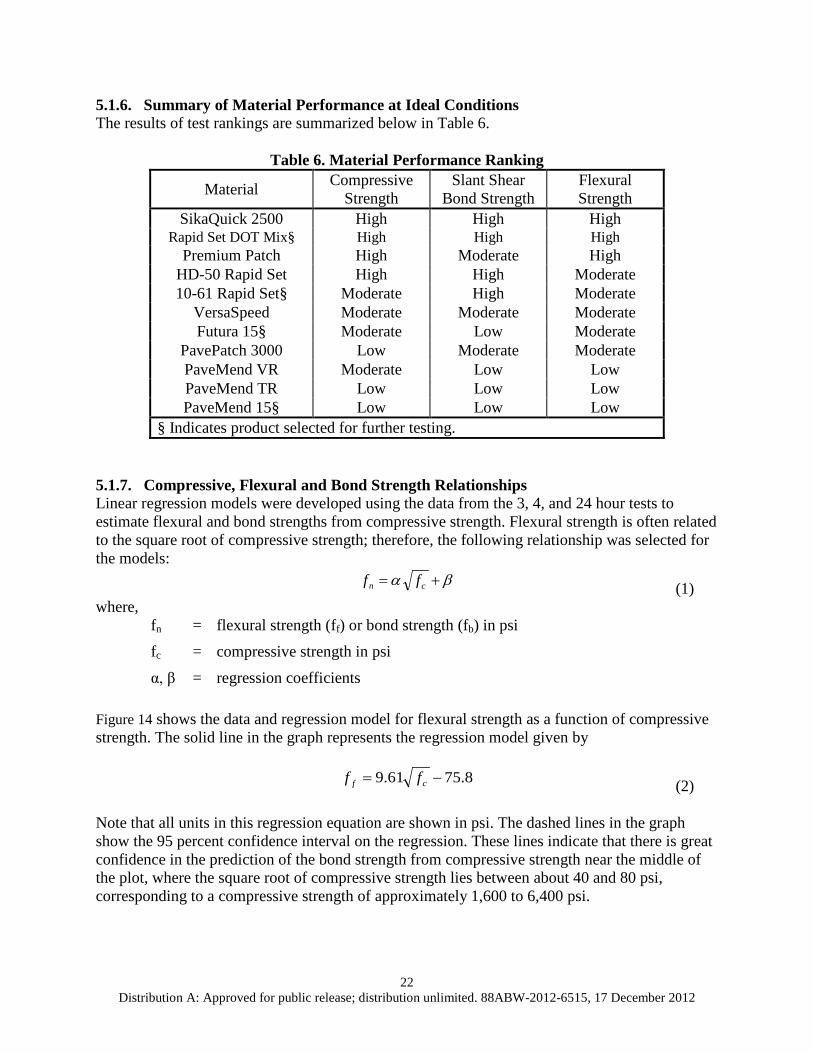
5.1.6. Summary of Material Performance at Ideal Conditions The results of test rankings are summarized below in Table 6.
Table 6. Material Performance Ranking
Material Compressive Strength
Slant Shear Bond Strength
Flexural Strength
SikaQuick 2500 High High High Rapid Set DOT Mix§ High High High
Premium Patch High Moderate High HD-50 Rapid Set High High Moderate 10-61 Rapid Set§ Moderate High Moderate
VersaSpeed Moderate Moderate Moderate Futura 15§ Moderate Low Moderate
PavePatch 3000 Low Moderate Moderate PaveMend VR Moderate Low Low PaveMend TR Low Low Low PaveMend 15§ Low Low Low
§ Indicates product selected for further testing. 5.1.7. Compressive, Flexural and Bond Strength Relationships Linear regression models were developed using the data from the 3, 4, and 24 hour tests to estimate flexural and bond strengths from compressive strength. Flexural strength is often related to the square root of compressive strength; therefore, the following relationship was selected for the models:
βα += cn ff (1) where,
fn = flexural strength (ff) or bond strength (fb) in psi
fc = compressive strength in psi
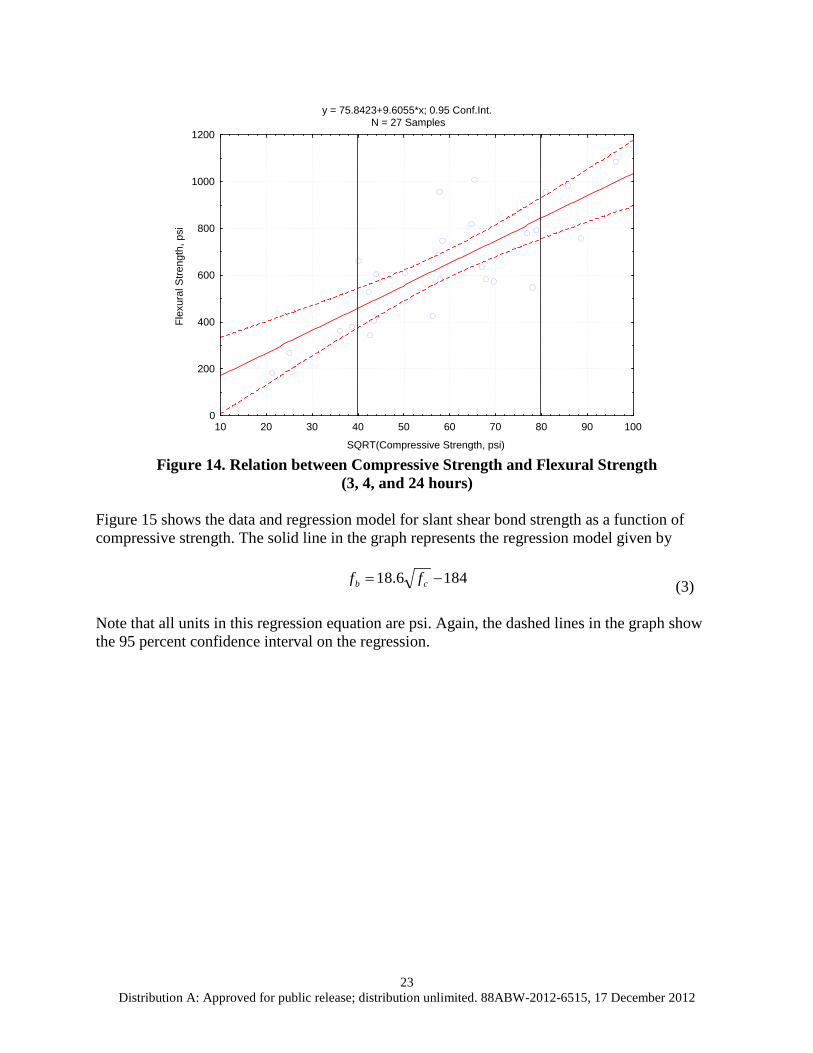
α, β = regression coefficients Figure 14 shows the data and regression model for flexural strength as a function of compressive strength. The solid line in the graph represents the regression model given by
8.7561.9 −= cf ff (2) Note that all units in this regression equation are shown in psi. The dashed lines in the graph show the 95 percent confidence interval on the regression. These lines indicate that there is great confidence in the prediction of the bond strength from compressive strength near the middle of the plot, where the square root of compressive strength lies between about 40 and 80 psi, corresponding to a compressive strength of approximately 1,600 to 6,400 psi.
23 Distribution A: Approved for public release; distribution unlimited. 88ABW-2012-6515, 17 December 2012
Figure 14. Relation between Compressive Strength and Flexural Strength
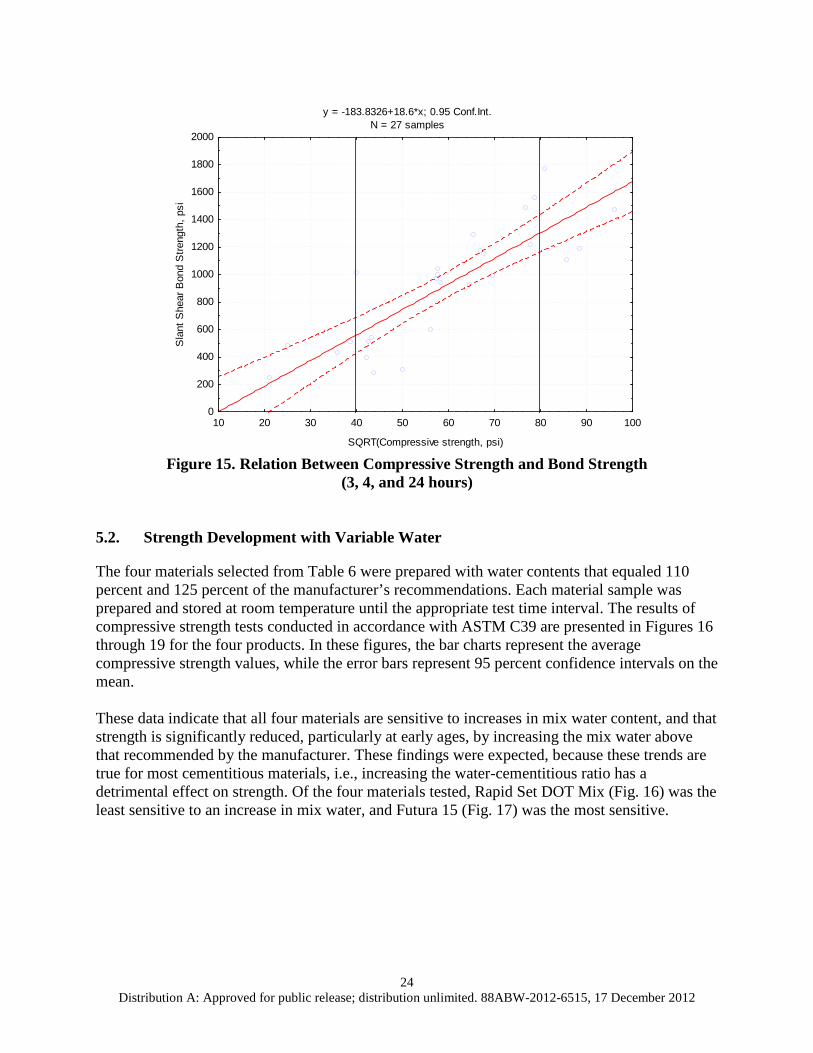
(3, 4, and 24 hours) Figure 15 shows the data and regression model for slant shear bond strength as a function of compressive strength. The solid line in the graph represents the regression model given by
1846.18 −= cb ff (3) Note that all units in this regression equation are psi. Again, the dashed lines in the graph show the 95 percent confidence interval on the regression.
y = 75.8423+9.6055*x; 0.95 Conf.Int.N = 27 Samples
10 20 30 40 50 60 70 80 90 100
SQRT(Compressive Strength, psi)
0
200
400
600
800
1000
1200
Flex
ural
Stre
ngth
, psi
24 Distribution A: Approved for public release; distribution unlimited. 88ABW-2012-6515, 17 December 2012
Figure 15. Relation Between Compressive Strength and Bond Strength
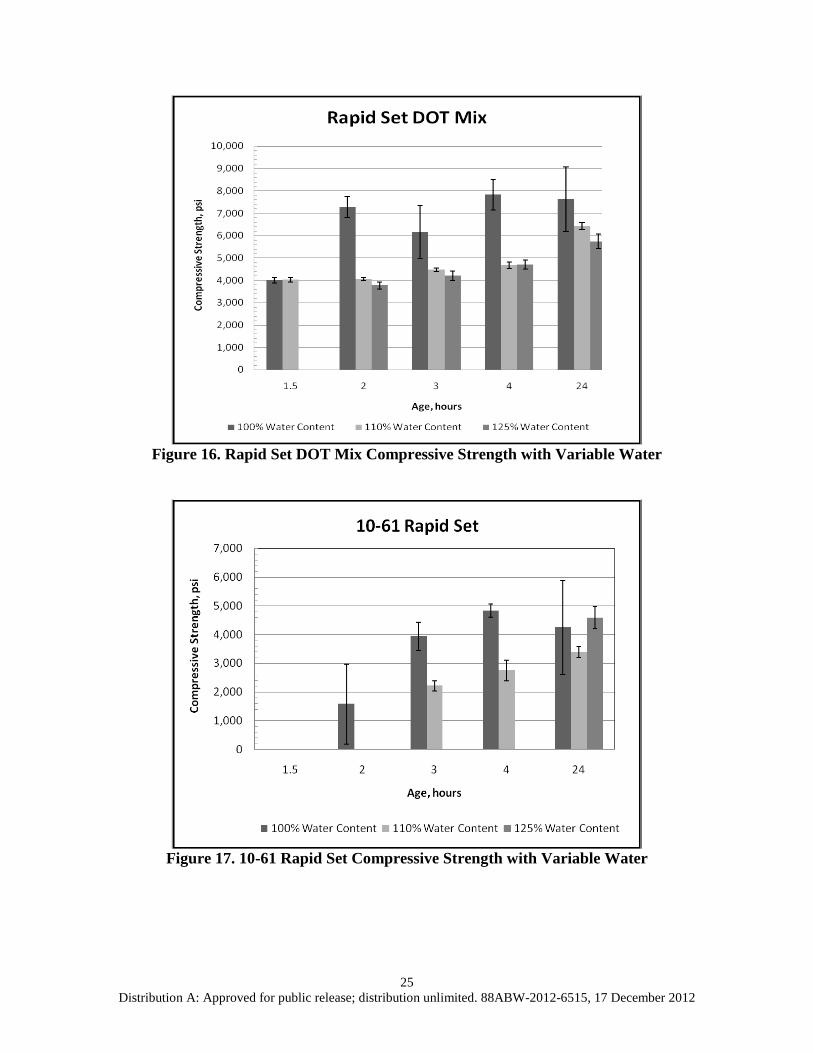
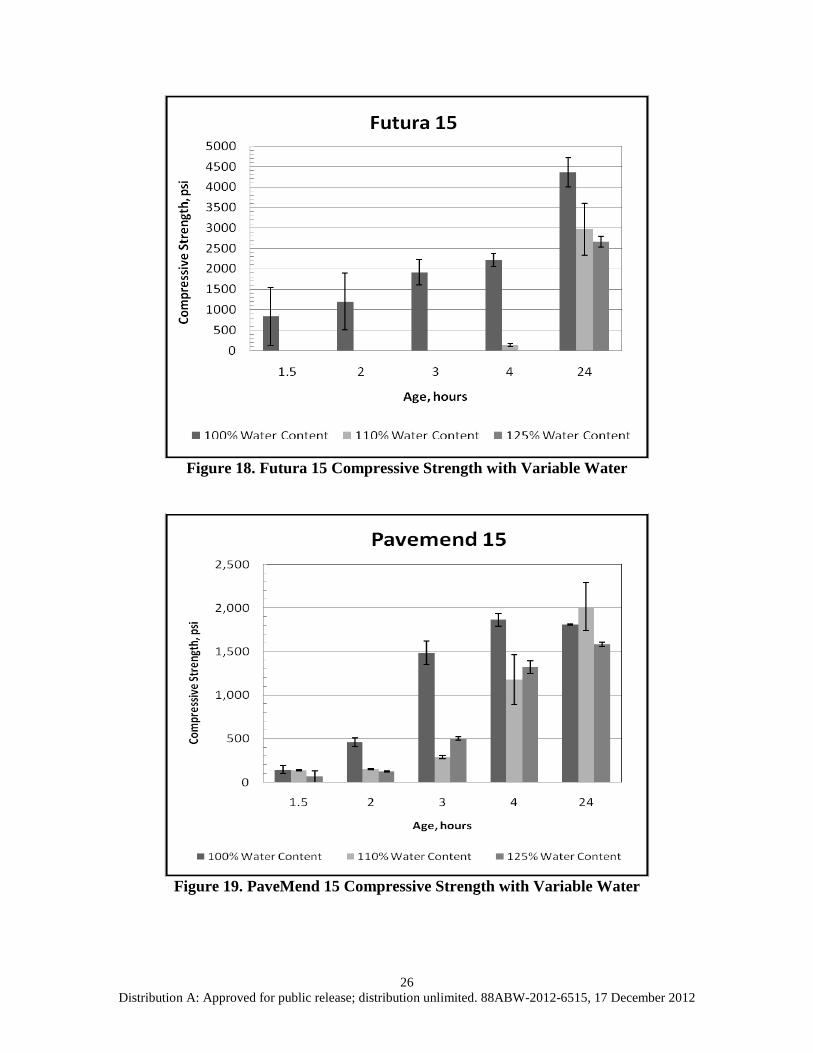
(3, 4, and 24 hours) 5.2. Strength Development with Variable Water
The four materials selected from Table 6 were prepared with water contents that equaled 110 percent and 125 percent of the manufacturer’s recommendations. Each material sample was prepared and stored at room temperature until the appropriate test time interval. The results of compressive strength tests conducted in accordance with ASTM C39 are presented in Figures 16 through 19 for the four products. In these figures, the bar charts represent the average compressive strength values, while the error bars represent 95 percent confidence intervals on the mean. These data indicate that all four materials are sensitive to increases in mix water content, and that strength is significantly reduced, particularly at early ages, by increasing the mix water above that recommended by the manufacturer. These findings were expected, because these trends are true for most cementitious materials, i.e., increasing the water-cementitious ratio has a detrimental effect on strength. Of the four materials tested, Rapid Set DOT Mix (Fig. 16) was the least sensitive to an increase in mix water, and Futura 15 (Fig. 17) was the most sensitive.
y = -183.8326+18.6*x; 0.95 Conf.Int.
N = 27 samples
10 20 30 40 50 60 70 80 90 100
SQRT(Compressive strength, psi)
0
200
400
600
800
1000
1200
1400
1600
1800
2000
Sla
nt S
hear
Bon
d S
treng
th, p
si
25 Distribution A: Approved for public release; distribution unlimited. 88ABW-2012-6515, 17 December 2012
Figure 16. Rapid Set DOT Mix Compressive Strength with Variable Water
Figure 17. 10-61 Rapid Set Compressive Strength with Variable Water
26 Distribution A: Approved for public release; distribution unlimited. 88ABW-2012-6515, 17 December 2012
Figure 18. Futura 15 Compressive Strength with Variable Water
Figure 19. PaveMend 15 Compressive Strength with Variable Water
27 Distribution A: Approved for public release; distribution unlimited. 88ABW-2012-6515, 17 December 2012
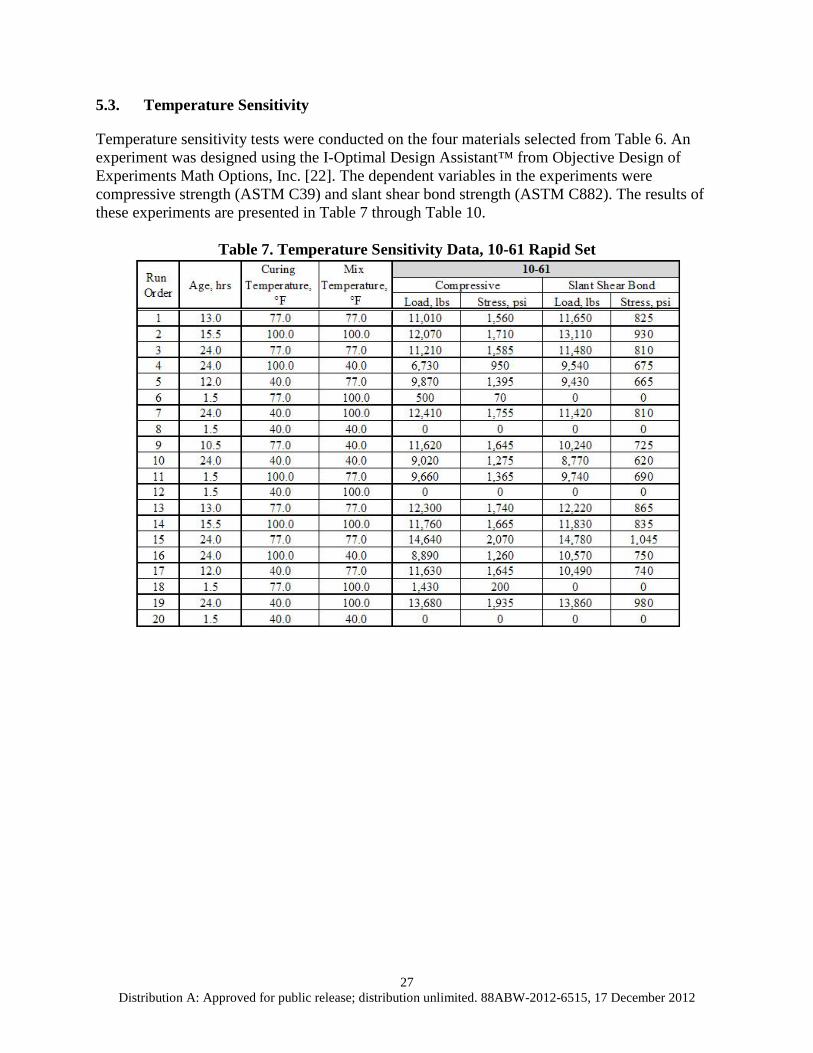
5.3. Temperature Sensitivity
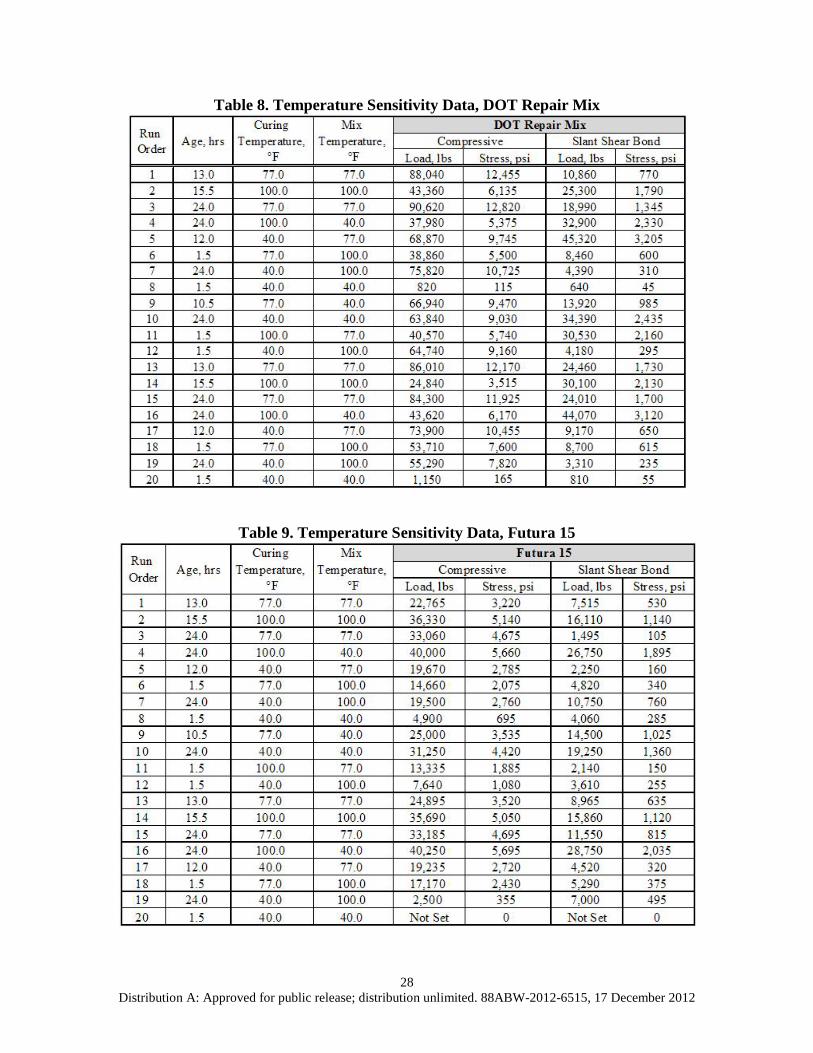
Temperature sensitivity tests were conducted on the four materials selected from Table 6. An experiment was designed using the I-Optimal Design Assistant™ from Objective Design of Experiments Math Options, Inc. [22]. The dependent variables in the experiments were compressive strength (ASTM C39) and slant shear bond strength (ASTM C882). The results of these experiments are presented in Table 7 through Table 10.
Table 7. Temperature Sensitivity Data, 10-61 Rapid Set
28 Distribution A: Approved for public release; distribution unlimited. 88ABW-2012-6515, 17 December 2012
Table 8. Temperature Sensitivity Data, DOT Repair Mix
Table 9. Temperature Sensitivity Data, Futura 15
29 Distribution A: Approved for public release; distribution unlimited. 88ABW-2012-6515, 17 December 2012
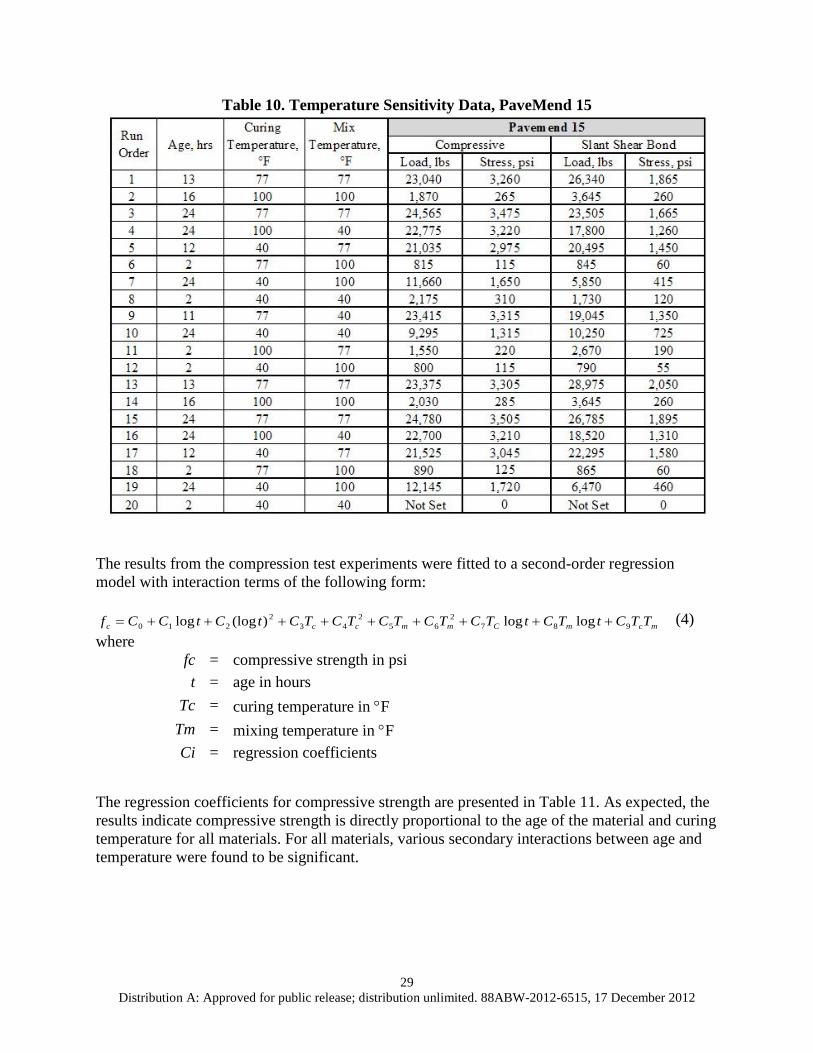
Table 10. Temperature Sensitivity Data, PaveMend 15
The results from the compression test experiments were fitted to a second-order regression model with interaction terms of the following form:
mcmCmmccc TTCtTCtTCTCTCTCTCtCtCCf 9872
652
432
210 loglog)(loglog +++++++++= (4) where
fc = compressive strength in psi t = age in hours
Tc = curing temperature in °F Tm = mixing temperature in °F Ci = regression coefficients
The regression coefficients for compressive strength are presented in Table 11. As expected, the results indicate compressive strength is directly proportional to the age of the material and curing temperature for all materials. For all materials, various secondary interactions between age and temperature were found to be significant.
30 Distribution A: Approved for public release; distribution unlimited. 88ABW-2012-6515, 17 December 2012
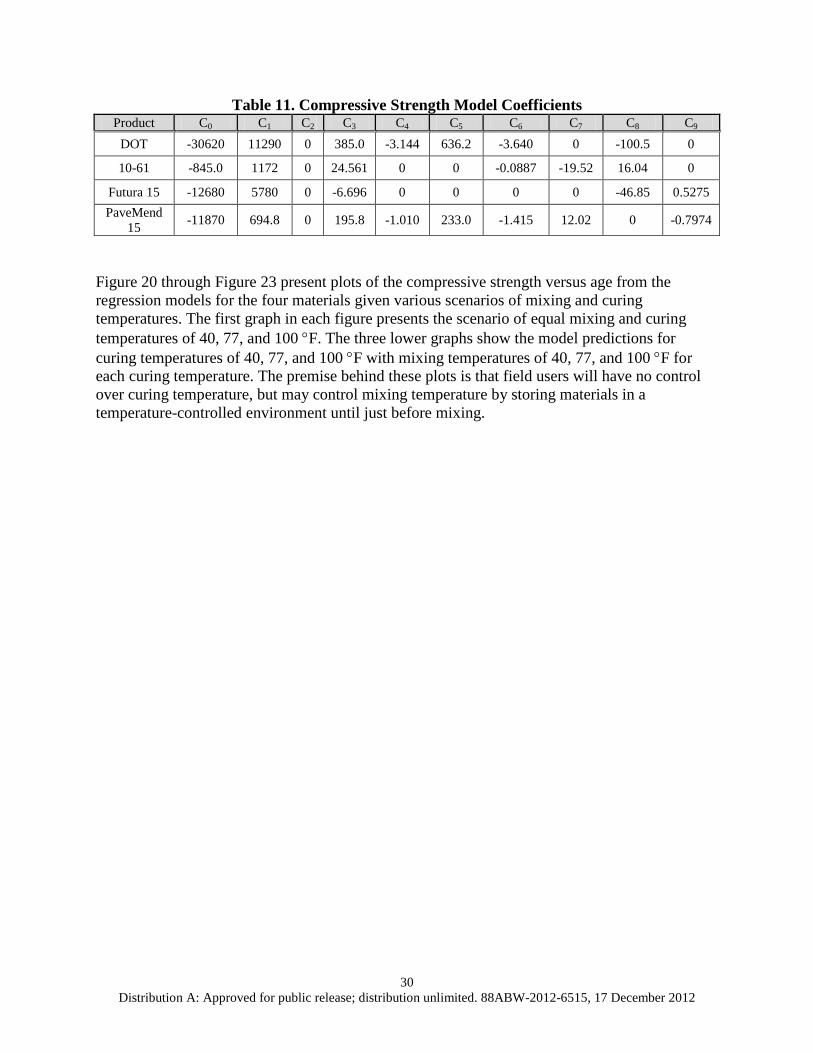
Table 11. Compressive Strength Model Coefficients Product C0 C1 C2 C3 C4 C5 C6 C7 C8 C9
DOT -30620 11290 0 385.0 -3.144 636.2 -3.640 0 -100.5 0
10-61 -845.0 1172 0 24.561 0 0 -0.0887 -19.52 16.04 0
Futura 15 -12680 5780 0 -6.696 0 0 0 0 -46.85 0.5275 PaveMend
15 -11870 694.8 0 195.8 -1.010 233.0 -1.415 12.02 0 -0.7974
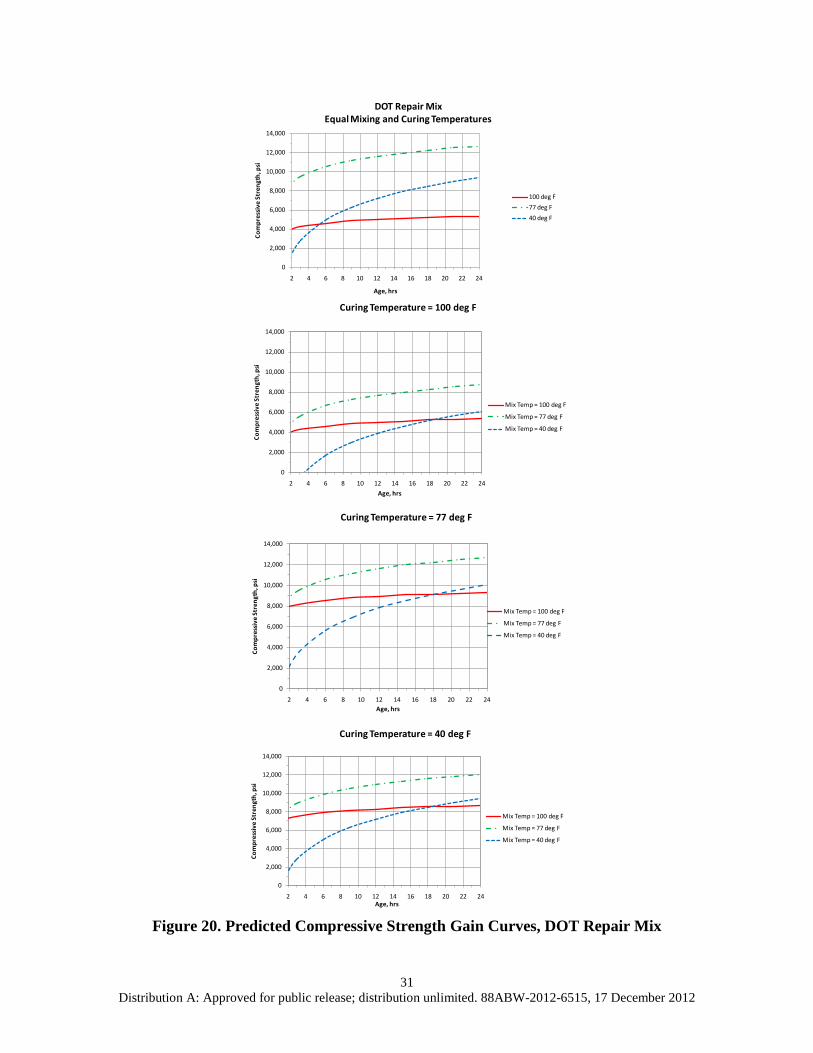
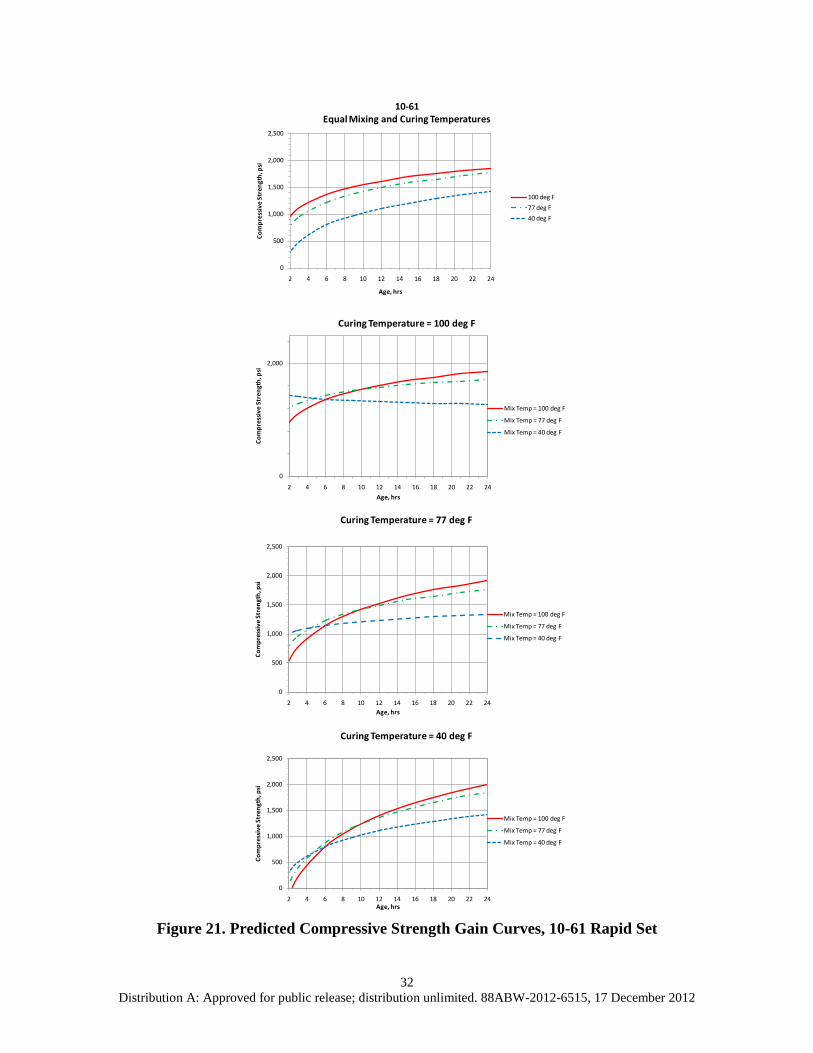
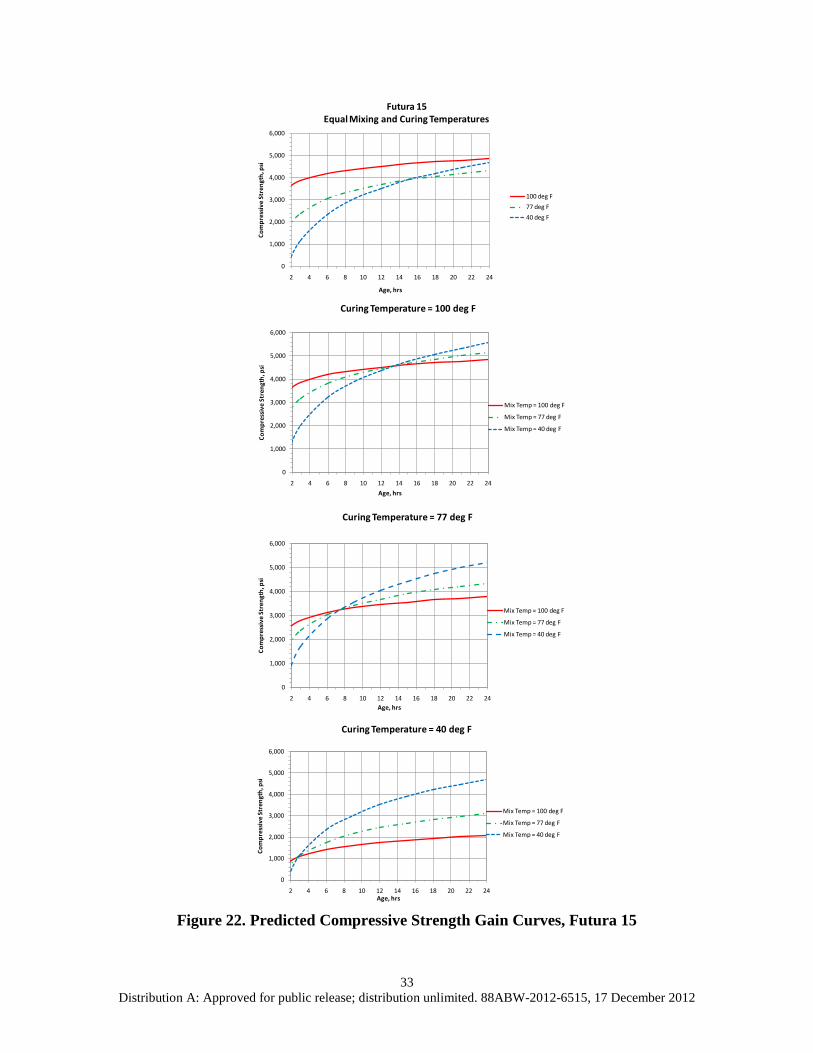
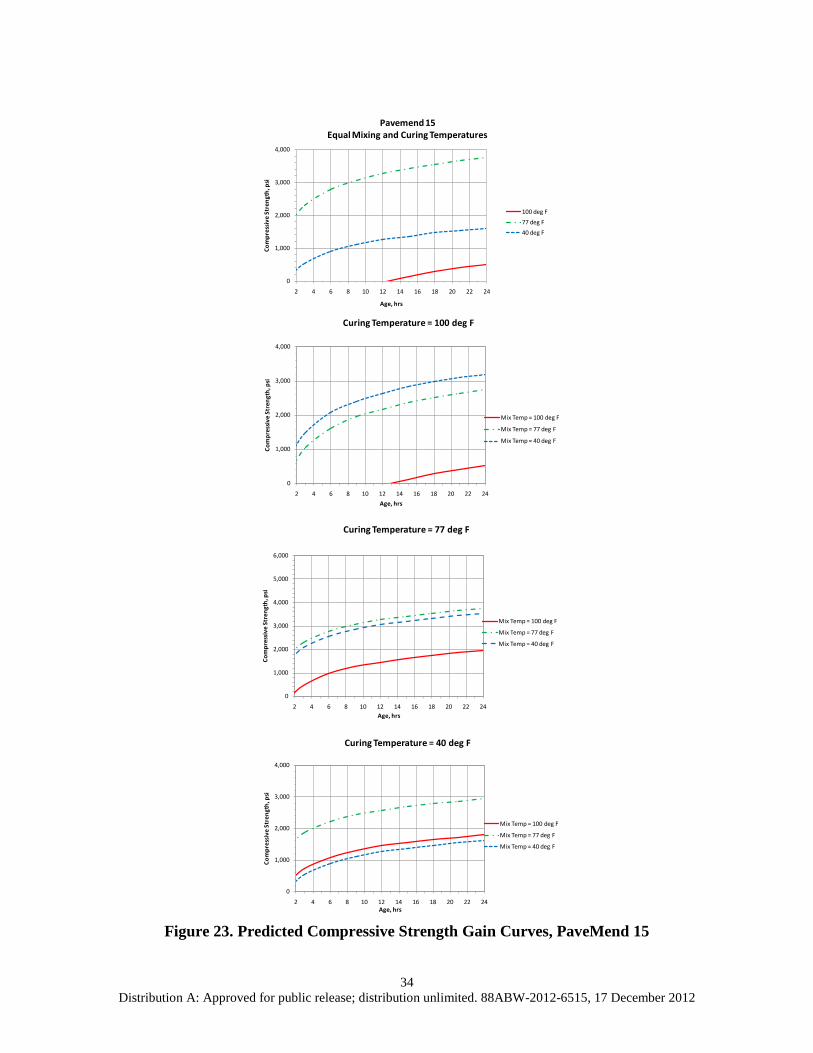
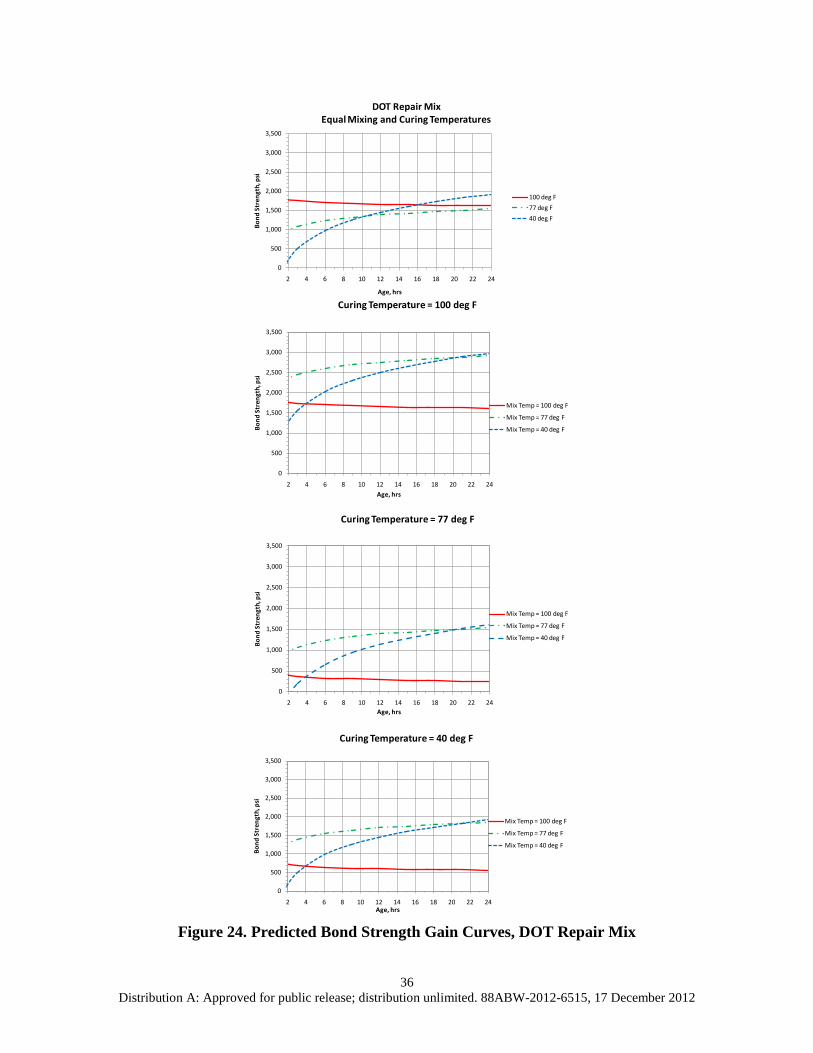
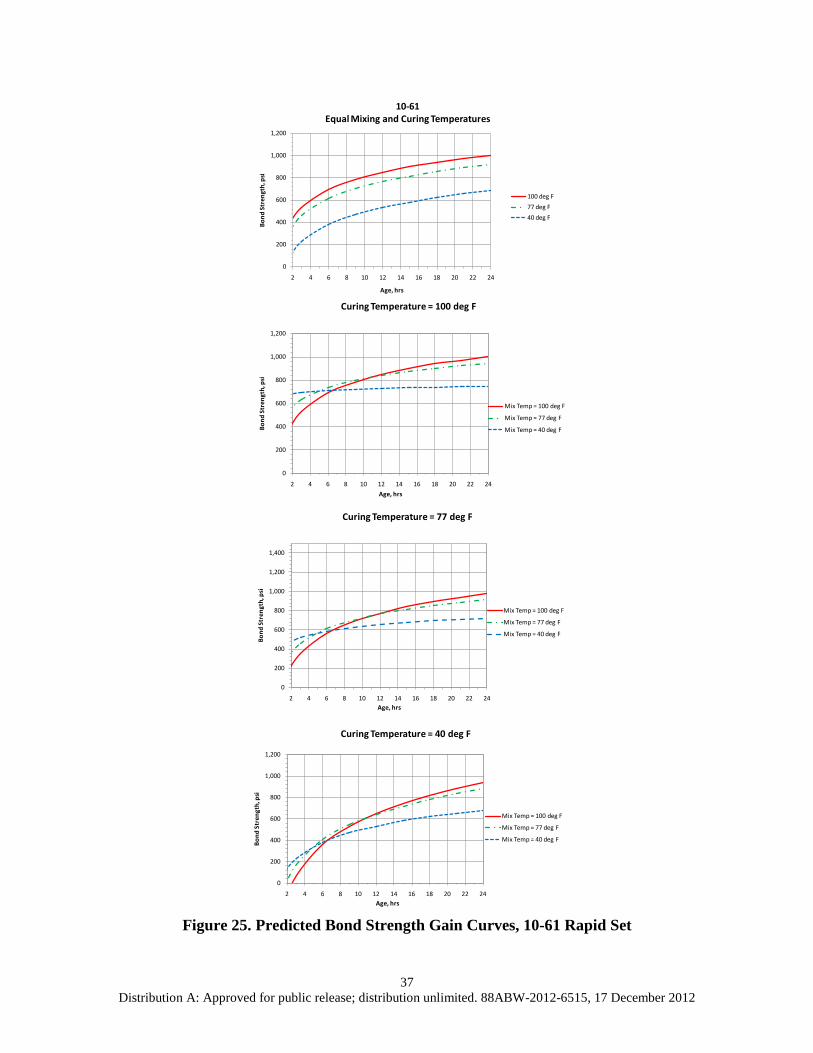
Figure 20 through Figure 23 present plots of the compressive strength versus age from the regression models for the four materials given various scenarios of mixing and curing temperatures. The first graph in each figure presents the scenario of equal mixing and curing temperatures of 40, 77, and 100 °F. The three lower graphs show the model predictions for curing temperatures of 40, 77, and 100 °F with mixing temperatures of 40, 77, and 100 °F for each curing temperature. The premise behind these plots is that field users will have no control over curing temperature, but may control mixing temperature by storing materials in a temperature-controlled environment until just before mixing.
31 Distribution A: Approved for public release; distribution unlimited. 88ABW-2012-6515, 17 December 2012
Figure 20. Predicted Compressive Strength Gain Curves, DOT Repair Mix
0
2,000
4,000
6,000
8,000
10,000
12,000
14,000
2 4 6 8 10 12 14 16 18 20 22 24
Com
pres
sive
Stre
ngth
, psi
Age, hrs
DOT Repair MixEqual Mixing and Curing Temperatures
100 deg F77 deg F40 deg F
0
2,000
4,000
6,000
8,000
10,000
12,000
14,000
2 4 6 8 10 12 14 16 18 20 22 24
Com
pres
sive
Stre
ngth
, psi
Age, hrs
Curing Temperature = 100 deg F
Mix Temp = 100 deg F
Mix Temp = 77 deg F
Mix Temp = 40 deg F
0
2,000
4,000
6,000
8,000
10,000
12,000
14,000
2 4 6 8 10 12 14 16 18 20 22 24
Com
pres
sive
Stre
ngth
, psi
Age, hrs
Curing Temperature = 40 deg F
Mix Temp = 100 deg F
Mix Temp = 77 deg F
Mix Temp = 40 deg F
0
2,000
4,000
6,000
8,000
10,000
12,000
14,000
2 4 6 8 10 12 14 16 18 20 22 24
Com
pres
sive
Stre
ngth
, psi
Age, hrs
Curing Temperature = 77 deg F
Mix Temp = 100 deg F
Mix Temp = 77 deg F
Mix Temp = 40 deg F
32 Distribution A: Approved for public release; distribution unlimited. 88ABW-2012-6515, 17 December 2012
Figure 21. Predicted Compressive Strength Gain Curves, 10-61 Rapid Set
0
500
1,000
1,500
2,000
2,500
2 4 6 8 10 12 14 16 18 20 22 24
Com
pres
sive
Stre
ngth
, psi
Age, hrs
10-61Equal Mixing and Curing Temperatures
100 deg F77 deg F40 deg F
0
2,000
2 4 6 8 10 12 14 16 18 20 22 24
Com
pres
sive
Stre
ngth
, psi
Age, hrs
Curing Temperature = 100 deg F
Mix Temp = 100 deg F
Mix Temp = 77 deg F
Mix Temp = 40 deg F
0
500
1,000
1,500
2,000
2,500
2 4 6 8 10 12 14 16 18 20 22 24
Com
pres
sive
Stre
ngth
, psi
Age, hrs
Curing Temperature = 40 deg F
Mix Temp = 100 deg F
Mix Temp = 77 deg F
Mix Temp = 40 deg F
0
500
1,000
1,500
2,000
2,500
2 4 6 8 10 12 14 16 18 20 22 24
Com
pres
sive
Stre
ngth
, psi
Age, hrs
Curing Temperature = 77 deg F
Mix Temp = 100 deg F
Mix Temp = 77 deg F
Mix Temp = 40 deg F
33 Distribution A: Approved for public release; distribution unlimited. 88ABW-2012-6515, 17 December 2012
Figure 22. Predicted Compressive Strength Gain Curves, Futura 15
0
1,000
2,000
3,000
4,000
5,000
6,000
2 4 6 8 10 12 14 16 18 20 22 24
Com
pres
sive
Stre
ngth
, psi
Age, hrs
Futura 15Equal Mixing and Curing Temperatures
100 deg F77 deg F40 deg F
0
1,000
2,000
3,000
4,000
5,000
6,000
2 4 6 8 10 12 14 16 18 20 22 24
Com
pres
sive
Stre
ngth
, psi
Age, hrs
Curing Temperature = 100 deg F
Mix Temp = 100 deg F
Mix Temp = 77 deg F
Mix Temp = 40 deg F
0
1,000
2,000
3,000
4,000
5,000
6,000
2 4 6 8 10 12 14 16 18 20 22 24
Com
pres
sive
Stre
ngth
, psi
Age, hrs
Curing Temperature = 40 deg F
Mix Temp = 100 deg F
Mix Temp = 77 deg F
Mix Temp = 40 deg F
0
1,000
2,000
3,000
4,000
5,000
6,000
2 4 6 8 10 12 14 16 18 20 22 24
Com
pres
sive
Stre
ngth
, psi
Age, hrs
Curing Temperature = 77 deg F
Mix Temp = 100 deg F
Mix Temp = 77 deg F
Mix Temp = 40 deg F
34 Distribution A: Approved for public release; distribution unlimited. 88ABW-2012-6515, 17 December 2012
Figure 23. Predicted Compressive Strength Gain Curves, PaveMend 15
0
1,000
2,000
3,000
4,000
2 4 6 8 10 12 14 16 18 20 22 24
Com
pres
sive
Stre
ngth
, psi
Age, hrs
Pavemend 15Equal Mixing and Curing Temperatures
100 deg F77 deg F40 deg F
0
1,000
2,000
3,000
4,000
2 4 6 8 10 12 14 16 18 20 22 24
Com
pres
sive
Stre
ngth
, psi
Age, hrs
Curing Temperature = 100 deg F
Mix Temp = 100 deg F
Mix Temp = 77 deg F
Mix Temp = 40 deg F
0
1,000
2,000
3,000
4,000
2 4 6 8 10 12 14 16 18 20 22 24
Com
pres
sive
Stre
ngth
, psi
Age, hrs
Curing Temperature = 40 deg F
Mix Temp = 100 deg F
Mix Temp = 77 deg F
Mix Temp = 40 deg F
0
1,000
2,000
3,000
4,000
5,000
6,000
2 4 6 8 10 12 14 16 18 20 22 24
Com
pres
sive
Stre
ngth
, psi
Age, hrs
Curing Temperature = 77 deg F
Mix Temp = 100 deg F
Mix Temp = 77 deg F
Mix Temp = 40 deg F
35 Distribution A: Approved for public release; distribution unlimited. 88ABW-2012-6515, 17 December 2012
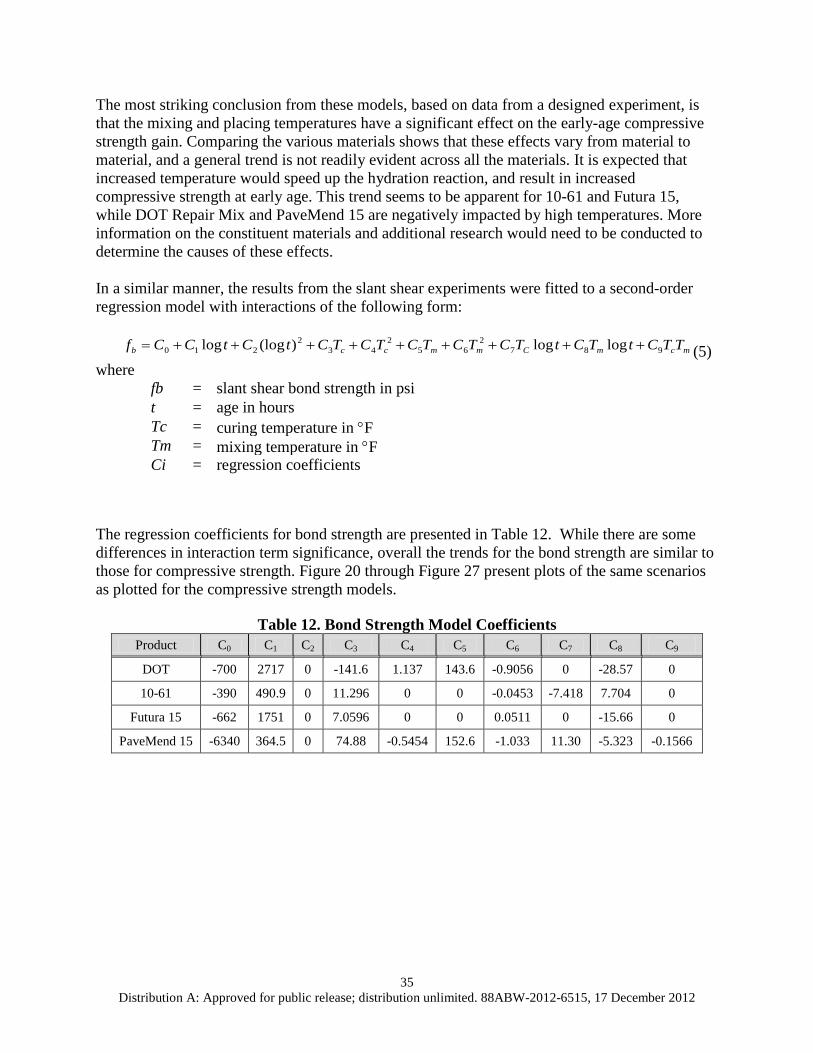
The most striking conclusion from these models, based on data from a designed experiment, is that the mixing and placing temperatures have a significant effect on the early-age compressive strength gain. Comparing the various materials shows that these effects vary from material to material, and a general trend is not readily evident across all the materials. It is expected that increased temperature would speed up the hydration reaction, and result in increased compressive strength at early age. This trend seems to be apparent for 10-61 and Futura 15, while DOT Repair Mix and PaveMend 15 are negatively impacted by high temperatures. More information on the constituent materials and additional research would need to be conducted to determine the causes of these effects. In a similar manner, the results from the slant shear experiments were fitted to a second-order regression model with interactions of the following form:
mcmCmmccb TTCtTCtTCTCTCTCTCtCtCCf 9872
652
432
210 loglog)(loglog +++++++++= (5) where
fb = slant shear bond strength in psi t = age in hours Tc = curing temperature in °F Tm = mixing temperature in °F Ci = regression coefficients
The regression coefficients for bond strength are presented in Table 12. While there are some differences in interaction term significance, overall the trends for the bond strength are similar to those for compressive strength. Figure 20 through Figure 27 present plots of the same scenarios as plotted for the compressive strength models.
Table 12. Bond Strength Model Coefficients
Product C0 C1 C2 C3 C4 C5 C6 C7 C8 C9
DOT -700 2717 0 -141.6 1.137 143.6 -0.9056 0 -28.57 0
10-61 -390 490.9 0 11.296 0 0 -0.0453 -7.418 7.704 0
Futura 15 -662 1751 0 7.0596 0 0 0.0511 0 -15.66 0
PaveMend 15 -6340 364.5 0 74.88 -0.5454 152.6 -1.033 11.30 -5.323 -0.1566
36 Distribution A: Approved for public release; distribution unlimited. 88ABW-2012-6515, 17 December 2012
Figure 24. Predicted Bond Strength Gain Curves, DOT Repair Mix
0
500
1,000
1,500
2,000
2,500
3,000
3,500
2 4 6 8 10 12 14 16 18 20 22 24
Bond
Str
engt
h, p
si
Age, hrs
DOT Repair MixEqual Mixing and Curing Temperatures
100 deg F77 deg F40 deg F
0
500
1,000
1,500
2,000
2,500
3,000
3,500
2 4 6 8 10 12 14 16 18 20 22 24
Bond
Str
engt
h, p
si
Age, hrs
Curing Temperature = 100 deg F
Mix Temp = 100 deg F
Mix Temp = 77 deg F
Mix Temp = 40 deg F
0
500
1,000
1,500
2,000
2,500
3,000
3,500
2 4 6 8 10 12 14 16 18 20 22 24
Bond
Str
engt
h, p
si
Age, hrs
Curing Temperature = 40 deg F
Mix Temp = 100 deg F
Mix Temp = 77 deg F
Mix Temp = 40 deg F
0
500
1,000
1,500
2,000
2,500
3,000
3,500
2 4 6 8 10 12 14 16 18 20 22 24
Bond
Str
engt
h, p
si
Age, hrs
Curing Temperature = 77 deg F
Mix Temp = 100 deg F
Mix Temp = 77 deg F
Mix Temp = 40 deg F
37 Distribution A: Approved for public release; distribution unlimited. 88ABW-2012-6515, 17 December 2012
Figure 25. Predicted Bond Strength Gain Curves, 10-61 Rapid Set
0
200
400
600
800
1,000
1,200
2 4 6 8 10 12 14 16 18 20 22 24
Bond
Str
engt
h, p
si
Age, hrs
10-61Equal Mixing and Curing Temperatures
100 deg F77 deg F40 deg F
0
200
400
600
800
1,000
1,200
2 4 6 8 10 12 14 16 18 20 22 24
Bond
Str
engt
h, p
si
Age, hrs
Curing Temperature = 100 deg F
Mix Temp = 100 deg F
Mix Temp = 77 deg F
Mix Temp = 40 deg F
0
200
400
600
800
1,000
1,200
2 4 6 8 10 12 14 16 18 20 22 24
Bond
Str
engt
h, p
si
Age, hrs
Curing Temperature = 40 deg F
Mix Temp = 100 deg F
Mix Temp = 77 deg F
Mix Temp = 40 deg F
0
200
400
600
800
1,000
1,200
1,400
2 4 6 8 10 12 14 16 18 20 22 24
Bond
Str
engt
h, p
si
Age, hrs
Curing Temperature = 77 deg F
Mix Temp = 100 deg F
Mix Temp = 77 deg F
Mix Temp = 40 deg F
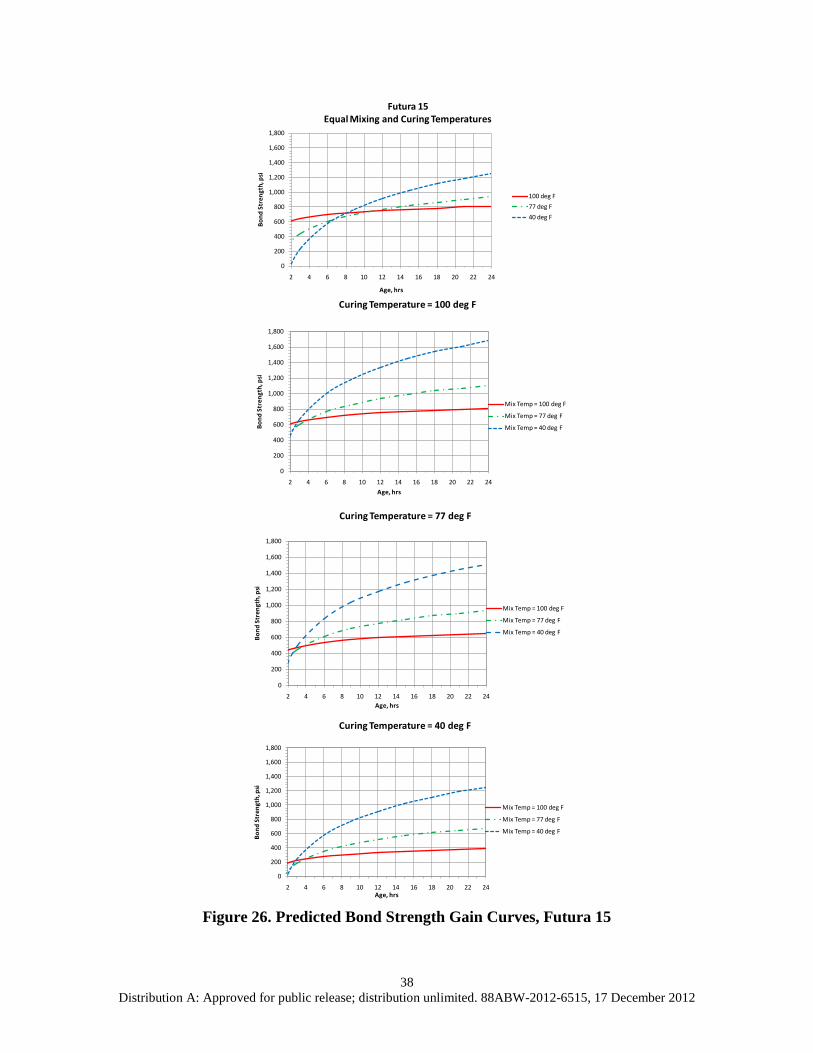
38 Distribution A: Approved for public release; distribution unlimited. 88ABW-2012-6515, 17 December 2012
Figure 26. Predicted Bond Strength Gain Curves, Futura 15
0
200
400
600
800
1,000
1,200
1,400
1,600
1,800
2 4 6 8 10 12 14 16 18 20 22 24
Bond
Str
engt
h, p
si
Age, hrs
Futura 15Equal Mixing and Curing Temperatures
100 deg F77 deg F40 deg F
0
200
400
600
800
1,000
1,200
1,400
1,600
1,800
2 4 6 8 10 12 14 16 18 20 22 24
Bond
Str
engt
h, p
si
Age, hrs
Curing Temperature = 100 deg F
Mix Temp = 100 deg F
Mix Temp = 77 deg F
Mix Temp = 40 deg F
0
200
400
600
800
1,000
1,200
1,400
1,600
1,800
2 4 6 8 10 12 14 16 18 20 22 24
Bond
Str
engt
h, p
si
Age, hrs
Curing Temperature = 40 deg F
Mix Temp = 100 deg F
Mix Temp = 77 deg F
Mix Temp = 40 deg F
0
200
400
600
800
1,000
1,200
1,400
1,600
1,800
2 4 6 8 10 12 14 16 18 20 22 24
Bond
Str
engt
h, p
si
Age, hrs
Curing Temperature = 77 deg F
Mix Temp = 100 deg F
Mix Temp = 77 deg F
Mix Temp = 40 deg F
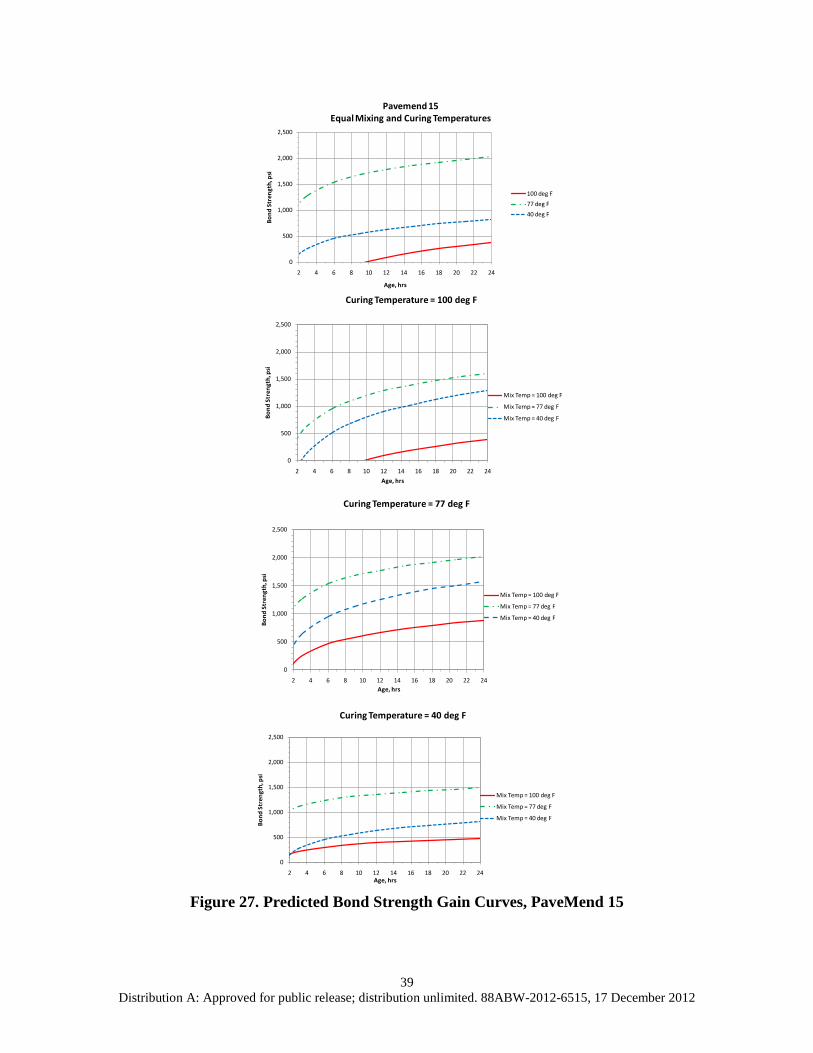
39 Distribution A: Approved for public release; distribution unlimited. 88ABW-2012-6515, 17 December 2012
Figure 27. Predicted Bond Strength Gain Curves, PaveMend 15
0
500
1,000
1,500
2,000
2,500
2 4 6 8 10 12 14 16 18 20 22 24Bo
nd S
tren
gth,
psi
Age, hrs
Pavemend 15Equal Mixing and Curing Temperatures
100 deg F77 deg F40 deg F
0
500
1,000
1,500
2,000
2,500
2 4 6 8 10 12 14 16 18 20 22 24
Bond
Str
engt
h, p
si
Age, hrs
Curing Temperature = 100 deg F
Mix Temp = 100 deg F
Mix Temp = 77 deg F
Mix Temp = 40 deg F
0
500
1,000
1,500
2,000
2,500
2 4 6 8 10 12 14 16 18 20 22 24
Bond
Str
engt
h, p
si
Age, hrs
Curing Temperature = 40 deg F
Mix Temp = 100 deg F
Mix Temp = 77 deg F
Mix Temp = 40 deg F
0
500
1,000
1,500
2,000
2,500
2 4 6 8 10 12 14 16 18 20 22 24
Bond
Str
engt
h, p
si
Age, hrs
Curing Temperature = 77 deg F
Mix Temp = 100 deg F
Mix Temp = 77 deg F
Mix Temp = 40 deg F
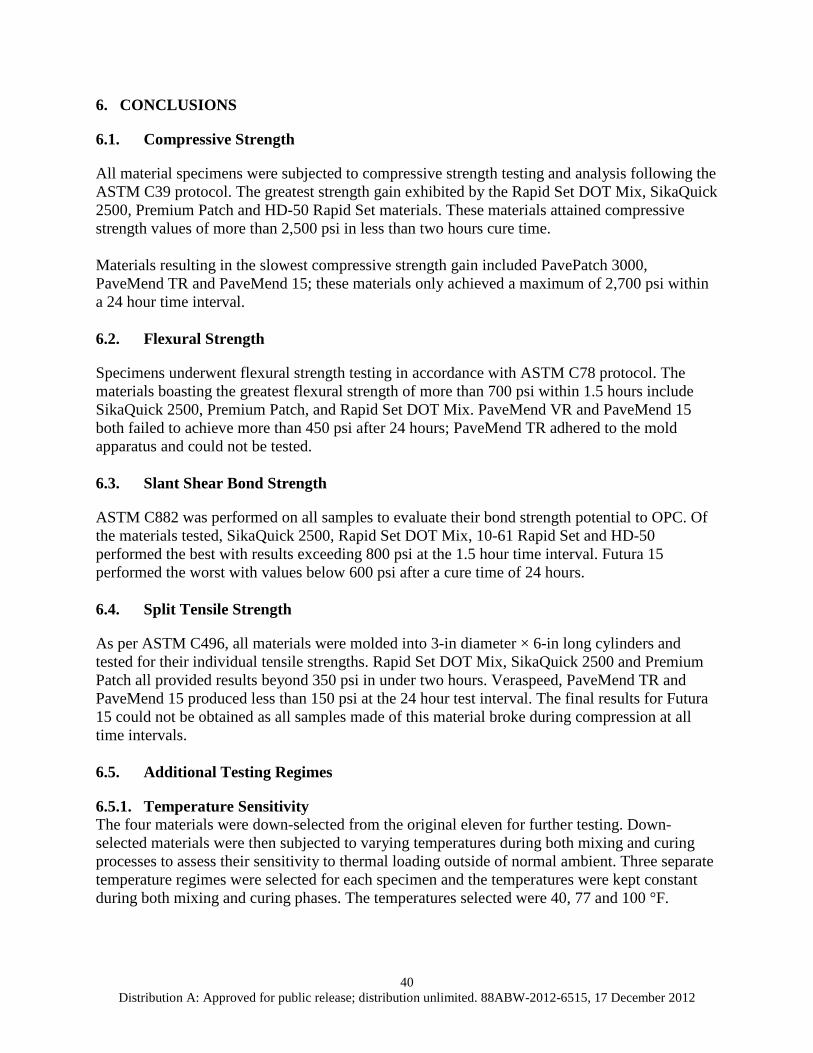
40 Distribution A: Approved for public release; distribution unlimited. 88ABW-2012-6515, 17 December 2012
6. CONCLUSIONS
6.1. Compressive Strength
All material specimens were subjected to compressive strength testing and analysis following the ASTM C39 protocol. The greatest strength gain exhibited by the Rapid Set DOT Mix, SikaQuick 2500, Premium Patch and HD-50 Rapid Set materials. These materials attained compressive strength values of more than 2,500 psi in less than two hours cure time. Materials resulting in the slowest compressive strength gain included PavePatch 3000, PaveMend TR and PaveMend 15; these materials only achieved a maximum of 2,700 psi within a 24 hour time interval. 6.2. Flexural Strength
Specimens underwent flexural strength testing in accordance with ASTM C78 protocol. The materials boasting the greatest flexural strength of more than 700 psi within 1.5 hours include SikaQuick 2500, Premium Patch, and Rapid Set DOT Mix. PaveMend VR and PaveMend 15 both failed to achieve more than 450 psi after 24 hours; PaveMend TR adhered to the mold apparatus and could not be tested. 6.3. Slant Shear Bond Strength
ASTM C882 was performed on all samples to evaluate their bond strength potential to OPC. Of the materials tested, SikaQuick 2500, Rapid Set DOT Mix, 10-61 Rapid Set and HD-50 performed the best with results exceeding 800 psi at the 1.5 hour time interval. Futura 15 performed the worst with values below 600 psi after a cure time of 24 hours. 6.4. Split Tensile Strength
As per ASTM C496, all materials were molded into 3-in diameter × 6-in long cylinders and tested for their individual tensile strengths. Rapid Set DOT Mix, SikaQuick 2500 and Premium Patch all provided results beyond 350 psi in under two hours. Veraspeed, PaveMend TR and PaveMend 15 produced less than 150 psi at the 24 hour test interval. The final results for Futura 15 could not be obtained as all samples made of this material broke during compression at all time intervals. 6.5. Additional Testing Regimes
6.5.1. Temperature Sensitivity The four materials were down-selected from the original eleven for further testing. Down-selected materials were then subjected to varying temperatures during both mixing and curing processes to assess their sensitivity to thermal loading outside of normal ambient. Three separate temperature regimes were selected for each specimen and the temperatures were kept constant during both mixing and curing phases. The temperatures selected were 40, 77 and 100 °F.
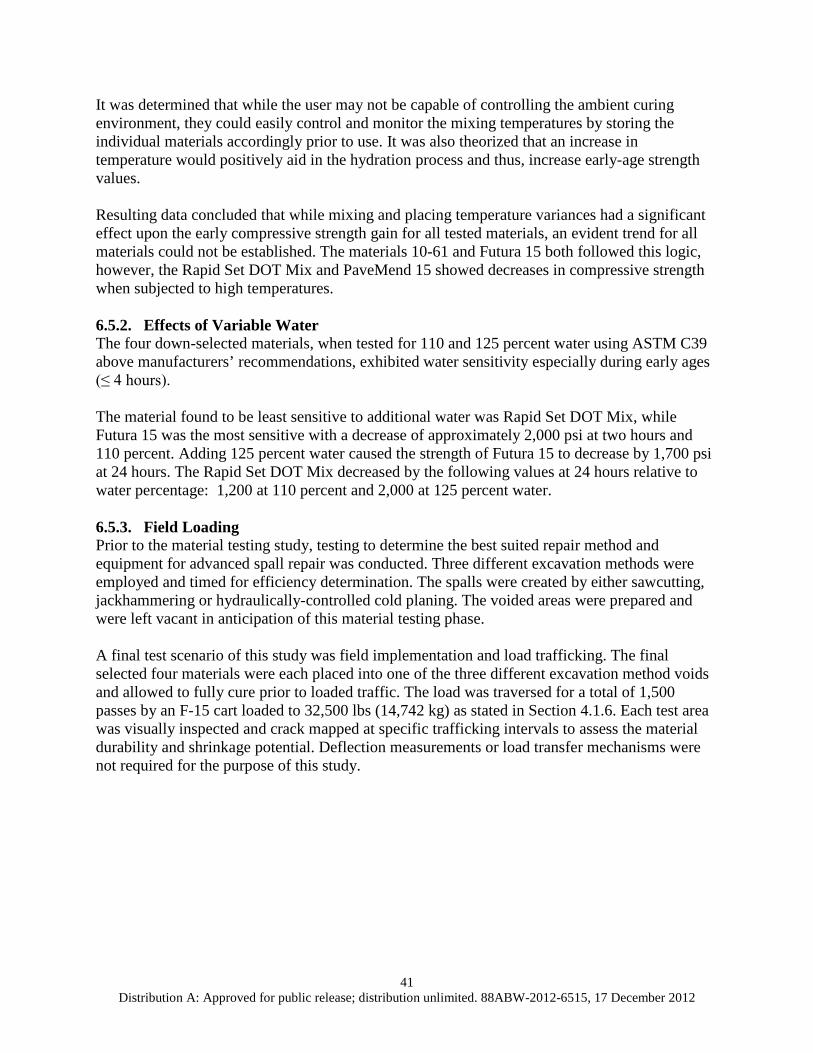
41 Distribution A: Approved for public release; distribution unlimited. 88ABW-2012-6515, 17 December 2012
It was determined that while the user may not be capable of controlling the ambient curing environment, they could easily control and monitor the mixing temperatures by storing the individual materials accordingly prior to use. It was also theorized that an increase in temperature would positively aid in the hydration process and thus, increase early-age strength values. Resulting data concluded that while mixing and placing temperature variances had a significant effect upon the early compressive strength gain for all tested materials, an evident trend for all materials could not be established. The materials 10-61 and Futura 15 both followed this logic, however, the Rapid Set DOT Mix and PaveMend 15 showed decreases in compressive strength when subjected to high temperatures. 6.5.2. Effects of Variable Water The four down-selected materials, when tested for 110 and 125 percent water using ASTM C39 above manufacturers’ recommendations, exhibited water sensitivity especially during early ages (≤ 4 hours). The material found to be least sensitive to additional water was Rapid Set DOT Mix, while Futura 15 was the most sensitive with a decrease of approximately 2,000 psi at two hours and 110 percent. Adding 125 percent water caused the strength of Futura 15 to decrease by 1,700 psi at 24 hours. The Rapid Set DOT Mix decreased by the following values at 24 hours relative to water percentage: 1,200 at 110 percent and 2,000 at 125 percent water. 6.5.3. Field Loading Prior to the material testing study, testing to determine the best suited repair method and equipment for advanced spall repair was conducted. Three different excavation methods were employed and timed for efficiency determination. The spalls were created by either sawcutting, jackhammering or hydraulically-controlled cold planing. The voided areas were prepared and were left vacant in anticipation of this material testing phase. A final test scenario of this study was field implementation and load trafficking. The final selected four materials were each placed into one of the three different excavation method voids and allowed to fully cure prior to loaded traffic. The load was traversed for a total of 1,500 passes by an F-15 cart loaded to 32,500 lbs (14,742 kg) as stated in Section 4.1.6. Each test area was visually inspected and crack mapped at specific trafficking intervals to assess the material durability and shrinkage potential. Deflection measurements or load transfer mechanisms were not required for the purpose of this study.
42 Distribution A: Approved for public release; distribution unlimited. 88ABW-2012-6515, 17 December 2012
7. RECOMMENDATIONS
• Based on empirical data and materials characteristics testing, it is recommended that either the Rapid Set DOT Mix or SikaQuick 2500 material be used for rapid-setting spall repairs.
• Materials are water sensitive as each manufacturers recommendation should be followed to ensure superior performance.
• The cold planer method is the recommended method of spall preparation.
• Additional tests should be performed using alternative materials not yet tested in an effort to broaden the applicable base of available and newer repair materials.
43 Distribution A: Approved for public release; distribution unlimited. 88ABW-2012-6515, 17 December 2012
8. REFERENCES
1. Speer, Benjamin S., “A Value-Focused Thinking Model for the Selection of the Best Rigid Pavement Partial-Depth Spall Repair Material,” AFIT/GEM/ENS-07-4, Air Force Institute of Technology, Wright-Patterson Air Force Base, OH, March 2007.
2. American Concrete Institute. “Guide for the Selection of Materials for the Repair of Concrete.” ACI 546.3R-06, Farmington Hills, Michigan. December 2006.
3. Department of the Air Force. “Spall Repair of Portland Cement Concrete (PCC) Airfield Pavements in Expeditionary Environments, ETL 07-8,” Air Force Civil Engineer Support Agency, Tyndall AFB, FL, Jul 2007.
4. Vaysburd, Alexander M., Peter H. Emmons, James E. McDonald, and Randall W. Poston, “Performance Criteria for Concrete Repair Materials, Phase II Summary Report,” Technical Report REMR-CS-62, U.S. Army Corps of Engineers, March 1999.
5. Federal Highway Administration, “Materials and Procedures for Rapid Repair of Partial-Depth Spalls in Concrete Pavements – Manual of Practice,” FHWA-RD-99-152, Washington D.C., March 2000.
6. W.R. Meadows Website. “Futura-15 Material Safety Data Sheet.” 1 July 2004. http://www.wrmeadows.com/MSDS-PDF/8140000.pdf. Accessed 17 September 2007.
7. W.R. Meadows Website. “Futura-15 Product Data Sheet.” July 2004. http://www.wrmeadows.com/wrmh0127.htm. Accessed 17 September 2007.
8. Dayton Superior Website. “HD-50 Data Sheet.” http://www.daytonsuperior.com/chemical/techdata/HD_50.pdf. Accessed 17 September 2007.
9. Dayton Superior Website. “Pave Patch-3000 Data Sheet.” http://www.conspecmkt.com/techdata/Pave_Patch_3000.pdf. Accessed 17 September 2007.
10. Dayton Superior Website. “Pave Patch-3000 Material Safety Data Sheet.” . http://www.conspecmkt.com/msds/Pave_Patch_3000.pdf. Accessed 17 September 2007
11. Pre-Blend Website. “Premium Patch Material Safety Data Sheet.” http://www.preblend.com/sitebuildercontent/sitebuilderfiles/premiumpatchmsds.pdf. Accessed 17 September 2007.
12. Pre-Blend Website. “Premium Patch Technical Data Sheet.” http://www.preblend.com/sitebuildercontent/sitebuilderfiles/TDS/TDSPremiumPatch.pdf. Accessed 17 September 2007.
13. Sika Corporation Website. “SikaQuick 2500 Specification Component: SC-086-0103.” 24 January 2003. http://www.sikacorp.com/sc-cpd-SikaQuick2500-us.pdf. Accessed 17 September 2007.
44 Distribution A: Approved for public release; distribution unlimited. 88ABW-2012-6515, 17 December 2012
14. Sika Corporation Website. “SikaQuick 2500 Product Data Sheet.” 18 January 2007. http://www.sikacorp.com/tds-cpd-SikaQuick2500-us.pdf. Accessed 17 September 2007.
15. The Euclid Company Website. “Versaspeed Material Safety Data Sheet.” 24 May 2005. http://www.euclidchemical.com/fileshare/ProductFiles/msds/083P_50_U.pdf. Accessed 17 September 2007.
16. The Euclid Company Website. “Versaspeed Product Data Sheet.” http://www.euclidchemical.com/fileshare/ProductFiles/msds/083P_50_U.pdf. Accessed 17 September 2007.
17. Emerging Construction Technologies Website. “PaveMend – Ceracrete Rapid Repair Products.” Purdue University. http://www.ecn.purdue.edu/ECT/Civil/ceracrete.htm. Accessed 14 September 2007.
18. CeraTech Website. “Repair Product Brochure.” 16 April 2007. Accessed 14 September 2007. http://www.ceratechinc.com/pdf/product_brochure.pdf
19. BASF Building Systems Website. “10-61 Rapid Mortar Material Safety Data Sheet Version 1.5.” 22 December 2006. http://www.buildingsystems.basf.com/documents/61r_msd.pdf. Accessed 14 September 2007.
20. BASF Building Systems Website. “10-61 Rapid Mortar Product Data Sheet.” http://www.buildingsystems.basf.com/documents/61r_tdg.pdf . Accessed 14 September 2007.
21. CTS Cement Website. “Rapid Set DOT Repair Mix – FAQ’s.” http://www.rapidset.com/DOTRepairMix_FAQ.asp. Accessed 18 September 2007.
22. Objective Design of Experiments Website. “I-Optimal Design Assistant™ Online.” http://www.objectivedoe.com/student/DOEResources/Assistant/assistantintro.php. Accessed 25 June 2009.
45 Distribution A: Approved for public release; distribution unlimited. 88ABW-2012-6515, 17 December 2012
LIST OF SYMBOLS, ABBREVIATIONS, AND ACRONYMS
ACI American Concrete Institute AFRL Air Force Research Laboratory ASR alkali-silica reaction ASTM American Society for Testing and Materials bar unit of pressure CTI CeraTech Incorporated e.g. for example ETL Engineering Technical Letter FOD foreign object debris ft foot/feet hrs hours in inch kg kilograms lbs pounds m meter(s) mm millimeter(s) OPC ordinary Portland cement psi pounds per square inch SSD saturated surface dry °F temperature in degrees Fahrenheit % percent