Embed Size (px)
Citation preview
SWP559
Rapid Population Growth in Sub-Saharan AfricaIssues and Policies
Rashid FaruqeeRavi Gulhati
WORLD BANK STAFF WORKING PAPERSNumber 559
FILE Cpy
Pub
lic D
iscl
osur
e A
utho
rized
Pub
lic D
iscl
osur
e A
utho
rized
Pub
lic D
iscl
osur
e A
utho
rized
Pub
lic D
iscl
osur
e A
utho
rized
Pub
lic D
iscl
osur
e A
utho
rized
Pub
lic D
iscl
osur
e A
utho
rized
Pub
lic D
iscl
osur
e A
utho
rized
Pub
lic D
iscl
osur
e A
utho
rized

fe-,la,s$`,4*_
WORLD BANK STAFF WORKING PAPERS g
Number 559
Rapid Population Growth in Sub-Saharan AfricaIssues and Policies
Rashid FaruqeeRavi Gulhati
The World BankWashington, D.C., U.S.A.
Copyright © 1983The International Bank for Reconstructionand Development / THE WO)RLD BANX1818 H Street, N.W.Washington, D.C. 20433, U.S.A.
All rights reservedManufactured in the United States of AmericaFirst printing February 1983
This is a working document published informally by the World Bank. Topresent the results of research with the least possible delay, the typescript hasnot been prepared in accordance with the procedures appropriate to formalprinted texts, and the World Bank accepts no responsibility for errors. Thepublication is supplied at a token charge to defray part of the cost ofmanufacture and distribution.
The views and interpretations in this document are those of the author(s) andshould not be attributed to the World Bank, to its affiliated organizations, or toany individual acting on their behalf. Any maps used have been preparedsolely for the convenience of the readers; the denominations used and theboundaries shown do not imply, on the part of the World Bank and its affiliates,any judgment on the legal status of any territory or any endorsement oracceptance of such boundaries.
The full range of World B3ank publications is described in the Catalog of WorldBank Publications; the continuing research program of the Bank is outlined inWorld Bank Research Program: Abstracts of Current Studies. Both booklets areupdated annually; the most recent edition of each is available without chargefrom the Publications Distribution Unit of the Bank in Washington or from theEuropean Office of the Bank, 66, avenue d'Iéna, 7511.6 Paris, France.
Rashid Faruqee is an economist with the West Africa Regional Office ofThe World Bank; Ravi Gulhati is chief economist of the East Africa RegionalOffice.
Llibrary of Coongress Vataloging in Publication IData
El.zuqee, %ahîd, 1938-R.piîd populatiou gA alh f.n Sub.-'sa az Aflzîca.
(World Bank staff frOkLas papers ; 559)B2blb1ogzaphyt P.,X A-frica, Sub-Seh Pop 1afLon , 2 Populat0on
-Afrîcas, Subg-Sahana. 4. 3Loin pol.cy.. Do. Gu.ha ', S ;X s.' 1-X.. 2
EB3661 .A3F37 19833 306 2 0967 83 -12 5ISBZ 0=8213=0152-7
Abstract
Substantial social and economic progress in Sub-Saharan Africa during
the past 15 years has not altered the traditional regime of very high fertil-
ity. Explanations for this paradox have to turn to broad societal character-
istics not captured by multivariate analysis of the household level. The
search for physical survival promotes a very large family norm. Righ fertil-
ity may also reflect the predicament of the African woman. The paper argues
that enough is known to provide a reliable basis for policies aimed atreducing fertility. The case for such policies rests on evidence that the
challenge posed by accelerating population growth in Africa has not elicited a
commensurate response in the form of technological or organizational prog-ress. Instead, growing population numbers have accentuated the food deficit,
magnified the budgetary problem of financing basic needs services and compli-
cated the employment issue.
The paper projects future population growth of nine sample countries,
accounting for two-thirds of Africa's total population, on the basis of foursets of assumptions. These exercises confirm the desirability of action by
African governments to reduce fertility. Present population policies are weak
and attempts to strengthen them face formidable obstacles. Nevertheless, a
start can be made almost everywhere by defining programs which fit into theprevailing cultural context. These programs have to evolve into broad
policies. The goal is not simply to deliver contraceptives through the health
network. What is required is a transformation of production and socialrelationships and through these changes a major revolution in values that
determine desired family size.
Acknowledgement
Authors are grateful to Timothy King, Paul Isennan and Susan Cochrane
for their valuable comments on an earlier version of this paper.

CONTENTS
Page No.
I. The Record ............................................... 2
II. Prospects, 1980-2020 ....... .............................. 18
III. Consequences of Rapid Population Growth . ................. 25Food and Agriculture ...... .......................... 25Labor Force Growth and Employment ............ ........ 32Services for Basic Needs ............................ 39
IV. Determinants of Fertility .............. .. ................ 44
V. Population Policies: Present and Future ................. 55
LIST OF TEXT TABLES AND FIGURES
Table 1: Growth of GDP, By Country Group, 1960-80. ......... 3
Table 2: Indices of Progress, Sub-Saharan Africa . . 3
Table 3: Relations between Per Capita GNP and OtherVariables .. .. .12
Table 4: Socioeconomic and Demographic Characteristicsof Kenya and Other African Countries (Late 1970s) ...... 13
Table 5: Grouping of Sub-Saharan Countries by their Birthand Death Rates ........................................ 15
Table 6: Decline in Fertility and Mortality, SelectedAsian and Sub-Saharan Countries .17
Table 7: Projections of Percentage Increase in TotalPopulation, Working-Age Population, and Womenof Reproductive Age for Nine Sub-SaharanCountries, Under Alternative Assumptions,1980-2000 and 2000-2020.... 21
Table 8: Median Fertility and Mortality Rates Implied inAlternative Projections of Nine Sub-Saharan Countries 22
Table 9A: Potential Agricultural Land by Cost of Development ..... 30
Table 9B: Percent Distribution of Agricultural Land by Quality ... 30
Table 10: Expansion of Labour Force, Output and Capitalper Worker: 1970s. .......... . 33
ii 1
Table 11: Actual Fertility and Desired Number of Children .. 0.0.0. 46
Table 12: Sub-Saharan African Countries Classified by theirPosition on Population Policy and Family Planning 000000 56
Figure 1: Sub-Saharan Africa, Asia, Latin AmericaPopulation Growth Rates, 1950-2000 ..................... 5
Figure 2: Crude Birth Rate and GNP per Capita o................... 6
Figure 3: Crude Death Rate and GNP per Capita .................... 7
Figure 4: Urbanization Rate and GNP per Capita ................... 8
Figure 5: Primary School Enrollment and GNP per Capita ........... 9
Figure 6: Secondary School Enrollment and GNP per Capita ......... 10
Figure 7: Adult Literacy Rate and GNP per Capita ................. il
Figure 8: Projection of Population of Nine Sub--Saharan AfricaCountries OOOOOOOOOOOOOO.Oooooooooo.OOoooooooooooooooooo 19
Figure 9: Sub-Saharan Africa: Index of Food ProductionPer Capita ....................................... 26
Figure 10: Sub-Saharan Africa, Asia, and Latin AmericaYields for Staple Crops ................................ 27
Figure 11: Working Age Population, Labor Force UnderAlternative Assumptions ooo....o..........o .......... 38
Figure 12: Projections of Primary School-Age Population for NineSub-Saharan African Countries under AlternativeAssumptions .............................. o............. 40
LIST OF ANNEX TABLES
Annex Table 1: Birth Rates, Death Rates and Rates of NaturalIncrease by Region, 1950-55 to 1975-80 0.0.0o00o00 68
Annex Table 2: Growth of Total Population, Working AgePopulation, and Women of Reproductive Age,Under Alternative Projections ....... o ......... 69
Annex Table 3: Low Fertility Projection: Total Population,Birth and Death Rates of Selected Countriesin Sub-Saharan Africa .......- ............ o .... 70
Annex Table 4: Assumptions Underlying the Low FertilityPopulation Projections ........................... 71
- iii -
Annex Table 5: UN High Fertility Variant Projection: TotalPopulation, Birth and Death Rates of SelectedCountries in Sub-Saharan Africa .... .............. 72
Annex Table 6: Assumptions Underlying the UN High VariantPopulation Projections ..... ...................... 73
Annex Table 7: Population Projection Based on the Assumptionthat TFR for 1980-85 Remains Constant During
1980-2020: Total Population, Birth and DeathRates of Selected Countries in Sub-Saharan Africa 74
Annex Table 8: Assumptions Underlying the Constant FertilityPopulation Projections ........................... 75
Annex Table 9: Population Projection Based on Constant TFR andSlow Improvement of Female Life Expectancy:Total Population, Birth and Death Rates ofSelected Countries in Sub-Saharan Africa ......... 76
Annex Table 10: Assumptions Underlying the Constant Fertility(with Slow Improvement in Life Expectancy)Population Projections ........................... 77
Annex Table 11: Labor Force Projection of Selected Countries inSub-Saharan Africa .... ........................... 78
Annex Table 12: Labor Force Projection of Selected Countriesin Sub-Saharan Africa (Assuming that TFR for1980-85 will remain constant during 1980-2020) ... 79
Annex Table 13: Some Indicators of the Provision of Basic Needsin Selected Countries of Sub-Saharan Africa -1960, 1970 and the Most Recent Estimates (MRE) ... 80
Annex Table 14: Projection of Primary School-Age Population(6-13) of Selected Countries in Sub-SaharanAfrica (Based on Low Fertility Estimates) ........ 81
Annex Table 15: Projection of Primary School-Age Population
(6-13) of Selected Countries in Sub-SaharanAfrica (Based on UN High Fertility VariantEstimates) ......................................................... 82
Annex Table 16: Projection of Primary School-Age Population
(6-13) of Selected Countries of Sub-SaharanAssuming the TFR for 1980-85 to RemainConstant during 1980-2020 .... .................... 83
Annex Table 17: Estimates of Fertility Rates in Kenya, 1948-1978 84
Annex Table 18: Estimates of Total Fertility Rate in Countriesof Sub-Saharan Africa from Two Sources ........ .. 85

iv -
Annex Table 19: Population Policy Compendium: Selected AfricanCountries with Strongest Population Program ...... 86
Annex Table 20: Comparative Indices on Women Status în SelectedCountries in Sub-Saharan Africa and Southand East Asia .................................... 88
References ... o.. .o.o.o.o.o.o.o 89
Rapid Population Growth in Sub-Saharan Africa: Issues and Policies
Countries in Sub-Saharan Africa continue to lag behind other developing
countries in the demographic transition from a regime of high mortality and
fertility to a regime in which death and birth rates stabilize at much lower
levels. The lag is a reflection of the relative underdevelopment of the
region, but that is not the whole story. Despite significant progress in
living standards, a substantial fall in mortality, impressive expansion in
education, and a measure of urbanization during the 1960s and 1970s, fertility
rates remain extraordinarily high in most Sub-Saharan countries. Furthermore,
the prospect of fertility reduction is not very bright during the 1980s or
1990s. The pace of economic and social development in Sub-Saharan Africa has
slowed down considerably, and the probability of an early revival is low.
This grim outlook means stagnation in per capita incomes, formidable
difficulties in sustaining or improving educational systems, and a setback in
health--conditions hardly propitious for initiating fertility declines. In
addition, many governments remain unconvinced of the desirability or
feasibility of population policies aimed at speeding up the transition to
lower birth rates.
In this paper, we first analyze the demographic scene in Sub-Saharan
Africa and compare it with conditions in other parts of the world. Second, we
bring out demographic differences among Sub-Saharan countries and try to
assess their impact. Projections for 1980-2020 of the total population, the
school-going population, and the working population for a sample of nine coun-
tries are attempted on the basis of alternative assumptions regarding
fertility and mortality. Third, the implications of rapid population growth
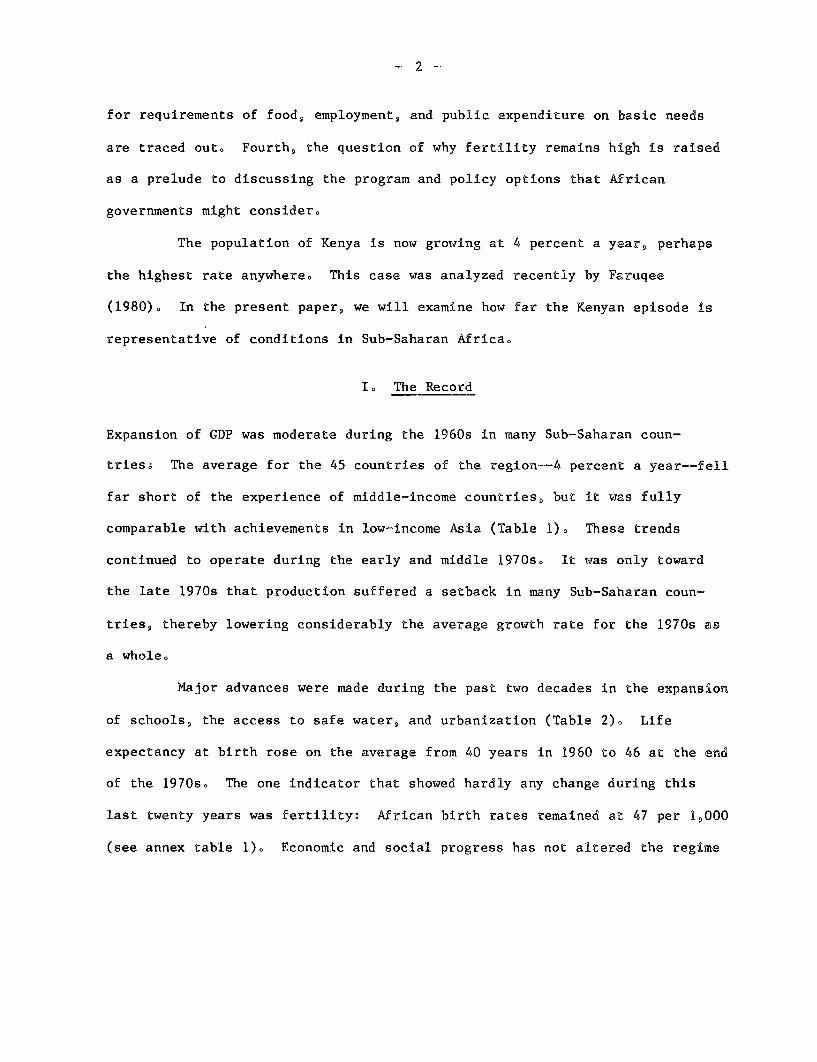
for requirements of food, employment, and public expenditure on basic needs
are traced out. Fourth, the question of why fertility remains hîgh is raised
as a prelude to discussing the program and policy options that African
governments might consider.
The population of Kenya is now growîng at 4 percent a year, perhaps
the highest rate anywhere. This case was analyzed recently by Faruqee
(1980). In the present paper, we will examine how far the Kenyan episode is
representative of conditions in Sub-Saharan Africa.
I. The Record
Expansion of GDP was moderate during the 1960s in many Sub-Saharan coun-
tries4 The average for the 45 countries of the region--4 percent a year--fell
far short of the experience of middle-income countries, but it was fully
comparable with achievements in low-income Asia (Table 1). These trends
continued to operate during the early and middle 1970s. It was only toward
the late 1970s that production suffered a setback in many Sub-Saharan coun-
tries, thereby lowering considerably the average growth rate for the 1970s as
a whole.
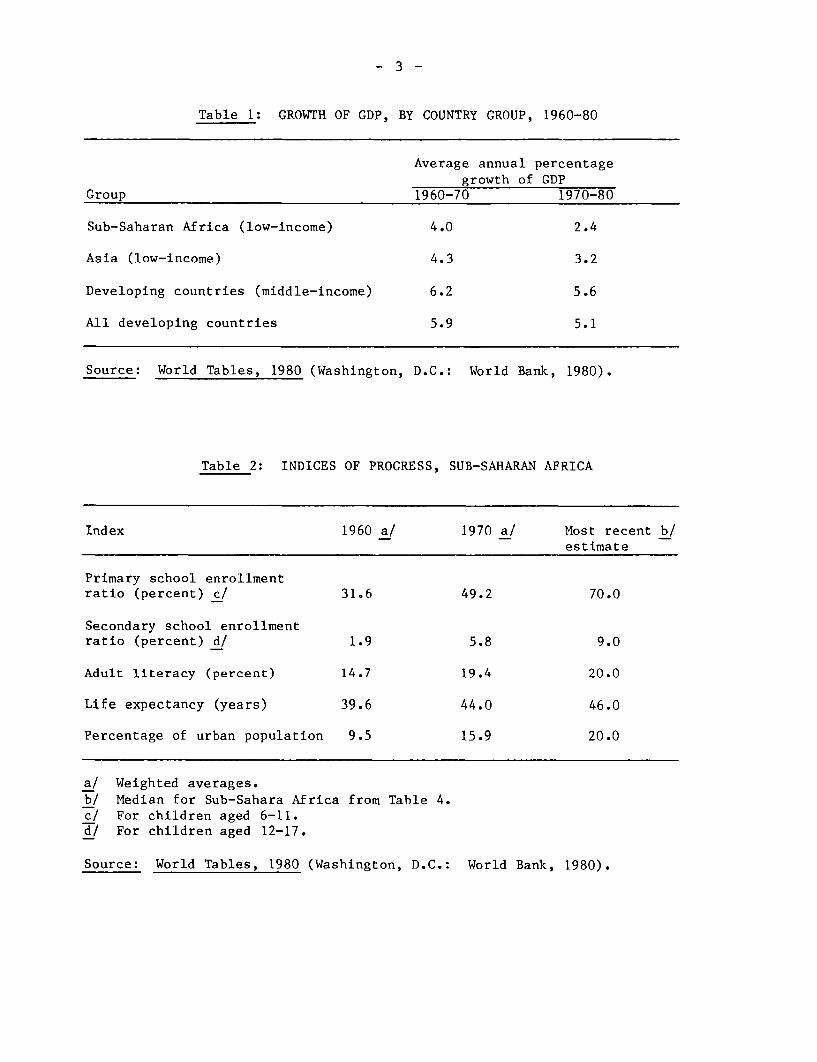
Major advances were made during the past two decades in the expansion
of schools, the access to safe water, and urbanization (Table 2)o Life
expectancy at birth rose on the average from 40 years in 1960 to 46 at the end
of the 1970so The one indicator that showed hardly any change during this
last twenty years was fertility: African birth rates remained at 47 per 1,000
(see annex table 1)o Economic and social progress has not altered the regime
-3 -
Table 1: GROWTH OF GDP, BY COUNTRY GROUP, 1960-80
Average annual percentagegrowth of GDP
Group 1960-70 1970-80
Sub-Saharan Africa (low-income) 4.0 2.4
Asia (low-income) 4.3 3.2
Developing countries (middle-income) 6.2 5.6
All developing countries 5.9 5.1
Source: World Tables, 1980 (Washington, D.C.: World Bank, 1980).
Table 2: INDICES OF PROGRESS, SUB-SAHARAN AFRICA
Index 1960 a/ 1970 a/ Most recent b/estimate
Primary school enrollmentratio (percent) c/ 31.6 49.2 70.0
Secondary school enrollmentratio (percent) d/ 1.9 5.8 9.0
Adult literacy (percent) 14.7 19.4 20.0
Life expectancy (years) 39.6 44.0 46.0
Percentage of urban population 9.5 15.9 20.0
a/ Weighted averages.bi Median for Sub-Sahara Africa from Table 4.ci For children aged 6-11.di For children aged 12-17.
Source: World Tables, 1980 (Washington, D.C.: World Bank, 1980).
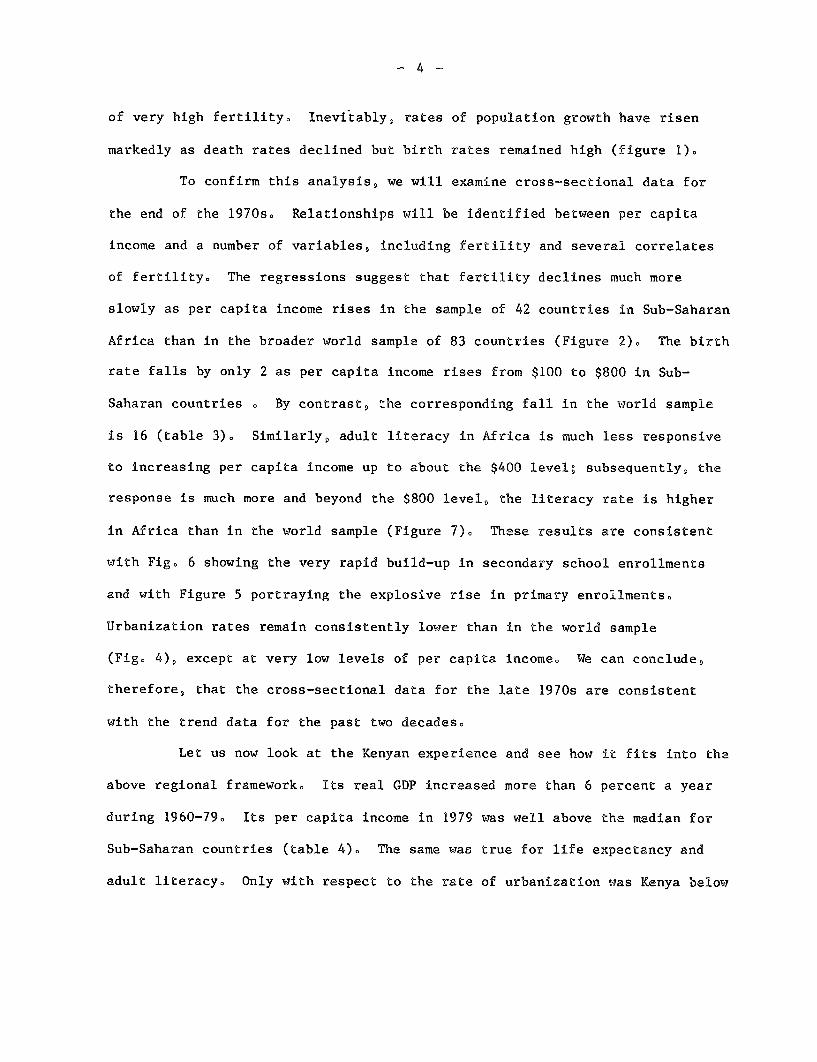
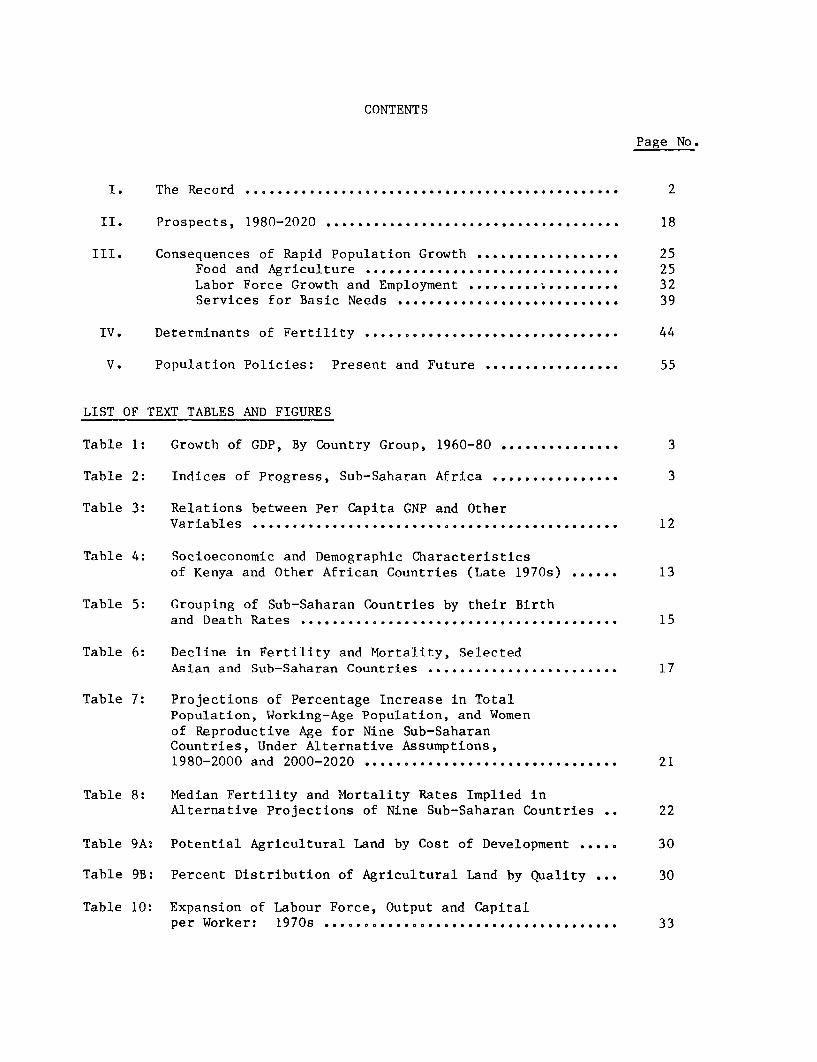
of very high fertility. Inevitably, rates of population growth have risen
markedly as death rates declined but birth rates remained high (figure 1)o
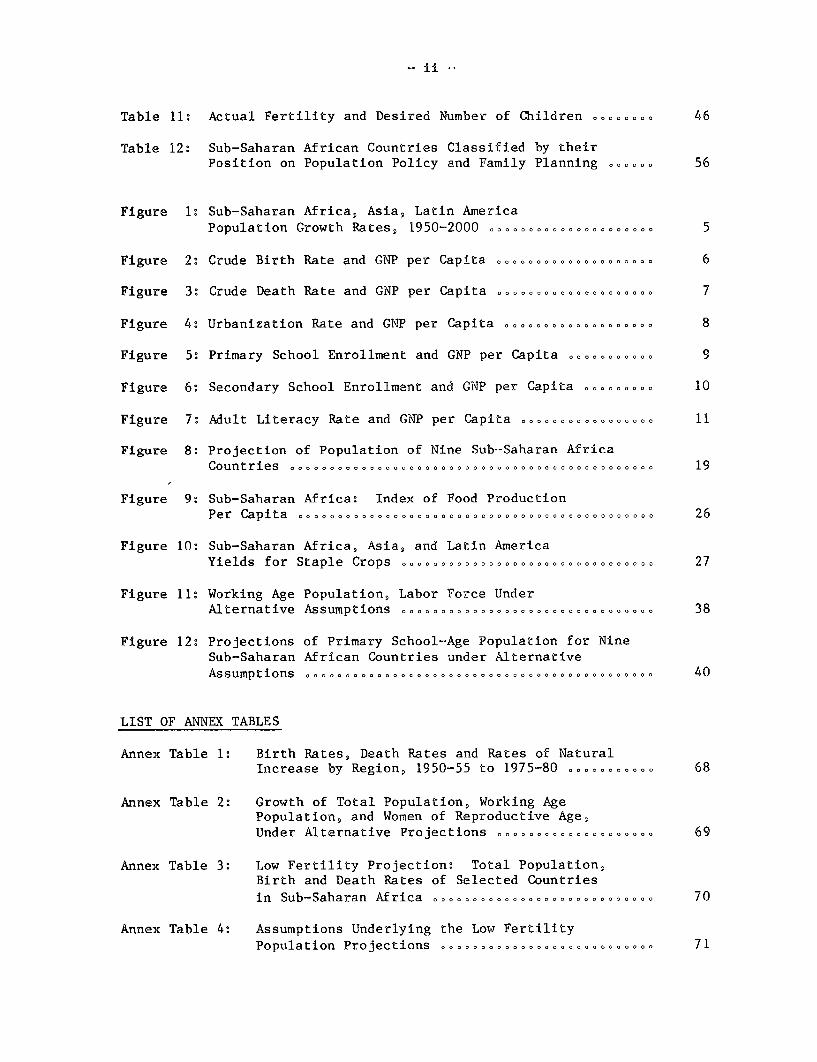
To confirm this analysis, we will examine cross-sectîonal data for
the end of the 1970so Relationships will be identified between per capita
income and a number of variables, including fertility and several correlates
of fertility. The regressions suggest that fertility declines much more
slowly as per capita income rises in the sample of 42 countries în Sub-Saharan
Africa than in the broader world sample of 83 countries (Figure 2)o The birth
rate falls by only 2 as per capita income rises from $100 to $800 in Sub-
Saharan countries . By contrast, the corresponding fall in the world sample
is 16 (table 3). Similarly, adult literacy in Africa is much less responsive
to increasing per capita income up to about the $400 level; subsequently, the
response is much more and beyond the $800 level, the literacy rate is higher
in Africa than in the world sample (Figure 7). These results are consistent
with Fig0 6 showing the very rapîd buîld-up in secondary school enrollments
and with Figure 5 portraying the explosîve rise in primary enroilments.
Urbanization rates remain consistently lower than in the world sample
(Fig0 4), except at very low levels of per capita income. We can conclude,
therefore, that the cross-sectional data for the late 1970s are consistent
with the trend data for the past two decades.
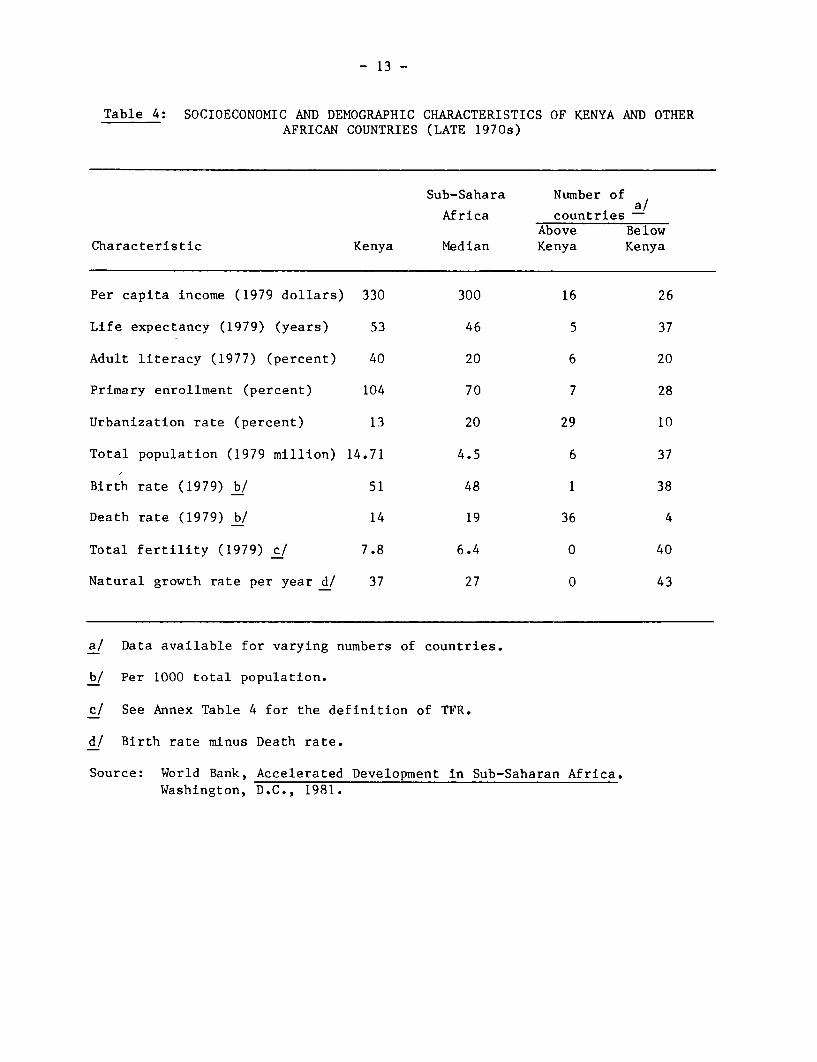
Let us now look at the Kenyan experience and see how it fits into the
above regional framework0 Its real GDP increased more than 6 percent a year
during 1960-79. Its per capita income in 1979 was well above the median for
Sub-Saharan countries (table 4). The same was true for life expectancy and
adult literacy. Only iith respect to the rate of urbanization was Kenya below
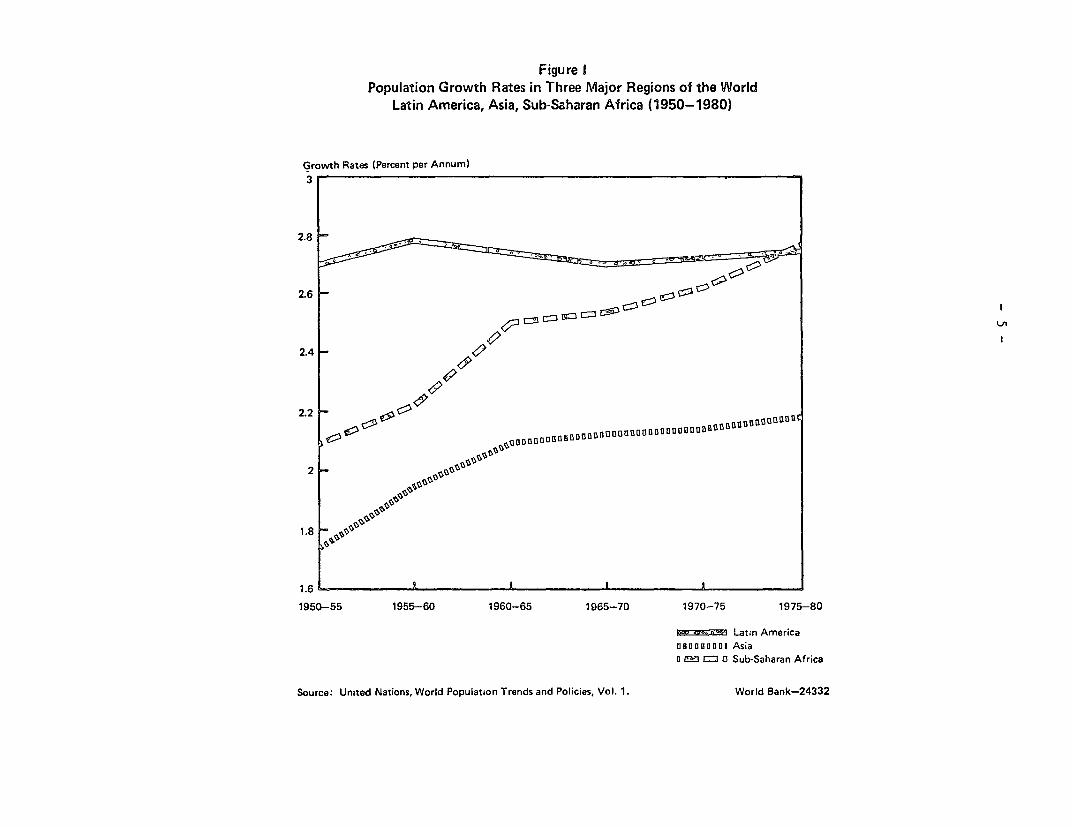
Figure IPopulation Growth Rates in Three Major Regions of the World
Latin America, Asia, Sub-Saharan Africa (1950-1980)
Growth Rates (Percent per Annum>3
2.8 -
2.6-
2.4-
2.2 -
2
1.6 _ . . t
1950-55 1955-60 1960-65 1965-70 1970-75 1975-80
Latin Americaceeancenu Asian i Sub-Saharan Africa
Source: United Nations, World Population Trends and Policies, Vol. 1. World Bank-24332
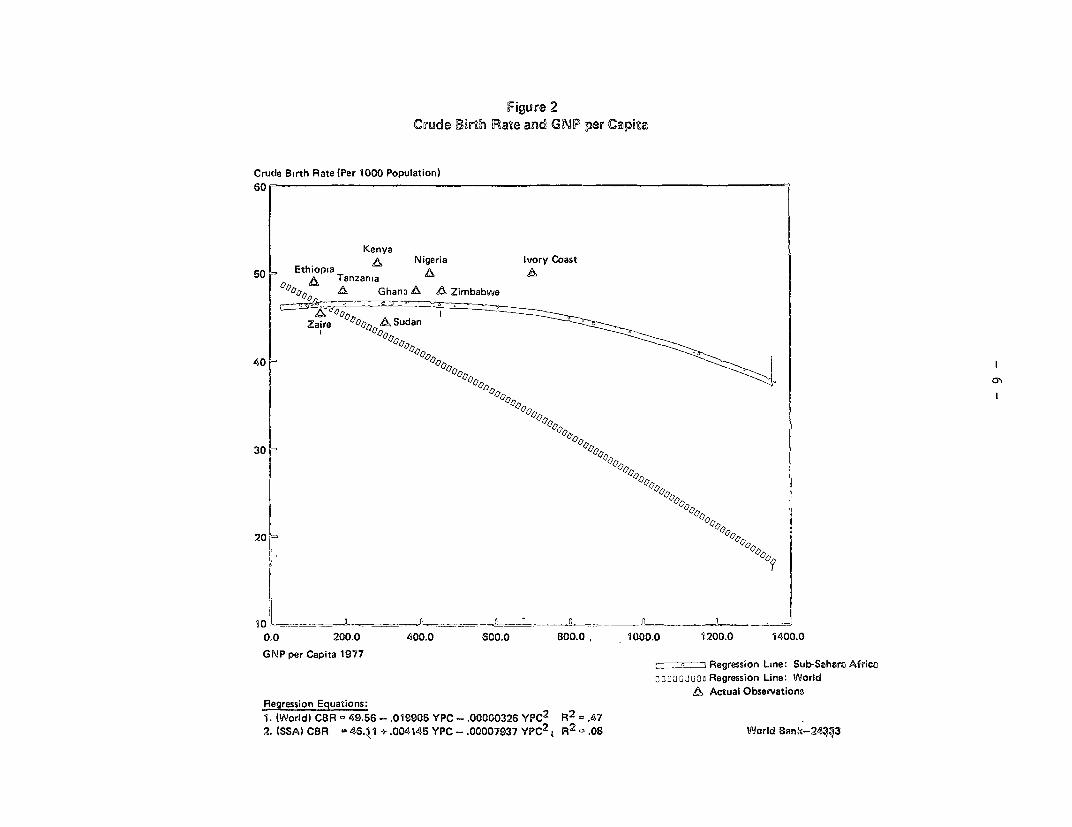
Figure 2Crude Birth Rate and GNPR per Capita
Crude Birth Rate (Per 1000 Population)60
Kenya50 Ethiopia à Nigeria Ivory Coast
50 E fhilTanzana A A0°oo% A Ghana A Zimbabvde
40 !
30 -0_=0__0
20 00
0.0 200.0 400.0 600.0 800.0 1000.0 1200.0 1400.0GNP per Capita 1977
G p C Regression LUne: Sub-Sahare Africoco a a aorn Regression Line: World
^ Actual ObservationsRegression Equations:1. (Worid) C8R - 49.56 - .019905 YPC -. 00000326 ypC2 R2 = .472. (SSA) CBR = 46.,11 O .C04145 YPC -. 00007937 YPC 2
( R2 - .08 Wcrld Bank-24Z?3
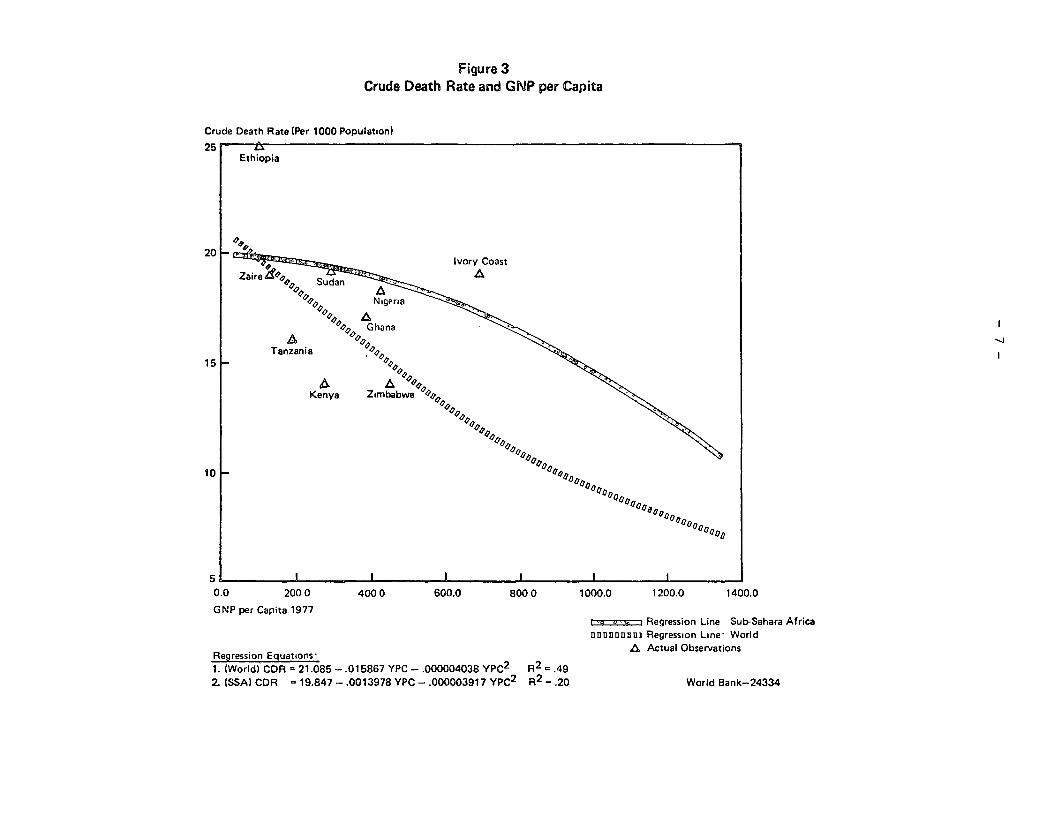
Figure 3Crude Death Rate and GNP per Capita
Crude Death Rate (Per 1000 Populatton>
25 Ethiopia
20- 20 ! + > ~~~~~~~~~Ivory Coast
>NGhana
Tanzania15 0
Kenya Zimbabwe
10
5 l I L t I
0.0 200 0 400 0 600.0 800 0 1000.0 1200.0 1400.0
GNP per Capita 1977Regression Line Sub-Sahara Africa
]DDDDIJui Regression Line Worldh, Actual Observations
Regression Equations1. (World) CDR = 21.085 -. 015867 YPC - .000004038 YPC2 R2 = .492. (SSA) CDR = 19.847-.0013978 YPC-.000003917 ypC2 R2
= .20 World Bank-24334
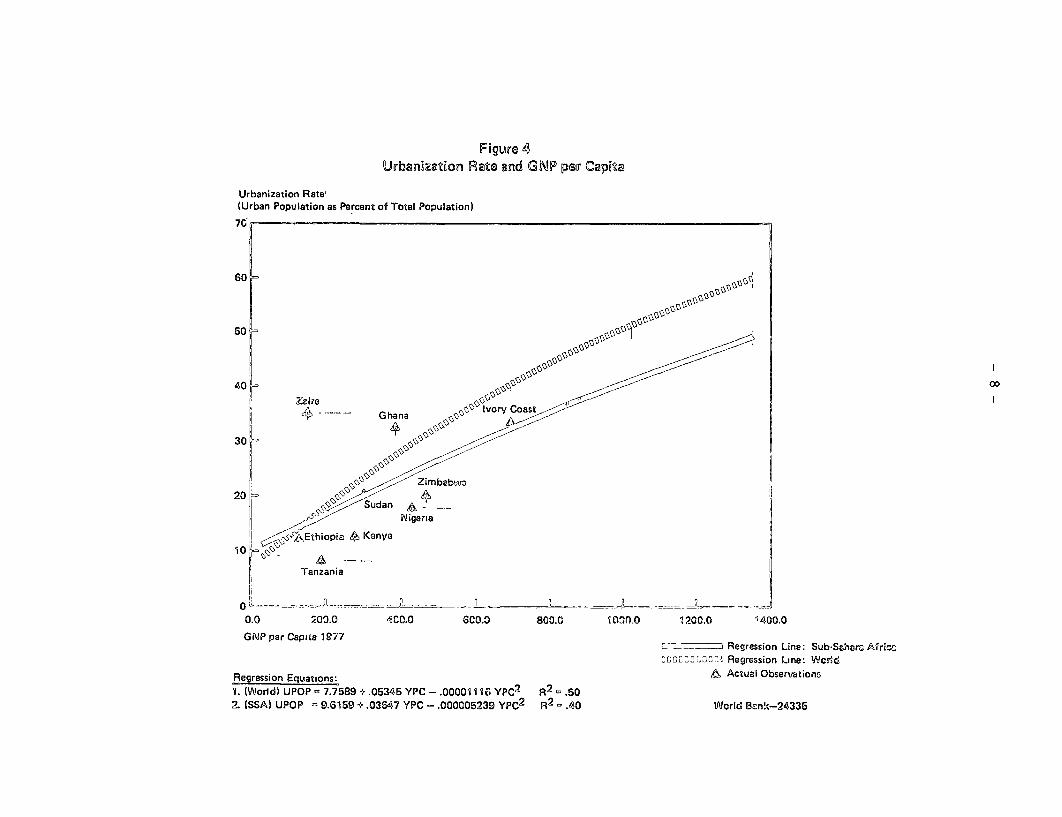
Figure 4Urbanization Rate and GNP par Capita
Urbanization Rate,(Urban Population as Percent of Total Population)
7C:
60 -
50
40 - 0
/</ NiSGhna
30
20
1Ethiopia e Kanya
Tanzania
o t 9- -- -- '-- _ _-_J___ _
0.0 200.0 400.0 600.0 800.0 IO te.o 1200.0 1400.0GNIP per Çapîta 1977
G a p 7 Regression Line: Sub-Sahea Afrrsc
cOOL30r.3 Regression Line: Wcidd
Regression Equations: , Actuel Observacions1. (World) UPOP 7.7589 - .05345 YPC -. 00001116 YPC2 R2
G .502. ISSA) UpFO p 9.6159 - .03647 YPC -. 000005239 ypC2 R2 = .40 Worid zank-24335
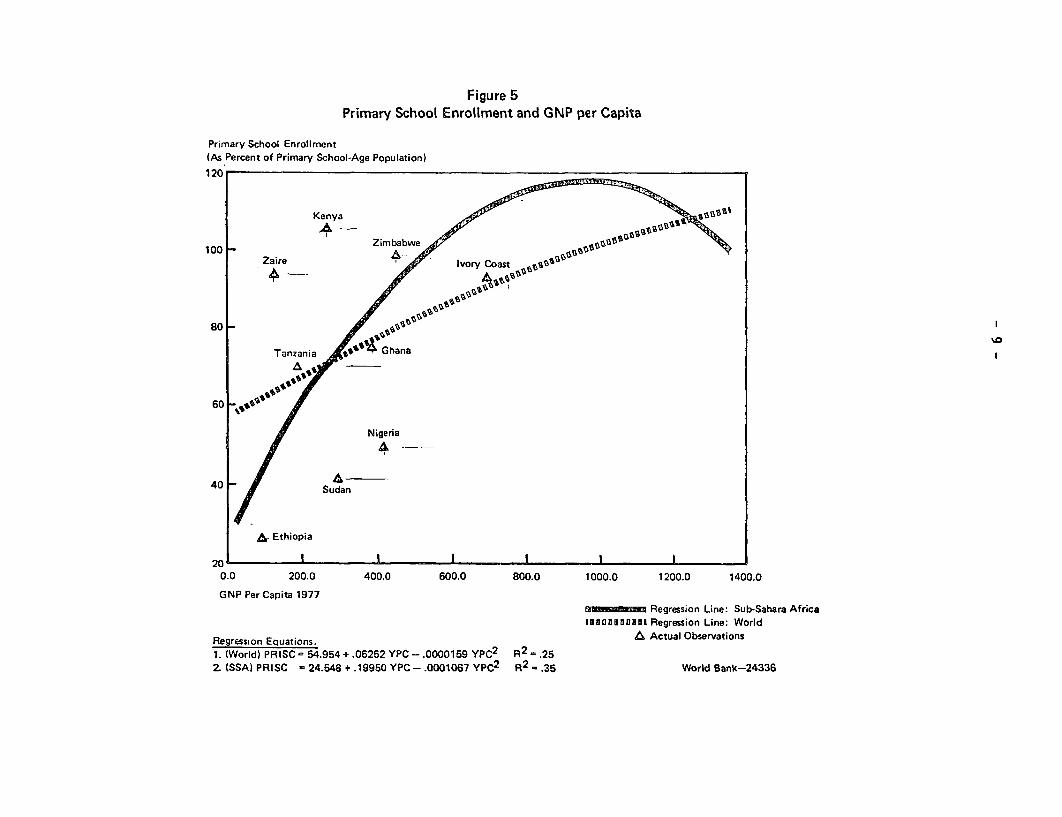
Figure 5Primary School Enroliment and GNP per Capita
Primary School Enroliment(As Percent of Primary School-Age Population)
120
Kenya
100 Zimbab e
800 - Zaire
80
Tanzania Ghana
Nigeria
40 / Sudan
,& Ethiopia
20 t0.0 200.0 400.0 600.0 800.0 1000.0 1200.0 1400.0
GNP Per Capita 1977_ansammumgc Regression Line: Sub-Sahara Africa
ImmaDeSlhIBE Regression Line: Worid
Regression Equations. à Actual Observations1. (Worid) PRISC = 54.954 + .06252 YPC -. 0000169 YPC2 R2
= .252. (SSA) PRISC -24.548 + .19950 YPC-.0001067 YPC2 R2 =.3S Worid Bank-24336

Figure 6Secondary Schooù Enroflment and GNP per Capita
Secondary School En roliment(As Percent of Secondary School Age Population)60
Ghana
40
20 KenVat< ~~~~~~~~Ivorv Coast
XS tX //E Sdan
AYN,Tanzania
20
-20X200 200.0 400.0 600.0 800.0 1000.0 1200.0 1400.0
GNP Per Capite 1977
X c: U - x Regression Line: Sub-Sahara Africaoo0nB0000l1 Regression Line: Worid
Regression Equations: A Actual Secondary School Observations1. (Worid) SECSC. = 6.847 + .0429 YPC - .0U0079 ypC2 R2 _.582. (SSA) SECSC. =-4.194 + .0717 YPC-.000022 YPC2 R2 = .47 World Bank-24337
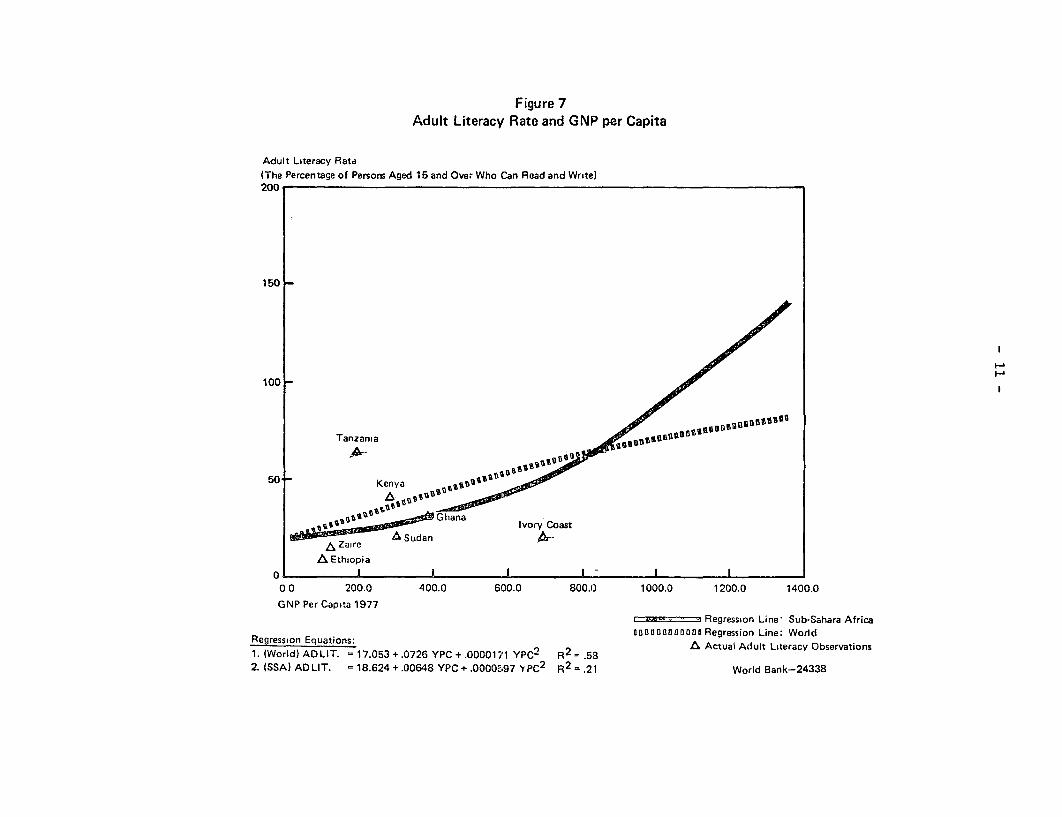
Figure 7Adult Literacy Rate and GNP per Capita
Adult Lmteracy Rate(The Percentage of Persons Aged 16 and Over Who Can Read and Write)200
150
100 _
Tanzania
50S .Wtt50 ~~~~KenyaA
Gha)G ha na Ivory Coast
,a ^ S~~~udan ~à Ethiopia
O II I I - t 0 0 200.0 400.0 600.0 800.( 1000.0 1200.0 1400.0
GNP Per Capita 1977r-m q Regression Line Sub-Sahara Africa
a 0i a a 0 n D Da 0 D eRegression Line: WorldRegressioon Equations: A Actual Adult Literacy Observations1. (Worid) ADLIT. = 17.053 +.0726 YPC +.00001-71 YPC2 R2
=.53
2. (SSA) AD LIT. - 18.624 +.00648 YPC + .0000597 y pC 2 R2 = .21 World Bank-24338
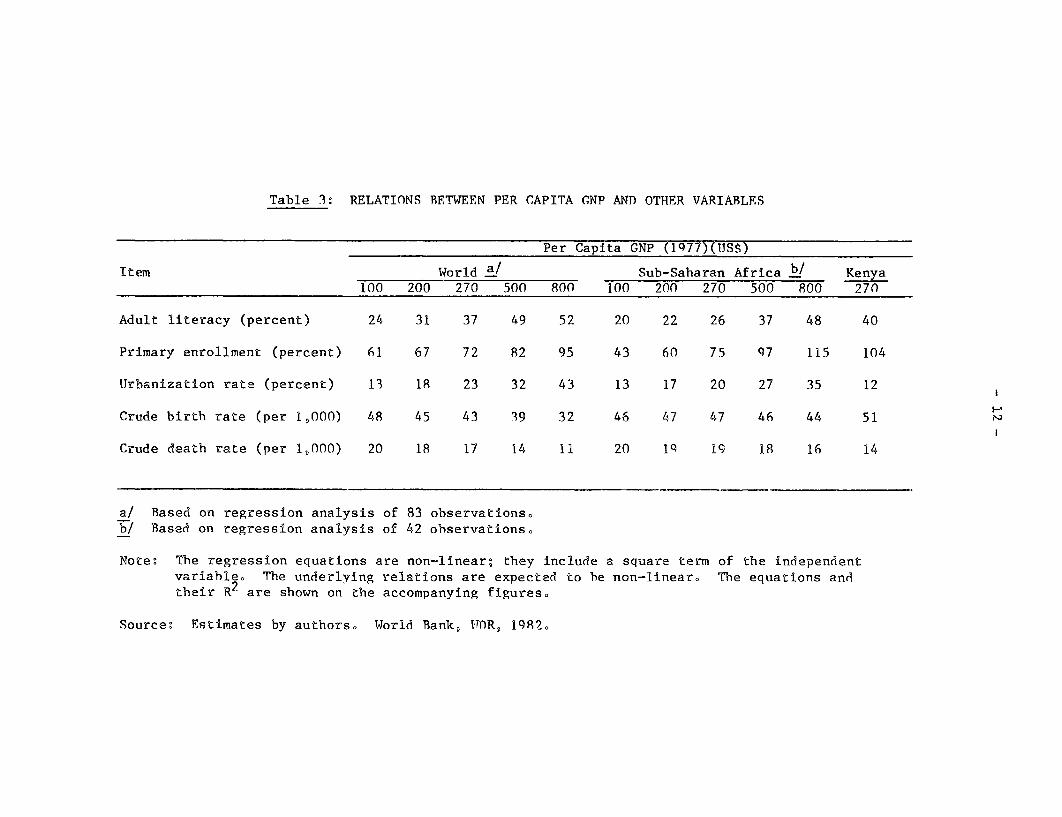
Table 3: RELATIONS RETWEEN PER CAPITA GNP AND OTHER VARIABLES
Per Capita GNP (1977)(TJSS)
Item World a/ Sub-Saharan Africa _/ Kenya100 200 270 500 800 100 200 270 500 800 270
Adult literacy (percent) 24 31 37 49 52 20 22 26 37 48 40
Primary enrollment (percent) 61 67 72 82 95 43 60 75 97 115 104
Urbanization rate (percent) 13 18 23 32 43 13 17 20 27 35 12
Crude birth rate (per 1,000) 48 45 43 39 32 46 47 47 46 44 51
Crude death rate (per 1,000) 20 18 17 14 il 20 1q 19 18 16 14
a/ Based on regression analysis of 83 observations.b/ Based on regressïon analysis of 42 observations.
Note: The regression equations are non-linear; they include a square term of the independentvariable. The underlying relations are expected to be non-linear. The equatîons andtheir R- are shown on the accompanying figures.
Source: Estîmates by authors. World Bank, IMR, 1982.
- 13 -
Table 4: SOCIOECONOMIC AND DEMOGRAPHIC CHARACTERISTICS OF KENYA AND OTHERAFRICAN COUNTRIES (LATE 1970s)
Sub-Sahara Number of
Africa countries -Above Below
Characteristie Kenya Median Kenya Kenya
Per capita income (1979 dollars) 330 300 16 26
Life expectancy (1979) (years) 53 46 5 37
Adult literacy (1977) (percent) 40 20 6 20
Primary enrollment (percent) 104 70 7 28
Urbanization rate (percent) 13 20 29 10
Total population (1979 million) 14.71 4.5 6 37
Birth rate (1979) b/ 51 48 1 38
Death rate (1979) b/ 14 19 36 4
Total fertility (1979) c/ 7.8 6.4 0 40
Natural growth rate per year d/ 37 27 0 43
a/ Data available for varying numbers of countries.
b/ Per 1000 total population.
c/ See Annex Table 4 for the definition of TFR.
d/ Birth rate minus Death rate.
Source: World Bank, Accelerated Development in Sub-Saharan Af rica.Washington, D.C., 1981.
14
the median. It was also clear that Kenyan health (measured by lf e
expectancy) and education standards were far hîgher than expected from either
the Sub-Saharan or world regressions. Notwithstanding these achievements in
living standards and social servicesD Kenya had a birth rate of 51 per 1,000,
compared with a Sub-Saharan median of 48. And because Cenya's death rate had
already fallen to a relatively low 14, its rate of growth of population in
1979 was estimated at 3.7 percent a year. There is evidence that this rate
has climbed to the extraordinary 4 percent level since then (Faruqee, 1980)o
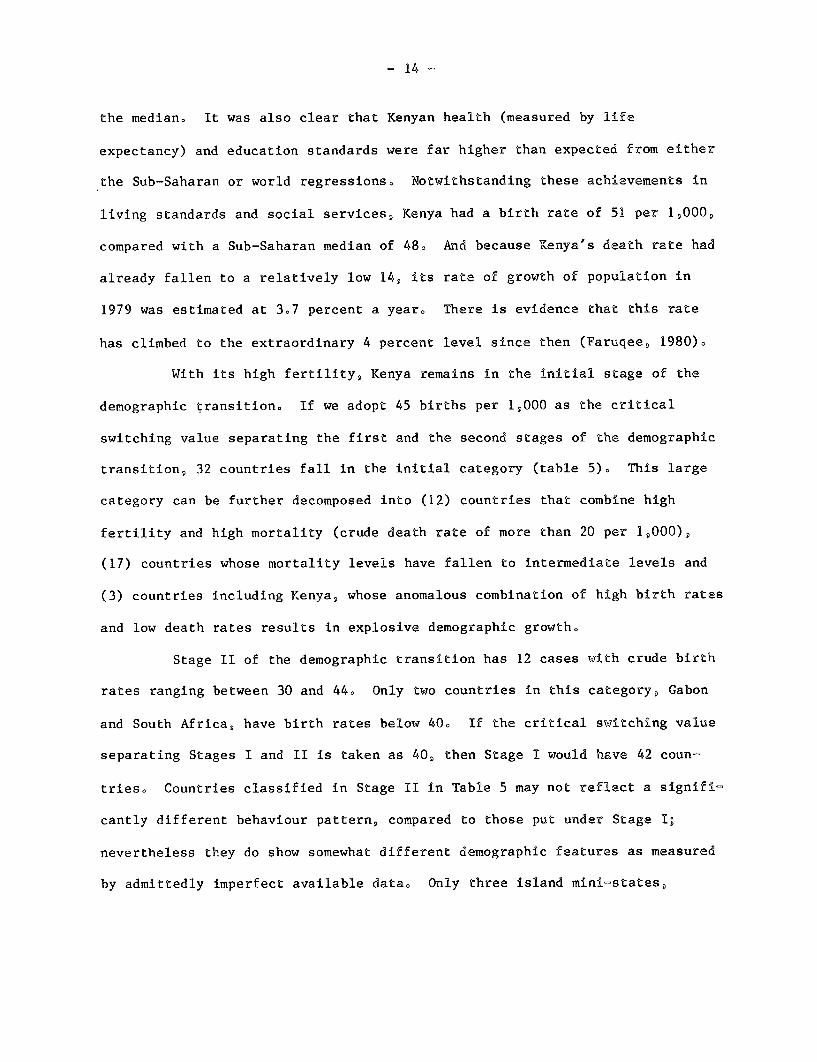
With its high fertility, Kenya remains in the initial stage of the
demographic transition. If we adopt 45 births per 1,000 as the critical
switching value separating the first and the second stages of the demographic
transition, 32 countries fall in the initial category (table 5). This large
category can be further decomposed into (12) countries that combine high
fertility and high mortality (crude death rate of more than 20 per 1,000)D
(17) countries whose mortality levels have fallen to intermediate levels and
(3) countries including Kenya, whose anomalous combination of high birth rates
and low death rates results in explosive demographic growth.
Stage II of the demographic transition has 12 cases with crude birth
rates ranging between 30 and 44. Only two countries in this category , Gabon
and South Africa, have birth rates below 40. If the crîtical swîtching value
separating Stages I and II is taken as 40, then Stage I would have 42 coun°
tries. Countries classified in Stage II in Table 5 may not reflect a signifiî
cantly different behaviour pattern, compared to those put under Stage I;
nevertheless they do show somewhat different demographic features as measured
by admittedly imperfect available data. Only three island mîniîstates,
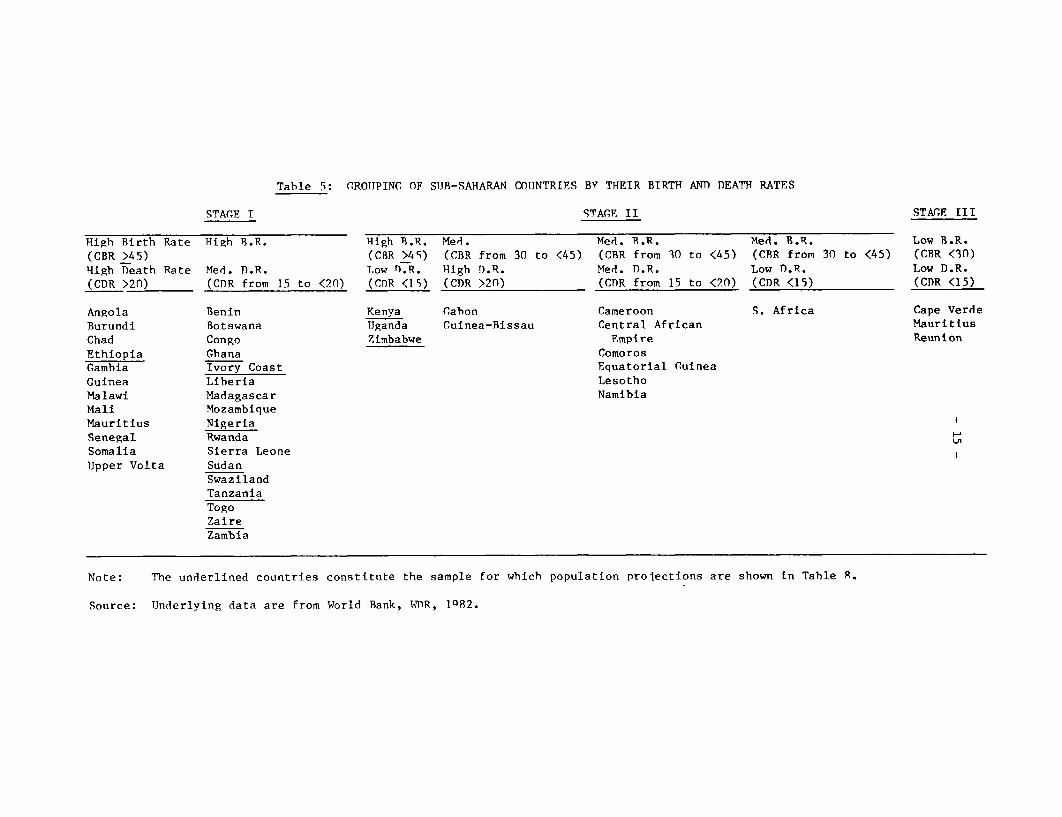
Table 5: GROT1PING OF SUB-SAHARAN COIJNTRIES BV THEIR BIRTR ANT) DEAT- RATES
STACE I STAGFE II STAGE III
High Birth Rate High B.R. Righ B1.R. Med. Med. RB.R. Med. R.R. Low B.R.(CBR >45) (CBR >45) (CBR from 30 to <45) (CBR from 30 to <45) (CBR from 30 to <45) (CBR <30)High Death Rate Med. D.R. Low D.R. High D.R. Med. D.R. Low D.R. Low D.R.
(CDR >20) (CDR from 15 to <20) (CDR <15) (CDR >20) (CDR from 15 to <20) (CDR <15) (CDR <15)
Angola Benin Kenya Cahon Cameroon S. Africa Cape VerdeBurundi Botswana Uganda Guinea-Bissau Central African MauritiusChad Congo Zimbabwe Empire ReunionEthiopia Ghana ComorosGambia Ivory Coast Equatorial GuineaGuinea Liberia LesothoMalawi Madagascar NamibiaMali MozambiqueMauritius NigeriaSenegal RwandaSomalia Sierra LeoneUpper Volta Sudan
SwazilandTanzaniaTogoZaireZambia
Note: The underlined countries constitute the sample for which population projections are shown in Table R.
Source: Underlying data are from World Bank, WDR, 1q82.
16 -
with populations of less than a million in 1979, have entered stage III of the
demographic transition with birth rates below 30O
It is reasonable to conclude then, that most of Sub-Saharan Africa
remains rooted in the initial stage of the demographic transition. Factors
that lower fertility have not yet taken hold, despite substantial declines in
mortality as in Kenya. In this sense, Kenya embodies the characteristic
ingredients of the African demographic dilemma. The question for the future
is whether countries on the left-hand side in table 5 will replicate the
demographic hîstory of Kenya and thereby experience very high rates of
population growth. And how long will these very high rates of growth persist
before fertility starts declining?
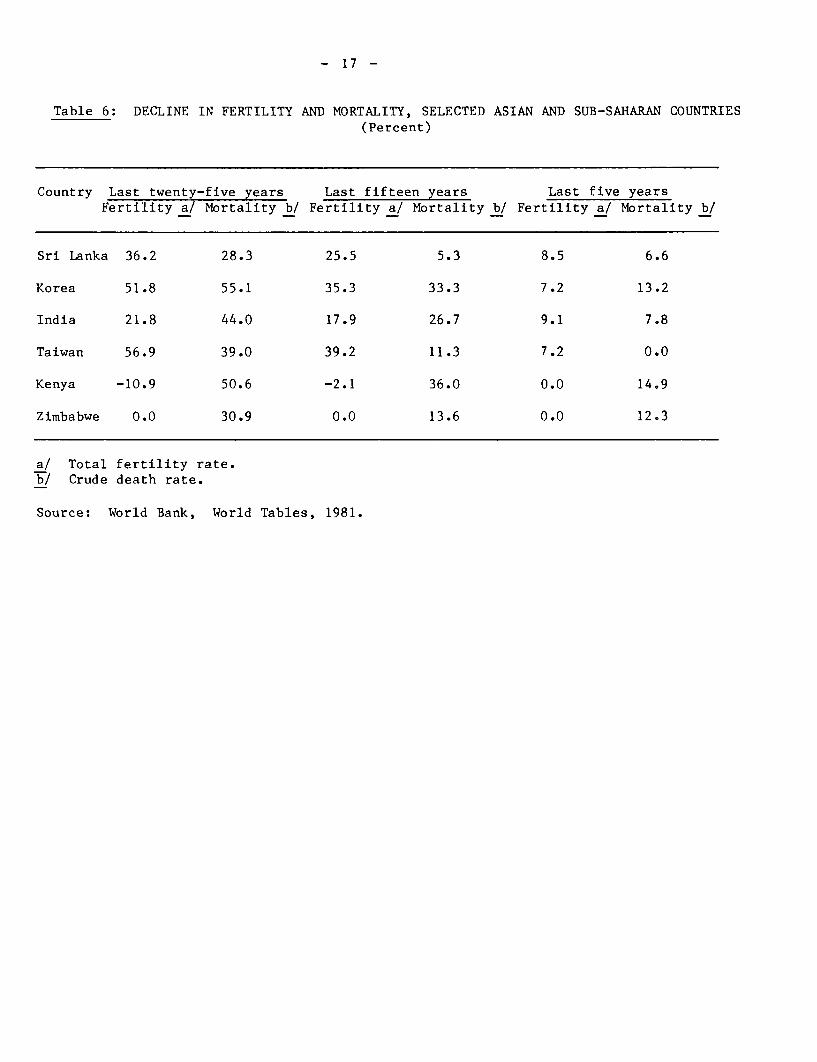
The changes of fertility and mortality in Asia and Sub-Saharan Afrîca
are shown in table 60 In such countries as Korea, Taîwan, and Sri Lanka, the
decline of fertility has more or less kept pace wîth that of mortality during
the last quarter century0 In India, mortality has fallen much more than
fertility, which nonetheless appears to be catching up in recent years. In
sharp contrast is the situation in Kenya and Zimbabwe, where fertîlity levels
remain high in the face of falling mortalityo
- 17 -
Table 6: DECLINE IN FERTILITY AND MORTALITY, SELECTED ASIAN AND SUB-SAHARAN COUNTRIES(Percent)
Country Last twenty-five years Last fifteen years Last five yearsFertility a/ Mortality b/ Fertility a/ Mortality b/ Fertility a/ Mortality b/
Sri Lanka 36.2 28.3 25.5 5.3 8.5 6.6
Korea 51.8 55.1 35.3 33.3 7.2 13.2
India 21.8 44.0 17.9 26.7 9.1 7.8
Taiwan 56.9 39.0 39.2 11.3 7.2 0.0
Kenya -10.9 50.6 -2.1 36.0 0.0 14.9
Zimbabwe 0.0 30.9 0.0 13.6 0.0 12.3
a/ Total fertility rate.b/ Crude death rate.
Source: World Bank, World Tables, 1981.
- 18 -
II. Prospects, 1980-2020
According to the World Development Report (1982)9 low-income oil-importing
countries of Africa succeeded in raising GDP at a rate of 4.0% per year during
the 1960so This expansion slowed down very considerably in the 1973-80
period; GDP rose at an annual rate of only 1.3% and per capita income declined
apprecîably. Middle-income oil-importing countries in Afrîca also witnessed
some setback in GDP expansion, although the extent of the retardation was much
less than for low-income countries. The future prospect for Africa, according
to this report, remains very poor; the Low Case projections, which is described
as the more likely one, visualizes a growth rate in GDP of 1.9% p.a. during
the 1980s for low-income and 2.8% p.a. for middle-income countries. The real-
istic scenario is a grim one with stagnant or declining per capita incomes in
many countries.
The grim prospects for per capita income growth in Sub-Saharan Africa
have many implications. First, it may not be possible to sustain the rapid
educational expansion experienced in the post-independence period. Education
typically accounts for 15-25 percent of the government's budgets and 3-6
percent of GNPO With slower expansion of GDP and budget revenues in recent
years, governments have been compelled to restrain outlays on education
(Gulhati and Datta forthcoming). Underfunding of schools has detracted from
the quality of education. Second, the health sector may suffer even more,
because health outlays have a comparatively larger component of foreign
exchange (drugs, equipment, energy-intensive transport), which has been very
scarce and is likely to remain scarce in many African economies. Thirdly,
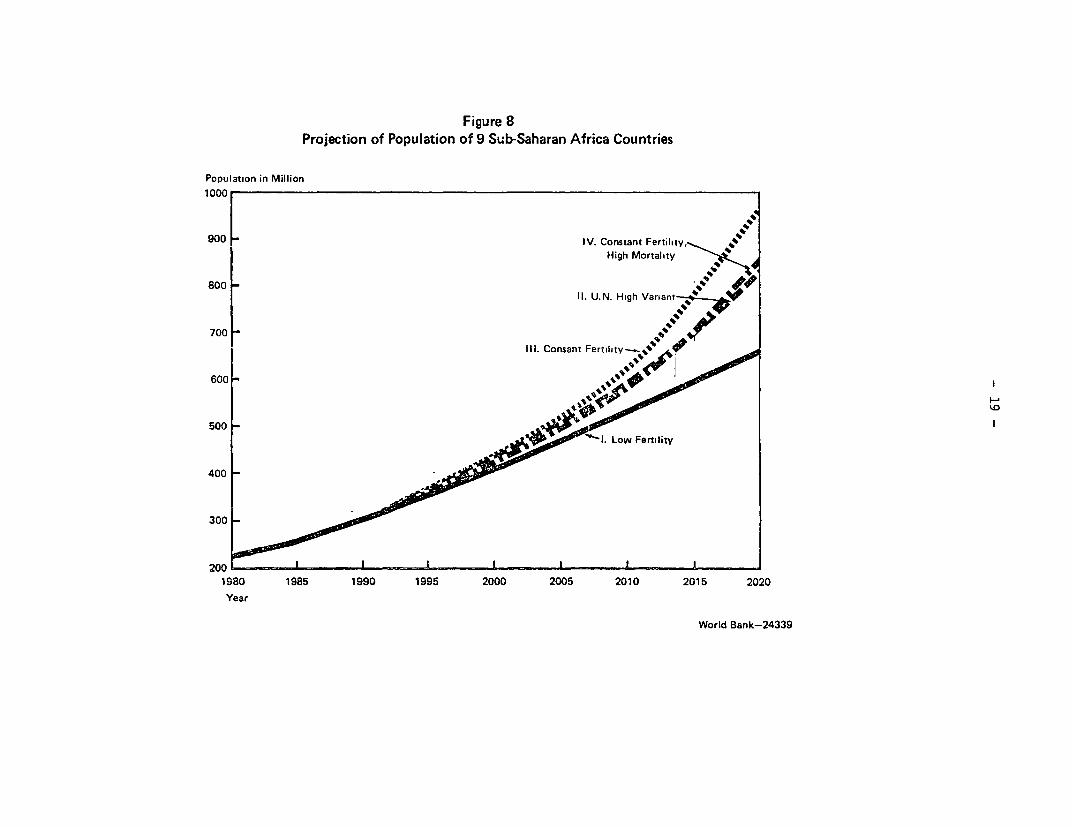
Figure 8Projection of Population of 9 Sub-Saharan Africa Countries
Population in Million1000
900 IV. Constant Fertility, 44
High Mortality
800 Il. U.N. H:gh Variant
700 -l .n r g700~ Ili. Consant Fertîlity,etI
600
500 -
400
300
1980 1985 1990 1995 2000 2005 2010 2015 2020Year
World Bank-24339
20 -
slow income growth of the Sub-Saharan economies will also slow down the rurali
urban migration0 The modern urban wage sector will grow slowly, îf at all0
Most additions to the labor force wîll have to be absorbed by agriculture0
With this macro°economic p!cture as background, we made four differ-
ent population projections for nine Sub-Saharan countries. These countries
account for 225 million, iîe. 62% of the total population of Sub-Sahara Africa
(see tables 7 and 8, and annex tables 2-12)o All of these countries are ïn
Stage I of the demographic transition; Ethiopia represents a situation in
which both fertility and mortality are at very high levels; Nigeria, Sudan,
Zaire, Tanzania, Ghana and Ivory Coast represent a situation in which
mortality has fallen sharply; Kenya and Zimbabwe typify countries with even
lower levels of mortality.
The first projection makes assumptlons regarding fertîllty which are
very optimistic (Table 8)o They imply that the average crude bîrth rate for
the selected countries will decrease by nearly 45% over 35 years. This speed
of change is much more than can be expected reasonably. Our second projection
is the high variant of the UN population projections for these countries.
This high variant has less optîmistic assumption about fertility decline; thîs
projection implies that the crude birth rate will decline by about 25%o
Although some decline in fertiîity (based on the experience elsewhere) is not
unreasonable to assume, several Sub-Saharan countries have shown no sîgn of
decline, despite substantîal socioeconomîc progress. An assumption of no
change in fertility rates throughout the total projection perîod 1s not
implausible. Our third projection assumes that total fertïlity rates ln these
countries wîll remain constant at the level estîmated for the perlod 1980-850
- 21 -
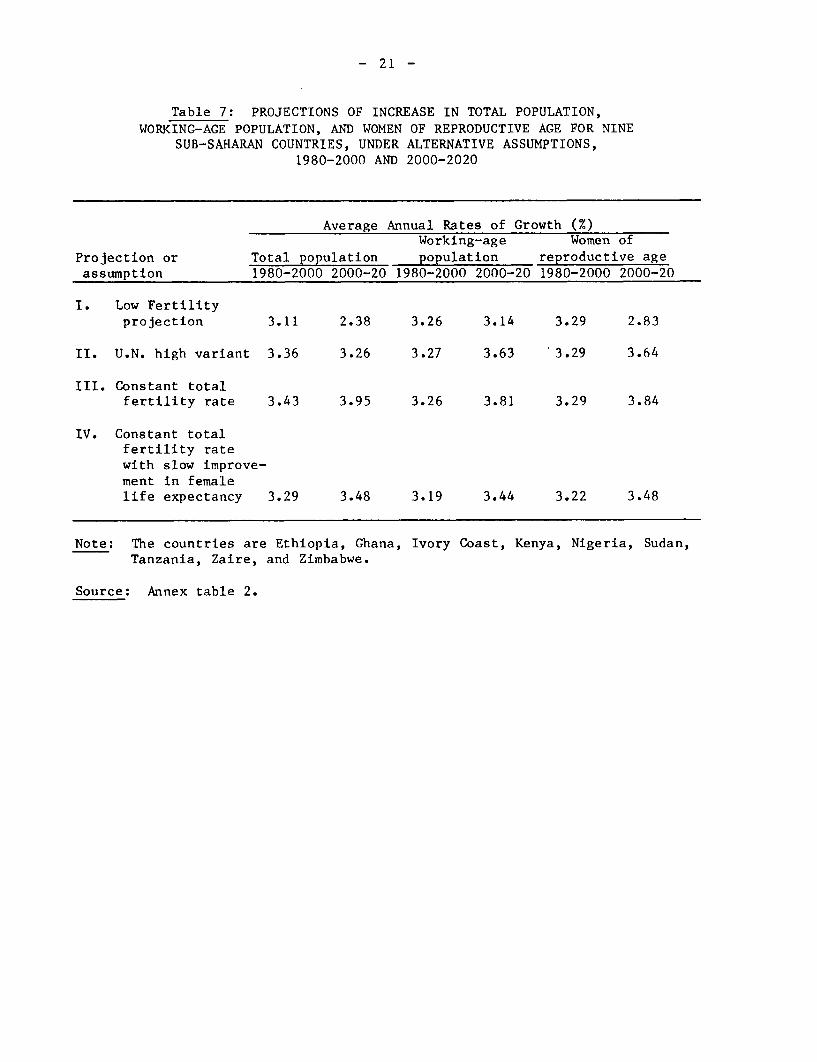
Table 7: PROJECTIONS OF INCREASE IN TOTAL POPULATION,WORKING-AGE POPULATION, AND WOMEN OF REPRODUCTIVE AGE FOR NINE
SUB-SAHARAN COUNTRIES, UNDER ALTERNATIVE ASSUMPTIONS,1980-2000 AND 2000-2020
Average Annual Rates of Growth (x)Working-age Women of
Projection or Total population population reproductive ageassumption 1980-2000 2000-20 1980-2000 2000-20 1980-2000 2000-20
I. Low Fertilityprojection 3.11 2.38 3.26 3.14 3.29 2.83
II. U.N. high variant 3.36 3.26 3.27 3.63 3.29 3.64
III. Constant totalfertility rate 3.43 3.95 3.26 3.81 3.29 3.84
IV. Constant totalfertility ratewith slow improve-ment in femalelife expectancy 3.29 3.48 3.19 3.44 3.22 3.48
Note: The countries are Ethiopia, Ghana, Ivory Coast, Kenya, Nigeria, Sudan,Tanzania, Zaire, and Zimbabwe.
Source: Annex table 2.
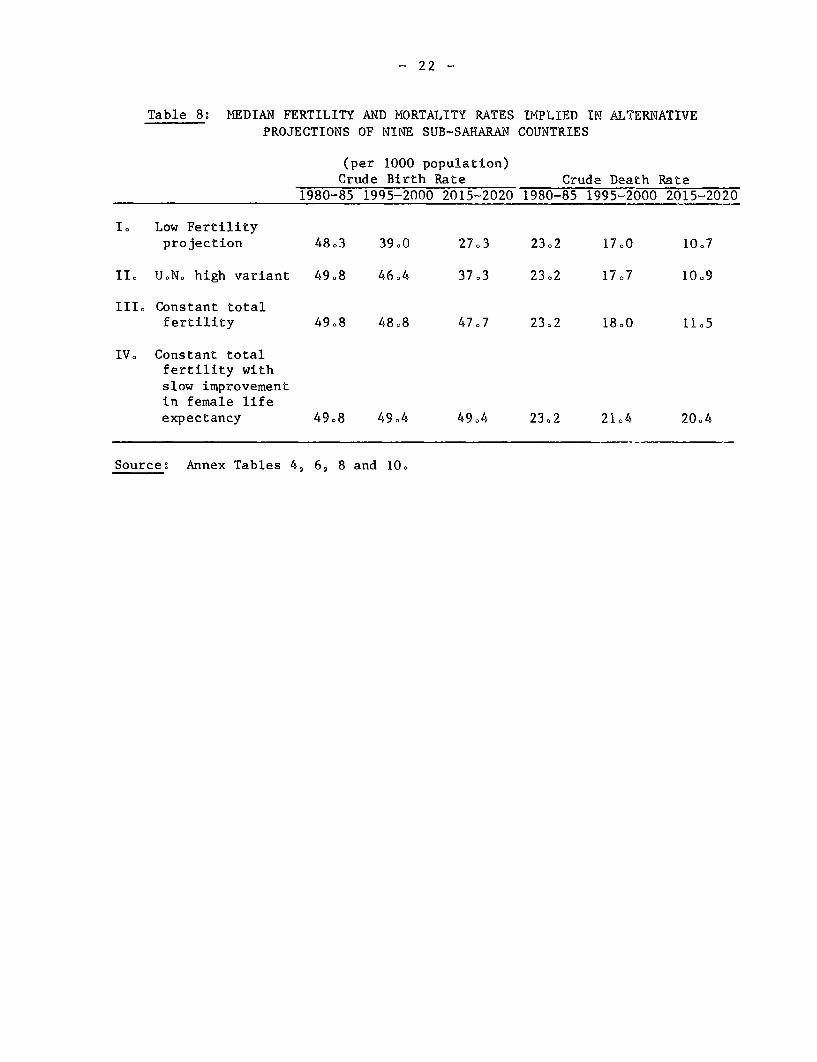
- 22 -
Table 8: MEDIAN FERTILITY AND MORTALITY RATES IMPLIED IN ALTERNATIVEPROJECTIONS OF NINE SUB-SAHARAN COUNTRIES
(per 1000 population)Crude Birth Rate Crude Death Rate
1980-85 1995-2000 2015-2020 1980-85 1995=2000 2015=2020
I. Low Fertilityprojection 48.3 39.0 27.3 23.2 17.0 1007
II. U.N. high variant 49o8 46.4 37.3 23o2 17.7 109
III. Constant totalfertility 49.8 48.8 47o7 23.2 1800 1105
IV. Constant totalfertility withslow improvementin female lifeexpectancy 49.8 49.4 49.4 23.2 21.4 20.4
Source: Annex Tables 4, 6, 8 and 100
- 2 3 -
These three projections assume a similar trend in mortality - average
crude death rate, starting at around 23 in 1980-85 declining to around 11 in
2015-2020 (see table 8). This assumption is based on the observed trend of
mortality in these countries and consistent with the experience of other
developing countries. These projections illustrate the effect of alternative
fertility rates, without varying mortality assumptions. But fertility and
mortality are interrelated. If fertility remains constant at the current
level, mortality conditions may not improve in the same way as in the past.
Stagnation in income projected for Africa may slow down the pace of progress
in health and life expectancy. We, therefore, made the fourth projection in
which fertility remains constant and mortality improves only slightly. Figure
8 charts the total population of these 9 countries. The value of this exer-
cise is that it illustrates the implications of the underlying assumptions.
The four projections do not differ materially till 1995. In the year 2000,
the combined population would be 442 million based on constant fertility or as
low as 416 million, according to the low fertility projection. The differ-
ences mount as we move towards the terminal year 2020. The annual growth rate
of population would decline from 3.1% during 1980-2000 to 2.4% in 2000-2020 on
the basis of the low fertility projection but it would rise from 3.4% to more
than 3.9% if fertility remained constant. Highest growth rates under the
latter projection would be encountered during 2000-2020 in Kenya (4.9% p.a.),
Zimbabwe (4.1% p.a.) and Nigeria (4.1% p.a.) (see Annex Table 2).
The projection results bring out the dramatic impact of the lagged
effects of past high fertility. Because of this history, the number of women
in the reproductive age group will expand by an average of 91% during 1980-
2000, irrespective of the assumption we make regarding the course of future

24 -
fertility. This growth momentum is now built into the demographîc structure
and its consequences will blunt the impact of any future decline în
fertility. Even in the subsequent two decades 2000-2020, the number of women
in the reproductive age group will rise by 75% under the low fertîlity projec-
tion, compared to an increase in the total population of 60O%
- 25 -
III. Consequences of Rapid Population Growth
The decade of the 1970s witnessed a major deceleration in the rate of growth
of African production and a significant acceleration in the pace of its popu-
lation increase. Are these two trends causally related? This question is not
easy to answer despite the existence of a vast literature on the connection
between population and economic development. Many factors, tncluding policy,
influence the speed and pattern of economic growth. Population is only one of
these factors and it is very difficult to isolate its impact from that of all
other influences at work. It would be difficult to maintain, nevertheless,
that the acceleration of population growth in the 1970s has been a positive
influence on African economic change. On the contrary, we conclude that
rapidly expanding population has greatly complicated the inherently difficult
task of securing rapid economic progress in Africa.
The Food Issue
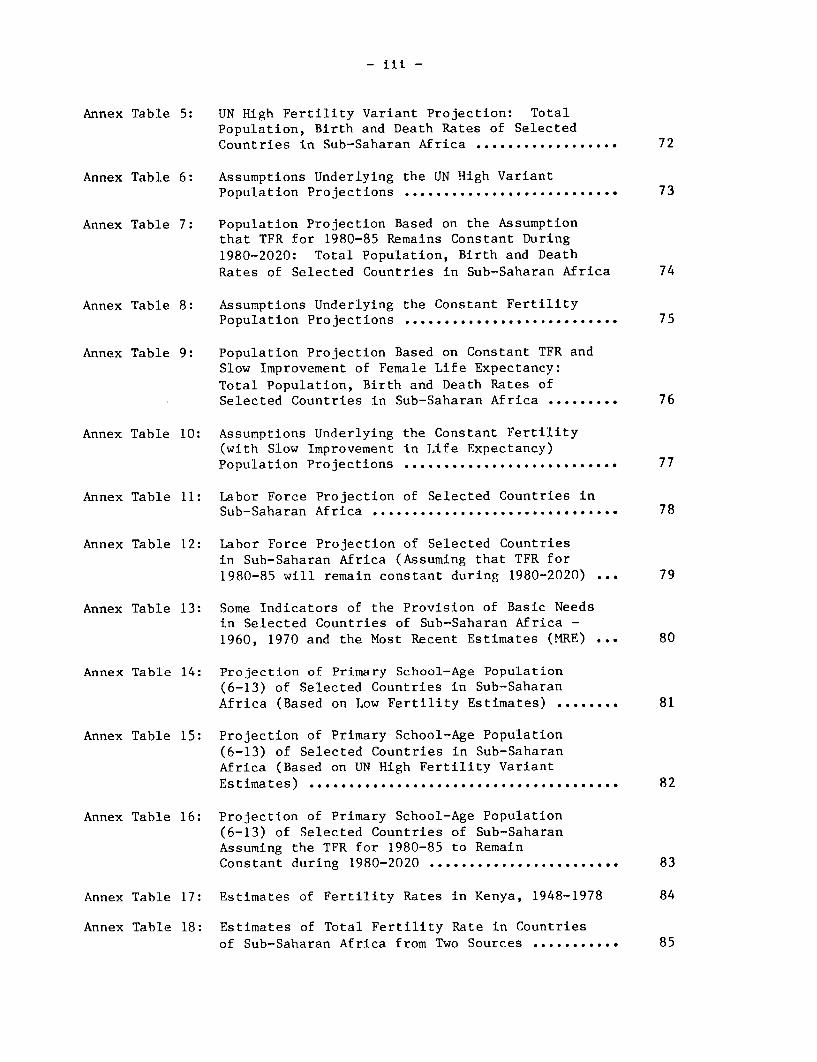
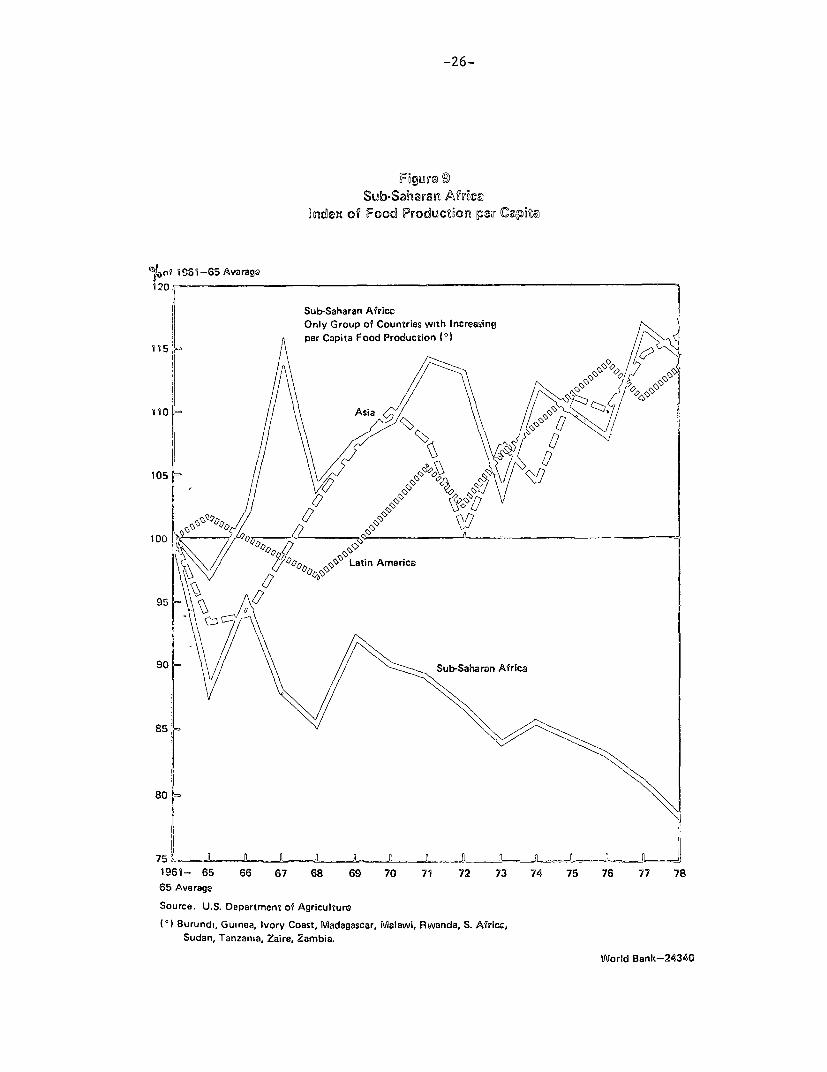
Sub-Saharan Africa is the only region in the world where per capita
food production declined over the past twenty years (Figure 9). Only a
handful of countries--Burundi, Ivory Coast, Rwanda, Sudan, Tanzania, Zambia--
held or improved upon the per capita production achieved in the early 1960s.
All other countries showed a moderate or severe decline. In Angola, Ethiopia,
Ghana, Niger, Uganda, and Upper Volta, per capita production in 1978 was less
than 80 percent of their earlier record. Total food production during 1970-77
grew at an average annual rate of only 1.1 percent in Western Africa, 1.0
percent in Central Africa, and 1.9 percent in Eastern and Southern Africa; the
corresponding figures for the growth of population were 2.6, 2.3 and 2.8
percent (FAO, 1978). The volume of cereal imports increased by 9.5 percent
per year in Sub-Saharan Africa during the 1970s (World Bank, 1981).
-26-
F~OGur e
Sub-Saharan AMcaBndex of Food Producoion pau C&pom
eXof 1 gS1-65 Av0raga
120
Sub-Saharan AfriccOnly Group of Countries wvth Increasingper Capita Food Production (e'>
110 As a
105
100
Latin America
95 -i
90 S_Saharan Africa
85
80 L
75 R I1961- 65 66 67 68 69 70 71 72 73 74 75 76 77 7865 Average
Source. U.S. Department of Agriculture
<B> Burundi, Gumnea, Ivory Coast, Madagascar, Malawi, Rwanda, S. Afric.,Sudan, Tanzansa, Zaire, Zambia.
World Bank-24340
- 27 -
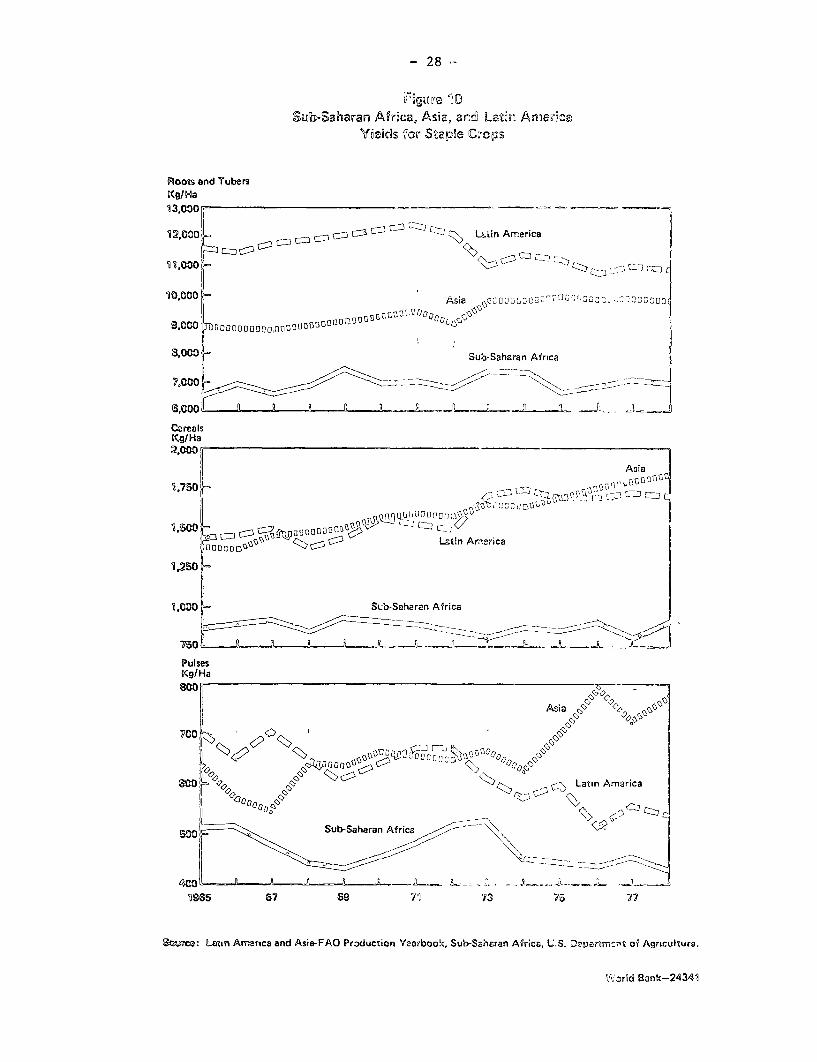
It would be wrong to attribute the growing food deficit of Africa to
population pressures per se. Only 5 percent of the total land area of the
continent is now cultivated. 1/ Buringh et. al. (1977) estimates that 24
percent of the total land area is potentially cultivable. 1/ The land
frontier in this sense is much further away in Africa than in Asia (where 16
percent of total area is now cultivated as against a potential cultivable area
of 20 percent). Furthermore, average yields of staple crops are very low in
Sub-Sahara Africa compared to those in Asia and Latin America (Figure 10).
This is the case in roots and tubers, cereals and pulses. While Asian yields
have shown an appreciable upward trend during the 1965-1980 period, particu-
larly in the case of cereals and pulses, the African picture is one of
stagnation.
Lack of progress in tapping the African agricultural potential is the
result of factors such as
(i) unavailability of technical packages suitable for local
agronomic conditions;
(ii) acute shortage of professional and administrative skills
required for operating delivery systems for agricultural
extension, credit and marketing;
(iii) weakness of tax, exchange rate, price and marketing policies
bearing on producer incentives and consumption patterns and
1/ These figures apply to the entire continent, including North Africa. Alarge part of North Africa is the Sahara desert (more than one-quarter ofthe entire African area) which is not potentially cultivable. Correspond-ing approximate figures for Sub-Sahara Africa would be 6 percent forpresently cultivated area and 33 percent for potentially cultivated area.
- 28
Sub-Saharan Afr^ca, Asia, anrd Laîr A:meF~rVYDefds 1OG' StapSe C¢'ops
Roots end TubersK<gIHa
il3,0C00_._.
12,sBstD =] 0 00 a 5=3 =1 Cz 9> Lutin Amerca
10,000 Asiage002,2-s l:4uv 00D
9.000 ~~~~~~~~~~~0
Sub-Saharan Africa
7,5'000 n / n: n_ = ~ < ___
CerealsKg/Ha2,000
',750 t
Stb-Saharan Africa
?50 n n n _ ____
PulsesKg/Ha
8tl0 Q~~~~~~~~~~~~~sia <ttt-t
Latin America
Sub-Saharan Af rc
1965 67 69 71 73 75 77
Stu7mc: L.etin Aernica and Asie-FAO Production Yearbook, Sub-Saharan Africa, U.S. DtpaeTm-' of Agriculturo.
Uarlci Bank-24341
- 29 -
(iv) persistence of land-use and tenure conditions which devel-
oped in the colonial period and which now require
substantial changes.
We must conclude, therefore, that the population problem in Sub-Sahara Africa
is manifest not in the form of land unavailability and visible overcrowding
but in much more subtle ways. Accommodation of rapid population growth
requires massive improvements in the food and larger agricultural sector
involving not only substantial public investment outlays in developing land
and improving its productivity but also in building transport networks and
other infrastructure. In fact, African agricultural development strategy must
find solutions to a whole variety of policy, technological, institutional and
organizational issues. While these solutions can yield a large pay-off over
the long-run, they may prove to be quite expensive in the immediate future in
terms of demands on decision-making and socio-political dislocation.
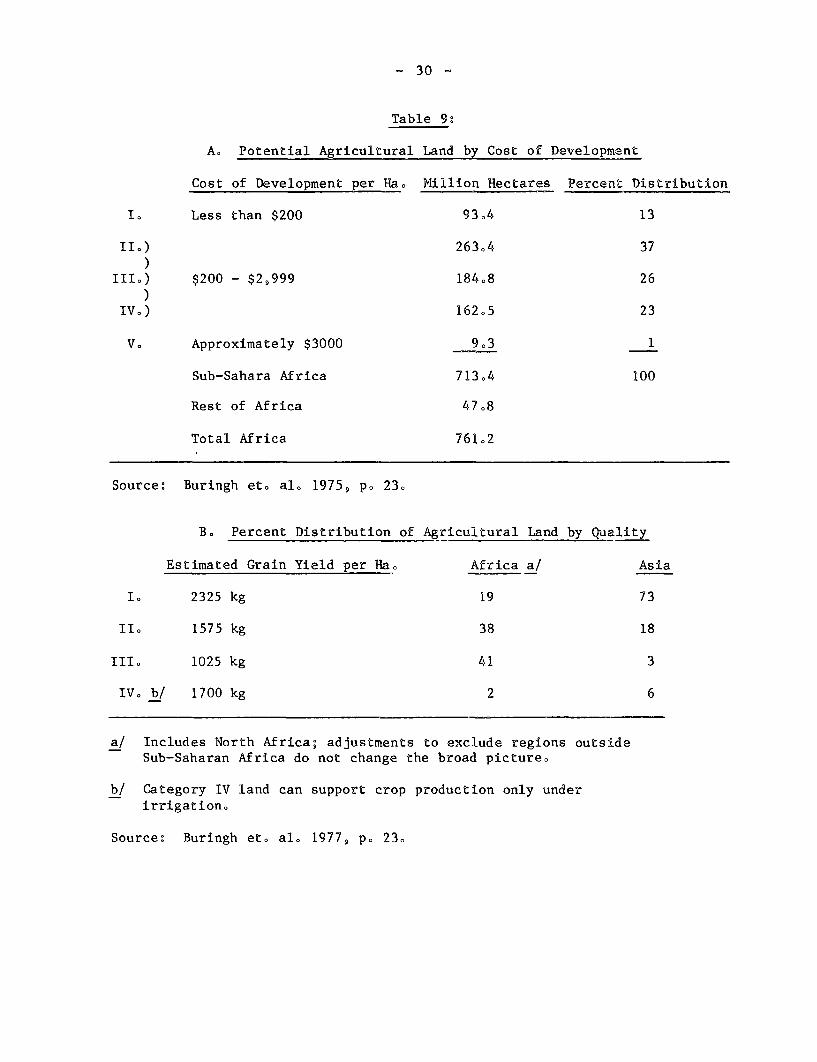
In this context, we should note that, while Sub-Saharan Africa has
plenty of cultivable land, only a small part of it can be reclaimed at low
cost. The top part of Table 9 shows that only 13 percent of the potential
cultivable land can be developed at a cost of about $200 per ha (in prices of
1977). Undoubtedly, much of this category I land is already under crops. In
ascending order of costs, the next two categories account for 63 percent of
the total. The exploitation of the remaining land (Categories IV and V) will
involve very high costs (perhaps $2000 per ha or more) on account of one or
more of the following operations: clearing dense vegetation, soil conserva-
tion works, drainage.
Another qualification to the picture of land-abundant Africa should
be introduced at this juncture. Less than 20% of the land has sufficient
- 30 -
Table 9:
A. Potential Agricultural Land by Cost of Development
Cost of Development per Ha. Million Hectares Percent Distribution
I. Less than $200 93.4 13
II) 263.4 37
III.) $200 - $2,999 184.8 26
IVo,) 162.5 23
VO Approximately $3000 9.3 1
Sub-Sahara Africa 713.4 100
Rest of Africa 47.8
Total Africa 76102
Source: Buringh et. al. 1975, po 23.
B. Percent Distribution of Agricultural Land by Quality
Estimated Grain Yield per Ha. Africa a/ Asia
I. 2325 kg 19 73
II. 1575 kg 38 18
III. 1025 kg 41 3
IV. b/ 1700 kg 2 6
a/ Includes North Africa; adjustments to exclude regions outsideSub-Saharan Africa do not change the broad picture.
b/ Category IV land can support crop production only underirrigation0
Source: Buringh et0 al. 1977, po 23.
- 31 -
rainfall to secure a relatively high yield under a regime of "labour-oriented
agriculture" assumed by Buringh (see the lower part of Table 9). This regime
implies fairly advanced farm management but very little mechanization,
pesticides or chemical fertilizers. The proportion of land which can support
such high yields in Asia is very much higher than in Africa. By contrast,
category III land which can secure yields, which are only 44 percent of those
obtaining in Category I, accounts for 41 percent of the total in Africa.
Agricultural land has already become scarce in some countries.
Examples are Kenya, Rwanda, Burundi, Malawi and Mauritius. In these cases,
the scope for horizontal expansion via extending the margin of cultivation is
limited and the burden of increasing food output falls much more heavily on
technological improvements as well as on creating a policy-cum-institutional
setting within which technical advances can be adopted speedily by farmers.
In the absence of such a progressive environment, population pressure causes
serious injury. This can be illustrated by the prevailing situation in
Kenya. First, as Mbithi and Barnes (1975) have shown, part of the low, dry
marginal land is becoming arid because squatter migrants are destroying
forests and using poor farming techniques. If squatters stay more than three
years on marginal land, using improper techniques of cultivation, the results
are often well nigh irreversible. In addition, the concentration of popula-
tion depletes valuable water catchments, upsetting the equilibrium between
land use and land capacity. Second, even on better land, excessive fragmenta-
tion can lead to a loss of output--a fact made clear by data from settlement
schemes. On some Kenyan farms held by groups of cooperatives, members have
unofficially divided the land among themselves. As a result, output has been
lower than it would have been under more efficient management or more rational
- 32
distribution. This problem is acute in the Haraka settlement scheme, where
each family is given a small farm (five to seven acres) on the condition that
the children will seek their livelihood elsewhere when they become adults. In
practice, the children do not go elsewhere, and the land is parceled out among
them. As the size of farms gradually declines, the loss of productivity
follows.
Population pressure in land-scarce countries has also manifested
itself in the growing scarcity of fuelwood. With increasing needs of cropland
(to meet the growing needs of rapid population growth)9 forests have been
reduced and, therefore, the availability of fuelwood has become more and more
limited. Lester Brown (1981) has noted that Africa has only 6 percent of its
land in closed forest (with more than 20 percent tree cover) - as against 15
percent in Asia and 33 percent in Latin America. A series of country studies
on energy indicate that nearly nine--tenths of the people in the Sub-Saharan
countries depend on firewood as the chief source of fuel. 1/ In most of these
countries population growth is outstripping the growth of new trees, and as a
result there is a trend towards deforestation which threatens the whole
ecological system9 specially the fertility and stability of tropical soils
(Lester Brown 1978)o
The Employment Issue
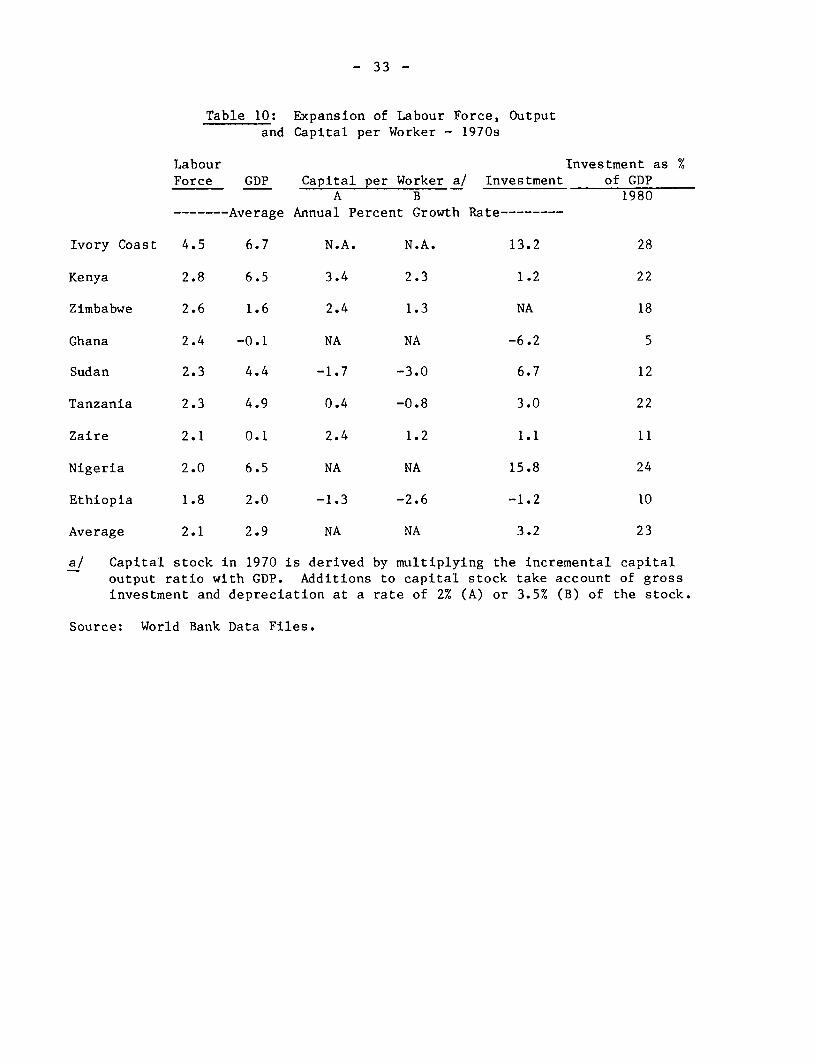
The labour force expanded during the 1960s and 1970s at a rate of
roughly 2% per year on average in Sub-Saharan countries. In Kenya and
Zimbabwe the pace of increase was much faster (see Table 10) and in the Ivory
1/ Such studies are now available for Kenya, Maurittus, Zimbabwe, Burundi,Rwanda, Malawi and Zambia. They have been undertaken as part of a jointUNDP and World Bank Energy Sector Assessment Program.
- 33 -
Table 10: Expansion of Labour Force, Outputand Capital per Worker - 1970s
Labour Investment as %Force GDP Capital per Worker a/ Investment of GDP
A B 1980------- Average Annual Percent Growth Rate--------
Ivory Coast 4.5 6.7 N.A. N.A. 13.2 28
Kenya 2.8 6.5 3.4 2.3 1.2 22
Zimbabwe 2.6 1.6 2.4 1.3 NA 18
Ghana 2.4 -0.1 NA NA -6.2 5
Sudan 2.3 4.4 -1.7 -3.0 6.7 12
Tanzania 2.3 4.9 0.4 -0.8 3.0 22
Zaire 2.1 0.1 2.4 1.2 1.1 il
Nigeria 2.0 6.5 NA NA 15.8 24
Ethiopia 1.8 2.0 -1.3 -2.6 -1.2 10
Average 2.1 2.9 NA NA 3.2 23
a/ Capital stock in 1970 is derived by multiplying the incremental capitaloutput ratio with GDP. Additions to capital stock take account of grossinvestment and depreciation at a rate of 2% (A) or 3.5% (B) of the stock.
Source: World Bank Data Files.
- 34 -
Coast the very high rise in the labour force was greatly influenced by inflows
of workers from neighbouring countries. Labour productivity rose in most
countries. It fell in Zimbabwe, Ghana and Zaire, however; expansion in GDP
failed to keep pace with the increase in the labour force0
As in other LDCs, African labour productivity in 1960 ijas far below
that in industrialized countries. This reflected both technological
backwardness and a relatively low stock of capital. Investment in 1960 was,
on average, 15% of a relatively low GDPo The volume of investment expanded by
about 5.7% per annum during the 1960s, thereby raising the capital stock in
relation to the labour force. The pace of capital accumulation slowed down to
3.2% p.a. during the 1970s9 while labour force continued to rise at the
earlier rate. Capital per worker failed to rise as rapidly as in the earlier
decade and in some cases, an absolute decline could have occurred. Table 10
shows such a decline in the Sudan, Ethiopia and possibly in Tanzania.
In 1960, the bulk of the labour force (about 80%) was în agriculture
and consisted very largely of small farmers using low technology and very
little capital0 Only 10% of the workers were urban and a very small part of
these were employed in the formal wage sector (i.e. government establishments
and businesses using high technology and substantial capital)0 The rest of
urban workers were engaged in informal pursuits (i.e. small enterprises and
the self-employed). There was not one unified labour market but several
partially connected sub-markets. The urban labour force expanded much more
rapidly than the total in all countries of Africa; the average urban growth
rate being about 6% p.a. The urbanization rate was high but starting from a
low base0 A large part of the increasing labour force was accommodated within
- 35 -
the low productivity, small farmer sector in most African countries while a
small part found highly paid jobs within the modern sector.
We can illustrate this rough, impressionistic sketch by citing the
Kenyan case. There, the labour force increased by 1.6 million during 1968-
78. More than half of this increment was absorbed in residual rural areas as
small farmers, pastoralists, migrant farmers and landless workers. About a
third of the rural population was below the poverty line; the corresponding
proportion for urban areas being 4% (Collier and Lal 1980). About a fifth of
the new workers found high paid jobs in the modern sector and the rest made
their livelihood in the informal sector. Much of this period was favorable
for the Kenyan economy and aggregate GDP expanded rapidly. Furthermore,
government was deliberately reducing real wages through its policy of partial
compensation (75%) of the rise in the cost of living. This combination of an
expansionary climate and effective wage restraint made it possible to expand
high paid modern sector jobs by about 4% p.a. Also, government's initiative
in expanding public education led directly to a very large increase in the
number of teachers.
Conditions for growth in high paid modern sector jobs were much less
favorable in many other African countries than in Kenya. Aggregate GDP growth
was much smaller than in Kenya in many cases (Table 10). Reduction of real
wages was not a favored policy in Africa; on the contrary, the emphasis in
many cases was to raise minimum wages and to install social welfare legisla-
tion. Given these trends, it is quite likely that a much smaller portion of
the growing labour force than in Kenya could be accommodated in the high paid
wage sectors of many African countries. And since agriculture tended to be a
neglected, slow-growth sector in many parts of Sub-Saharan Africa, it was
36 -
likely that the growth in the labour force dependent on farming was accompa-
nied by underemployment, stagnant household încomes and, possibly, declining
per capita incomes in some cases. The end of the 1970s and early 1980s saw a
widespread tendency for economic growth to slow down. This retardation must
have reduced the number of job openings in the formal urban sector. Many
governments have tried to protect their own labour force by keeping workers on
the rolls, even when cutbacks in government expenditure for other purposes
have been severe. Obviously, this response cannot be sustained indefinitely.
The phenomenon of rural underemployment is difficult, to defîne and
even more difficult to measure in Afrîca, as elsewhere. A specîal problem ls
that under rainfed conditions, typical of African agriculture, the demand for
labour is subject to sharp peaks and troughs. Labour is very scarce at the
time of planting and harvesting; in fact, for most small=holders, labour îs
the binding constraint on the amount of land farmed and on the cropping
pattern. The labour market is fragmented; small-holders rely almost wholly on
family workers and there is scarcely any wage employment. Seasonal peaks
coexist with a condition of labour surplus, taking the whole year under
consideration. Some evidence along these lines is cited by Cleave (1974),
based on 50 field surveys in 10 countries. According to these data, the
averge time spent in the field is only 1000 hours per adult, per year. Women
spend another 3-4 hours per day in food preparatîon, cooking and the collec-
tion of firewood and water. The same point is made by Mbilinyî (forthcomîng);
she quotes a number of studîes to emphasize the 'double day' phenomenon for
rural African women. In the absence of attractive încome-earning opportuni
ties durîng the long, slack season, men farmers spend sîgnifîcant amounts of
time drinking beer or local brews and visiting friends and relatives0
- 37 -
These impressions of labour surplus are confirmed by a unique data
set assembled for Botswana which shows the use of time by all individuals in a
household above the age of six. Mueller (1981) concludes her analysis of this
data by stating that substantial surplus labour exists in rural Botswana.
Adult males tend to record very high leisure time; they work 60% longer in the
busy season than in the slack season; they work 33% longer in the commercial
Baralong farms (area with progressive, high technology production) than in
other areas.
A marked acceleration in the growth of the labour force is in the
cards (see Figure 11). Compared to 2.1 percent per year average increase
during the 1970s, our sample of 9 countries will see the growth rate climb to
3.3 percent during 1980-2000. The highest growth rates in the labour force
will be experienced in Kenya (4.2 percent p.a.) and in Zimbabwe (3.6 percent
p.a.). Those who will join the labour force during these two decades are
already born. How can these new recruits be deployed effectively? Such
expansion, unprecedented by historical standards, will require major depar-
tures from ongoing policies and institutional structures; a revival of agri-
culture, high doses of investment, elimination of urban wage and other price
distortions, reformulation of technologically unsuitable government standards
and a whole host of other changes. If African development policy fails to
respond to these challenges, the rapidly growing labour force can become a
source of instability and demoralization.
What happens to the labour force in the 21st century is much more
open. If fertility remains constant during the next 20 years, then growth in
the labour force will gain speed and, during 2000-2020, the average annual
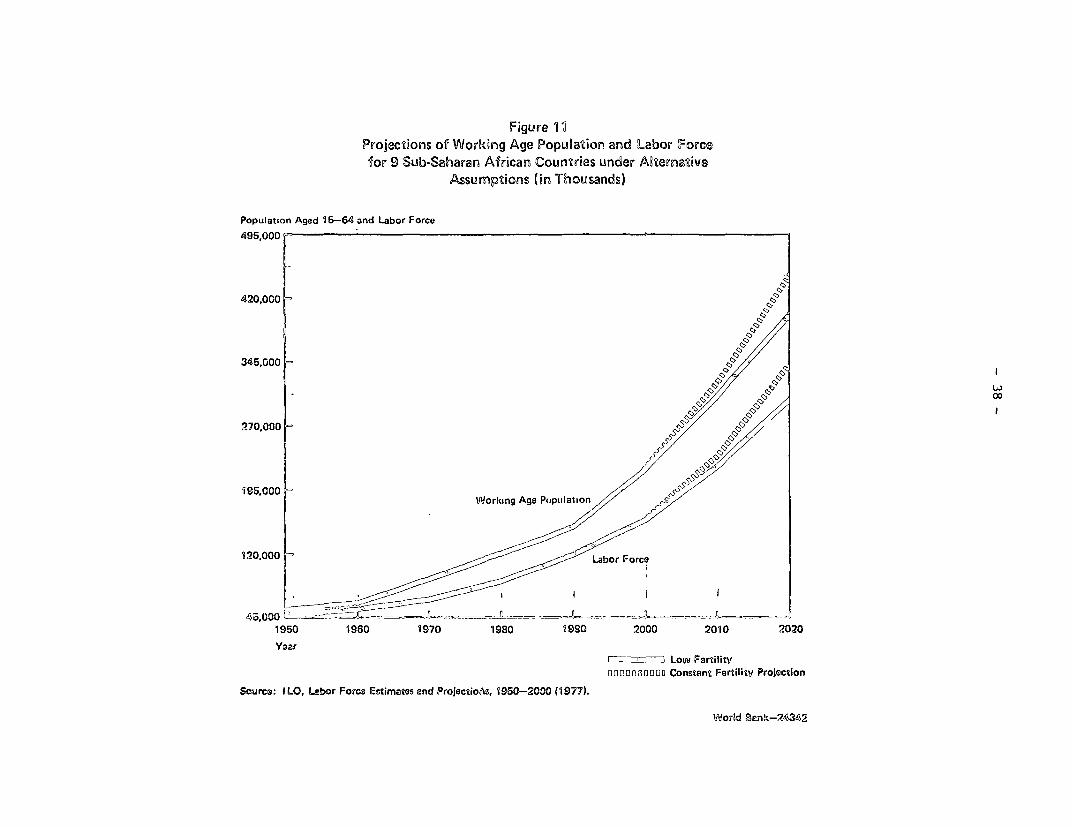
Figure 1 XProjections oe Working Age Population and Labor Forcefor 9 Sub-Saharan African Coutitries under Alternative
Assumptions (in Tlhousands)
Population Aged 15-64 and Labor Force
495,000
420,000
ot f~~~~~~~~~~~~C
270,000SSA
i8S 000 // SX
320,000 boro Force
1950 1960 1970 1980 1980 2000 2010 2020Ys2r
LLow FertilitéoDOOOsoooa Constant FertilitV Projection
Source: I LO, L ebor Forcs Es,timatos and Projectiolis, 960-20S0 (1977).
World Benk-24342
- 39 -
rate for the sample will rise further to 3.8 percent. On the other hand, the
low fertility projection implies a turnaround in the growth of the labour
force; from 3.3 percent p.a. during 1980-2000 to 3.2 percent p.a. during the
following two decades. Depending on how Africa decides on its fertility, the
total labour force of the nine country sample in 2020 could be anywhere
between 304 million and 345 million. A larger labour force can be an asset if
it is well educated and trained, if it is healthy and if it can be equipped
fully with capital equipment and infrastructure. Given the present predica-
ment of African countries, the constraints on the availability of finance and
management and formidable obstacles in the way of policy-cum institutional
reform, a larger labour force can also turn out to be a liability.
Services for Basic Needs
Despite considerable progress in the provision of basic needs in
recent years, the situation is still unsatisfactory (see annex table 13). The
coverage of primary education has risen to an average of 70 percent but that
of secondary education remains very low at 9 percent. Improved water supply
is only available to 20 percent of the population. Infant and child mortality
remain at fairly high levels. Population growth adds the serious problem of
"keeping up" the quantity and quality of the existing coverage to the already
serious problem of "catching up."
The primary school-age population in our sample of 9 countries
increased at a rate of 3 percent p.a. during the 1960s and at 3.6 percent p.a.
during the 1970s. If fertility is unchanged, we can expect this rate of
increase to continue during the next 20 years and then accelerate further to
4.1 percent p.a. during 2000-2020 (Figure 12 and Annex Table 16). By
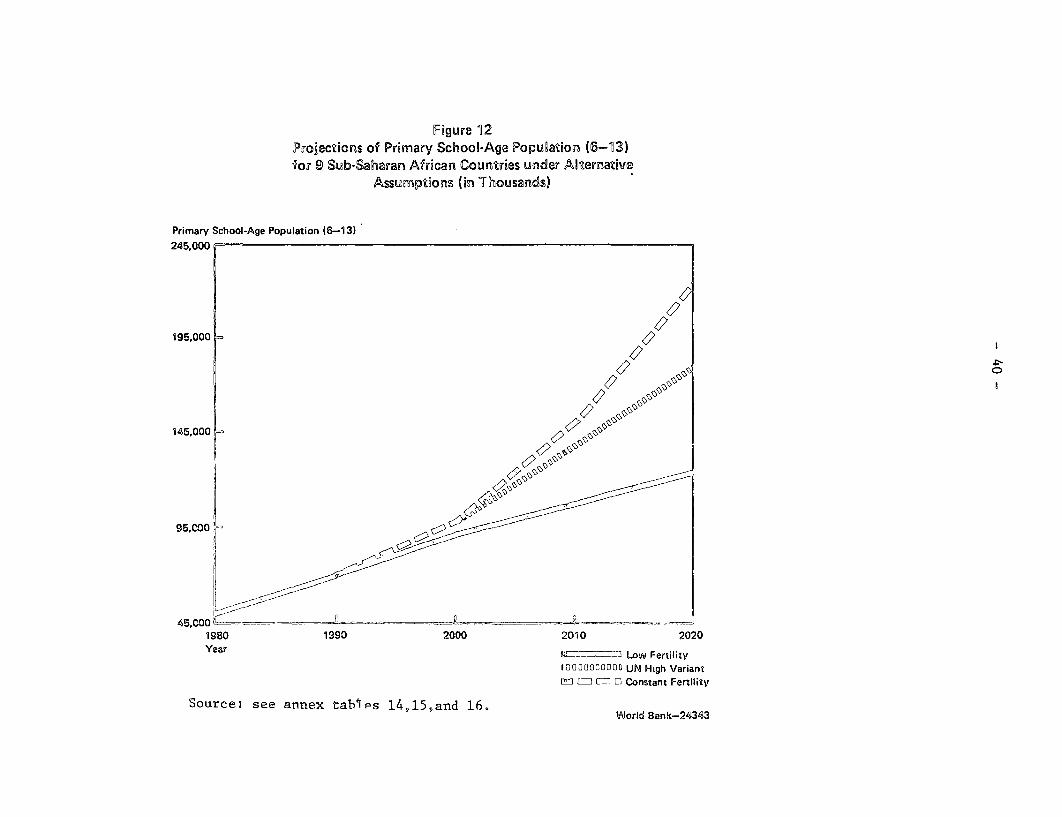
Figure 12Projections of Primary School-Age Population (6-13)for 9 Sub-Saharan African Countries under Alternative
Assumptions (in Thousands)
Primary School-Age Population (6-13)245,000
195,000 G62~~~~~~~~~~~~~~~~~~C
145.000
45,0001980 1990 2000 2010 2020Year L -= LO'N Fertility
tUOQflD0D000 UN High Variant=r =~ =E Constant Fertility
Source3 see annex tablps 149 15,and 16. World Bank-24343

- 41 -
contrast, the growth in the primary school-age population will slow down to
3.4 percent p.a. during 1980-2000 and further to 1.3 percent p.a. during the
following two decades, according to projections based on low fertility.
Universal primary education implies increasing the number of primary school
places from about 34 million in 1980 to 124 million in 2020 under the low
fertility regime. But this order of expansion in primary school places will
only accommodate 56 percent of the primary school age population if fertility
levels remain unchanged. This is quite a dramatic conclusion. Expanding
primary school places by 3.6 times during 1980-2020 will suffice to make such
education universal under the low fertility projections; the same effort will
lead to an unconscionable fall in the enrollment ratio from 70 percent to 56
percent under the constant fertility projection.
The arithmetic of Basic Needs can be presented in another way using
Kenyan data. During 1975-80, Kenya spent 32% of total government expenditures
(10% of GDP) on education, health, rural water supply and urban housing. If
we assume constant fertility, Kenya will have to expand these outlays in real
terms by 878% in the period up to 2015-2020 to maintain present coverage and
quality (Faruqee 1980). By contrast, the required expansion would be only
269% if fertility declined rapidly as per Projection I in this paper (Annex
Table 3), thereby freeing up substantial resources with which Kenya can
improve the coverage and quality of these services.
To recapitulate, past trends in Sub-Saharan Africa are worrying,
irrespective of whether the focus is on food output, employment conditions,
provision of basic needs or general development. This difficult situation is
the result of many different factors. It is not easy to assign weights to
each factor even in the context of a single country, to say nothing about the
- 42 -
hazards of generalizations at the Pan-Afrîcan level. It would be difficult to
maintain, nevertheless, that the acceleration of population growth in the
1970s has been a positive influence on such halting progress as has
occurred. The challenge posed by rapid growth in numbers has not, in fact ,
led to a commensurate response in the form of technological or organizatio-nal
progress as hypothesized by Boserup (1965) or Simon (1982)o A sizeable part
of government expenditure has been diverted to the task of "keeping up"i per
capita standards instead of extending the coverage of basic needs services and
improving their quality. Again, a substantial part of investment and imports
have been directed to equipping additions to the labor force with a minimal
allotment of equipment and inputs instead of raising per worker allotments.
Looking to the future, we have argued that rapid population growth in the near
term is inevitable given the demographic momentum already built up. Further
on in time, the room for maneuver expands and there is an important choice to
be made regarding the course of fertility. The scale and complexity of the
development problem facing Africa will be influenced by the future behavior of
fertility. If this begins to fall in the coming decades, the development task
of the next generation will be facilitated to some considerable extent. A
slower growth in population numbers should provide more breathing space. It
should reduce , somewhat, the trend rate of expansion in food demand, thereby
facilitating the attainment of self-sufficiency and moderating pressures on
the balance of payments. A reduction in population growth should also relieve
the pressure on government budgets, thereby permitting faster expansion in
coverage and quality of basic needs services. The result will be a better
educated population who are in better health and who can make a bigger
contribution to production. The accumulation of human capital (in the form of
- 43 -
health and education) is also regarded as a major factor determining attitudes
and values favorable to the reduction of fertility (Cassen, 1976). Finally, a
slowing down in population numbers should reduce the inflow of entrants into
the labour force but improve the quality (in terms of skills and attitudes) of
each new worker. It should permit a faster increase in the amount of physical
capital with which new workers can begin production. The economies of Africa
will, then, have a better prospect of generating attractive earning
opportunities in sufficient number to engage the growing labour force.
The above propositions constitute the case for reducing the pace of
demographic expansion in Africa. If this case is persuasive and forceful
action is taken to reduce fertility, population will still grow at a rapid
pace, albeit not as rapid as it would on the assumption of constant fertility
(Table 7). In stating this case for fertility restraint, we do not wish to
minimize the inherent difficulties of the development task in Africa, no
matter what happens to fertility. Clearly, effective population policies are
a desirable part of the overall approach to development but they are not a
panacea.
-- 44 --
IV. Determîrants cf Fertility
Historical data at the country level show that fertl'lity has not declîned much
in Sub-Saharan Africa, despite a measure oL prcgress in social and economic
indicators. Cross-sectional data, a21so at the country levelD confirm that
fertility declines much more slowly with rise in per capita inccwie in this
region than in other parts of the world 'l'hese trends were dccumented in
Section Io
There is a wide variation in fertîlity rates in the Su -'Saharan coun-
tries. The fertility data for most oL- these countries are not dL-nendable; the
figures should be interpreted as ranges (Hill 1981). Trhe estimated total
fertility rate ranges from 305 to 8.OD wlith mcst rates fallirg within 5 to
7o All the countries of Eastern and Southern Africa show total fertility
rates of at least 6.3, with several countries above 7. By conc-cast, Western
and Central Africa have only one country, Ghanea Dit/it a total fezrtlility rate
of 7; several are below 60 The sîgnificance of this broad regional difference
fades in the light of the dates of these estimates HIost of tne data for
Western and Central Africa are from the 1950s anci 1960s; those For the Eastern
and Southern Africa are much more recent. Nore recent data fo-e Western and
Central Africa may confirm the rising trend of fertility revea½eci in Kenya.
There is strong evidence t'nat the low fertillity observed in some
areas in the 1950s and early 1960s was largely caused by the abortifacient and
sterilizing effects of venereal diseases (Romaniuk 1967; Miobogunje and Arowolo
1978)o There is also some evidence that other diseasesD such as malaria,
tuberculosis, and nutritional deficiencies. cause infer,îlity %"i ?abogunje and
Arowolo 1978)o The low fertility due to .he effects of venereai diseases in a
- 45 -
few areas indicates that fertility in those areas will rise with the introduc-
tion of antibiotic therapy and improved nutrition.
Of the Sub-Saharan countries, Kenya has the most reliable data on
fertility for different years, which make it possible to study both its level
and trend. Annex table 17 presents the data on fertility in Kenya; annex
table 18 that for other Sub-Saharan countries. The main features of Kenya's
fertility are that it is high, has been high in the past, and appears to be
increasing at present. In 1978 Kenya's total fertility rate was estimated at
8. According to the U.N. (1975), no other country has such a high rate.
The similarities between the fertility rates of Kenya and those of
other Sub-Saharan African countries are obvious - fertility has either
remained constant at a high level or has recently increased. A recent review
of World Fertility Survey (WFS) findings in 29 developing countries shows that
fertility levels are highest in Africa, where the average TFR is 6.7 compared
to average TFR of 4.8 in Asia and Pacific countries and 4.6 in Latin America
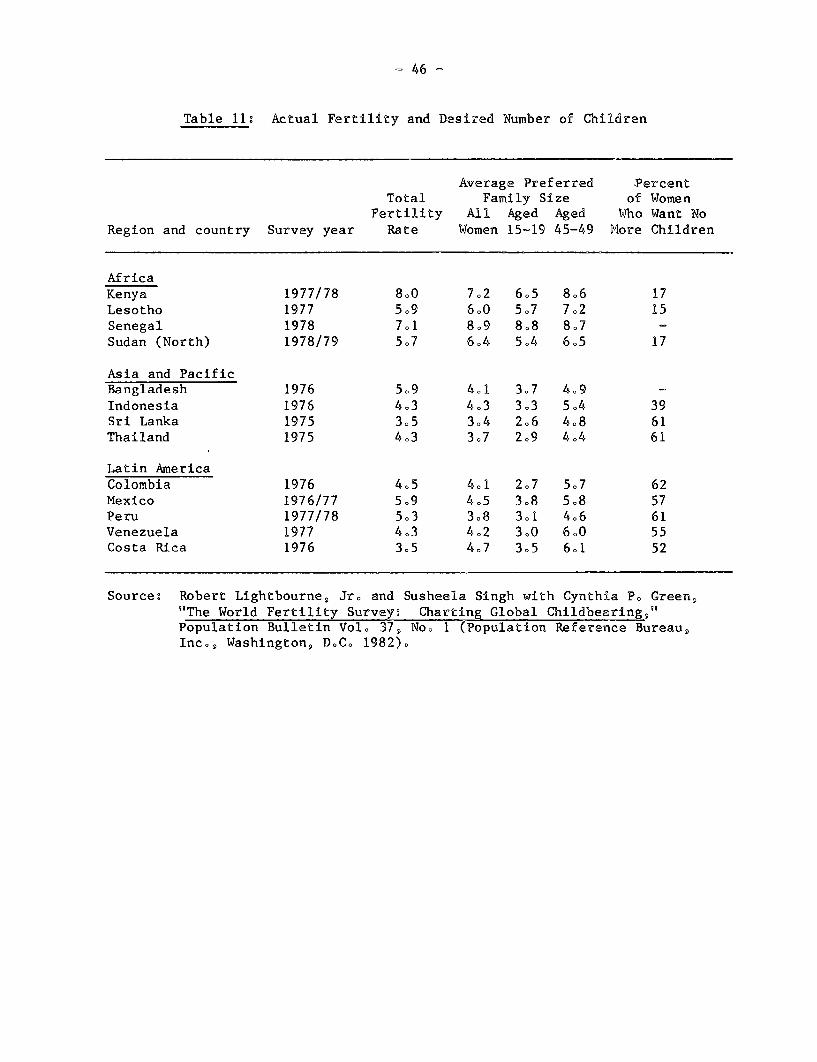
(Lightbourne et al 1982). The average number children desired is 7.1, in
Africa, compared to 4.0 in Asia and Pacific countries and 4.3 in Latin America
(see table 11).
How can this be explained? Why has fertility remained high, or in
some cases even risen, in the face of rising education, falling mortality, and
some urbanization, factors that caused fertility to decline in others parts of
the world? Why is preferred family size universally so high in Africa? What
factors explain high fertility and preference for large families? Are the
fertility determinants in Africa different from those in other parts of the
world?
46 -
Table l: Actual Fertility and Desired Number of Children
Average Preferred PercentTotal Family Size of Women
Fertîlity All Aged Aged Who Want NoRegion and country Survey year Rate Women 15.19 45-49 More Children
AfricaKenya 1977/78 8.0 7.2 6.5 8.6 17Lesotho 1977 5.9 6.0 5.7 7.2 15Senegal 1978 7.1 8.9 8.8 8.7 -Sudan (North) 1978/79 5o7 6.4 5.4 6.5 17
Asia and PacificBangladesh 1976 5.9 4.1 3.7 4.9 -Indonesia 1976 403 403 303 504 39Sri Lanka 1975 3.5 3.4 2.6 4.8 61Thailand 1975 4.3 3.7 2.9 4.4 61
Latin AmericaColombia 1976 4.5 4.1 2.7 5.7 62Mexico 1976/77 5.9 4.5 3o8 5o8 57Peru 1977/78 5.3 308 301 4.6 61Venezuela 1977 4.3 4.2 3.0 6.0 55Costa Rica 1976 3.5 4.7 3.5 6.1 52
Source: Robert Lightbourne, Jr0 and Susheela Singh with Cynthia P. Green,"The World Fertility Survey. Charting Global Childbearing,"Population Bulletin Vol. 37 , No. 1 (Population Reference Bureau,Inc0 , Washington, DoCo 1982)o
- 47 -
Studies of fertility differentials within countries are very scarce
but the limited evidence suggests that fertility behavior in Sub-Saharan
Africa does not differ too much from that observed elsewhere. The results of
the multivariate analysis in Kenya show that the following variables are
significantly related to fertility: wife's education (negative), husband's
education (positive), urban residence (negative), and the amount of land owned
(positive) (Faruqee 1980). A significant, negative relation between wife's
education and fertility appears after junior-secondary education, which can be
regarded as a threshold of fertility decline. It is likely that this
threshold moved downward as primary education spread throughout the popula-
tion. Information obtained through the World Fertility Survey in 1977 showed
that the number of children desired by Kenyan women dropped from 7.8 for those
without any education to 6.8 for those with primary education to 5.6 for
secondary school graduates (Kent and Larson 1982). The relevance of wife's
education is also borne out in other studies for tropical Africa (Ward 1976),
Ghana (Caldwell 1967a and 1969b), Botswana (Chernichovsky 1981), Nigeria
(Ohadike 1968b), and Sierra Leone (Dow 1971). The Kenya study by Faruqee also
found a negative relation between urban residence and fertility. A similar
finding has been recorded for Sierra Leone by Dow (1971). Cohen (1967)
classified Mali, Guinea, and Togo as countries with significantly lower
fertility rates in urban areas than in rural areas.
Explanations of continued high fertility in Africa have to turn to
broad societal characteristics not captured by multivariate analysis at the
houehold level. In fact, the household may be quite unsuitable as a unit of
analysis, specially in Africa. This point has been made once again by Jane
Guyer in a long 'state of the art' paper commissioned by the African Studies
- 48 -
Association (Guyer 1981). The household tends not to be a very meaningful
unit for production, consumption or fertility decisions. There may be no
common budget for a man and his wife. The head of the household may not have
full control over the labour supply of îndividual members. Chîldren may have
very different implications in terms of costs and benefits, for fathers and
mothers. These aspects compel the analyst to focus on individual members of
the household; the distribution of income, power, work and leisure .Iîthin the
family acquire a great deal of signîficance. Equally, it may be necessary to
focus on units larger than households, such as kinship, lineage and tribe.
The values, structure and functioning of these social groups may exercise
important influence on îndividual and household behavior, including fertility
behavior.
Based on a study of available social-anthropologîcal and other
literature, we wish to put forward two workîng hypotheses. The first is that
the security motive (i.e. search for physical survival of family, clan and
tribe) makes for a larger ideal family size in Africa. Some support for this
hypothesis can be found in the notion that large numbers in a family or clan
may be the only guarantee of securîty în fragmented, traditional societies
where governments have not yet established the protective cover via the rule
of law enforced effectively by a mobile, non-partisan, police force. The
writings of Caldwell are suggestive on this score.
According to Caldwell (1977), there are only two types of fertility
regime: one where there is no economic gain to individuals from restricting
fertility; and the other where there is substantial economic gain from such
restriction. Whether unrestricted or restrîcted fertility is economically
rational is determined by social conditions, primarily by the direction of the
- 49 -
intergenerational wealth flow. According to Caldwell, this flow has been from
younger to older generations in all traditional societies. Only after the
family is largely nucleated both emotionally and economically is there a
reversal of flow. Caldwell holds that the African society by and large, is in
the first regime, implying that most parents, especially women, do not find it
gainful to restrict fertility. In describing the characteristics of tradi-
tional societies, Caldwell remarks that if larger organizational units have
not arisen, as among warring clans, and even families, numbers are presumably
almost the only guarantee of security from attack and of the ability to take
resources from others. In this sense, African societies with many clans and
tribes, often in conflict with each other, may have strengthened the norm for
unrestricted fertility. In another recent article, Caldwell (1981) further
elaborates his observation. He writes:
"Sub-Saharan Africa has been characterized by strongdescent lineages and by weak conjugal bonds. Land ismost frequently communally owned, and hence power andfortune have been derived almost solely from the controlof sufficient people. Children have by no means beenbrought up solely by the nuclear family, and fertilitydetermines neither the number of economic dependents atany specific time nor the identity of the person meetingthe costs of rearing a child."
The second hypothesis is that high fertility in Africa reflects the
predicament of women. This line of argument draws on a variety of historical,
economic and social-anthropological sources but we have not seen it spelt out
fully. Evidence (sometimes fragmentary) can be cited in support of individual
elements in this chain of reasoning, but other elements are no more than
suggestive. The validation of this hypothesis will require a new round of
inter-disciplinary research. Notwithstanding its speculative nature, we
present the argument here.
50 -
First, we will describe the position of African women in the pre-
colonial period. They were responsible for most domestic work in cooking,
cleaning, child-rearing9 collection of water and fuel wood; much like women
everywhere at that point in history. The distinctive aspect of African women
was that they played a dominating role in agriculture. Boserup (1970) tied
this fact to several structural aspects of farming; its concentration on
subsistence food crops, the low density of population, the widespread practice
of shifting cultivation and low technology. Women in Africa carried out half
of the agricultural work and, in some cases9 much more; the corresponding
Asian proportion being 20%.
The introduction of cash crops during the colonial period had a
number of repercussions in African agriculture and in African society. While
men had left the growing of subsistence food to women, they did not shy away
from cultivating export crops. Men had much more time to respond to the new
profit opportunities; women after all were preoccupied with traditional9
reproductive9 child-rearing and food-growing activities. In addition9
European colonial policy neither understood9 nor accepted the prevailing
female-farming system in Africa. Subsistence food crops were largely
neglected by research, extension and infrastructure services provided by the
colonial state. An attempt was made to recruit males for wage-jobs in
European plantations9 to educate them and to get them to grow cash crops on
their small-farms for export to Europe. The result was a growing gap in
labour productivity as between food and cash crops or (in other words) between
women and men farmers. Men acquired the cash to upgrade the cultivation of
export crops while women continued to use traditional, low-input, low-yield
methods for food production. These trends led to a deterioration in the
- 51 -
relative position of women. On the one hand, there took place an increase in
their already considerable workload (Safilios-Rothschild 1980). In addition
to domestic work, child-rearing and food-growing, women were expected to work
on cash crops. They were also expected to take over male functions when
husbands left to earn wages in the modern sector or when sons went off to
attend school. On the other hand, women tended to become more dependent on
men. The best lands and household labour were diverted to cash crops. Women
remained responsible for food but failed to produce enough on the farm;
supplements had to be purchased by them financed by men's cash earnings.
Damage done to the relative position of women during the colonial
period was not offset during the last two decades of independent socio-
economic development (Mbilinyi, forthcoming). This latter period was marked
by a tendency for the entire agricultural growth (cash crops and food crops)
to slow down, particularly during the mid and late 1970s, as the internal
terms of trade moved in favour of cities and as waves of rural men left to
find city jobs. More and more houseolds came to be headed by women.
Botswana, with its large number of male workers working in South Af rica mines,
is perhaps an extreme case of what is common in many African countries--male
migration from rural areas. Kossoudji and Mueller (1981) found that nearly 41
percent of rural households surveyed had a female head. And despite the
increasing responsibility of women, their position has not improved in
society, according to the study. Economically, the female-headed households
generally are poorer than male-headed households. Socially, women are still
given lower status than men: for example, in Botswana women are regarded as
minors both in law and in actual behaviour. The situation of rural women in
Lesotho is similar to that in Botswana. Many male workers move to South
- 52 -
Africa for work; women are left with household responsibilities and agricul
tural tasks0 A survey found that two of three workers in the agricultural
fields were women. Males still play a dominant role in family decisions9
including those about agriculture. Even an absent, migrant, maie decides on
the use of land when on home visits. If the husband is absent, the wife has
to obtain his agreement before starting a farming operation, employing a
contractor sharecropper, or getting a loan from the local credit union.
Faruqee's Kenya study also underlines the low status of women. There
is strong social pressure on women to marry and produce children, thus extend°
ing the kinship network. An intense desire is created for family roles by
community praise of the wife and mother and severe censure of the unmarried or
childless woman. Most Kenyan women, therefore, marry at the onset of puberty;
feelings of dependence underlie a woman's relationship with her husband and
his friends, placing her in a position of near-zero power in the family into
which she marries. The low status of Kenyan women has a big effect on their
decisions about family size, their knowledge of bîrth control, and their
access to contraceptives. The nature of legal rights and the obligations of
couples toward each other and their children also affect decîsions about
family size. Available information indicates that the heavy workload of
Kenyan rural women induces them to have children, who are looked on as
potential sources of labor and support0 In Kenya, nearly one quarter of the
rural households are headed by females, whose economic situations is worse
than that of male-headed households, as in Botswana. Absence of husband makes
these women dependent on children for security and this is reflected in the
desire to have many children. The current rule regarding property rights of
women also makes them economically dependent on their children0 Through a
- 53 -
system of kinship ties, holdings are generally transmitted from one generation
to another. Women in Kenya do not normally inherit land; rather they are
granted the right to use land belonging to their husbands or father or in some
instances sons. This means women lack security of tenure and want children,
especially sons, for security. Matiko (1981) makes a similar observation for
Tanzania.
In some Western African countries (Ghana, Nigeria, and the Ivory
Coast), women are more active in trade. But their status remains weak.
Harrington (1978) uses two measures to examine the position of women: an
index of physical and nutritional stress that measures the proportion of the
reproductive life spent either pregnant or breastfeeding, and an index of
economic roles and responsibilities that measures the woman's responsibility
for household and personal expenses. Both measures show Nigerian women to be
very heavily burdened.
Tanzania provides an interesting case in which state policy
recognized the women's predicament. Julius Nyerere (1967) said it was
"impossible to deny that the women did, and still do, more than their fair
share of the work in the fields and in the home." Government attempted to
provide relief to women by changing production relations through ujamaa,
villagisation, provision of basic needs and in other ways. Undoubtedly, some
improvement has occurred but Croll (1981) is not enthusiastic about the net
outcome. According to her, "women remain dependent upon and dominated by men
due to the primary place men have in relation to production....." Most land
is cultivated privately where the male exercises control. Communal farming
imposes an additional demand on women's time while cash returns from the
activity are frequently appropriated by their spouses. Government attempts to
- 54 -
assist private farming through extension and supply of new equipment tend to
neglect women (Fortman 1976, 1979)o An impressive expansion of schools has
occurred but disparity in access to education as between boys and girls still
persists. A major effort has been made to expand improved water supply,
thereby releiving the burden on women. The recent budgetary crisis has
undermined the maintenance and effectiveness of these and other basic need
services.
We can conclude this section by acknowledging that our understanding
of fertility determinants in Africa is weako Statistical analysis at the
household level provides some clues. These are no different than the results
of similar multiple correlation exercises elsewhere. What may distinguish the
African scene is the relatively slower response of fertility to socio-economic
development. It may also be that these indices of development have to reach
higher threshold levels in Africa than in other places before they trigger a
fertility reduction. In addition, it seems that analysis at the household
level should be supplemented by explorations of intra-family relationships and
of larger social groups such as kinship and tribe. High fertility may reflect
a search for physical security in a fragmented, traditional society. It may
be the woman's way of acquiring power; through children they can influence the
behaviour of others, including, of course, the children themselves (Safilios-
Rothschild 1982)o If society impedes other avenues to power such as pursuit
of autonomous economic activity, then women may compensate by having large
numbers of children. Righ fertility may also be a response by rural women to
the onerous work-load assigned to them (Youssef 1982)o Children, according to
this view, can be regarded as a captive labour force that assist women to
carry out their responsibilities. The incomplete understanding of fertility
determinants in Africa is not a good reason for government inaction in thîs
sphere. Enough is known to provide a reliable basis for population policies.
- 55 -
V. Population Policies: Present and Future
Present Status
A review of the development plans of Sub-Saharan countries indicates that very
few considered demographic aspects very seriously (Stamper 1977).
At least eight parameters need attention in this context: rates of population
growth; projections of future population size, future school-age population,
and future working age population; and estimates of fertility, mortality,
current school-age population, and current working-age population.
A similar picture emerges from a study by the Population Council
which classifies countries by their population policy (Table 12). Category A
is used for a strongly antinatalist policy, B for a policy moderately suppor-
tive of a family planning program (for health and human rights reasons), and C
for a neutral or pronatalist population policy. Most countries in Sub-Saharan
Africa are in the B and C categories. Only three countries--Kenya, Ghana and
Botswana--are in the A category.
The Economic Commission for Africa has also examined the population
policy of countries in Sub-Saharan Africa (see table 12). Category I is used
for a strong antinatalist policy with direct government intervention.
Category II is used for a policy moderately supportive of a family planning
program (for health and human rights reasons) with no direct fertility
reduction goal. Most countries in Category II perceive their fertility levels
as being satisfactory. Category III is for neutral or a pronatalist policy in
which some countries perceive their fertility levels as being too low and some
actually limit access to methods of fertility regulation.
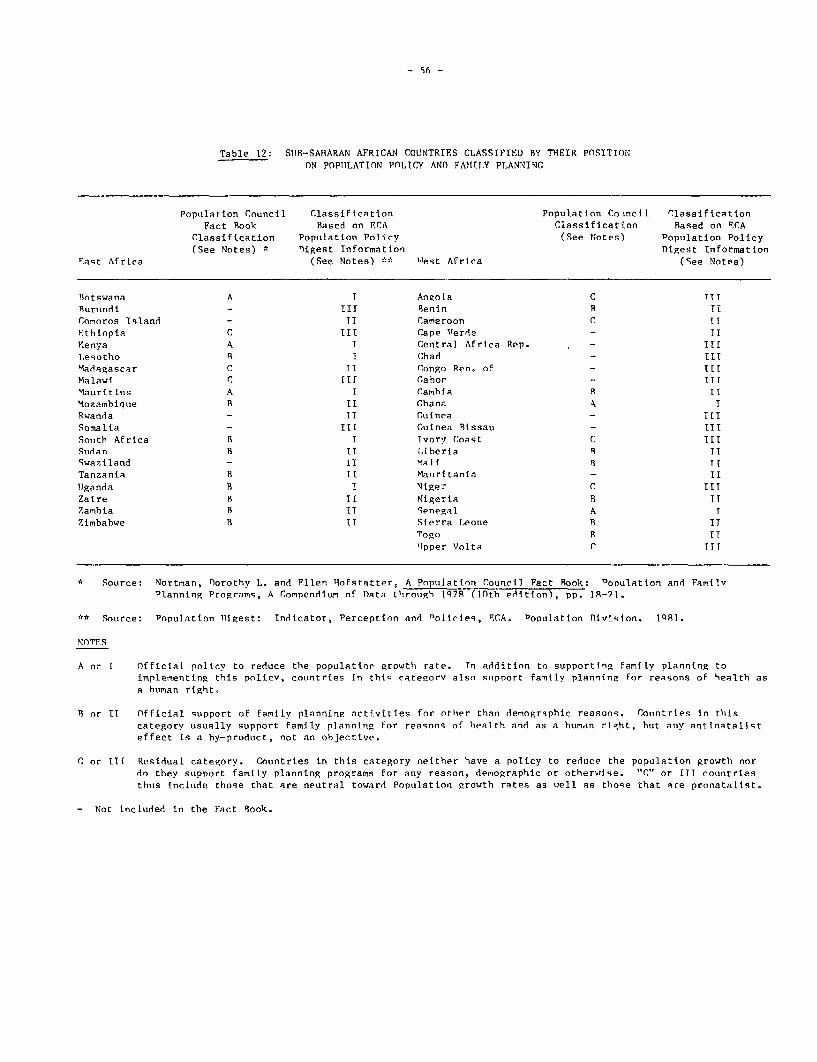
- 56 -
Table 12: SIB-SAHARAN AFRICAN COL'NTRTES CLASSIFIED BY THEIR POSITIONON POPIILATION PO0.ICY AND FAMI1LY PLANNING
Popuilation Council Classification Population Coincil ClassificationFact Book Based on ECA Classification Based on ;.CA
Classification Population Policy (See Notes) Population Policy(See Notes) * nigest Information Digest Information
East Afrtea (See Notes) T lest Africa (See Notes)
Botswana A T Angola C TIIurunindi III Benin R If
Comoros Island - TI Cameroon C IlFthiopia C lit Cape Verde - IlEenya A I Central Africa Rep. - TIILesotho B I Chad - IITMadagascar C TI Congo Ren. of - I[tMalawi C ITT Cahor -I IrMauriti s A Camhbia B IIMozambique B II Chana I Rwanda -I tuinea - IlTSomalia III Cuinea Bissau - IIISouith Africa B I Ivory Coast C TIISudan B IT ihberia B TISwaziland Il Mali B TITanzania B il Mauiritania - IIliganda B I 'Niger C IITZaire B If Nigeria B IlZambia B II Senegal A tZimbabwe h Il Sierra Leone h IT
Togo B Ilipper Volta ^ TITT
* Source: Nortman, Dorothy L. and Ellen Hofstatter, A Population Council Fact Book: Population and FamllvPlanning Progranm, A Compendium of Data through 10q7 (0th peition), pp. 18-21.
** Source: Population Digest: Indicator, Perception and Polirles, ECA. Population Diviqion. 1°81.
NOTES
A or I Official policy to reduce the populatior growtlh rate. Tn addition to supporting family planning toimplementing this policv, countries in this categorv also support famtly plannina for reasons of health asa human right.
B or Il Official support of family planning activities for other than demographic reasons. Countries in thiscategory usually support family planning for reasons of bealth and as a human riEht, hut any antinatalisteffect is a by-product, not an objective.
C or III Residual category. Countries in this category neither have a policy to reduce the population growth nordo they support family planning programs for any reason, demographic or otherwise. "C" or ITI countriesthus incltde those that are neutral toward Population growth rates as vell as those that are pronatalist.
- Not included in the Fact look.
- 57 -
The two classifications are essentially the same, but the ECA classi-
fication provides more recent information on some countries (Uganda and
Cameroon) and covers more countries. Most Sub-Saharan African countries are
in categories II (similar to B) and III (similar to C). Only eight countries
(comprising about 20.0% of the total population of Africa) fall in category
I. Annex table 19 outlines current perceptions, policies and population
programs in these countries. Six of these countries are in Eastern Africa.
In West Africa only two countries, Ghana and Senegal, have an explicit
population policy. Even countries in Category I cannot be said to have an
effective population policy. The commitment to reduce the natural increase in
population remains partial or tends to vacillate. This is illustrated by the
Kenyan case.
Kenya was the first Sub-Saharan country to adopt an official national
family planning program. It did this in 1967, but the program received sub-
stantial support only during the Third Five-Year Plan (1975-79). The goals of
the program under that plan were to reduce the high annual rate of natural
increase of population (estimated at 3.3% in 1975 and 3.0% in 1979) by
recruiting 640,000 new family planning acceptors and thereby helping to avert
some 150,000 births. But there was a serious shortfall in achieving the
targets. Moreover, the rates of continuing family planning use were excep-
tionally low. A preliminary estimate shows that the average number of
revisits per client is only about 3.5; in other words, the average new client
comes back to the clinic fewer than four times and then drops out of the
system. The low retention is also reflected in the low prevalence rates of
contraceptive practice. Only a small proportion of women of reproductive age
58 -
have been found to use contraceptives. Recent evidence of practice and accep-
tance rates comes from the 1977-78 Kenya fertilîty survey. Although 42 per-
cent of the sampled, ever-married women knew of a source of family planning
services, only 12 percent reported ever having visited such a facility0 This
nonetheless represents a slight improvement over the results of the contracep-
tive practice survey of 1974. Roughly 5 percent of women in the reproductive
age group are currently practicing famîly planning.
On the supply side of the Kenyan family planning program, the main
issue is access to and quality of services. The acceptance of family planning
is affected by the availability and quality of services delivered and the dis-
tance traveled to service facilities. More than 80 percent of rural Kenyan
women give birth at home. To reach the nearest health facility, they must
travel on the average more than three miles0 Because rural health facilities
are overburdened with demands for curative services, because preventative and
promotive services are underdeveloped, and because outreach programs are
insufficiently coordinated, many women of reproductive age remain outside the
health delivery system. The family-health field educators have reached some
of these women, but they can cover only a small percentage with present
staff. Extending and improving access to rural health services could increase
the number of acceptors and long-term users of family planning services0 On
the demand side, the most important issue is to find the links between
socioeconomic development and the demand for and use of family planning0 The
factors that explain high fertility in Kenya also explain the low acceptance
of family planning0
Ten countries in Eastern Africa and an equal number in the Western
Africa fall into Category II, iîe. governments in these countries provide

- 59 -
official support for family planning but not in order to reduce population
growth. Nigeria belongs in this group. The combined population of these 20
countries comprises 45.6% of the African total. Category Il is a diverse
group. Zimbabwe, for example, has succeeded in having 15 percent of women in
the reproductive age group practice family planning; a far higher proportion
than in Kenya placed in Category I. Some countries in this group have
recorded important changes in policy in recent years, i.e. from a neutral
population policy to one which emphasizes spacing of children. The need to
curb population growth was recognized for the first time in Rwanda's Second
Plan (1977-81). A National Population Office was established in 1981 to
formulate a population policy, to carry out an informational campaign using
mass media, to coordinate pilot family planning projects and to prepare for a
larger program. In Tanzania, President Nyerere has called for the formulation
of a national birth policy and for launching campaign to educate people on the
need for adequate spacing of children (UNFPA 1982). Other countries in
Category Il have not had such transformations in policy.
Family planning activities in almost all countries in categories I
and II were begun by volunteer groups. In many of these countries, family
planning services were first provided by clinics run by the voluntary organi-
zation, which still run these clinics in some countries, along with government
services. The small groups of pioneering volunteers in these countries often
became organized as local Family Planning Associations (FPA) which are affil-
iated with the International Planned Parenthood Federation (IPPF). The volun-
tary associations - notably FPAs - have been instrumental in many of these
countries in persuading the government to assume responsibility to provide
services. Even in those countries where the government has not yet stepped
- 60 -
in, FPAs are the most important force to create interest in the government
about family planning. The voluntary associations in Africa hold out a
promise to be innovative and promote family planning.
Ten countries in Western Afrîca and four on the Eastern side are in
Category III, i.eo governments in these countries are either pronatalist or
neutral on the question of population. Surprisingly, this category includes
Malawi and Burundi; countries in whîch population pressure is very visible0
An important change seems to have occurred recently in Malawi; Government is
reported to have decided to introduce chîld spacing activîties in its maternai
and child health programo
It is right to conclude, then, that present population policies in
Sub-Saharan Africa remain weak. At least, 14 governments do not seem to
recognize the seriousness of the population issue (Category III). This is
also true, perhaps, of many of the 20 governments in Category Il, although
others in this group are aware of the magnitude of the demographic problem but
either cannot or will not intervene in this area. Even countrles in Category
I cannot be said to have a strong population policy. Recent changes in
Rwanda, Tanzania and Malawi are promising but they do not yet add up to a
different picture.
There is no satisfactory explanation of twhy the policy posture on
population remains ambivalent in Africa today. Nevertheless, the following
considerations help in understanding the present position:
The common perception is that of "empty spaces" and vast
unutilized natural resources ready to be harnessed. The
fact that population density is low în most countries
(there is no visible congestion as in Calcutta or Java)

- 61 -
tends to reinforce this perception of limitless
frontiers.
The message that Africa faces a population problem has
come mostly from the West, and in many quarters it has
been dismissed as either irrelevant or mischievous.
Religious and tribal factors make population an extremely
sensitive political issue.
Governments have been pre-occupied by tasks aimed at
nation-building and economic development. The typical
African view at the 1974 Bucharest World Population
Conference was that "... ... economic progress and
foreign aid were more urgent needs than curbing of
population growth" (Population Reference Bureau,
undated).
Accumulating financial and economic difficulties during
recent years in many countries have diverted the energies
of policy-makers to the task of tackling urgent, short-
term issues. Longer-term concerns, including population
growth, have receded into the background.
New Policy Initiatives
A prerequisite for the strengthening of population policies is the
recognition by policy-makers and opinion-leaders in Africa that such moves are
in the national interest. It is not at all clear how such recognition will
come about and when. Past attempts by non-Africans to promote population
policies have not borne much fruit. Within Africa, the population issue is
not at the center of the stage. National leaders show little enthusiasm about
62 -
tackling this question and those few who have tried to do so regard the
population issue as a political liability. Building commitment for population
policies will not be easy. It will require not only a thorough grasp of the
economic and social aspects, not only the ability to project the case for
government intervention in a difficult area but also' the capacity to define
what is an acceptable intervention, taking account of the range within which
social and cultural change is feasible.
In many countries it may not be possible for leaders to visualize the
introduction of comprehensive population policies aîmed at reducing family
size. This is certainly the case in countries classified into categories lI &
III and even some countries placed in Category I. But even in countries
facing formidable socio-cultural barriers, it should be possible to define
some acceptable program to make a start, For example, governments may be able
to reinforce the traditional norm favoring child spacîng, as in Rwanda and
Tanzania. Many tribes favour sexual abstinence after childbirth to ensure
spacing between births. Page and Lestaeghe (1981) summarize findings of over
100 studies on postpartum-sexual abstinence and note that the usual duration
of such abstinence was over one year. Strong taboos and customs promoted thîs
restraintD but their hold is weakening gradually. Recent increases in
fertility in a number of Sub-Saharan countries can be partly ascribed to the
shortening of birth intervals, caused by shortening of traditional abstinence
and breast feeding, without compensating increase of contraceptiono In
Nigeria, for example, the age at marriage has risen significantly tending to
reduce fertility, but this is more than offset by the weakening of traditional
norms about child spacing (Lestaeghe et al. 1981)o In Ghana, a survey by the
National Food and Nutrition in 1961-62 found a decline in breast feeding
- 63 -
associated with urbanization. Gaisie (1981) analyzing World Fertility Survey
(WFS) pilot survey data from Ghana observed that differentials in the
postpartum variables are the major factors responsible for the regional
variations in fertility.
Given this emphasis on child-spacing in the traditional culture, it
should be possible to build a government program which reinforces abstinence
by contraception. At least such programs can check the drift towards higher
fertility accompanying the weakening of tribal sanctions. If it is possible
to lengthen average intervals between pregnancies, such programs could lower
fertility. More important, once family planning is accepted by a community it
can not only uphold norms regarding child spacing but also serve as an
instrument for avoiding more children than desired. The incidence of excess
fertility (defined in terms of private househo'ld or group values) can be quite
large at a time when infant and child mortality is falling sharply. This
incidence can be reduced by an informational effort aimed at increasing
awareness of participants in the family planning program about changes in
vital rates taking place in their community. Such awareness will cause
parents to revise downward their ideas about the number of pregnancies
required to achieve the desired family-size.
Countries in Categories I & II, which already have some kind of
family planning program, should consider the full-range of policy options
aimed at stimulating demand for contraception and at increasing the access of
the population in the reproductive age-group to contraceptive services. Not
much emphasis has been given so far to the demand side of the equation. This
neglect has proved to be very costly; it has meant that existing facilities
64 -
are not being used fully and that women who became acceptors at one time soon
dropped out of the system.
What is required is a deeper assessment of the base-lîne position
(than has been undertaken typically) before designing an operational
population policy. Such an assessment must identify both the factors that
make for high fertility in each community as well as the dynamic elements
trying to bring about social change. Is physical security a major concern?
What can be done to relieve anxiety on this score? Are women deprived of
income-earning opportunities? Do extension services, credit agencies and
cooperatives discriminate against women? Does the intra-famîly division of
labour impose an onerous burden on women. How does the land-tenure affect
women's sense of security? Do norms regarding family size differ by sex and
by generation? What kinds of individualD households , kinship groups and
social organizations are trying to break away from traditional attitudes0
What is the nature and extent of opposition to deviant behaviour? What are
the impediments to easy access to contraceptive supplies?
This kind of diagnosis will permît the designing of gcvernment
interventions responsive to the needs of the local situation0 Most family
planning programs today are linked to the health delivery system and they are
largely clinic-based. In many cases it may be desirable and practical to
supplement existing outlets wîth (î) communîty-based schemes, (ii) commercial
channels, (iii) activity of women's organizations and (iv) efforts of rural
development agencies. Similarly, most exîsting programs are wueak on extension
and promotion0 New instruments for propagating the family planning message
can be designed using local acceptors, traditional channels of communication
as well as nation-wide systems of non-formal education (adult lîteracy
- 65 -
campaigns, youth recreation programs), mass-media and the introduction of
family-life education in secondary schools and colleges.
Attempts on the part of African governments and foreign aid agencies
to promote rural development have not recognized the women's issue. The
neglect of research on traditional subsistence crops, the preeminent domain of
female farming, has continued until very recently. Extension services, credit
agencies and agricultural cooperatives have allowed much less access to women
farmers than to the men. Staudt (1979) describes the scene in the Kakamega
district in Kenya where the proportionate incidence of visits by extension
workers to women farmers was far lower than that to male farmers. Access to
credit and agricultural training displayed the same bias. The recent report
on the history of the International Development Association acknowledges that
the design of rural development projects have not displayed sufficient sensi-
tivity to these important aspects (IDA 1982). Govts. in Africa can adopt a
number of development policies to improve the socio-economic condition of
women. These policies are worthwhile from the standpoint of expanding
production and promoting equity; they may also indirectly reduce fertility, as
argued earlier in this paper. Very important in this context will be a
reorientation of agricultural policies aimed at increasing women's access to
(i) land, (ii) new production technology for food crops, (iii) basic skills
training (iv) credit and (v) cooperatives. This reorientation will not be eay
to bring about in the face of present attitudes and given the political weak-
ness of women. It will require a great deal of persistence and plenty of
resourcefulness. Women will need to be trained as extension workers, assis-
tant teachers and health auxilliaries. They will need to go to secondary
schools and institutions of higher learning in much larger numbers. They will
66 -
need to become professionals, technicians, civil servants and party offi-
cials. Annex Table 20 presents indices of male-female differentiais in
education, life expectancy, employment in professional jobs.
Population policies in Africa must be viewed very broadLy. The goal
is not simply to deliver contraceptives through the health network. What is
required is a transformation of production and social relationships and
through these changes a major revolution in values and attitudes that
determine desired family size.
Policies aimed at altering existing preferences regarding family size
are not acceptable in most countries in Africa, although they have been
applied successfully in Asia. For example, incentives might be provîded with
the purpose of changing the preference for family size--a kind of compensation
for foregone fertility. There can be a strong justification for such compen-
sation if the private (perceived) net benefit of having an extra child exceeds
the social net benefit. A scheme of financial incentives for households to
avoid pregnancy is especially suitable for a well-defined group of people if
the scheme can be efficiently administered. For example, such programs have
been introduced experimentally for tea estate workers in India (Ridker, 1971)o
Another important step is to provide disincentives for having many
children. This could include eliminating income-tax relief in cases of three
or more children, paid maternity leave up to the first two pregnancies only,
progressive increases in childbirth costs after the first two deliveries, and
loss of priority for public housing if family size exceeds a defined level.
But most people in Sub-Saharan countrîes live in rural areas and their access
to benefits and services from the government are limited. Wit'drawing these
services and benefits, therefore, would have little force. In the future,

- 67 -
some of these services are going to expand substantially, and a discriminating
policy to encourage fertility regulation will become feasible.
It is not easy to force the pace of history and yet Africa's economic
and social development requires the adoption and implementation of a broad-
based population policy.
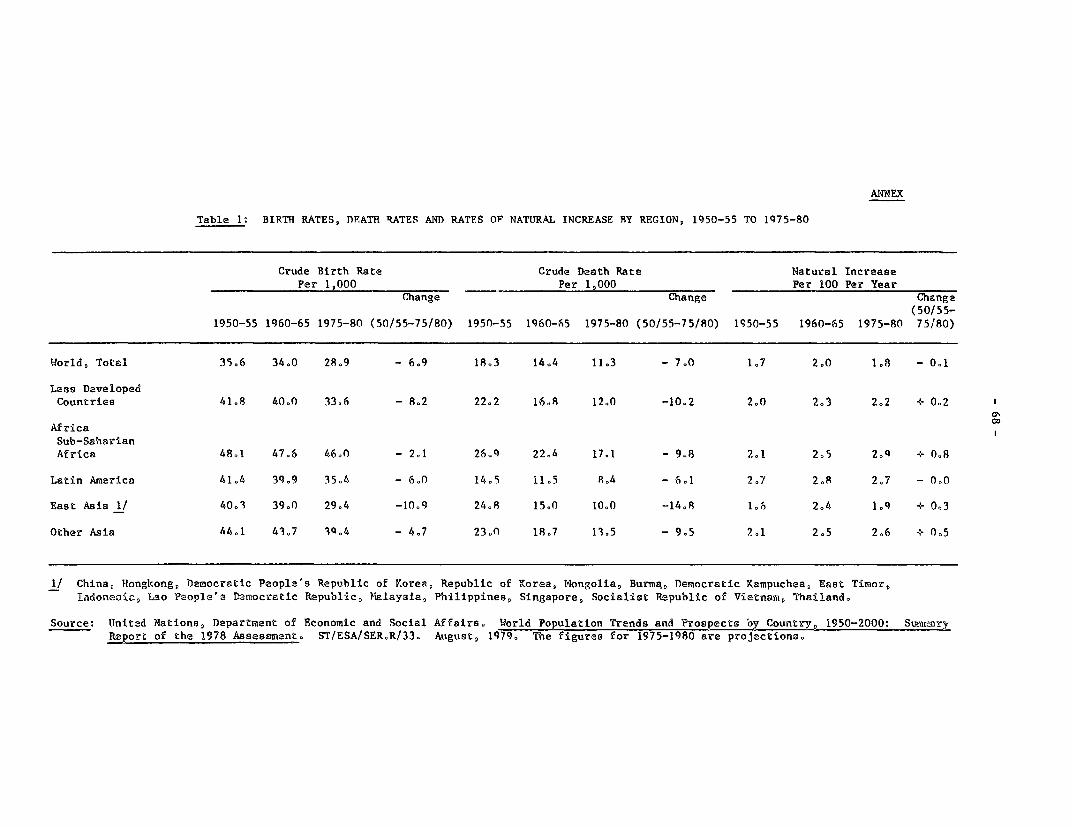
ANNEX
Table 1: BIRTH RATES, DEATn RATES AND RATES OF NATURAL INCREASE BY REGION, 1950-55 TO 1Q75-80
Crude Birth Rate Crude Death Rate Natural Increase
Per 1,000 Per 1,000 Per 100 Per Year
Change Change Change(50/55-
1950-55 1960-65 1975-80 (50/55-75/80) 1950-55 1960-65 1975-80 (50/55-75/80) 1950-55 1960-65 1975-80 75/80)
World, Total 35.6 34.0 28.9 - 6.9 18.3 14.4 11.3 - 7.0 1.7 2.0 108 - 01
Less DevelopedCountries 41.8 40.0 33.6 - 8.2 22.2 16.8 12.0 -10.2 2.0 2.3 2.2 + 0.2
Co
AfricaSub-SaharianAfrica 48.1 47.6 46.0 - 2.1 26.Q 22.4 17.1 - 9.8 2.1 2.5 20Q + 0.8
Latin America 41.4 39.9 35.4 - 6.0 14.5 1105 804 - 6.1 2.7 2.8 2.7 - 000
East Asia 1/ 40.3 39.0 29.4 -10.9 24.8 15.0 10.0 -14.8 1.6 2.4 109 + 0.3
Other Asia 44.1 4307 IQ.4 - 4.7 23.0 18.7 1305 - 9.5 201 2.5 2.6 + 0.5
1/ China, Rongkong, Democratic People's Republic of Korea, Republie of Korea, Mongolia, Burma, Temocratic Kampuchea, East Tîmor,
ladonnoi2, Lao People's D2mocratic R%public, Malay3ia, Philippines, Singapore, Socialist R%public of Vietnau, Thailand.
Source: UTnited Nations, Department of Economic and Social Affairs. World Population Trends and Prospects by Country, 1950-2000: Surnmary
Report of the 1978 Assessment, ST/ESA/SER.R/33. August, 1979, The figures for 1975-1980 are projections0
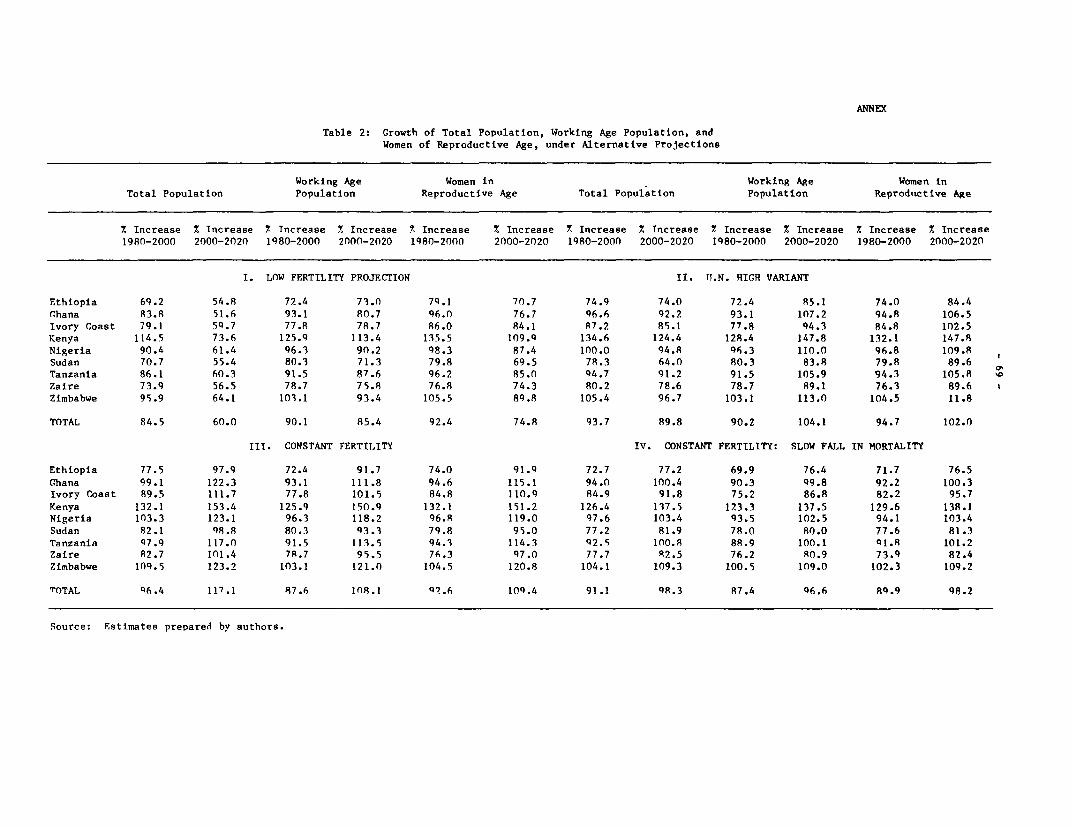
ANNEX
Table 2: Growth of Total Population, Working Age Population, andWomen of Reproductive Age, under Alternative Projections
Working Age Women in Working Age Women inTotal Population Population Reproductive Age Total Population Population Reproductive Age
2 Increase % Increase % Increase % Increase % Increase X Increase X Increase X Increase % Increase Z Increase % Increase % Increase1980-2000 2000-2020 1980-2000 2000-2020 1980-2000 2000-2020 1980-2000 2000-2020 1980-2000 2000-2020 1980-2000 2000-2020
I. LOW FERTILITY PROJFCTION Il. Il.N. RIGH VARIANT
Ethiopia 69.2 54.8 72.4 73.0 79.1 70.7 74.9 74.0 72.4 R5.1 74.0 84.4Chana R3.8 51.6 93.1 80.7 96.0 76.7 96.6 92.2 93.1 107.2 94.R 106.5Ivory Coast 79.1 5q.7 77.8 78.7 86.0 84.1 87.2 85.1 77.8 94.3 84.8 102.5Kenya 114.5 73.6 125.9 113.4 135.5 109.Q 134.6 124.4 128.4 147.8 132.1 147.8Nigeria 90.4 61.4 96.3 9n.2 98.3 87.4 100.0 44.8 9fi.3 110.0 96.8 109.8Sudan 70.7 55.4 80.3 71.3 79.8 69.5 78.3 64.0 80.3 83.8 79.8 89.6Tanzania 86.1 60.3 91.5 87.6 96.2 85.0 94.7 91.2 91.5 105.9 94.3 105.8 'oZaire 73.9 56.5 78.7 75.8 76.8 74.3 R0.2 78.6 78.7 89.1 76.3 89.6Zimbabwe 95.9 64.1 103.1 93.4 105.5 89.8 105.4 96.7 103.1 113.0 104.5 11.8
TOTAL 84.5 60.0 90.1 85.4 92.4 74.8 93.7 89.8 90.2 104.1 94.7 102.0
III. CONSTANT FERTILITY IV. CONSTANT FERTILITY: SLOW FALL IN MORTALITY
Ethiopia 77.5 97.9 72.4 91.7 74.0 91.9 72.7 77.2 69.9 76.4 71.7 76.5Chana 99.1 122.3 93.1 111.8 94.6 115.1 94.0 100.4 90.3 Q9.8 92.2 100.3Ivory Coast 89.5 111.7 77.8 101.5 84.8 110.9 84.9 91.8 75.2 86.8 82.2 95.7Kenya 132.1 153.4 125.9 150.9 132.1 151.2 126.4 117.5 123.3 137.5 129.6 138.1Nigeria 103.3 123.1 96.3 118.2 96.8 119.0 97.6 103.4 93.5 102.5 94.1 103.4Sudan 82.1 98.8 80.3 43.3 79.8 95.0 77.2 81.9 78.0 s0.0 77.6 81.3Tanzania 97.9 117.0 91.5 113.5 94.1 114.3 92.% 100.8 88.9 100.1 91.8 101.2Zaire 82.7 101.4 7R.7 95.5 76.3 47.0 77.7 82.5 76.2 80.9 73.9 82.4Zimbabwe 109.5 123.2 103.1 121.0 104.5 120.8 104.1 109.3 100.5 109.0 102.3 109.2
TOTAL 96.4 117.1 87.6 108.1 q2.6 109.4 91.1 98.3 87.4 96.6 89.9 48.2
Source: Estimates prepared by authors.
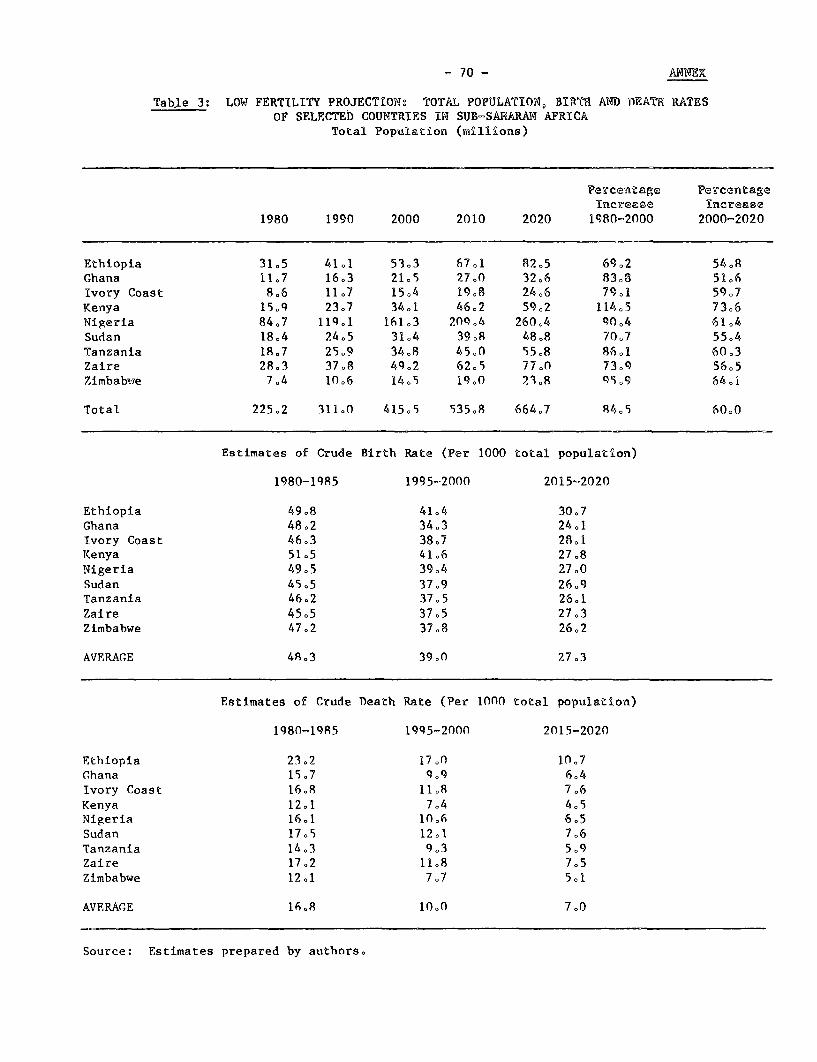
- 70 - A-E
Table 3: LOW FERTILITY PROJECTION: TOTAL P0PULATI0N, BIRTR AND DEATR RATESOF SELECTEb COUNTRIRS IN SUB-SARARAN AFRICA
Total Population (millions)
Fercentaga PercentagaInereaae Increase
1980 1990 2000 2010 2020 198MO2000 2000-2020
Ethiopia 31.5 41.1 5303 67.1 82.5 69,2 54.8Ghana 11.7 16.3 21.5 27.0 32.6 8308 51.6Ivory Coast 8.6 11.7 15.4 1908 24.6 79.1 5907Kenya 15.9 23.7 34.1 46.2 59.2 114.5 73.6Nigeria 84.7 11901 161.3 2n0q4 260,4 90O4 61.4Sudan 18.4 24.5 31.4 39.8 4808 70.7 55.4Tanzania 18,7 25.9 3408 45.0 5508 86f1 60.3Zaire 28,3 37.8 49,2 62.5 77.0 73.Q 56.5Zimbabue 7.4 10.6 14.5 19.0 2308 Q5O9 64.1
Total 225o2 311.0 415.5 535o8 664,7 84,5 60.0
Estimates of Crude Birth Rate (Per 1000 total population)
1980-1985 1995-2000 2015-2020
Ethiopia 49.8 41.4 30.7Ghana 48.2 34.3 24.1Ivory Coast 46.3 38.7 2801Kenya 51.5 41.6 27.8Nigeria 49.5 39.4 27.0Sudan 4505 37.9 26h9Tanzania 46.2 37.5 26,1Zaire 4505 37.5 27.3Zimbabwe 47.2 3708 26.2
AVERAGE 48,3 39.0 27.3
Estimates of Crude Death Rate (Per 1000 total population)
1980-1985 1995-2000 2015-2020
Ethiopia 23o2 17,0 10o7Ghana 157 9,9 6.4Ivory Coast 16o8 118 7o6Kenya 12.1 7.4 4,5Nigeria 16.1 1)6 6.5Sudan 1705 12.1 7.6Tanzania 14.3 9.3 5.9Zaire 17.2 1108 7.5Zimbabwe 12,1 7.7 5,1
AVERAGE 1608 10.0 7,0
Source: Estimates prepared by authors,
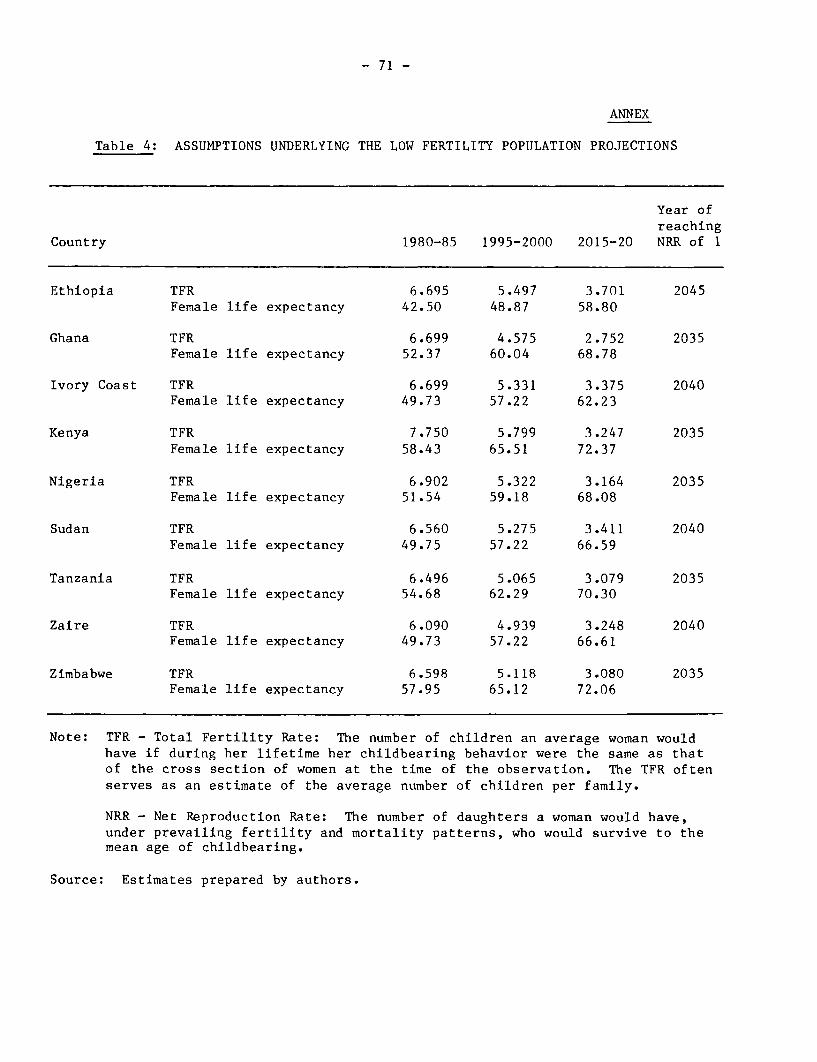
- 71 -
ANNEX
Table 4: ASSUMPTIONS UNDERLYING THE LOW FERTILITY POPULATION PROJECTIONS
Year ofreaching
Country 1980-85 1995-2000 2015-20 NRR of 1
Ethiopia TFR 6.695 5.497 3.701 2045Female life expectancy 42.50 48.87 58.80
Ghana TFR 6.699 4.575 2.752 2035Female life expectancy 52.37 60.04 68.78
Ivory Coast TFR 6.699 5.331 3.375 2040Female life expectancy 49.73 57.22 62.23
Kenya TFR 7.750 5.799 3.247 2035Female life expectancy 58.43 65.51 72.37
Nigeria TFR 6.902 5.322 3.164 2035Female life expectancy 51.54 59.18 68.08
Sudan TFR 6.560 5.275 3.411 2040Female life expectancy 49.75 57.22 66.59
Tanzania TFR 6.496 5.065 3.079 2035Female life expectancy 54.68 62.29 70.30
Zaire TFR 6.090 4.939 3.248 2040Female life expectancy 49.73 57.22 66.61
Zimbabwe TFR 6.598 5.118 3.080 2035Female life expectancy 57.95 65.12 72.06
Note: TFR - Total Fertility Rate: The number of children an average woman wouldhave if during her lifetime her childbearing behavior were the same as thatof the cross section of women at the time of the observation. The TFR oftenserves as an estimate of the average number of children per family.
NRR - Net Reproduction Rate: The number of daughters a woman would have,under prevailing fertility and mortality patterns, who would survive to themean age of childbearing.
Source: Estimates prepared by authors.
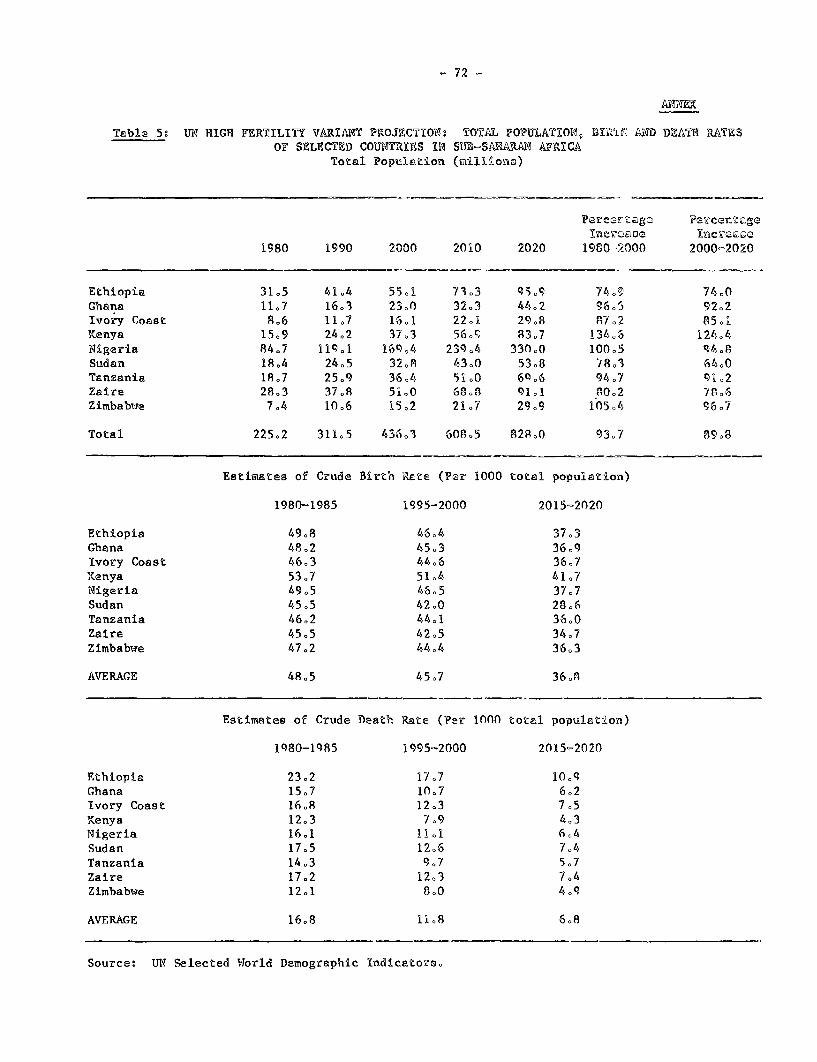
- 72 -
Table 50 UN HIGR FERTILITY VARIANT PROJECTION TÏOTAL POPULATI0HD B1 AND DZ1ATR RATZSOF SELECTED COUWTRXES IN SU-SA11RA- AFRICA
Total Population (ii1lîonc)
Pre~rt2s£ag PeocentaInc)C!aSc Increase
1980 1990 2300 20i0 2020 1980 2000 20002020
Ethiopia 31.5 41.4 5501 7Y33 9509 74.9 74.0Ghana 11.7 1603 23.0 3203 44.2 9606 92.2Ivory Coast 8.6 11.7 16,1 2201 29,8 8702 8501Kenya 15.9 24.2 37,3 5609" 83.7 13406 12404Nigeria 84J7 119,1 16904 23904 330.0 10005 9408Sudan 18,4 24.5 3208 43.0 53.8 */8,3 64.0Tanzania 18.7 25.9 36,4 51o0 60,6 9407 91o2Zaire 28.3 37o8 5io0 68.8 91.1 80.2 7806Zimbabwe 7.4 10.6 15,2 2107 29.9 105.4 9607
Total 225,2 311,5 43603 60805 828.0 9307 89.8
Estimates of Crude Birth Rate (Per 1000 total population)
1980-1985 1995-2000 2015-2020
Ethiopia 49.8 46.4 37.3Ghana 48.2 4503 36.9Ivory Coast 46.3 44.6 36.7Kenya 5307 51.4 41.7Nigeria 49.5 46.5 37,7Sudan 45.5 42.0 28.6Tanzania 46.2 44.1 36,0Zaire 45.5 42.5 34.7Zimbabwe 47.2 44.4 36,3
AVERAGE 48,5 45.7 3608
Estimates of Crude neath Rate (Per 1000 total population)
1980-19R5 1995-2000 2015-2020
Ethiopia 23,2 17,7 10,9Ghana 15,7 10,7 6,2Ivory Coast 16.8 12,3 7.5Kenya 12,3 7.9 4,3Nigeria 16,1 11.1 6,4Sudan 17,5 12,6 7,4Tanzanîa 14.3 9.7 5,7Zaire 17,2 1203 7.4Zimbabwe 12,1 8,0 4.9
AVERAGE 16.8 1108 6.8
Source: UN Selected World Demographic Indicators.
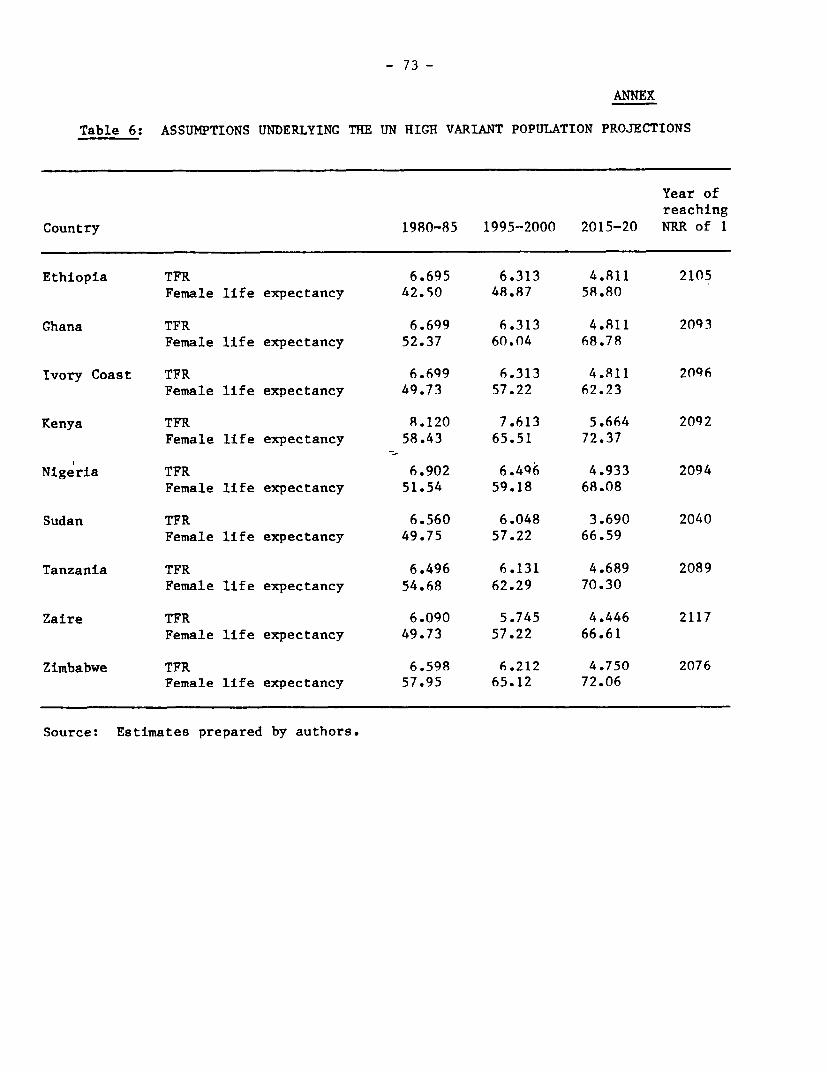
- 73 -
ANNEX
Table 6: ASSUMPTIONS UNDERLYINC TRE UN RIGH VARIANT POPULATION PROJECTIONS
Year ofreaching
Country 1980-85 1995-2000 2015-20 NRR of 1
Ethiopia TFR 6.695 6.313 4.811 2105Female life expectancy 42.50 48.87 58.80
Ghana TFR 6.699 6.313 4.811 2093Female life expectancy 52.37 60.04 68.78
Ivory Coast TFR 6.699 6.313 4.811 2096Female life expectancy 49.73 57.22 62.23
Kenya TFR 8.120 7.613 5.664 2092Female life expectancy 58.43 65.51 72.37
Nigeria TFR 6.902 6.496 4.933 2094Female life expectancy 51.54 59.18 68.08
Sudan TFR 6.560 6.048 3.690 2040Female life expectancy 49.75 57.22 66.59
Tanzania TFR 6.496 6.131 4.689 2089Female life expectancy 54.68 62.29 70.30
Zaire TFR 6.090 5.745 4.446 2117Female life expectancy 49.73 57.22 66.61
Zimbabwe TFR 6.598 6.212 4.750 2076Female life expectancy 57.95 65.12 72.06
Source: Estimates prepared by authors.
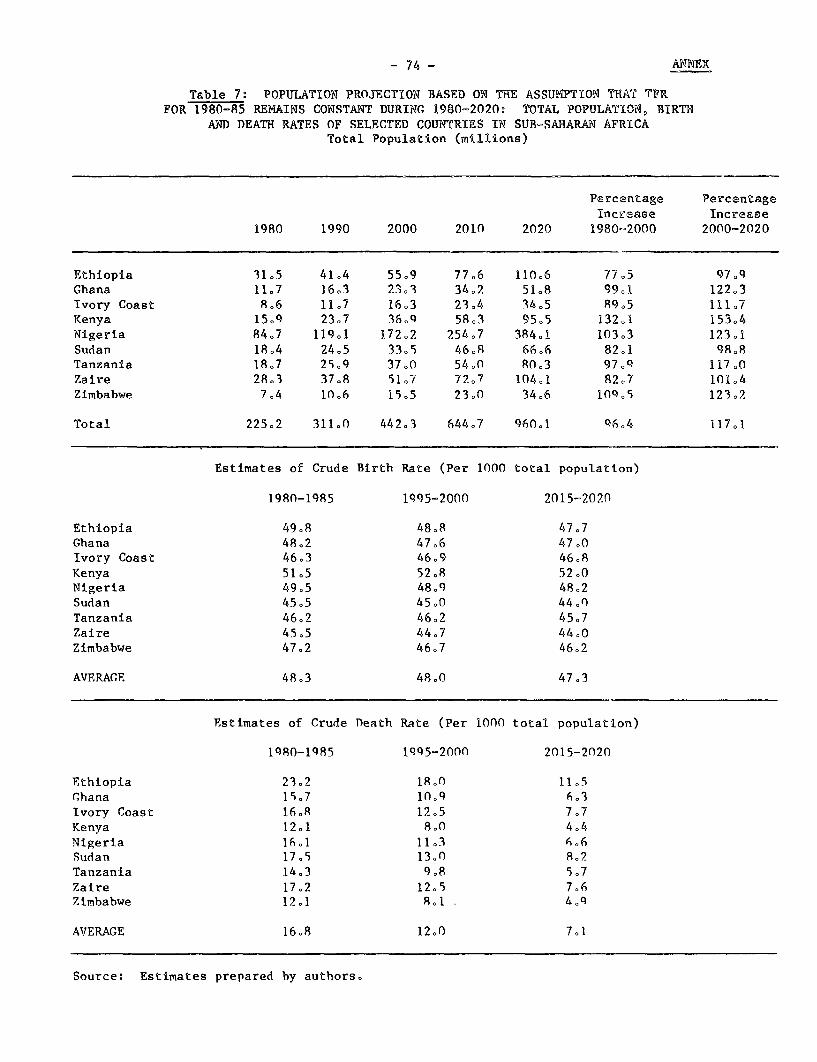
- 74 - ANNEX
Table 7: POPULATION PROJECTION BASED ON THE ASSUMPTION TRKA TFRFOR 1980-85 REMAINS CONSTANT DURINTG 19802020 TOTAL POPULATION, BIRTH
AND DEATH RATES OF SELECTED COUNTRIES IN SUB-SARARAN AFRICATotal Population (millions)
Percentage PercentageIncrease Increase
1980 1990 2000 2010 2020 1980--2000 2000-2020
Ethiopia 3105 41.4 55.9 77,6 110,6 7705 97,9Ghana 11.7 16.3 2303 34.2 5108 9901 122,3Ivory Coast 8,6 11.7 16,3 2304 3405 89.5 11107Kenya 15,9 23,7 3609 5803 95.5 132.1 153.4Nigeria 8407 11901 172.2 254.7 384,1 103.3 123,1Sudan 18.4 24.5 330S 4608 6606 82,1 9808Tanzania 18,7 2%,9 37,0 54.0 80o3 97.9 117.0Zaire 28.3 37.8 51.7 72.7 10401 82.7 101.4Zimbabwe 704 10.6 15.5 23.0 34,6 iOq.5 12302
Total 225.2 311.0 442.3 644.7 96001 9604 117.1
Estimates of Crude Birth Rate (Per 1000 total population)
1980-1985 l95-2000 2015-2020
Ethiopia 49.8 48.8 47.7Ghana 48.2 47.6 47.0Ivory Coast 46.3 46.9 46.8Kenya 5105 52.8 52.0Nigeria 49.5 48.9 48,2Sudan 4505 45°0 44.0Tanzania 46.2 46,2 45.7Zaire 45,5 44.7 44.0Zimbabwe 47.2 46,7 46,2
AVERAGE 48,3 48.0 47.3
Estimates of Crude Death Rate (Per 1000 total populatlon)
1480-1985 1995-2000 2015-2020
Ethiopia 23,2 18.0 1105rhana 15.7 10,9 603Ivory Coast 16,8 12,5 7.7Kenya 12,1 8,0 4,4Nigeria 16.1 11,3 6o6Sudan 17,5 13,0 8,2Tanzania 14.3 9,8 5,7Zaire 17,2 12,5 7.6Zimbabwe 12,1 8,1 4,q
AVERAGE 16.8 12,0 7,1
Source: Estimates prepared by authors.
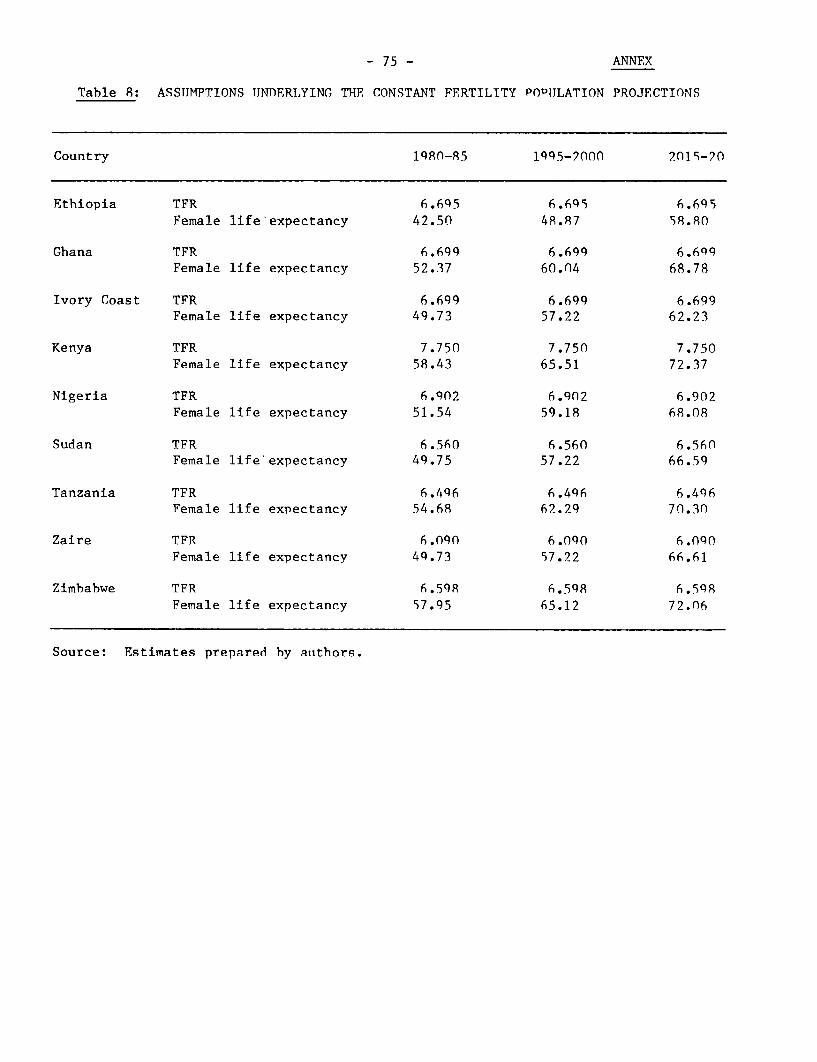
_ 75 - ANNEX
Table 8: ASSIJMPTIONS UNNDERLYING THE CONSTANT FERTILITY POPIJLATION PROJECTIONS
Country 1980-85 1995-2000 2015-20
Ethiopia TFR 6.695 6.695 6.695Female life'expectancy 42.50 48.87 58.80
Ghana TFR 6.6hs 6.699 6.6qsFemale life expectancy 52.37 60.04 68.78
Ivory Coast TFR 6.699 6.699 6.699Female life expectancy 49.73 57.22 62.23
Kenya TFR 7.750 7.750 7.750Female life expectancy 58.43 65.51 72.37
Nigeria TFR 6.902 6.902 6.902Female life expectancy 51.54 59.18 68.08
Sudan TFR 6.560 6.560 6.560Female life'expectancy 49.75 57.22 66.59
Tanzania TFR 6.496 6.496 6.496Female life expectancy 54.689 62.29 70.30
Zaire TFR 6.0s0 6.090 6.0s0Female life expectancy 49.73 57.22 66.61
Zimbabwe TFR 6.598 6.598 6.598Female life expectancy 57.95 65.12 72.06
Source: Estimates prepared by authors.
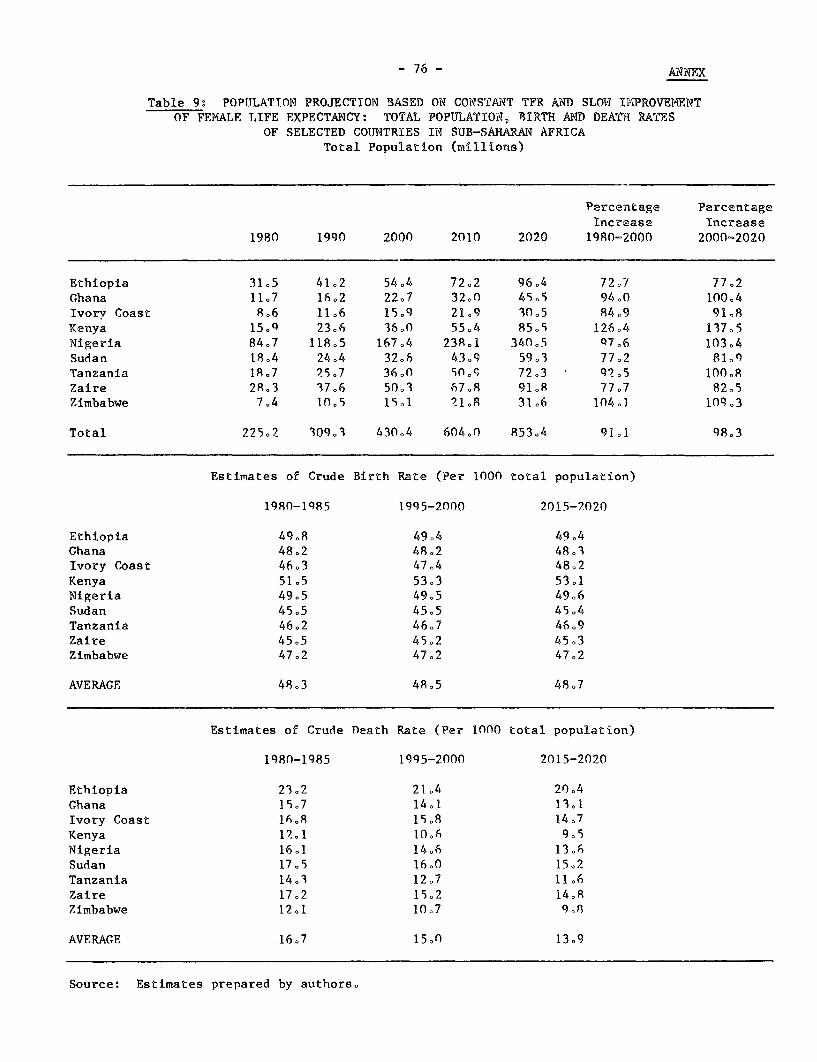
- 76 - ANNEX
Table 9: POPIJLATION PROJECTION 3ASED ON CONSTANT TFR AND SLOW IMPROVEMENTOF FEMALE LIFE EXPECTANCY: TOTAL POPULATION, BIRTH AND DEATN RATES
OF SELECTED COUNTRIES IN SUB-SAHARAN AFRICATotal Population (millions)
Percentage PercentageIncrease Increase
1980 1990 2000 2010 2020 1980-2000 2000-2020
Ethiopia 31.5 41.2 54.4 72.2 96.4 72.7 77.2Ghana 11.7 16.2 22.7 32.0 45.5 94.0 1004Ivorv Coast 8R6 116 15.9 21.9 30.5 8409 9108Kenya 150. 23.6 36.0 55.4 8505 126.4 13705Nigeria 84.7 118.5 167.4 23Ro1 340.5 Q706 103.4Sudan 18.4 24.4 3206 43.q 5903 77.2 8109Tanzania 18.7 2507 36.0 50O9 72.3 4205 10008Zaire 28R3 3706 50.3 67.8 91.8 77.7 8205Zimbabwe 7.4 10.5 1501 2108 31.6 104.1 109.3
Total 225.2 309.3 430.4 604.0 853.4 91.1 98.3
Estimates of Crude Birth Rate (Per 1000 total population)
1980-1985 1995-2000 2015-2020
Ethiopia 4908 49.4 49.4Ghana 48.2 48R2 48.3Ivory Coast 46f3 47.4 48.2Kenya 5105 53.3 53.1Nigeria 49.5 49.5 49.6Sudan 45.5 45.5 45.4Tanzania 46.2 46.7 46.9Zaire 45.5 452 45.3Zimbabwe 47.2 47.2 47.2
AVERAGE 48R3 48.5 48R7
Estimates of Crude Death Rate (Per 1000 total population)
1980-1985 1995-2000 2015-2020
Ethiopia 2302 21.4 20.4Ghana 157 14.1 1301Ivory Coast 1e8 15.8 14.7Kenya 1201 10.6 9.5Nigeria 16.1 14.6 1306Sudan 17.5 16.0 15.2Tanzania 14.3 12.7 1106Zaire 17.2 152 14.8Zimbabwe 1201 10.7 908
AVERAGE 167 15.0 13.9
Source: Estimates prepared by authors.
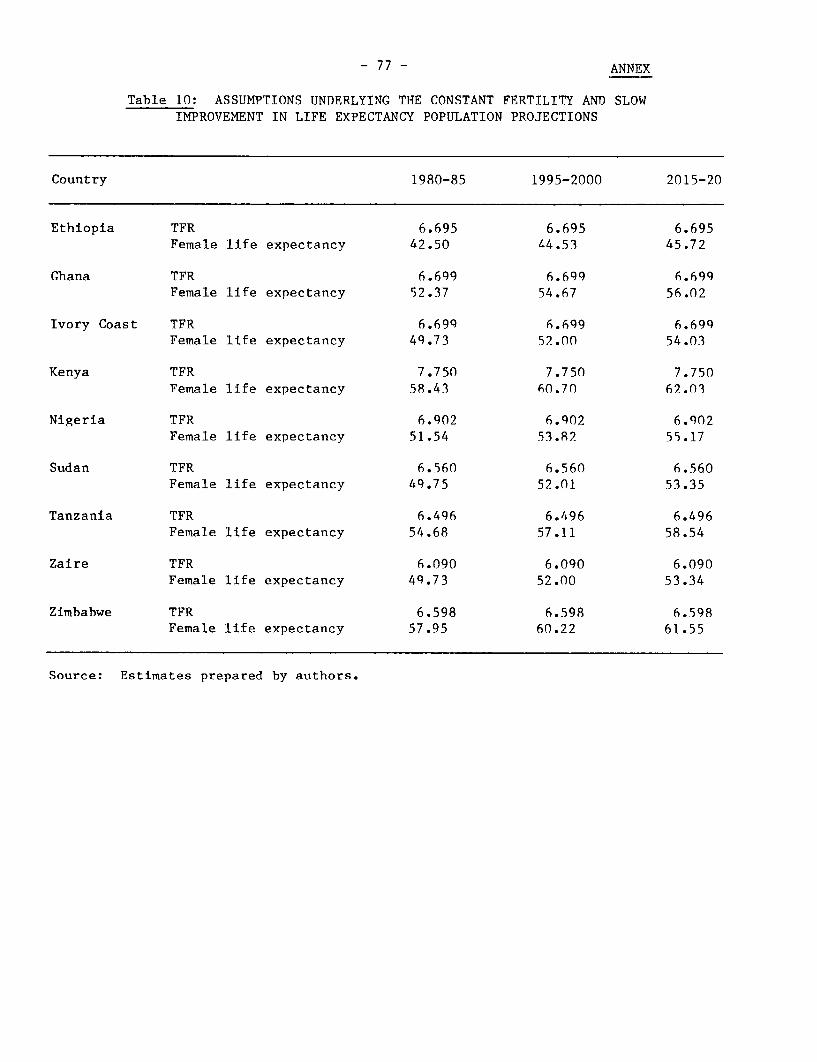
- 77 - ANNEX
Table 10: ASSUMPTIONS UNDERLYING THE CONSTANT FERTILITY AND SLOWIMPROVEMENT IN LIFE EXPECTANCY POPULATION PROJECTIONS
Country 1980-85 1995-2000 2015-20
Ethiopia TFR 6.695 6.695 6.695Female life expectancy 42.50 44.53 45.72
Ghana TFR 6.699 6.699 6.699Female life expectancy 52.37 54.67 56.02
Ivory Coast TFR 6.69q 6.699 6.699Female life expectancy 49.73 52.00 54.03
Kenya TFR 7.750 7.750 7.750Female life expectancy 58.43 60.70 62.03
Nigeria TFR 6.902 6.902 6.902Female life expectancy 51.54 53.82 55.17
Sudan TFR 6.560 6.560 6.560Female life expectancy 49.75 52.01 53.35
Tanzania TFR 6.496 6.496 6.496Female life expectancy 54.68 57.11 58.54
Zaire TFR 6.090 6.090 6.090Female life expectancy 49.73 52.00 53.34
Zimbabwe TFR 6.598 6.598 6.598Female life expectancy 57.95 60.22 61.55
Source: Estimates prepared by authors.
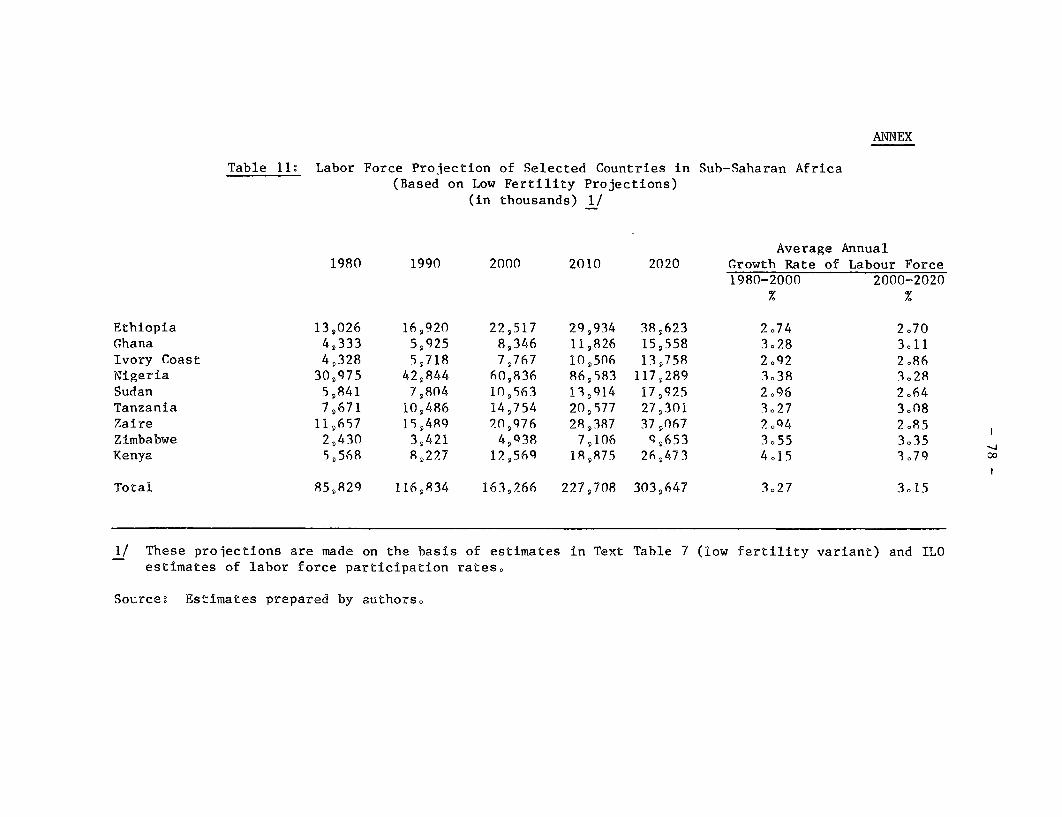
ANNEX
Table 1 1: Labor Force Projection of Selected Countries in Sub-Saharan Africa(Based on Low Fertility Projections)
(in thousands) 1/
Average Annual1980 1990 2000 2010 2020 Growth Rate of Labour Force
1980-2000 2000-2020
Ethîopia 13,026 16,920 22,517 29,934 38,623 2.74 2.70Ghana 4s333 5,925 8,346 11,826 15,558 3.28 3.11Ivory Coast 49328 5,718 7,767 10,506 13,758 2.92 2.86Nigeria 30D975 429844 f60,836 86,583 117S289 3.38 3.28Sudan 5,841 7,804 10,563 139I4 17,925 2.96 2.64Tanzania 7,671 10486 14,754 2OP577 27,301 3.27 3.08Zaire 11,657 15g489 20,976 28,387 37,067 2?q4 2.85Zimbabwe 2,430 3,421 4,q38 7,106 q9653 3.55 3.35Kenya 5g,568 89227 12,569 1%8R75 26f473 4.15 MQ7q
Total 85,829 11i6,834 163?,266 227,708 303,647 3.27 3.15
1/ These projections are made on the basis of estimates in Text Table 7 (low fertility variant) and ILOestimates of labor force participation rates.
Source: Estimates prepared by authors.
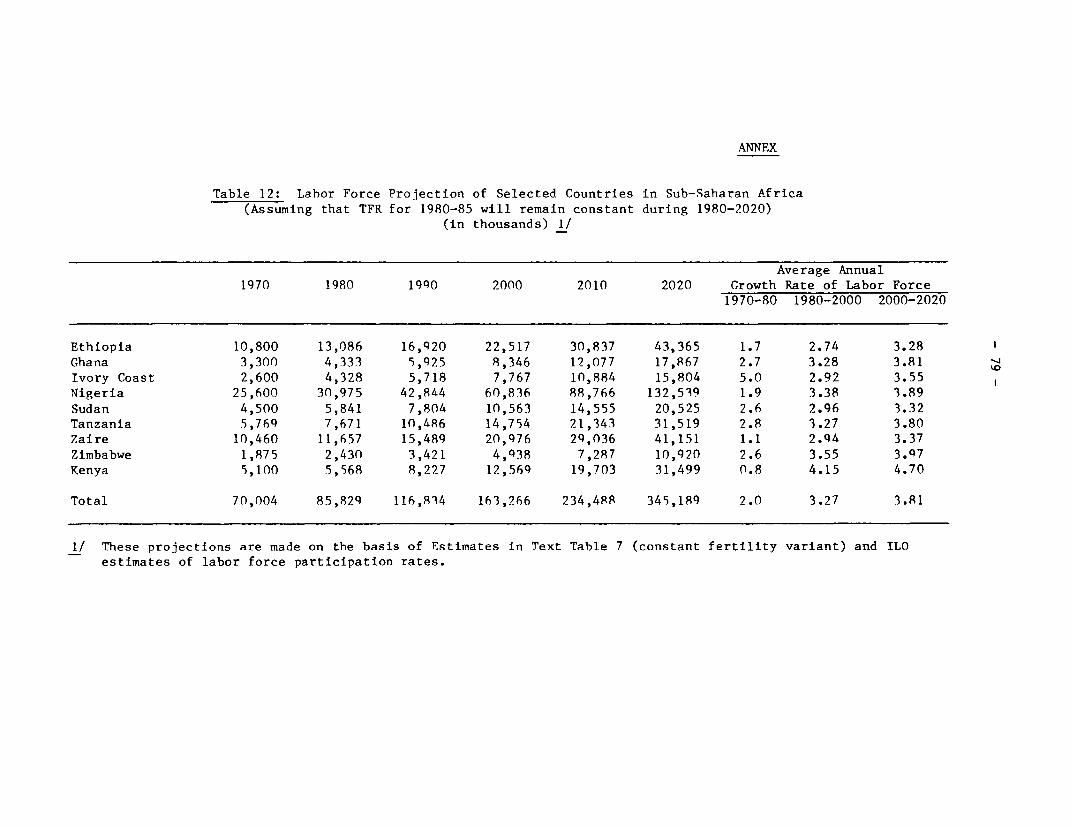
ANNEX
Table 12: Lahor Force Projection of Selected Countries in Sub-Saharan Africa(Assuming that TFR for 1980-85 will remain constant during 1980-2020)
(in thousands) 1/
Average Annual1970 1980 1990 2000 2010 2020 Growth Rate of Labor Force
1970-80 1980-2000 2000-2020
Ethiopia 10,800 13,086 16,q20 22,517 30,837 43,365 1.7 2.74 3.28Ghana 3,300 4,333 5,925 8,346 12,077 17,867 2.7 3.28 3.81Ivory Coast 2,600 4,328 5,718 7,767 10,884 15,804 5.0 2.92 3.55Nigeria 25,600 30,975 42,844 60,836 88,766 132,519 1.9 3.38 3.89Sudan 4,500 5,841 7,804 10,563 14,555 20,525 2.6 2.96 3.32Tanzania 5,764 7,671 10,486 14,754 21,343 31,519 2.8 3.27 3.80Zaire 10,460 11,657 15,489 20,976 24,036 41,151 1.1 2.94 3.37Zimbabwe 1,875 2,430 3,421 4,938 7,287 10,920 2.6 3.55 3.Q7Kenya 5,100 5,568 8,227 12,564 19,703 31,499 0.8 4.15 4.70
Total 70,004 85,829 116,834 163,266 234,498 345,189 2.0 3.27 3.81
I/ These projections are made on the basis of Estimates in Text Table 7 (constant fertility variant) and ILOestimates of labor force participation rates.
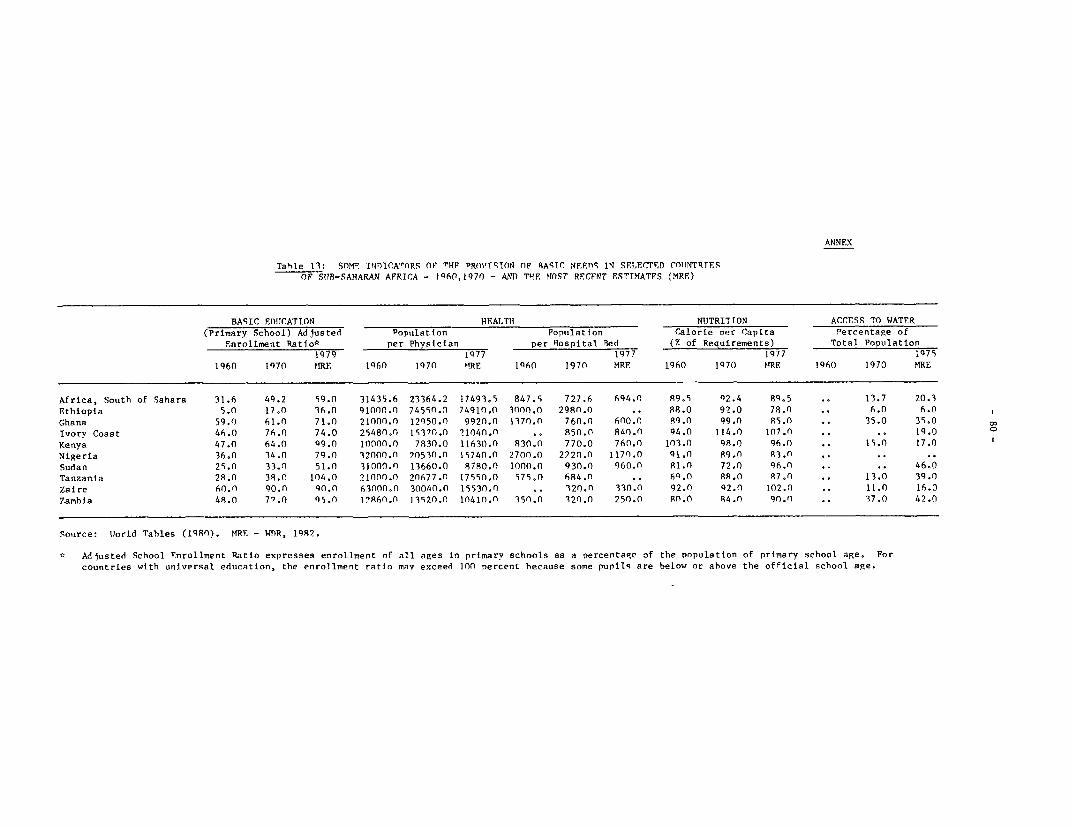
ANNEX
Tahie 13: SOM, INTUICA"ORS OPF "HF PROVSTqION nF 8AI5C NEFnS IN SE.LECTED COTINTRIESOP StlB-SAHARAN AFRICA - 1960,1970 - AND) THE MOST RECENT ESTIMATFS (!RE)
BASI(C El)tCATION HEALTH NUTRITION ACCESS TO WATER(Primary School) Adjusted Populatton Popuilation Calorie per Capita Percentage of
Enrollment Ratio* per Physician per Hospital Bed (7 of Requirements) Total Population1979 1Q77 1977 1977 1Q75
1960 1970 NRE 1960 1970 'iRE 14h6 1970 MRF. 1960 1970 MRE 1960 1970 MRE
Africa, South of Sahara 31.6 49.2 S9.0 31435.6 23364.2 17493.5 847.S 727.6 694.0 89.5 42.4 89.5 .. 13.7 20.3Ethiopia 5.0 17.0 36.0 91000.0 745ss.0 74910.0 3000.0 298n.0 .. 88.0 97.0 78.0 .. 6.0 6.0Ghana 59.0 61.0 71.0 21000.n 12950.0 9920.0 1370.0 760.0 600.0 89.0 99.n 85.0 .. 35.0 35.0 oIvory Coast 46.0 76.0 74.0 25480.0 15370.0 21040.0 850.0 840.0 94.0 114.0 107.0 .. .. 19.0 OKenya 47.0 64.0 99.0 10000.0 7830.0 11630.( 830.0 770.0 760.0 1(3.0 98.0 96.0 .. IS.( 17.0Nigeria 36.0 34.0 79.0 12000.n 20530.0 15740.0 2700.0 2722n. 1170.0 91.0 89.0 83.0Sudan 29.0 33.n 51.0 31000.0 13660.0 8780.0 1000.0 930.0 960.0 81.0 72.0 96.0 .. .. 46.0Tanzania 28.0 38.0 104.0 21000.0 20677.0 17550.n S75.0 684.n .. 69.0 88.0 87.0 .. 13.0 39.0Zaire 60.n 90.0 90.0 63non.0 30040.0 15530.0 .. 320.0 330.0 92.0 92.0 102.0 .. 11.0 16.0Zanhia 48.0 79.0 Q5.0 1?860.n 135220. 1041n.0 350.0 120.0 250.0 80.0 84.0 90.0 .. 37.0 42.0
Source: Jlorid Tables (1980). MRF. - WOR, 1982.
' Adjusted School Enrollment Ratio expresses enrollment of all ages in primarv schools as a percentage of the population of primary school age. Forcountries with universal education, the enrollment ratio mav exceed 100 percent hecause some pupile are below or ahove the official school age.
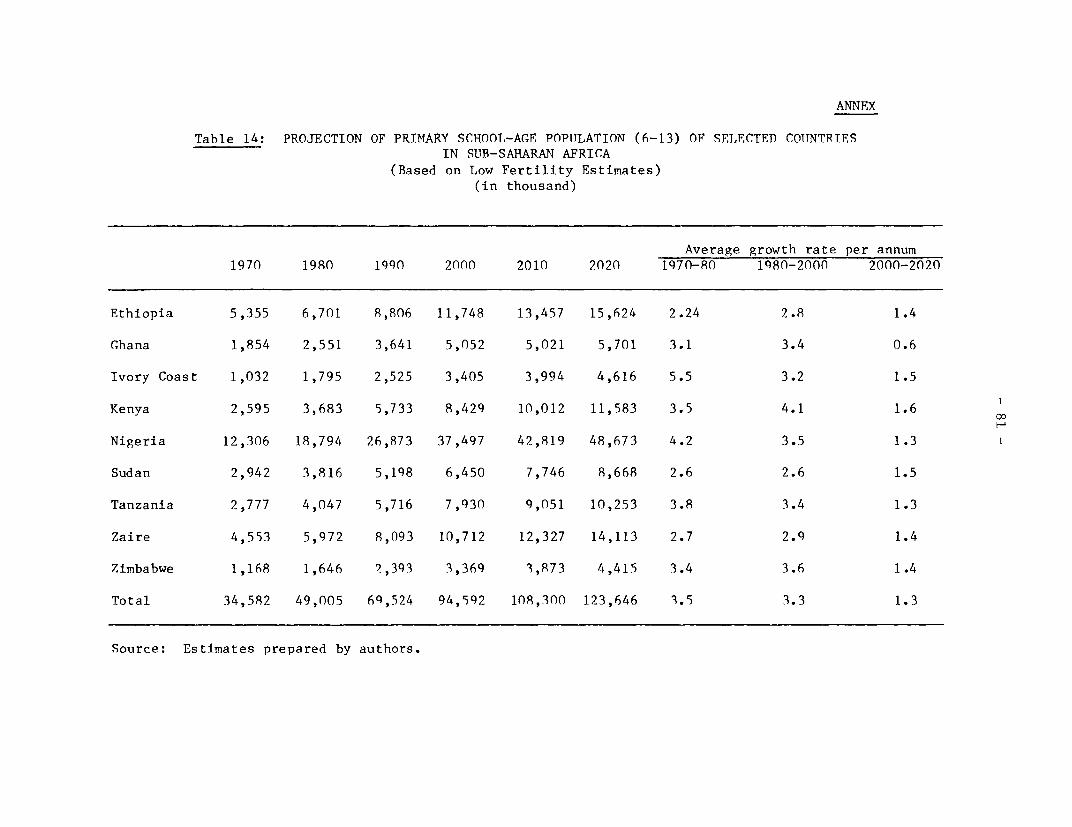
ANNEX
Table 14: PROJECTION OF PRIMARY SCHOOL-AGE POPIJLATION (6-13) OF SELECTED COTJNTRIESIN SUB-SARARAN AFRICA
(Based on Low Fertility Estimates)(in thousand)
Average growth rate per annum1970 1980 1990 2000 2010 2020 170-80 19S0-2000 2000-2020
Ethiopia 5,355 6,701 8,806 11,748 13,457 15,624 2.24 2.8 1.4
Ghana 1,854 2,551 3,641 5,052 5,021 5,701 3.1 3.4 0.6
Ivory Coast 1,032 1,795 2,525 3,405 3,994 4,616 5.5 3.2 1.5
Kenya 2,595 3,683 5,733 8,429 10,012 11,583 3.5 4.1 1.6
Nigeria 12,306 18,794 26,873 37,497 42,819 48,673 4.2 3.5 1.3
Sudan 2,942 3,816 5,198 6,450 7,746 8,668 2.6 2.6 1.5
Tanzania 2,777 4,047 5,716 7,930 9,051 10,253 3.8 3.4 1.3
Zaire 4,553 5,972 8,093 10,712 12,327 14,113 2.7 2.9 1.4
Zimbabwe 1,168 1,646 2,393 3,369 3,R73 4,415 3.4 3.6 1.4
Total 34,582 49,005 69,524 94,592 108e,300 123,646 3.5 3.3 1.3
Source: Estimates prepared by authors.
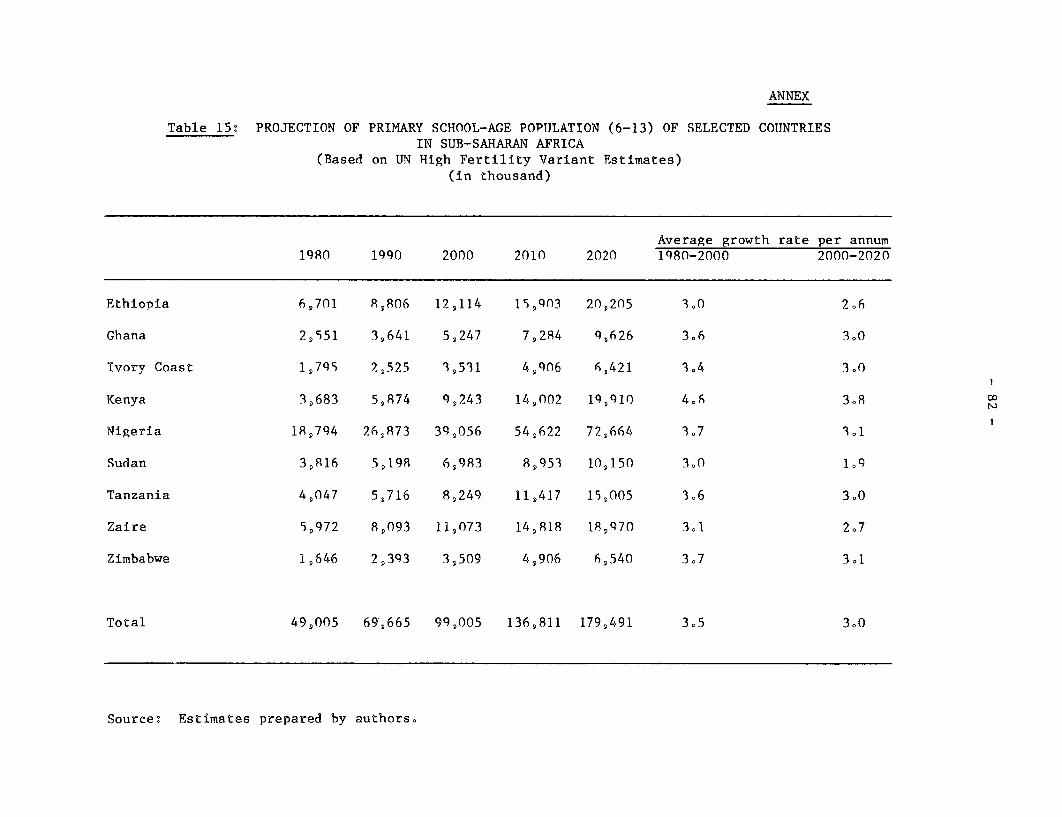
ANNEX
Table 15: PROJECTION OF PRIMARY SCHOOL-AGE POPTJLATION (6-13) OF SELECTED COUNTRIESIN SUB-SARARAN AFRICA
(Based on UN High Fertility Variant Estimates)(in thousand)
Average growth rate per annum19F0 1990 2000 2010 2020 1980-2000 2000-2020
Ethiopia 6,701 8,806 124114 15,903 20,205 3.0 2.6
Ghana 2,551 3,641 5,247 7,284 Q,626 306 3.0
Ivory Coast 1,795 2,525 39531 4,906 6,421 3.4 3.0
Kenya 3,683 5,974 9,243 14,002 1Q9,IO 4910 38A
Nigeria 18,794 26,873 39,056 54,622 72,664 3.7 3.1
Sudan 36916 5498 6983 8,953 10,150 3.0
Tanzania 4,047 5,716 8,249 11,417 15,005 306 3.0
Zaire 5,972 8,093 11,073 14,818 18,970 3.1 207
Zimbabwe 1,646 2,393 3,509 4,906 6,540 307 3.1
Total 49,005 69,665 99,005 136,811 179,491 3.5 3.0
Source: Estîmates prepared by authors.
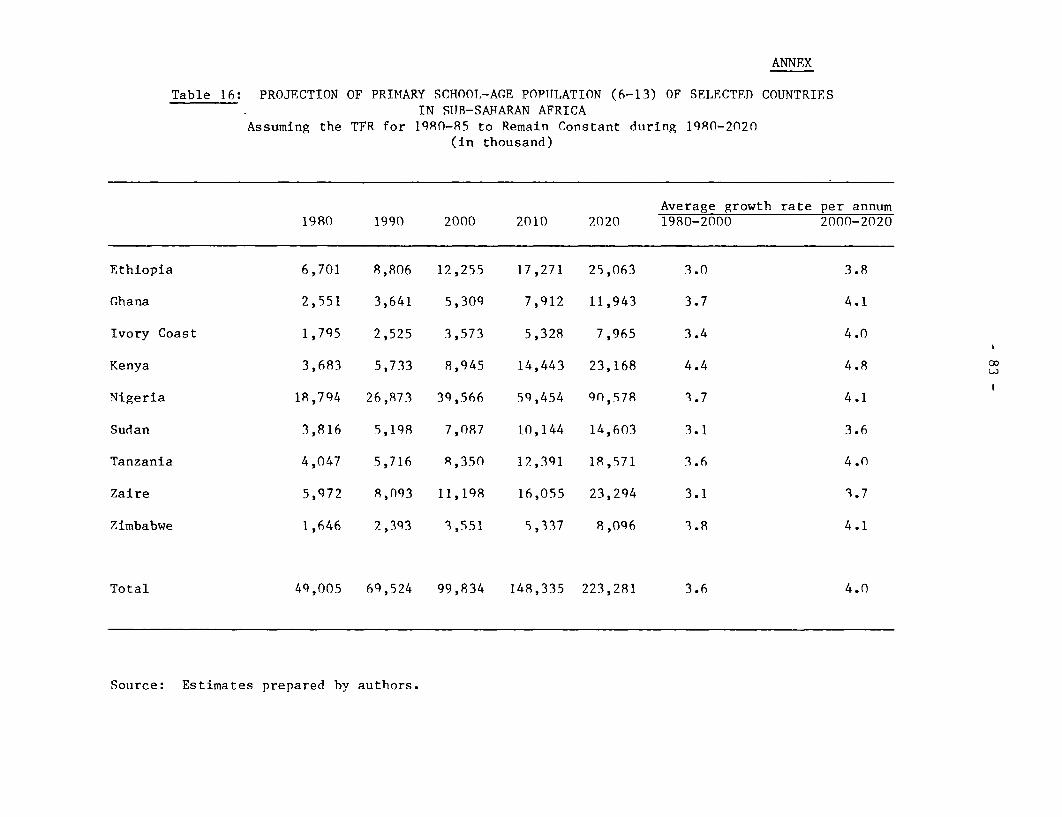
ANNEX
Table 16: PROJECTION OF PRIMARY SCHOOL-AGE POPTuLATION (6-13) OF SELECTED COUNTRIESIN SIJB-SAIARAN AFRICA
Assuming the TFR for 1980-85 to Remain Constant during 1980-2020(in thousand)
Average growth rate per annum1980 1990 2000 2010 2020 1980-2000 2000-2020
Ethiopia 6,701 8,806 12,255 17,271 25,063 3.0 3.8
Ghana 2,551 3,641 5,309 7,912 11,943 3.7 4.1
Ivory Coast 1,795 2,525 3,573 5,328 7,965 3.4 4.0
Kenya 3,683 5,733 8,945 14,443 23,168 4.4 4.8
Nigeria 18,794 26,873 39,566 59,454 90,578 3.7 4.1
Sudan 3,816 5,198 7,087 10,144 14,603 3.1 3.6
Tanzania 4,047 5,716 8,350 12,391 18,571 3.6 4.0
Zaire 5,972 8,093 11,198 16,055 23,294 3.1 3.7
Zimbabwe 1,646 2,393 3,551 5,337 8,096 3.8 4.1
Total 49,005 69,524 99,834 148,335 223,281 3.6 4.0
Source: Estimates prepared by authors.
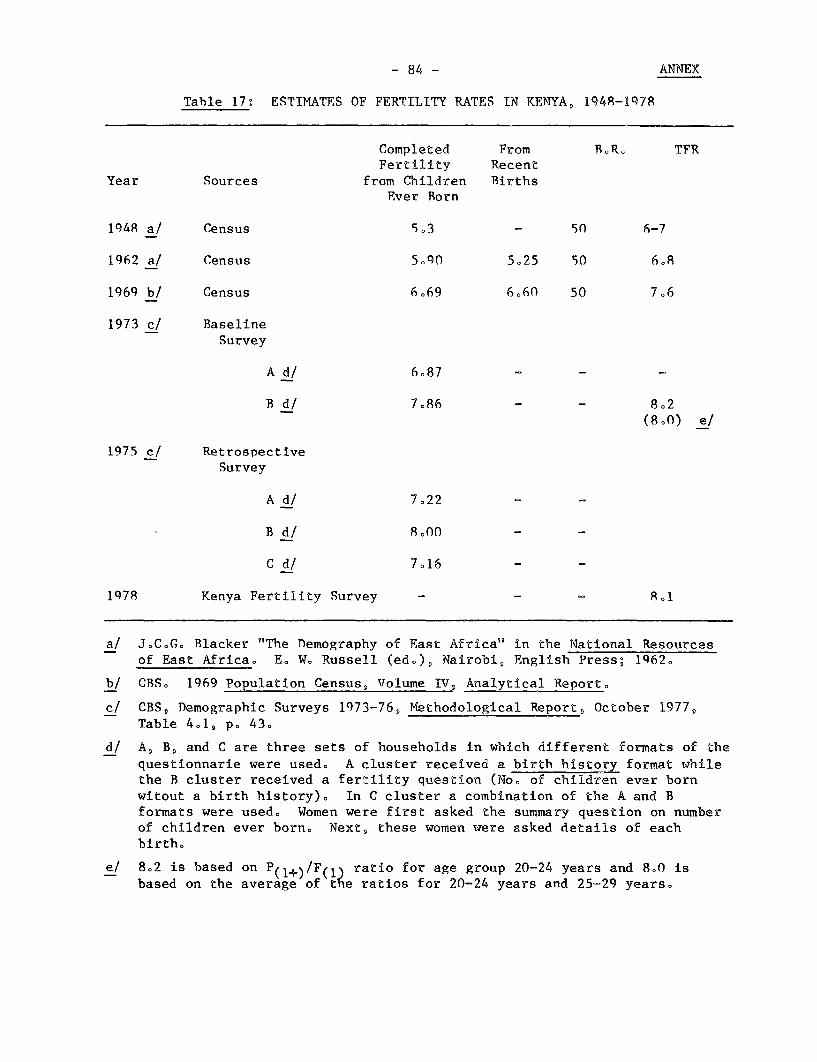
- 84 - ANNEX
Table 17: ESTIMATES OF FERTILITY RATES IN KENYA, 1948-1978
Completed From BRoR TFRFertility Recent
Year Sources from Children BirthsEver Born
148 a/ Census 5.3 - 50 6-7
1962 a/ Census 5,0O 525 50 6o8
1969 b/ Census 6.69 6.60 50 7.6
1973 c/ BaselineSurvey
A d/ 6.87 - -
B d/ 7.86 - - 802(8.0) e/
1975 c/ RetrospectiveSurvey
A d/ 7.22
B d/ 8.00
C d/ 7.16
1978 Kenya Fertility Survey - - 8.1
a/ J.C.G. Blacker "The Temography of East Africa in the National Resourcesof East Africa. E, W. Russell (ed.), Nairobi, English Press; 1962.
b/ CBS. 1969 Population Census, Volume IV, Analytical Report.
c/ CBS, Demographic Surveys 1973-76, Methodological Report, October 1977,Table 4.1, p. 43.
d/ A, Bg and C are three sets of households in which different formats of thequestionnarie were used. A cluster receîved a birth history format whilethe B cluster received a fertility question (No. of children ever bornwitout a birth history). In C cluster a combination of the A and Bformats were used. Women were first asked the summary question on numberof children ever born. Next, these women were asked detaîls of eachbirth.
e/ 8.2 is based on P(î+)/F(lî ratio for age group 20-24 years and 8.0 isbased on the average of t e ratios for 20-24 years and 25-29 years.
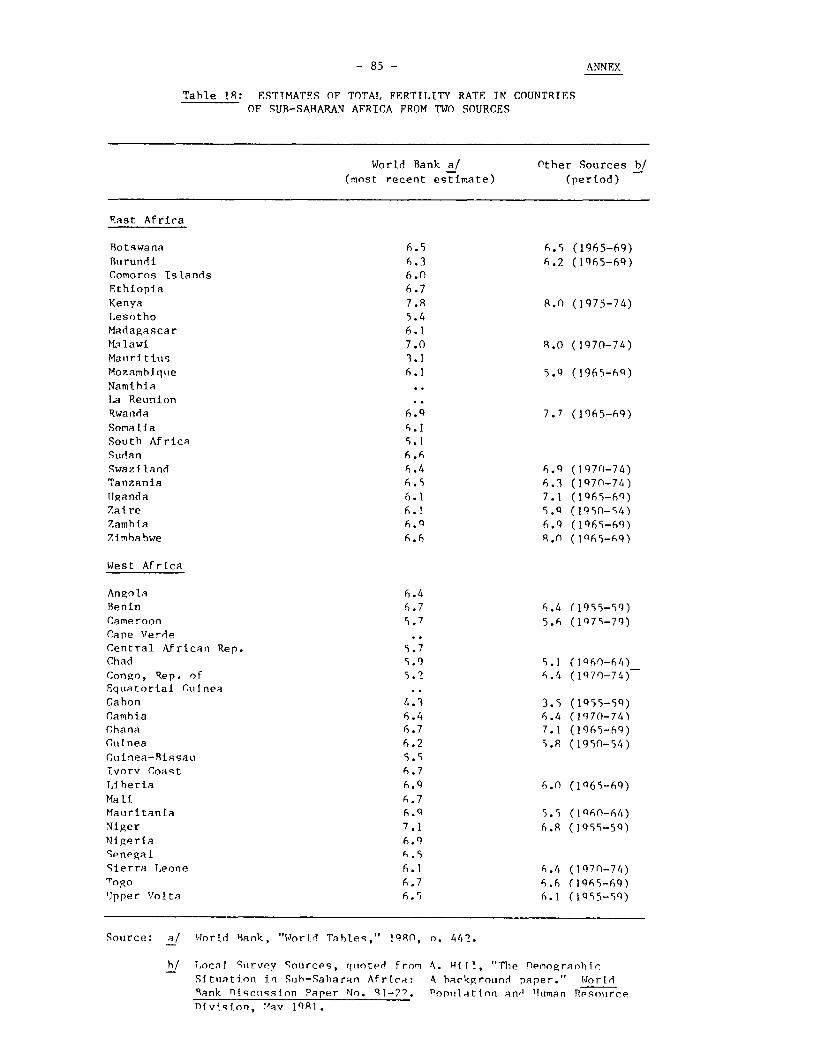
- 85 - ANNEX
Table 18: ESTIMATES OF TOTAL FERTILITY RATE TN COUNTRIESOF SUB-SARARAN AFRICA FROM TWO SOURCES
World Bank a/ Other Sources b/(most recent estimate) (period)
East Africa
Botswana 6.5 6.5 (1965-69)Bxîrundi 6.3 6.2 (1065-69)Comoros Islands 6.0Ethiopia 6.7Kenya 7.8 8.0 (1975-74)Lesotho 5.4Madagascar 6.1Malawi 7.0 8.0 (1970-74)Maurit ixs 3.1Mozambiqîe 6.1 5.9 (1965-69)Namihia aLa ReunionRwanda 6.9 7.7 (1965-69)Somalia 6.1South Africa 5.1Sudan 6.6Swazlland 6.4 6.9 (197n-74)Tanzania 6.5 6.3 (IQ70-74)IJRanda 6.1 7.1 (1Q65-60)Zaire 6.1 5.Q (l950-54)Zamhia 6.9 6.9 (1Q65-60)Zimbabwe 6.6 R.0 (1065-69)
West Africa
AnRola 6.4Benin 6.7 6.4 (1955-59)Cameroon 5.7 5.6 (1475-79)Cape VerdeCentral African Rep. 5.7Chad 5.9 5.1 (1q60-64)Congo, Rep. of 5.2 6.4 (1970-74)Equatorial CiiîneaCabon 4.3 3.5 (1955-59)C,ambia 6.4 6.4 (1070-74)Chana 6.7 7.1 (1965-69)Gutnea 6.2 5.8 (1950-54)Cuinea-Bissaau 5.5ivorv Coaqt 6.7Liheria 6.9 6.n (1965-69)Mati 6.7Mauiritania h.9 5.5 (lq60-64)Niger 7.1 6.8 (1955-59)Nigeria 6.9Spnegat 6.5Sierra Leone 6.1 6.4 (1970-74)'Topo 6.7 6.6 (1965-69)'Jpper "olta 6.5 6.1 (1q55-50)
Source: a/ Worîd Bank, "IJorld Tables,," 190R, . 447.
h/ T.ocal Sirvev sources, quoted fron A. Mill, "The erenogranh1cSituation in Suh-Saharan Africa: A hackground paper." WorLdBank nt»;cuss1on Paper No. 51-.7. 0 opulatinn anA 1luman RpsotircenivLs Lon, Mav I'QR.
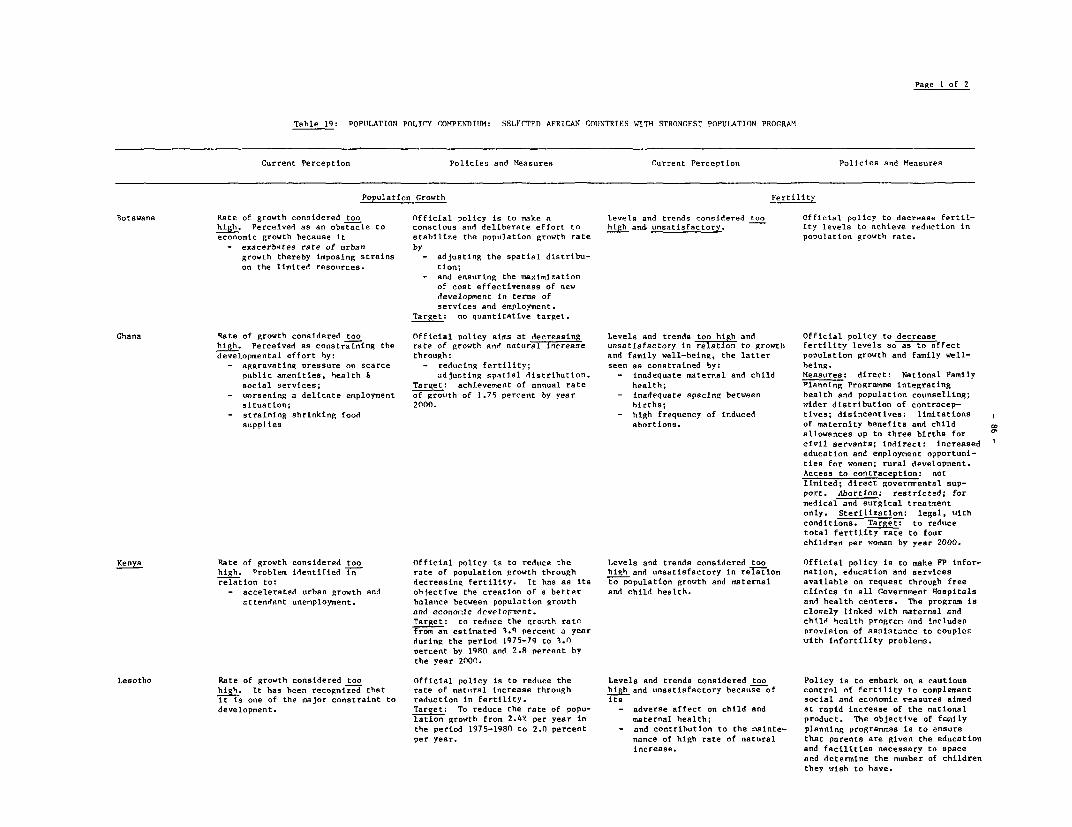
Page I of 2
Table 19: POPULATION POLICY COMPENDII9I: SELF(-TED AFRICAN CO(tNTRIES WlTTH STRONGFST POPULATION PROGRAM
Current Perception Policies and Measures Current Perception Policies and Measures
Population Crowth FertiIlty
Botswana Rate of growth considered too Official policy is to make a Levels and trends considered too Official policy to decrease fertitl-htgh. Perceived as an obstacle to consctous and deliberate effort to high and. unsatisfactory. ity levels to achieve reduction lneconomic growth because it stabilize the population growth rate population growth rate.
- exacerbates rate of urban bygrowth thereby imposing strains - adjusting the spatial distribu-on the limited resources. tion;
- and ensuring the maximizationof cost effectiveness of newdevelopment la terms ofservices and emplovrent.
Target: no quantitative target.
Ghana Rate of growth considered too Official policy ains at decreaaing Levels and trends to hi gh and Official policy to decreasehigh. Perceived as constraining the rate of growth and naturai !ncreaae unsatiafactory in relation to growtb fertility levels sa as to affectdevelopmental effort by: through: and family well-heing, the latter population growth and family well-
- aggravating pressure on scarce - reducing fertility; seen as constrained by: being.public amenittes, heaith & adjusting spatial distribution. - inadequate maternal and child Measures: direct: National Familysocial services; Target: achievement of annual rate health; Planning Programme integrating
- worsening a delicate employment of grouth of 1.75 percent by year - inadequate spacing between health and population counselling;situation; 20no. hirths; wider distribution of contracep-
- straining shrinking food - high frequency of induced tives; disincentives: limitationssupplies abortions. of maternity benefits and child co
allowances up to three births for O
civil servants; Indirect: increasededucation and employnent opportuni-ties for women; rural developraent.Access to contraception: notlimited; direct governirental sup-
port. Abortion: restricted; formedical and surgical treatmentonly. Sterilization: legal, uithconditions. Target: to reducetotal fertility rate to fourchildren per woman by year 2000.
Kenya Rate of growth considered too Official policy is to reduce the Levels and trends considered too Official policy is to make FP infor-high. Problem identified in rate of population growth through high and unsatisfactory in relation mation, education and servicesrelation to: decreasing fertility. It has as its to population growth and maternal available on request through free
- accelerated urban growth and objective the creation of a better and child health. clinics in ail Government qospitalsattendant unenployment. halance between population grouth and health centers. Tbe program is
and econonic developnent. closely linked vith maternal andTarget: to reduce the grouth rate child henlth progran and includenfrom an estinated 1.q percent a year provision of naniotance to couplesduring the period 1 975-79 to 1.n tith infortility problens.percent by 1980 and 2.8 percent hythe year 2000.
Lesotho Rate of growth considered too Official policy is to reduce the Levels and trends considered too Policy is to embark on a cautioushigh. It has been recognized that rate of natutral increase through high and unsatisfactory because of contrnl of fertility to complementit is one of the rajor constraint to reduction in fertility. tts social and economic reasures aimeddevelopment. Target: To reduce the rate of popu- - adverse affect on child and at rapid increase of the national
lation grouth from 2.41 per year in maternal health; product. The objective of familythe period 1975-1980 to 2.0 percent - and contribution to the mainte- planning programmes is to ensureper year. nance of high rate of natural that parents are given the education
increase. and facilities necessary to spaceand determine the number of childrenthey uish to have.
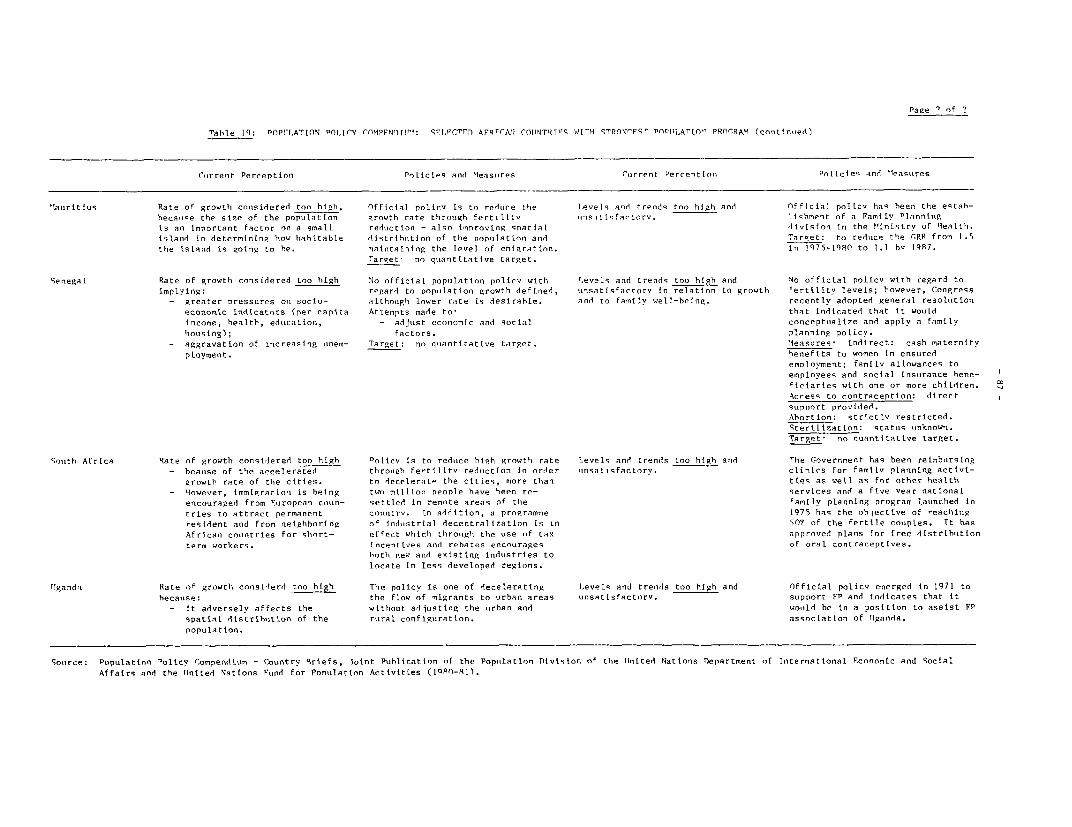
Page ' of
Table 19: POPTI,hATION POJÂCnMPFVPN)TlI': sFf.ICTrD AFRTCAfl CO1TNTRl9S WITT cTPnRCFq' POPhI.ATîO'J PROCRKM (cnntionred)
Crirrent Perception PoLicies and 'leasi,res (urrent Perception Polictesq ad '¶easures
'lauritius Rate of growth cnnsidered too high, Official policv is to redore the T.evels and trends ton high and Official policv has heen tire estah-hecauqe the saze of the population eirowth rate through fertittv *îrshtisfar-trv. Iishnent nf a Family Planningts an Important factor on a small redtrction - alao improving spatial division in the Mlinistrv of
1lealth.
island in deternining how hahitable distriburtion of the populatton and Tarqiet: tu reduice the GRR from 1.5the island is going to he. maintaining the level nf enierAtion. ln 1975-1980 to 1.1 bv 19R7.
Target no quantttative target.
Senegal Rate of growthi constdered too high No official popuilatton policv with T.evels and trends too high and No official policy with regard toimplyinR: regard to population growth defined, uinsatisfacrorv Ln relation to growth Fertility levels; however, Congress
- greater pressures on socio- although lower rate is desirable. and to family well-being. recently adopted general resoluitioneconortc indicators (per capita Attempts made tor that indicated that it wouldincome, health, education, - adjust econonic and social conceptuali7e and apply a familyhousing); factors. planning poticy.
- aggravation of increasing unem- Target: no quiantitative tArget. Measures indirect: cash maternityployment. beneftts to wnmen in ensured
emlnyvment; family allowances to
employees and social insaurance hene-liciartes with one or more children. C
Accesc to contraception: direct
su1poort provided.Abortion: strictIv restricted.
Stertitzatton: status ucnknown.Target- no quantitative target.
Soouth Africa Rate nf growth consitdered too high Policv is to redrice hih grnwtfi rate Levels and trends too high and The Governrent has been reimbursing- heause of the accelerated thrnrîgb fertilttv reduction ln order incsatisfactorv. clinirs for familv planning activi-
growth rate of the cittes. to decelerate thie cities, more than tteq as well as for other health- Nowever, immigration is helng twn miltion people have heen re- services and a five vear national
encouraged from N1uropean coun- settled in remote areas of the 'anily planning program launched intries to attract permanent corcntry. In addition, a programne 1975 bas the objective of reachingrestdent and fron neighboring on industrial decentralization is in SO7 of the fertile couples. tt hasAfrican corontries for short- effect which throurgh the use nf tax approved plans for free distributionterm workers. incentives and rebates encourages of oral contraceptives.
hoth new and existing industries to
locate tn less developed regions.
liganda Rate oF growth considerd ton high The policv is one of decelerating levels and trends too high and Official policv emerged in 1971 tohecause: the flow of migrants to urban areas unsatisfactorv. support FP and indtcates thar it
- it adverselv affects the withonit adjustlng the tîrban and would be bn a position to assist FPspatial distribution of the rural configuration. associatton of 11ganda.population.
Source: Population tolicy Corrpendturr - Country Brtefs, loint Publication of the Popuilation Diviston oF the llnited Nations Oepartment of Tnternational Economic and Soctal
Affairs and the 1lnited Nations Furnd for Popuilation Acttvttite (1980-911.
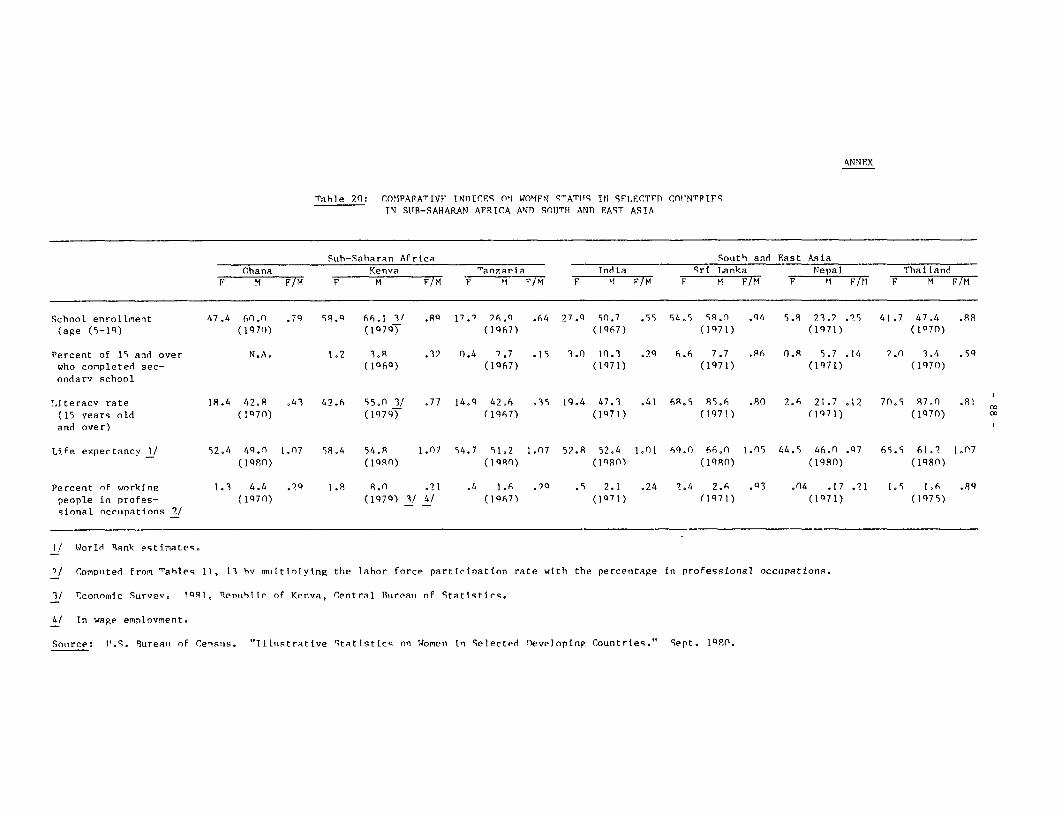
\NNEX
Tahle 20: CO`1PARATIVF INTICF.' nN WOMEN qTT'ATIS IN SFIFECTFO COVNTPIFSTN StIR-SAHARAN AFRICA AND SOUTH AND EAST ASIA
Suh-Saharan Africa South and East Asia
Chana Kenva Tanzanla India Sri Lanka Nepal ThailandF M F/M F M F/M F M C/M F M F/M F M F/M F M F/M F M F/M
School enrollment 47.4 60.n .79 58.q 66.1 3V .9 17.7 26.9 .64 27.q 50.7 .55 54.5 s.s.n .94 5.R 23.2 .25 41.7 47.4 .88
(age (5-19) (197n) (1979) (lf67) (1967) (lQ71) (1971) (1070)
Percent of 15 and over N.A. 1.2 3.9 .37 0.4 7.7 .15 3.0 10.3 .29 6.6 7.7 .R6 0.R 5.7 .14 7.n 3.4 .59
who completed sec- (1Q6q) (1Q67) (1971) (1971) (1971) (I970)ondarv school
Literacv rate 19.4 42.8 .43 42.6 55.n 3/ .77 14.9 42.6 .35 19.4 47.3 .41 68.5 85.6 .80 2.6 21.7 .12 7n.5 97.0 .91
(15 Fears old (I170) (1979) (1967) (1Q71) (1971) (1971) (1Q70) ca
and over) 1
Life expectancv 1/ 52.4 49.0 1.n7 59.4 54.9 1.07 54.7 51.2 1.07 52.7 52.4 1I01 69.0 66.n 1.05 44.5 46.0 .q7 6s.s 61.? 1.n7
(Iq99n) (IqR9) (1990) (I9sn) (1990) (19An) (1980)
Percent of working 1.3 4.4 .29 1.9 s.0 .?1 .4 1.6 .79q .5 2.1 .24 2.4 2.6 .*3 .04 .17 .?1 1.5 1.6 .89
people in profes- (1970) (197q) 3/ 4/ (I967) (1971) (1971) (1q71) (1q75)
sional ocrtipatlons 2/
1/ World Sank eqtirateq.
7/ Computed from 'rables 11, 13 hv mu1ltinlying the lahor force participation rate wlth the percentage In professional occeipations.
3/ Tconomic Survev, IQR1, Rentbhlir of 1Cenva, Central Ouireaau of Stattstics.
4/ In wage emplovment.
Souirce: T.S. Burealu of Census. "Iltllstrative Stattst1cs on oromen in Selected Developing Countries." Sept. 19R0.
- 89 -
References
Adadevoh, B.K. (ed) Sub-fertility and Infertility in Africa: Report of AnInternational Workshop, Ibadan, Nigeria, 1973. Ibadan, Caxton Press,1974, pp. 65-68.
Adegboola, 0. "New Estimates of Fertility and Child Mortality in Africa,
South of Sahara". Population Studies, November 1977, 31 (3).
Adeniyi, E.0. "Population Growth and Fertility among the Nupe of Nigeria".In Oppong, C., Adaba, G., Bekombo-Priso, M., Mogey, J. (eds.) "Marriage,Fertility and Parenthood in West Africa." Canberra, Australia, AustralianNational University, 1978, pp. 435-451.
Adepoju, Aderanti. "Military Rule and Population Issues in Nigeria". AfricanAffairs (London), January 1981, 80, pp. 29-47.
Anderson, B.A., McCabe, J.L. "Nutritiion and the Fertility of Younger Women inKinshasa, Zaire. Journal of Development Economics 1977, 4, pp. 343-363.
Anker, R., Buvinic, M., and Youssef, N. Women's Roles and Population Trendsin the Third World, London, 1982.
Arowoo, Oladele 0. "Fertility of Urban Yoruba Working Women: A Case Study ofIbadan City". Nigerian Journal of Economic and Social Studies (Ibadan).March 1977, No. 19, pp. 37-66.
Baffoe, F. "The Political Economy of Population Policies: The UgandanExperience". In Uche, U.U. (ed.) Law and Population Change in Africa.Nairobi, Kenya: East African Literature Bureau, 1976. pp. 186-195.
Belsey, M.A. "The Epidemiology of Infertility: A Review with ParticularReference to Sub-Saharan Africa:. Bulletin of the World RealthOrganization, 1976, 54 (3) pp. 319-341.
Berger, Iris. "Sources of Class Consciousness: The Experience of WomenWorkers in South Africa, 1973-1980". Boston 11niversity, African StudiesCenter Working Papers.
Bernard, F.E. "Population Pressure and Population Redistribution in Kenya",in Clark, J.I., Kosinski, L.A. (eds) "Population Redistribution inAfrica: Proceedings of the Symposium in Zaria, Nigeria". Edmonton,
Alberta, Canada: International Geographical Union, Commission onPopulation Geography.
. "Population Pressure: A Preliminary Assessment with SpecialReference to Kenya". East African Geographical Review (Kampala), 1977,No. 15, pp. 43-68.
- 90 -
Blacker, JOCOGO "The Estimation of Adult Mortality in Africa from Data onOrphanhood" Population Studies , March 1977,, 31 (1).
_ "Dual Record Demographic Surveys: A Reassessment". PopulationStudies, November 1977,S 31 (3).
o "The Mechanisms of Demographic Change in Historica: Prospect".
Population Studies, March 1981, No. 1,D Vol. 35.
Boserup, Esther. Women's Role in Economic Development, St. Mar'in's Press, NewYork, 19700
Boserup, Esther. The Conditions cf Agricultural Growth: The Economics ofAgricultural Change under Population Pressure. London. Allen and Unwin,1965.
Brown, Barbara B. "Women, Migrant Labor and Social Change in Botswana".Boston University, African Studies Center Working Papers0
Brown, Lester R0 "Global Economic Prospect, New Sources of EconomicStress." Washington, D.C0 Worldwatch paper, No0 20: 1-56, 19780
Buringh, P., van Heemst, H., and Staring, G0 Computation of the AbsoluteMaximum Food Production of the World, Agricultural University, Wageningen,19750
Buringh, P. and van Heemst, H0 An Estimation of World Food Production Basedon Labour-Oriented Agriculture, Wageningen, 19770
Caldwell, JoCo "The Mechanisms of Demographic Change in HistoricalPerspective." Population Studies, Vol0 35, March No0 1o1, ppo 5-27(1981)0
Caldwell, JoCo "Education as a Factor in Mortality Decline: An Examinationof the Nigerian Data. Population Studies, November 1979,, 33 (3), pp0 3954130
_ "The Economic Rationality of High Fertility: An investigationIllustrated with Nigerian Survey Data"0 Population Studies, March 1977,,31 (1)o
o The Persistence of High Fertility: Population prospects in theThird World. Canberra, Australia, Australian National University, 19770
o "The Sahelian Drought and its Demographic Indications"0 OLCPaper No. 8, Overseas Liaison Committee, American Council on Education,Washington, 19750
o (ed0)0 Population Growth and Socioeconomic Change in WestAfrica. New York: Published for the Population Council by CambridgeUniversity Press, 19750

- 91 -
African Rural-Urban Migration: The Movement to Ghana's Towns.New York, Columbia University Press (1969).
, Population Growth and Family Change in Africa; The New Urban Elite
in Ghana. Canberra, Australian National University. 1968.
, and Caldwell P. "The Achieved Small Family: Early Fertility
Transition in an African City". Studies in Family Planning, January 1978,9 (1), pp. 2-18.
, and Thompson, B. "Gambia" in Caldwell, J.C. (ed.) Population
Growth and Socioeconomic Change in West Africa. New York, Published forthe Population Council by Columbia University Press, 1975.
Cantrelle, P., Ferry, B., Mondot, J. "Relationships Between Fertility andMortality in Tropical Africa" in Preston, S.H. (ed.) The Effects ofInfant and Child Mortality on Fertility (Based on papers from a seminar"Infant Mortality in Relation to Level of Fertility, Bangkok, Thailand,May 6-12, 1975. New York, Academic Press, 1978, pp. 181-205.
Cantrelle et. al. (eds.) "Population in African Development". Vols. 1 & 2:Dolhain, IUSSP, Ordina Editions, 1976.
Cantrelle, P. "Repeated Demographic Observation in a Rural Area in Senegal:Method and First Results" in "Proceedings of the World PopulationConference, Belgrade, August 30-September 10, 1965." Vol. 3 "SelectedPapers and Summaries: Projections, Measurement of population trends".New York, United Nations 1967.
Carael, M. "Child-Spacing, Ecology and Nutrition in the Kivu Province ofZaire" in Page, H.J. Lesthaeghe R. (eds). Child-Spacing in TropicalAfrica: Traditions and Change. New York, Academic Press, 1981, pp. 275-286.
Carlsen, John and Tony Moody. "Population Pressure, AgricultrualProductivity, and Rural Employment in Kenya". Copenhagen: Centre forDevelopment Research, 1976.
Cassen, R. "Population and Development: A Survey," World Development, Oct.-Nov., 1976.
Cassen, R., Wolfson, M., and Ohlin, G. (eds.) Planning for GrowingPopulations. Paris: Development Center of the Organisation for EconomicCo-operation and Development, 1978.
Caughman, Susan. "Women at Work in Mali: The Case of the MarkalaCooperative". Boston University, African Studies Center Working Papers.
Chad National Experience in the Formulation and Implementation of PopulationPolicy, 1960-1976, United Nations, 1978.
92 -
Chernichovsky, D. "Socioeconomic Correlates of Fertility: Behavîour in RuralBotswana," Population and Human Resources Division, Discussion Paper No.81-48, 1981.
Ciele, J0 ZO and AoCo Smock. (eds)0 Women Roles and Status in EightCountries. John Wiley and Sons, New York, 1977.
Cleave, J.H. African Farmers: Labour Use in the Development of SmallholderAgriculture, Praeger, 1974.
Collier, P. and Deepak Lal "Poverty and Growth in Klenya0" World Bank StaffWorking Paper No. 389, May 1980O
Conde, J0 Some Demographic Aspects of Human Resources in Africa0 Paris:OECD Development Centre, 1973.
Courel, AoIo, Pool, D0I "Upper Volta" in Caldwell, JoCo (ed0) PopulationGrowth and Socîoeconomic Change in West Africa. New York, Published forthe Population Council by Columnbia University Press, 19750
Croll, E.J. "Women in Rural Production and Reproduction in the Soviet Union,China, Cuba and Tanzania: Case Studies," Sîgns, Vol0 7, Noo 2.
Cutshall, Charles R0 "The Role of Women in Disputing Among the Ila ofZambia: Political Adaptation in Legal Change"0 Boston University,African Studies Center Working Paper.
Dow, T0 "Fertility and Family Planning in Africa0 " Journal of Modern Studies8 (3), 1971.
Dow, Te J°, Benjamin, E0 "Demographic Trends and Implications", in Caldwell,JoCo (ed.) Population Growth and Socioeconomic Change in West Africa0 NexiYork, Published for the Population Council by Columbia Unîversity Press,1975.
Eberstadt, Nick. (ed0). Fertility Decline in The Less Developed Countries:Praeger Special Studies 1981. CBS Educational and ProfessionalPublishing, New York.
Ekanem, IoIo "The Dynamics of Urban Growth: A Case Study of Nedium-SizedTowns of Nigeria", in Clark, Jo1, Kosinski, L0Ao (eds0) Populationand Redistribution in Africa: Proceedings of the Symposium in Zaria,Nigeria0 Edmonton, Alberta, Canada, International GeographicalUnion, Commission on Population Geography, 19780
FAO, Tenth Regional Conference for Africa, Arusha, Tanzania, 18-29 September1978.
Faruqee, Rashid. Sources of Fertility Decline: Factor Analysis of IntercountryData0 World Bank Staff Working Paper, 318 February 19-/9o

- 93 -
Faruqee, Rashid, et. al., Kenya: Population and Development, The World Bank,1980.
Faulkingham, R.J. "Fertility in Tudu: An Analysis of Constraints onFertility in a Village in Niger". In Caldwell, J.C. The Persistence ofHigh Fertility: Population prospects in the Third World. Canberra,Australia, Australian National University, 1977, pp. 153-188.
Fortman, L. "An Evaluation of the Progress of the National Maize Project atthe End of One Cropping Season in Morogoro and Arusha Regions," preparedfor U.S.A.I.D./Tanzania, 1976.
_ "The Plight of the Invisible Farmer: The Effect of NationalAgricultural Policy on Women," in Women and Development, Washington,D.C.: American Association for the Advancement of Science, 1979.
Francois, M. "Gabon" in Caldwell, J.C. (ed.) Population Growth andSocioeconomic Change in West Africa. New York, Published for thePopulation Council by Columbia University Press, 1975.
Gaisie, S.K. Dynamics of Population Growth in Ghana. CICRED, 1969.
Gaisie, S.K. and A.S. David. Planned Fertility Reduction in Ghana: StructuralInter-Relationship, Potential Socio-Economic Impact and the Magnitude ofNeeded Programme. Ghana Population, Series No. 6.
George, E. "Kenya: Tackling a National Problem". Agenda, October 1979, 2(8).
Gulhati, R. and Datta, G. "Setback in Capital Accumulation in Eastern andSouthern Africa" (forthcoming).
Guyer, Jane I. "Household Budgets and Women's Incomes." Boston University,African Studies Center Working Papers.
Guyer, Jane I. "The Economic Position of Beti Widows, Past and Present."Boston University, African Studies Center Working Papers.
Guyer, Jane I. "The Raw, The Cooked, and the Half-Baked: A Note on theDivision of Labor by Sex." Boston University, African Studies CenterWorking Papers.
Guyer, Jane I. "Women's Work in the Food Economy of the Cocoa Belt: AComparison." Boston University, African Studies Center Working Papers.
Guyer, J.I. "Household and Community in African Studies," The African StudiesReview, Vol. XXIV, Nos. 2/3, June/September 1981.
Ghana. Population Policy: Population Planning for National Progress andPosterity. March 1969, Republic of Ghana.
- 94 -
_ National Experience in the Formulation and Implementation ofPopulation Policy9 1960-1976. United NationsD, New York 1978.
Guinea. National Experience in the Formulation and Implementation ofPopulation Policy, 1960-1976, United Nations, New York 1979.
Government of Kenya. Central Bureau of Statistics. Demographic BaselineSurvey Report". Nairobi: Central Bureau of Statistics, Ministry ofFinance and Planning, 1975.
Harrington, J.A0 "Mortality in Infancy and Childhood in a DevelopmentEconomy: The Example of West Africa". In Udo9 RoKo (ed.) PopulationEducation Source Book for Sub-Saharan Africa. Nairobi, Kenya, HeinemannEducational Books9 1979, ppo 125-136.
Harrington9 Judith. "Some Micro-Socioeconomics of Female Status inNigeria." Conference on Women in Poverty: What Do We Know?International Center for Research on Women , University of Michigan.
Haupt9 Arthur. "Africa Faces New Population Challenges: the Sub-SaharanRegion0 Intercom. May 19809 Vol. 8 (1) pp. 12-15.
Herz9 Barbara Knapp. "Demographic Pressure and Economic Change".Washington: AID9 Office of Policy Development and Analysis, 1974.
Hill9 Althea. "The Demographic Situation in Sub-Saharan Africa.Washington: World Bank9 DEDPH Discussion Paper9 No. 81-22. May 1981.
IDA in Retrospect, published for the World Bank9 Oxford University Press,19820
Institute of Development Studies Health Group0 "'Health Needs and HealthServices in Rural Ghana." Volume 10 Brighton, England: University ofSussex9 Institute of Development Studies. June 1978.
Jonsson9 UO "Towards a Food and Nutrition Policy in Tanzania". Food Policy,May 19809 5 (2), pp. 143-147.
Kabagambeg JoCo "Demographic Trends and Family Planning in Africa". AfricaLink. July 1979o
Kabore, AoBo "Upper Volta". In Bloch, LoSo (ed.)o The Physical andPopulation Change: A Strategy for Africa, the Middle East and Europe.Bethesda, Maryland, World Federation for Medical Education, March 1979Dpp. 220-224.
Kent, M0 and Larson, A0 Family Size Preferences: Evidence from the WorldFertility Surveys, Population Reference Bureau, 1982.
Ketkar, S.L0 "Determinants of Fertility in a Developing Society; The Case ofSierra Leone". Population Studies. November 19799 33 (3) pp. 479-488.
- 95 -
"Female Education and Fertility: Some Evidence from SierraLeone" Journal of Developing Areas. October 1978. 13 (1), pp. 25-33.
Kochner, J.E. "Rural Development and Fertility Change in Tropical Africa:Evidence from Tanzania. East Lansing, Michigan: Michigan StateUniversity, Department of Agricultural Economics. 1979.
Kossoudji, Sherrie and Eva Mueller. "The Economic and Demographic Status ofFemale Headed Household in Rural Botswana." Discussion Paper #81-49, Oct.1981, World Bank.
Lacombe, B., Lamy, B., and Vaugelade, J. "Senegal" in Caldwell, T.C. (ed.)Population Growth and Socioeconomic Change in West Africa. llew York,Published for the Population Council by Columbia University Press, 1975.
Lal, Deepak and Paul Collier, "Poverty and Growth in Kenya", World Bank StaffWorking Paper No. 389. Washington DC: The World Bank, 1980.
Lightbourne Jr., Robert, and Singh, Susheila with Green, Cynthia. "The WorldFertility Survey: Charting Global Childbearing" Population BulletinVol. 37 No. 1 (Population Reference Bureau Inc., Washington, D.C. 1982)
Lightbourne et. al. The World Fertility Survey: Chasting Global Childbearing.Population Builetin. Vol 37 #l, March 1982, PRB Inc.
Mabogunje, A.L. and 0. Arowolo. "Social Science Research on Population andDevelopment in Africa South of the Sahara". Appendix 7 to the Report ofthe International Review Group of Social Science Research on Populationand Development, El Colegio de Mexico, Mexico City, 1978.
Madagascar. National Experience in the Formation and Implementation ofPopulation Policy, 1960-76, United Nations, New York 1979.
Maletnlema, T.N. "Tanzania: Nutrition and Government Policy -- Socialism asa Solution". In Winikoff, B. (ed.) Nutrition and National Policy.Cambridge, Mass: MIT Press, 1978.
Mati, J.D. "Abortion in Africa". In Sai, F.T. (ed.) "Family Welfare andDevelopment in Africa". Proceedings of the IPPF Regional Conference,Ibadan, Nigeria, August 29-September 3, 1976. London: InternationalPlanned Parenthood Federation, 1977, pp. 74-79.
Matiko, Mariam. "African Women: The Unequal Partners." New Africa, an ICPublication, May 1981, No. 164.
Mauldin, Parker W. and Berelson B. "Conditions of Fertility Decline inDeveloping Countries" Studies in Family Planning Vol. 9 # 5, ThePopulation Council, May 1978
Mbiliny, Marjorie. "The State of Women in Tanzania." Canadian Journal ofAfrican Studies. 1972, 6 (2):371-377.
- 96 -
Mbilinyi, M. "The Changing Position of Women in the Af rican Labour Force"(forthcoming).
Mbithi, PoMo and Carolyn Barnes. Spontaneous Settlement Problem in Kenya.1975 East African Literature Bureau, Nairobi.
McGregor, I.A., Williams, K., Billewics, W.C0 and R0 Holliday. vMortality ina Rural West African Village (Keneba) with Special Reference to DeathOccurring in the First Five Years of Lîfe". Unpublished paper presentedat a conference on "Medical Aspects of African Demography", Cambridge,September 1979.
Menes, R.J. "Senegal". Washington, DoCo, UoSo Office of InternationalHealth, Division of Planning and Evaluatîon, June 1976.
Mondot-Bernard, J.M. Relationships Between Fertility, Child Mortality andNutrition in Africa. Paris: Development Center of the Organization forEconomic Cooperation and Development, 1977.
Mott, Frank L. and Susan H0 Mottr0 'fKenya's Record Population Growth: ADilemma of Development". Population Bulletin. Washington: PopulationReference Bureau , 1980O
Mozambique. National Experience in the Formulation and Implementation ofPopulation Policy, 1960-76. Unîted Nations, New York l981l
Mueller, E0 "A Poverty Profile for Rural Botswana.` World Bank DiscussionPaper No. 81-43, Population and Human Resources Division, October, 19810
Mukherjee, D0 "Tanzania: More Aid Needed.0 People, 1981, 8 (1), pp. 2425.
Mureithi9 Leopold P. "Demographic and Technological Variables în Kenya'sEmployment Scene, Nairobi: Institute for Development Studies, Universityof Nairobi, 1974.
Nasah, B.T., Azefor, M.A., Ondoa, BoNo `Socio-cultural Aspects of Fertilityin Cameroon". In Adadevoh,, B.K. (ed.) Sub-fertility and Irfertîlity inAfrica: Report of An International Workshop, Ibadan, Nigeria, 1973,Ibadan, Caxton press, 1974, ppo 65-68.
Nwafor, JoCo "Agriculturla land use and Associated Problems in Rwanda".Journal of Tropical Geography, June 1979, ppo 58-65.
Nyerere, Julius K. Freedom and Unity: Uhuru na Umajo; A Selection fromWriting and Speeches, 1952-65, Oxford University Press.
_ Socialism and Rural Development, Dar Es Salaam, 1967.
Ogbeide, 0. "Infant Mortality in Benin City"'. Journal of Tropical Pediatrîcsand Environmental Child Health, October 1980, 26 (5), pp. 199-202.
- 97 -
Ohadike, P. "A Demographic Note on Marriage, Family and Family Growth inLagos, Nigeria." In the Population of Tropical Africa, J. Caldwell andC. Okanjo, eds. London: Longmans.
Ohadike, P.O., Tesaghiorghis, H. "The Population of Zambia". Paris,Committee for International Coordination of National Research inDemography. 1975.
Olusanya, P.O. "Reduced Fertility and Associated Factors in the Western Stateof Nigeria." In Adadevoh, B.K. (ed.) Sub-fertility and Infertility inAfrica: Report of An International Workshop, Ibadan, Nigeria, 1973.Ibadan, Caxton press, 1974, pp. 65-68.
Ominde, S.H. and C.N. Ejiogu (eds.) Population Growth and EconomicDevelopment in Africa. Reinemann (with the Population Council), 1972.
Omololu, A. Nigeria". In Winikoff, B. (ed.) Nutrition and NationalPolicy. Cambridge, Mass: MIT Press, 1978.
Onadeko, M.O. "Public Health and the Nigerian Population Pressure". NigerianMedical Journal. 1978, 8 (3), pp. 220-224.
Onwuazor, S.N. "Continuity and Change: Abortion and Family Size in aNigerian Village" in Epstein, T.W., and Jackson, D. (eds.) The Feasibilityof Fertility Planning: Micro Perspectives. Oxford and New York:Pergamon Press, 1977, pp. 67-95.
Oppong, C., Adaba, G., Bekombo-Priso, M., Mogey, J. (eds.) "Marriage,Fertility and Parenthood in West Africa". Canberra, Australia, AustralianNational University, 1978.
Orubuloye, I.O. and J.C. Caldwell. "The Impact of Public Health Services onMortality: A Study of Mortality Differentials in a Rural Area ofNigeria". Population Studies, July 1975, 20 (2).
Oucho, John O. The Interrelations of Population with Economic and SocialDevelopment: A Macro-Case Study of Kenya". Addis Ababa: UN EconomicCommission for Africa, Case Studies, Series 1, 1979.
Page, H.J. and R. Lesthaeghe R. (eds.) Child-Spacing in Tropical Africa:Traditions and Change. New York, Academic Press, 1981.
Paulane, Denise. Classes it Association d'Age en Afrique de l'ouest. Paris:Routledge and Kegal Paul 1971.
Population Reference Bureau. Africa and Its Population Growth, Vol. 30,No. 1.
Reis, C.S. "Demographic and Epidemiological Transition in Africa". TropicalDoctor, October 1978, 8 (4), pp. 229-233.
- 98 -
Reyna, S.P., Bouquet, C0 "Chad" in Caldwell, JoCo (ed.) Population Growth andSocioeconomic Change in West Africa. New York, Published for thePopulation Council by Columbia University Press, 1975.
Rogers, GoB., and E0 Anger. "Urban Fmployment in the 1980s: The Cases ofKenya and the Philippines." Geneva: International Labor Office, May1978. Population and Employment Working paper no. 63.
Ridker, Ro Savings Accounts for Family Planning: An Illustration from TeaEstates of Indian Studies in Family Planning No. 31 (May 1968) pp0 8-16.
Ridker, RoGo Land Reform and Rural Poverty in India, Washington, D.C0 , U0S.Agency for International Development Spring Review of Land Reforms, 1970.
Romaniuk, A. La fecondite des populations congolaises. Paris, Morta, 1967.
Roukens de Lange, A0 "Economic Development for an Exploding Population"0Zimbabwe Journal of Economics, June 1979, 1 (2), pp0 72-81.
Safilios-Rothschild. "The Role of the Family: A Neglected Aspect ofPoverty," Implementing Programs of Human Development. Edited by Knight,PoT0 World Bank Staff Working Paper No0 403.
_ "Female Power, Autonomy and Demographic Change in the Third World"in Anker et al. 1982.
o "Role of the Family in Development. Journal of Family andDevelopment. Vol0 17, No0 4.
Sai, F0T0 "Nutrition in Ghana". In Winikoff, B0 (ed0) Nutrition andNational Policy. Cambridge, Mass: MIT Press, 1978.
Shields, N, "Female Labor Force Participation and Fertility: A ReviLew ofEmpirical Evidence from LDC's0 " Washington, D0C0 , Population and HumanResource Division, World Bank, mîmeo.
Sheikh, M.H- "Population and Manpower Growth in Southern AfricanCountries"0 African Population Newsletter, No. 21, June 1976, ppo 4-9o
Smock, A.C0t"Measuring Rural Women's Economic Roles and Contributions in
Kenya". Studies in Family Planning, Nov0-Dec. 1979, 10 (li-12), pp. 385-3900
Snyder, D. "Economic Determinants of Family Size in West Africa"0Demography, November 1974, Il (4).
Stamper, OoMo Population and Planning in Developing Nations, The PopulationCouncil, 1977.
Staudt, K. "Class and Sex in the Politics of Women Farmers," journal ofPolitics, May 1979.
- 99 -
Tekce, B. "A Research Note on Investigation of Childhood Mortality within theGezira Province". Population Council. West Asia and North AfricaRegion. Agricultural Labour for the Modern (Irrigated) Schemes: Reportof a study Group, Wad Mdani, Sudan, 1979, February 24-26, New York,Population Council, 1979, pp. 22-28.
Tsui, Amy 0. and Bogue, Donald J. Declining World Fertility: Trends causes,Implications Population References Bureau Inc. Vol. 33 # 4, Washington,D.C. 1978.
Uche, C. "The Contexts of Mortality in Nigeria". Unpublished 1980.
Uche, U.U. (ed.) Law and Population Change in Africa. Nairobi, Kenya: EastAfrican Literature Bureau, 1976, pp. 186-195.
U.N. Department of International Economic and Social Affairs. PopulationDivision. "National Experience in the Formulation and Implementation ofPopulation Policy, 1960-1976: Ghana". New York: UN, 1979.
UNFPA. Population, IJNFPA Newsletter, November 1982.
U.N. Economic Commission for Africa (ECA) (Addis Ababa) and InternationalLabour Office (ILO) (Geneva). Report of the National Seminar onPopulation and Development, Arusha, United Republic of Tanzania, February17-24, 1980.
U.N. Selected World Demographic Indicators by Countries (1950-2000) Series#ESA/P/WP:25 UN publication.
United Republic of Tanzania. National Experience in the Formulation andImplementation of Population Policy, 1960-76, United Nations, New York1978.
Valentine, Carol Hopkins. "Cultural Traditions, Social Change and Fertilityin Sub-Saharan Africa". Journal of Modern African Studies. Vol. 17,September 1979, pp. 453-472.
Van Allen, Judith. "Women in Africa: Modernization Means More Dependency."The Centre Magazine (May/June):60-67, 1974.
Van Ginneken, J.K., Voorhoeve, A.M. Omondi-Odhiambo, Muller, A.S., Blok, P.G.W-Oigo, H.O. "Machakos Project Studies: Agents Affecting Health ofMother and Child in Rural Kenya. Part 18, "Fertility, Mortality andMigration in 1975-78".
Ware, H. "Population and Development in Africa South of the Sahara: A Review
of the Literature, 1970-1978". Appendix 7A to the Report of theInternational Review Group of Social Science Research on Populatrion and
Development, El Colegio de Mexico, Mexico City, 1978.
- 100 -
Wenlock, RoWo "Social Factors, Nutrition and Child Mortality in a RuralSubsistence Economy". Ecology of Food and Nutrition0 1979, 8 (4)s pp°227-40.
White, Luise. "Women's Domestic Labor In Colonial Kenya, Prostîtution inNairobi, 1909-1950". Boston University, African Studies Center WorkingPapers.
Wils, W0 "Malnutrition in Centreal Africa" în Mosley, W.H. (ed0) Nutritionand Human Reproduction. New York, Plenum Press, 1978, ppo 325-343.
Winikoff, BN. (ed0) Nutrition and National Policy. Cambridge, Hiass: MITPress, 1978.
Wilmsen, Edwin. "Diet and Fertility Among Kalahari Bushmen. BostonUniversity, African Studies Center Working Papers.
World Bank. "Accelerated Development in Sub-Saharan Africa: An Agenda forAction." Washington: World Bank, i98io
World Bank. World Development Reports, 1980. Washington, August 1980.
World Bank. World Development Report, 1982. Washington, DoCo August 1982,Oxford University Press.
World Bank. Kenya: Population and Development. Washington. W^lorld Bank,1980.
World Fertility Survey0 The World Fertility Sruvey Inventory, Major Fertilityand Related Surveys in Africa, 1960-1973". Voorburg: WFS, InternationalStatistical Institute, London, 1974.
Yohannis, Abate. "Population Growth and Urbanization in Afrîca" CurrentHistory, March 1980, Vol. 78, pp. 102-106 and 132-133.
Youssef, N0 "Interrelationship Between the Division of Labour în Households;Women's Roles and Their Impact on Fertilîty," in Anker et al, 1982.
W orld Bank Confronting Urban these studies is presented inMalnutrition: The Design of Migration in West Africa:
Pulblications INutrition Programs Demographic Aspects.
of Related James E. Austin World Bank Staff Working Paper No.Describes a framework for 415. September 1980. vi + 385 pagesInterest systematically carrying out urban (including statistical annexes,nutrition programs that examines bibliography).several key considerations in nutri- Stock No. WP-0415. $15.00.tion education, on-site feeding, take-home feeding. nutrient-dense foods,ration shops, food coupons, fortifica- Economic Motivation versustion, direct nutrient dosage, and food City Lights: Testingprocessing and distribution. HIypotheses about Inter-
The Johns Hopkins University Press, Changwat Migration in1980. 136 pages. ThailandLC 79-3705. ISBIY 0-8018-2261-0, Fred Arnold and$6.50 (£4.50) paperback. Susan H. Cochrane
World Bank Staff Working Paper No.The Costs and Benefits of 416. September 1980. 41 pagesFamily Planning Programs (including footnotes, references).George C. Zaidan Stock No. WP-0416. $3.00.
A technique for measuring the
NEW economic returns from investing in Economics of Supplementalpopulation control, with an appraisal
Analyzing the Impact of of inherent assumptions and Feeding of MalnourishedNealth Serices: Project limitations. Chlldren: Leakages, CostsBExperiences from India, The Johns Hopkins University Press, and Kenef*tsGhana, and Thailand 1971. 62 pages (including in . KnudsenRashid Faruqee bibliography). Analyzes some of the economic
.aruqee LC 70-155166. ISBN 0-8018-1317-4, issues involvecd in the supplementalReviews four categories of health LC0 70-155166 papeb[a0-01-11 feeding of malnourished children.indicators (environment, services $4.00 (f2.40) paperback. Demonstrates that supplementaloffered, services received, and feeding programs are economicallychanges in mortality, morbidity, and Demographic Aspects of justified if minimum improvementsnutritional status) in order to evaluate in mortality rates and more substan-the impact of health projects in India, Migration in West Africa tial increases in productivity takeGhana, and Thailand. -Volume 1 place.
World Bank Staff Working Paper K. C. Zachariah World Bank Staff Working Paper No.P[o. 546.1982. 44 pages. and others 451. April 1981. iu + 76 pages.
ISB[I 0-8213-017-9. $3.00. Background data on migration in Stock [Vo. WP-0451. $3.00.four English-speaking countries:Ghana, Sierra Leone, Liberia, and
-EW The Gambia. A regional analysis Experiments in FamilyNEW inbased on these studies is presented Planning: Lessons from
in Migration in West Africa:gBenefits and Costs of Food Demographic Aspects. the Developing WorldDistribution Policies: The World Bank Staff Working Paper No. Roberto Cuca andIndia Case 414. September 1980. vi + 363 pages Catherine S. P'iercePasquale L. Scandizzo and (including statistical annexes, A comprehensive review of experi-Gurushri Swamy bibliography). mental efforts in the developing
worid to determine more effectiveAnalyzes some of the characteristics Stock [Vo. WP-0414. $15.00. ways of providing family planningand the main consequences of the services.food distribution policies followed bythe Indian government and provides Demographic Aspects of The Johns Hopkins University Press,a quantification and a cost-benefit Migration in West Africa 1978. 276 pages (including bibliogra-analysis of their effects on con- -Volume 2 phy, index of experiments).sumers, producers, and the govern- K. C. Zachariah LC 77-16596. ISB[N 0-8018-2013-8,
and others $19.50 (f77.50) hardcover;World Bank Staff Working Paper ISBIY 0-8018-2014-6, $8.95 (f4.00)[Yo. 509. August 1982. 54 pages. Background data on migration in paperback.
four French-speaking countries: IvoryISB[Y 0-8213-0011-3. $3.00. Coast, Upper Volta, Senegal, and
Togo. A regional analysis based on
Ann :n-fenice Fredrick Golladay,Roberto Cuca coordinating author . nDmMUiïf
World Bank Staff Working Paper IYo. Draws on experience gained from wi fPn E2ællf0n 2 1345. July 1979. xii + 134 pages health components of seventy World & ffl0Ei(including 2 annexes, references). Bank projects in forty-four countries R-ashid FEaruqee
between 1975 and 1978.Stock No. WP-0345. $5.00. Emphasizes the disoroportionately Analyzes the findings of an experi-
high expenditures incurred on cura- ment carried out in Narangwal, ative medicine, maintenance of expen- village in Punjab, India, between 1968
e -1- .-| ".' , ,snt EalEUn&OnnOsive hospitals, and sophisticated and 1974 related to health care andUYTFrh&• ID«D WEO fEsflHy lnnaDw? training of medical personnel at the family planning. The World Bank col-Susan hï. Cochrarne cost of preventive care for the laborated with The Johns lHopkinsA model identifying the many chan- majority of the people. Foints out University in analyzing this data from
that low-cost health care systems are one of the best known and well-docu-nels through which education might feasible and recommends that the mented field experiments in healthact to determine fertility and a review rRank begin regular and direct lend- (are and family planning in the worid.
botween education and the interven- ing for health, in addition to having World Bank Staff Working Papering variables in the model that affect health components as part of [Vo. 515. September 1982. 47 pages.
fertility. ~~~~~~projects in other sectors.fertility. ISB[N 0-8213-0003-2. $3,00.Sector Policy Paper. February 1980.
The Johns Hlopkins University Press, 90 pages (including 8 annexes,1979. 188 pages (including bibliogra- 4 figes map). dng 8 rench,phy, index). 4 figures, map). English, French,LC 78-26070. ISBNV 0-8018-2140-1, Japanese, Spanish, andArabic. n 9nDtb$6.95 (74.75) paperback. Stock Nos. PP-8001-E, PP-8001-F, (See description under Country
PP-8001-J, PP-8001-S, PP-8001-A. Studies listing.)$5.00.
IFe2&nDiiy maD& RegmalUaunzu !-- '- - =; -i f - rE17:Vr:kc
Rashid Farugee nIM &z D (See description under DevelopmentBashid Faruqee ~~~~~Fredrick Go'tIaday listing.)
World Bank Staff Working Paper IVo. World Bank Staff Vllorking Paper [Vo.383. April 1980. iv + 50 pages 412. August 1980. ii + 53 pages. D(including references). Stock No. WP-0412. $3.00.Stock No. KIP-0383. $3.00.
-__ __ Shiomo Reutlingeer anid-- Gy NEGU~[ Karcele Selowsky
lEt:D&0D r 1 l p- .-- Sli2(lli The first large research effort in theWorld Bank to determine the global
i1X&l&nO2n llmêEDvrt§C3Dno 1I ne ust aDF E59mîîin@En& En4l dimension of malnutrition.
(c:oé CD9 (7F[uc: 5pzcM . The Johns Hopkins University Press,Lioyd Marbert and Rashid Faruqee and 1976; 2nd printing, 1978. 94 pagesPasquale L. Scandizzo Ethna Johnson (including 5 appendixes).
The impact of Chile's Complementary Surveys fourteen experiments and LC 76-17240. ISBN 0-8018-1868-0,Feeding Program (CFP), both on the special projects in health, nutrition, $4.75 (22.85) paperback.direct and indirect beneficiaries, is and family planning in India and pro- Spanish: Desnutriciôn y pobreza:analyzed. 3escribes Chile's major poses guidelines for future Bank magnitudes y opciones de politica.nutrition intervention programs and projects on the basis of the survey. Editorial Tecn 1977establishes the relative importance of cnos,the CFP in terms of budgetary expen- World Bank Staff Working Paper ISBN 84-309-0726-2, 380 pesetas.ditures and number of beneficiaries No. 507. February 1982. xi + 97 pagesreached. Reviews briefly the pro- (including references). rgrams past limitations, recent Stock No. WP-0507. $5.00. &CD aMÉ FCVMr7O K CM$éreforms, and potential effectiveness. 3crû cD~ I «w trlfx
IlorId Bank Staff Working Paper No. (C l=IrM512. May 1982. v + 45 pages (including Rakesh Mohan,bibliography, annex). M. Wilhelm Wagner,ISBN 0-8213-0001-6. $3.00. and Jorge Garcia
Attempts to measure the extent ofmaInutrition and poverty in the citiesof Bogota and Cali, Colombia. One

of five papers resulting from a Population Policy andresearch program entitled "City Family Planning Programs:Study," a study of the workings of Trends in Policy andfive major urban sectors inColombia. AdministrationWorld Bank Staff Working Paper Io. Kandiah Kanagaratnam and447. April 1981. 80 pages (including atere . iercebibliography, appendixes). World Bank Staff Working Paper [No.Stock /Yo. WP-0447. $3.00. 411. August 1980. iii + 22 pages
(including footnotes).
Migration in West Africa: Stock No. WP-04L7. $3.00.Demographic AspectsK. C. Zachariah and Regional Aspects of FamilyJulien Condé Planning and FertilityThe first study of the large-scale Behavior in Indonesiamovernent of people in nine West Dov Chernichovsky andAfrican countries. Discusses the Oey Astra Meesookvolume and direction of internal and Discusses the recent decline inexternal flows and the economic and .ndonesias population growth ratesocial characteristics of migrants. despite that country's relatively low
A joint World Bank-OECD study. Oxford level of income and socioeconomicUniversity Press, 1981. 166 pages development. Reviews the history(including 22 maps, bibliography, and organization of the family plan-index). ning program and attempts to iden-tify those factors that have beenLC 80-21352. ISBIY 0-19-520186-8, responsible for its success and$19.95 (£10.50) hardcover: assesses its prospects for the future.ISBN 0-19-520187-6, $8.95 (f4.50) World Batk Staff Working Paper [o.paperback, 462. May 1981. 62 pages (including
appendix, references).Nutrition and Food INeeds Stock No. WP-0462. $3 00.in Developing CountriesOdin K. Knudsen and REPRINTSPasquale L. Scandizzo Health Care in the Developing Worid:
World Bank Staff Working Paper No. Problems of Scarcity and Choice(Shattuck Lecture)328. May 1979. 73 pages (including John R. Evans, Karen Lashman Hall, and4 appendixes). Jeremy J WarfordStock No. WP-0328. $3.00. Worid Bank Reprint Series: Number 209
Reprnnted from New England Journal of Medicine,vol, 305 (Nouember 1981):1117-27
Population and Poverty in Stock No RP-0209. Free of charge
the Developing WorldNancy Birdsall Measurement of Deprivation and
Poverty Based on the ProportionWorld Bank Staff Working Paper No. Spent on Food: An Exploratory404. July 1980. 96 pages (including Exercise2 appendixes, bibliography). VV Bhanoji Rao
World Bank Reprint Series Nulmber 193Stock No. WP-0404. $3.00. Reprmt7ed from World Development, vol 9, no 4
(1981) 337-53
Stock No RP-0193 Free of chargePopulation Policies andEconomic Development Nutrition, Health, and Education: TheTimothy King and others Economîc Significance of
Complementarities at Early AgeThe English-language edition is Marcelo Selowskyout of print. World Batik Reprint Series N'inuber 218
Reprinted froui Journal of DevelopmentSpanish: Polfticas de poblaciôn y Economics, vol 9 (1981p331-46desarrollo econômico. Editorial Stock No RP-0218 Free ofchargeTecnos, 1975.ISBN3 84-309-0605-3, 440 pesetas.


WORLD BANK PUBLICATIONSORDER FORM
SEND TO:WORLD BANK PUBLICATIONS WORLD BANK PUBLICATIONSP.O. BOX 37525 or 66, AVENUE D'IÉNAWASHINGTON, D.C. 20013 75116 PARIS, FRANCEU.S.A.
Name:
Address:
Stock or ISBN # Author, Title Qty Price Total
Sub-Total Cost:
Postage & handling fee for more than two free items ($1.00 each):
Total copies: _ _ Air mail surcharge ($2.00 each):
TOTAL PAYMENT ENCLOSED
Make checks payable: WORLD BANK PUBLICATIONS
Prepayment on orders from individuals is requested Purchase orders are accepted from booksellers, library suppliers, libraries, and institutionsAll prices include cost of postage by the least expensive means The prices and publication dates quoted in this Catalog are subject to changewîthout notice
No refunds will be gîven for items that cannot be filled Credit wili be applied towards future ordersNo more than two free publications will be provided wîthout charge Requests for additional copies will be fiîled at a charge of US $1.00 per
copy to cover handiîng and postage costsAirmail delivery will require a prepayment of US $2 00 per copyMail-order payment to the Worid Bank need not be in U S dollars, but the amount remitted must be at the rate of exchange on the day the
order is placed The World Bank will also accept Unesco coupons


HG 3881.5 nW57 W67 N0O559c.3
FARUQEF, RASHID, 1938-
RAPID POPULATION GROWTH INSUB-SAHARAN AFRICA :
DATE NAME AND EXTENSION NUROOMNUMBER

The Wreld I3nkzHeadquar1ers:1818 H Street, N WWashington, D C 20433, U.S A .Telephone (202) 477-1234Telex WUI 64145 WORLDBANK
RCA 248423 WORLDBKCable address INTBAFRAD
WASFIING1 ONDC
Eezzpv CliiS<S, avenue d'Iéna75116 Pans, France
Telephone: 723.54.21Telex: 842-620628
'Ty¢@ O oce:Xokusai Building1-1, Marunouchi 3-chomeChiyoda-ku, Tokyo l00, Japan
Telephone: 214-S501Telex: 781-26838
ISS1 0253-2RM5/US1BN 0-8223-OnZ7-9