Embed Size (px)
Citation preview
RAPID MAPPING FOR BUILT HERITAGE AT RISK USING LOW-COST AND COTS
SENSORS. A TEST IN THE DUOMO VECCHIO OF SAN SEVERINO MARCHE
A. Calantropio a, E. Colucci a, L. Teppati Losè a *
a DAD, Department of Architecture and Design, Politecnico di Torino, Viale Mattioli 39, 10129 Torino, Italy.
(alessio.calantropio, elisabetta.colucci, lorenzo.teppati)@polito.it
Commission II
KEY WORDS: Built Heritage, Rapid Mapping, Sensor calibration, 3D model comparison, SfM
ABSTRACT:
In the last years, the researchers in the field of Geomatics have focused their attention in the experimentation and validation of new
methodologies and techniques, stressing especially the potential of low-cost and COTS (Commercial Off The Shelf) solutions and
sensors. In particular, these tools have been used with purposes of rapid mapping in different contexts (ranging from the construction
industry, environmental monitoring, mining activities, etc.). The Built Heritage, due to its intrinsic nature of endangered artefact, can
largely benefit from the technological and methodological innovations in this research field. The contribute presented in this paper will
highlight these main topics: the rapid mapping of the Built Heritage (in particular the one subjected to different types of risk) using
low-cost and COTS solutions. Different sensors and techniques were chosen to be evaluated on a specific test site: the Duomo Vecchio
of San Severino Marche (MC - Italy), that was partially affected by the earthquake swarm that hit the area of Central Italy starting from
the 24th of August 2016. One of the main aims of this work is to demonstrate how low-cost and COTS sensors can contribute to the
documentation of the Built Heritage for its safeguard, for damage assessment in case of disastrous events and operations of restoration
and preservation.
1. INTRODUCTION
Among the last researches addresses in Geomatics two key
elements can be identify in the field of Rapid Mapping for the
Built Heritage: time and sustainability. Often, especially in case
of calamitous event, the time dedicated to the operations of
survey in the field is restricted due to peculiar conditions (safety
of the operator, need of metric data and products in short amount
of time, etc.). Moreover, researchers are moving their attention in
the direction of the sustainability of approaches and techniques,
both from an economical point of view and human resources
employed. After a brief overview of the actual state of research
in this specific field the work presented will focus on the use of
low-cost and COTS (Commercial Off The Shelf) sensors for the
generation of 3D models through a SfM (Structure from Motion)
approach. First, a comparison between two different products of
the Faro CAM2 is presented, to evaluate their use as ground truth
indicator and to choose the more sustainable option. Then,
different software solutions developed on an image-based
approach, both commercial and open source, were tested to
analyse the different available outputs. A deeper analysis was
also achieved in the attempt to calibrate the different sensors and
estimate the differences between the self-calibration performed
by the tested photogrammetric software. Finally, some
qualitative and quantitative analyses realised on the available
products are presented.
1.1 Rapid Mapping strategies with low-cost and COTS
solutions for the Built Heritage at risk
One of the most accepted definition of Rapid Mapping can be
identify in the one provided by the European programme
Copernicus (http://emergency.copernicus.eu) that states that
Rapid Mapping can be defined as: “on-demand and fast
provision (within hours or days) of geospatial information in
support of emergency management activities immediately
following an emergency event.” The traditional Rapid Mapping
approaches through the use of satellite data have already proven
* Corresponding author
their efficiency in post disaster scenarios for the creation of large
scale maps useful to support the operations in the field (Ajmar et
al., 2015; Cooner et al., 2016; De Alwis Pitts and So, 2017;
Yamazaki and Liu, 2016). In the context of a multiscale
approach, especially for the Rapid Mapping of the Built Heritage,
in at risk scenarios is crucial to adopt different strategies to
achieve a higher detail of areas of specific interest. For example,
the rapid growth in the use of UAVs for aerial photogrammetry
is having a big impact also in these scenarios (Boccardo et al.,
2015; Chiabrando et al., 2017; Fernandez Galarreta et al., 2015)
creating new perspectives for the management of future events
and new operation procedures. However, in this work the focus
will be set on different types of sensors and considering a
different scale (mainly architectural) and the aerial contribution
will not be considered in this part of research.Different groups of
researchers have already investigated the use of low-cost and
COTS sensors in different scenarios (Chiabrando et al., 2017;
Das et al., 2015; Kolev et al., 2014; Micheletti et al, 2015),
however lot of questions are still open and the definition of
operative standards in this field is still missing.
1.2 The test site: the Duomo Vecchio of San Severino
Marche (MC - Italy)
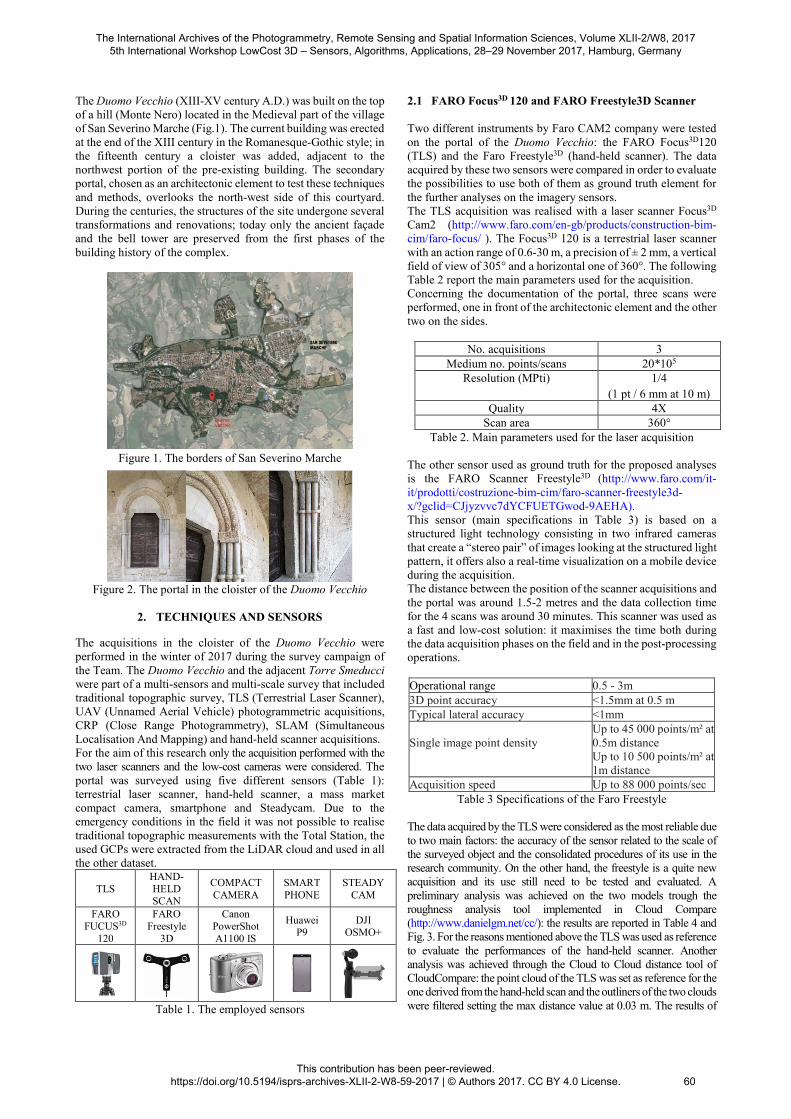
The site chosen to evaluate the low-cost and COTS sensors is a
small portal (Fig.2) of the Duomo Vecchio of San Severino
Marche (MC - Italy). The survey campaign conduced in this area
is part of the activities of the student team DIRECT (DIsaster
RECovery Team of the Politecnico di Torino, in the framework
of the task force created after the earthquake swarm in the area of
Central Italy. The Team DIRECT is composed by students, with
different academic backgrounds (architecture and engineering),
involved every year in training activity, both theoretical classes
and stages in the field. This project aims to contribute actively to
the protection of the Built Heritage and the environmental and
architectural assets and it is focused on the heritage vulnerable to
natural hazard and risk or subjected to ordinary dangers.
The International Archives of the Photogrammetry, Remote Sensing and Spatial Information Sciences, Volume XLII-2/W8, 2017 5th International Workshop LowCost 3D – Sensors, Algorithms, Applications, 28–29 November 2017, Hamburg, Germany
This contribution has been peer-reviewed. https://doi.org/10.5194/isprs-archives-XLII-2-W8-59-2017 | © Authors 2017. CC BY 4.0 License.
59
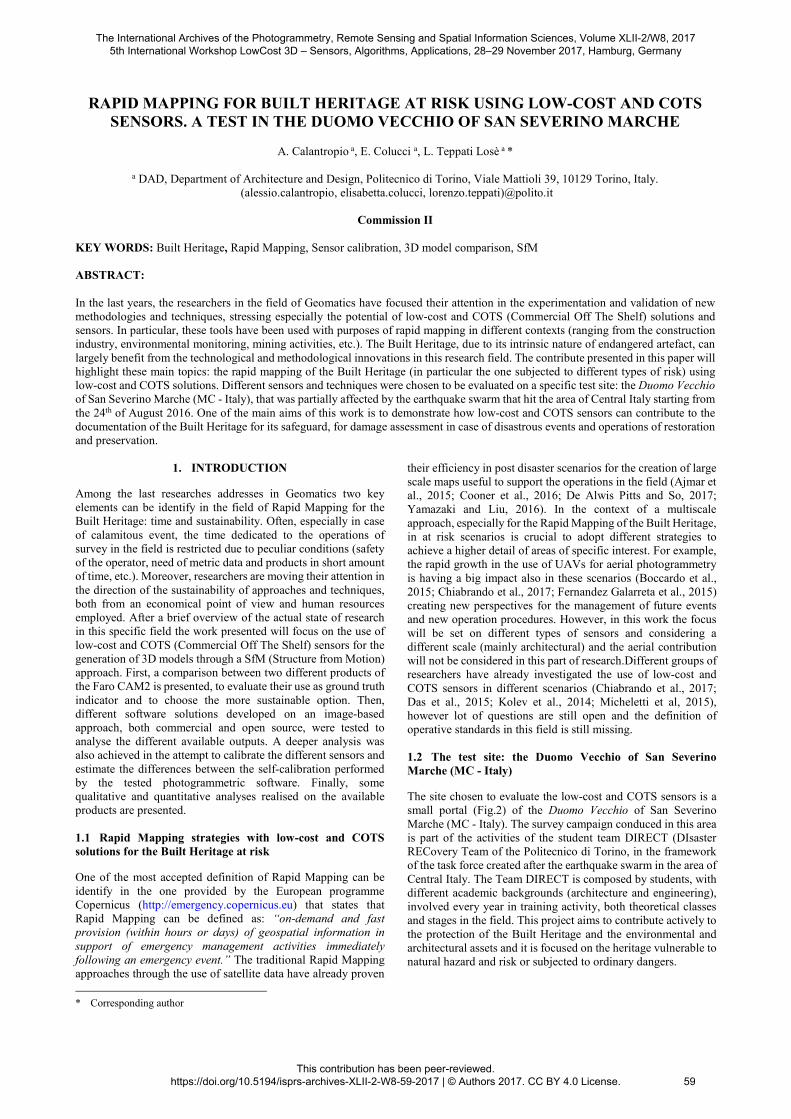
The Duomo Vecchio (XIII-XV century A.D.) was built on the top
of a hill (Monte Nero) located in the Medieval part of the village
of San Severino Marche (Fig.1). The current building was erected
at the end of the XIII century in the Romanesque-Gothic style; in
the fifteenth century a cloister was added, adjacent to the
northwest portion of the pre-existing building. The secondary
portal, chosen as an architectonic element to test these techniques
and methods, overlooks the north-west side of this courtyard.
During the centuries, the structures of the site undergone several
transformations and renovations; today only the ancient façade
and the bell tower are preserved from the first phases of the
building history of the complex.
Figure 1. The borders of San Severino Marche
Figure 2. The portal in the cloister of the Duomo Vecchio
2. TECHNIQUES AND SENSORS
The acquisitions in the cloister of the Duomo Vecchio were
performed in the winter of 2017 during the survey campaign of
the Team. The Duomo Vecchio and the adjacent Torre Smeducci
were part of a multi-sensors and multi-scale survey that included
traditional topographic survey, TLS (Terrestrial Laser Scanner),
UAV (Unnamed Aerial Vehicle) photogrammetric acquisitions,
CRP (Close Range Photogrammetry), SLAM (Simultaneous
Localisation And Mapping) and hand-held scanner acquisitions.
For the aim of this research only the acquisition performed with the
two laser scanners and the low-cost cameras were considered. The
portal was surveyed using five different sensors (Table 1):
terrestrial laser scanner, hand-held scanner, a mass market
compact camera, smartphone and Steadycam. Due to the
emergency conditions in the field it was not possible to realise
traditional topographic measurements with the Total Station, the
used GCPs were extracted from the LiDAR cloud and used in all
the other dataset.
TLS
HAND-
HELD SCAN
COMPACT
CAMERA
SMART
PHONE
STEADY
CAM
FARO
FUCUS3D
120
FARO
Freestyle
3D
Canon
PowerShot
A1100 IS
Huawei P9
DJI OSMO+
Table 1. The employed sensors
2.1 FARO Focus3D 120 and FARO Freestyle3D Scanner
Two different instruments by Faro CAM2 company were tested
on the portal of the Duomo Vecchio: the FARO Focus3D120
(TLS) and the Faro Freestyle3D (hand-held scanner). The data
acquired by these two sensors were compared in order to evaluate
the possibilities to use both of them as ground truth element for
the further analyses on the imagery sensors.
The TLS acquisition was realised with a laser scanner Focus3D
Cam2 (http://www.faro.com/en-gb/products/construction-bim-
cim/faro-focus/ ). The Focus3D 120 is a terrestrial laser scanner
with an action range of 0.6-30 m, a precision of ± 2 mm, a vertical
field of view of 305° and a horizontal one of 360°. The following
Table 2 report the main parameters used for the acquisition.
Concerning the documentation of the portal, three scans were
performed, one in front of the architectonic element and the other
two on the sides.
No. acquisitions 3
Medium no. points/scans 20*105
Resolution (MPti) 1/4
(1 pt / 6 mm at 10 m)
Quality 4X
Scan area 360°
Table 2. Main parameters used for the laser acquisition
The other sensor used as ground truth for the proposed analyses
is the FARO Scanner Freestyle3D (http://www.faro.com/it-
it/prodotti/costruzione-bim-cim/faro-scanner-freestyle3d-
x/?gclid=CJjyzvvc7dYCFUETGwod-9AEHA).
This sensor (main specifications in Table 3) is based on a
structured light technology consisting in two infrared cameras
that create a “stereo pair” of images looking at the structured light
pattern, it offers also a real-time visualization on a mobile device
during the acquisition.
The distance between the position of the scanner acquisitions and
the portal was around 1.5-2 metres and the data collection time
for the 4 scans was around 30 minutes. This scanner was used as
a fast and low-cost solution: it maximises the time both during
the data acquisition phases on the field and in the post-processing
operations.
Operational range 0.5 - 3m
3D point accuracy <1.5mm at 0.5 m
Typical lateral accuracy <1mm
Single image point density
Up to 45 000 points/m² at
0.5m distance
Up to 10 500 points/m² at
1m distance
Acquisition speed Up to 88 000 points/sec
Table 3 Specifications of the Faro Freestyle
The data acquired by the TLS were considered as the most reliable due
to two main factors: the accuracy of the sensor related to the scale of
the surveyed object and the consolidated procedures of its use in the
research community. On the other hand, the freestyle is a quite new
acquisition and its use still need to be tested and evaluated. A
preliminary analysis was achieved on the two models trough the
roughness analysis tool implemented in Cloud Compare
(http://www.danielgm.net/cc/): the results are reported in Table 4 and
Fig. 3. For the reasons mentioned above the TLS was used as reference
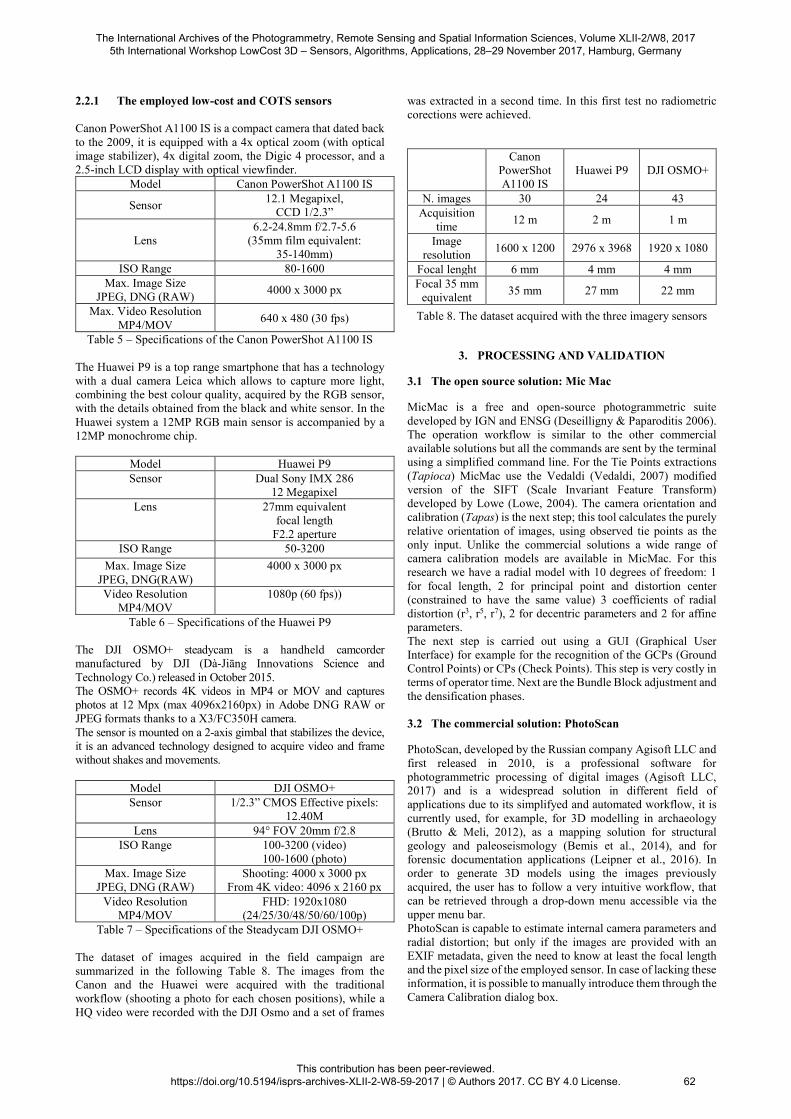
to evaluate the performances of the hand-held scanner. Another
analysis was achieved through the Cloud to Cloud distance tool of
CloudCompare: the point cloud of the TLS was set as reference for the
one derived from the hand-held scan and the outliners of the two clouds
were filtered setting the max distance value at 0.03 m. The results of
The International Archives of the Photogrammetry, Remote Sensing and Spatial Information Sciences, Volume XLII-2/W8, 2017 5th International Workshop LowCost 3D – Sensors, Algorithms, Applications, 28–29 November 2017, Hamburg, Germany
This contribution has been peer-reviewed. https://doi.org/10.5194/isprs-archives-XLII-2-W8-59-2017 | © Authors 2017. CC BY 4.0 License.
60
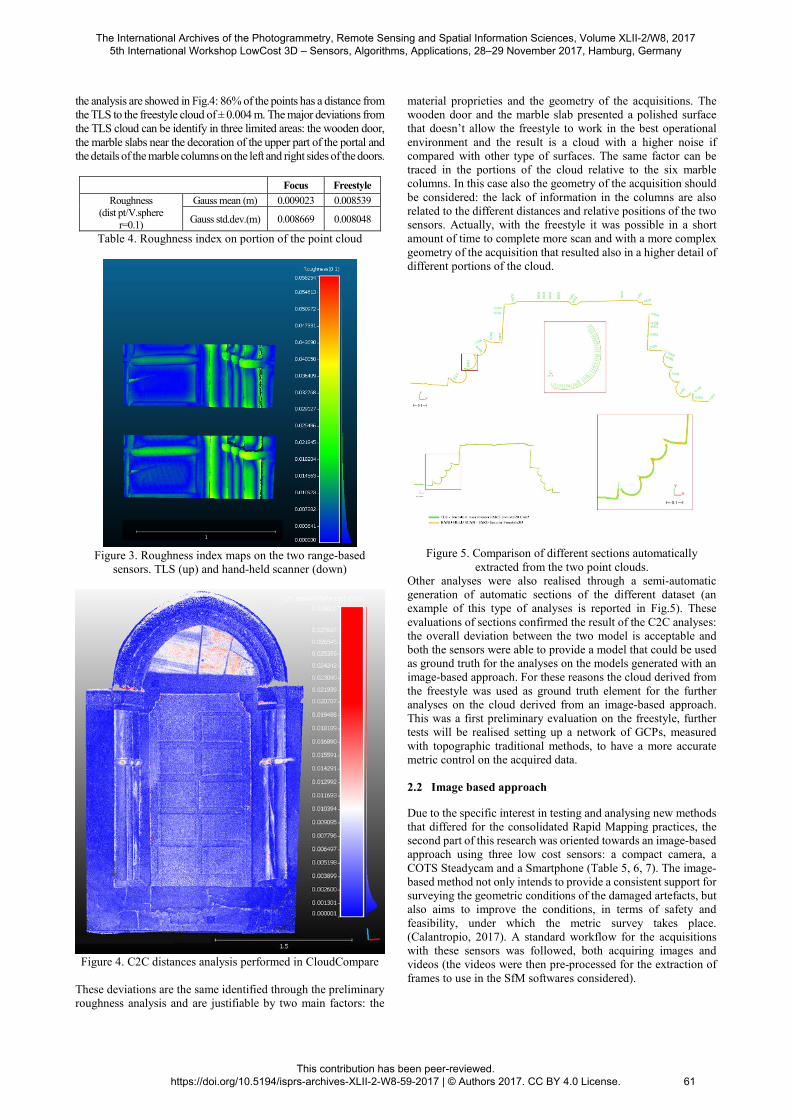
the analysis are showed in Fig.4: 86% of the points has a distance from
the TLS to the freestyle cloud of ± 0.004 m. The major deviations from
the TLS cloud can be identify in three limited areas: the wooden door,
the marble slabs near the decoration of the upper part of the portal and
the details of the marble columns on the left and right sides of the doors.
Focus Freestyle
Roughness (dist pt/V.sphere
r=0.1)
Gauss mean (m) 0.009023 0.008539
Gauss std.dev.(m) 0.008669 0.008048
Table 4. Roughness index on portion of the point cloud
Figure 3. Roughness index maps on the two range-based
sensors. TLS (up) and hand-held scanner (down)
Figure 4. C2C distances analysis performed in CloudCompare
These deviations are the same identified through the preliminary
roughness analysis and are justifiable by two main factors: the
material proprieties and the geometry of the acquisitions. The
wooden door and the marble slab presented a polished surface
that doesn’t allow the freestyle to work in the best operational
environment and the result is a cloud with a higher noise if
compared with other type of surfaces. The same factor can be
traced in the portions of the cloud relative to the six marble
columns. In this case also the geometry of the acquisition should
be considered: the lack of information in the columns are also
related to the different distances and relative positions of the two
sensors. Actually, with the freestyle it was possible in a short
amount of time to complete more scan and with a more complex
geometry of the acquisition that resulted also in a higher detail of
different portions of the cloud.
Figure 5. Comparison of different sections automatically
extracted from the two point clouds.
Other analyses were also realised through a semi-automatic
generation of automatic sections of the different dataset (an
example of this type of analyses is reported in Fig.5). These
evaluations of sections confirmed the result of the C2C analyses:
the overall deviation between the two model is acceptable and
both the sensors were able to provide a model that could be used
as ground truth for the analyses on the models generated with an
image-based approach. For these reasons the cloud derived from
the freestyle was used as ground truth element for the further
analyses on the cloud derived from an image-based approach.
This was a first preliminary evaluation on the freestyle, further
tests will be realised setting up a network of GCPs, measured
with topographic traditional methods, to have a more accurate
metric control on the acquired data.
2.2 Image based approach
Due to the specific interest in testing and analysing new methods
that differed for the consolidated Rapid Mapping practices, the
second part of this research was oriented towards an image-based
approach using three low cost sensors: a compact camera, a
COTS Steadycam and a Smartphone (Table 5, 6, 7). The image-
based method not only intends to provide a consistent support for
surveying the geometric conditions of the damaged artefacts, but
also aims to improve the conditions, in terms of safety and
feasibility, under which the metric survey takes place.
(Calantropio, 2017). A standard workflow for the acquisitions
with these sensors was followed, both acquiring images and
videos (the videos were then pre-processed for the extraction of
frames to use in the SfM softwares considered).
The International Archives of the Photogrammetry, Remote Sensing and Spatial Information Sciences, Volume XLII-2/W8, 2017 5th International Workshop LowCost 3D – Sensors, Algorithms, Applications, 28–29 November 2017, Hamburg, Germany
This contribution has been peer-reviewed. https://doi.org/10.5194/isprs-archives-XLII-2-W8-59-2017 | © Authors 2017. CC BY 4.0 License.
61
2.2.1 The employed low-cost and COTS sensors
Canon PowerShot A1100 IS is a compact camera that dated back
to the 2009, it is equipped with a 4x optical zoom (with optical
image stabilizer), 4x digital zoom, the Digic 4 processor, and a
2.5-inch LCD display with optical viewfinder.
Model Canon PowerShot A1100 IS
Sensor 12.1 Megapixel,
CCD 1/2.3”
Lens
6.2-24.8mm f/2.7-5.6
(35mm film equivalent:
35-140mm)
ISO Range 80-1600
Max. Image Size
JPEG, DNG (RAW) 4000 x 3000 px
Max. Video Resolution
MP4/MOV 640 x 480 (30 fps)
Table 5 – Specifications of the Canon PowerShot A1100 IS
The Huawei P9 is a top range smartphone that has a technology
with a dual camera Leica which allows to capture more light,
combining the best colour quality, acquired by the RGB sensor,
with the details obtained from the black and white sensor. In the
Huawei system a 12MP RGB main sensor is accompanied by a
12MP monochrome chip.
Model Huawei P9
Sensor Dual Sony IMX 286
12 Megapixel
Lens 27mm equivalent
focal length
F2.2 aperture
ISO Range 50-3200
Max. Image Size
JPEG, DNG(RAW)
4000 x 3000 px
Video Resolution
MP4/MOV
1080p (60 fps))
Table 6 – Specifications of the Huawei P9
The DJI OSMO+ steadycam is a handheld camcorder
manufactured by DJI (Dà-Jiāng Innovations Science and
Technology Co.) released in October 2015.
The OSMO+ records 4K videos in MP4 or MOV and captures
photos at 12 Mpx (max 4096x2160px) in Adobe DNG RAW or
JPEG formats thanks to a X3/FC350H camera.
The sensor is mounted on a 2-axis gimbal that stabilizes the device,
it is an advanced technology designed to acquire video and frame
without shakes and movements.
Model DJI OSMO+
Sensor 1/2.3” CMOS Effective pixels:
12.40M
Lens 94° FOV 20mm f/2.8
ISO Range 100-3200 (video)
100-1600 (photo)
Max. Image Size
JPEG, DNG (RAW)
Shooting: 4000 x 3000 px
From 4K video: 4096 x 2160 px
Video Resolution
MP4/MOV
FHD: 1920x1080
(24/25/30/48/50/60/100p)
Table 7 – Specifications of the Steadycam DJI OSMO+
The dataset of images acquired in the field campaign are
summarized in the following Table 8. The images from the
Canon and the Huawei were acquired with the traditional
workflow (shooting a photo for each chosen positions), while a
HQ video were recorded with the DJI Osmo and a set of frames
was extracted in a second time. In this first test no radiometric
corections were achieved.
Canon
PowerShot
A1100 IS
Huawei P9 DJI OSMO+
N. images 30 24 43
Acquisition
time 12 m 2 m 1 m
Image
resolution 1600 x 1200 2976 x 3968 1920 x 1080
Focal lenght 6 mm 4 mm 4 mm
Focal 35 mm
equivalent 35 mm 27 mm 22 mm
Table 8. The dataset acquired with the three imagery sensors
3. PROCESSING AND VALIDATION
3.1 The open source solution: Mic Mac
MicMac is a free and open-source photogrammetric suite
developed by IGN and ENSG (Deseilligny & Paparoditis 2006).
The operation workflow is similar to the other commercial
available solutions but all the commands are sent by the terminal
using a simplified command line. For the Tie Points extractions
(Tapioca) MicMac use the Vedaldi (Vedaldi, 2007) modified
version of the SIFT (Scale Invariant Feature Transform)
developed by Lowe (Lowe, 2004). The camera orientation and
calibration (Tapas) is the next step; this tool calculates the purely
relative orientation of images, using observed tie points as the
only input. Unlike the commercial solutions a wide range of
camera calibration models are available in MicMac. For this
research we have a radial model with 10 degrees of freedom: 1
for focal length, 2 for principal point and distortion center
(constrained to have the same value) 3 coefficients of radial
distortion (r3, r5, r7), 2 for decentric parameters and 2 for affine
parameters.
The next step is carried out using a GUI (Graphical User
Interface) for example for the recognition of the GCPs (Ground
Control Points) or CPs (Check Points). This step is very costly in
terms of operator time. Next are the Bundle Block adjustment and
the densification phases.
3.2 The commercial solution: PhotoScan
PhotoScan, developed by the Russian company Agisoft LLC and
first released in 2010, is a professional software for
photogrammetric processing of digital images (Agisoft LLC,
2017) and is a widespread solution in different field of
applications due to its simplifyed and automated workflow, it is
currently used, for example, for 3D modelling in archaeology
(Brutto & Meli, 2012), as a mapping solution for structural
geology and paleoseismology (Bemis et al., 2014), and for
forensic documentation applications (Leipner et al., 2016). In
order to generate 3D models using the images previously
acquired, the user has to follow a very intuitive workflow, that
can be retrieved through a drop-down menu accessible via the
upper menu bar.
PhotoScan is capable to estimate internal camera parameters and
radial distortion; but only if the images are provided with an
EXIF metadata, given the need to know at least the focal length
and the pixel size of the employed sensor. In case of lacking these
information, it is possible to manually introduce them through the
Camera Calibration dialog box.
The International Archives of the Photogrammetry, Remote Sensing and Spatial Information Sciences, Volume XLII-2/W8, 2017 5th International Workshop LowCost 3D – Sensors, Algorithms, Applications, 28–29 November 2017, Hamburg, Germany
This contribution has been peer-reviewed. https://doi.org/10.5194/isprs-archives-XLII-2-W8-59-2017 | © Authors 2017. CC BY 4.0 License.
62
In this software it is possible to estimate the following calibration
parameters: Focal length in x- and y-dimensions measured in
pixels (fx, fy), Principal point coordinates, i.e. coordinates of lens
optical axis interception with sensor plane (cx, cy), Skew
transformation coefficient, Radial distortion coefficients (k1, k2,
k3, k4) and Tangential distortion coefficients (p1, p2, p3, p4)
After aligning the photos trough tie points detection with the first
step, the software generates a sparse point cloud. In order to
obtain a good quality 3D model, it is necessary to first compute
a dense point cloud; based on the estimated camera positions, the
software process depth information for every given camera.
Dense cloud can be exported for performing analysis using
external tools, or further processed for the generation of textured
mesh, tiled model, DEM (Digital Elevation Model) and
orthomosaic.
3.3 Camera Calibrator
As previously stated, the reflexion on the use of these kind of
low-cost and COTS sensors with a photogrammetric approach is
still mainly unexplored and operative standard are still missing.
One of the aim of this research was to perform a standard and
preliminary calibration of the employed sensors, to better
understand their performances, especially if compared with the
camera parameters given by consolidated software solutions.
To perform the calibration of these sensors the Single Camera
Calibrator app of MATLAB was used (MathWorks, 2017). This
speditive tool is intended for image processing and computer
vision purposes and the aim of the software is to automatically
estimate intrinsic, extrinsic, and lens distortion parameters, given
a set of 10-20 images of a specific calibration pattern (Figure 6);
thus, it can be successfully used for a preliminary estimation of
lens distortion parameters for photogrammetric purposes.
The used pattern was created using a CNC (Computer Numerical
Control) laser-cutting machine on a wooden table to have a clean
and plane surface and with a high precision of the geometric
features. It’s fundamental to acquire the images of the pattern
with a fixed zoom and focus. While the calibration requires at
least three images (10-20 are the suggested), we acquired and
used around 30 images for each sensor. The images must be
acquired with a specific configuration, changing the distance and
the orientation between pattern and sensor, to achieve good
results (some example of the acquired images and of the
processing with Camera Calibrator in Figure 7). The calibration
algorithm assumes a pinhole camera model, and after running the
applications results and the accuracies of the process are
displayed.
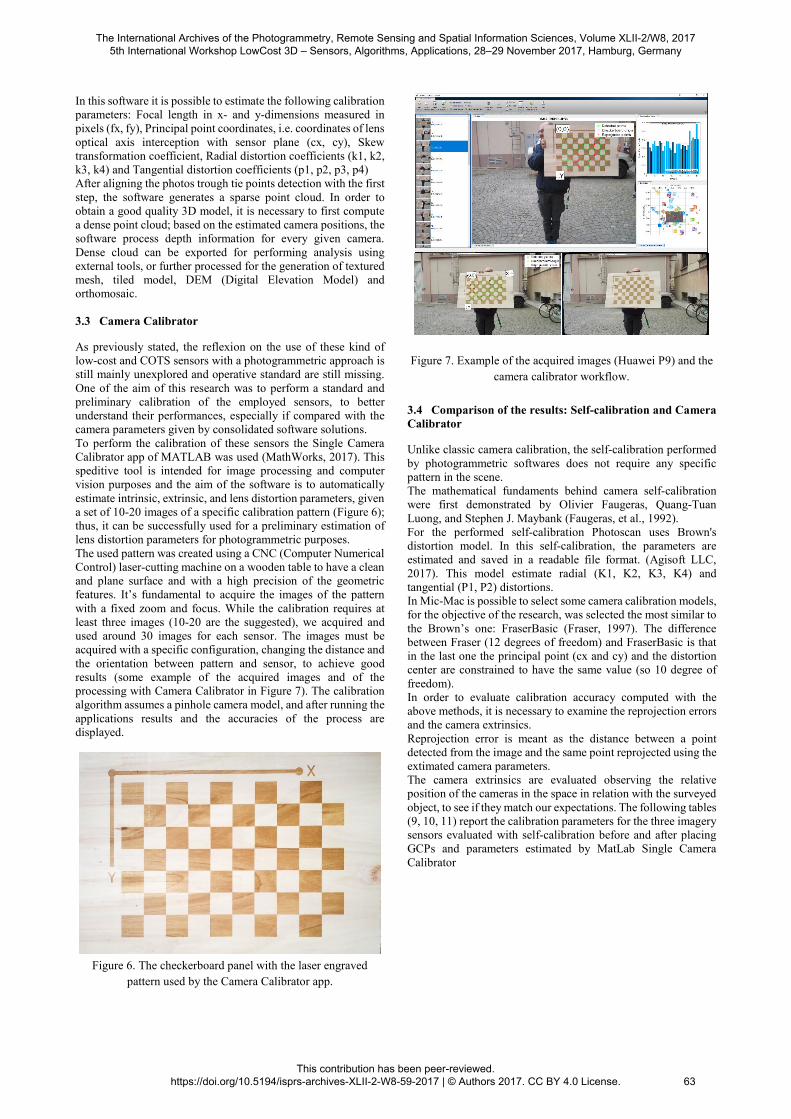
Figure 6. The checkerboard panel with the laser engraved
pattern used by the Camera Calibrator app.
Figure 7. Example of the acquired images (Huawei P9) and the
camera calibrator workflow.
3.4 Comparison of the results: Self-calibration and Camera
Calibrator
Unlike classic camera calibration, the self-calibration performed
by photogrammetric softwares does not require any specific
pattern in the scene.
The mathematical fundaments behind camera self-calibration
were first demonstrated by Olivier Faugeras, Quang-Tuan
Luong, and Stephen J. Maybank (Faugeras, et al., 1992).
For the performed self-calibration Photoscan uses Brown's
distortion model. In this self-calibration, the parameters are
estimated and saved in a readable file format. (Agisoft LLC,
2017). This model estimate radial (K1, K2, K3, K4) and
tangential (P1, P2) distortions.
In Mic-Mac is possible to select some camera calibration models,
for the objective of the research, was selected the most similar to
the Brown’s one: FraserBasic (Fraser, 1997). The difference
between Fraser (12 degrees of freedom) and FraserBasic is that
in the last one the principal point (cx and cy) and the distortion
center are constrained to have the same value (so 10 degree of
freedom).
In order to evaluate calibration accuracy computed with the
above methods, it is necessary to examine the reprojection errors
and the camera extrinsics.
Reprojection error is meant as the distance between a point
detected from the image and the same point reprojected using the
extimated camera parameters.
The camera extrinsics are evaluated observing the relative
position of the cameras in the space in relation with the surveyed
object, to see if they match our expectations. The following tables
(9, 10, 11) report the calibration parameters for the three imagery
sensors evaluated with self-calibration before and after placing
GCPs and parameters estimated by MatLab Single Camera
Calibrator
The International Archives of the Photogrammetry, Remote Sensing and Spatial Information Sciences, Volume XLII-2/W8, 2017 5th International Workshop LowCost 3D – Sensors, Algorithms, Applications, 28–29 November 2017, Hamburg, Germany
This contribution has been peer-reviewed. https://doi.org/10.5194/isprs-archives-XLII-2-W8-59-2017 | © Authors 2017. CC BY 4.0 License.
63
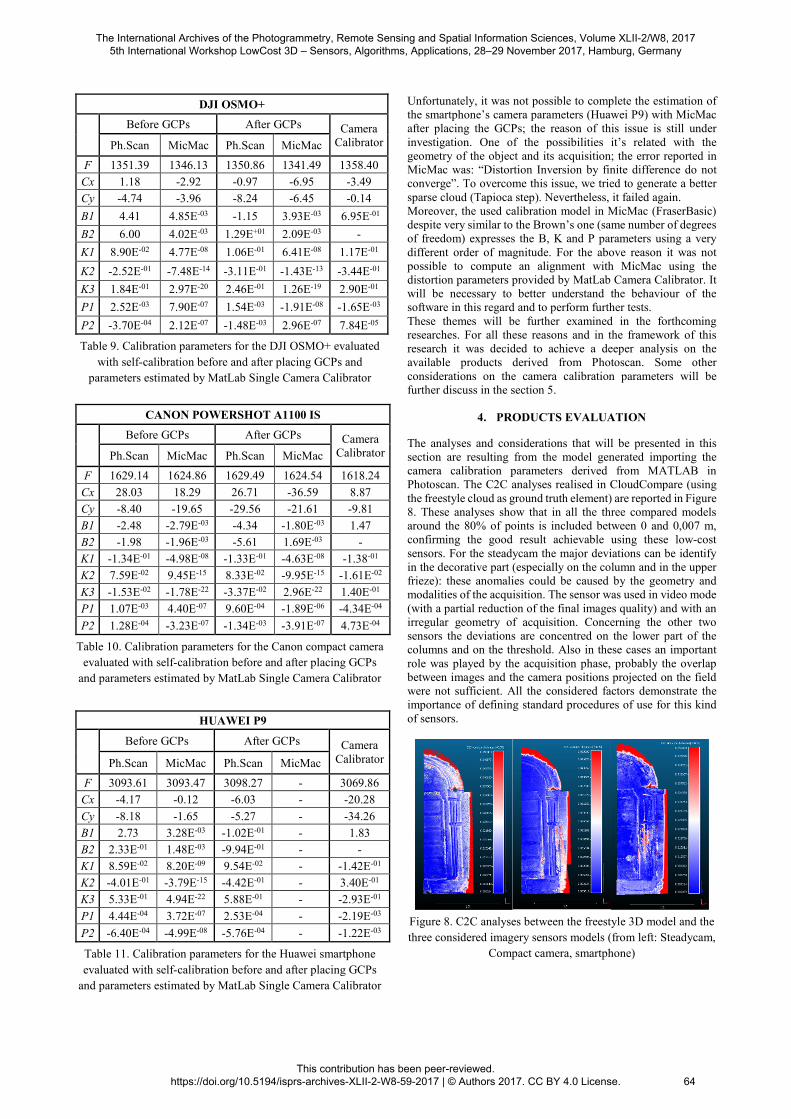
DJI OSMO+
Before GCPs After GCPs Camera
Calibrator Ph.Scan MicMac Ph.Scan MicMac
F 1351.39 1346.13 1350.86 1341.49 1358.40
Cx 1.18 -2.92 -0.97 -6.95 -3.49
Cy -4.74 -3.96 -8.24 -6.45 -0.14
B1 4.41 4.85E-03 -1.15 3.93E-03 6.95E-01
B2 6.00 4.02E-03 1.29E+01 2.09E-03 -
K1 8.90E-02 4.77E-08 1.06E-01 6.41E-08 1.17E-01
K2 -2.52E-01 -7.48E-14 -3.11E-01 -1.43E-13 -3.44E-01
K3 1.84E-01 2.97E-20 2.46E-01 1.26E-19 2.90E-01
P1 2.52E-03 7.90E-07 1.54E-03 -1.91E-08 -1.65E-03
P2 -3.70E-04 2.12E-07 -1.48E-03 2.96E-07 7.84E-05
Table 9. Calibration parameters for the DJI OSMO+ evaluated
with self-calibration before and after placing GCPs and
parameters estimated by MatLab Single Camera Calibrator
CANON POWERSHOT A1100 IS
Before GCPs After GCPs Camera
Calibrator Ph.Scan MicMac Ph.Scan MicMac
F 1629.14 1624.86 1629.49 1624.54 1618.24
Cx 28.03 18.29 26.71 -36.59 8.87
Cy -8.40 -19.65 -29.56 -21.61 -9.81
B1 -2.48 -2.79E-03 -4.34 -1.80E-03 1.47
B2 -1.98 -1.96E-03 -5.61 1.69E-03 -
K1 -1.34E-01 -4.98E-08 -1.33E-01 -4.63E-08 -1.38-01
K2 7.59E-02 9.45E-15 8.33E-02 -9.95E-15 -1.61E-02
K3 -1.53E-02 -1.78E-22 -3.37E-02 2.96E-22 1.40E-01
P1 1.07E-03 4.40E-07 9.60E-04 -1.89E-06 -4.34E-04
P2 1.28E-04 -3.23E-07 -1.34E-03 -3.91E-07 4.73E-04
Table 10. Calibration parameters for the Canon compact camera
evaluated with self-calibration before and after placing GCPs
and parameters estimated by MatLab Single Camera Calibrator
HUAWEI P9
Before GCPs After GCPs Camera
Calibrator Ph.Scan MicMac Ph.Scan MicMac
F 3093.61 3093.47 3098.27 - 3069.86
Cx -4.17 -0.12 -6.03 - -20.28
Cy -8.18 -1.65 -5.27 - -34.26
B1 2.73 3.28E-03 -1.02E-01 - 1.83
B2 2.33E-01 1.48E-03 -9.94E-01 - -
K1 8.59E-02 8.20E-09 9.54E-02 - -1.42E-01
K2 -4.01E-01 -3.79E-15 -4.42E-01 - 3.40E-01
K3 5.33E-01 4.94E-22 5.88E-01 - -2.93E-01
P1 4.44E-04 3.72E-07 2.53E-04 - -2.19E-03
P2 -6.40E-04 -4.99E-08 -5.76E-04 - -1.22E-03
Table 11. Calibration parameters for the Huawei smartphone
evaluated with self-calibration before and after placing GCPs
and parameters estimated by MatLab Single Camera Calibrator
Unfortunately, it was not possible to complete the estimation of
the smartphone’s camera parameters (Huawei P9) with MicMac
after placing the GCPs; the reason of this issue is still under
investigation. One of the possibilities it’s related with the
geometry of the object and its acquisition; the error reported in
MicMac was: “Distortion Inversion by finite difference do not
converge”. To overcome this issue, we tried to generate a better
sparse cloud (Tapioca step). Nevertheless, it failed again.
Moreover, the used calibration model in MicMac (FraserBasic)
despite very similar to the Brown’s one (same number of degrees
of freedom) expresses the B, K and P parameters using a very
different order of magnitude. For the above reason it was not
possible to compute an alignment with MicMac using the
distortion parameters provided by MatLab Camera Calibrator. It
will be necessary to better understand the behaviour of the
software in this regard and to perform further tests.
These themes will be further examined in the forthcoming
researches. For all these reasons and in the framework of this
research it was decided to achieve a deeper analysis on the
available products derived from Photoscan. Some other
considerations on the camera calibration parameters will be
further discuss in the section 5.
4. PRODUCTS EVALUATION
The analyses and considerations that will be presented in this
section are resulting from the model generated importing the
camera calibration parameters derived from MATLAB in
Photoscan. The C2C analyses realised in CloudCompare (using
the freestyle cloud as ground truth element) are reported in Figure
8. These analyses show that in all the three compared models
around the 80% of points is included between 0 and 0,007 m,
confirming the good result achievable using these low-cost
sensors. For the steadycam the major deviations can be identify
in the decorative part (especially on the column and in the upper
frieze): these anomalies could be caused by the geometry and
modalities of the acquisition. The sensor was used in video mode
(with a partial reduction of the final images quality) and with an
irregular geometry of acquisition. Concerning the other two
sensors the deviations are concentred on the lower part of the
columns and on the threshold. Also in these cases an important
role was played by the acquisition phase, probably the overlap
between images and the camera positions projected on the field
were not sufficient. All the considered factors demonstrate the
importance of defining standard procedures of use for this kind
of sensors.
Figure 8. C2C analyses between the freestyle 3D model and the
three considered imagery sensors models (from left: Steadycam,
Compact camera, smartphone)
The International Archives of the Photogrammetry, Remote Sensing and Spatial Information Sciences, Volume XLII-2/W8, 2017 5th International Workshop LowCost 3D – Sensors, Algorithms, Applications, 28–29 November 2017, Hamburg, Germany
This contribution has been peer-reviewed. https://doi.org/10.5194/isprs-archives-XLII-2-W8-59-2017 | © Authors 2017. CC BY 4.0 License.
64
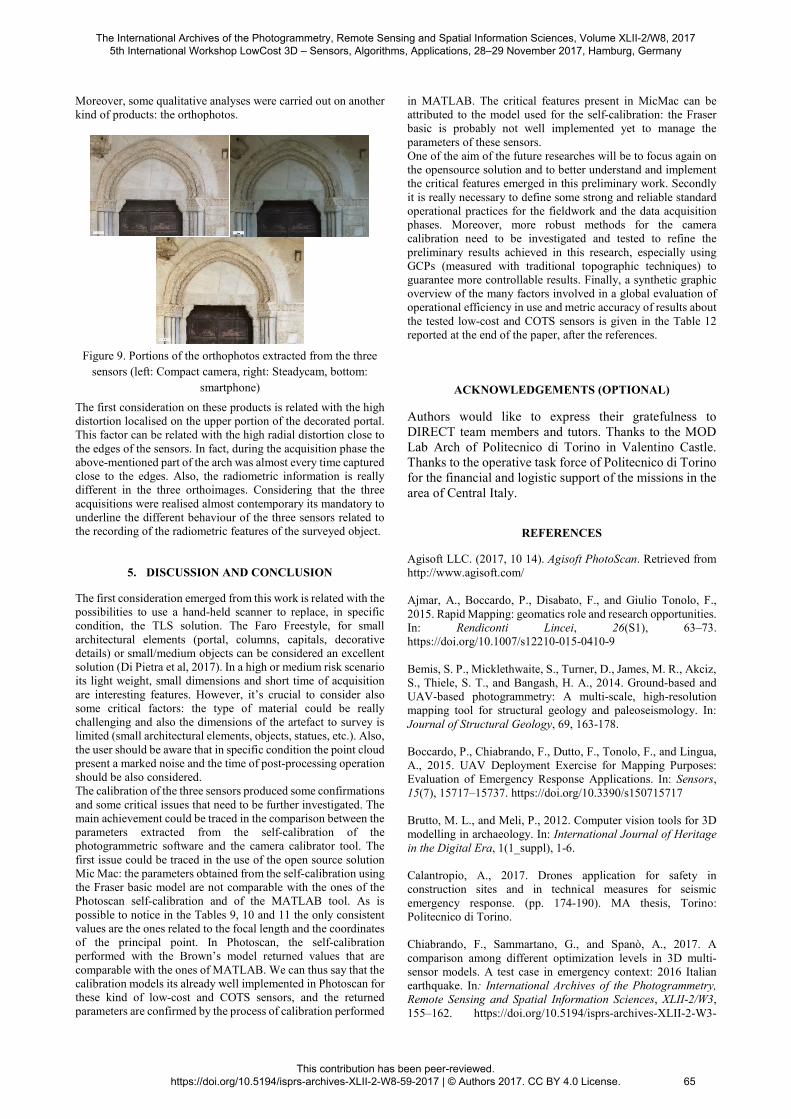
Moreover, some qualitative analyses were carried out on another
kind of products: the orthophotos.
Figure 9. Portions of the orthophotos extracted from the three
sensors (left: Compact camera, right: Steadycam, bottom:
smartphone)
The first consideration on these products is related with the high
distortion localised on the upper portion of the decorated portal.
This factor can be related with the high radial distortion close to
the edges of the sensors. In fact, during the acquisition phase the
above-mentioned part of the arch was almost every time captured
close to the edges. Also, the radiometric information is really
different in the three orthoimages. Considering that the three
acquisitions were realised almost contemporary its mandatory to
underline the different behaviour of the three sensors related to
the recording of the radiometric features of the surveyed object.
5. DISCUSSION AND CONCLUSION
The first consideration emerged from this work is related with the
possibilities to use a hand-held scanner to replace, in specific
condition, the TLS solution. The Faro Freestyle, for small
architectural elements (portal, columns, capitals, decorative
details) or small/medium objects can be considered an excellent
solution (Di Pietra et al, 2017). In a high or medium risk scenario
its light weight, small dimensions and short time of acquisition
are interesting features. However, it’s crucial to consider also
some critical factors: the type of material could be really
challenging and also the dimensions of the artefact to survey is
limited (small architectural elements, objects, statues, etc.). Also,
the user should be aware that in specific condition the point cloud
present a marked noise and the time of post-processing operation
should be also considered.
The calibration of the three sensors produced some confirmations
and some critical issues that need to be further investigated. The
main achievement could be traced in the comparison between the
parameters extracted from the self-calibration of the
photogrammetric software and the camera calibrator tool. The
first issue could be traced in the use of the open source solution
Mic Mac: the parameters obtained from the self-calibration using
the Fraser basic model are not comparable with the ones of the
Photoscan self-calibration and of the MATLAB tool. As is
possible to notice in the Tables 9, 10 and 11 the only consistent
values are the ones related to the focal length and the coordinates
of the principal point. In Photoscan, the self-calibration
performed with the Brown’s model returned values that are
comparable with the ones of MATLAB. We can thus say that the
calibration models its already well implemented in Photoscan for
these kind of low-cost and COTS sensors, and the returned
parameters are confirmed by the process of calibration performed
in MATLAB. The critical features present in MicMac can be
attributed to the model used for the self-calibration: the Fraser
basic is probably not well implemented yet to manage the
parameters of these sensors.
One of the aim of the future researches will be to focus again on
the opensource solution and to better understand and implement
the critical features emerged in this preliminary work. Secondly
it is really necessary to define some strong and reliable standard
operational practices for the fieldwork and the data acquisition
phases. Moreover, more robust methods for the camera
calibration need to be investigated and tested to refine the
preliminary results achieved in this research, especially using
GCPs (measured with traditional topographic techniques) to
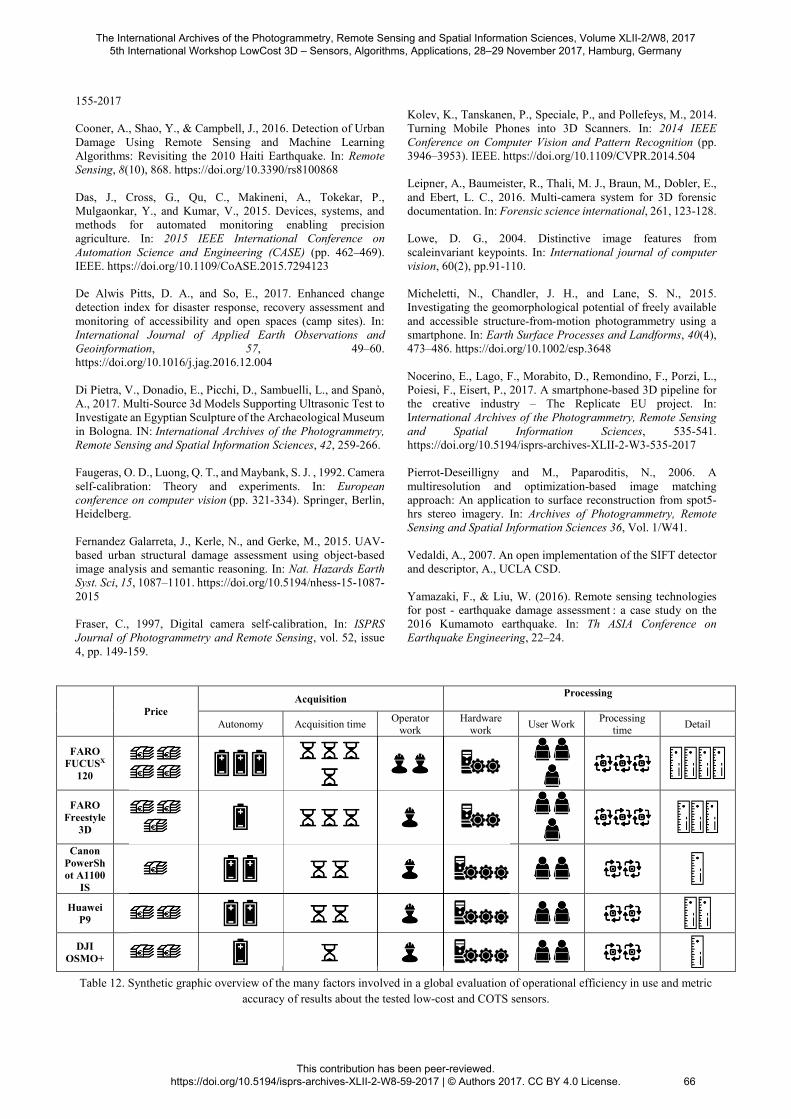
guarantee more controllable results. Finally, a synthetic graphic
overview of the many factors involved in a global evaluation of
operational efficiency in use and metric accuracy of results about
the tested low-cost and COTS sensors is given in the Table 12
reported at the end of the paper, after the references.
ACKNOWLEDGEMENTS (OPTIONAL)
Authors would like to express their gratefulness to
DIRECT team members and tutors. Thanks to the MOD
Lab Arch of Politecnico di Torino in Valentino Castle.
Thanks to the operative task force of Politecnico di Torino
for the financial and logistic support of the missions in the
area of Central Italy.
REFERENCES
Agisoft LLC. (2017, 10 14). Agisoft PhotoScan. Retrieved from
http://www.agisoft.com/
Ajmar, A., Boccardo, P., Disabato, F., and Giulio Tonolo, F.,
2015. Rapid Mapping: geomatics role and research opportunities.
In: Rendiconti Lincei, 26(S1), 63–73.
https://doi.org/10.1007/s12210-015-0410-9
Bemis, S. P., Micklethwaite, S., Turner, D., James, M. R., Akciz,
S., Thiele, S. T., and Bangash, H. A., 2014. Ground-based and
UAV-based photogrammetry: A multi-scale, high-resolution
mapping tool for structural geology and paleoseismology. In:
Journal of Structural Geology, 69, 163-178.
Boccardo, P., Chiabrando, F., Dutto, F., Tonolo, F., and Lingua,
A., 2015. UAV Deployment Exercise for Mapping Purposes:
Evaluation of Emergency Response Applications. In: Sensors,
15(7), 15717–15737. https://doi.org/10.3390/s150715717
Brutto, M. L., and Meli, P., 2012. Computer vision tools for 3D
modelling in archaeology. In: International Journal of Heritage
in the Digital Era, 1(1_suppl), 1-6.
Calantropio, A., 2017. Drones application for safety in
construction sites and in technical measures for seismic
emergency response. (pp. 174-190). MA thesis, Torino:
Politecnico di Torino.
Chiabrando, F., Sammartano, G., and Spanò, A., 2017. A
comparison among different optimization levels in 3D multi-
sensor models. A test case in emergency context: 2016 Italian
earthquake. In: International Archives of the Photogrammetry,
Remote Sensing and Spatial Information Sciences, XLII-2/W3,
155–162. https://doi.org/10.5194/isprs-archives-XLII-2-W3-
The International Archives of the Photogrammetry, Remote Sensing and Spatial Information Sciences, Volume XLII-2/W8, 2017 5th International Workshop LowCost 3D – Sensors, Algorithms, Applications, 28–29 November 2017, Hamburg, Germany
This contribution has been peer-reviewed. https://doi.org/10.5194/isprs-archives-XLII-2-W8-59-2017 | © Authors 2017. CC BY 4.0 License.
65
155-2017
Cooner, A., Shao, Y., & Campbell, J., 2016. Detection of Urban
Damage Using Remote Sensing and Machine Learning
Algorithms: Revisiting the 2010 Haiti Earthquake. In: Remote
Sensing, 8(10), 868. https://doi.org/10.3390/rs8100868
Das, J., Cross, G., Qu, C., Makineni, A., Tokekar, P.,
Mulgaonkar, Y., and Kumar, V., 2015. Devices, systems, and
methods for automated monitoring enabling precision
agriculture. In: 2015 IEEE International Conference on
Automation Science and Engineering (CASE) (pp. 462–469).
IEEE. https://doi.org/10.1109/CoASE.2015.7294123
De Alwis Pitts, D. A., and So, E., 2017. Enhanced change
detection index for disaster response, recovery assessment and
monitoring of accessibility and open spaces (camp sites). In:
International Journal of Applied Earth Observations and
Geoinformation, 57, 49–60.
https://doi.org/10.1016/j.jag.2016.12.004
Di Pietra, V., Donadio, E., Picchi, D., Sambuelli, L., and Spanò,
A., 2017. Multi-Source 3d Models Supporting Ultrasonic Test to
Investigate an Egyptian Sculpture of the Archaeological Museum
in Bologna. IN: International Archives of the Photogrammetry,
Remote Sensing and Spatial Information Sciences, 42, 259-266.
Faugeras, O. D., Luong, Q. T., and Maybank, S. J. , 1992. Camera
self-calibration: Theory and experiments. In: European
conference on computer vision (pp. 321-334). Springer, Berlin,
Heidelberg.
Fernandez Galarreta, J., Kerle, N., and Gerke, M., 2015. UAV-
based urban structural damage assessment using object-based
image analysis and semantic reasoning. In: Nat. Hazards Earth
Syst. Sci, 15, 1087–1101. https://doi.org/10.5194/nhess-15-1087-
2015
Fraser, C., 1997, Digital camera self-calibration, In: ISPRS
Journal of Photogrammetry and Remote Sensing, vol. 52, issue
4, pp. 149-159.
Kolev, K., Tanskanen, P., Speciale, P., and Pollefeys, M., 2014.
Turning Mobile Phones into 3D Scanners. In: 2014 IEEE
Conference on Computer Vision and Pattern Recognition (pp.
3946–3953). IEEE. https://doi.org/10.1109/CVPR.2014.504
Leipner, A., Baumeister, R., Thali, M. J., Braun, M., Dobler, E.,
and Ebert, L. C., 2016. Multi-camera system for 3D forensic
documentation. In: Forensic science international, 261, 123-128.
Lowe, D. G., 2004. Distinctive image features from
scaleinvariant keypoints. In: International journal of computer
vision, 60(2), pp.91-110.
Micheletti, N., Chandler, J. H., and Lane, S. N., 2015.
Investigating the geomorphological potential of freely available
and accessible structure-from-motion photogrammetry using a
smartphone. In: Earth Surface Processes and Landforms, 40(4),
473–486. https://doi.org/10.1002/esp.3648
Nocerino, E., Lago, F., Morabito, D., Remondino, F., Porzi, L.,
Poiesi, F., Eisert, P., 2017. A smartphone-based 3D pipeline for
the creative industry – The Replicate EU project. In:
International Archives of the Photogrammetry, Remote Sensing
and Spatial Information Sciences, 535-541.
https://doi.org/10.5194/isprs-archives-XLII-2-W3-535-2017
Pierrot-Deseilligny and M., Paparoditis, N., 2006. A
multiresolution and optimization-based image matching
approach: An application to surface reconstruction from spot5-
hrs stereo imagery. In: Archives of Photogrammetry, Remote
Sensing and Spatial Information Sciences 36, Vol. 1/W41.
Vedaldi, A., 2007. An open implementation of the SIFT detector
and descriptor, A., UCLA CSD.
Yamazaki, F., & Liu, W. (2016). Remote sensing technologies
for post - earthquake damage assessment : a case study on the
2016 Kumamoto earthquake. In: Th ASIA Conference on
Earthquake Engineering, 22–24.
Table 12. Synthetic graphic overview of the many factors involved in a global evaluation of operational efficiency in use and metric
accuracy of results about the tested low-cost and COTS sensors.
Price
Acquisition Processing
Autonomy Acquisition time Operator
work Hardware
work User Work
Processing time
Detail
FARO
FUCUSX
120
FARO
Freestyle
3D
Canon
PowerSh
ot A1100
IS
Huawei
P9
DJI
OSMO+
The International Archives of the Photogrammetry, Remote Sensing and Spatial Information Sciences, Volume XLII-2/W8, 2017 5th International Workshop LowCost 3D – Sensors, Algorithms, Applications, 28–29 November 2017, Hamburg, Germany
This contribution has been peer-reviewed. https://doi.org/10.5194/isprs-archives-XLII-2-W8-59-2017 | © Authors 2017. CC BY 4.0 License.
66