Embed Size (px)
Citation preview
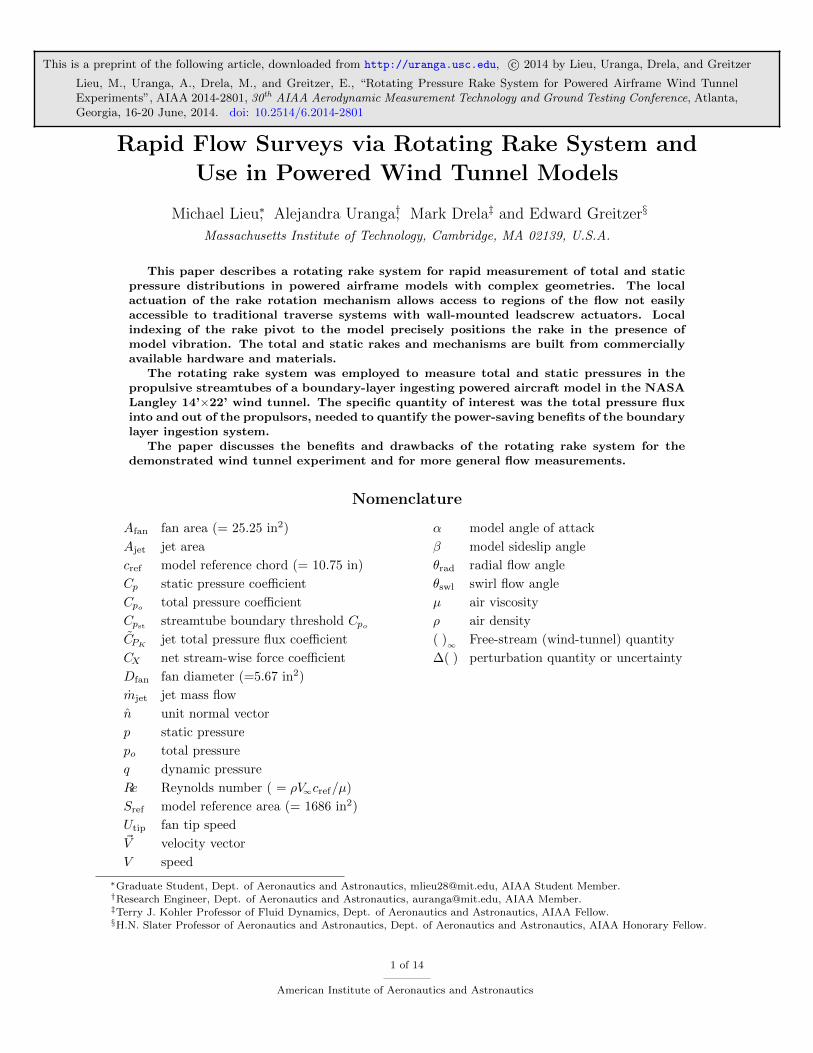
This is a preprint of the following article, downloaded from http://uranga.usc.edu, c© 2014 by Lieu, Uranga, Drela, and Greitzer
Lieu, M., Uranga, A., Drela, M., and Greitzer, E., “Rotating Pressure Rake System for Powered Airframe Wind TunnelExperiments”, AIAA 2014-2801, 30th AIAA Aerodynamic Measurement Technology and Ground Testing Conference, Atlanta,Georgia, 16-20 June, 2014. doi: 10.2514/6.2014-2801
Rapid Flow Surveys via Rotating Rake System and
Use in Powered Wind Tunnel Models
Michael Lieu∗, Alejandra Uranga†, Mark Drela‡ and Edward Greitzer§
Massachusetts Institute of Technology, Cambridge, MA 02139, U.S.A.
This paper describes a rotating rake system for rapid measurement of total and staticpressure distributions in powered airframe models with complex geometries. The localactuation of the rake rotation mechanism allows access to regions of the flow not easilyaccessible to traditional traverse systems with wall-mounted leadscrew actuators. Localindexing of the rake pivot to the model precisely positions the rake in the presence ofmodel vibration. The total and static rakes and mechanisms are built from commerciallyavailable hardware and materials.
The rotating rake system was employed to measure total and static pressures in thepropulsive streamtubes of a boundary-layer ingesting powered aircraft model in the NASALangley 14’×22’ wind tunnel. The specific quantity of interest was the total pressure fluxinto and out of the propulsors, needed to quantify the power-saving benefits of the boundarylayer ingestion system.
The paper discusses the benefits and drawbacks of the rotating rake system for thedemonstrated wind tunnel experiment and for more general flow measurements.
Nomenclature
Afan fan area (= 25.25 in2)
Ajet jet area
cref model reference chord (= 10.75 in)
Cp static pressure coefficient
Cpototal pressure coefficient
Cpststreamtube boundary threshold Cpo
CPKjet total pressure flux coefficient
CX net stream-wise force coefficient
Dfan fan diameter (=5.67 in2)
mjet jet mass flow
n unit normal vector
p static pressure
po total pressure
q dynamic pressure
Re Reynolds number ( = ρV∞cref/µ)
Sref model reference area (= 1686 in2)
Utip fan tip speed~V velocity vector
V speed
α model angle of attack
β model sideslip angle
θrad radial flow angle
θswl swirl flow angle
µ air viscosity
ρ air density
( )∞ Free-stream (wind-tunnel) quantity
∆( ) perturbation quantity or uncertainty
∗Graduate Student, Dept. of Aeronautics and Astronautics, [email protected], AIAA Student Member.†Research Engineer, Dept. of Aeronautics and Astronautics, [email protected], AIAA Member.‡Terry J. Kohler Professor of Fluid Dynamics, Dept. of Aeronautics and Astronautics, AIAA Fellow.§H.N. Slater Professor of Aeronautics and Astronautics, Dept. of Aeronautics and Astronautics, AIAA Honorary Fellow.
1 of 14
American Institute of Aeronautics and Astronautics
I. Introduction
There is a common need to survey and characterize flow coming into or out of propulsors. Five-holeprobe traverses are often used for detailed propulsor exit flow surveys, while mounted rakes are used
to characterize the inlet flow. These forms of measurements have their own drawbacks; five-hole probesurveys can be time consuming while mounted rakes can only obtain pressure data in a specific area. Fortime-sensitive experiments that require full flow field surveys to visualize the flow or calculate integratedquantities, a rotating rake systems is a viable option.
Measurements from a rotating rake are relatively quicker to obtain. Rakes have the advantage of mea-suring entire radial profiles simultaneously, in contrast to a 2D actuated, five-hole probe traverse where onespatial point is measured at a time. Rotating rake systems are also better suited for applications that requiredirect pressure measurements, as opposed to methods like particle image velocimetry where pressures mustbe post-processed from velocity data.
Rotating rake systems are not uncommon. For example, Sutliff’s1 propulsor aero-acoustic experimentfeatured a rake on a rotating drum wheel mounted on the outside the circumference of the propulsor. Typicalrotating rake systems use the rotating drum concept to survey the flow, but this setup can be cumbersomeand expensive. The rotating drum works best for isolated propulsor experiments, but becomes too bulky forexperiments that require flow surveys in locations where access is limited.
The rotating rake system described in this paper has specific applications to scaled, powered airframeexperiments, but the concept could be extended to larger experiments. The system is compact which allowsaccess to measurement planes not normally accessible with traditional setups, such as the planes upstreamof the propulsor. This also forgoes the need to conduct isolated experiments that simulate incoming flowoff the airframe since the surveys can be taken directly on the airframe model. The rotating rake systemfeatures an indexing capability which allows for spatial repeatability. This system is cost effective which isbeneficial for academic level experiments since many of the components are commercially available.
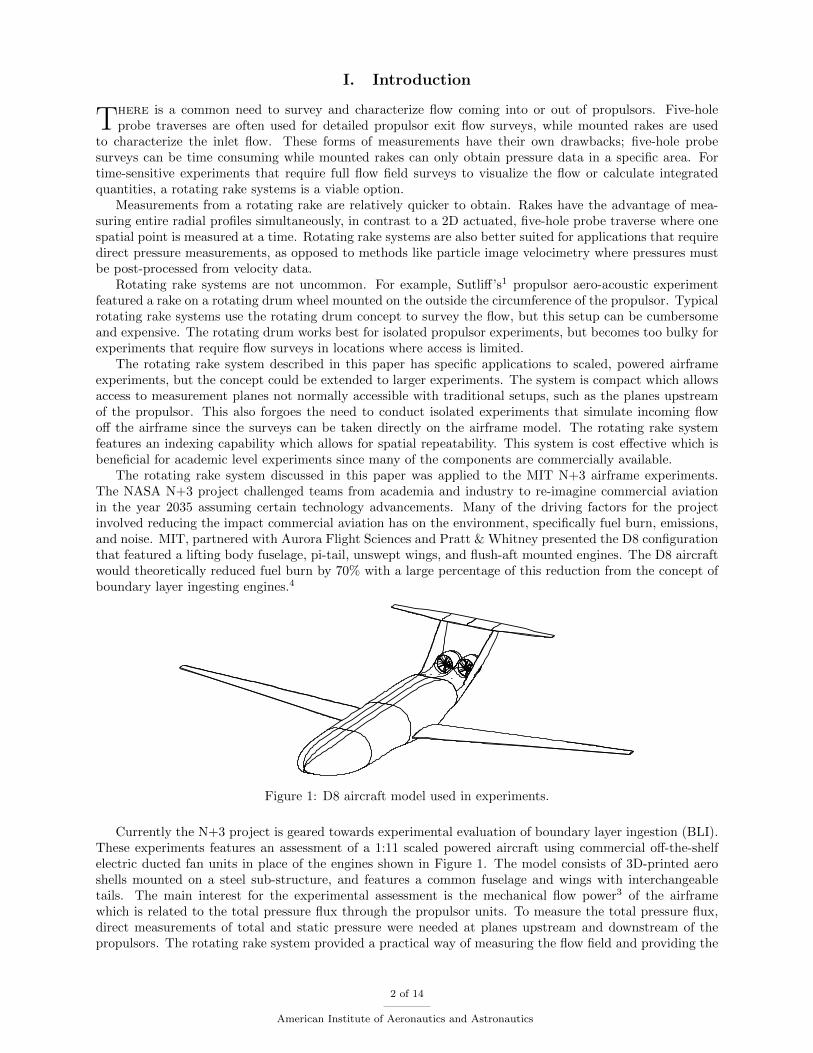
The rotating rake system discussed in this paper was applied to the MIT N+3 airframe experiments.The NASA N+3 project challenged teams from academia and industry to re-imagine commercial aviationin the year 2035 assuming certain technology advancements. Many of the driving factors for the projectinvolved reducing the impact commercial aviation has on the environment, specifically fuel burn, emissions,and noise. MIT, partnered with Aurora Flight Sciences and Pratt & Whitney presented the D8 configurationthat featured a lifting body fuselage, pi-tail, unswept wings, and flush-aft mounted engines. The D8 aircraftwould theoretically reduced fuel burn by 70% with a large percentage of this reduction from the concept ofboundary layer ingesting engines.4
Figure 1: D8 aircraft model used in experiments.
Currently the N+3 project is geared towards experimental evaluation of boundary layer ingestion (BLI).These experiments features an assessment of a 1:11 scaled powered aircraft using commercial off-the-shelfelectric ducted fan units in place of the engines shown in Figure 1. The model consists of 3D-printed aeroshells mounted on a steel sub-structure, and features a common fuselage and wings with interchangeabletails. The main interest for the experimental assessment is the mechanical flow power3 of the airframewhich is related to the total pressure flux through the propulsor units. To measure the total pressure flux,direct measurements of total and static pressure were needed at planes upstream and downstream of thepropulsors. The rotating rake system provided a practical way of measuring the flow field and providing the
2 of 14
American Institute of Aeronautics and Astronautics
total pressure flux on the model airframe.
II. Pressure Rakes
A. Rake Overview
In order to measure the total and static pressure fields of the propulsor inlet and exit, separate total andstatic rakes were manufactured for the rotating rake system. Although the total and static rakes do notprovide flow direction information, this still allowed the measurement of the jet total pressure flux to anacceptable level of accuracy.
The design of the rakes were based on the size of the propulsor and any predicted flow features thatneeded resolution. Both rakes used in the experiments were made in-house using readily available materialsand equipment. To ensure data quality, each rake was tested in a previously characterized flow to quantifymeasurement biases and sensitivity to yaw and pitch angles, or equivalently to swirl and radial flow anglesin a propulsor flow.
1 in0 0.25
0.125”
stainless steelhypodermic tubes0.028” diameter0.0035” wall
brass bar0.25” × 0.125”
3/8” brass tube0.062” diameter0.014” wall
brass tube0.0625” square
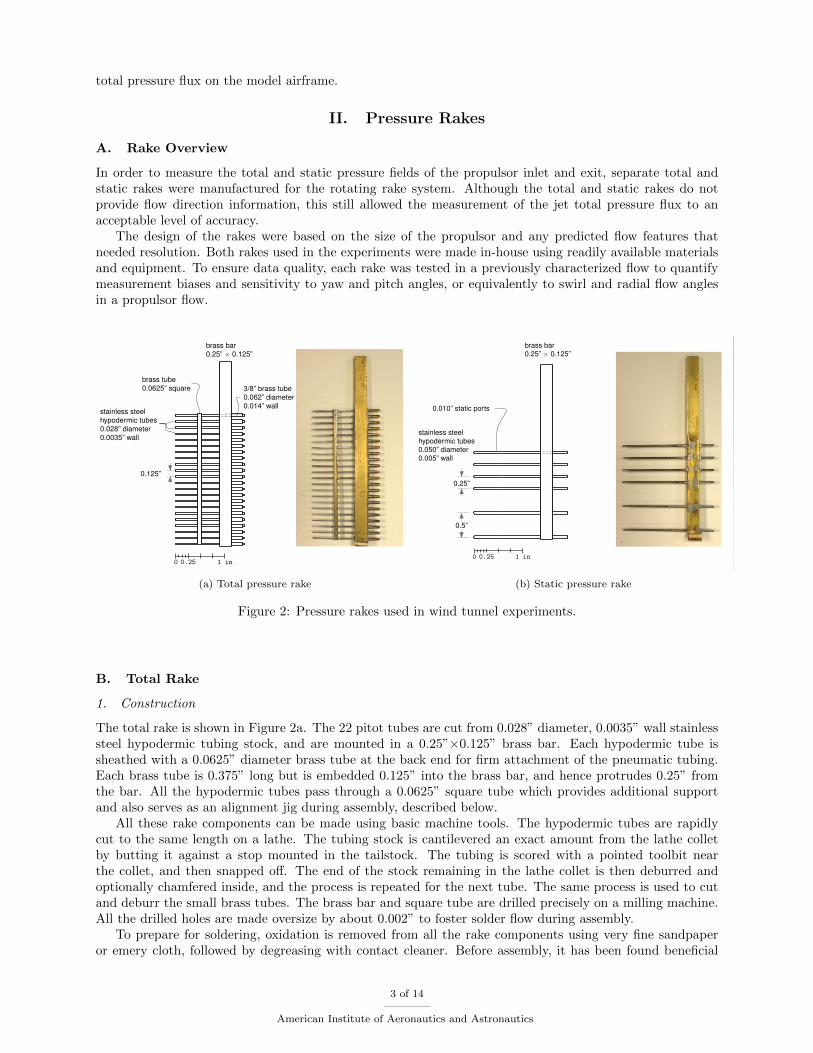
(a) Total pressure rake
1 in0 0.25
0.5”
0.25”
stainless steelhypodermic tubes0.050” diameter0.005” wall
brass bar0.25” × 0.125”
0.010” static ports
(b) Static pressure rake
Figure 2: Pressure rakes used in wind tunnel experiments.
B. Total Rake
1. Construction
The total rake is shown in Figure 2a. The 22 pitot tubes are cut from 0.028” diameter, 0.0035” wall stainlesssteel hypodermic tubing stock, and are mounted in a 0.25”×0.125” brass bar. Each hypodermic tube issheathed with a 0.0625” diameter brass tube at the back end for firm attachment of the pneumatic tubing.Each brass tube is 0.375” long but is embedded 0.125” into the brass bar, and hence protrudes 0.25” fromthe bar. All the hypodermic tubes pass through a 0.0625” square tube which provides additional supportand also serves as an alignment jig during assembly, described below.
All these rake components can be made using basic machine tools. The hypodermic tubes are rapidlycut to the same length on a lathe. The tubing stock is cantilevered an exact amount from the lathe colletby butting it against a stop mounted in the tailstock. The tubing is scored with a pointed toolbit nearthe collet, and then snapped off. The end of the stock remaining in the lathe collet is then deburred andoptionally chamfered inside, and the process is repeated for the next tube. The same process is used to cutand deburr the small brass tubes. The brass bar and square tube are drilled precisely on a milling machine.All the drilled holes are made oversize by about 0.002” to foster solder flow during assembly.
To prepare for soldering, oxidation is removed from all the rake components using very fine sandpaperor emery cloth, followed by degreasing with contact cleaner. Before assembly, it has been found beneficial
3 of 14
American Institute of Aeronautics and Astronautics
to pre-tin all the stainless steel tubes with soft solder and acid flux, using a soldering iron. Excess moltensolder is wiped off to enable assembly of the rake. This pre-tinning promotes solder wicking in the finalsoldering step.
The assembly of the rake is eased by the fact that it is largely self-jigging. For alignment, it is onlynecessary to press the pitot tube ends against a flat surface and the their tips against a straightedge. Thenthe acid flux is applied to all the metal joints with a pipette, followed by heating with the soldering iron andapplication of the solder. The soldering iron must have a large thermal mass so that it is not quenched bythe rake brass bar. Cleaning all oxidation from the solid-core solder helps quick wicking into all the joints.
The use of soft solder and soldering iron is very much easier than the alternative of using silver solderwith a torch. The relatively low temperature of the iron also has the advantage that it does not soften thehypodermic tubing metal. The soft solder joints have proven to be more than strong enough in use.
2. Measurement quality
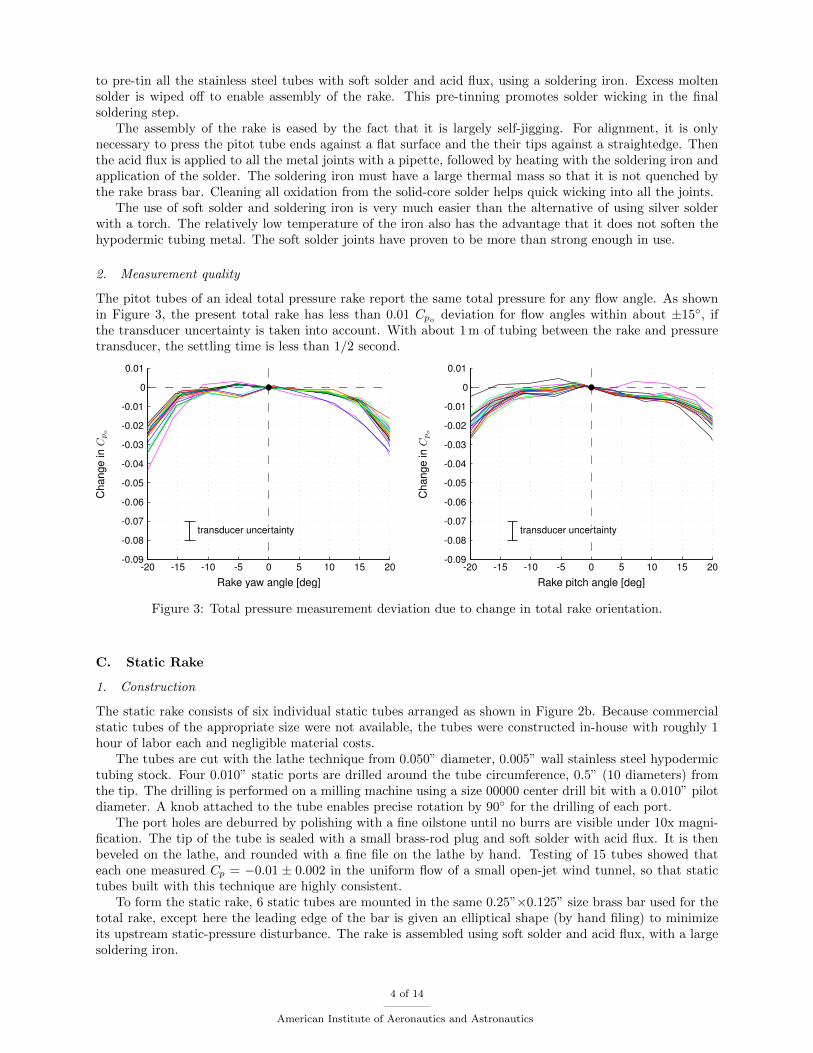
The pitot tubes of an ideal total pressure rake report the same total pressure for any flow angle. As shownin Figure 3, the present total rake has less than 0.01 Cpo deviation for flow angles within about ±15◦, ifthe transducer uncertainty is taken into account. With about 1 m of tubing between the rake and pressuretransducer, the settling time is less than 1/2 second.
-20 -15 -10 -5 0 5 10 15 20-0.09
-0.08
-0.07
-0.06
-0.05
-0.04
-0.03
-0.01
0
0.01
Rake yaw angle [deg]
-0.02
Cha
nge
inC
po
transducer uncertainty
-20 -15 -10 -5 0 5 10 15 20-0.09
-0.08
-0.07
-0.06
-0.05
-0.04
-0.03
-0.01
0
0.01
Rake pitch angle [deg]
-0.02C
hang
ein
Cpo
transducer uncertainty
Figure 3: Total pressure measurement deviation due to change in total rake orientation.
C. Static Rake
1. Construction
The static rake consists of six individual static tubes arranged as shown in Figure 2b. Because commercialstatic tubes of the appropriate size were not available, the tubes were constructed in-house with roughly 1hour of labor each and negligible material costs.
The tubes are cut with the lathe technique from 0.050” diameter, 0.005” wall stainless steel hypodermictubing stock. Four 0.010” static ports are drilled around the tube circumference, 0.5” (10 diameters) fromthe tip. The drilling is performed on a milling machine using a size 00000 center drill bit with a 0.010” pilotdiameter. A knob attached to the tube enables precise rotation by 90◦ for the drilling of each port.
The port holes are deburred by polishing with a fine oilstone until no burrs are visible under 10x magni-fication. The tip of the tube is sealed with a small brass-rod plug and soft solder with acid flux. It is thenbeveled on the lathe, and rounded with a fine file on the lathe by hand. Testing of 15 tubes showed thateach one measured Cp = −0.01 ± 0.002 in the uniform flow of a small open-jet wind tunnel, so that statictubes built with this technique are highly consistent.
To form the static rake, 6 static tubes are mounted in the same 0.25”×0.125” size brass bar used for thetotal rake, except here the leading edge of the bar is given an elliptical shape (by hand filing) to minimizeits upstream static-pressure disturbance. The rake is assembled using soft solder and acid flux, with a largesoldering iron.
4 of 14
American Institute of Aeronautics and Astronautics
2. Measurement quality
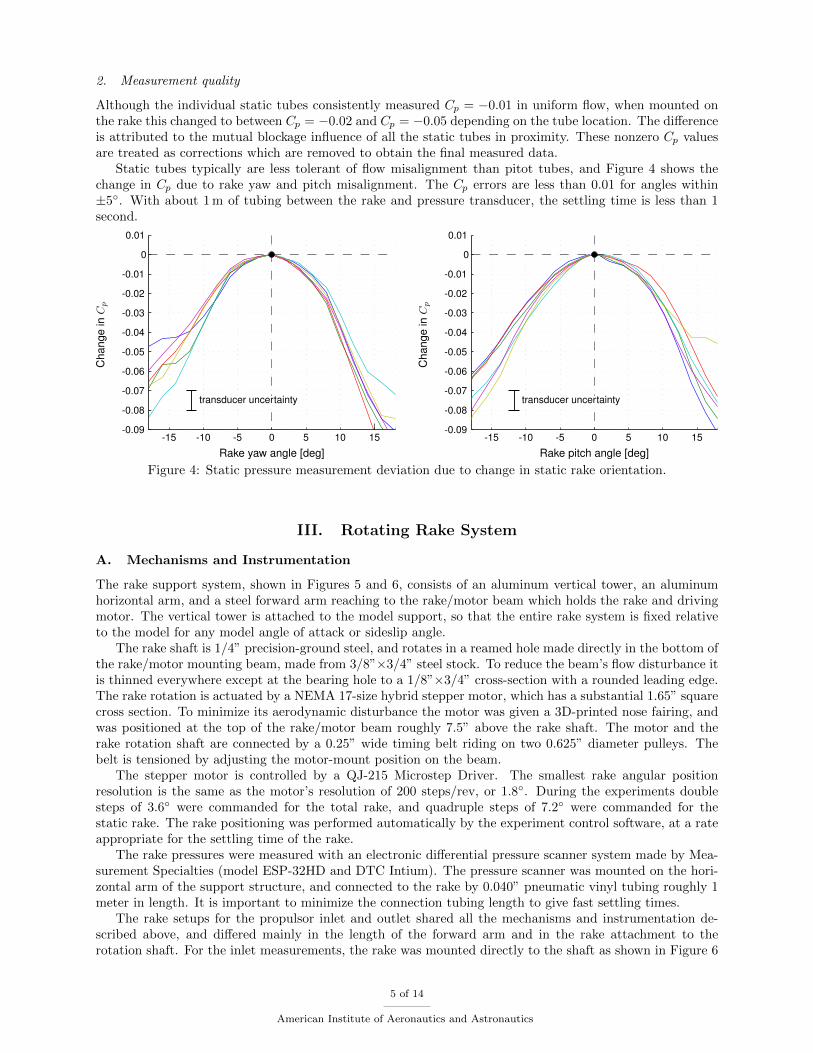
Although the individual static tubes consistently measured Cp = −0.01 in uniform flow, when mounted onthe rake this changed to between Cp = −0.02 and Cp = −0.05 depending on the tube location. The differenceis attributed to the mutual blockage influence of all the static tubes in proximity. These nonzero Cp valuesare treated as corrections which are removed to obtain the final measured data.
Static tubes typically are less tolerant of flow misalignment than pitot tubes, and Figure 4 shows thechange in Cp due to rake yaw and pitch misalignment. The Cp errors are less than 0.01 for angles within±5◦. With about 1 m of tubing between the rake and pressure transducer, the settling time is less than 1second.
-15 -10 -5 0 5 10 15-0.09
-0.08
-0.07
-0.06
-0.05
-0.04
-0.03
-0.01
0
0.01
Rake yaw angle [deg]
-0.02
Cha
nge
inC
p
transducer uncertainty
-15 -10 -5 0 5 10 15-0.09
-0.08
-0.07
-0.06
-0.05
-0.04
-0.03
-0.01
0
0.01
Rake pitch angle [deg]
-0.02
Cha
nge
inC
p
transducer uncertainty
Figure 4: Static pressure measurement deviation due to change in static rake orientation.
III. Rotating Rake System
A. Mechanisms and Instrumentation
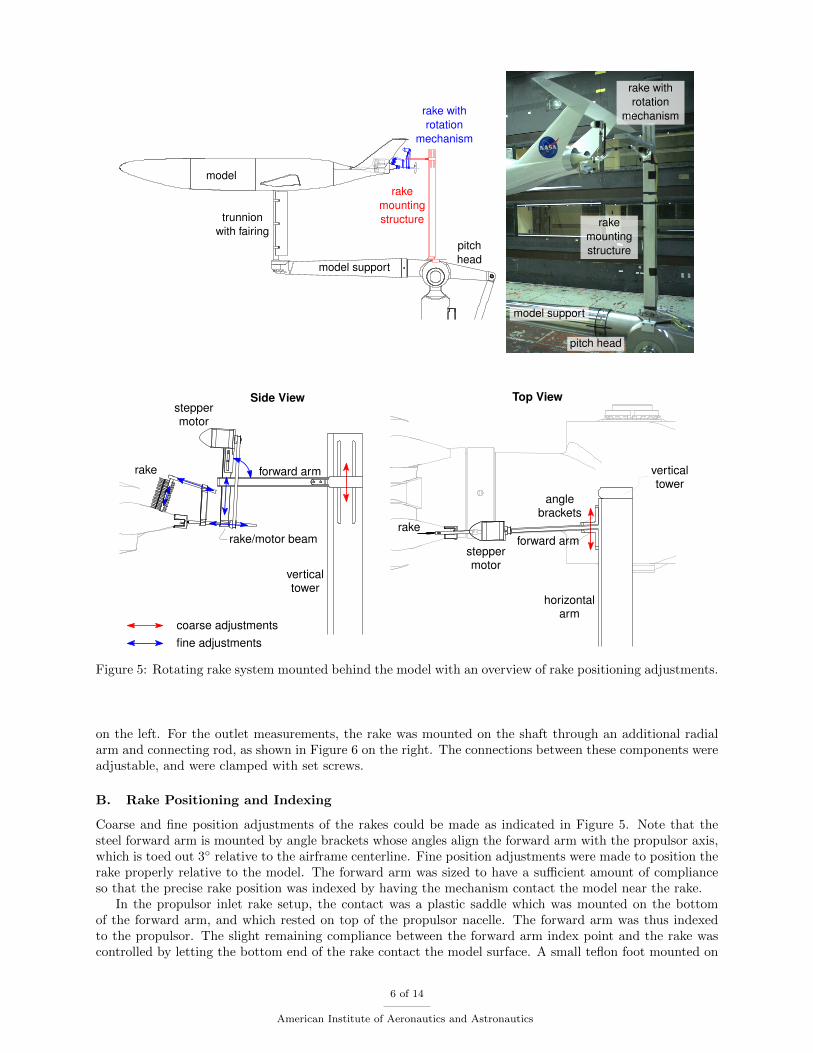
The rake support system, shown in Figures 5 and 6, consists of an aluminum vertical tower, an aluminumhorizontal arm, and a steel forward arm reaching to the rake/motor beam which holds the rake and drivingmotor. The vertical tower is attached to the model support, so that the entire rake system is fixed relativeto the model for any model angle of attack or sideslip angle.
The rake shaft is 1/4” precision-ground steel, and rotates in a reamed hole made directly in the bottom ofthe rake/motor mounting beam, made from 3/8”×3/4” steel stock. To reduce the beam’s flow disturbance itis thinned everywhere except at the bearing hole to a 1/8”×3/4” cross-section with a rounded leading edge.The rake rotation is actuated by a NEMA 17-size hybrid stepper motor, which has a substantial 1.65” squarecross section. To minimize its aerodynamic disturbance the motor was given a 3D-printed nose fairing, andwas positioned at the top of the rake/motor beam roughly 7.5” above the rake shaft. The motor and therake rotation shaft are connected by a 0.25” wide timing belt riding on two 0.625” diameter pulleys. Thebelt is tensioned by adjusting the motor-mount position on the beam.
The stepper motor is controlled by a QJ-215 Microstep Driver. The smallest rake angular positionresolution is the same as the motor’s resolution of 200 steps/rev, or 1.8◦. During the experiments doublesteps of 3.6◦ were commanded for the total rake, and quadruple steps of 7.2◦ were commanded for thestatic rake. The rake positioning was performed automatically by the experiment control software, at a rateappropriate for the settling time of the rake.
The rake pressures were measured with an electronic differential pressure scanner system made by Mea-surement Specialties (model ESP-32HD and DTC Intium). The pressure scanner was mounted on the hori-zontal arm of the support structure, and connected to the rake by 0.040” pneumatic vinyl tubing roughly 1meter in length. It is important to minimize the connection tubing length to give fast settling times.
The rake setups for the propulsor inlet and outlet shared all the mechanisms and instrumentation de-scribed above, and differed mainly in the length of the forward arm and in the rake attachment to therotation shaft. For the inlet measurements, the rake was mounted directly to the shaft as shown in Figure 6
5 of 14
American Institute of Aeronautics and Astronautics
model
trunnionwith fairing
model support
rakemountingstructure
rake withrotation
mechanism
pitchhead
rake withrotation
mechanism
rakemountingstructure
model support
pitch head
steppermotor
steppermotor
rake
anglebrackets
rake
forward arm
verticaltower
horizontalarm
rake/motor beam
Top View
forward arm
fine adjustmentscoarse adjustments
verticaltower
Side View
Figure 5: Rotating rake system mounted behind the model with an overview of rake positioning adjustments.
on the left. For the outlet measurements, the rake was mounted on the shaft through an additional radialarm and connecting rod, as shown in Figure 6 on the right. The connections between these components wereadjustable, and were clamped with set screws.
B. Rake Positioning and Indexing
Coarse and fine position adjustments of the rakes could be made as indicated in Figure 5. Note that thesteel forward arm is mounted by angle brackets whose angles align the forward arm with the propulsor axis,which is toed out 3◦ relative to the airframe centerline. Fine position adjustments were made to position therake properly relative to the model. The forward arm was sized to have a sufficient amount of complianceso that the precise rake position was indexed by having the mechanism contact the model near the rake.
In the propulsor inlet rake setup, the contact was a plastic saddle which was mounted on the bottomof the forward arm, and which rested on top of the propulsor nacelle. The forward arm was thus indexedto the propulsor. The slight remaining compliance between the forward arm index point and the rake wascontrolled by letting the bottom end of the rake contact the model surface. A small teflon foot mounted on
6 of 14
American Institute of Aeronautics and Astronautics
stepper motor
indexingsupport
total rake
rotationshaft
timing belt
(a) Total rake at exit measurement plane
stepper motor
indexing foot
total rake
rotationshaft
timing belt
(b) Total rake at inlet measurement plane
inlet rakeposition
exit rakeposition
0 1 5 in
(c) Total rake at exit plane
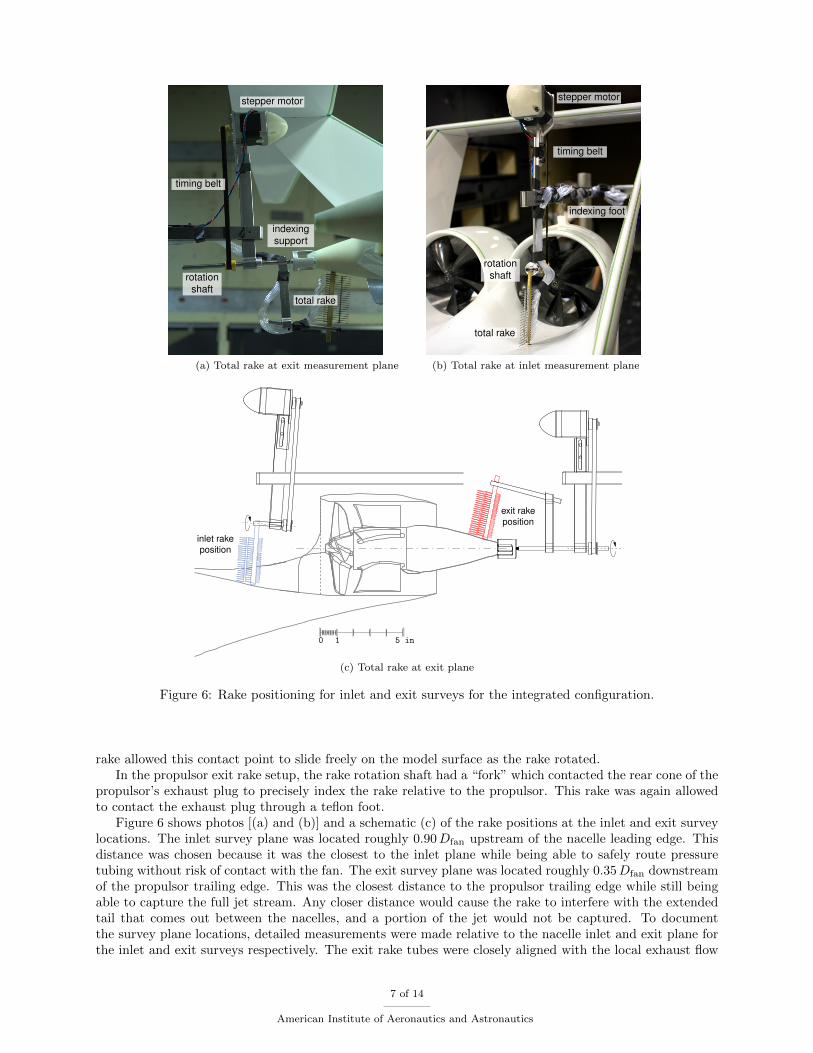
Figure 6: Rake positioning for inlet and exit surveys for the integrated configuration.
rake allowed this contact point to slide freely on the model surface as the rake rotated.In the propulsor exit rake setup, the rake rotation shaft had a “fork” which contacted the rear cone of the
propulsor’s exhaust plug to precisely index the rake relative to the propulsor. This rake was again allowedto contact the exhaust plug through a teflon foot.
Figure 6 shows photos [(a) and (b)] and a schematic (c) of the rake positions at the inlet and exit surveylocations. The inlet survey plane was located roughly 0.90Dfan upstream of the nacelle leading edge. Thisdistance was chosen because it was the closest to the inlet plane while being able to safely route pressuretubing without risk of contact with the fan. The exit survey plane was located roughly 0.35Dfan downstreamof the propulsor trailing edge. This was the closest distance to the propulsor trailing edge while still beingable to capture the full jet stream. Any closer distance would cause the rake to interfere with the extendedtail that comes out between the nacelles, and a portion of the jet would not be captured. To documentthe survey plane locations, detailed measurements were made relative to the nacelle inlet and exit plane forthe inlet and exit surveys respectively. The exit rake tubes were closely aligned with the local exhaust flow
7 of 14
American Institute of Aeronautics and Astronautics
direction by pitching the rake relative to the rotation shaft.
C. Rake Traverse Grids
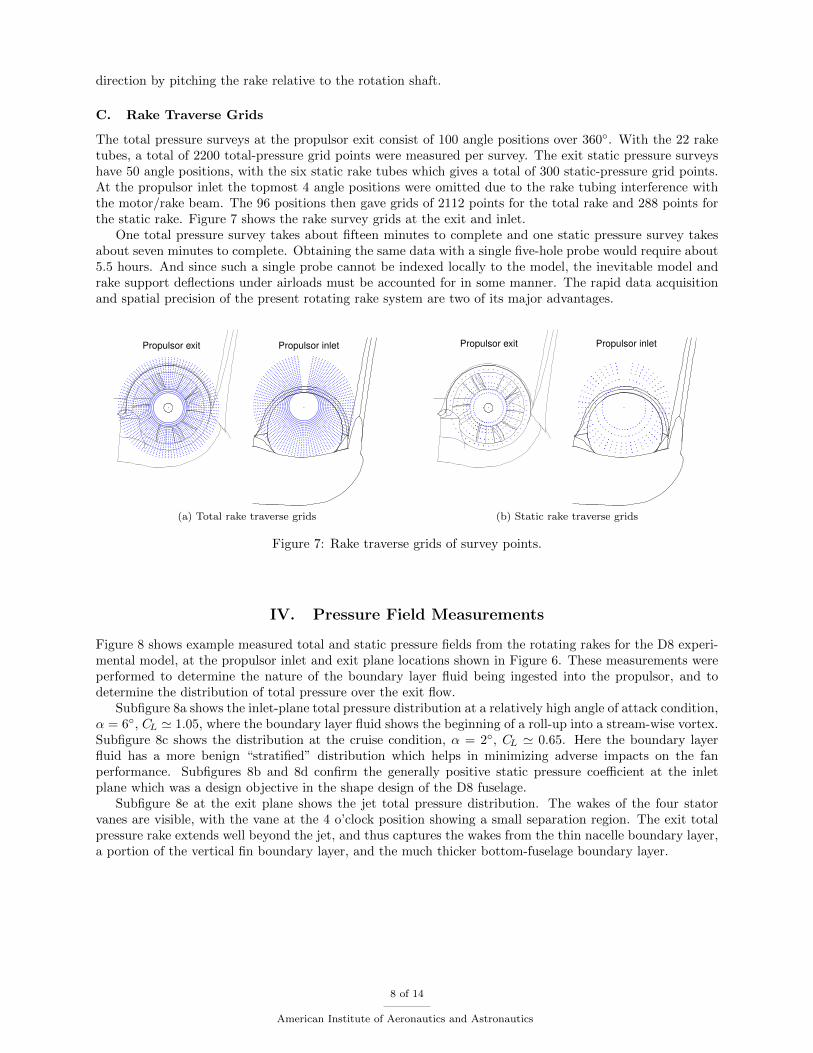
The total pressure surveys at the propulsor exit consist of 100 angle positions over 360◦. With the 22 raketubes, a total of 2200 total-pressure grid points were measured per survey. The exit static pressure surveyshave 50 angle positions, with the six static rake tubes which gives a total of 300 static-pressure grid points.At the propulsor inlet the topmost 4 angle positions were omitted due to the rake tubing interference withthe motor/rake beam. The 96 positions then gave grids of 2112 points for the total rake and 288 points forthe static rake. Figure 7 shows the rake survey grids at the exit and inlet.
One total pressure survey takes about fifteen minutes to complete and one static pressure survey takesabout seven minutes to complete. Obtaining the same data with a single five-hole probe would require about5.5 hours. And since such a single probe cannot be indexed locally to the model, the inevitable model andrake support deflections under airloads must be accounted for in some manner. The rapid data acquisitionand spatial precision of the present rotating rake system are two of its major advantages.
Propulsor exit Propulsor inlet
(a) Total rake traverse grids
Propulsor exit Propulsor inlet
(b) Static rake traverse grids
Figure 7: Rake traverse grids of survey points.
IV. Pressure Field Measurements
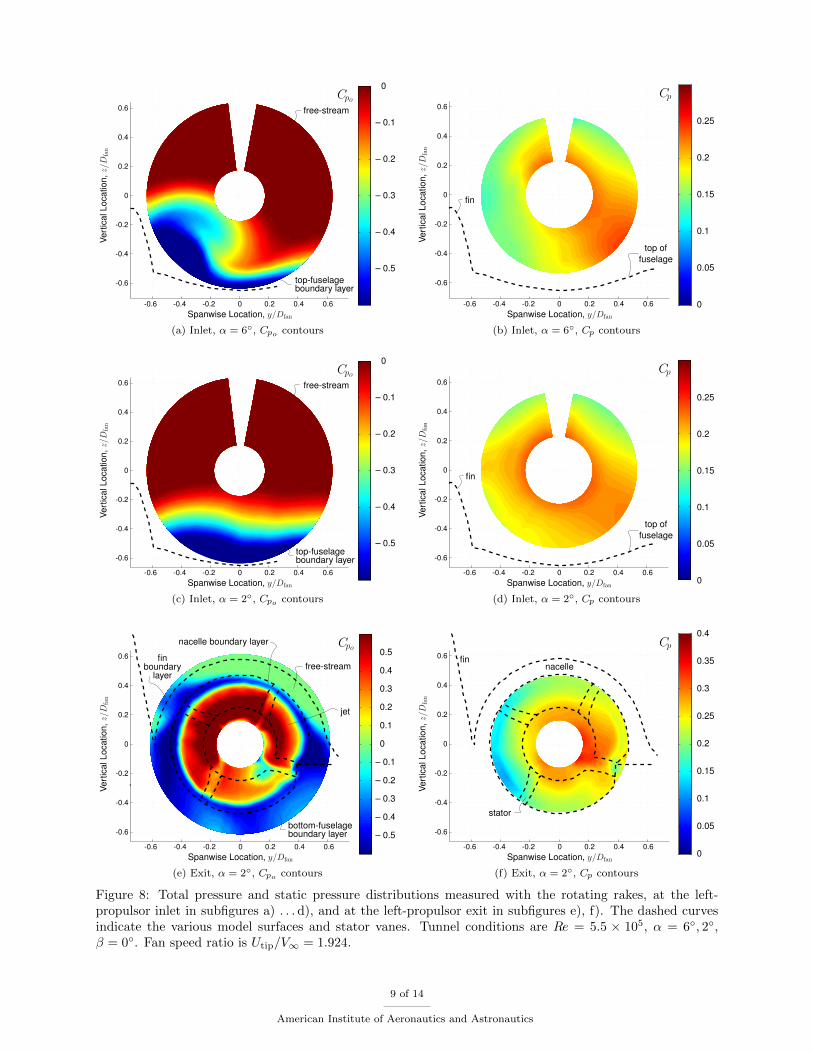
Figure 8 shows example measured total and static pressure fields from the rotating rakes for the D8 experi-mental model, at the propulsor inlet and exit plane locations shown in Figure 6. These measurements wereperformed to determine the nature of the boundary layer fluid being ingested into the propulsor, and todetermine the distribution of total pressure over the exit flow.
Subfigure 8a shows the inlet-plane total pressure distribution at a relatively high angle of attack condition,α = 6◦, CL ' 1.05, where the boundary layer fluid shows the beginning of a roll-up into a stream-wise vortex.Subfigure 8c shows the distribution at the cruise condition, α = 2◦, CL ' 0.65. Here the boundary layerfluid has a more benign “stratified” distribution which helps in minimizing adverse impacts on the fanperformance. Subfigures 8b and 8d confirm the generally positive static pressure coefficient at the inletplane which was a design objective in the shape design of the D8 fuselage.
Subfigure 8e at the exit plane shows the jet total pressure distribution. The wakes of the four statorvanes are visible, with the vane at the 4 o’clock position showing a small separation region. The exit totalpressure rake extends well beyond the jet, and thus captures the wakes from the thin nacelle boundary layer,a portion of the vertical fin boundary layer, and the much thicker bottom-fuselage boundary layer.
8 of 14
American Institute of Aeronautics and Astronautics
-0.6 -0.4 -0.2 0 0.2 0.4 0.6
-0.6
-0.4
-0.2
0
0.2
0.4
0.6
Spanwise Location, y/Dfan
Vert
ical
Loca
tion,
z/D
fan
Cpo
– 0.5
– 0.4
– 0.3
– 0.2
– 0.1
0
top-fuselageboundary layer
free-stream
(a) Inlet, α = 6◦, Cpo contours
-0.6
-0.4
-0.2
0
0.2
0.4
0.6
Spanwise Location, y/Dfan
Vert
ical
Loca
tion,
z/D
fan
Cp
0
0.05
0.1
0.15
0.2
0.25
top offuselage
fin
-0.6 -0.4 -0.2 0 0.2 0.4 0.6
(b) Inlet, α = 6◦, Cp contours
-0.6 -0.4 -0.2 0 0.2 0.4 0.6
-0.6
-0.4
-0.2
0
0.2
0.4
0.6
Spanwise Location, y/Dfan
Vert
ical
Loca
tion,
z/D
fan
Cpo
– 0.5
– 0.4
– 0.3
– 0.2
– 0.1
0
top-fuselageboundary layer
free-stream
(c) Inlet, α = 2◦, Cpo contours
-0.6 -0.4 -0.2 0 0.2 0.4 0.6
-0.6
-0.4
-0.2
0
0.2
0.4
0.6
Vert
ical
Loca
tion,
z/D
fan
Cp
0
0.05
0.1
0.15
0.2
0.25
top offuselage
fin
Spanwise Location, y/Dfan
(d) Inlet, α = 2◦, Cp contours
-0.6
-0.4
-0.2
0
0.2
0.4
0.6
Spanwise Location, y/Dfan
Vert
ical
Loca
tion,
z/D
fan
Cpo
– 0.5
– 0.4
– 0.3
– 0.2
– 0.1
0
0.1
0.2
0.3
0.4
0.5
-0.6 -0.4 -0.2 0 0.2 0.4 0.6
free-stream
nacelle boundary layer
bottom-fuselageboundary layer
jet
finboundary
layer
(e) Exit, α = 2◦, Cpo contours
-0.6 -0.4 -0.2 0 0.2 0.4 0.6
-0.6
-0.4
-0.2
0
0.2
0.4
0.6
Vert
ical
Loca
tion,
z/D
fan
Cp
0
0.05
0.1
0.15
0.2
0.25
0.3
0.35
0.4
finnacelle
stator
Spanwise Location, y/Dfan
(f) Exit, α = 2◦, Cp contours
Figure 8: Total pressure and static pressure distributions measured with the rotating rakes, at the left-propulsor inlet in subfigures a) . . . d), and at the left-propulsor exit in subfigures e), f). The dashed curvesindicate the various model surfaces and stator vanes. Tunnel conditions are Re = 5.5 × 10⁵, α = 6◦, 2◦,β = 0◦. Fan speed ratio is Utip/V∞ = 1.924.
9 of 14
American Institute of Aeronautics and Astronautics
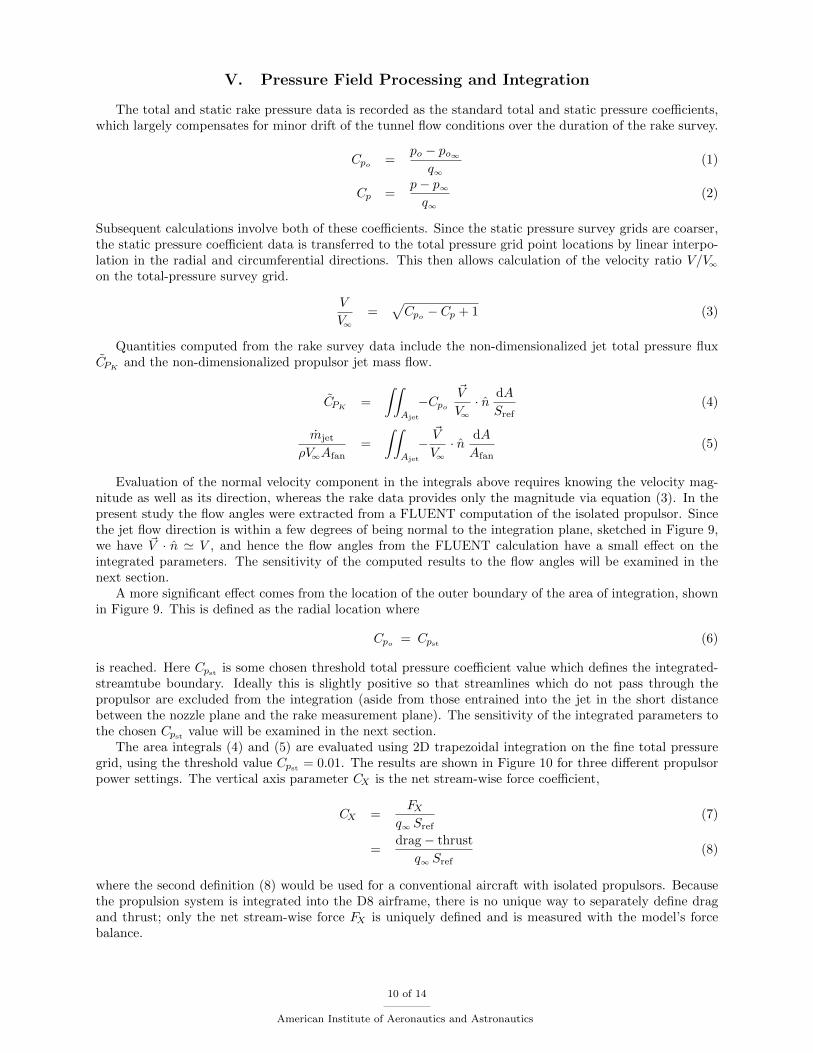
V. Pressure Field Processing and Integration
The total and static rake pressure data is recorded as the standard total and static pressure coefficients,which largely compensates for minor drift of the tunnel flow conditions over the duration of the rake survey.
Cpo=
po − po∞q∞
(1)
Cp =p− p∞
q∞(2)
Subsequent calculations involve both of these coefficients. Since the static pressure survey grids are coarser,the static pressure coefficient data is transferred to the total pressure grid point locations by linear interpo-lation in the radial and circumferential directions. This then allows calculation of the velocity ratio V/V∞on the total-pressure survey grid.
V
V∞=
√Cpo− Cp + 1 (3)
Quantities computed from the rake survey data include the non-dimensionalized jet total pressure fluxCPK
and the non-dimensionalized propulsor jet mass flow.
CPK=
∫∫Ajet
−Cpo
~V
V∞· n dA
Sref(4)
mjet
ρV∞Afan=
∫∫Ajet
−~V
V∞· n dA
Afan(5)
Evaluation of the normal velocity component in the integrals above requires knowing the velocity mag-nitude as well as its direction, whereas the rake data provides only the magnitude via equation (3). In thepresent study the flow angles were extracted from a FLUENT computation of the isolated propulsor. Sincethe jet flow direction is within a few degrees of being normal to the integration plane, sketched in Figure 9,we have ~V · n ' V , and hence the flow angles from the FLUENT calculation have a small effect on theintegrated parameters. The sensitivity of the computed results to the flow angles will be examined in thenext section.
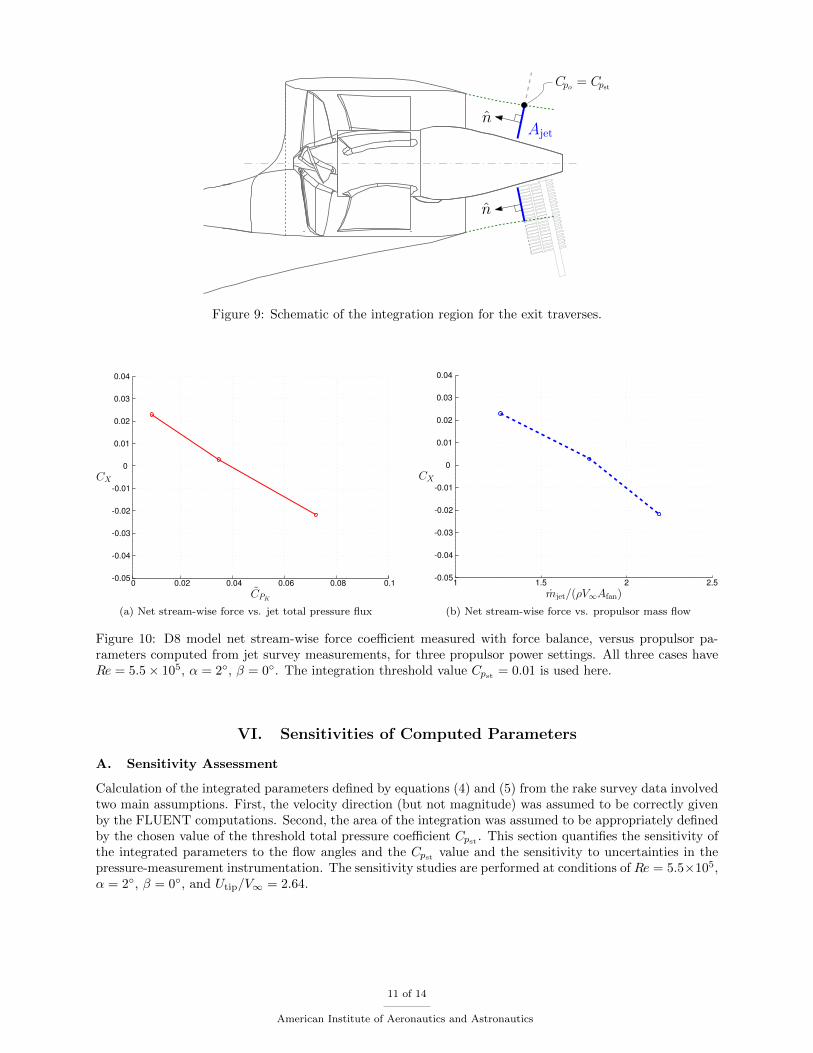
A more significant effect comes from the location of the outer boundary of the area of integration, shownin Figure 9. This is defined as the radial location where
Cpo = Cpst (6)
is reached. Here Cpst is some chosen threshold total pressure coefficient value which defines the integrated-streamtube boundary. Ideally this is slightly positive so that streamlines which do not pass through thepropulsor are excluded from the integration (aside from those entrained into the jet in the short distancebetween the nozzle plane and the rake measurement plane). The sensitivity of the integrated parameters tothe chosen Cpst
value will be examined in the next section.The area integrals (4) and (5) are evaluated using 2D trapezoidal integration on the fine total pressure
grid, using the threshold value Cpst = 0.01. The results are shown in Figure 10 for three different propulsorpower settings. The vertical axis parameter CX is the net stream-wise force coefficient,
CX =FX
q∞ Sref(7)
=drag− thrust
q∞ Sref(8)
where the second definition (8) would be used for a conventional aircraft with isolated propulsors. Becausethe propulsion system is integrated into the D8 airframe, there is no unique way to separately define dragand thrust; only the net stream-wise force FX is uniquely defined and is measured with the model’s forcebalance.
10 of 14
American Institute of Aeronautics and Astronautics
Ajet
n
n
Cpo = Cpst
Figure 9: Schematic of the integration region for the exit traverses.
0 0.02 0.04 0.06 0.08 0.1CPK
-0.05
-0.04
-0.03
-0.02
-0.01
0
0.01
0.02
0.03
0.04
CX
(a) Net stream-wise force vs. jet total pressure flux
-0.05
-0.04
-0.03
-0.02
-0.01
0
0.01
0.02
0.03
0.04
CX
1 1.5 2 2.5mjet/(ρV∞Afan)
(b) Net stream-wise force vs. propulsor mass flow
Figure 10: D8 model net stream-wise force coefficient measured with force balance, versus propulsor pa-rameters computed from jet survey measurements, for three propulsor power settings. All three cases haveRe = 5.5× 10⁵, α = 2◦, β = 0◦. The integration threshold value Cpst
= 0.01 is used here.
VI. Sensitivities of Computed Parameters
A. Sensitivity Assessment
Calculation of the integrated parameters defined by equations (4) and (5) from the rake survey data involvedtwo main assumptions. First, the velocity direction (but not magnitude) was assumed to be correctly givenby the FLUENT computations. Second, the area of the integration was assumed to be appropriately definedby the chosen value of the threshold total pressure coefficient Cpst
. This section quantifies the sensitivity ofthe integrated parameters to the flow angles and the Cpst
value and the sensitivity to uncertainties in thepressure-measurement instrumentation. The sensitivity studies are performed at conditions of Re = 5.5×10⁵,α = 2◦, β = 0◦, and Utip/V∞ = 2.64.
11 of 14
American Institute of Aeronautics and Astronautics
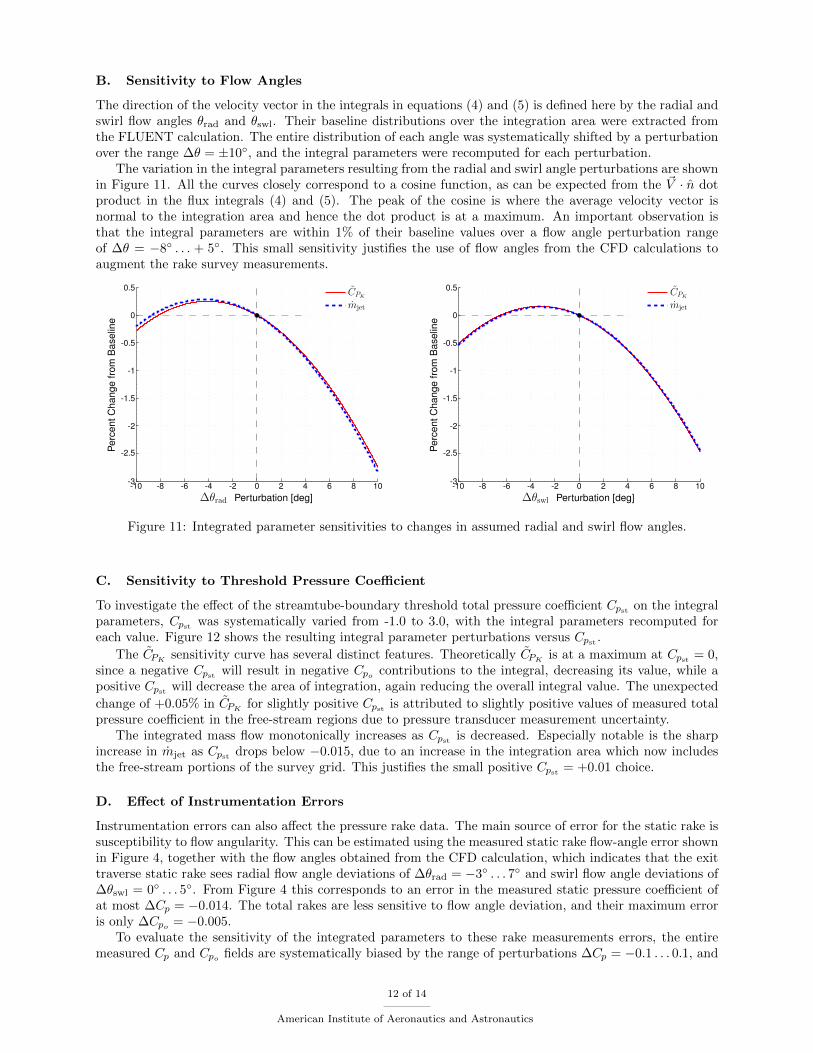
B. Sensitivity to Flow Angles
The direction of the velocity vector in the integrals in equations (4) and (5) is defined here by the radial andswirl flow angles θrad and θswl. Their baseline distributions over the integration area were extracted fromthe FLUENT calculation. The entire distribution of each angle was systematically shifted by a perturbationover the range ∆θ = ±10◦, and the integral parameters were recomputed for each perturbation.
The variation in the integral parameters resulting from the radial and swirl angle perturbations are shownin Figure 11. All the curves closely correspond to a cosine function, as can be expected from the ~V · n dotproduct in the flux integrals (4) and (5). The peak of the cosine is where the average velocity vector isnormal to the integration area and hence the dot product is at a maximum. An important observation isthat the integral parameters are within 1% of their baseline values over a flow angle perturbation rangeof ∆θ = −8◦ . . . + 5◦. This small sensitivity justifies the use of flow angles from the CFD calculations toaugment the rake survey measurements.
Perc
entC
hang
efro
mB
asel
ine
-10 -8 -6 -4 -2 0 2 4 6 8 10-3
-2.5
-2
-1.5
-1
-0.5
0
0.5
∆θrad Perturbation [deg]
CPK
mjet
-10 -8 -6 -4 -2 0 2 4 6 8 10-3
-2.5
-2
-1.5
-1
-0.5
0
0.5
Perc
entC
hang
efro
mB
asel
ine
∆θswl Perturbation [deg]
CPK
mjet
Figure 11: Integrated parameter sensitivities to changes in assumed radial and swirl flow angles.
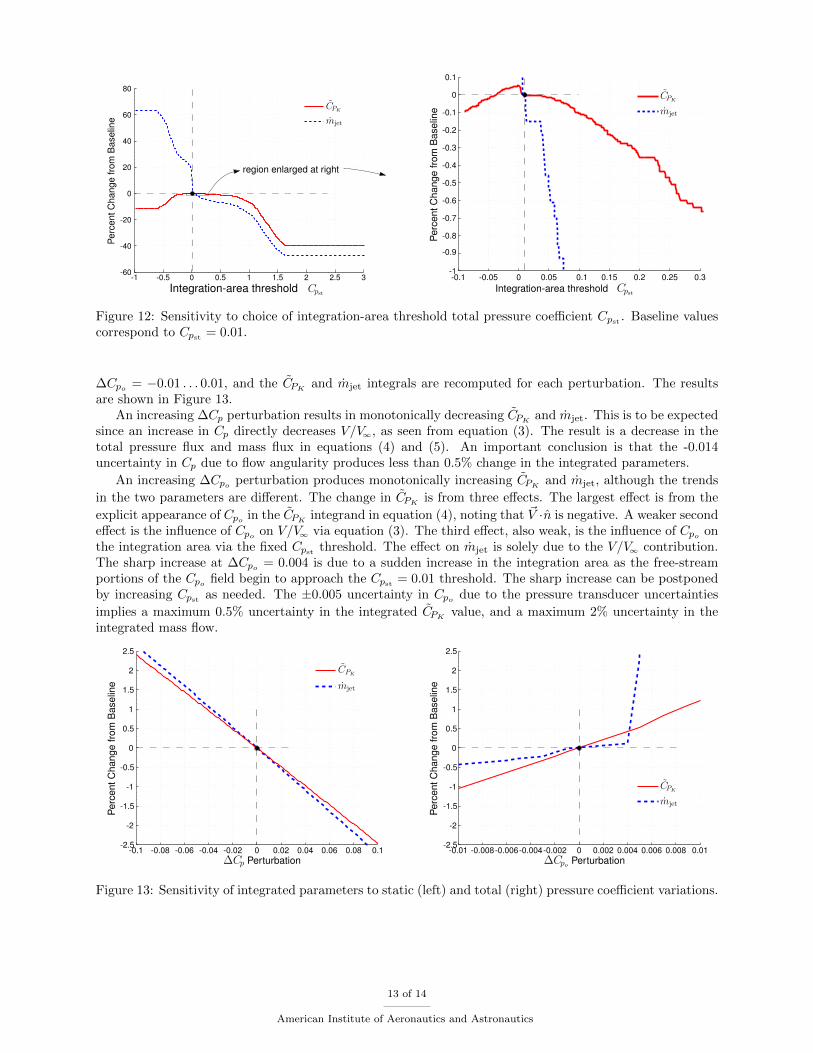
C. Sensitivity to Threshold Pressure Coefficient
To investigate the effect of the streamtube-boundary threshold total pressure coefficient Cpston the integral
parameters, Cpst was systematically varied from -1.0 to 3.0, with the integral parameters recomputed foreach value. Figure 12 shows the resulting integral parameter perturbations versus Cpst .
The CPKsensitivity curve has several distinct features. Theoretically CPK
is at a maximum at Cpst= 0,
since a negative Cpst will result in negative Cpo contributions to the integral, decreasing its value, while apositive Cpst will decrease the area of integration, again reducing the overall integral value. The unexpected
change of +0.05% in CPKfor slightly positive Cpst
is attributed to slightly positive values of measured totalpressure coefficient in the free-stream regions due to pressure transducer measurement uncertainty.
The integrated mass flow monotonically increases as Cpst is decreased. Especially notable is the sharpincrease in mjet as Cpst
drops below −0.015, due to an increase in the integration area which now includesthe free-stream portions of the survey grid. This justifies the small positive Cpst
= +0.01 choice.
D. Effect of Instrumentation Errors
Instrumentation errors can also affect the pressure rake data. The main source of error for the static rake issusceptibility to flow angularity. This can be estimated using the measured static rake flow-angle error shownin Figure 4, together with the flow angles obtained from the CFD calculation, which indicates that the exittraverse static rake sees radial flow angle deviations of ∆θrad = −3◦ . . . 7◦ and swirl flow angle deviations of∆θswl = 0◦ . . . 5◦. From Figure 4 this corresponds to an error in the measured static pressure coefficient ofat most ∆Cp = −0.014. The total rakes are less sensitive to flow angle deviation, and their maximum erroris only ∆Cpo
= −0.005.To evaluate the sensitivity of the integrated parameters to these rake measurements errors, the entire
measured Cp and Cpofields are systematically biased by the range of perturbations ∆Cp = −0.1 . . . 0.1, and
12 of 14
American Institute of Aeronautics and Astronautics
-1 -0.5 0 0.5 1 1.5 2 2.5 3-60
-40
-20
0
20
40
60
80
Perc
entC
hang
efro
mB
asel
ine
Integration-area threshold Cpst
CPK
mjet
region enlarged at right
-0.1 -0.05 0 0.05 0.1 0.15 0.2 0.25 0.3-1
-0.9
-0.8
-0.7
-0.6
-0.5
-0.4
-0.3
-0.2
-0.1
0
0.1
Perc
entC
hang
efro
mB
asel
ine
Integration-area threshold Cpst
CPK
mjet
Figure 12: Sensitivity to choice of integration-area threshold total pressure coefficient Cpst. Baseline values
correspond to Cpst= 0.01.
∆Cpo= −0.01 . . . 0.01, and the CPK
and mjet integrals are recomputed for each perturbation. The resultsare shown in Figure 13.
An increasing ∆Cp perturbation results in monotonically decreasing CPKand mjet. This is to be expected
since an increase in Cp directly decreases V/V∞, as seen from equation (3). The result is a decrease in thetotal pressure flux and mass flux in equations (4) and (5). An important conclusion is that the -0.014uncertainty in Cp due to flow angularity produces less than 0.5% change in the integrated parameters.
An increasing ∆Cpo perturbation produces monotonically increasing CPKand mjet, although the trends
in the two parameters are different. The change in CPKis from three effects. The largest effect is from the
explicit appearance of Cpoin the CPK
integrand in equation (4), noting that ~V ·n is negative. A weaker secondeffect is the influence of Cpo
on V/V∞ via equation (3). The third effect, also weak, is the influence of Cpoon
the integration area via the fixed Cpstthreshold. The effect on mjet is solely due to the V/V∞ contribution.
The sharp increase at ∆Cpo = 0.004 is due to a sudden increase in the integration area as the free-streamportions of the Cpo field begin to approach the Cpst = 0.01 threshold. The sharp increase can be postponedby increasing Cpst
as needed. The ±0.005 uncertainty in Cpodue to the pressure transducer uncertainties
implies a maximum 0.5% uncertainty in the integrated CPKvalue, and a maximum 2% uncertainty in the
integrated mass flow.
-0.1 -0.08 -0.06 -0.04 -0.02 0 0.02 0.04 0.06 0.08 0.1-2.5
-2
-1.5
-1
-0.5
0
0.5
1
1.5
2
2.5
Perc
entC
hang
efro
mB
asel
ine
∆Cp Perturbation
CPK
mjet
-0.01 -0.008-0.006-0.004-0.002 0 0.002 0.004 0.006 0.008 0.01-2.5
-2
-1.5
-1
-0.5
0
0.5
1
1.5
2
2.5
Perc
entC
hang
efro
mB
asel
ine
∆Cpo Perturbation
CPK
mjet
Figure 13: Sensitivity of integrated parameters to static (left) and total (right) pressure coefficient variations.
13 of 14
American Institute of Aeronautics and Astronautics
VII. Summary and Conclusions
This paper illustrates the use of a rotating rake system for effective flow field measurements. Separatetotal and static pressure fields from the rake system can be merged to calculate other related local andintegrated flow field quantities of interest.
The rotating rake used in the N+3 experiments provided rapid pressure measurements which allowedexploration of a wide range of operating conditions for a given tunnel time. The compactness of the rakesystem allowed measurements in planes immediately upstream and downstream of integrated propulsors.The total cost for the rake materials was less than $100 for two rakes, and the commercially available itemsthat drove the rotation, specifically the stepper motor, motor controller, timing belts and gears, cost under$90. The rakes were constructed using only common machine tools.
The rotating rake system does have some limitations. One is the sensitivity to flow angularity. For Cpo
errors less than 0.01, the total rake could tolerate flow angles within ±15◦, while for Cp errors of less than0.01 the more sensitive static rake could tolerate angles within ±8◦. Fortunately, the jet total pressure flux,the quantity of interest in the experiments, is not sensitive to errors in the measured static pressure field orflow angularity.
One improvement to the system that is specific to the N+3 application is to be able to measure atthe actual propulsor inlet and exit planes. Due to the rake size and shape, full surveys at the propulsortrailing edge were impossible. This can be solved by making the rake shorter and contouring the rake to avoidobstructions. By making this change, the need to set a integration area threshold is avoided because the areaof interest would be defined by the propulsor geometry. The upstream propulsor surveys can also be closerto the inlet with some re-routing of the pressure tubing. The relative speed and ease of the manufacture ofthe rakes described here makes it feasible to build custom rakes to match any special experimental geometry.It would also be possible to make pitot-static rakes which would avoid the need to survey the flow field twicewith two different rakes.
Acknowledgments
The work is supported by the NASA’s Fundamental Aeronautics program, Fixed Wing project whoprovided funding for the project. The authors are only a part of a larger team and this work would not bepossible without the help of the N+3 team. The authors would like to extend their gratitude to the membersof the Aurora Flight Sciences N+3 team who supported the experimental effort, specifically Ben Smith wholed the structural design of the rake system support. The authors would also like to acknowledge Dr. NeilTitchener and Alex Feldstein who conducted the total pressure rake measurement assessment.
References
1et al., E. G., “N+3 aircradt concept designs and trade studies, Final Report,” NASA CR 2010-216794 , 2010.2Drela, M., “Development of the D8 transport configuration,” 29th AIAA Applied Aerodynamics Conference, Honolulu,
HI, AIAA Paper 2011-3970, 27-30 June 2011 , 2011.3Drela, M., “Power balance in aerodynamic flows,” AIAA Journal , Vol. 47, No. 7, 2009, pp. 1761–1771.
References
1Sutliff, Daniel L., “Rotating Rake Turbofan Duct Mode Measurement System”, NASA/TM 2005-213828, Oct. 20052Drela, M., “Development of the D8 transport configuration”, 29th AIAA Applied Aerodynamics Conference, 27-30 June
2011, Honolulu, HI, AIAA Paper 2011-39703Drela, M., “Power Balance in Aerodynamic Flows”, 27th AIAA Applied Aerodynamics Conference, 22-25 June 2009, San
Antonio, TX, AIAA Paper 2009-37624Greitzer, E.M., et al., “N+3 Aircraft Concept Designs and Trade Studies, Final Report”, NASA CR 2010-216794, Dec.
2010
14 of 14
American Institute of Aeronautics and Astronautics