Embed Size (px)
Citation preview

Rapid
Eco
regio
nal A
ssessm
ent
Change Agent: Climate
A summary of key findings related to temperature, precipitation, and linked variables

Rapid
Eco
regio
nal A
ssessm
ent
Introduction The climate of northern ecosystems is changing rapidly, resulting
in thawing permafrost, altered hydrology, and shifting biological processes.
Climate variables can directly impact ecosystems and individual species, and are also part of feedback loops with fire, permafrost, invasive species, and human behavior.
Understanding these relationships is complex, but ultimately crucial for decision-making by policymakers and land managers.
Climate was primarily modeled using models and data from the Scenarios Network for Alaska and Arctic Planning. See www.snap.uaf.edu for details.

Rapid
Eco
regio
nal A
ssessm
ent
Change Agent: ClimateGlobal Circulation
Models (AR4)5 highest-performing
models
Inputs to ALFRESCO, Cliomes model, and GIPL permafrost
model; creation of freeze, thaw, and season length
interpolations
Biome shift model
PRISM data
Monthly projected data, temp and precip, to 2100, for 3 emission scenarios
Permafrost model
5-model composite, A2 scenario, baseline plus 2020s,
2050s, 2060s (decadal averages)
Fire model
GCM testing and selection
Downscaling
Data processing
Data selection
Climate model
Selection of key variables pertinent to CEs
See separate model schematics for full
inputs

Rapid
Eco
regio
nal A
ssessm
ent
Change Agents: Climate
Raw data sources:• Weather station data• Climate grids mathematically scaled down to
the local level• Global Circulation Models (based on the
balance of the sun’s energy and conditions in the atmosphere and oceans)
Downscaling:• Based on CRU and PRISM algorithms
GCM output (ECHAM5) 2.5 x 2.5 degrees; 2 km SNAP data

Rapid
Eco
regio
nal A
ssessm
ent
Inter-model standard deviations in projected monthly temperature (°C) and precipitation (mm), A2 emission scenario.
Jan Feb Mar Apr May Jun Jul Aug Sep Oct Nov Dec mean2010s 2.8 1.2 2.4 1.7 0.9 0.8 1.0 0.9 0.7 1.0 1.8 1.0 1.42020s 1.7 2.0 1.7 1.5 0.9 0.5 0.4 0.6 0.5 0.6 0.8 2.3 1.12030s 2.6 1.6 1.5 1.1 0.7 0.9 1.4 0.9 1.2 1.4 1.2 1.3 1.3mean 2.4 1.6 1.9 1.4 0.8 0.7 0.9 0.8 0.8 1.0 1.3 1.5 1.3
Uncertainty
Jan Feb Mar Apr May Jun Jul Aug Sep Oct Nov Dec mean2010s 3.8 3.3 2.1 2.2 1.8 5.9 7.1 6.2 7.1 3.5 2.7 2.9 4.12020s 4.7 2.6 2.7 3.1 2.5 6.5 5.1 12.6 5.1 4 3.3 5.2 4.82030s 6 3.7 3 3.8 1.8 6.2 8.6 8.9 6.1 5.4 3.9 5.6 5.3mean 4.8 3.2 2.6 3.0 2.0 6.2 6.9 9.2 6.1 4.3 3.3 4.6 4.7
Assessing standard deviations between the five models used to create climate projections offers one methods of assessing uncertainty, although not all sources of uncertainty are captured here.

Rapid
Eco
regio
nal A
ssessm
ent
January temperature

Rapid
Eco
regio
nal A
ssessm
ent
January temperature by community
Anaktu
vuk P
ass
Atkasu
k
Barrow
Kakto
vik
Kivalin
a
Nuiqsut
Point Hope
Point Lay
Prudhoe Bay
Wain
wright
-30
-25
-20
-15
-10
-5
2010s2020s2060s
Temperatures (°C) are averaged across watersheds (5th level HUCs) surrounding communities. Error bars represent maximum and minimum values for 771m pixels within those HUCs.
Rapid
Eco
regio
nal A
ssessm
ent
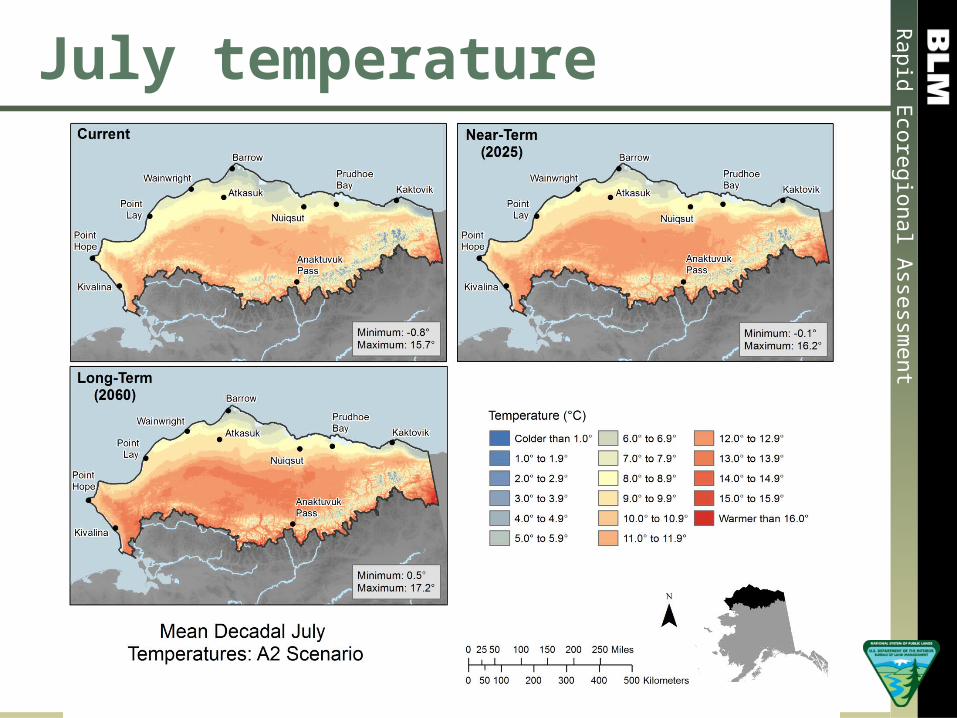
July temperature

Rapid
Eco
regio
nal A
ssessm
ent
July temperature by community
Anaktuvu
k Pass
Atkasu
k
Barrow
Kaktovik
Kivalin
a
Nuiqsut
Point Hope
Point Lay
Prudhoe Bay
Wain
wright
0
2
4
6
8
10
12
14
2010s2020s2060s
Temperatures (°C) are averaged across watersheds (5th level HUCs) surrounding communities. Error bars represent maximum and minimum values for 771m pixels within those HUCs.

Rapid
Eco
regio
nal A
ssessm
ent
Mean summer precipitation

Rapid
Eco
regio
nal A
ssessm
ent
Mean summer precipitation by sub-region
Porcupine R
iver
Koyuku
k Rive
r
Prudhoe Bay
(coast
al)
Prudhoe Bay
(inlan
d)
Kobuk-Sela
wik Rive
rs
Noatak R
iver-L
isburne P
eninsu
la
Colville
River (c
oastal)
Colville
River (i
nland)
West
ern Arcti
c0
50
100
150
200
250
300
2010s2020s2060s
Precipitation (mm) is averaged across ecological sub-regions.

Rapid
Eco
regio
nal A
ssessm
ent
Mean winter precipitation

Rapid
Eco
regio
nal A
ssessm
ent
Mean winter precipitation by sub-region
Porcupine R
iver
Koyuku
k Rive
r
Prudhoe Bay
(coast
al)
Prudhoe Bay
(inlan
d)
Kobuk-Sela
wik Rive
rs
Noatak R
iver-L
isburne P
eninsu
la
Colville
River (c
oastal)
Colville
River (i
nland)
West
ern Arcti
c0
20
40
60
80
100
120
2010s2020s2060s
Precipitation (mm rainwater equivalent) is averaged across ecological sub-regions.

Rapid
Eco
regio
nal A
ssessm
ent
Data at which the running mean temperature crosses the freezing point in the autumn.
Projected date of freeze (DOF)

Rapid
Eco
regio
nal A
ssessm
ent
Date of freeze by sub-region
Porcupine River
Koyukuk River
Prudhoe Bay
(coastal)
Prudhoe Bay (in-
land)
Kobuk-Selawik Rivers
Noatak River-Lis-
burne Peninsula
Colville River
(coastal)
Colville River (in-
land)
Western Arctic
2010s 256 257 264 263 262 266 264 263 265
2020s 256 258 265 264 263 267 265 263 266
2060s 263 264 272 270 268 273 273 269 274
3-Sep
8-Sep
13-Sep
18-Sep
23-Sep
28-Sep
3-Oct

Rapid
Eco
regio
nal A
ssessm
ent
Data at which the running mean temperature crosses the freezing point in the spring.
Projected date of thaw (DOT)

Rapid
Eco
regio
nal A
ssessm
ent
Date of thaw by sub-region
Porcupine River
Koyukuk River
Prudhoe Bay (coastal)
Prudhoe Bay (inland)
Kobuk-Selawik Rivers
Noatak River-Lis-
burne Peninsula
Colville River (coastal)
Colville River (inland)
Western Arc-tic
2010s 138 135 151 143 137 143 151 142 151
2020s 136 133 150 142 135 141 150 140 150
2060s 135 130 149 141 133 140 148 139 148
26-Apr
1-May
6-May
11-May
16-May
21-May
26-May
31-May
2010s2020s2060s

Rapid
Eco
regio
nal A
ssessm
ent
Warm season length

Rapid
Eco
regio
nal A
ssessm
ent
Warm season length by community
Anaktuvu
k Pass
Kaktovik
Kivalin
a
Point Hope
Point Lay
Barrow
Nuiqsut
Atkasu
k
Prudhoe Bay
Wain
wright
60
70
80
90
100
110
120
130
140
150
160
2010s2020s2060s
Warm season length is the number of days between DOT and DOF. Values are averaged across watersheds (5th level HUCs) surrounding communities. Error bars represent maximum and minimum values for 771m pixels within those HUCs.

Rapid
Eco
regio
nal A
ssessm
ent
Snow Day Fraction
Change in snow day fraction: percentage of days in which precipitation, were it to fall, would be expected to be snow rather than rain. May (top) and September (bottom).
Anaktuvu
k Pass
Kaktovik
Kivalin
a
Point Hope
Point Lay
Barrow
Nuiqsut
Atkasu
k
Prudhoe B
ay
Wain
wright
0102030405060708090
100
2010s2020s2060s
Anaktuvu
k Pass
Kaktovik
Kivalin
a
Point Hope
Point Lay
Barrow
Nuiqsut
Atkasu
k
Prudhoe B
ay
Wain
wright
0
10
20
30
40
50
60
70
2010s2020s2060s

Rapid
Eco
regio
nal A
ssessm
ent
Climate-Biome Shift

Rapid
Eco
regio
nal A
ssessm
ent
Describing the clusters:growing degree days, season length, and snowfall
0
500
1000
1500
2000
2500
3000
50
70
90
110
130
150
170
190
210
230
1 2 3 4 5 6 7 8 9 10 11 12 13 14 15 16 17 18G
row
ing
degr
ee d
ays
Day
s ab
ove
free
zing
cluster
Days above freezing
Growing Degree Days
0
200
400
600
800
1000
1200
1 2 3 4 5 6 7 8 9 10 11 12 13 14 15 16 17 18
Tota
l pre
cipi
tatio
n, m
m (
rain
wat
er e
quiv
alen
t)
Clusters
total for months with mean temperature below freezing
total for months with mean temperature above freezing
Length of above-freezing season and GDD by cluster. Days above freezing were estimated via linear interpolation between monthly mean temperatures. Growing degree days (GDD) were calculated using 0°C as a baseline.
Warm-season and cold-season precipitation by cluster. The majority of precipitation in months with mean temperatures below freezing is assumed to be snow (measured as rainwater equivalent).

Rapid
Eco
regio
nal A
ssessm
ent
Projected cliomes for the five-model composite, A1B (mid-range ) climate scenario.
Alaska and the Yukon are shown at 2km resolution and NWT at 10 minute lat/long resolution .
Climate-biomeProjections
Original 18 clusters

Rapid
Eco
regio
nal A
ssessm
ent
2010s 2020s 2060sAnaktuvuk Pass 12 11 12Kaktovik 3 3 3Kivalina 8 8 10Point Hope 9 10 10Point Lay 3 3 6Barrow 3 3 3Nuiqsut 3 3 5Atkasuk 6 6 6Prudhoe Bay 3 3 6Wainwright 3 3 3
Climate-Biome Shift

Rapid
Eco
regio
nal A
ssessm
ent
Climate: Application
Projected CE change based on climate change?
Some climate variables not presented in this overview may be pertinent to a particular species.
Changing climate is likely to affect human uses of the landscape, either indirectly (e.g., as ecosystem changes alter subsistence harvest patterns) or directly (e.g., as longer summer seasons make travel across snow or ice impossible during shoulder seasons).

Rapid
Eco
regio
nal A
ssessm
ent
Permafrost: driver of change
Permafrost thaw is both a result of climate change, and a change agent in its own right
In permafrost areas, the formation and drainage of thermokarst lakes plays a key role in the hydrologic dynamics of the ecosystem
Permafrost degradation can occur in many different ways, depending on slope, soil texture, hydrology, and ice content, and each of these modes has different effects on ecosystems, human activities, infrastructure, and energy fluxes
Torre Jorgenson

Rapid
Eco
regio
nal A
ssessm
ent
Schematic of GIPL model
Permafrost thaw leads to multiple effects, including frost heaves, pits, gullies, differential tussock growth, localized drying, and changes in shrub and moss species abundance, productivity, and mortality

Rapid
Eco
regio
nal A
ssessm
ent
Mean Annual Ground Temperature (MAGT)

Rapid
Eco
regio
nal A
ssessm
ent
Active Layer Thickness (ALT)

Rapid
Eco
regio
nal A
ssessm
ent
MAGT by community
Anaktuvu
k Pass
Kaktovik
Kivalin
a
Point Hope
Point Lay
Barrow
Nuiqsut
Atkasu
k
Prudhoe Bay
Wain
wright
-9
-8
-7
-6
-5
-4
-3
-2
-1
0
2010s2020s2060s
Values are averaged across watersheds (5th level HUCs) surrounding communities. Error bars represent maximum and minimum values for 771m pixels within those HUCs.

Rapid
Eco
regio
nal A
ssessm
ent
Soil thermal regime: Applications
Permafrost loss is not expected in most parts of the REA.
Even small changes in ALT can lead to large changes in hydrology and vegetation
Literature can link ALT with vegetation Spatial analysis of shift and comparison
to cliome shift?

Rapid
Eco
regio
nal A
ssessm
ent
Change Agent: Fire
Simulated fire
Historical fire perimeters, 1950-2007
Historical climate data (CRU and PICIR climate
data, 1862-2002)
Vegetation distribution and age structure (3
classes of tundra, black spruce, white spruce,
hardwoods, and unvegetated)
Simulated landscape 1860
Generate simulated landscapes
Simulated landscape,
current
SNAP climate projections (single
model, monthly mean temperature and
precipitation)
Generate simulated linkages between climate and fire
Model outputs: simulated fire and time since fire in the NOS REA for designated time
periods Apply future climate to simulated landscape to generate simulated fires
Regional analysis of projected fire dynamics and
effects on vegetation
Average results across all five SNAP climate models and hundreds of stochastic model runs

Rapid
Eco
regio
nal A
ssessm
ent
Change Agent: Fire
SNAP climate data and the ALFRESCO model allow for simulation of fire on a spatial landscape using multiple cover types and age classes, with model runs specifically calibrated for the REA area.

Rapid
Eco
regio
nal A
ssessm
ent
Fire Assessment and Modeling
Fire was modeled using SNAP climate data and the ALFRESCO model
seagrant.uaf.edu
ALFRESCO is a stochastic model; thus, outputs were averaged across multiple model runs and across broad landscape areas.

Rapid
Eco
regio
nal A
ssessm
ent
ALFRESCO 2.0

Rapid
Eco
regio
nal A
ssessm
ent
Cumulative Area BurnedHistorical (1950-2011)ALFRESCO replicates

Rapid
Eco
regio
nal A
ssessm
ent
Fire: driving variables
July temperature is the most frequently occurring predictor across all models.
Fuel moisture for all summer months is a key predictor of area burned.
Climate-driven changes in fire have been estimated to have greater impacts on ecosystems than the direct impacts of warming climate.
Transitions may be abrupt following fire. In tundra systems, more frequent fires are
expected, but data on long-term effects are limited.

Rapid
Eco
regio
nal A
ssessm
ent
Fire: Applications
Literature review suggests that fire has been increasing in tundra systems, and is likely to continue to do so in the foreseeable future.
In forested areas, shorter fire cycles are likely to alter the relative proportions of early- vs. late-succession vegetation.
Fire frequency is likely to stabilize over time.