Embed Size (px)
Citation preview
RAPID DETERMINATION OF MOISTURE AND FAT IN MEATS BY
MICROWAVE AND NUCLEAR MAGNETIC RESONANCE ANALYSIS
A Thesis
By
AMY ELIZABETH CLAFLIN
Submitted to the Office of Graduate and Professional Studies of
Texas A&M University
in partial fulfillment of the requirements for the degree of
MASTER OF SCIENCE
Chair of Committee, Jimmy T. Keeton
Committee Members, Stephen B. Smith
Luis Cisneros-Zevallos
Head of Department, Jimmy T. Keeton
December 2013
Major Subject: Food Science and Technology
Copyright 2013 Amy Claflin
ii
ABSTRACT
Determination of moisture, fat, protein, and other components of meat is
important for the evaluation of the quality of raw materials and finished products, the
assessment of process control, and for ensuring regulatory compliance of meat products.
Standard methods of analysis may be time- or labor-intensive, expensive, potentially
harmful to the user or environment, or may require advanced training for operation of
analytical equipment, but technology has allowed the introduction of more rapid
methods that require less time, labor, skill, and cost. Microwave drying and nuclear
magnetic resonance technologies for the determination of moisture and fat in meat
products, respectively, have been incorporated into the CEM Smart Trac 5 System®, an
instrument designed for the rapid analysis of moisture and fat in various food products.
The CEM Smart Trac 5 System®, approved as an AOAC Peer Verified Method,
was used in a collaborative study for the rapid determination of moisture and fat in a
variety of raw and processed meat products of beef, pork, chicken, and turkey origin.
The objective of the study was to determine if the CEM Smart Trac 5 System® could
analyze moisture and fat in meat products with the same accuracy and precision as
standard methods of analysis as specified by the Association of Official Analytical
Chemists (AOAC). Meat products were obtained from various commercial sources,
homogenized, and distributed to 10 collaborative laboratories. Each collaborative
laboratory evaluated the fat and moisture content of each meat product samples provided
using the CEM Smart Trac 5 System®. Two standard methods of analysis, Forced Air
iii
Drying Method (AOAC Official Method 950.46) and Soxhlet Extraction of Crude Fat
(AOAC Official Method 960.39), were performed on each sample for comparison to the
Smart Trac 5 System®. Ten replicates were analyzed by the reference methods to
achieve an analytical variance of no more than + 2%. Data collected from the reference
methods for moisture (AOAC 950.46) and fat (AOAC 960.39) were used for the
calibration of each of the CEM Smart Trac 5 Systems® and for comparison to the results
produced by the Smart Trac 5 System® in each of the collaborative laboratories.
The results indicated that the CEM Smart Trac 5 System® compares favorably
with the AOAC methods for moisture and fat determination. The CEM Smart Trac 5
System® would be suitable for the rapid determination of moisture and fat in a variety of
commercially produced raw and processed meat and poultry products. Statistical
analysis confirmed the within-laboratory repeatability qualities of AOAC methods and
provided a baseline for comparing the between-laboratory reproducibility potential of
the CEM Smart Trac 5 System®.
For all samples evaluated, the within-laboratory (repeatability) results and
between-laboratory (reproducibility) results for moisture were acceptable. With the
exception of low-fat ham, diluted low-fat ham, low-fat pork, diluted low-fat pork,
diluted low-fat chicken, low-fat turkey, and diluted low-fat turkey, the within-laboratory
(repeatability) results and between-laboratory (reproducibility) results for fat were
acceptable. This study revealed that meat samples that have a very low concentration of
fat (i.e. <3% fat) yielded relative standard deviation values (> 2%) that were not
acceptable by AOAC standards.
iv
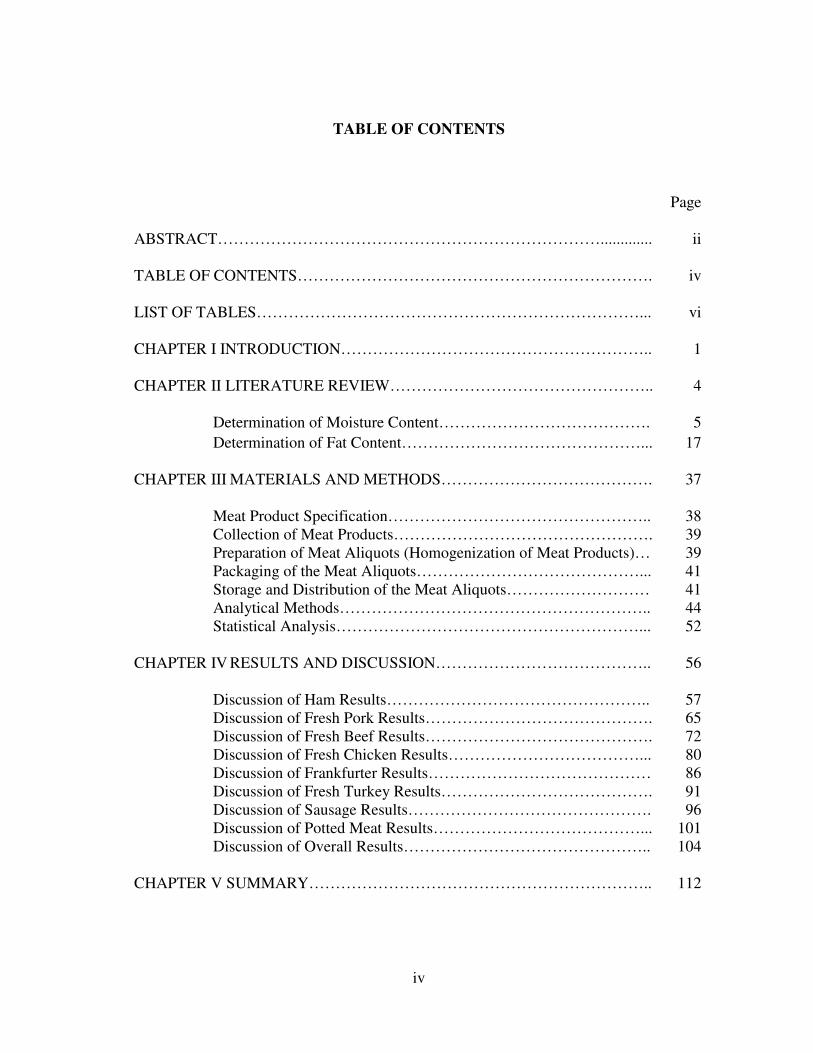
TABLE OF CONTENTS
ABSTRACT……………………………………………………………….............
Page
ii
TABLE OF CONTENTS…………………………………………………………. iv
LIST OF TABLES………………………………………………………………... vi
CHAPTER I INTRODUCTION………………………………………………….. 1
CHAPTER II LITERATURE REVIEW………………………………………….. 4
Determination of Moisture Content…………………………………. 5
Determination of Fat Content………………………………………... 17
CHAPTER III MATERIALS AND METHODS…………………………………. 37
Meat Product Specification………………………………………….. 38
Collection of Meat Products…………………………………………. 39
Preparation of Meat Aliquots (Homogenization of Meat Products)… 39
Packaging of the Meat Aliquots……………………………………... 41
Storage and Distribution of the Meat Aliquots……………………… 41
Analytical Methods………………………………………………….. 44
Statistical Analysis…………………………………………………... 52
CHAPTER IV RESULTS AND DISCUSSION………………………………….. 56
Discussion of Ham Results………………………………………….. 57
Discussion of Fresh Pork Results……………………………………. 65
Discussion of Fresh Beef Results……………………………………. 72
Discussion of Fresh Chicken Results………………………………... 80
Discussion of Frankfurter Results…………………………………… 86
Discussion of Fresh Turkey Results…………………………………. 91
Discussion of Sausage Results………………………………………. 96
Discussion of Potted Meat Results…………………………………... 101
Discussion of Overall Results……………………………………….. 104
CHAPTER V SUMMARY……………………………………………………….. 112

v
CHAPTER VI CONCLUSIONS…………………………………………………. 114
LITERATURE CITED…………………………………………………………… 115
APPENDIX……………………………………………………………………….. 118
vi
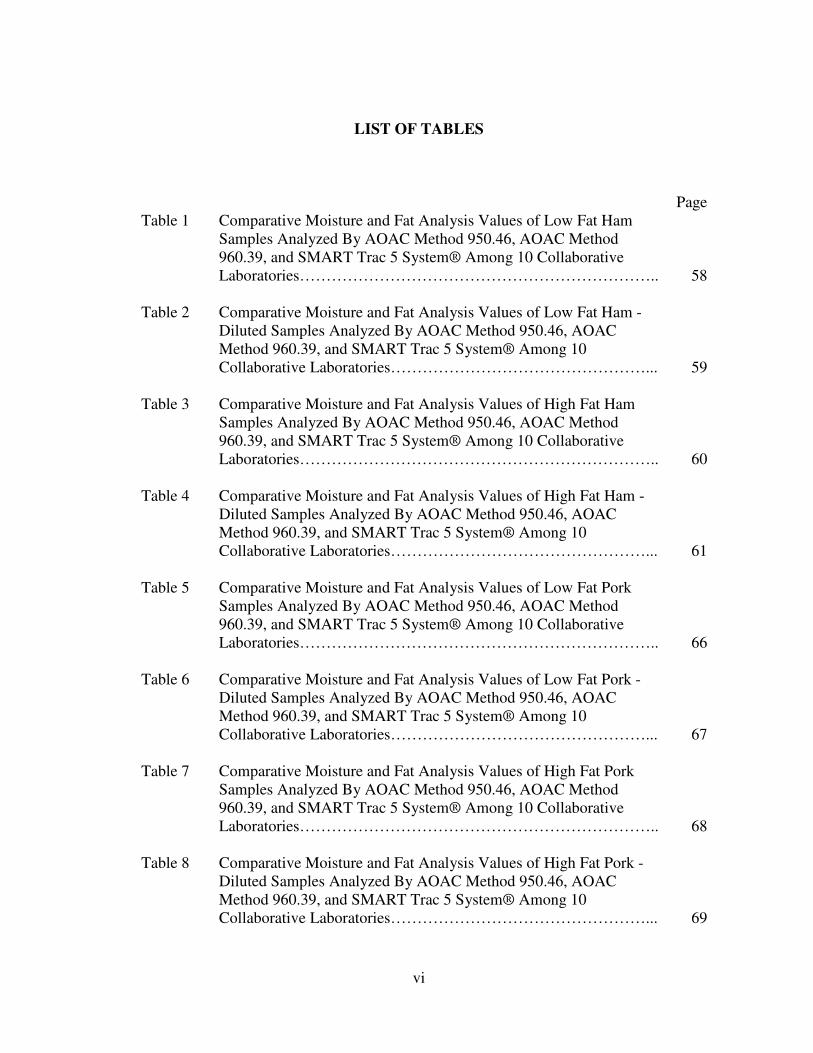
LIST OF TABLES
Table 1
Comparative Moisture and Fat Analysis Values of Low Fat Ham
Samples Analyzed By AOAC Method 950.46, AOAC Method
960.39, and SMART Trac 5 System® Among 10 Collaborative
Laboratories…………………………………………………………..
Page
58
Table 2 Comparative Moisture and Fat Analysis Values of Low Fat Ham -
Diluted Samples Analyzed By AOAC Method 950.46, AOAC
Method 960.39, and SMART Trac 5 System® Among 10
Collaborative Laboratories…………………………………………...
59
Table 3 Comparative Moisture and Fat Analysis Values of High Fat Ham
Samples Analyzed By AOAC Method 950.46, AOAC Method
960.39, and SMART Trac 5 System® Among 10 Collaborative
Laboratories…………………………………………………………..
60
Table 4 Comparative Moisture and Fat Analysis Values of High Fat Ham -
Diluted Samples Analyzed By AOAC Method 950.46, AOAC
Method 960.39, and SMART Trac 5 System® Among 10
Collaborative Laboratories…………………………………………...
61
Table 5 Comparative Moisture and Fat Analysis Values of Low Fat Pork
Samples Analyzed By AOAC Method 950.46, AOAC Method
960.39, and SMART Trac 5 System® Among 10 Collaborative
Laboratories…………………………………………………………..
66
Table 6 Comparative Moisture and Fat Analysis Values of Low Fat Pork -
Diluted Samples Analyzed By AOAC Method 950.46, AOAC
Method 960.39, and SMART Trac 5 System® Among 10
Collaborative Laboratories…………………………………………...
67
Table 7 Comparative Moisture and Fat Analysis Values of High Fat Pork
Samples Analyzed By AOAC Method 950.46, AOAC Method
960.39, and SMART Trac 5 System® Among 10 Collaborative
Laboratories…………………………………………………………..
68
Table 8 Comparative Moisture and Fat Analysis Values of High Fat Pork -
Diluted Samples Analyzed By AOAC Method 950.46, AOAC
Method 960.39, and SMART Trac 5 System® Among 10
Collaborative Laboratories…………………………………………...
69
vii
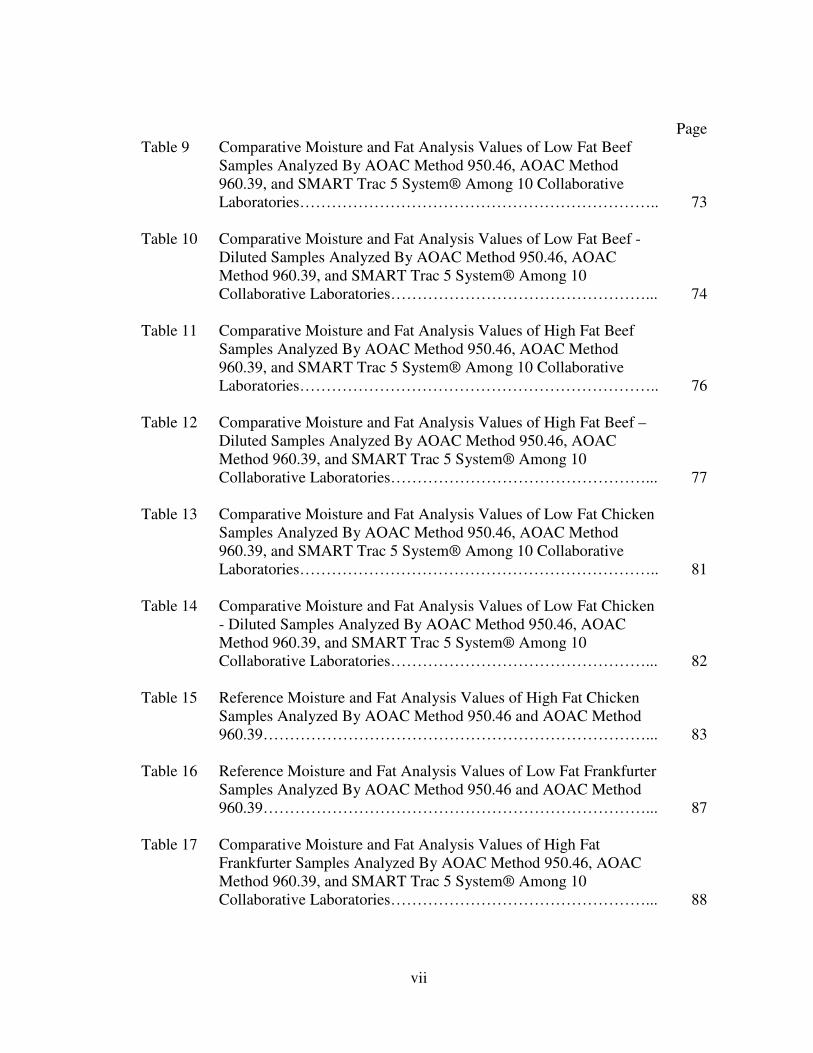
Table 9
Comparative Moisture and Fat Analysis Values of Low Fat Beef
Samples Analyzed By AOAC Method 950.46, AOAC Method
960.39, and SMART Trac 5 System® Among 10 Collaborative
Laboratories…………………………………………………………..
Page
73
Table 10 Comparative Moisture and Fat Analysis Values of Low Fat Beef -
Diluted Samples Analyzed By AOAC Method 950.46, AOAC
Method 960.39, and SMART Trac 5 System® Among 10
Collaborative Laboratories…………………………………………...
74
Table 11 Comparative Moisture and Fat Analysis Values of High Fat Beef
Samples Analyzed By AOAC Method 950.46, AOAC Method
960.39, and SMART Trac 5 System® Among 10 Collaborative
Laboratories…………………………………………………………..
76
Table 12 Comparative Moisture and Fat Analysis Values of High Fat Beef –
Diluted Samples Analyzed By AOAC Method 950.46, AOAC
Method 960.39, and SMART Trac 5 System® Among 10
Collaborative Laboratories…………………………………………...
77
Table 13 Comparative Moisture and Fat Analysis Values of Low Fat Chicken
Samples Analyzed By AOAC Method 950.46, AOAC Method
960.39, and SMART Trac 5 System® Among 10 Collaborative
Laboratories…………………………………………………………..
81
Table 14 Comparative Moisture and Fat Analysis Values of Low Fat Chicken
- Diluted Samples Analyzed By AOAC Method 950.46, AOAC
Method 960.39, and SMART Trac 5 System® Among 10
Collaborative Laboratories…………………………………………...
82
Table 15 Reference Moisture and Fat Analysis Values of High Fat Chicken
Samples Analyzed By AOAC Method 950.46 and AOAC Method
960.39………………………………………………………………...
83
Table 16 Reference Moisture and Fat Analysis Values of Low Fat Frankfurter
Samples Analyzed By AOAC Method 950.46 and AOAC Method
960.39………………………………………………………………...
87
Table 17 Comparative Moisture and Fat Analysis Values of High Fat
Frankfurter Samples Analyzed By AOAC Method 950.46, AOAC
Method 960.39, and SMART Trac 5 System® Among 10
Collaborative Laboratories…………………………………………...
88
viii
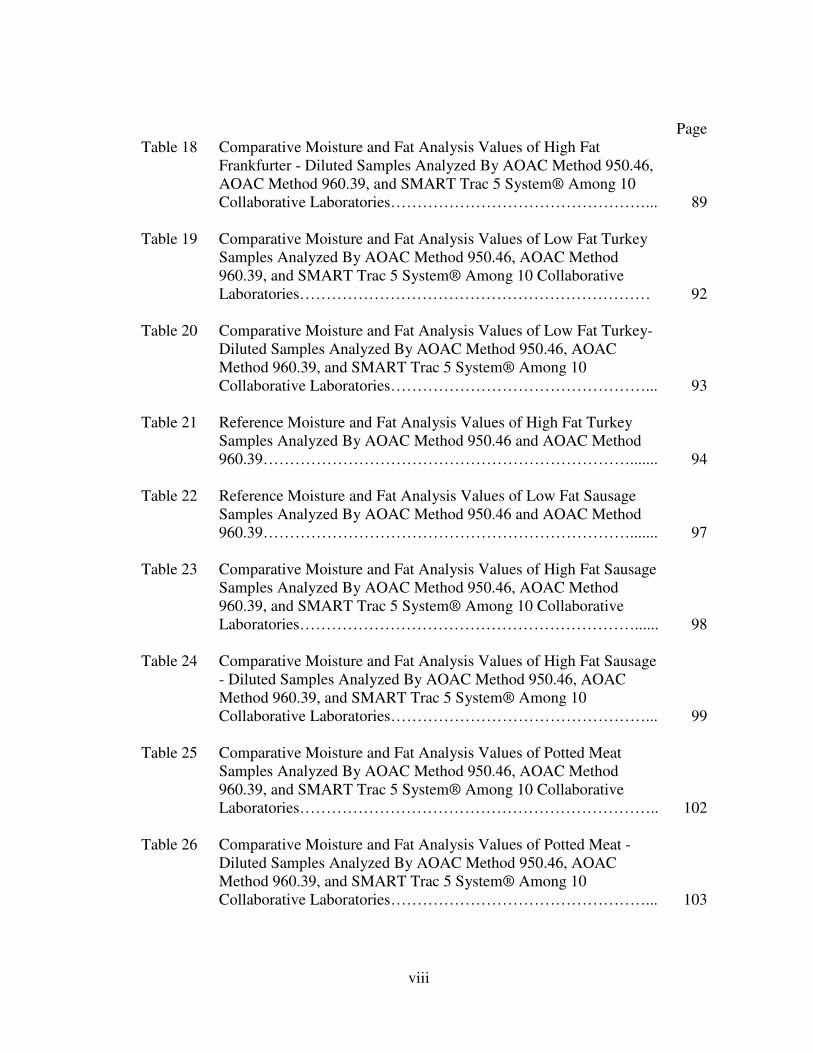
Table 18
Comparative Moisture and Fat Analysis Values of High Fat
Frankfurter - Diluted Samples Analyzed By AOAC Method 950.46,
AOAC Method 960.39, and SMART Trac 5 System® Among 10
Collaborative Laboratories…………………………………………...
Page
89
Table 19 Comparative Moisture and Fat Analysis Values of Low Fat Turkey
Samples Analyzed By AOAC Method 950.46, AOAC Method
960.39, and SMART Trac 5 System® Among 10 Collaborative
Laboratories…………………………………………………………
92
Table 20 Comparative Moisture and Fat Analysis Values of Low Fat Turkey-
Diluted Samples Analyzed By AOAC Method 950.46, AOAC
Method 960.39, and SMART Trac 5 System® Among 10
Collaborative Laboratories…………………………………………...
93
Table 21 Reference Moisture and Fat Analysis Values of High Fat Turkey
Samples Analyzed By AOAC Method 950.46 and AOAC Method
960.39…………………………………………………………….......
94
Table 22 Reference Moisture and Fat Analysis Values of Low Fat Sausage
Samples Analyzed By AOAC Method 950.46 and AOAC Method
960.39…………………………………………………………….......
97
Table 23 Comparative Moisture and Fat Analysis Values of High Fat Sausage
Samples Analyzed By AOAC Method 950.46, AOAC Method
960.39, and SMART Trac 5 System® Among 10 Collaborative
Laboratories………………………………………………………......
98
Table 24 Comparative Moisture and Fat Analysis Values of High Fat Sausage
- Diluted Samples Analyzed By AOAC Method 950.46, AOAC
Method 960.39, and SMART Trac 5 System® Among 10
Collaborative Laboratories…………………………………………...
99
Table 25 Comparative Moisture and Fat Analysis Values of Potted Meat
Samples Analyzed By AOAC Method 950.46, AOAC Method
960.39, and SMART Trac 5 System® Among 10 Collaborative
Laboratories…………………………………………………………..
102
Table 26 Comparative Moisture and Fat Analysis Values of Potted Meat -
Diluted Samples Analyzed By AOAC Method 950.46, AOAC
Method 960.39, and SMART Trac 5 System® Among 10
Collaborative Laboratories…………………………………………...
103
ix
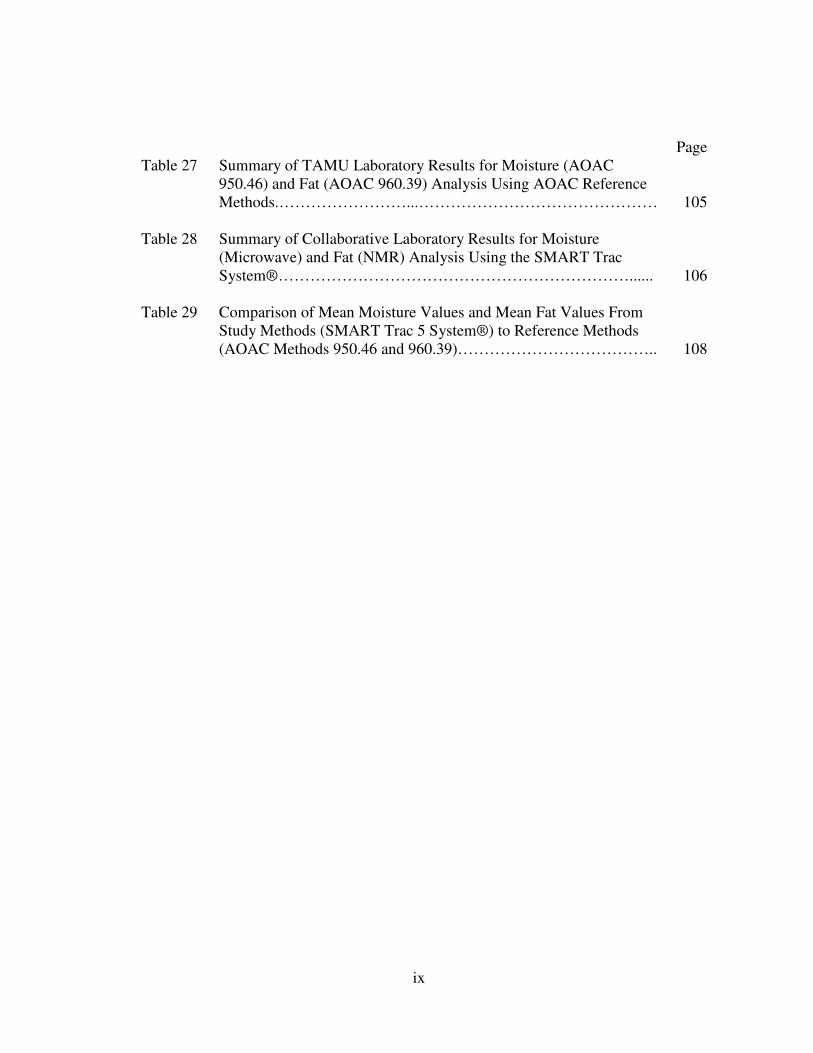
Table 27
Summary of TAMU Laboratory Results for Moisture (AOAC
950.46) and Fat (AOAC 960.39) Analysis Using AOAC Reference
Methods.……………………...………………………………………
Page
105
Table 28 Summary of Collaborative Laboratory Results for Moisture
(Microwave) and Fat (NMR) Analysis Using the SMART Trac
System®…………………………………………………………......
106
Table 29 Comparison of Mean Moisture Values and Mean Fat Values From
Study Methods (SMART Trac 5 System®) to Reference Methods
(AOAC Methods 950.46 and 960.39)………………………………..
108
1
CHAPTER I
INTRODUCTION
Analyses for the determination of moisture, fat, protein, salt, and other analytes
in meat and poultry products are important for evaluating raw material quality, ensuring
process control and finished product composition, and meeting regulatory compliance in
meat plant operations. Such analyses are also valuable for scientists in governmental
agencies and academia conducting food related research.
Regulatory requirements are in place to protect the health and safety of
consumers by ensuring that the food produced is safe for human consumption, complies
with government regulations, and conforms to information provided on the label.
Ensuring compliance with regulatory requirements and meeting customer specifications
are two of the most important purposes for analyzing meat and poultry products.
In addition, analysis of raw materials and final products can assist the producer in
more effectively manufacturing a product that fulfills product specifications and that is
consistent in taste, quality, and appearance batch after batch. Analyses also assist the
producer in controlling costs through use of appropriate ingredients, meeting the
expectations of customers, minimizing waste, and avoiding unnecessary expense.
Standard methods of analysis are universally accepted and provide a known
degree of accuracy and precision. However, some standard methods of analysis of meat
and poultry products can be time- or energy-intensive, require highly trained personnel,
involve the use of harmful or toxic chemicals, or generate wastes that have expensive
2
disposal fees. Other methods of analysis may not provide the same degree of accuracy,
but may have greater ease of use or require less time or less training of employees.
Laboratories in plant operations and other entities may select a method of analysis for
use in their facility based upon the following criteria: the types of products
manufactured, specific component(s) in the product, product specifications, budget,
training of personnel, laboratory capacity, number of samples to be analyzed, time
requirements, degree of accuracy, reliability of the equipment or method, or other
important factors.
Rapid analytical methods with the potential to produce results with the same
precision and accuracy as standard methods would be of great benefit to researchers,
plant operations, governmental agencies, academia, and other entities. Of particular
interest for this study was comparison of rapid analytical methods for the determination
of moisture and fat in raw and processed meat and poultry products to standard methods
of analysis. The intent was to verify the accuracy and precision of the CEM Smart Trac
5 System® by comparing same sample analytical results to those of accepted standard
methods, such as the Association of Official Analytical Chemists (AOAC) Official
Methods. To accomplish this, an Association of Official Analytical Chemists (AOAC)
collaborative study involving 10 laboratories was conducted to analyze various raw and
processed meat products commonly produced and distributed by the meat industry.
We hypothesized that the combined use of microwave drying technology and
nuclear magnetic resonance (NMR) technology incorporated into the CEM Smart Trac 5
System® would be effective in rapidly determining the moisture and fat content of meat
3
products, respectively, with comparable accuracy and precision to the standard methods
of analysis (AOAC Official Methods 950.46 for moisture and 960.39 for fat).
Previously, CEM Corporation (Matthews, NC) obtained AOAC Peer-Verified Method
(PVM) approval for the CEM Smart Trac 5 System® that was used in this study,
indicating the instrument’s potential for use as an acceptable method for rapid analysis
of moisture and fat in meat and poultry products.
The objective of this study was to compare the moisture and fat content of a
variety of raw and processed meat products using standard and rapid methods of analysis
as part of a 10 laboratory collaborative study for the fulfillment of AOAC requirements
to become an official method of analysis. This study evaluated the accuracy and
precision of the CEM Smart Trac 5 System® for rapid determination of moisture and fat
in meat products in comparison to the standard methods of analysis (AOAC official
methods 950.46 and 960.39, respectively). Knowledge from this study may provide
food processors, governmental and regulatory laboratories, and researchers in academia
a tool that will improve testing efficiency, save time, and reduce the cost of labor
without compromising the accuracy or precision of the results.
4
CHAPTER II
LITERATURE REVIEW
Analytical methods for proximate (fat, water, protein, ash) composition are
essential in the meat industry for good product control. Consistency in the formulation
and blending stages of meat for further processed products is of great importance for
controlling costs, maintaining process control, and ensuring compliance with
governmental regulations (Sebranek 1998). Meat and further processed meat products
can go from raw material to finished product within a few hours depending on plant
operation capabilities, thus it is vital to have rapid analytical methods that provide quick
and efficient results throughout the production process.
In the evaluation of meat and meat products, standard methods of analysis have
been universally accepted and used in research, analytical laboratories, and the food
industry, but the standard methods for moisture and fat analysis can be time-consuming,
costly, inconvenient, and require trained personnel, specialized laboratory equipment,
and harmful chemicals. Such methods are not efficient or practical in fast-paced plant
operations, so rapid methods of analysis with similar precision and repeatability are
essential.
The use of rapid methods for proximate composition would have obvious
advantages, including time and labor savings, collection of a greater number of sample
measurements, better control over multi-step processes, more precise formulations, and
more frequent checks on processes (Sebranek 1998). Two important factors that should
be considered in obtaining usable analytical information, regardless of the analytical
5
method to be used, are sample preparation and method performance. Samples should be
collected and prepared in a manner to provide a homogenous, uniform, and
representative portion of the larger lot. This becomes increasingly important as sample
size becomes limited to 1 g or 2 g for some methods of analysis. The second factor,
method performance, should be evaluated objectively before selecting a method of
analysis and then continuously monitored for performance (Sebranek 1998).
Determination of Moisture Content
Lean muscle tissue of beef, pork, lamb, and chicken is comprised of
approximately 68-74% moisture, 19-23% protein, 4-11% lipid, and 1.0-1.6% ash
(Foegeding and others 1996). Water is the most abundant chemical component of meat,
and the predominant component of lean muscle, but not fatty tissue. The total moisture
content of a meat cut varies inversely with the amount of fat in the tissue, so the leaner
the meat cut, the higher the moisture content (Romans and others 2001).
Water is a common ingredient added to further processed meat products to help
facilitate chopping and mixing, to control meat batter temperature (when added as ice),
to hydrate binders and extenders within a product formulation, to achieve a specific
texture, to improve product juiciness, and to assist salt in solubilizing meat proteins for
batter stability (Romans and others 2001).
Multiple factors can affect the moisture content of a meat product. These factors
include fat percentage (inverse relationship), addition of water and non-meat ingredients,
and degree and type of processing and cooking. The moisture content of a meat or food
6
product is important because of the properties of water, its interaction with other
components in the product, and its contribution to the chemical, biological, and physical
properties of foods (Cornejo and Chinachoti 2003).
Several analytical methods, including drying methods and spectroscopic
methods, have been developed and used in the food industry to determine the moisture
content of meat and meat products. Drying methods offer accurate moisture values, are
relatively easy and inexpensive to perform, permit the simultaneous analyses of large
numbers of samples, and do not require calibration of equipment. Although drying
methods offer many advantages, the greatest disadvantage to drying is the length of time
required to perform the analysis in comparison to spectroscopic methods. The drying
process is often lengthy (generally several hours), since the degree of heating for
moisture determination is generally performed at 95-105°C to prevent decomposition of
lipids, proteins, or other components within the sample that could release compounds
and falsify moisture results (Honikel 2009).
In comparison to drying, spectroscopic methods from moisture determination are
more rapid and often enable the simultaneous measurement of other analytes (such as fat
or protein) within the same sample. However, spectroscopic methods often involve
more expensive and specialized equipment and are dependant on careful and proper
calibration of each instrument with samples similar to the unknowns to be measured.
Additionally, if the sample material being analyzed falls outside of the range of the
samples used to calibrate the equipment, then re-calibration of the equipment based on
new parameters may be necessary (Honikel 2009).
7
The following paragraphs will discuss specific methods for determining moisture
content in meat and meat products, including drying (Forced Air Drying, Rapid
Microwave Drying, and Drying Under Vacuum) and spectroscopic methods (Near
Infrared Transmittance and Guided Microwave Spectrometry).
Forced Air Drying (AOAC Method 950.46(B))
The AOAC standard reference method 950.46(B), Forced Air Drying Method, is
a gravimetric method that uses an air oven (mechanical convection is preferred) to dry a
meat sample for the determination of moisture content. In this method, a small amount
(ca 5-6 g) of homogenized meat sample is evenly distributed in a small aluminum dish
(> 50 mm diameter and < 40 mm deep), then dried in an air oven (16-18 hr at 100-102°C
with lids removed) to produce ca 2 g of dried material. When drying is complete, the
dishes are covered (with their corresponding lid), cooled to a constant weight in a
desiccator, and weighed (AOAC 2006a). The weight loss is reported as the moisture
content (as a percentage of total sample weight) and is calculated by subtracting the
weight of the wet meat sample (includes weight of dish and lid) and the weight of the
dried meat sample (includes weight of dish and lid), dividing the difference by the
weight of the wet meat sample (includes weight of dish and lid), and then multiplying
the quotient by 100.
Moisture = Wet Meat Wt. – Dried Meat Wt. x 100
Wet Meat Wt.
The two greatest advantages to using this method include its low cost and the
accurate and precise results that it provides for a wide variety of products. In addition,
8
multiple 5-6 g homogenized meat samples can be dried simultaneously in an oven. The
greatest disadvantage to using this method is the amount of time (16-18 hr) required to
dry the samples, which is inconvenient for fast-paced operations and may hinder real-
time production and product quality decisions. In addition, the dried sample obtained
from this method cannot be used in subsequent fat determination. The temperature and
time at which a sample is dried are very important when considering drying methods for
the determination of moisture in a sample. High temperatures and long drying times
could result in oxidation of fat in the sample, which could lead to erroneous moisture
results.
If a mechanical convection oven or gravity oven with single shelf, set at 125°C,
is available for use, then the drying time may be reduced from 16-18 hr to 2-4 hr
(depending on the product), as indicated in AOAC 950.46(B)(b). Procedures for sample
preparation, desiccation, and moisture calculation are the same as described above and
the resultant dried sample cannot be used for subsequent fat determination (AOAC
2006a).
Rapid Microwave Drying Method (AOAC 985.14)
The AOAC standard reference method 985.14, Rapid Microwave Drying
Method, is a gravimetric method that uses microwave energy to rapidly dry a
homogenized meat sample. The CEM Smart Trac 5 System®, which was the instrument
used in this collaborative study for the fulfillment of AOAC requirements to become an
official method, uses focused microwave drying technology for moisture determination.
9
The instrument is comprised of a computerized microwave moisture analyzer, an
automatic tare electronic balance, a microwave drying system, and a microprocessor
digital computer control (AOAC 2006c).
To perform the analysis, two glass fiber pads (9.8 x 10.2 cm, CEM Corp. or
equivalent) are tared on the instrument’s internal electronic balance. A homogenized
meat sample (ca 4 g) is spread evenly across one glass fiber pad using a Teflon coated
spatula. The second glass fiber pad is then placed over the sample (to produce a
‘sandwiched’ appearance). The prepared sample ‘sandwich’ is transferred to the
instrument’s drying chamber and dried per manufacturer’s instructions. The microwave
moisture analyzer automatically calculates moisture content based on weight loss during
drying (determined by the electronic balance readings before and after drying) and
displays the result on the equipment’s digital readout panel (AOAC 2006c).
The four greatest advantages to using this method include the rapid determination
of moisture content (3-5 min), the ease of use of the instrument (does not require highly
trained or skilled personnel), comparable degree of precision and accuracy to traditional
drying methods, and the resultant dried sample can be used for subsequent fat analysis in
the instrument’s NMR chamber. The greatest potential disadvantage to using this
method is that it is limited to analyzing one sample at a time, so the equipment may not
have the capacity to perform moisture and fat analysis in settings that require numerous
product sample analysis (i.e. > 100 samples per day). A second potential disadvantage
to using the CEM Smart Trac 5 System® is the initial cost required to purchase the
10
instrumentation. In addition, consumable materials, such as the glass fiber pads, would
also need to be replaced.
Drying Under Vacuum at 95-100°C (AOAC 950.46(A))
The AOAC standard reference method 950.46(A), Drying Under Vacuum
Method, is a gravimetric method that uses a vacuum oven to dry a homogenized meat
sample for the determination of moisture content. In this method, ca 5-6 g homogenized
meat sample is evenly distributed in a small aluminum dish (> 50 mm diameter and < 40
mm deep), then dried under pressure (<100 mm Hg at 95-100°C with lids removed, ca 5
hr) to produce ca 2 g of dried material. When drying is complete, the dishes are covered
(with their corresponding lid), cooled in a desiccator to a constant weight, and weighed.
The loss of weight is reported as moisture content (as a percentage of total sample
weight) and is calculated by subtracting the weight of the wet meat sample (includes
weight of dish and lid) and the weight of the dried meat sample (includes weight of dish
and lid), dividing the difference by the weight of the wet meat sample (includes weight
of dish and lid), and then multiplying the quotient by 100.
Moisture = Wet Meat Wt. – Dried Meat Wt. x 100
Wet Meat Wt.
The greatest advantage to using this method is the shorter drying time required in
comparison to the forced air drying method. By drying under reduced pressure, more
complete removal of water and volatiles can be obtained without decomposition
(Bradley 2003). The three greatest disadvantages to using this method are that it is not
suitable for high fat products (i.e. pork sausage), the dried sample obtained cannot be
11
used for subsequent fat determination (AOAC 2006a), and the number of samples that
can be analyzed at a time or throughout the day may be limited due to the size and
capacity of the vacuum chamber.
Near Infrared Transmittance (FOSS FoodScan™, AOAC 2007.04)
Near Infrared (NIR) Transmittance technology offers a newer and more
sophisticated spectroscopic method for the analysis of moisture content in meat samples.
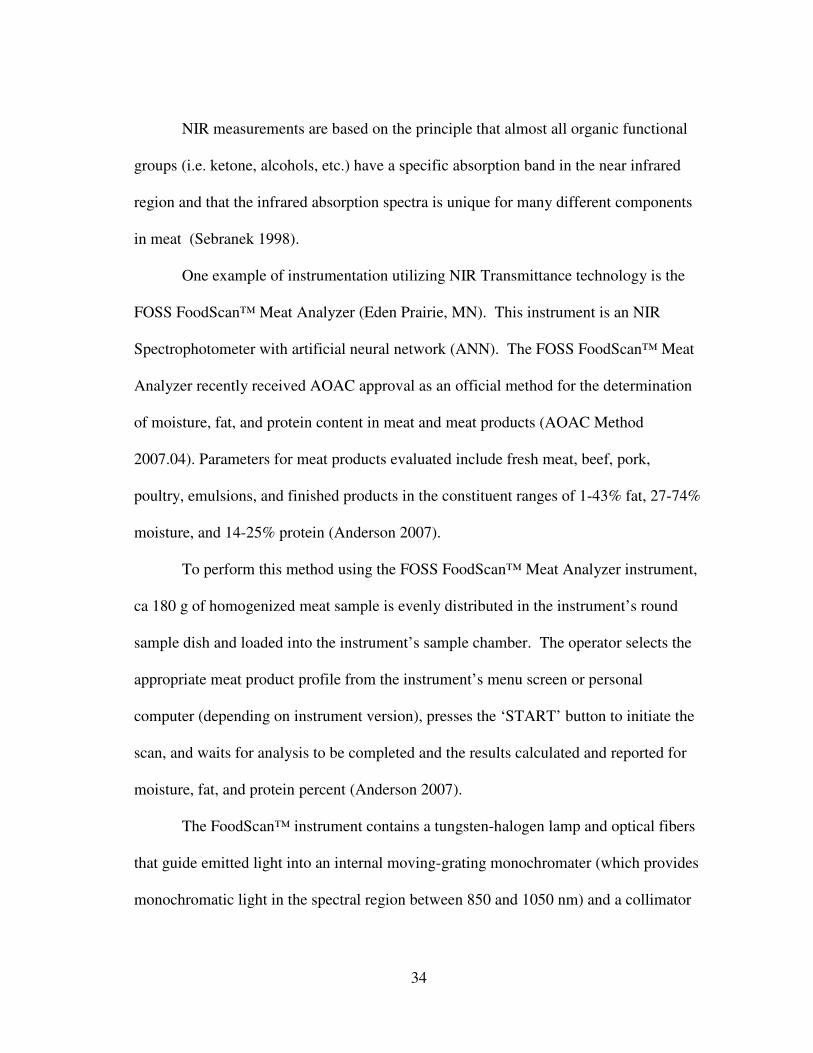
NIR measurements are based on the principle that almost all organic functional groups
(i.e. ketones, alcohols, etc.) have a specific absorption band in the near infrared region
and that the infrared absorption spectra is unique for many different components in meat
(Sabrenek 1998).
One example of instrumentation utilizing NIR Transmittance technology is the
FOSS FoodScan™ Meat Analyzer (Eden Prairie, MN). This instrument is an NIR
Spectrophotometer with artificial neural network (ANN). The FOSS FoodScan™ Meat
Analyzer recently received AOAC approval as an official method for the determination
of moisture, fat, and protein content in meat and meat products (AOAC Method
2007.04). Parameters for meat products evaluated included fresh meat, beef, pork,
poultry, emulsions, and finished products in the constituent ranges of 1-43% fat, 27-74%
moisture, and 14-25% protein (Anderson 2007).
To perform this method using the FOSS FoodScan™ Meat Analyzer instrument,
ca 180 g of homogenized meat sample is evenly distributed in the instrument’s round
sample dish and loaded into the instrument’s sample chamber. The operator selects the
12
appropriate meat product profile from the instrument’s menu screen or personal
computer (depending on instrument version), presses the ‘START’ button to initiate the
scan, and waits for analysis to be completed and the results calculated and reported for
moisture, fat, and protein percent (Anderson 2007).
The FOSS FoodScan™ instrument contains a tungsten-halogen lamp and optical
fibers that guide emitted light into an internal moving-grating monochromater (which
provides monochromatic light in the spectral region between 850 and 1050 nm) and a
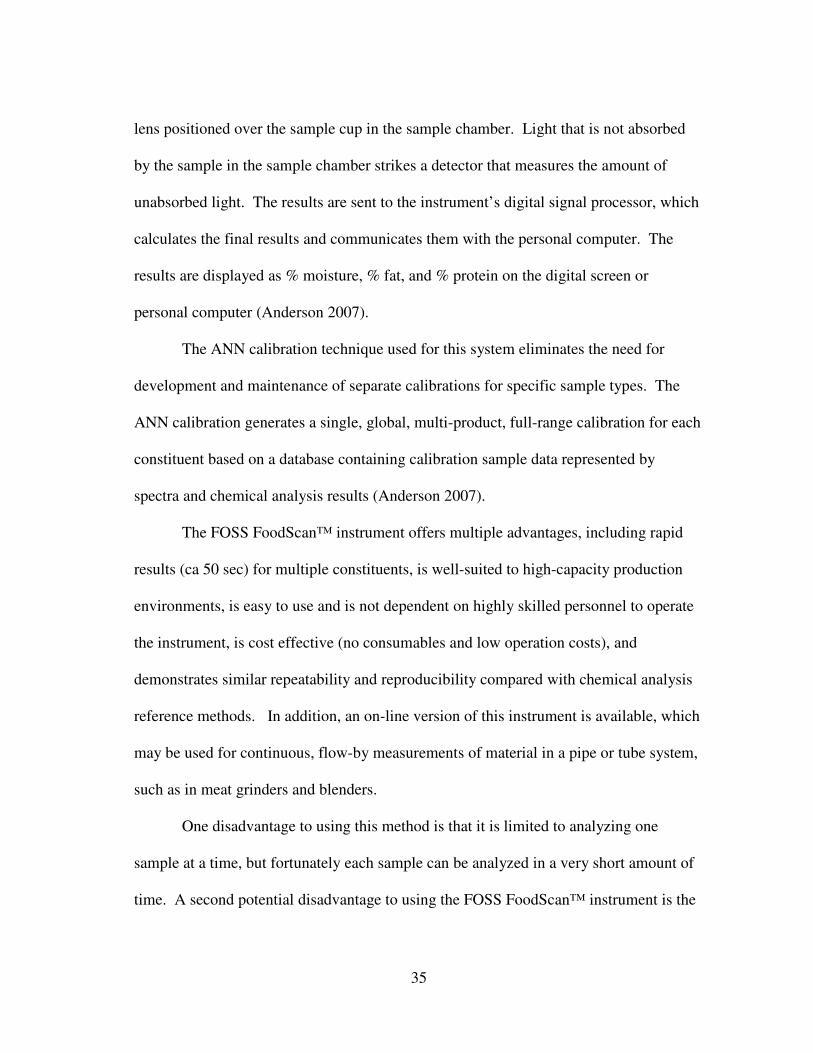
collimator lens positioned over the sample cup in the sample chamber. Light that is not
absorbed by the sample in the sample chamber strikes a detector that measures the
amount of unabsorbed light. The results are sent to the instrument’s digital signal
processor, which calculates the final results and communicates them with the personal
computer. The results are displayed as % moisture, % fat, and % protein on the digital
screen or personal computer (Anderson 2007).
The ANN calibration technique used for this system eliminates the need for
development and maintenance of separate calibrations for specific sample types. The
ANN calibration generates a single, global, multi-product, full-range calibration for each
constituent based on a database containing calibration sample data represented by
spectra and chemical analysis results (Anderson 2007).
The FOSS FoodScan™ instrument offers multiple advantages, including rapid
results (ca 50 sec) for multiple constituents, is well-suited to high-capacity production
environments, is easy to use and not dependent on highly skilled personnel to operate the
instrument, is cost effective (no consumable materials and low operation costs), and
13
demonstrates similar repeatability and reproducibility compared with chemical analysis
reference methods. In addition, an on-line version of this instrument is available, which
may be used for continuous, flow-by measurements of material in a pipe or tube system,
such as in meat grinders and blenders.
One disadvantage to using this method is that it is limited to analyzing one
sample at a time, but fortunately each sample can be analyzed in a very short amount of
time. A second potential disadvantage to using the FOSS FoodScan™ instrument is the
initial cost required to purchase the instrumentation. Additional disadvantages may
exist, such as affected instrumentation performance due to addition of non-meat
ingredients (such as spices, colorants, or other ingredients that affect meat batter color)
or the presence of ice crystals in the sample. Although not discussed in the literature, ice
crystals, non-meat ingredients, or other factors may potentially interfere with the
instrument’s infrared absorption performance. In such cases, it may be necessary to
calibrate the equipment specific to the type of product being analyzed in order to obtain
the most reliable results.
NIR transmission instruments are believed to perform better than NIR reflectance
instruments because a greater amount of sample may be scanned and a highly sensitive
detector can be used (Sebranek 1998). In many cases, sample scans with infrared
instruments must be calibrated against known values for sample composition with
reference methods. In addition, a large number of samples similar to those to be
measured need to be included for calibration (Sebranek 1998).
14
Guided Microwave Spectrometry (GMS)
Guided Microwave Spectrometry (GMS) is a method that is based on microwave
energy absorption. It utilizes a broad range of frequencies (up to 750 frequencies) in the
microwave spectrum to measure molecular electromagnetic properties (such as the
dielectric constant of water, conductivity, and molecular relaxation time) and relate
those properties to composition (such as moisture, fat, and protein) through the use of a
transmitter and receiver within the GMS instrument (Sebranek 1998).
The E-Scan In-line Food Analyzer™ (Guided Microwave Spectrometer) by
Thermo Fisher Scientific, Inc. is an example of an instrument that uses GMS technology
for the determination of moisture, fat, and protein in ground meat. The instrument
includes a GMS chamber, electronics control module, and PC-based software for
developing calibrations and configuring the analyzer (ThermoElectron Corp. 2003).
The instrument is installed within processing equipment and can provide rapid,
real-time data feedback from analysis of samples flowing through pipe-type processes.
Commercial applications for the meat industry have been for meat grinders where
product composition can be measured as the meat exits the grinder (Sebranek 1998).
Calibration of the instrument prior to sample measurement is needed, and the results are
validated with daily checks against the results from an off-line measurement tool. GMS
has been used to measure moisture in milled corn, dog food, candy-coated peanuts,
dough, peppercorns, and other foods, but measurement of moisture, fat, and protein in
ground meat is a newer application (Food Eng Mag 2004).
15
Microwave energy is sensitive to the concentration of polar, semi-polar, and non-
polar molecules such as water, protein, fat, oil, and ion/salt concentration in a process or
sample (ThermoElectron Corp. 2003). When electromagnetic energy of various
frequencies in the microwave spectrum is transmitted through sample material in a GMS
instrument, the polar molecules (such as water) within the sample rotate and align with
the electromagnetic field. The movement of the molecules cause the microwave signal
to be attenuated or weakened, and the velocity of the wave decreases as it passes through
the sample (Food Eng Mag 2004).
The attenuation of the microwave signal through the sample and the reduction in
velocity of the energy (which changes the wavelength) results in what is known as the
cut-off region, which is one of two characteristic features of the GMS spectrum. The cut-
off region is the characteristic high slope ‘rise’ in the spectrum and is determined by the
dielectric constant of the sample. The cut-off region is generally sensitive to moisture
(ThermoElectron Corp. 2003).
The second characteristic feature of the GMS spectrum is the pass-band region,
which is generally horizontal and shifts in the vertical direction with small changes in
the slope. The amplitude (intensity) of the pass-band region is determined by the
conductivity of the sample and the amount of energy that is lost in the transmission of
electromagnetic energy from the GMS instrument transmitter to the receiver antennae of
the GMS chamber (ThermoElectron Corp., 2003). The pass-band region is generally
sensitive to constituents other than water.
16
The GMS system is ‘trained’ to interpret readings it receives from the product
using multiple regression analysis to compare the plotted cut-off and pass-band regions
with results from off-line analysis of the same sample (Food Eng Mag 2004). Using a
well-defined calibration, the changes in the pass-band and cut-off regions are correlated
to the amount of change in the concentration of the component of interest (i.e. moisture,
fat) in the sample material being analyzed (ThermoElectron Corp. 2003). The slope and
the intercept of the cut-off and pass-band regions are plotted to derive a rapid response
analysis. The cut-off band shifts to the right on the X-axis (a measure of frequency) as
moisture content decreases. The strength of the signal in the pass-band region indicates
other constituents in the sample, each with its own electromagnetic signature (Food Eng
Mag 2004).
The greatest advantage offered by the E-Scan In-Line Food Analyzer equipment
is that it can be incorporated into on-line processing equipment so that rapid, real-time
results can be achieved. This method can also analyze multiple constituents (moisture,
fat, and protein) simultaneously.
The greatest disadvantage to this instrument is that it is limited to raw ground
meat, so it would not be an acceptable method to use to evaluate constituents in raw
meat blends containing non-meat ingredients or in cooked meat products. In addition,
this method is not an AOAC-approved method for the analysis of moisture, fat, protein,
or other constituents, which may be a disadvantage for food manufacturers seeking
AOAC-approved methods for their operation’s processes and products.
17
Determination of Fat Content
One important component of meat and meat products is fat. Fat influences
palatability (i.e. flavor, aroma, tenderness) and keeping quality (i.e. development of off-
flavors due to oxidation) of meat and meat products and serves many important
functions in human nutrition (i.e. carrier of fat soluble vitamins, source of energy,
insulation) (Romans and others 2001). Fat is also the basis for many formulation
decisions in further processed meat and meat products.
The amount of fat in meat is variable and inversely related to the amount of
moisture. Fat content of various grades and cuts of meat and poultry can vary widely.
Raw poultry without skin and lean cuts of red meat (beef, pork, lamb) are generally low
in fat (<10% fat), whereas poultry with skin and red meat cuts that have greater amounts
of marbling and trim can be much higher in fat (<20%). Further processed meat and
poultry products can also vary greatly in fat percentage, depending on government
regulations, labeling and nutritional goals, product formulation, and degree and type of
processing and cooking.
The physical and chemical properties of fat are very different from the other
components of meat, so different measurement techniques are needed to analyze or
quantify fat content. Many procedures for the determination of fat are available, but
only a limited number of methods are approved as an ‘official method’. Some
techniques involve the use of organic solvents to extract and gravimetrically measure fat,
whereas other methods involve sophisticated instrumentation to determine fat content.
Considerations for choosing a method include: cost, equipment, waste and disposal,
18
speed of testing, accuracy and reproducibility, and level of skill required to perform the
test.
The following paragraphs will discuss specific methods for determining fat
content in meat and meat products, including extraction methods (Soxhlet Extraction of
Crude Fat, Extraction of Fat with Chloroform and Methanol (Folch), Rapid Specific
Gravity Method, Rapid Microwave-Solvent Extraction Method, Supercritical Fluid
Extraction) and non-extraction methods (Low-Resolution Nuclear Magnetic Resonance
and Near Infrared Transmittance).
Soxhlet Extraction of Crude Fat (AOAC Official Method 960.39)
The AOAC standard reference method 960.39, Soxhlet Extraction of Crude Fat
Method, is a solvent-based extraction method for the determination of fat in meat and
meat products that is often considered the standard method by which other methods are
evaluated (Min and Boff 2003). This method involves the use of petroleum ether (a
flammable, non-polar solvent with a low boiling point (35°C/95°F) to extract fat from a
dried, homogenized meat sample. Although petroleum ether is not as good of a solvent
as diethyl ether, petroleum ether is more often used because it is selective for more
hydrophobic lipids, and less expensive, less hygroscopic, and less flammable than
diethyl ether (Min and Boff 2003).
Prior to Soxhlet extraction, a homogenized meat sample (ca 3-4 g) is weighed
into a small, disposable aluminum dish, mixed with a small amount of laboratory-grade
sand (the sand increases surface area, allowing for moisture escape and prevention of fat
19
entrapment), and dried in an air oven (100-102°C for 16-18 hr). The dried sample is
cooled in a desiccator and prepared for subsequent Soxhlet extraction.
The Soxhlet extraction system involves five important components, including a
heating mantel, a flat-bottom flask, a Soxhlet, a condenser, and rubber tubing connected
to a functioning water faucet. The extraction system operates by heating the petroleum
ether to create a vapor, then cooling the vapor back to liquid form via the condensers.
The condensed liquid ether drips into the Soxhlet and completely surrounds the dried
meat sample, providing a soaking effect, then ‘fluxes’ back into the flask (ca 40-50 mL
of ether at a time), taking with it fat from the meat sample. This ‘fill and flux’ process
continues for 4-6 hr to completely extract the fat from the meat sample. Once the
extraction process is complete, the flasks are disconnected from the condensers, the
petroleum ether evaporated, the flasks weighed, and the fat content of the meat sample
calculated.
This method has several advantages, including precision, repeatability,
recognition as a standard reference method, and the ability to analyze multiple samples
simultaneously. However, there are multiple disadvantages to using this method,
including the use of a flammable solvent, the length of time required to prepare and
extract the sample (drying time + extraction time), the need for a trained and skilled
analyst, and the need for special accommodations (i.e. fume hood, running water).
Despite extensive efforts to develop analytical methods for fat using new technology, the
extraction of fat followed by measurement is still the most successful general approach
(Sebranek 1998).
20
Folch or Modified Folch (Extraction With Chloroform/Methanol)
The Folch Method was originally developed as a method for the preparation and
purification of brain lipids by the biochemist, Jordi Folch, but has been applied to the
extraction of lipids in other biological tissues. Folch described his extraction method in
his article, “A Simple Method For the Isolation and Purification of Total Lipides From
Animal Tissues” (Folch and others 1957).
The extraction method described by Folch is a solvent-based extraction method
that uses chloroform:methanol (2:1, v/v) and water (or adequate salt solution) to extract
lipid components from a meat sample. Unlike extraction methods that use diethyl ether
or chloromethane, the Folch method also extracts phospholipids from a meat sample.
When a meat sample is homogenized with the solvent mixture, the mixture separates
into two phases that can be divided and further analyzed. The lower phase (chloroform)
contains the lipid material while the upper phase (methanol and aqueous) contains the
non-lipid material and water (Castera 1995). For lipid quantification, the upper phase
(methanol and aqueous) is siphoned off, allowing the lower phase to be evaporated and
lipid content gravimetrically determined.
This procedure is performed by homogenizing a meat sample with a chloroform-
methanol (2:1, v/v) mixture. The chloroform-methanol mixture is added in an amount
that is 20 times the volume of the tissue sample (i.e. 20 mL of solvent mixture is needed
for a 1 g meat sample). In his publication, Folch indicated performing homogenization
in a Potter-Elvehjem type homogenizer for samples that are < 1 g or in an adequate
blender for larger samples (> 1 g) (Folch and others 1957).
21
After homogenization, the homogenate is filtered (through a funnel with folded
filter paper) or centrifuged to recover the liquid phase. The crude extract is washed with
0.2 volume (4 mL for 20 mL) of water or NaCl solution (0.9%) and the mixture is
allowed to separate into two phases (by centrifugation or prolonged standing). Upon
separation, the upper phase is removed by siphoning and the inside wall of the tube is
rinsed three times with methanol/water (1/1). Care should be taken to avoid mixing of
the upper and lower phases during rinsing. The upper phase that forms after rinsing is
also siphoned off. In this washing procedure, the proportions of chloroform, methanol,
and water (including water from the meat sample) are 8:4:3, which is critical and must
be kept constant (Folch and others 1957).
The lower phase (which contains the lipid constituents) is then combined with
the rest of the rinsing fluid and made into one phase by the addition of methanol. The
lower phase is then evaporated (in a rotary evaporator or under nitrogen stream) until all
detectable traces of solvent are gone. Final traces of solvent and water are then removed
by flushing with nitrogen then vacuum suctioning to complete dryness (Iverson and
others 2001). Lipid content is then determined gravimetrically.
Several researchers have used various extraction procedures and have found that
the chloroform/methanol procedure worked best for extracting all classes of lipids (King
and Min 1998). The combination of polar and non-polar solvents (2:1
chloroform:methanol) to extract fat has made this method very efficient. The Folch
method, when compared to other solvent extraction methods, may yield higher results
for fat due to more complete extraction (Mann and others 1991). Polar solvents
22
(chloroform) disrupt hydrogen bonding between lipids and proteins and lipids and
carbohydrates, so when a non-polar solvent (methanol) is introduced after a polar solvent
has been used, the non-polar solvent can access the lipid components and fully extract
them (Mann and others 1991).
The two greatest advantages to this method are the complete extraction of all
classes of lipids from a tissue sample and the opportunity to further analyze the extracted
lipids. This method of fat extraction is very efficient and would be especially useful if
further analysis of the lipids is needed, as very few other methods offer the complete
extraction of all classes of lipids.
Despite the greatest advantages to this method, multiple disadvantages exist for
this method, including the use of two organic solvents (potentially harmful to health,
costs and dangers associated to storing, handling, and disposing of them), the greater
degree of difficulty in performing the fat extraction, the need for more highly trained
personnel, the sensitive nature of the method (must maintain specific solvent
proportions, avoid mixing the two phases when rinsing), and the amount of time required
to perform the procedure. If further analysis of the lipids is not needed, other methods
may be more ideal and user-friendly for the general quantification of fat in a meat-
production environment. In addition, this method has not received AOAC approval for
the analysis of fat in meat and meat products, which may be an additional disadvantage
for analytical laboratories or food manufacturers seeking to use AOAC-approved
methods for their product analysis.
23
Rapid Specific Gravity Method (Foss-let, AOAC 976.21)
The AOAC standard reference method 976.21, Rapid Specific Gravity Method,
is a solvent-based extraction method for the determination of fat content in meat and
poultry products. This method is known as the Foss-let procedure and is very effective
in determining fat content (Sebranek 1998). This procedure involves the Foss-let Fat
Analyzer system, a solvent (tetrachloroethylene) for the extraction of fat, an anhydrous
salt (anhydrous calcium sulfate) for the absorption of moisture droplets from the sample,
and a specific gravity read-out unit for determining fat content of the sample.
To perform the Foss-let procedure, a test sample is weighed into a tared stainless
steel Foss-let cup. For meat products containing < 60% fat, a 45.0 g test sample is used.
For meat products containing > 60% fat, a 22.5 g test sample is used. Upon weighing
the meat sample into the cup, 80 g of anhydrous calcium sulfate (CaS04) and 120 mL of
tetrachloroethylene are added to the cup. The cup is covered and placed in the
mechanical orbital shaker, which facilitates the rapid extraction of fat through strong
mechanical action. After 2 min. in the orbital shaker, the cup containing the sample is
removed and immersed in an ice-water bath to cool the contents to ca 40°C (from 47-
52°C out of the orbital shaker).
The contents of the cup are poured into an assembled filter and filtered under
pressure until 10 mL of extract is retained in the measuring chamber. The measuring
chamber, which is thermostatically maintained at 37°C, contains a miniature hydrometer
that measures the specific gravity of the extract (Pettinati and Swift 1976). Three to five
specific gravity readings are obtained and averaged, then converted to percent fat by
24
means of the conversion chart provided with the equipment. For high-fat products in
which a 22.5 g portion was used, the chart percent fat should be multiplied by 2 (AOAC
2006b). A reference standard oil (specific gravity at 23°C = 0.915) is provided for use
as a periodic check of the potentiometer calibration.
The three greatest advantages to using this method include its recognition as an
AOAC standard method, results can be obtained rather quickly (7-10 min), and it is
efficient in extracting fat. Two of the greatest disadvantages include the use, handling,
and disposal of the chemical solvent and the need for more skilled personnel to perform
the analysis.
Rapid Microwave-Solvent Extraction Method (CEM Automated System, AOAC
985.15)
The AOAC standard reference method 985.15, Rapid Microwave-Solvent
Extraction Method, is a solvent-based extraction method that uses methylene chloride
and the CEM Automated Solvent Extraction System (CEM Corp., Mathews, NC). The
CEM apparatus is an enclosed, self-contained, thermostatically controlled fat extraction
and solvent recovery system with a 0.5 mg fat sensitivity and 0-100% fat measurement
range (AOAC 2006d). The CEM apparatus also includes a microwave moisture
analyzer, which is used to dry the test sample in preparation for solvent extraction. This
method is less time-intensive compared to other traditional extraction methods.
To perform the analysis, three glass fiber pads [two rectangular (9.8 x 10.2 cm)
and one round (11 cm), CEM Corp] are tared on the internal electronic balance of the
apparatus. A homogenized meat sample (ca 4 g) is spread evenly across one rectangular
25
glass fiber pad and covered with the second rectangular glass fiber pad (to produce a
‘sandwiched’ appearance). The ‘sandwiched’ sample preparation is weighed on the
internal balance, dried for ca 3-5 min in the apparatus’s microwave drying chamber, then
transferred to the automated solvent extraction chamber. In the extraction chamber, the
dried meat sample and rectangular glass pads are blended with a sufficient amount of
methylene chloride to extract fat. During the extraction cycle, which takes ca 1-2 min,
the extracted fat is collected on the round glass fiber pad. Upon completion of the
extraction cycle, the round glass fiber pad containing the fat extract is transferred to the
balance pan in the microwave moisture analyzer chamber and dried (ca 30 s) to remove
residual solvent or moisture. The apparatus’ microprocessor converts the weight loss
due to solvent extraction to % fat and displays the result on the digital read-out panel.
An adjustment factor is needed for certain product classes in order to produce
more accurate results with this method. An adjustment factor of 0.40 is needed for fresh
meats, pre-blends, emulsions, and cured cooked meats, whereas an adjustment factor of
0.80 is needed for cooked sausages (AOAC 2006b).
This method efficiently extracts triglycerides, but fails to fully extract
phospholipids. This was realized when fat extraction with the CEM automated system
was compared to the modified Folch method. During a study that compared the CEM
automated system to the modified Folch method, it was observed that the CEM
automated system consistently yielded lower values for fat compared to the modified
Folch method. The researchers explained that the Folch method uses a combination of
polar and non-polar solvents (2:1 chloroform: methanol) to extract fat. Polar solvents
26
disrupt hydrogen bonding between lipids and proteins and lipids and carbohydrates, so
when a non-polar solvent is introduced after a polar solvent has been used, the non-polar
solvent can access the lipid components and fully extract them, which is demonstrated in
the Folch method (Mann and others 1991). The Folch method also exposes the test
sample to solvent for 24 hr, so a longer exposure to solvents may improve extraction
results.
In comparison, the CEM automated system uses a slightly polar solvent
(methylene chloride), which is efficient in extracting triglycerides, but does not
completely extract phospholipids. In addition, the CEM automated system exposes the
test sample to the solvent for a short amount of time (1-2 min), which may not allow
sufficient time for the solvent to disrupt the membrane material and extract the
phospholipids completely (Mann and others 1991).
Although the CEM automated system has limitations, it is able to efficiently
extract triglycerides, which are the primary lipids of interest for evaluating raw material
quality, process control, finished product composition, and regulatory compliance in
meat plant operations. The CEM automated system offers four main advantages: (1) it
is an AOAC approved method of analysis, (2) it provides reliable results in a short
amount of time, (3) it uses less solvent than other extraction methods, so less waste is
generated, and (4) it does not require a highly skilled technician to perform the
procedure. Three primary disadvantages to using this method include: (1) it requires the
use of a potentially harmful chemical, (2) it is limited to analyzing one constituent at a
time, and (3) the sample cannot be retained for other analytical procedures.
27
Super Critical Fluid Extraction (AOAC Peer Verified Method – PVM 3:2000)
More recent developments have led to extraction methods, such as supercritical
fluid extraction (SFE), that do not require the use of organic solvents. SFE has been
published by AOAC International as a Peer Verified Method (PVM 3:2000) for the
determination of crude fat in meat and meat products. This method involves the use of
the TFE2000 fat determinator SFE system (LECO Corp., St. Joseph, MI), carbon dioxide
(CO2), and granular diatomaceous earth (LECO-dry or equivalent). In addition, a
household microwave oven (1000 W) is also needed. The peer verified study involved
the analysis of raw, cooked, and processed meat products containing 5-28% crude fat
(Chandrasekar 2001).
SFE uses a supercritical fluid for the selective extraction of a constituent from a
test sample. A supercritical fluid is a substance that has exceeded its critical point for
temperature and pressure, giving rise to liquid-like densities and gas-like properties.
Carbon dioxide (an inert, non-toxic, inexpensive fluid) is commonly used in SFE,
including the extraction of fat from meat samples, because of the high solubility of lipids
in this medium (King 2001).
Through a specific pressure-temperature combination, CO2 is transformed into a
substance with supercritical fluid properties. The liquid-like density of the supercritical
CO2 enhances fat extraction from the sample matrix and the gas-like properties promote
separation of the solubilized fat from the solvent fluid after extraction (Min and Boff
2003). When a fluid is close to its critical point, these properties can be altered or ‘fine-
28
tuned’, which can promote selectivity of specific components because small changes in
pressure or temperature can result in large changes in density (Min and Boff 2003).
To perform fat extraction using the TFE2000 instrument, ca 1.0-1.5 g of ground,
homogenized meat sample is weighed and thoroughly mixed with 2.2 g diatomaceous
earth (to absorb moisture and increase surface area of the sample). However, a smaller
sample (<1.0 g) should be used if the meat sample contains >70% moisture. Higher
sample moisture content was noted by Chandrasekar and others to impede lipid
extraction. In their study, when total moisture was >1.0 g in a test sample, incomplete
extraction and reduced extraction efficiency occurred (Chandrasekar 2001).
Once the meat sample has been prepared, it is transferred to a high-pressure
extraction thimble and placed in the SFE instrument according to the manufacturer’s
instructions. Once the ‘START’ key on the instrument’s panel is pressed, the extraction
process begins automatically. The system draws liquid CO2 from a ‘dip-tube’ tank into a
refrigerated pump head, preheats and compresses the CO2 to 9,000 psi, then passes it
through the heated high-pressure extraction thimbles (95-105°C) containing the sample.
As the compressed CO2 passes through the sample (a process that lasts for 45 min), it
removes fat and carries it to the collection system, where the CO2 is depressurized. The
sudden change in pressure separates the dissolved fat from the supercritical solvent (Min
and Boff 2003), allowing for the collection of the fat into a vial containing glass wool.
Once the extraction process is complete, the collection vial is removed from the SFE
instrument, placed into a microwave oven for 2 min (at 1000 W) to remove residual
29
moisture and solvent, cooled for 15 min, then weighed. Fat percentage is determined
based on the weight gain of the collection vial (Chandrasekar 2001).
The SFE method described above involves the use of a ‘wet’ homogenized meat
sample. However, some SFE methods may require that the sample be dried prior to
extraction. For example, Min and Boff (2003) describe a procedure in which ca 3-5 g of
dried homogenized meat sample is placed into the extraction cell of the instrument,
extracted for 20 min at the proper temperature-pressure settings, then rotary dried and
weighed to determine fat content. For methods using dried meat samples, use of
diatomaceous earth or other desiccants is not necessary since moisture was removed
from the sample during the drying process.
The greatest advantage to using SFE is that no harsh solvents are required, which
(1) eliminates exposure of lab personnel to harmful chemicals, and (2) eliminates
storage, tracking, and disposal costs and dangers associated with organic solvents and
waste. In addition, SFE methods can match the overall precision and accuracy of
traditional extraction methods (Min and Boff 2003). Depending on the instrument used,
multiple samples may be extracted simultaneously (Sebranek 1998). One additional
advantage for analytical laboratories or food manufacturers seeking AOAC-approved
methods for use in their operations is that the TFE2000 fat determinator SFE system has
been accepted as an AOAC Peer Verified Method, indicating the potential of this
method to become and AOAC-approved method in the future.
SFE offers a more rapid method for determining fat content in meat and meat
products when compared to traditional extraction methods that use organic solvents.
30
SFE and similar methods may gain more acceptance as regulations by the U.S.
Environmental Protection Agency (EPA) and other federal entities encourage the
reduction of organic solvents in laboratories (Min and Boff 2003).
Low Resolution Nuclear Magnetic Resonance (CEM Corporation Instrumentation)
Low Resolution-Nuclear Magnetic Resonance (LR-NMR) offers rapid fat
analysis for meat and meat products. The CEM Smart Trac 5 System® has been
accepted as an AOAC Peer-Verified Method (PVM 1:2003) for the rapid determination
of moisture and fat in meats by microwave and Nuclear Magnetic Resonance analysis.
The CEM Smart Trac 5 System®, which was the instrument used in this collaborative
study for the fulfillment of AOAC requirements to become an official method, uses LR-
NMR technology for fat determination. It is the goal of this collaborative study to
recommend that this method be adopted as an AOAC-approved reference method for the
rapid determination of fat.
Nuclear Magnetic Resonance (NMR) is based on the observation that certain
nuclei will re-absorb and re-emit radio frequency (RF) energy over a narrow band of
frequencies when placed in a static magnetic field. NMR does not involve the emission
of ionizing radiation as the name may suggest, but rather is caused by the interaction
between the nuclear magnetic dipole of a nucleus and the magnetic field it experiences.
The strength of a magnetic field produces a specific frequency at which the NMR effect
occurs for a given nuclear isotope (Leffler and others 2008).
In NMR spectroscopy, a phenomenon known as a chemical shift effect occurs,
and can be used to distinguish different hydrogen-containing constituents within a
31
sample. Differences in the electronic structure of molecules cause small variations in the
magnetic field that 1H nuclei experience in different molecules and in different parts of
the same molecule. This leads to small differences in the NMR frequencies of 1H nuclei
in different molecules, which can be used to distinguish between the different
constituents within a meat sample (Leffler and others 2008).
Unlike NMR spectroscopy, LR-NMR cannot detect chemical shift effects in
samples containing 1H nuclei due to the low field strength and homogeneity of the
magnet used to generate the static magnetic field. In LR-NMR, the NMR signals from
different constituents (moisture, fat, protein, carbohydrates) within the sample are
distinguished by differences in the rate of decay of the signal from the different
constituents (commonly known as transverse relaxation or T2 decay). There are
significant differences between the proton transverse relaxation times (T2) of these
constituents. More specifically, protein and carbohydrates have a very short transverse
relaxation time and therefore decay very quickly, whereas fat has a much longer
transverse relaxation time and decays much more slowly.
Transverse relaxation can generally be approximated as an exponential decay
with time constant T2. The transverse relaxation times for fat are considerably longer
(typically of the order of 10 mS or greater) than the transverse relaxation times of protein
and carbohydrates (typically of the order of 10 mS or less). When the system is excited,
the signals associated with protein and carbohydrates decay first, which make it possible
to acquire the remaining signal from fat. The NMR signal acquired from a dried food
sample using the NMR methodology will be directly proportional to the number of
32
protons within the fat contained in the sample and thus directly proportional to the fat
content of the sample (Leffler and others 2008).
The CEM Smart Trac 5 System® removes moisture from a food sample using
the microwave drying technique prior to fat analysis using NMR. Moisture and its
corresponding protons are removed from a meat sample, leaving fat, protein, and
carbohydrate as the remaining constituents that contain significant protons in the sample
to be analyzed. The protons associated with the fat, protein, and carbohydrates in the
dried meat sample will produce a signal when a magnetic field is applied to the dried
meat sample in the NMR chamber.
To perform fat analysis using the CEM Smart Trac 5 System®, a homogenized
meat sample is first dried in the microwave drying chamber per manufacturer’s
instructions (and as described previously in this report). After drying, the sample
(including the glass fiber pads) is placed on a single sheet of Teflon film and tightly
rolled into a cylindrical shape, placed and pounded into a special Teflon tube fitted for
the instrument, placed into the NMR chamber, and the instrument initialized to begin the
analysis of fat content. The instrument uses LR-NMR technology that sends pulses of
magnetic energy through the sample, creating a free induction decay (FID) of the
hydrogen protons associated with the lipid, ash, and protein components of the meat
sample.
The FID relates to the scattering and realignment of the protons in response to
the pulsing on and off of the magnetic energy through the sample. The magnetic energy
causes the protons to align while the removal of the magnetic energy causes the protons
33
to “scatter” or resume their natural position. Due to the longer FID time of the hydrogen
protons of the lipid components in comparison to the shorter FID time of the hydrogen
protons of the protein and ash components, the equipment is able to identify and measure
the lipid components separate from the other protons and use the information to calculate
the fat percentage of the sample using the programmed equations.
The advantages to using the CEM Smart Trac 5 System® NMR instrument
include: the speed in which it can determine the fat content of a wide variety of meat
product samples; organic solvents are not required for extraction, which (1) eliminates
exposure of lab personnel to harmful chemicals, and (2) eliminates storage, tracking, and
disposal costs and dangers associated with organic solvents and waste; the ease of use of
the instrument (no complicated procedures are involved and highly skilled personnel are
not needed); the low cost of operating the instrument; and it is recognized as an AOAC
peer verified method.
Disadvantages associated with this method include the relatively high initial cost
of purchasing the instrumentation, the expense associated with replenishing consumable
materials (i.e. glass fiber pads, Teflon film), and the limitation of analyzing one sample
at a time.
Near Infrared Transmittance (FOSS FoodScan™, AOAC 2007.04)
Near Infrared Transmittance was discussed previously in this report in the section
regarding moisture analysis using NIR. NIR will be discussed again in this section
regarding fat analysis, as NIR Transmittance technology offers a newer and more
sophisticated spectroscopic method for the analysis of fat content in meat samples.
34
NIR measurements are based on the principle that almost all organic functional
groups (i.e. ketone, alcohols, etc.) have a specific absorption band in the near infrared
region and that the infrared absorption spectra is unique for many different components
in meat (Sebranek 1998).
One example of instrumentation utilizing NIR Transmittance technology is the
FOSS FoodScan™ Meat Analyzer (Eden Prairie, MN). This instrument is an NIR
Spectrophotometer with artificial neural network (ANN). The FOSS FoodScan™ Meat
Analyzer recently received AOAC approval as an official method for the determination
of moisture, fat, and protein content in meat and meat products (AOAC Method
2007.04). Parameters for meat products evaluated include fresh meat, beef, pork,
poultry, emulsions, and finished products in the constituent ranges of 1-43% fat, 27-74%
moisture, and 14-25% protein (Anderson 2007).
To perform this method using the FOSS FoodScan™ Meat Analyzer instrument,
ca 180 g of homogenized meat sample is evenly distributed in the instrument’s round
sample dish and loaded into the instrument’s sample chamber. The operator selects the
appropriate meat product profile from the instrument’s menu screen or personal
computer (depending on instrument version), presses the ‘START’ button to initiate the
scan, and waits for analysis to be completed and the results calculated and reported for
moisture, fat, and protein percent (Anderson 2007).
The FoodScan™ instrument contains a tungsten-halogen lamp and optical fibers
that guide emitted light into an internal moving-grating monochromater (which provides
monochromatic light in the spectral region between 850 and 1050 nm) and a collimator
35
lens positioned over the sample cup in the sample chamber. Light that is not absorbed
by the sample in the sample chamber strikes a detector that measures the amount of
unabsorbed light. The results are sent to the instrument’s digital signal processor, which
calculates the final results and communicates them with the personal computer. The
results are displayed as % moisture, % fat, and % protein on the digital screen or
personal computer (Anderson 2007).
The ANN calibration technique used for this system eliminates the need for
development and maintenance of separate calibrations for specific sample types. The
ANN calibration generates a single, global, multi-product, full-range calibration for each
constituent based on a database containing calibration sample data represented by
spectra and chemical analysis results (Anderson 2007).
The FOSS FoodScan™ instrument offers multiple advantages, including rapid
results (ca 50 sec) for multiple constituents, is well-suited to high-capacity production
environments, is easy to use and is not dependent on highly skilled personnel to operate
the instrument, is cost effective (no consumables and low operation costs), and
demonstrates similar repeatability and reproducibility compared with chemical analysis
reference methods. In addition, an on-line version of this instrument is available, which
may be used for continuous, flow-by measurements of material in a pipe or tube system,
such as in meat grinders and blenders.
One disadvantage to using this method is that it is limited to analyzing one
sample at a time, but fortunately each sample can be analyzed in a very short amount of
time. A second potential disadvantage to using the FOSS FoodScan™ instrument is the
36
initial cost required to purchase the instrumentation. Additional disadvantages may
exist, such as affected instrumentation performance due to addition of non-meat
ingredients (such as spices, colorants, or other ingredients that affect meat batter color)
or the presence of ice crystals in the sample. Although not discussed in the literature, ice
crystals, non-meat ingredients, or other factors may potentially interfere with the
instrument’s infrared absorption performance. In such cases, it may be necessary to
calibrate the equipment specific to the type of product being analyzed in order to obtain
the most reliable results.
NIR transmission instruments are believed to perform better than NIR reflectance
instruments because a greater amount of sample may be scanned and a highly sensitive
detector can be used (Sebranek 1998). In many cases, sample scans with infrared
instruments must be calibrated against known values for sample composition with
reference methods. In addition, a large number of samples similar to those to be
measured need to be included for calibration (Sebranek 1998).
37
CHAPTER III
MATERIALS AND METHODS
An AOAC collaborative study involving 10 laboratories representing private
industry, government agencies, and academia was conducted to determine if the CEM
Smart Trac 5 System®, which performs rapid analyses of moisture and fat, is
comparable to universally accepted standard methods of analysis. The primary goal of
the collaborative study was to determine if a method for the rapid determination of
moisture and fat in raw and processed meat products could produce results of
comparable accuracy and precision to standard methods. A variety of raw and processed
meat products representing the primary meat categories of beef, pork, chicken, and
turkey were selected for analysis in this study. The meat products selected for use are
commonly produced and distributed by meat plant operations.
Meat samples were obtained fresh from commercial sources and stored frozen
until homogenized, packaged, frozen, and distributed to participating collaborative
laboratories for analysis on the Smart Trac 5 System®. Ten replicates were analyzed in
the Department of Animal Science at Texas A&M University (TAMU) using the
following standard methods of analysis for the determination of moisture and fat,
respectively: Forced Air Drying, AOAC Official Method 950.46 and Soxhlet Extraction
of Crude Fat, AOAC Official Method 960.39. Data collected from replicate analyses
using the AOAC official methods provided by TAMU were used for the programming
and calibration of all CEM Smart Trac 5 Systems® used in this study and for
38
comparative analysis of the data collected from ten different collaborators using their
calibrated CEM Smart Trac 5 Systems®. Each of the 10 collaborative research
laboratories owned a CEM Smart Trac 5 System® and was familiar with sample
preparation and instrument operation. Each laboratory independently completed an
analysis of the moisture and fat content of each meat product specified using the
calibrated CEM Smart Trac 5 System®. All meat samples evaluated were taken from a
larger composite sample and handled in a similar manner by each laboratory per detailed
instructions. Thus, the only differences observed should have been due to individual
sample handling and the inherent limitations of the instrument.
The following paragraphs will discuss the collection, homogenization,
packaging, storage, distribution, and analysis of the meat samples. The statistical design
used to analyze the data will also be discussed.
Meat Product Specification
Raw and further processed meat products representing four primary categories of
red meat and poultry (beef, pork, chicken, and turkey) were obtained commercially for
analysis for this study. The raw meat products obtained included: ground beef (high fat
and low fat), fresh pork (high fat and low fat), fresh pork sausage (high fat and low fat),
fresh chicken (high fat and low fat), and fresh turkey breasts (low fat). Other further
processed meat products obtained included: mechanically deboned turkey (high fat),
bone-in ham (high fat), formed ham with natural juices (low fat), beef frankfurters (high
fat), beef frankfurters (low fat), and potted meat (medium fat). For each of the meat
39
products listed, a diluted counterpart was prepared by adding four percent (w:w) of
distilled, deionized water during homogenization for use as blind samples and required
by AOAC for the study.
Collection of Meat Products
Approximately 6.8 kg (15 lbs) of each meat product specified above were
obtained from meat plant operations and local grocery stores. The meat products
purchased from local grocery stores were homogenized within one day of purchase. The
meat products obtained from meat plant operations were shipped frozen to Texas A&M
University, stored in a freezer (-10oC) upon receipt, and thawed in a refrigerator (4
oC)
one to two days prior to homogenization and sample preparation. The fresh pork sausage
(low fat) used in this study was prepared fresh at the Rosenthal Meat Science and
Technology processing facility using lean pork, a pre-blended sausage spice blend, and
by following standard processing practices for ground products. Low fat fresh pork
sausages are not commonly produced by meat operations, so for the purpose of this
study, a fresh pork sausage (low fat) was specially made.
Preparation of Meat Aliquots (Homogenization of Meat Products)
Each meat product was kept refrigerated (4° C) immediately prior to size
reduction and homogenization. As written previously, some products were frozen (to
prevent spoilage) and then thawed in the refrigerator two days prior to sample
preparation. The fresh pork, fresh chicken, fresh turkey, ham, and frankfurter products
40
required size reduction prior to homogenization. Each of these products were
individually removed from their respective package, manually cut with a knife into
smaller pieces (ca. 5 cm x 5 cm), and ground through a table-top meat grinder (Hobart®
4612 Chopper, Hobart Corporation, Troy, OH), using a 1.27 cm (1/2 inch) grinding
plate. The ground beef, fresh pork sausage, mechanically deboned turkey, and potted
meat products did not require size reduction (cutting and grinding) prior to
homogenization.
Approximately 3.18 kg (7 lbs) of material was placed in a 10 quart capacity
stainless steel commercial food processor (Robot Coupe® R10 Vertical Cutter-Mixer,
Robot Coupe USA, Inc., Jackson, MS) and chopped for 30 seconds using a two blade,
high speed (4.5 HP) setting. A rubber spatula was used to recover and return the meat
that had collected on the inner sides and bottom of the bowl. The sample was then
chopped for an additional 30 seconds on high speed. Products with “skin” (processed
and bone-in hams, frankfurters) were more difficult to homogenize and required an
additional 60 seconds (30 seconds of chop, wipe sides, 30 seconds of chop) of chopping.
For each meat product, a 0.4% diluted counterpart was prepared for use as blind
samples for calibration and testing of the CEM Smart Trac 5 System® to ensure
detection of modest variations in the moisture content of each meat product. The diluted
counterpart for all of the meat products was prepared by placing 3.18 kg (7 lbs) of the
remaining ground material into the commercial food processor and adding 0.127 kg
(0.28 lbs) of distilled, deionized water. Each diluted sample was then chopped in the
41
same manner as its undiluted counterpart (as indicated in the previous paragraph) for the
same amount of time to maintain consistency between products of the same kind.
The temperature of each meat product was taken immediately prior to and after
homogenization. The temperature of each meat sample prior to homogenization was
between 4°C and 10°C. Each meat sample experienced an average of 9°C temperature
increase while chopping in the commercial food processor, likely due to the heat
generated by the friction of the blades against the meat.
Packaging of the Meat Aliquots
The homogenized material was tightly packed into forty 2-oz and five 4-oz
sterile, screw capped polyurethane specimen containers. During packaging, the
homogenized material was covered to minimize moisture escape, evaporation, or
absorption. Each specimen container was filled to minimize airspace and to limit
oxidation and risk of sample deterioration during storage. Each container was labeled
with a self-adhesive label indicating the title of the study, the meat product and fat level,
the packaging date, and the name of the laboratory to which it would be sent. The
containers of homogenized material were then transferred to a -40oC freezer for storage.
Storage and Distribution of the Meat Aliquots
All containers of homogenized material were transferred to a -40oC freezer for
storage within 25 minutes of packaging and were undisturbed until the date of
distribution to collaborating laboratories. Samples were distributed to collaborating
42
laboratories on two separate days. On the first day of distribution, two 2-oz containers
of each of the following homogenized samples were packed into Thermosafe™ insulated
boxes: ground beef (high fat and low fat), pork (high fat and low fat), chicken (high fat
and low fat), and ham (high fat and low fat). On the second day of distribution, two 2-oz
containers of each of the following homogenized samples were packed into
Thermosafe™ insulated boxes: turkey (high fat and low fat), frankfurters (high and low
fat), pork sausage (high fat and low fat), and potted meat.
On each of the two days of distribution, the homogenized meat samples and ice
packs were packed into insulated boxes. The empty top space inside the boxes was
packed with crumpled newspaper to aid in insulation and to prevent shifting of the
sample containers during transport. Taped onto the outer top portion of the Styrofoam
lid were the following instructions for the storage and handling of the meat samples
shipped to the collaborating laboratories:
1. Receive samples from Texas A&M University.
2. Place the samples in the freezer immediately upon receipt. Store the samples
in the freezer (0°F or below is preferred) until one day prior to sample
analysis on the CEM Smart Trac 5 System®. [Please note: Your lab will
receive more than one product sample per shipment. Remove the sample to
be analyzed the following day (for example, High Fat Beef sample) from the
freezer and place in the refrigerator the day before analysis. Leave the
remaining samples (for example: Low Fat Beef, High Fat Pork, and Low Fat
43
Pork samples) in the freezer until the day before analysis of the specific
product sample]
3. One day prior to sample analysis, place the sample to be analyzed in the
refrigerator (< 40°F) to thaw overnight. Do not try to speed up the thawing
process by using a microwave, running water, or other thawing method.
4. On the day of analysis, remove the sample container from the refrigerator and
place it in ice at least two-thirds of depth of the container to keep the sample
cold. Keep the container in ice until the analysis of all replications (10) of
the sample is complete. (Ice will help keep the product a constant
temperature throughout the analysis of all replications).
5. After placing the sample in ice, open the container lid and stir the sample
thoroughly with a small spatula since ice crystals may have condensed on the
side. (Note: Avoid transferring moisture from the ice to the sample). Replace
the lid between each replication to prevent moisture loss. Stir the sample
before beginning the next replication.
6. After stirring the sample, follow the instructions provided by CEM to begin
the analysis (i.e. tare the pads, spread 3-4 g of sample on the pads, place on
scale, press ‘START’, etc).
The outer box flaps were taped closed, shipping labels attached, and the packages
shipped for next-day delivery via Federal Express. The project leader at each of the
collaborative laboratories was notified via electronic mail that the package was en route
to their facility and the date in which the samples would be delivered. Per the
44
instructions listed above, the collaborators, upon receipt of the samples, stored them in a
freezer at their facility until one day prior to analysis on the CEM Smart Trac 5
System®.
Analytical Methods
Moisture Analysis – Standard Method (AOAC Official Method 950.46)
Ten replicates of each meat product and their diluted counterparts were analyzed
at Texas A&M University in the Department of Animal Science using the Forced Air
Drying Method (AOAC Official Method 950.46) for the determination of moisture in
meat products. The AOAC official method for moisture determination was performed to
obtain data for programming and calibrating the CEM Smart Trac 5 System® and for
comparative analysis of results collected from collaborators using their individual CEM
Smart Trac 5 System®. For statistical purposes, 10 replicates of each meat product
(undiluted and diluted) were analyzed simultaneously using the standard method for
moisture analysis.
One day prior to analysis, a 4-oz polyurethane specimen container of
homogenized meat sample was transferred from the -40oC freezer to a refrigerator (4
oC)
for thawing. The following day, the sample was stirred thoroughly with a stainless steel
spatula to evenly redistribute any moisture that may have migrated during storage and
subsequent thawing. It is also important to note that most, if not all, samples had
moisture droplets collect on the inward-facing specimen cup lid. The moisture that had
collected on the lid was carefully transferred from the lid and reincorporated into the
45
sample by stirring. Maintaining sample temperature was important in preventing data
inconsistencies that could have been caused by the warming of the sample to room
temperature. Potential moisture transfer from the chilling ice to the sample was of
concern, so a sheet of waxed paper was placed between the sample container and the ice
to serve as a barrier against moisture transfer.
Ten aluminum pans (5.08 cm diameter) and corresponding lids were numbered,
washed, dried in a forced-air oven (103oC), and desiccated until cooled to room
temperature. Latex gloves and tongs were used in the handling of all pans, lids, spatulas,
and other utensils to prevent transfer of sweat and oils from hands and fingers onto
equipment and utensils. The importance of using gloves cannot be understated in
quantitative methods of analyses, as fingerprints have weight (i.e. moisture, oils,
residues) and can affect results. The amount of sample to be weighed into each pan was
determined using the following equation:
Amount of sample = 200 .
100% - Predicted moisture % of sample
Note: The AOAC official method indicates that approximately two grams of
dried material remain after drying. In most cases, five grams of meat material
was used for high fat meat products and six grams of meat material was used for
low fat meat products.
The combined weight of the first pan and corresponding lid was obtained and
recorded to the nearest 0.0001 g using an analytical balance. Approximately 5-6 grams
of homogenized material were weighed into the pan and spread in an even layer using a
small metal spatula. The combined weight of the pan, lid, and sample was then recorded
46
to the nearest 0.0001 g. This process was repeated until 10 replicates were prepared.
The meat sample in the polyurethane specimen container was stirred between each
replicate sample and the lid kept in place to minimize moisture escape, evaporation, or
absorption during sample preparation.
The pans containing the prepared samples were transferred to a forced air drying
oven and the samples dried for 16 hours. The lids were removed and placed alongside
the corresponding pans during drying. Upon completion of the drying process, the lids
were fitted onto the corresponding pans, the pans removed from the oven, transferred to
a desiccator, and allowed to cool to room temperature (for at least 6 hours to ensure a
stable balance reading). The pans (with the corresponding lids tightly fitted) containing
the dried meat material were weighed on the balance and the weight recorded. The
following calculation was used to determine the percent moisture in each of the samples:
A – B x 100 = D
C
A= Wet weight (pan + lid + wet sample)
B = Dry weight (pan + lid + dry weight)
C = Initial sample weight [Wet weight – (pan + lid weight)]
D = % Moisture
After the data was collected and the results determined, the dry sample material
was removed from the pan and discarded. The aluminum pans and corresponding lids
were washed with soap and water, rinsed with distilled de-ionized water, dried in the
forced air drying oven, and placed in a desiccator until needed for further use.
47
Moisture Analysis – Rapid Method (CEM Smart Trac 5 System®)
Each of the 10 collaborative laboratories involved in the study analyzed the
moisture for each of the aforementioned meat products using their CEM Smart Trac 5
System®. To begin analysis of the meat samples, the appropriate program method was
selected using the digital menu and touchpad on the CEM Smart Trac 5 System®. Two
square-shaped glass fiber pads (stored at room temperature, undesiccated) designed
specifically for use with the CEM Smart Trac 5 System® were placed on the internal
balance and tared by pressing the “TARE” button on the touchpad. Approximately 3-4 g
of sample was spread in a thin, even layer with a Teflon-coated spatula on one of the
glass fiber pads. The second glass fiber pad was placed on top of the first so that the
meat sample was sandwiched between the two glass fiber pads. The lid to the equipment
was then closed and locked in place and the “START” button on the touchpad pressed to
initiate drying of the sample. After drying (approximately 3 ½ - 4 min), the internal
computer in the CEM Smart Trac 5 System® automatically calculated the percentage of
moisture in the sample and displayed the results on the digital screen. The “READY”
button was then pressed and the dried sample material prepared for fat analysis, as
described in the section titled “Fat Analysis – Rapid Method (CEM Smart Trac 5
System®).”
Fat Analysis – Standard Method (AOAC Official Method 960.39)
The standard method for fat analysis is a lengthy process that requires the use of
a potentially hazardous chemical. Great care should be exercised when performing the
48
analysis to avoid risk of damage or injury. Among the ten collaborative laboratories
involved in the study, the research laboratory at Texas A&M University was designated
to perform the AOAC Official Method 960.39 (Soxhlet Extraction of Crude Fat) for the
determination of fat in each of the meat products. Ten replicate samples for each meat
product (undiluted and diluted) were analyzed for statistical purposes.
The two fume hoods used for Soxhlet extraction were inspected and serviced
prior to use for this study to ensure adequate ventilation and operation. The apparatus
for the simultaneous Soxhlet extraction of five to six samples per hood was assembled
and several analyses performed on generic meat samples to ensure that the system was
operating correctly.
For the actual replications, a homogenized meat sample packaged in a 4-oz
polyurethane specimen container was thawed overnight in a refrigerator. The following
day, the sample was stirred thoroughly and kept on ice for the duration of sample
preparation. A sheet of waxed paper was placed between the container and the ice to
prevent moisture transfer from the ice to the sample. Ten disposable aluminum pans
(5.05 cm diameter) were labeled in numerical order with a permanent marker. A small
glass rod (ca. 4 cm in length) was placed in each pan. The first pan with a glass rod was
placed on the analytical balance, tared, and approximately 3.34 g of homogenized
material weighed into the pan. (AOAC Official Method 960.39 indicated between 3.0-
3.5 g of sample be added). The weight of the homogenized material was recorded to the
nearest 0.0001 g. Approximately 3.34 to 3.35 g of laboratory grade sand was added to
the pan and mixed into the homogenized material using the glass rod. The glass rod was
49
then used to spread the mixture into an even layer on the bottom of the pan. The glass
rod was kept in the pan with the mixture when the spreading of the sample was
complete. This set of steps was repeated until 10 replicate samples had been prepared.
The ten prepared samples were then transferred to a forced air drying oven (103oC) for
16 hours (overnight) to dry.
Flat-bottom 250 mL glass flasks for the extraction system were numbered,
washed with soap and water, rinsed thoroughly with distilled water, and rinsed a second
time with distilled, deionized water. Approximately 5 to 7 g of porous boiling chips
(VWR Scientific, Inc.) were added to each flask, which were then placed into a forced
air drying oven (103oC) until dry. The flasks were then transferred to a desiccator and
allowed to cool overnight.
The following day, the ten samples were removed from the oven and transferred
to a desiccator to cool to room temperature. Meanwhile, each flask containing porous
boiling chips was weighed on an analytical balance and each weight recorded to the
nearest 0.0001 g. Each of the ten flasks was then transferred to the fume hood and filled
with 150 ml of petroleum ether. Each of the pans containing the dried sample material
was removed from the desiccator, folded and fitted into a cellulose thimble to prevent
escape of pan contents, then placed into a Soxhlet apparatus corresponding to the
appropriate flask. For example, sample #1 would be placed in a Soxhlet to correspond
with flask #1. The setup of the Soxhlet extraction system was then completed by
connecting the flasks to the Soxhlet condensers and tightly wrapping the junctions
between the three pieces of glassware with Parafilm® to prevent escape of the petroleum
50
ether. The heating mantels were adjusted to an initial setting of “6”, the water for the
condensers were turned on, and the extraction process allowed to proceed for a
minimum of four hours without interruption. After the petroleum ether started to
condense and drip into the Soxhlet, the mantels were adjusted as necessary to maintain a
consistent rapid drip of approximately 4 to 6 drops/sec. At this rate, the ether dripped as
rapid individual drops, but not so fast that a continuous, unbroken stream was formed.
At the end of the extraction period, the water and heating mantels were turned off
and the flasks containing the petroleum ether allowed to cool. The Parafilm® was
removed and the condenser disconnected from its corresponding Soxhlet. The cellulose
thimble was then removed from the Soxhlet with large stainless steel tweezers and the
remaining petroleum ether in the Soxhlet carefully fluxed back into the flask. The
Soxhlet was then set aside and the flask placed back onto the heating mantel. This series
of steps was repeated for each of the samples. The flasks were then slowly heated on the
mantels to aid in the evaporation of the remaining petroleum ether to near dryness.
When near dryness was reached, the heating mantels were shut off and the flasks were
gently removed. The flasks were kept in the vent hood overnight to allow the residual
petroleum ether to evaporate unassisted and undisturbed overnight.
After all of the ether had evaporated from the flasks, the flasks were placed into
the forced air drying oven (103oC) for an hour to evaporate any moisture that may have
collected in the flask. The flasks were removed from the oven, transferred to a
desiccator, and allowed to cool to room temperature so a stable balance reading could be
obtained. When cooled, each flask containing the extracted fat was weighed and the
51
weight recorded. The difference between the pre-extract flask weight and the post-
extract flask weight was the direct weight of the fat extracted from the sample. The
percentage of fat in the sample was calculated using the following equation:
% Fat = Post-extract Flask Wt. (g) - Pre-Extract Flask Wt. (g) x 100
Wet Sample Wt. (g)
Fat Analysis – Rapid Method (CEM Smart Trac 5 System®)
Each of the 10 collaborative laboratories involved in the study used their CEM
Smart Trac 5 System® to analyze a specimen of each of the aforementioned meat
products for fat percentage. Each sample was prepared for fat determination using the
steps described in the previous section titled “Moisture Analysis – Rapid Method (CEM
Smart Trac 5 System®)” and was analyzed for fat immediately after the sample’s
moisture content had been determined by the microwave drying process.
After the sample had been dried, the glass fiber pad “sandwich” was removed
from the internal balance, placed onto a sheet of Smart Trac® Teflon film (CEM
Corporation, Matthews, NC), tightly rolled into a cylindrical shape per manufacturer’s
instruction manual, and placed into the polyurethane tubing designed specifically for the
NMR portion of the system equipment. The sample was then tightly compacted into the
tubing, and the tubing inserted into the appropriate opening in the NMR portion of the
system equipment. The “START” button was pressed to initiate the measurement of fat
in the product. Upon measurement completion, the internal computer of the CEM Smart
Trac 5 System® computed the percentage of fat in the meat sample using results from
52
the NMR procedure. The equipment automatically displayed the results on the digital
display screen and printed the results for the moisture and fat analyses of the sample.
The results from the AOAC Official Methods for Moisture (950.46) and Fat
(960.39) analyses performed in the Dept. of Animal Science at TAMU were used as
reference values for each sample type in the Smart Trac 5 System®. The reference
values for each sample type (i.e. “ham”, includes reference values for low fat ham and
high fat ham) were loaded into the Smart Trac 5 System® and encompassed the entire
range of fat into which the aliquot samples could fall. Additional samples were used in
conjunction with the reference values in order to determine the appropriate NMR signal
for that specific sample type (i.e. “ham”) and to establish a standard curve (y=mx+b) for
fat determination of that specific sample type. This was to ensure that each program was
equal and that variations would be due to preparation of the sample, the instrument, or
both.
Each collaborating laboratory was then instructed to perform one analysis from
each sample aliquot (non-diluted and diluted) and report the results to the Study Director
for comparative analysis against data collected using the AOAC Official Methods.
Statistical analysis of the study results for moisture and fat were performed to determine
repeatability and reproducibility of the Smart Trac 5 System® for the determination of
moisture and fat.
Statistical Analysis
The following statistical analyses were performed to fulfill requirements set forth
by AOAC International for calculating and reporting data results for collaborative
53
studies: mean, repeatability (within-laboratory) standard deviation (SDr), reproducibility
(between-laboratory) standard deviation (SDR), repeatability (within-laboratory) relative
standard deviation (RSDr), reproducibility (between-laboratory) relative standard
deviation (RSDR), and percent recovery (%Recovery) (AOAC Int. 2002). Acceptability
criteria for repeatability (within-laboratory) relative standard deviation (RSDr) and
reproducibility (between-laboratory) relative standard deviation (RSDR) are values <2%.
The mean is the average of the results, such as the average among 10 replicate
analyses for moisture for a specific meat sample type (i.e. low-fat ham). It is calculated
by adding the individual result values and dividing the sum of the values by the number
(n) of individual values, as follows:
Mean = x1 + x2 + x3 + x4…..
n
Repeatability (within-laboratory) is a measure of how well an analyst in a given
laboratory can check himself using the same analytical method to analyze the same test
sample at the same time (AOAC Int 2002). The repeatability (within-laboratory)
standard deviation (SDr) was calculated as follows, where x1, x2, x3, etc. represent
individual results obtained for an analyte (i.e. moisture, fat), and where is the mean of
the values obtained within the data set:
SDr = (x1 - )2 + (x2 - )
2 + (x3 - )
2 + . . . . .
n-1
Reproducibility (between-laboratory) is a measure of how well an analyst in one
laboratory can check the results of another analyst in another laboratory using the same
analytical method to analyze the same test sample at the same or different time (AOAC
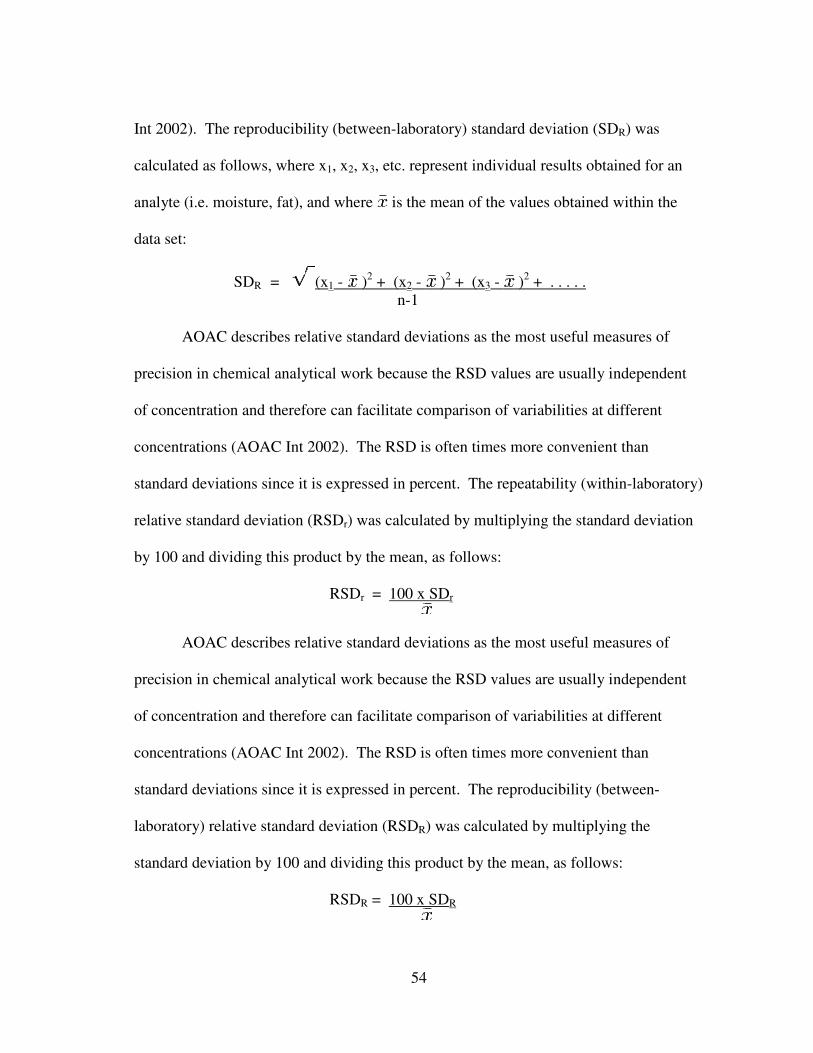
54
Int 2002). The reproducibility (between-laboratory) standard deviation (SDR) was
calculated as follows, where x1, x2, x3, etc. represent individual results obtained for an
analyte (i.e. moisture, fat), and where is the mean of the values obtained within the
data set:
SDR = (x1 - )2 + (x2 - )
2 + (x3 - )
2 + . . . . .
n-1
AOAC describes relative standard deviations as the most useful measures of
precision in chemical analytical work because the RSD values are usually independent
of concentration and therefore can facilitate comparison of variabilities at different
concentrations (AOAC Int 2002). The RSD is often times more convenient than
standard deviations since it is expressed in percent. The repeatability (within-laboratory)
relative standard deviation (RSDr) was calculated by multiplying the standard deviation
by 100 and dividing this product by the mean, as follows:
RSDr = 100 x SDr
AOAC describes relative standard deviations as the most useful measures of
precision in chemical analytical work because the RSD values are usually independent
of concentration and therefore can facilitate comparison of variabilities at different
concentrations (AOAC Int 2002). The RSD is often times more convenient than
standard deviations since it is expressed in percent. The reproducibility (between-
laboratory) relative standard deviation (RSDR) was calculated by multiplying the
standard deviation by 100 and dividing this product by the mean, as follows:
RSDR = 100 x SDR
55
The percent recovery indicates how much of the analyte was recovered using the
study methods (i.e. CEM SMART Trac 5 System) in comparison to the amount of
analyte recovered using the reference method (i.e. AOAC methods 950.46 and 960.39).
To obtain the percent recovery for moisture and fat using for the CEM SMART Trac 5
System in comparison to AOAC reference methods, the following calculation was used:
% Recovery = Study method mean x 100
Reference method mean
An additional AOAC International requirement for calculation and reporting of
data for collaborative studies is the HORRAT (Horwitz Ratio). For purposes of this
study, the HORRAT value was not determined for moisture and fat analysis because
AOAC indicates that the HORRAT value is not applicable to empirical methods (i.e.
fiber, enzymes, moisture, methods with indefinite analytes (i.e. polymers), quality
measurements (i.e. drained weight), or physical properties (i.e. viscosity, density, pH,
absorbance, etc.) (AOAC Int 2002).
56
CHAPTER IV
RESULTS AND DISCUSSION
Four primary categories of red meat (beef and pork) and poultry (chicken and
turkey) were analyzed for moisture and fat for this study, including: ground beef (high
fat and low fat), fresh pork (high fat and low fat), fresh pork sausage (high fat and low
fat), fresh chicken (high fat and low fat), fresh turkey breasts (low fat), mechanically
deboned turkey (high fat), bone-in ham (high fat), formed ham with natural juices (low
fat), beef frankfurters (high fat), pork/chicken/turkey frankfurters (low fat), and potted
meat (medium fat). For each of the meat products listed, a diluted counterpart was also
analyzed as blind samples.
AOAC methods for moisture (AOAC 950.46) and fat (AOAC 960.39) were
performed by the TAMU laboratory. The results from these methods of analysis were
used as reference values for each sample type. Results from AOAC methods for each
sample type are provided in Tables 1-26.
AOAC methods for moisture and fat for four sample types (high-fat chicken,
low-fat frankfurters, high-fat turkey, and low-fat sausage) were performed by the TAMU
laboratory, but were not analyzed by the 10 collaborative laboratories. These samples
were used in conjunction with the reference values in order to determine the appropriate
NMR signal for that specific sample type (i.e. “chicken”) and to establish a standard
curve for fat determination of that specific sample type to ensure that each program was
equal and that variations would be due to preparation of the sample, the instrument, or
57
both. The moisture and fat results for these four sample types are provided (see tables
on pages 83, 87, 94, and 97).
Study methods for moisture (rapid microwave method) and fat (NMR method)
were performed by 10 collaborative laboratories using the CEM Smart Trac 5 System®.
Results from the study methods are provided in Tables 1-26.
Data were analyzed and the statistical summaries for within-laboratory
repeatability (see table on page 105) and for between-laboratory reproducibility (see
table on page 106) are provided. The values shown for each product type include means,
standard deviations (SD), and relative standard deviations (RSD).
The percent recovery of moisture and fat was calculated based on data obtained
from the AOAC methods and CEM SMART Trac 5 System® methods. The percent
recovery for moisture and fat is provided (see table on page 108).
Discussion of Ham Results
AOAC methods yielded 74.93% and 75.91% mean total moisture values and
2.54% and 2.37% mean total fat values for the low-fat ham and diluted low-fat ham
samples, respectively (Tables 1 and 2). The CEM Smart Trac 5 System® yielded
comparable results, with 74.28% and 75.59% mean total moisture values and 2.60% and
2.36% mean total fat values, respectively.
For the high-fat ham and diluted high-fat ham samples, AOAC methods yielded
mean total moisture values of 58.41% and 60.18% and mean total fat values of 16.34%
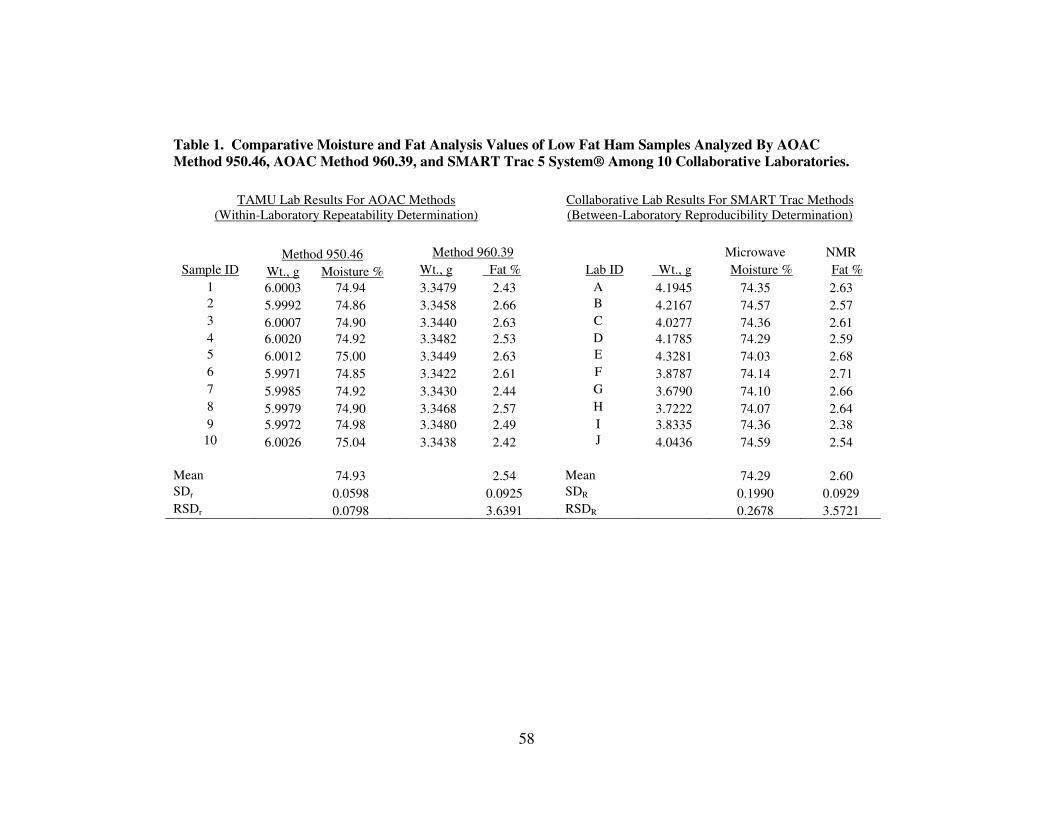
58
Table 1. Comparative Moisture and Fat Analysis Values of Low Fat Ham Samples Analyzed By AOAC
Method 950.46, AOAC Method 960.39, and SMART Trac 5 System® Among 10 Collaborative Laboratories.
TAMU Lab Results For AOAC Methods
(Within-Laboratory Repeatability Determination)
Collaborative Lab Results For SMART Trac Methods
(Between-Laboratory Reproducibility Determination)
Method 950.46 Method 960.39 Microwave NMR
Sample ID Wt., g Moisture % Wt., g Fat % Lab ID Wt., g Moisture % Fat %
1 6.0003 74.94 3.3479 2.43 A 4.1945 74.35 2.63
2 5.9992 74.86 3.3458 2.66 B 4.2167 74.57 2.57
3 6.0007 74.90 3.3440 2.63 C 4.0277 74.36 2.61
4 6.0020 74.92 3.3482 2.53 D 4.1785 74.29 2.59
5 6.0012 75.00 3.3449 2.63 E 4.3281 74.03 2.68
6 5.9971 74.85 3.3422 2.61 F 3.8787 74.14 2.71
7 5.9985 74.92 3.3430 2.44 G 3.6790 74.10 2.66
8 5.9979 74.90 3.3468 2.57 H 3.7222 74.07 2.64
9 5.9972 74.98 3.3480 2.49 I 3.8335 74.36 2.38
10 6.0026 75.04 3.3438 2.42 J 4.0436 74.59 2.54
Mean 74.93 2.54 Mean 74.29 2.60
SDr 0.0598 0.0925 SDR 0.1990 0.0929
RSDr 0.0798 3.6391 RSDR 0.2678 3.5721
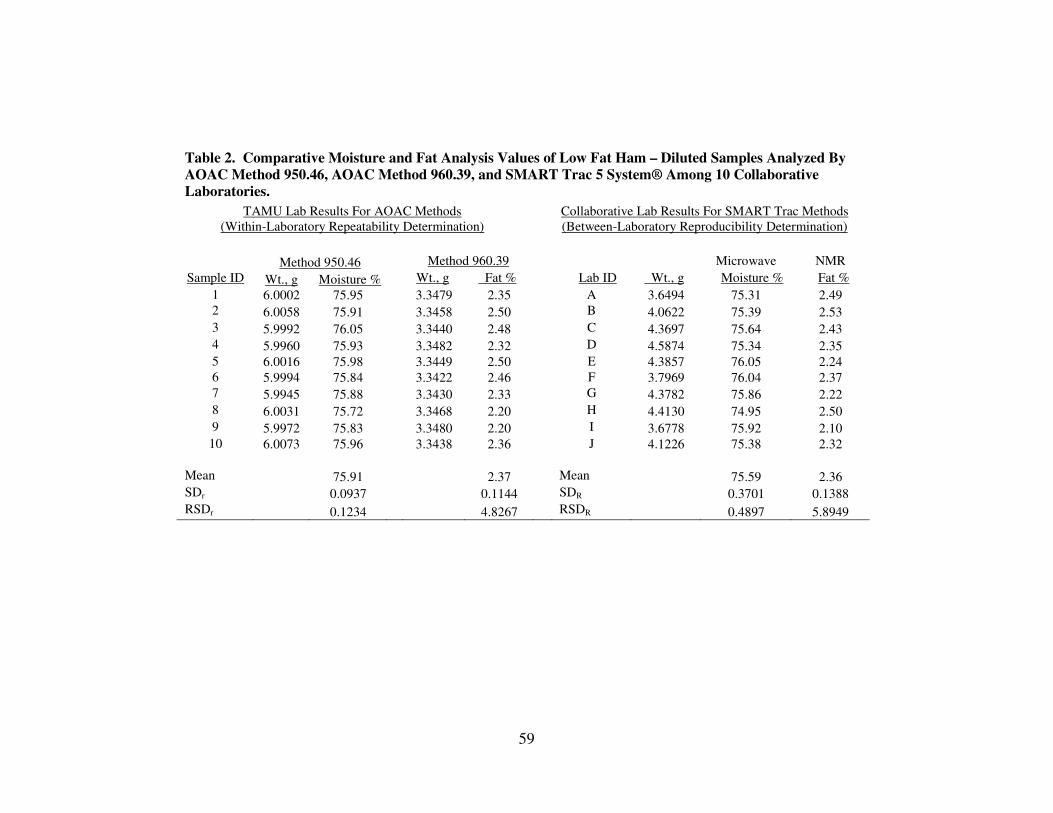
59
Table 2. Comparative Moisture and Fat Analysis Values of Low Fat Ham – Diluted Samples Analyzed By
AOAC Method 950.46, AOAC Method 960.39, and SMART Trac 5 System® Among 10 Collaborative
Laboratories.
TAMU Lab Results For AOAC Methods
(Within-Laboratory Repeatability Determination)
Collaborative Lab Results For SMART Trac Methods
(Between-Laboratory Reproducibility Determination)
Method 950.46 Method 960.39 Microwave NMR
Sample ID Wt., g Moisture % Wt., g Fat % Lab ID Wt., g Moisture % Fat %
1 6.0002 75.95 3.3479 2.35 A 3.6494 75.31 2.49
2 6.0058 75.91 3.3458 2.50 B 4.0622 75.39 2.53
3 5.9992 76.05 3.3440 2.48 C 4.3697 75.64 2.43
4 5.9960 75.93 3.3482 2.32 D 4.5874 75.34 2.35
5 6.0016 75.98 3.3449 2.50 E 4.3857 76.05 2.24
6 5.9994 75.84 3.3422 2.46 F 3.7969 76.04 2.37
7 5.9945 75.88 3.3430 2.33 G 4.3782 75.86 2.22
8 6.0031 75.72 3.3468 2.20 H 4.4130 74.95 2.50
9 5.9972 75.83 3.3480 2.20 I 3.6778 75.92 2.10
10 6.0073 75.96 3.3438 2.36 J 4.1226 75.38 2.32
Mean 75.91 2.37 Mean 75.59 2.36
SDr 0.0937 0.1144 SDR 0.3701 0.1388
RSDr 0.1234 4.8267 RSDR 0.4897 5.8949
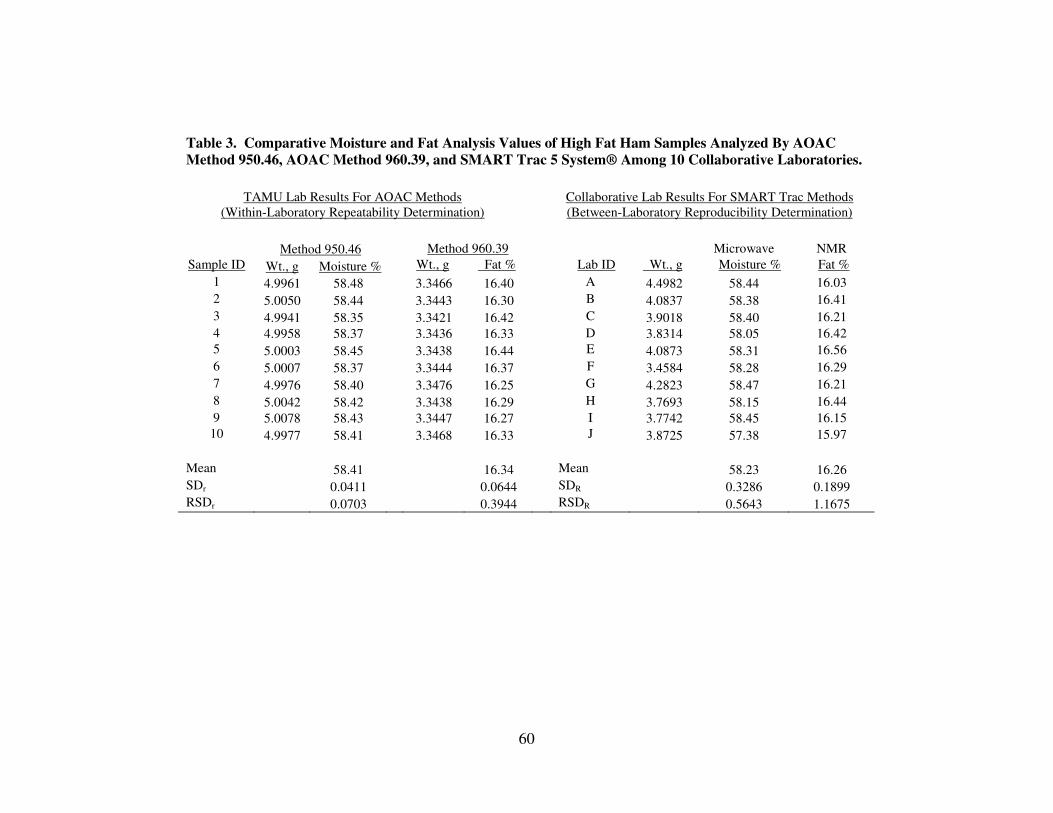
60
Table 3. Comparative Moisture and Fat Analysis Values of High Fat Ham Samples Analyzed By AOAC
Method 950.46, AOAC Method 960.39, and SMART Trac 5 System® Among 10 Collaborative Laboratories.
TAMU Lab Results For AOAC Methods
(Within-Laboratory Repeatability Determination)
Collaborative Lab Results For SMART Trac Methods
(Between-Laboratory Reproducibility Determination)
Method 950.46 Method 960.39 Microwave NMR
Sample ID Wt., g Moisture % Wt., g Fat % Lab ID Wt., g Moisture % Fat %
1 4.9961 58.48 3.3466 16.40 A 4.4982 58.44 16.03
2 5.0050 58.44 3.3443 16.30 B 4.0837 58.38 16.41
3 4.9941 58.35 3.3421 16.42 C 3.9018 58.40 16.21
4 4.9958 58.37 3.3436 16.33 D 3.8314 58.05 16.42
5 5.0003 58.45 3.3438 16.44 E 4.0873 58.31 16.56
6 5.0007 58.37 3.3444 16.37 F 3.4584 58.28 16.29
7 4.9976 58.40 3.3476 16.25 G 4.2823 58.47 16.21
8 5.0042 58.42 3.3438 16.29 H 3.7693 58.15 16.44
9 5.0078 58.43 3.3447 16.27 I 3.7742 58.45 16.15
10 4.9977 58.41 3.3468 16.33 J 3.8725 57.38 15.97
Mean 58.41 16.34 Mean 58.23 16.26
SDr 0.0411 0.0644 SDR 0.3286 0.1899
RSDr 0.0703 0.3944 RSDR 0.5643 1.1675
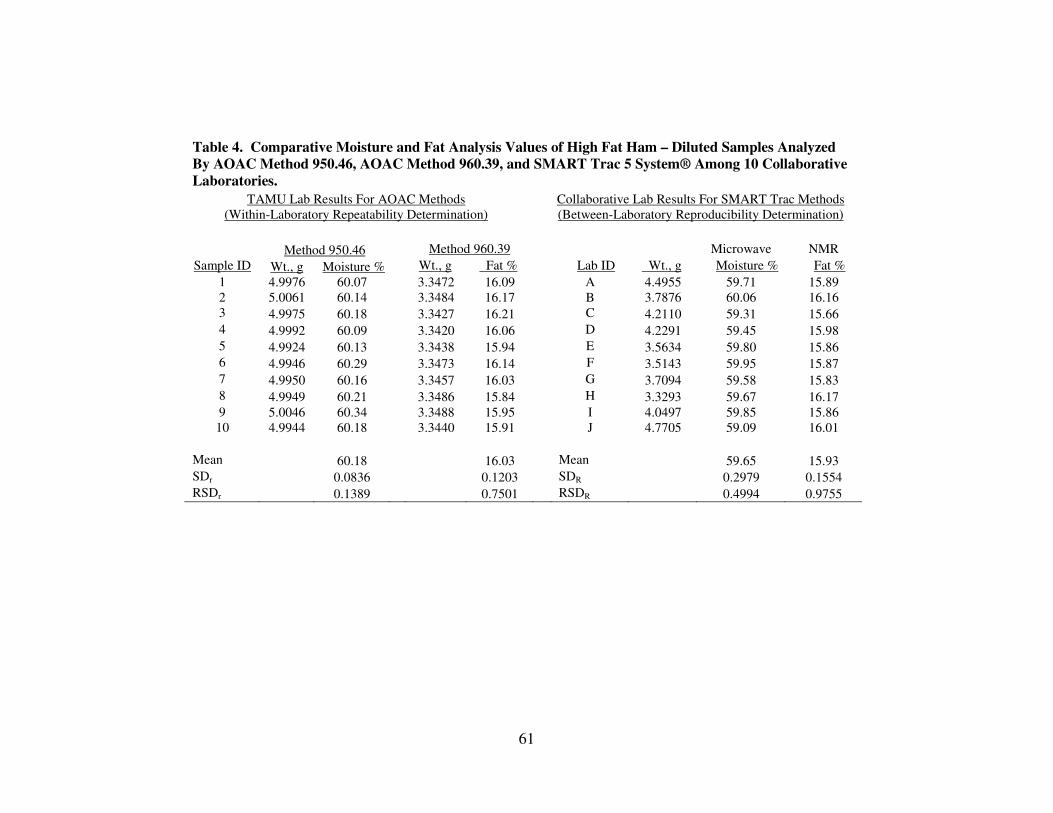
61
Table 4. Comparative Moisture and Fat Analysis Values of High Fat Ham – Diluted Samples Analyzed
By AOAC Method 950.46, AOAC Method 960.39, and SMART Trac 5 System® Among 10 Collaborative
Laboratories.
TAMU Lab Results For AOAC Methods
(Within-Laboratory Repeatability Determination)
Collaborative Lab Results For SMART Trac Methods
(Between-Laboratory Reproducibility Determination)
Method 950.46 Method 960.39 Microwave NMR
Sample ID Wt., g Moisture % Wt., g Fat % Lab ID Wt., g Moisture % Fat %
1 4.9976 60.07 3.3472 16.09 A 4.4955 59.71 15.89
2 5.0061 60.14 3.3484 16.17 B 3.7876 60.06 16.16
3 4.9975 60.18 3.3427 16.21 C 4.2110 59.31 15.66
4 4.9992 60.09 3.3420 16.06 D 4.2291 59.45 15.98
5 4.9924 60.13 3.3438 15.94 E 3.5634 59.80 15.86
6 4.9946 60.29 3.3473 16.14 F 3.5143 59.95 15.87
7 4.9950 60.16 3.3457 16.03 G 3.7094 59.58 15.83
8 4.9949 60.21 3.3486 15.84 H 3.3293 59.67 16.17
9 5.0046 60.34 3.3488 15.95 I 4.0497 59.85 15.86
10 4.9944 60.18 3.3440 15.91 J 4.7705 59.09 16.01
Mean 60.18 16.03 Mean 59.65 15.93
SDr 0.0836 0.1203 SDR 0.2979 0.1554
RSDr 0.1389 0.7501 RSDR 0.4994 0.9755
62
and 16.03%, respectively (Tables 3 and 4). The CEM Smart Trac 5 System® yielded
comparable results, with 58.23% and 59.65% mean total moisture values and 16.27%
and 15.93% mean total fat values, respectively.
Within-laboratory SDr and RSDr (repeatability) values (Tables 1 and 2) for
moisture content of low-fat ham (0.0598, 0.0798%) and diluted low-fat ham (0.0937,
0.1234%) samples were similar to between-laboratory SDR and RSDR (reproducibility)
values for moisture content of low-fat ham (0.1990, 0.2678%) and diluted low-fat ham
(0.3701, 0.4897%) samples. The between-laboratory RSDR values were slightly higher
than the within-laboratory RSDr values, but collectively, the very low RSDr and RSDR
values for moisture observed for the low-fat ham and diluted low-fat ham samples were
likely due to the high level of moisture among these two sample types. Based on the
RSDr and RSDR values for moisture, the AOAC reference method and CEM SMART
Trac 5 System® method met AOAC’s acceptability criteria of < 2.00% for low-fat ham
and diluted low-fat ham samples.
Within-laboratory (AOAC) SDr and RSDr (repeatability) values (Tables 1 and 2)
for fat content of low-fat ham (0.0925, 3.6391%) and diluted low-fat ham (0.1144,
4.8267%) samples trended similarly to between-laboratory (CEM®) SDR and RSDR
(reproducibility) values for fat content of low-fat ham (0.0929, 3.5721%) and diluted
low-fat ham (0.1388, 5.8949%) samples. Within-laboratory RSDr and between-
laboratory RSDR values exceeded AOAC’s acceptability criteria of 2.00% for low-fat
ham and diluted low-fat ham samples and were therefore not acceptable for fat analysis.
The high RSDr and RSDR values were likely due to the very small levels of fat in the
63
low-fat ham and diluted low-fat ham samples and the inherent variability of weighing
minute amounts of fat to the fourth decimal place. The small amount of fat in the low-
fat ham and diluted low-fat ham samples could have also reduced fat extraction
efficiency in the AOAC method, thus making fat weights more variable (less precise)
among samples.
Within-laboratory SDr and RSDr (repeatability) values (Tables 3 and 4) for
moisture content of high-fat ham (0.0411, 0.0703%) and diluted high-fat ham (0.0836,
0.1389%) samples were similar to between-laboratory SDR and RSDR (reproducibility)
values for moisture content of high-fat ham (0.3286, 0.5643%) and diluted high-fat ham
(0.2979, 0.4994%) samples. Between-laboratory RSDR values were higher than the
within-laboratory RSDr values, likely due to the variation among different laboratory
conditions and multiple individuals performing the analyses among the collaborative
laboratories, but the RSDr and RSDR values were < 2.00% and therefore met AOAC’s
acceptability criteria for moisture for the AOAC reference method and the CEM
SMART Trac 5 System® method for moisture analysis.
Within-laboratory SDr and RSDr (repeatability) values (Tables 3 and 4) for fat
content of high-fat ham (0.0644, 0.3944%) and diluted high-fat ham (0.1203, 0.7501%)
samples were similar to between-laboratory SDR and RSDR (reproducibility) values for
fat content of high-fat ham (0.1899, 1.1675%) and diluted high-fat ham (0.1554,
0.9755%) samples. Within-laboratory RSDr and between-laboratory RSDR values met
AOAC’s acceptability criteria of < 2.00% for the high-fat ham and diluted high-fat ham
samples. The smaller RSDr and RSDR values for these samples, in comparison to the
64
low-fat ham samples, indicate that the AOAC reference method and CEM SMART Trac
5 System® method were more precise in determining fat content in the high-fat ham
samples than in the low-fat ham samples. This can be attributed to the higher fat content
in the high-fat ham samples, which produced less variability when handling samples
with higher fat content.
Among all ham samples (low-fat, diluted low-fat, high-fat, diluted high-fat), the
between-laboratory (CEM®) SDR and RSDR values were higher in comparison to
within-laboratory (AOAC) SDr and RSDr values for moisture and fat. The higher SDR
and RSDR (between-laboratory) values were likely a result of variation among different
laboratory conditions and multiple individuals performing the analyses in comparison to
the carefully controlled laboratory conditions and a single individual performing within-
laboratory analyses.
The data indicates that the CEM SMART Trac 5 System® performed very well
in recovering moisture and fat from the ham samples (see table on page 108). Using
AOAC method mean values as the reference values for moisture and fat in the ham
samples, the percent recovery for moisture by the CEM SMART Trac 5 System® ranged
from 99.12% to 99.69% while the percent recovery for fat by the CEM SMART Trac 5
System® ranged from 99.38% to 102.36% among all ham samples.
The CEM SMART Trac 5 System® was found to be acceptable based on
AOAC’s acceptability criteria (RSDR < 2.00%) for moisture analysis in all ham samples.
It was also found to be acceptable for fat analysis for the high-fat ham and diluted high-
65
fat ham samples, but failed to meet the acceptability criteria for fat analysis for the low-
fat ham and diluted low-fat ham samples.
Discussion of Fresh Pork Results
AOAC methods yielded 74.49% and 75.40% mean total moisture values and
2.26% and 2.18% mean total fat values for the low-fat pork and diluted low-fat pork
samples, respectively (Tables 5 and 6). The CEM Smart Trac 5 System® yielded
comparable results, with 74.19% and 75.24% mean total moisture values and 2.28% and
2.11% mean total fat values, respectively.
For the high-fat pork and diluted high-fat pork samples, AOAC methods yielded
mean total moisture values of 60.07% and 61.54% and mean total fat values of 22.30%
and 21.88%, respectively (Tables 7 and 8). The CEM Smart Trac 5 System® yielded
comparable results, with 60.15% and 61.42% mean total moisture values and 22.44%
and 21.73% mean total fat values, respectively.
Within-laboratory SDr and RSDr (repeatability) values (Tables 5 and 6) for
moisture content of low-fat pork (0.0445, 0.0598%) and diluted low-fat pork (0.0370,
0.0491%) samples were similar to between-laboratory SDR and RSDR (reproducibility)
values for moisture content of low-fat pork (0.2211, 0.2980%) and diluted low-fat pork
(0.1106, 0.1470%) samples. The between-laboratory RSDR values were higher than the
within-laboratory RSDr values, but collectively, the very low RSDr and RSDR values for
moisture observed for the low-fat pork and diluted low-fat pork samples were likely due
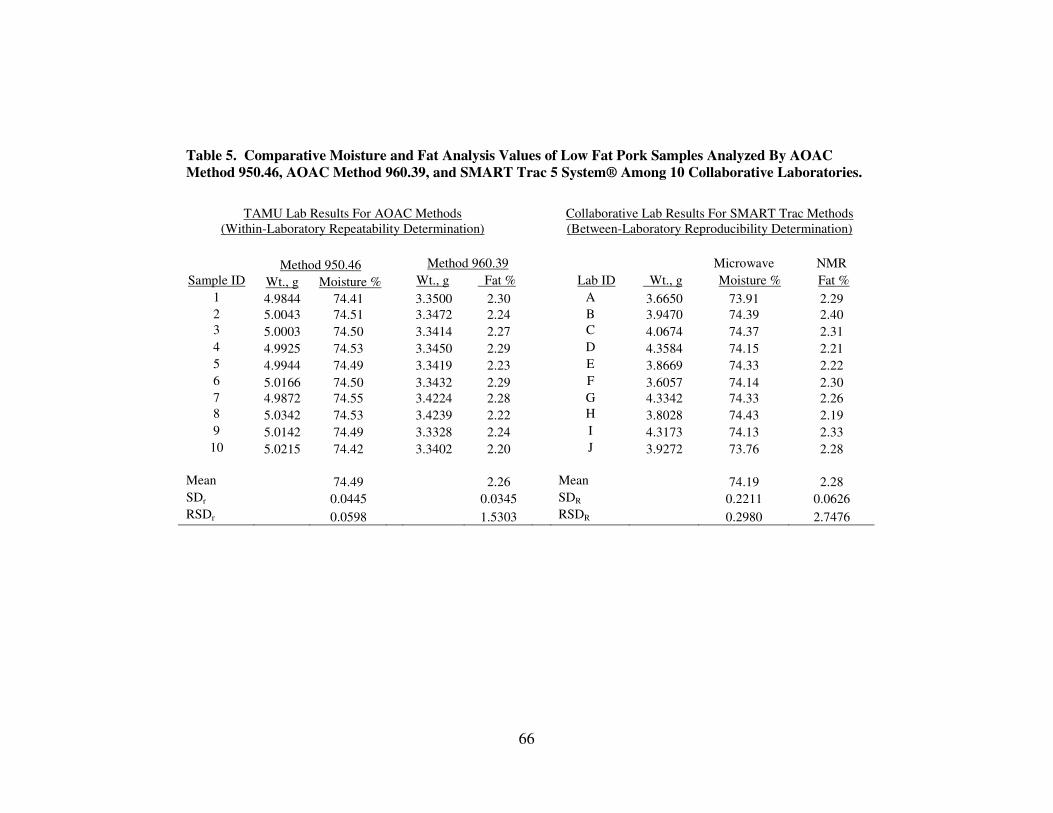
66
Table 5. Comparative Moisture and Fat Analysis Values of Low Fat Pork Samples Analyzed By AOAC
Method 950.46, AOAC Method 960.39, and SMART Trac 5 System® Among 10 Collaborative Laboratories.
TAMU Lab Results For AOAC Methods
(Within-Laboratory Repeatability Determination)
Collaborative Lab Results For SMART Trac Methods
(Between-Laboratory Reproducibility Determination)
Method 950.46 Method 960.39 Microwave NMR
Sample ID Wt., g Moisture % Wt., g Fat % Lab ID Wt., g Moisture % Fat %
1 4.9844 74.41 3.3500 2.30 A 3.6650 73.91 2.29
2 5.0043 74.51 3.3472 2.24 B 3.9470 74.39 2.40
3 5.0003 74.50 3.3414 2.27 C 4.0674 74.37 2.31
4 4.9925 74.53 3.3450 2.29 D 4.3584 74.15 2.21
5 4.9944 74.49 3.3419 2.23 E 3.8669 74.33 2.22
6 5.0166 74.50 3.3432 2.29 F 3.6057 74.14 2.30
7 4.9872 74.55 3.4224 2.28 G 4.3342 74.33 2.26
8 5.0342 74.53 3.4239 2.22 H 3.8028 74.43 2.19
9 5.0142 74.49 3.3328 2.24 I 4.3173 74.13 2.33
10 5.0215 74.42 3.3402 2.20 J 3.9272 73.76 2.28
Mean 74.49 2.26 Mean 74.19 2.28
SDr 0.0445 0.0345 SDR 0.2211 0.0626
RSDr 0.0598 1.5303 RSDR 0.2980 2.7476
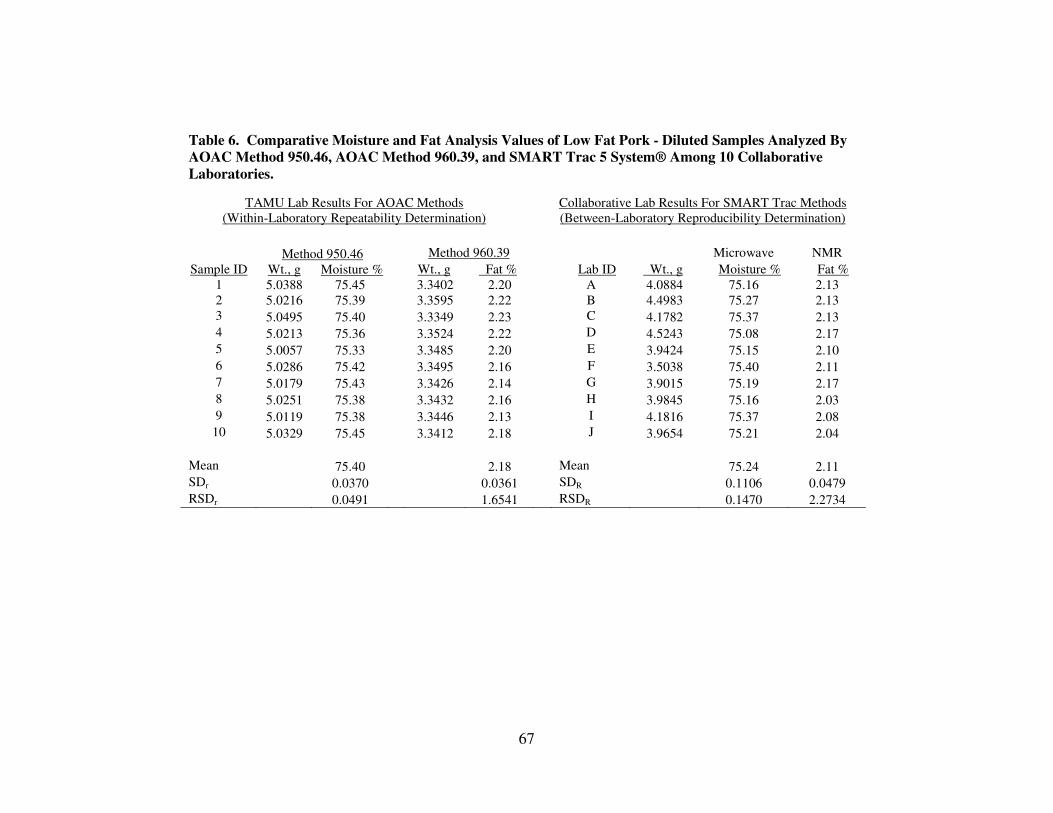
67
Table 6. Comparative Moisture and Fat Analysis Values of Low Fat Pork - Diluted Samples Analyzed By
AOAC Method 950.46, AOAC Method 960.39, and SMART Trac 5 System® Among 10 Collaborative
Laboratories.
TAMU Lab Results For AOAC Methods
(Within-Laboratory Repeatability Determination)
Collaborative Lab Results For SMART Trac Methods
(Between-Laboratory Reproducibility Determination)
Method 950.46 Method 960.39 Microwave NMR
Sample ID Wt., g Moisture % Wt., g Fat % Lab ID Wt., g Moisture % Fat %
1 5.0388 75.45 3.3402 2.20 A 4.0884 75.16 2.13
2 5.0216 75.39 3.3595 2.22 B 4.4983 75.27 2.13
3 5.0495 75.40 3.3349 2.23 C 4.1782 75.37 2.13
4 5.0213 75.36 3.3524 2.22 D 4.5243 75.08 2.17
5 5.0057 75.33 3.3485 2.20 E 3.9424 75.15 2.10
6 5.0286 75.42 3.3495 2.16 F 3.5038 75.40 2.11
7 5.0179 75.43 3.3426 2.14 G 3.9015 75.19 2.17
8 5.0251 75.38 3.3432 2.16 H 3.9845 75.16 2.03
9 5.0119 75.38 3.3446 2.13 I 4.1816 75.37 2.08
10 5.0329 75.45 3.3412 2.18 J 3.9654 75.21 2.04
Mean 75.40 2.18 Mean 75.24 2.11
SDr 0.0370 0.0361 SDR 0.1106 0.0479
RSDr 0.0491 1.6541 RSDR 0.1470 2.2734
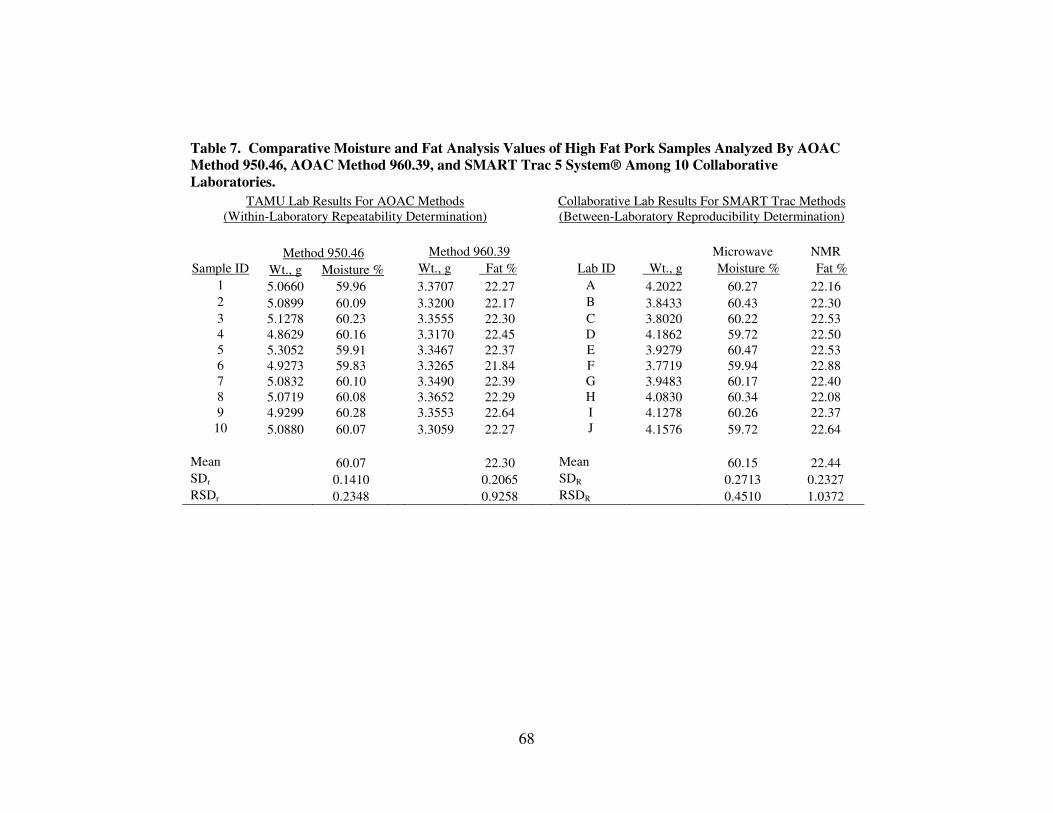
68
Table 7. Comparative Moisture and Fat Analysis Values of High Fat Pork Samples Analyzed By AOAC
Method 950.46, AOAC Method 960.39, and SMART Trac 5 System® Among 10 Collaborative
Laboratories.
TAMU Lab Results For AOAC Methods
(Within-Laboratory Repeatability Determination)
Collaborative Lab Results For SMART Trac Methods
(Between-Laboratory Reproducibility Determination)
Method 950.46 Method 960.39 Microwave NMR
Sample ID Wt., g Moisture % Wt., g Fat % Lab ID Wt., g Moisture % Fat %
1 5.0660 59.96 3.3707 22.27 A 4.2022 60.27 22.16
2 5.0899 60.09 3.3200 22.17 B 3.8433 60.43 22.30
3 5.1278 60.23 3.3555 22.30 C 3.8020 60.22 22.53
4 4.8629 60.16 3.3170 22.45 D 4.1862 59.72 22.50
5 5.3052 59.91 3.3467 22.37 E 3.9279 60.47 22.53
6 4.9273 59.83 3.3265 21.84 F 3.7719 59.94 22.88
7 5.0832 60.10 3.3490 22.39 G 3.9483 60.17 22.40
8 5.0719 60.08 3.3652 22.29 H 4.0830 60.34 22.08
9 4.9299 60.28 3.3553 22.64 I 4.1278 60.26 22.37
10 5.0880 60.07 3.3059 22.27 J 4.1576 59.72 22.64
Mean 60.07 22.30 Mean 60.15 22.44
SDr 0.1410 0.2065 SDR 0.2713 0.2327
RSDr 0.2348 0.9258 RSDR 0.4510 1.0372
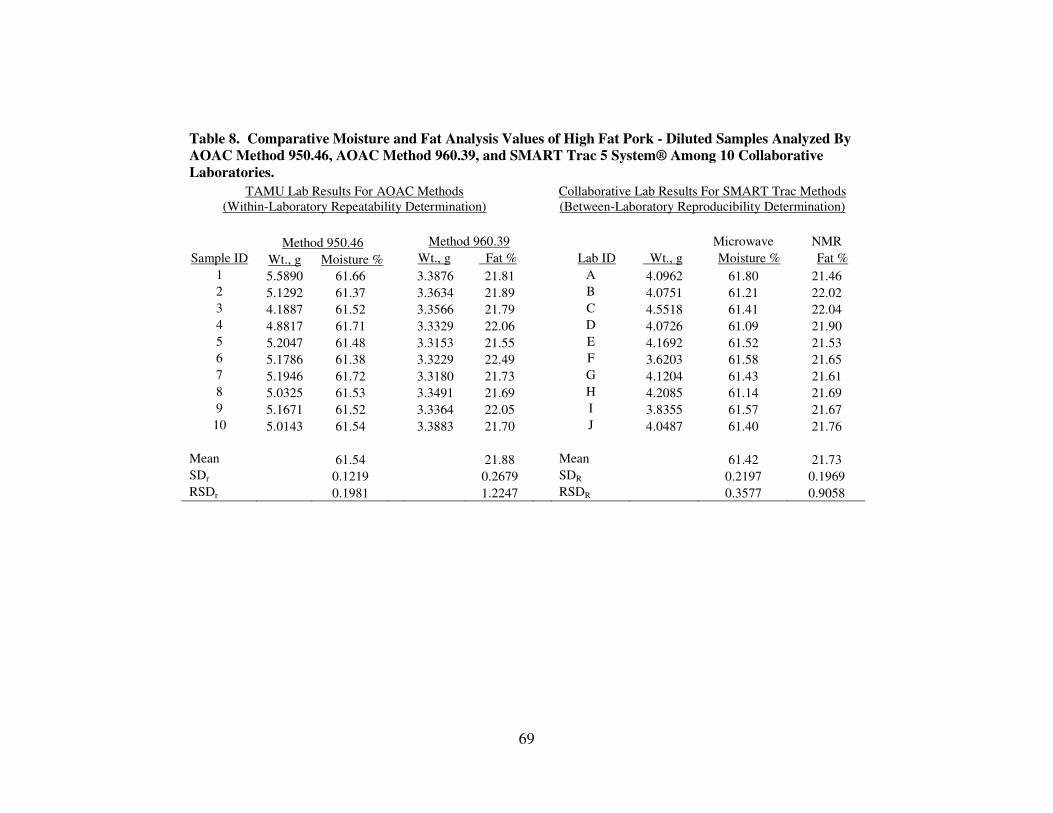
69
Table 8. Comparative Moisture and Fat Analysis Values of High Fat Pork - Diluted Samples Analyzed By
AOAC Method 950.46, AOAC Method 960.39, and SMART Trac 5 System® Among 10 Collaborative
Laboratories.
TAMU Lab Results For AOAC Methods
(Within-Laboratory Repeatability Determination)
Collaborative Lab Results For SMART Trac Methods
(Between-Laboratory Reproducibility Determination)
Method 950.46 Method 960.39 Microwave NMR
Sample ID Wt., g Moisture % Wt., g Fat % Lab ID Wt., g Moisture % Fat %
1 5.5890 61.66 3.3876 21.81 A 4.0962 61.80 21.46
2 5.1292 61.37 3.3634 21.89 B 4.0751 61.21 22.02
3 4.1887 61.52 3.3566 21.79 C 4.5518 61.41 22.04
4 4.8817 61.71 3.3329 22.06 D 4.0726 61.09 21.90
5 5.2047 61.48 3.3153 21.55 E 4.1692 61.52 21.53
6 5.1786 61.38 3.3229 22.49 F 3.6203 61.58 21.65
7 5.1946 61.72 3.3180 21.73 G 4.1204 61.43 21.61
8 5.0325 61.53 3.3491 21.69 H 4.2085 61.14 21.69
9 5.1671 61.52 3.3364 22.05 I 3.8355 61.57 21.67
10 5.0143 61.54 3.3883 21.70 J 4.0487 61.40 21.76
Mean 61.54 21.88 Mean 61.42 21.73
SDr 0.1219 0.2679 SDR 0.2197 0.1969
RSDr 0.1981 1.2247 RSDR 0.3577 0.9058
70
to the high level of moisture among these two sample types. Based on the RSDr and
RSDR values for moisture, the AOAC reference method and CEM SMART Trac 5
System® method met AOAC’s acceptability criteria of < 2.00% for low-fat pork and
diluted low-fat pork samples.
Within-laboratory (AOAC) SDr and RSDr (repeatability) values (Tables 5 and 6)
for fat content of low-fat pork (0.0345, 1.5303%) and diluted low-fat pork (0.0361,
1.6541%) samples were lower than between-laboratory (CEM®) SDR and RSDR
(reproducibility) values for fat content of low-fat pork (0.0626, 2.7476%) and diluted
low-fat pork (0.0479, 2.2734%) samples.
Within-laboratory RSDr values met AOAC’s acceptability criteria (RSDr <
2.00%) for fat in the low-fat pork and diluted low-fat pork samples, but the between-
laboratory RSDR values for fat exceeded AOAC’s acceptability criteria (RSDR < 2.00%)
and was therefore not acceptable for fat for the low-fat pork and diluted low-fat pork
samples. The higher RSDR values indicate that the CEM SMART Trac 5 System® was
less precise than the AOAC reference method in determining fat content, likely due to
the very small levels of fat in the low-fat pork and diluted low-fat pork samples and the
greater variability that existed between laboratories and analysts. Sample preparation
and handling would have also been critical, as small variations in the sample could
produce large data inconsistencies when fat content is at such a low level.
Within-laboratory (AOAC) SDr and RSDr (repeatability) values (Tables 7 and 8)
for moisture content of high-fat pork (0.1410, 0.2348%) and diluted high-fat pork
(0.1219, 0.1981%) samples were similar to between-laboratory (CEM®) SDR and RSDR
71
(reproducibility) values for moisture content of high-fat pork (0.2713, 0.4510%) and
diluted high-fat pork (0.2197, 0.3577%) samples. Between-laboratory RSDR values
were higher than the within-laboratory RSDr values, likely due to the variation among
different laboratory conditions and multiple individuals performing the analyses among
the collaborative laboratories, but the RSDr and RSDR values were < 2.00% and
therefore met AOAC’s acceptability criteria for moisture for the AOAC reference
method and the CEM SMART Trac 5 System® method for moisture analysis.
Within-laboratory SDr and RSDr (repeatability) values (Tables 7 and 8) for fat
content of high-fat pork (0.2065, 0.9258%) and diluted high-fat pork (0.2679, 1.2247%)
samples were similar to between-laboratory SDR and RSDR (reproducibility) values for
fat content of high-fat pork (0.2327, 1.0372%) and diluted high-fat pork (0.1969,
0.9058%) samples. Within-laboratory RSDr and between-laboratory RSDR values met
AOAC’s acceptability criteria of < 2.00% for the high-fat ham and diluted high-fat ham
samples. The smaller RSDr and RSDR values for these samples, in comparison to the
low-fat pork samples, indicate that the AOAC reference method and CEM SMART Trac
5 System® method were more precise in determining fat content in the high-fat pork
samples than in the low-fat pork samples. This can be attributed to the higher fat content
in the high-fat pork samples, which produced less variability when handling samples
with higher fat content.
Among all pork samples, with the exception of diluted high-fat pork samples, the
between-laboratory SDR and RSDR values were higher in comparison to within-
laboratory SDr and RSDr values for moisture and fat. The higher SDR and RSDR
72
(reproducibility) values were likely a result of variation among different laboratory
conditions and multiple individuals performing the analyses in comparison to the
carefully controlled laboratory conditions and a single individual performing within-
laboratory analyses.
The data indicates that the CEM SMART Trac 5 System® performed very well
in recovering moisture and fat from the pork samples (see table on page 108). Using
AOAC method mean values as the reference values for moisture and fat in the pork
samples, the percent recovery for moisture by the CEM SMART Trac 5 System® ranged
from 99.60% to 100.13% while the percent recovery for fat by the CEM SMART Trac 5
System® ranged from 99.31% to 100.88% among all pork samples.
The CEM SMART Trac 5 System was found to be acceptable based on AOAC’s
acceptability criteria (RSDR < 2.00%) for moisture analysis in all pork samples. It was
also found to be acceptable for fat analysis for the high-fat pork and diluted high-fat pork
samples, but failed to meet the acceptability criteria for fat analysis for the low-fat pork
and diluted low-fat pork samples.
Discussion of Fresh Beef Results
AOAC methods yielded 67.31% and 68.86% mean total moisture values and
11.23% and 10.63% mean total fat values for the low-fat beef and diluted low-fat beef
samples, respectively (Tables 9 and 10). The CEM Smart Trac 5 System® yielded very
comparable results, with 67.11% and 68.58% mean total moisture values and 11.30%
and 10.73% mean total fat values, respectively.
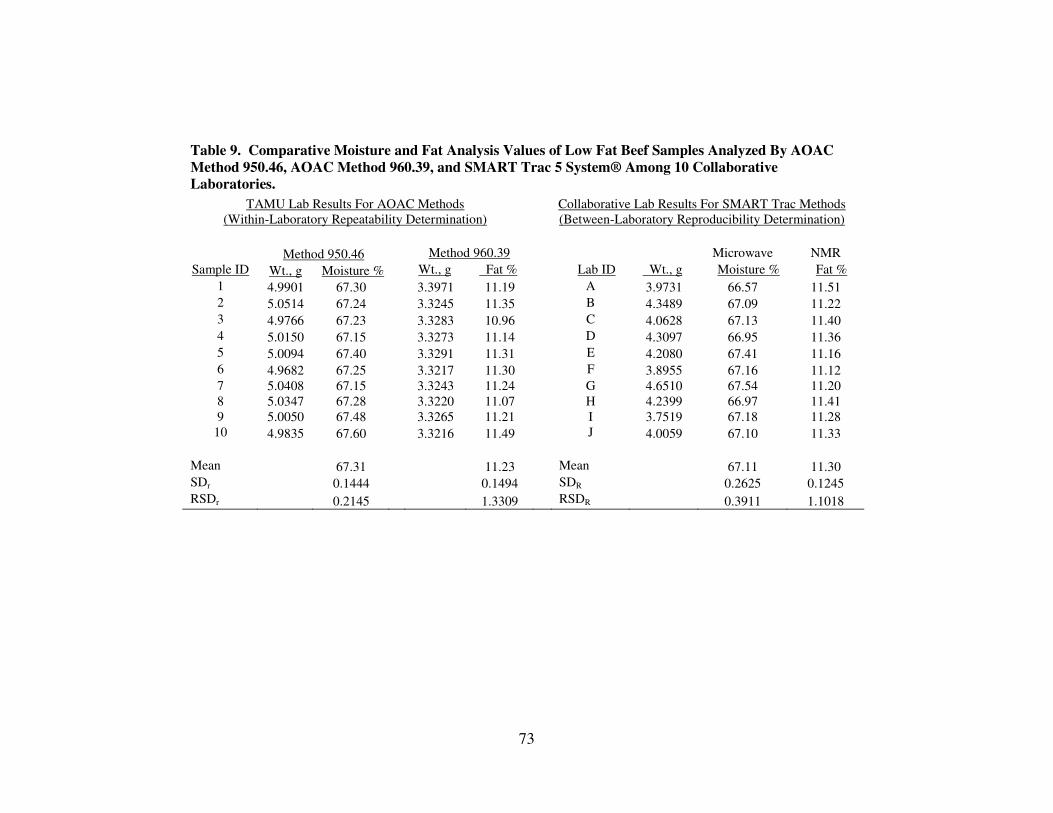
73
Table 9. Comparative Moisture and Fat Analysis Values of Low Fat Beef Samples Analyzed By AOAC
Method 950.46, AOAC Method 960.39, and SMART Trac 5 System® Among 10 Collaborative
Laboratories.
TAMU Lab Results For AOAC Methods
(Within-Laboratory Repeatability Determination)
Collaborative Lab Results For SMART Trac Methods
(Between-Laboratory Reproducibility Determination)
Method 950.46 Method 960.39 Microwave NMR
Sample ID Wt., g Moisture % Wt., g Fat % Lab ID Wt., g Moisture % Fat %
1 4.9901 67.30 3.3971 11.19 A 3.9731 66.57 11.51
2 5.0514 67.24 3.3245 11.35 B 4.3489 67.09 11.22
3 4.9766 67.23 3.3283 10.96 C 4.0628 67.13 11.40
4 5.0150 67.15 3.3273 11.14 D 4.3097 66.95 11.36
5 5.0094 67.40 3.3291 11.31 E 4.2080 67.41 11.16
6 4.9682 67.25 3.3217 11.30 F 3.8955 67.16 11.12
7 5.0408 67.15 3.3243 11.24 G 4.6510 67.54 11.20
8 5.0347 67.28 3.3220 11.07 H 4.2399 66.97 11.41
9 5.0050 67.48 3.3265 11.21 I 3.7519 67.18 11.28
10 4.9835 67.60 3.3216 11.49 J 4.0059 67.10 11.33
Mean 67.31 11.23 Mean 67.11 11.30
SDr 0.1444 0.1494 SDR 0.2625 0.1245
RSDr 0.2145 1.3309 RSDR 0.3911 1.1018

74
Table 10. Comparative Moisture and Fat Analysis Values of Low Fat Beef - Diluted Samples Analyzed
By AOAC Method 950.46, AOAC Method 960.39, and SMART Trac 5 System® Among 10 Collaborative
Laboratories.
TAMU Lab Results For AOAC Methods
(Within-Laboratory Repeatability Determination)
Collaborative Lab Results For SMART Trac Methods
(Between-Laboratory Reproducibility Determination)
Method 950.46 Method 960.39 Microwave NMR
Sample ID Wt., g Moisture % Wt., g Fat % Lab ID Wt., g Moisture % Fat %
1 4.9946 68.87 3.3206 10.65 A 4.0521 68.37 10.74
2 5.0011 68.30 3.3222 10.72 B 4.9856 68.94 10.37
3 4.9430 69.00 3.3212 10.77 C 4.3503 68.64 10.60
4 4.9965 68.92 3.3191 10.68 D 4.3530 68.26 10.80
5 4.9838 69.01 3.3301 10.53 E 3.7710 68.96 10.87
6 4.9680 68.89 3.3229 10.62 F 3.7252 68.63 10.64
7 5.0042 68.93 3.3255 10.68 G 3.7224 68.91 10.73
8 4.9871 68.90 3.3226 10.42 H 3.7017 68.70 10.74
9 5.0051 68.87 3.3243 10.81 I 4.2452 68.36 10.85
10 5.0107 68.86 3.3315 10.44 J 4.3877 68.02 10.98
Mean 68.86 10.63 Mean 68.58 10.73
SDr 0.2016 0.1331 SDR 0.3183 0.1687
RSDr 0.2928 1.2516 RSDR 0.4642 1.5720
75
For the high-fat beef and diluted high-fat beef samples, AOAC methods yielded
mean total moisture values of 57.84% and 60.16% and mean total fat values of 26.56%
and 25.44%, respectively (Tables 11 and 12). The CEM Smart Trac 5 System® yielded
very comparable results, with 57.96% and 59.59% mean total moisture values and
26.55% and 25.43% mean total fat values, respectively.
Within-laboratory (AOAC) SDr and RSDr (repeatability) values (Tables 9 and
10) for moisture content of low-fat beef (0.1444, 0.2145%) and diluted low-fat beef
(0.2016, 0.2928%) samples were similar to between-laboratory (CEM®) SDR and RSDR
(reproducibility) values for moisture content of low-fat beef (0.2625, 0.3911%) and
diluted low-fat beef (0.3183, 0.4642%) samples. The within-laboratory RSDr values and
between-laboratory RSDR values for moisture were very low, with between-laboratory
RSDR values being slightly higher, likely due to the variation among different laboratory
conditions and multiple analysts among the collaborative laboratories. Based on the
RSDr and RSDR values for moisture, the AOAC reference method and CEM SMART
Trac 5 System® method met AOAC’s acceptability criteria of < 2.00% for moisture
analysis in low-fat beef and diluted low-fat beef samples.
Within-laboratory (AOAC) SDr and RSDr (repeatability) values (Tables 9 and
10) for fat content of low-fat beef (0.1494, 1.3309%) and diluted low-fat beef (0.1331,
1.2516%) samples were similar to between-laboratory (CEM®) SDR and RSDR
(reproducibility) values for fat content of low-fat beef (0.1245, 1.1018%) and diluted
low-fat beef (0.1687, 1.5720%) samples. The within-laboratory RSDr and between-
laboratory RSDR values for fat analysis were within AOAC’s acceptability criteria
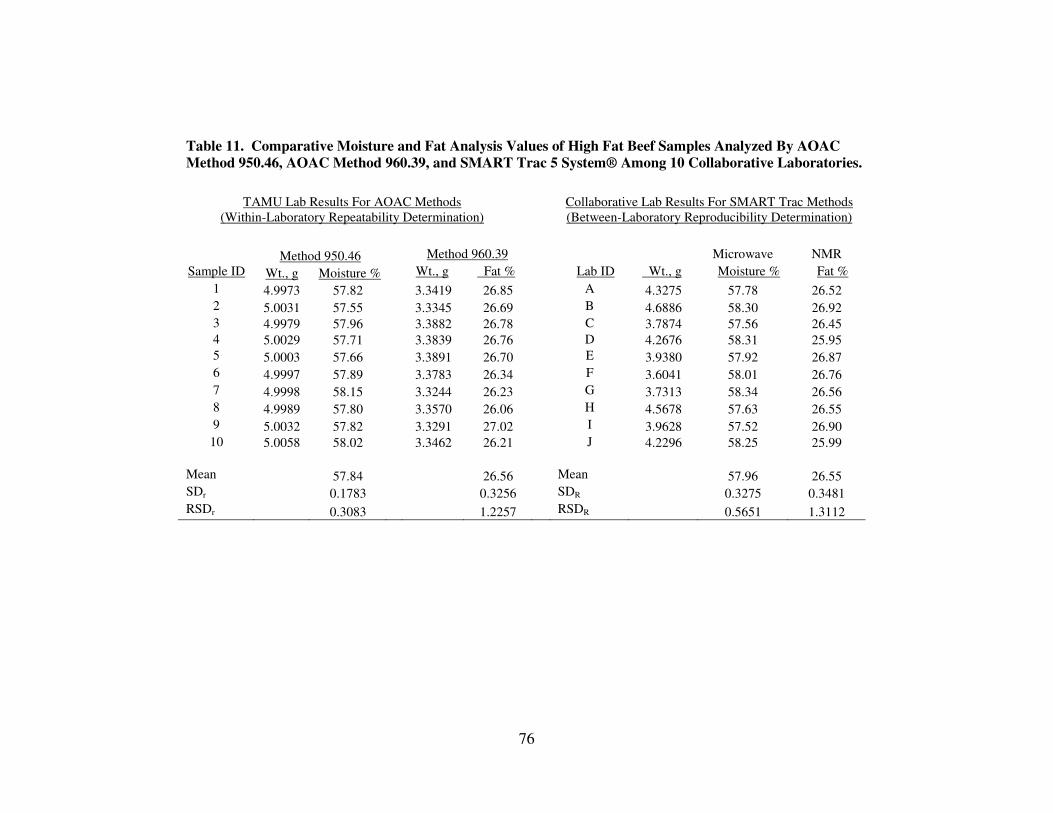
76
Table 11. Comparative Moisture and Fat Analysis Values of High Fat Beef Samples Analyzed By AOAC
Method 950.46, AOAC Method 960.39, and SMART Trac 5 System® Among 10 Collaborative Laboratories.
TAMU Lab Results For AOAC Methods
(Within-Laboratory Repeatability Determination)
Collaborative Lab Results For SMART Trac Methods
(Between-Laboratory Reproducibility Determination)
Method 950.46 Method 960.39 Microwave NMR
Sample ID Wt., g Moisture % Wt., g Fat % Lab ID Wt., g Moisture % Fat %
1 4.9973 57.82 3.3419 26.85 A 4.3275 57.78 26.52
2 5.0031 57.55 3.3345 26.69 B 4.6886 58.30 26.92
3 4.9979 57.96 3.3882 26.78 C 3.7874 57.56 26.45
4 5.0029 57.71 3.3839 26.76 D 4.2676 58.31 25.95
5 5.0003 57.66 3.3891 26.70 E 3.9380 57.92 26.87
6 4.9997 57.89 3.3783 26.34 F 3.6041 58.01 26.76
7 4.9998 58.15 3.3244 26.23 G 3.7313 58.34 26.56
8 4.9989 57.80 3.3570 26.06 H 4.5678 57.63 26.55
9 5.0032 57.82 3.3291 27.02 I 3.9628 57.52 26.90
10 5.0058 58.02 3.3462 26.21 J 4.2296 58.25 25.99
Mean 57.84 26.56 Mean 57.96 26.55
SDr 0.1783 0.3256 SDR 0.3275 0.3481
RSDr 0.3083 1.2257 RSDR 0.5651 1.3112
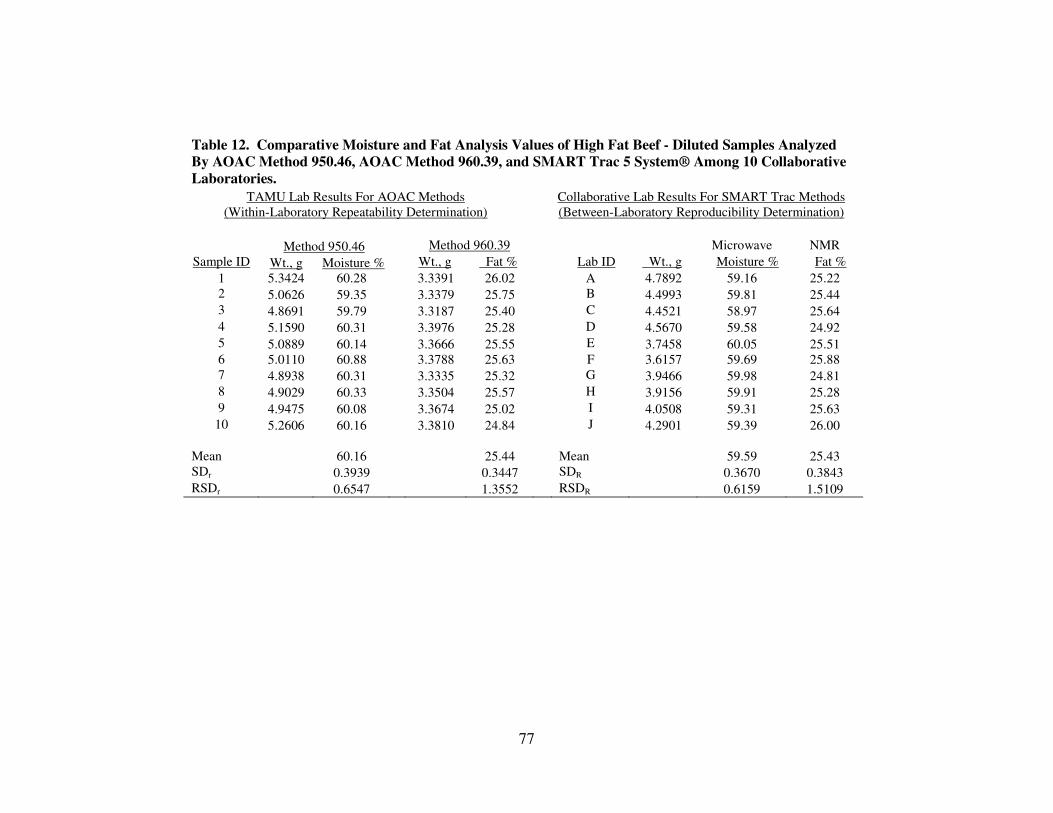
77
Table 12. Comparative Moisture and Fat Analysis Values of High Fat Beef - Diluted Samples Analyzed
By AOAC Method 950.46, AOAC Method 960.39, and SMART Trac 5 System® Among 10 Collaborative
Laboratories.
TAMU Lab Results For AOAC Methods
(Within-Laboratory Repeatability Determination)
Collaborative Lab Results For SMART Trac Methods
(Between-Laboratory Reproducibility Determination)
Method 950.46 Method 960.39 Microwave NMR
Sample ID Wt., g Moisture % Wt., g Fat % Lab ID Wt., g Moisture % Fat %
1 5.3424 60.28 3.3391 26.02 A 4.7892 59.16 25.22
2 5.0626 59.35 3.3379 25.75 B 4.4993 59.81 25.44
3 4.8691 59.79 3.3187 25.40 C 4.4521 58.97 25.64
4 5.1590 60.31 3.3976 25.28 D 4.5670 59.58 24.92
5 5.0889 60.14 3.3666 25.55 E 3.7458 60.05 25.51
6 5.0110 60.88 3.3788 25.63 F 3.6157 59.69 25.88
7 4.8938 60.31 3.3335 25.32 G 3.9466 59.98 24.81
8 4.9029 60.33 3.3504 25.57 H 3.9156 59.91 25.28
9 4.9475 60.08 3.3674 25.02 I 4.0508 59.31 25.63
10 5.2606 60.16 3.3810 24.84 J 4.2901 59.39 26.00
Mean 60.16 25.44 Mean 59.59 25.43
SDr 0.3939 0.3447 SDR 0.3670 0.3843
RSDr 0.6547 1.3552 RSDR 0.6159 1.5109
78
(<2.00%) for the low-fat beef and diluted low-fat beef samples.
Within-laboratory SDr and RSDr (repeatability) values (Tables 11 and 12) for
moisture content of high-fat beef (0.1783, 0.3083%) and diluted high-fat beef (0.3939,
0.6547%) samples were similar to between-laboratory SDr and RDSR (reproducibility)
values for moisture content of high-fat beef (0.3275, 0.5651%) and diluted high-fat beef
(0.3670, 0.6159%) samples. Between-laboratory RSDR values and within-laboratory
RSDr values were < 2.00% and therefore met AOAC’s acceptability criteria for moisture
for the AOAC reference method and the CEM SMART Trac 5 System® method for
moisture analysis.
Within-laboratory SDr and RSDr (repeatability) values (Tables 11 and 12) for
fat content of high-fat beef (0.3256, 1.2257%) and diluted high-fat beef (0.3447,
1.3552%) samples were similar to between-laboratory SDR and RSDR (reproducibility)
values for fat content of high-fat beef (0.3481, 1.3112%) and diluted high-fat beef
(0.3843, 1.5109%) samples. Within-laboratory RSDr and between-laboratory RSDR
values for fat analysis met AOAC’s acceptability criteria of < 2.00% for the high-fat
beef and diluted high-fat beef samples.
In comparing the RSDr and RSDR values for fat analysis between the four beef
samples (low-fat beef, diluted low-fat beef, high-fat beef, and diluted high-fat beef),
there did not appear to be as great of a difference between the low-fat RSD (RSDr and
RSDR) values as compared to the low-fat RSD (RSDr and RSDR) values observed for
other meat sample types (i.e. ham samples, pork samples). For example, the RSDr value
for fat analysis of the low-fat beef sample (1.3309%) was similar to the RSDr value of
79
the high-fat beef sample (1.2257%). In comparison to the ham samples and fresh pork
samples, a much greater difference between the low-fat RSDr fat values (i.e. low-fat
pork RSDr = 1.5303%) was much greater than the high-fat RSDr fat values (i.e. high-fat
pork RSDr = 0.9258%). This difference in trend may indicate that the beef samples were
more variable in nature than other meat samples (such as ham or fresh pork), with one
possible explanation being the presence of connective tissue in the beef samples.
Among all beef samples (low-fat, diluted low-fat, high-fat, diluted high-fat), the
between-laboratory SDR and RSDR values were higher in comparison to within-
laboratory SDr and RSDr values for moisture and fat, with the exception of RSDR values
for fat analysis in the low-fat beef samples. The RSDR value for fat analysis of the low-
fat beef samples was slightly lower than the RSDr value for fat analysis, indicating that
the CEM SMART Trac 5 Systems® among collaborative laboratories performed with
slightly greater precision than AOAC within-laboratory methods.
The data indicates that the CEM SMART Trac 5 System® performed very well
in recovering moisture and fat from the beef samples (see table on page 108). Using
AOAC method mean values as the reference values for moisture and fat in the beef
samples, the percent recovery for moisture by the CEM SMART Trac 5 System® ranged
from 99.05% to 100.21% while the percent recovery for fat by the CEM SMART Trac 5
System® ranged from 99.96% to 100.94% among all beef samples.
The CEM SMART Trac 5 System® was found to be acceptable based on the
AOAC’s acceptability criteria (RSDR < 2.00%) for moisture and fat analysis in all beef
samples.
80
Discussion of Fresh Chicken Results
AOAC methods yielded 74.99% and 75.90% mean total moisture values and
2.91% and 2.79% mean total fat values for the low-fat chicken and diluted low-fat
chicken samples, respectively (Tables 13 and 14). The CEM Smart Trac 5 System®
yielded very comparable results, with 74.66% and 75.63% mean total moisture values
and 2.92% and 2.73% mean total fat values, respectively.
For the high-fat chicken, AOAC methods yielded a mean total moisture value of 61.62%
and a mean total fat value of 23.30% (Table 15). Moisture and fat data were not
obtained from the collaborative laboratories’ CEM SMART Trac 5 Systems®. The
high-fat chicken sample results from AOAC methods were used only for establishing a
reference value in order to determine the appropriate NMR signal for that specific
sample type (i.e. “chicken”) and to establish a standard curve for fat determination of
that specific sample type on the CEM SMART Trac 5 Systems®. Diluted high-fat
chicken samples were not analyzed by AOAC methods or by the CEM SMART Trac 5
Systems® among collaborative laboratories.
Within-laboratory (AOAC) SDr and RSDr (repeatability) values (Tables 13 and
14) for moisture content of low-fat chicken (0.0388, 1.3327%) and diluted low-fat
chicken (0.0382, 1.3695%) samples were similar to between-laboratory (CEM®) SDR
and RSDR (reproducibility) values for moisture content of low-fat chicken (0.1552,
0.2079%) and diluted low-fat chicken (0.2225, 0.2942%) samples. The between-
laboratory RSDR values were slightly higher than the within-laboratory RSDr values, but
both values were within AOAC’s acceptability criteria of < 2.00% and were therefore

81
Table 13. Comparative Moisture and Fat Analysis Values of Low Fat Chicken Samples Analyzed By
AOAC Method 950.46, AOAC Method 960.39, and SMART Trac 5 System® Among 10 Collaborative
Laboratories.
TAMU Lab Results For AOAC Methods
(Within-Laboratory Repeatability Determination)
Collaborative Lab Results For SMART Trac Methods
(Between-Laboratory Reproducibility Determination)
Method 950.46 Method 960.39 Microwave NMR
Sample ID Wt., g Moisture % Wt., g Fat % Lab ID Wt., g Moisture % Fat %
1 5.0029 75.02 3.3436 2.92 A 4.6249 74.75 2.98
2 5.0016 74.85 3.3460 2.99 B 3.9349 74.76 2.97
3 4.9983 74.96 3.3423 2.88 C 3.8794 74.76 2.98
4 5.1334 74.95 3.3436 2.93 D 2.9766 74.68 2.84
5 5.0057 74.94 3.3467 2.93 E 4.2604 74.66 2.91
6 5.0315 75.02 3.3452 2.85 F 3.8469 74.80 2.87
7 4.9689 75.11 3.3458 2.90 G 3.5562 74.81 2.90
8 4.9765 75.01 3.3447 2.88 H 3.9174 74.45 2.91
9 4.9890 75.03 3.3479 2.93 I 4.2915 74.55 2.93
10 5.0354 74.99 3.3492 2.89 J 4.1324 74.36 2.93
Mean 74.99 2.91 Mean 74.66 2.92
SDr 0.0668 0.0388 SDR 0.1552 0.0464
RSDr 0.0891 1.3327 RSDR 0.2079 1.5873
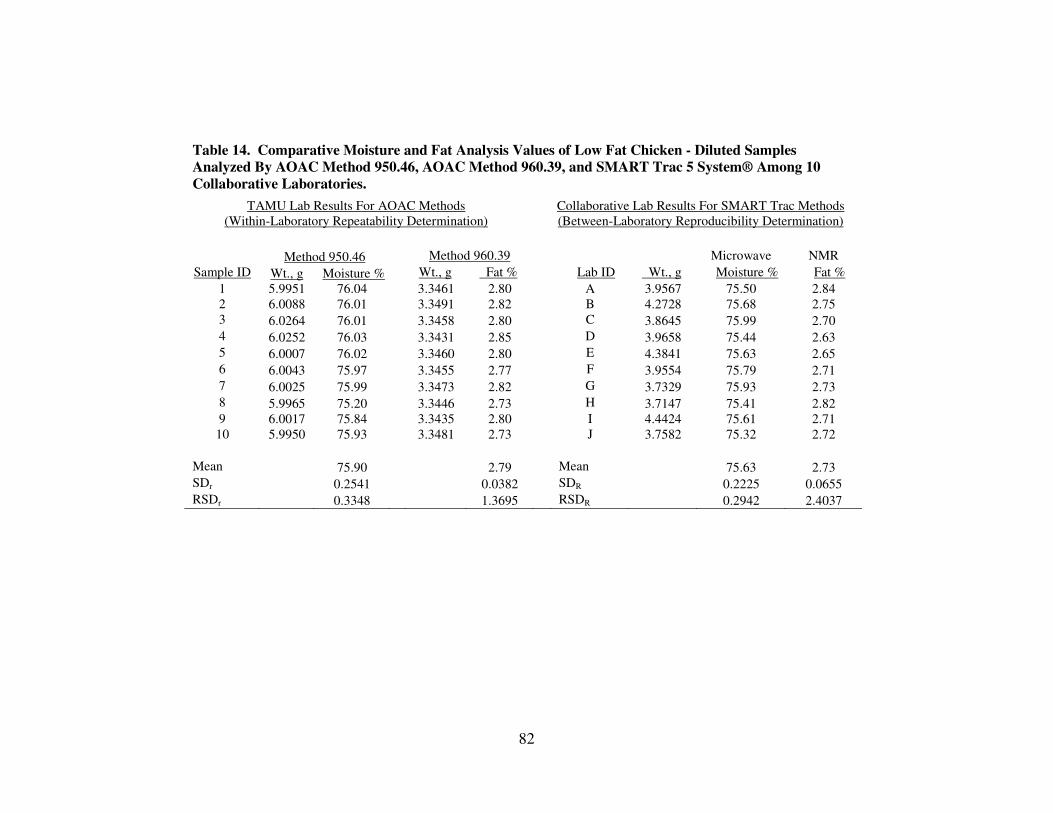
82
Table 14. Comparative Moisture and Fat Analysis Values of Low Fat Chicken - Diluted Samples
Analyzed By AOAC Method 950.46, AOAC Method 960.39, and SMART Trac 5 System® Among 10
Collaborative Laboratories.
TAMU Lab Results For AOAC Methods
(Within-Laboratory Repeatability Determination)
Collaborative Lab Results For SMART Trac Methods
(Between-Laboratory Reproducibility Determination)
Method 950.46 Method 960.39 Microwave NMR
Sample ID Wt., g Moisture % Wt., g Fat % Lab ID Wt., g Moisture % Fat %
1 5.9951 76.04 3.3461 2.80 A 3.9567 75.50 2.84
2 6.0088 76.01 3.3491 2.82 B 4.2728 75.68 2.75
3 6.0264 76.01 3.3458 2.80 C 3.8645 75.99 2.70
4 6.0252 76.03 3.3431 2.85 D 3.9658 75.44 2.63
5 6.0007 76.02 3.3460 2.80 E 4.3841 75.63 2.65
6 6.0043 75.97 3.3455 2.77 F 3.9554 75.79 2.71
7 6.0025 75.99 3.3473 2.82 G 3.7329 75.93 2.73
8 5.9965 75.20 3.3446 2.73 H 3.7147 75.41 2.82
9 6.0017 75.84 3.3435 2.80 I 4.4424 75.61 2.71
10 5.9950 75.93 3.3481 2.73 J 3.7582 75.32 2.72
Mean 75.90 2.79 Mean 75.63 2.73
SDr 0.2541 0.0382 SDR 0.2225 0.0655
RSDr 0.3348 1.3695 RSDR 0.2942 2.4037
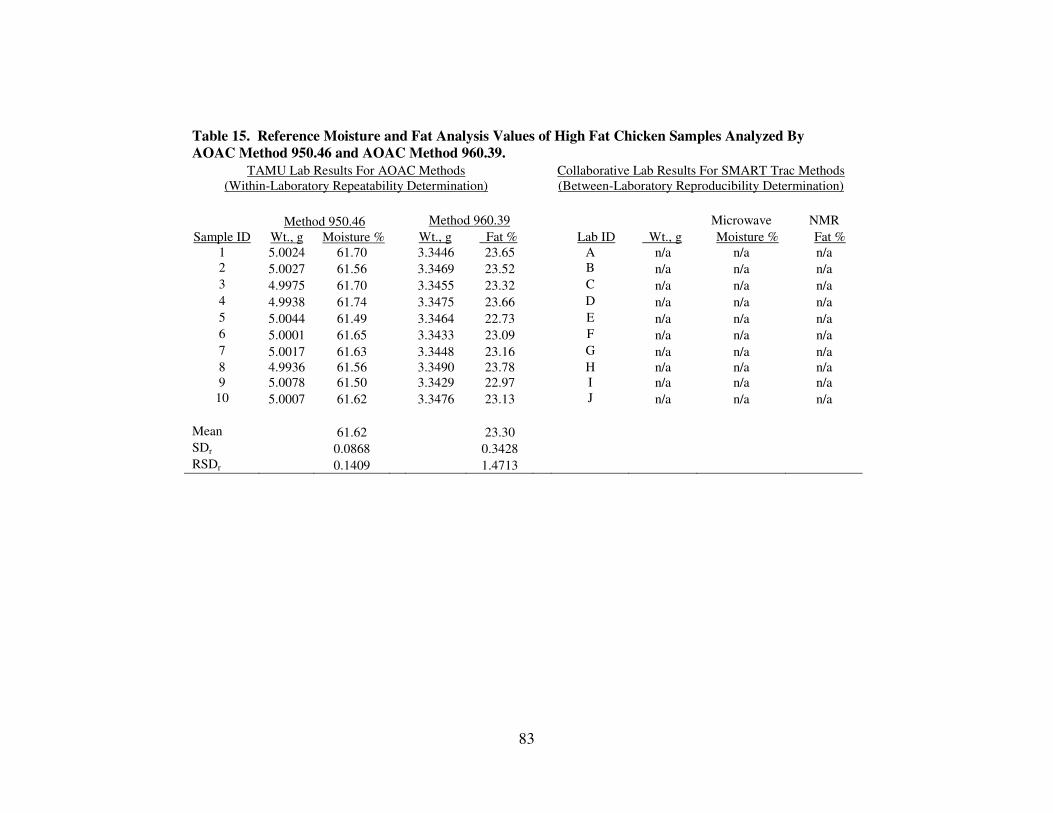
83
Table 15. Reference Moisture and Fat Analysis Values of High Fat Chicken Samples Analyzed By
AOAC Method 950.46 and AOAC Method 960.39.
TAMU Lab Results For AOAC Methods
(Within-Laboratory Repeatability Determination)
Collaborative Lab Results For SMART Trac Methods
(Between-Laboratory Reproducibility Determination)
Method 950.46 Method 960.39 Microwave NMR
Sample ID Wt., g Moisture % Wt., g Fat % Lab ID Wt., g Moisture % Fat %
1 5.0024 61.70 3.3446 23.65 A n/a n/a n/a
2 5.0027 61.56 3.3469 23.52 B n/a n/a n/a
3 4.9975 61.70 3.3455 23.32 C n/a n/a n/a
4 4.9938 61.74 3.3475 23.66 D n/a n/a n/a
5 5.0044 61.49 3.3464 22.73 E n/a n/a n/a
6 5.0001 61.65 3.3433 23.09 F n/a n/a n/a
7 5.0017 61.63 3.3448 23.16 G n/a n/a n/a
8 4.9936 61.56 3.3490 23.78 H n/a n/a n/a
9 5.0078 61.50 3.3429 22.97 I n/a n/a n/a
10 5.0007 61.62 3.3476 23.13 J n/a n/a n/a
Mean 61.62 23.30
SDr 0.0868 0.3428
RSDr 0.1409 1.4713
84
acceptable for moisture analysis. Collectively, the very low RSDr and RSDR values for
moisture observed for the low-fat chicken and diluted low-fat chicken samples were
likely due to the high level of moisture among these two sample types.
Within-laboratory (AOAC) SDr and RSDr (repeatability) values (Tables 13 and
14) for fat content of low-fat chicken (0.0388. 1.3327%) and diluted low-fat chicken
(0.0382, 1.3695%) samples trended similarly to between-laboratory (CEM®) SDR and
RSDR (reproducibility) values for fat content of low-fat chicken (0.0464, 1.5873%) and
diluted low-fat chicken (0.0655, 2.4037%) samples. Within-laboratory RSDr values for
low-fat chicken and diluted low-fat chicken and between-laboratory RSDR value for
low-fat chicken were within AOAC’s acceptability criteria of < 2.00% for fat analysis.
However, the between-laboratory RSDR value for diluted low-fat chicken exceeded
AOAC’s acceptability criteria of 2.00% and was therefore not acceptable for fat
analysis. The high RSDR value for the between-laboratory fat analysis of the diluted
low-fat chicken samples was due to the very small amount of fat in the sample and the
variation among different laboratory conditions and multiple analysts. It was not
unexpected to see a high RSDR value in the diluted low-fat chicken sample, as this trend
was observed in other meat samples in which fat content was very low (i.e. low-fat ham,
low-fat pork).
Within-laboratory SDr and RSDr (repeatability) values (Table 15) for moisture
content (0.0868, 0.1409%) and fat content (0.3428, 1.4713%) of high-fat chicken
samples were acceptable based on AOAC’s acceptability criteria of RSDr < 2.00%.
Moisture and fat data were not obtained from the collaborative laboratories’ CEM
85
SMART Trac 5 Systems® for high-fat chicken, so between-laboratory reproducibility
cannot be determined. Moisture and fat data were also not obtained from AOAC
methods or from the collaborative laboratories’ CEM SMART Trac 5 Systems® for
diluted high-fat chicken.
The data indicates that the CEM SMART Trac 5 System® performed well in
recovering moisture and fat from the low-fat chicken and diluted low-fat chicken
samples (see table on page 108). Using AOAC method mean values as the reference
values for moisture and fat in the chicken samples, the percent recovery for moisture by
the CEM SMART Trac 5 System® ranged from 99.56% to 99.64% while the percent
recovery for fat by the CEM SMART Trac 5 System® ranged from 97.85% to 100.34%.
Based on this data, the percent fat recovery by the CEM SMART Trac 5 System® was
more variable for the low-fat chicken and diluted low-fat chicken samples compared to
other meat samples analyzed. This is most likely due to the very small amount of fat in
the samples.
The CEM SMART Trac 5 System® was found to be acceptable for moisture
analysis for low-fat chicken and diluted low-fat chicken samples based on AOAC’s
acceptability criteria (RSDR < 2.00%). The CEM SMART Trac 5 System® was also
acceptable for fat analysis for low-fat chicken samples, but was not acceptable for fat
analysis for diluted low-fat chicken samples due to exceeding AOAC’s acceptability
criteria.
86
Discussion of Frankfurter Results
AOAC methods yielded a 74.97% mean total moisture value and a 2.68% mean
total fat value for the low-fat frankfurter samples, respectively, based on three replicate
determinations (Table 16). Moisture and fat data were not obtained from the
collaborative laboratories’ CEM SMART Trac 5 Systems®. The low-fat frankfurter
sample results from AOAC methods were used only for establishing a reference value
in order to determine the appropriate NMR signal for that specific sample type (i.e.
“frankfurter”) and to establish a standard curve for fat determination of that specific
sample type on the CEM SMART Trac 5 Systems®. Diluted low-fat frankfurter
samples were not analyzed by AOAC methods or by the CEM SMART Trac 5
Systems® among collaborative laboratories.
For the high-fat and diluted high-fat frankfurter samples, AOAC methods yielded
mean total moisture values of 54.03% and 55.54% and mean total fat values of 29.79%
and 28.80%, respectively (Tables 17 and 18). The CEM Smart Trac 5 System® yielded
comparable results, with 53.64% and 55.52% mean total moisture values and 29.93%
and 28.78% mean total fat values, respectively.
Within-laboratory (AOAC) SDr and RSDr (repeatability) values (Tables 17 and
18) for moisture content of high-fat frankfurter (0.0722, 0.1337%) and diluted high-fat
frankfurter (0.0787, 0.1416%) samples were similar to between-laboratory (CEM®) SDR
and RSDR (reproducibility) values for moisture content of high-fat frankfurter (0.2704,
0.5041%) and diluted high-fat frankfurter (0.3709, 0.6680%) samples. The between-
laboratory RSDR values were higher than the within-laboratory RSDr values, but overall,
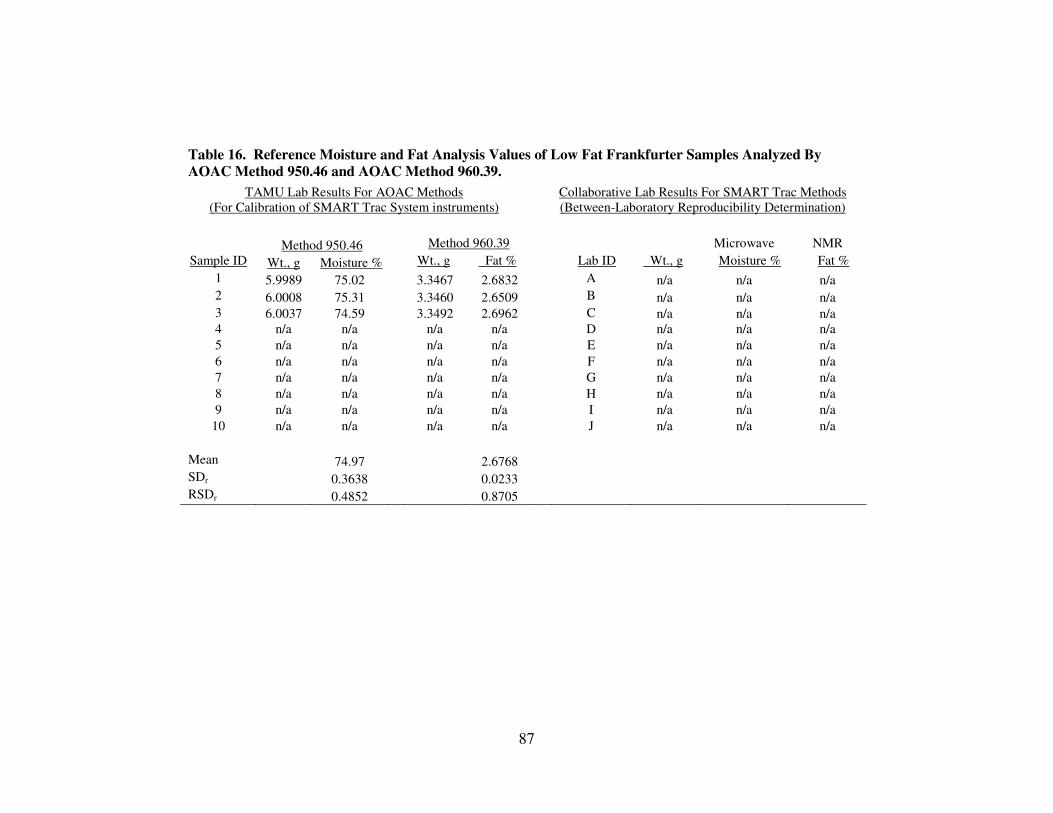
87
Table 16. Reference Moisture and Fat Analysis Values of Low Fat Frankfurter Samples Analyzed By
AOAC Method 950.46 and AOAC Method 960.39.
TAMU Lab Results For AOAC Methods
(For Calibration of SMART Trac System instruments)
Collaborative Lab Results For SMART Trac Methods
(Between-Laboratory Reproducibility Determination)
Method 950.46 Method 960.39 Microwave NMR
Sample ID Wt., g Moisture % Wt., g Fat % Lab ID Wt., g Moisture % Fat %
1 5.9989 75.02 3.3467 2.6832 A n/a n/a n/a
2 6.0008 75.31 3.3460 2.6509 B n/a n/a n/a
3 6.0037 74.59 3.3492 2.6962 C n/a n/a n/a
4 n/a n/a n/a n/a D n/a n/a n/a 5 n/a n/a n/a n/a E n/a n/a n/a 6 n/a n/a n/a n/a F n/a n/a n/a 7 n/a n/a n/a n/a G n/a n/a n/a 8 n/a n/a n/a n/a H n/a n/a n/a 9 n/a n/a n/a n/a I n/a n/a n/a
10 n/a n/a n/a n/a J n/a n/a n/a
Mean 74.97 2.6768
SDr 0.3638 0.0233
RSDr 0.4852 0.8705
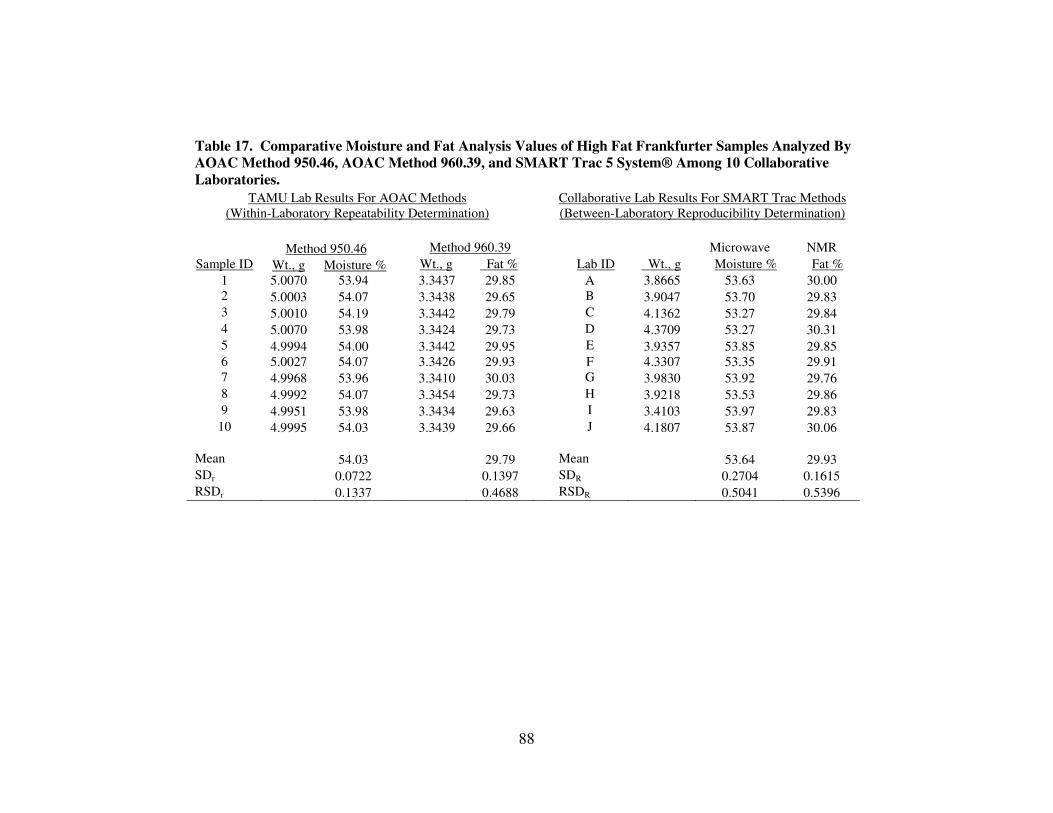
88
Table 17. Comparative Moisture and Fat Analysis Values of High Fat Frankfurter Samples Analyzed By
AOAC Method 950.46, AOAC Method 960.39, and SMART Trac 5 System® Among 10 Collaborative
Laboratories.
TAMU Lab Results For AOAC Methods
(Within-Laboratory Repeatability Determination)
Collaborative Lab Results For SMART Trac Methods
(Between-Laboratory Reproducibility Determination)
Method 950.46 Method 960.39 Microwave NMR
Sample ID Wt., g Moisture % Wt., g Fat % Lab ID Wt., g Moisture % Fat %
1 5.0070 53.94 3.3437 29.85 A 3.8665 53.63 30.00
2 5.0003 54.07 3.3438 29.65 B 3.9047 53.70 29.83
3 5.0010 54.19 3.3442 29.79 C 4.1362 53.27 29.84
4 5.0070 53.98 3.3424 29.73 D 4.3709 53.27 30.31
5 4.9994 54.00 3.3442 29.95 E 3.9357 53.85 29.85
6 5.0027 54.07 3.3426 29.93 F 4.3307 53.35 29.91
7 4.9968 53.96 3.3410 30.03 G 3.9830 53.92 29.76
8 4.9992 54.07 3.3454 29.73 H 3.9218 53.53 29.86
9 4.9951 53.98 3.3434 29.63 I 3.4103 53.97 29.83
10 4.9995 54.03 3.3439 29.66 J 4.1807 53.87 30.06
Mean 54.03 29.79 Mean 53.64 29.93
SDr 0.0722 0.1397 SDR 0.2704 0.1615
RSDr 0.1337 0.4688 RSDR 0.5041 0.5396
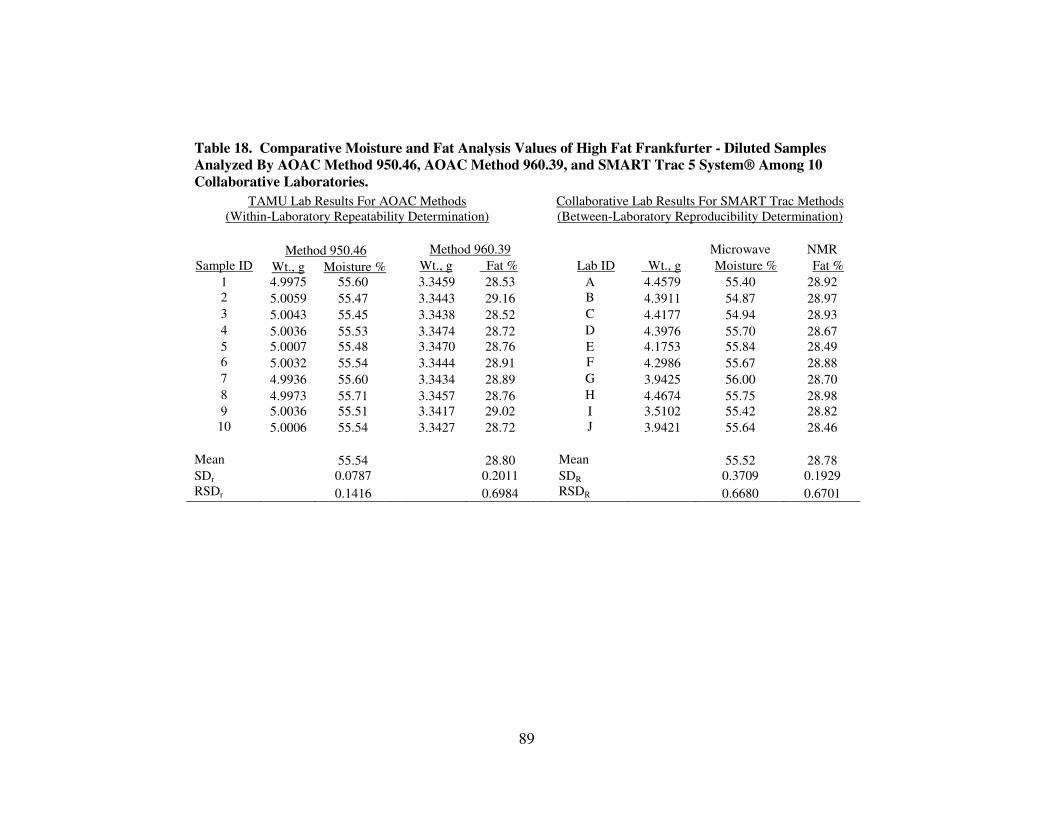
89
Table 18. Comparative Moisture and Fat Analysis Values of High Fat Frankfurter - Diluted Samples
Analyzed By AOAC Method 950.46, AOAC Method 960.39, and SMART Trac 5 System® Among 10
Collaborative Laboratories.
TAMU Lab Results For AOAC Methods
(Within-Laboratory Repeatability Determination)
Collaborative Lab Results For SMART Trac Methods
(Between-Laboratory Reproducibility Determination)
Method 950.46 Method 960.39 Microwave NMR
Sample ID Wt., g Moisture % Wt., g Fat % Lab ID Wt., g Moisture % Fat %
1 4.9975 55.60 3.3459 28.53 A 4.4579 55.40 28.92
2 5.0059 55.47 3.3443 29.16 B 4.3911 54.87 28.97
3 5.0043 55.45 3.3438 28.52 C 4.4177 54.94 28.93
4 5.0036 55.53 3.3474 28.72 D 4.3976 55.70 28.67
5 5.0007 55.48 3.3470 28.76 E 4.1753 55.84 28.49
6 5.0032 55.54 3.3444 28.91 F 4.2986 55.67 28.88
7 4.9936 55.60 3.3434 28.89 G 3.9425 56.00 28.70
8 4.9973 55.71 3.3457 28.76 H 4.4674 55.75 28.98
9 5.0036 55.51 3.3417 29.02 I 3.5102 55.42 28.82
10 5.0006 55.54 3.3427 28.72 J 3.9421 55.64 28.46
Mean 55.54 28.80 Mean 55.52 28.78
SDr 0.0787 0.2011 SDR 0.3709 0.1929
RSDr 0.1416 0.6984 RSDR 0.6680 0.6701
90
the very low RSDr and RSDR values met AOAC’s acceptability criteria (< 2.00%) for
moisture analysis and reflect a great level of precision for moisture analysis among the
AOAC method and CEM Smart Trac 5 System® method.
Within-laboratory (AOAC) SDr and RSDr (repeatability) values (Tables 17 and
18) for fat content of high-fat frankfurter (0.1397, 0.4688%) and diluted high-fat
frankfurter (0.2011, 0.6984%) samples were similar to between-laboratory (CEM®) SDR
and RSDR (reproducibility) values for fat content of high-fat frankfurter (0.1615,
0.5396%) and diluted high-fat frankfurter (0.1929, 0.6701%) samples. The low RSDr
and RSDR values met AOAC’s acceptability criteria (< 2.00%) for fat analysis and
reflect a great level of precision among the AOAC method and CEM Smart Trac 5
System® method for fat analysis in frankfurter samples.
The data indicates that the CEM Smart Trac 5 System® performed well in
recovering moisture and fat from the frankfurter samples (see table on page 108). Using
AOAC method mean values as the reference values for moisture and fat in the
frankfurter samples, the percent recovery for moisture by the CEM Smart Trac 5
System® ranged from 99.28% to 99.96% while the percent recovery for fat by the CEM
Smart Trac 5 System® ranged from 99.93% to 100.47% among the frankfurter samples.
The CEM SMART Trac 5 System® was found to be acceptable for moisture
analysis and fat analysis for high-fat frankfurter samples based on AOAC’s acceptability
criteria (RSDR < 2.00%).
91
Discussion of Fresh Turkey Results
AOAC methods yielded 74.67% and 75.43% mean total moisture values and
1.00% and 0.74% mean total fat values for the low-fat turkey samples and diluted low-
fat turkey samples, respectively (Tables 19 and 20). The CEM Smart Trac 5 System®
yielded very comparable results, with 74.37% and 75.16% mean total moisture values
and 0.95% and 0.87% mean total fat values, respectively.
For the high-fat turkey samples, AOAC methods yielded a mean total moisture
value of 65.79% and a mean total fat value of 18.52% for the high-fat turkey samples
based on three replicate determinations (Table 21). Moisture and fat data were not
obtained from the collaborative laboratories’ CEM SMART Trac 5 Systems® for high-
fat turkey samples. The high-fat turkey sample results from AOAC methods were used
only for establishing a reference value in order to determine the appropriate NMR signal
for that specific sample type (i.e. “turkey”) and to establish a standard curve for fat
determination of that specific sample type on the CEM SMART Trac 5 Systems®.
Diluted high-fat turkey samples were not analyzed by AOAC methods or by the CEM
SMART Trac 5 Systems® among collaborative laboratories.
Within-laboratory (AOAC) SDr and RSDr (repeatability) values (Tables 19 and
20) for moisture content of low-fat turkey (0.0564, 0.0755%) and diluted low-fat turkey
(0.0687, 0.0911) samples were similar to between-laboratory (CEM®) SDR and RSDR
(reproducibility) values for moisture content of low-fat turkey (0.2708, 0.3641%) and
diluted low-fat turkey (0.2399, 0.3191%) samples. The between-laboratory RSDR
values were higher than the within-laboratory RSDr values, which is a trend that has
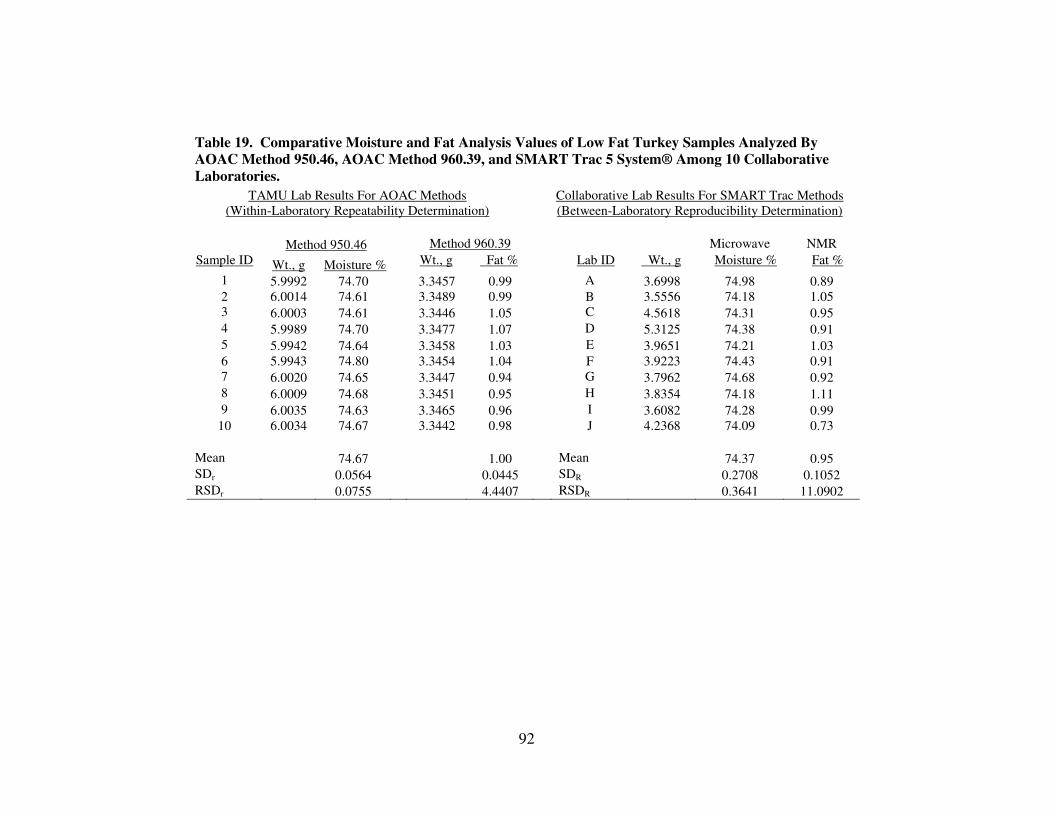
92
Table 19. Comparative Moisture and Fat Analysis Values of Low Fat Turkey Samples Analyzed By
AOAC Method 950.46, AOAC Method 960.39, and SMART Trac 5 System® Among 10 Collaborative
Laboratories.
TAMU Lab Results For AOAC Methods
(Within-Laboratory Repeatability Determination)
Collaborative Lab Results For SMART Trac Methods
(Between-Laboratory Reproducibility Determination)
Method 950.46 Method 960.39 Microwave NMR
Sample ID Wt., g Moisture % Wt., g Fat % Lab ID Wt., g Moisture % Fat %
1 5.9992 74.70 3.3457 0.99 A 3.6998 74.98 0.89
2 6.0014 74.61 3.3489 0.99 B 3.5556 74.18 1.05
3 6.0003 74.61 3.3446 1.05 C 4.5618 74.31 0.95
4 5.9989 74.70 3.3477 1.07 D 5.3125 74.38 0.91
5 5.9942 74.64 3.3458 1.03 E 3.9651 74.21 1.03
6 5.9943 74.80 3.3454 1.04 F 3.9223 74.43 0.91
7 6.0020 74.65 3.3447 0.94 G 3.7962 74.68 0.92
8 6.0009 74.68 3.3451 0.95 H 3.8354 74.18 1.11
9 6.0035 74.63 3.3465 0.96 I 3.6082 74.28 0.99
10 6.0034 74.67 3.3442 0.98 J 4.2368 74.09 0.73
Mean 74.67 1.00 Mean 74.37 0.95
SDr 0.0564 0.0445 SDR 0.2708 0.1052
RSDr 0.0755 4.4407 RSDR 0.3641 11.0902
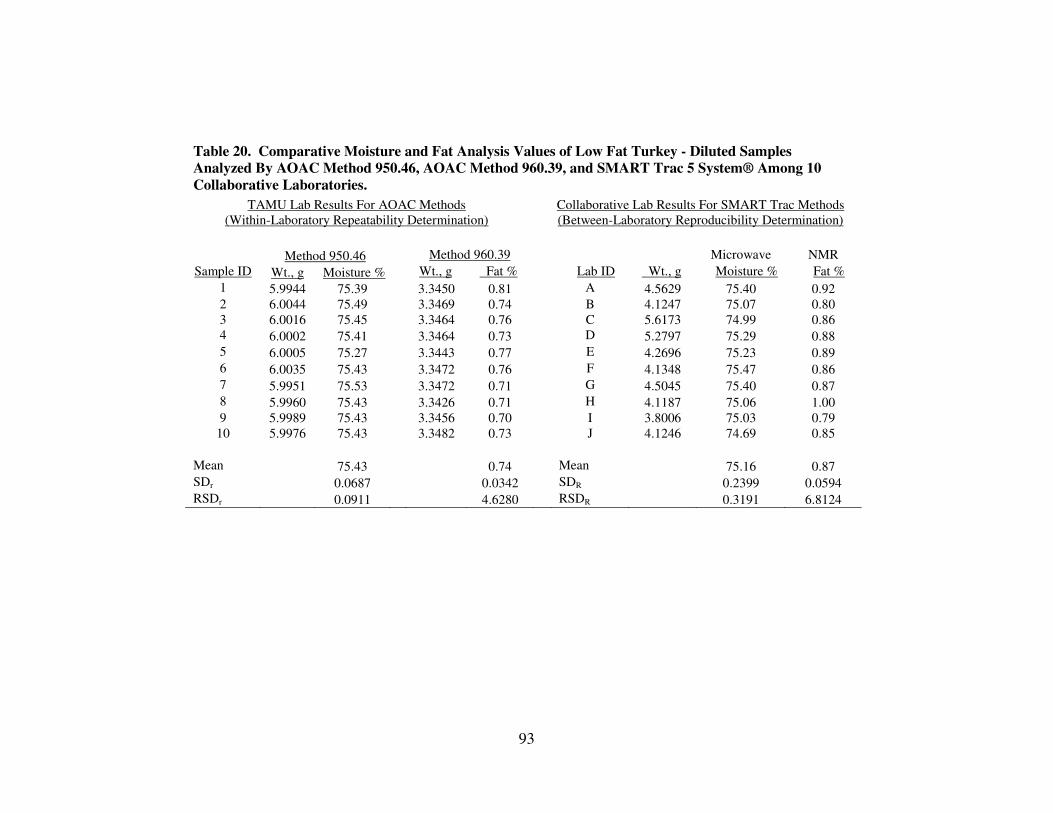
93
Table 20. Comparative Moisture and Fat Analysis Values of Low Fat Turkey - Diluted Samples
Analyzed By AOAC Method 950.46, AOAC Method 960.39, and SMART Trac 5 System® Among 10
Collaborative Laboratories.
TAMU Lab Results For AOAC Methods
(Within-Laboratory Repeatability Determination)
Collaborative Lab Results For SMART Trac Methods
(Between-Laboratory Reproducibility Determination)
Method 950.46 Method 960.39 Microwave NMR
Sample ID Wt., g Moisture % Wt., g Fat % Lab ID Wt., g Moisture % Fat %
1 5.9944 75.39 3.3450 0.81 A 4.5629 75.40 0.92
2 6.0044 75.49 3.3469 0.74 B 4.1247 75.07 0.80
3 6.0016 75.45 3.3464 0.76 C 5.6173 74.99 0.86
4 6.0002 75.41 3.3464 0.73 D 5.2797 75.29 0.88
5 6.0005 75.27 3.3443 0.77 E 4.2696 75.23 0.89
6 6.0035 75.43 3.3472 0.76 F 4.1348 75.47 0.86
7 5.9951 75.53 3.3472 0.71 G 4.5045 75.40 0.87
8 5.9960 75.43 3.3426 0.71 H 4.1187 75.06 1.00
9 5.9989 75.43 3.3456 0.70 I 3.8006 75.03 0.79
10 5.9976 75.43 3.3482 0.73 J 4.1246 74.69 0.85
Mean 75.43 0.74 Mean 75.16 0.87
SDr 0.0687 0.0342 SDR 0.2399 0.0594
RSDr 0.0911 4.6280 RSDR 0.3191 6.8124
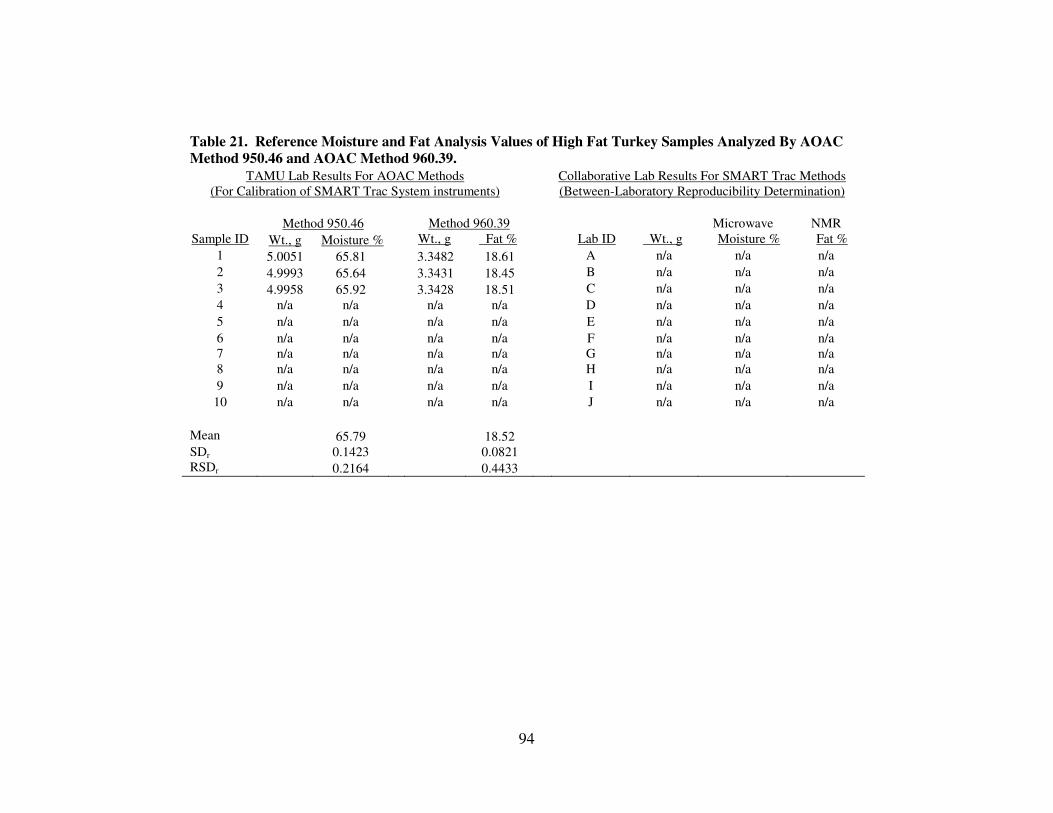
94
Table 21. Reference Moisture and Fat Analysis Values of High Fat Turkey Samples Analyzed By AOAC
Method 950.46 and AOAC Method 960.39.
TAMU Lab Results For AOAC Methods
(For Calibration of SMART Trac System instruments)
Collaborative Lab Results For SMART Trac Methods
(Between-Laboratory Reproducibility Determination)
Method 950.46 Method 960.39 Microwave NMR
Sample ID Wt., g Moisture % Wt., g Fat % Lab ID Wt., g Moisture % Fat %
1 5.0051 65.81 3.3482 18.61 A n/a n/a n/a 2 4.9993 65.64 3.3431 18.45 B n/a n/a n/a 3 4.9958 65.92 3.3428 18.51 C n/a n/a n/a 4 n/a n/a n/a n/a D n/a n/a n/a 5 n/a n/a n/a n/a E n/a n/a n/a 6 n/a n/a n/a n/a F n/a n/a n/a 7 n/a n/a n/a n/a G n/a n/a n/a 8 n/a n/a n/a n/a H n/a n/a n/a 9 n/a n/a n/a n/a I n/a n/a n/a 10 n/a n/a n/a n/a J n/a n/a n/a
Mean 65.79 18.52
SDr 0.1423 0.0821
RSDr 0.2164 0.4433
95
been observed in almost all other meat samples. Overall, the RSDr and RSDR values
were very low due to the very high moisture content in the low-fat turkey and diluted
low-fat turkey samples and met AOAC’s acceptability criteria of <2.00%.
Within-laboratory (AOAC) SDr and RSDr (repeatability) values (Tables 19 and
20) for fat content of low-fat turkey (0.0445, 4.4407%) and diluted low-fat turkey
(0.0342, 4.6280%) samples trended similarly to between-laboratory (CEM®) SDR and
RSDR (reproducibility) values for fat content of low-fat turkey (0.1052, 11.0902%) and
diluted low-fat turkey (0.0594, 6.8124%) samples. Within-laboratory RSDr and
between-laboratory RSDR values exceeded AOAC’s acceptability criteria of 2.00% for
low-fat turkey and diluted low-fat turkey samples and were therefore not acceptable for
fat analysis. The very high RSDr and RSDR values were likely due to the very small
levels of fat in the low-fat turkey and diluted low-fat turkey samples, as these samples
contained the least amount of fat of all meat samples analyzed. High RSDr and RSDR
values were also seen in other very low-fat meat samples, such as low-fat ham, low-fat
pork, and low-fat beef, so the high RSDr and RSDR values observed for fat analysis in
the low-fat turkey samples followed the same trend as other low-fat meat samples and
were therefore expected.
The data indicates that the CEM Smart Trac 5 System® performed well in
recovering moisture from the turkey samples (see table on page 108), but that its
performance was much more variable in recovering fat from the turkey samples. Using
AOAC method mean values as the reference values for moisture and fat in the turkey
samples, the percent recovery for moisture by the CEM Smart Trac 5 System® ranged
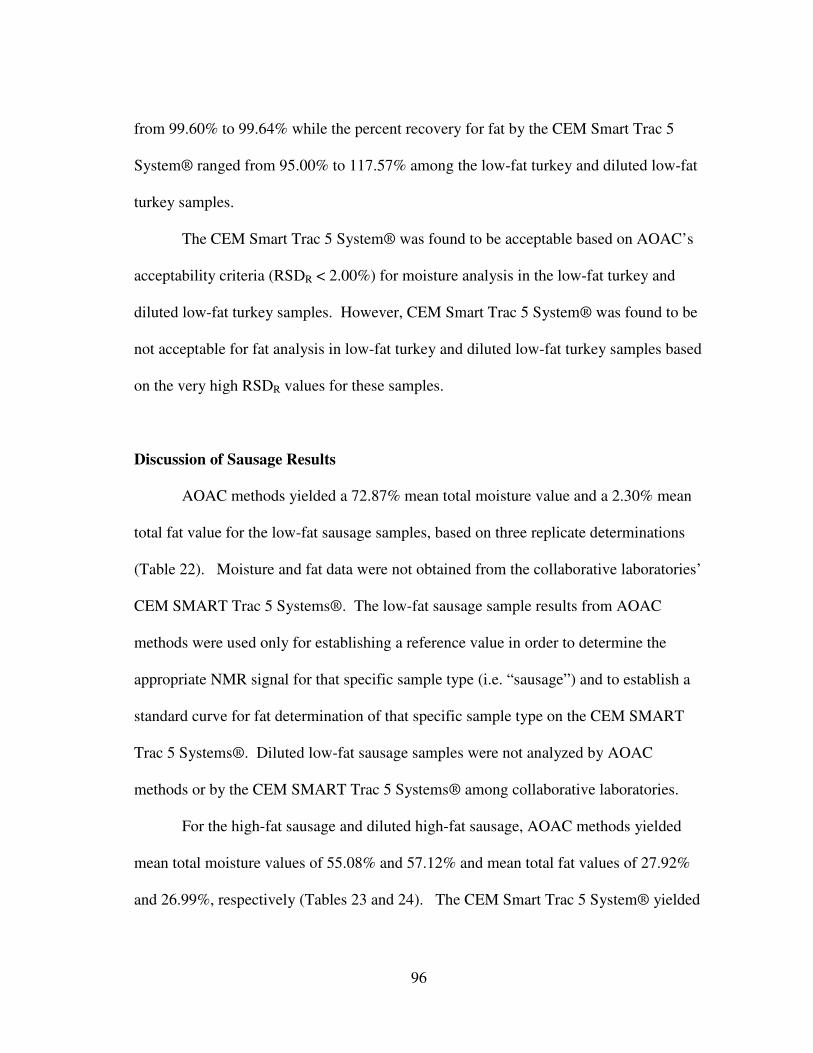
96
from 99.60% to 99.64% while the percent recovery for fat by the CEM Smart Trac 5
System® ranged from 95.00% to 117.57% among the low-fat turkey and diluted low-fat
turkey samples.
The CEM Smart Trac 5 System® was found to be acceptable based on AOAC’s
acceptability criteria (RSDR < 2.00%) for moisture analysis in the low-fat turkey and
diluted low-fat turkey samples. However, CEM Smart Trac 5 System® was found to be
not acceptable for fat analysis in low-fat turkey and diluted low-fat turkey samples based
on the very high RSDR values for these samples.
Discussion of Sausage Results
AOAC methods yielded a 72.87% mean total moisture value and a 2.30% mean
total fat value for the low-fat sausage samples, based on three replicate determinations
(Table 22). Moisture and fat data were not obtained from the collaborative laboratories’
CEM SMART Trac 5 Systems®. The low-fat sausage sample results from AOAC
methods were used only for establishing a reference value in order to determine the
appropriate NMR signal for that specific sample type (i.e. “sausage”) and to establish a
standard curve for fat determination of that specific sample type on the CEM SMART
Trac 5 Systems®. Diluted low-fat sausage samples were not analyzed by AOAC
methods or by the CEM SMART Trac 5 Systems® among collaborative laboratories.
For the high-fat sausage and diluted high-fat sausage, AOAC methods yielded
mean total moisture values of 55.08% and 57.12% and mean total fat values of 27.92%
and 26.99%, respectively (Tables 23 and 24). The CEM Smart Trac 5 System® yielded
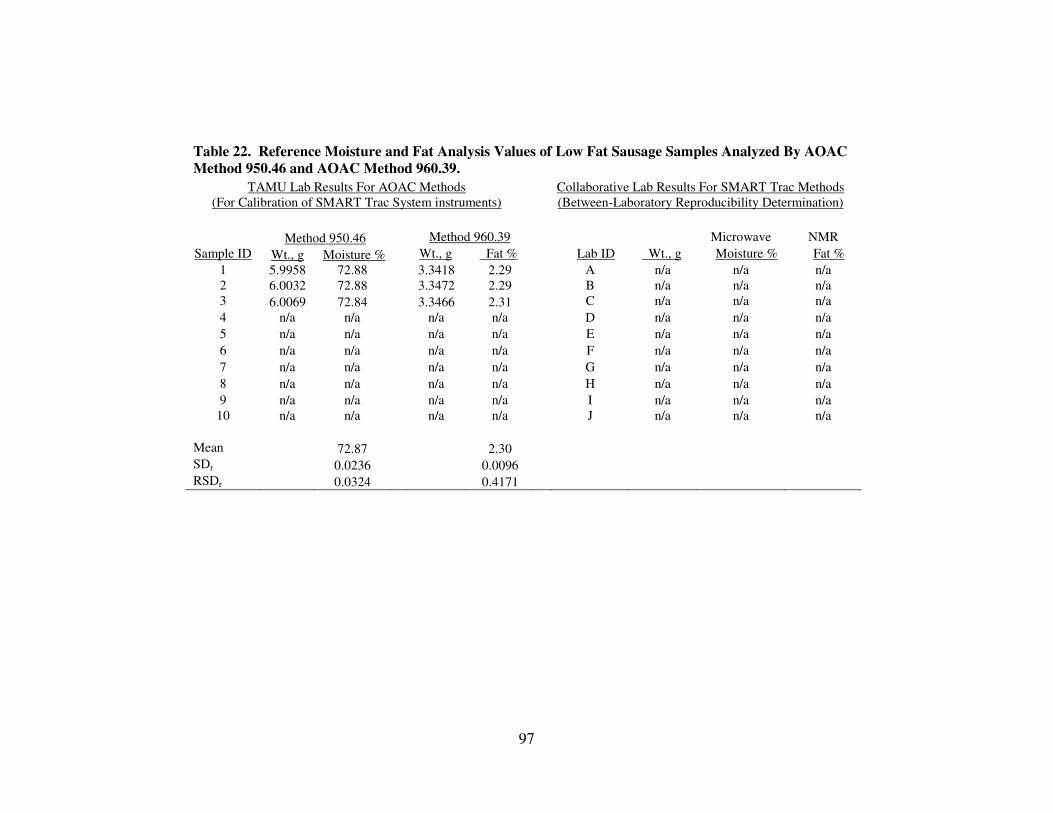
97
Table 22. Reference Moisture and Fat Analysis Values of Low Fat Sausage Samples Analyzed By AOAC
Method 950.46 and AOAC Method 960.39.
TAMU Lab Results For AOAC Methods
(For Calibration of SMART Trac System instruments)
Collaborative Lab Results For SMART Trac Methods
(Between-Laboratory Reproducibility Determination)
Method 950.46 Method 960.39 Microwave NMR
Sample ID Wt., g Moisture % Wt., g Fat % Lab ID Wt., g Moisture % Fat %
1 5.9958 72.88 3.3418 2.29 A n/a n/a n/a 2 6.0032 72.88 3.3472 2.29 B n/a n/a n/a 3 6.0069 72.84 3.3466 2.31 C n/a n/a n/a 4 n/a n/a n/a n/a D n/a n/a n/a 5 n/a n/a n/a n/a E n/a n/a n/a 6 n/a n/a n/a n/a F n/a n/a n/a 7 n/a n/a n/a n/a G n/a n/a n/a 8 n/a n/a n/a n/a H n/a n/a n/a 9 n/a n/a n/a n/a I n/a n/a n/a
10 n/a n/a n/a n/a J n/a n/a n/a
Mean 72.87 2.30
SDr 0.0236 0.0096
RSDr 0.0324 0.4171
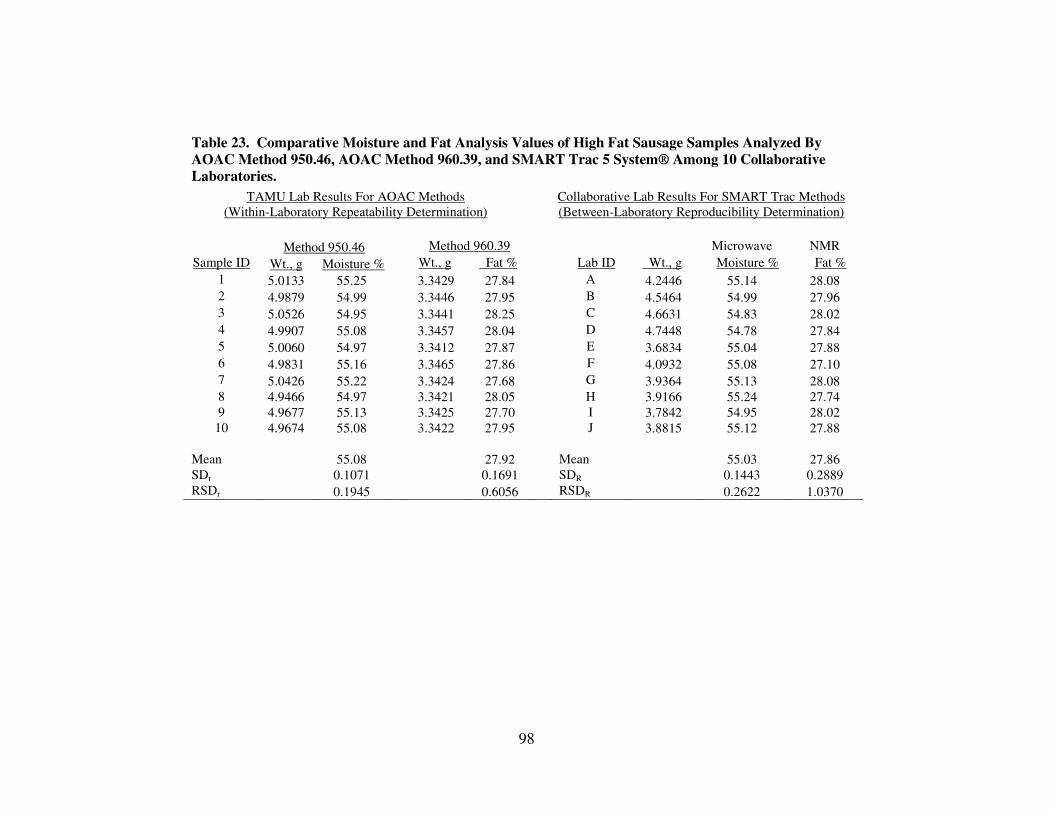
98
Table 23. Comparative Moisture and Fat Analysis Values of High Fat Sausage Samples Analyzed By
AOAC Method 950.46, AOAC Method 960.39, and SMART Trac 5 System® Among 10 Collaborative
Laboratories.
TAMU Lab Results For AOAC Methods
(Within-Laboratory Repeatability Determination)
Collaborative Lab Results For SMART Trac Methods
(Between-Laboratory Reproducibility Determination)
Method 950.46 Method 960.39 Microwave NMR
Sample ID Wt., g Moisture % Wt., g Fat % Lab ID Wt., g Moisture % Fat %
1 5.0133 55.25 3.3429 27.84 A 4.2446 55.14 28.08
2 4.9879 54.99 3.3446 27.95 B 4.5464 54.99 27.96
3 5.0526 54.95 3.3441 28.25 C 4.6631 54.83 28.02
4 4.9907 55.08 3.3457 28.04 D 4.7448 54.78 27.84
5 5.0060 54.97 3.3412 27.87 E 3.6834 55.04 27.88
6 4.9831 55.16 3.3465 27.86 F 4.0932 55.08 27.10
7 5.0426 55.22 3.3424 27.68 G 3.9364 55.13 28.08
8 4.9466 54.97 3.3421 28.05 H 3.9166 55.24 27.74
9 4.9677 55.13 3.3425 27.70 I 3.7842 54.95 28.02
10 4.9674 55.08 3.3422 27.95 J 3.8815 55.12 27.88
Mean 55.08 27.92 Mean 55.03 27.86
SDr 0.1071 0.1691 SDR 0.1443 0.2889
RSDr 0.1945 0.6056 RSDR 0.2622 1.0370

99
Table 24. Comparative Moisture and Fat Analysis Values of High Fat Sausage – Diluted Samples
Analyzed By AOAC Method 950.46, AOAC Method 960.39, and SMART Trac 5 System® Among 10
Collaborative Laboratories.
TAMU Lab Results For AOAC Methods
(Within-Laboratory Repeatability Determination)
Collaborative Lab Results For SMART Trac Methods
(Between-Laboratory Reproducibility Determination)
Method 950.46 Method 960.39 Microwave NMR
Sample ID Wt., g Moisture % Wt., g Fat % Lab ID Wt., g Moisture % Fat %
1 5.0054 56.92 3.3434 26.95 A 4.2379 56.83 26.83
2 4.9967 58.27 3.3469 27.15 B 4.0120 56.55 27.11
3 5.0028 56.94 3.3415 27.12 C 4.2778 56.28 27.35
4 5.0030 57.10 3.3487 26.74 D 4.1757 56.14 27.07
5 5.0051 57.06 3.3459 27.04 E 4.0293 57.05 26.36
6 4.9970 56.86 3.3435 27.20 F 4.1172 57.15 26.86
7 4.9998 56.96 3.3421 26.68 G 4.0107 56.71 27.15
8 4.9982 57.12 3.3455 26.92 H 3.9572 56.66 27.01
9 4.9973 56.84 3.3484 27.00 I 3.9956 56.56 26.74
10 5.0043 57.12 3.3481 27.12 J 3.8916 56.76 27.22
Mean 57.12 26.99 Mean 56.67 26.97
SDr 0.4182 0.1738 SDR 0.3109 0.2843
RSDr 0.7322 0.6439 RSDR 0.5485 1.0540
100
comparable results, with 55.03% and 56.67% mean total moisture values and 27.86%
and 26.97% mean total fat values, respectively.
Within-laboratory (AOAC) SDr and RSDr (repeatability) values (Tables 23 and
24) for moisture content of high-fat sausage (0.1071, 0.1945%) and diluted high-fat
sausage (0.4182, 0.7322%) samples were similar to between-laboratory (CEM®) SDR
and RSDR (reproducibility) values for moisture content of high-fat sausage (0.1443,
0.2622%) and diluted high-fat sausage (0.3109, 0.5485%) samples. The between-
laboratory RSDR values were higher than the within-laboratory RSDr values, which is a
trend observed in nearly all other meat sample results. The RSDr and RSDR values for
moisture analysis were all < 2.00% and therefore were acceptable based on AOAC’s
acceptability criteria (RSDr and RSDR < 2.00%).
Within-laboratory (AOAC) SDr and RSDr (repeatability) values (Tables 23 and
24) for fat content of high-fat sausage (0.1691, 0.6056%) and diluted high-fat sausage
(0.1738, 0.6439%) were similar to between-laboratory (CEM®) SDR and RSDR
(reproducibility) values for fat content of high-fat sausage (0.2889, 1.0370%) and diluted
high-fat sausage (0.2843, 1.0540%) samples. Within-laboratory RSDr and between-
laboratory RSDR values were within AOAC’s acceptability criteria of < 2.00% and were
therefore acceptable for fat analysis.
The data indicates that the CEM Smart Trac 5 System® performed well in
recovering moisture and fat from the sausage samples (see table on page 108). Using
AOAC method mean values as the reference values for moisture and fat in the sausage
samples, the percent recovery for moisture by the CEM Smart Trac 5 System® ranged
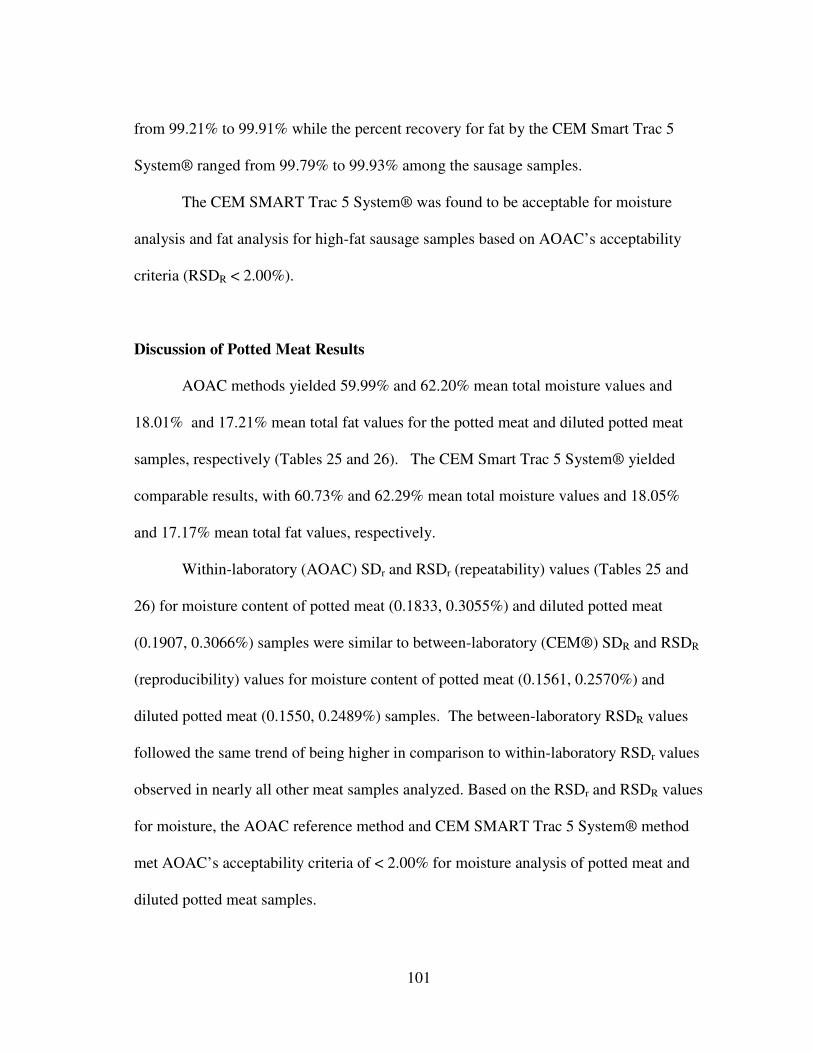
101
from 99.21% to 99.91% while the percent recovery for fat by the CEM Smart Trac 5
System® ranged from 99.79% to 99.93% among the sausage samples.
The CEM SMART Trac 5 System® was found to be acceptable for moisture
analysis and fat analysis for high-fat sausage samples based on AOAC’s acceptability
criteria (RSDR < 2.00%).
Discussion of Potted Meat Results
AOAC methods yielded 59.99% and 62.20% mean total moisture values and
18.01% and 17.21% mean total fat values for the potted meat and diluted potted meat
samples, respectively (Tables 25 and 26). The CEM Smart Trac 5 System® yielded
comparable results, with 60.73% and 62.29% mean total moisture values and 18.05%
and 17.17% mean total fat values, respectively.
Within-laboratory (AOAC) SDr and RSDr (repeatability) values (Tables 25 and
26) for moisture content of potted meat (0.1833, 0.3055%) and diluted potted meat
(0.1907, 0.3066%) samples were similar to between-laboratory (CEM®) SDR and RSDR
(reproducibility) values for moisture content of potted meat (0.1561, 0.2570%) and
diluted potted meat (0.1550, 0.2489%) samples. The between-laboratory RSDR values
followed the same trend of being higher in comparison to within-laboratory RSDr values
observed in nearly all other meat samples analyzed. Based on the RSDr and RSDR values
for moisture, the AOAC reference method and CEM SMART Trac 5 System® method
met AOAC’s acceptability criteria of < 2.00% for moisture analysis of potted meat and
diluted potted meat samples.
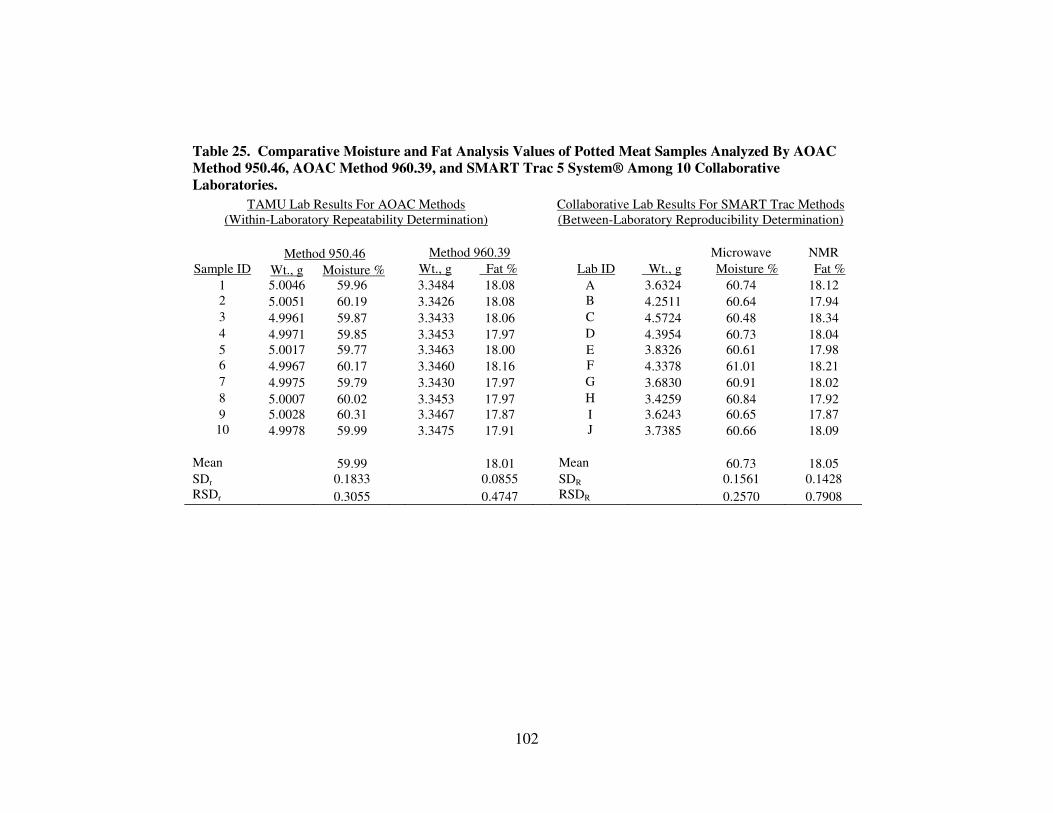
102
Table 25. Comparative Moisture and Fat Analysis Values of Potted Meat Samples Analyzed By AOAC
Method 950.46, AOAC Method 960.39, and SMART Trac 5 System® Among 10 Collaborative
Laboratories.
TAMU Lab Results For AOAC Methods
(Within-Laboratory Repeatability Determination)
Collaborative Lab Results For SMART Trac Methods
(Between-Laboratory Reproducibility Determination)
Method 950.46 Method 960.39 Microwave NMR
Sample ID Wt., g Moisture % Wt., g Fat % Lab ID Wt., g Moisture % Fat %
1 5.0046 59.96 3.3484 18.08 A 3.6324 60.74 18.12
2 5.0051 60.19 3.3426 18.08 B 4.2511 60.64 17.94
3 4.9961 59.87 3.3433 18.06 C 4.5724 60.48 18.34
4 4.9971 59.85 3.3453 17.97 D 4.3954 60.73 18.04
5 5.0017 59.77 3.3463 18.00 E 3.8326 60.61 17.98
6 4.9967 60.17 3.3460 18.16 F 4.3378 61.01 18.21
7 4.9975 59.79 3.3430 17.97 G 3.6830 60.91 18.02
8 5.0007 60.02 3.3453 17.97 H 3.4259 60.84 17.92
9 5.0028 60.31 3.3467 17.87 I 3.6243 60.65 17.87
10 4.9978 59.99 3.3475 17.91 J 3.7385 60.66 18.09
Mean 59.99 18.01 Mean 60.73 18.05
SDr 0.1833 0.0855 SDR 0.1561 0.1428
RSDr 0.3055 0.4747 RSDR 0.2570 0.7908
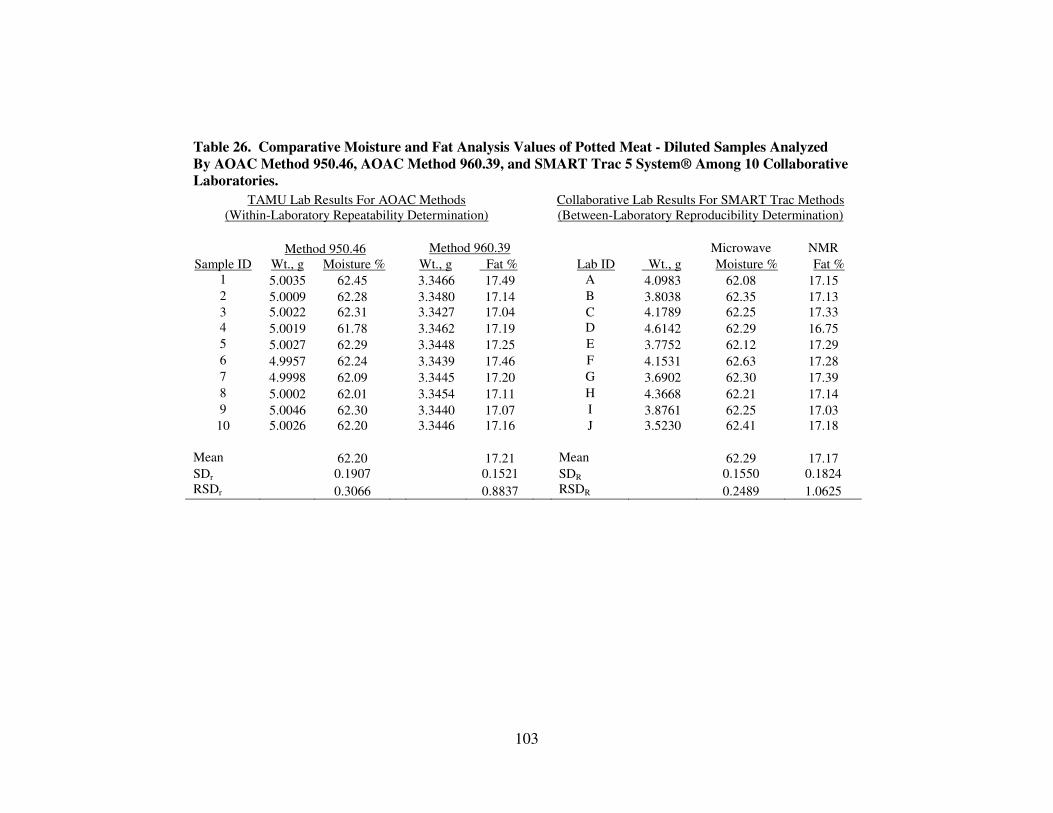
103
Table 26. Comparative Moisture and Fat Analysis Values of Potted Meat - Diluted Samples Analyzed
By AOAC Method 950.46, AOAC Method 960.39, and SMART Trac 5 System® Among 10 Collaborative
Laboratories.
TAMU Lab Results For AOAC Methods
(Within-Laboratory Repeatability Determination)
Collaborative Lab Results For SMART Trac Methods
(Between-Laboratory Reproducibility Determination)
Method 950.46 Method 960.39 Microwave NMR
Sample ID Wt., g Moisture % Wt., g Fat % Lab ID Wt., g Moisture % Fat %
1 5.0035 62.45 3.3466 17.49 A 4.0983 62.08 17.15
2 5.0009 62.28 3.3480 17.14 B 3.8038 62.35 17.13
3 5.0022 62.31 3.3427 17.04 C 4.1789 62.25 17.33
4 5.0019 61.78 3.3462 17.19 D 4.6142 62.29 16.75
5 5.0027 62.29 3.3448 17.25 E 3.7752 62.12 17.29
6 4.9957 62.24 3.3439 17.46 F 4.1531 62.63 17.28
7 4.9998 62.09 3.3445 17.20 G 3.6902 62.30 17.39
8 5.0002 62.01 3.3454 17.11 H 4.3668 62.21 17.14
9 5.0046 62.30 3.3440 17.07 I 3.8761 62.25 17.03
10 5.0026 62.20 3.3446 17.16 J 3.5230 62.41 17.18
Mean 62.20 17.21 Mean 62.29 17.17
SDr 0.1907 0.1521 SDR 0.1550 0.1824
RSDr 0.3066 0.8837 RSDR 0.2489 1.0625
104
Within-laboratory (AOAC) SDr and RSDr (repeatability) values (Tables 25 and
26) for fat content of potted meat (0.0855, 0.4747%) and diluted potted meat (0.1521,
0.8837%) were similar to between-laboratory (CEM®) SDR and RSDR (reproducibility)
values for potted meat (0.1428, 0.7908%) and diluted potted meat (0.1824, 1.0625%)
samples. The between-laboratory RSDR values followed the same trend of being higher
in comparison to within-laboratory RSDr values observed in nearly all other meat
samples analyzed. Based on the RSDr and RSDR values for fat, the AOAC reference
method and CEM SMART Trac 5 System® method met AOAC’s acceptability criteria
of < 2.00% for fat analysis of potted meat and diluted potted meat samples.
The data indicates that the CEM SMART Trac 5 System® performed well in
recovering moisture and fat from the potted meat samples (see table on page 108).
Using AOAC method mean values as the reference values for moisture and fat in the
potted meat samples, the percent recovery for moisture by the CEM SMART Trac 5
System® ranged from 100.14% to 101.23% while the percent recovery for fat by the
CEM SMART Trac 5 System® ranged from 99.77% to 100.22% for the potted meat and
diluted potted meat samples.
The CEM SMART Trac 5 System® was found to be acceptable for moisture
analysis and fat analysis for potted meat samples based on AOAC’s acceptability criteria
(RSDR <2.00%).
Discussion of Overall Results
A summary of the statistical analysis results is provided in Tables 27 and 28.
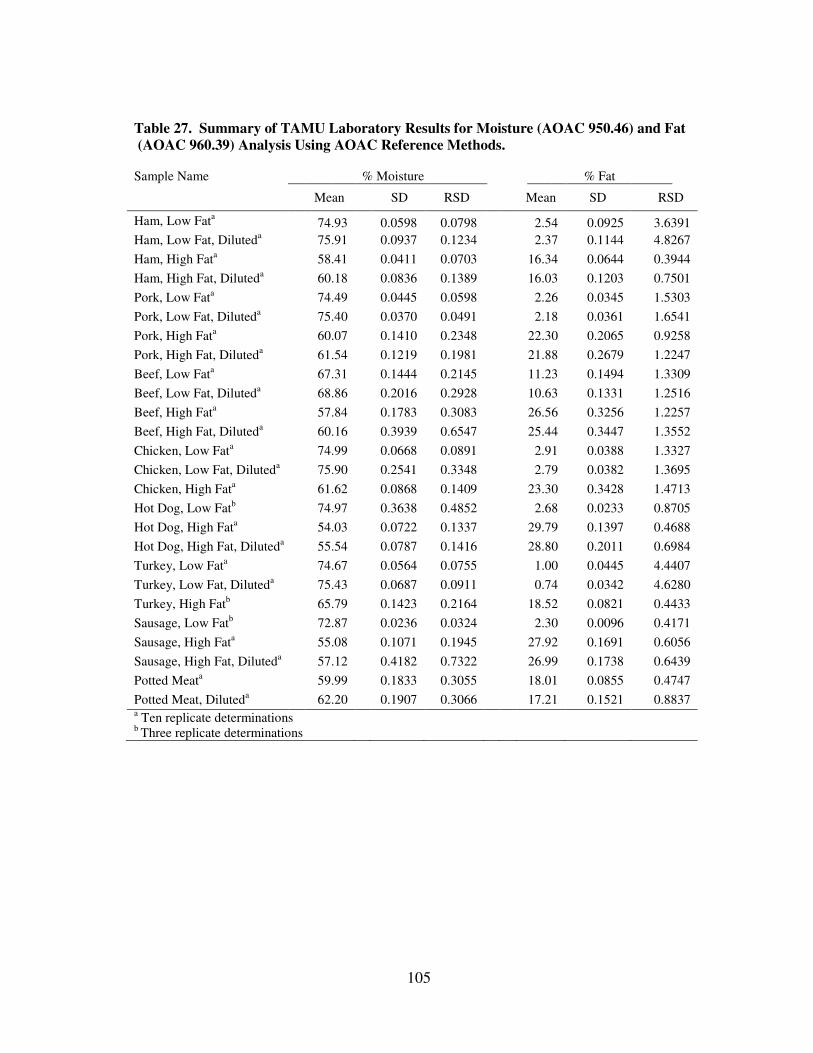
105
Table 27. Summary of TAMU Laboratory Results for Moisture (AOAC 950.46) and Fat
(AOAC 960.39) Analysis Using AOAC Reference Methods.
Sample Name % Moisture % Fat
Mean SD RSD Mean SD RSD
Ham, Low Fata 74.93 0.0598 0.0798 2.54 0.0925 3.6391
Ham, Low Fat, Diluteda 75.91 0.0937 0.1234 2.37 0.1144 4.8267
Ham, High Fata 58.41 0.0411 0.0703 16.34 0.0644 0.3944
Ham, High Fat, Diluteda 60.18 0.0836 0.1389 16.03 0.1203 0.7501
Pork, Low Fata 74.49 0.0445 0.0598 2.26 0.0345 1.5303
Pork, Low Fat, Diluteda 75.40 0.0370 0.0491 2.18 0.0361 1.6541
Pork, High Fata 60.07 0.1410 0.2348 22.30 0.2065 0.9258
Pork, High Fat, Diluteda 61.54 0.1219 0.1981 21.88 0.2679 1.2247
Beef, Low Fata 67.31 0.1444 0.2145 11.23 0.1494 1.3309
Beef, Low Fat, Diluteda 68.86 0.2016 0.2928 10.63 0.1331 1.2516
Beef, High Fata 57.84 0.1783 0.3083 26.56 0.3256 1.2257
Beef, High Fat, Diluteda 60.16 0.3939 0.6547 25.44 0.3447 1.3552
Chicken, Low Fata 74.99 0.0668 0.0891 2.91 0.0388 1.3327
Chicken, Low Fat, Diluteda 75.90 0.2541 0.3348 2.79 0.0382 1.3695
Chicken, High Fata 61.62 0.0868 0.1409 23.30 0.3428 1.4713
Hot Dog, Low Fatb 74.97 0.3638 0.4852 2.68 0.0233 0.8705
Hot Dog, High Fata 54.03 0.0722 0.1337 29.79 0.1397 0.4688
Hot Dog, High Fat, Diluteda 55.54 0.0787 0.1416 28.80 0.2011 0.6984
Turkey, Low Fata 74.67 0.0564 0.0755 1.00 0.0445 4.4407
Turkey, Low Fat, Diluteda 75.43 0.0687 0.0911 0.74 0.0342 4.6280
Turkey, High Fatb 65.79 0.1423 0.2164 18.52 0.0821 0.4433
Sausage, Low Fatb 72.87 0.0236 0.0324 2.30 0.0096 0.4171
Sausage, High Fata 55.08 0.1071 0.1945 27.92 0.1691 0.6056
Sausage, High Fat, Diluteda 57.12 0.4182 0.7322 26.99 0.1738 0.6439
Potted Meata 59.99 0.1833 0.3055 18.01 0.0855 0.4747
Potted Meat, Diluteda 62.20 0.1907 0.3066 17.21 0.1521 0.8837
a Ten replicate determinations
b Three replicate determinations
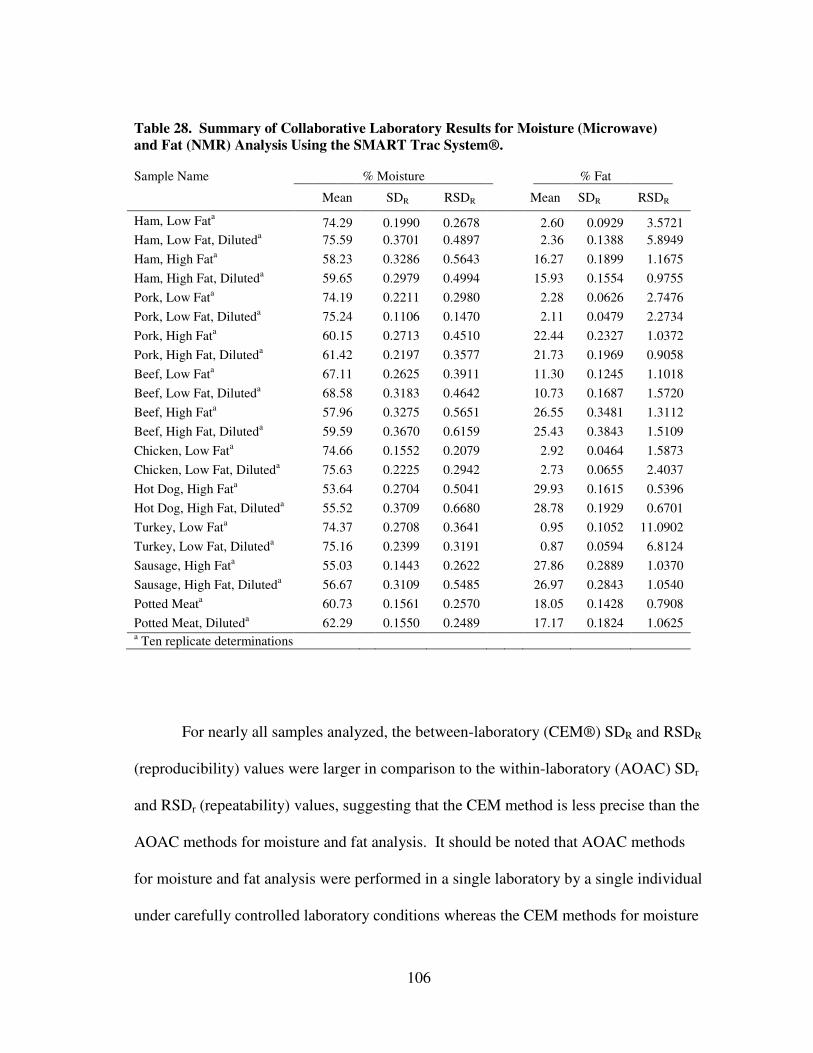
106
Table 28. Summary of Collaborative Laboratory Results for Moisture (Microwave)
and Fat (NMR) Analysis Using the SMART Trac System®.
Sample Name % Moisture % Fat
Mean SDR RSDR Mean SDR RSDR
Ham, Low Fata 74.29 0.1990 0.2678 2.60 0.0929 3.5721
Ham, Low Fat, Diluteda 75.59 0.3701 0.4897 2.36 0.1388 5.8949
Ham, High Fata 58.23 0.3286 0.5643 16.27 0.1899 1.1675
Ham, High Fat, Diluteda 59.65 0.2979 0.4994 15.93 0.1554 0.9755
Pork, Low Fata 74.19 0.2211 0.2980 2.28 0.0626 2.7476
Pork, Low Fat, Diluteda 75.24 0.1106 0.1470 2.11 0.0479 2.2734
Pork, High Fata 60.15 0.2713 0.4510 22.44 0.2327 1.0372
Pork, High Fat, Diluteda 61.42 0.2197 0.3577 21.73 0.1969 0.9058
Beef, Low Fata 67.11 0.2625 0.3911 11.30 0.1245 1.1018
Beef, Low Fat, Diluteda 68.58 0.3183 0.4642 10.73 0.1687 1.5720
Beef, High Fata 57.96 0.3275 0.5651 26.55 0.3481 1.3112
Beef, High Fat, Diluteda 59.59 0.3670 0.6159 25.43 0.3843 1.5109
Chicken, Low Fata 74.66 0.1552 0.2079 2.92 0.0464 1.5873
Chicken, Low Fat, Diluteda 75.63 0.2225 0.2942 2.73 0.0655 2.4037
Hot Dog, High Fata 53.64 0.2704 0.5041 29.93 0.1615 0.5396
Hot Dog, High Fat, Diluteda 55.52 0.3709 0.6680 28.78 0.1929 0.6701
Turkey, Low Fata 74.37 0.2708 0.3641 0.95 0.1052 11.0902
Turkey, Low Fat, Diluteda 75.16 0.2399 0.3191 0.87 0.0594 6.8124
Sausage, High Fata 55.03 0.1443 0.2622 27.86 0.2889 1.0370
Sausage, High Fat, Diluteda 56.67 0.3109 0.5485 26.97 0.2843 1.0540
Potted Meata 60.73 0.1561 0.2570 18.05 0.1428 0.7908
Potted Meat, Diluteda 62.29 0.1550 0.2489 17.17 0.1824 1.0625
a Ten replicate determinations
For nearly all samples analyzed, the between-laboratory (CEM®) SDR and RSDR
(reproducibility) values were larger in comparison to the within-laboratory (AOAC) SDr
and RSDr (repeatability) values, suggesting that the CEM method is less precise than the
AOAC methods for moisture and fat analysis. It should be noted that AOAC methods
for moisture and fat analysis were performed in a single laboratory by a single individual
under carefully controlled laboratory conditions whereas the CEM methods for moisture
107
and fat analysis were performed in multiple laboratories with different CEM SMART
Trac 5 Systems® and by multiple analysts among different laboratory conditions.
Lower precision would likely result from such variations. As the data indicates, the CEM
SMART Trac 5 System® was found to be acceptable for moisture analysis for all
samples analyzed and acceptable for fat analysis for meat samples containing more than
3% fat based on AOAC’s acceptability criteria (RSDR < 2.00%). The CEM SMART
Trac 5 System® was found not to be acceptable for fat analysis of meat samples
containing less than 3% fat (i.e. low-fat ham, low-fat pork, low-fat turkey).
The percent recovery (% Recovery) for moisture and fat reported in Table 29 was
determined by comparing the overall mean of the collaborative laboratory values
(obtained from CEM Smart Trac 5 System® analysis) to the reference values (obtained
from AOAC Methods 950.46 and 960.39). The recovery for moisture was excellent for
all meat sample types analyzed and ranged from 99.05% to 101.23%. Recovery for fat
was more variable, ranging from 95.00% to 117.57%, with the greater variation due to
some sample types containing very low levels of fat (i.e. low-fat ham, low-fat turkey).
Overall review of the results indicates that the CEM Smart Trac 5 System®
compares favorably to the AOAC methods for moisture and fat determination. The
CEM Smart Trac 5 System® would be suitable for the rapid determination of moisture
and fat in a variety of commercially produced raw and processed meat and poultry
products. Statistical analysis confirmed the within-laboratory repeatability and
precision qualities of AOAC methods and provided a baseline for comparing the
between-laboratory reproducibility and precision potential of the CEM Smart Trac 5
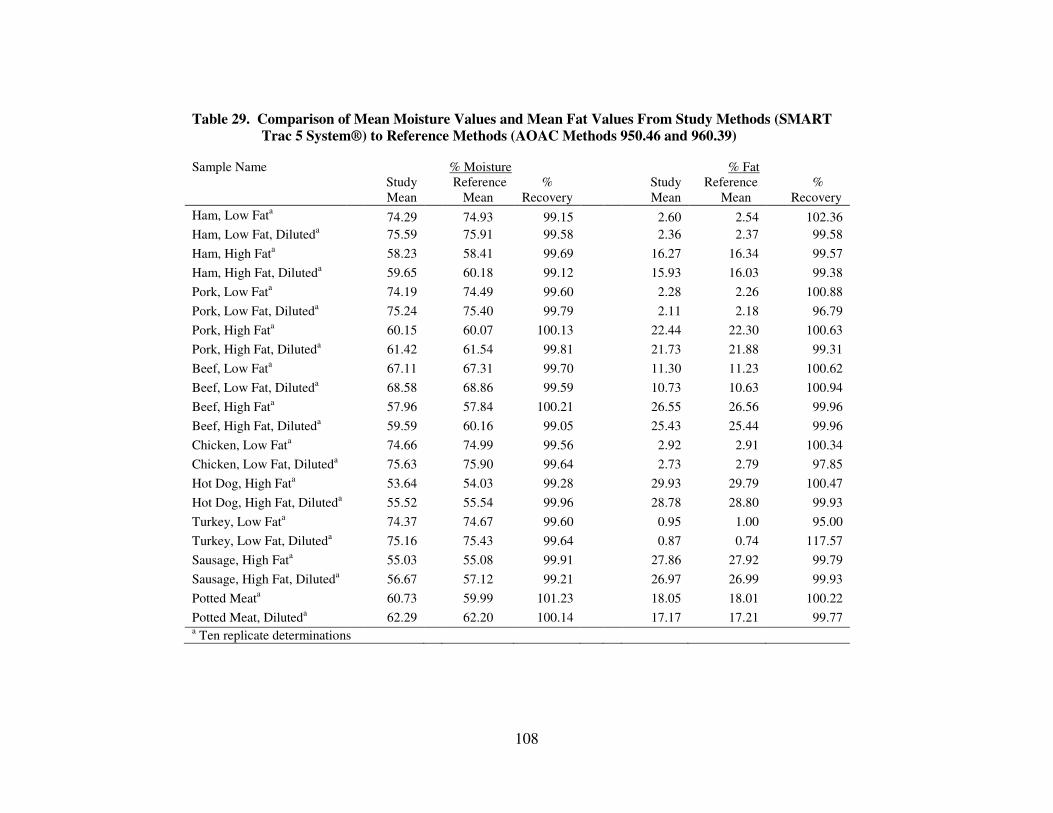
108
Table 29. Comparison of Mean Moisture Values and Mean Fat Values From Study Methods (SMART
Trac 5 System®) to Reference Methods (AOAC Methods 950.46 and 960.39)
Sample Name % Moisture % Fat
Study
Mean
Reference
Mean
%
Recovery
Study
Mean
Reference
Mean
%
Recovery
Ham, Low Fata 74.29 74.93 99.15 2.60 2.54 102.36
Ham, Low Fat, Diluteda 75.59 75.91 99.58 2.36 2.37 99.58
Ham, High Fata 58.23 58.41 99.69 16.27 16.34 99.57
Ham, High Fat, Diluteda 59.65 60.18 99.12 15.93 16.03 99.38
Pork, Low Fata 74.19 74.49 99.60 2.28 2.26 100.88
Pork, Low Fat, Diluteda 75.24 75.40 99.79 2.11 2.18 96.79
Pork, High Fata 60.15 60.07 100.13 22.44 22.30 100.63
Pork, High Fat, Diluteda 61.42 61.54 99.81 21.73 21.88 99.31
Beef, Low Fata 67.11 67.31 99.70 11.30 11.23 100.62
Beef, Low Fat, Diluteda 68.58 68.86 99.59 10.73 10.63 100.94
Beef, High Fata 57.96 57.84 100.21 26.55 26.56 99.96
Beef, High Fat, Diluteda 59.59 60.16 99.05 25.43 25.44 99.96
Chicken, Low Fata 74.66 74.99 99.56 2.92 2.91 100.34
Chicken, Low Fat, Diluteda 75.63 75.90 99.64 2.73 2.79 97.85
Hot Dog, High Fata 53.64 54.03 99.28 29.93 29.79 100.47
Hot Dog, High Fat, Diluteda 55.52 55.54 99.96 28.78 28.80 99.93
Turkey, Low Fata 74.37 74.67 99.60 0.95 1.00 95.00
Turkey, Low Fat, Diluteda 75.16 75.43 99.64 0.87 0.74 117.57
Sausage, High Fata 55.03 55.08 99.91 27.86 27.92 99.79
Sausage, High Fat, Diluteda 56.67 57.12 99.21 26.97 26.99 99.93
Potted Meata 60.73 59.99 101.23 18.05 18.01 100.22
Potted Meat, Diluteda 62.29 62.20 100.14 17.17 17.21 99.77
a Ten replicate determinations
109
System®. For moisture analysis, the within-laboratory (AOAC) precision results (RSDr)
and between-laboratory (CEM®) precision results (RSDR) were acceptable for all
samples evaluated based on AOAC’s acceptability criteria (RSD < 2.00%). For fat
analysis, the within-laboratory (AOAC) precision results (RSDr) and between-laboratory
(CEM®) precision results (RSDR) were acceptable for high-fat ham, diluted high-fat
ham, high-fat pork, diluted high-fat pork, low-fat beef, diluted low-fat beef, high-fat
beef, diluted high-fat beef, low-fat chicken, high-fat frankfurter, diluted high-fat
frankfurter, high-fat sausage, diluted high-fat sausage, potted meat, and diluted potted
meat samples based on AOAC’s acceptability criteria (RSD <2.00%).
Samples containing very small amounts of fat (< 3% fat) were found to yield
higher relative standard deviation (RSD) results, and therefore lower precision, for
within-laboratory (RSDr) and between-laboratory (RSDR) fat analysis. The samples that
yielded RSDr and/or RSDR values that exceeded AOAC’s acceptability criteria of
<2.00% included: low-fat ham, diluted low-fat ham, low-fat pork, diluted low-fat pork,
diluted low-fat chicken, low-fat turkey, and diluted low-fat turkey samples.
Although RSDr and RSDR values were calculated to determine if the method met
the acceptability criteria for each meat sample type, it is interesting to note that the
difference between the highest value and lowest value for fat results in a high fat sample
set (i.e. AOAC fat results for high fat ham) yields a greater value than the difference
between the highest value and lowest value for fat results in the corresponding low fat
sample set (i.e. AOAC fat results for low fat ham). For example, the difference between
the high and low values for fat analysis using the AOAC method for high fat ham was
110
0.50 whereas the difference between the high and low values for fat analysis using the
AOAC method for low fat ham was 0.24. The same trend was observed for fat values
obtained using the CEM SMART Trac System® for fat analysis. This trend would
suggest that although RSDr and RSDR values for fat analysis of low fat samples exceed
the 2.00% limit for acceptability, the range in which the individual fat results are being
measured is much tighter for low fat samples compared to high fat samples.
When analyzing a meat sample using AOAC methods, the CEM Smart Trac 5
System® methods, or any other method available, it is important to collect and prepare
samples in a manner that provides a homogenous, uniform, and representative portion of
the larger lot and to handle samples and equipment with care to achieve the most
accurate and reliable results for the selected method. One of the most notable
observations made upon reviewing the statistical results of this study data was that
samples that have a very small amount of fat (<3% fat) have the largest relative standard
deviation (RSD) in comparison to meat samples that have a larger amount of fat (>10%
fat). For fat analysis methods used in this study (AOAC and CEM®), the larger RSDr
and RSDR values observed in the low-fat samples were primarily due to the very small
amount of fat in the samples, in which small variations in the sample or procedure could
significantly impact data results. In addition, the inherent variability of weighing minute
amounts of fat to the fourth decimal place or possible reduced fat extraction efficiency
associated with the AOAC extraction method may have also contributed to higher RSDr
values for fat analysis in low-fat samples. For the CEM® method, higher RSDR values
for fat analysis likely resulted, in part, from the variation among different laboratory
111
conditions and multiple individuals performing analyses among the collaborative
laboratories.
When analyzing the fat content of very low-fat products, it is critical that the
sample be homogenized and great care be taken in the handling of the sample through
each step of the analytical procedure, as small deviations can results in large data gaps.
Such care should be taken no matter which method is selected for analysis.
112
CHAPTER V
SUMMARY
Analyses for the determination of moisture, fat, protein, salt, and other analytes
in meat and poultry products are important for evaluating raw material quality, ensuring
process control and finished product composition, and meeting regulatory compliance in
meat plant operations. Such analyses are also valuable for scientists in governmental
agencies and academia conducting food related research.
Standard methods of analysis are universally accepted and provide a known
degree of accuracy and precision. However, some standard methods of analysis of meat
and poultry products can be time- or energy-intensive, require highly trained personnel,
involve the use of harmful or toxic chemicals, or generate wastes that have expensive
disposal fees. Other methods of analysis may not provide the same degree of accuracy,
but may have greater ease of use or require less time or less training of employees.
Rapid analytical methods with the potential to produce results with the same
precision and accuracy as standard methods would be of great benefit to researchers,
plant operations, governmental agencies, academia, and other entities. This study
evaluated the accuracy and precision of the CEM Smart Trac 5 System® for rapid
determination of moisture and fat in meat products in comparison to the standard
methods of analysis (AOAC official methods 950.46 and 960.39, respectively). An
AOAC collaborative study involving 10 laboratories representing private industry,
government agencies, and academia was conducted to determine if the CEM Smart Trac
113
5 System®, which performs rapid analyses of moisture and fat, is comparable to
universally accepted standard methods of analysis. A variety of raw and processed meat
products representing the primary meat categories of beef, pork, chicken, and turkey
were selected for analysis in this study.
Overall review of the results and data analysis indicated that the CEM Smart
Trac 5 System® compares favorably with the AOAC methods for moisture and fat
determination and would be suitable for the rapid determination of moisture and fat in a
variety of commercially produced raw and processed meat and poultry products.
Statistical analysis confirmed the within-laboratory repeatability qualities of AOAC
methods and provided a baseline for comparing the between-laboratory reproducibility
potential of the CEM Smart Trac 5 System®. For all samples evaluated, the within-
laboratory (AOAC) RSDr (repeatability) results and between-laboratory (CEM®) RSDR
(reproducibility) results for moisture met AOAC acceptability criteria (RSD < 2.00%).
With the exception of meat products containing very small amounts of fat (i.e. low-fat
ham, low-fat pork, low-fat turkey), the within-laboratory (AOAC) and between-
laboratory (CEM®) results for fat met AOAC’s acceptability criteria (RSD < 2.00%).
114
CHAPTER VI
CONCLUSIONS
The data from this study indicate that the moisture and fat results obtained from
the CEM Smart Trac 5 System® compare favorably to moisture and fat results obtained
by AOAC methods. We conclude that the CEM Smart Trac 5 System® would be
suitable for determining total moisture and fat in a variety of commercially produced raw
and processed meat and poultry products. This method offers similar accuracy and
precision of moisture and fat results in comparison to AOAC methods, with the
additional benefit of producing results more rapidly, with greater ease of use and less
personnel training, and without the use of harmful or toxic chemicals or wastes.
Therefore it is our recommendation that the CEM Smart Trac 5 System® be accepted as
an AOAC-approved official method of analysis for moisture and fat in meat and meat
products.
115
LITERATURE CITED
Anderson S. 2007. Determination of fat, moisture, and protein in meat and meat
products by using the FOSS FoodScan™ near-infrared spectrophotometer with FOSS
artificial neural network calibration model and associated database: collaborative study.
J AOAC Int. 90: 1073-83.
AOAC Official Methods of Analysis – Appendix D: Guidelines for collaborative study
procedures to validate characteristics of a method of analysis. AOAC Int: 2002.
Available from
http://www.aoac.org/Official_Methods/Collaborative_Study_Validation_Guidelines.pdf
AOAC Official Method 950.46 - Moisture in meat. AOAC Int; 2006a. Available from
www.aoac.org/omarev1/950_46.pdf
AOAC Official Method 976.21 – Fat (crude) in meat: rapid specific gravity method.
AOAC Int; 2006b. Available from www.aoac.org/omarev1/976_21.pdf
AOAC Official Method 985.14 – Moisture in meat and poultry products: rapid
microwave drying. AOAC Int; 2006c. Available from
www.aoac.org/omarev1/985_14.pdf
AOAC Official Method 985.15 – Fat (crude) in meat and poultry products: rapid
microwave-solvent extraction method. AOAC Int; 2006d. Available from
www.aoac.org/omarev1/985_15.pdf
Bradley RL. 2003. Moisture and total solids analysis. In: Nielsen SS, editor. Food
analysis. 3rd
ed. New York, New York: Kluwer Academic. p 81-90.
Castera A. 1995. Extraction of lipids for analytical purposes. In: Sebedio JL, Perkins
EG, editors. New trends in lipid and lipoprotein analyses. Champaign, Illinois. AOCS
Press. p 10-16.
Chandrasekar R. 2001. Determination of crude fat in meat by supercritical fluid
extraction: direct method. J AOAC Int. 84: 466-71.
Cornejo F, Chinachoti P. 2003. NMR in foods: opportunity and challenges. In: Belton
PS, Gil AM, Webb GA, Rutledge D, editors. Magnetic resonance in food science: latest
developments. Cambridge, United Kingdom: Athenaeum Press Ltd. p 25-37.
116
Foegeding EA, Lanier TC, Hultin HO. 1996. Characteristics of Edible Muscle Tissue.
In: Fennema OR, editor. Food Chemistry. 3rd
ed. New York, New York: Marcel
Dekker, Inc. p 879-942.
Folch J, Lees M, Stanley GHS. 1957. A simple method for the isolation and
purification of total lipids from animal tissues. J Biol Chem. 226: 497-509.
Food Engineering Magazine (Food Eng Mag) [Internet]. Engineering R&D: In-line
analysis with GMS. 2004 [Accessed 2012 Sept 25]. Available from
http://www.foodengineeringmag.com/articles/print/engineering-r-d-br-in-line-analysis-
with-gms).
Honikel KO. 2009. Composition and calories. In: Nollet LML, Toldra F, editors.
Handbook of processed meats and poultry analysis. Boca Raton, Florida: CRC Press
Taylor and Francis Group. p 195-214.
Iverson SJ, Lang SLC, Cooper MH. 2001. Comparison of the Bligh and Dyer and
Folch methods for total lipid determination in a broad range of marine tissue. Lipids 36:
1283-7.
King JM, Min DB. 1998. Analysis of fatty acids. In: Wetzel DLB, Charalambous G,
editors. Instrumental methods in food and beverage analysis. Amsterdam, The
Netherlands: Elsevier. p 195-223.
King JW. 2001. Supercritical fluid extraction: present status and prospects. Grasas y
Aceites. 53: 8-21.
Leffler TP, Moser CR, McManus BJ, Urh JJ, Keeton JT, Claflin A. 2008.
Determination of moisture and fat in meats by microwave and nuclear magnetic
resonance analysis: collaborative study. J AOAC Int. 91: 802-10.
Mann N, Sinclair A, Watson M, O’Dea K. 1991. Evaluation of rapid fat determination
in meats using the CEM automated analyzer. Food Australia. 43: 67-69.
Min DB, Boff JM. 2003. Crude fat analysis. In: Nielsen SS, editor. Food analysis. 3rd
ed. New York, New York: Kluwer Academic. p 113-129.
Pettinati JD, Swift CE. 1976. Meat and meat products: rapid determination of fat in
meat and meat products by Foss-let solvent extraction and density measurement. J
AOAC Int. 58: 1182-7.
Romans JR, Costello WJ, Carlson CW, Greaser ML, Jones KW. 2001. The meat we
eat. 14th
ed. Danville, Illinois: Interstate Publishers, Inc. 1112 p.
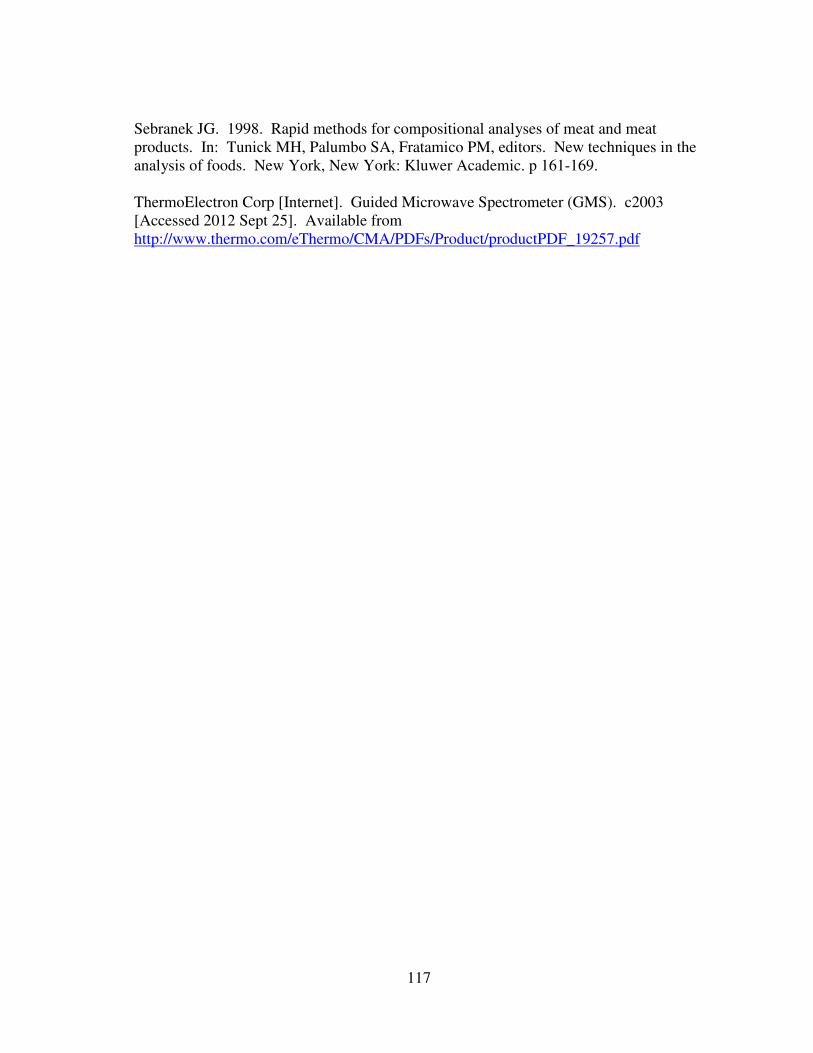
117
Sebranek JG. 1998. Rapid methods for compositional analyses of meat and meat
products. In: Tunick MH, Palumbo SA, Fratamico PM, editors. New techniques in the
analysis of foods. New York, New York: Kluwer Academic. p 161-169.
ThermoElectron Corp [Internet]. Guided Microwave Spectrometer (GMS). c2003
[Accessed 2012 Sept 25]. Available from
http://www.thermo.com/eThermo/CMA/PDFs/Product/productPDF_19257.pdf
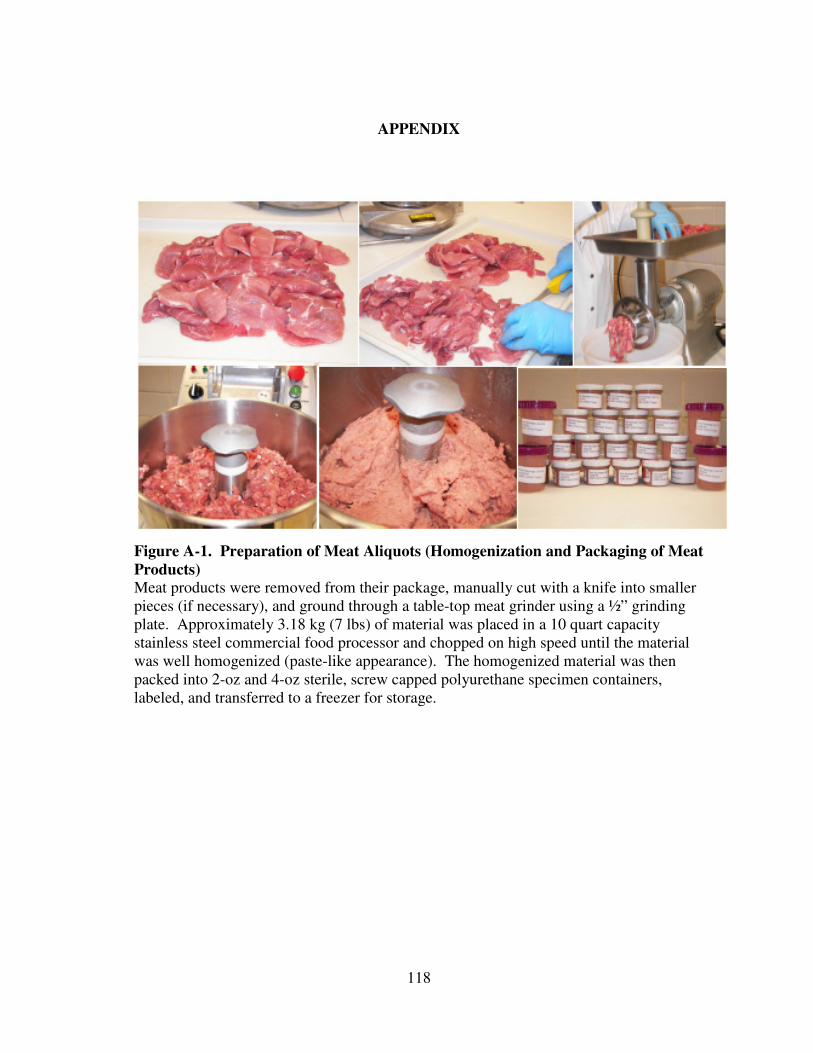
118
APPENDIX
Figure A-1. Preparation of Meat Aliquots (Homogenization and Packaging of Meat
Products) Meat products were removed from their package, manually cut with a knife into smaller
pieces (if necessary), and ground through a table-top meat grinder using a ½” grinding
plate. Approximately 3.18 kg (7 lbs) of material was placed in a 10 quart capacity
stainless steel commercial food processor and chopped on high speed until the material
was well homogenized (paste-like appearance). The homogenized material was then
packed into 2-oz and 4-oz sterile, screw capped polyurethane specimen containers,
labeled, and transferred to a freezer for storage.
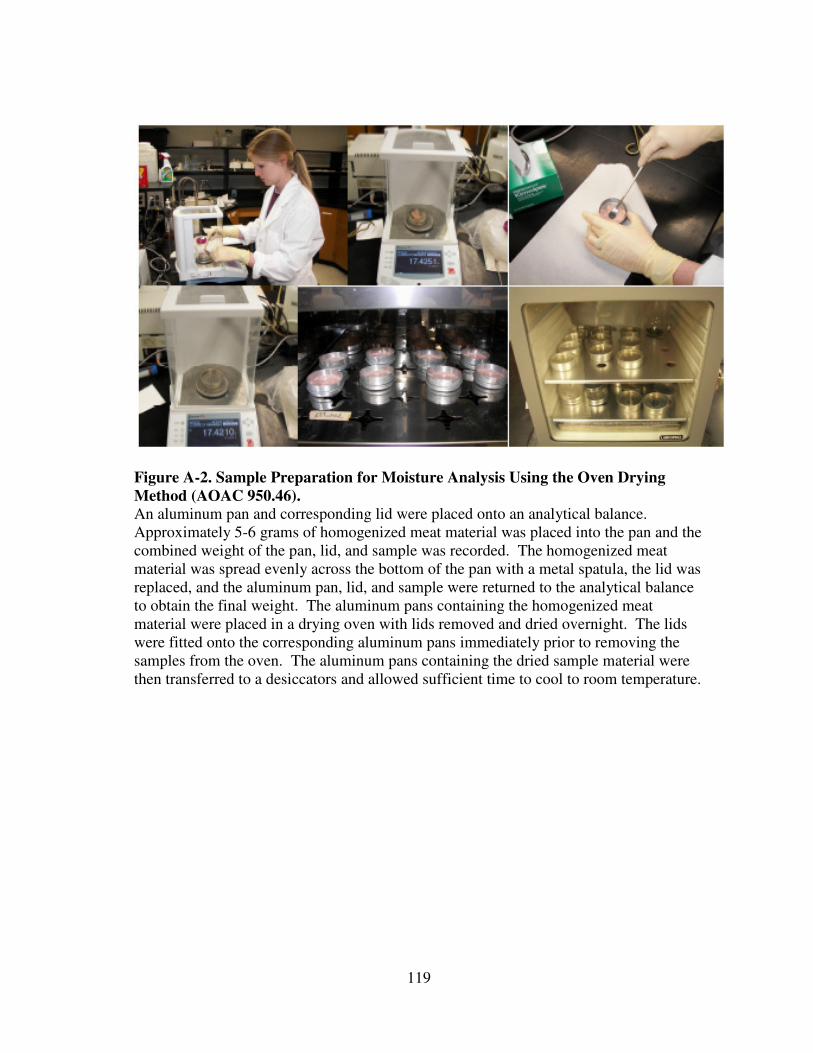
119
Figure A-2. Sample Preparation for Moisture Analysis Using the Oven Drying
Method (AOAC 950.46). An aluminum pan and corresponding lid were placed onto an analytical balance.
Approximately 5-6 grams of homogenized meat material was placed into the pan and the
combined weight of the pan, lid, and sample was recorded. The homogenized meat
material was spread evenly across the bottom of the pan with a metal spatula, the lid was
replaced, and the aluminum pan, lid, and sample were returned to the analytical balance
to obtain the final weight. The aluminum pans containing the homogenized meat
material were placed in a drying oven with lids removed and dried overnight. The lids
were fitted onto the corresponding aluminum pans immediately prior to removing the
samples from the oven. The aluminum pans containing the dried sample material were
then transferred to a desiccators and allowed sufficient time to cool to room temperature.
120
Figure A-3. Sample Preparation for Fat Analysis Using the Soxhlet Extraction
Method (AOAC 960.39). Approximately 3-5 g of homogenized meat material was placed into a disposable pan
and the weight recorded. Approximately 3-5 g of laboratory grade sand was added to
the pan, mixed into the homogenized meat material using a glass rod, and the mixture
spread into an even layer on the bottom of the pan. The meat sample was then dried in a
drying oven and desiccated to room temperature (picture not shown). The disposable
pan containing the dried meat material, sand, and glass rod was folded into thirds with
the ends folded upward to prevent escape of the pan contents. The folded pan was then
placed in a cellulose thimble and transferred to the Soxhlet portion of the fat extraction
system. The fully assembled Soxhlet extraction system (bottom right) is comprised of:
a heating mantle, a 250 mL glass flask containing 150 mL of petroleum ether and porous
boiling chips, a Soxhlet, and a condenser connected to tubing in which cool running
water flows through continuously.
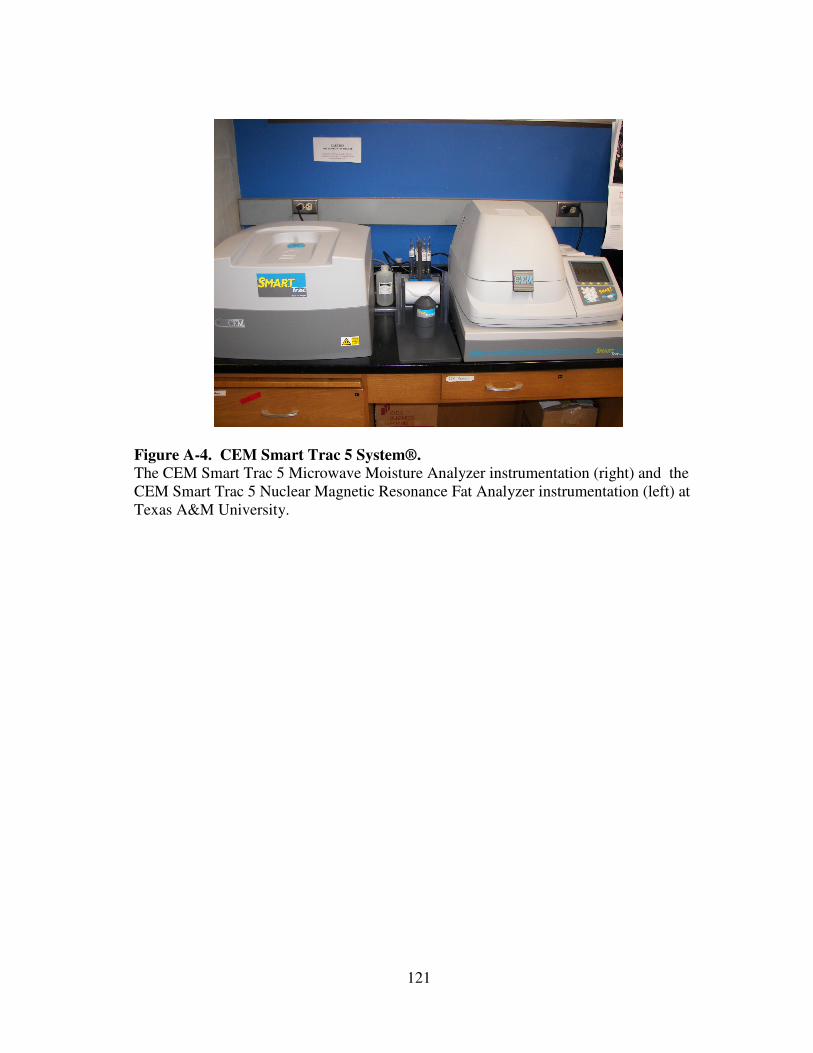
121
Figure A-4. CEM Smart Trac 5 System®.
The CEM Smart Trac 5 Microwave Moisture Analyzer instrumentation (right) and the
CEM Smart Trac 5 Nuclear Magnetic Resonance Fat Analyzer instrumentation (left) at
Texas A&M University.
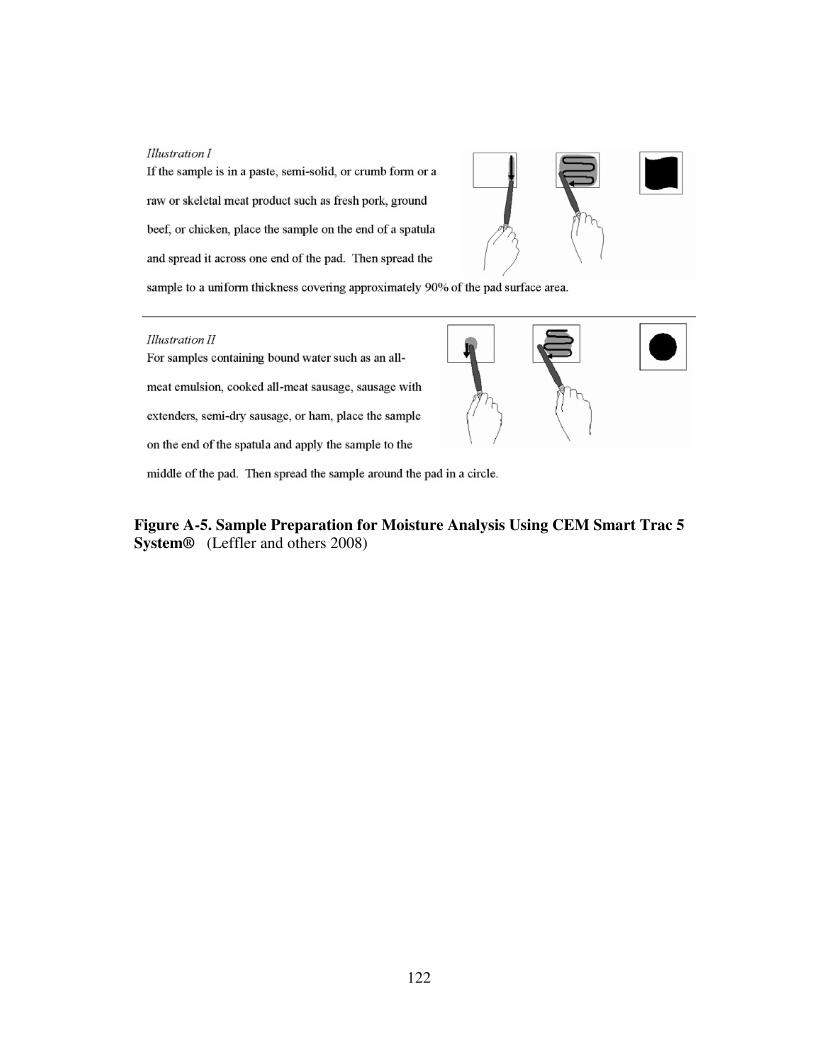
122
Figure A-5. Sample Preparation for Moisture Analysis Using CEM Smart Trac 5
System® (Leffler and others 2008)
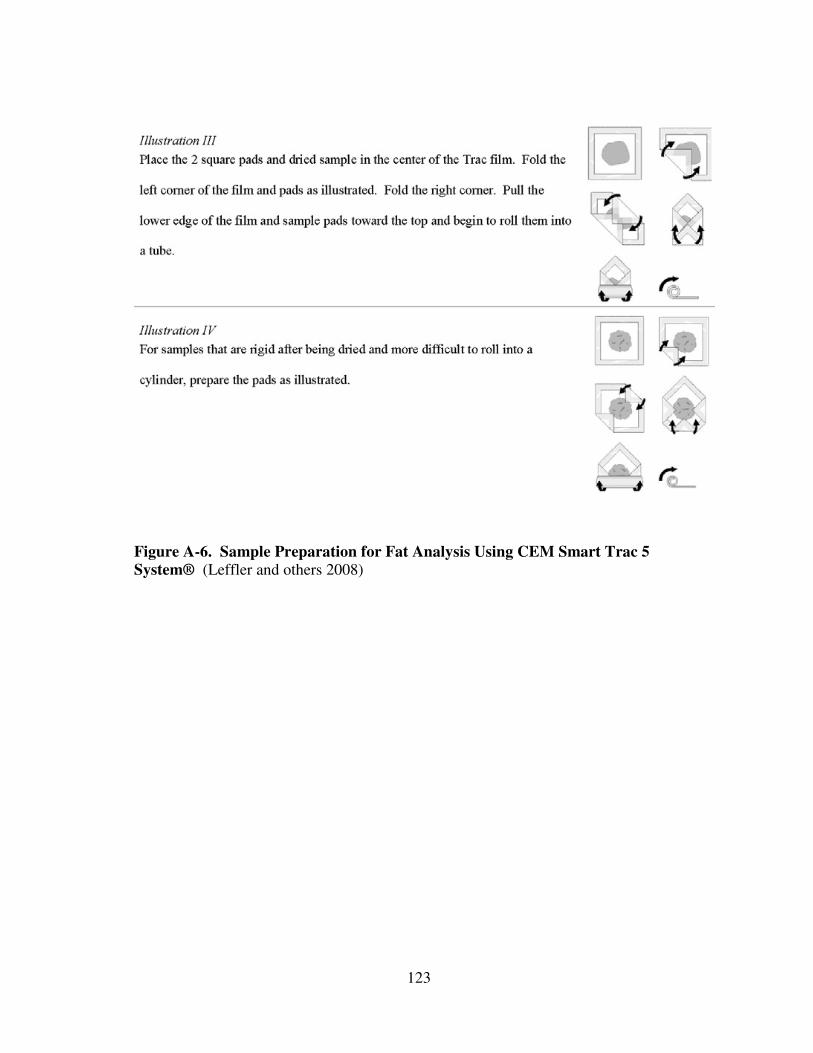
123
Figure A-6. Sample Preparation for Fat Analysis Using CEM Smart Trac 5
System® (Leffler and others 2008)
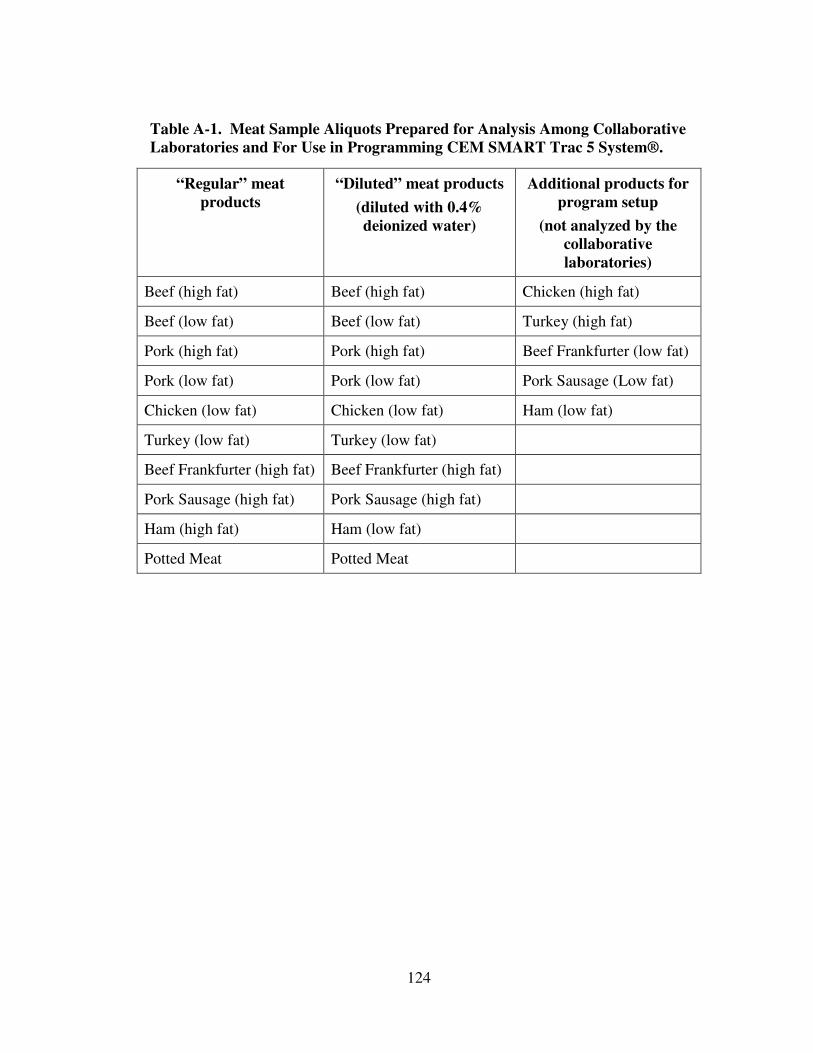
124
Table A-1. Meat Sample Aliquots Prepared for Analysis Among Collaborative
Laboratories and For Use in Programming CEM SMART Trac 5 System®.
“Regular” meat
products
“Diluted” meat products
(diluted with 0.4%
deionized water)
Additional products for
program setup
(not analyzed by the
collaborative
laboratories)
Beef (high fat) Beef (high fat) Chicken (high fat)
Beef (low fat) Beef (low fat) Turkey (high fat)
Pork (high fat) Pork (high fat) Beef Frankfurter (low fat)
Pork (low fat) Pork (low fat) Pork Sausage (Low fat)
Chicken (low fat) Chicken (low fat) Ham (low fat)
Turkey (low fat) Turkey (low fat)
Beef Frankfurter (high fat) Beef Frankfurter (high fat)
Pork Sausage (high fat) Pork Sausage (high fat)
Ham (high fat) Ham (low fat)
Potted Meat Potted Meat
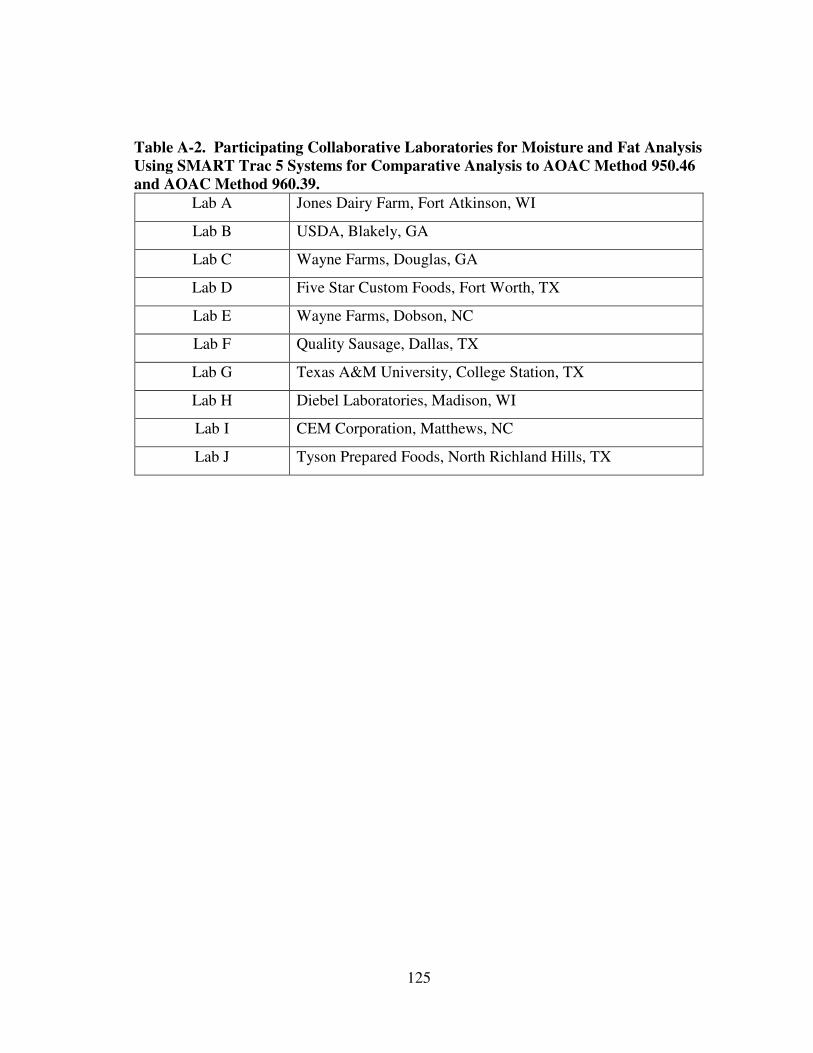
125
Table A-2. Participating Collaborative Laboratories for Moisture and Fat Analysis
Using SMART Trac 5 Systems for Comparative Analysis to AOAC Method 950.46
and AOAC Method 960.39.
Lab A Jones Dairy Farm, Fort Atkinson, WI
Lab B USDA, Blakely, GA
Lab C Wayne Farms, Douglas, GA
Lab D Five Star Custom Foods, Fort Worth, TX
Lab E Wayne Farms, Dobson, NC
Lab F Quality Sausage, Dallas, TX
Lab G Texas A&M University, College Station, TX
Lab H Diebel Laboratories, Madison, WI
Lab I CEM Corporation, Matthews, NC
Lab J Tyson Prepared Foods, North Richland Hills, TX