Embed Size (px)
Citation preview

Literature Review
Final version, 17 December 2012
Aixa Del Greco, Sandra Oliveira, Nicole Demers and Stephan F. Weise
Rapid Biodiversity Assessment Methodologies
Project: Biodiversity and Cocoa farming: Ghana Case
2
COVER NOTE
The goal of the project is to develop a field biodiversity assessment methodology to apply to 4,000
Ghanaian cocoa producer farms. Data collection will focus on farm size and shape, agricultural practices, cocoa production and farmer profiles in order to promote biodiversity-friendly practices through appropriate training. These biodiversity-friendly practices could, ultimately, enable a farmer to certify his cocoa production and use an environmentally-friendly certificate standard.
The current review includes two separate sections: Section 1 presents a synopsis of the general roles and functions of the plant diversity found in cocoa systems (ecological, economic, social elements), while Section 2 reviews the existing literature on rapid biodiversity assessment methodologies (in terms of what biodiversity they measure, how it is measured, and with what time and resource investment) and proposes some assessment options to be tested in the field.
The rapid biodiversity assessment options contained in Section 2 have been reviewed by the
stakeholders of the project during a consultation workshop held in Accra, Ghana, on 2-3 October 2012, on
the basis of their appropriateness and complementarity with the partner‘s field assessment methodology.
This Section has been the basis for the development of specific rapid assessment methods in light of
stakeholders‘ feedback and which are being tested in the field. Eventually, only one methodology will be
applied to assess biodiversity level in the 4,000 Ghanaian cocoa farms as planned by the project.
This work has been supported by Armajaro Trading Limited, UK which, together with Chemonics International Inc. entered into an agreement under the Biodiversity and Agricultural Commodities Program (BACP) to fund Bioversity International implementation component of the project titled Biodiversity and Cocoa farming: Ghana Case. The project lifetime covers the period from August 2012 to October 2013.
Cover images © Sandra Oliveira. From top left: Cocoa pod; Team member measuring DBH; Team member compiling the form; Adjacent land
use; Cocoa tree.
3
Contents
Section 1. Synopsis of general roles and functions of biodiversity in cocoa systems ........................ 4
1.1 Ecological Role ..................................................................................................................................... 4
1.1.1 Role of shade trees in cocoa production ................................................................................... 4
1.1.2 Plant diversity for the improvement of pest and disease management ................................ 5
1.1.3 Plant diversity for the provision of ecosystem services........................................................... 7
1.1.4 Long-term sustainability of the cocoa production .................................................................... 8
1.2 Economic role ....................................................................................................................................... 9
1.2.1 Plant diversity for income diversification ................................................................................... 9
1.2.2 Economic (or other kind of) incentives to encourage farmers‘ biodiversity-friendly
practices ................................................................................................................................................. 10
1.3 Social role ............................................................................................................................................ 11
1.3.1 Diverse plants for social, cultural and traditional uses .......................................................... 11
1.3.2 Policies related with the ownership or management of trees on the farm (forestry
policies) .................................................................................................................................................. 11
Annex 1 of Section 1 ................................................................................................................................ 13
Annex 2 of Section 1 ................................................................................................................................ 15
Bibliography of Section 1 ......................................................................................................................... 16
Section 2. Comparative technical review of rapid plant diversity assessment methods ................ 19
Summary of methodologies .................................................................................................................... 20
2.1. Plant functional type method ........................................................................................................... 23
2.2. Transects and significant species only method ............................................................................ 27
2.3. Quadrats and species with certain criteria method ...................................................................... 30
2.4. Quick Biodiversity Survey (QBS) method ..................................................................................... 33
2.5. Rapid plant assemblage analysis ................................................................................................... 36
2.6. Inventory of woody species ............................................................................................................. 40
2.7. Tree species diversity in agroforests ............................................................................................. 43
2.8. Rapid assessment of plant diversity patterns ............................................................................... 46
2.9. Rainforest Alliance Criteria .............................................................................................................. 50
2.10. UTZ Certified ................................................................................................................................... 60
Complementary information .................................................................................................................... 64
Comparison of methods and assessment of suitability ....................................................................... 68
Conclusions ............................................................................................................................................... 76
Annex 1 of Section 2 ................................................................................................................................ 78
Bibliography of Section 2 ......................................................................................................................... 79
4
Section 1. Synopsis of general roles and functions of biodiversity in cocoa systems
1.1 Ecological Role
1.1.1 Role of shade trees in cocoa production
The impact of new plantings of cocoa on biodiversity levels in the landscape depends on several factors. The type of land use prior to cocoa planting and its biodiversity level, in conjunction with the type of cocoa production system determines the extent to which biodiversity is lost (Gockowski and Sonwa, 2008). The biodiversity of the cocoa production system depends on the type of system, increasing from monoculture, simple agro-silvicultural to complex agroforestry systems.
Cocoa agroforests are commonly established by introducing cocoa seedlings into forest or idle land,
thus shifting the land use to crop land. In order to provide shade to young cocoa plants, banana/plantain are widespread grown with cocoa, and possibly introduced beforehand (Sonwa et al., 2009). As cocoa is growing, farmers retain and/or introduce other trees -either exotic and/or native species- to create a long-lasting canopy and to satisfy other needs of the household (economic or medicinal, as an example) (Sonwa, 2004; Sonwa and Weise, 2008).
This composition made of a mixture of cocoa, native forest trees and/or exotic trees leads into a multi-strata and multi-species system with a structure and function similar to forest (FAO, 2002; Sonwa et al., 2008).
Fruit trees, shrubs and other plants generate at least three levels of canopy, one below the cocoa plants level and, more importantly, one or two above (Ruf, 2011). As the level of biodiversity hosted generally depends on the quality and quantity of shade provided, cocoa agroforests where higher proportions of different shade trees are maintained is increasingly being viewed as a sustainable land-use practice able to complement biodiversity conservation (Asare, May 2006), while satisfying ecological, social and economic requirements (Asare and Prah, 2011).
Asare and colleagues (Asare et al., 2009) while analysing the desirable and existing characteristics of other trees grown with cocoa, underline the importance of the quality of shade provided, which consists of the size, density and compactness of the crown. For example, for crown size (described by its diameter), relatively large crowns have a negative shade effect; as well, with relevance to crown density (i.e. the number and size of the leaves per unit area on the branch) relatively broad leaves and extensive branches negatively affect shade quality. In their guide for farmers training, Asare et al. (2009) also report on farmers retaining and planting trees with different quality of shade as a practice to reduce temperature, wind speed, evaporation and direct sunlight exposure, as well as to intercept rain, thus influencing the local microclimate.
Aiming at establishing both a temporary and a permanent shade effectively covering cocoa, young cocoa trees (between 0-3 years) should benefit of shade levels of about 70% (30% sunlight) while mature and old cocoa trees (i.e. 4 years and beyond) would need about 30-40% shade (70% sunlight, as suggested by Asare and Sonii, 2010).
As one can expect, the type of trees and plants that farmers maintain or introduce (even exotic varieties) in the cocoa agro-forests varies between regions, according to local availability and soil characteristics, to smallholders‘ needs in terms of family own use and depending on the capacity of the planted trees to provide additional income (Sonwa and Weise, 2008). In Central Cameroon, for example, farmers traditionally grow fruit tree species associated with cocoa, thus contributing to the maintenance of a certain level of agrobiodiversity in the field. Such production creates the necessary shade for cocoa seedlings to grow and is at the same time a source of food for self-consumption or household income, as they can sell the surplus (Jagoret et al., 2009).
On the other hand, in one of their recent studies, Sonwa and colleagues found that in the Yaoundé
region of Southern Cameroon more than half of the edible tree species found in cocoa plantations were exotic, with Musaceae and Palmae being the most cultivated plant families, replacing former wild forest species like Euphorbiaceae and Rubiaceae (Sonwa et al., 2009).
5
Cocoa agroforests of Ondo State in Nigeria represent another reality where a variety of exotic non-cocoa tree species (mainly oil palm) are widespread cultivated among cocoa farms, thus impoverishing the rich natural forest, although constituting an important source for family income (Oke and Odebiyi, 2007). Nevertheless, cocoa-based agroforestry systems still have the capacity to produce timber, edible fruits and conserve many of the forest species under improved management practices.
Researchers recommend planting food crops (like cassava, maize, various fruit trees), forest trees (like Terminalia sp., Milicia excelsa, Khaya ivorensis, among others) and tree species promoting nitrogen fixation (like Gliricidia sp., Albizia sp., Acacia sp., as an example) to improve soil nutrient content but also of high economic value (Asare and Sonii, 2010). Eventually, the smallholders‘ selection of neighbour
1 trees to
be planted in their cocoa fields is based on their intrinsic value, mainly in terms of additional income and family consumption (Sonwa, 2004).
The level of biodiversity hosted by cocoa agroforests generally depends on the quality and quantity
of shade provided. Therefore, as a consequence of the introduction of hybrid species adapted to higher sun exposure, if no or less shade is needed, this may directly affect the ability for cocoa agroforests to maintain a sustainable level of biodiversity in a specific area. To this regard, Ruf (2011) reported the importance of considering that at least medium-density shade is probably needed for meaningful biodiversity conservation. This is particularly true in view of certification purposes where, in some cases, a minimum percentage of canopy cover is requested.
Studies conducted in the critical conservation area of the Ecuadorean Chocó report on farmers
increasingly believing that shade reduces yield, thus removing most shade trees from their fields (Waldron et al., 2012). This situation is also supported by Ruf (2011), whose work revealed that under heavy shade cocoa yields and revenues are low, if compared to yields from a full sun mature cocoa farm.
Interestingly, as a result of his field surveys conducted among migrant and autochthon farmers in different districts of Ghana, the author demonstrated through an analytical grid that there are five factors interacting in the maintenance of trees species for shade in cocoa farms: adoption of hybrids adapted to higher sun exposure; farmers‘ negative perception of ecological services in relation to hybrids; legislation excluding smallholders from the legal timber market; recent expansion of the timber industry; and the migratory phenomenon.
Smallholders in Ghana explicitly stated that technical progress is considered to be the primary determining factor in the process of abandoning shade and in the almost systematic elimination of large forest trees. This would explain why smallholder population‘s strategies in most countries currently favour the ―zero-shade‖ plantations, close to the concept of monoculture. As Ruf (2011) and Waldron et al. (2012) documented, production goals are therefore in direct opposition to biodiversity conservation purposes. Farmers would naturally shift towards shade level which provides the highest yield: unfortunately, this may correspond to the lowest conservation benefit level.
Finally, Waldron and colleagues (Waldron et al., 2012) underline the importance of a joint analysis of
trade-offs between shade/production and shade/biodiversity. In such cases (although still rare), farmers may be cultivating cocoa under an inappropriate low level of shade, probably also due to the influence of technical or governmental statement that shade is not beneficial for production.
1.1.2 Plant diversity for the improvement of pest and disease management
The instability of agroecosystems, considered the strongest manifestation of pest problems is one of the consequences of the expansion of crop monocultures at the expense of the natural vegetation, thereby decreasing local habitat diversity. Plant communities that are modified to meet human needs become subject to pest damage, whose harmfulness expands in direct proportion to the intensity of these changes. This is because the inherent self-regulation characteristics of natural communities are lost (Altieri, 1999).
It is therefore important to analyse pest and diseases peculiarities found in cocoa agroforests, in
order to develop and implement suitable countermeasures, taking advantage, where possible, of the effects of the integration of plant and animal biodiversity, such as: enhancing complex interactions and synergisms; optimising ecosystem functions and processes, such as biotic regulation of harmful organisms, nutrient
1 These are trees in cocoa agroforests other than the cocoa trees, as per Asare (2005).
6
recycling, and biomass production and accumulation, thus allowing agroecosystems to sponsor their own functioning (Altieri, 1999).
As well, suitable biodiversification results in pest regulation through restoration of the natural control of insect pests, diseases and nematodes, besides producing optimal nutrient recycling and soil conservation by activating soil biota. All these factors lead to sustainable yields, energy conservation and less dependence on external inputs (Altieri, 1999).
Integrated pest management (IPM) is a system whereby farmers use various methods to control
pests and diseases, to overcome chemical pesticides need. These include good farming practices (growing a combination of different crops, managing shade, etc.), using chemical pesticides carefully and only when necessary and protecting non harmful insects and insects that feed on harmful insects. This combination of methods to control pests reduces the need to use agro-chemicals which are for the most part harmful to the environment (Altieri, 1999). Furthermore, the majority of the preferable application methods of pesticides/insecticides are unaffordable for smallholder farmers due to their high cost (Sonii, 2008).
In cocoa agroforestry systems, plant diversification is considered an efficient means to decrease
chemical input needs. Unfortunately, it appears that beneficial effects against one pest or disease may be accompanied by unwanted effects, such as an increased incidence of another pest or disease (Avelino et al., 2012). Nevertheless, farmers do not always remove those associated plants from their cocoa field, as they may play other important roles for the household (Sonwa, 2004).
Of all cocoa diseases in the world, black pod disease, which Phytophthora fungus is the causative
agent, causes the largest loss of pods. Phytophthora megakarya, one of the four fungus strains, is present only in Central and West African cocoa producing countries, and is the most damaging of the cocoa diseases in this region (Sonii, 2008). As well, mirids (Sahlbergella singularis and Distantiella theobroma) are the most common insect pest damaging cocoa in West Africa, where the crop is increasingly grown in less-biodiverse but apparently more productive unshaded plantations (Avelino et al., 2012).
Even if the use of antagonistic microorganisms is frequently considered as one of the safest and
most affordable control strategies, Deberdt‘s study (Deberdt et al., 2008) in Cameroon showed that microbial control of black pod disease was promising but not as effective as the chemical methods under the current high disease pressure, and therefore needing integration with other control methods to establish a sustainable management system for black pod disease.
As well, there are various natural enemies (or insects that attack pest insects, but not the crop) that
could be efficient in pest control. In the case of mirids, an example is given by the weaver ant which helps reducing mirids‘ attach. Nevertheless, these insects can‘t survive when pesticides are used intensively; therefore a rational pesticide use has to be applied in order to let those natural enemies to keep control of pest insects (Sonii, 2008).
Importantly, some species causing Phytophthora diseases as well as mirids can live on other host
plants (like forest trees), which may provide an alternative source of infestation for cocoa plantations. Therefore, particular attention has to be given when planting (or replanting) cocoa in a new or already exploited habitat. In such cases, Asare and Sonii (2010) suggest ad hoc methods in order to protect seedlings against diseases like the black pod (which develops in humid environments, mainly due to high levels of shade or heavy rainfall), and pests like mirids and termites (spreading in bright light agroforestry).
In the framework of a biodiversity-friendly approach, another example is given by Ruf‘s research in
Ghana, where farmers using hybrids believe that shade and agroforests may even provide negative ecological services, such as increased damage by pests (ex. squirrels, which seek refuge in the upper strata of shade trees) and diseases like the black pod (Ruf, 2011). The author explains that this situation is probably a direct consequence of the moisture increase, as cocoa farmers involved in the study had moved to the Enchi region (South-west of Ghana), characterised by higher rainfall average, where the risk of black pod was thus further augmented by shade trees.
7
1.1.3 Plant diversity for the provision of ecosystem services
The Millennium Ecosystem Assessment report, assessing the state of the world's ecosystems, identifies the main ecosystem services as follows: (i) provisioning services: products obtained from ecosystems including, for example, genetic resources, food and fibre, fresh/clean water; (ii) regulating services: benefits obtained from the regulation of ecosystem processes, including climate regulation, pest control, pollination; (iii) cultural services: non-material benefits people obtain from ecosystems through spiritual enrichment, cognitive development, reflection, recreation, and aesthetic experience, like cultural heritage, social relations, and aesthetic values; and (iv) supporting services: ecosystem services that are necessary for the production of all other ecosystem services, among which are biomass production, production of atmospheric oxygen, soil formation and retention, nutrient cycling, water cycling, and provisioning of habitat (Corvalan et al., 2005).
These ecosystem services and renewal processes are largely of biological nature, therefore their
persistence depends upon maintenance of biological diversity. During the last two decades, scientists started looking more closely at environmental services that agroforestry practices may provide to the society, i.e. carbon preservation in the plant–soil system and watershed functions management. More recently, the research shifted its attention also to the role that those practices play in supporting biodiversity conservation (McNeely and Schroth, 2006). As a matter of fact, when natural services are lost due to biological impoverishment (including deforestation and land degradation), economic and environmental costs can be quite significant (Sonwa and Weise, 2008).
Cocoa cropping systems are one of the significant land uses in West Africa occupying somewhere
between five and six million hectares of the moist tropics of Côte d‘Ivoire, Ghana, Nigeria and Cameroon. Together these four countries produce more than 3/5t of the world cocoa supply, roughly 2 million tons annually. The level of ecosystem functions and consumptive value produced by any particular cocoa land use system is largely a function of the level and composition of associated shade species (Gockowski et al., 2004).
Economically, in agriculture the burdens include the need to supply crops with expensive external
inputs, because agro-ecosystems deprived of basic regulating functional components lack the capacity to support their own soil fertility and pest regulation. Biological diversity loss due to environmental degradation is reflected in the reduction of the quality of life, due to decreased soil, water, and food quality when pesticide and/or nitrate contamination occurs (Altieri, 1999). Steffan-Dewenter et al. (2007) document that the conversion of rainforest to extensive cacao agroforestry with high shading levels strongly impacts plant biomass and carbon storage as well as diversity of forest-using plant and insect species in the cacao agroforestry intensification in Sulawesi, Indonesia.
Nevertheless, due to their structure and function, cocoa agroforests still mimic forest-like habitats,
thus being able to provide a certain level of ecological services at a landscape scale, as they complement -if not fulfil- the role previously played by natural forest (FAO, 2002; Schroth et al., 2004, cited by Sonwa et al., 2007).
According to Sonwa et al. (2008), in the Yaoundé fringe (Cameroon) environmental services
provided by the cocoa agroforests could include: (a) biodiversity conservation and landscape restoration; (b) carbon sequestration through reforestation using cocoa agroforest; (c) ecotourism; and (d) water control. Such agroforests can be used for Payment for Environmental Services (PESs) tests and initiatives, where PESs can be complemented by cocoa yield increase. As well, in one of his works, Asare (2006) identifies and describes the fundamental characteristics of tree species on the basis of the type of services they are capable of providing to cocoa agroforests in Ghana, like crop(s) with economic value for the household.
From a different perspective, although smallholders should be encouraged to keep shade trees in
their farm as an additional ecological service source, it has been seen that the removal of canopies is a common practice among them; Ruf (2011) suggests that one of the reasons behind this option could come from cocoa smallholders doubting the (positive) ecological services provided by shade on cocoa farming and, more generally, biodiversity preservation as a means for pests and diseases regulation.
8
1.1.4 Long-term sustainability of the cocoa production
As the cultivation of cocoa has been an important driver of tropical deforestation, efforts to reverse this trend are focusing on the reintroduction of shade trees to cocoa plantations, since shade trees can enhance biophysical conditions on cocoa fields and contribute to biodiversity and product diversification for smallholder producers; (Obiri et al., 2007). A study by Obiri et al. (2007) compares hybrid, shaded hybrid and traditional cocoa and found that, from an economic perspective, cocoa production will remain, in general, profitable, even in case of a 20% reduction in cocoa price or yield.
Over a period of an 80 years cycle, the shaded hybrid has generated the highest net cash flow but,
as acknowledged by the authors, such long period is unrealistic. Moreover, as trials on hybrid cocoa have not yet been studied over the long period, their high yields sustainability is unknown.
In addition to the greater vigour of the hybrid, the use of moderate amounts of pesticides, fertilisers and herbicides (as experimented, in the same chronological order, in Ghana and Côte d‘Ivoire) helps in preserving relatively good yields and good incomes in 25-30 year old unshaded cocoa farms (Ruf 2007, cited by Ruf, 2011). Ruf‘s analysis of cocoa farmers‘ strategies in Ghana shows that farmers are now clearing remnant forests and agroforests by replacing them with full sun farms, either of cocoa or exotic species like rubber and oil palm, and eventually teak. The author forecasts that this kind of tree crops rotation process will result in creating a mosaic of small farm plots, closer to the concept of polyculture than that of agroforest.
A recent study by Waldron et al. (2012) explored the trade-offs between biodiversity conservation
(biodiversity would benefit from an increase in shade) and production (shade reduces yield) in cocoa farms in Ecuador, in order to verify if and how a new certification for biodiversity-friendly chocolate could achieve sustainability. The study highlighted a rare case in which farmers were producing at an inappropriately low level of shade under the influence of a powerful technical/governmental discourse. The study demonstrated that both production and biodiversity would benefit from a higher level of shade.
On the other hand, according to the author, biodiversity-friendly incentives may push farmers into using unsustainably high levels of shade (e.g., if yield losses exceed price premium gains in certification schemes). As a consequence, economically precarious cocoa farms are often abandoned and replaced by more profitable but biodiversity-poor monocultures (such as oil palm).
Given that agricultural activities diminish biodiversity by displacing or replacing natural environments,
the major challenge for conservationists and agriculturists in biodiversity hotspots is how to balance the economically driven agricultural expansion with strategies necessary for conserving natural resources, and maintaining ecosystem integrity and species viability (Pimentel et al., 1992; Perfecto, 1997: cf. Parish et al., 1998, cited by Asare, May 2006). The rapid rate of abandonment among shade-grown cocoa smallholders represents a novel but critical type of ―conservation threat‖ in the wet lowland tropics (Ruf, 2011). To overcome this situation, Waldron et al. (2012) suggest a simple development help specifically targeted at cocoa smallholders, as the best short-term means to improve the long-term stability of the production in a sustainable environment, together with cacao smallholders‘ economic status.
9
1.2 Economic role
1.2.1 Plant diversity for income diversification
Many studies have shown how the composition of the cocoa agroforest is the result of a synergic balance capable to meet specific environmental and economic needs of different regions in cocoa producing countries. Nevertheless, as in the case of West and Central Africa, most cocoa farmers are getting insufficient benefits from growing the crop, as the production is low (200-700kg/ha) (Asare and Sonii, 2010). They therefore need to intensify
2 their cocoa cultivation to overcome the loss from growing cocoa.
The introduction or development of a new or already existing culture, which takes the place of a
declining one with the aim to secure or improve smallholders income, is frequently a response to growing urbanisation and to international market changes and risks which interfere with the pre-existing situation. In fact, among the species potentially associable with cocoa, those needed by local, regional and international markets are not necessarily those that are more frequent in the cocoa field (Sonwa and Weise, 2008). An important factor is the kind of access to urban centres, as public roads infrastructure facilitates easy access to market for cocoa fruit agroforests. Another determining factor is represented by the presence of local markets for indigenous fruits (Gockowski et al., 2004).
As income from trees associated with cocoa can complement that from the cocoa itself, with increasing market access and land use intensity, native forest species were increasingly replaced with common and often exotic tree crops (Sonwa et al., 2007). Within this framework, while choosing which kind of plant species could be associated with cocoa, farmers place more importance on enhancing cocoa production and use the cocoa farm to meet their daily household demands and market needs.
An example of good trade-off between shade/yield and shade/biodiversity is given by the Chocó cocoa in northwest Ecuador (Waldron et al., 2012), where biodiversity benefits from an increase in average shade levels in the fields, in parallel with a higher income for farmers.
Timber is another economically important component of the upper canopy with many rapidly growing
species selectively maintained by farmers, resulting in densities above those found in secondary forests (e.g. Lovoa trichilioides, Terminalia superba, Milicia excelsa, and Triplochiton scleroxylon). This timber is mainly destined for local construction and furniture (Gockowski et al., 2004). As the authors demonstrate in their analysis of cocoa and non-cocoa revenues, certain of the fruits marketed from cocoa agroforests contribute significantly to the overall wellbeing of the household. An additional positive aspect of the shaded cocoa agroforest is a more constant stream of revenue over the year, whereas for cocoa monoculture, cash flow is lumpy.
Often, production goals are in direct opposition to biodiversity conservation requirements. As a
matter of fact, different studies show how agroforests close to more urbanised areas or to areas more linked to local and international markets, tend to be less diverse than the ones in other sub-regions.
As a global result, it is interesting to note that the farmers‘ need to secure their income through
diversification may sometimes produce an increase of biodiversity at regional level with the introduction of exotic species that meet the market needs (in addition to the indigenous ones still growing in less exploited or protected areas). Importantly, Steffan-Dewenter et al.‘s results (2007) indicate that trade-offs between income and overall biodiversity are less severe than trade-offs between economic gains and losses of more specialised forest-based species.
Other studies (Jagoret et al., 2009) present opposite trends, underlying how in some regions the
diversification process remains closely linked to traditional practices and farmers often prefer reintroducing local species already cultivated in the area.
It is interesting to note that the farmers‘ need to secure and diversify their income does not occur
only among plants (Weinbaum et al., 2007). In Central Africa, in the remote locations where cocoa and hunting are an important part of a households‘ annual revenue, if cocoa income were to decline due to decreased prices or demand, income would need to be substituted by other sources, with the potential effect of increasing hunting pressure on wildlife and on biodiversity.
2 As per Asare et al. (2010), cocoa intensification is a term used to describe a new vision of the cocoa investment whereby the crop is
grown with the objective of increasing productivity while at the same time ensuring sustainability by protecting the environment.
10
1.2.2 Economic (or other kind of) incentives to encourage farmers’ biodiversity-friendly practices
The need to increase cocoa farmers‘ income using biodiversity-friendly practices does not always find appropriate answers in strategies aimed only at fostering the productivity of cocoa agroforests. Furthermore, diversification led by the necessity to follow market changes and the introduction of technological achievements (mainly represented by hybrids adapted to higher sun exposure) shows how a higher productivity trend does not always meet biodiversity imperatives. In fact, as a response to the pressure of urbanisation and to the instability of international markets, old cocoa agroforests are at risk of being replaced by sun-loving hybrids or other tree species (like rubber, oil palm, citrus or teak, mainly exotic), frequently in the form of monoculture plantations, in a process of tree diversification without tree intercropping (Ruf, 2011).
To make cocoa agroforests attractive to farmers, it is important to compensate their economic losses
from biodiversity-friendly cocoa production with incentive policies that define, quantify and Pay for the Environmental Services (PES) provided, such as biodiversity conservation, landscape restoration, carbon sequestration, reduction of deforestation, watershed protection, agricultural pest management and ecotourism, among others (Sonwa and Weise, 2008; Sonwa et al., 2009).
Furthermore, it is interesting to note that farmers frequently don‘t appreciate these self-inherited
services provided by cocoa agroforests, even when they have a direct impact on their productions (insect pest management, microclimate control, pollinator habitat, enhanced soil nutrition) (Ruf, 2011), confirming that the empowerment of farmers should be based not only on favourable policies but also on education and information sharing programs (Asare and Prah, 2011).
Certification of eco-friendly products or Geographic Indicators (GI) could represent another way to
encourage biodiversity friendly practices giving competitive market advantages. Even if many economists and ecologists believe in the potential of eco-markets applied to the cocoa sector, it is difficult to assess the economic consequences of certification criteria, and so their sustainability is hard to be accurately predicted (Waldron et al., 2012).
On the other hand, it has been noted that incentives that push farmers into using biodiversity friendly
practices but unsustainable high levels of shade could be counterproductive in the long-term. Exploring both shade/yield and shade/biodiversity balances, could help stakeholders to better determine the correct level of shade or more precisely define the amount of the incentive that has to be granted. As mentioned above, there are only few cases witnessing an increase in average shade levels accompanied by a proper biodiversity conservation status and farmers‘ income increase (Waldron et al., 2012).
11
1.3 Social role
1.3.1 Diverse plants for social, cultural and traditional uses
As a consequence of the growing urbanisation process and of the increasing market access and land use intensity, native forests‘ species are being frequently replaced by common and/or exotic tree crops (Sonwa et al., 2007). Historically, native forests have been a natural source of products capable of meeting the local population needs for construction materials, food, medicine and other non-timber forest products (NTFPs), besides land for farming (Sonwa et al., 2007).
The close relationship between the forest products and local population traditions is clearly
perceptible in different traditional practices that have enabled Africans to keep people and biodiversity links active. Such practices include preserving certain trees because they are considered to house spirits, creating sacred areas where access is restricted (for example sacred forests or sacred groves, elephant forests, monkey forests, etc.), attributing a tribe‘s existence to a particular species and making it an offence to destroy that species (totem), banning activities (for example hunting, farming and/or fishing) in certain areas for certain periods of time, cultivating and breeding certain species of plants and animals, among others (Asare et al., 2009).
In the same context, a different situation is presented by Steffan-Dewenter et al. (2007) in their study
conducted in Sulawesi, Indonesia, where data from three representative villages with low, intermediate, and high proportions of migrants showed a parallel proportional increase of cacao cropping for autochthonous ethnic groups. Thus, cultural influences by migrant households changed the dominant livelihood strategy from a ‗‗food first‘‘ strategy based on irrigated rice to a ‗‗cash crop first‘‘ strategy, thereby increasing the pressure for forest conversion and intensification.
According to McNeely and Schroth (2006), traditional complex agroforestry systems are more
supportive of biodiversity than monocrop ones, although they are not substitutes for natural habitats, which proximity agroforests may depend on for high levels of wild biodiversity. The relationship between forests, agroforestry and wild biodiversity can be fostered by applying adaptive management approaches that recognise local knowledge and practices and incorporate ongoing research and monitoring in order to feed information back into the management system, with farmers and local populations included as active participants.
Such efforts would have the benefit of helping maintaining access for poor people to forest products
such as food, medicinal products and charcoal, despite increasing land use pressure (Sonwa et al., 2007). Furthermore, without recognition of traditional practices and of the detailed, although non-scientific
knowledge of the indigenous people, it would be hard for governmental biodiversity-friendly policies to succeed in their efforts to introduce new agroforestry practices (McNeely and Schroth, 2006).
1.3.2 Policies related with the ownership or management of trees on the farm (forestry policies)
According to Ruf (2011), anthropologists and economists were among the first suggesting that the choice of deforestation and full sun options can be explained by existing laws that deny ownership of any timber tree to smallholders, even autochthons. This is the case in many tropical countries, like Côte d‘Ivoire (with the important role of migrants that, in the absence of a clear legal property framework, look for quick returns and plant cocoa whenever possible to try to secure their property) and Ghana.
As a matter of fact, the West African legislation supporting loggers against farmers is obviously a barrier to any farmer investing in timber trees. To this end, Ruf (2011) promotes the idea of smallholders getting full access to the timber market and to financial and institutional mechanisms, in order to cope with the investment in the long term.
Looking at specific policies related to the management of trees on farm, Altieri (1999) suggests the
key being the identification of the biodiversity type that is desirable to maintain/enhance in order to promote ecological services, and then the choice of the best practices that will encourage the desired biodiversity components. There are many agricultural practices that have the potential to enhance functional biodiversity,
12
and others that negatively affect it. The author‘s idea is to apply the best management practices in order to enhance or regenerate the kind of biodiversity that can not only subsidise the sustainability of agroecosystems by providing ecological services such as biological pest control, but also promote nutrient cycling, water and soil conservation, as an example.
On the other hand, any effort to re-orient cocoa production to meet conservation objectives through
the introduction of new policies will necessarily demand a change in how cocoa farmers and their families use the natural and agricultural resources. Most governments and organisations are committed to the idea that they can change how people use resources, but in truth many projects fail because they are unable to understand the human aspects of the system. Therefore, if farmers‘ behaviour or management decisions have to be changed, then there is the need to present options that are ecologically possible, socially adoptable and economically gainful (Asare, May 2006). The same work underlines the importance of Farmer Field School (FFS). FFS, developed and applied by IITA/STCP, is based on principles of adult learning and is best suited for extending knowledge-based technologies and practices and especially to introduce cocoa farmers to integrated pest and disease management and general farm-management practices.
The importance of an efficient farm management has been also demonstrated by Olujide and
Adeogun (2006). In Southern Nigeria, low prices are offered to cocoa farmers due to the poor quality of their products as a consequence of the lack of correct hygiene practices. The findings of the study suggest that the Cocoa Research Institute of Nigeria (CRIN), the Ministry of Agriculture, and relevant non-governmental organisations should plan a programme/training scheme to de-emphasise the use of chemicals and encourage the use of appropriate crop growing practices for improving farm hygiene.
13
Annex 1 of Section 1
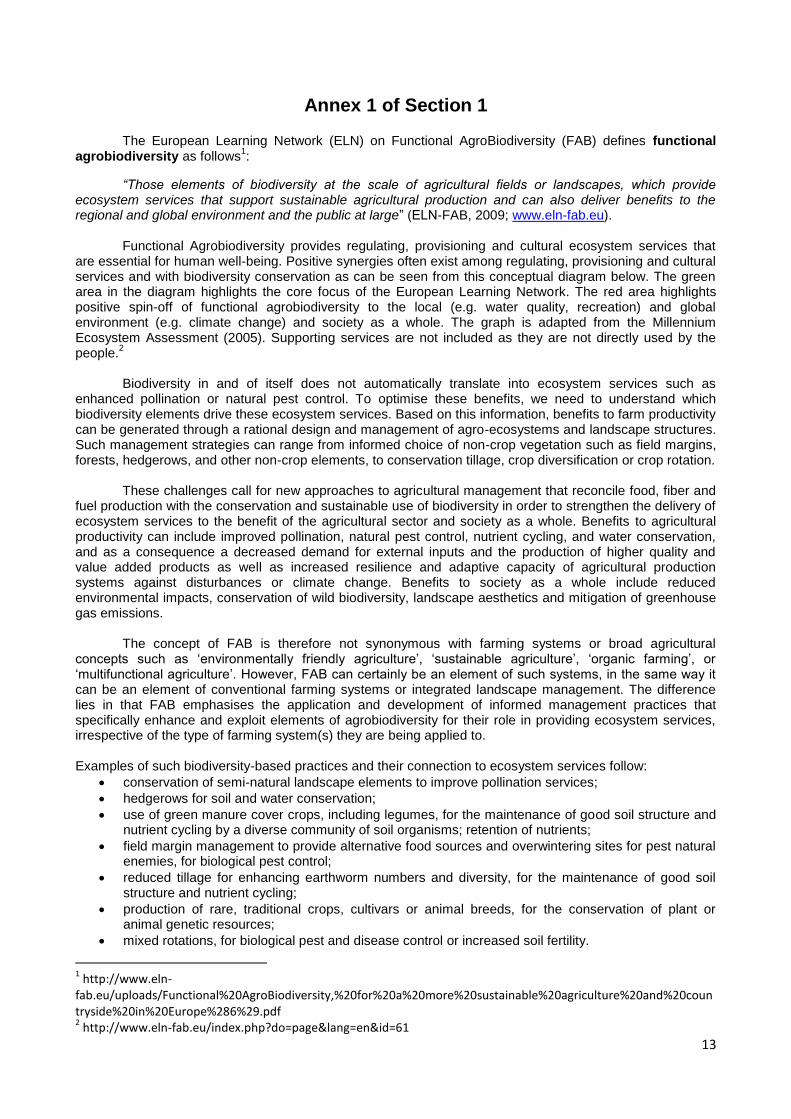
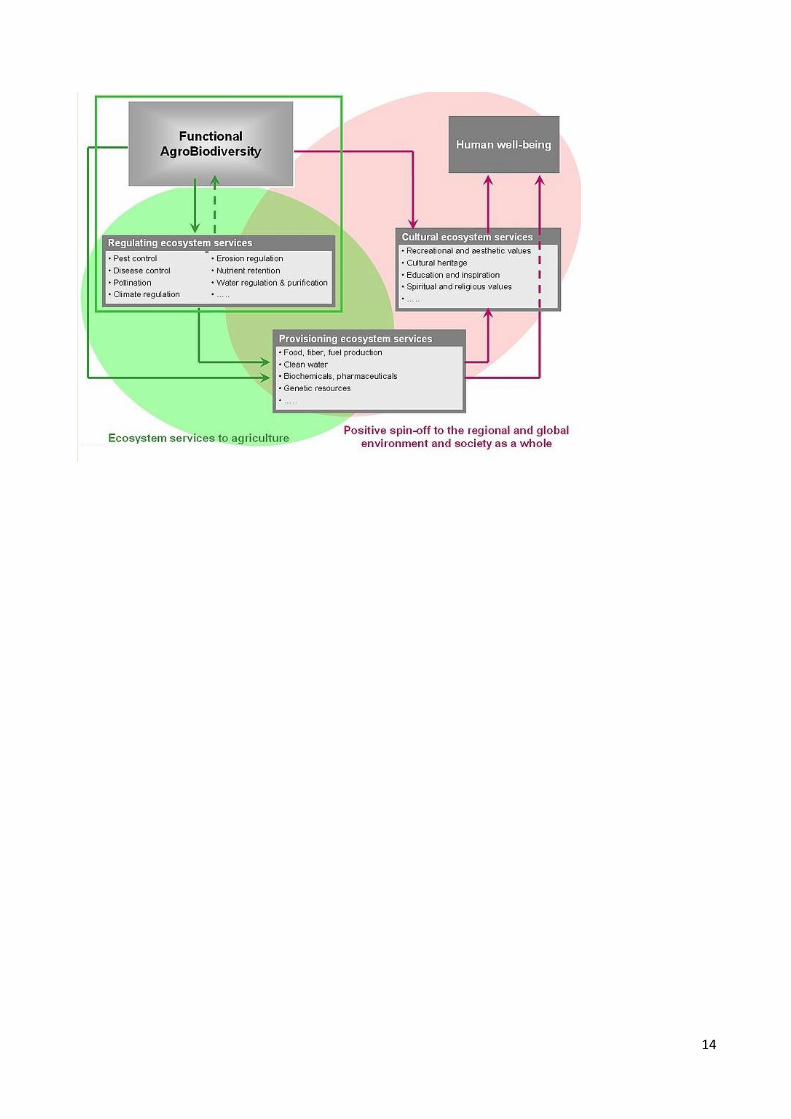
The European Learning Network (ELN) on Functional AgroBiodiversity (FAB) defines functional agrobiodiversity as follows
1:
“Those elements of biodiversity at the scale of agricultural fields or landscapes, which provide ecosystem services that support sustainable agricultural production and can also deliver benefits to the regional and global environment and the public at large‖ (ELN-FAB, 2009; www.eln-fab.eu).
Functional Agrobiodiversity provides regulating, provisioning and cultural ecosystem services that are essential for human well-being. Positive synergies often exist among regulating, provisioning and cultural services and with biodiversity conservation as can be seen from this conceptual diagram below. The green area in the diagram highlights the core focus of the European Learning Network. The red area highlights positive spin-off of functional agrobiodiversity to the local (e.g. water quality, recreation) and global environment (e.g. climate change) and society as a whole. The graph is adapted from the Millennium Ecosystem Assessment (2005). Supporting services are not included as they are not directly used by the people.
2
Biodiversity in and of itself does not automatically translate into ecosystem services such as
enhanced pollination or natural pest control. To optimise these benefits, we need to understand which biodiversity elements drive these ecosystem services. Based on this information, benefits to farm productivity can be generated through a rational design and management of agro-ecosystems and landscape structures. Such management strategies can range from informed choice of non-crop vegetation such as field margins, forests, hedgerows, and other non-crop elements, to conservation tillage, crop diversification or crop rotation.
These challenges call for new approaches to agricultural management that reconcile food, fiber and fuel production with the conservation and sustainable use of biodiversity in order to strengthen the delivery of ecosystem services to the benefit of the agricultural sector and society as a whole. Benefits to agricultural productivity can include improved pollination, natural pest control, nutrient cycling, and water conservation, and as a consequence a decreased demand for external inputs and the production of higher quality and value added products as well as increased resilience and adaptive capacity of agricultural production systems against disturbances or climate change. Benefits to society as a whole include reduced environmental impacts, conservation of wild biodiversity, landscape aesthetics and mitigation of greenhouse gas emissions.
The concept of FAB is therefore not synonymous with farming systems or broad agricultural concepts such as ‗environmentally friendly agriculture‘, ‗sustainable agriculture‘, ‗organic farming‘, or ‗multifunctional agriculture‘. However, FAB can certainly be an element of such systems, in the same way it can be an element of conventional farming systems or integrated landscape management. The difference lies in that FAB emphasises the application and development of informed management practices that specifically enhance and exploit elements of agrobiodiversity for their role in providing ecosystem services, irrespective of the type of farming system(s) they are being applied to. Examples of such biodiversity-based practices and their connection to ecosystem services follow:
conservation of semi-natural landscape elements to improve pollination services;
hedgerows for soil and water conservation;
use of green manure cover crops, including legumes, for the maintenance of good soil structure and nutrient cycling by a diverse community of soil organisms; retention of nutrients;
field margin management to provide alternative food sources and overwintering sites for pest natural enemies, for biological pest control;
reduced tillage for enhancing earthworm numbers and diversity, for the maintenance of good soil structure and nutrient cycling;
production of rare, traditional crops, cultivars or animal breeds, for the conservation of plant or animal genetic resources;
mixed rotations, for biological pest and disease control or increased soil fertility.
1 http://www.eln-
fab.eu/uploads/Functional%20AgroBiodiversity,%20for%20a%20more%20sustainable%20agriculture%20and%20countryside%20in%20Europe%286%29.pdf 2 http://www.eln-fab.eu/index.php?do=page&lang=en&id=61
14
15
Annex 2 of Section 1
Different people and groups who have been consulted when gathering information
For the synopsis of general roles and functions of biodiversity in cocoa systems, the following people have been contacted:
Stephan Weise: Dr. Weise is the primary contact for this project at Bioversity International. He has previously worked for the Sustainable Tree-Crop Programme (STCP) at the International Institute for Tropical Agriculture (IITA). He has given the first instructions on the project as well as directed the team to a first list of references and some of the following people to be contacted for a possible contribution;
Denis Sonwa: Denis is working for the Centre for International Forestry Research (CIFOR) based in Cameroon and has already published many articles on Cameroonian cocoa agroforests, production and diversity;
Richard Asare: Richard is working for the Sustainable Tree-Crop Programme (STCP) at the International Institute for Tropical Agriculture (IITA) based in Accra, Ghana, and with Forest & Landscape Denmark. He is now doing a PhD on cocoa agroforestry systems and climate change resilience. He already published many documents and training guides for farmers on cocoa agroforests and their management.
List of other data sources that have been accessed
Google Scholar for looking for appropriate references on the subject
Rainforest Alliance Website for the Sustainable Agriculture Network (SAN) Standards criteria for possible certification
World Agroforestry Centre Website
Conservation Alliance Website
Sci-Lit database: Bioversity International internal database of staff authored publications
Sustainable Tree-Crop Programme (STCP) of the International Institute for Tropical Agriculture (IITA) Website
Acknowledgements
Bioversity International wishes to thank all partners who collaborated to the compilation of this literature review, by giving their guidance on the core literature useful for the purpose.
16
Bibliography of Section 1
Altieri, Miguel A. (1999). ―The ecological role of biodiversity in agroecosystems.‖ Agriculture, Ecosystems &
Environment 74, 1-3: 19-31.
Avelino, J., Régis Babin, Paula Fernandes, Martijn ten Hoopen, Jean-Baptiste Laurent, Krishna Naudin, Alain
Ratnadass (2012). Incorporating plant species diversity in cropping systems for pest and disease risk
management. http://www.agriskmanagementforum.org/content/incorporating-plant-species-diversity-
cropping-systems-pest-and-disease-risk-management.
Asare, Richard (2005). ―Cocoa agroforests in West Africa: a look at activities on preferred trees in the farming
systems‖. Forest & Landscape Working Papers no. 6.
Asare, Richard (2006). ―Learning about neighbour trees in cocoa growing systems: a manual for farmer
trainers‖. Forest & Landscape, Development and Environment Series, no. 4.
Asare, Richard (May 2006). ―A review on cocoa agroforestry as a means for biodiversity conservation‖. Forest
& Landscape Denmark.
Asare, R., David, S. and Sonwa, D. (eds.) (2009). Conservation and biodiversity in and around cocoa farms.
Learning about Sustainable Cocoa Production: A Guide for Participatory Farmer Training. Development
and Environment Series 12-2009. Forest & Landscape Denmark.
Asare, R. and David, S. (2010). ―Planting, replanting and tree diversification in cocoa systems. Learning about
sustainable cocoa production: a guide for participatory farmer training‖. Manual No. 2. Development and
Environment Series 13-2010. Forest & Landscape Denmark.
Asare, R. and Cynthia Prah (2011). ―Shade trees in the cocoa landscape: how Ghana can benefit from
valuable trees on farms.‖ Daily Graphics. Accra, Ghana.
Corvalan, C. et al. (2005). Ecosystems and human well-being: health synthesis. WHO, 53 p.
Deberdt, P., C.V. Mfegue, P.R. Tondje, M.C. Bon, M. Ducamp, C. Hurard, B.A.D. Begoude, M. Ndoumbe-
Nkeng, P.K. Hebbar and C. Cilas (2008). Impact of environmental factors, chemical fungicide and
biological control on cacao pod production dynamics and black pod disease (Phytophthora megakarya)
in Cameroon. Biological Control 44: 149–159.
ELN FAB Functional AgroBiodiversity for a more sustainable agriculture and countryside in Europe. Online at
http://www.eln-
fab.eu/uploads/Functional%20AgroBiodiversity,%20for%20a%20more%20sustainable%20agriculture%2
0and%20countryside%20in%20Europe%286%29.pdf
European Learning Network on Functional AgroBiodiversity (ELN-FAB). Online at: http://www.eln-fab.eu/
FAO (2002). ―Etude de cas d‘aménagement forestier exemplaire en Afrique centrale: les systèmes
agroforestiers cacaoyers, Cameroun‖. Par Denis J. Sonwa, octobre 2002. Document de travail FM/12F.
Service de la mise en valeur des ressources forestières, Division des ressources forestières. FAO,
Rome (non publié).
17
Gockowski, J., S. Weise, D. Sonwa, M. Tchtat and M. Ngobo (2004). Conservation because it pays: shaded
cocoa agroforests in West Africa. Discussion Paper presented at the National Academy of Sciences in
Washington DC on February 10, 2004, at a symposium titled “The Science behind cocoa’s benefits”.
Gockowski, J. and Denis Sonwa (2008). Biodiversity and smallholder cocoa production systems in West
Africa. Tropical Agriculture, STCP Working Paper Series, Issue 6.
Jagoret, P.; H. T. Ngogue, E. Bouambi, J. L. Battini and S. Nyassé (2009). Diversification of cocoa farms in
the Central Cameroon: myth or reality? Les Presses Agronomiques de Gembloux, A.S.B.L., Gembloux,
Belgium, Biotechnologie, Agronomie, Société et Environnement, 13, 2: 271-280.
McNeely, J. A. and G. Schroth (2006). Agroforestry and biodiversity conservation – traditional practices,
present dynamics, and lessons for the future. Biodiversity and Conservation, 15: 549–554.
Obiri, B. D., G. A. Bright, M. A. McDonald, L. C. N. Anglaaere and J. Cobbina (2007). Agroforest Syst 71:
139–149.
Oke, D.O. and K.A. Odebiyi (2007).‖Traditional cocoa-based agroforestry and forest species conservation in
Ondo State, Nigeria‖. Agriculture, Ecosystems and Environment 122: 305–311.
Olujide, M.G. and S.O. Adeogun (2006). Assessment of cocoa growers‘ farm management practices in Ondo
State, Nigeria. Spanish Journal of Agricultural Research 4, 2: 173-179.
Ruf, François Olivier (2011). The myth of complex cocoa agroforests: the case of Ghana. Hum Ecol 39, 3:
373–388.
Sonii, David (ed.) (2008). Learning about sustainable cocoa production: a guide for participatory farmer
training. 1. Integrated crop and pest management. Sustainable Tree Crops Program, International
Institute of Tropical Agriculture, Accra, Ghana. September 2008 version.
Sonwa, Denis Jean (2004). Biomass management and diversification within cocoa agroforests in the humid
forest zone of Southern Cameroon. PhD thesis. Faculty of Agriculture. University of Bonn. Germany.
Cuvillier Verlag, Goettingen. 112 pp.
Sonwa, D. J., B. A. Nkongmeneck, S. F. Weise, M. Tchatat, A. a. Adesina and M. J. J. Janssens (2007).
―Diversity of plants in cocoa agroforests in the humid forest zone of Southern Cameroon.‖ Biodiversity
and Conservation 16, 8: 2385-2400.
Sonwa, D. J., and S. F. Weise (2008). Diversifying and Intensifying the Cocoa Agroforest Landscape: Review
and strategic approaches for managing the shade matrix in West and Central Africa. STCP Working
Paper Series, Issue 4 (version January 2008). International Institute of Tropical Agriculture, Accra,
Ghana.
Sonwa, D. J., A. B. Nkongmeneck, S. F., Weise, M. Tchatat and J. J. Janssens (2008). ―Chocolate Forest and
the Peri-Urban Landscape : Tree diversity of the cocoa agroforests around Yaoundé (Southern
Cameroon)‖. Tropical Agriculture, STCP Working Paper Series Issue 5.
Sonwa, D. J., A. B. Nkongmeneck, S. F. Weise, M. Tchatat and M. J. J. Janssens (2009). Tree diversity of the
cocoa agroforest around Yaoundé (Southern Cameroon). In: X. van der Burgt, J. van der Maesen and J.-
M. Onana (eds), Systematics and Conservation of African Plants, pp. 691–699. Royal Botanic Gardens,
Kew.
18
Steffan-Dewenter, I. et al. (2007). Tradeoffs between income, biodiversity, and ecosystem functioning during
tropical rainforest conversion and agroforestry intensification. PNAS 104, 12: 4973–4978.
Waldron, A.; R. Justicia, L. Smith, Sanchez M. and Wiley-Blackwell (2012). Conservation through Chocolate:
a win-win for biodiversity and farmers in Ecuador's lowland tropics. Boston, USA, Conservation Letters,
5, 3: 213-221.
Weinbaum, K., D. Sonwa, S. Weise, J. Brashares and W. M. Getz (2007). ―Wildlife Diversity in
Cocoa/Agricultural Mosaics at the Congo Basin Forest Margin‖.‖ Tropical Agriculture, STCP Working
Paper Series, Issue 3.
19
Section 2. Comparative technical review of rapid plant diversity assessment methods
Objective: Perform a comparative technical review of some rapid plant diversity assessment
methodologies, focusing on what biodiversity they measure, how it is measured and the time and
resource investment needed, in order to identify and propose potential assessment options to be tested
in the field.
Procedure:
To attain this purpose, a template has been defined to enable a coherent comparison of the different
methodologies, as follows:
2.1 Name of the method
2.1.1 Origin of the method (some background about the method, where it comes from)
2.1.2 Objectives of the method (purpose, where it is used)
2.1.3 Assumptions
2.1.4 Description
2.1.4.1 Variables measured or identified
2.1.4.2 Area or transect measured
2.1.5 Type of analysis
2.1.6 Time and resources investment
2.1.7 Strengths and weaknesses of the method
2.1.8 Initial assessments and observations
2.1.9 References
Research questions:
The literature review was guided by a set of research questions about biodiversity assessment in cocoa
agroforests, which the methods should help answering. The questions are presented below:
Do we want to maintain a certain type of biodiversity (species wise)? And so, what type and for
what?
Or are we interested in maintaining a certain type of functional diversity (functional attributes
wise)? What type and for what?
Or should we look at what ecological services or other livelihood services we want to enhance
(carbon sequestration? watershed protection? water retention? Water supply? Soil fertility aspects?
Biodiversity conservation? Landscape restoration? Reduction of deforestation and degradation
(REDD)? Ecotourism? etc) and then determine what (in terms of species or functional diversity) we
need for that? How do we make the link between a certain type of ecological service to be enhanced
and the trees compositions, plantation density, etc, to maintain?
Do we want to measure and apply ―biodiversity-friendly practices‖ for better long-term sustainability
and resilience of the system in general? For better (long-term) economic return to farmers? For
better conservation of some specific species? For a combination of all these? If so, how do we
measure those criteria? Do we have indicators?
Or do we base the study on assumptions?
Structure of the section:
This methodological section is organised as follows:
- First, a description of the method is provided following the template presented above. When the
information was directly available in the literature, it was included as such. In some cases, information
on the origin of the method, the assumptions or the time and resources investment was not available in
the literature, nor it was possible to obtain it from the contact person, hence it may not be included.
The strengths and weaknesses were mostly derived from the interpretation of the contributors of this
20
section, considering the characteristics of the methods and their applications. A total of 8 methods are
presented.
- After the methods, a brief description of the Rainforest Alliance criteria and the UTZ Certified code of
conduct for cocoa are presented, focusing on the criteria with relevance for biodiversity assessment.
- Some additional information is provided afterwards, based on studies by R. Asare and R. Kindt & R.
Coe with relevant impact for biodiversity assessment procedures in cocoa agroforests.
- Finally, a set of summary tables is provided, gathering the most important aspects of the methods and
the certification programmes reviewed. These tables facilitate visual inspection and interpretation of
the information obtained and are useful to compare the methods, in terms of:
Applications of each method
Technical characteristics and requirements of the methods
Strengths and weaknesses of each method
Compliance with the indicators of Rainforest Alliance and UTZ
To allow for a quick overview of the type of methods selected, a summary of the methods reviewed is
presented beforehand. At the end of the document, a short discussion and conclusions on the
requirements and applicability of the methods are drawn.
Summary of methodologies
2.1. Plant functional type method
This relatively new approach focuses on the adaptive responses of plants in a way that complements
taxonomic and vegetation structure features. It is based on the interactions between the plants‘
functional elements and the biophysical environment, which allows using plants as indicators of habitat
conditions and modification. It creates functional groups of plants and it is easy to apply, but has no
mention of links to social or economic aspects. Identification of plants is also not provided. Specific
software is available (VegClass).
Reference/contact: Andy Gillison.
2.2 Transect and significant species
This method is part of the Rapid Assessment Program (RAP) of Conservation Alliance, whose surveys
provide a quick assessment of the biological value of an area and identify species in need of
conservation action. It uses transects and looks particularly for significant/important or vulnerable
species. Forest trees and all vascular plant species were identified on several sites and flora of less than
5cm diameter at breast height (DBH) at a height of 1.3m was also identified.
Reference/contact: Yaw Osei-Owusu (Conservation Alliance).
2.3 Quadrat and specific criteria species
In this method, it is assumed that a system with a mixture of cocoa, wild forest trees and/or exotic trees
leads to a multi-strata and multi-species system with a structure and function similar to forest. All
individual plants associated with cocoa, with diameter at breast height (dbh) of ≥ 2,5cm were identified
and richness, diversity and equitability indices were calculated. This method also used key-informants of
the villages to record main use of species. The quadrats were also applied to a gradient of land use,
market and population conditions to assess their influence in the biodiversity in cocoa agroforests,
allowing for comparisons between regions and countries.
Reference/contact: Denis Sonwa (CIFOR).
21
2.4 Quick Biodiversity Survey method
This method is part of the Rapid Agro-Biodiversity Appraisal (RABA), an analytical framework that
combines, summarizes and adapts different approaches to collect data and appraise the conservation
value of an area rapidly. The Quick Biodiversity Survey method is used when detailed and recent
biodiversity data are unavailable or where previous information on biodiversity may need to be validated.
For plants, they identify and count large trees and saplings, employing the belt transect method, where
plots of a certain size are delineated along a 1 km transect. The sample plots differ in size according to
the size of the plants being surveyed.
Reference/contact: World Agroforestry Centre, Trees in Multi-Use Landscape in Southeast Asia (TUL-
SEA) project, Nurhariyanto, Pandam Nugroho, Jihad, Laxman Joshi and Endri Martinid.
2.5 Rapid plant assemblage analysis.
This method was used to conduct a rapid plant assemblage analysis based on quick estimation of basal
area and tree density. The sampling method uses a transect from a central 60-metre line, from which
sampling plots are then established based on tree distance criteria. It was used to determine the
conservation value of rubber agroforests in Indonesia.
Reference/contact: Douglas Sheil, CIFOR (not contacted directly), World Agroforestry Centre – ICRAF.
2.6 Inventory of woody species
This method was used in a study aimed at characterising and quantifying tree diversity of parkland
systems, taking into consideration the household‘s wealth status, land uses, market access and the type
of farming system, factors that could be related to the dynamics of degrading parklands, specifically in
Burkina Faso. Tree inventory, with all living trees identified, counted and measured, combined with
participatory analysis of wealth status of the households, were the techniques used.
Reference/contact: Jules Bayala or Antoine Kalinganire, World Agroforestry Centre (ICRAF).
2.7 Tree species diversity in agroforests in Nigeria.
This method was used in studies in cocoa plantations in Nigeria; it collects detailed measurements of
trees and identifies exotic and indigenous species and their frequency and tree uses in villages and
forest reserves. It compares cocoa farms with forests.
Reference/Contact: David Boshier, Department of Plant Sciences, University of Oxford. Contact at
Bioversity International: Michele Bozzano.
2.8 Rapid assessment of plant diversity patterns
This method uses a gradient analysis approach to quantify species-environment relationships, with
sampling units selected to span dominant environmental gradients. It is suitable for studies at landscape
level. Sampling locations are previously selected with satellite imagery and a Modified-Whittaker nested
vegetation sampling plot is set at each location. It calculates species-area curves and estimates species
richness for the different vegetation types where the sampling plots were located.
References/Contact: Thomas Stohlgren, National Biological Service, USA (not contacted directly).
22
2.9 Rainforest Alliance Criteria
Rainforest Alliance Certified farms meet the comprehensive standards of the Sustainable Agriculture
Network (SAN), which address social, economic and environmental criteria. A set of generic guidelines
were created, and contain indicators to help implementing Good Agricultural Practices (GAP) on farms.
The SAN guiding principles relevant for biodiversity assessment were reviewed, specifically: 2.
Ecosystem Conservation; 8. Integrated Crop Management; and 9. Soil Conservation. For Ghana, local
guidelines for cocoa plantations were defined and include an interpretation of the relevant binding
criteria, adjusted to the environmental and social conditions in the country, which are also described.
2.10 UTZ Certified code of conduct for cocoa
The codes of conduct of UTZ Certified assure good agricultural practices and management, safe and
healthy working conditions, no child labour and protection of the environment, under a model of
continuous improvement with detailed requirements added over the years. They comprise a set of
control points, divided by thematic chapters, which the farmers need to comply with. The control points
related to Varieties and rootstocks, Soil management & Cocoa farm maintenance and Natural resources
and biodiversity potentially relevant to this project are described.
23
2.1. Plant functional type method
2.1.1. Origin of the method:
Summary: Standard methods of vegetation classification and survey tend to be either too broad for
management purposes or too reliant on local species to support inter-regional comparisons. A new
approach to this problem uses species-independent plant functional types with a wide spectrum of
environmental sensitivity.
Full: Conservation planners and managers face increasing demands for rapid resource appraisals that
are relevant to management at local, regional, and global scales. Rapidly diminishing biodiversity
resources and escalating concern about the impact of global change make it increasingly clear that there
is a need for ready access to generic, low-input, high-return classification and survey methods. This level
of urgency demands a break from traditional, logistically demanding methods that focus on highly
detailed inventories of restricted areas with limited potential for extrapolation. Instead, the emphasis
should be on methods that can provide a rapid overview of environmental variability and the manner in
which biota respond to change along biophysical environmental gradients.
A functional type is defined as ―sets of organisms showing similar responses to a suite of environmental
conditions and having similar effects on the dominant ecosystem processes‖ (Diaz 1998, cited by
Gillison 2002 and Gillison et al., 2004).
It is a relatively new approach that focuses on the adaptive responses of plants in a way that
complements taxonomic and vegetation structural features. It is based on the interactions between the
plants‘ functional elements and the biophysical environment, which allows using plants as indicators of
habitat conditions and modifications. It is important at the outset to emphasise that the method described
below is in no way intended to replace the use of taxa in inventories, but rather to complement
particularly in situations in which their information may be lacking, as is frequently the case in complex,
tropical humid forests.
2.1.2 Objectives:
The plant functional type method, when used together with vegetation structure, facilitates rapid
vegetation assessment that complements species-based data and makes possible uniform comparisons
of vegetation response to environmental change within and between countries. More specifically, the
objectives of this method are:
- To identify correlations between singular functional attributes of plants with the biophysical
environment
- To assess functional differences within and between species in gradients of differing physical
conditions
- To compare organism response to environmental change
- To develop a more efficient description of vegetation dynamics
Assumptions: NA
2.1.3 Description:
Plant functional types can be constructed according to specific combinations from within a generic set of
35 adaptive, morphological plant functional attributes. Each combination assumes that a vascular plant
individual can be described as a "coherent" functional unit, being composed by the photosynthetic
envelope and the vascular support system. Each of these components is made of particular attributes
that are identified by specific functional and morphological elements. The set of attributes that describes
an individual is called a modus, reflecting the core attributes of growth, physiology and survival of a
24
plant. The modus is represented by grammar descriptors and syntactic rules, allowing for many
combinations of attributes (modi). A set of 46 transformation rules was also created, based on
subjectively weighted values, to transform one modus to another and to calculate the relative distances
(minimum cumulative values for a transformation to occur) between them.
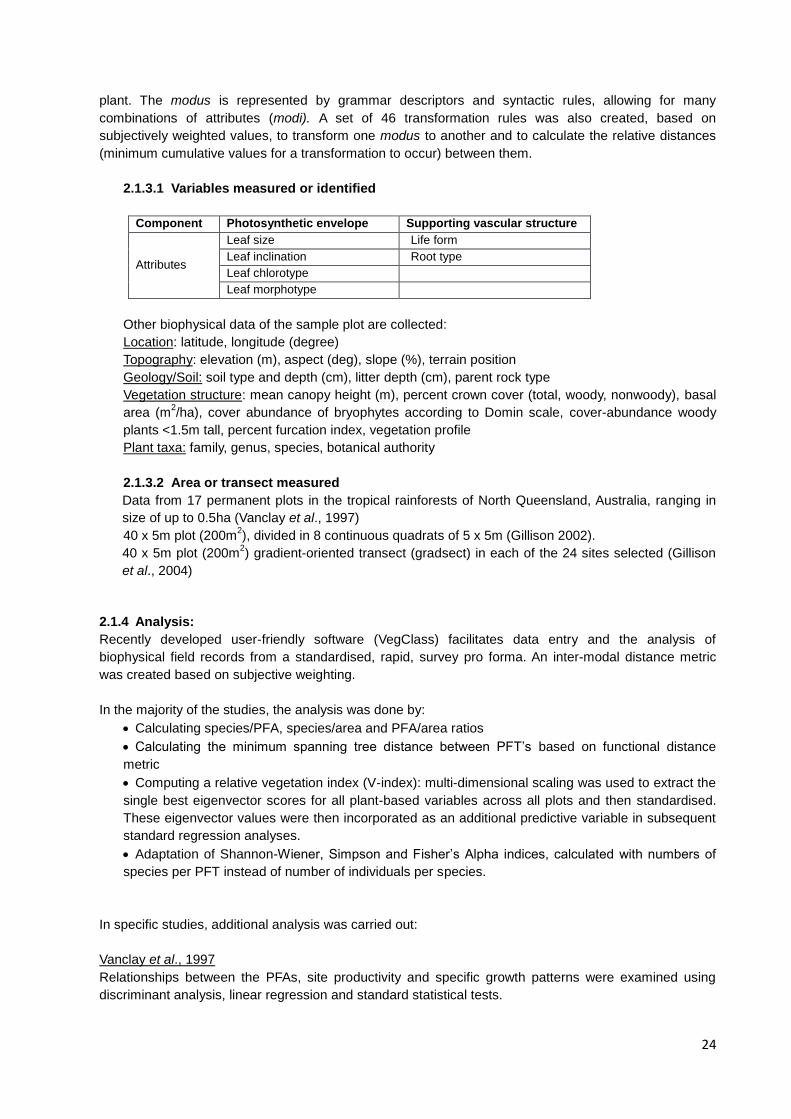
2.1.3.1 Variables measured or identified
Component Photosynthetic envelope Supporting vascular structure
Attributes
Leaf size Life form
Leaf inclination Root type
Leaf chlorotype
Leaf morphotype
Other biophysical data of the sample plot are collected:
Location: latitude, longitude (degree)
Topography: elevation (m), aspect (deg), slope (%), terrain position Geology/Soil: soil type and depth (cm), litter depth (cm), parent rock type Vegetation structure: mean canopy height (m), percent crown cover (total, woody, nonwoody), basal
area (m2/ha), cover abundance of bryophytes according to Domin scale, cover-abundance woody
plants <1.5m tall, percent furcation index, vegetation profile Plant taxa: family, genus, species, botanical authority
2.1.3.2 Area or transect measured
Data from 17 permanent plots in the tropical rainforests of North Queensland, Australia, ranging in
size of up to 0.5ha (Vanclay et al., 1997)
40 x 5m plot (200m2), divided in 8 continuous quadrats of 5 x 5m (Gillison 2002).
40 x 5m plot (200m2) gradient-oriented transect (gradsect) in each of the 24 sites selected (Gillison
et al., 2004)
2.1.4 Analysis:
Recently developed user-friendly software (VegClass) facilitates data entry and the analysis of
biophysical field records from a standardised, rapid, survey pro forma. An inter-modal distance metric
was created based on subjective weighting.
In the majority of the studies, the analysis was done by:
Calculating species/PFA, species/area and PFA/area ratios
Calculating the minimum spanning tree distance between PFT‘s based on functional distance
metric
Computing a relative vegetation index (V-index): multi-dimensional scaling was used to extract the
single best eigenvector scores for all plant-based variables across all plots and then standardised.
These eigenvector values were then incorporated as an additional predictive variable in subsequent
standard regression analyses.
Adaptation of Shannon-Wiener, Simpson and Fisher‘s Alpha indices, calculated with numbers of
species per PFT instead of number of individuals per species.
In specific studies, additional analysis was carried out:
Vanclay et al., 1997
Relationships between the PFAs, site productivity and specific growth patterns were examined using
discriminant analysis, linear regression and standard statistical tests.
25
Gillison 2002 Vegetation assemblages analysed with a multidimensional generalisation of the Wald-Wolfowitz two-
sample test.
Gillison et al., 2004 Gower similarity measure with the multivariate exploratory data analysis software PATN; due to lack of
replicates and complexity of plot samples standard sampling and statistical methods were not possible.
Linear and polynomial regressions for analysis of correlations with biophysical variables.
Cluster analysis of the average vegetation structure variables and PFT ratios.
2.1.5 Time and resources investment:
Survey takes 3 hours to complete the data compilation by experienced observers, on a typical plot in a
complex, humid tropical lowland forest. Software to compile and analyse the data is available
(VegClass).
2.1.6 Strengths and weaknesses
Strengths
Data can be rapidly acquired, analysed, and communicated to conservation managers;
Greatly reduces the amount of data gathered, builds more manageable entities – faster to process;
Readily observable and measurable attributes;
Allows for assessment of vegetation structure
Includes measurement of canopy cover and basal area
No need a priori for species identification to conduct analysis of functional components;
It can be done by observers with minimal training;
PFA represent key adaptive features that can be used for general purposes, no need for life-history detailed knowledge;
It can be applied to any assemblage of vascular plants (although intended for land-based plants initially);
The use of the grammar assists in data compilation and quality control (e.g. finding impossible rules);
Potential application in the prediction of vegetation response to environmental impact
Cost-efficient, logistics acceptable, increased survey efficiency
The generic nature of the system favours data networking, knowledge-share and technology transfer
Provides baseline information about the underlying natural resource and the impact of land use and other disturbances on this resource
Weaknesses
Complementary method; simple classification misses relevant data, it lacks species identification
Does not include description of uses or any information obtained from species data
Standard species diversity indices cannot be computed (need to be adapted)
Missing info on life-history – measures only partial component of biodiversity (not in-depth)
Size of sample plot small – suitable for targeted habitats. Likely to be difficult to expand to larger
sample areas
2.1.7 Initial assessments and observations
Vanclay et al., 1997 Applied to mixed-species rainforest in Australia. Based on individual tree growth of 18 reference species.
This method of PFT measurement provided a more efficient prediction of site productivity potential. Mean
leaf size and the incidence of species with vertical leaf inclination (more than 30‖ above horizontal) were
significantly correlated with site productivity.
26
Five PFAs offer a useful basis for forming species groups for modelling: leaf size and inclination, a
furcation index and the presence of lenticels and chlorophyllous tissue on the main stem.
Gillison 2002 100 sites covering a wide range of environments (eg: Brazilian cerrado/woodland savannah, jungle
rubber in Sumatra, jungle cocoa in Cameroon, oil palm plantations in Brazil and Papua New Guinea).
All vascular plant species and all unique plant functional types in the sample plot are recorded during the
field work.
Sumatra, Indonesia (Riau Province) – high numbers of mostly woody species and PFT were found (217
and 73, respectively) and a logging moratorium was established to allow further investigation;
Amazon Basin – survey carried out in primary tropical lowland rain forest, lower numbers (60 species
and 40 PFT).
Gillison et al., 2004
Applied to coffee agrosystems in Sumatra, Indonesia. Target area was a coffee-based production system
in a relatively remote, upland tropical forested landscape: Sumberjaya, Lampung Province, where 24
sites were selected as representative of different levels in a gradient of land-use intensity.
Highest biodiversity found in the more complex agro-forest systems with coffee grown with shade and in
late secondary and closed-canopy forests.
PFT and species richness useful in predicting site and soil conditions and can be predictors of
production and profitability.
Age of particular land-use sequence can be a simple indicator of biodiversity and soil nutrients within the
context of the study. Tree dry weight also a potential indicator of biodiversity and site condition.
2.1.8 References
European Learning Network on Functional AgroBiodiversity (ELN-FAB). Online at: http://www.eln-fab.eu/
Gillison A. 2002. ―A Generic, Computer-assisted Method for Rapid Vegetation Classification and Survey :
Tropical and Temperate Case Studies,‖ Conservation Ecology 6(2): 1-17,
http://www.ecologyandsociety.org/vol6/iss2/art3/.
Gillison AN, Carpenter G, 1997. ―A generic plant functional attribute set and grammar for dynamic
vegetation description and analysis,‖ Functional Ecology 11: 775-783,
http://www.cbmglobe.org/pdf/gillison_carpenter_97.pdf.
Gillison AN, Liswanti N, Budidarsono S, van Noordwijk M, and Tomich TP (2004),―Impact of Cropping
Methods on Biodiversity in Coffee Agroecosystems in Sumatra, Indonesia,‖ Ecology and Society 9, no. 2:
1-31, http://www.ecologyandsociety.org/vol9/iss2/art7.
Vanclay JK, Gillison, AN, Keenan RJ. 1997. ―Using plant functional attributes to quantify site productivity
and growth patterns in mixed forests‖, Forest Ecology and Management 94: 149-l 63
27
2.2. Transects and significant species only method
2.2.1 Origin of the method:
According to McCullough et al. (2006), this method is part of the Rapid Assessment Program (RAP) of
Conservation Alliance, whose surveys provide a quick assessment of the biological value of an area and
identify species in need of conservation action. This program started in 1990 and is considered an
―innovative biological inventory program designed to generate scientific information to catalyse
conservation action in tropical areas that are under imminent threat of habitat conversion.‖
Two applications of the method in different survey areas of Ghana are presented, for a better illustration
of its objectives and characteristics.
2.2.2 Objectives:
To provide management and research recommendations together with conservation priorities;
To make this information publicly available to increase awareness of the region and promote its
conservation;
Area 1
To know better the forest composition of the Atewa Range Forest Reserve and formulate
conservation recommendations
Area 2
To conduct a rapid, first-cut assessment of species diversity in Ajenjua Bepo and Mamang River ;
To compare the two forest reserves‘ biodiversity profiles;
To evaluate the relative conservation importance and threats to this biodiversity within each area.
2.2.3 Assumptions: For area 1, this method looks at important trees for farmers, trees which provide economic, health,
ecological or other benefits to farmers (including shade to cocoa trees): which species are present and
how many. Afterwards, extrapolation to which ecological services are provided by those trees can be
done. In area 2, it is assumed that the area selected has unique or endemic species and/or ecosystems. The
RAP expeditions survey focal taxonomic groups as well as indicator species, with the aim of choosing
taxa whose presence can help identify a habitat type and its condition.
2.2.4 Description:
2.2.4.1 Variables measured or identified
Forest trees and all vascular plant species were identified on 3 sites, using four Temporary Sample
Plots (TSP) of 50m X 50m and regeneration subplots of 10m X 10m at each site. Flora of less than
5cm diameter at breast height (DBH) at a height of 1.3m was identified inside the subplot.
2.2.4.2 Area or transect measured
Transect walks of at least 6 km were traversed. Existing timber hauling roads, footpaths and lines cut
through forest were used as transects. Trees within 20m on either side of each transect were
identified (2 transects per village).
28
2.2.5 Analysis:
Species richness, diversity and density (including tree population). No more details available.
Scoring of the health of the forest. This score is based on a classification system developed by
Hawthorne & Abu-Juam (1995)1 to evaluate the condition of forest reserves in Ghana. The scale of the
system extends from a score of 1 (excellent condition) to 6 (no significant forest remaining).
Recording of the presence of black and gold stars species on the sites (the star rating of a species
defines its weight for the calculation of weighted average referred to as Genetic Heat Index (GHI) which
provides a framework for defining the conservation merit of a tract or sample of forest of any size. The
star system is related to the rarity and conservation priority of a species, among other characteristics.
For area 2, the plants were grouped in ecological guilds according to: pioneer, NPLD (non-pioneer light
demanding), shade and swamp.
2.2.6 Time and resources investment: In area 1, a 3 weeks period was necessary (1 week per site) to
do the survey. In area 2, approximately 1 week per site was needed, in total 2 weeks. The team
comprised experts specialising in West Africa‘s ecosystems and biodiversity.
2.2.7 Strengths and weaknesses
Strengths
Brief and thorough overview of species diversity
Suitable for targeted sites from a point of view of conservation
Collection of data on other aspects of forest and land use (conservation perspective)
Assessment of the influence of human activities in the sample plots
Allows for assessment of forest structure (regeneration subplots)
Definition of conservation recommendations is possible
Comparisons can be done with other RAP surveys in other areas
Weaknesses
Requires a priori knowledge (extensive training), carried out by experts on West Africa‘s
ecosystems and biodiversity
No functional attributes retrieved
Complementary method, used to confirm existence of significant species
Suitable for targeted sites from a point of view of conservation, missing other purposes
Solid comparisons possible only with other RAP surveys
2.2.8 Initial assessments and observations: Survey done on a forest reserve, not on a cocoa
plantation. The surveys were carried out on three hill summits on the Atewa Range, previously selected
to coincide with areas of high biodiversity. They were verifying the level of endemism and uniqueness of
the ecosystems, to complement previously collected information under a conservation point of view.
1Hawthorne, WD, Abu-Juam, M. 1995. Forest protection in Ghana with particular reference to vegetation and plant species. IUCN,
Forest Conservation Programme ; United Kingdom, Overseas Development Administration ; Ghana, Forestry Department - Gland : IUCN
29
2.2.9 References
Notes taken from a phone call and details added using Yaw‘s draft report (Osei-Owusu Y. 2012. Plant
survey Atewa Range Forest Reserve. Draft Report).
FAO. 2001. Country Report – Ghana. Available at: http://www.fao.org/docrep/003/ab567e/AB567E02.htm
McCullough J, Alonso LE, Naskrecki P and Osei-Owusu Y. 2006. ―A Rapid Biodiversity Assessment of
the Atewa Range Forest Reserve, Ghana‖. RAP Bulletin of Biological Assessment 47. 184 pages,
Conservation International Rapid Assessment Program.
McCullough J, Hoke P, Naskrecki P, Osei-Owusu Y. (eds). 2008. A Rapid Biological Assessment of the
Ajenjua Bepo and Mamang River Forest Reserves, Ghana. RAP Bulletin of Biological Assessment 50.
100 pages. Conservation International Rapid Assessment Program.
30
2.3. Quadrats and species with certain criteria method
2.3.1 Origin of the method: No mention of the origin of the method
2.3.2 Objectives: To evaluate the diversity of trees associated with cocoa inside cocoa agroforests.
2.3.3 Assumptions:
1) a more diverse agroforest can complement natural forests for ecological services at landscape level
(Schroth et al., 2004);
2) A system consisting of a mixture of cocoa, wild forest trees and/or exotic trees leads to a multi-strata
and multi-species system with a structure and function similar to forest (Duguma et al., 2001; FAO, 2002,
from Sonwa et al., 2009).
2.3.4 Description:
2.3.4.1 Variables measured or identified
All individual plants associated with cocoa, with diameter at breast height (dbh) of ≥ 2,5cm were
identified following Letouzey (1982) and Vivien & Faure (1985 & 1996) and compared with
specimens at the National Herbarium in Yaoundé. One key-informant per village is interviewed to
record main use of species (edible, medicinal, high value or low value timber, others).
2.3.4.2 Area or transect measured
In 4 villages of a region in Cameroon, 5 representative cocoa agroforests randomly selected in each
village. In each cocoa farm, 25% of the entire agroforest was surveyed. This sample area was further
divided in elementary plots of 25m X 25m (625m2), comprising a total of 44 plots and a total
sampling area of 2.75ha.
One key-informant per village is interviewed to record main use of species (edible, medicinal, high
value or low value timber, others).
2.3.5 Analysis: Floristic diversity (species richness, diversity using Shannon and Simpson indexes,
Piélou equitability), Sorensen index, density of plants. More details below.
Species richness was expressed as the number of accompanying species per cocoa plantation,
obtained by counting all species found in the survey plots (Sonwa et al., 2009)
Total number of species per village
Average number of species per cocoa field (or agroforest) calculated, for each village and for the
entire study area
Diversity index calculated using the Shannon index and the Simpson index
The Simpson index expresses the probability of two individuals taken randomly to belong to the
same species. It is therefore the inverse measurement of the diversity
Piélou equitability: gives information on the distribution of individuals among the species,
corresponding to the ratio between the observed diversity and the maximum expected diversity
Similarity between villages was evaluated using the Sørensen index (CC) to find the number of
species common between village agroforests
Density per hectare of associated plants, divided by utility (exotic edible, wild edible, high value
timber, low value timber, medicinal and other utility), per village
Density of plants for each village was calculated as an average density of each of the 5 cocoa
farms in the village
Abundance of species
31
Discussion includes:
Comparing diversity of cocoa associated plant in that region with the diversity of cocoa associated
plant in other regions of the same country and with other countries of the West African region
(extrapolating from references)
Comparative analysis of species uses/utility including wild vs. exotic edible species in between villages
and compared also with production of other agricultural products in the area (extrapolated from
references)
Opening about the particular combination of the different tree species in the agroforests, creating a
similar environment to an original forest and thus providing low intensity forest ecological services (from
Sonwa 2004, cited in Sonwa et al., 2009)
2.3.6 Time and resources investment:
National Herbarium information needed for tree species identification.
Time allocated to field work and data analysis not mentioned.
2.3.7 Strengths and weaknesses
Strengths
Extensive inventory of plant species; abundance and richness retrieved
Possibility to gather data on plant uses – economic motivation
Objectivity, no estimation or subjective evaluation is necessary
Simple procedure, only counts of each species are needed, no particular training needed
There is no need to distinguish individuals in frequency sampling
Standard species diversity and equitability indices can be computed
Contact with local farmers, participatory process
Weaknesses
Does not consider functional types
Requires previous knowledge on plant species and/or herbarium comparison - it may be time-
consuming
Values dependent on size of sample plots
Site-specific, results difficult to extrapolate
2.3.8 Initial assessments and observations
Plant diversity in the fringes of Yaoundé is low compared to other cocoa belts of Cameroon but high in
comparison to cocoa agroforests of West Africa in general. A total of 101 species was found in the total
sample area; on average, each cocoa agroforest has 15 species.
Consumable species, mostly exotic, dominate the plants associated with cocoa at the fringe of Yaoundé.
Exotic species constitute 1/3 of individual trees in cocoa forests. Around two-thirds are trees producing
edible products, only one out of six are timber species.
The 10 most abundant species comprise 67% of the trees found inside cocoa agroforest
Some five species found inside the cocoa agroforest of this area are classified as Vulnerable by IUCN.
Density of exotic species and high value timber species varied between villages. Only 10% of species
are found in all cocoa agroforests in the study area.
Sonwa et al. (2007, see reference below) use the same method, just adding 2 sub-regions with 4 villages
each (total of 12 villages, 60 cocoa agroforests surveyed and 146 elementary plots); in this case, the
sampling plots were selected according to a gradient of population density, resource use intensity and
market access. Same analysis and indexes used, comparisons were made between sub-regions and the
influence of the gradient of the three human variables in plant diversity was considered. The results
32
suggest that increasing population density, market access and resource (land) use intensity are
associated with a decrease in the number of local forest tree species in cocoa agroforests.
2.3.9 References
Sonwa, Denis J., Nkongmeneck Bernard A., Weise Stephan F., Tchatat Maturin, Adesina Akin A,
Janssens Marc J. J. 2007. ―Diversity of plants in cocoa agroforests in the humid forest zone of Southern
Cameroon.‖ Biodiversity and Conservation 16, no. 8 (May 31, 2007): 2385-2400.
Sonwa, Denis J., Bernard A. Nkongmeneck, Stephan F. Weise, Maturin Tchatat, and Marc J.J. Janssens.
2009. ―Tree diversity of the cocoa agroforest around Yaounde (Southern Cameroon)‖. In Systematics
and Conservation of African Plants, edited by X. van der Burgt, J. van der Maesen, and J.-M. Onana,
691-699. Kew: Royal Botanic Gardens, 2009.
33
2.4. Quick Biodiversity Survey (QBS) method
2.4.1 Origin of the method: This method is part of the Rapid Agrobiodiversity Appraisal (RABA) in the context of Environmental
Service Rewards method; also developed by ICRAF scientists (see reference below).
The Rapid Agro-Biodiversity Appraisal (RABA) (Kuncoro et al., 2006) is a diagnostic tool designed to
appraise perceptions of different stakeholders related to conservation in a target area and to assess the
feasibility of a PES mechanism. RABA is an analytical framework that combines, summarises and
adapts diverse approaches to collect data and appraise the conservation value of an area rapidly.
Extensive consultations are held with both buyers and sellers of conservation services, usually in
landscapes of high biodiversity value or that harbour species of special interest such as tiger, orangutan,
rhino or endangered bird species. Data on such high-value species and biodiversity richness are usually
available. Detailed biodiversity surveys are usually tedious, time consuming and can be conducted only
by experts. Occasionally, however, where detailed recent biodiversity data are unavailable or where
previous information on biodiversity may need to be validated, a rapid biodiversity survey of indicator
plant and animal groups may provide sufficient information necessary for a RABA. The Quick
Biodiversity Survey or QBS tool was developed for this purpose (source:
http://worldagroforestry.org/sea/projects/tulsea/sites/default/files/inrm_tools/09_TULSEA_QBS.pdf).
QBS uses indicator animal groups - dung beetles, bats, small mammals, primates, birds - in addition to
plants. Only the method applied to plants will be described here below.
2.4.2 Objectives: The QBS method is used when detailed recent biodiversity data are unavailable or where previous
information on biodiversity may need to be validated. The QBS uses indicator animal groups in addition
to plants. For plants, they identify and count large trees and saplings.
2.4.3 Assumptions:
The RABA was developed under the assumption that effective natural resource management, including
biodiversity conservation, can only be achieved if there is a synergy between three different types of
capital: human, natural and social. The combination of all three provides the basis for evaluation of local
agrobiodiversity for conservation. The QBS is applied to assess the natural capital of an area.
2.4.4 Description:
2.4.4.1 Variables measured or identified
Number of plants of each species in different size-related groups
2.4.4.2 Area or transect measured
The Quick Biodiversity Survey (QBS) employs the belt transect method, where plots of a certain size
are delineated along a 1 km transect. The sample plots differ in size according to the size of the
plants being surveyed, as described below.
Trees: set up ten 8m x 8m sample plot at every 100m distance along a 1 km long transect. Record
all trees with girth of 31cm and above; identify local and/ or scientific names, if possible their
phenology (fruiting and flowering). Only indicator plants can also be recorded.
Saplings: set up ten 4m x 4m sample plot at every 100m distance along the same 1-km transect.
Record all plants below 31cm girth but above 2m height. Identify their local and/or scientific names.
Count the number of all saplings in each plot.
34
If a plant (tree and sapling) cannot be identified positively, collect its specimen for later
identification.
Collect information about seed dispersal mechanism (wind, long range animal, short range animal
and large seeded autochory meaning seeds and fruits dispersed through some kind of physical
explosion) from the local people and/ or literature.
A local guide who is knowledgeable about local plants is necessary for the field work.
Time and other resource permitting, the number of transects can be increased to improve the
accuracy of survey data.
2.4.5 Analysis:
Number of species (for trees and for saplings)
Number of genera (for trees and for saplings)
Number of families (for trees and for saplings)
Number of trees and of saplings
Tree or sapling density (m-2, mean +- S.D.)
Diversity index (for trees and for saplings), including:
o Shannon-Wiener‘s index
o Shannon-Wiener‘s evenness
o Simpson‘s index
2.4.6 Time and resources investment: The entire field work of the QBS (including the plants and
animals survey) can be conducted in 2 weeks, while the species identification should be done in
consultation with experts. In general, the survey, identification, data analysis and reporting can be
completed in about six weeks (for plants and animals survey).
2.4.7 Strengths and weaknesses
Strengths
Time efficient
Allows for forest structure analysis (collects data on plants of different sizes)
Possible to assess some indicators of succession dynamics, it collects data on plants growth (e.g.,
to check if the number of elements of each species are the same in the tree and sapling plots and
find the causes of discrepancies, in case they exist; analysis of distribution of diameter classes)
Allows for adjustments in the method (increase number of plots)
Computation of standard diversity indices possible
Weaknesses
Requires expert knowledge for identification of species
High biodiversity spots should be previously selected, previous knowledge of the area needed
Complementary method included in a wider approach (RABA)
2.4.8 Initial assessments and observations
This particular method has been applied in the sacred forests of Ban Mae Hae Tai Karen and Ban Mude
Lhong Lawa villages, Chiang Mai, Thailand, for trees and sapling survey. In this case it was shown that
the sampling areas covered by the QBS method, selected through species area curves, might not be
representative of the populations.
It is mentioned a survey carried out in rubber forests in Indonesia, however the sampling method is
different (see below, Sheil et al., 2003).
35
2.4.9 References
http://worldagroforestry.org/sea/projects/tulsea/sites/default/files/inrm_tools/09_TULSEA_QBS.pdf
Kuncoro SA, van Noordwijk M, Martini E, Saipothong P, Areskoug V, EkaDinata A and O'Connor T. 2006.
Rapid Agrobiodiversity Appraisal (RABA) in the Context of Environmental Service Rewards. Bogor,
Indonesia. World Agroforestry Centre - ICRAF, SEA Regional Office. 106 p.
Additional notes:
Kuncoro et al. (2003) refer to the sampling method described by Sheil et al. (2003) which was applied for
the RABA in Indonesia, to assess plant diversity in rubber agroforest in the Bungo District, Jambi Area,
Sumatra. This method is presented next as method 5.
36
2.5. Rapid plant assemblage analysis
2.5.1 Origin of the method:
This method is part of the Rapid Agrobiodiversity Appraisal (RABA) in the context of Environmental Service Rewards method; also developed by ICRAF scientists (Kuncoro et al., 2003). Please see detailed description in the previous method. This method was applied in the Bungo district in Sumatra, Indonesia, since this area was being
promoted for biodiversity conservation as part of a RABA process. The rubber agroforest known as
jungle rubber (a type of agroforest in which rubber trees (Hevea brasiliensis) are planted together with
fruit trees and timber trees) in this area are able to provide refuges for species from nearby forest and
serve as ecological corridors. The rubber agroforestry, with its high plant assemblage diversity and
dense canopy cover exhibits potential as a 'steeping stone' providing temporary habitat for endangered
species to move between protected areas.
2.5.2 Objectives
To conduct a rapid plant assemblage analysis in rubber agroforests, in order to determine conservation
value in the Bongo district, Indonesia.
2.5.3 Assumptions
The calculation of the value of the rubber agroforests follows certain assumptions:
Based on ICRAF's previous study, the extent of biodiversity richness (both plants and animals) of rubber agroforest correlates positively with basal area.
Factors that influence the extent of biodiversity in a plot of rubber agroforest include management intensity and distance from the plot to forest. Assemblages of biodiversity depend on the number of non-rubber species growing in a plot. Additionally, plots adjacent to forest tend to have more plant diversity than do those further away.
A plot in which many fruit trees are grown would be preferred, as it may be used as a feeding ground by various animals.
2.5.4 Description:
2.5.4.1 Variables measured or identified
Information on basal area and density in combination with plant inventory data as a reference (done
by ICRAF and IRD since 2001 in this area) are used as indicators of biodiversity level of rubber
agroforests (RAF).
2.5.4.2 Area or transect measured
Sampling plots were created with two or three linear transects made in every hectare.
The method of assessing plant diversity rapidly used in this research was developed by Sheil et al.
(2003) and uses a 60-metre line made in the 'representative' location; for the case of Bungo,
'representative' potential area for biodiversity conservation is selected among rubber agroforests that
are more than 25 years old, where observation indicates relatively high plant (fruit) diversity.
Six vegetation transects using Sheil et al. (2003) method have been taken in Lubuk Beringin cluster.
Transect-site selection was done purposively, of which two transects were made in agroforest with
good biodiversity (using understorey flora as indicator), two transects in agroforest with many fruit
trees, and the other two transects in productive rubber, in which rubber domination is more than
60%.
37
2.5.5 Analysis
Basal area (BA) ratio refers to the ratio of BA rubber divided by BA total, while the density ratio is the
ratio of rubber density divided by total density. Further analysis is possible by plotting the basal area data
to GIS to see any relationship with digital patch value.
Similarity analysis, done to observe the percentage of forest-dependent species that can be harboured in
rubber agroforests, was carried out by measuring aspects of distance to forest and management
intensity. The result is compared with the species assemblages from different plots.
Additionally, diversity indices of Simpson and Fisher-Alpha were derived from calculating the plot-based
qualitative data.
2.5.6 Time and resources investment
The sampling and the estimation of parameters are time-efficient.
Sheil et al. (2003) field trials showed that the procedures were easily applied in all but the thickest
vegetation. Very little time was spent on plot establishment, or measuring distances (about 3 to 10
minutes depending on terrain and the need to cut marker sticks). In general the distances were easily
observed.
2.5.7 Strengths and weaknesses
Strengths
The sample unit is quick and easy to apply even in difficult terrain;
Time-efficient
Accurate judgements can be made rapidly without numerous measurements and comparisons
The sample unit remains compact even in sparsely populated, divided, or patchy environments
The central baseline provides a reference line on which to assess accessory data such as soil
properties or other site characters
The amount of information collected varies little even when forest densities vary greatly. The
amount of effort required for each plot is not dependent upon stem densities
Each stem can only be recorded once and the resulting data is simple to compile
The calculation of basic stand parameters from the sample data does not require any
sophisticated analyses
Weaknesses
It‘s an estimation, not a precise assessment
Open patches may impact some of the short variable-area cells, although generally will not result
in unusable sample information
Variation in plot size and shape may not be appropriate for some studies and could confound
relationships
Parameter biases are present
2.5.8 Initial assessments and observations
There was quite a strong tendency that Total Basal Area correlates with the estimated level of plant
diversity. Nonetheless, the very limited number of transects could not support such conclusion
statistically. The highest value of BA in rubber agroforest in Lubuk Beringin (41.60m2/ha) is higher than
the average of secondary forest.
On the basis of the rapid appraisal, the location of Bungo and the existing system of rubber agroforest
have potential for agrobiodiversity conservation. The agroforests have potential as havens for plant
diversity, to act as a buffer zone for adjacent forest and as a corridor connecting national parks inside
and outside of Bungo.
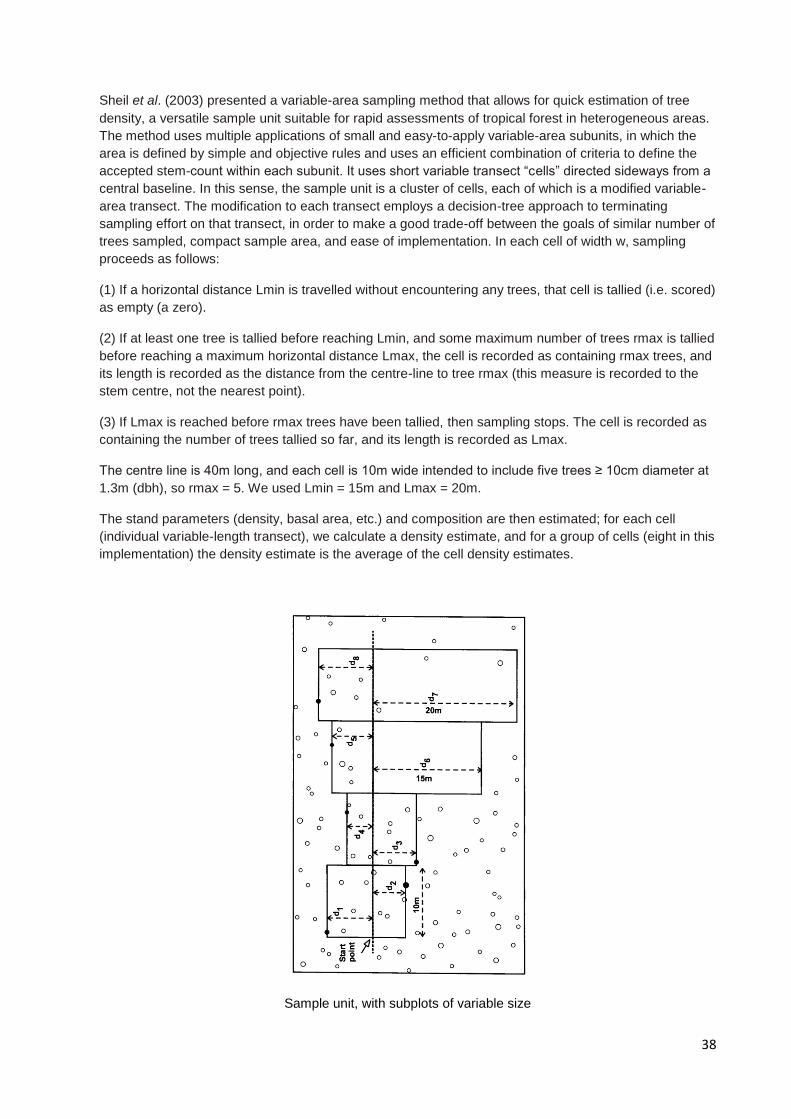
38
Sheil et al. (2003) presented a variable-area sampling method that allows for quick estimation of tree
density, a versatile sample unit suitable for rapid assessments of tropical forest in heterogeneous areas.
The method uses multiple applications of small and easy-to-apply variable-area subunits, in which the
area is defined by simple and objective rules and uses an efficient combination of criteria to define the
accepted stem-count within each subunit. It uses short variable transect ―cells‖ directed sideways from a
central baseline. In this sense, the sample unit is a cluster of cells, each of which is a modified variable-
area transect. The modification to each transect employs a decision-tree approach to terminating
sampling effort on that transect, in order to make a good trade-off between the goals of similar number of
trees sampled, compact sample area, and ease of implementation. In each cell of width w, sampling
proceeds as follows:
(1) If a horizontal distance Lmin is travelled without encountering any trees, that cell is tallied (i.e. scored)
as empty (a zero).
(2) If at least one tree is tallied before reaching Lmin, and some maximum number of trees rmax is tallied
before reaching a maximum horizontal distance Lmax, the cell is recorded as containing rmax trees, and
its length is recorded as the distance from the centre-line to tree rmax (this measure is recorded to the
stem centre, not the nearest point).
(3) If Lmax is reached before rmax trees have been tallied, then sampling stops. The cell is recorded as
containing the number of trees tallied so far, and its length is recorded as Lmax.
The centre line is 40m long, and each cell is 10m wide intended to include five trees ≥ 10cm diameter at
1.3m (dbh), so rmax = 5. We used Lmin = 15m and Lmax = 20m.
The stand parameters (density, basal area, etc.) and composition are then estimated; for each cell
(individual variable-length transect), we calculate a density estimate, and for a group of cells (eight in this
implementation) the density estimate is the average of the cell density estimates.
Sample unit, with subplots of variable size
39
2.5.9 References
Kuncoro SA, van Noordwijk M, Martini E, Saipothong P, Areskoug V, EkaDinata A and O'Connor T. 2006. Rapid Agrobiodiversity Appraisal (RABA) in the Context of Environmental Service Rewards. Bogor, Indonesia. World Agroforestry Centre - ICRAF, SEA Regional Office. 106 p. Sheil, D., Ducey, M.J., Sidiyasa, K., Samsoedin, I. 2003. A new type of sample unit for the efficient
assessment of diverse tree communities in complex forest landscapes. Journal of Tropical Forest
Science 15(1): 117-135.
40
2.6. Inventory of woody species 2.6.1 Origin of the method: Method used by Bayala et al. (2011) Factors Affecting the Dynamics of
Tree Diversity in Agroforestry Parklands of Cereal and Cotton Farming Systems in Burkina Faso, New
Forests, 41: 281-296
2.6.2 Objectives: The whole study aimed at characterising and quantifying tree diversity of parkland systems taking into
consideration the household‘s wealth status, land uses, market access and the type of farming system
(cereal based on the ‗‗Plateau Central‘‘ and cotton based in ‗‗Boucle du Mouhoun‘‘).
These factors, which are affecting the dynamics of the degrading parklands in Burkina Faso, could help
in identifying restoration actions for both production and environmental services to be undertaken in
these socio-economically and ecologically very important systems.
2.6.3 Assumptions
NA
2.6.4 Description
The study was conducted in the cotton farming region of ‗‗Boucle du Mouhoun‘‘ and the cereal farming
region of the ‗‗Plateau Central‘‘ in Burkina Faso. Six villages were studied in each region. In each region,
three villages were selected with easy access and three with poor access to markets.
Participatory analysis of wealth status of the households and tree inventory in the parklands were the
two main methods used in the present study.
Wealth ranking and selection of households: The Participatory Analysis of Poverty and Livelihood Dynamics (PAPoLD) method was used by rural
farmers to rank farmer households of their communities according to their wealth status (Krishna et al.,
2004; Phiri et al., 2004; Bayala et al., 2006). Three groups of wealth status were defined as follows: poor,
fairly well-off and well-off. Five households representing each of the three wealth groups in each village,
i.e. 15 households per village, were randomly selected by wealth group and the tree inventory was
conducted in their fields.
Inventory of woody species: With the help of informants from each village, the different land use types of each selected household
were identified, i.e. house field (HF), village field (VF) and bush field (BF). Tree/shrub inventories were
conducted in all land use types of the 180 selected households for the 12 studied sites.
2.6.4.1 Inventory of woody species: Variables measured or identified
All living trees within the quadrats (as defined below) were identified (scientific name) in the field,
counted and measured. Stem diameter was recorded at breast height (DBH: 1.3m above ground) if
the DBH was greater than 5cm and at 0.3m above ground if the DBH was less than 5cm.
2.6.4.2 Inventory of woody species: Area or transect measured
Rectangular quadrats of 1,000m2 (20m x 50m) were laid out using compass and measuring tape,
and their limits marked with stakes.
41
2.6.5 Analysis
Statistical analysis of survey data was done within the R statistical language and environment (R
Development Core Team 2005) by preparing the data in the required format for the BiodiversityR
package (Kindt and Coe 2005). Two data sets were prepared (BFVF and Plateau –see Bayala et al.,
2011, for details) that described the abundance of all the encountered species on each quadrat. The
environmental data set documented the region, the market access of each village, the village, the wealth
level of households and the land-use type of the quadrat. The graphical user interface of the
BiodiversityR package was used during each subsequent analysis step. Specific functions that were
called by the package are described immediately below.
The total number of species, average number of species per quadrat, average abundance per quadrat
based on stem counts and the first-order Jackknife estimator of gamma diversity (i.e. the total species
richness that would be encountered if the entire area was surveyed) were determined with the
diversitycomp function (BiodiversityR package, based on functions from the vegan community ecology
package). These statistics were calculated for all quadrats, and for quadrats belonging to different
market access levels, land-use types and all possible combinations of market access and land-use type.
As species richness depends on sample size (Gotelli and Colwell 2001) and different numbers of plots
were surveyed within land-uses and market access types, we compared the total number of species on
the basis of species accumulation curves. Species accumulation curves were obtained for quadrats
grouped by market access and land use type with the accumcomp function (BiodiversityR package; this
function is based on the specaccum function of the vegan package). (For further details see Bayala et
al., 2011).
2.6.6 Time and resources investment
No indication.
2.6.7 Strengths and weaknesses of the method
Strengths
Identification of exotic and native trees
Allows for analysis of forest structure (richness and abundance per diameter class)
Participatory approach, includes contribution of farmers in the definition of samples
Analysis package available (open-source R), possible to include additional tools
Assessment of external factors influencing biodiversity in forests (gradient)
Weaknesses
Number of quadrats differed between regions due to sampling scheme (stratified by land use)
Higher number of quadrats was surveyed in villages with little access to market so this might
have influenced on the data, which show higher accumulation of species in those villages.
Misleading data on natural regeneration (plot size effect in number of stems per diameter class)
Need informants from each village (training needs)
2.6.8 Initial assessments and observations
The number of species in the different land use types ranged from 96 to 102, but the majority of species
were represented by less than 10 individuals. This indicates the selection effect made by the farmers to
the parklands. Land use and farming system showed a clear effect on tree diversity in parklands. The
effect of accessibility to market was evident in some cases whereas wealth status did not show any
effect. Despite the statistical significant effect of farming system and land use type, the ANOVA models
accounted for relatively little variation, indicating that other factors may contribute to tree diversity in
parkland systems. The most threatened species were Adansonia digitata, Afzelia africana, Bombax
costatum, Celtis integrifolia, Ficus asperifolia, Ficus iteophylla, Lannea velutina, and Parkia biglobosa.

42
These species were represented in the largest diameter class (C80cm) or showed very few individuals in
the different diameter classes. Due to the increasing degradation of the parklands, a domestication and
conservation strategy of key threatened species needs to be developed and implemented with the
participation of local communities.
2.6.9 References
Bayala J, Kindt R, Belem M, Kalinganire A. 2011. Factors Affecting the Dynamics of Tree Diversity in
Agroforestry Parklands of Cereal and Cotton Farming Systems in Burkina Faso, New Forests, 41: 281-
296.
43
2.7. Tree species diversity in agroforests
2.7.1 Origin of the method Method used in ―Boshier D. 2012. Conservation of tree species diversity in cocoa agroforests in Nigeria.
A case study and teacher‘s note. In: Forest Genetic Resources Training Guide. Edited by D. Boshier, M.
Bozzano, J. Loo, P. Rudebjer. Bioversity International, Rome, Italy. www.bioversity international.org.‖
The case study is based on the following papers:
Oke, DO, Odebiyi, KA. 2007 Traditional cocoa-based agroforestry and forest species conservation in
Ondo State, Nigeria. Agriculture, Ecosystems & Environment, 122: 305-311.
Asare, R. 2005 Cocoa agroforests in West Africa: a look at activities on preferred trees in the farming
systems. Forest & Landscape Working Papers no.6-2005 published on www.SL.kvl.dk 77pp.
Asare, R. 2006 A review on cocoa agroforestry as a means for biodiversity conservation. Forest &
Landscape Conference Paper published on www.SL.kvl.dk 16pp.
Hawthorne, WD. 1995 Ecological profiles of Ghanaian forest trees. TFP 29 Oxford Forestry Inst. 345pp.
2.7.2 Objectives
The tree conservation value of cocoa agroforests was assessed in Ondo State, an important area of
cocoa and timber production in Nigeria. In Ondo State, deforestation for agriculture, including cocoa, is a
serious concern and in an attempt to curb indiscriminate felling of trees and forest, forest reserves were
gazetted across the State. However, these reserves continued to shrink under the pressure of rapid
population growth and the related increased rate of conversion to agriculture. Although there are few
reliable data, it is clear that a large proportion of forest has been converted into cocoa farms, with
associated threats to remnant forest cover. The climate is a tropical monsoon type with two distinct
seasons: rainy (April–October) and dry (November–March). The soils of the study area are a ferruginous
tropical soil (Alfisol) on crystalline rock.
2.7.3 Assumptions
NA
2.7.4 Description:
2.7.4.1 Variables measured or identified
Number of trees of each species identified;
Enumeration of timber species;
All trees greater than 10cm dbh were measured for diameter at breast height;
Detailed measurements of diameter at base (db), middle (dm), top (dt) and height were carried out in
two mean trees in sample plots in forest reserves and in all the trees other than cocoa in cocoa
farms.
2.7.4.2 Area or transect measured
Three villages, close to each of three forest reserves (Idanre, Owo, and Ala Forest Reserves), were
randomly selected as they are within the main cocoa producing areas. Tree diversity was assessed
in sample plots within each reserve, and also on cocoa farms from each of the selected villages.
Three sample plots of 25x25m were demarcated along transect lines in each reserve and all trees
identified. All timber species were counted within each plot, and diameter at breast height (dbh)
measured for all trees greater than 10cm dbh. One productive cocoa farm was selected from each of
the three selected villages. The area of each selected farm was measured and all trees inside the
farm, other than cocoa, were identified, counted and measured in the same way as for the forest.
Basal area and volume of all measured trees in the sample plots and cocoa farms were calculated.
44
2.7.5 Analysis
The following metrics are often used to measure species-level biodiversity, covering species richness or
species evenness:
Species richness: the number of species in an ecosystem: this makes no use of relative abundances.
Species evenness: the relative abundance or proportion of individuals among the species.
Simpson index: takes into account the number of species present, as well relative abundance of each
species. The Simpson index represents the probability that two randomly selected individuals in the
habitat belong to the same species.
Shannon-Weaver index: takes into account the number of species and the evenness of the species.
The index increases either by having additional unique species, or by a greater species evenness.
In this case study, the diversity of non-cocoa tree species (>10cm dbh) in 21ha of cocoa agroforests and
0.56ha of native forest reserve in Ondo State, Nigeria, was measured and data classified as follow:
Species on farm frequency (21ha);
species on farm density per ha;
Species frequency in forest (0.56ha);
Species density in forest per ha;
Species were also classified as native or not; as edible fruit or not and by ecological guild (Pioneer,
Non-pioneer light demander (NPLD), Shade bearer, Savanna, Swamp, NA – no classification available,
exotics are not classified for ecological guild);
IUCN status Category (IUCN status based on 1994 categories as assessments are from 1996-2000
that have not been converted to revised system, EN–Endangered, VU–Vulnerable, LR–Lower risk).
The density (trees/ha), basal area (m2/ha), volume (m
3/ha) and diversity indices (Shannon diversity
index) of non-cocoa trees in cocoa agroforests and natural rainforest were also calculated (with
differences significant at P <0.05).
Finally, the tree species richness (tree species richness / number of trees sampled) in cocoa agroforests
and in primary forest (forest reserve) were also calculated and illustrated with the individual rarefaction
curves and confidence intervals. Rarefaction is a method that allows comparisons of the number of
species found in two areas when sampling effort differs. It was used to generate the expected number of
species in cocoa agroforests and natural forest, with confidence intervals for species richness.
2.7.6 Time and resources investment
Not mentioned.
2.7.7 Strengths and weaknesses
Strengths
Identification of exotic and indigenous species and their frequency
Identification of tree uses
Comparison of cocoa farms with forests
Free software available for data analysis
Computation of standard indices possible
Weaknesses
Experienced taxonomist needed for species identification
Divergent sample size of detailed measurements in cocoa farms and forests
45
2.7.8 Initial assessments and observations
Four hundred and eighty seven trees belonging to 45 species and 24 families were identified in the 21ha
of cocoa agroforests surveyed, with the predominant 10 species accounting for 77% of the total. Edible
fruit species topped the list with Elaeis guineensis, followed by Cola nitida, Citrus sinensis, Mangifera
indica, Anacardium occidentale, Psidium guajava and Persea americana. Overall, 423 edible fruit trees
belonging to 16 species in 13 families were recorded in the 21ha of cocoa agroforests, of which only
26.3% were indigenous (Table 2). Non-fruit tree species that were present in substantial proportions
were Alstonia congensis, Ceiba pentandra, Triplochiton scleroxylon and Milicia excelsa. There were also
indications that some farmers were making deliberate efforts to plant some timber tree species on their
farms, especially Terminalia spp. In the 0.56ha of forest surveyed, 163 trees from 62 species and 29
families were found (Table 2). The dominant tree species were Celtis mildbraedii, Piptadeniastrum
africanum, Afzelia africanum, Antiaris africana, Entandrophragma cylindricum, Brachystegia euricoma,
Canarium schweinfurthii, C. pentandra and A. congensis.
Tree diversity in the natural forest was higher than in the cocoa agroforests, both in terms of the number
of species and by Shannon‘s index (Table 3). Rarefaction curves indicate cocoa agroforests support
lower species richness than a floristically and climatically similar site of native forest (Fig. 1). Basal area
and density of non-cocoa trees in the cocoa agroforests were also low compared to the natural forest
(Table 3).
2.7.9 References
Boshier D. 2012. Conservation of tree species diversity in cocoa agroforests in Nigeria. A case study and
teacher‘s note. In: Forest Genetic Resources Training Guide. Edited by D. Boshier, M. Bozzano, J. Loo,
P. Rudebjer. Bioversity International, Rome, Italy. www.bioversity international.org.
Oke, DO, Odebiyi, KA. 2007. Traditional cocoa-based agroforestry and forest species conservation in
Ondo State, Nigeria. Agriculture, Ecosystems & Environment, 122: 305-311.
46
2.8. Rapid assessment of plant diversity patterns
2.8.1 Origin of the method: This method is based on the study carried out by Peet (1981), who used a
gradient analysis approach to quantify species-environment relationships with sampling units selected to
span dominant environmental gradients in Rocky Mountain National Park. He established 305 vegetation
plots (typically 20-50m plots) and collected data on forest structure, plant species composition and
richness, and environmental characteristics such as slope, aspect, elevation and soil characteristics.
2.8.2 Objectives:
Link plant diversity surveys from plots to landscapes
Estimate total species richness and patterns of plant diversity in a landscape
Assess the completeness of species richness information for specific vegetation types
Quantify total species richness for the study area
Evaluate the contribution of heterogeneous or rare habitats to the diversity of plant species on
the landscape
2.8.3 Assumptions:
Detailed information at multiple scales is needed to evaluate the status and trends of native plant
species, non-native plant species invasions, and the effects of grazing and fire on plant diversity.
However, there are no generally accepted ‗off-the-shelf‘ sampling protocols for botanical surveys at
landscape scales, which can be up to several hundred square kilometres.
2.8.4 Description
The method follows several steps:
1) interpret aerial photography to develop a vegetation type map which includes both homogeneous and
heterogeneous vegetation types and small areas (<0.02ha minimum mapping unit) suspected of having
high numbers or proportions of unique species (‗keystone ecosystems‘);
2) randomly select plot locations in each type and use a multi-scale vegetation sampling design to
assess key aspects of plant diversity (e.g., species richness at multiple scales, plant species cover and
height, patterns of non-native species invasions); five to seven ground truth plot locations per vegetation
type are selected randomly using a randomising function in an image processing system
3) calculate species-area curves corrected for within-type heterogeneity;
4) determine species overlap among communities to estimate the total number of plant species in the
landscape.
2.8.4.1 Variables measured or identified
Percent cover by species and average height by species are recorded in the 1m2 subplots.
Cumulative species (additional species found in the subplot or plot) are recorded successively in the
other plots.
2.8.4.2 Area or transect measured
At each randomly selected ground truth sampling point (five to seven ground truth plot locations per
vegetation type, a Modified-Whittaker nested vegetation sampling plot was established within the
vegetation type and across the major environmental gradient. Three to five Modified-Whittaker plots
were established in each vegetation type area.
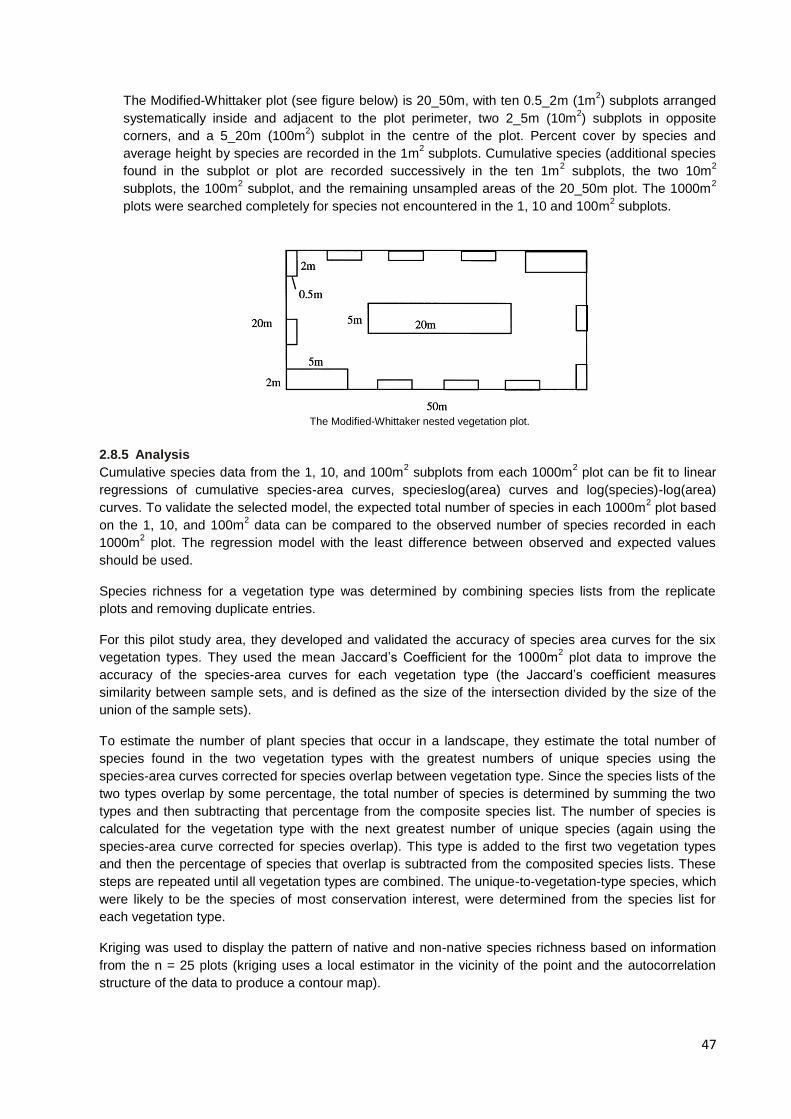
47
The Modified-Whittaker plot (see figure below) is 20_50m, with ten 0.5_2m (1m2) subplots arranged
systematically inside and adjacent to the plot perimeter, two 2_5m (10m2) subplots in opposite
corners, and a 5_20m (100m2) subplot in the centre of the plot. Percent cover by species and
average height by species are recorded in the 1m2 subplots. Cumulative species (additional species
found in the subplot or plot are recorded successively in the ten 1m2 subplots, the two 10m
2
subplots, the 100m2 subplot, and the remaining unsampled areas of the 20_50m plot. The 1000m
2
plots were searched completely for species not encountered in the 1, 10 and 100m2 subplots.
The Modified-Whittaker nested vegetation plot.
2.8.5 Analysis
Cumulative species data from the 1, 10, and 100m2 subplots from each 1000m
2 plot can be fit to linear
regressions of cumulative species-area curves, specieslog(area) curves and log(species)-log(area)
curves. To validate the selected model, the expected total number of species in each 1000m2 plot based
on the 1, 10, and 100m2 data can be compared to the observed number of species recorded in each
1000m2 plot. The regression model with the least difference between observed and expected values
should be used.
Species richness for a vegetation type was determined by combining species lists from the replicate
plots and removing duplicate entries.
For this pilot study area, they developed and validated the accuracy of species area curves for the six
vegetation types. They used the mean Jaccard‘s Coefficient for the 1000m2 plot data to improve the
accuracy of the species-area curves for each vegetation type (the Jaccard‘s coefficient measures
similarity between sample sets, and is defined as the size of the intersection divided by the size of the
union of the sample sets).
To estimate the number of plant species that occur in a landscape, they estimate the total number of
species found in the two vegetation types with the greatest numbers of unique species using the
species-area curves corrected for species overlap between vegetation type. Since the species lists of the
two types overlap by some percentage, the total number of species is determined by summing the two
types and then subtracting that percentage from the composite species list. The number of species is
calculated for the vegetation type with the next greatest number of unique species (again using the
species-area curve corrected for species overlap). This type is added to the first two vegetation types
and then the percentage of species that overlap is subtracted from the composited species lists. These
steps are repeated until all vegetation types are combined. The unique-to-vegetation-type species, which
were likely to be the species of most conservation interest, were determined from the species list for
each vegetation type.
Kriging was used to display the pattern of native and non-native species richness based on information
from the n = 25 plots (kriging uses a local estimator in the vicinity of the point and the autocorrelation
structure of the data to produce a contour map).
48
2.8.6 Time and resources investment
One plot took a team of two 2–3 hours to complete; to quantify vegetation patterns in the 754ha study
area, field work was carried out in few weeks with a four-person field crew.
2.8.7 Strengths and weaknesses
Strengths
Cost-efficient
Easy to use
Adaptable to other vegetation types and biomes.
Allows for rapid assessment of the number of species that remain undetected in the much larger
landscape, based on estimation
The slopes of species-area curves help identify species-rich vegetation types
Allows the identification of local hotspots of plant diversity on the landscape (Kriging maps)
If the plots are permanently marked, the subplots and plots can be easily relocated to monitor
vegetation change, as a means to monitor long-term changes in plant diversity
Accurate assessments could be made of species richness in larger areas and species overlap
within and between vegetation types
The mathematics used are plot-size independent and rely on linear regression models
Weaknesses
Small number of sample points, final results from estimation
Not applied in agro-forests, only forest reserves in USA
Requires additional material and equipment (satellite imagery)
Requires expert knowledge on remote sensing
Suitable to studies done at the level of the landscape
2.8.8 Initial assessments and observations
They recorded 330 plant species in the 25 plots sampled (four 0.025ha plots and twenty-one 0.1ha
plots). By stratifying the vegetation into both large, homogeneous types (e.g., lodgepole pine, ponderosa
pine, and dry meadow) and potentially important small-area types (e.g., aspen, wet meadow, and burned
ponderosa pine), and using unbiased plot locations, they accounted for about one third of the 920 plants
on Rocky Mountain National Park‘s checklist in just 2.2ha of sampling area.
The species overlap between the replicate plots within a vegetation type ranged from 19.9% in the wet
meadow and lodgepole types to 31.8% in the burned ponderosa type. Species overlap generally
increases with increases in plot size and sample size.
Species-area curves, corrected with the mean Jaccard‘s Coefficient, produced highly accurate estimates
of species richness in areas ten times larger than the sampled area (3000-5000m2).
Species-area curves in the six vegetation types ranged in accuracy from 99.3% (aspen) to 95.1% (dry
meadow). The accuracy of the species-area curve for the dry meadow type was influenced by spatial
autocorrelation.
Species overlap varied greatly among vegetation types. Species composition of the wet meadow
vegetation type, for example, overlapped 21.8% with the aspen community type but less than 14% with
the other vegetation types. The cross comparisons of the ponderosa pine, burned ponderosa pine, and
lodgepole pine types had between 28 and 31% overlap.
49
If species overlap among certain types was found to be high (ca.>70%), then they probably could be
combined into one type for future sampling or monitoring. Where native species overlap between a
certain vegetation type and all other types is very low (ca. <20%), this indicates a distinctive community
that perhaps requires additional protection and study.
2.8.9 References
Peet, RK. 1981. ‗Forest vegetation of the Colorado Front Range: patterns of species diversity‘,
Vegetation 52, 129–140 (from Stohlgren et al, 1997).
Stohlgren TJ, Chong GW, Kalkhan MA, Schell LD. 1997. Rapid assessment of plant diversity patterns: a
methodology for landscapes. Environmental Monitoring and Assessment 48: 25-43.
50
2.9. Rainforest Alliance Criteria
2.9.1 What are the Rainforest Alliance criteria?
Rainforest Alliance Certified™ farms meet the comprehensive standards of the Sustainable Agriculture
Network (SAN)2, a coalition of non-profit conservation organisations, which address social, economic
and environmental criteria. Certified farms and companies that source products or ingredients from
certified farms are eligible to use the Rainforest Alliance Certified green frog seal, if they meet the
Sustainable Agriculture Network (SAN) guidelines3.
The SAN‘s sustainable agriculture standard is represented by the ten guiding principles outlined below
(extracted from the Sustainable Agriculture Network Website4):
1. Management System
Social and environmental management systems (according to the complexity of the operation) must be
in place so that auditors can confirm that farms are operated in compliance with the Sustainable
Agriculture Network (SAN) standard and the laws of the respective countries. Most farmers find that such
a system not only improves conditions for workers and the environment, but also results in better-
organised and more efficient farms.
2. Ecosystem Conservation
Farmers must conserve existing ecosystems and aid in the ecological restoration of critical areas. They
can achieve this by taking steps that protect waterways and wetlands from erosion and contamination,
prohibit logging and other deforestation, maintain vegetation barriers and prevent negative impacts on
natural areas outside farmlands.
3. Wildlife Protection
Certified farms serve as refuge for wildlife, and therefore farmers should monitor wildlife species on
farms. This is particularly important for endangered species and their habitats on the land, which farmers
should take specific steps to protect. This includes educating workers, prohibiting hunting and the
removal of plants and animals from their lands, protecting nesting places, and either releasing captive
wildlife or registering animals with the proper authorities.
4. Water Conservation
The SAN standard requires that farmers conserve water by keeping track of water sources and
consumption. A farm‘s practices and machinery may need to be modified — or new technology installed
— in order to reduce water consumption or to avoid contamination of springs and rivers on and near the
property. Farmers should have the proper permits for water use, treat wastewater and monitor water
quality.
5. Working Conditions
Farmers must ensure good working conditions for all employees, as defined by such international bodies
as the United Nations and the International Labour Organization. The SAN standards prohibit forced and
2http://sanstandards.org/sitio/sections/display/3
3http://www.rainforest-alliance.org/agriculture/certification
4http://sanstandards.org/sitio/subsections/display/7
Rainforest Alliance Certified™
seal
51
child labour and all forms of discrimination and abuse. Workers should be aware of their rights and of
farm policies. They should benefit from legally established salaries, work schedules and any benefits
required by the national government. If housing is provided, it must be in good condition, with potable
water, sanitary facilities and waste collection. Workers and their families should have access to
healthcare and education. Read more about the SAN standards and relevant International Labour
Organization (ILO) conventions.
6. Occupational Health
Certified farms must have occupational health and safety programs to reduce the risk of accidents. This
requires that workers receive safety training — especially regarding the use of agrochemicals — and that
farmers provide the necessary protective gear and ensure that farm infrastructure, machinery and other
equipment is in good condition and poses no danger to human health. The SAN standard contains
extensive criteria for establishing a safe work environment. This includes avoiding the potentially harmful
effects of agrochemicals on workers and others, identifying and mitigating health risks and preparing for
emergencies.
7. Community Relations
The SAN standard requires farmers to be good neighbours and inform surrounding communities and
local interest groups about their activities and plans. They should consult with interested parties about
the potential impacts of their farm and contribute to local development through employment, training and
public works.
8. Integrated Crop Management
The SAN encourages the elimination of chemical products that pose dangers to people and the
environment. Farm managers must monitor pests and use biological or mechanical alternatives to
pesticides where possible — and if they determine that agrochemicals are necessary to protect the crop,
they are obligated to choose the safest products available and use every possible safeguard to protect
human health and the environment.
9. Soil Conservation
A goal of SAN‘s sustainable agriculture approach is the long-term improvement of soils, which is why
certified farms take steps to prevent erosion, base fertilisation on crop requirements and soil
characteristics and use organic matter to enrich soil. Vegetative ground cover and mechanical weeding
are used to reduce agrochemical use whenever possible.
10. Integrated Waste Management
Certified farms are clean and orderly with programs for managing waste through recycling, reducing
consumption and reuse. Waste is segregated, treated and disposed of in ways that minimise
environmental and health impacts. Workers are educated about properly managing waste on the farms
and in their communities.
The SAN guiding principles containing relevant and important information to take into consideration for
the development of the rapid plant diversity assessment methodology for the project are: 2. Ecosystem
Conservation; 8. Integrated Crop Management; and 9. Soil Conservation. The interpretation and
application of these principles may depend on the particular conditions of the crop and the location. For
this reason, SAN has developed two different types of Interpretation Guidelines: the generic and the
local. They both contain indicators and are not binding for certification processes, however they are

52
important for implementing Good Agricultural Practices (GAP) on farms and they provide guidance
during audit processes.
For Ghana, a local workgroup defined the Local Interpretation Guidelines for cocoa plantations, which
comprises a partial set of indicators and their assessment adjusted to the country‘s conditions and the
requirements of the crop, the ―SAN Indicators for Sustainable Cocoa Production in Ghana‖5. From the 3
principles with importance to this project, number 2 (Ecosystem Conservation) and number 8 (Integrated
Crop Management) were addressed in the local guidelines and include an interpretation of the relevant
binding criteria in conformity with the environmental and social conditions in Ghana. The compliance of
the methods with the indicators reviewed is analysed in section 2.12 of this document.
These guidelines are briefly described here, starting with the general guidelines and presenting the local
interpretation when applicable.
2.9.2 Review of the SAN guiding principles important for the “Biodiversity and Cocoa Farming:
Ghana case” project
2. Ecosystem Conservation
Summary of the principle: Natural ecosystems are integral components of the agricultural and rural
countryside. Carbon capture, crops pollination, pest control, biodiversity and soil and water conservation
are just some of the services provided by natural ecosystems on farms. Certified farms protect these
natural ecosystems and conduct activities to restore degraded ecosystems. Emphasis is placed on
restoring natural ecosystems in areas unsuitable for agriculture, for example by re-establishing the
riparian forests that are critical to the protection of water channels. The Sustainable Agriculture Network
recognises that forests and farms are potential sources of timber and non-timber forest products that
help to diversify farm income when they are managed in a sustainable manner.
2.4 The harvesting or other taking of threatened or endangered plant species is not permitted. Cutting,
extracting or harvesting trees, plants and other non-timber forest products is only allowed in instances
when the farm implements a sustainable management plan that has been approved by the relevant
authorities, and has all the permits required by law. If no applicable laws exist, the plan must have been
developed by a competent professional.
Local Guidelines for Ghana
a) Farms document the growing of shade trees and seek legal right to the trees since ―no timber
harvesting rights shall be granted in respect of land with any timber grown or owned by any
individual or group of individuals‖ [Timber Resource Management (Amendment Act) 547, 2002;
Section 4(3b)].
b) Where the shade trees already exist, farms consent to its exploitation and agree on terms of
compensation since ―no timber harvesting rights shall be granted in respect of land with farms
without the written authorisation of the individual, group or owners concerned‖ (Amendment Act 547,
2002; section 4(2b).
c) Farms cut or harvest trees only in instances where the farmer has timber utilisation permit -
approved by the Forestry Services Division (FSD) of the Forestry Commission (FC) - and is
implementing a sustainable management plan that is in compliance with the SAN Sustainable
Agriculture Standard.
2.8 Farms with agroforestry crops located in areas where the original natural vegetative cover is forest
must establish and maintain a permanent agroforestry system distributed homogenously throughout the
plantations. The agroforestry system‘s structure must meet the following requirements:
5 Interpretation Guidelines - Indicators for Sustainable Cocoa Production in Ghana .April 2009 © Sustainable Agriculture Network
53
a. The tree community on the cultivated land consists of minimum 12 native species per hectare on
average. b. The tree canopy comprises at least two strata or stories. c. The overall canopy density on the cultivated land is at least 40%.
Farms in areas where the original natural vegetation is not forest – such as grasslands, savannas,
scrublands or shrublands - must dedicate at least 30% of the farm area for conservation or recovery of
the area‘s typical ecosystems. These farms must implement a plan to establish or recover natural
vegetation within ten years.
Local Guidelines for Ghana
a) Farms maintain a shade density of 40% equivalent to 20 trees per hectare (representing spacing
between trees of 22m x 22m on the ground) at all times.
b) Farms maintain an optimum shade canopy in accordance with the following developmental stages of
the cocoa trees:
i. Farms with mature cocoa trees (4 years and above), maintain a minimum of 18 shade trees per
hectare (equivalent to 24m x 24m and representing 30% shade).
ii. Young cocoa farms (0-3 years), maintain 70% shade corresponding to at least 18 permanent
trees (30%) and temporal shade from food crops – plantain, cocoyam, cassava, or native
species.
c) There are at least 12 different native tree species per hectare (see preferred native tree species in
cocoa in Ghana in Annex 1 of this document).
d) The establishment of shade in new areas continues in accordance with a plan at a pace that
guarantees that there will be shade in all production areas within five years.
e) After pruning, shade density is at least 30% throughout the production area.
f) There is no evidence of indiscriminate removal of shade trees that does not correspond to a
sustainable management or renewal plan.
g) Variations in shade density are permitted in order to control outbreaks of pests or diseases, but are
recorded as part of the integrated pest management program.
2.9 The farm must implement a plan to maintain or restore the connectivity of natural ecosystems, within
its boundaries, considering the connectivity of habitats at the landscape level; e.g. through elements
such as native vegetation on roadsides and along water courses or river banks, shade trees, live
fences and live barriers.
8. Integrated Crop Management Summary of the principle: The Sustainable Agriculture Network encourages the elimination of chemical
products known internationally, regionally and nationally for their negative impacts on human health and
natural resources. Certified farms contribute to the elimination of these products through integrated
crop management to reduce the risk of pest infestations. They also record the use of agrochemicals
to register the amounts consumed, and work to reduce and eliminate these products, especially the most
toxic ones. To minimise the excessive application and waste of agrochemicals, certified farms have the
procedures and equipment for mixing these products and for maintaining and calibrating application
equipment. Certified farms do not use products that are not registered for use in their country, nor do
they use transgenic organisms or other products prohibited by different entities or national and
international agreements.
8.1 The farm must have an integrated pest-management program based on ecological principles for the
control of harmful pests (insects, plants, animals and microbes). The program must give priority to the
use of physical, mechanical, cultural and biological control methods, and the least possible use of
agrochemicals. The program must include activities for monitoring pest populations, training personnel
that monitor these populations, and integrated pest management techniques. As part of the program, the
54
farm must collect and record the following information about pest infestations: infestation dates, duration,
area and location; type of pest; the control mechanisms employed; environmental factors during the
infestation; damage caused and estimated costs of damage and control.
8.9 The use of fire for pest and disease management must only be used if it is the option of less
environmental impact in comparison with other pest control measures. This option must be approved by
competent authorities, must reflect technical considerations and focus on problematic areas only.
9. Soil Conservation
Summary of the principle: One of the objectives of sustainable agriculture is the long-term improvement
of the soils that supports agricultural production. Certified farms carry out activities that prevent or control
erosion, and thus reduce the loss of nutrients and the negative impacts on water bodies. The farms have
fertilisation programs based on the crop requirements and soil characteristics. The use of vegetative
ground cover and crop rotation reduces dependency on agrochemicals for the control of pests and
weeds. Certified farms only establish new production areas on land that is suitable for agriculture and the
new crops, and never by cutting forests.
9.1 The farm must execute a soil erosion prevention and control program that minimises the risk of
erosion and reduces existing erosion. The program activities must be based on the identification of soils
affected by or susceptible to erosion, as well as soil properties and characteristics, climatic conditions,
topography and agricultural practices for the crop. Special emphasis must be placed on controlling runoff
and wind erosion from newly tilled or planted areas, as well as preventing sedimentation of water bodies.
The farm must use and expand vegetative ground covers on the banks and bottoms of drainage canals
to reduce erosion and agrochemical drift and runoff towards water bodies.
9.2 The farm must have a soil or crop fertilisation program based on soil characteristics and properties,
periodic soil or foliage sampling and analysis, and advice from a competent and impartial professional or
authority. The number of soil or foliage samples must correspond with the size of the production area,
types of soil, and variations in its properties, as well as results of previous analyses. The producer must
keep the results of these analyses on the farm for a two-year period. Organic and non-organic fertilisers
must be applied so as to avoid any potential negative impacts on the environment. The farm must give
priority to organic fertilisation using residues generated by the farm.
9.3 The farm must use and expand its use of vegetative ground cover to reduce erosion and
improve soil fertility; structure and organic material content, as well as minimise the use of herbicides.
There must be a vegetative ground cover establishment and expansion plan that indicates the areas
with existing cover, as well as areas where cover will be established in the future. The farm must include
a timeframe for these activities.
9.4 The farm must promote the use of fallow areas with natural or planted vegetation in order to recover
natural fertility and interrupt pest life cycles. The farm must have a plan that indicates the fallow
techniques or practices (planting, natural regeneration, etc.) and their timing. These areas must be
identified in the fields and on the farm map. Burning is not allowed to prepare land.
9.5 Critical Criterion. New production areas must only be located on land with the climatic, soil and
topographic conditions suitable for intensity level of the agricultural production planned. The
establishment of new production areas must be based on land use capacity studies that demonstrate
long-term production capacity. The cutting of natural forest cover or burning to prepare new
production areas is not permitted.
In the local Interpretation Guidelines for Ghana, additional information is provided concerning the
suitable and preferred tree species in cocoa plantations, as shown below.
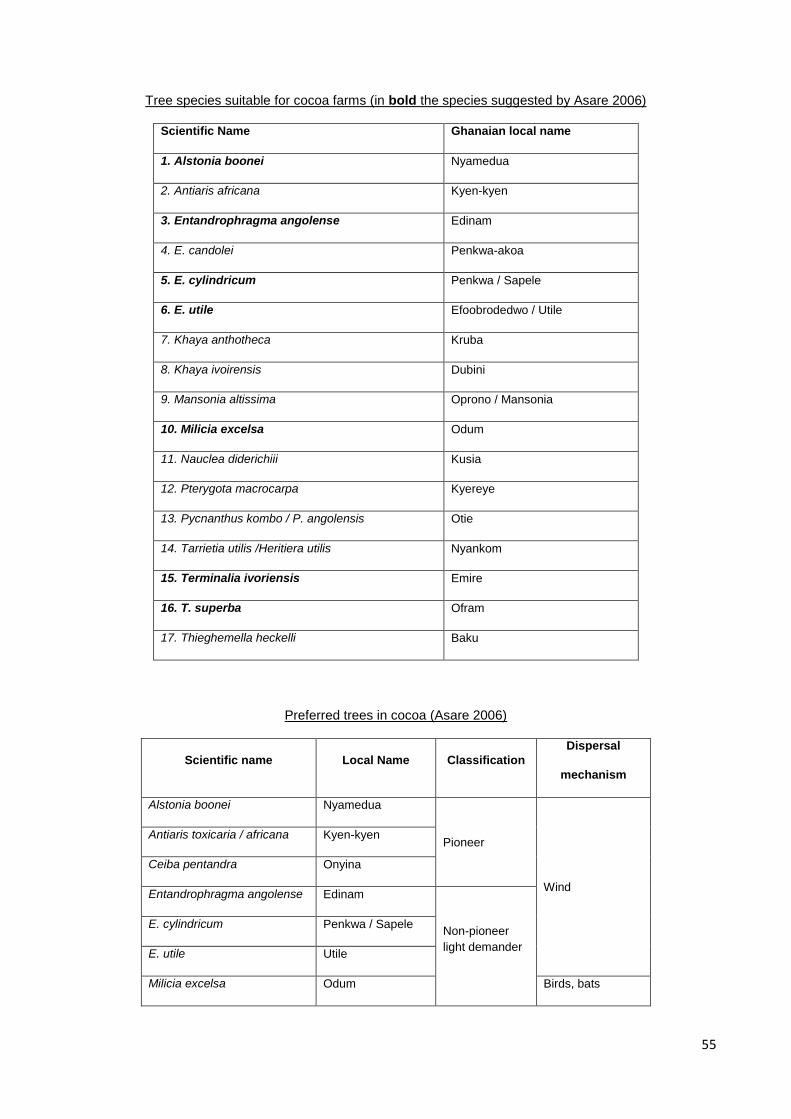
55
Tree species suitable for cocoa farms (in bold the species suggested by Asare 2006)
Scientific Name Ghanaian local name
1. Alstonia boonei Nyamedua
2. Antiaris africana Kyen-kyen
3. Entandrophragma angolense Edinam
4. E. candolei Penkwa-akoa
5. E. cylindricum Penkwa / Sapele
6. E. utile Efoobrodedwo / Utile
7. Khaya anthotheca Kruba
8. Khaya ivoirensis Dubini
9. Mansonia altissima Oprono / Mansonia
10. Milicia excelsa Odum
11. Nauclea diderichiii Kusia
12. Pterygota macrocarpa Kyereye
13. Pycnanthus kombo / P. angolensis Otie
14. Tarrietia utilis /Heritiera utilis Nyankom
15. Terminalia ivoriensis Emire
16. T. superba Ofram
17. Thieghemella heckelli Baku
Preferred trees in cocoa (Asare 2006)
Scientific name Local Name Classification
Dispersal
mechanism
Alstonia boonei Nyamedua
Pioneer
Wind
Antiaris toxicaria / africana Kyen-kyen
Ceiba pentandra Onyina
Entandrophragma angolense Edinam
Non-pioneer
light demander
E. cylindricum Penkwa / Sapele
E. utile Utile
Milicia excelsa Odum Birds, bats
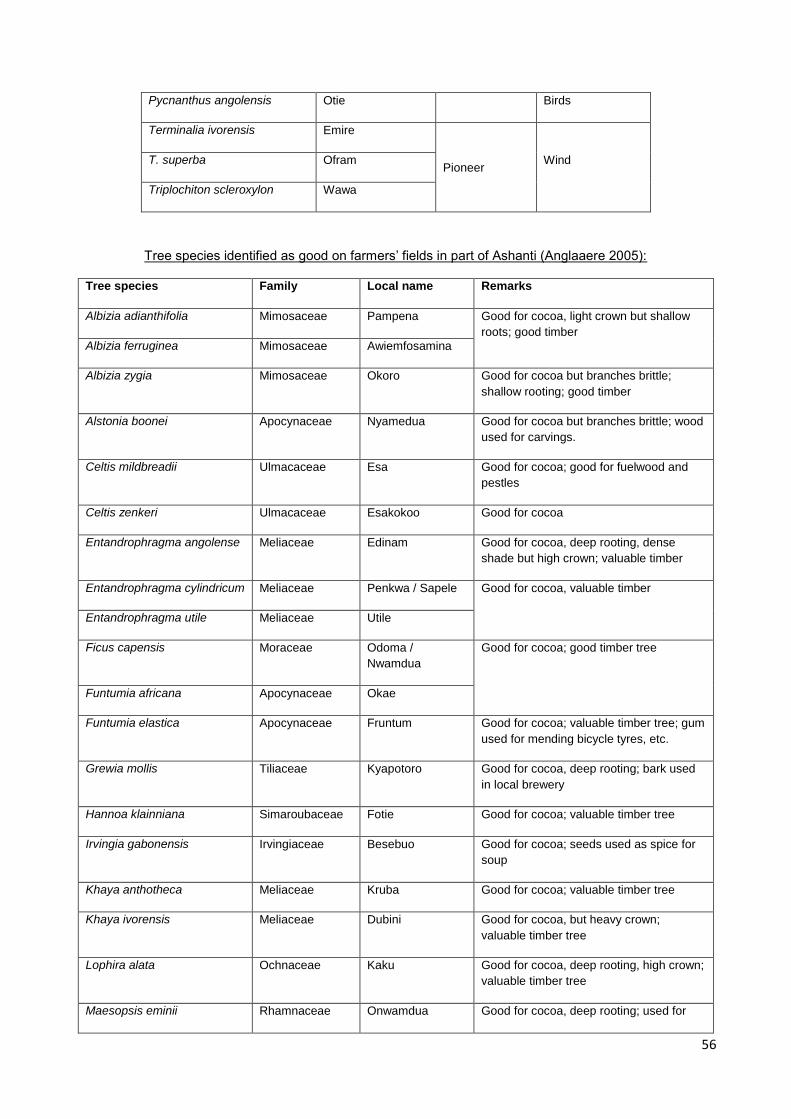
56
Pycnanthus angolensis Otie Birds
Terminalia ivorensis Emire
Pioneer Wind T. superba Ofram
Triplochiton scleroxylon Wawa
Tree species identified as good on farmers‘ fields in part of Ashanti (Anglaaere 2005):
Tree species Family Local name Remarks
Albizia adianthifolia Mimosaceae Pampena Good for cocoa, light crown but shallow
roots; good timber Albizia ferruginea Mimosaceae Awiemfosamina
Albizia zygia Mimosaceae Okoro Good for cocoa but branches brittle;
shallow rooting; good timber
Alstonia boonei Apocynaceae Nyamedua Good for cocoa but branches brittle; wood
used for carvings.
Celtis mildbreadii Ulmacaceae Esa Good for cocoa; good for fuelwood and
pestles
Celtis zenkeri Ulmacaceae Esakokoo Good for cocoa
Entandrophragma angolense Meliaceae Edinam Good for cocoa, deep rooting, dense
shade but high crown; valuable timber
Entandrophragma cylindricum Meliaceae Penkwa / Sapele Good for cocoa, valuable timber
Entandrophragma utile Meliaceae Utile
Ficus capensis Moraceae Odoma /
Nwamdua
Good for cocoa; good timber tree
Funtumia africana Apocynaceae Okae
Funtumia elastica Apocynaceae Fruntum Good for cocoa; valuable timber tree; gum
used for mending bicycle tyres, etc.
Grewia mollis Tiliaceae Kyapotoro Good for cocoa, deep rooting; bark used
in local brewery
Hannoa klainniana Simaroubaceae Fotie Good for cocoa; valuable timber tree
Irvingia gabonensis Irvingiaceae Besebuo Good for cocoa; seeds used as spice for
soup
Khaya anthotheca Meliaceae Kruba Good for cocoa; valuable timber tree
Khaya ivorensis Meliaceae Dubini Good for cocoa, but heavy crown;
valuable timber tree
Lophira alata Ochnaceae Kaku Good for cocoa, deep rooting, high crown;
valuable timber tree
Maesopsis eminii Rhamnaceae Onwamdua Good for cocoa, deep rooting; used for
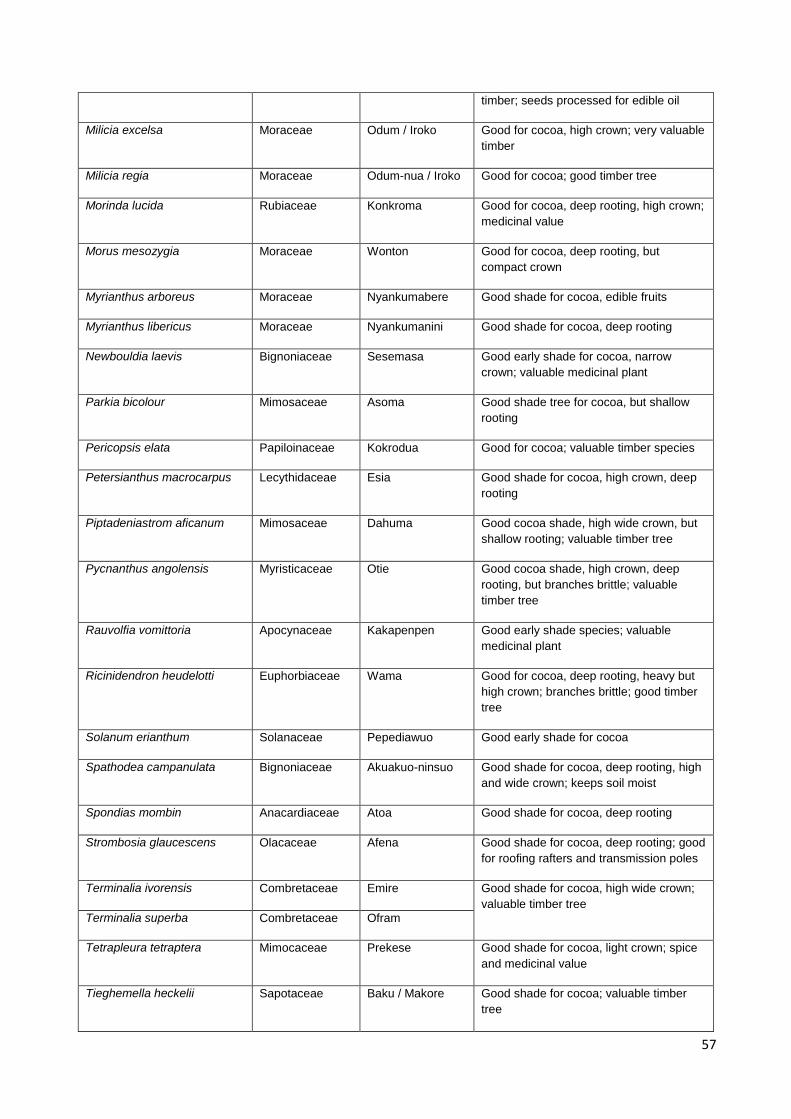
57
timber; seeds processed for edible oil
Milicia excelsa Moraceae Odum / Iroko Good for cocoa, high crown; very valuable
timber
Milicia regia Moraceae Odum-nua / Iroko Good for cocoa; good timber tree
Morinda lucida Rubiaceae Konkroma Good for cocoa, deep rooting, high crown;
medicinal value
Morus mesozygia Moraceae Wonton Good for cocoa, deep rooting, but
compact crown
Myrianthus arboreus Moraceae Nyankumabere Good shade for cocoa, edible fruits
Myrianthus libericus Moraceae Nyankumanini Good shade for cocoa, deep rooting
Newbouldia laevis Bignoniaceae Sesemasa Good early shade for cocoa, narrow
crown; valuable medicinal plant
Parkia bicolour Mimosaceae Asoma Good shade tree for cocoa, but shallow
rooting
Pericopsis elata Papiloinaceae Kokrodua Good for cocoa; valuable timber species
Petersianthus macrocarpus Lecythidaceae Esia Good shade for cocoa, high crown, deep
rooting
Piptadeniastrom aficanum Mimosaceae Dahuma Good cocoa shade, high wide crown, but
shallow rooting; valuable timber tree
Pycnanthus angolensis Myristicaceae Otie Good cocoa shade, high crown, deep
rooting, but branches brittle; valuable
timber tree
Rauvolfia vomittoria Apocynaceae Kakapenpen Good early shade species; valuable
medicinal plant
Ricinidendron heudelotti Euphorbiaceae Wama Good for cocoa, deep rooting, heavy but
high crown; branches brittle; good timber
tree
Solanum erianthum Solanaceae Pepediawuo Good early shade for cocoa
Spathodea campanulata Bignoniaceae Akuakuo-ninsuo Good shade for cocoa, deep rooting, high
and wide crown; keeps soil moist
Spondias mombin Anacardiaceae Atoa Good shade for cocoa, deep rooting
Strombosia glaucescens Olacaceae Afena Good shade for cocoa, deep rooting; good
for roofing rafters and transmission poles
Terminalia ivorensis Combretaceae Emire Good shade for cocoa, high wide crown;
valuable timber tree Terminalia superba Combretaceae Ofram
Tetrapleura tetraptera Mimocaceae Prekese Good shade for cocoa, light crown; spice
and medicinal value
Tieghemella heckelii Sapotaceae Baku / Makore Good shade for cocoa; valuable timber
tree
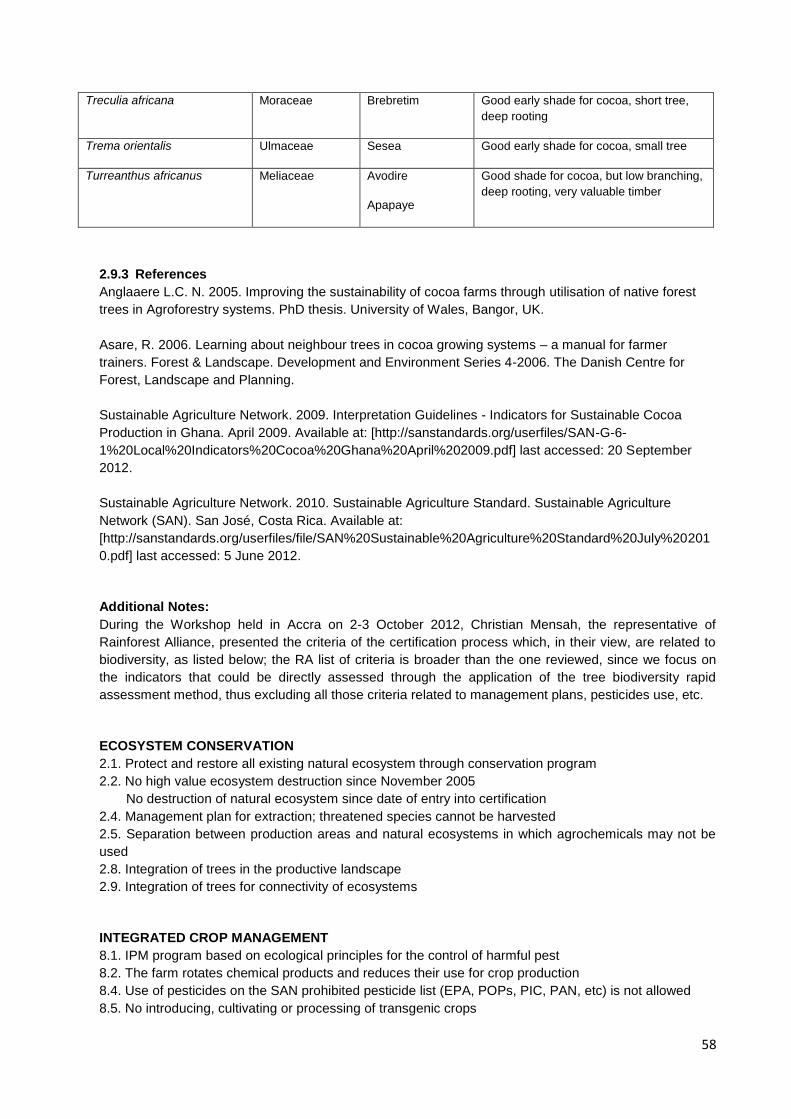
58
Treculia africana Moraceae Brebretim Good early shade for cocoa, short tree,
deep rooting
Trema orientalis Ulmaceae Sesea Good early shade for cocoa, small tree
Turreanthus africanus Meliaceae Avodire
Apapaye
Good shade for cocoa, but low branching,
deep rooting, very valuable timber
2.9.3 References Anglaaere L.C. N. 2005. Improving the sustainability of cocoa farms through utilisation of native forest
trees in Agroforestry systems. PhD thesis. University of Wales, Bangor, UK.
Asare, R. 2006. Learning about neighbour trees in cocoa growing systems – a manual for farmer
trainers. Forest & Landscape. Development and Environment Series 4-2006. The Danish Centre for
Forest, Landscape and Planning.
Sustainable Agriculture Network. 2009. Interpretation Guidelines - Indicators for Sustainable Cocoa
Production in Ghana. April 2009. Available at: [http://sanstandards.org/userfiles/SAN-G-6-
1%20Local%20Indicators%20Cocoa%20Ghana%20April%202009.pdf] last accessed: 20 September
2012.
Sustainable Agriculture Network. 2010. Sustainable Agriculture Standard. Sustainable Agriculture
Network (SAN). San José, Costa Rica. Available at:
[http://sanstandards.org/userfiles/file/SAN%20Sustainable%20Agriculture%20Standard%20July%20201
0.pdf] last accessed: 5 June 2012.
Additional Notes:
During the Workshop held in Accra on 2-3 October 2012, Christian Mensah, the representative of
Rainforest Alliance, presented the criteria of the certification process which, in their view, are related to
biodiversity, as listed below; the RA list of criteria is broader than the one reviewed, since we focus on
the indicators that could be directly assessed through the application of the tree biodiversity rapid
assessment method, thus excluding all those criteria related to management plans, pesticides use, etc.
ECOSYSTEM CONSERVATION
2.1. Protect and restore all existing natural ecosystem through conservation program
2.2. No high value ecosystem destruction since November 2005
No destruction of natural ecosystem since date of entry into certification
2.4. Management plan for extraction; threatened species cannot be harvested
2.5. Separation between production areas and natural ecosystems in which agrochemicals may not be
used
2.8. Integration of trees in the productive landscape
2.9. Integration of trees for connectivity of ecosystems
INTEGRATED CROP MANAGEMENT
8.1. IPM program based on ecological principles for the control of harmful pest
8.2. The farm rotates chemical products and reduces their use for crop production
8.4. Use of pesticides on the SAN prohibited pesticide list (EPA, POPs, PIC, PAN, etc) is not allowed
8.5. No introducing, cultivating or processing of transgenic crops
59
8.9. The use of fire for pest and disease management only if it is the option of less environmental impact
in comparison with other pest control measures.
SOIL MANAGEMENT & CONSERVATION
9.1. Execution of a soil erosion prevention and control program that minimises the risk of erosion and
reduces existing erosion
9.2. A soil or crop fertilisation program based on soil characteristics and properties, periodic soil or
foliage sampling and analysis, and advice from a competent and impartial professional or authority.
9.3. Use of vegetation to reduce soil erosion and improve soil fertility
9.4. Promote the use of fallow areas with natural or planted vegetation in order to recover natural fertility
and interrupt pest life cycles. No burning to prepare new areas for agriculture
9.5. The cutting of natural forest cover or burning to prepare new production areas is not permitted
RA also presented a short list of potential methods that could be used to assess the compliance with the
indicators mentioned above, some of them reviewed in this document:
APPLICABLE METHODOLOGIES
•Inventory of desirable woody species (method 6)
•Tree species diversity in agroforests (method 7)
•Transect and desirable native species
•Quick Biodiversity Survey method (method 4)
•Internal Inspection of farms

60
2.10. UTZ Certified
2.10.1 What is UTZ Certified?
UTZ Certified consists on a program to promote sustainable farming and better opportunities for farmers,
their families and our planet. The certification program enables farmers to grow better crops, generate
more income and create better opportunities by learning better farming methods and improve working
conditions, while safeguarding the environment and securing the earth‘s natural resources.
In order to create credible assurance of sustainable production, UTZ Certified has developed the UTZ
Codes of Conduct. These codes consist of product-specific standards for certain crops, namely coffee,
cocoa, tea and rooibos, as well as chain of custody standards and a thorough certification system for
each one of them. These codes of conduct consist on a list of economic, social and environmental
criteria which farmers must comply with. The code development process has been carried out through
an intensive multi stakeholder approach, involving consultation and research, a public consultation
round, field testing, local workshops and expert advice from a technical working group. They are based
on a holistic approach of the commodities production and market cycles and focus on improving
agricultural methods and management skills and on promoting environmental protection and good social
practices. This results in environmentally and socially responsible agricultural production, providing
companies and consumers with the assurance of sustainable quality products.
In brief, the codes of conduct of UTZ Certified assure good agricultural practices and management, safe
and healthy working conditions, no child labour and protection of the environment, under a model of
continuous improvement with detailed requirements added over the years.
The Code of Conduct for Cocoa was reviewed and a brief description of its structure and contents is
here presented. There are 2 different codes, one for individual and multi-site certification and another for
groups; for the purpose of this project, the code for individual certification was used.
2.10.2 UTZ Certified Code of Conduct for Cocoa Individual Certification
The Code of Conduct consists of 182 control points, divided into 10 chapters:
1. Traceability, product identification and separation
2. Management system, record keeping and self-inspection
3. Varieties and rootstocks
4. Soil management & Cocoa farm maintenance
5. Fertiliser use
6. Irrigation
7. Integrated pest management and crop protection
8. Harvesting
9. Workers‘ rights, health and safety
10. Natural resources and biodiversity
Each chapter presents a set of control points, quite self-explanatory and in the form of a checklist,
complemented by additional information compiled in an annex document (see references below). The
control points related to 3. Varieties and rootstocks, 4.Soil management & Cocoa farm maintenance and
10. Natural resources and biodiversity potentially relevant to this project are described below.
The compliance of the methods with the control points is analysed in section 2.12 of this document.
61
3. Varieties and rootstocks
3.A Planting material
3.A.4 New cocoa trees are planted in the most suitable pattern and density to the varietal requirements
to ensure easy management of the farms. Preferably this is based on locally adapted expert advice (e.g.
national research institutions). For example a planting density of 3 x 3m can be suitable.
4. Soil management & Cocoa farm maintenance
4.A. Soil management
The control points in this section are about maintaining the structure of the soil, improving the fertility of
the soil and preventing soil erosion.
4.A.1 The certificate holder uses techniques to prevent soil erosion. There is visual and/or documented
evidence that these techniques are used. Special attention is given to new clearing, pruning and
(re)planting. Examples are cross line planting on slopes, drains, sowing grass, trees and bushes on
borders of sites, etc.
4.A.2 No new plantings on steep slopes (>25%) after initiating the certification process. If cocoa is
planted on slopes over 8%, the producer uses techniques to prevent erosion.
4.A.3 In case of new plantings or re-planting, during the first five years the certificate holder prevents
erosion through leaving shade trees in place and/or planting new shade trees, other plants and cover
crops during land preparation. Soil erosion especially occurs when plantations are initially established
and during their early years. Legumes/green manures can also be used to prevent erosion. Planting
density should be as indicated in 3.A.4.
4.A.4 The certificate holder uses techniques to maintain and improve soil structure and fertility. There is
visual and/or documented evidence that these techniques are used. Examples of these practices are the
use of shade trees, compost, cover crops, nitrogen fixing plants, mulching, etc. Practices should lead to
appropriate quantities of organic matter and healthy biological activity.
4.A.5 The fertility of the soil is assessed and soil type and structure are identified. Objective is to
establish the suitability of the soil for cocoa. Therefore the type of soil is identified for each farm or group
of comparable farms based on a soil profile, soil analysis or local/regional soil map. This can be done by
locating the lot by e.g. using the soil maps made at regional or country level by universities, research
institutes (Soil Institute) for government, or by an internal or external expert.
4.B Cocoa farm maintenance
4.B.1 Optimal tree architecture is obtained and maintained by regular pruning and removal of chupons.
Pruning includes thinning of branches and removal of old or dead stems. Chupons are the young and
soft shoots that cocoa trees grow throughout the season. Especially chupons emerging at the base of
the trees should be removed regularly.
4.B.2 Good sanitation practices are maintained on the farm:
- Diseased or infested pods, branches and other plant material are regularly removed from the trees.
- Diseased material is disposed of in a way that prevents contamination.
- Tools are used that are dedicated for this purpose and disinfected afterwards.
Less damaging species can be left to provide ground cover.
62
10. Natural resources and biodiversity
10.A Impact of farming on the environment
10.A.1 The certificate holder conducts a risk assessment to identify possible negative impacts of farm
activities on the environment (including possible sources of pollution and waste products from the
production process). The risk assessment is regularly reviewed and kept up-to-date. The assessment
can be done regionally and can be conducted by an external party.
10.A.2 Based on the risk assessment the certificate holder makes and implements an action plan how to
address these risks. Implemented corrective actions are documented.
10.A.3 The certificate holder has a conservation plan or participates in a regional plan to protect and
enhance biodiversity on and around the farm. The conservation plan identifies areas of high ecological
value, and specifies how they are protected. Within the conservation plan there is (reference to) a
baseline assessment of animal and plant diversity and abundance in the production area. Animal and
plant diversity and abundance in the production area are monitored.
10.A.4 The conservation plan includes a baseline assessment of animal and plant diversity. The effects
of agricultural production on flora and fauna are monitored.
10.A.5 The certificate holder assesses the possibilities of product diversification as a way of making the
cocoa production more sustainable. The certificate holder takes into account what the effect is on the
quality and quantity of the cocoa.
10.C Forest and Biodiversity
10.C.1 Degradation and deforestation of primary forest is prohibited. There has been no such
degradation and/or deforestation after 2008. It is also not accepted to use practices to purposely weaken
or destroy trees with the objective to deforest in a potential legal way in the future.
10.C.2 The certificate holder does not plant new cocoa on land that is not classified as agricultural and/or
approved for agricultural use. The producer complies with the relevant local and national regulations with
respect to land use and biodiversity conservation for all new plantings. This area could be identified on a
basic overview map.
10.C.3 Deforestation of secondary forest is only allowed if:
- legal land title is available;
- government permits are available (if required);
- there is compensation with at least equal ecological value, to be confirmed by an independent
expert report.
There is demonstrated compensation with at least equal ecological value could include a larger area to
be planted with mixed native species or establishment of critical wildlife corridors.
10.C.4 The certificate holder maintains (or plants enough to eventually have) at least 18 mature shade
trees per hectare dispersed on the farm. If there are currently too few or unsuitable trees or if the trees
are not dispersed, (extra) trees are planted. 18 mature trees per hectare lead to around 30% shade. If
new shade trees are needed, it is recommended to plant at least twice as many seedlings.
10.C.5 If new shade trees are planted, diverse and native tree species are used that will lead to multiple
canopy levels. For the selections of trees, the certificate holder follows the recommendations of a
research agency. If native tree species are recommended by a technical consultant or qualified expert,
the producer follows these recommendations.
63
The following aspects are considered:
- climate, humidity, sun exposure and rain
- soil and fertilisation level
- cocoa variety
- slope
- erosion risk
- temporary or permanent shade
10.C.6 The certificate holder re-forests and stimulates ecological restoration of areas that are not used
for agricultural production on the farm as much as possible. These areas include for example low lying
wetlands, woodlands, headland strips and areas with impoverished soil.
10.C.7 Cocoa production does not take place in protected areas, including officially proposed protected
areas. Cocoa production does not take place in the vicinity (2km) of protected areas if this is not allowed
in the official management plan of the area. Protected areas include national parks, nature reserves,
wildlife sanctuaries, private parks, etc. If production already takes place inside protected areas measures
are taken to stop these practices.
10.C.8 If production takes place in the immediate vicinity (2 km) of a protected area or biological corridor,
the certificate holder is in contact with the park authorities to ensure that farming practices do not
jeopardise the park and that human-wildlife conflicts are managed appropriately. The objective is that the
farming practices do not jeopardise the park and that human-wildlife conflicts are managed
appropriately.
10.C.9 The certificate holder communicates which threatened and endangered species are (known or
likely to be) present in the production area. Threatened and endangered species and their habitats on
the farm are protected, and hunting, trafficking or commercial collection of such species is restricted. It is
recommended to ask an external expert to advise on what falls under this category (e.g. forestry service,
wildlife service).
2.10.3 References
UTZ CERTIFIED 2009. UTZ CERTIFIED Good Inside Code of Conduct for Cocoa. Version 1.0 - April
2009, 33 p. Available at: [http://www.utzcertified-
trainingcenter.com/home/images/documentos/cocoaGroupMultigroup/ENUTZ_CocoaCode1.0.pdf], last
accessed 20/09/2012.
UTZ CERTIFIED 2009. UTZ CERTIFIED Good Inside Code of Conduct for Cocoa For Individual
Certification. Version 1.0 – December 2009, 22p. Available at [http://www.utzcertified-
trainingcenter.com/home/images/documentos/cocoaIndividualMultisite/ENUTZCERTIFIEDCodeofCondu
ctforCocoaforIndividualCertification.pdf], last accessed 20/09/2012.
UTZ CERTIFIED 2010. UTZ CERTIFIED Good Inside Code of Conduct Annex for Cocoa For Individual
Certification Version 1.0 – January 2010. 12p. Available at [http://www.utzcertified-
trainingcenter.com/home/images/documentos/cocoaIndividualMultisite/
ENUTZCERTIFIEDCoCAnnexforCocoaforIndividualCertification.pdf]. Last accessed 20/09/2012.
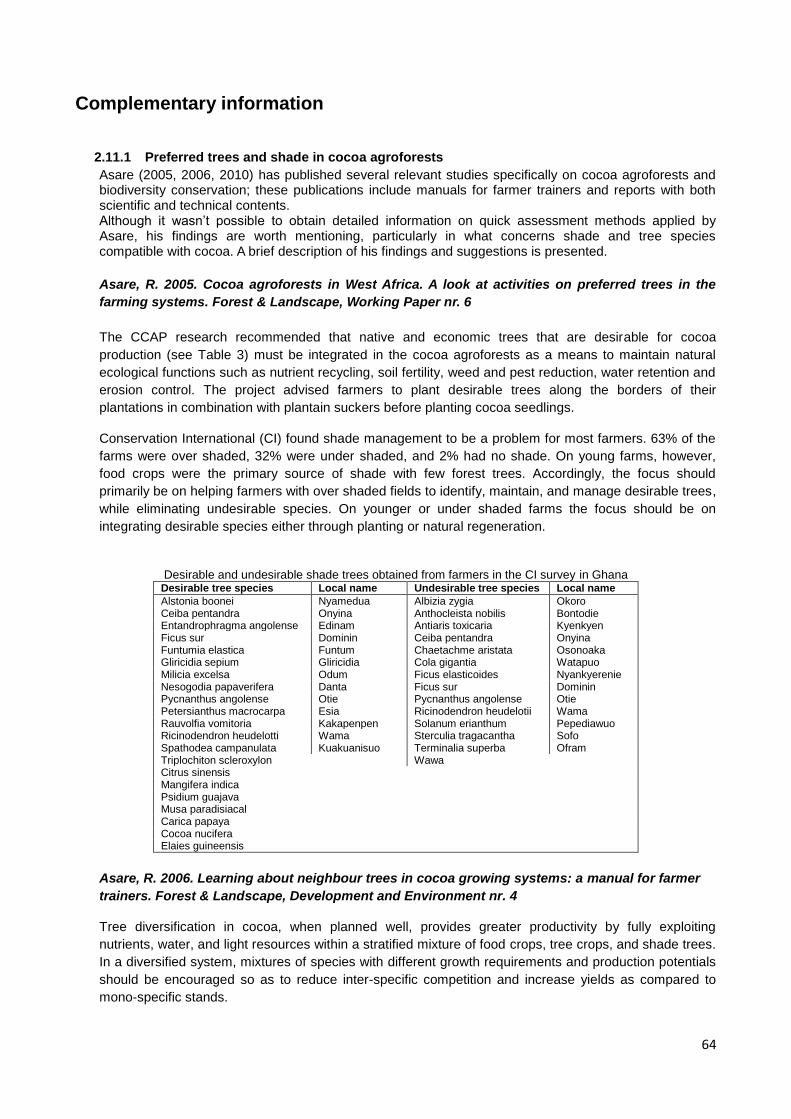
64
Complementary information
2.11.1 Preferred trees and shade in cocoa agroforests
Asare (2005, 2006, 2010) has published several relevant studies specifically on cocoa agroforests and biodiversity conservation; these publications include manuals for farmer trainers and reports with both scientific and technical contents. Although it wasn‘t possible to obtain detailed information on quick assessment methods applied by Asare, his findings are worth mentioning, particularly in what concerns shade and tree species compatible with cocoa. A brief description of his findings and suggestions is presented.
Asare, R. 2005. Cocoa agroforests in West Africa. A look at activities on preferred trees in the
farming systems. Forest & Landscape, Working Paper nr. 6
The CCAP research recommended that native and economic trees that are desirable for cocoa
production (see Table 3) must be integrated in the cocoa agroforests as a means to maintain natural
ecological functions such as nutrient recycling, soil fertility, weed and pest reduction, water retention and
erosion control. The project advised farmers to plant desirable trees along the borders of their
plantations in combination with plantain suckers before planting cocoa seedlings.
Conservation International (CI) found shade management to be a problem for most farmers. 63% of the
farms were over shaded, 32% were under shaded, and 2% had no shade. On young farms, however,
food crops were the primary source of shade with few forest trees. Accordingly, the focus should
primarily be on helping farmers with over shaded fields to identify, maintain, and manage desirable trees,
while eliminating undesirable species. On younger or under shaded farms the focus should be on
integrating desirable species either through planting or natural regeneration.
Desirable and undesirable shade trees obtained from farmers in the CI survey in Ghana Desirable tree species Local name Undesirable tree species Local name
Alstonia boonei Nyamedua Albizia zygia Okoro Ceiba pentandra Onyina Anthocleista nobilis Bontodie Entandrophragma angolense Edinam Antiaris toxicaria Kyenkyen Ficus sur Dominin Ceiba pentandra Onyina Funtumia elastica Funtum Chaetachme aristata Osonoaka Gliricidia sepium Gliricidia Cola gigantia Watapuo Milicia excelsa Odum Ficus elasticoides Nyankyerenie Nesogodia papaverifera Danta Ficus sur Dominin Pycnanthus angolense Otie Pycnanthus angolense Otie Petersianthus macrocarpa Esia Ricinodendron heudelotii Wama Rauvolfia vomitoria Kakapenpen Solanum erianthum Pepediawuo Ricinodendron heudelotti Wama Sterculia tragacantha Sofo Spathodea campanulata Kuakuanisuo Terminalia superba Ofram Triplochiton scleroxylon Wawa Citrus sinensis Mangifera indica Psidium guajava Musa paradisiacal Carica papaya Cocoa nucifera Elaies guineensis
Asare, R. 2006. Learning about neighbour trees in cocoa growing systems: a manual for farmer
trainers. Forest & Landscape, Development and Environment nr. 4
Tree diversification in cocoa, when planned well, provides greater productivity by fully exploiting
nutrients, water, and light resources within a stratified mixture of food crops, tree crops, and shade trees.
In a diversified system, mixtures of species with different growth requirements and production potentials
should be encouraged so as to reduce inter-specific competition and increase yields as compared to
mono-specific stands.
65
Tree diversification in cocoa usually occurs in the following ways:
• Establishing cocoa with food crops
• Integrating fruit trees in cocoa
• Integrating timber and nitrogen fixing tree species in cocoa
• A mixture of two or all of the above
Common traits of desired forest trees in cocoa cultivation (these traits could be included in the field
surveys).
Crown size and architecture
Tree crown size should be moderate with small branches. The crown should not be too thick or wide in
order to avoid excess humidity within the farm.
The crown should also be open so that it allows sufficient sunlight to reach the crops and/or cocoa
growing beneath it.
Root structure and composition
Selection should focus on trees with few or no buttresses, as well as trees that have deep roots that will
not compete with other crops for available moisture and nutrients.
Leaf shedding rhythm
The tree should be one that maintains most of its foliage in the dry season (this is the time desiccation is
high in cocoa) in order to provide shade for cocoa. It should also have a high decomposition rate so as to
maintain soil organic matter and nutrients within the soil.
Alternative host for diseases and pests
It is important to avoid tree species that serve as alternative hosts for diseases and pests that tend to
affect cocoa. Most of these species are trees that are part of the Sterculeaceae family (of which cocoa is
a species) or the Bombacaceae family, which share common diseases and pests with cocoa.
Asare, R. and David, S. 2010. Planting, replanting and tree diversification in cocoa systems.
Learning about sustainable cocoa production: a guide for participatory farmer training. Manual
No. 2. Development and Environment Series 13-2010. Forest & Landscape Denmark.
Cocoa is an understorey crop which means it grows well under shade. Cocoa trees need enough
vegetation cover for two purposes:
• To provide adequate initial (0-3 years) and permanent (after 4 years) shade and organic matter
• To improve soil fertility
When clearing a field to grow cocoa, farmers should leave forest trees and other vegetation that grows
well in association with cocoa and which have economic or household value. In areas where there are
no forest trees, farmers should plant forest trees (e.g., Terminalia sp., Milicia excelsa, Khaya ivorensis,
etc.) and traditional agroforestry tree species that can fix nitrogen (e.g. Gliricidia sp., Albizia sp., Acacia
sp., etc.) to improve soil nutrient content.
66
When establishing a new cocoa farm, farmers should also plant certain recommended food crops such
as plantain, cassava, coco yam, maize, etc. to provide initial shade for newly planted cocoa seedlings
and also serve as source of income. In selecting which crops to plant, it is important to choose varieties
that provide maximum shade. When an effective initial shade is provided for newly planted cocoa
seedlings it protects the seedlings from intense sun light and Mirid attack.
Young cocoa trees (0-3 years) require shade levels of about 70% (30% sunlight) and mature and old
cocoa trees (4 years and beyond) need about 30-40% shade (70% sunlight).
Selecting desirable non-cocoa trees for cultivation should follow certain criteria (these criteria could be
included in the field surveys):
Shade quality
• For crown size use the diameter to describe it – relatively large crowns have a negative shade effect
• Crown density should be determined by number and size of the leaves per unit area on the branch -
relatively broad leaves and extensive branches negatively affect shade quality
• For compactness of the canopy use the size of leaves on the branches. Relatively small leaves with a
lot of space between them promote an open canopy that allows enough sunlight to penetrate to crops
beneath the canopy. Broad, closely spaced leaf arrangements block most of the sun light resulting in a
close canopy that promotes high humidity under the canopy. This condition can create optimal conditions
for Black Pod.
2.11.2 Tree diversity analysis
Kindt and Coe, of the World Agroforestry Centre, published in 2005 a manual for tree diversity analysis
using a specific R software package, called BiodiversityR. The manual includes as well other valuable
information on sampling rules, survey techniques, and methods of analysis of biodiversity data. The
relevant information for the project, contained in this manual, is briefly described.
Sampling
The authors remind the basic rules to follow when designing and implementing a sampling procedure
and provide suggestions, specifically:
Research hypothesis
Before designing a sampling scheme, think about the research hypothesis or research objectives. The
research hypothesis should define: where the data were collected, when the data were collected and
what type of measurement was taken.
Survey area
Define clearly the survey area, with explicit geographical and temporal boundaries and at the ecological
scale of the research question
67
Size and shape of sampling units
Size and shape of the sample units can influence results; for example, more tree species are observed
in rectangular quadrats than in square quadrats of the same area. Tree species often occur in a
clustered pattern, thus more trees of the same species will be observed in square quadrats.
To compare with other studies, conversion of results to a common size and shape is sometimes
possible, although sometimes also very difficult (e.g. to calculate species richness and diversity).
To facilitate conversions, there is the possibility to split the quadrat into sub-plots of smaller sizes.
Location of sampling units
The location of the sampling units can be selected by:
Simple random sampling (it is better to first generate a grid of plots that covers the entire area). Sample units may be too close to each other or not located in all the environmental conditions under assessment
Systematic sampling. Selects sample plots at regular intervals. It is easy to implement, ensures that the entire area is sampled and it avoids selecting sample plots that are next to each other. Some statistical analysis may not be suitable
Stratified sampling. The study area is subdivided into different strata, which do not overlap and cover the entire survey area. Within each stratum, a random or systematic sample can be taken.
Choosing the sample size, the number of sampling units to select and measure should be paid proper
attention. This will depend on the complexity of the objectives, the variability of the response being
studied, the resources available. The area sampled must be representative of the study area (different
conditions, gradients)
In the case of a stratified sample, when is not possible to have the same number of observations per
strata, they can be done proportional to the size of the area (self-weighting sampling).
There are adaptive methods as well, where the position of new samples is guided by the results from
previous samples.
Data analysis
The data is usually stored in matrices. BiodiversityR works with matrices of species and environmental
conditions. This software package includes a wide range of tools that can be applied to a diversified set
of data and using different statistical techniques.
References
Kindt R and Coe R. 2005. Tree diversity analysis. A manual and software for common statistical
methods for ecological and biodiversity studies. Nairobi: World Agroforestry Centre (ICRAF).
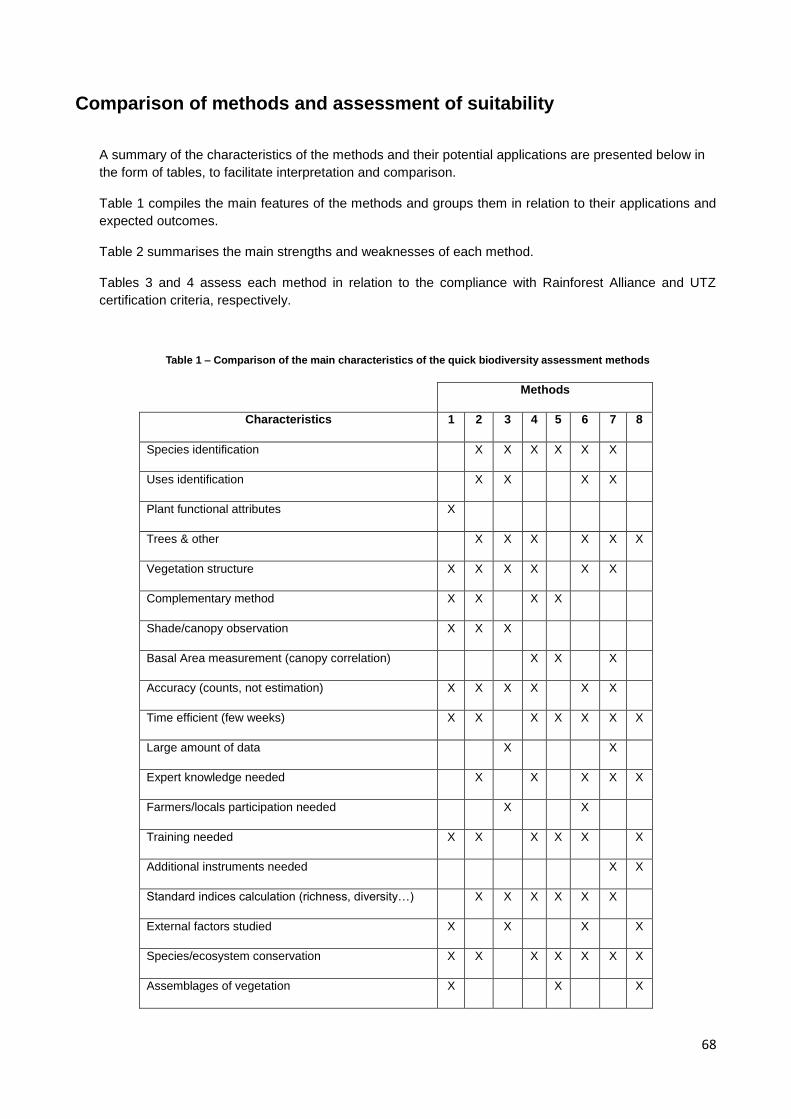
68
Comparison of methods and assessment of suitability
A summary of the characteristics of the methods and their potential applications are presented below in
the form of tables, to facilitate interpretation and comparison.
Table 1 compiles the main features of the methods and groups them in relation to their applications and
expected outcomes.
Table 2 summarises the main strengths and weaknesses of each method.
Tables 3 and 4 assess each method in relation to the compliance with Rainforest Alliance and UTZ
certification criteria, respectively.
Table 1 – Comparison of the main characteristics of the quick biodiversity assessment methods
Methods
Characteristics 1 2 3 4 5 6 7 8
Species identification X X X X X X
Uses identification X X X X
Plant functional attributes X
Trees & other X X X X X X
Vegetation structure X X X X X X
Complementary method X X X X
Shade/canopy observation X X X
Basal Area measurement (canopy correlation) X X X
Accuracy (counts, not estimation) X X X X X X
Time efficient (few weeks) X X X X X X X
Large amount of data X X
Expert knowledge needed X X X X X
Farmers/locals participation needed X X
Training needed X X X X X X
Additional instruments needed X X
Standard indices calculation (richness, diversity…) X X X X X X
External factors studied X X X X
Species/ecosystem conservation X X X X X X X
Assemblages of vegetation X X X
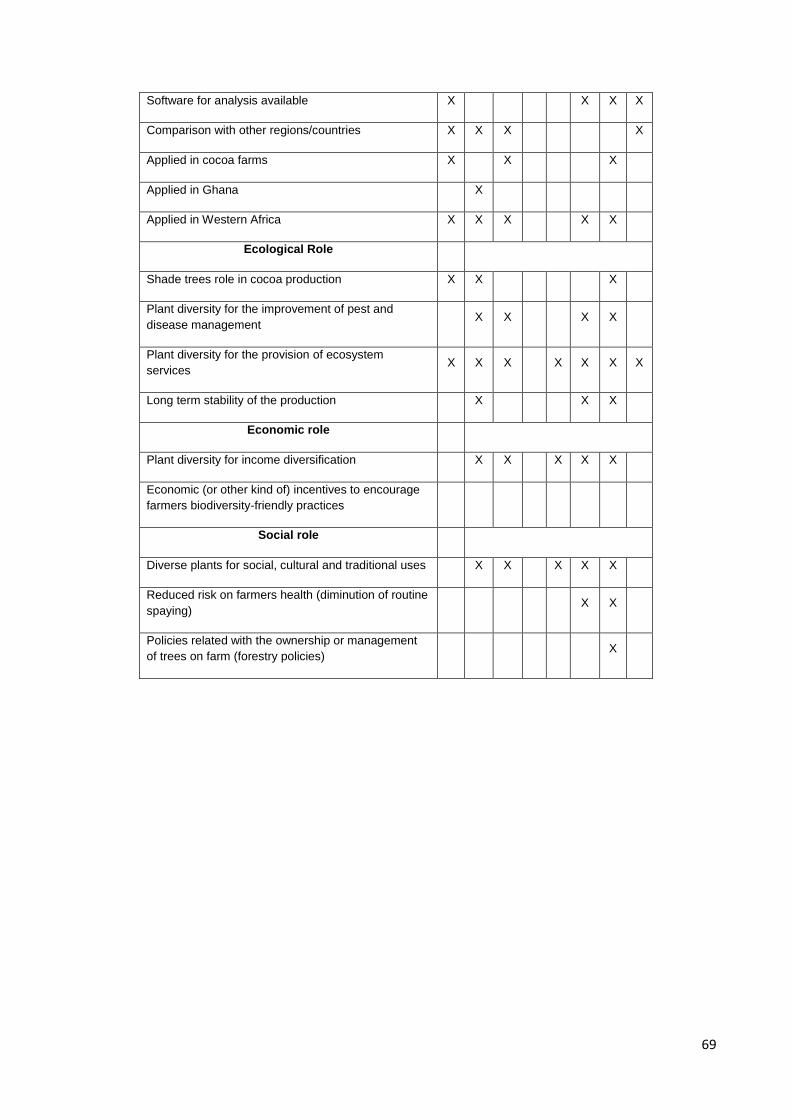
69
Software for analysis available X X X X
Comparison with other regions/countries X X X X
Applied in cocoa farms X X X
Applied in Ghana X
Applied in Western Africa X X X X X
Ecological Role
Shade trees role in cocoa production X X X
Plant diversity for the improvement of pest and
disease management X X X X
Plant diversity for the provision of ecosystem
services X X X X X X X
Long term stability of the production X X X
Economic role
Plant diversity for income diversification X X X X X
Economic (or other kind of) incentives to encourage
farmers biodiversity-friendly practices
Social role
Diverse plants for social, cultural and traditional uses X X X X X
Reduced risk on farmers health (diminution of routine
spaying) X X
Policies related with the ownership or management
of trees on farm (forestry policies) X
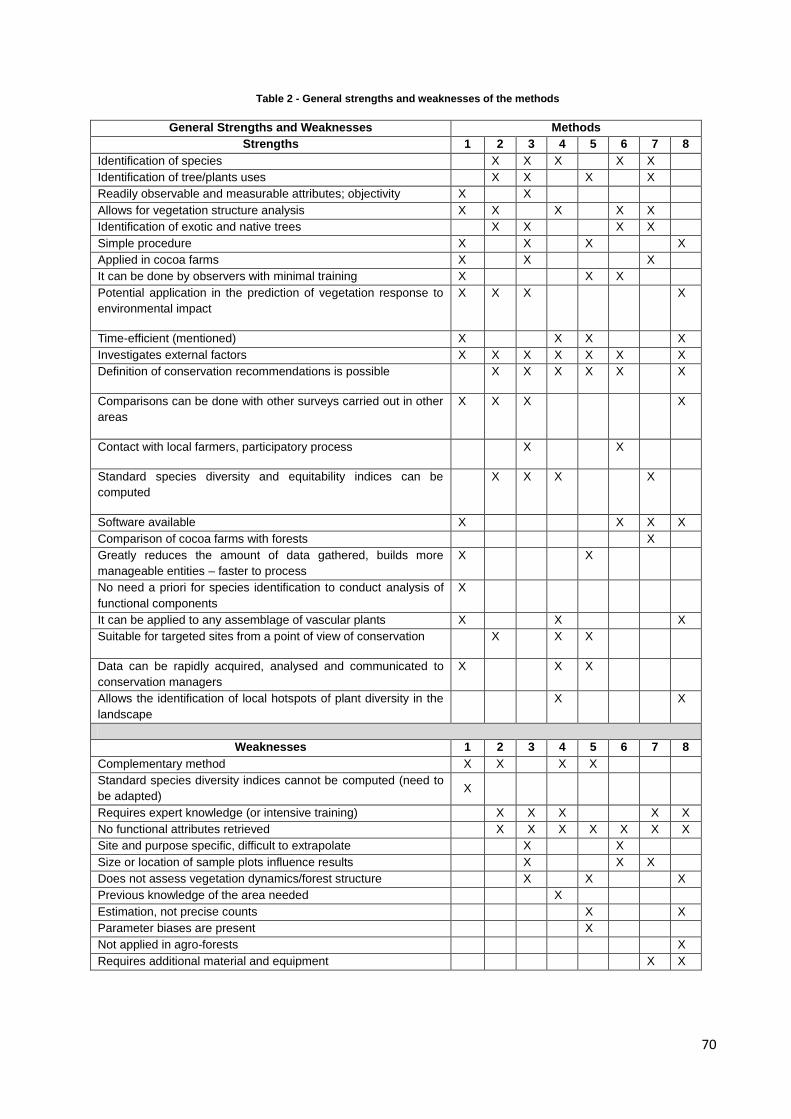
70
Table 2 - General strengths and weaknesses of the methods
General Strengths and Weaknesses Methods
Strengths 1 2 3 4 5 6 7 8
Identification of species X X X X X
Identification of tree/plants uses X X X X
Readily observable and measurable attributes; objectivity X X
Allows for vegetation structure analysis X X X X X
Identification of exotic and native trees X X X X
Simple procedure X X X X
Applied in cocoa farms X X X
It can be done by observers with minimal training X X X
Potential application in the prediction of vegetation response to
environmental impact
X X X X
Time-efficient (mentioned) X X X X
Investigates external factors X X X X X X X
Definition of conservation recommendations is possible X X X X X X
Comparisons can be done with other surveys carried out in other
areas
X X X X
Contact with local farmers, participatory process X X
Standard species diversity and equitability indices can be
computed
X X X X
Software available X X X X
Comparison of cocoa farms with forests X
Greatly reduces the amount of data gathered, builds more
manageable entities – faster to process
X X
No need a priori for species identification to conduct analysis of
functional components
X
It can be applied to any assemblage of vascular plants X X X
Suitable for targeted sites from a point of view of conservation X X X
Data can be rapidly acquired, analysed and communicated to
conservation managers
X X X
Allows the identification of local hotspots of plant diversity in the
landscape
X X
Weaknesses 1 2 3 4 5 6 7 8
Complementary method X X X X
Standard species diversity indices cannot be computed (need to
be adapted) X
Requires expert knowledge (or intensive training) X X X X X
No functional attributes retrieved X X X X X X X
Site and purpose specific, difficult to extrapolate X X
Size or location of sample plots influence results X X X
Does not assess vegetation dynamics/forest structure X X X
Previous knowledge of the area needed X
Estimation, not precise counts X X
Parameter biases are present X
Not applied in agro-forests X
Requires additional material and equipment X X
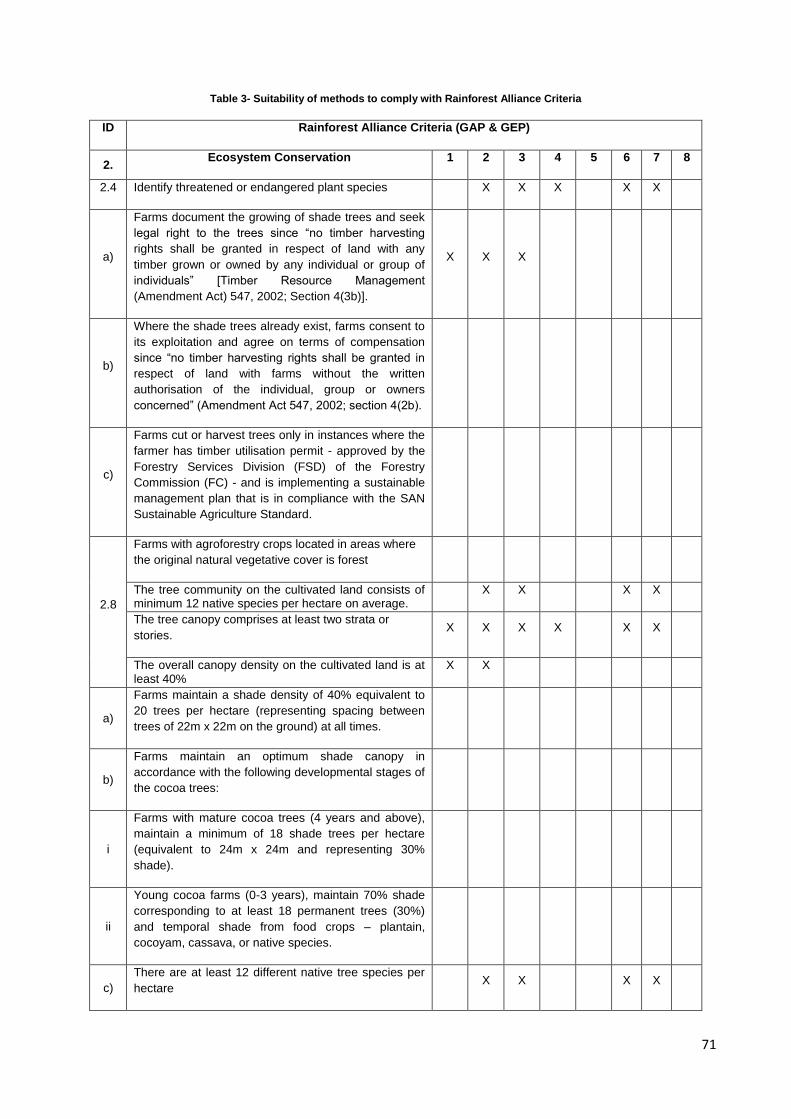
71
Table 3- Suitability of methods to comply with Rainforest Alliance Criteria
ID Rainforest Alliance Criteria (GAP & GEP)
2. Ecosystem Conservation 1 2 3 4 5 6 7 8
2.4 Identify threatened or endangered plant species X X X X X
a)
Farms document the growing of shade trees and seek
legal right to the trees since ―no timber harvesting
rights shall be granted in respect of land with any
timber grown or owned by any individual or group of
individuals‖ [Timber Resource Management
(Amendment Act) 547, 2002; Section 4(3b)].
X X X
b)
Where the shade trees already exist, farms consent to
its exploitation and agree on terms of compensation
since ―no timber harvesting rights shall be granted in
respect of land with farms without the written
authorisation of the individual, group or owners
concerned‖ (Amendment Act 547, 2002; section 4(2b).
c)
Farms cut or harvest trees only in instances where the
farmer has timber utilisation permit - approved by the
Forestry Services Division (FSD) of the Forestry
Commission (FC) - and is implementing a sustainable
management plan that is in compliance with the SAN
Sustainable Agriculture Standard.
2.8
Farms with agroforestry crops located in areas where
the original natural vegetative cover is forest
The tree community on the cultivated land consists of minimum 12 native species per hectare on average.
X X X X
The tree canopy comprises at least two strata or
stories. X X X X X X
The overall canopy density on the cultivated land is at least 40%
X X
a)
Farms maintain a shade density of 40% equivalent to
20 trees per hectare (representing spacing between
trees of 22m x 22m on the ground) at all times.
b)
Farms maintain an optimum shade canopy in
accordance with the following developmental stages of
the cocoa trees:
i
Farms with mature cocoa trees (4 years and above),
maintain a minimum of 18 shade trees per hectare
(equivalent to 24m x 24m and representing 30%
shade).
ii
Young cocoa farms (0-3 years), maintain 70% shade
corresponding to at least 18 permanent trees (30%)
and temporal shade from food crops – plantain,
cocoyam, cassava, or native species.
c)
There are at least 12 different native tree species per
hectare X X X X
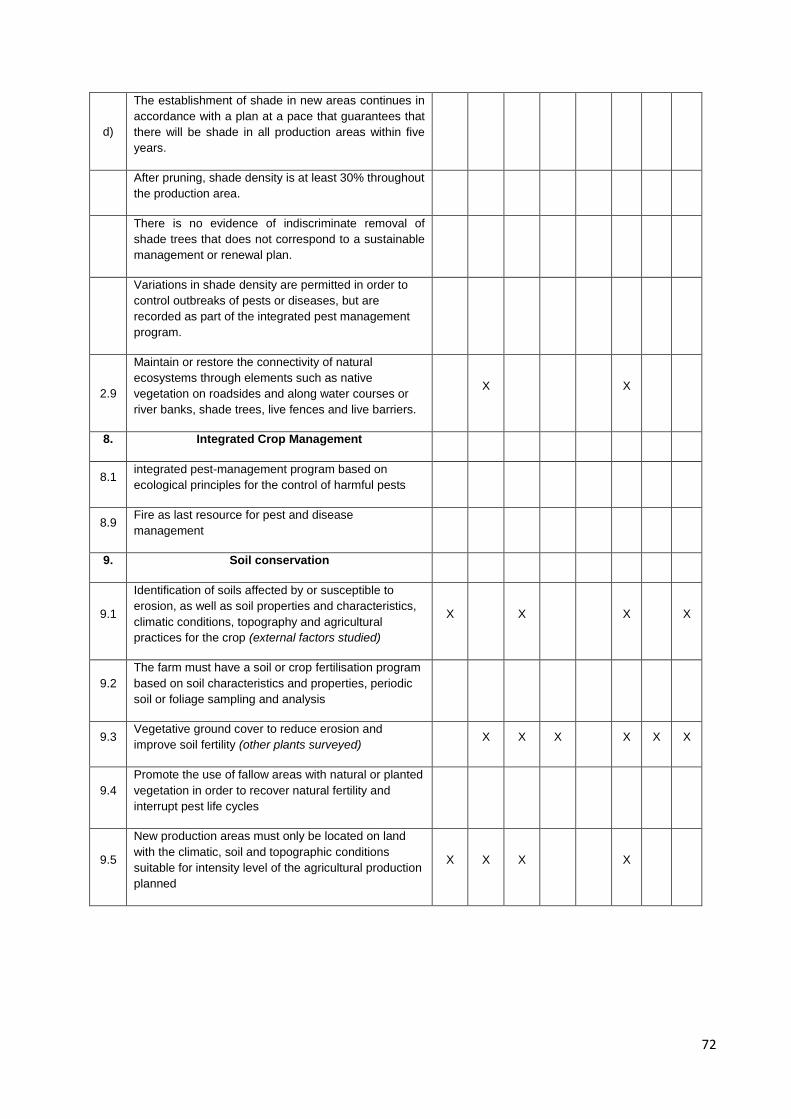
72
d)
The establishment of shade in new areas continues in
accordance with a plan at a pace that guarantees that
there will be shade in all production areas within five
years.
After pruning, shade density is at least 30% throughout
the production area.
There is no evidence of indiscriminate removal of
shade trees that does not correspond to a sustainable
management or renewal plan.
Variations in shade density are permitted in order to
control outbreaks of pests or diseases, but are
recorded as part of the integrated pest management
program.
2.9
Maintain or restore the connectivity of natural
ecosystems through elements such as native
vegetation on roadsides and along water courses or
river banks, shade trees, live fences and live barriers.
X X
8. Integrated Crop Management
8.1 integrated pest-management program based on
ecological principles for the control of harmful pests
8.9 Fire as last resource for pest and disease
management
9. Soil conservation
9.1
Identification of soils affected by or susceptible to
erosion, as well as soil properties and characteristics,
climatic conditions, topography and agricultural
practices for the crop (external factors studied)
X X X X
9.2
The farm must have a soil or crop fertilisation program
based on soil characteristics and properties, periodic
soil or foliage sampling and analysis
9.3 Vegetative ground cover to reduce erosion and
improve soil fertility (other plants surveyed) X X X X X X
9.4
Promote the use of fallow areas with natural or planted
vegetation in order to recover natural fertility and
interrupt pest life cycles
9.5
New production areas must only be located on land
with the climatic, soil and topographic conditions
suitable for intensity level of the agricultural production
planned
X X X X
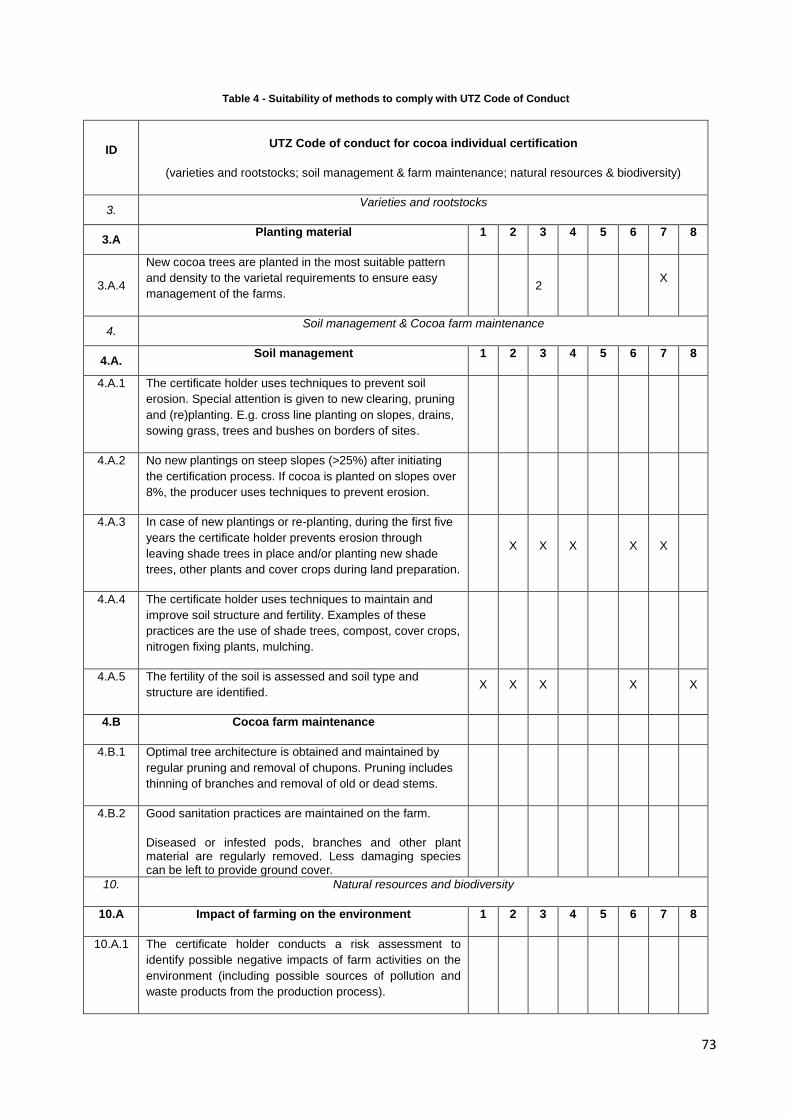
73
Table 4 - Suitability of methods to comply with UTZ Code of Conduct
ID
UTZ Code of conduct for cocoa individual certification
(varieties and rootstocks; soil management & farm maintenance; natural resources & biodiversity)
3. Varieties and rootstocks
3.A Planting material 1 2 3 4 5 6 7 8
3.A.4
New cocoa trees are planted in the most suitable pattern
and density to the varietal requirements to ensure easy
management of the farms.
2 X
X
4. Soil management & Cocoa farm maintenance
4.A. Soil management 1 2 3 4 5 6 7 8
4.A.1 The certificate holder uses techniques to prevent soil
erosion. Special attention is given to new clearing, pruning
and (re)planting. E.g. cross line planting on slopes, drains,
sowing grass, trees and bushes on borders of sites.
4.A.2 No new plantings on steep slopes (>25%) after initiating
the certification process. If cocoa is planted on slopes over
8%, the producer uses techniques to prevent erosion.
4.A.3 In case of new plantings or re-planting, during the first five
years the certificate holder prevents erosion through
leaving shade trees in place and/or planting new shade
trees, other plants and cover crops during land preparation.
X X X X X
4.A.4 The certificate holder uses techniques to maintain and
improve soil structure and fertility. Examples of these
practices are the use of shade trees, compost, cover crops,
nitrogen fixing plants, mulching.
4.A.5 The fertility of the soil is assessed and soil type and
structure are identified. X X X X X
4.B Cocoa farm maintenance
4.B.1 Optimal tree architecture is obtained and maintained by
regular pruning and removal of chupons. Pruning includes
thinning of branches and removal of old or dead stems.
4.B.2 Good sanitation practices are maintained on the farm.
Diseased or infested pods, branches and other plant material are regularly removed. Less damaging species can be left to provide ground cover.
10. Natural resources and biodiversity
10.A Impact of farming on the environment 1 2 3 4 5 6 7 8
10.A.1 The certificate holder conducts a risk assessment to
identify possible negative impacts of farm activities on the
environment (including possible sources of pollution and
waste products from the production process).
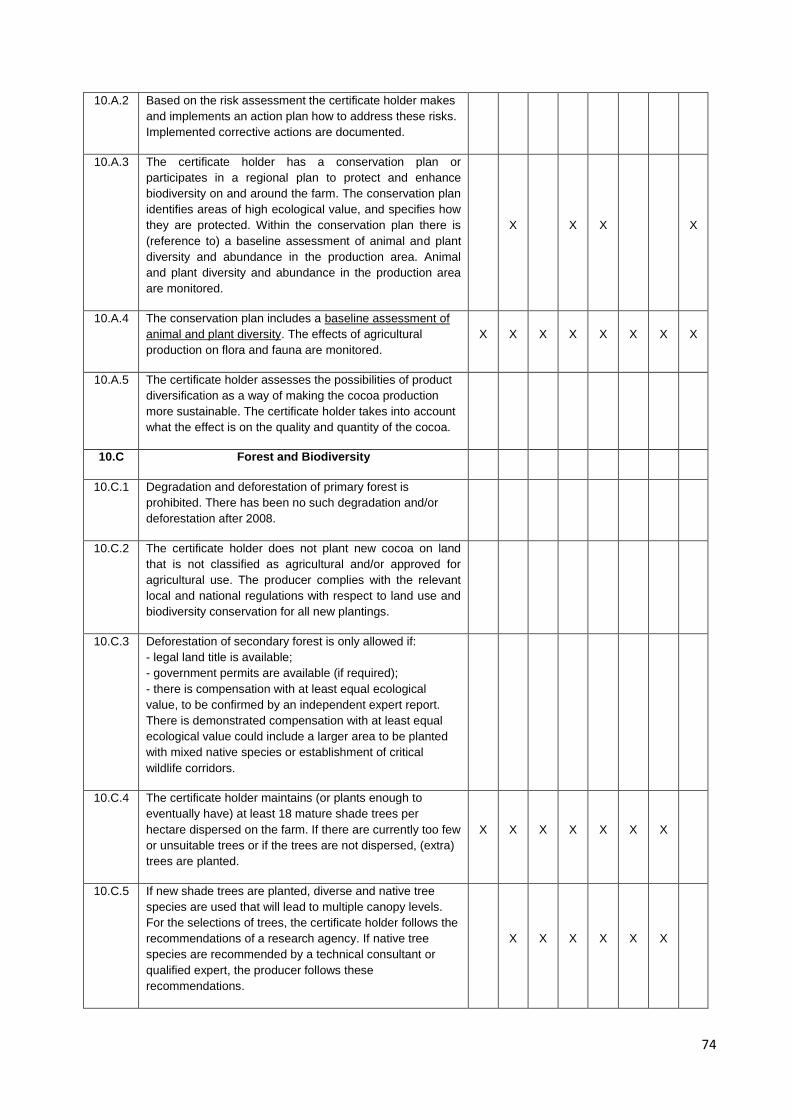
74
10.A.2 Based on the risk assessment the certificate holder makes
and implements an action plan how to address these risks.
Implemented corrective actions are documented.
10.A.3 The certificate holder has a conservation plan or
participates in a regional plan to protect and enhance
biodiversity on and around the farm. The conservation plan
identifies areas of high ecological value, and specifies how
they are protected. Within the conservation plan there is
(reference to) a baseline assessment of animal and plant
diversity and abundance in the production area. Animal
and plant diversity and abundance in the production area
are monitored.
X X X X
10.A.4 The conservation plan includes a baseline assessment of
animal and plant diversity. The effects of agricultural
production on flora and fauna are monitored.
X X X X X X X X
10.A.5 The certificate holder assesses the possibilities of product
diversification as a way of making the cocoa production
more sustainable. The certificate holder takes into account
what the effect is on the quality and quantity of the cocoa.
10.C Forest and Biodiversity
10.C.1 Degradation and deforestation of primary forest is
prohibited. There has been no such degradation and/or
deforestation after 2008.
10.C.2 The certificate holder does not plant new cocoa on land
that is not classified as agricultural and/or approved for
agricultural use. The producer complies with the relevant
local and national regulations with respect to land use and
biodiversity conservation for all new plantings.
10.C.3 Deforestation of secondary forest is only allowed if:
- legal land title is available;
- government permits are available (if required);
- there is compensation with at least equal ecological
value, to be confirmed by an independent expert report.
There is demonstrated compensation with at least equal
ecological value could include a larger area to be planted
with mixed native species or establishment of critical
wildlife corridors.
10.C.4 The certificate holder maintains (or plants enough to
eventually have) at least 18 mature shade trees per
hectare dispersed on the farm. If there are currently too few
or unsuitable trees or if the trees are not dispersed, (extra)
trees are planted.
X X X X X X X
10.C.5 If new shade trees are planted, diverse and native tree
species are used that will lead to multiple canopy levels.
For the selections of trees, the certificate holder follows the
recommendations of a research agency. If native tree
species are recommended by a technical consultant or
qualified expert, the producer follows these
recommendations.
X X X X X X
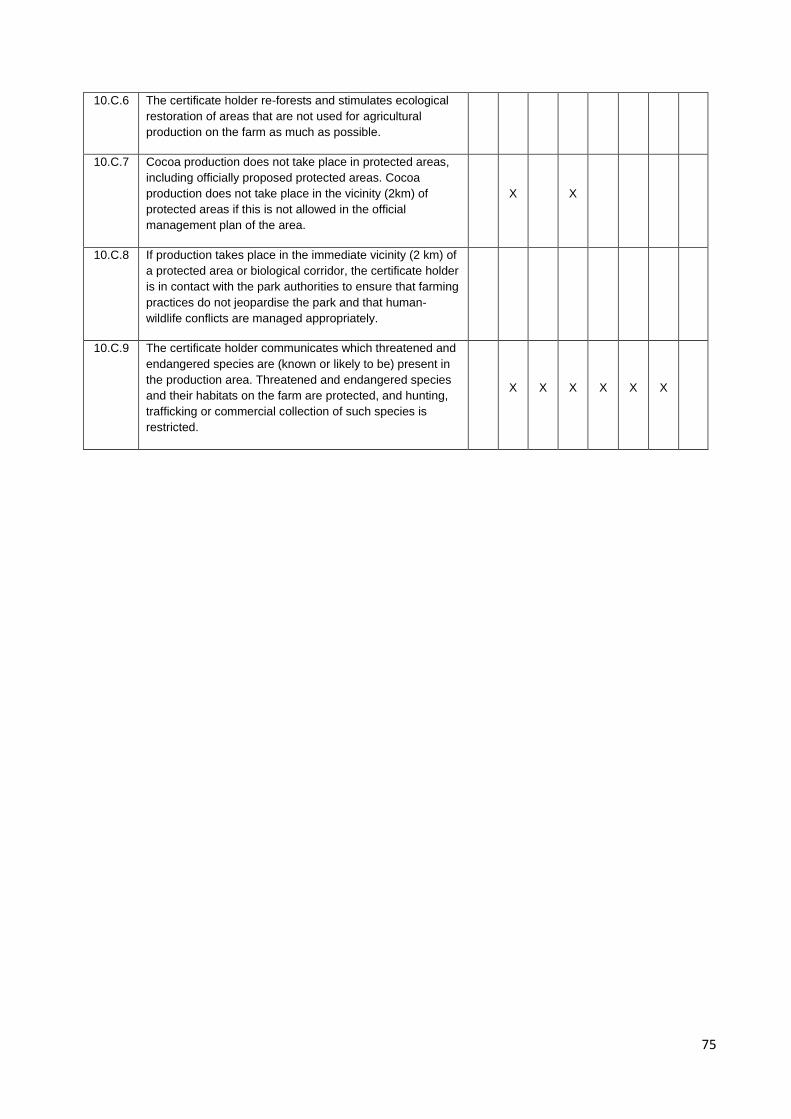
75
10.C.6 The certificate holder re-forests and stimulates ecological
restoration of areas that are not used for agricultural
production on the farm as much as possible.
10.C.7 Cocoa production does not take place in protected areas,
including officially proposed protected areas. Cocoa
production does not take place in the vicinity (2km) of
protected areas if this is not allowed in the official
management plan of the area.
X X
10.C.8 If production takes place in the immediate vicinity (2 km) of
a protected area or biological corridor, the certificate holder
is in contact with the park authorities to ensure that farming
practices do not jeopardise the park and that human-
wildlife conflicts are managed appropriately.
10.C.9 The certificate holder communicates which threatened and
endangered species are (known or likely to be) present in
the production area. Threatened and endangered species
and their habitats on the farm are protected, and hunting,
trafficking or commercial collection of such species is
restricted.
X X X X X X
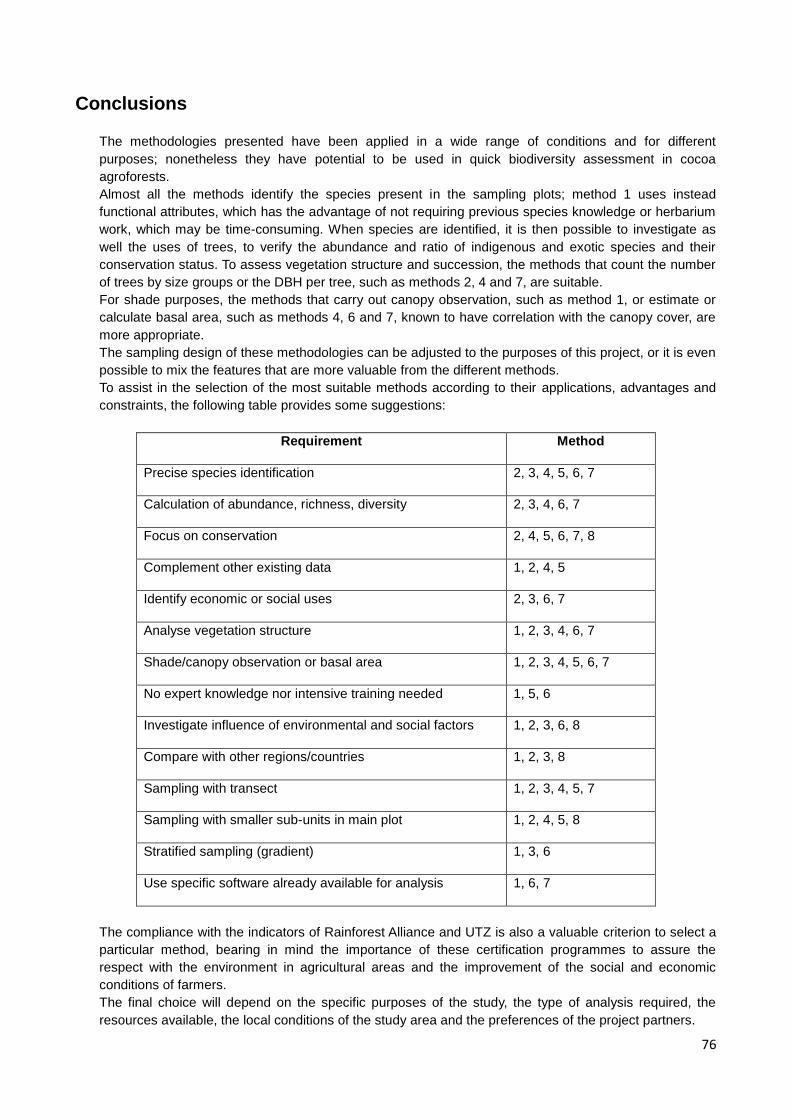
76
Conclusions
The methodologies presented have been applied in a wide range of conditions and for different
purposes; nonetheless they have potential to be used in quick biodiversity assessment in cocoa
agroforests.
Almost all the methods identify the species present in the sampling plots; method 1 uses instead
functional attributes, which has the advantage of not requiring previous species knowledge or herbarium
work, which may be time-consuming. When species are identified, it is then possible to investigate as
well the uses of trees, to verify the abundance and ratio of indigenous and exotic species and their
conservation status. To assess vegetation structure and succession, the methods that count the number
of trees by size groups or the DBH per tree, such as methods 2, 4 and 7, are suitable.
For shade purposes, the methods that carry out canopy observation, such as method 1, or estimate or
calculate basal area, such as methods 4, 6 and 7, known to have correlation with the canopy cover, are
more appropriate.
The sampling design of these methodologies can be adjusted to the purposes of this project, or it is even
possible to mix the features that are more valuable from the different methods.
To assist in the selection of the most suitable methods according to their applications, advantages and
constraints, the following table provides some suggestions:
Requirement Method
Precise species identification 2, 3, 4, 5, 6, 7
Calculation of abundance, richness, diversity 2, 3, 4, 6, 7
Focus on conservation 2, 4, 5, 6, 7, 8
Complement other existing data 1, 2, 4, 5
Identify economic or social uses 2, 3, 6, 7
Analyse vegetation structure 1, 2, 3, 4, 6, 7
Shade/canopy observation or basal area 1, 2, 3, 4, 5, 6, 7
No expert knowledge nor intensive training needed 1, 5, 6
Investigate influence of environmental and social factors 1, 2, 3, 6, 8
Compare with other regions/countries 1, 2, 3, 8
Sampling with transect 1, 2, 3, 4, 5, 7
Sampling with smaller sub-units in main plot 1, 2, 4, 5, 8
Stratified sampling (gradient) 1, 3, 6
Use specific software already available for analysis 1, 6, 7
The compliance with the indicators of Rainforest Alliance and UTZ is also a valuable criterion to select a
particular method, bearing in mind the importance of these certification programmes to assure the
respect with the environment in agricultural areas and the improvement of the social and economic
conditions of farmers.
The final choice will depend on the specific purposes of the study, the type of analysis required, the
resources available, the local conditions of the study area and the preferences of the project partners.
77
Additional notes:
The methodologies hereby reviewed were presented and discussed at the workshop in Accra (please see the workshop report). The methodological principles here presented were used as guidelines to design and propose a set of rapid assessment methods to be tested in the field, in order to select the most suitable method to attain the project objectives (please see the Proposal of Biodiversity Rapid Assessment Methodologies for further information).

78
Annex 1 of Section 2
Different people and groups who have been consulted when gathering information
For the rapid plant diversity assessment methods, the following people have been contacted:
Richard Asare: Richard is working for the Sustainable Tree-Crop Programme (STCP) at the International Institute for Tropical Agriculture (IITA) based in Accra, Ghana, and with Forest & Landscape Denmark. He is now doing a PhD on cocoa agroforestry systems and climate change resilience. He already published many documents and training guides for farmers on cocoa agroforests and their management;
Denis Sonwa: Denis is working for the Centre for International Forestry Research (CIFOR) based in Cameroon and has already published many articles on Cameroonian cocoa agroforests, production and diversity;
Yaw Osei-Owusu: Yaw Osei-Owusu is the Regional Director of Conservation Alliance, a non-governmental environmental organisation based in Accra, Ghana, whose mission is to work with strategic partners to empower communities to lead in biodiversity conservation and create opportunities for economic growth and improved human wellbeing. Conservation Alliance has a programme on cocoa and commodity certification through which they provide support for improved farm yields and wellbeing through the good agricultural practices and environmentally friendly methods of cocoa cultivation. Their services include mobilising farmers into groups, providing farmers with training and prepare them towards Rainforest Alliance, UTZ or Fairtrade Certification Standards. Mr. Osei-Owusu has experiences with rapid diversity assessment methods;
Andy Gillison: Dr. Gillison is an expert forester and Director of the Center for Biodiversity Management, based in Queensland, Australia. Dr. Gillison has developed a methodology (the ‗VegClass‘ system) which includes the recording of plant functional types using a generic typology for rapid diversity assessment. The VegClass system will be part of our analysis;
Bioversity International staff from the Forest Genetic Resources Programme: Dr. Laura Snook, forester, and Riina Jalonen, an associate expert working on forest tree population distribution and climate change in Malaysia;
Richard Coe: Dr. Coe is working in the research support unit of the World Agroforestry Centre, based in Tanzania. He has written a Manual and developed a software package on tree diversity analysis.
List of other data sources that have been accessed
Google Scholar for looking for appropriate references on the subject
Rainforest Alliance Website for the Sustainable Agriculture Network (SAN) Standards criteria for possible certification
World Agroforestry Centre Website
Conservation Alliance Website
Sci-Lit database: Bioversity International internal database of staff authored publications
Sustainable Tree-Crop Programme (STCP) of the International Institute for Tropical Agriculture (IITA) Website
Acknowledgements Bioversity International wishes to thank all partners who collaborated to the compilation of this literature review, by giving their guidance on the core literature useful for the purpose.
79
Bibliography of Section 2
Anglaaere, L.C. N. (2005). Improving the sustainability of cocoa farms in Ghana through utilization of native
forest trees in Agroforestry systems. PhD thesis. University of Wales, Bangor, UK.
Altieri, Miguel A. ―The ecological role of biodiversity in agroecosystems.‖ Agriculture, Ecosystems &
Environment 74, no. 1-3 (June 1999): 19-31.
Asare, Richard. ―A review on cocoa agroforestry as a means for biodiversity conservation.‖ Forest &
Landscape, no. May (2006).
———. ―Cocoa agroforests in West Africa: a look at activities on preferred trees in the farming systems.‖
Forest & Landscape Working Papers no. 6, 2005.
———. ―Learning about neighbour trees in cocoa growing systems: a manual for farmer trainers.‖ Forest &
Landscape, Development and Environment Series, no. 4 (2006): 91 p.
Asare, Richard, Sonii David, and Denis Sonwa. Conservation and biodiversity in and around cocoa farms.
Learning about sustainable cocoa production: a guide for participatory farmer training. Edited by Richard
Asare, Sonii David, and Denis Sonwa. Environment. Development and Environment Series 12-2009.
Forest and Landscape Denmark, 2009.
Asare, Richard, and Sonii David. Planting, replanting and tree diversification in cocoa systems. Learning about
sustainable cocoa production: a guide for participatory farmer training. Manual No. 2. Environment.
Copenhagen, Denmark: Development and Environment Series 13-2010, Forest and Landscape
Denmark, 2010.
Asare, Richard, and Cynthia Prah. ―Shade trees in the cocoa landscape: how Ghana can benefit from
valuable trees on farms.‖ Daily Graphics. Accra, Ghana, 2011.
Bayala, J., R. Kindt, M. Belem, and A. Kalinganire. ―Factors affecting the dynamics of tree diversity in
agroforestry parklands of cereal and cotton farming systems in Burkina Faso.‖ New Forests 41 (2011):
281-296.
Boshier D. (2012). Conservation of tree species diversity in cocoa agroforests in Nigeria. A case study and
teacher‘s note. In: Forest Genetic Resources Training Guide. Edited by D. Boshier, M. Bozzano, J. Loo,
P. Rudebjer. Bioversity International, Rome, Italy.
Boulay, Michel. ―ETUDE DE LA PHENOEOGIE DE DIFFERENTS HYBRIDES DE CACAOYER ASSOCIES A
SIX ESPECES D‘ARBRE D'OMBRAGE.‖ Mémoire présenté a 1a Faculté des études supérieures de
l’Université Laval pour l'obtention du grade de maître ès sciences (M. Sc.). UNIVERSITE LAVAL,
Quebec, Canada, 1998.
CREM. PES and Cocoa: Securing future supplies and preserving biodiversity by paying cocoa farmers for
Ecosystem Services. Amsterdam, The Netherlands, 2011.
Dahlquist, R. M., M. P. Whelan, L. Winowiecki, B. Polidoro, S. Candela, C. a. Harvey, J. D. Wulfhorst, P. a.
McDaniel, and N. a. Bosque-Pérez. ―Incorporating livelihoods in biodiversity conservation: a case study
of cacao agroforestry systems in Talamanca, Costa Rica.‖ Biodiversity and Conservation 16, no. 8 (June
6, 2007): 2311-2333.
80
David, Soniia, Sylvanus Agordorku, Simon Bassanaga, JeanYves Couloud, Mary Adu Kumi, Innocent Okuku,
and Dieu ne dort Wandji. A guide for conducting farmer field schools on cocoa integrated crop and pest
management. Accra, Ghana: Sustainable Tree Crops Program (STCP), International Institute of Tropical
Agriculture (IITA), 2006.
Duguma, B., J. Gockowski, and J. Bakala. ―Smallholder cocoa cultivation in agroforestry systems of West and
Central Africa‖, n.d.
European Learning Network on Functional AgroBiodiversity (ELN-FAB). Online at: http://www.eln-fab.eu/
FAO (2002). ―Etude de cas d‘aménagement forestier exemplaire en Afrique centrale: les systems
agroforestiers cacaoyers, Cameroun‖. Par Denis J. Sonwa, octobre 2002. Document de travail FM/12F.
Service de la mise en valeur des ressources forestières, Division des ressources forestières. FAO,
Rome (non publié).
FAO (2001). Country Report – Ghana. Available at: http://www.fao.org/docrep/003/ab567e/AB567E02.htm
Flynn, Dan F B, Melanie Gogol-Prokurat, Theresa Nogeire, Nicole Molinari, Bárbara Trautman Richers,
Brenda B Lin, Nicholas Simpson, Margaret M Mayfield, and Fabrice DeClerck. ―Loss of functional
diversity under land use intensification across multiple taxa.‖ Ecology letters 12, no. 1 (January 2009):
22-33.
Gillison, A. N., and G. Carpenter. ―A generic plant functional attribute set and grammar for dynamic vegetation
description and analysis.‖ Functional Ecology 11 (1997): 775-783.
Gillison, Andrew. ―A Generic, Computer-assisted Method for Rapid Vegetation Classification and Survey :
Tropical and Temperate Case Studies.‖ Conservation Ecology 6, no. 2 (2002): 1-17.
Gillison, Andrew N, Nining Liswanti, Suseno Budidarsono, Meine Van Noordwijk, and Thomas P Tomich.
―Impact of Cropping Methods on Biodiversity in Coffee Agroecosystems in Sumatra , Indonesia.‖ Ecology
and Society 9, no. 2 (2004): 1-31.
Gockowski, James, Stephan Weise, Denis Sonwa, Mathurin Tchtat, and Martine Ngobo. ―Conservation
Because It Pays : Shaded Cocoa Agroforests in West Africa‖ (n.d.): 29 p.
Gockowski, Jim, and Denis Sonwa. ―Biodiversity and smallholder cocoa production systems in West Africa.‖
Tropical Agriculture. Accra, Ghana, 2008.
Kindt R and Coe R. 2005. Tree diversity analysis. A manual and software for common statistical methods for
ecological and biodiversity studies. Nairobi: World Agroforestry Centre (ICRAF).
Kuncoro SA, van Noordwijk M, Martini E, Saipothong P, Areskoug V, EkaDinata A and O'Connor T. (2006).
Rapid Agrobiodiversity Appraisal (RABA) in the Context of Environmental Service Rewards. Bogor,
Indonesia. World Agroforestry Centre - ICRAF, SEA Regional Office. 106p.
Laird, Sarah a., Gabriel Leke Awung, and Rita J. Lysinge. ―Cocoa farms in the Mount Cameroon region:
biological and cultural diversity in local livelihoods.‖ Biodiversity and Conservation 16, no. 8 (June 21,
2007): 2401-2427.
McCullough J, Alonso LE, Naskrecki P and Osei-Owusu Y. (2006). ―A Rapid Biodiversity Assessment of the
Atewa Range Forest Reserve, Ghana‖. RAP Bulletin of Biological Assessment #47. 184 pages,
Conservation International Rapid Assessment Program.
81
McCullough J, Hoke P, Naskrecki P, Osei-Owusu Y. (eds). (2008). A Rapid Biological Assessment of the
Ajenjua Bepo and Mamang River Forest Reserves, Ghana. RAP Bulletin of Biological Assessment 50.
Conservation International Rapid Assessment Program.
Moonen, Anna-Camilla, and Paolo Bàrberi. ―Functional biodiversity: An agroecosystem approach.‖ Agriculture,
Ecosystems & Environment 127, no. 1-2 (August 2008): 7-21.
Norgrove, Lindsey, C Csuzdi, F Forzi, M Canet, and J Gounes. ―Shifts in soil faunal community structure in
shaded cacao agroforests and consequences for ecosystem function in Central Africa.‖ Journal of
Tropical Ecology 50, no. 1 (2009): 71-78.
Noss, Reed F. ―Indicators for Monitoring Biodiversity: A Hierarchical Approach.‖ Conservation Biology 4, no. 4
(1990): 355-364.
Obiri, Beatrice Darko, Geoff a. Bright, Morag a. McDonald, Luke C. N. Anglaaere, and Joseph Cobbina.
―Financial analysis of shaded cocoa in Ghana.‖ Agroforestry Systems 71, no. 2 (April 21, 2007): 139-
149.
Oke, DO, Odebiyi, KA. (2007). Traditional cocoa-based agroforestry and forest species conservation in Ondo
State, Nigeria. Agriculture, Ecosystems & Environment, 122: 305-311.
Ruf, François Olivier. ―The Myth of Complex Cocoa Agroforests: The Case of Ghana.‖ Human ecology: an
interdisciplinary journal 39, no. 3 (June 2011): 373-388.
Sanders, Casey J. ―Avian Foraging Behaviors in Cacao Agroecosystems of Southern Cameroon‖. Technische
Universität München, 2007.
Schroth G, Harvey, CA. ―Biodiversity conservation in cocoa production landscapes : an overview.‖ Biodiversity
& Conservation 16, no. 8 (2007): 2237-2244.
Sheil, D., Ducey, M.J., Sidiyasa, K., Samsoedin, I. (2003). A new type of sample unit for the efficient
assessment of diverse tree communities in complex forest landscapes. Journal of Tropical Forest
Science 15 (1): 117-135.
Sonwa, D J, J C Okafor, P Mpungi Buyungu, S F Weise, M Tchatat, A A Adesina, A B Nkongmeneck, O
Ndoye, and D Endamana. ―DACRYODES EDULIS , A NEGLECTED NON-TIMBER FOREST SPECIES
FOR THE AGROFORESTRY SYSTEMS OF WEST AND CENTRAL AFRICA.‖ Forests, Trees and
Livelihoods 12 (2002): 41-55.
Sonwa, D J, S F Weise, A-B Nkongmeneck, D Nwaga, L Zapfack, L Z Nzooh, and M.J.J. Janssens. ―Potential
contributions of biotechnologies in the management and conservation of forest resources of the Congo
basin.‖ International Forestry Review 7, no. 1 (2005): 59-62.
Sonwa, Denis J, Bernard A Nkongmeneck, Stephan F Weise, Maturin Tchatat, and J J Janssens. ―Chocolate
Forest and the Peri-Urban Landscape : Tree diversity of the cocoa agroforests around Yaoundé
(southern Cameroon).‖ Tropical Agriculture, 2008.
Sonwa, Denis J, and Stephan F Weise. ―Diversifying and Intensifying the Cocoa Agroforest Landscape :
Review and strategic approaches for managing the shade matrix in West and Central Africa.‖ Africa.
Accra, Ghana, 2008.
82
Sonwa, Denis J., Bernard A. Nkongmeneck, Stephan F. Weise, Maturin Tchatat, and Marc J.J. Janssens
(2009). ―TREE DIVERSITY OF THE COCOA AGROFOREST AROUND YAOUNDE (SOUTHERN
CAMEROON).‖ In Systematics and Conservation of African Plants, edited by X. van der Burgt, J. van der
Maesen, and J.-M. Onana, 691-699. Kew: Royal Botanic Gardens.
Sonwa, Denis J., Bernard a. Nkongmeneck, Stephan F. Weise, Maturin Tchatat, Akin a. Adesina, and Marc J.
J. Janssens (May 31, 2007). ―Diversity of plants in cocoa agroforests in the humid forest zone of
Southern Cameroon.‖ Biodiversity and Conservation 16, 8: 2385-2400.
Sonwa, Denis J., Stephan F. Weise, Akin A. Adesina, Mathurin Tchatat, Ousseynou Ndoye, and Dominique
Endamana (2006). ―ADAPTATIONS OF COCOA AND COFFEE FARMERS‘ COMMUNITIES IN THE
HEART OF REMNANT PRISTINE FOREST OF EAST CAMEROON TO INSTITUTIONAL CHANGES.‖
In Patterns and processes in forest landscapes. Consequences of human management, edited by R.
Lafortezza and G. Sanesi, pp 339-347. Accademia Italiana di Scienze Forestali.
Sonwa, Denis, Setphan F Weise, Mathurin Tchatat, Bernard Nkongmeneck, Akinwumi A. Adesina,
Ousseynou Ndoye, and James Gockowski (2001). ―The Role of Cocoa Agroforests in Community and
Farm Forestry in Southern Cameroon.‖ Network. London, UK.
Stohlgren, Thomas J, Geneva W Chong, Mohammed A Kalkhan, and Lisa D Schell (1997). ―Rapid
assessment of plant diversity patterns: a methodology for landscapes‖. Environmental Monitoring and
Assessment 48: 25-43.
Sustainable Agriculture Network (2009). Interpretation Guidelines - Indicators for Sustainable Cocoa
Production in Ghana. April 2009. Available at: [http://sanstandards.org/userfiles/SAN-G-6-
1%20Local%20Indicators%20Cocoa%20Ghana%20April%202009.pdf] last accessed: 20 September
2012
―Sustainable Agriculture Standard‖ (SAN), (2010). Agriculture. San Jose, Costa Rica: Sustainable Agriculture
Network.
Sustainable Tree Crop Program. Improve your cocoa production - a guide for farmers. Part 1. Pruning, black
pod, shade, IPM (2007). Accra, Ghana: International Institute of Tropical Agriculture (IITA).
———. Improve your cocoa production - a guide for farmers. Part 2. Applying fertilizer and pesticides to cocoa
trees (2007). Accra, Ghana: International Institute of Tropical Agriculture (IITA).
———. Improve your cocoa production - a guide for farmers. Part 3 (2007). Harvest and post harvest cocoa
production. Accra, Ghana: International Institute of Tropical Agriculture (IITA).
Tettey, Samuel, Moses Ogoe, and Sonii David (2009). Preventing and Reducing Injuries and Ill Health in
Cocoa Production. Learning about Sustainable Cocoa Production : A Guide for Participatory Farmer
Training, Manual no. 4. Accra, Ghana: Sustainable Tree Crops Program, International Institute of
Tropical Agriculture (IITA).
Tomich, T.P., C.A. Palm, S.J. Velarde, H. Geist, A.N. Gillison, L. Lebel, M. Locatelli, et al. (2004). Forest and
Agroecosystem Tradeoffs in the Humid Tropics. A Crosscutting Assessment by the Alternatives to Slash-
and-Burn Consortium conducted as a sub-global component of the Millennium Ecosystem Assessment.
Assessment. Nairobi, Kenya.
Vanclay, J. K., A. N. Gillison, and R. J. Keenan. ―Using plant functional attributes to quantify site productivity
and growth patterns in mixed forests.‖ Forest Ecology and Management 94 (June 1997): 149-163.
83
Weinbaum, K., D. Sonwa, S. Weise, J. Brashares, and W. M. Getz (2007). ―Wildlife Diversity in
Cocoa/Agricultural Mosaics at the Congo Basin Forest Margin‖.‖ STCP Working Paper Series 3.
International Institute of Tropical Agriculture.
UTZ CERTIFIED 2009. UTZ CERTIFIED Good Inside Code of Conduct for Cocoa. Version 1.0 - April 2009,
33 p. Available at: [http://www.utzcertified-
trainingcenter.com/home/images/documentos/cocoaGroupMultigroup/ENUTZ_CocoaCode1.0.pdf], last
accessed 20 September 2012.
UTZ CERTIFIED 2009. UTZ CERTIFIED Good Inside Code of Conduct for Cocoa For Individual Certification.
Version 1.0 – December 2009, 22p. Available at [http://www.utzcertified-
trainingcenter.com/home/images/documentos/cocoaIndividualMultisite/ENUTZCERTIFIEDCodeofCondu
ctforCocoaforIndividualCertification.pdf], last accessed 20 September 2012.
UTZ CERTIFIED 2010. UTZ CERTIFIED Good Inside Code of Conduct Annex for Cocoa For Individual
Certification Version 1.0 – January 2010. 12p. Available at [http://www.utzcertified-
trainingcenter.com/home/images/documentos/cocoaIndividualMultisite/ENUTZCERTIFIEDCoCAnnexfor
CocoaforIndividualCertification.pdf]. Last accessed 20 September 2012.