Embed Size (px)
Citation preview

12/11/2013
1
Rapid assessment of the Quality of Growth indicators
Brian Carisma and Hitomi Rankine Environment and Development Division
Economic and Social Commission for Asia and the Pacific
Expert Group Meeting on Strategies for Improving Environmental Statistics in the
Asia-Pacific regionf g2-4 December 2013, Bangkok
Background
Better measure of progress are needed and the need to go b d GDP i i (Ri +20)beyond GDP in assessing progress (Rio +20)
Many efforts to develop environment related indicators
Increasing interest in the economy-environment integration
SEEA has good guidance but how to prioritize?

12/11/2013
2
Background
Focusing on economic growth as driver of change
Post-2015 development agenda to focus on transformation Post 2015 development agenda to focus on transformation
Quality of growth as a prerequisite for sustainable development
Green growth as a key dimension of QofG
ESCAP’s work – Quality of growth framework and indicators, Eco-efficiency indicators, Assessment framework (tool), Economic modeling for sustainable development
to prioritize?
Defining priorities
Keep demand perspective in mind (including for financing)
Initiatives to define indicators in the environmental sphere in A-P (e.g. green growth, quality of growth, sustainable consumption and production)
Initiatives to build capacity (SEEA, material flow accounts, economic modeling)
12/11/2013
3
Linking climate change, resource use, land use, and economic activity Can we really do this atand economic activity.. Can we really do this at the national level ?
- Yes .. but we need environmental satellite accounts
ESCAP/CSIRO/Univ. of Sydney study tour, September 2013, Canberra
Expanding the investor base (forests)
Traditional management
Management for How hmanagement
for timber production
Private sector (plantations)
L l
service provision
Ecotourism operators Local governments Water utilities Hydropower companies Water users Energy users Beverage producers
much should
we pay?
Why should we pay ?
Local governments
Local communities
Beverage producers Agro-industries Local communities Farmers

12/11/2013
4
Assessing priorities key questions
There is a wide range of possible set of indicators g pbut…..
Are they all feasible?
If not, should we invest?
Assessing priorities -
We adapted the RACER framework and applied to the quality of growth indicators (work in progress)
Useful to assess indicators and their feasibility
Technical basis for describing the state of individual indicator
Support dialogue on statistical investment - which indicator and what investment needed

12/11/2013
5
Asia-Pacific development context
The Quality of Growth Framework - (work in progress)
12/11/2013
6
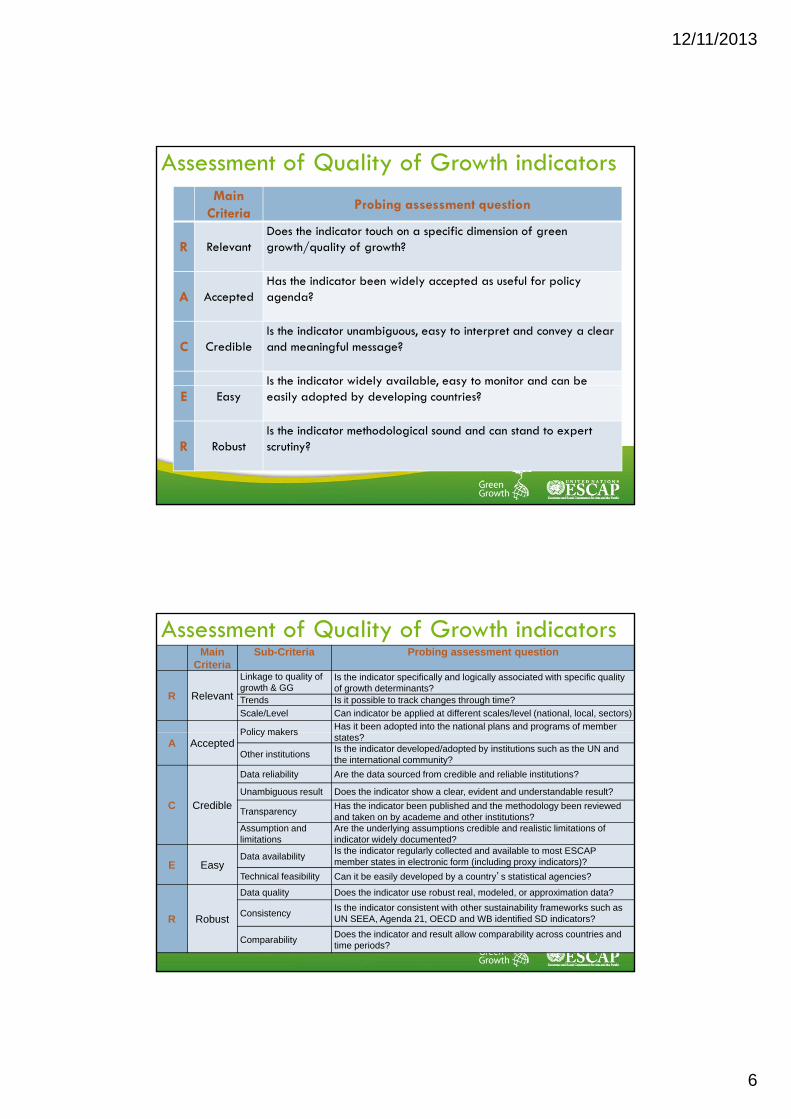
Assessment of Quality of Growth indicators Main
CriteriaProbing assessment question
R RelevantDoes the indicator touch on a specific dimension of green growth/quality of growth?
A AcceptedHas the indicator been widely accepted as useful for policy agenda?
C CredibleIs the indicator unambiguous, easy to interpret and convey a clear and meaningful message?
Is the indicator widely available, easy to monitor and can be E Easy
y , yeasily adopted by developing countries?
R RobustIs the indicator methodological sound and can stand to expert scrutiny?
Assessment of Quality of Growth indicators Assessment of Quality of Growth indicators Main
CriteriaSub-Criteria Probing assessment question
R Relevant
Linkage to quality of growth & GG
Is the indicator specifically and logically associated with specific quality of growth determinants?
Trends Is it possible to track changes through time?
Scale/Level Can indicator be applied at different scales/level (national, local, sectors)
Policy makersHas it been adopted into the national plans and programs of member
A AcceptedPolicy makers
states?
Other institutionsIs the indicator developed/adopted by institutions such as the UN and the international community?
C Credible
Data reliability Are the data sourced from credible and reliable institutions?
Unambiguous result Does the indicator show a clear, evident and understandable result?
TransparencyHas the indicator been published and the methodology been reviewed and taken on by academe and other institutions?
Assumption and limitations
Are the underlying assumptions credible and realistic limitations of indicator widely documented?Is the indicator regularly collected and available to most ESCAP
E EasyData availability
Is the indicator regularly collected and available to most ESCAP member states in electronic form (including proxy indicators)?
Technical feasibility Can it be easily developed by a country’s statistical agencies?
R Robust
Data quality Does the indicator use robust real, modeled, or approximation data?
ConsistencyIs the indicator consistent with other sustainability frameworks such as UN SEEA, Agenda 21, OECD and WB identified SD indicators?
ComparabilityDoes the indicator and result allow comparability across countries and time periods?

12/11/2013
7
Result of assessment (GG indicators)(work in progress)

12/11/2013
8
RELEVANTAssessment category
Linkage to GG and QG Trends Scale/Level
Criteria Reinforces the quality of growth determinants
Availability of time series data
Level (macro, micro, national, local, sectoral) of
RACER scoring
)disaggregation of indicator
Fully satisfied (2 points)
Strong link to at least 2 determinants of QG
Long time series available (time series for more than 10-years)
Indicator covers over 2 levels
Partly satisfied
Moderate linkage to at least 1 determinant of
Short time series available (time series for at most 10
Indicator covers only 2 levels
(1 point) QG years or at least 5-data-point year observation)
Not satisfied(0 point)
No/weak link to any determinants of QG
No time series data available
Indicator covers 1 level
Gaps and issues(Rio +20)
RACER is promising tool in investigating issues with data
Regional application- country specific application needed
Rapid assessment Subjectivity and bias in the evaluation Rapid assessment - Subjectivity and bias in the evaluation
12/11/2013
9
What’s next? assessing progress (Rio +20)
Joint identification of “wish list” indicators
Designing/adapting assessment framework
Analysis (expert)
Defining investment areas, partners and approaches
Thank you for your attentiony y

12/11/2013
10
Additional slides
Result of assessment (work in progress) Distribution determinants

12/11/2013
11
Result of assessment (work in progress) Allocation determinants
Result of assessment Scale determinants

12/11/2013
12
Result of assessment Scale determinants