Embed Size (px)
Citation preview
Research Article
Rapid Assessment of Tablet Film Coating Quality by Multispectral UV Imaging
Marten Klukkert,1 Jian X. Wu,2 Jukka Rantanen,2 Soenke Rehder,1 Jens M. Carstensen,3
Thomas Rades,2 and Claudia S. Leopold1,4
Received 31 May 2015; accepted 13 September 2015; published online 13 October 2015
Abstract. Chemical imaging techniques are beneficial for control of tablet coating layer quality as theyprovide spectral and spatial information and allow characterization of various types of coating defects.The purpose of this study was to assess the applicability of multispectral UV imaging for assessment of thecoating layer quality of tablets. UV images were used to detect, characterize, and localize coating layerdefects such as chipped parts, inhomogeneities, and cracks, as well as to evaluate the coating surfacetexture. Acetylsalicylic acid tablets were prepared on a rotary tablet press and coated with a polyvinylalcohol-polyethylene glycol graft copolymer using a pan coater. It was demonstrated that the coatingintactness can be assessed accurately and fast by UV imaging. The different types of coating defects couldbe differentiated and localized based on multivariate image analysis and Soft Independent Modeling byClass Analogy applied to the UV images. Tablets with inhomogeneous texture of the coating could beidentified and distinguished from those with a homogeneous surface texture. Consequently, UV imagingwas shown to be well-suited for monitoring of the tablet coating layer quality. UV imaging is a promisingtechnique for fast quality control of the tablet coating because of the high data acquisition speed and itsnondestructive analytical nature.
KEY WORDS: multispectral UV imaging; multivariate image analysis; SIMCA; tablet coating quality;tablet quality attributes.
INTRODUCTION
Pharmaceutical tablets are commonly coated for reasonssuch as improvement of the visual appearance, facilitation ofthe tablet intake, taste masking, drug release control, andprotection of the tablet core from light and moisture (1–5).Improper control of the coating quality can compromise activepharmaceutical ingredient (API) physical and chemical stabil-ity and may result in dose failure and dumping as well as analtered dissolution profile. Furthermore, inadequate appear-ance of the tablet coating reduces customer acceptance andpatient compliance. In agreement with the standards specifiedby the regulatory authorities, film coating quality is routinelydetermined only with a small number of samples using, e.g.,disintegration and dissolution tests as well as nonautomated
inspection of tablet appearance in laboratories (6–8). Suchquality control strategies are time-consuming and cost-intensive and follow the paradigm of measuring the qualityfrom the product (7). Furthermore, these strategies do notallow to relate the obtained product characteristics toquality-relevant production parameters (7). Thus, inspired bythe QbD and PAT initiatives of the regulatory authorities (9–11), pharmaceutical manufacturers are encouraged to buildthe quality into the product by understanding and mathemat-ical relation of input variables to critical quality attributes(CQA) and control of the production process in real-timethrough the use of inline, fast, and nondestructive sensors.This strategy is beneficial because insufficient product qualityis detected during the process, which can therefore be adjust-ed so that the product meets the defined specifications (9). Inthis context, vibrational spectroscopic techniques such as NIR(12–16) and Raman spectroscopy (17–19) have been demon-strated to be useful tools for evaluation of tablet coatingquality as they are fast, nondestructive, and versatile andprovide chemical as well as physical information on the sam-ples. However, one drawback of such techniques is the lack ofspatial information, as average spectra are obtained only fromspots of a sample or from more than one tablet during a givenintegration time (20). Hence, for understanding and control ofthe film coating process, spatially resolved physicochemicalinformation on the coated tablets can be beneficial (21,22).The detection and localization of coating defects such aschipping at either the center or the edge of the tablet may
Electronic supplementary material The online version of this article(doi:10.1208/s12249-015-0414-x) contains supplementary material,which is available to authorized users.1 Division of Pharmaceutical Technology, Department of Chemistry,University of Hamburg, Bundesstraße 45, 20146, Hamburg,Germany.
2 Department of Pharmacy, Faculty of Health and Medical Sciences,University of Copenhagen, Copenhagen, Denmark.
3 Department of Applied Mathematics and Computer Science, Tech-nical University of Denmark, Kongens Lyngby, Denmark.
4 To whom correspondence should be addressed. (e-mail:[email protected])
AAPS PharmSciTech, Vol. 17, No. 4, August 2016 (# 2015)DOI: 10.1208/s12249-015-0414-x
9581530-9932/16/0400-0958/0 # 2015 American Association of Pharmaceutical Scientists
be caused by different phenomena, such as twinning of tabletsduring film coating or insufficient flexibility of the coating filmand thus allowing systematic adjustment of the defect-causingprocess parameters (4). In this context, spectral imaging tech-niques have been shown to be attractive for evaluation oftablet coating quality, as they are nondestructive and providechemical as well as spatial information on the samples. Forinstance, coating integrity, thickness, and uniformity havebeen evaluated by hyperspectral NIR imaging (23–25) andterahertz pulsed imaging (TPI) (24,26–29). However, forreal-time process monitoring, remaining challenges are thedata acquisition speed (30) as well as the handling of the largedata sets (20,31). To obtain spectra with sufficiently high signalto noise ratio, many scans of each sampling point need to berecorded having a negative impact on the sampling time. Inthis context, the application of imaging techniques that allowcapturing spectra of wavelength regions in which the sampleexhibits a high absorptivity is attractive because it potentiallyenables acquisition of high-quality spectra within a short sen-sor integration time leading to an increased image acquisitionspeed (32). From the abovementioned perspective, the maingoal of this study was to assess the suitability of six-wavelengthUV imaging for evaluation of the coating quality of tablets.Multispectral UV imaging has been previously demonstratedto be a well-suited technique for evaluation of the API solid-state form within uncoated tablets (32). In the present study, itwas investigated if defects such as chipped parts, cracks, andinhomogeneities in the coating layer can be detected, identi-fied, and localized by UV imaging combined with multivariateimage and pattern recognition analysis. Moreover, the possi-bility to determine the surface texture of the tablet coatingsfrom the UV images was examined.
MATERIALS AND METHODS
Materials
Acetylsalicylic acid (ASA), highly dispersed silicon diox-ide (Aerosil® 200), and potato starch all of Ph. Eur. gradewere obtained from Fagron (Barsbüttel, Germany). Micro-crystalline cellulose (MCC, Avicel® PH-102) of Ph. Eur. gradewas supplied by FMC Biopolymer (Dublin, Ireland),Kollicoat® IR (polyvinyl alcohol-polyethylene glycol graftcopolymer (PVA/PEG)) of two colors (blue and yellow basedon aluminum lakes) was donated by BASF (Ludwigshafen,Germany), and magnesium stearate (MgSt) by Baerlocher(Unterschleissheim, Germany).
Methods
Tablet Compaction
Tablet compaction was performed on a rotary tablet press(Fette 102i, Fette Compacting, Schwarzenbek, Germany)equipped with faceted punches of 8 mm diameter. ASA tab-lets (50.0% (w/w) ASA, 40.5% (w/w) MCC, 8.0% (w/w)starch, 0.5% (w/w) silicon dioxide, and 1.0% (w/w) MgSt)with a weight of approximately 250 mg were obtained at maincompaction pressures of about 200 MPa and a rotor speed of20 rpm. All tableting experiments were performed in an air-conditioned room at 21°C and a RH of 45%.
Pan Coating
ASA tablets were film coated with a mixture ofKollicoat® IR (blue and yellow, resulting in a green color)using a pan coater (Solidlab 1, Bosch, Schopfheim, Germany)equipped with a nozzle of 1.2 mm diameter. During the coat-ing process, the product temperature range was 32–46°C, theair flow rate was varied between 53 and 61 m3 h−1, and theatomizing air pressure and fluid spray rate were set to 0.67 barand 1.0 g min−1, respectively. Under these intentionally non-ideal process conditions, tablets with intact coating layer thatshow an either homogeneous or inhomogeneous surface tex-ture as well as tablets with a defect coating layer (chippedparts or inhomogeneous appearance) were obtained. A smallfraction of coated ASA tablets were manually processed witha scalpel to obtain tablets with cracks in the coating layer.Uncoated tablets were prepared by gently scraping of thecoating layer.
Photographic Imaging
Photographs of all ASA tablets were taken with a 18-megapixel Canon EOS 600D-SLR camera attached to a Can-on EF-S 18–55 mm 1:3.5–5.6 IS II objective (both from Canon,Tokyo, Japan) and processed using Adobe® Photoshop® CS2(ver. 9.0, Adobe Systems, San Jose, USA).
Photometric Stereo
Images of coated ASA tablets with either visuallyhomogeneous or inhomogeneous coating were acquiredusing a Videometer MultiRay imager (Videometer,Hørsholm, Denmark) combined with the VideometerLabsoftware (ver. 2.8, Videometer, Hørsholm, Denmark) toverify the surface texture analyzed by UV imaging. Theinstrument consists of a combined darkfield and coaxialbrightfield illumination source which illuminates the sam-ple at different angles. As wavelength 465 nm was select-ed, a silicon range imaging detector was used to collectthe reflected light. The obtained images were of size1280×960 pixels with a pixel size of 7.7 μm.
UV Imaging
UV imaging of all tablets was performed using aVideometerLabUV multispectral imager (Videometer,Hørsholm, Denmark) and the VideometerLab software (ver.1.6, Videometer, Hørsholm, Denmark). The imager wasequipped with a Mercury-Xenon UV light source andbandpass filters to illuminate the samples at six wavelengths(254, 280, 300, 313, 334, and 365 nm) as well as a CCD camerato collect the light that is diffusely reflected by the samples.The field of view of the instrument with a size of 11.7 cm×8.8 cm was imaged within about 18 s and resulted in a raw dataarray of dimension 960×1280×6, where the wavelengths arearranged along the third dimension. The spatial resolution was77.9 μm.
The UV imager and the instrument setup are illustratedin Fig. 1.
959Assessment of Tablet Film Coating Quality by UV Imaging
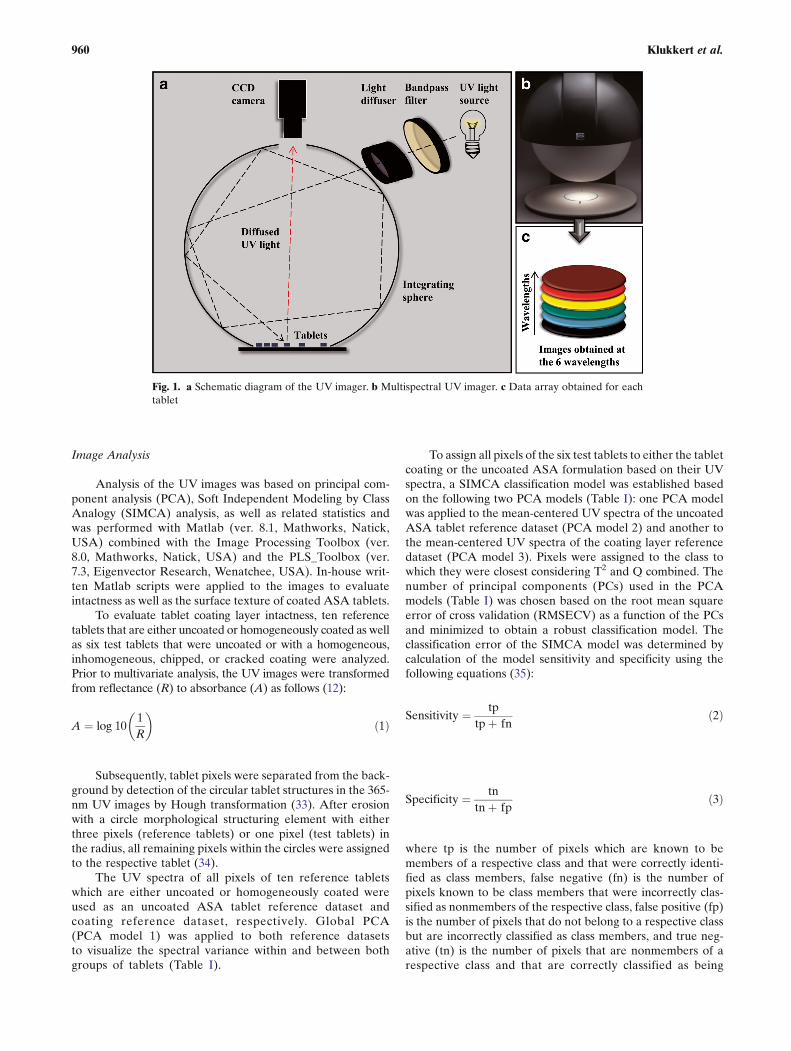
Image Analysis
Analysis of the UV images was based on principal com-ponent analysis (PCA), Soft Independent Modeling by ClassAnalogy (SIMCA) analysis, as well as related statistics andwas performed with Matlab (ver. 8.1, Mathworks, Natick,USA) combined with the Image Processing Toolbox (ver.8.0, Mathworks, Natick, USA) and the PLS_Toolbox (ver.7.3, Eigenvector Research, Wenatchee, USA). In-house writ-ten Matlab scripts were applied to the images to evaluateintactness as well as the surface texture of coated ASA tablets.
To evaluate tablet coating layer intactness, ten referencetablets that are either uncoated or homogeneously coated as wellas six test tablets that were uncoated or with a homogeneous,inhomogeneous, chipped, or cracked coating were analyzed.Prior to multivariate analysis, the UV images were transformedfrom reflectance (R) to absorbance (A) as follows (12):
A ¼ log 101R
� �ð1Þ
Subsequently, tablet pixels were separated from the back-ground by detection of the circular tablet structures in the 365-nm UV images by Hough transformation (33). After erosionwith a circle morphological structuring element with eitherthree pixels (reference tablets) or one pixel (test tablets) inthe radius, all remaining pixels within the circles were assignedto the respective tablet (34).
The UV spectra of all pixels of ten reference tabletswhich are either uncoated or homogeneously coated wereused as an uncoated ASA tablet reference dataset andcoating reference dataset, respectively. Global PCA(PCA model 1) was applied to both reference datasetsto visualize the spectral variance within and between bothgroups of tablets (Table I).
To assign all pixels of the six test tablets to either the tabletcoating or the uncoated ASA formulation based on their UVspectra, a SIMCA classification model was established basedon the following two PCA models (Table I): one PCA modelwas applied to the mean-centered UV spectra of the uncoatedASA tablet reference dataset (PCA model 2) and another tothe mean-centered UV spectra of the coating layer referencedataset (PCA model 3). Pixels were assigned to the class towhich they were closest considering T2 and Q combined. Thenumber of principal components (PCs) used in the PCAmodels (Table I) was chosen based on the root mean squareerror of cross validation (RMSECV) as a function of the PCsand minimized to obtain a robust classification model. Theclassification error of the SIMCA model was determined bycalculation of the model sensitivity and specificity using thefollowing equations (35):
Sensitivity ¼ tptpþ fn
ð2Þ
Specificity ¼ tntnþ fp
ð3Þ
where tp is the number of pixels which are known to bemembers of a respective class and that were correctly identi-fied as class members, false negative (fn) is the number ofpixels known to be class members that were incorrectly clas-sified as nonmembers of the respective class, false positive (fp)is the number of pixels that do not belong to a respective classbut are incorrectly classified as class members, and true neg-ative (tn) is the number of pixels that are nonmembers of arespective class and that are correctly classified as being
Fig. 1. a Schematic diagram of the UV imager. b Multispectral UV imager. c Data array obtained for eachtablet
960 Klukkert et al.
outside that class. Sensitivity is a parameter describing howaccurately known class members are identified as such, whilespecificity is a parameter that indicates how well samples thatare nonmembers of a respective class are classified as such(36). Specificity and sensitivity varies in the range betweenzero and unity. In general, values close to unity indicate a highclassification performance of the model (37).
To distinguish tablets according to their coating textureby UV imaging, intact tablets that showed an either homoge-neous (n=8) or an inhomogeneous (n=8) coating in the pho-tographic images were analyzed as follows: in the first step,PCA-based background segmentation was applied (38). In thesecond step, pixels belonging to the facet of the tablets wereassigned to the background by circular erosion of the tabletpixels using a circle morphological structuring element with20 pixels in the radius (34).
From the segmented image, a global PCAwas applied toall remaining pixels of the flat region of the 16 investigatedtablets to monitor the spectral variance between them. Foreach tablet, the average score variation (Xa, Eq. 4) was cal-culated from the respective PC-1 scores as parametric estima-tor for coating surface texture by modification of the equationfor calculation of the average roughness (39) as follows:
Xa ¼X N
n¼1
Zn−Z��� ���
Nð4Þ
where Zn is the individual PC-1 score intensity of each tabletpixel, Z is the mean PC-1 score intensity of all pixels of fivecoated tablets which were considered to show a homogeneoussmooth coating (reference set), and N is the total number ofpixels of a respective tablet. The way of calculation of Z wasbased on the mean PC-1 score intensity of five homogenouslycoated reference tablets instead of that of the respective tab-let, because tablets that are widely differing in surface texture
To investigate the suitability of multispectral UV imagingto evaluate the integrity of the tablet coating layer, first of all itwas investigated if uncoated and coated ASA tablets can bedistinguished from each other based on their solid-state UVabsorbance spectra. Therefore, mean UV spectra (Fig. 2a) ofall pixels of an uncoated ASA tablet (Fig. 3, row A) as well asof a tablet with an intact coating and homogeneous smoothtexture (Fig. 3, row B) were calculated from the respective UVimages. It is obvious from Fig. 2a that the two types of tabletsexhibit markedly different absorbance profiles that vary con-siderably with regard to the overall extent of UV absorbanceas well as in the shape of the spectra. The tablet with thegreen-colored PVA/PEG coating layer (green curve) showsa markedly higher absorbance at all six wavelengths compared
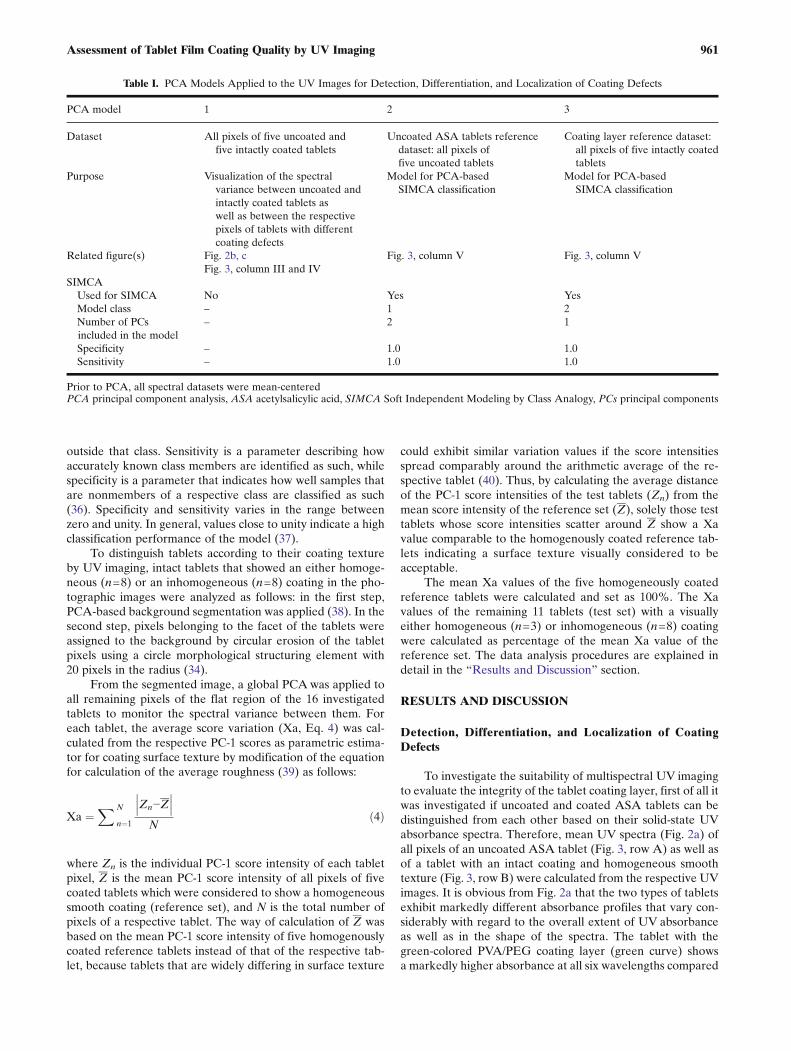
Table I. PCA Models Applied to the UV Images for Detection, Differentiation, and Localization of Coating Defects
PCA model 1 2 3
Dataset All pixels of five uncoated andfive intactly coated tablets
Uncoated ASA tablets referencedataset: all pixels offive uncoated tablets
Coating layer reference dataset:all pixels of five intactly coatedtablets
Purpose Visualization of the spectralvariance between uncoated andintactly coated tablets aswell as between the respectivepixels of tablets with differentcoating defects
Model for PCA-basedSIMCA classification
Model for PCA-basedSIMCA classification
Related figure(s) Fig. 2b, cFig. 3, column III and IV
Fig. 3, column V Fig. 3, column V
SIMCAUsed for SIMCA No Yes YesModel class – 1 2Number of PCsincluded in the model
– 2 1
Specificity – 1.0 1.0Sensitivity – 1.0 1.0
Prior to PCA, all spectral datasets were mean-centeredPCA principal component analysis, ASA acetylsalicylic acid, SIMCA Soft Independent Modeling by Class Analogy, PCs principal components
961Assessment of Tablet Film Coating Quality by UV Imaging
could exhibit similar variation values if the score intensitiesspread comparably around the arithmetic average of the re-spective tablet (40). Thus, by calculating the average distanceof the PC-1 score intensities of the test tablets (Zn) from themean score intensity of the reference set (Z), solely those testtablets whose score intensities scatter around Z show a Xavalue comparable to the homogenously coated reference tab-lets indicating a surface texture visually considered to beacceptable.
The mean Xa values of the five homogeneously coatedreference tablets were calculated and set as 100%. The Xavalues of the remaining 11 tablets (test set) with a visuallyeither homogeneous (n=3) or inhomogeneous (n=8) coatingwere calculated as percentage of the mean Xa value of thereference set. The data analysis procedures are explained indetail in the “Results and Discussion” section.
RESULTS AND DISCUSSION
Detection, Differentiation, and Localization of CoatingDefects
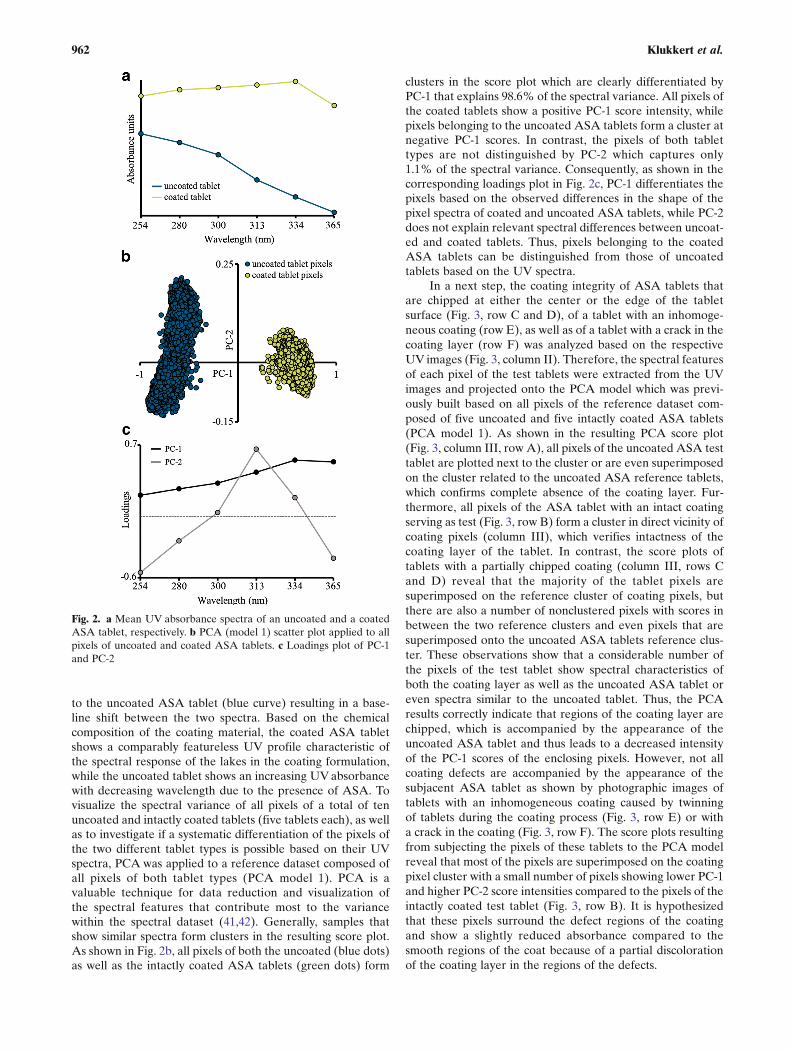
to the uncoated ASA tablet (blue curve) resulting in a base-line shift between the two spectra. Based on the chemicalcomposition of the coating material, the coated ASA tabletshows a comparably featureless UV profile characteristic ofthe spectral response of the lakes in the coating formulation,while the uncoated tablet shows an increasing UVabsorbancewith decreasing wavelength due to the presence of ASA. Tovisualize the spectral variance of all pixels of a total of tenuncoated and intactly coated tablets (five tablets each), as wellas to investigate if a systematic differentiation of the pixels ofthe two different tablet types is possible based on their UVspectra, PCA was applied to a reference dataset composed ofall pixels of both tablet types (PCA model 1). PCA is avaluable technique for data reduction and visualization ofthe spectral features that contribute most to the variancewithin the spectral dataset (41,42). Generally, samples thatshow similar spectra form clusters in the resulting score plot.As shown in Fig. 2b, all pixels of both the uncoated (blue dots)as well as the intactly coated ASA tablets (green dots) form
clusters in the score plot which are clearly differentiated byPC-1 that explains 98.6% of the spectral variance. All pixels ofthe coated tablets show a positive PC-1 score intensity, whilepixels belonging to the uncoated ASA tablets form a cluster atnegative PC-1 scores. In contrast, the pixels of both tablettypes are not distinguished by PC-2 which captures only1.1% of the spectral variance. Consequently, as shown in thecorresponding loadings plot in Fig. 2c, PC-1 differentiates thepixels based on the observed differences in the shape of thepixel spectra of coated and uncoated ASA tablets, while PC-2does not explain relevant spectral differences between uncoat-ed and coated tablets. Thus, pixels belonging to the coatedASA tablets can be distinguished from those of uncoatedtablets based on the UV spectra.
In a next step, the coating integrity of ASA tablets thatare chipped at either the center or the edge of the tabletsurface (Fig. 3, row C and D), of a tablet with an inhomoge-neous coating (row E), as well as of a tablet with a crack in thecoating layer (row F) was analyzed based on the respectiveUV images (Fig. 3, column II). Therefore, the spectral featuresof each pixel of the test tablets were extracted from the UVimages and projected onto the PCA model which was previ-ously built based on all pixels of the reference dataset com-posed of five uncoated and five intactly coated ASA tablets(PCA model 1). As shown in the resulting PCA score plot(Fig. 3, column III, row A), all pixels of the uncoated ASA testtablet are plotted next to the cluster or are even superimposedon the cluster related to the uncoated ASA reference tablets,which confirms complete absence of the coating layer. Fur-thermore, all pixels of the ASA tablet with an intact coatingserving as test (Fig. 3, row B) form a cluster in direct vicinity ofcoating pixels (column III), which verifies intactness of thecoating layer of the tablet. In contrast, the score plots oftablets with a partially chipped coating (column III, rows Cand D) reveal that the majority of the tablet pixels aresuperimposed on the reference cluster of coating pixels, butthere are also a number of nonclustered pixels with scores inbetween the two reference clusters and even pixels that aresuperimposed onto the uncoated ASA tablets reference clus-ter. These observations show that a considerable number ofthe pixels of the test tablet show spectral characteristics ofboth the coating layer as well as the uncoated ASA tablet oreven spectra similar to the uncoated tablet. Thus, the PCAresults correctly indicate that regions of the coating layer arechipped, which is accompanied by the appearance of theuncoated ASA tablet and thus leads to a decreased intensityof the PC-1 scores of the enclosing pixels. However, not allcoating defects are accompanied by the appearance of thesubjacent ASA tablet as shown by photographic images oftablets with an inhomogeneous coating caused by twinningof tablets during the coating process (Fig. 3, row E) or witha crack in the coating (Fig. 3, row F). The score plots resultingfrom subjecting the pixels of these tablets to the PCA modelreveal that most of the pixels are superimposed on the coatingpixel cluster with a small number of pixels showing lower PC-1and higher PC-2 score intensities compared to the pixels of theintactly coated test tablet (Fig. 3, row B). It is hypothesizedthat these pixels surround the defect regions of the coatingand show a slightly reduced absorbance compared to thesmooth regions of the coat because of a partial discolorationof the coating layer in the regions of the defects.
Fig. 2. a Mean UV absorbance spectra of an uncoated and a coatedASA tablet, respectively. b PCA (model 1) scatter plot applied to allpixels of uncoated and coated ASA tablets. c Loadings plot of PC-1and PC-2
962 Klukkert et al.
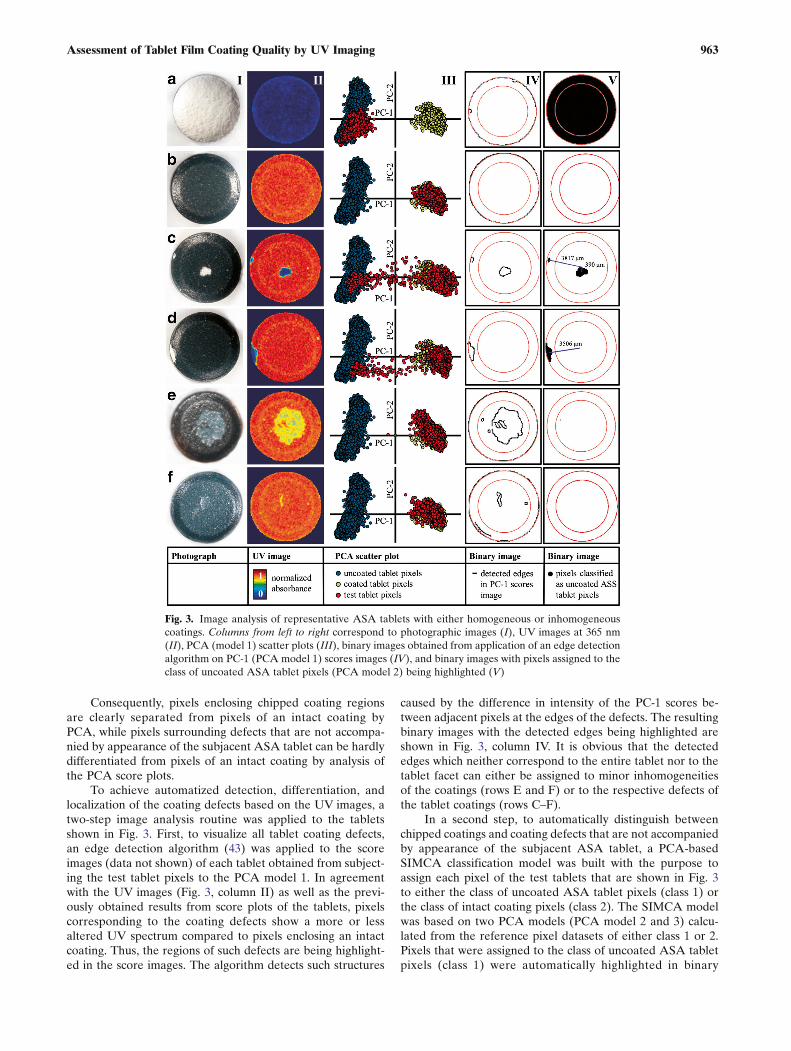
Consequently, pixels enclosing chipped coating regionsare clearly separated from pixels of an intact coating byPCA, while pixels surrounding defects that are not accompa-nied by appearance of the subjacent ASA tablet can be hardlydifferentiated from pixels of an intact coating by analysis ofthe PCA score plots.
To achieve automatized detection, differentiation, andlocalization of the coating defects based on the UV images, atwo-step image analysis routine was applied to the tabletsshown in Fig. 3. First, to visualize all tablet coating defects,an edge detection algorithm (43) was applied to the scoreimages (data not shown) of each tablet obtained from subject-ing the test tablet pixels to the PCA model 1. In agreementwith the UV images (Fig. 3, column II) as well as the previ-ously obtained results from score plots of the tablets, pixelscorresponding to the coating defects show a more or lessaltered UV spectrum compared to pixels enclosing an intactcoating. Thus, the regions of such defects are being highlight-ed in the score images. The algorithm detects such structures
caused by the difference in intensity of the PC-1 scores be-tween adjacent pixels at the edges of the defects. The resultingbinary images with the detected edges being highlighted areshown in Fig. 3, column IV. It is obvious that the detectededges which neither correspond to the entire tablet nor to thetablet facet can either be assigned to minor inhomogeneitiesof the coatings (rows E and F) or to the respective defects ofthe tablet coatings (rows C–F).
In a second step, to automatically distinguish betweenchipped coatings and coating defects that are not accompaniedby appearance of the subjacent ASA tablet, a PCA-basedSIMCA classification model was built with the purpose toassign each pixel of the test tablets that are shown in Fig. 3to either the class of uncoated ASA tablet pixels (class 1) orthe class of intact coating pixels (class 2). The SIMCA modelwas based on two PCA models (PCA model 2 and 3) calcu-lated from the reference pixel datasets of either class 1 or 2.Pixels that were assigned to the class of uncoated ASA tabletpixels (class 1) were automatically highlighted in binary
Fig. 3. Image analysis of representative ASA tablets with either homogeneous or inhomogeneouscoatings. Columns from left to right correspond to photographic images (I), UV images at 365 nm(II), PCA (model 1) scatter plots (III), binary images obtained from application of an edge detectionalgorithm on PC-1 (PCA model 1) scores images (IV), and binary images with pixels assigned to theclass of uncoated ASA tablet pixels (PCA model 2) being highlighted (V)
963Assessment of Tablet Film Coating Quality by UV Imaging
images (Fig. 3, column V). It is obvious that, in agreementwith the photographs and the UV images, no single pixel ofthe tablet with a uniform coating (row B) and of the tabletwith cracked coating (row F) were assigned to class 1. Incontrast, all pixels of the uncoated ASA tablet (row A) aswell as the pixels surrounding the pronounced coating defectsat the center and edge of the tablets in rows C and D arecorrectly assigned to the class of uncoated ASA tablet pixels(class 1) and are thus highlighted in the binary images. Asshown in the binary image of the tablet with an inhomoge-neous coating (row E), all pixels except one, which could beremoved by setting a threshold in the binary images based onthe pixel quantity of highlighted pixel clusters, were correctlyassigned to class 2. Specificity and sensitivity (Eqs. 2 and 3) ofthe classification model which were calculated based on allpixels of the homogeneously coated and uncoated test tablets(rows A and B) are both 1.0 for both class 1 as well as class 2indicating an adequate model quality. Thus, the defects of theinvestigated coated tablets that are accompanied by appear-ance of the subjacent ASA formulation could be clearly de-tected by a SIMCA classification model based on theirmultispectral UV images. Subsequently, localization of thesedefects was achieved by calculation of the distance from thecenter of the tablet to the center of the defects, which givesvaluable information for readjustment of the coating processparameters. By comparing the defects found by application ofeither the edge detection algorithm or of the SIMCA model, adifferentiation of coating defects that are not accompanied byappearance of the subjacent ASA tablet and defects resultingfrom chipped coatings parts could be achieved. It has to bementioned that the detection of coating defects which areaccompanied by the appearance of the subjacent tablet for-mulation are routinely performed by machine vision systemsworking in the VIS range. However, for a reliable detection ofcoating defects with VIS instruments, usually a high contrastin coloration between the coating layer and the tablet formu-lation is required. In contrast to VIS imaging, UV imaging isable to distinguish between different compounds based on
their chemical nature irrespective of the contrast in colorationbetween them (32). As different chemical compounds showdistinct UV profiles, this fact is considered to be a majorbenefit of UV imaging compared to systems working in theVIS range and it indicates the potential of UV imaging for thedetection of defects even if the applied coating is of similarcolor (such as a moisture barrier coating) as the tabletformulation.
Evaluation of Tablet Coating Texture
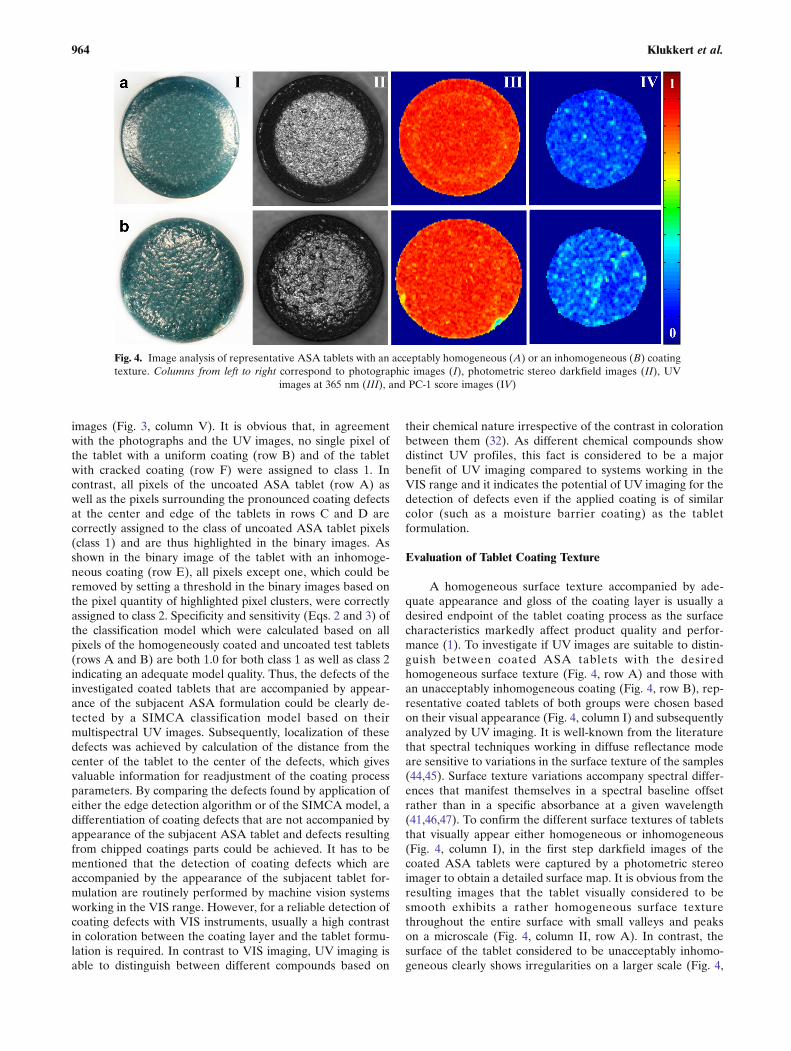
A homogeneous surface texture accompanied by ade-quate appearance and gloss of the coating layer is usually adesired endpoint of the tablet coating process as the surfacecharacteristics markedly affect product quality and perfor-mance (1). To investigate if UV images are suitable to distin-guish between coated ASA tablets with the desiredhomogeneous surface texture (Fig. 4, row A) and those withan unacceptably inhomogeneous coating (Fig. 4, row B), rep-resentative coated tablets of both groups were chosen basedon their visual appearance (Fig. 4, column I) and subsequentlyanalyzed by UV imaging. It is well-known from the literaturethat spectral techniques working in diffuse reflectance modeare sensitive to variations in the surface texture of the samples(44,45). Surface texture variations accompany spectral differ-ences that manifest themselves in a spectral baseline offsetrather than in a specific absorbance at a given wavelength(41,46,47). To confirm the different surface textures of tabletsthat visually appear either homogeneous or inhomogeneous(Fig. 4, column I), in the first step darkfield images of thecoated ASA tablets were captured by a photometric stereoimager to obtain a detailed surface map. It is obvious from theresulting images that the tablet visually considered to besmooth exhibits a rather homogeneous surface texturethroughout the entire surface with small valleys and peakson a microscale (Fig. 4, column II, row A). In contrast, thesurface of the tablet considered to be unacceptably inhomo-geneous clearly shows irregularities on a larger scale (Fig. 4,
Fig. 4. Image analysis of representative ASA tablets with an acceptably homogeneous (A) or an inhomogeneous (B) coatingtexture. Columns from left to right correspond to photographic images (I), photometric stereo darkfield images (II), UV
images at 365 nm (III), and PC-1 score images (IV)
964 Klukkert et al.
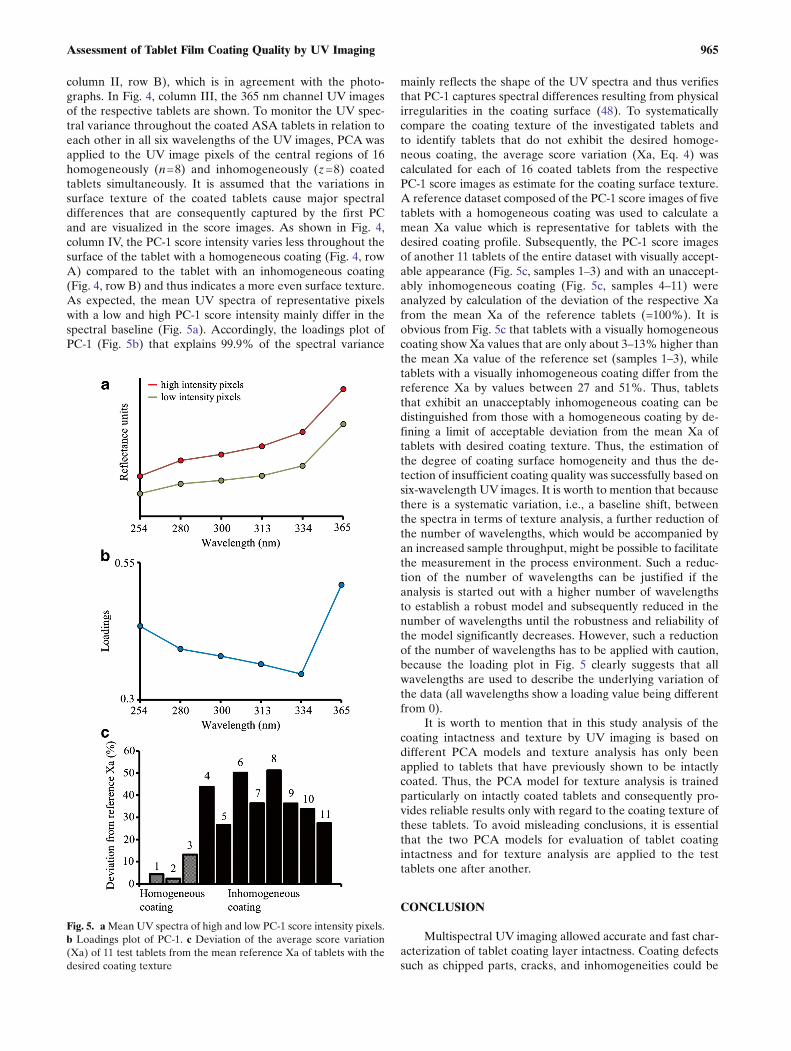
column II, row B), which is in agreement with the photo-graphs. In Fig. 4, column III, the 365 nm channel UV imagesof the respective tablets are shown. To monitor the UV spec-tral variance throughout the coated ASA tablets in relation toeach other in all six wavelengths of the UV images, PCA wasapplied to the UV image pixels of the central regions of 16homogeneously (n=8) and inhomogeneously (z=8) coatedtablets simultaneously. It is assumed that the variations insurface texture of the coated tablets cause major spectraldifferences that are consequently captured by the first PCand are visualized in the score images. As shown in Fig. 4,column IV, the PC-1 score intensity varies less throughout thesurface of the tablet with a homogeneous coating (Fig. 4, rowA) compared to the tablet with an inhomogeneous coating(Fig. 4, row B) and thus indicates a more even surface texture.As expected, the mean UV spectra of representative pixelswith a low and high PC-1 score intensity mainly differ in thespectral baseline (Fig. 5a). Accordingly, the loadings plot ofPC-1 (Fig. 5b) that explains 99.9% of the spectral variance
mainly reflects the shape of the UV spectra and thus verifiesthat PC-1 captures spectral differences resulting from physicalirregularities in the coating surface (48). To systematicallycompare the coating texture of the investigated tablets andto identify tablets that do not exhibit the desired homoge-neous coating, the average score variation (Xa, Eq. 4) wascalculated for each of 16 coated tablets from the respectivePC-1 score images as estimate for the coating surface texture.A reference dataset composed of the PC-1 score images of fivetablets with a homogeneous coating was used to calculate amean Xa value which is representative for tablets with thedesired coating profile. Subsequently, the PC-1 score imagesof another 11 tablets of the entire dataset with visually accept-able appearance (Fig. 5c, samples 1–3) and with an unaccept-ably inhomogeneous coating (Fig. 5c, samples 4–11) wereanalyzed by calculation of the deviation of the respective Xafrom the mean Xa of the reference tablets (=100%). It isobvious from Fig. 5c that tablets with a visually homogeneouscoating show Xa values that are only about 3–13% higher thanthe mean Xa value of the reference set (samples 1–3), whiletablets with a visually inhomogeneous coating differ from thereference Xa by values between 27 and 51%. Thus, tabletsthat exhibit an unacceptably inhomogeneous coating can bedistinguished from those with a homogeneous coating by de-fining a limit of acceptable deviation from the mean Xa oftablets with desired coating texture. Thus, the estimation ofthe degree of coating surface homogeneity and thus the de-tection of insufficient coating quality was successfully based onsix-wavelength UV images. It is worth to mention that becausethere is a systematic variation, i.e., a baseline shift, betweenthe spectra in terms of texture analysis, a further reduction ofthe number of wavelengths, which would be accompanied byan increased sample throughput, might be possible to facilitatethe measurement in the process environment. Such a reduc-tion of the number of wavelengths can be justified if theanalysis is started out with a higher number of wavelengthsto establish a robust model and subsequently reduced in thenumber of wavelengths until the robustness and reliability ofthe model significantly decreases. However, such a reductionof the number of wavelengths has to be applied with caution,because the loading plot in Fig. 5 clearly suggests that allwavelengths are used to describe the underlying variation ofthe data (all wavelengths show a loading value being differentfrom 0).
It is worth to mention that in this study analysis of thecoating intactness and texture by UV imaging is based ondifferent PCA models and texture analysis has only beenapplied to tablets that have previously shown to be intactlycoated. Thus, the PCA model for texture analysis is trainedparticularly on intactly coated tablets and consequently pro-vides reliable results only with regard to the coating texture ofthese tablets. To avoid misleading conclusions, it is essentialthat the two PCA models for evaluation of tablet coatingintactness and for texture analysis are applied to the testtablets one after another.
CONCLUSION
Multispectral UV imaging allowed accurate and fast char-acterization of tablet coating layer intactness. Coating defectssuch as chipped parts, cracks, and inhomogeneities could be
Fig. 5. aMean UV spectra of high and low PC-1 score intensity pixels.b Loadings plot of PC-1. c Deviation of the average score variation(Xa) of 11 test tablets from the mean reference Xa of tablets with thedesired coating texture
965Assessment of Tablet Film Coating Quality by UV Imaging
detected and analyzed by image analysis routines applied tothe UV images of the coated ASA tablets. Tablets with intactcoating and either homogeneous or inhomogeneous coatingtexture were successfully differentiated based on the UV im-ages. The amount and relevance of the obtained data com-bined with a high-speed image acquisition makes UV imagingan attractive technique for at-line quality control of the coat-ing process. In this context, the implementation of multispec-tral UV imaging in the manufacturing line of coated tabletshas to be further investigated. Furthermore, although neitherwarming of the samples nor any visual changes of the tabletcoating were observed after exposure of the samples to UVradiation during the measurements, the potential influence ofUV radiation on curing of the tablet coating should be inves-tigated in a further study.
REFERENCES
1. Rohera BD, Parikh NH. Influence of plasticizer type and coatlevel on surelease film properties. Pharm Dev Technol.2002;7(4):407–20. doi:10.1081/Pdt-120015043.
2. Pearnchob N, Siepmann J, Bodmeier R. Pharmaceutical applica-tions of shellac: moisture-protective and taste-masking coatingsand extended-release matrix tablets. Drug Dev Ind Pharm.2003;29(8):925–38. doi:10.1081/Ddc-120024188.
3. Siepmann F, Hoffmann A, Leclercq B, Carlin B, Siepmann J.How to adjust desired drug release patterns from ethylcellulose-coated dosage forms. J Control Release. 2007;119(2):182–9.doi:10.1016/J.Jconrel.2007.02.003.
4. Levina M, Cunningham CR. The effect of core design and for-mulation on the quality of film coated tablets. Pharm TechnolEur. 2005;17(4):29–37.
5. Sohi H, Sultana Y, Khar RK. Taste masking technologies in oralpharmaceuticals: recent developments and approaches. DrugDev Ind Pharm. 2004;30(5):429–48. doi:10.1081/Ddc-120037477.
6. EDQM. European pharmacopoeia. 8th ed. Strasbourg: Councilof Europe; 2013.
7. Yu LX. Pharmaceutical quality by design: product and processdevelopment, understanding, and control. Pharm Res.2008;25(4):781–91. doi:10.1007/S11095-007-9511-1.
8. FDA. Code of federal regulations title 21. part 211. Current goodmanufacturing practice for finished pharmaceuticals. 2014. http://www. a c c e s s d a t a . f d a . g ov / s c r i p t s / c d r h / c f do c s / c f c f r /cfrsearch.cfm?cfrpart=211&Showfr=1. Accessed 15 May 2015.
9. FDA. Guidance for industry pat—a framework for innovativepharmaceutical development, manufacturing, and quality assur-ance. 2004. http://www.fda.gov/downloads/drugs/guidances/ucm070305. Accessed 15 May 2015.
10. FDA. Pharmaceutical CGMPs for the 21st century: a risk-basedapproach. 2004. http: / /www.fda.gov/downloads/drugs/d e v e l o p m e n t a p p r o v a l p r o c e s s / m a n u f a c t u r i n g /questionsandanswersoncurrentgoodmanufacturingpracticescgm-pfordrugs/ucm176374. Accessed 15 May 2015.
11. ICH. Guideline on pharmaceutical development Q8 (2r).2009 . ht tp : / /www. ich .org / f i leadmin/publ ic_web_si te /ich_products/guidelines/quality/q8_r1/step4/q8_r2_guideline.Accessed 15 May 2015.
12. Reich G. Near-infrared spectroscopy and imaging: basic princi-ples and pharmaceutical applications. Adv Drug Deliv Rev.2005;57(8):1109–43. doi:10.1016/J.Addr.2005.01.020.
13. Gendre C, Genty M, Boiret M, Julien M, Meunier L, Lecoq O,et al. Development of a process analytical technology (PAT) forin-line monitoring of film thickness and mass of coating materialsduring a pan coating operation. Eur J Pharm Sci. 2011;43(4):244–50. doi:10.1016/J.Ejps.2011.04.017.
14. Möltgen C, Herdling T, Reich G. A novel multivariate approachusing science-based calibration for direct coating thickness deter-mination in real-time nir process monitoring. Eur J PharmBiopha rm . 2013 ; 85 ( 3 P t B) : 1056–63 . do i : 1 0 . 1 016 /J.Ejpb.2013.09.011.
15. Kirsch JD, Drennen JK. Near-infrared spectroscopy: applicationsin the analysis of tablets and solid pharmaceutical dosage forms.Appl Spectrosc Rev. 1995;30(3):139–74. doi:10.1080/05704929508000906.
16. Andersson M, Folestad S, Gottfries J, Johansson MO, JosefsonM, Wahlund K. Quantitative analysis of film coating in a fluidizedbed process by in-line nir spectrometry and multivariate batchcalibration. Anal Chem. 2000;72(9):2099–108. doi:10.1021/Ac990256r.
17. Müller J, Knop K, Thies J, Uerpmann C, Kleinebudde P. Feasi-bility of raman spectroscopy as pat tool in active coating. DrugDev Ind Pha rm . 2 010 ; 3 6 ( 2 ) : 2 3 4 –43 . d o i : 1 0 . 3 1 0 9 /03639040903225109.
18. Romero-Torres S, Pérez-Ramos JD, Morris KR, Grant ER. Ra-man spectroscopic measurement of tablet-to-tablet coating vari-ability. J Pharm Biomed Anal. 2005;38(2):270–4. doi:10.1016/J.Jpba.2005.01.007.
19. Romero-Torres S, Pérez-Ramos JD, Morris KR, Grant ER. Ra-man spectroscopy for tablet coating thickness quantification andcoating characterization in the presence of strong fluorescentinterference. J Pharm Biomed Anal. 2006;41(3):811–9.doi:10.1016/J.Jpba.2006.01.033.
20. Gowen AA, O’donnell CP, Cullen PJ, Bell S. Recent applicationsof chemical imaging to pharmaceutical process monitoring andquality control. Eur J Pharm Biopharm. 2008;69(1):10–22.doi:10.1016/J.Ejpb.2007.10.013.
21. Zeitler JA, Taday PF, Newnham DA, Pepper M, Gordon KC,Rades T. Terahertz pulsed spectroscopy and imaging in the phar-maceutical setting‐a review. J Pharm Pharmacol. 2007;59(2):209–23. doi:10.1211/Jpp.59.2.0008.
22. Brock D, Zeitler JA, Funke A, Knop K, Kleinebudde P.Evaluation of critical process parameters for intra-tabletcoating uniformity using terahertz pulsed imaging. Eur JPharm Biopharm. 2013;85(3 Pt B):1122–9. doi:10.1016/J.Ejpb.2013.07.004.
23. Cairós C, Amigo JM, Watt R, Coello J, Maspoch S. Implementa-tion of enhanced correlation maps in near infrared chemicalimages: application in pharmaceutical research. Talanta.2009;79(3):657–64. doi:10.1016/J.Talanta.2009.04.042.
24. Maurer L, Leuenberger H. Terahertz pulsed imaging and nearinfrared imaging to monitor the coating process of pharmaceuti-cal tablets. Int J Pharm. 2009;370(1–2):8–16. doi:10.1016/J.Ijpharm.2008.11.011.
25. Palou A, Cruz J, Blanco M, Tomàs J, De Los Ríos J, Alcalà M.Determination of drug, excipients and coating distribution inpharmaceutical tablets using Nir-Ci . J Pharm Anal .2012;2(2):90–7. doi:10.1016/J.Jpha.2011.11.003.
26. Ho L, Müller R, Römer M, Gordon KC, Heinämäki J,Kleinebudde P. Analysis of sustained-release tablet film coatsusing terahertz pulsed imaging. J Control Release.2007;119(3):253–61. doi:10.1016/J.Jconrel.2007.03.011.
27. Niwa M, Hiraishi Y, Terada K. Evaluation of coating propertiesof enteric-coated tablets using terahertz pulsed imaging. PharmRes. 2014;31(8):2140–51. doi:10.1007/S11095-014-1314-6.
28. Fitzgerald AJ, Cole BE, Taday PF. Nondestructive analysis oftablet coating thicknesses using terahertz pulsed imaging. JPharm Sci. 2005;94(1):177–83. doi:10.1002/Jps.20225.
29. Zhong S, Shen Y, Ho L, May RK, Zeitler JA, Evans M.Non-destructive quantification of pharmaceutical tablet coat-ings using terahertz pulsed imaging and optical coherencetomography. Opt Laser Eng. 2011;49(3):361–5. doi:10.1016/J.Optlaseng.2010.11.003.
30. Amigo J. Emerging possibilities of near infrared spectroscopyand near infrared chemical imaging in the pharmaceuticalmanufacturing industry. The challenge of the process analyticaltechnologies paradigm or just a research tool. NIR News.2013;24(8):9.
31. Boldrini B, Kessler W, Rebner K, Kessler R. Hyperspectral im-aging: a review of best practice, performance and pitfalls forinline and online applications. J Near Infrared Spectrosc.2012;20(5):438.
32. Wu JX, Rehder S, Van Den Berg F, Amigo JM, Carstensen JM,Rades T, et al. Chemical imaging and solid state analysis atcompact surfaces using UV imaging. Int J Pharm. 2014;477(1–2):527–35. doi:10.1016/J.Ijpharm.2014.10.064.
966 Klukkert et al.
33. Atherton TJ, Kerbyson DJ. Size invariant circle detection. ImageVision Comput. 1999;17(11):795–803. doi:10.1016/S0262-8856(98)00160-7.
34. Gonzalez RC, Woods RE, Eddins SL. Digital image processingusing Matlab. 1st ed. Upper Saddle River: Prentice Hall; 2004.
35. Bylesjö M, Rantalainen M, Cloarec O, Nicholson JK, Holmes E,Trygg J. OPLS discriminant analysis: combining the strengths ofPLS-DA and SIMCA classification. J Chemom. 2006;20(8–10):341–51. doi:10.1002/Cem.1006.
36. Derde MP, Massart DL. Comparison of the performance of theclass modelling techniques UNEQ, SIMCA, and prima. ChemomIntell Lab Syst. 1988;4(1):65–93.
37. Forina M, Oliveri P, Casale M, Lanteri S. Multivariate rangemodeling, a new technique for multivariate class modeling: theuncertainty of the estimates of sensitivity and specificity. AnalChim Acta. 2008;622(1–2):85–93. doi:10.1016/J.Aca.2008.05.065.
38. Vidal M, Amigo JM. Pre-processing of hyperspectral images.Essential steps before image analysis. Chemom Intell Lab Syst.2012;117:138–48. doi:10.1016/J.Chemolab.2012.05.009.
39. Seitavuopio P, Heinämäki J, Rantanen J, Yliruusi J. Monitoringtablet surface roughness during the film coating process. AapsPharmscitech. 2006;7(2):E31. doi:10.1208/Pt070231.
40. Seitavuopio P. The roughness and imaging characterisation ofdifferent pharmaceutical surfaces. 2006. http://hdl.handle.net/10138/19122. Accessed 15 May 2015.
41. Wu J, Van Den Berg F, Rantanen J, Rades T, Yang M. Currentadvances and future trends in characterizing poorly water-soluble
drugs using spectroscopic, imaging and data analytical tech-niques. Curr Pharm Des. 2014;20(3):436–53. doi:10.2174/13816128113199990398.
42. Lavine BK. Clustering and classification of analytical data.In: Meyers RA, editor. Encyclopedia of analytical chemistry.C h i c h e s t e r : J W i l e y ; 2 0 0 6 . d o i : 1 0 . 1 0 0 2 /9780470027318.A5204.Pub2.
43. Canny JA. Computational approach to edge detection. IEEE TPattern Anal . 1986 ;PAMI-8(6) :679–98 . doi :10 .1109 /Tpami.1986.4767851.
44. Ciurczak E. Uses of near-infrared spectroscopy in pharmaceuticalanalysis. Appl Spectrosc Rev. 1987;23(1–2):147–63. doi:10.1080/05704928708060445.
45. Gendrin C, Roggo Y, Collet C. Pharmaceutical applications ofvibrational chemical imaging and chemometrics: a review: a re-view. J Pharm Biomed Anal. 2008;48(3):533–53. doi:10.1016/J.Jpba.2008.08.014.
46. Ropero J, Colón Y, Johnson-Restrepo B, Romañach RJ. Near-infrared chemical imaging slope as a new method to study tabletcompact ion and tablet re laxat ion . Appl Spectrosc .2011;65(4):459–65. doi:10.1366/410-06078.
47. Rinnan Å, Van Den Berg F, Engelsen SB. Review of the mostcommon pre-processing techniques for near-infrared spectra.Trends Anal Chem. 2009;28(10):1201–22. doi:10.1016/J.Trac.2009.07.007.
48. Eriksson L. Multi-and megavariate data analysis. 2nd ed. Umea:Umetrics AB; 2006.
967Assessment of Tablet Film Coating Quality by UV Imaging